Daly City, CA Map & Demographics
Daly City Map
Daly City Overview
$46,581
PER CAPITA INCOME
$130,153
AVG FAMILY INCOME
$114,910
AVG HOUSEHOLD INCOME
15.4%
WAGE / INCOME GAP [ % ]
84.6¢/ $1
WAGE / INCOME GAP [ $ ]
$10,539
FAMILY INCOME DEFICIT
0.43
INEQUALITY / GINI INDEX
103,648
TOTAL POPULATION
51,615
MALE POPULATION
52,033
FEMALE POPULATION
99.20
MALES / 100 FEMALES
100.81
FEMALES / 100 MALES
41.4
MEDIAN AGE
3.6
AVG FAMILY SIZE
3.2
AVG HOUSEHOLD SIZE
61,177
LABOR FORCE [ PEOPLE ]
67.7%
PERCENT IN LABOR FORCE
5.4%
UNEMPLOYMENT RATE
Daly City Area Codes
Income in Daly City
Income Overview in Daly City
Per Capita Income in Daly City is $46,581, while median incomes of families and households are $130,153 and $114,910 respectively.
| Characteristic | Number | Measure |
| Per Capita Income | 103,648 | $46,581 |
| Median Family Income | 23,190 | $130,153 |
| Mean Family Income | 23,190 | $156,729 |
| Median Household Income | 32,206 | $114,910 |
| Mean Household Income | 32,206 | $142,548 |
| Income Deficit | 23,190 | $10,539 |
| Wage / Income Gap (%) | 103,648 | 15.39% |
| Wage / Income Gap ($) | 103,648 | 84.61¢ per $1 |
| Gini / Inequality Index | 103,648 | 0.43 |
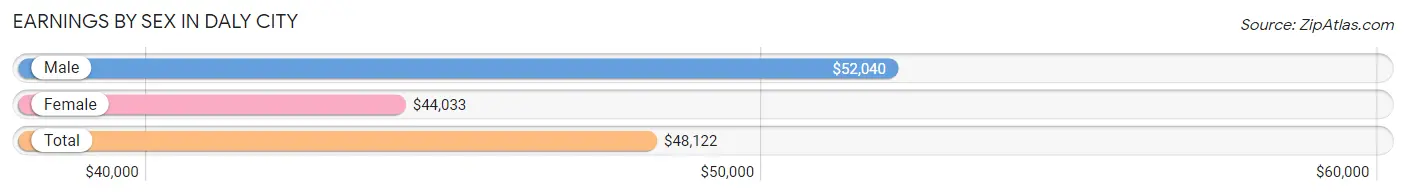
Earnings by Sex in Daly City
Average Earnings in Daly City are $48,122, $52,040 for men and $44,033 for women, a difference of 15.4%.
| Sex | Number | Average Earnings |
| Male | 32,610 (53.1%) | $52,040 |
| Female | 28,787 (46.9%) | $44,033 |
| Total | 61,397 (100.0%) | $48,122 |
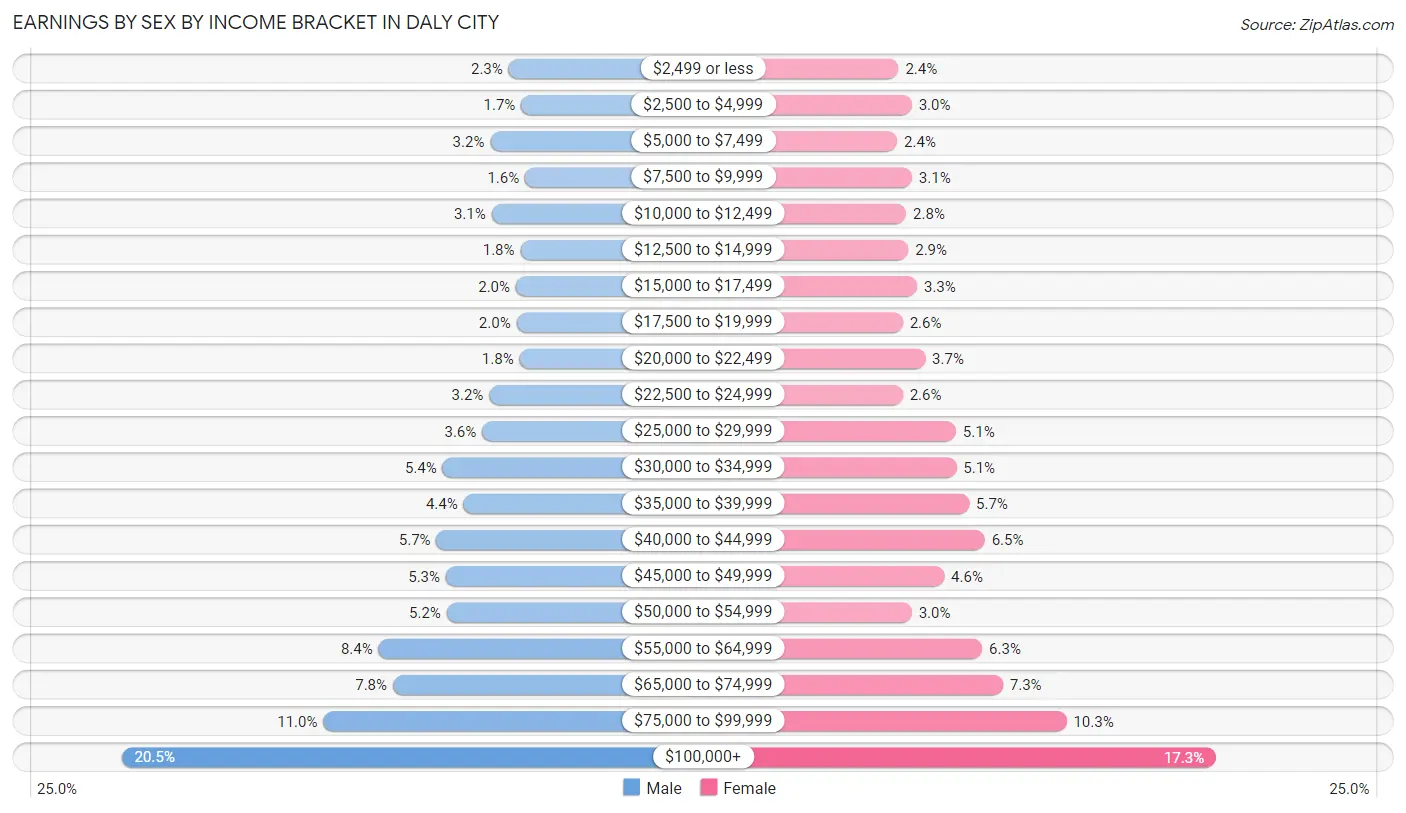
Earnings by Sex by Income Bracket in Daly City
The most common earnings brackets in Daly City are $100,000+ for men (6,671 | 20.5%) and $100,000+ for women (4,976 | 17.3%).
| Income | Male | Female |
| $2,499 or less | 760 (2.3%) | 696 (2.4%) |
| $2,500 to $4,999 | 567 (1.7%) | 876 (3.0%) |
| $5,000 to $7,499 | 1,040 (3.2%) | 680 (2.4%) |
| $7,500 to $9,999 | 509 (1.6%) | 879 (3.0%) |
| $10,000 to $12,499 | 1,021 (3.1%) | 801 (2.8%) |
| $12,500 to $14,999 | 581 (1.8%) | 830 (2.9%) |
| $15,000 to $17,499 | 649 (2.0%) | 946 (3.3%) |
| $17,500 to $19,999 | 639 (2.0%) | 755 (2.6%) |
| $20,000 to $22,499 | 595 (1.8%) | 1,056 (3.7%) |
| $22,500 to $24,999 | 1,055 (3.2%) | 753 (2.6%) |
| $25,000 to $29,999 | 1,163 (3.6%) | 1,471 (5.1%) |
| $30,000 to $34,999 | 1,766 (5.4%) | 1,478 (5.1%) |
| $35,000 to $39,999 | 1,447 (4.4%) | 1,650 (5.7%) |
| $40,000 to $44,999 | 1,862 (5.7%) | 1,861 (6.5%) |
| $45,000 to $49,999 | 1,720 (5.3%) | 1,312 (4.6%) |
| $50,000 to $54,999 | 1,704 (5.2%) | 874 (3.0%) |
| $55,000 to $64,999 | 2,746 (8.4%) | 1,826 (6.3%) |
| $65,000 to $74,999 | 2,526 (7.7%) | 2,105 (7.3%) |
| $75,000 to $99,999 | 3,589 (11.0%) | 2,962 (10.3%) |
| $100,000+ | 6,671 (20.5%) | 4,976 (17.3%) |
| Total | 32,610 (100.0%) | 28,787 (100.0%) |
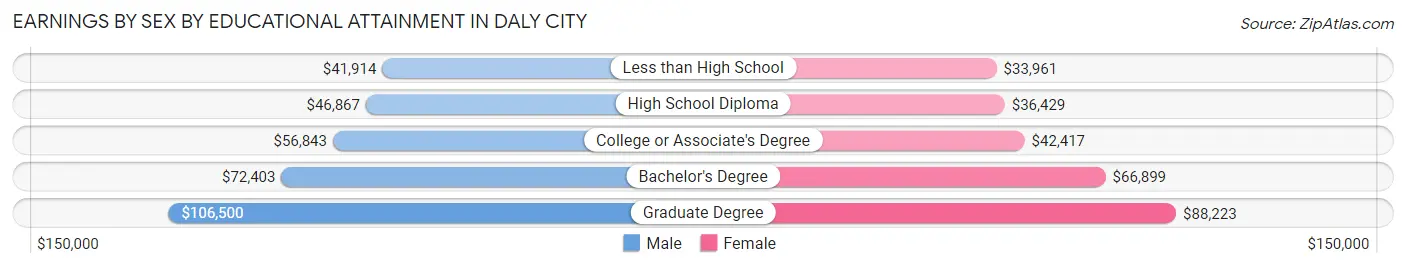
Earnings by Sex by Educational Attainment in Daly City
Average earnings in Daly City are $57,571 for men and $49,117 for women, a difference of 14.7%. Men with an educational attainment of graduate degree enjoy the highest average annual earnings of $106,500, while those with less than high school education earn the least with $41,914. Women with an educational attainment of graduate degree earn the most with the average annual earnings of $88,223, while those with less than high school education have the smallest earnings of $33,961.
| Educational Attainment | Male Income | Female Income |
| Less than High School | $41,914 | $33,961 |
| High School Diploma | $46,867 | $36,429 |
| College or Associate's Degree | $56,843 | $42,417 |
| Bachelor's Degree | $72,403 | $66,899 |
| Graduate Degree | $106,500 | $88,223 |
| Total | $57,571 | $49,117 |
Family Income in Daly City
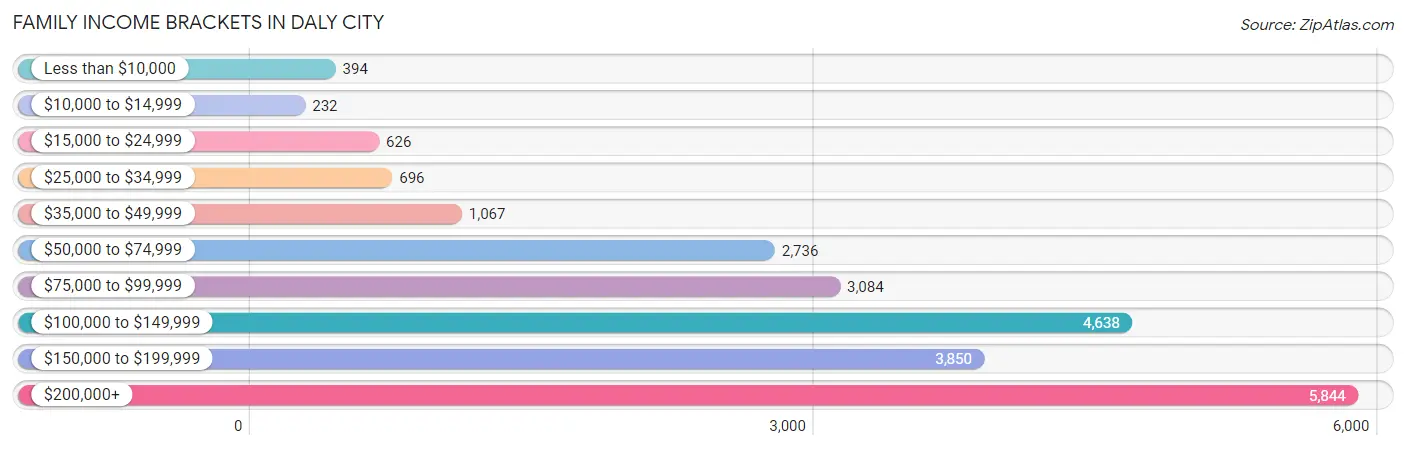
Family Income Brackets in Daly City
According to the Daly City family income data, there are 5,844 families falling into the $200,000+ income range, which is the most common income bracket and makes up 25.2% of all families. Conversely, the $10,000 to $14,999 income bracket is the least frequent group with only 232 families (1.0%) belonging to this category.
| Income Bracket | # Families | % Families |
| Less than $10,000 | 394 | 1.7% |
| $10,000 to $14,999 | 232 | 1.0% |
| $15,000 to $24,999 | 626 | 2.7% |
| $25,000 to $34,999 | 696 | 3.0% |
| $35,000 to $49,999 | 1,067 | 4.6% |
| $50,000 to $74,999 | 2,736 | 11.8% |
| $75,000 to $99,999 | 3,084 | 13.3% |
| $100,000 to $149,999 | 4,638 | 20.0% |
| $150,000 to $199,999 | 3,850 | 16.6% |
| $200,000+ | 5,844 | 25.2% |
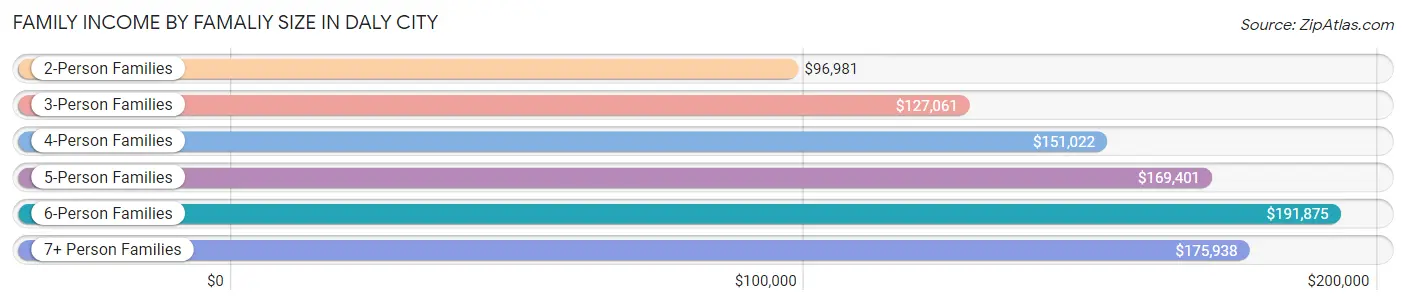
Family Income by Famaliy Size in Daly City
6-person families (1,164 | 5.0%) account for the highest median family income in Daly City with $191,875 per family, while 2-person families (8,522 | 36.7%) have the highest median income of $48,490 per family member.
| Income Bracket | # Families | Median Income |
| 2-Person Families | 8,522 (36.7%) | $96,981 |
| 3-Person Families | 5,793 (25.0%) | $127,061 |
| 4-Person Families | 4,537 (19.6%) | $151,022 |
| 5-Person Families | 2,224 (9.6%) | $169,401 |
| 6-Person Families | 1,164 (5.0%) | $191,875 |
| 7+ Person Families | 950 (4.1%) | $175,938 |
| Total | 23,190 (100.0%) | $130,153 |
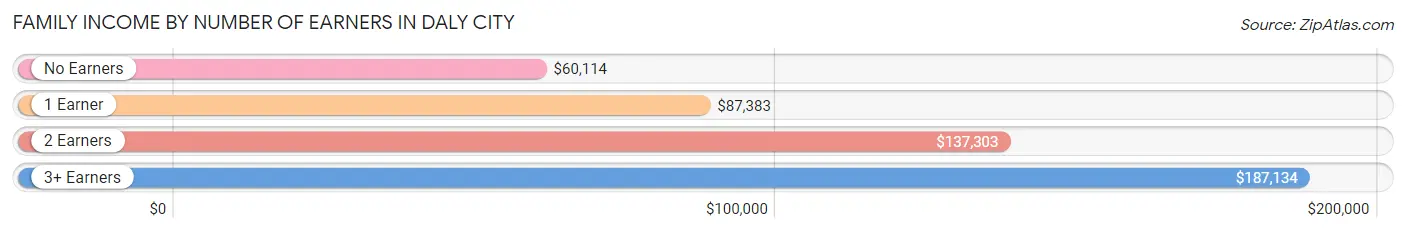
Family Income by Number of Earners in Daly City
The median family income in Daly City is $130,153, with families comprising 3+ earners (5,777) having the highest median family income of $187,134, while families with no earners (2,588) have the lowest median family income of $60,114, accounting for 24.9% and 11.2% of families, respectively.
| Number of Earners | # Families | Median Income |
| No Earners | 2,588 (11.2%) | $60,114 |
| 1 Earner | 5,662 (24.4%) | $87,383 |
| 2 Earners | 9,163 (39.5%) | $137,303 |
| 3+ Earners | 5,777 (24.9%) | $187,134 |
| Total | 23,190 (100.0%) | $130,153 |
Household Income in Daly City
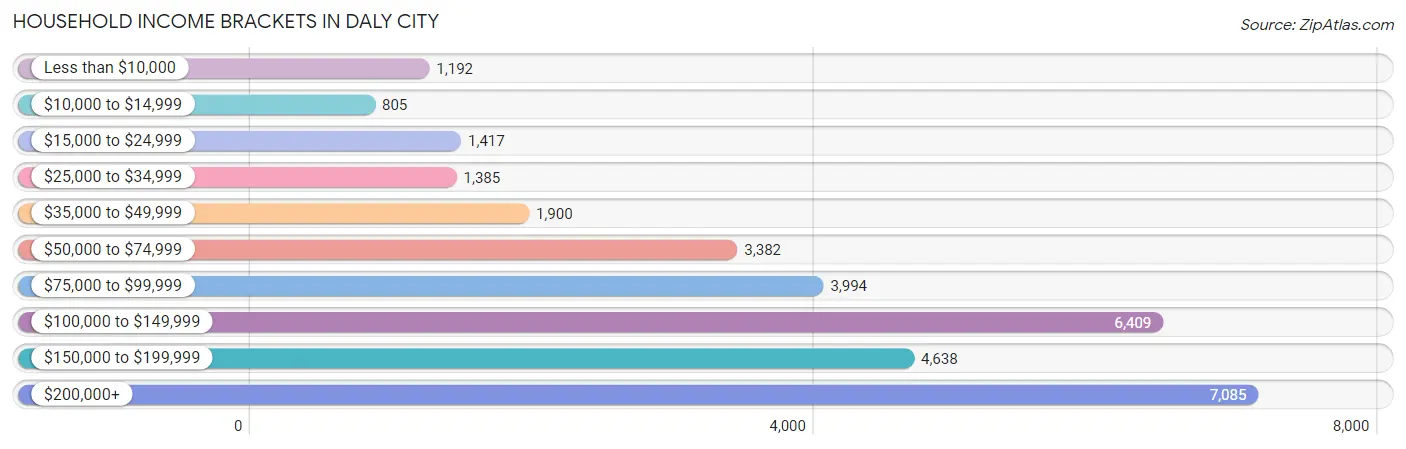
Household Income Brackets in Daly City
With 7,085 households falling in the category, the $200,000+ income range is the most frequent in Daly City, accounting for 22.0% of all households. In contrast, only 805 households (2.5%) fall into the $10,000 to $14,999 income bracket, making it the least populous group.
| Income Bracket | # Households | % Households |
| Less than $10,000 | 1,192 | 3.7% |
| $10,000 to $14,999 | 805 | 2.5% |
| $15,000 to $24,999 | 1,417 | 4.4% |
| $25,000 to $34,999 | 1,385 | 4.3% |
| $35,000 to $49,999 | 1,900 | 5.9% |
| $50,000 to $74,999 | 3,382 | 10.5% |
| $75,000 to $99,999 | 3,994 | 12.4% |
| $100,000 to $149,999 | 6,409 | 19.9% |
| $150,000 to $199,999 | 4,638 | 14.4% |
| $200,000+ | 7,085 | 22.0% |
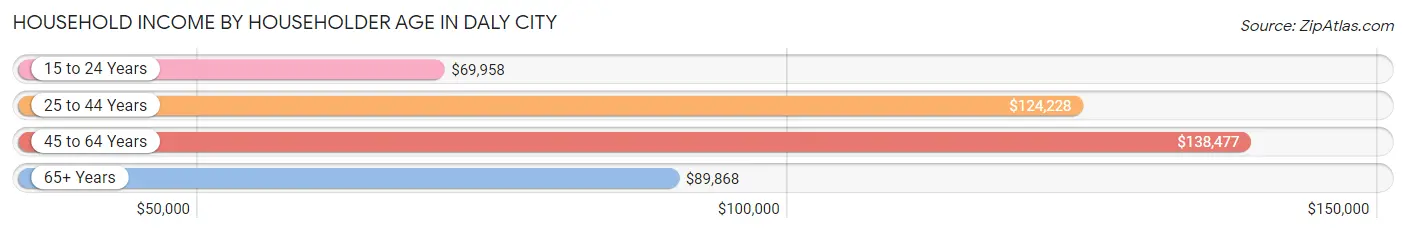
Household Income by Householder Age in Daly City
The median household income in Daly City is $114,910, with the highest median household income of $138,477 found in the 45 to 64 years age bracket for the primary householder. A total of 11,832 households (36.7%) fall into this category. Meanwhile, the 15 to 24 years age bracket for the primary householder has the lowest median household income of $69,958, with 1,019 households (3.2%) in this group.
| Income Bracket | # Households | Median Income |
| 15 to 24 Years | 1,019 (3.2%) | $69,958 |
| 25 to 44 Years | 9,579 (29.7%) | $124,228 |
| 45 to 64 Years | 11,832 (36.7%) | $138,477 |
| 65+ Years | 9,776 (30.3%) | $89,868 |
| Total | 32,206 (100.0%) | $114,910 |
Poverty in Daly City
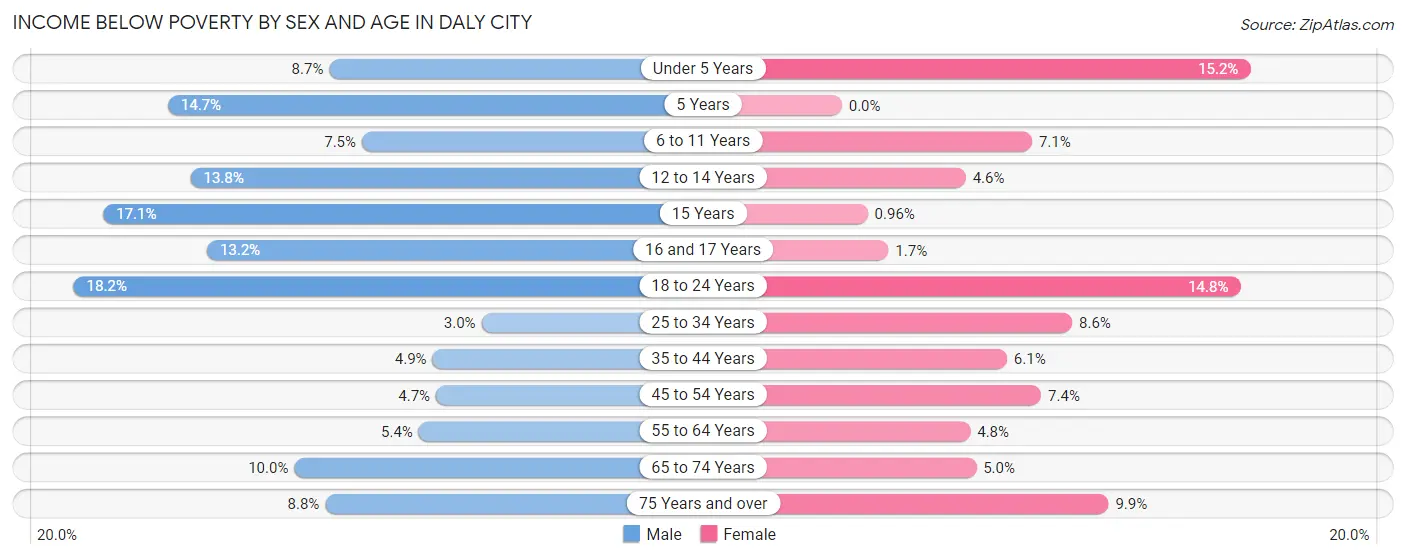
Income Below Poverty by Sex and Age in Daly City
With 7.5% poverty level for males and 7.7% for females among the residents of Daly City, 18 to 24 year old males and under 5 year old females are the most vulnerable to poverty, with 889 males (18.2%) and 345 females (15.2%) in their respective age groups living below the poverty level.
| Age Bracket | Male | Female |
| Under 5 Years | 159 (8.7%) | 345 (15.2%) |
| 5 Years | 85 (14.7%) | 0 (0.0%) |
| 6 to 11 Years | 173 (7.5%) | 166 (7.1%) |
| 12 to 14 Years | 132 (13.8%) | 65 (4.6%) |
| 15 Years | 69 (17.1%) | 5 (1.0%) |
| 16 and 17 Years | 123 (13.2%) | 20 (1.7%) |
| 18 to 24 Years | 889 (18.2%) | 742 (14.8%) |
| 25 to 34 Years | 284 (3.0%) | 659 (8.6%) |
| 35 to 44 Years | 354 (4.9%) | 406 (6.1%) |
| 45 to 54 Years | 315 (4.7%) | 482 (7.4%) |
| 55 to 64 Years | 379 (5.4%) | 333 (4.8%) |
| 65 to 74 Years | 575 (10.0%) | 293 (5.0%) |
| 75 Years and over | 287 (8.8%) | 491 (9.9%) |
| Total | 3,824 (7.5%) | 4,007 (7.7%) |
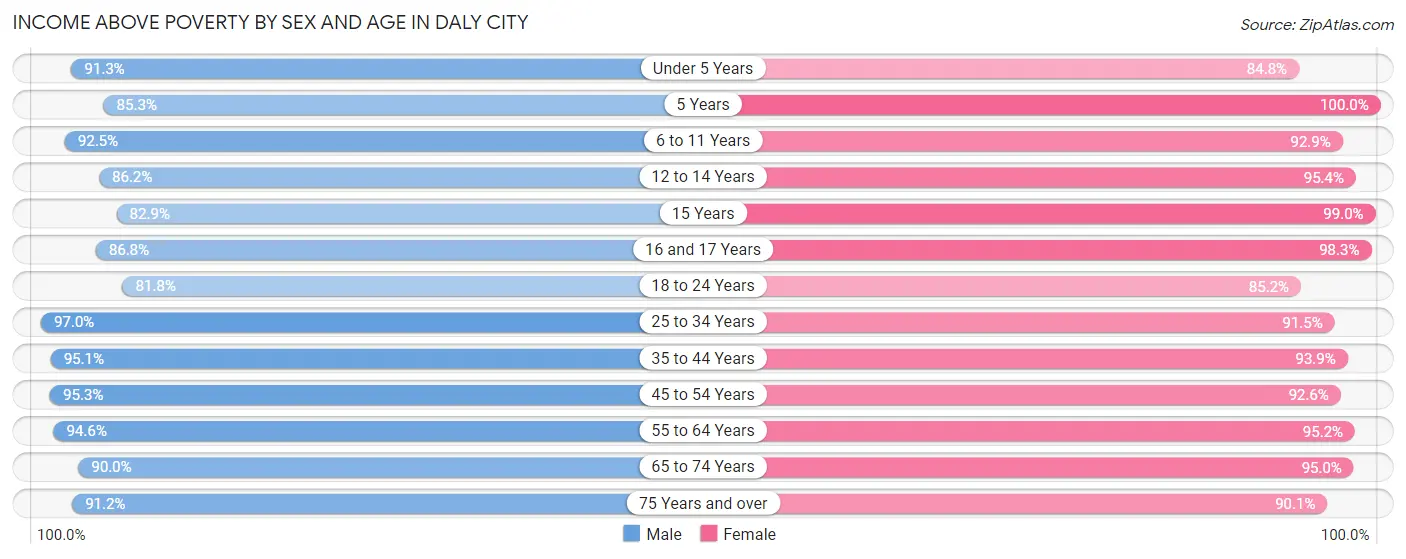
Income Above Poverty by Sex and Age in Daly City
According to the poverty statistics in Daly City, males aged 25 to 34 years and females aged 5 years are the age groups that are most secure financially, with 97.0% of males and 100.0% of females in these age groups living above the poverty line.
| Age Bracket | Male | Female |
| Under 5 Years | 1,670 (91.3%) | 1,931 (84.8%) |
| 5 Years | 494 (85.3%) | 420 (100.0%) |
| 6 to 11 Years | 2,141 (92.5%) | 2,184 (92.9%) |
| 12 to 14 Years | 822 (86.2%) | 1,348 (95.4%) |
| 15 Years | 335 (82.9%) | 515 (99.0%) |
| 16 and 17 Years | 807 (86.8%) | 1,137 (98.3%) |
| 18 to 24 Years | 4,002 (81.8%) | 4,274 (85.2%) |
| 25 to 34 Years | 9,050 (97.0%) | 7,048 (91.4%) |
| 35 to 44 Years | 6,923 (95.1%) | 6,213 (93.9%) |
| 45 to 54 Years | 6,338 (95.3%) | 6,030 (92.6%) |
| 55 to 64 Years | 6,684 (94.6%) | 6,642 (95.2%) |
| 65 to 74 Years | 5,179 (90.0%) | 5,573 (95.0%) |
| 75 Years and over | 2,959 (91.2%) | 4,470 (90.1%) |
| Total | 47,404 (92.5%) | 47,785 (92.3%) |
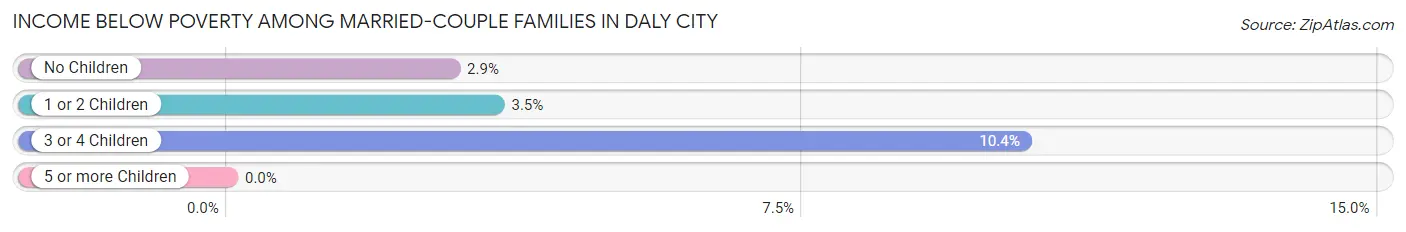
Income Below Poverty Among Married-Couple Families in Daly City
The poverty statistics for married-couple families in Daly City show that 3.4% or 563 of the total 16,732 families live below the poverty line. Families with 3 or 4 children have the highest poverty rate of 10.4%, comprising of 58 families. On the other hand, families with 5 or more children have the lowest poverty rate of 0.0%, which includes 0 families.
| Children | Above Poverty | Below Poverty |
| No Children | 9,663 (97.1%) | 289 (2.9%) |
| 1 or 2 Children | 5,986 (96.5%) | 216 (3.5%) |
| 3 or 4 Children | 502 (89.6%) | 58 (10.4%) |
| 5 or more Children | 18 (100.0%) | 0 (0.0%) |
| Total | 16,169 (96.6%) | 563 (3.4%) |
Income Below Poverty Among Single-Parent Households in Daly City
According to the poverty data in Daly City, 5.8% or 117 single-father households and 8.6% or 378 single-mother households are living below the poverty line. Among single-father households, those with 3 or 4 children have the highest poverty rate, with 7 households (17.9%) experiencing poverty. Likewise, among single-mother households, those with 5 or more children have the highest poverty rate, with 39 households (100.0%) falling below the poverty line.
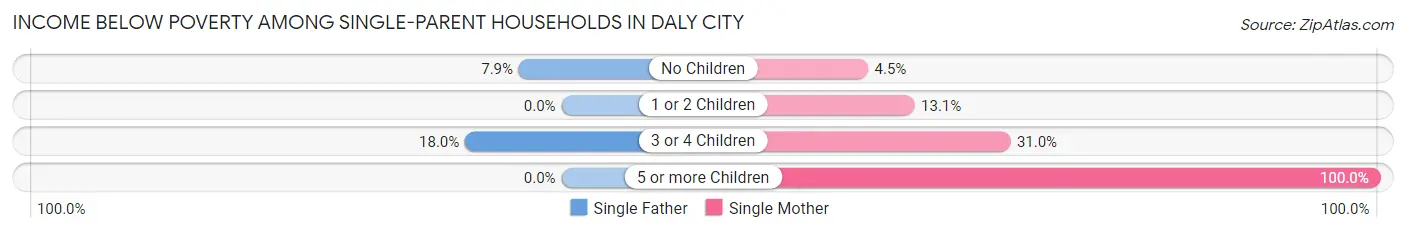
| Children | Single Father | Single Mother |
| No Children | 110 (7.9%) | 132 (4.5%) |
| 1 or 2 Children | 0 (0.0%) | 172 (13.1%) |
| 3 or 4 Children | 7 (17.9%) | 35 (31.0%) |
| 5 or more Children | 0 (0.0%) | 39 (100.0%) |
| Total | 117 (5.8%) | 378 (8.6%) |
Income Below Poverty Among Married-Couple vs Single-Parent Households in Daly City
The poverty data for Daly City shows that 563 of the married-couple family households (3.4%) and 495 of the single-parent households (7.7%) are living below the poverty level. Within the married-couple family households, those with 3 or 4 children have the highest poverty rate, with 58 households (10.4%) falling below the poverty line. Among the single-parent households, those with 5 or more children have the highest poverty rate, with 39 household (100.0%) living below poverty.
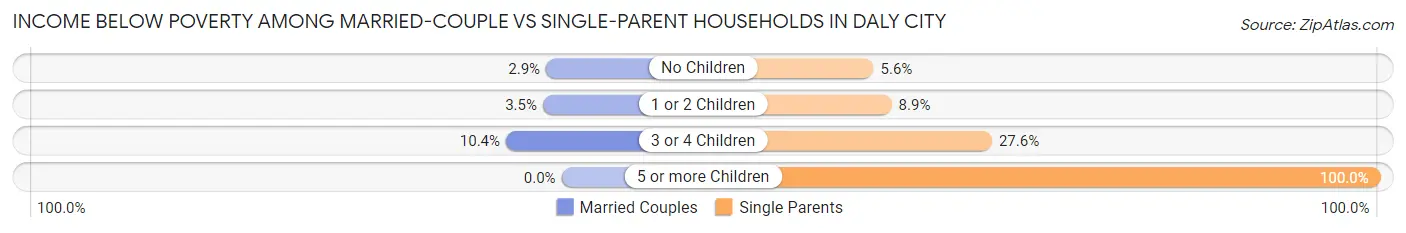
| Children | Married-Couple Families | Single-Parent Households |
| No Children | 289 (2.9%) | 242 (5.6%) |
| 1 or 2 Children | 216 (3.5%) | 172 (8.9%) |
| 3 or 4 Children | 58 (10.4%) | 42 (27.6%) |
| 5 or more Children | 0 (0.0%) | 39 (100.0%) |
| Total | 563 (3.4%) | 495 (7.7%) |
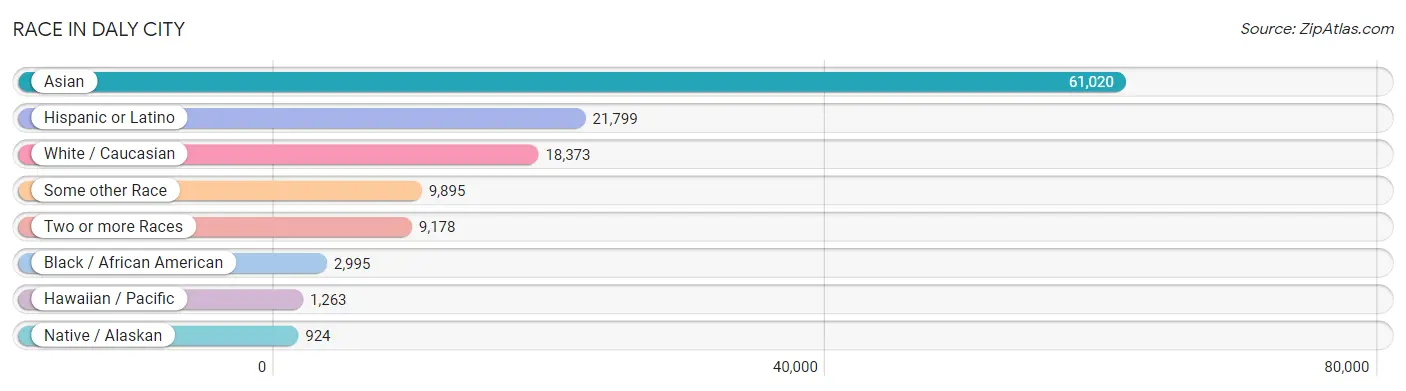
Race in Daly City
The most populous races in Daly City are Asian (61,020 | 58.9%), Hispanic or Latino (21,799 | 21.0%), and White / Caucasian (18,373 | 17.7%).
| Race | # Population | % Population |
| Asian | 61,020 | 58.9% |
| Black / African American | 2,995 | 2.9% |
| Hawaiian / Pacific | 1,263 | 1.2% |
| Hispanic or Latino | 21,799 | 21.0% |
| Native / Alaskan | 924 | 0.9% |
| White / Caucasian | 18,373 | 17.7% |
| Two or more Races | 9,178 | 8.8% |
| Some other Race | 9,895 | 9.6% |
| Total | 103,648 | 100.0% |
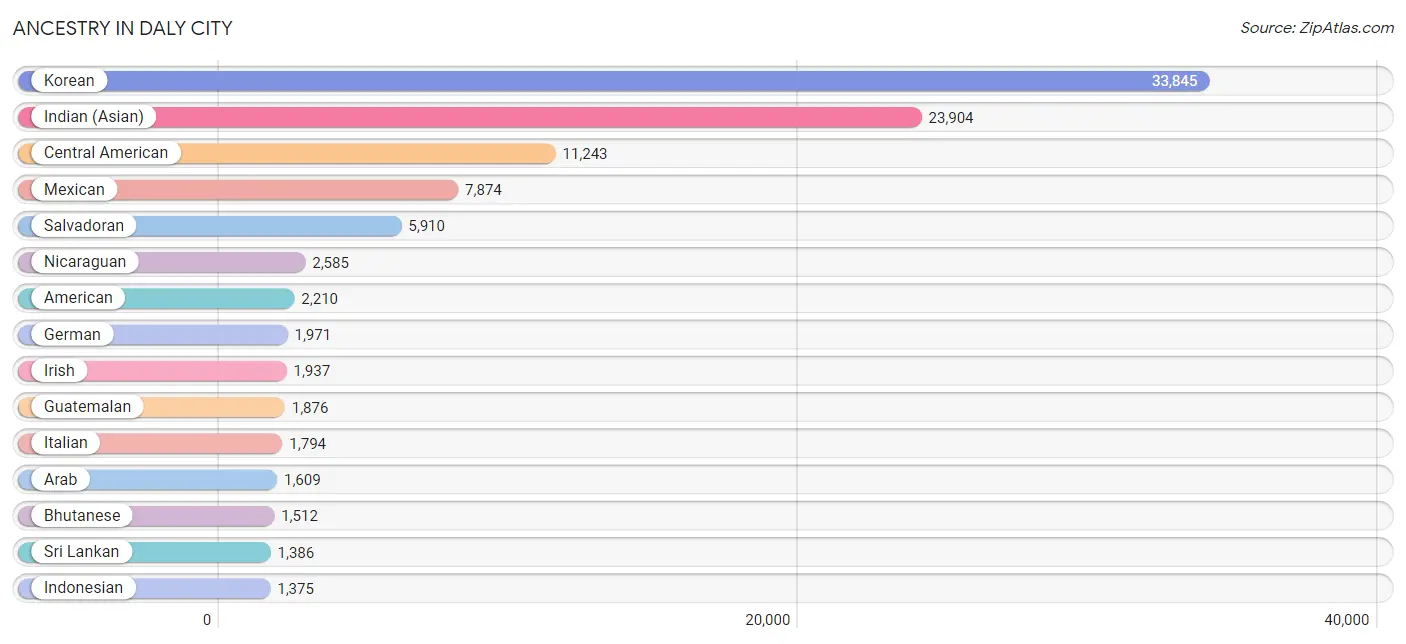
Ancestry in Daly City
The most populous ancestries reported in Daly City are Korean (33,845 | 32.7%), Indian (Asian) (23,904 | 23.1%), Central American (11,243 | 10.8%), Mexican (7,874 | 7.6%), and Salvadoran (5,910 | 5.7%), together accounting for 79.9% of all Daly City residents.
| Ancestry | # Population | % Population |
| African | 138 | 0.1% |
| American | 2,210 | 2.1% |
| Apache | 173 | 0.2% |
| Arab | 1,609 | 1.5% |
| Argentinean | 44 | 0.0% |
| Armenian | 251 | 0.2% |
| Australian | 25 | 0.0% |
| Austrian | 31 | 0.0% |
| Bangladeshi | 163 | 0.2% |
| Basque | 24 | 0.0% |
| Belgian | 23 | 0.0% |
| Belizean | 45 | 0.0% |
| Bhutanese | 1,512 | 1.5% |
| Brazilian | 405 | 0.4% |
| British | 57 | 0.1% |
| Bulgarian | 122 | 0.1% |
| Burmese | 998 | 1.0% |
| Cambodian | 132 | 0.1% |
| Canadian | 43 | 0.0% |
| Celtic | 24 | 0.0% |
| Central American | 11,243 | 10.8% |
| Central American Indian | 252 | 0.2% |
| Cherokee | 84 | 0.1% |
| Chickasaw | 5 | 0.0% |
| Chilean | 10 | 0.0% |
| Chippewa | 90 | 0.1% |
| Choctaw | 23 | 0.0% |
| Colombian | 236 | 0.2% |
| Costa Rican | 33 | 0.0% |
| Croatian | 13 | 0.0% |
| Cuban | 353 | 0.3% |
| Czech | 93 | 0.1% |
| Danish | 63 | 0.1% |
| Dutch | 144 | 0.1% |
| Eastern European | 26 | 0.0% |
| Ecuadorian | 118 | 0.1% |
| Egyptian | 67 | 0.1% |
| English | 1,245 | 1.2% |
| Ethiopian | 58 | 0.1% |
| European | 745 | 0.7% |
| Filipino | 137 | 0.1% |
| Finnish | 58 | 0.1% |
| French | 724 | 0.7% |
| French Canadian | 55 | 0.1% |
| German | 1,971 | 1.9% |
| Greek | 353 | 0.3% |
| Guamanian / Chamorro | 153 | 0.2% |
| Guatemalan | 1,876 | 1.8% |
| Haitian | 32 | 0.0% |
| Honduran | 809 | 0.8% |
| Hungarian | 55 | 0.1% |
| Icelander | 7 | 0.0% |
| Indian (Asian) | 23,904 | 23.1% |
| Indonesian | 1,375 | 1.3% |
| Iranian | 269 | 0.3% |
| Iraqi | 184 | 0.2% |
| Irish | 1,937 | 1.9% |
| Italian | 1,794 | 1.7% |
| Jamaican | 21 | 0.0% |
| Japanese | 221 | 0.2% |
| Jordanian | 349 | 0.3% |
| Kenyan | 61 | 0.1% |
| Korean | 33,845 | 32.7% |
| Laotian | 465 | 0.4% |
| Lebanese | 42 | 0.0% |
| Lithuanian | 7 | 0.0% |
| Malaysian | 95 | 0.1% |
| Maltese | 41 | 0.0% |
| Mexican | 7,874 | 7.6% |
| Mexican American Indian | 316 | 0.3% |
| Mongolian | 22 | 0.0% |
| Native Hawaiian | 278 | 0.3% |
| Navajo | 35 | 0.0% |
| Nepalese | 6 | 0.0% |
| Nicaraguan | 2,585 | 2.5% |
| Nigerian | 40 | 0.0% |
| Northern European | 75 | 0.1% |
| Norwegian | 148 | 0.1% |
| Pakistani | 280 | 0.3% |
| Palestinian | 260 | 0.3% |
| Panamanian | 30 | 0.0% |
| Peruvian | 269 | 0.3% |
| Polish | 346 | 0.3% |
| Portuguese | 406 | 0.4% |
| Pueblo | 38 | 0.0% |
| Puerto Rican | 587 | 0.6% |
| Russian | 554 | 0.5% |
| Salvadoran | 5,910 | 5.7% |
| Samoan | 1,026 | 1.0% |
| Scandinavian | 51 | 0.1% |
| Scotch-Irish | 82 | 0.1% |
| Scottish | 166 | 0.2% |
| Sioux | 190 | 0.2% |
| Slovene | 15 | 0.0% |
| South African | 52 | 0.1% |
| South American | 677 | 0.6% |
| Spaniard | 249 | 0.2% |
| Spanish | 257 | 0.3% |
| Spanish American | 7 | 0.0% |
| Sri Lankan | 1,386 | 1.3% |
| Subsaharan African | 365 | 0.4% |
| Sudanese | 16 | 0.0% |
| Swedish | 217 | 0.2% |
| Swiss | 76 | 0.1% |
| Syrian | 44 | 0.0% |
| Thai | 815 | 0.8% |
| Tongan | 67 | 0.1% |
| Turkish | 44 | 0.0% |
| Ukrainian | 125 | 0.1% |
| Vietnamese | 4 | 0.0% |
| Welsh | 66 | 0.1% |
| Yaqui | 4 | 0.0% |
| Yugoslavian | 7 | 0.0% | View All 113 Rows |
Immigrants in Daly City
The most numerous immigrant groups reported in Daly City came from Asia (39,457 | 38.1%), South Eastern Asia (25,082 | 24.2%), Philippines (21,000 | 20.3%), Eastern Asia (12,153 | 11.7%), and China (11,114 | 10.7%), together accounting for 105.0% of all Daly City residents.
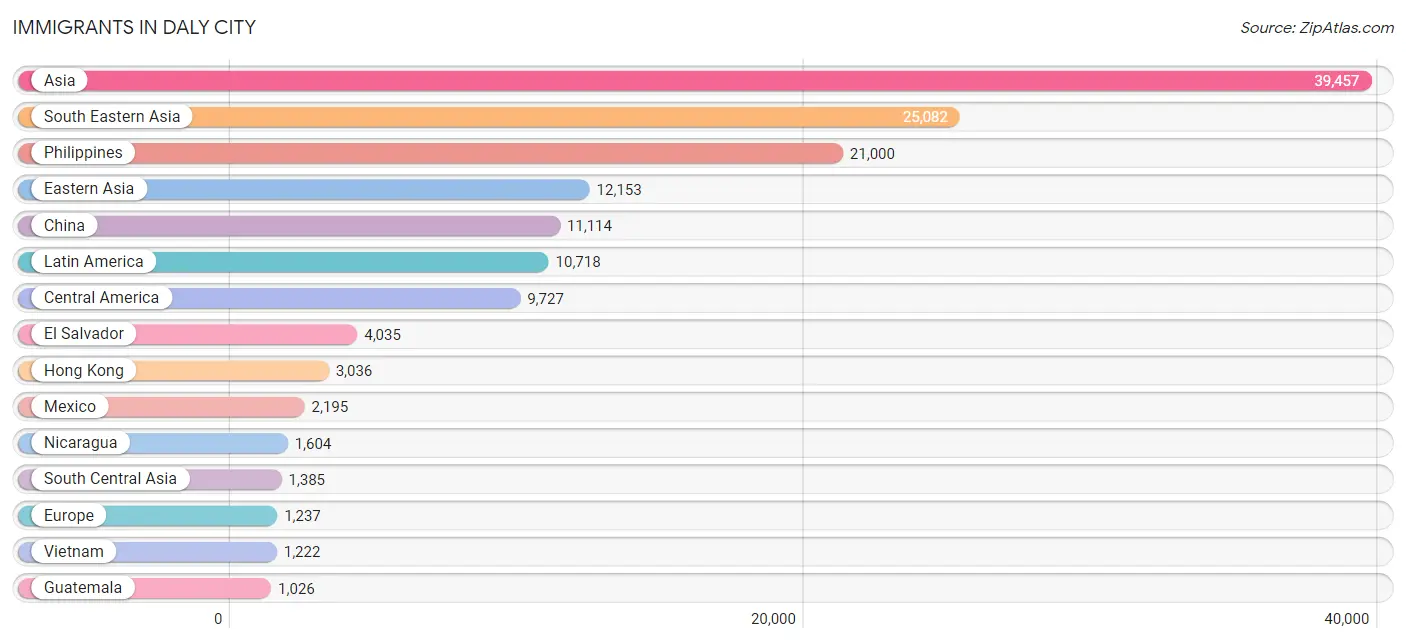
| Immigration Origin | # Population | % Population |
| Africa | 368 | 0.4% |
| Argentina | 44 | 0.0% |
| Armenia | 10 | 0.0% |
| Asia | 39,457 | 38.1% |
| Australia | 46 | 0.0% |
| Bangladesh | 4 | 0.0% |
| Belarus | 44 | 0.0% |
| Belize | 45 | 0.0% |
| Bolivia | 15 | 0.0% |
| Brazil | 291 | 0.3% |
| Bulgaria | 122 | 0.1% |
| Cambodia | 119 | 0.1% |
| Canada | 174 | 0.2% |
| Caribbean | 171 | 0.2% |
| Central America | 9,727 | 9.4% |
| Chile | 10 | 0.0% |
| China | 11,114 | 10.7% |
| Colombia | 143 | 0.1% |
| Costa Rica | 11 | 0.0% |
| Cuba | 150 | 0.1% |
| Eastern Africa | 152 | 0.2% |
| Eastern Asia | 12,153 | 11.7% |
| Eastern Europe | 951 | 0.9% |
| Ecuador | 87 | 0.1% |
| Egypt | 67 | 0.1% |
| El Salvador | 4,035 | 3.9% |
| England | 15 | 0.0% |
| Ethiopia | 59 | 0.1% |
| Europe | 1,237 | 1.2% |
| Fiji | 266 | 0.3% |
| France | 9 | 0.0% |
| Germany | 53 | 0.1% |
| Greece | 29 | 0.0% |
| Guatemala | 1,026 | 1.0% |
| Honduras | 734 | 0.7% |
| Hong Kong | 3,036 | 2.9% |
| Hungary | 8 | 0.0% |
| India | 478 | 0.5% |
| Indonesia | 270 | 0.3% |
| Iran | 201 | 0.2% |
| Iraq | 184 | 0.2% |
| Ireland | 32 | 0.0% |
| Israel | 59 | 0.1% |
| Italy | 63 | 0.1% |
| Jamaica | 21 | 0.0% |
| Japan | 295 | 0.3% |
| Jordan | 193 | 0.2% |
| Kazakhstan | 15 | 0.0% |
| Kenya | 38 | 0.0% |
| Korea | 637 | 0.6% |
| Laos | 37 | 0.0% |
| Latin America | 10,718 | 10.3% |
| Malaysia | 114 | 0.1% |
| Mexico | 2,195 | 2.1% |
| Nepal | 488 | 0.5% |
| Nicaragua | 1,604 | 1.5% |
| Northern Africa | 158 | 0.2% |
| Northern Europe | 88 | 0.1% |
| Oceania | 474 | 0.5% |
| Pakistan | 139 | 0.1% |
| Panama | 73 | 0.1% |
| Peru | 203 | 0.2% |
| Philippines | 21,000 | 20.3% |
| Poland | 19 | 0.0% |
| Portugal | 9 | 0.0% |
| Russia | 434 | 0.4% |
| Saudi Arabia | 73 | 0.1% |
| Scotland | 13 | 0.0% |
| Singapore | 39 | 0.0% |
| South Africa | 58 | 0.1% |
| South America | 820 | 0.8% |
| South Central Asia | 1,385 | 1.3% |
| South Eastern Asia | 25,082 | 24.2% |
| Southern Europe | 136 | 0.1% |
| Sri Lanka | 30 | 0.0% |
| Sudan | 25 | 0.0% |
| Sweden | 28 | 0.0% |
| Taiwan | 283 | 0.3% |
| Thailand | 159 | 0.2% |
| Turkey | 82 | 0.1% |
| Ukraine | 189 | 0.2% |
| Uzbekistan | 30 | 0.0% |
| Vietnam | 1,222 | 1.2% |
| Western Asia | 770 | 0.7% |
| Western Europe | 62 | 0.1% |
| Yemen | 159 | 0.2% |
| Zimbabwe | 45 | 0.0% | View All 87 Rows |
Sex and Age in Daly City
Sex and Age in Daly City
The most populous age groups in Daly City are 30 to 34 Years (4,887 | 9.5%) for men and 25 to 29 Years (4,276 | 8.2%) for women.
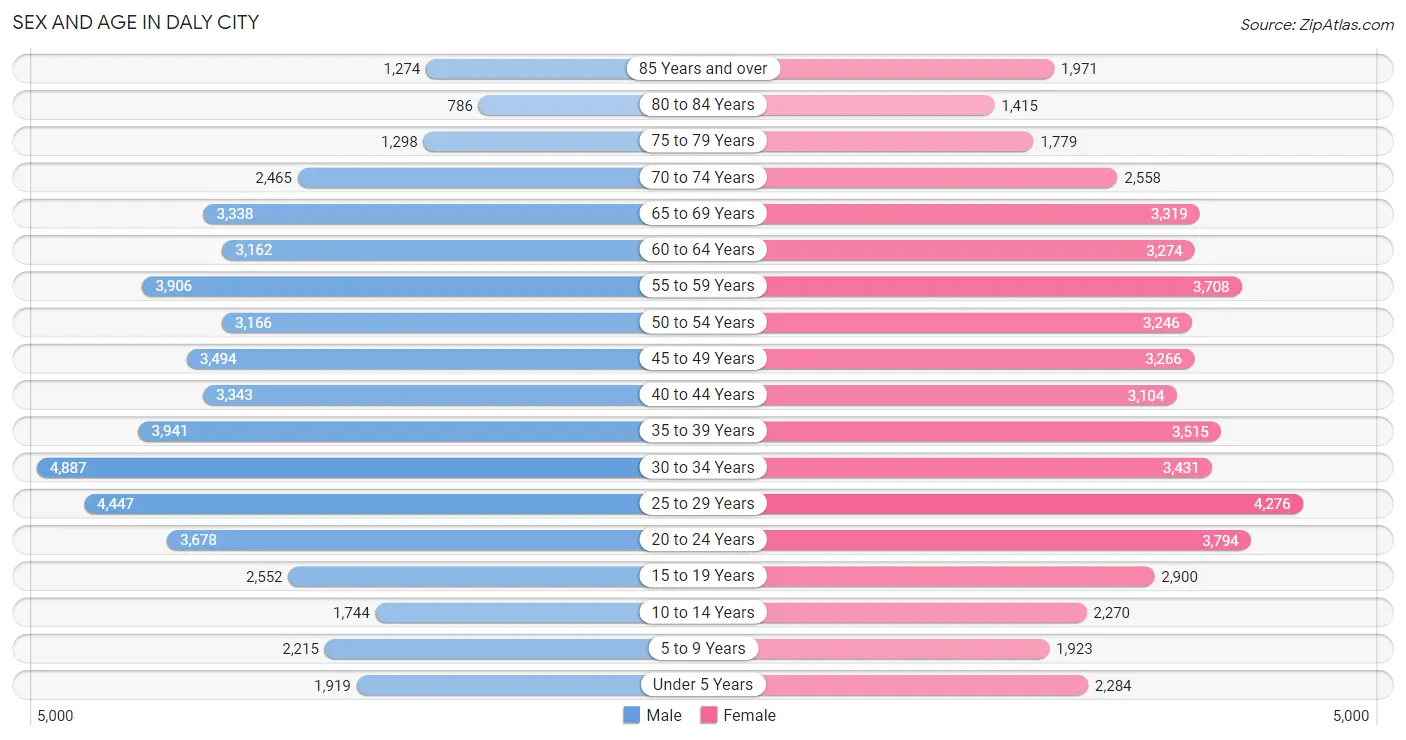
| Age Bracket | Male | Female |
| Under 5 Years | 1,919 (3.7%) | 2,284 (4.4%) |
| 5 to 9 Years | 2,215 (4.3%) | 1,923 (3.7%) |
| 10 to 14 Years | 1,744 (3.4%) | 2,270 (4.4%) |
| 15 to 19 Years | 2,552 (4.9%) | 2,900 (5.6%) |
| 20 to 24 Years | 3,678 (7.1%) | 3,794 (7.3%) |
| 25 to 29 Years | 4,447 (8.6%) | 4,276 (8.2%) |
| 30 to 34 Years | 4,887 (9.5%) | 3,431 (6.6%) |
| 35 to 39 Years | 3,941 (7.6%) | 3,515 (6.8%) |
| 40 to 44 Years | 3,343 (6.5%) | 3,104 (6.0%) |
| 45 to 49 Years | 3,494 (6.8%) | 3,266 (6.3%) |
| 50 to 54 Years | 3,166 (6.1%) | 3,246 (6.2%) |
| 55 to 59 Years | 3,906 (7.6%) | 3,708 (7.1%) |
| 60 to 64 Years | 3,162 (6.1%) | 3,274 (6.3%) |
| 65 to 69 Years | 3,338 (6.5%) | 3,319 (6.4%) |
| 70 to 74 Years | 2,465 (4.8%) | 2,558 (4.9%) |
| 75 to 79 Years | 1,298 (2.5%) | 1,779 (3.4%) |
| 80 to 84 Years | 786 (1.5%) | 1,415 (2.7%) |
| 85 Years and over | 1,274 (2.5%) | 1,971 (3.8%) |
| Total | 51,615 (100.0%) | 52,033 (100.0%) |
Families and Households in Daly City
Median Family Size in Daly City
The median family size in Daly City is 3.61 persons per family, with married-couple families (16,732 | 72.2%) accounting for the largest median family size of 3.69 persons per family. On the other hand, single male/father families (2,036 | 8.8%) represent the smallest median family size with 3.32 persons per family.
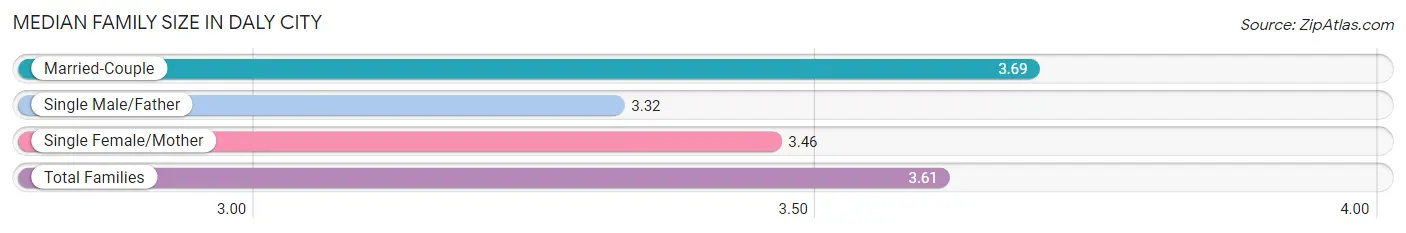
| Family Type | # Families | Family Size |
| Married-Couple | 16,732 (72.2%) | 3.69 |
| Single Male/Father | 2,036 (8.8%) | 3.32 |
| Single Female/Mother | 4,422 (19.1%) | 3.46 |
| Total Families | 23,190 (100.0%) | 3.61 |
Median Household Size in Daly City
The median household size in Daly City is 3.19 persons per household, with single male/father households (2,036 | 6.3%) accounting for the largest median household size of 3.88 persons per household. non-family households (9,016 | 28.0%) represent the smallest median household size with 1.53 persons per household.
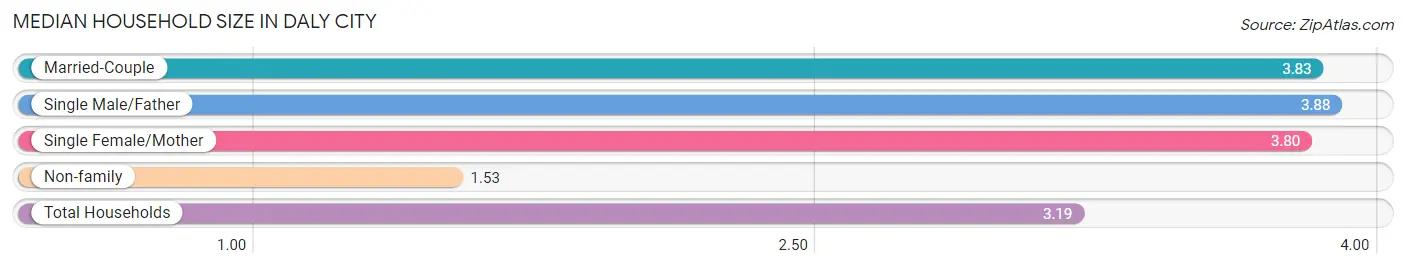
| Household Type | # Households | Household Size |
| Married-Couple | 16,732 (51.9%) | 3.83 |
| Single Male/Father | 2,036 (6.3%) | 3.88 |
| Single Female/Mother | 4,422 (13.7%) | 3.80 |
| Non-family | 9,016 (28.0%) | 1.53 |
| Total Households | 32,206 (100.0%) | 3.19 |
Household Size by Marriage Status in Daly City
Out of a total of 32,206 households in Daly City, 23,190 (72.0%) are family households, while 9,016 (28.0%) are nonfamily households. The most numerous type of family households are 2-person households, comprising 7,485, and the most common type of nonfamily households are 1-person households, comprising 6,112.
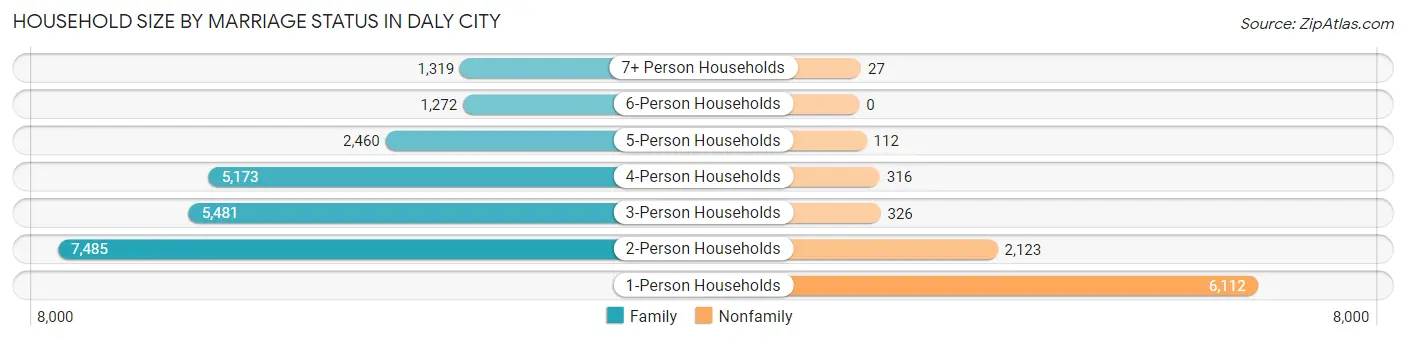
| Household Size | Family Households | Nonfamily Households |
| 1-Person Households | - | 6,112 (19.0%) |
| 2-Person Households | 7,485 (23.2%) | 2,123 (6.6%) |
| 3-Person Households | 5,481 (17.0%) | 326 (1.0%) |
| 4-Person Households | 5,173 (16.1%) | 316 (1.0%) |
| 5-Person Households | 2,460 (7.6%) | 112 (0.4%) |
| 6-Person Households | 1,272 (4.0%) | 0 (0.0%) |
| 7+ Person Households | 1,319 (4.1%) | 27 (0.1%) |
| Total | 23,190 (72.0%) | 9,016 (28.0%) |
Female Fertility in Daly City
Fertility by Age in Daly City
Average fertility rate in Daly City is 53.0 births per 1,000 women. Women in the age bracket of 20 to 34 years have the highest fertility rate with 61.0 births per 1,000 women. Women in the age bracket of 20 to 34 years acount for 52.9% of all women with births.
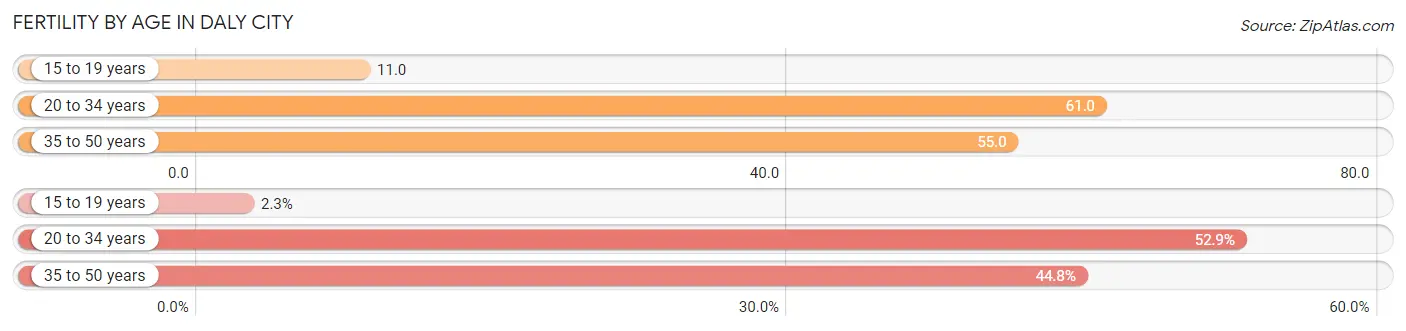
| Age Bracket | Women with Births | Births / 1,000 Women |
| 15 to 19 years | 31 (2.3%) | 11.0 |
| 20 to 34 years | 699 (52.9%) | 61.0 |
| 35 to 50 years | 592 (44.8%) | 55.0 |
| Total | 1,322 (100.0%) | 53.0 |
Fertility by Age by Marriage Status in Daly City
78.6% of women with births (1,322) in Daly City are married. The highest percentage of unmarried women with births falls into 15 to 19 years age bracket with 100.0% of them unmarried at the time of birth, while the lowest percentage of unmarried women with births belong to 35 to 50 years age bracket with 3.2% of them unmarried.
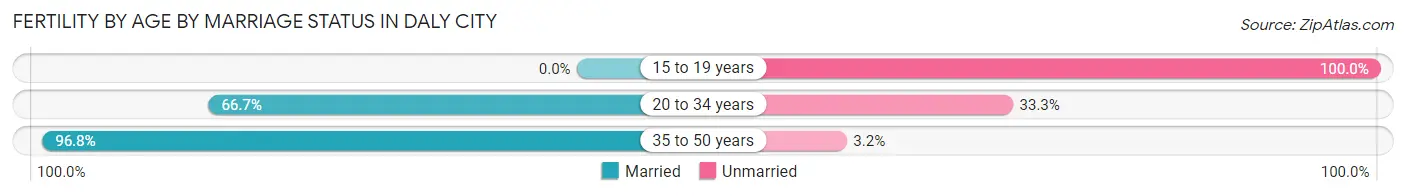
| Age Bracket | Married | Unmarried |
| 15 to 19 years | 0 (0.0%) | 31 (100.0%) |
| 20 to 34 years | 466 (66.7%) | 233 (33.3%) |
| 35 to 50 years | 573 (96.8%) | 19 (3.2%) |
| Total | 1,039 (78.6%) | 283 (21.4%) |
Fertility by Education in Daly City
Average fertility rate in Daly City is 53.0 births per 1,000 women. Women with the education attainment of graduate degree have the highest fertility rate of 103.0 births per 1,000 women, while women with the education attainment of less than high school have the lowest fertility at 20.0 births per 1,000 women. Women with the education attainment of bachelor's degree represent 41.7% of all women with births.
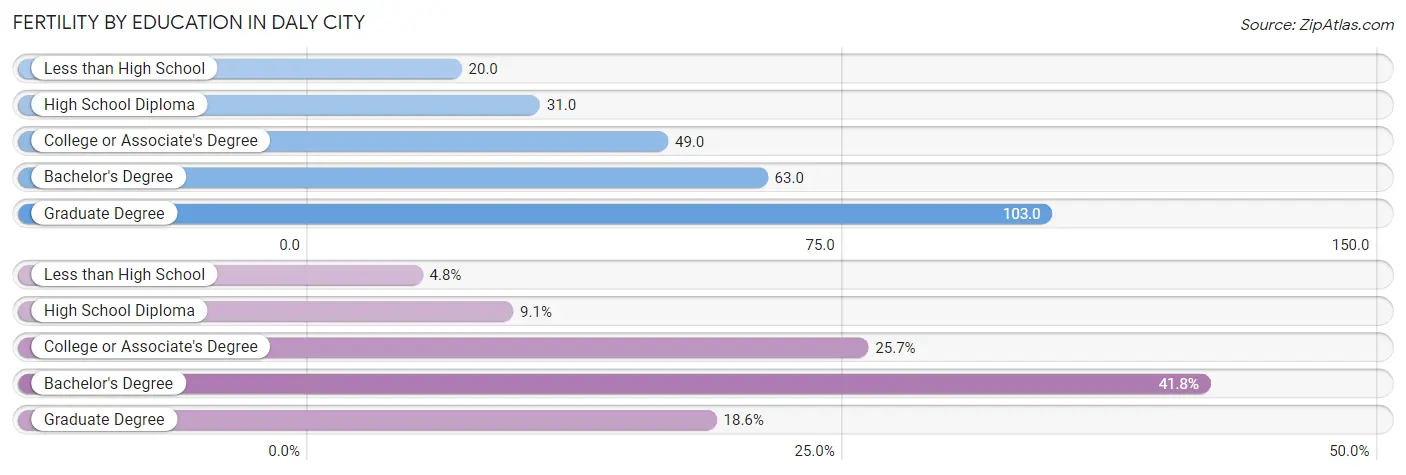
| Educational Attainment | Women with Births | Births / 1,000 Women |
| Less than High School | 64 (4.8%) | 20.0 |
| High School Diploma | 120 (9.1%) | 31.0 |
| College or Associate's Degree | 340 (25.7%) | 49.0 |
| Bachelor's Degree | 552 (41.7%) | 63.0 |
| Graduate Degree | 246 (18.6%) | 103.0 |
| Total | 1,322 (100.0%) | 53.0 |
Fertility by Education by Marriage Status in Daly City
21.4% of women with births in Daly City are unmarried. Women with the educational attainment of graduate degree are most likely to be married with 93.9% of them married at childbirth, while women with the educational attainment of less than high school are least likely to be married with 75.0% of them unmarried at childbirth.
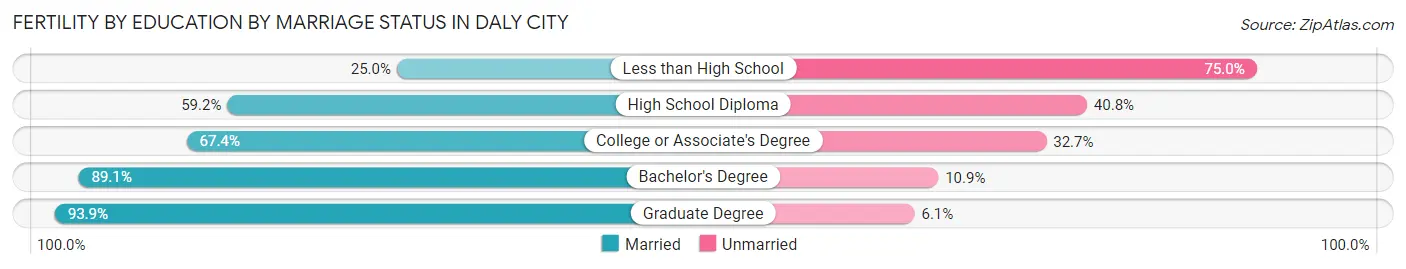
| Educational Attainment | Married | Unmarried |
| Less than High School | 16 (25.0%) | 48 (75.0%) |
| High School Diploma | 71 (59.2%) | 49 (40.8%) |
| College or Associate's Degree | 229 (67.3%) | 111 (32.7%) |
| Bachelor's Degree | 492 (89.1%) | 60 (10.9%) |
| Graduate Degree | 231 (93.9%) | 15 (6.1%) |
| Total | 1,039 (78.6%) | 283 (21.4%) |
Employment Characteristics in Daly City
Employment by Class of Employer in Daly City
Among the 56,695 employed individuals in Daly City, private company employees (39,703 | 70.0%), not-for-profit organizations (4,337 | 7.6%), and local government employees (4,263 | 7.5%) make up the most common classes of employment.
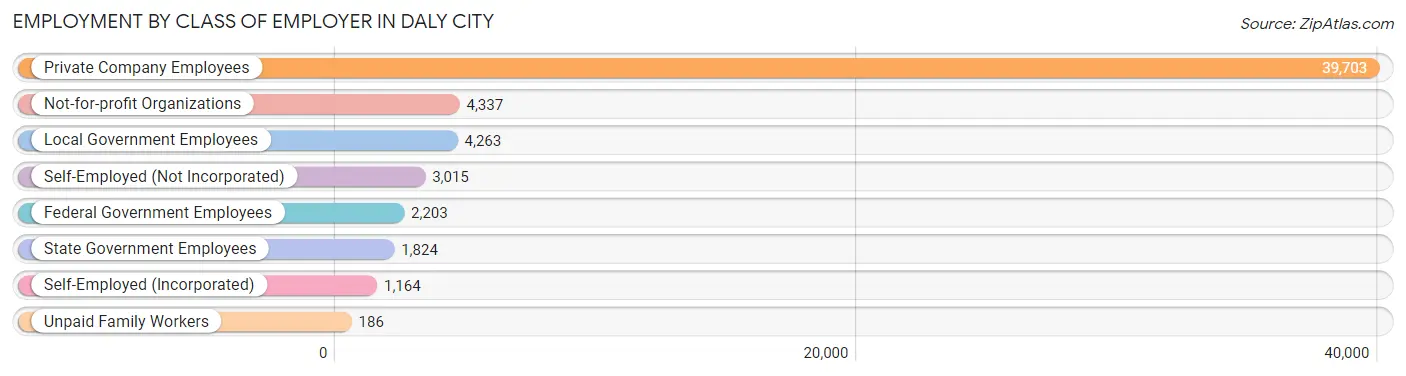
| Employer Class | # Employees | % Employees |
| Private Company Employees | 39,703 | 70.0% |
| Self-Employed (Incorporated) | 1,164 | 2.1% |
| Self-Employed (Not Incorporated) | 3,015 | 5.3% |
| Not-for-profit Organizations | 4,337 | 7.6% |
| Local Government Employees | 4,263 | 7.5% |
| State Government Employees | 1,824 | 3.2% |
| Federal Government Employees | 2,203 | 3.9% |
| Unpaid Family Workers | 186 | 0.3% |
| Total | 56,695 | 100.0% |
Employment Status by Age in Daly City
According to the labor force statistics for Daly City, out of the total population over 16 years of age (90,365), 67.7% or 61,177 individuals are in the labor force, with 5.4% or 3,304 of them unemployed. The age group with the highest labor force participation rate is 35 to 44 years, with 91.5% or 12,721 individuals in the labor force. Within the labor force, the 16 to 19 years age range has the highest percentage of unemployed individuals, with 17.9% or 249 of them being unemployed.
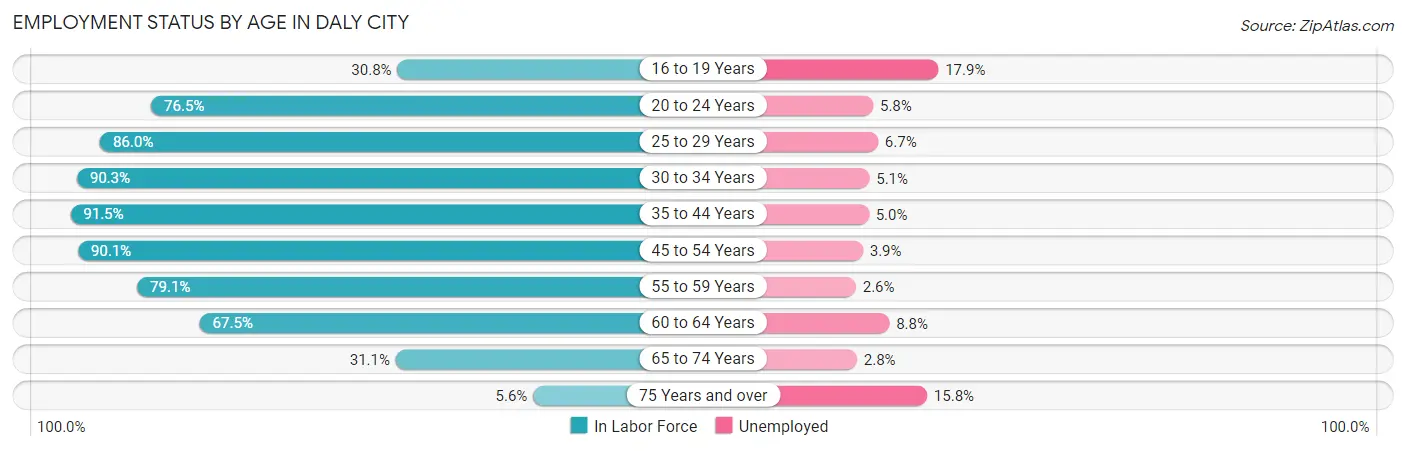
| Age Bracket | In Labor Force | Unemployed |
| 16 to 19 Years | 1,393 (30.8%) | 249 (17.9%) |
| 20 to 24 Years | 5,716 (76.5%) | 332 (5.8%) |
| 25 to 29 Years | 7,502 (86.0%) | 503 (6.7%) |
| 30 to 34 Years | 7,511 (90.3%) | 383 (5.1%) |
| 35 to 44 Years | 12,721 (91.5%) | 636 (5.0%) |
| 45 to 54 Years | 11,868 (90.1%) | 463 (3.9%) |
| 55 to 59 Years | 6,023 (79.1%) | 157 (2.6%) |
| 60 to 64 Years | 4,344 (67.5%) | 382 (8.8%) |
| 65 to 74 Years | 3,632 (31.1%) | 102 (2.8%) |
| 75 Years and over | 477 (5.6%) | 75 (15.8%) |
| Total | 61,177 (67.7%) | 3,304 (5.4%) |
Employment Status by Educational Attainment in Daly City
According to labor force statistics for Daly City, 85.9% of individuals (49,965) out of the total population between 25 and 64 years of age (58,166) are in the labor force, with 5.0% or 2,498 of them being unemployed. The group with the highest labor force participation rate are those with the educational attainment of bachelor's degree or higher, with 91.7% or 21,681 individuals in the labor force. Within the labor force, individuals with less than high school education have the highest percentage of unemployment, with 10.1% or 447 of them being unemployed.
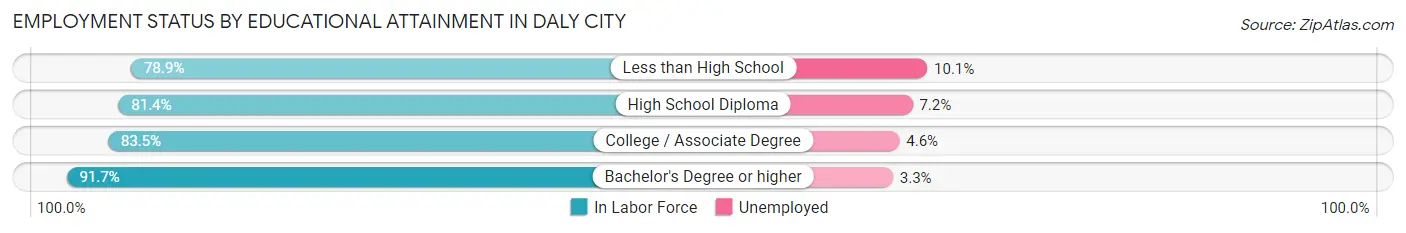
| Educational Attainment | In Labor Force | Unemployed |
| Less than High School | 4,429 (78.9%) | 567 (10.1%) |
| High School Diploma | 9,964 (81.4%) | 881 (7.2%) |
| College / Associate Degree | 13,918 (83.5%) | 767 (4.6%) |
| Bachelor's Degree or higher | 21,681 (91.7%) | 780 (3.3%) |
| Total | 49,965 (85.9%) | 2,908 (5.0%) |
Employment Occupations by Sex in Daly City
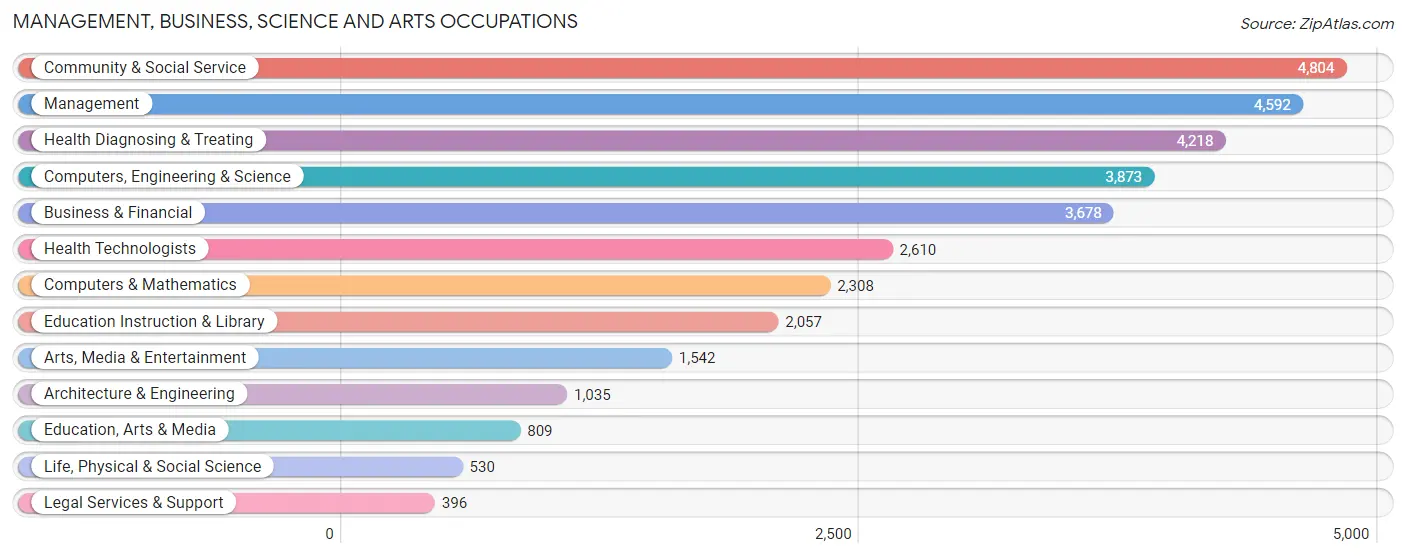
Management, Business, Science and Arts Occupations
The most common Management, Business, Science and Arts occupations in Daly City are Community & Social Service (4,804 | 8.3%), Management (4,592 | 8.0%), Health Diagnosing & Treating (4,218 | 7.3%), Computers, Engineering & Science (3,873 | 6.7%), and Business & Financial (3,678 | 6.4%).
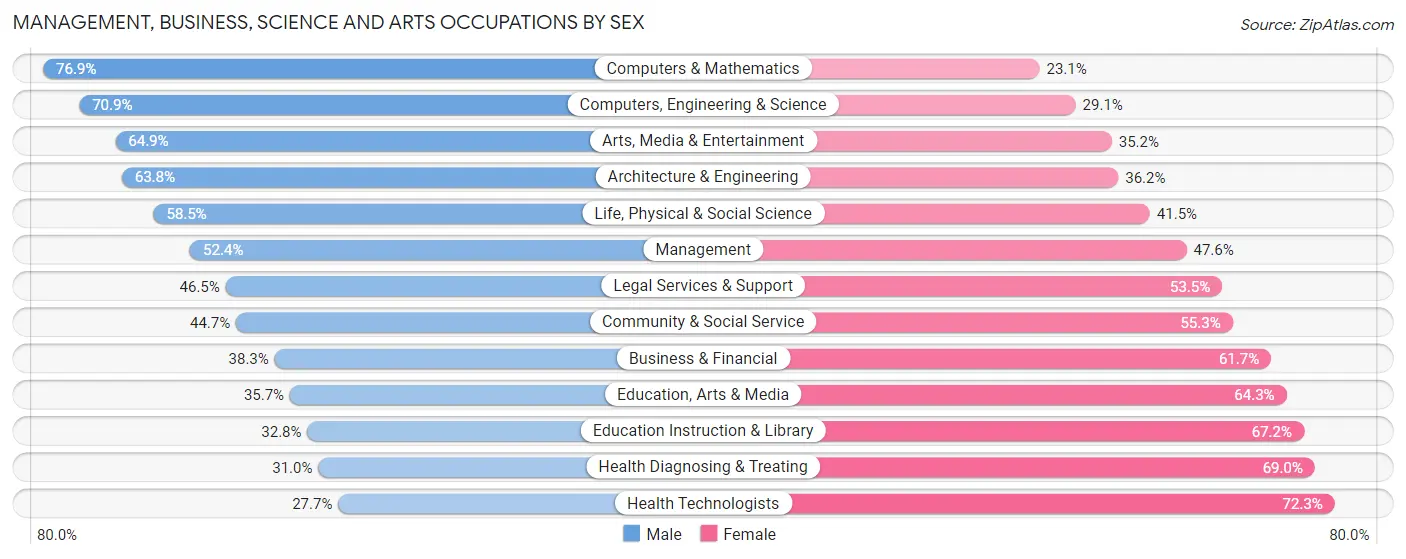
Management, Business, Science and Arts Occupations by Sex
Within the Management, Business, Science and Arts occupations in Daly City, the most male-oriented occupations are Computers & Mathematics (76.9%), Computers, Engineering & Science (70.9%), and Arts, Media & Entertainment (64.8%), while the most female-oriented occupations are Health Technologists (72.3%), Health Diagnosing & Treating (69.0%), and Education Instruction & Library (67.2%).
| Occupation | Male | Female |
| Management | 2,405 (52.4%) | 2,187 (47.6%) |
| Business & Financial | 1,408 (38.3%) | 2,270 (61.7%) |
| Computers, Engineering & Science | 2,745 (70.9%) | 1,128 (29.1%) |
| Computers & Mathematics | 1,775 (76.9%) | 533 (23.1%) |
| Architecture & Engineering | 660 (63.8%) | 375 (36.2%) |
| Life, Physical & Social Science | 310 (58.5%) | 220 (41.5%) |
| Community & Social Service | 2,148 (44.7%) | 2,656 (55.3%) |
| Education, Arts & Media | 289 (35.7%) | 520 (64.3%) |
| Legal Services & Support | 184 (46.5%) | 212 (53.5%) |
| Education Instruction & Library | 675 (32.8%) | 1,382 (67.2%) |
| Arts, Media & Entertainment | 1,000 (64.8%) | 542 (35.1%) |
| Health Diagnosing & Treating | 1,307 (31.0%) | 2,911 (69.0%) |
| Health Technologists | 722 (27.7%) | 1,888 (72.3%) |
| Total (Category) | 10,013 (47.3%) | 11,152 (52.7%) |
| Total (Overall) | 30,637 (53.1%) | 27,049 (46.9%) |
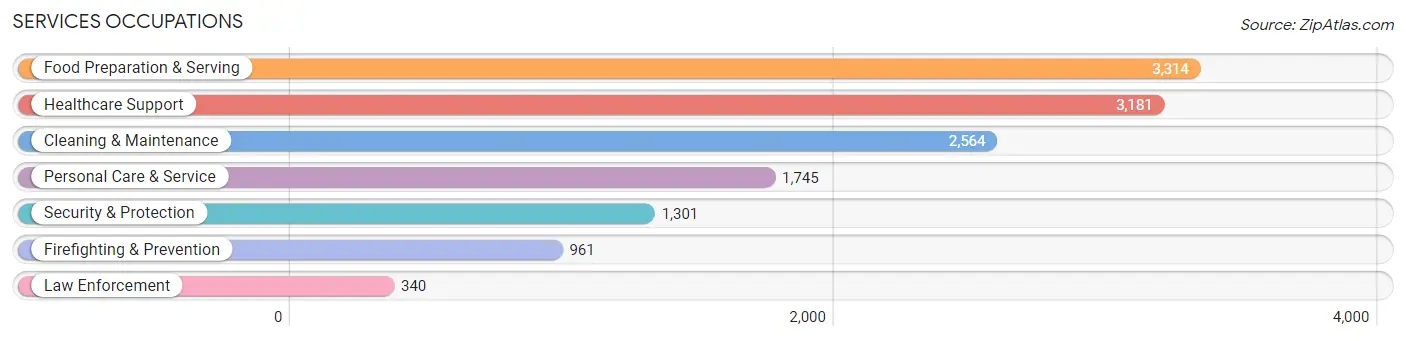
Services Occupations
The most common Services occupations in Daly City are Food Preparation & Serving (3,314 | 5.7%), Healthcare Support (3,181 | 5.5%), Cleaning & Maintenance (2,564 | 4.4%), Personal Care & Service (1,745 | 3.0%), and Security & Protection (1,301 | 2.3%).
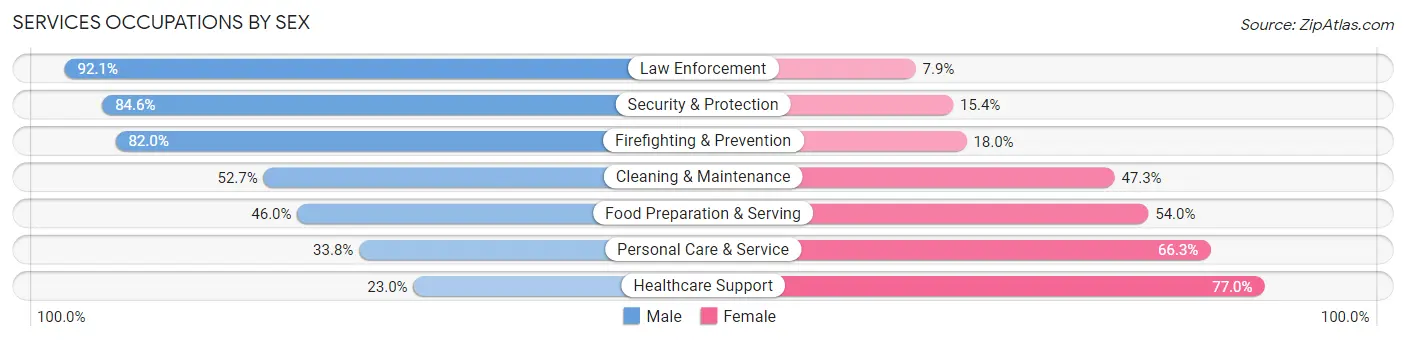
Services Occupations by Sex
Within the Services occupations in Daly City, the most male-oriented occupations are Law Enforcement (92.1%), Security & Protection (84.6%), and Firefighting & Prevention (82.0%), while the most female-oriented occupations are Healthcare Support (77.0%), Personal Care & Service (66.2%), and Food Preparation & Serving (54.0%).
| Occupation | Male | Female |
| Healthcare Support | 732 (23.0%) | 2,449 (77.0%) |
| Security & Protection | 1,101 (84.6%) | 200 (15.4%) |
| Firefighting & Prevention | 788 (82.0%) | 173 (18.0%) |
| Law Enforcement | 313 (92.1%) | 27 (7.9%) |
| Food Preparation & Serving | 1,524 (46.0%) | 1,790 (54.0%) |
| Cleaning & Maintenance | 1,351 (52.7%) | 1,213 (47.3%) |
| Personal Care & Service | 589 (33.8%) | 1,156 (66.2%) |
| Total (Category) | 5,297 (43.8%) | 6,808 (56.2%) |
| Total (Overall) | 30,637 (53.1%) | 27,049 (46.9%) |
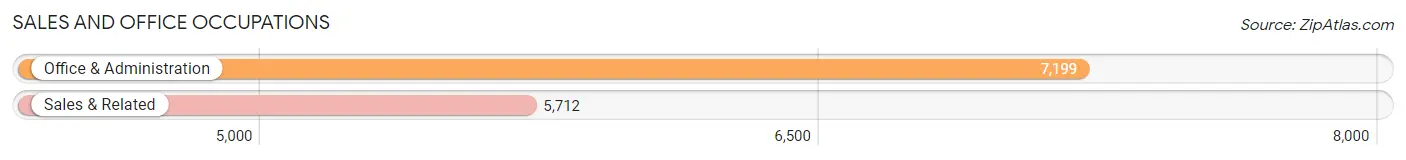
Sales and Office Occupations
The most common Sales and Office occupations in Daly City are Office & Administration (7,199 | 12.5%), and Sales & Related (5,712 | 9.9%).
Sales and Office Occupations by Sex
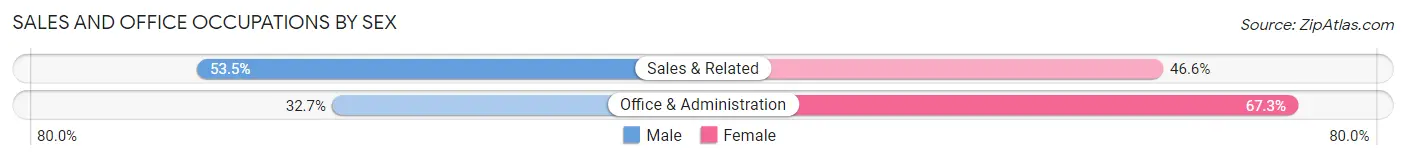
| Occupation | Male | Female |
| Sales & Related | 3,053 (53.4%) | 2,659 (46.6%) |
| Office & Administration | 2,357 (32.7%) | 4,842 (67.3%) |
| Total (Category) | 5,410 (41.9%) | 7,501 (58.1%) |
| Total (Overall) | 30,637 (53.1%) | 27,049 (46.9%) |
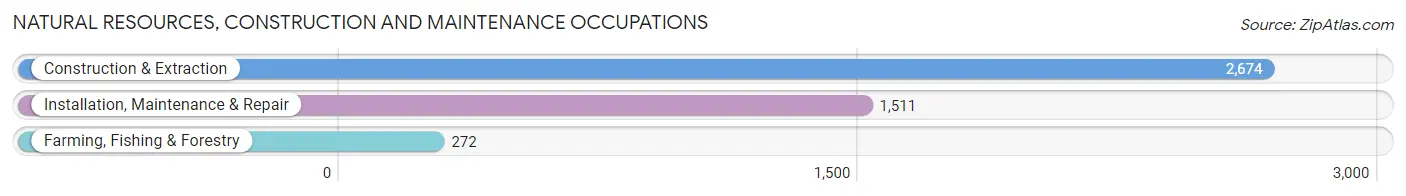
Natural Resources, Construction and Maintenance Occupations
The most common Natural Resources, Construction and Maintenance occupations in Daly City are Construction & Extraction (2,674 | 4.6%), Installation, Maintenance & Repair (1,511 | 2.6%), and Farming, Fishing & Forestry (272 | 0.5%).
Natural Resources, Construction and Maintenance Occupations by Sex
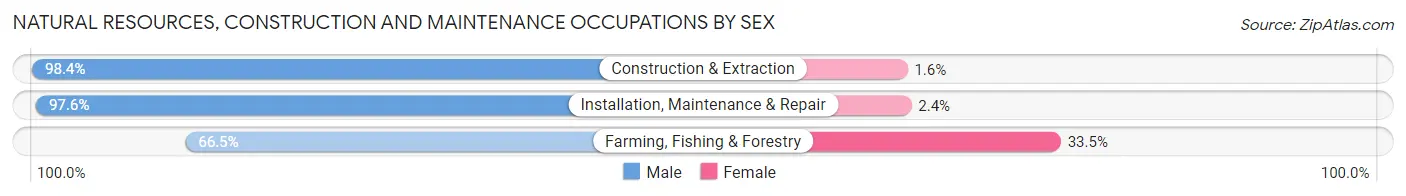
| Occupation | Male | Female |
| Farming, Fishing & Forestry | 181 (66.5%) | 91 (33.5%) |
| Construction & Extraction | 2,632 (98.4%) | 42 (1.6%) |
| Installation, Maintenance & Repair | 1,475 (97.6%) | 36 (2.4%) |
| Total (Category) | 4,288 (96.2%) | 169 (3.8%) |
| Total (Overall) | 30,637 (53.1%) | 27,049 (46.9%) |
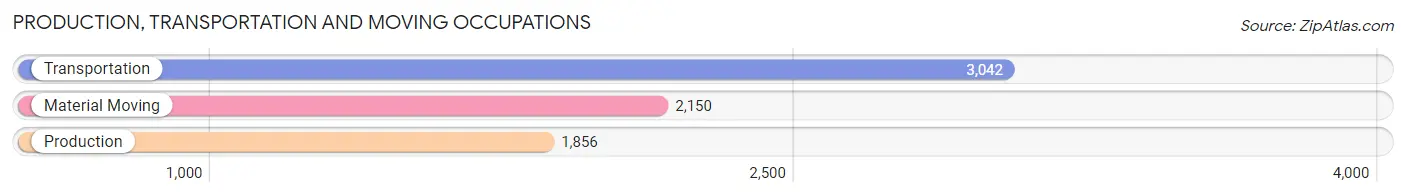
Production, Transportation and Moving Occupations
The most common Production, Transportation and Moving occupations in Daly City are Transportation (3,042 | 5.3%), Material Moving (2,150 | 3.7%), and Production (1,856 | 3.2%).
Production, Transportation and Moving Occupations by Sex
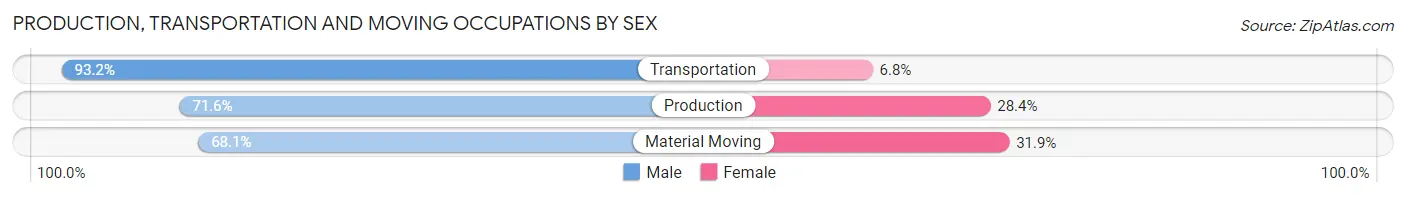
| Occupation | Male | Female |
| Production | 1,329 (71.6%) | 527 (28.4%) |
| Transportation | 2,835 (93.2%) | 207 (6.8%) |
| Material Moving | 1,465 (68.1%) | 685 (31.9%) |
| Total (Category) | 5,629 (79.9%) | 1,419 (20.1%) |
| Total (Overall) | 30,637 (53.1%) | 27,049 (46.9%) |
Employment Industries by Sex in Daly City
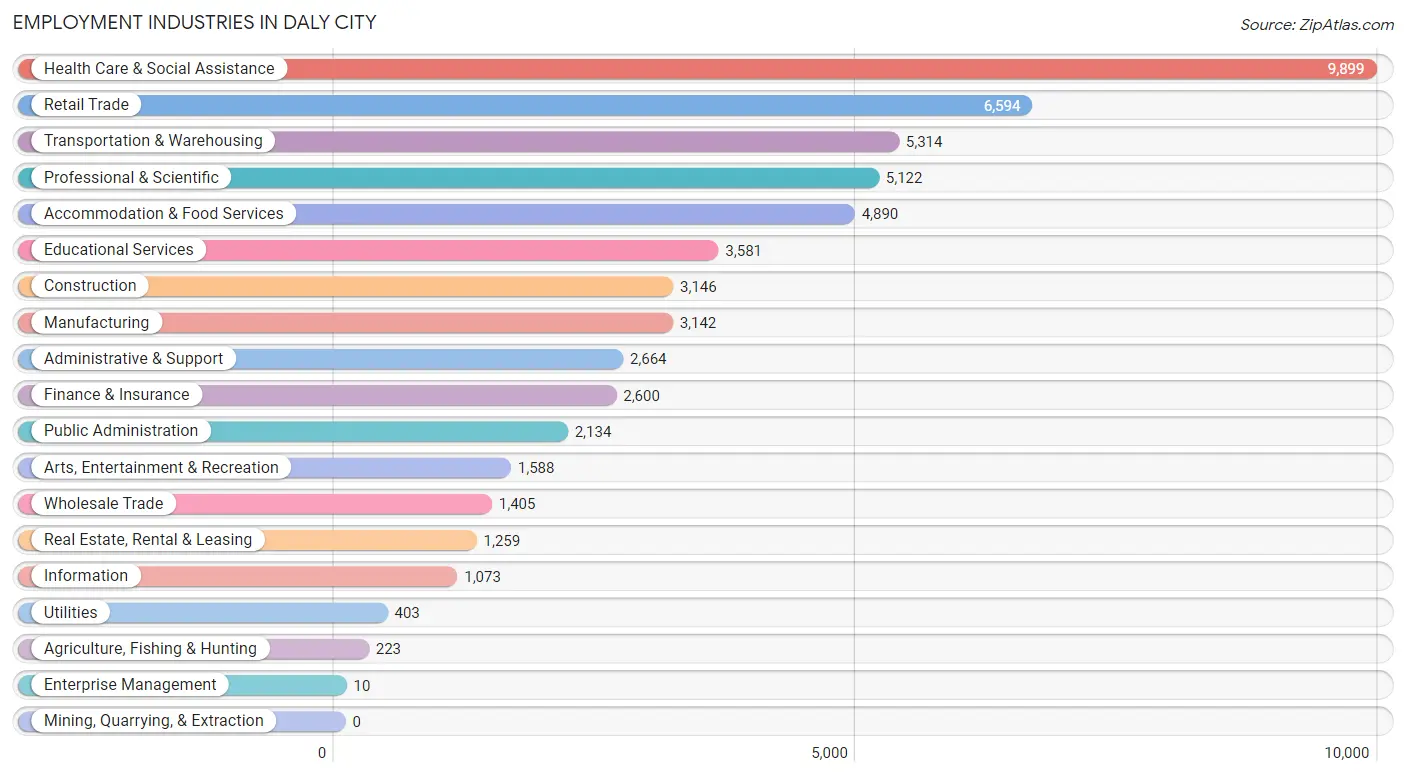
Employment Industries in Daly City
The major employment industries in Daly City include Health Care & Social Assistance (9,899 | 17.2%), Retail Trade (6,594 | 11.4%), Transportation & Warehousing (5,314 | 9.2%), Professional & Scientific (5,122 | 8.9%), and Accommodation & Food Services (4,890 | 8.5%).
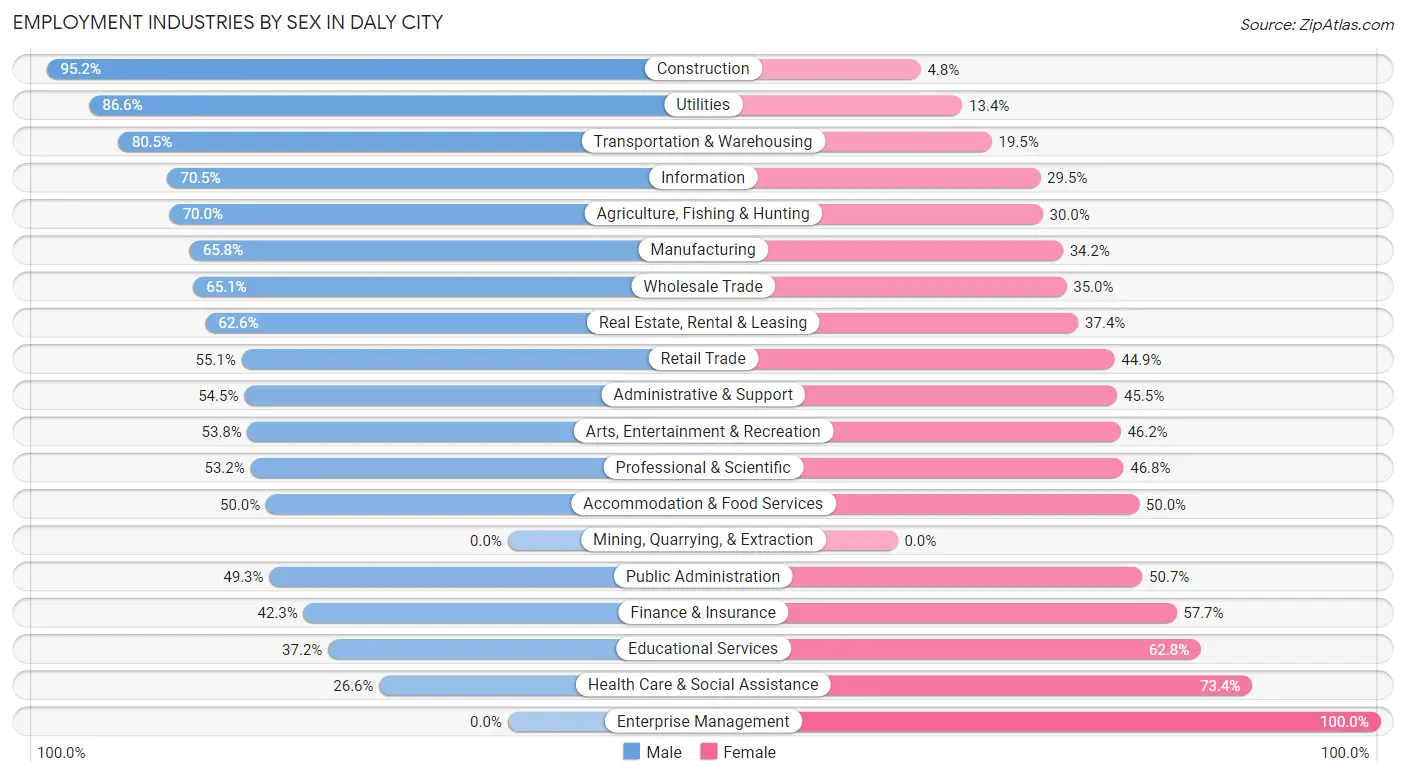
Employment Industries by Sex in Daly City
The Daly City industries that see more men than women are Construction (95.2%), Utilities (86.6%), and Transportation & Warehousing (80.5%), whereas the industries that tend to have a higher number of women are Enterprise Management (100.0%), Health Care & Social Assistance (73.4%), and Educational Services (62.8%).
| Industry | Male | Female |
| Agriculture, Fishing & Hunting | 156 (70.0%) | 67 (30.0%) |
| Mining, Quarrying, & Extraction | 0 (0.0%) | 0 (0.0%) |
| Construction | 2,996 (95.2%) | 150 (4.8%) |
| Manufacturing | 2,067 (65.8%) | 1,075 (34.2%) |
| Wholesale Trade | 914 (65.0%) | 491 (34.9%) |
| Retail Trade | 3,633 (55.1%) | 2,961 (44.9%) |
| Transportation & Warehousing | 4,278 (80.5%) | 1,036 (19.5%) |
| Utilities | 349 (86.6%) | 54 (13.4%) |
| Information | 756 (70.5%) | 317 (29.5%) |
| Finance & Insurance | 1,099 (42.3%) | 1,501 (57.7%) |
| Real Estate, Rental & Leasing | 788 (62.6%) | 471 (37.4%) |
| Professional & Scientific | 2,727 (53.2%) | 2,395 (46.8%) |
| Enterprise Management | 0 (0.0%) | 10 (100.0%) |
| Administrative & Support | 1,453 (54.5%) | 1,211 (45.5%) |
| Educational Services | 1,331 (37.2%) | 2,250 (62.8%) |
| Health Care & Social Assistance | 2,630 (26.6%) | 7,269 (73.4%) |
| Arts, Entertainment & Recreation | 855 (53.8%) | 733 (46.2%) |
| Accommodation & Food Services | 2,446 (50.0%) | 2,444 (50.0%) |
| Public Administration | 1,053 (49.3%) | 1,081 (50.7%) |
| Total | 30,637 (53.1%) | 27,049 (46.9%) |
Education in Daly City
School Enrollment in Daly City
The most common levels of schooling among the 21,927 students in Daly City are college / undergraduate (7,482 | 34.1%), high school (4,096 | 18.7%), and elementary school (3,258 | 14.9%).
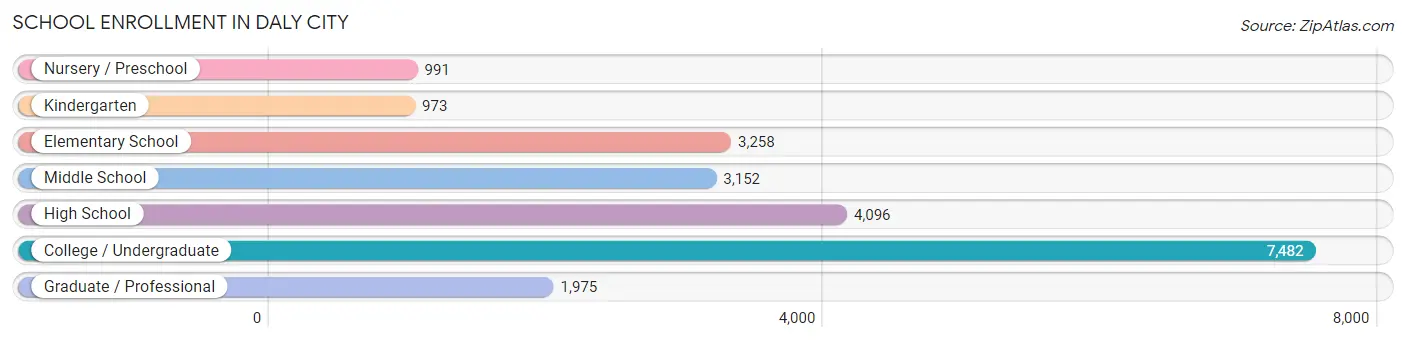
| School Level | # Students | % Students |
| Nursery / Preschool | 991 | 4.5% |
| Kindergarten | 973 | 4.4% |
| Elementary School | 3,258 | 14.9% |
| Middle School | 3,152 | 14.4% |
| High School | 4,096 | 18.7% |
| College / Undergraduate | 7,482 | 34.1% |
| Graduate / Professional | 1,975 | 9.0% |
| Total | 21,927 | 100.0% |
School Enrollment by Age by Funding Source in Daly City
Out of a total of 21,927 students who are enrolled in schools in Daly City, 5,679 (25.9%) attend a private institution, while the remaining 16,248 (74.1%) are enrolled in public schools. The age group of 3 to 4 year olds has the highest likelihood of being enrolled in private schools, with 482 (54.6% in the age bracket) enrolled. Conversely, the age group of 18 to 19 year olds has the lowest likelihood of being enrolled in a private school, with 1,741 (88.7% in the age bracket) attending a public institution.
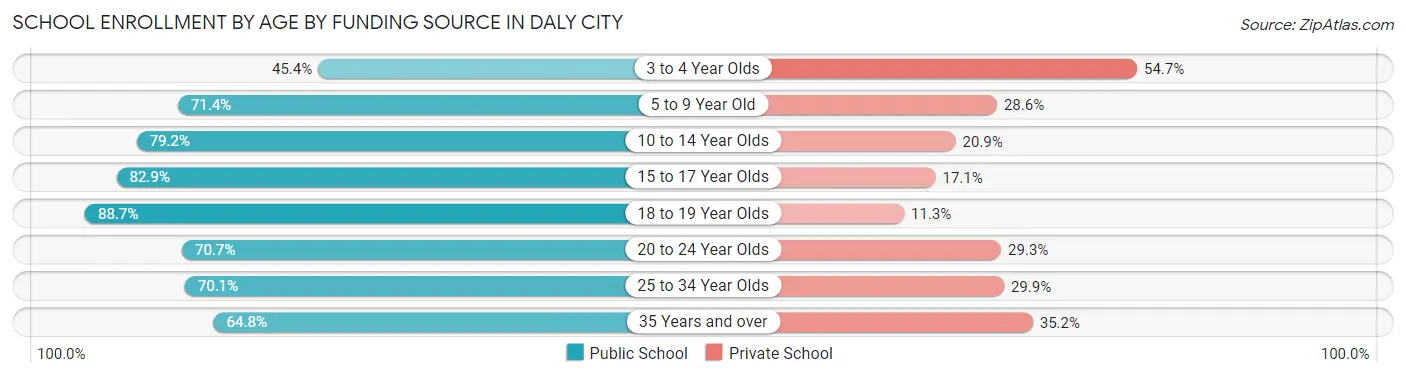
| Age Bracket | Public School | Private School |
| 3 to 4 Year Olds | 400 (45.4%) | 482 (54.6%) |
| 5 to 9 Year Old | 2,882 (71.4%) | 1,152 (28.6%) |
| 10 to 14 Year Olds | 3,139 (79.1%) | 827 (20.8%) |
| 15 to 17 Year Olds | 2,473 (82.9%) | 511 (17.1%) |
| 18 to 19 Year Olds | 1,741 (88.7%) | 221 (11.3%) |
| 20 to 24 Year Olds | 2,884 (70.7%) | 1,197 (29.3%) |
| 25 to 34 Year Olds | 1,689 (70.1%) | 719 (29.9%) |
| 35 Years and over | 1,043 (64.8%) | 567 (35.2%) |
| Total | 16,248 (74.1%) | 5,679 (25.9%) |
Educational Attainment by Field of Study in Daly City
Business (7,716 | 24.3%), science & technology (4,184 | 13.2%), social sciences (2,920 | 9.2%), engineering (2,585 | 8.1%), and bio, nature & agricultural (2,150 | 6.8%) are the most common fields of study among 31,746 individuals in Daly City who have obtained a bachelor's degree or higher.
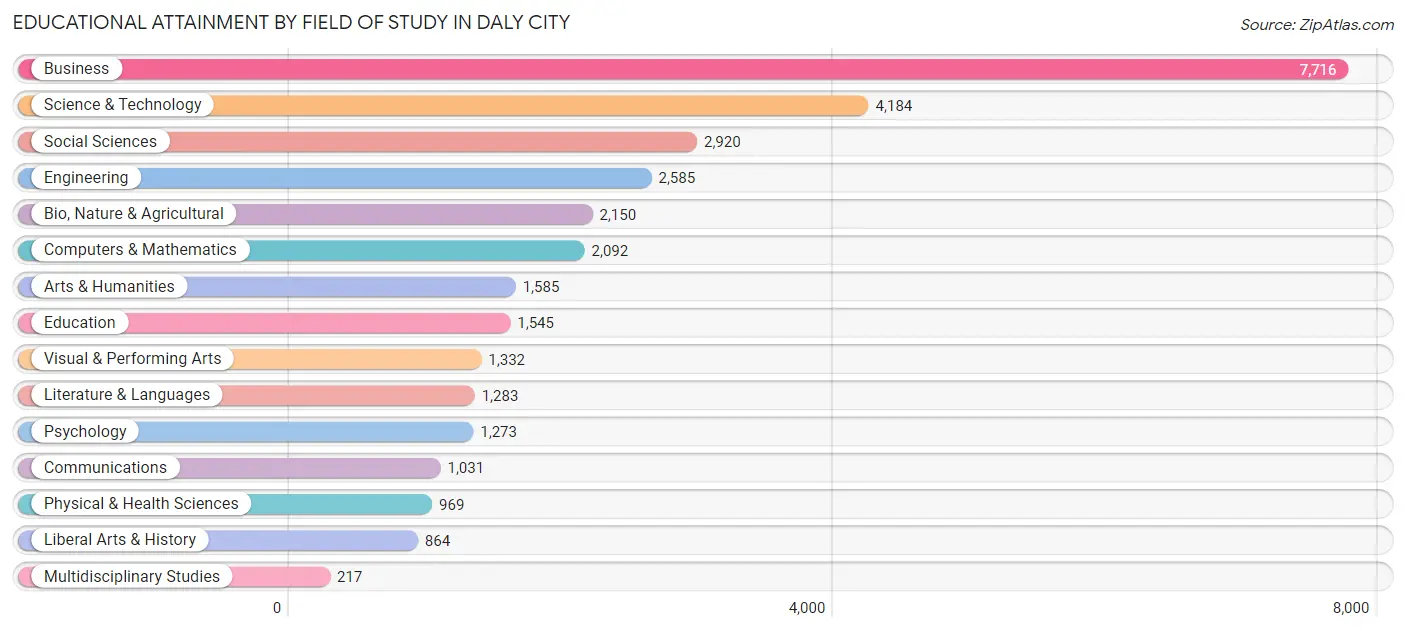
| Field of Study | # Graduates | % Graduates |
| Computers & Mathematics | 2,092 | 6.6% |
| Bio, Nature & Agricultural | 2,150 | 6.8% |
| Physical & Health Sciences | 969 | 3.0% |
| Psychology | 1,273 | 4.0% |
| Social Sciences | 2,920 | 9.2% |
| Engineering | 2,585 | 8.1% |
| Multidisciplinary Studies | 217 | 0.7% |
| Science & Technology | 4,184 | 13.2% |
| Business | 7,716 | 24.3% |
| Education | 1,545 | 4.9% |
| Literature & Languages | 1,283 | 4.0% |
| Liberal Arts & History | 864 | 2.7% |
| Visual & Performing Arts | 1,332 | 4.2% |
| Communications | 1,031 | 3.3% |
| Arts & Humanities | 1,585 | 5.0% |
| Total | 31,746 | 100.0% |
Transportation & Commute in Daly City
Vehicle Availability by Sex in Daly City
The most prevalent vehicle ownership categories in Daly City are males with 2 vehicles (10,265, accounting for 34.3%) and females with 2 vehicles (9,255, making up 38.6%).
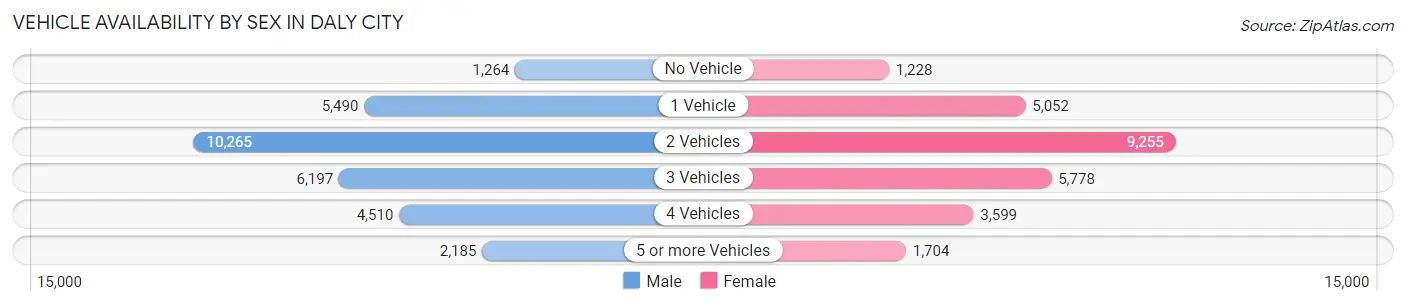
| Vehicles Available | Male | Female |
| No Vehicle | 1,264 (4.2%) | 1,228 (4.6%) |
| 1 Vehicle | 5,490 (18.3%) | 5,052 (19.0%) |
| 2 Vehicles | 10,265 (34.3%) | 9,255 (34.8%) |
| 3 Vehicles | 6,197 (20.7%) | 5,778 (21.7%) |
| 4 Vehicles | 4,510 (15.1%) | 3,599 (13.5%) |
| 5 or more Vehicles | 2,185 (7.3%) | 1,704 (6.4%) |
| Total | 29,911 (100.0%) | 26,616 (100.0%) |
Commute Time in Daly City
The most frequently occuring commute durations in Daly City are 30 to 34 minutes (9,181 commuters, 18.0%), 20 to 24 minutes (7,926 commuters, 15.5%), and 15 to 19 minutes (7,833 commuters, 15.4%).
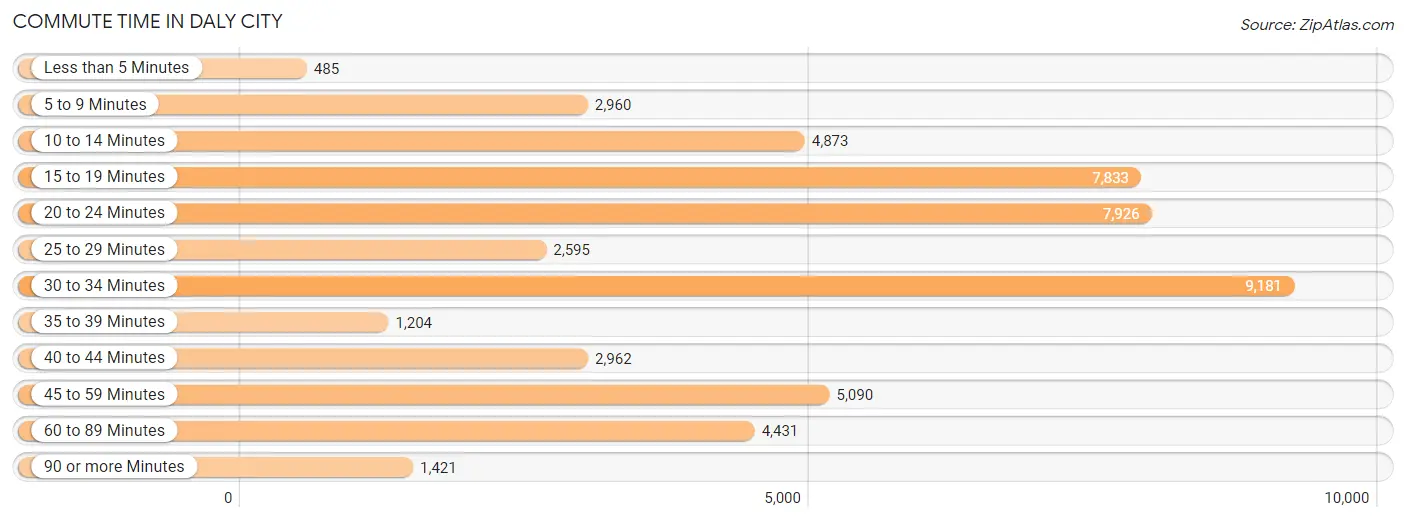
| Commute Time | # Commuters | % Commuters |
| Less than 5 Minutes | 485 | 0.9% |
| 5 to 9 Minutes | 2,960 | 5.8% |
| 10 to 14 Minutes | 4,873 | 9.6% |
| 15 to 19 Minutes | 7,833 | 15.4% |
| 20 to 24 Minutes | 7,926 | 15.5% |
| 25 to 29 Minutes | 2,595 | 5.1% |
| 30 to 34 Minutes | 9,181 | 18.0% |
| 35 to 39 Minutes | 1,204 | 2.4% |
| 40 to 44 Minutes | 2,962 | 5.8% |
| 45 to 59 Minutes | 5,090 | 10.0% |
| 60 to 89 Minutes | 4,431 | 8.7% |
| 90 or more Minutes | 1,421 | 2.8% |
Commute Time by Sex in Daly City
The most common commute times in Daly City are 30 to 34 minutes (5,303 commuters, 19.4%) for males and 30 to 34 minutes (3,878 commuters, 16.4%) for females.
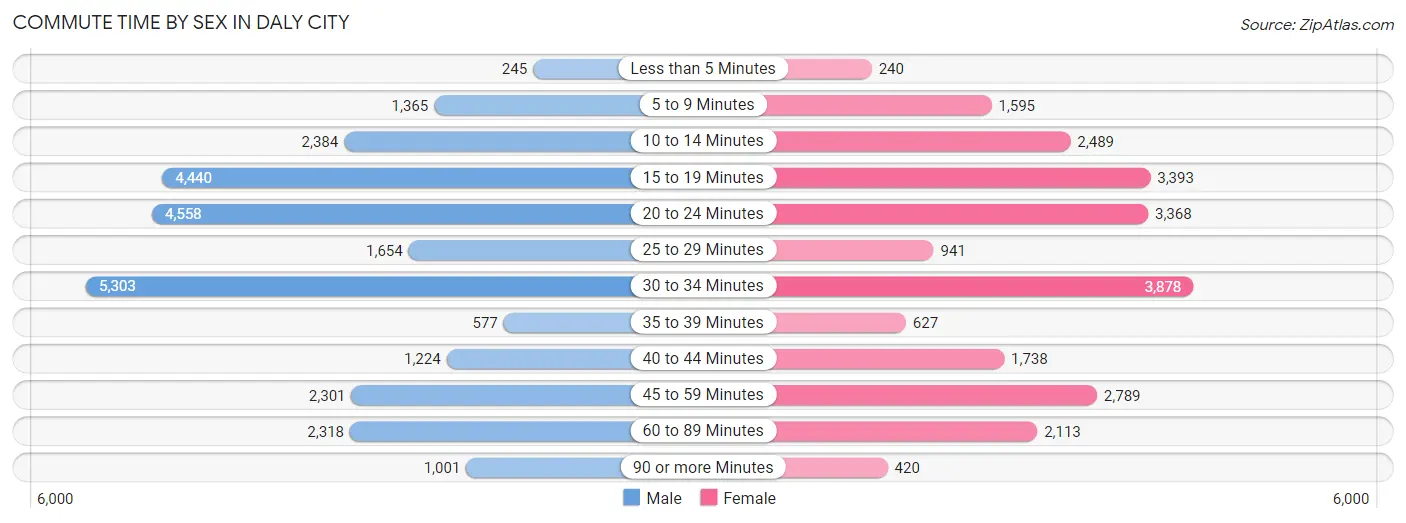
| Commute Time | Male | Female |
| Less than 5 Minutes | 245 (0.9%) | 240 (1.0%) |
| 5 to 9 Minutes | 1,365 (5.0%) | 1,595 (6.8%) |
| 10 to 14 Minutes | 2,384 (8.7%) | 2,489 (10.5%) |
| 15 to 19 Minutes | 4,440 (16.2%) | 3,393 (14.4%) |
| 20 to 24 Minutes | 4,558 (16.7%) | 3,368 (14.3%) |
| 25 to 29 Minutes | 1,654 (6.0%) | 941 (4.0%) |
| 30 to 34 Minutes | 5,303 (19.4%) | 3,878 (16.4%) |
| 35 to 39 Minutes | 577 (2.1%) | 627 (2.7%) |
| 40 to 44 Minutes | 1,224 (4.5%) | 1,738 (7.4%) |
| 45 to 59 Minutes | 2,301 (8.4%) | 2,789 (11.8%) |
| 60 to 89 Minutes | 2,318 (8.5%) | 2,113 (9.0%) |
| 90 or more Minutes | 1,001 (3.7%) | 420 (1.8%) |
Time of Departure to Work by Sex in Daly City
The most frequent times of departure to work in Daly City are 7:00 AM to 7:29 AM (3,690, 13.5%) for males and 7:00 AM to 7:29 AM (3,637, 15.4%) for females.
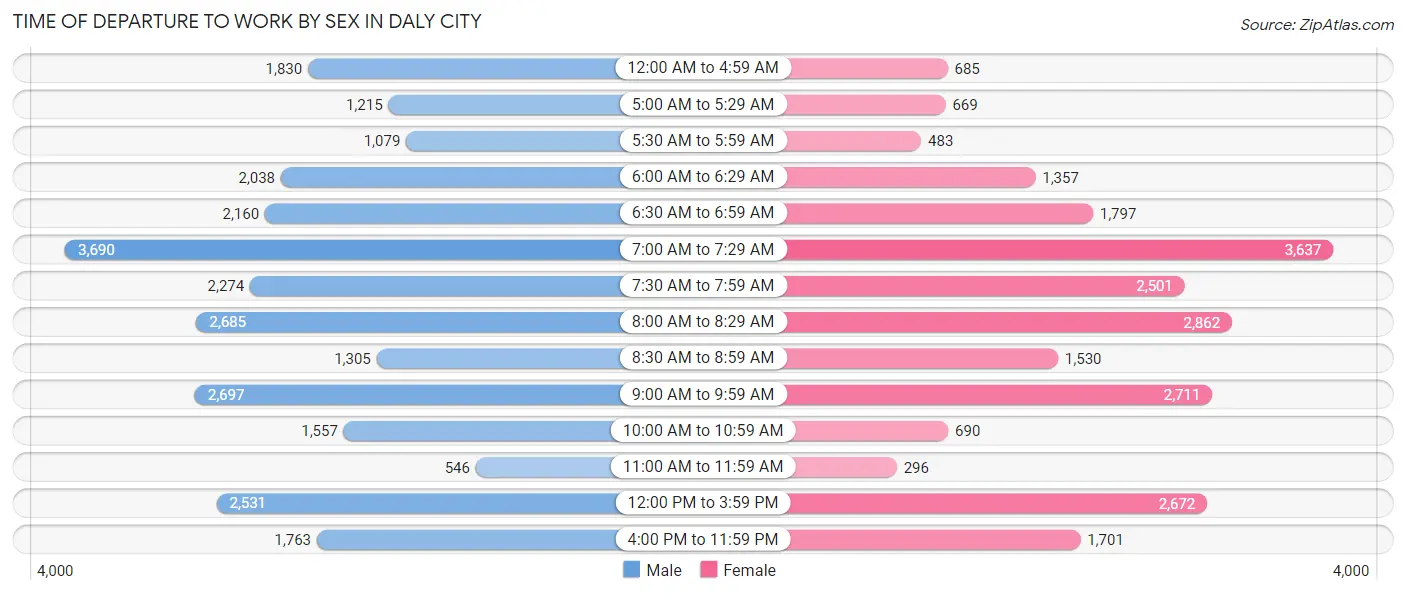
| Time of Departure | Male | Female |
| 12:00 AM to 4:59 AM | 1,830 (6.7%) | 685 (2.9%) |
| 5:00 AM to 5:29 AM | 1,215 (4.4%) | 669 (2.8%) |
| 5:30 AM to 5:59 AM | 1,079 (3.9%) | 483 (2.1%) |
| 6:00 AM to 6:29 AM | 2,038 (7.4%) | 1,357 (5.8%) |
| 6:30 AM to 6:59 AM | 2,160 (7.9%) | 1,797 (7.6%) |
| 7:00 AM to 7:29 AM | 3,690 (13.5%) | 3,637 (15.4%) |
| 7:30 AM to 7:59 AM | 2,274 (8.3%) | 2,501 (10.6%) |
| 8:00 AM to 8:29 AM | 2,685 (9.8%) | 2,862 (12.1%) |
| 8:30 AM to 8:59 AM | 1,305 (4.8%) | 1,530 (6.5%) |
| 9:00 AM to 9:59 AM | 2,697 (9.9%) | 2,711 (11.5%) |
| 10:00 AM to 10:59 AM | 1,557 (5.7%) | 690 (2.9%) |
| 11:00 AM to 11:59 AM | 546 (2.0%) | 296 (1.3%) |
| 12:00 PM to 3:59 PM | 2,531 (9.2%) | 2,672 (11.3%) |
| 4:00 PM to 11:59 PM | 1,763 (6.4%) | 1,701 (7.2%) |
| Total | 27,370 (100.0%) | 23,591 (100.0%) |
Housing Occupancy in Daly City
Occupancy by Ownership in Daly City
Of the total 32,206 dwellings in Daly City, owner-occupied units account for 19,375 (60.2%), while renter-occupied units make up 12,831 (39.8%).
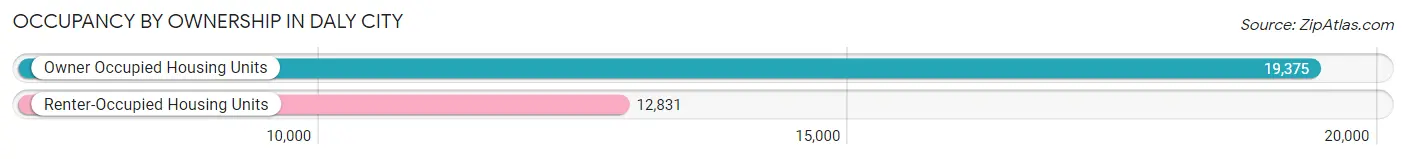
| Occupancy | # Housing Units | % Housing Units |
| Owner Occupied Housing Units | 19,375 | 60.2% |
| Renter-Occupied Housing Units | 12,831 | 39.8% |
| Total Occupied Housing Units | 32,206 | 100.0% |
Occupancy by Household Size in Daly City
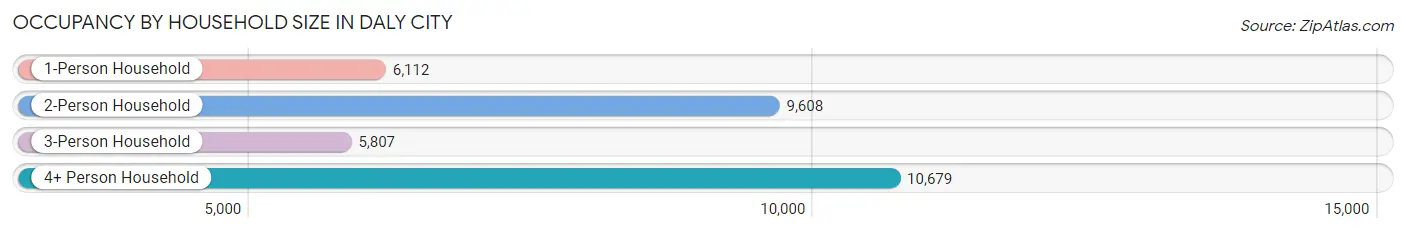
| Household Size | # Housing Units | % Housing Units |
| 1-Person Household | 6,112 | 19.0% |
| 2-Person Household | 9,608 | 29.8% |
| 3-Person Household | 5,807 | 18.0% |
| 4+ Person Household | 10,679 | 33.2% |
| Total Housing Units | 32,206 | 100.0% |
Occupancy by Ownership by Household Size in Daly City
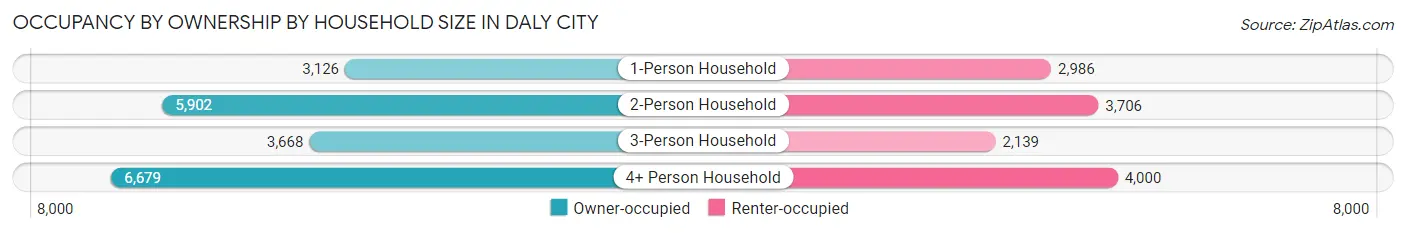
| Household Size | Owner-occupied | Renter-occupied |
| 1-Person Household | 3,126 (51.1%) | 2,986 (48.8%) |
| 2-Person Household | 5,902 (61.4%) | 3,706 (38.6%) |
| 3-Person Household | 3,668 (63.2%) | 2,139 (36.8%) |
| 4+ Person Household | 6,679 (62.5%) | 4,000 (37.5%) |
| Total Housing Units | 19,375 (60.2%) | 12,831 (39.8%) |
Occupancy by Educational Attainment in Daly City
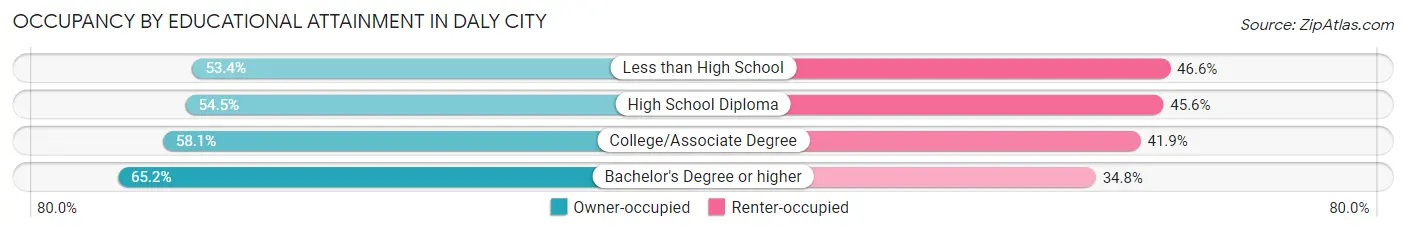
| Household Size | Owner-occupied | Renter-occupied |
| Less than High School | 1,679 (53.4%) | 1,467 (46.6%) |
| High School Diploma | 3,108 (54.4%) | 2,600 (45.6%) |
| College/Associate Degree | 5,172 (58.1%) | 3,734 (41.9%) |
| Bachelor's Degree or higher | 9,416 (65.2%) | 5,030 (34.8%) |
Occupancy by Age of Householder in Daly City
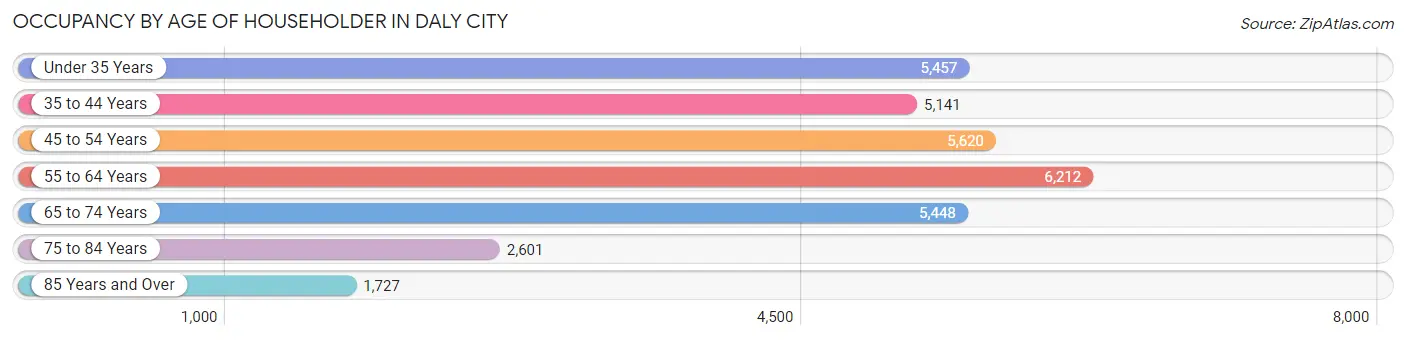
| Age Bracket | # Households | % Households |
| Under 35 Years | 5,457 | 16.9% |
| 35 to 44 Years | 5,141 | 16.0% |
| 45 to 54 Years | 5,620 | 17.4% |
| 55 to 64 Years | 6,212 | 19.3% |
| 65 to 74 Years | 5,448 | 16.9% |
| 75 to 84 Years | 2,601 | 8.1% |
| 85 Years and Over | 1,727 | 5.4% |
| Total | 32,206 | 100.0% |
Housing Finances in Daly City
Median Income by Occupancy in Daly City
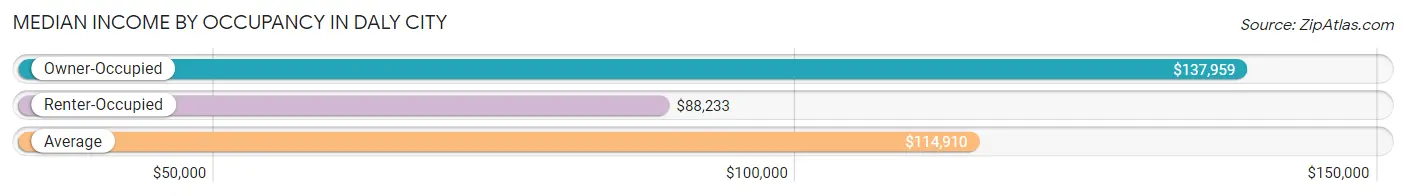
| Occupancy Type | # Households | Median Income |
| Owner-Occupied | 19,375 (60.2%) | $137,959 |
| Renter-Occupied | 12,831 (39.8%) | $88,233 |
| Average | 32,206 (100.0%) | $114,910 |
Occupancy by Householder Income Bracket in Daly City
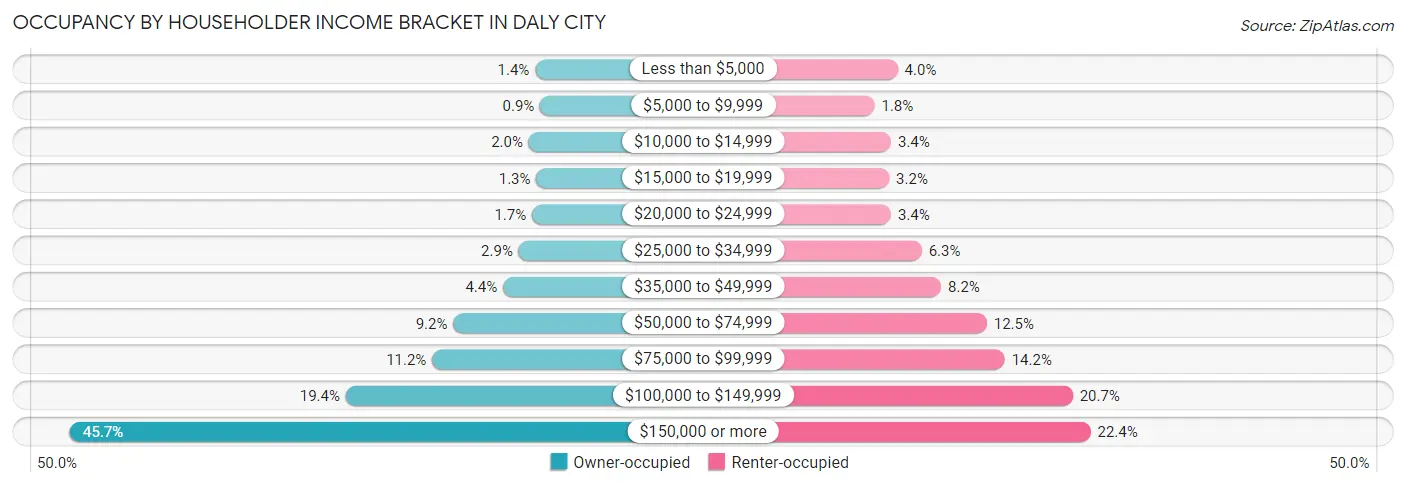
| Income Bracket | Owner-occupied | Renter-occupied |
| Less than $5,000 | 266 (1.4%) | 515 (4.0%) |
| $5,000 to $9,999 | 175 (0.9%) | 232 (1.8%) |
| $10,000 to $14,999 | 384 (2.0%) | 434 (3.4%) |
| $15,000 to $19,999 | 245 (1.3%) | 410 (3.2%) |
| $20,000 to $24,999 | 323 (1.7%) | 434 (3.4%) |
| $25,000 to $34,999 | 569 (2.9%) | 808 (6.3%) |
| $35,000 to $49,999 | 858 (4.4%) | 1,046 (8.2%) |
| $50,000 to $74,999 | 1,776 (9.2%) | 1,604 (12.5%) |
| $75,000 to $99,999 | 2,167 (11.2%) | 1,823 (14.2%) |
| $100,000 to $149,999 | 3,761 (19.4%) | 2,654 (20.7%) |
| $150,000 or more | 8,851 (45.7%) | 2,871 (22.4%) |
| Total | 19,375 (100.0%) | 12,831 (100.0%) |
Monthly Housing Cost Tiers in Daly City
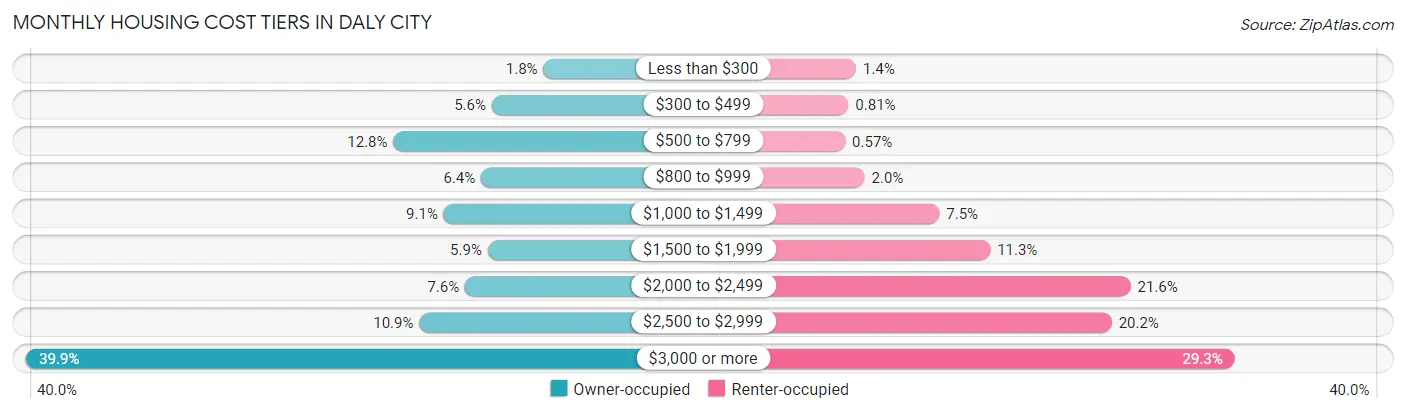
| Monthly Cost | Owner-occupied | Renter-occupied |
| Less than $300 | 347 (1.8%) | 176 (1.4%) |
| $300 to $499 | 1,084 (5.6%) | 104 (0.8%) |
| $500 to $799 | 2,488 (12.8%) | 73 (0.6%) |
| $800 to $999 | 1,237 (6.4%) | 257 (2.0%) |
| $1,000 to $1,499 | 1,768 (9.1%) | 964 (7.5%) |
| $1,500 to $1,999 | 1,141 (5.9%) | 1,444 (11.3%) |
| $2,000 to $2,499 | 1,464 (7.6%) | 2,770 (21.6%) |
| $2,500 to $2,999 | 2,117 (10.9%) | 2,592 (20.2%) |
| $3,000 or more | 7,729 (39.9%) | 3,753 (29.2%) |
| Total | 19,375 (100.0%) | 12,831 (100.0%) |
Physical Housing Characteristics in Daly City
Housing Structures in Daly City
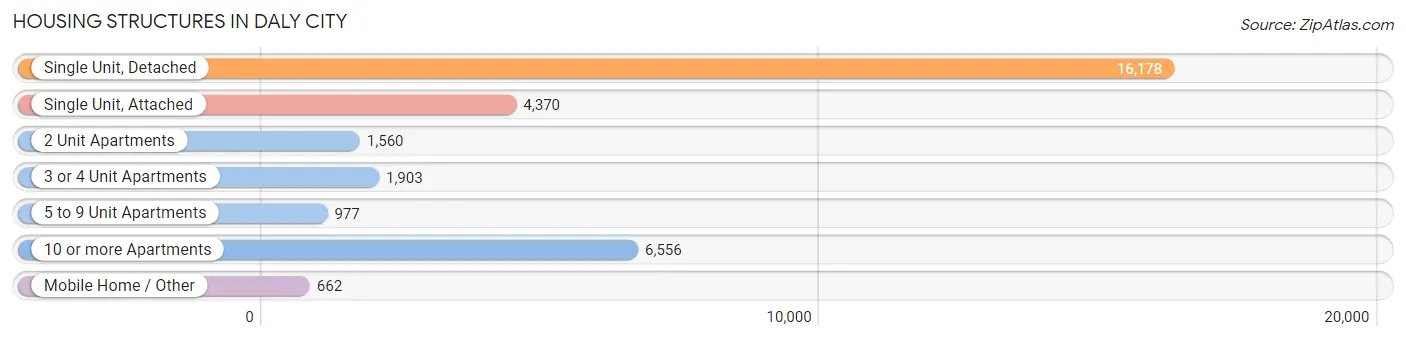
| Structure Type | # Housing Units | % Housing Units |
| Single Unit, Detached | 16,178 | 50.2% |
| Single Unit, Attached | 4,370 | 13.6% |
| 2 Unit Apartments | 1,560 | 4.8% |
| 3 or 4 Unit Apartments | 1,903 | 5.9% |
| 5 to 9 Unit Apartments | 977 | 3.0% |
| 10 or more Apartments | 6,556 | 20.4% |
| Mobile Home / Other | 662 | 2.1% |
| Total | 32,206 | 100.0% |
Housing Structures by Occupancy in Daly City
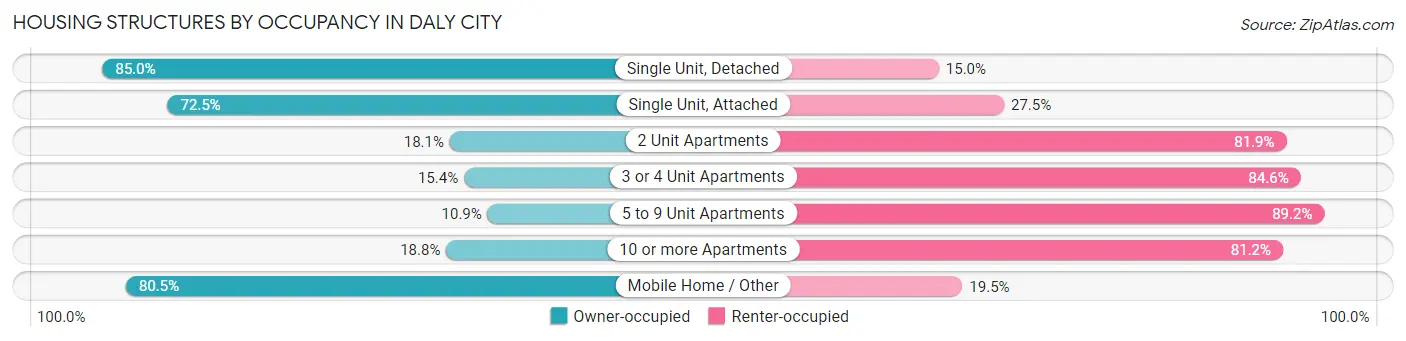
| Structure Type | Owner-occupied | Renter-occupied |
| Single Unit, Detached | 13,758 (85.0%) | 2,420 (15.0%) |
| Single Unit, Attached | 3,168 (72.5%) | 1,202 (27.5%) |
| 2 Unit Apartments | 283 (18.1%) | 1,277 (81.9%) |
| 3 or 4 Unit Apartments | 293 (15.4%) | 1,610 (84.6%) |
| 5 to 9 Unit Apartments | 106 (10.8%) | 871 (89.1%) |
| 10 or more Apartments | 1,234 (18.8%) | 5,322 (81.2%) |
| Mobile Home / Other | 533 (80.5%) | 129 (19.5%) |
| Total | 19,375 (60.2%) | 12,831 (39.8%) |
Housing Structures by Number of Rooms in Daly City
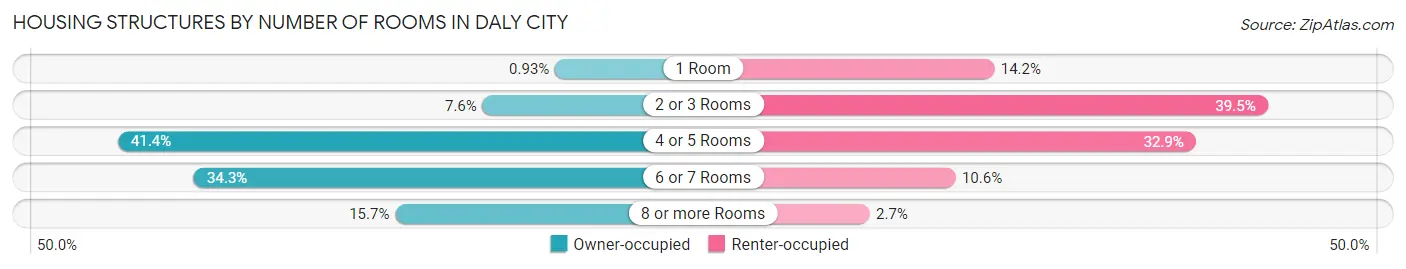
| Number of Rooms | Owner-occupied | Renter-occupied |
| 1 Room | 181 (0.9%) | 1,826 (14.2%) |
| 2 or 3 Rooms | 1,480 (7.6%) | 5,073 (39.5%) |
| 4 or 5 Rooms | 8,015 (41.4%) | 4,221 (32.9%) |
| 6 or 7 Rooms | 6,654 (34.3%) | 1,365 (10.6%) |
| 8 or more Rooms | 3,045 (15.7%) | 346 (2.7%) |
| Total | 19,375 (100.0%) | 12,831 (100.0%) |
Housing Structure by Heating Type in Daly City
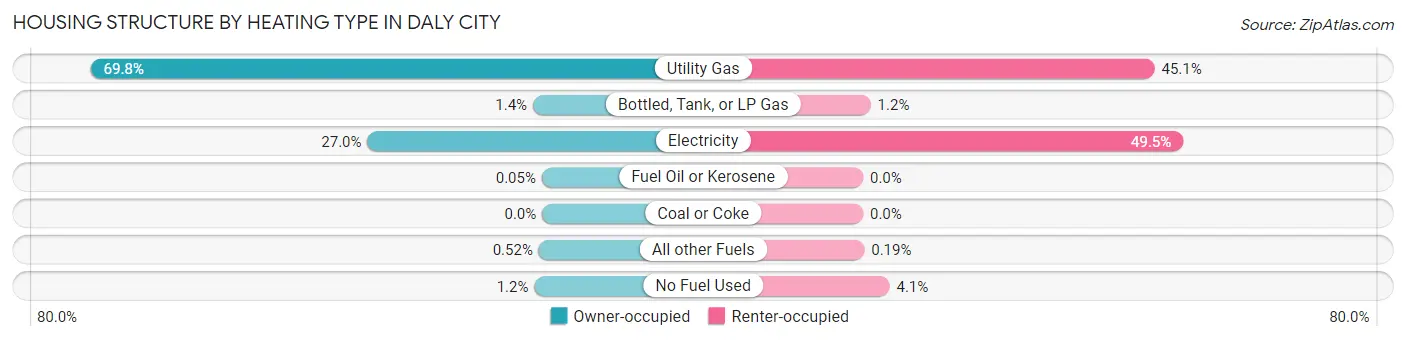
| Heating Type | Owner-occupied | Renter-occupied |
| Utility Gas | 13,521 (69.8%) | 5,782 (45.1%) |
| Bottled, Tank, or LP Gas | 275 (1.4%) | 151 (1.2%) |
| Electricity | 5,234 (27.0%) | 6,348 (49.5%) |
| Fuel Oil or Kerosene | 10 (0.1%) | 0 (0.0%) |
| Coal or Coke | 0 (0.0%) | 0 (0.0%) |
| All other Fuels | 100 (0.5%) | 24 (0.2%) |
| No Fuel Used | 235 (1.2%) | 526 (4.1%) |
| Total | 19,375 (100.0%) | 12,831 (100.0%) |
Household Vehicle Usage in Daly City
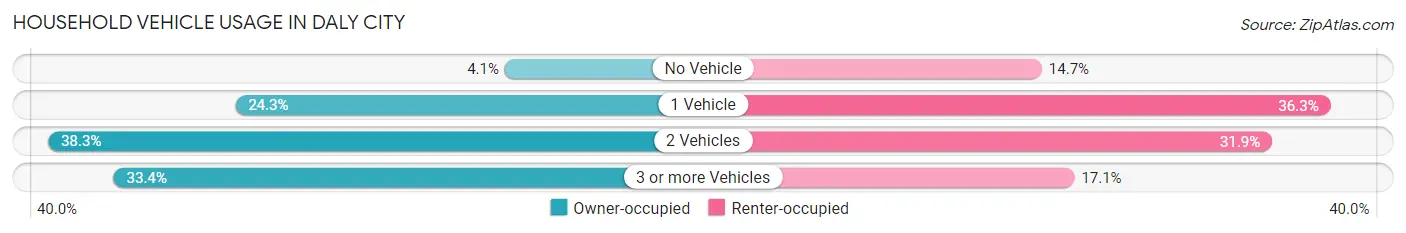
| Vehicles per Household | Owner-occupied | Renter-occupied |
| No Vehicle | 802 (4.1%) | 1,887 (14.7%) |
| 1 Vehicle | 4,702 (24.3%) | 4,652 (36.3%) |
| 2 Vehicles | 7,410 (38.3%) | 4,093 (31.9%) |
| 3 or more Vehicles | 6,461 (33.4%) | 2,199 (17.1%) |
| Total | 19,375 (100.0%) | 12,831 (100.0%) |
Real Estate & Mortgages in Daly City
Real Estate and Mortgage Overview in Daly City
| Characteristic | Without Mortgage | With Mortgage |
| Housing Units | 6,783 | 12,592 |
| Median Property Value | $1,047,400 | $1,085,700 |
| Median Household Income | $102,047 | $6,457 |
| Monthly Housing Costs | $757 | $7,692 |
| Real Estate Taxes | $4,149 | $363 |
Property Value by Mortgage Status in Daly City
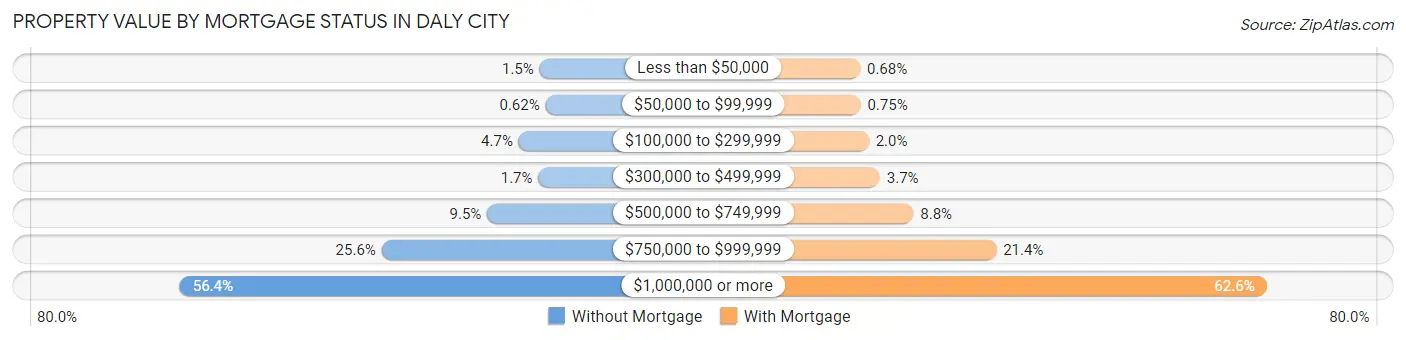
| Property Value | Without Mortgage | With Mortgage |
| Less than $50,000 | 103 (1.5%) | 85 (0.7%) |
| $50,000 to $99,999 | 42 (0.6%) | 94 (0.7%) |
| $100,000 to $299,999 | 319 (4.7%) | 253 (2.0%) |
| $300,000 to $499,999 | 116 (1.7%) | 466 (3.7%) |
| $500,000 to $749,999 | 645 (9.5%) | 1,109 (8.8%) |
| $750,000 to $999,999 | 1,736 (25.6%) | 2,698 (21.4%) |
| $1,000,000 or more | 3,822 (56.4%) | 7,887 (62.6%) |
| Total | 6,783 (100.0%) | 12,592 (100.0%) |
Household Income by Mortgage Status in Daly City
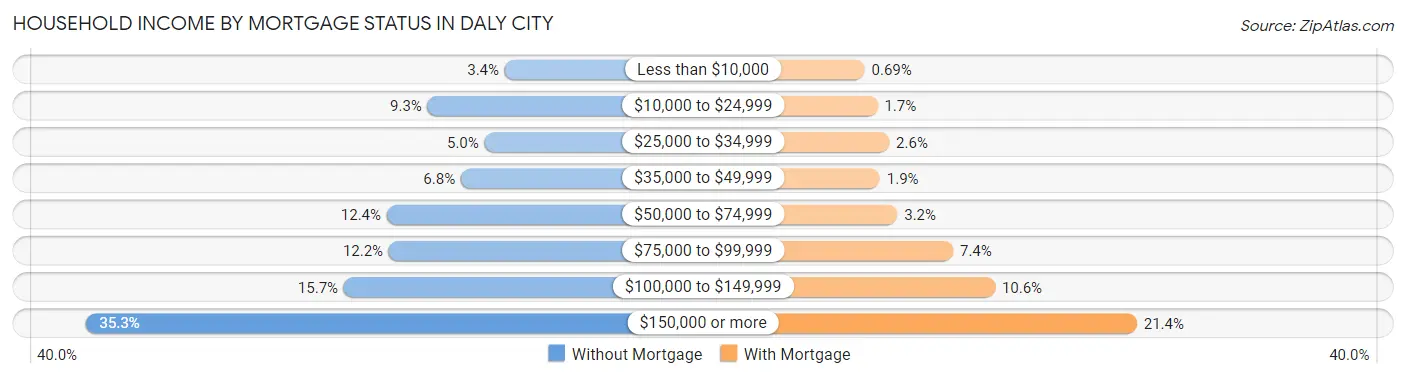
| Household Income | Without Mortgage | With Mortgage |
| Less than $10,000 | 231 (3.4%) | 87 (0.7%) |
| $10,000 to $24,999 | 630 (9.3%) | 210 (1.7%) |
| $25,000 to $34,999 | 336 (5.0%) | 322 (2.6%) |
| $35,000 to $49,999 | 458 (6.8%) | 233 (1.8%) |
| $50,000 to $74,999 | 841 (12.4%) | 400 (3.2%) |
| $75,000 to $99,999 | 830 (12.2%) | 935 (7.4%) |
| $100,000 to $149,999 | 1,063 (15.7%) | 1,337 (10.6%) |
| $150,000 or more | 2,394 (35.3%) | 2,698 (21.4%) |
| Total | 6,783 (100.0%) | 12,592 (100.0%) |
Property Value to Household Income Ratio in Daly City
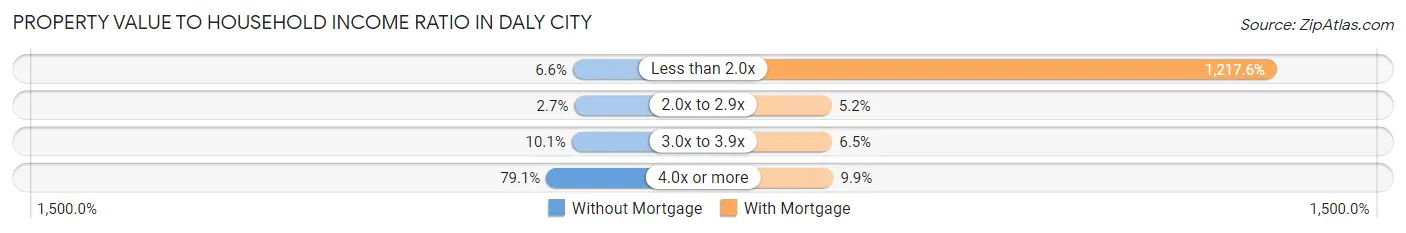
| Value-to-Income Ratio | Without Mortgage | With Mortgage |
| Less than 2.0x | 444 (6.6%) | 153,323 (1,217.6%) |
| 2.0x to 2.9x | 185 (2.7%) | 656 (5.2%) |
| 3.0x to 3.9x | 685 (10.1%) | 819 (6.5%) |
| 4.0x or more | 5,363 (79.1%) | 1,241 (9.9%) |
| Total | 6,783 (100.0%) | 12,592 (100.0%) |
Real Estate Taxes by Mortgage Status in Daly City
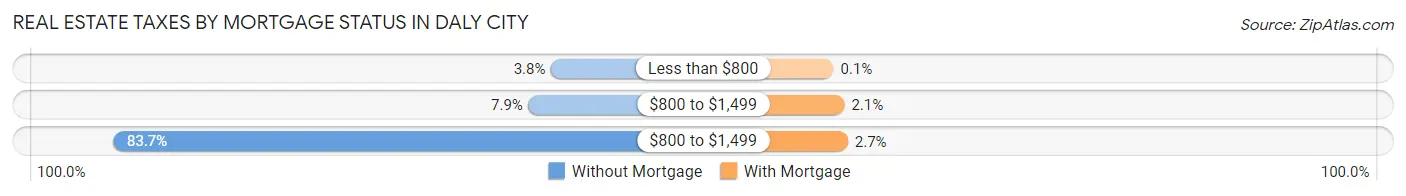
| Property Taxes | Without Mortgage | With Mortgage |
| Less than $800 | 258 (3.8%) | 13 (0.1%) |
| $800 to $1,499 | 538 (7.9%) | 263 (2.1%) |
| $800 to $1,499 | 5,677 (83.7%) | 341 (2.7%) |
| Total | 6,783 (100.0%) | 12,592 (100.0%) |
Health & Disability in Daly City
Health Insurance Coverage by Age in Daly City
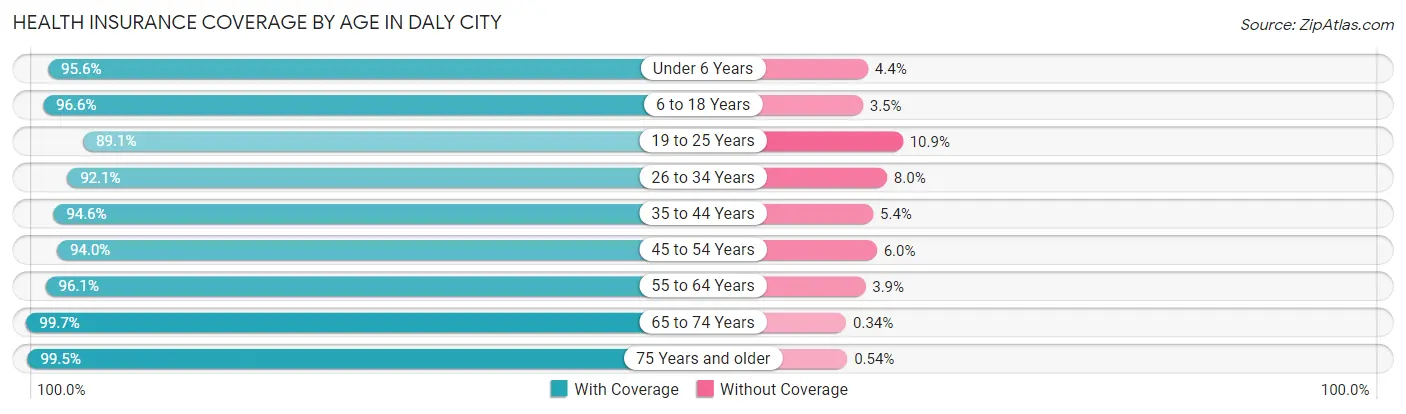
| Age Bracket | With Coverage | Without Coverage |
| Under 6 Years | 4,973 (95.6%) | 229 (4.4%) |
| 6 to 18 Years | 10,991 (96.6%) | 393 (3.5%) |
| 19 to 25 Years | 9,200 (89.1%) | 1,125 (10.9%) |
| 26 to 34 Years | 13,970 (92.0%) | 1,207 (8.0%) |
| 35 to 44 Years | 13,141 (94.6%) | 746 (5.4%) |
| 45 to 54 Years | 12,370 (94.0%) | 795 (6.0%) |
| 55 to 64 Years | 13,481 (96.1%) | 549 (3.9%) |
| 65 to 74 Years | 11,581 (99.7%) | 39 (0.3%) |
| 75 Years and older | 8,163 (99.5%) | 44 (0.5%) |
| Total | 97,870 (95.0%) | 5,127 (5.0%) |
Health Insurance Coverage by Citizenship Status in Daly City

| Citizenship Status | With Coverage | Without Coverage |
| Native Born | 4,973 (95.6%) | 229 (4.4%) |
| Foreign Born, Citizen | 10,991 (96.6%) | 393 (3.5%) |
| Foreign Born, not a Citizen | 9,200 (89.1%) | 1,125 (10.9%) |
Health Insurance Coverage by Household Income in Daly City
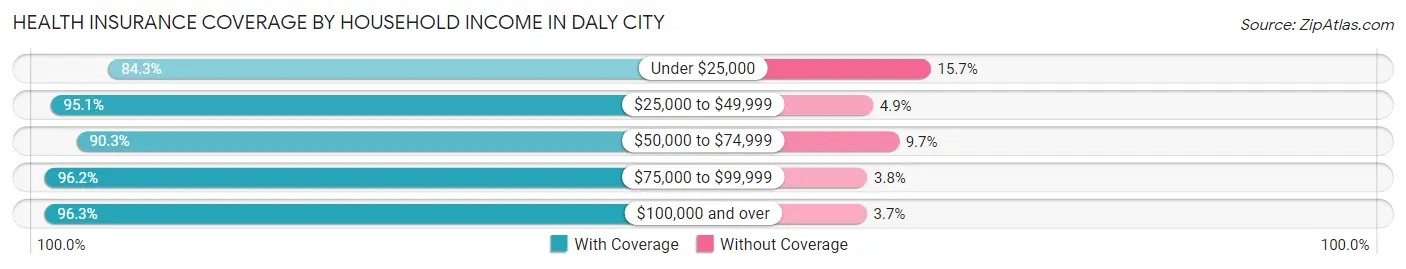
| Household Income | With Coverage | Without Coverage |
| Under $25,000 | 4,820 (84.3%) | 898 (15.7%) |
| $25,000 to $49,999 | 6,839 (95.1%) | 351 (4.9%) |
| $50,000 to $74,999 | 8,119 (90.3%) | 874 (9.7%) |
| $75,000 to $99,999 | 10,440 (96.2%) | 412 (3.8%) |
| $100,000 and over | 67,066 (96.3%) | 2,584 (3.7%) |
Public vs Private Health Insurance Coverage by Age in Daly City
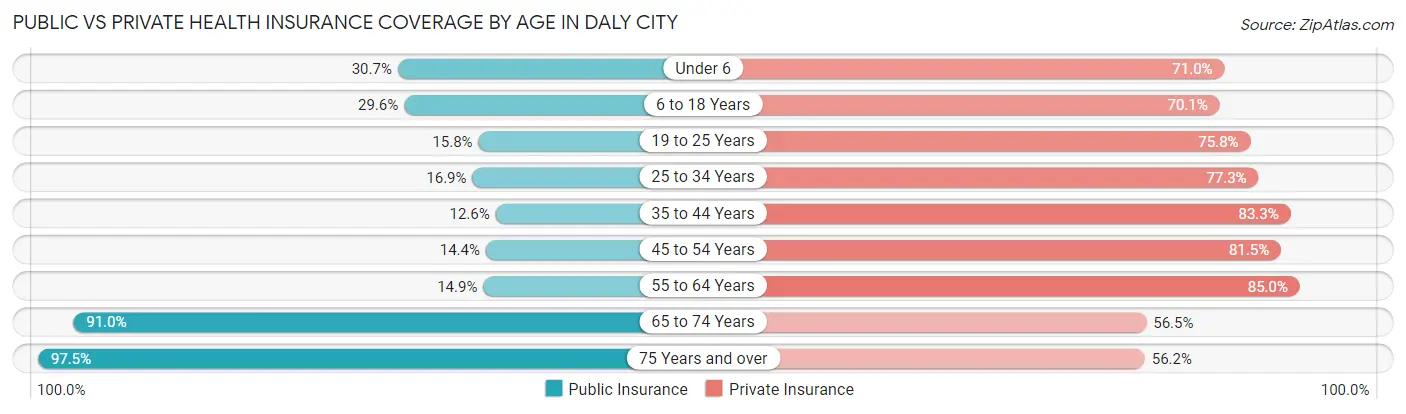
| Age Bracket | Public Insurance | Private Insurance |
| Under 6 | 1,599 (30.7%) | 3,694 (71.0%) |
| 6 to 18 Years | 3,366 (29.6%) | 7,982 (70.1%) |
| 19 to 25 Years | 1,627 (15.8%) | 7,830 (75.8%) |
| 25 to 34 Years | 2,563 (16.9%) | 11,737 (77.3%) |
| 35 to 44 Years | 1,748 (12.6%) | 11,567 (83.3%) |
| 45 to 54 Years | 1,894 (14.4%) | 10,732 (81.5%) |
| 55 to 64 Years | 2,086 (14.9%) | 11,927 (85.0%) |
| 65 to 74 Years | 10,568 (90.9%) | 6,568 (56.5%) |
| 75 Years and over | 8,005 (97.5%) | 4,616 (56.2%) |
| Total | 33,456 (32.5%) | 76,653 (74.4%) |
Disability Status by Sex by Age in Daly City
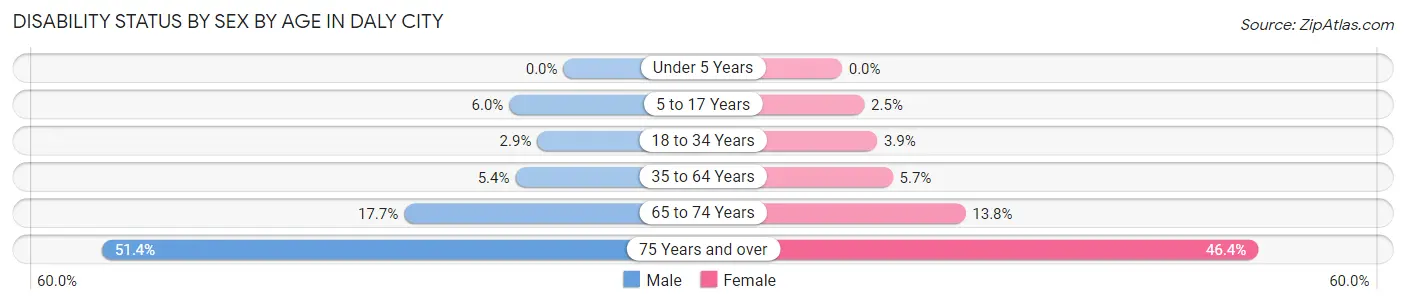
| Age Bracket | Male | Female |
| Under 5 Years | 0 (0.0%) | 0 (0.0%) |
| 5 to 17 Years | 319 (6.0%) | 146 (2.5%) |
| 18 to 34 Years | 412 (2.9%) | 494 (3.9%) |
| 35 to 64 Years | 1,123 (5.3%) | 1,137 (5.7%) |
| 65 to 74 Years | 1,021 (17.7%) | 807 (13.8%) |
| 75 Years and over | 1,668 (51.4%) | 2,300 (46.4%) |
Disability Class by Sex by Age in Daly City
Disability Class: Hearing Difficulty
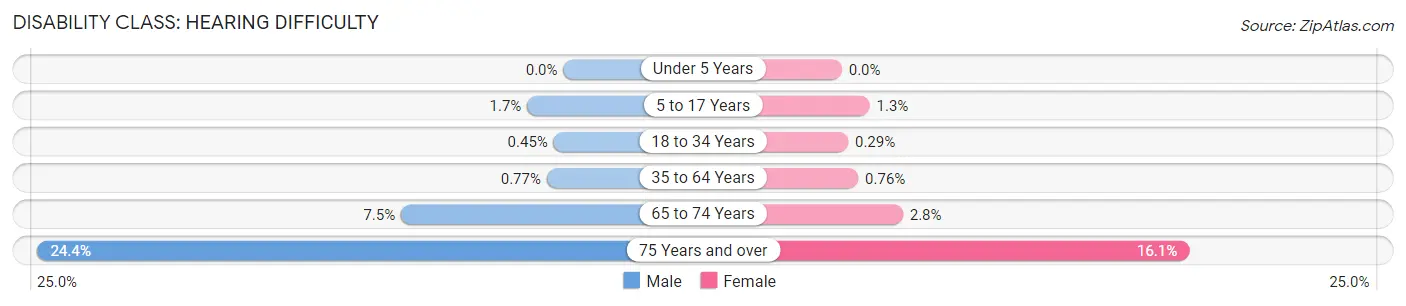
| Age Bracket | Male | Female |
| Under 5 Years | 0 (0.0%) | 0 (0.0%) |
| 5 to 17 Years | 89 (1.7%) | 76 (1.3%) |
| 18 to 34 Years | 63 (0.4%) | 37 (0.3%) |
| 35 to 64 Years | 162 (0.8%) | 153 (0.8%) |
| 65 to 74 Years | 433 (7.5%) | 166 (2.8%) |
| 75 Years and over | 792 (24.4%) | 799 (16.1%) |
Disability Class: Vision Difficulty
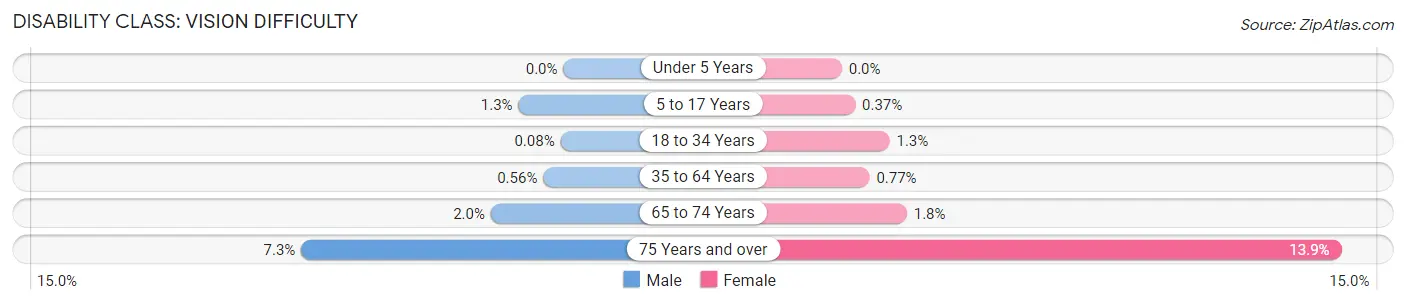
| Age Bracket | Male | Female |
| Under 5 Years | 0 (0.0%) | 0 (0.0%) |
| 5 to 17 Years | 66 (1.3%) | 22 (0.4%) |
| 18 to 34 Years | 11 (0.1%) | 168 (1.3%) |
| 35 to 64 Years | 118 (0.6%) | 154 (0.8%) |
| 65 to 74 Years | 116 (2.0%) | 106 (1.8%) |
| 75 Years and over | 237 (7.3%) | 690 (13.9%) |
Disability Class: Cognitive Difficulty
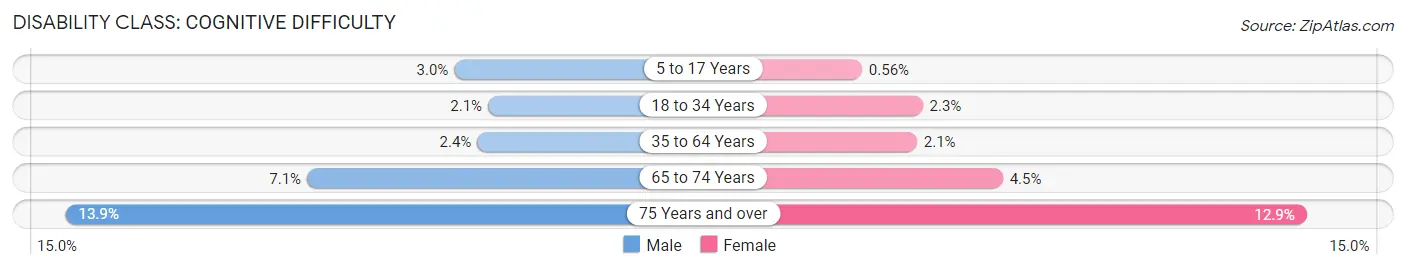
| Age Bracket | Male | Female |
| 5 to 17 Years | 161 (3.0%) | 33 (0.6%) |
| 18 to 34 Years | 297 (2.1%) | 283 (2.2%) |
| 35 to 64 Years | 503 (2.4%) | 421 (2.1%) |
| 65 to 74 Years | 411 (7.1%) | 263 (4.5%) |
| 75 Years and over | 450 (13.9%) | 642 (12.9%) |
Disability Class: Ambulatory Difficulty
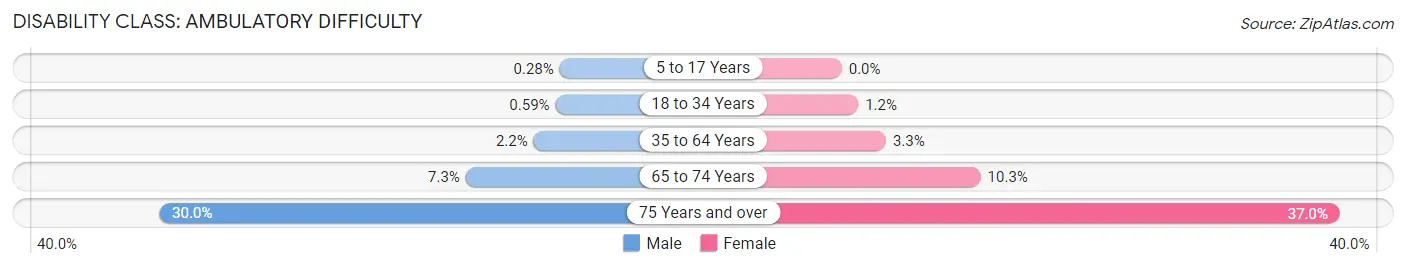
| Age Bracket | Male | Female |
| 5 to 17 Years | 15 (0.3%) | 0 (0.0%) |
| 18 to 34 Years | 83 (0.6%) | 153 (1.2%) |
| 35 to 64 Years | 463 (2.2%) | 659 (3.3%) |
| 65 to 74 Years | 417 (7.2%) | 605 (10.3%) |
| 75 Years and over | 974 (30.0%) | 1,834 (37.0%) |
Disability Class: Self-Care Difficulty
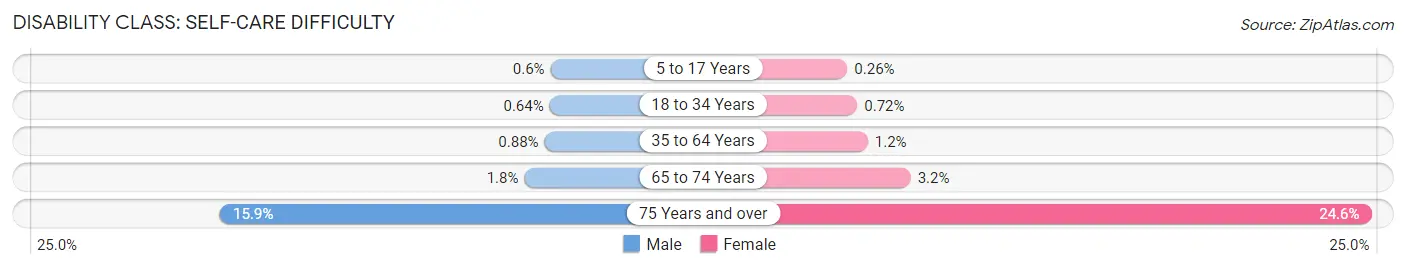
| Age Bracket | Male | Female |
| 5 to 17 Years | 32 (0.6%) | 15 (0.3%) |
| 18 to 34 Years | 90 (0.6%) | 91 (0.7%) |
| 35 to 64 Years | 184 (0.9%) | 244 (1.2%) |
| 65 to 74 Years | 104 (1.8%) | 188 (3.2%) |
| 75 Years and over | 517 (15.9%) | 1,219 (24.6%) |
Technology Access in Daly City
Computing Device Access in Daly City
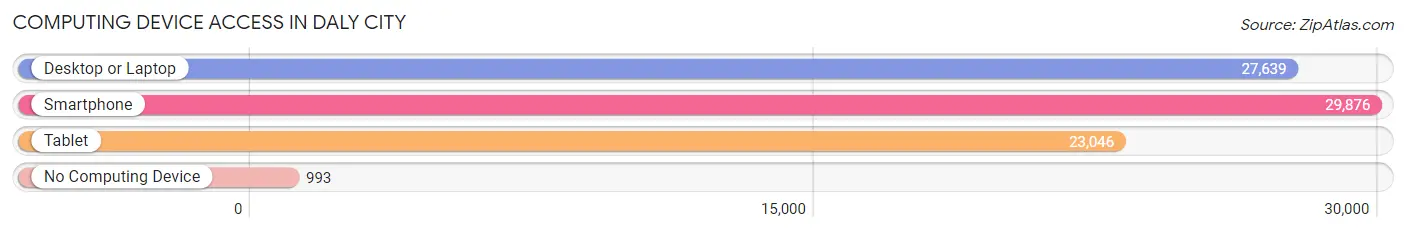
| Device Type | # Households | % Households |
| Desktop or Laptop | 27,639 | 85.8% |
| Smartphone | 29,876 | 92.8% |
| Tablet | 23,046 | 71.6% |
| No Computing Device | 993 | 3.1% |
| Total | 32,206 | 100.0% |
Internet Access in Daly City
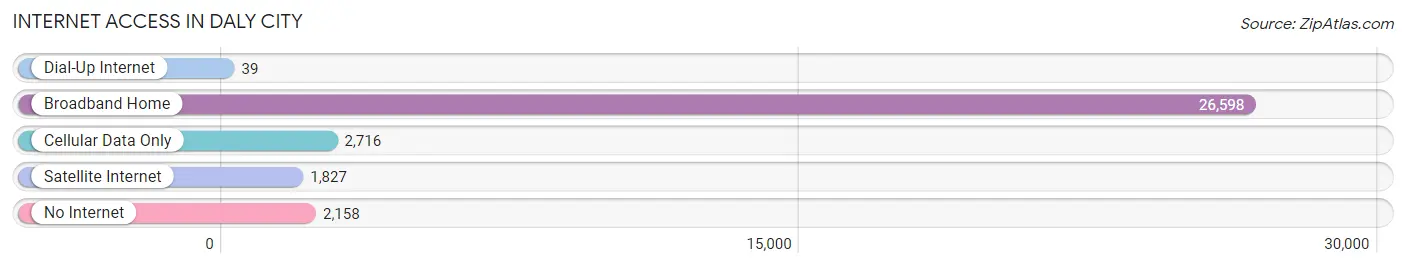
| Internet Type | # Households | % Households |
| Dial-Up Internet | 39 | 0.1% |
| Broadband Home | 26,598 | 82.6% |
| Cellular Data Only | 2,716 | 8.4% |
| Satellite Internet | 1,827 | 5.7% |
| No Internet | 2,158 | 6.7% |
| Total | 32,206 | 100.0% |
Daly City Summary
Daly City is a city located in San Mateo County, California, United States. It is situated immediately south of San Francisco, and is part of the San Francisco Bay Area. As of the 2010 census, the population of Daly City was 101,123, making it the fifth-most populous city in the county.
Geography
Daly City is located at the northern edge of the San Francisco Bay Area, approximately 10 miles (16 km) south of downtown San Francisco. It is bordered by the cities of San Francisco, South San Francisco, and Brisbane. The city is situated atop a series of hills and valleys, with the San Bruno Mountains to the west and the San Andreas Fault to the east. The city is located at the base of San Bruno Mountain, the highest point in the city at 938 feet (286 m).
The city covers an area of 22.2 square miles (57.5 km2), of which 21.8 square miles (56.5 km2) is land and 0.4 square miles (1.0 km2) is water. The city is located in the Pacific Time Zone and observes Daylight Saving Time.
Economy
Daly City is home to a variety of businesses, including retail, professional services, and manufacturing. The city is home to several major employers, including the San Francisco International Airport, the University of California, San Francisco, and the San Mateo County Health System.
The city is also home to a number of shopping centers, including Serramonte Center, Westlake Shopping Center, and the Westlake Village Shopping Center. The city is also home to a number of restaurants, including the popular In-N-Out Burger.
Demographics
As of the 2010 census, the population of Daly City was 101,123, with a population density of 4,521.7 people per square mile (1,749.2/km2). The racial makeup of the city was 44.3% White, 4.2% African American, 0.7% Native American, 28.2% Asian, 0.3% Pacific Islander, 16.2% from other races, and 6.2% from two or more races. Hispanic or Latino of any race were 33.2% of the population.
The median income for a household in the city was $63,837, and the median income for a family was $72,912. The per capita income for the city was $27,837. About 11.2% of families and 14.2% of the population were below the poverty line, including 19.2% of those under age 18 and 8.2% of those age 65 or over.
The population of Daly City is diverse, with a large Asian population. The city is home to a large Filipino population, making up 24.3% of the population. Other Asian populations include Chinese (14.2%), Vietnamese (7.2%), and Indian (3.2%). The city is also home to a large Hispanic population, making up 33.2% of the population. Other Hispanic populations include Mexican (20.2%), Puerto Rican (3.2%), and Cuban (1.2%).
Common Questions
What is Per Capita Income in Daly City?
Per Capita income in Daly City is $46,581.
What is the Median Family Income in Daly City?
Median Family Income in Daly City is $130,153.
What is the Median Household income in Daly City?
Median Household Income in Daly City is $114,910.
What is Income or Wage Gap in Daly City?
Income or Wage Gap in Daly City is 15.4%.
Women in Daly City earn 84.6 cents for every dollar earned by a man.
What is Family Income Deficit in Daly City?
Family Income Deficit in Daly City is $10,539.
Families that are below poverty line in Daly City earn $10,539 less on average than the poverty threshold level.
What is Inequality or Gini Index in Daly City?
Inequality or Gini Index in Daly City is 0.43.
What is the Total Population of Daly City?
Total Population of Daly City is 103,648.
What is the Total Male Population of Daly City?
Total Male Population of Daly City is 51,615.
What is the Total Female Population of Daly City?
Total Female Population of Daly City is 52,033.
What is the Ratio of Males per 100 Females in Daly City?
There are 99.20 Males per 100 Females in Daly City.
What is the Ratio of Females per 100 Males in Daly City?
There are 100.81 Females per 100 Males in Daly City.
What is the Median Population Age in Daly City?
Median Population Age in Daly City is 41.4 Years.
What is the Average Family Size in Daly City
Average Family Size in Daly City is 3.6 People.
What is the Average Household Size in Daly City
Average Household Size in Daly City is 3.2 People.
How Large is the Labor Force in Daly City?
There are 61,177 People in the Labor Forcein in Daly City.
What is the Percentage of People in the Labor Force in Daly City?
67.7% of People are in the Labor Force in Daly City.
What is the Unemployment Rate in Daly City?
Unemployment Rate in Daly City is 5.4%.