Huntington Beach, CA Map & Demographics
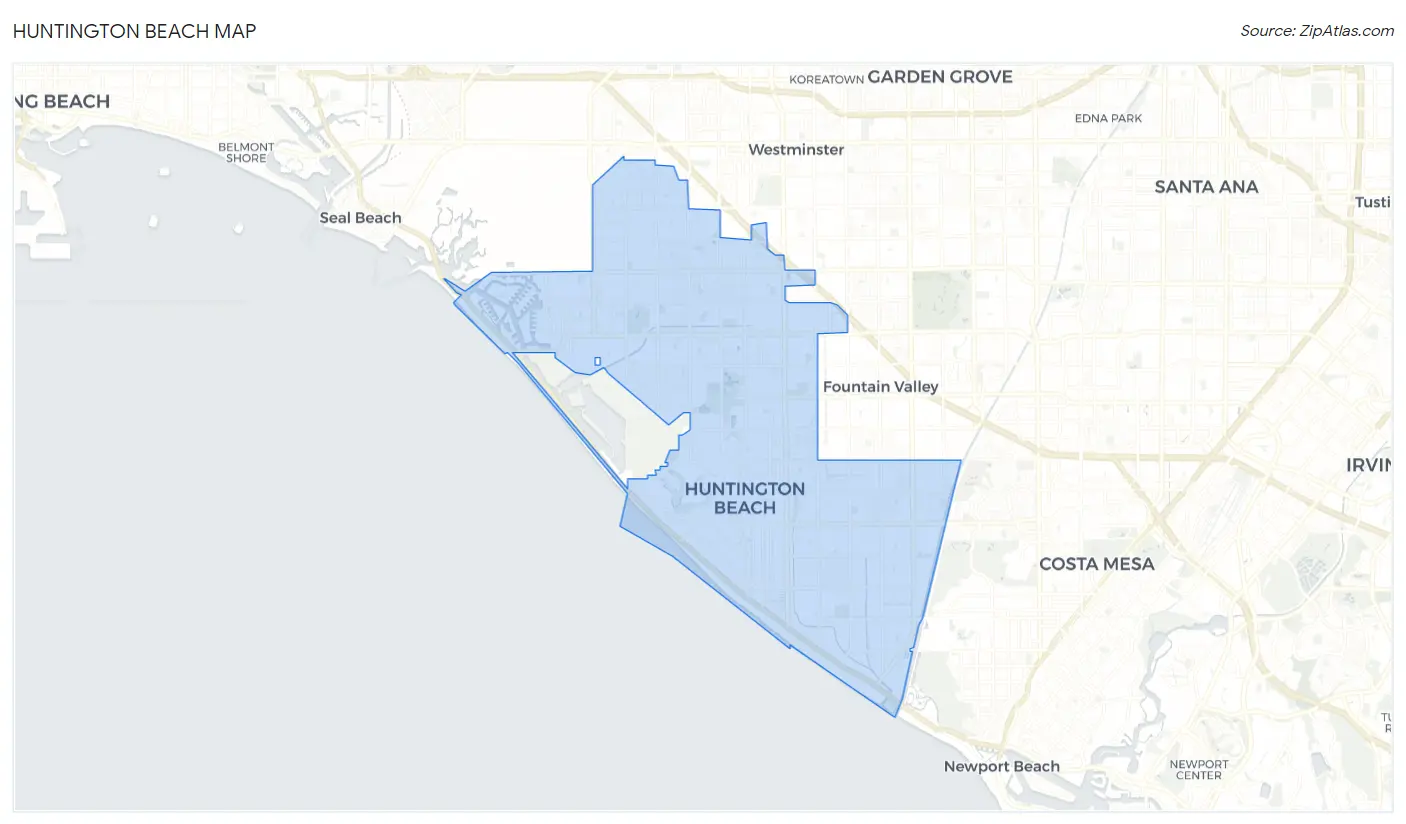
Huntington Beach Map
Huntington Beach Overview
$60,654
PER CAPITA INCOME
$136,494
AVG FAMILY INCOME
$114,747
AVG HOUSEHOLD INCOME
31.0%
WAGE / INCOME GAP [ % ]
69.0¢/ $1
WAGE / INCOME GAP [ $ ]
$10,733
FAMILY INCOME DEFICIT
0.44
INEQUALITY / GINI INDEX
197,481
TOTAL POPULATION
99,061
MALE POPULATION
98,420
FEMALE POPULATION
100.65
MALES / 100 FEMALES
99.35
FEMALES / 100 MALES
43.3
MEDIAN AGE
3.1
AVG FAMILY SIZE
2.5
AVG HOUSEHOLD SIZE
110,641
LABOR FORCE [ PEOPLE ]
66.3%
PERCENT IN LABOR FORCE
5.4%
UNEMPLOYMENT RATE
Income in Huntington Beach
Income Overview in Huntington Beach
Per Capita Income in Huntington Beach is $60,654, while median incomes of families and households are $136,494 and $114,747 respectively.
| Characteristic | Number | Measure |
| Per Capita Income | 197,481 | $60,654 |
| Median Family Income | 49,362 | $136,494 |
| Mean Family Income | 49,362 | $172,551 |
| Median Household Income | 77,641 | $114,747 |
| Mean Household Income | 77,641 | $151,196 |
| Income Deficit | 49,362 | $10,733 |
| Wage / Income Gap (%) | 197,481 | 31.04% |
| Wage / Income Gap ($) | 197,481 | 68.96¢ per $1 |
| Gini / Inequality Index | 197,481 | 0.44 |
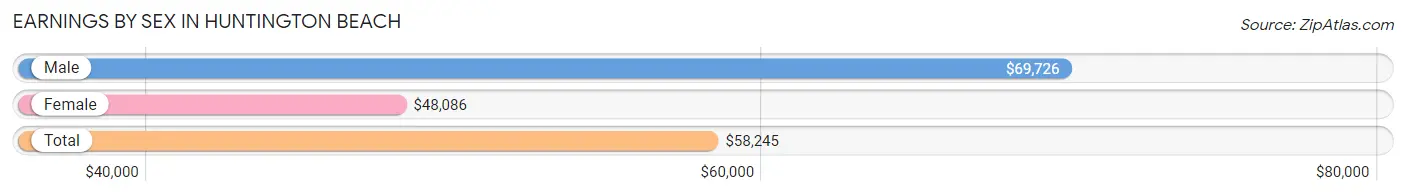
Earnings by Sex in Huntington Beach
Average Earnings in Huntington Beach are $58,245, $69,726 for men and $48,086 for women, a difference of 31.0%.
| Sex | Number | Average Earnings |
| Male | 60,687 (53.7%) | $69,726 |
| Female | 52,398 (46.3%) | $48,086 |
| Total | 113,085 (100.0%) | $58,245 |
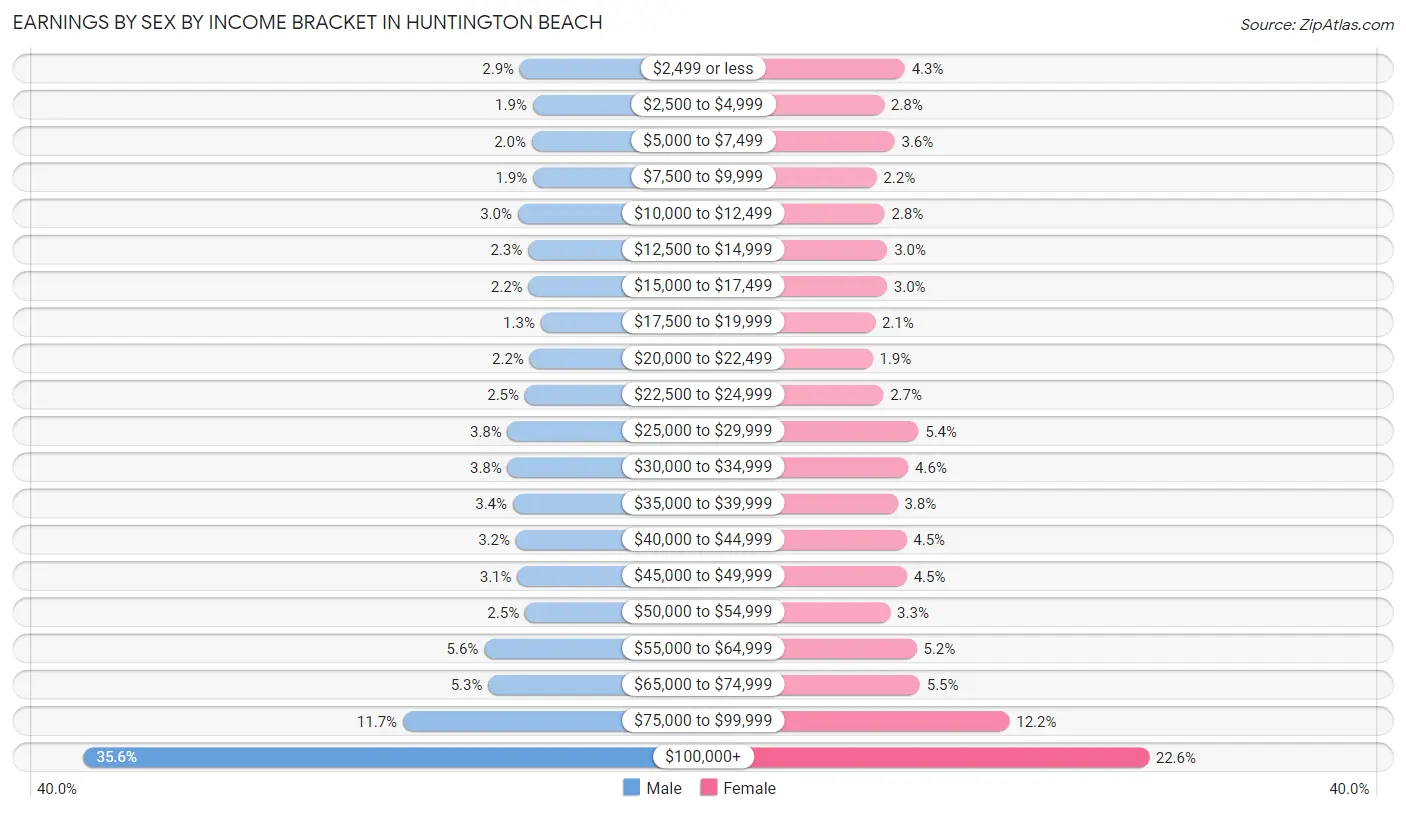
Earnings by Sex by Income Bracket in Huntington Beach
The most common earnings brackets in Huntington Beach are $100,000+ for men (21,590 | 35.6%) and $100,000+ for women (11,857 | 22.6%).
| Income | Male | Female |
| $2,499 or less | 1,748 (2.9%) | 2,275 (4.3%) |
| $2,500 to $4,999 | 1,165 (1.9%) | 1,457 (2.8%) |
| $5,000 to $7,499 | 1,208 (2.0%) | 1,877 (3.6%) |
| $7,500 to $9,999 | 1,144 (1.9%) | 1,161 (2.2%) |
| $10,000 to $12,499 | 1,844 (3.0%) | 1,481 (2.8%) |
| $12,500 to $14,999 | 1,376 (2.3%) | 1,586 (3.0%) |
| $15,000 to $17,499 | 1,362 (2.2%) | 1,574 (3.0%) |
| $17,500 to $19,999 | 800 (1.3%) | 1,106 (2.1%) |
| $20,000 to $22,499 | 1,302 (2.1%) | 1,011 (1.9%) |
| $22,500 to $24,999 | 1,522 (2.5%) | 1,433 (2.7%) |
| $25,000 to $29,999 | 2,307 (3.8%) | 2,808 (5.4%) |
| $30,000 to $34,999 | 2,305 (3.8%) | 2,410 (4.6%) |
| $35,000 to $39,999 | 2,068 (3.4%) | 1,989 (3.8%) |
| $40,000 to $44,999 | 1,938 (3.2%) | 2,336 (4.5%) |
| $45,000 to $49,999 | 1,862 (3.1%) | 2,352 (4.5%) |
| $50,000 to $54,999 | 1,518 (2.5%) | 1,701 (3.3%) |
| $55,000 to $64,999 | 3,373 (5.6%) | 2,734 (5.2%) |
| $65,000 to $74,999 | 3,185 (5.2%) | 2,867 (5.5%) |
| $75,000 to $99,999 | 7,070 (11.7%) | 6,383 (12.2%) |
| $100,000+ | 21,590 (35.6%) | 11,857 (22.6%) |
| Total | 60,687 (100.0%) | 52,398 (100.0%) |
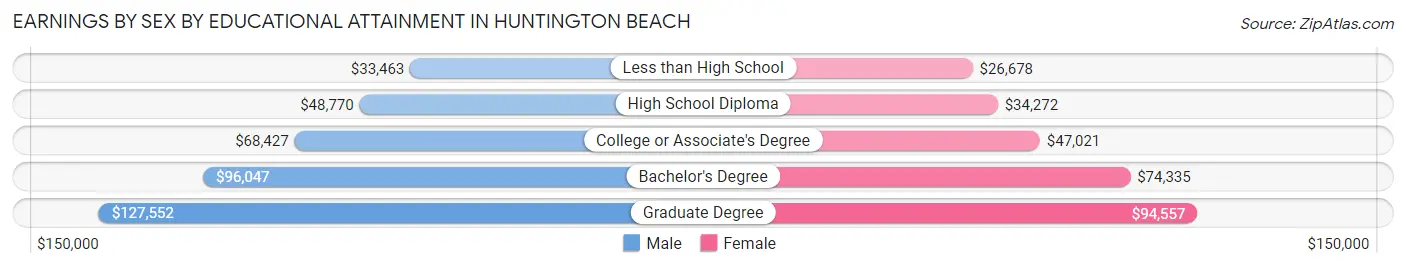
Earnings by Sex by Educational Attainment in Huntington Beach
Average earnings in Huntington Beach are $80,067 for men and $57,367 for women, a difference of 28.3%. Men with an educational attainment of graduate degree enjoy the highest average annual earnings of $127,552, while those with less than high school education earn the least with $33,463. Women with an educational attainment of graduate degree earn the most with the average annual earnings of $94,557, while those with less than high school education have the smallest earnings of $26,678.
| Educational Attainment | Male Income | Female Income |
| Less than High School | $33,463 | $26,678 |
| High School Diploma | $48,770 | $34,272 |
| College or Associate's Degree | $68,427 | $47,021 |
| Bachelor's Degree | $96,047 | $74,335 |
| Graduate Degree | $127,552 | $94,557 |
| Total | $80,067 | $57,367 |
Family Income in Huntington Beach
Family Income Brackets in Huntington Beach
According to the Huntington Beach family income data, there are 14,512 families falling into the $200,000+ income range, which is the most common income bracket and makes up 29.4% of all families. Conversely, the $10,000 to $14,999 income bracket is the least frequent group with only 592 families (1.2%) belonging to this category.
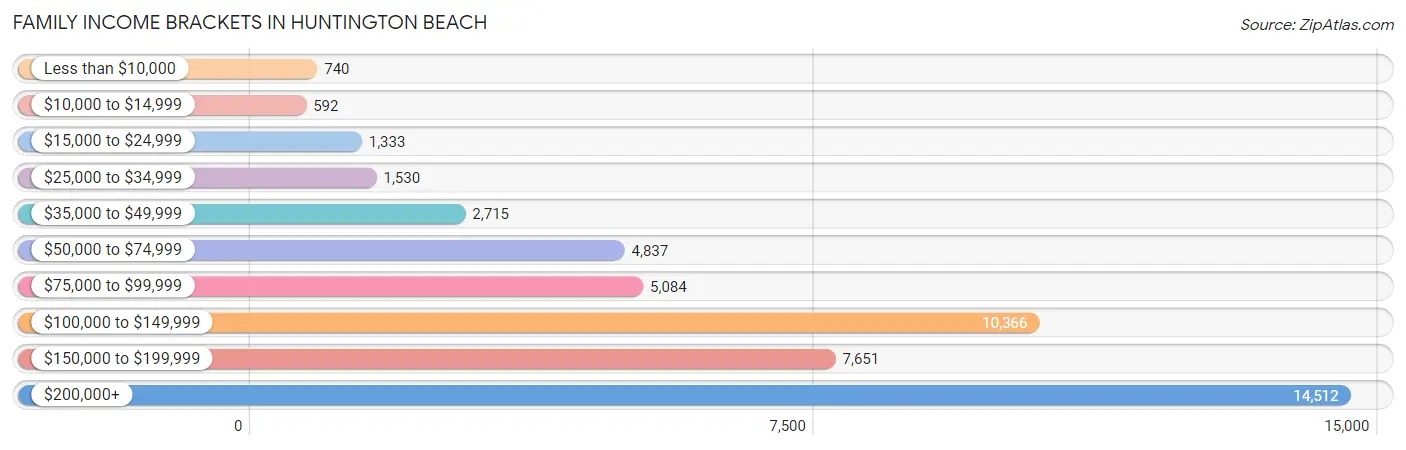
| Income Bracket | # Families | % Families |
| Less than $10,000 | 740 | 1.5% |
| $10,000 to $14,999 | 592 | 1.2% |
| $15,000 to $24,999 | 1,333 | 2.7% |
| $25,000 to $34,999 | 1,530 | 3.1% |
| $35,000 to $49,999 | 2,715 | 5.5% |
| $50,000 to $74,999 | 4,837 | 9.8% |
| $75,000 to $99,999 | 5,084 | 10.3% |
| $100,000 to $149,999 | 10,366 | 21.0% |
| $150,000 to $199,999 | 7,651 | 15.5% |
| $200,000+ | 14,512 | 29.4% |
Family Income by Famaliy Size in Huntington Beach
4-person families (10,092 | 20.4%) account for the highest median family income in Huntington Beach with $173,235 per family, while 2-person families (23,382 | 47.4%) have the highest median income of $61,024 per family member.
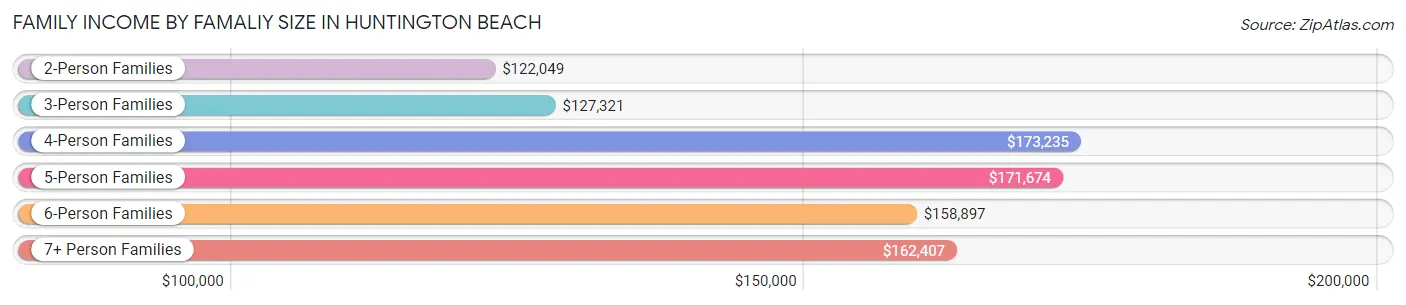
| Income Bracket | # Families | Median Income |
| 2-Person Families | 23,382 (47.4%) | $122,049 |
| 3-Person Families | 11,422 (23.1%) | $127,321 |
| 4-Person Families | 10,092 (20.4%) | $173,235 |
| 5-Person Families | 3,206 (6.5%) | $171,674 |
| 6-Person Families | 873 (1.8%) | $158,897 |
| 7+ Person Families | 387 (0.8%) | $162,407 |
| Total | 49,362 (100.0%) | $136,494 |
Family Income by Number of Earners in Huntington Beach
The median family income in Huntington Beach is $136,494, with families comprising 3+ earners (6,578) having the highest median family income of $190,000, while families with no earners (7,039) have the lowest median family income of $86,979, accounting for 13.3% and 14.3% of families, respectively.
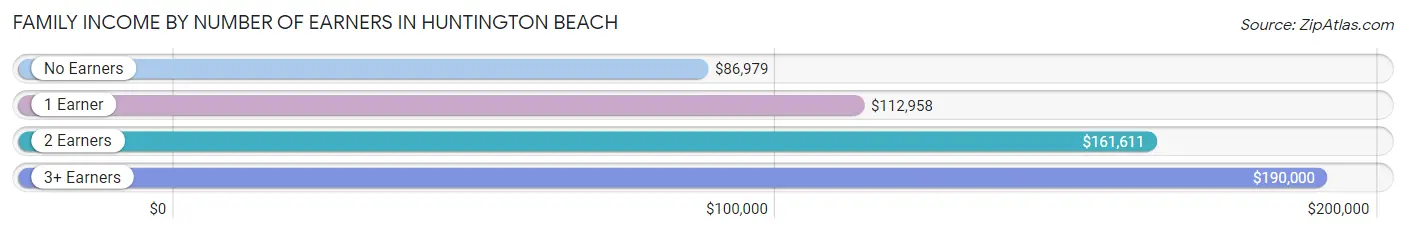
| Number of Earners | # Families | Median Income |
| No Earners | 7,039 (14.3%) | $86,979 |
| 1 Earner | 15,309 (31.0%) | $112,958 |
| 2 Earners | 20,436 (41.4%) | $161,611 |
| 3+ Earners | 6,578 (13.3%) | $190,000 |
| Total | 49,362 (100.0%) | $136,494 |
Household Income in Huntington Beach
Household Income Brackets in Huntington Beach
With 17,935 households falling in the category, the $200,000+ income range is the most frequent in Huntington Beach, accounting for 23.1% of all households. In contrast, only 1,708 households (2.2%) fall into the $10,000 to $14,999 income bracket, making it the least populous group.
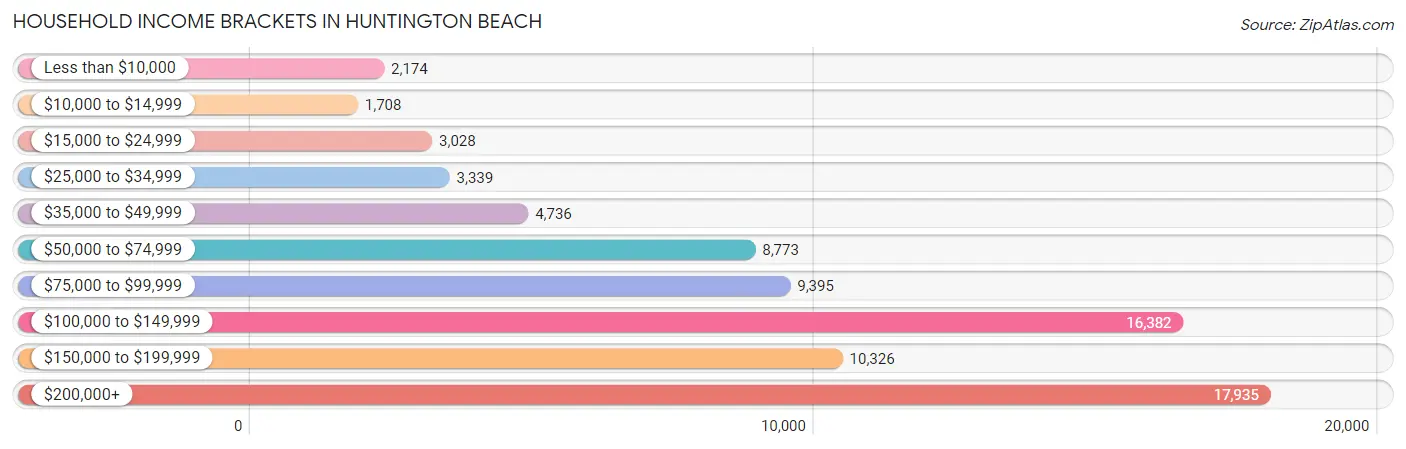
| Income Bracket | # Households | % Households |
| Less than $10,000 | 2,174 | 2.8% |
| $10,000 to $14,999 | 1,708 | 2.2% |
| $15,000 to $24,999 | 3,028 | 3.9% |
| $25,000 to $34,999 | 3,339 | 4.3% |
| $35,000 to $49,999 | 4,736 | 6.1% |
| $50,000 to $74,999 | 8,773 | 11.3% |
| $75,000 to $99,999 | 9,395 | 12.1% |
| $100,000 to $149,999 | 16,382 | 21.1% |
| $150,000 to $199,999 | 10,326 | 13.3% |
| $200,000+ | 17,935 | 23.1% |
Household Income by Householder Age in Huntington Beach
The median household income in Huntington Beach is $114,747, with the highest median household income of $129,280 found in the 45 to 64 years age bracket for the primary householder. A total of 32,163 households (41.4%) fall into this category. Meanwhile, the 15 to 24 years age bracket for the primary householder has the lowest median household income of $67,654, with 1,215 households (1.6%) in this group.
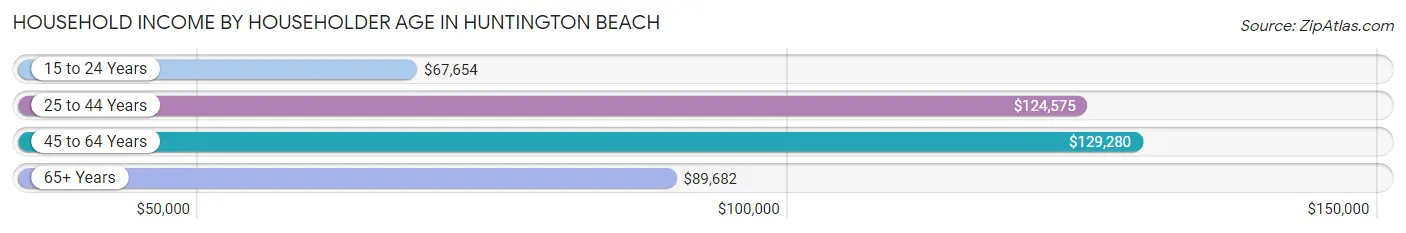
| Income Bracket | # Households | Median Income |
| 15 to 24 Years | 1,215 (1.6%) | $67,654 |
| 25 to 44 Years | 21,854 (28.1%) | $124,575 |
| 45 to 64 Years | 32,163 (41.4%) | $129,280 |
| 65+ Years | 22,409 (28.9%) | $89,682 |
| Total | 77,641 (100.0%) | $114,747 |
Poverty in Huntington Beach
Income Below Poverty by Sex and Age in Huntington Beach
With 6.7% poverty level for males and 7.8% for females among the residents of Huntington Beach, 6 to 11 year old males and 18 to 24 year old females are the most vulnerable to poverty, with 577 males (10.2%) and 1,003 females (12.1%) in their respective age groups living below the poverty level.
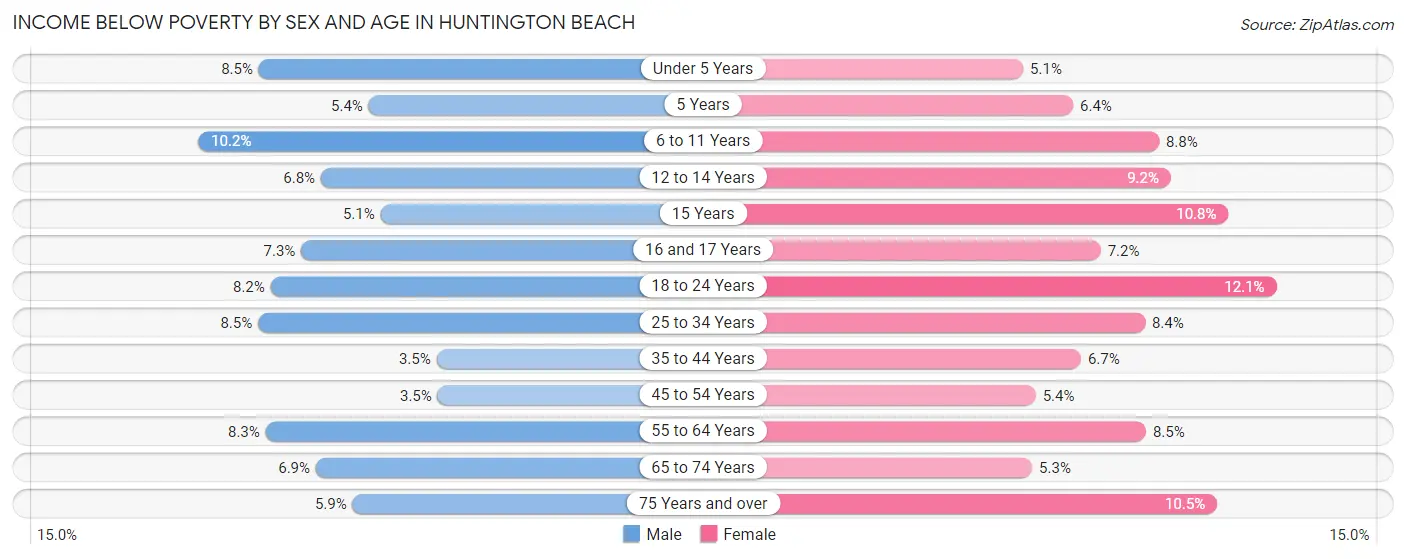
| Age Bracket | Male | Female |
| Under 5 Years | 415 (8.5%) | 212 (5.1%) |
| 5 Years | 32 (5.4%) | 59 (6.4%) |
| 6 to 11 Years | 577 (10.2%) | 454 (8.8%) |
| 12 to 14 Years | 250 (6.8%) | 245 (9.2%) |
| 15 Years | 44 (5.1%) | 145 (10.8%) |
| 16 and 17 Years | 189 (7.3%) | 151 (7.2%) |
| 18 to 24 Years | 609 (8.2%) | 1,003 (12.1%) |
| 25 to 34 Years | 1,238 (8.5%) | 1,138 (8.4%) |
| 35 to 44 Years | 442 (3.5%) | 773 (6.7%) |
| 45 to 54 Years | 481 (3.5%) | 756 (5.4%) |
| 55 to 64 Years | 1,253 (8.3%) | 1,223 (8.5%) |
| 65 to 74 Years | 701 (6.9%) | 587 (5.3%) |
| 75 Years and over | 396 (5.9%) | 895 (10.4%) |
| Total | 6,627 (6.7%) | 7,641 (7.8%) |
Income Above Poverty by Sex and Age in Huntington Beach
According to the poverty statistics in Huntington Beach, males aged 45 to 54 years and females aged under 5 years are the age groups that are most secure financially, with 96.5% of males and 95.0% of females in these age groups living above the poverty line.
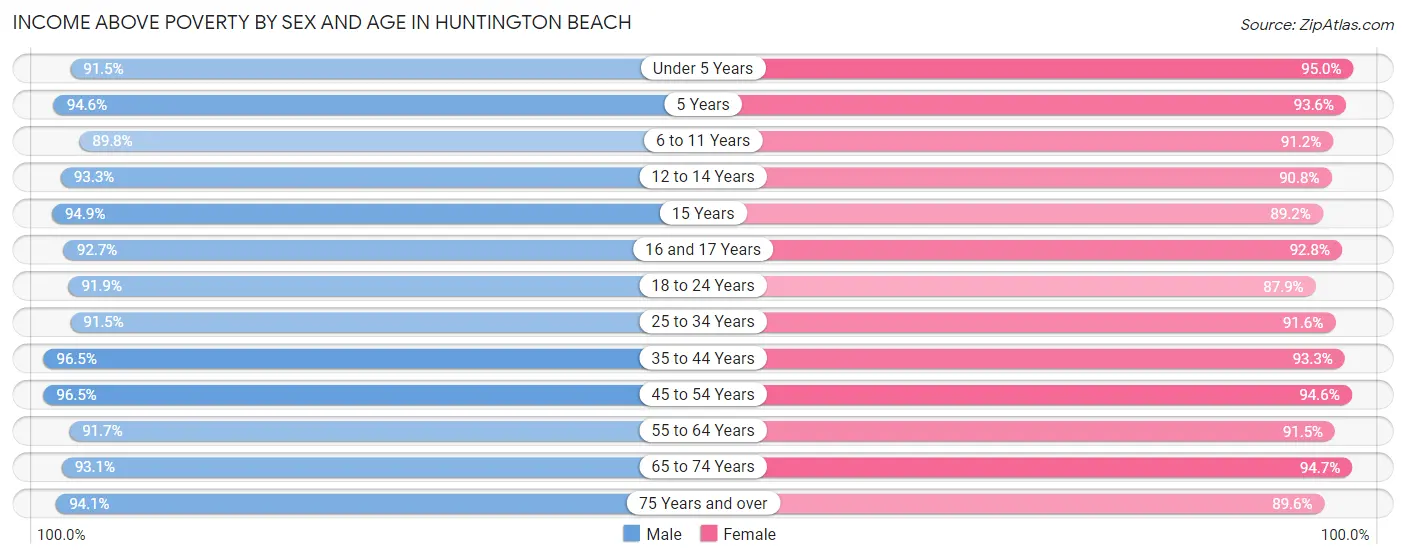
| Age Bracket | Male | Female |
| Under 5 Years | 4,481 (91.5%) | 3,990 (95.0%) |
| 5 Years | 558 (94.6%) | 857 (93.6%) |
| 6 to 11 Years | 5,098 (89.8%) | 4,689 (91.2%) |
| 12 to 14 Years | 3,452 (93.2%) | 2,431 (90.8%) |
| 15 Years | 820 (94.9%) | 1,203 (89.2%) |
| 16 and 17 Years | 2,399 (92.7%) | 1,944 (92.8%) |
| 18 to 24 Years | 6,860 (91.8%) | 7,288 (87.9%) |
| 25 to 34 Years | 13,324 (91.5%) | 12,350 (91.6%) |
| 35 to 44 Years | 12,062 (96.5%) | 10,832 (93.3%) |
| 45 to 54 Years | 13,267 (96.5%) | 13,249 (94.6%) |
| 55 to 64 Years | 13,860 (91.7%) | 13,214 (91.5%) |
| 65 to 74 Years | 9,466 (93.1%) | 10,484 (94.7%) |
| 75 Years and over | 6,347 (94.1%) | 7,669 (89.5%) |
| Total | 91,994 (93.3%) | 90,200 (92.2%) |
Income Below Poverty Among Married-Couple Families in Huntington Beach
The poverty statistics for married-couple families in Huntington Beach show that 2.6% or 976 of the total 37,260 families live below the poverty line. Families with 5 or more children have the highest poverty rate of 79.1%, comprising of 34 families. On the other hand, families with 1 or 2 children have the lowest poverty rate of 2.2%, which includes 267 families.
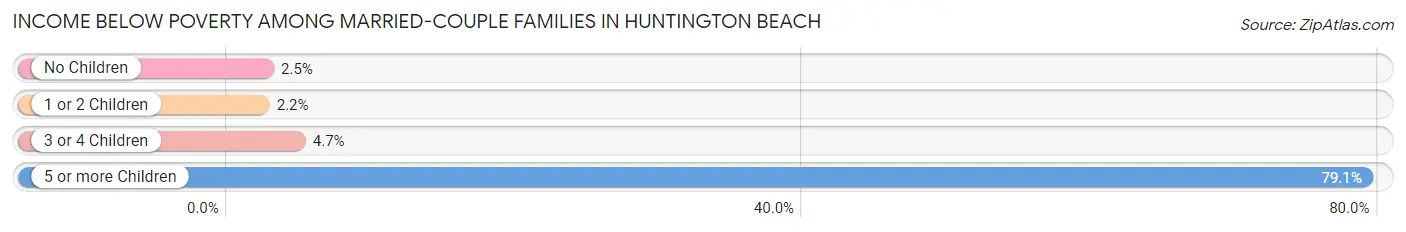
| Children | Above Poverty | Below Poverty |
| No Children | 22,565 (97.5%) | 581 (2.5%) |
| 1 or 2 Children | 11,812 (97.8%) | 267 (2.2%) |
| 3 or 4 Children | 1,898 (95.3%) | 94 (4.7%) |
| 5 or more Children | 9 (20.9%) | 34 (79.1%) |
| Total | 36,284 (97.4%) | 976 (2.6%) |
Income Below Poverty Among Single-Parent Households in Huntington Beach
According to the poverty data in Huntington Beach, 7.7% or 313 single-father households and 12.0% or 962 single-mother households are living below the poverty line. Among single-father households, those with 3 or 4 children have the highest poverty rate, with 29 households (12.6%) experiencing poverty. Likewise, among single-mother households, those with 3 or 4 children have the highest poverty rate, with 242 households (63.8%) falling below the poverty line.
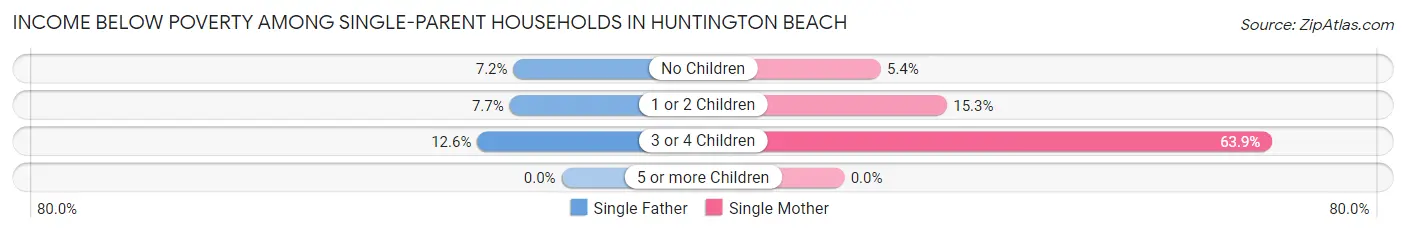
| Children | Single Father | Single Mother |
| No Children | 172 (7.2%) | 247 (5.4%) |
| 1 or 2 Children | 112 (7.7%) | 473 (15.3%) |
| 3 or 4 Children | 29 (12.6%) | 242 (63.8%) |
| 5 or more Children | 0 (0.0%) | 0 (0.0%) |
| Total | 313 (7.7%) | 962 (12.0%) |
Income Below Poverty Among Married-Couple vs Single-Parent Households in Huntington Beach
The poverty data for Huntington Beach shows that 976 of the married-couple family households (2.6%) and 1,275 of the single-parent households (10.5%) are living below the poverty level. Within the married-couple family households, those with 5 or more children have the highest poverty rate, with 34 households (79.1%) falling below the poverty line. Among the single-parent households, those with 3 or 4 children have the highest poverty rate, with 271 household (44.4%) living below poverty.
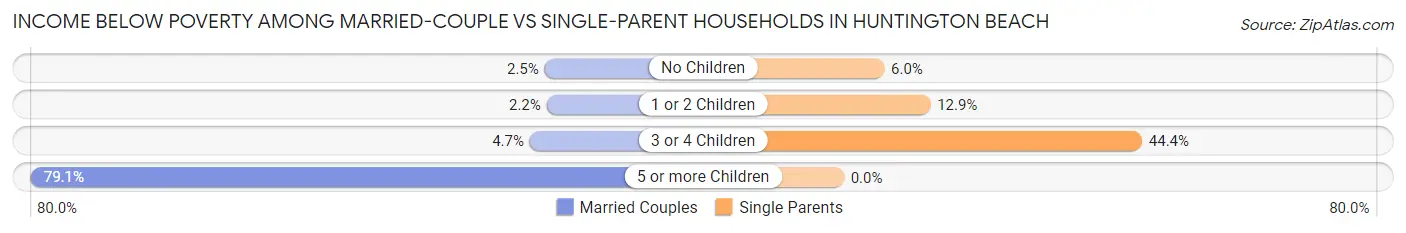
| Children | Married-Couple Families | Single-Parent Households |
| No Children | 581 (2.5%) | 419 (6.0%) |
| 1 or 2 Children | 267 (2.2%) | 585 (12.9%) |
| 3 or 4 Children | 94 (4.7%) | 271 (44.4%) |
| 5 or more Children | 34 (79.1%) | 0 (0.0%) |
| Total | 976 (2.6%) | 1,275 (10.5%) |
Race in Huntington Beach
The most populous races in Huntington Beach are White / Caucasian (129,873 | 65.8%), Hispanic or Latino (38,959 | 19.7%), and Asian (24,683 | 12.5%).
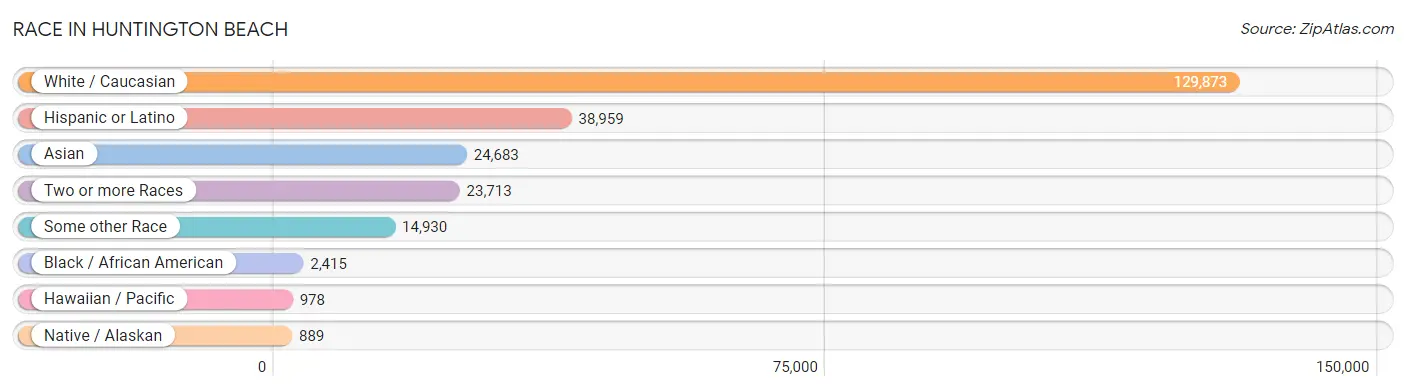
| Race | # Population | % Population |
| Asian | 24,683 | 12.5% |
| Black / African American | 2,415 | 1.2% |
| Hawaiian / Pacific | 978 | 0.5% |
| Hispanic or Latino | 38,959 | 19.7% |
| Native / Alaskan | 889 | 0.4% |
| White / Caucasian | 129,873 | 65.8% |
| Two or more Races | 23,713 | 12.0% |
| Some other Race | 14,930 | 7.6% |
| Total | 197,481 | 100.0% |
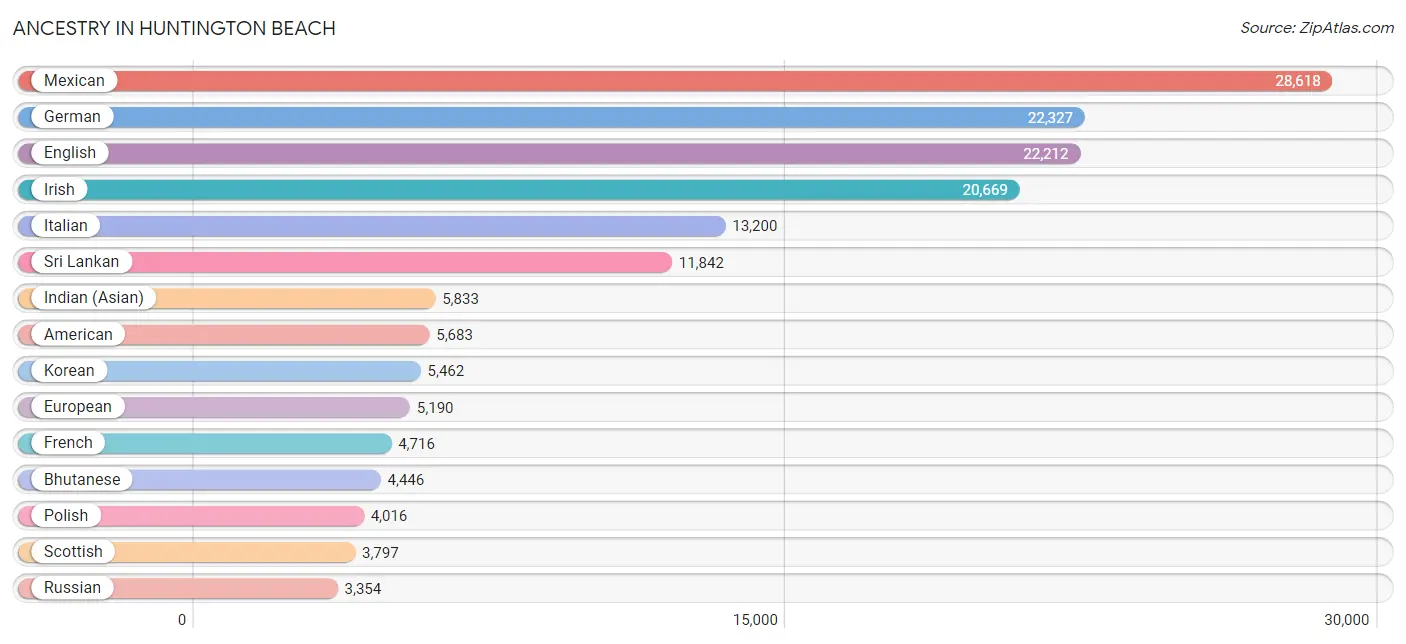
Ancestry in Huntington Beach
The most populous ancestries reported in Huntington Beach are Mexican (28,618 | 14.5%), German (22,327 | 11.3%), English (22,212 | 11.3%), Irish (20,669 | 10.5%), and Italian (13,200 | 6.7%), together accounting for 54.2% of all Huntington Beach residents.
| Ancestry | # Population | % Population |
| Afghan | 61 | 0.0% |
| African | 307 | 0.2% |
| Alaskan Athabascan | 38 | 0.0% |
| Albanian | 32 | 0.0% |
| Alsatian | 11 | 0.0% |
| American | 5,683 | 2.9% |
| Apache | 48 | 0.0% |
| Arab | 2,261 | 1.1% |
| Argentinean | 339 | 0.2% |
| Armenian | 731 | 0.4% |
| Assyrian / Chaldean / Syriac | 5 | 0.0% |
| Australian | 165 | 0.1% |
| Austrian | 671 | 0.3% |
| Bangladeshi | 2 | 0.0% |
| Barbadian | 11 | 0.0% |
| Basque | 147 | 0.1% |
| Belgian | 218 | 0.1% |
| Bhutanese | 4,446 | 2.2% |
| Blackfeet | 55 | 0.0% |
| Bolivian | 9 | 0.0% |
| Brazilian | 567 | 0.3% |
| British | 1,108 | 0.6% |
| Bulgarian | 66 | 0.0% |
| Burmese | 1,878 | 0.9% |
| Cajun | 12 | 0.0% |
| Cambodian | 34 | 0.0% |
| Canadian | 606 | 0.3% |
| Celtic | 134 | 0.1% |
| Central American | 3,247 | 1.6% |
| Central American Indian | 306 | 0.2% |
| Cherokee | 829 | 0.4% |
| Cheyenne | 51 | 0.0% |
| Chickasaw | 42 | 0.0% |
| Chilean | 161 | 0.1% |
| Chinese | 16 | 0.0% |
| Chippewa | 91 | 0.1% |
| Choctaw | 173 | 0.1% |
| Colombian | 552 | 0.3% |
| Comanche | 19 | 0.0% |
| Costa Rican | 83 | 0.0% |
| Cree | 26 | 0.0% |
| Creek | 25 | 0.0% |
| Croatian | 793 | 0.4% |
| Cuban | 754 | 0.4% |
| Czech | 1,160 | 0.6% |
| Czechoslovakian | 187 | 0.1% |
| Danish | 816 | 0.4% |
| Delaware | 8 | 0.0% |
| Dominican | 98 | 0.1% |
| Dutch | 2,783 | 1.4% |
| Eastern European | 568 | 0.3% |
| Ecuadorian | 367 | 0.2% |
| Egyptian | 856 | 0.4% |
| English | 22,212 | 11.3% |
| Ethiopian | 161 | 0.1% |
| European | 5,190 | 2.6% |
| Fijian | 15 | 0.0% |
| Filipino | 581 | 0.3% |
| Finnish | 439 | 0.2% |
| French | 4,716 | 2.4% |
| French Canadian | 910 | 0.5% |
| German | 22,327 | 11.3% |
| Ghanaian | 47 | 0.0% |
| Greek | 1,296 | 0.7% |
| Guamanian / Chamorro | 406 | 0.2% |
| Guatemalan | 1,163 | 0.6% |
| Honduran | 124 | 0.1% |
| Hopi | 15 | 0.0% |
| Hungarian | 1,090 | 0.5% |
| Icelander | 143 | 0.1% |
| Indian (Asian) | 5,833 | 2.9% |
| Indonesian | 28 | 0.0% |
| Iranian | 582 | 0.3% |
| Iraqi | 29 | 0.0% |
| Irish | 20,669 | 10.5% |
| Iroquois | 27 | 0.0% |
| Israeli | 43 | 0.0% |
| Italian | 13,200 | 6.7% |
| Jamaican | 89 | 0.1% |
| Japanese | 511 | 0.3% |
| Jordanian | 203 | 0.1% |
| Kenyan | 6 | 0.0% |
| Korean | 5,462 | 2.8% |
| Laotian | 350 | 0.2% |
| Latvian | 24 | 0.0% |
| Lebanese | 454 | 0.2% |
| Lithuanian | 379 | 0.2% |
| Malaysian | 150 | 0.1% |
| Maltese | 56 | 0.0% |
| Mexican | 28,618 | 14.5% |
| Mexican American Indian | 373 | 0.2% |
| Mongolian | 25 | 0.0% |
| Moroccan | 11 | 0.0% |
| Native Hawaiian | 765 | 0.4% |
| Navajo | 81 | 0.0% |
| New Zealander | 50 | 0.0% |
| Nicaraguan | 208 | 0.1% |
| Nigerian | 85 | 0.0% |
| Northern European | 321 | 0.2% |
| Norwegian | 3,086 | 1.6% |
| Okinawan | 28 | 0.0% |
| Ottawa | 6 | 0.0% |
| Pakistani | 401 | 0.2% |
| Palestinian | 143 | 0.1% |
| Panamanian | 50 | 0.0% |
| Pennsylvania German | 5 | 0.0% |
| Peruvian | 250 | 0.1% |
| Pima | 36 | 0.0% |
| Polish | 4,016 | 2.0% |
| Portuguese | 915 | 0.5% |
| Potawatomi | 16 | 0.0% |
| Puerto Rican | 876 | 0.4% |
| Romanian | 1,009 | 0.5% |
| Russian | 3,354 | 1.7% |
| Salvadoran | 1,599 | 0.8% |
| Samoan | 665 | 0.3% |
| Scandinavian | 1,338 | 0.7% |
| Scotch-Irish | 1,598 | 0.8% |
| Scottish | 3,797 | 1.9% |
| Serbian | 68 | 0.0% |
| Sioux | 112 | 0.1% |
| Slavic | 235 | 0.1% |
| Slovak | 198 | 0.1% |
| Slovene | 71 | 0.0% |
| South African | 207 | 0.1% |
| South American | 1,966 | 1.0% |
| Soviet Union | 24 | 0.0% |
| Spaniard | 1,362 | 0.7% |
| Spanish | 1,144 | 0.6% |
| Spanish American | 121 | 0.1% |
| Sri Lankan | 11,842 | 6.0% |
| Subsaharan African | 829 | 0.4% |
| Swedish | 3,328 | 1.7% |
| Swiss | 573 | 0.3% |
| Syrian | 119 | 0.1% |
| Thai | 1,577 | 0.8% |
| Tohono O'Odham | 32 | 0.0% |
| Trinidadian and Tobagonian | 157 | 0.1% |
| Turkish | 430 | 0.2% |
| Ukrainian | 508 | 0.3% |
| Uruguayan | 138 | 0.1% |
| Venezuelan | 41 | 0.0% |
| Vietnamese | 1 | 0.0% |
| Welsh | 1,405 | 0.7% |
| West Indian | 157 | 0.1% |
| Yaqui | 113 | 0.1% |
| Yugoslavian | 211 | 0.1% | View All 147 Rows |
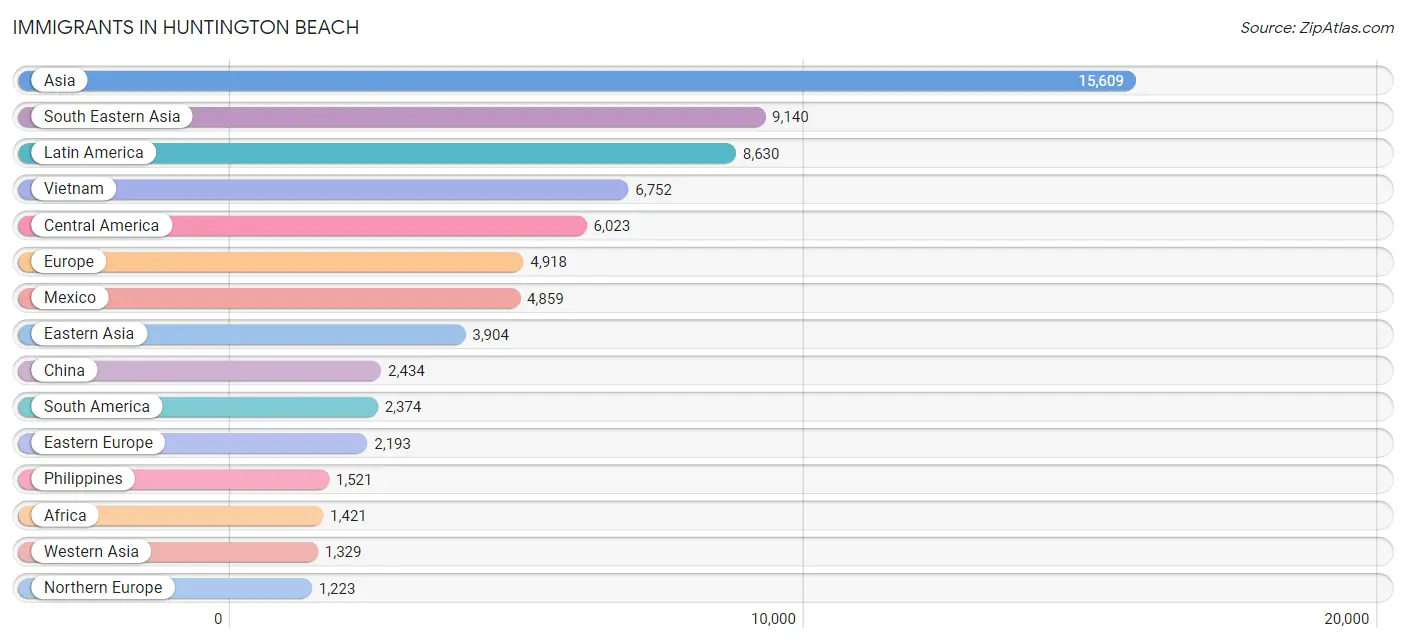
Immigrants in Huntington Beach
The most numerous immigrant groups reported in Huntington Beach came from Asia (15,609 | 7.9%), South Eastern Asia (9,140 | 4.6%), Latin America (8,630 | 4.4%), Vietnam (6,752 | 3.4%), and Central America (6,023 | 3.0%), together accounting for 23.4% of all Huntington Beach residents.
| Immigration Origin | # Population | % Population |
| Afghanistan | 96 | 0.1% |
| Africa | 1,421 | 0.7% |
| Argentina | 339 | 0.2% |
| Armenia | 121 | 0.1% |
| Asia | 15,609 | 7.9% |
| Australia | 215 | 0.1% |
| Austria | 52 | 0.0% |
| Bangladesh | 14 | 0.0% |
| Belarus | 26 | 0.0% |
| Belgium | 23 | 0.0% |
| Bolivia | 21 | 0.0% |
| Bosnia and Herzegovina | 93 | 0.1% |
| Brazil | 614 | 0.3% |
| Bulgaria | 28 | 0.0% |
| Cambodia | 208 | 0.1% |
| Cameroon | 14 | 0.0% |
| Canada | 1,048 | 0.5% |
| Caribbean | 233 | 0.1% |
| Central America | 6,023 | 3.0% |
| Chile | 82 | 0.0% |
| China | 2,434 | 1.2% |
| Colombia | 422 | 0.2% |
| Croatia | 87 | 0.0% |
| Cuba | 216 | 0.1% |
| Czechoslovakia | 160 | 0.1% |
| Denmark | 42 | 0.0% |
| Eastern Africa | 311 | 0.2% |
| Eastern Asia | 3,904 | 2.0% |
| Eastern Europe | 2,193 | 1.1% |
| Ecuador | 262 | 0.1% |
| Egypt | 646 | 0.3% |
| El Salvador | 791 | 0.4% |
| England | 657 | 0.3% |
| Ethiopia | 161 | 0.1% |
| Europe | 4,918 | 2.5% |
| Fiji | 11 | 0.0% |
| France | 291 | 0.2% |
| Germany | 475 | 0.2% |
| Ghana | 7 | 0.0% |
| Greece | 42 | 0.0% |
| Guatemala | 238 | 0.1% |
| Honduras | 71 | 0.0% |
| Hong Kong | 223 | 0.1% |
| Hungary | 57 | 0.0% |
| India | 478 | 0.2% |
| Indonesia | 122 | 0.1% |
| Iran | 358 | 0.2% |
| Iraq | 52 | 0.0% |
| Ireland | 174 | 0.1% |
| Israel | 58 | 0.0% |
| Italy | 193 | 0.1% |
| Japan | 609 | 0.3% |
| Jordan | 324 | 0.2% |
| Kenya | 88 | 0.0% |
| Korea | 850 | 0.4% |
| Kuwait | 40 | 0.0% |
| Laos | 118 | 0.1% |
| Latin America | 8,630 | 4.4% |
| Lebanon | 101 | 0.1% |
| Lithuania | 14 | 0.0% |
| Malaysia | 50 | 0.0% |
| Mexico | 4,859 | 2.5% |
| Middle Africa | 14 | 0.0% |
| Moldova | 279 | 0.1% |
| Morocco | 30 | 0.0% |
| Netherlands | 171 | 0.1% |
| Nicaragua | 38 | 0.0% |
| Northern Africa | 689 | 0.4% |
| Northern Europe | 1,223 | 0.6% |
| Norway | 21 | 0.0% |
| Oceania | 516 | 0.3% |
| Pakistan | 190 | 0.1% |
| Panama | 26 | 0.0% |
| Peru | 466 | 0.2% |
| Philippines | 1,521 | 0.8% |
| Poland | 229 | 0.1% |
| Romania | 302 | 0.2% |
| Russia | 494 | 0.3% |
| Scotland | 78 | 0.0% |
| Senegal | 103 | 0.1% |
| Serbia | 6 | 0.0% |
| Singapore | 75 | 0.0% |
| South Africa | 297 | 0.2% |
| South America | 2,374 | 1.2% |
| South Central Asia | 1,198 | 0.6% |
| South Eastern Asia | 9,140 | 4.6% |
| Southern Europe | 444 | 0.2% |
| Spain | 209 | 0.1% |
| Sri Lanka | 62 | 0.0% |
| St. Vincent and the Grenadines | 6 | 0.0% |
| Sweden | 71 | 0.0% |
| Switzerland | 40 | 0.0% |
| Syria | 128 | 0.1% |
| Taiwan | 1,150 | 0.6% |
| Thailand | 263 | 0.1% |
| Trinidad and Tobago | 11 | 0.0% |
| Turkey | 454 | 0.2% |
| Ukraine | 245 | 0.1% |
| Uruguay | 138 | 0.1% |
| Venezuela | 30 | 0.0% |
| Vietnam | 6,752 | 3.4% |
| Western Africa | 110 | 0.1% |
| Western Asia | 1,329 | 0.7% |
| Western Europe | 1,052 | 0.5% |
| Zimbabwe | 42 | 0.0% | View All 105 Rows |
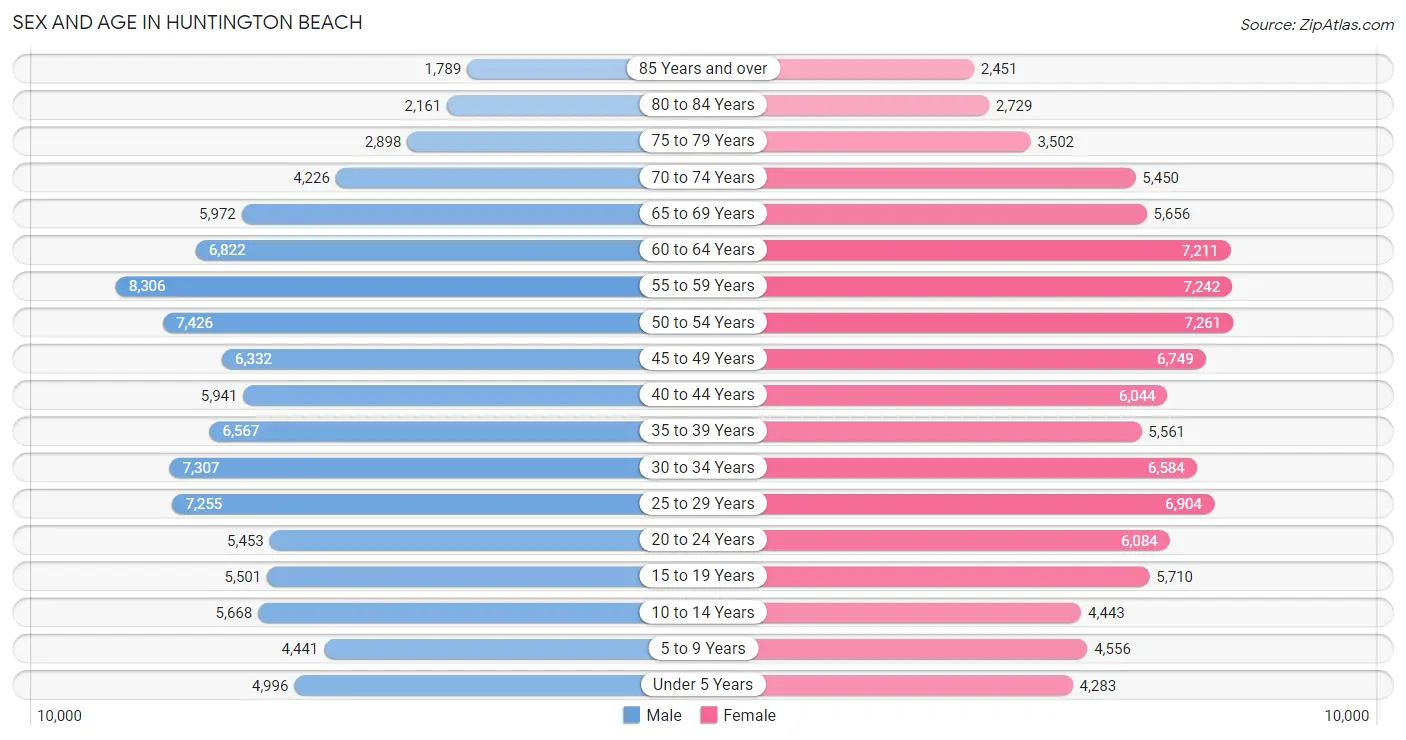
Sex and Age in Huntington Beach
Sex and Age in Huntington Beach
The most populous age groups in Huntington Beach are 55 to 59 Years (8,306 | 8.4%) for men and 50 to 54 Years (7,261 | 7.4%) for women.
| Age Bracket | Male | Female |
| Under 5 Years | 4,996 (5.0%) | 4,283 (4.3%) |
| 5 to 9 Years | 4,441 (4.5%) | 4,556 (4.6%) |
| 10 to 14 Years | 5,668 (5.7%) | 4,443 (4.5%) |
| 15 to 19 Years | 5,501 (5.6%) | 5,710 (5.8%) |
| 20 to 24 Years | 5,453 (5.5%) | 6,084 (6.2%) |
| 25 to 29 Years | 7,255 (7.3%) | 6,904 (7.0%) |
| 30 to 34 Years | 7,307 (7.4%) | 6,584 (6.7%) |
| 35 to 39 Years | 6,567 (6.6%) | 5,561 (5.7%) |
| 40 to 44 Years | 5,941 (6.0%) | 6,044 (6.1%) |
| 45 to 49 Years | 6,332 (6.4%) | 6,749 (6.9%) |
| 50 to 54 Years | 7,426 (7.5%) | 7,261 (7.4%) |
| 55 to 59 Years | 8,306 (8.4%) | 7,242 (7.4%) |
| 60 to 64 Years | 6,822 (6.9%) | 7,211 (7.3%) |
| 65 to 69 Years | 5,972 (6.0%) | 5,656 (5.8%) |
| 70 to 74 Years | 4,226 (4.3%) | 5,450 (5.5%) |
| 75 to 79 Years | 2,898 (2.9%) | 3,502 (3.6%) |
| 80 to 84 Years | 2,161 (2.2%) | 2,729 (2.8%) |
| 85 Years and over | 1,789 (1.8%) | 2,451 (2.5%) |
| Total | 99,061 (100.0%) | 98,420 (100.0%) |
Families and Households in Huntington Beach
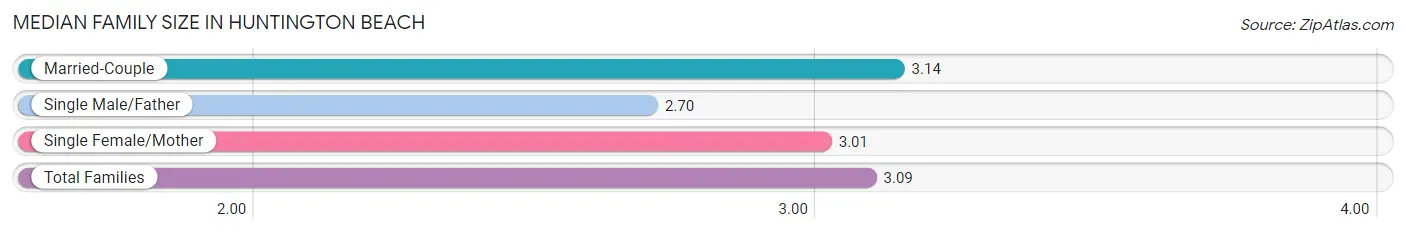
Median Family Size in Huntington Beach
The median family size in Huntington Beach is 3.09 persons per family, with married-couple families (37,260 | 75.5%) accounting for the largest median family size of 3.14 persons per family. On the other hand, single male/father families (4,077 | 8.3%) represent the smallest median family size with 2.70 persons per family.
| Family Type | # Families | Family Size |
| Married-Couple | 37,260 (75.5%) | 3.14 |
| Single Male/Father | 4,077 (8.3%) | 2.70 |
| Single Female/Mother | 8,025 (16.3%) | 3.01 |
| Total Families | 49,362 (100.0%) | 3.09 |
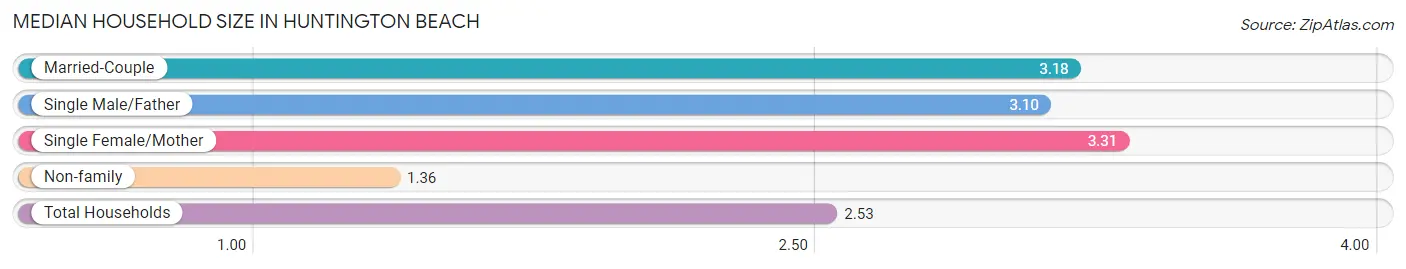
Median Household Size in Huntington Beach
The median household size in Huntington Beach is 2.53 persons per household, with single female/mother households (8,025 | 10.3%) accounting for the largest median household size of 3.31 persons per household. non-family households (28,279 | 36.4%) represent the smallest median household size with 1.36 persons per household.
| Household Type | # Households | Household Size |
| Married-Couple | 37,260 (48.0%) | 3.18 |
| Single Male/Father | 4,077 (5.2%) | 3.10 |
| Single Female/Mother | 8,025 (10.3%) | 3.31 |
| Non-family | 28,279 (36.4%) | 1.36 |
| Total Households | 77,641 (100.0%) | 2.53 |
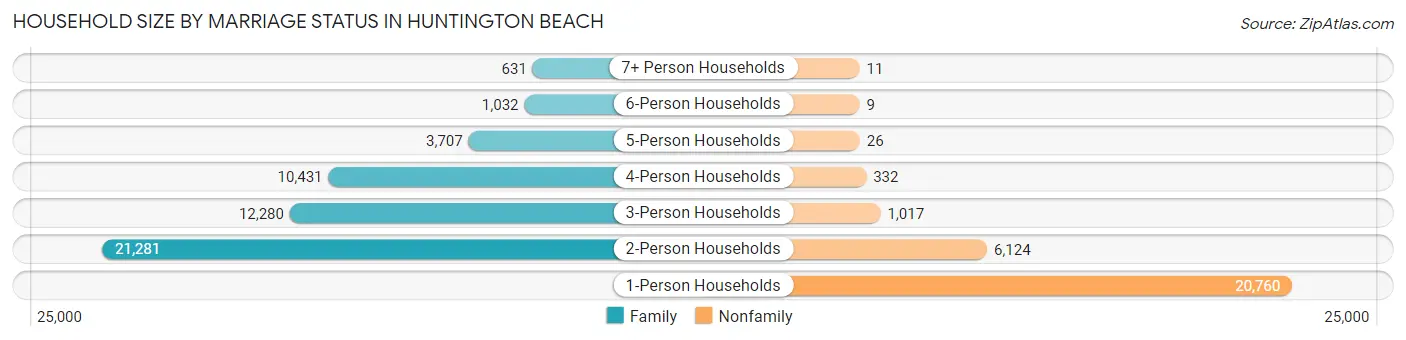
Household Size by Marriage Status in Huntington Beach
Out of a total of 77,641 households in Huntington Beach, 49,362 (63.6%) are family households, while 28,279 (36.4%) are nonfamily households. The most numerous type of family households are 2-person households, comprising 21,281, and the most common type of nonfamily households are 1-person households, comprising 20,760.
| Household Size | Family Households | Nonfamily Households |
| 1-Person Households | - | 20,760 (26.7%) |
| 2-Person Households | 21,281 (27.4%) | 6,124 (7.9%) |
| 3-Person Households | 12,280 (15.8%) | 1,017 (1.3%) |
| 4-Person Households | 10,431 (13.4%) | 332 (0.4%) |
| 5-Person Households | 3,707 (4.8%) | 26 (0.0%) |
| 6-Person Households | 1,032 (1.3%) | 9 (0.0%) |
| 7+ Person Households | 631 (0.8%) | 11 (0.0%) |
| Total | 49,362 (63.6%) | 28,279 (36.4%) |
Female Fertility in Huntington Beach
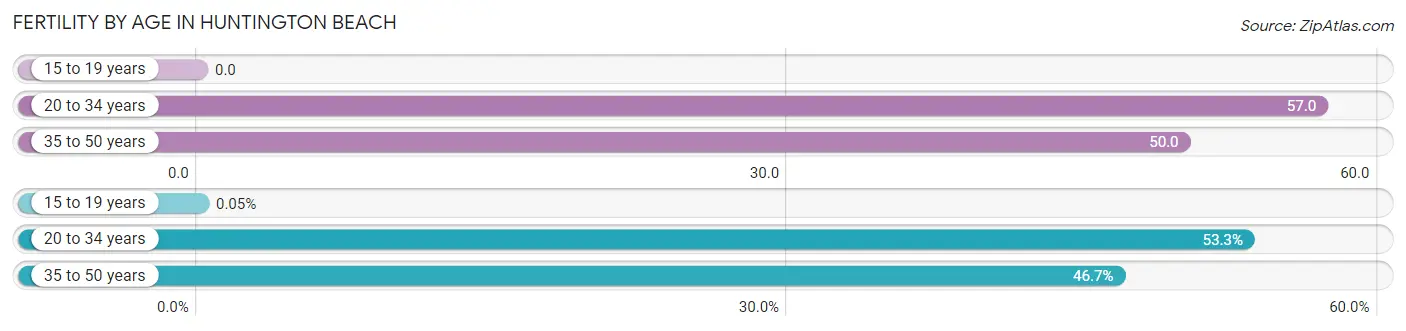
Fertility by Age in Huntington Beach
Average fertility rate in Huntington Beach is 47.0 births per 1,000 women. Women in the age bracket of 20 to 34 years have the highest fertility rate with 57.0 births per 1,000 women. Women in the age bracket of 20 to 34 years acount for 53.3% of all women with births.
| Age Bracket | Women with Births | Births / 1,000 Women |
| 15 to 19 years | 1 (0.1%) | 0.0 |
| 20 to 34 years | 1,124 (53.3%) | 57.0 |
| 35 to 50 years | 985 (46.7%) | 50.0 |
| Total | 2,110 (100.0%) | 47.0 |
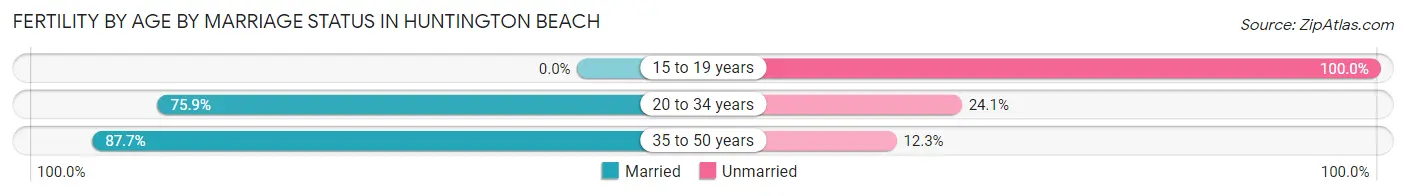
Fertility by Age by Marriage Status in Huntington Beach
81.4% of women with births (2,110) in Huntington Beach are married. The highest percentage of unmarried women with births falls into 15 to 19 years age bracket with 100.0% of them unmarried at the time of birth, while the lowest percentage of unmarried women with births belong to 35 to 50 years age bracket with 12.3% of them unmarried.
| Age Bracket | Married | Unmarried |
| 15 to 19 years | 0 (0.0%) | 1 (100.0%) |
| 20 to 34 years | 853 (75.9%) | 271 (24.1%) |
| 35 to 50 years | 864 (87.7%) | 121 (12.3%) |
| Total | 1,718 (81.4%) | 392 (18.6%) |
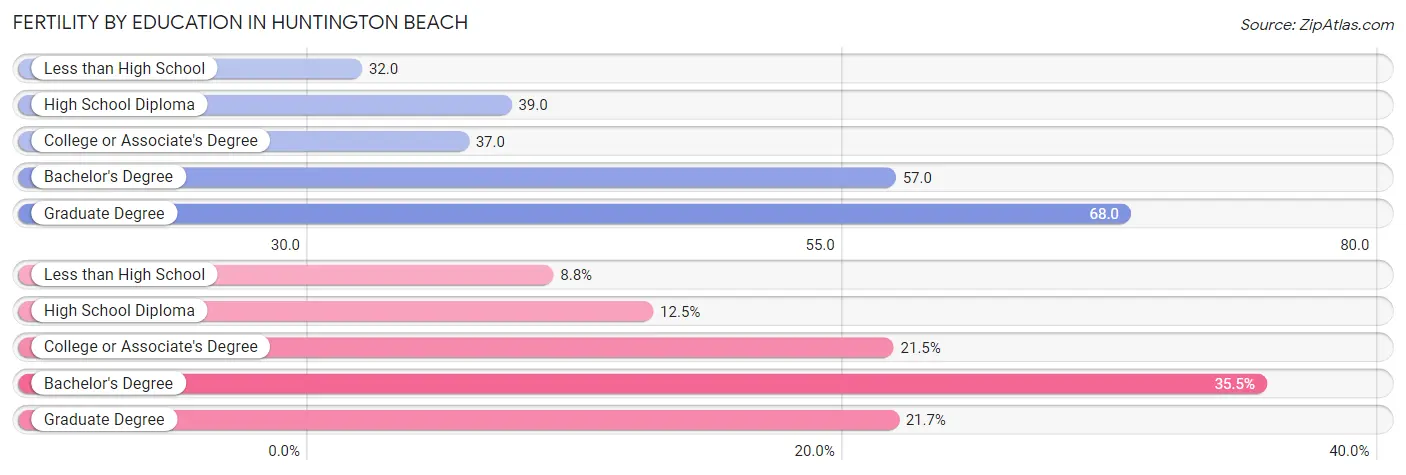
Fertility by Education in Huntington Beach
Average fertility rate in Huntington Beach is 47.0 births per 1,000 women. Women with the education attainment of graduate degree have the highest fertility rate of 68.0 births per 1,000 women, while women with the education attainment of less than high school have the lowest fertility at 32.0 births per 1,000 women. Women with the education attainment of bachelor's degree represent 35.5% of all women with births.
| Educational Attainment | Women with Births | Births / 1,000 Women |
| Less than High School | 185 (8.8%) | 32.0 |
| High School Diploma | 264 (12.5%) | 39.0 |
| College or Associate's Degree | 454 (21.5%) | 37.0 |
| Bachelor's Degree | 749 (35.5%) | 57.0 |
| Graduate Degree | 458 (21.7%) | 68.0 |
| Total | 2,110 (100.0%) | 47.0 |
Fertility by Education by Marriage Status in Huntington Beach
18.6% of women with births in Huntington Beach are unmarried. Women with the educational attainment of bachelor's degree are most likely to be married with 94.1% of them married at childbirth, while women with the educational attainment of less than high school are least likely to be married with 41.6% of them unmarried at childbirth.
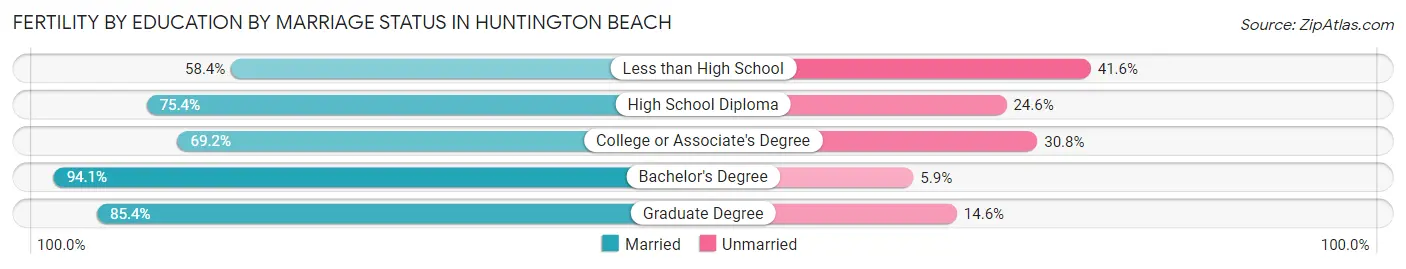
| Educational Attainment | Married | Unmarried |
| Less than High School | 108 (58.4%) | 77 (41.6%) |
| High School Diploma | 199 (75.4%) | 65 (24.6%) |
| College or Associate's Degree | 314 (69.2%) | 140 (30.8%) |
| Bachelor's Degree | 705 (94.1%) | 44 (5.9%) |
| Graduate Degree | 391 (85.4%) | 67 (14.6%) |
| Total | 1,718 (81.4%) | 392 (18.6%) |
Employment Characteristics in Huntington Beach
Employment by Class of Employer in Huntington Beach
Among the 101,872 employed individuals in Huntington Beach, private company employees (68,278 | 67.0%), local government employees (8,746 | 8.6%), and self-employed (not incorporated) (7,406 | 7.3%) make up the most common classes of employment.
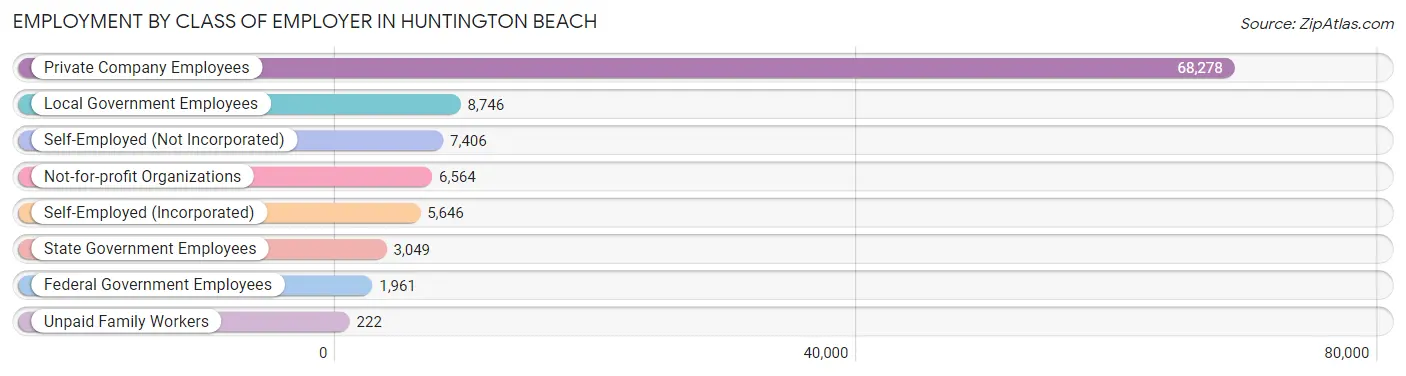
| Employer Class | # Employees | % Employees |
| Private Company Employees | 68,278 | 67.0% |
| Self-Employed (Incorporated) | 5,646 | 5.5% |
| Self-Employed (Not Incorporated) | 7,406 | 7.3% |
| Not-for-profit Organizations | 6,564 | 6.4% |
| Local Government Employees | 8,746 | 8.6% |
| State Government Employees | 3,049 | 3.0% |
| Federal Government Employees | 1,961 | 1.9% |
| Unpaid Family Workers | 222 | 0.2% |
| Total | 101,872 | 100.0% |
Employment Status by Age in Huntington Beach
According to the labor force statistics for Huntington Beach, out of the total population over 16 years of age (166,880), 66.3% or 110,641 individuals are in the labor force, with 5.4% or 5,975 of them unemployed. The age group with the highest labor force participation rate is 25 to 29 years, with 89.5% or 12,672 individuals in the labor force. Within the labor force, the 16 to 19 years age range has the highest percentage of unemployed individuals, with 14.3% or 508 of them being unemployed.
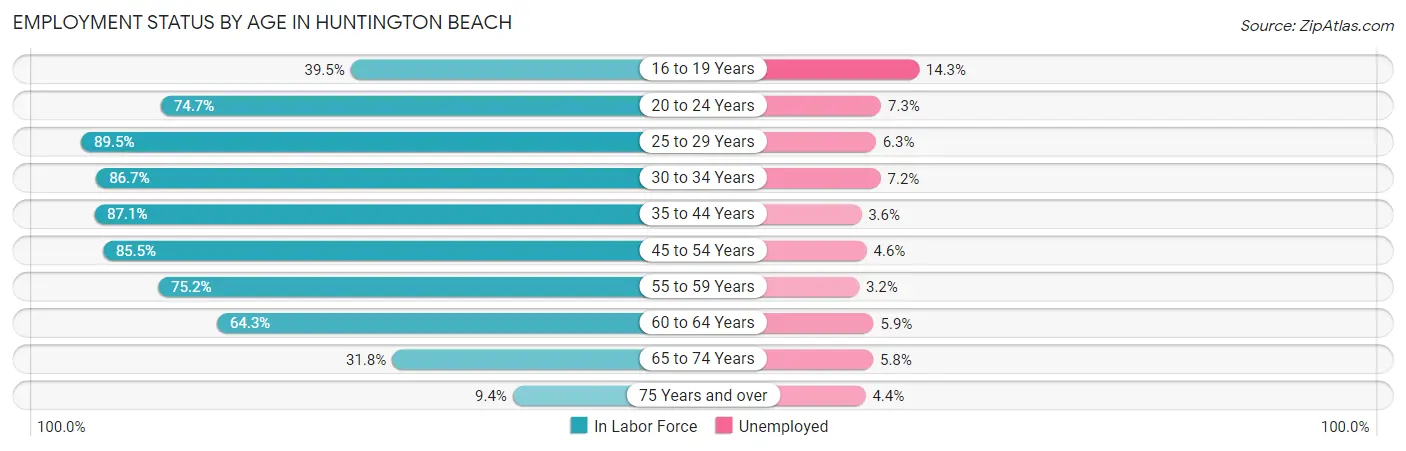
| Age Bracket | In Labor Force | Unemployed |
| 16 to 19 Years | 3,554 (39.5%) | 508 (14.3%) |
| 20 to 24 Years | 8,618 (74.7%) | 629 (7.3%) |
| 25 to 29 Years | 12,672 (89.5%) | 798 (6.3%) |
| 30 to 34 Years | 12,043 (86.7%) | 867 (7.2%) |
| 35 to 44 Years | 21,002 (87.1%) | 756 (3.6%) |
| 45 to 54 Years | 23,742 (85.5%) | 1,092 (4.6%) |
| 55 to 59 Years | 11,692 (75.2%) | 374 (3.2%) |
| 60 to 64 Years | 9,023 (64.3%) | 532 (5.9%) |
| 65 to 74 Years | 6,775 (31.8%) | 393 (5.8%) |
| 75 Years and over | 1,460 (9.4%) | 64 (4.4%) |
| Total | 110,641 (66.3%) | 5,975 (5.4%) |
Employment Status by Educational Attainment in Huntington Beach
According to labor force statistics for Huntington Beach, 82.3% of individuals (90,128) out of the total population between 25 and 64 years of age (109,512) are in the labor force, with 4.9% or 4,416 of them being unemployed. The group with the highest labor force participation rate are those with the educational attainment of bachelor's degree or higher, with 87.7% or 46,130 individuals in the labor force. Within the labor force, individuals with less than high school education have the highest percentage of unemployment, with 9.7% or 415 of them being unemployed.
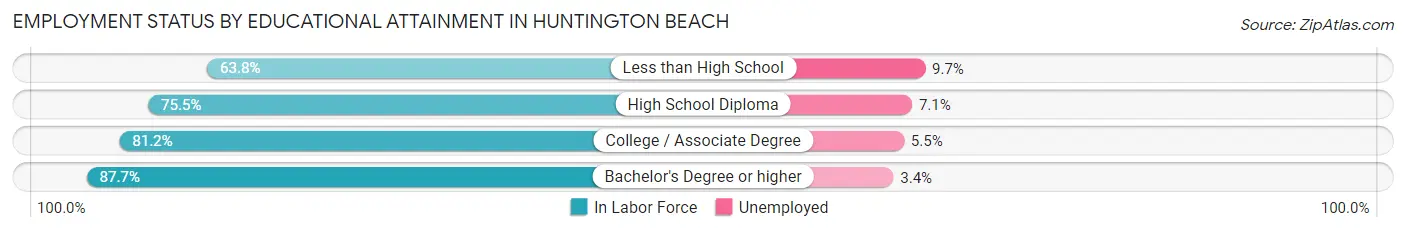
| Educational Attainment | In Labor Force | Unemployed |
| Less than High School | 4,280 (63.8%) | 651 (9.7%) |
| High School Diploma | 13,573 (75.5%) | 1,276 (7.1%) |
| College / Associate Degree | 26,167 (81.2%) | 1,772 (5.5%) |
| Bachelor's Degree or higher | 46,130 (87.7%) | 1,788 (3.4%) |
| Total | 90,128 (82.3%) | 5,366 (4.9%) |
Employment Occupations by Sex in Huntington Beach
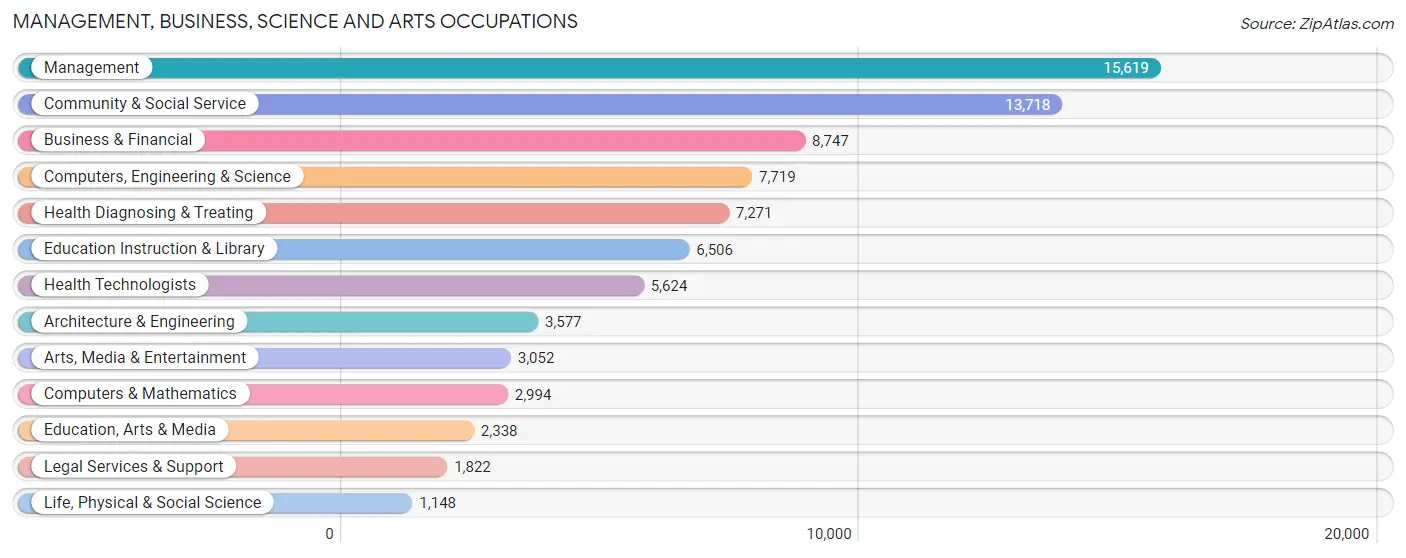
Management, Business, Science and Arts Occupations
The most common Management, Business, Science and Arts occupations in Huntington Beach are Management (15,619 | 14.9%), Community & Social Service (13,718 | 13.1%), Business & Financial (8,747 | 8.4%), Computers, Engineering & Science (7,719 | 7.4%), and Health Diagnosing & Treating (7,271 | 7.0%).
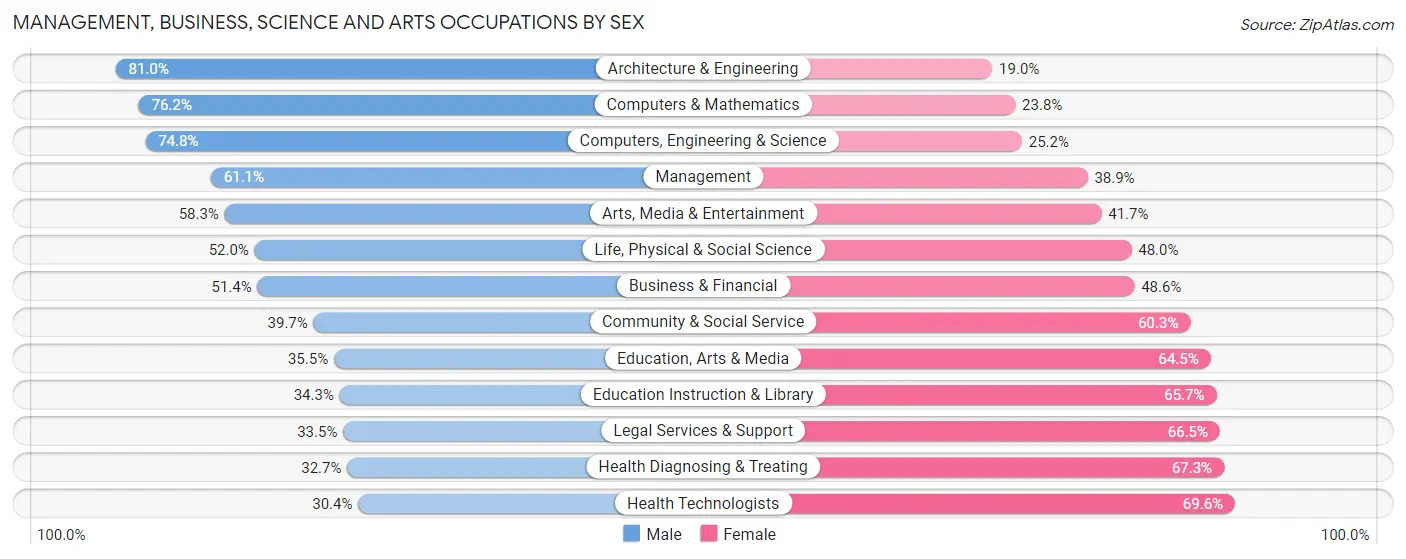
Management, Business, Science and Arts Occupations by Sex
Within the Management, Business, Science and Arts occupations in Huntington Beach, the most male-oriented occupations are Architecture & Engineering (81.0%), Computers & Mathematics (76.2%), and Computers, Engineering & Science (74.8%), while the most female-oriented occupations are Health Technologists (69.6%), Health Diagnosing & Treating (67.3%), and Legal Services & Support (66.5%).
| Occupation | Male | Female |
| Management | 9,549 (61.1%) | 6,070 (38.9%) |
| Business & Financial | 4,495 (51.4%) | 4,252 (48.6%) |
| Computers, Engineering & Science | 5,777 (74.8%) | 1,942 (25.2%) |
| Computers & Mathematics | 2,282 (76.2%) | 712 (23.8%) |
| Architecture & Engineering | 2,898 (81.0%) | 679 (19.0%) |
| Life, Physical & Social Science | 597 (52.0%) | 551 (48.0%) |
| Community & Social Service | 5,447 (39.7%) | 8,271 (60.3%) |
| Education, Arts & Media | 829 (35.5%) | 1,509 (64.5%) |
| Legal Services & Support | 611 (33.5%) | 1,211 (66.5%) |
| Education Instruction & Library | 2,229 (34.3%) | 4,277 (65.7%) |
| Arts, Media & Entertainment | 1,778 (58.3%) | 1,274 (41.7%) |
| Health Diagnosing & Treating | 2,376 (32.7%) | 4,895 (67.3%) |
| Health Technologists | 1,709 (30.4%) | 3,915 (69.6%) |
| Total (Category) | 27,644 (52.1%) | 25,430 (47.9%) |
| Total (Overall) | 56,135 (53.7%) | 48,335 (46.3%) |
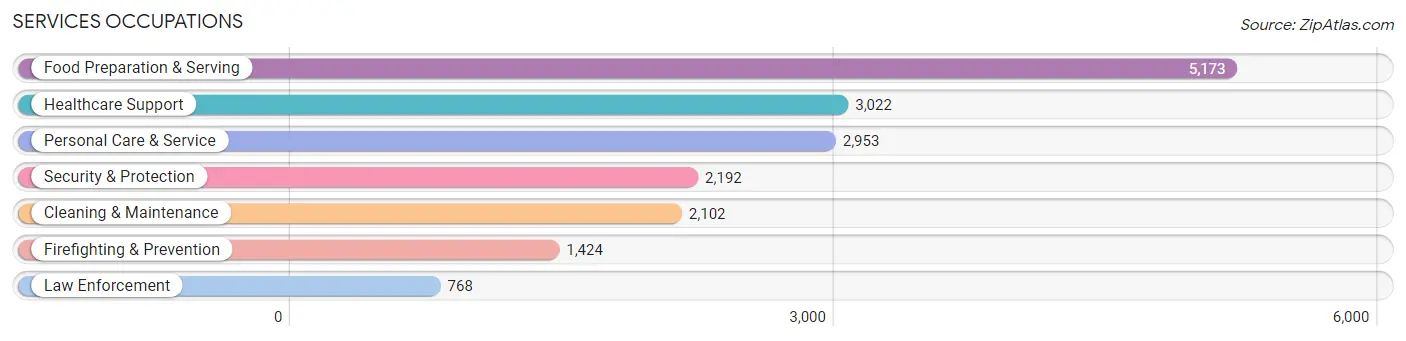
Services Occupations
The most common Services occupations in Huntington Beach are Food Preparation & Serving (5,173 | 5.0%), Healthcare Support (3,022 | 2.9%), Personal Care & Service (2,953 | 2.8%), Security & Protection (2,192 | 2.1%), and Cleaning & Maintenance (2,102 | 2.0%).
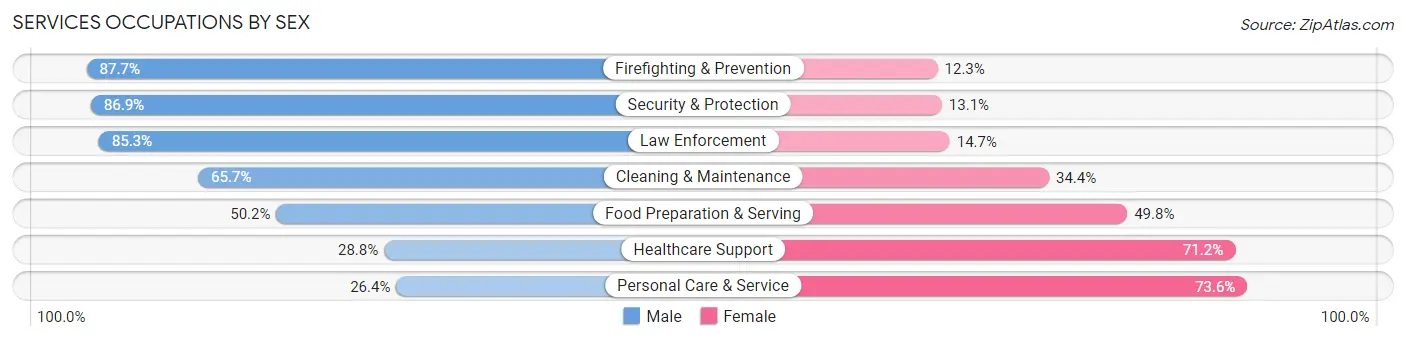
Services Occupations by Sex
Within the Services occupations in Huntington Beach, the most male-oriented occupations are Firefighting & Prevention (87.7%), Security & Protection (86.9%), and Law Enforcement (85.3%), while the most female-oriented occupations are Personal Care & Service (73.6%), Healthcare Support (71.2%), and Food Preparation & Serving (49.8%).
| Occupation | Male | Female |
| Healthcare Support | 871 (28.8%) | 2,151 (71.2%) |
| Security & Protection | 1,904 (86.9%) | 288 (13.1%) |
| Firefighting & Prevention | 1,249 (87.7%) | 175 (12.3%) |
| Law Enforcement | 655 (85.3%) | 113 (14.7%) |
| Food Preparation & Serving | 2,595 (50.2%) | 2,578 (49.8%) |
| Cleaning & Maintenance | 1,380 (65.6%) | 722 (34.4%) |
| Personal Care & Service | 780 (26.4%) | 2,173 (73.6%) |
| Total (Category) | 7,530 (48.8%) | 7,912 (51.2%) |
| Total (Overall) | 56,135 (53.7%) | 48,335 (46.3%) |
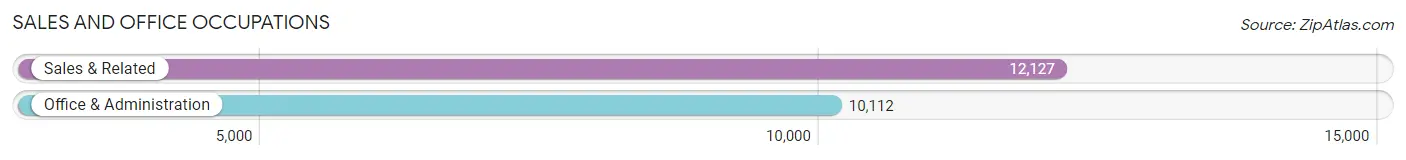
Sales and Office Occupations
The most common Sales and Office occupations in Huntington Beach are Sales & Related (12,127 | 11.6%), and Office & Administration (10,112 | 9.7%).
Sales and Office Occupations by Sex
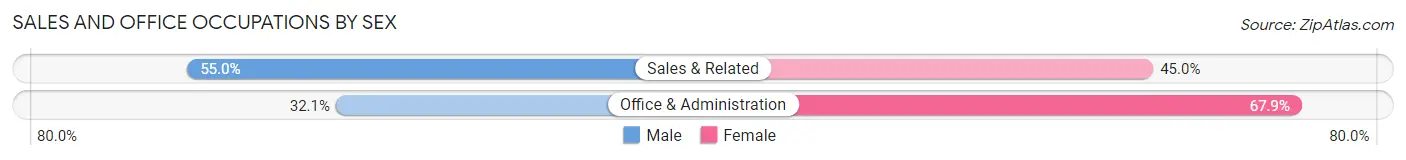
| Occupation | Male | Female |
| Sales & Related | 6,666 (55.0%) | 5,461 (45.0%) |
| Office & Administration | 3,248 (32.1%) | 6,864 (67.9%) |
| Total (Category) | 9,914 (44.6%) | 12,325 (55.4%) |
| Total (Overall) | 56,135 (53.7%) | 48,335 (46.3%) |
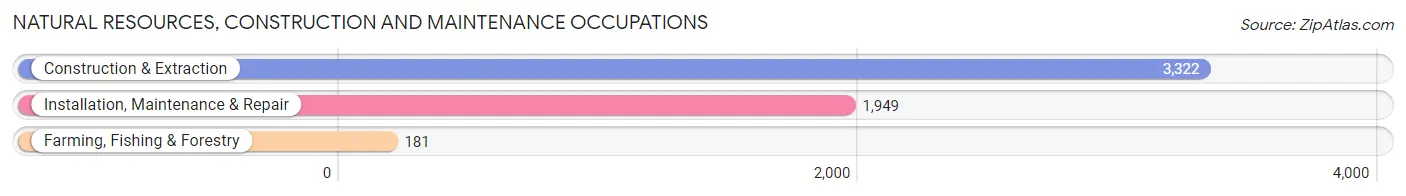
Natural Resources, Construction and Maintenance Occupations
The most common Natural Resources, Construction and Maintenance occupations in Huntington Beach are Construction & Extraction (3,322 | 3.2%), Installation, Maintenance & Repair (1,949 | 1.9%), and Farming, Fishing & Forestry (181 | 0.2%).
Natural Resources, Construction and Maintenance Occupations by Sex
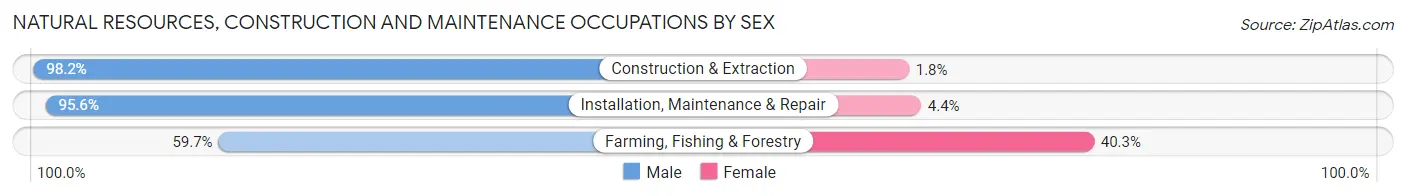
| Occupation | Male | Female |
| Farming, Fishing & Forestry | 108 (59.7%) | 73 (40.3%) |
| Construction & Extraction | 3,261 (98.2%) | 61 (1.8%) |
| Installation, Maintenance & Repair | 1,864 (95.6%) | 85 (4.4%) |
| Total (Category) | 5,233 (96.0%) | 219 (4.0%) |
| Total (Overall) | 56,135 (53.7%) | 48,335 (46.3%) |
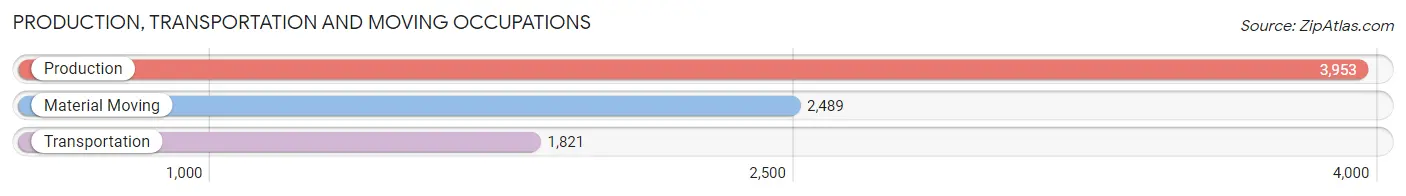
Production, Transportation and Moving Occupations
The most common Production, Transportation and Moving occupations in Huntington Beach are Production (3,953 | 3.8%), Material Moving (2,489 | 2.4%), and Transportation (1,821 | 1.7%).
Production, Transportation and Moving Occupations by Sex
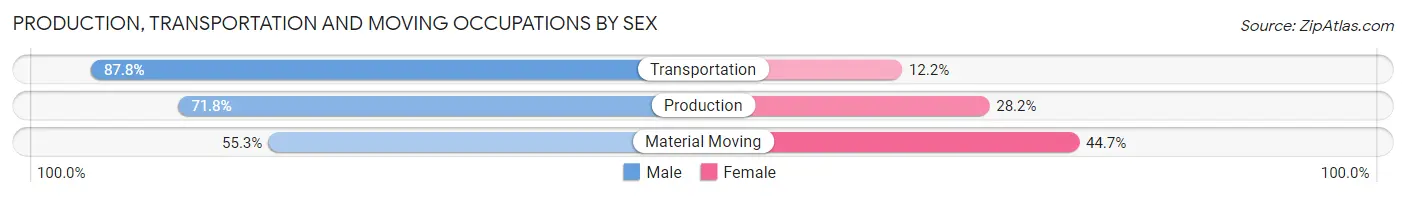
| Occupation | Male | Female |
| Production | 2,838 (71.8%) | 1,115 (28.2%) |
| Transportation | 1,599 (87.8%) | 222 (12.2%) |
| Material Moving | 1,377 (55.3%) | 1,112 (44.7%) |
| Total (Category) | 5,814 (70.4%) | 2,449 (29.6%) |
| Total (Overall) | 56,135 (53.7%) | 48,335 (46.3%) |
Employment Industries by Sex in Huntington Beach
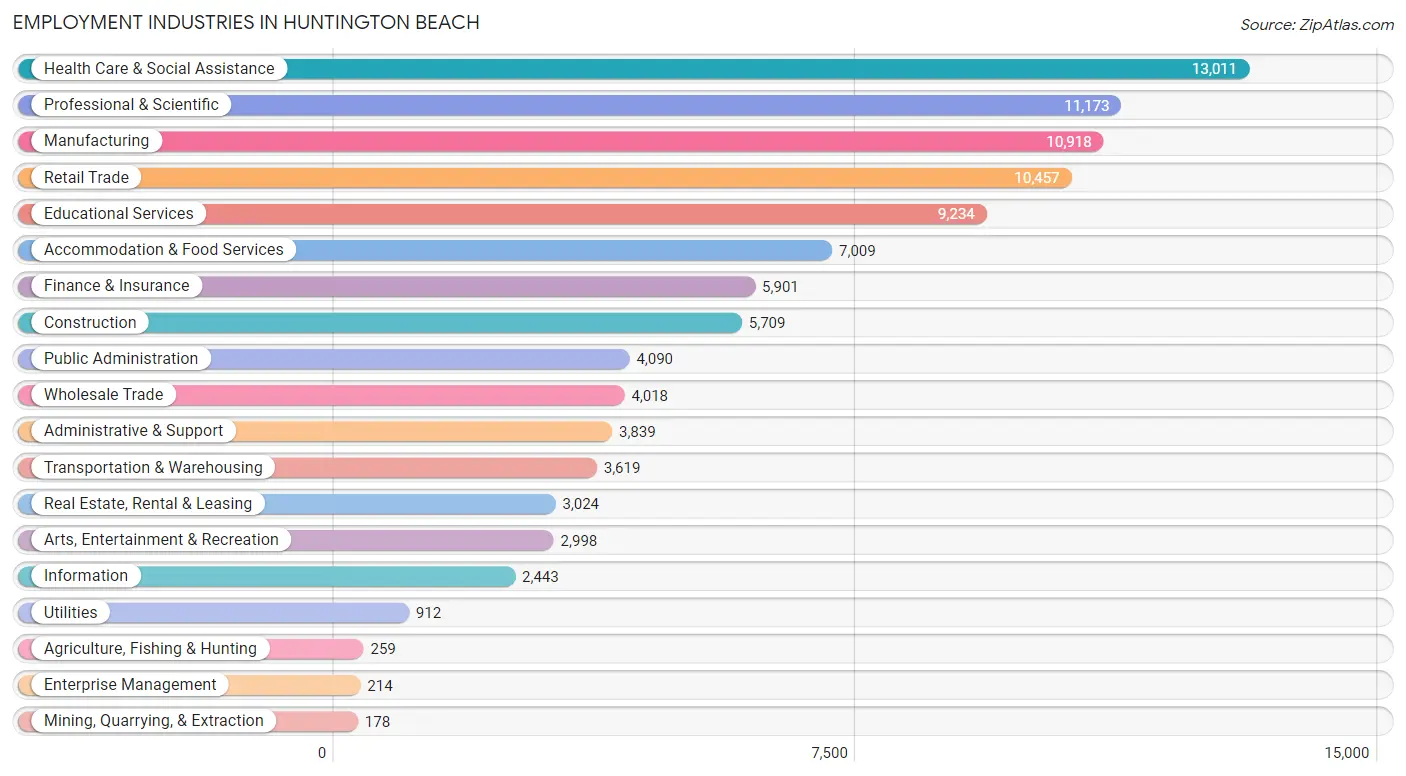
Employment Industries in Huntington Beach
The major employment industries in Huntington Beach include Health Care & Social Assistance (13,011 | 12.4%), Professional & Scientific (11,173 | 10.7%), Manufacturing (10,918 | 10.4%), Retail Trade (10,457 | 10.0%), and Educational Services (9,234 | 8.8%).
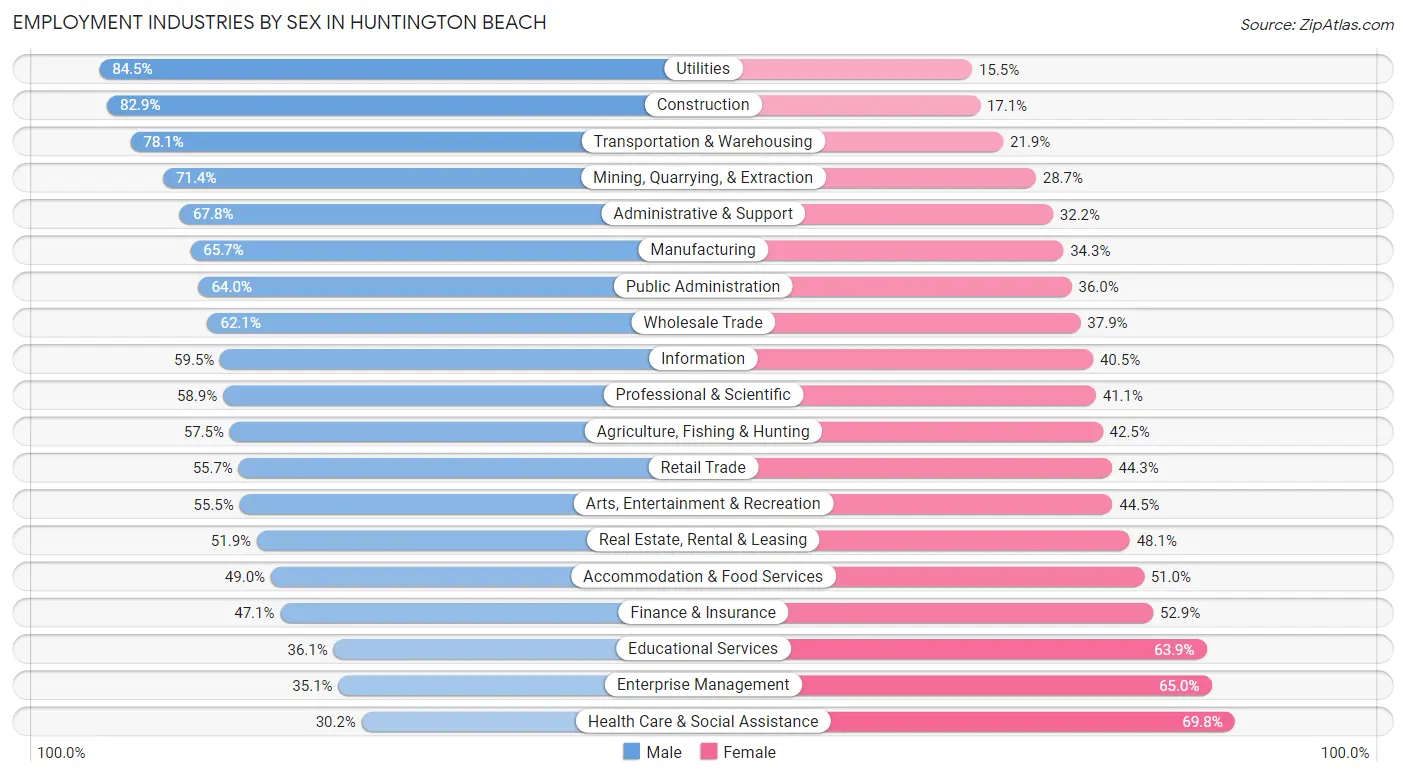
Employment Industries by Sex in Huntington Beach
The Huntington Beach industries that see more men than women are Utilities (84.5%), Construction (82.9%), and Transportation & Warehousing (78.1%), whereas the industries that tend to have a higher number of women are Health Care & Social Assistance (69.8%), Enterprise Management (64.9%), and Educational Services (63.9%).
| Industry | Male | Female |
| Agriculture, Fishing & Hunting | 149 (57.5%) | 110 (42.5%) |
| Mining, Quarrying, & Extraction | 127 (71.4%) | 51 (28.6%) |
| Construction | 4,734 (82.9%) | 975 (17.1%) |
| Manufacturing | 7,171 (65.7%) | 3,747 (34.3%) |
| Wholesale Trade | 2,496 (62.1%) | 1,522 (37.9%) |
| Retail Trade | 5,822 (55.7%) | 4,635 (44.3%) |
| Transportation & Warehousing | 2,827 (78.1%) | 792 (21.9%) |
| Utilities | 771 (84.5%) | 141 (15.5%) |
| Information | 1,454 (59.5%) | 989 (40.5%) |
| Finance & Insurance | 2,778 (47.1%) | 3,123 (52.9%) |
| Real Estate, Rental & Leasing | 1,570 (51.9%) | 1,454 (48.1%) |
| Professional & Scientific | 6,585 (58.9%) | 4,588 (41.1%) |
| Enterprise Management | 75 (35.0%) | 139 (64.9%) |
| Administrative & Support | 2,604 (67.8%) | 1,235 (32.2%) |
| Educational Services | 3,330 (36.1%) | 5,904 (63.9%) |
| Health Care & Social Assistance | 3,933 (30.2%) | 9,078 (69.8%) |
| Arts, Entertainment & Recreation | 1,664 (55.5%) | 1,334 (44.5%) |
| Accommodation & Food Services | 3,436 (49.0%) | 3,573 (51.0%) |
| Public Administration | 2,616 (64.0%) | 1,474 (36.0%) |
| Total | 56,135 (53.7%) | 48,335 (46.3%) |
Education in Huntington Beach
School Enrollment in Huntington Beach
The most common levels of schooling among the 44,623 students in Huntington Beach are college / undergraduate (12,490 | 28.0%), high school (9,130 | 20.5%), and middle school (7,432 | 16.7%).
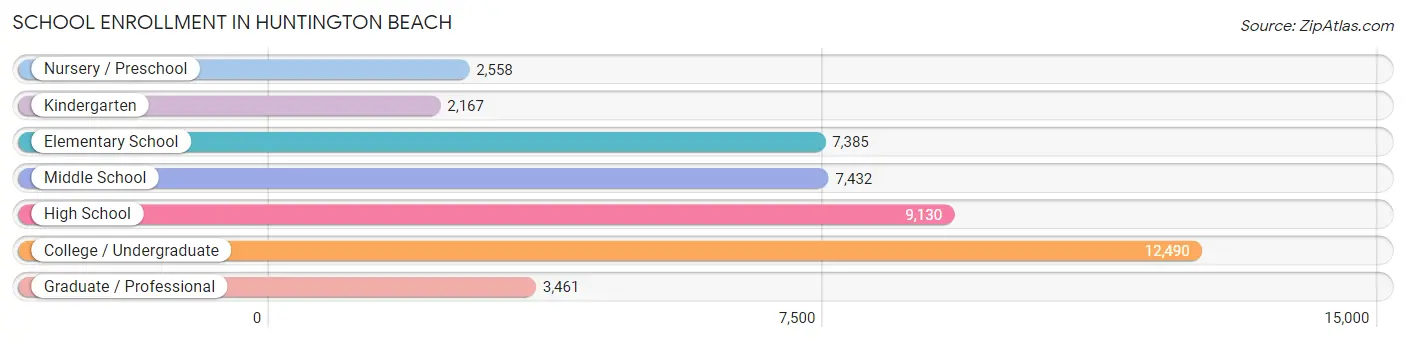
| School Level | # Students | % Students |
| Nursery / Preschool | 2,558 | 5.7% |
| Kindergarten | 2,167 | 4.9% |
| Elementary School | 7,385 | 16.6% |
| Middle School | 7,432 | 16.7% |
| High School | 9,130 | 20.5% |
| College / Undergraduate | 12,490 | 28.0% |
| Graduate / Professional | 3,461 | 7.8% |
| Total | 44,623 | 100.0% |
School Enrollment by Age by Funding Source in Huntington Beach
Out of a total of 44,623 students who are enrolled in schools in Huntington Beach, 8,478 (19.0%) attend a private institution, while the remaining 36,145 (81.0%) are enrolled in public schools. The age group of 3 to 4 year olds has the highest likelihood of being enrolled in private schools, with 1,384 (57.6% in the age bracket) enrolled. Conversely, the age group of 18 to 19 year olds has the lowest likelihood of being enrolled in a private school, with 3,306 (95.7% in the age bracket) attending a public institution.
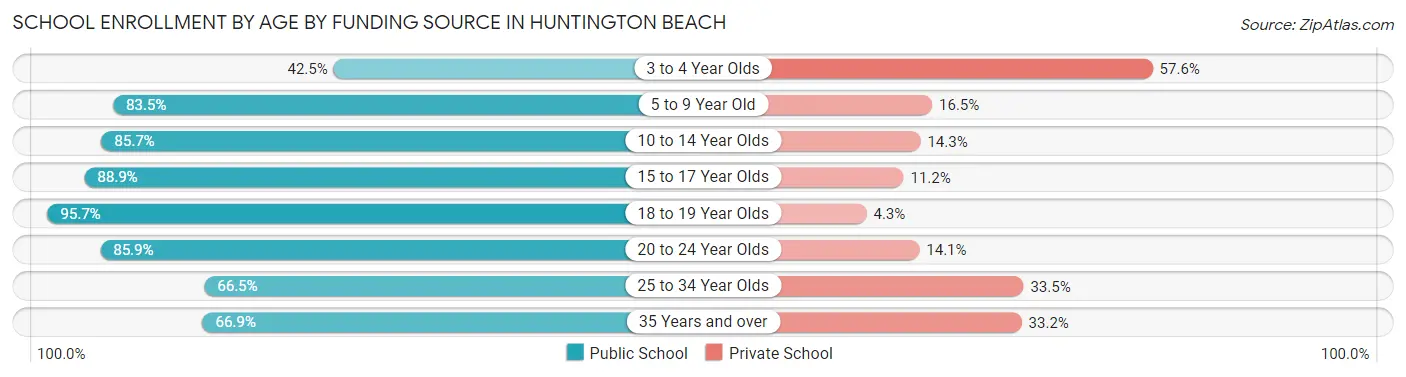
| Age Bracket | Public School | Private School |
| 3 to 4 Year Olds | 1,021 (42.4%) | 1,384 (57.6%) |
| 5 to 9 Year Old | 7,160 (83.5%) | 1,412 (16.5%) |
| 10 to 14 Year Olds | 8,364 (85.7%) | 1,397 (14.3%) |
| 15 to 17 Year Olds | 6,066 (88.8%) | 761 (11.2%) |
| 18 to 19 Year Olds | 3,306 (95.7%) | 147 (4.3%) |
| 20 to 24 Year Olds | 5,082 (85.9%) | 834 (14.1%) |
| 25 to 34 Year Olds | 2,401 (66.5%) | 1,209 (33.5%) |
| 35 Years and over | 2,727 (66.8%) | 1,352 (33.2%) |
| Total | 36,145 (81.0%) | 8,478 (19.0%) |
Educational Attainment by Field of Study in Huntington Beach
Business (15,705 | 21.5%), engineering (7,304 | 10.0%), science & technology (6,651 | 9.1%), social sciences (6,365 | 8.7%), and education (4,928 | 6.7%) are the most common fields of study among 73,125 individuals in Huntington Beach who have obtained a bachelor's degree or higher.
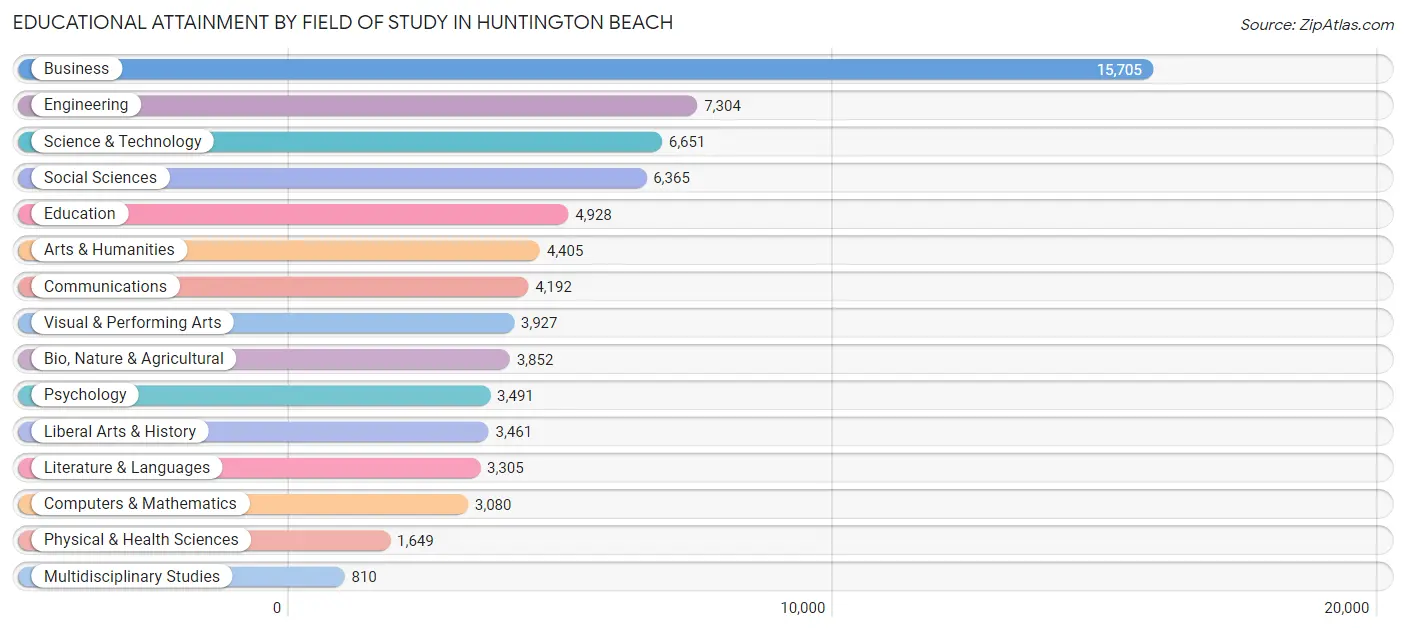
| Field of Study | # Graduates | % Graduates |
| Computers & Mathematics | 3,080 | 4.2% |
| Bio, Nature & Agricultural | 3,852 | 5.3% |
| Physical & Health Sciences | 1,649 | 2.3% |
| Psychology | 3,491 | 4.8% |
| Social Sciences | 6,365 | 8.7% |
| Engineering | 7,304 | 10.0% |
| Multidisciplinary Studies | 810 | 1.1% |
| Science & Technology | 6,651 | 9.1% |
| Business | 15,705 | 21.5% |
| Education | 4,928 | 6.7% |
| Literature & Languages | 3,305 | 4.5% |
| Liberal Arts & History | 3,461 | 4.7% |
| Visual & Performing Arts | 3,927 | 5.4% |
| Communications | 4,192 | 5.7% |
| Arts & Humanities | 4,405 | 6.0% |
| Total | 73,125 | 100.0% |
Transportation & Commute in Huntington Beach
Vehicle Availability by Sex in Huntington Beach
The most prevalent vehicle ownership categories in Huntington Beach are males with 2 vehicles (23,065, accounting for 42.1%) and females with 2 vehicles (18,947, making up 49.2%).
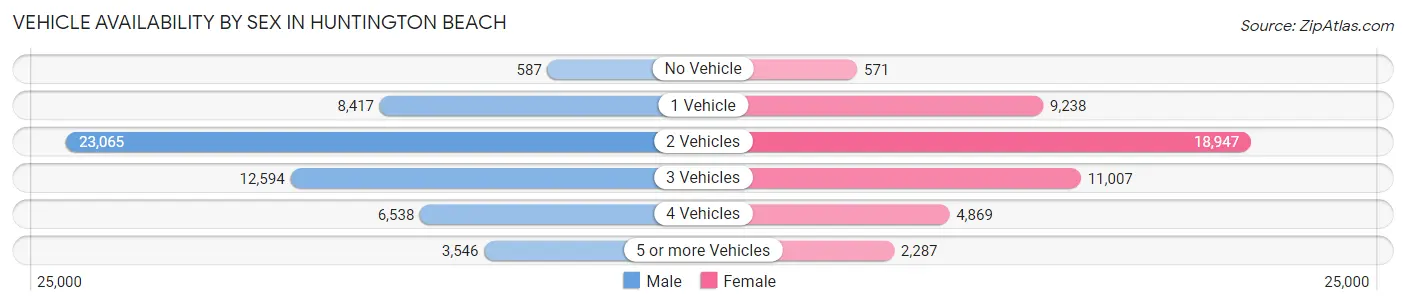
| Vehicles Available | Male | Female |
| No Vehicle | 587 (1.1%) | 571 (1.2%) |
| 1 Vehicle | 8,417 (15.4%) | 9,238 (19.7%) |
| 2 Vehicles | 23,065 (42.1%) | 18,947 (40.4%) |
| 3 Vehicles | 12,594 (23.0%) | 11,007 (23.5%) |
| 4 Vehicles | 6,538 (11.9%) | 4,869 (10.4%) |
| 5 or more Vehicles | 3,546 (6.5%) | 2,287 (4.9%) |
| Total | 54,747 (100.0%) | 46,919 (100.0%) |
Commute Time in Huntington Beach
The most frequently occuring commute durations in Huntington Beach are 30 to 34 minutes (15,940 commuters, 18.8%), 15 to 19 minutes (10,750 commuters, 12.7%), and 20 to 24 minutes (10,546 commuters, 12.4%).
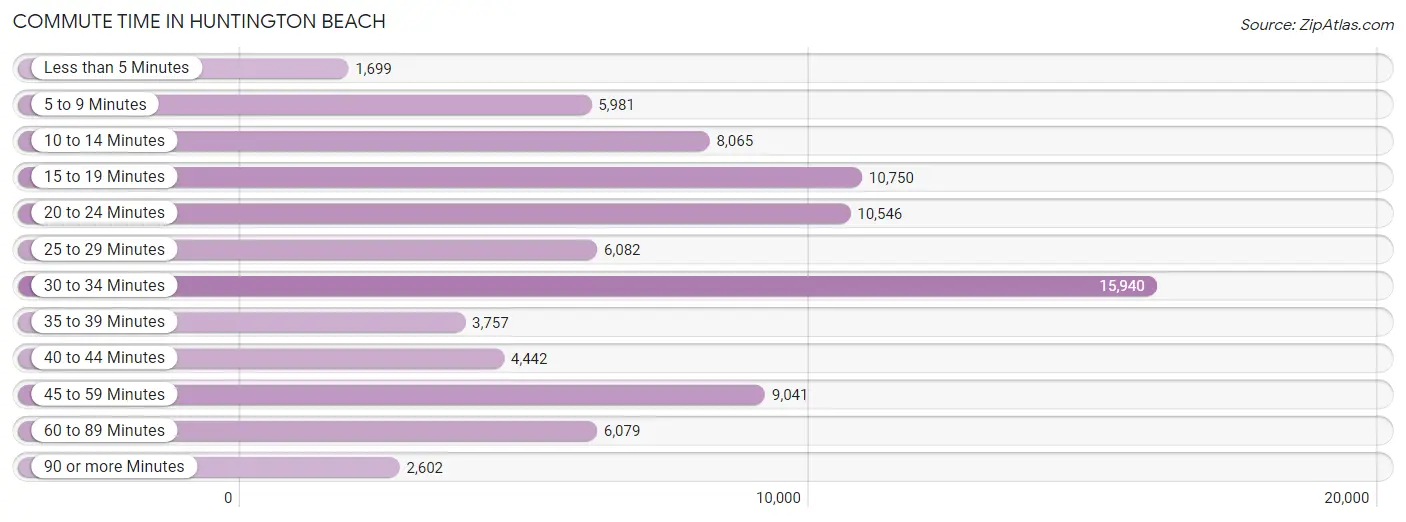
| Commute Time | # Commuters | % Commuters |
| Less than 5 Minutes | 1,699 | 2.0% |
| 5 to 9 Minutes | 5,981 | 7.0% |
| 10 to 14 Minutes | 8,065 | 9.5% |
| 15 to 19 Minutes | 10,750 | 12.7% |
| 20 to 24 Minutes | 10,546 | 12.4% |
| 25 to 29 Minutes | 6,082 | 7.2% |
| 30 to 34 Minutes | 15,940 | 18.8% |
| 35 to 39 Minutes | 3,757 | 4.4% |
| 40 to 44 Minutes | 4,442 | 5.2% |
| 45 to 59 Minutes | 9,041 | 10.6% |
| 60 to 89 Minutes | 6,079 | 7.1% |
| 90 or more Minutes | 2,602 | 3.1% |
Commute Time by Sex in Huntington Beach
The most common commute times in Huntington Beach are 30 to 34 minutes (9,030 commuters, 19.5%) for males and 30 to 34 minutes (6,910 commuters, 17.8%) for females.
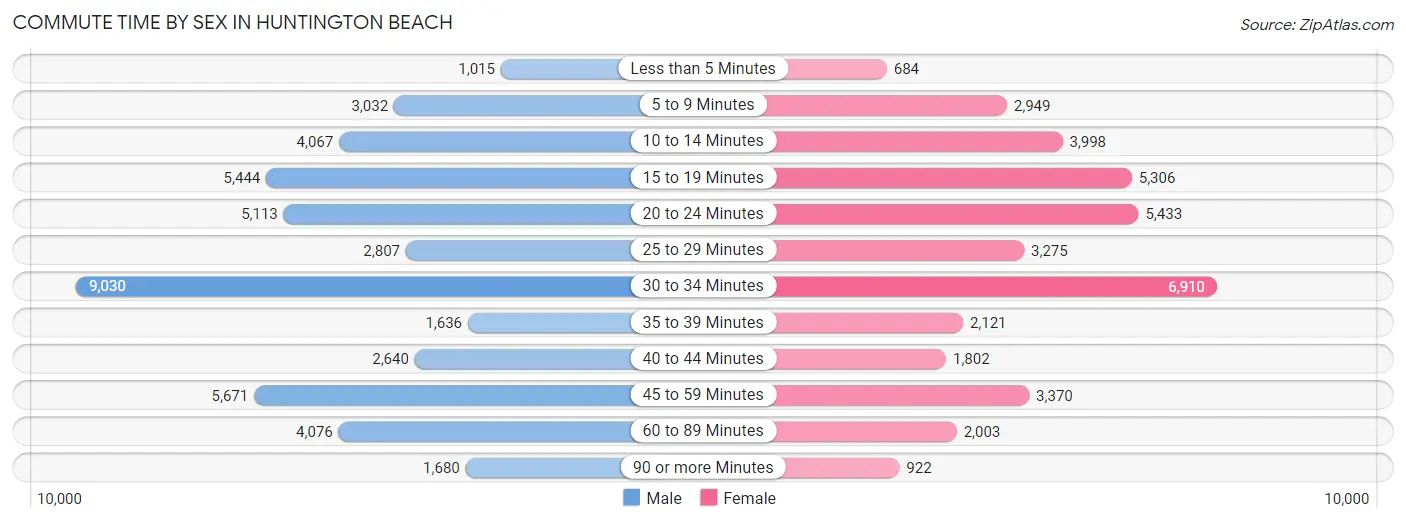
| Commute Time | Male | Female |
| Less than 5 Minutes | 1,015 (2.2%) | 684 (1.8%) |
| 5 to 9 Minutes | 3,032 (6.6%) | 2,949 (7.6%) |
| 10 to 14 Minutes | 4,067 (8.8%) | 3,998 (10.3%) |
| 15 to 19 Minutes | 5,444 (11.8%) | 5,306 (13.7%) |
| 20 to 24 Minutes | 5,113 (11.1%) | 5,433 (14.0%) |
| 25 to 29 Minutes | 2,807 (6.1%) | 3,275 (8.5%) |
| 30 to 34 Minutes | 9,030 (19.5%) | 6,910 (17.8%) |
| 35 to 39 Minutes | 1,636 (3.5%) | 2,121 (5.5%) |
| 40 to 44 Minutes | 2,640 (5.7%) | 1,802 (4.6%) |
| 45 to 59 Minutes | 5,671 (12.3%) | 3,370 (8.7%) |
| 60 to 89 Minutes | 4,076 (8.8%) | 2,003 (5.2%) |
| 90 or more Minutes | 1,680 (3.6%) | 922 (2.4%) |
Time of Departure to Work by Sex in Huntington Beach
The most frequent times of departure to work in Huntington Beach are 7:00 AM to 7:29 AM (5,775, 12.5%) for males and 7:00 AM to 7:29 AM (6,049, 15.6%) for females.
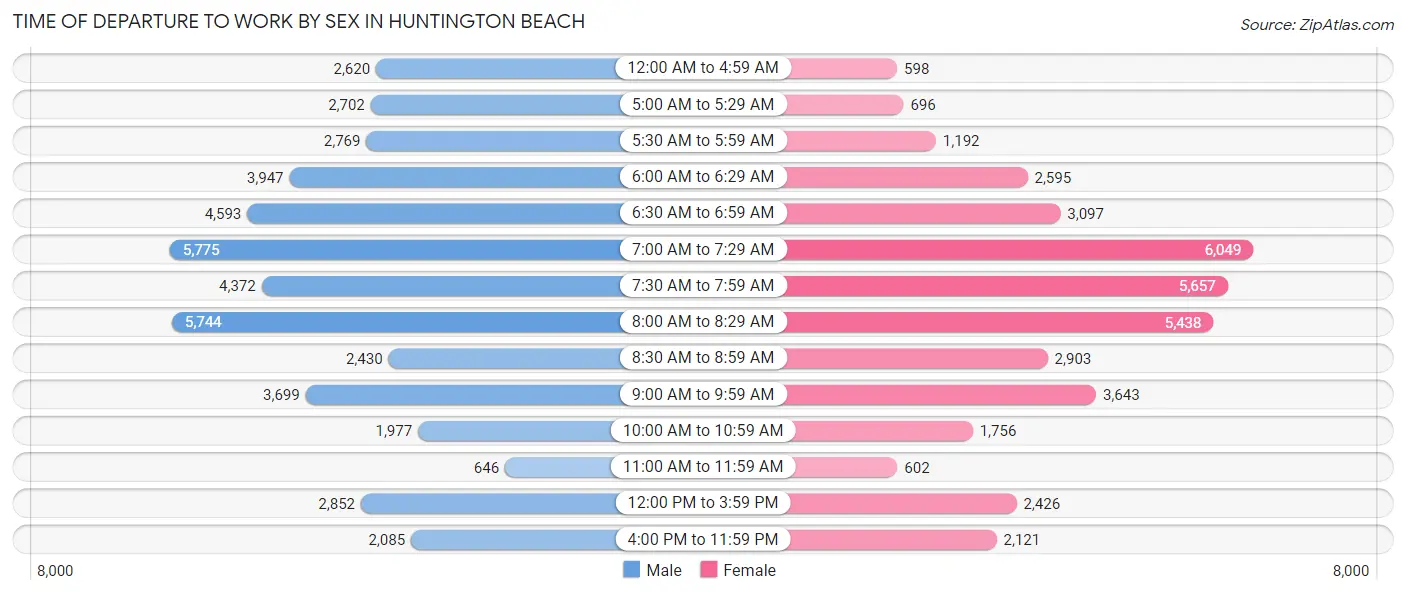
| Time of Departure | Male | Female |
| 12:00 AM to 4:59 AM | 2,620 (5.7%) | 598 (1.5%) |
| 5:00 AM to 5:29 AM | 2,702 (5.9%) | 696 (1.8%) |
| 5:30 AM to 5:59 AM | 2,769 (6.0%) | 1,192 (3.1%) |
| 6:00 AM to 6:29 AM | 3,947 (8.5%) | 2,595 (6.7%) |
| 6:30 AM to 6:59 AM | 4,593 (9.9%) | 3,097 (8.0%) |
| 7:00 AM to 7:29 AM | 5,775 (12.5%) | 6,049 (15.6%) |
| 7:30 AM to 7:59 AM | 4,372 (9.5%) | 5,657 (14.6%) |
| 8:00 AM to 8:29 AM | 5,744 (12.4%) | 5,438 (14.0%) |
| 8:30 AM to 8:59 AM | 2,430 (5.3%) | 2,903 (7.5%) |
| 9:00 AM to 9:59 AM | 3,699 (8.0%) | 3,643 (9.4%) |
| 10:00 AM to 10:59 AM | 1,977 (4.3%) | 1,756 (4.5%) |
| 11:00 AM to 11:59 AM | 646 (1.4%) | 602 (1.5%) |
| 12:00 PM to 3:59 PM | 2,852 (6.2%) | 2,426 (6.3%) |
| 4:00 PM to 11:59 PM | 2,085 (4.5%) | 2,121 (5.5%) |
| Total | 46,211 (100.0%) | 38,773 (100.0%) |
Housing Occupancy in Huntington Beach
Occupancy by Ownership in Huntington Beach
Of the total 77,641 dwellings in Huntington Beach, owner-occupied units account for 43,236 (55.7%), while renter-occupied units make up 34,405 (44.3%).
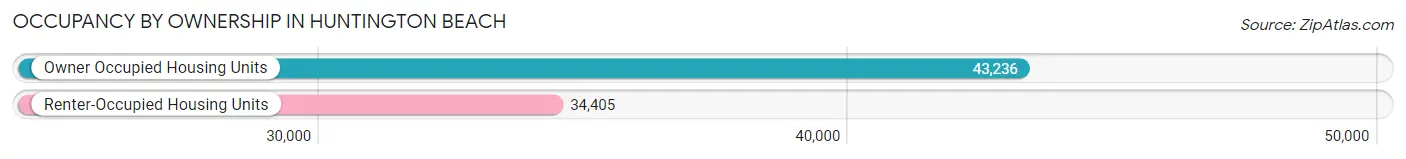
| Occupancy | # Housing Units | % Housing Units |
| Owner Occupied Housing Units | 43,236 | 55.7% |
| Renter-Occupied Housing Units | 34,405 | 44.3% |
| Total Occupied Housing Units | 77,641 | 100.0% |
Occupancy by Household Size in Huntington Beach
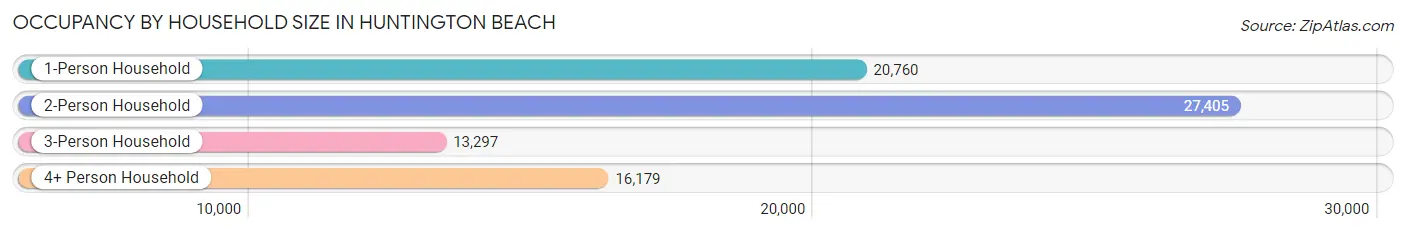
| Household Size | # Housing Units | % Housing Units |
| 1-Person Household | 20,760 | 26.7% |
| 2-Person Household | 27,405 | 35.3% |
| 3-Person Household | 13,297 | 17.1% |
| 4+ Person Household | 16,179 | 20.8% |
| Total Housing Units | 77,641 | 100.0% |
Occupancy by Ownership by Household Size in Huntington Beach
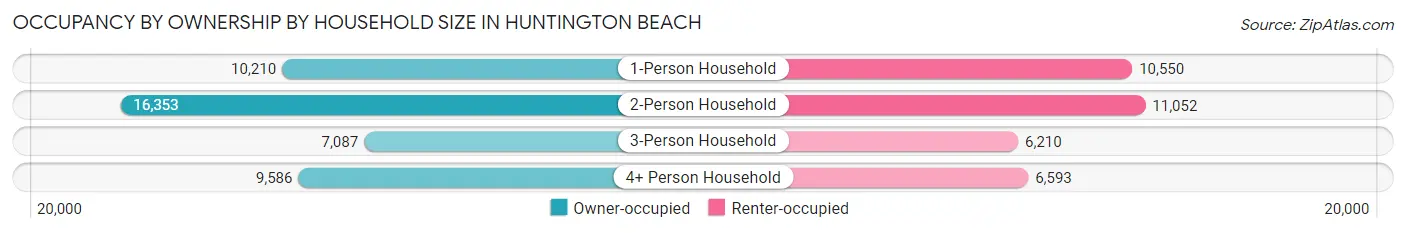
| Household Size | Owner-occupied | Renter-occupied |
| 1-Person Household | 10,210 (49.2%) | 10,550 (50.8%) |
| 2-Person Household | 16,353 (59.7%) | 11,052 (40.3%) |
| 3-Person Household | 7,087 (53.3%) | 6,210 (46.7%) |
| 4+ Person Household | 9,586 (59.3%) | 6,593 (40.7%) |
| Total Housing Units | 43,236 (55.7%) | 34,405 (44.3%) |
Occupancy by Educational Attainment in Huntington Beach
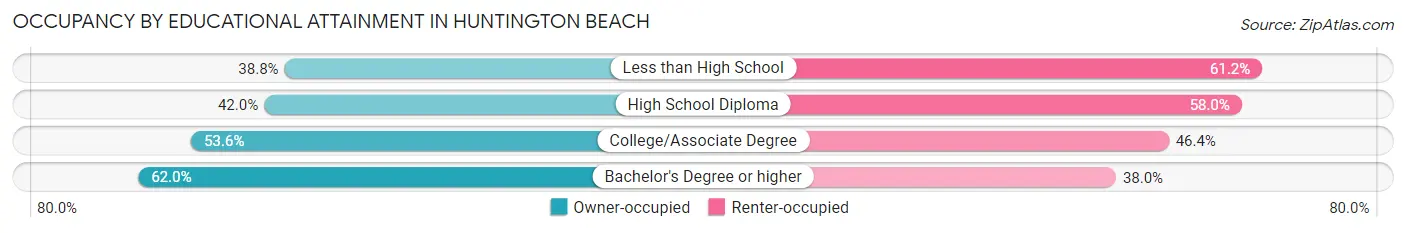
| Household Size | Owner-occupied | Renter-occupied |
| Less than High School | 1,508 (38.8%) | 2,380 (61.2%) |
| High School Diploma | 4,034 (42.0%) | 5,565 (58.0%) |
| College/Associate Degree | 13,204 (53.6%) | 11,429 (46.4%) |
| Bachelor's Degree or higher | 24,490 (62.0%) | 15,031 (38.0%) |
Occupancy by Age of Householder in Huntington Beach
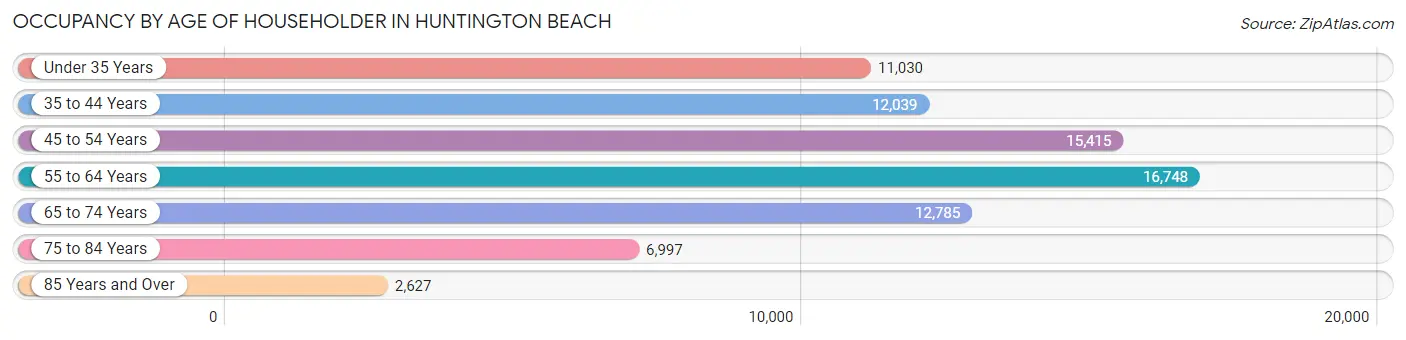
| Age Bracket | # Households | % Households |
| Under 35 Years | 11,030 | 14.2% |
| 35 to 44 Years | 12,039 | 15.5% |
| 45 to 54 Years | 15,415 | 19.9% |
| 55 to 64 Years | 16,748 | 21.6% |
| 65 to 74 Years | 12,785 | 16.5% |
| 75 to 84 Years | 6,997 | 9.0% |
| 85 Years and Over | 2,627 | 3.4% |
| Total | 77,641 | 100.0% |
Housing Finances in Huntington Beach
Median Income by Occupancy in Huntington Beach
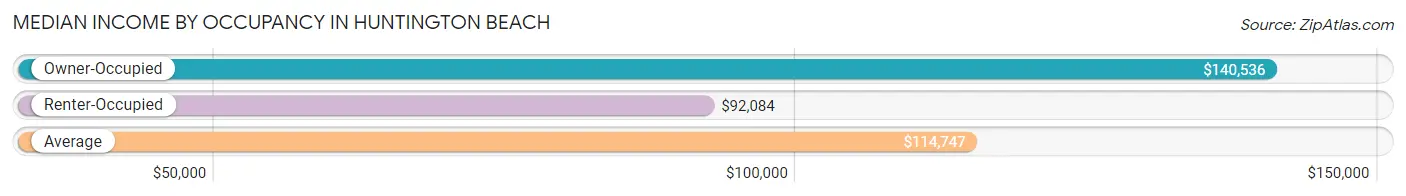
| Occupancy Type | # Households | Median Income |
| Owner-Occupied | 43,236 (55.7%) | $140,536 |
| Renter-Occupied | 34,405 (44.3%) | $92,084 |
| Average | 77,641 (100.0%) | $114,747 |
Occupancy by Householder Income Bracket in Huntington Beach
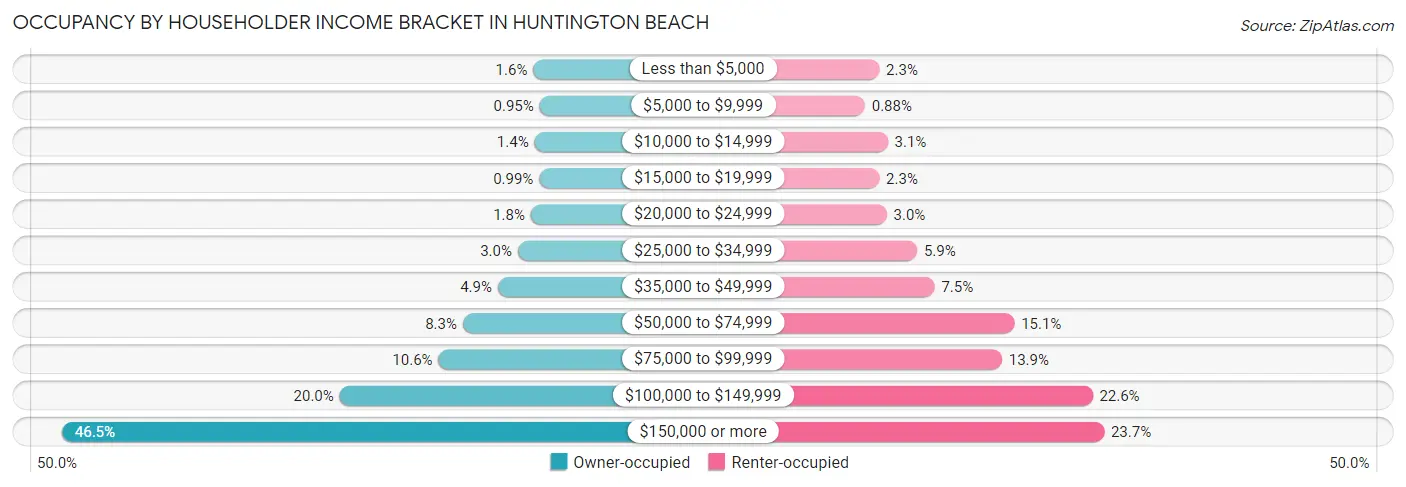
| Income Bracket | Owner-occupied | Renter-occupied |
| Less than $5,000 | 674 (1.6%) | 773 (2.2%) |
| $5,000 to $9,999 | 411 (0.9%) | 302 (0.9%) |
| $10,000 to $14,999 | 624 (1.4%) | 1,049 (3.0%) |
| $15,000 to $19,999 | 430 (1.0%) | 774 (2.2%) |
| $20,000 to $24,999 | 773 (1.8%) | 1,019 (3.0%) |
| $25,000 to $34,999 | 1,311 (3.0%) | 2,011 (5.9%) |
| $35,000 to $49,999 | 2,131 (4.9%) | 2,586 (7.5%) |
| $50,000 to $74,999 | 3,575 (8.3%) | 5,198 (15.1%) |
| $75,000 to $99,999 | 4,580 (10.6%) | 4,793 (13.9%) |
| $100,000 to $149,999 | 8,646 (20.0%) | 7,761 (22.6%) |
| $150,000 or more | 20,081 (46.5%) | 8,139 (23.7%) |
| Total | 43,236 (100.0%) | 34,405 (100.0%) |
Monthly Housing Cost Tiers in Huntington Beach
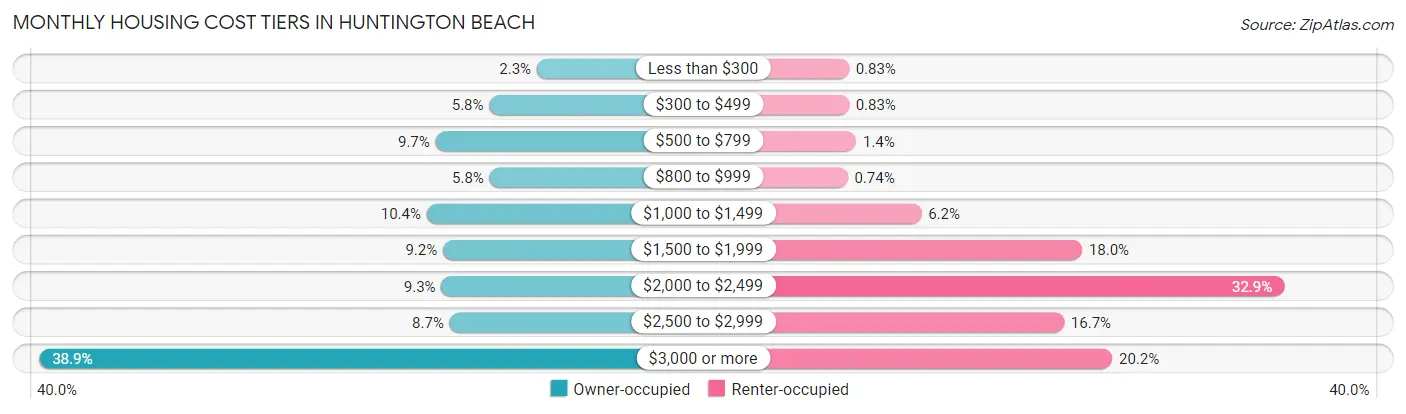
| Monthly Cost | Owner-occupied | Renter-occupied |
| Less than $300 | 982 (2.3%) | 284 (0.8%) |
| $300 to $499 | 2,495 (5.8%) | 284 (0.8%) |
| $500 to $799 | 4,207 (9.7%) | 471 (1.4%) |
| $800 to $999 | 2,488 (5.8%) | 255 (0.7%) |
| $1,000 to $1,499 | 4,486 (10.4%) | 2,124 (6.2%) |
| $1,500 to $1,999 | 3,971 (9.2%) | 6,198 (18.0%) |
| $2,000 to $2,499 | 4,020 (9.3%) | 11,316 (32.9%) |
| $2,500 to $2,999 | 3,758 (8.7%) | 5,740 (16.7%) |
| $3,000 or more | 16,829 (38.9%) | 6,960 (20.2%) |
| Total | 43,236 (100.0%) | 34,405 (100.0%) |
Physical Housing Characteristics in Huntington Beach
Housing Structures in Huntington Beach
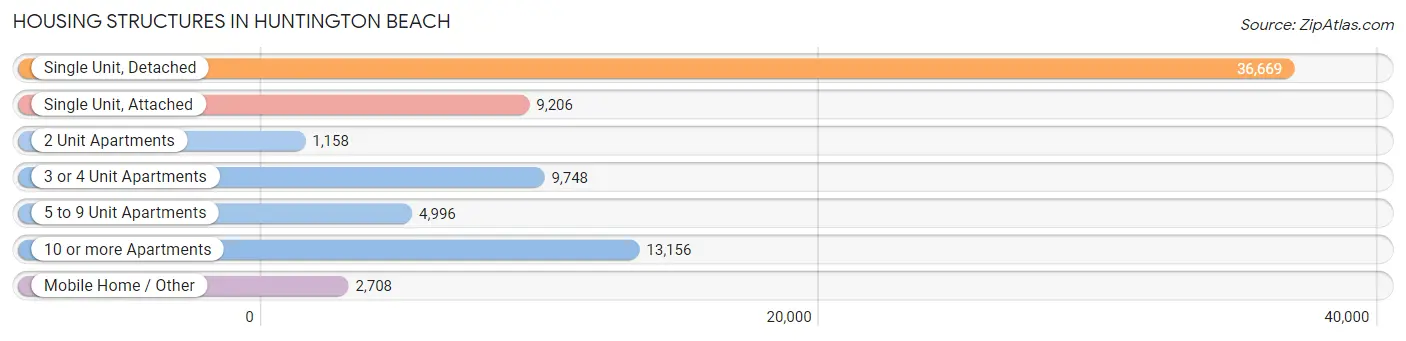
| Structure Type | # Housing Units | % Housing Units |
| Single Unit, Detached | 36,669 | 47.2% |
| Single Unit, Attached | 9,206 | 11.9% |
| 2 Unit Apartments | 1,158 | 1.5% |
| 3 or 4 Unit Apartments | 9,748 | 12.6% |
| 5 to 9 Unit Apartments | 4,996 | 6.4% |
| 10 or more Apartments | 13,156 | 16.9% |
| Mobile Home / Other | 2,708 | 3.5% |
| Total | 77,641 | 100.0% |
Housing Structures by Occupancy in Huntington Beach
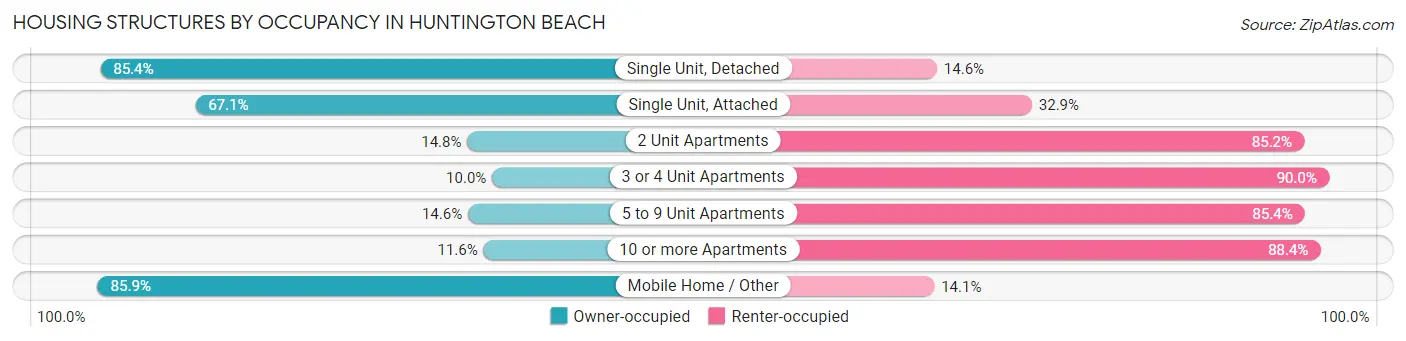
| Structure Type | Owner-occupied | Renter-occupied |
| Single Unit, Detached | 31,323 (85.4%) | 5,346 (14.6%) |
| Single Unit, Attached | 6,181 (67.1%) | 3,025 (32.9%) |
| 2 Unit Apartments | 171 (14.8%) | 987 (85.2%) |
| 3 or 4 Unit Apartments | 973 (10.0%) | 8,775 (90.0%) |
| 5 to 9 Unit Apartments | 731 (14.6%) | 4,265 (85.4%) |
| 10 or more Apartments | 1,530 (11.6%) | 11,626 (88.4%) |
| Mobile Home / Other | 2,327 (85.9%) | 381 (14.1%) |
| Total | 43,236 (55.7%) | 34,405 (44.3%) |
Housing Structures by Number of Rooms in Huntington Beach
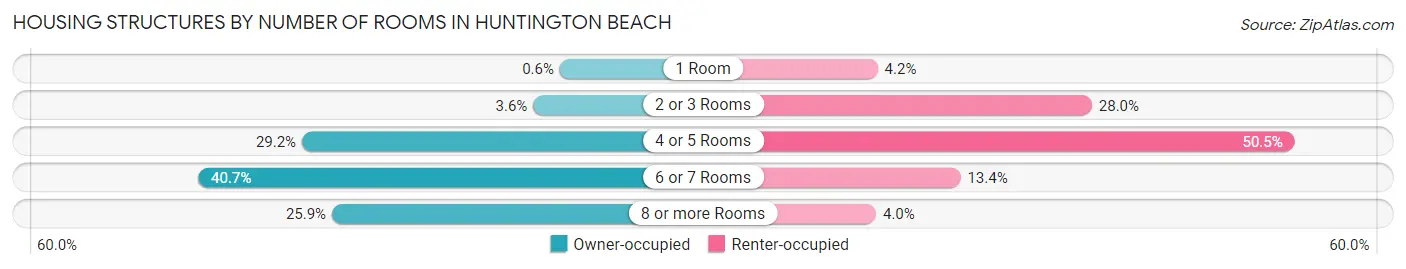
| Number of Rooms | Owner-occupied | Renter-occupied |
| 1 Room | 258 (0.6%) | 1,442 (4.2%) |
| 2 or 3 Rooms | 1,540 (3.6%) | 9,620 (28.0%) |
| 4 or 5 Rooms | 12,633 (29.2%) | 17,359 (50.4%) |
| 6 or 7 Rooms | 17,613 (40.7%) | 4,605 (13.4%) |
| 8 or more Rooms | 11,192 (25.9%) | 1,379 (4.0%) |
| Total | 43,236 (100.0%) | 34,405 (100.0%) |
Housing Structure by Heating Type in Huntington Beach
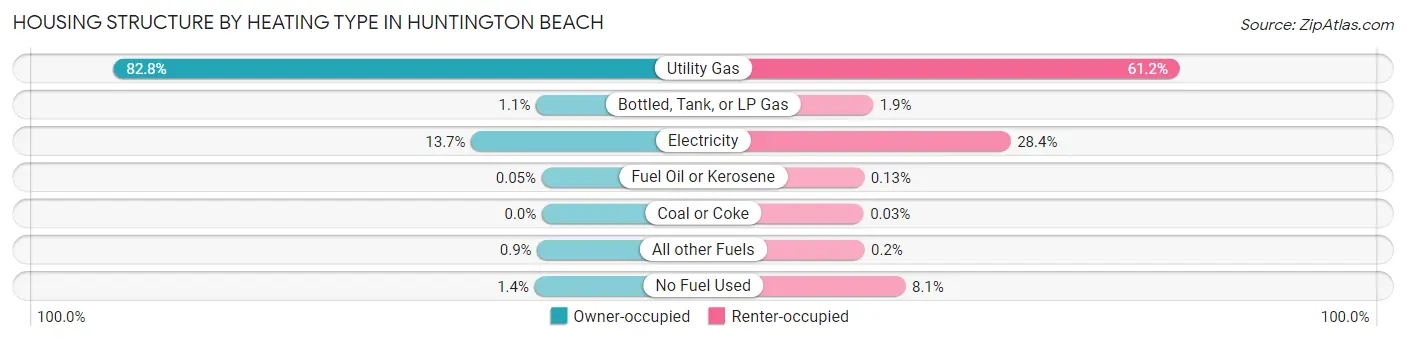
| Heating Type | Owner-occupied | Renter-occupied |
| Utility Gas | 35,818 (82.8%) | 21,057 (61.2%) |
| Bottled, Tank, or LP Gas | 489 (1.1%) | 647 (1.9%) |
| Electricity | 5,909 (13.7%) | 9,786 (28.4%) |
| Fuel Oil or Kerosene | 20 (0.1%) | 45 (0.1%) |
| Coal or Coke | 0 (0.0%) | 11 (0.0%) |
| All other Fuels | 390 (0.9%) | 68 (0.2%) |
| No Fuel Used | 610 (1.4%) | 2,791 (8.1%) |
| Total | 43,236 (100.0%) | 34,405 (100.0%) |
Household Vehicle Usage in Huntington Beach
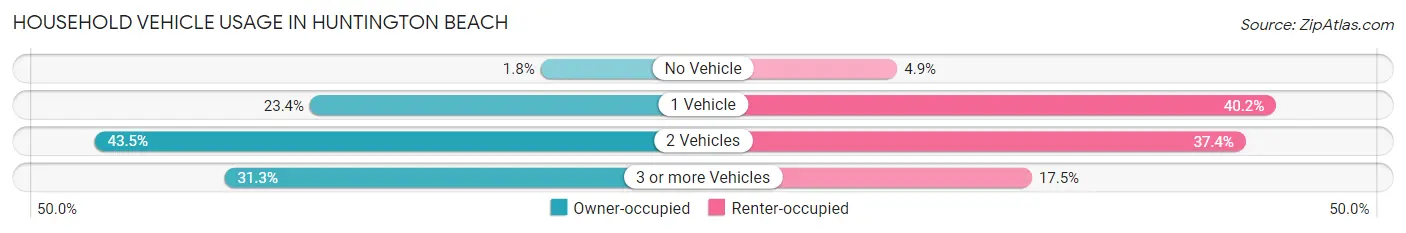
| Vehicles per Household | Owner-occupied | Renter-occupied |
| No Vehicle | 795 (1.8%) | 1,682 (4.9%) |
| 1 Vehicle | 10,104 (23.4%) | 13,845 (40.2%) |
| 2 Vehicles | 18,789 (43.5%) | 12,870 (37.4%) |
| 3 or more Vehicles | 13,548 (31.3%) | 6,008 (17.5%) |
| Total | 43,236 (100.0%) | 34,405 (100.0%) |
Real Estate & Mortgages in Huntington Beach
Real Estate and Mortgage Overview in Huntington Beach
| Characteristic | Without Mortgage | With Mortgage |
| Housing Units | 14,963 | 28,273 |
| Median Property Value | $923,200 | $1,004,000 |
| Median Household Income | $103,833 | $15,386 |
| Monthly Housing Costs | $810 | $16,630 |
| Real Estate Taxes | $3,986 | $323 |
Property Value by Mortgage Status in Huntington Beach
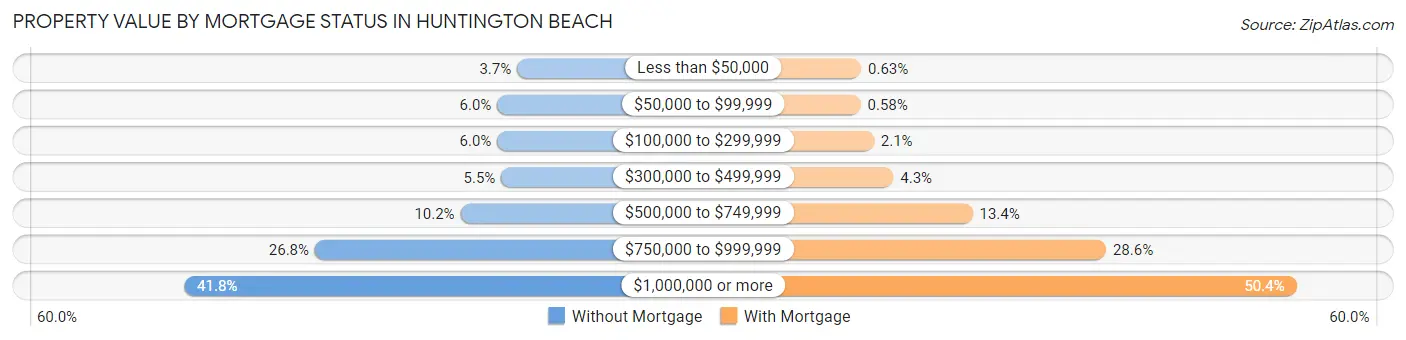
| Property Value | Without Mortgage | With Mortgage |
| Less than $50,000 | 557 (3.7%) | 178 (0.6%) |
| $50,000 to $99,999 | 896 (6.0%) | 163 (0.6%) |
| $100,000 to $299,999 | 896 (6.0%) | 592 (2.1%) |
| $300,000 to $499,999 | 827 (5.5%) | 1,222 (4.3%) |
| $500,000 to $749,999 | 1,525 (10.2%) | 3,780 (13.4%) |
| $750,000 to $999,999 | 4,014 (26.8%) | 8,092 (28.6%) |
| $1,000,000 or more | 6,248 (41.8%) | 14,246 (50.4%) |
| Total | 14,963 (100.0%) | 28,273 (100.0%) |
Household Income by Mortgage Status in Huntington Beach
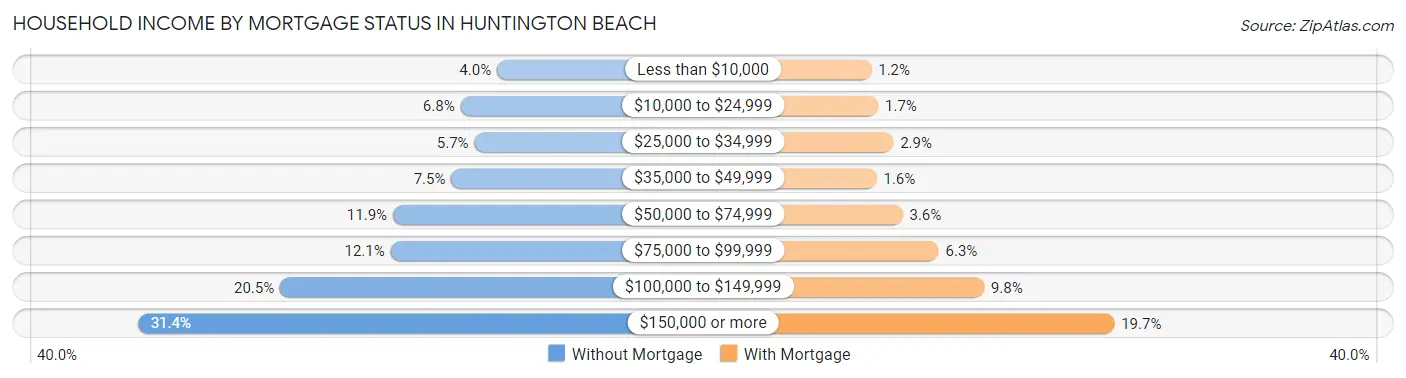
| Household Income | Without Mortgage | With Mortgage |
| Less than $10,000 | 600 (4.0%) | 338 (1.2%) |
| $10,000 to $24,999 | 1,016 (6.8%) | 485 (1.7%) |
| $25,000 to $34,999 | 858 (5.7%) | 811 (2.9%) |
| $35,000 to $49,999 | 1,120 (7.5%) | 453 (1.6%) |
| $50,000 to $74,999 | 1,786 (11.9%) | 1,011 (3.6%) |
| $75,000 to $99,999 | 1,814 (12.1%) | 1,789 (6.3%) |
| $100,000 to $149,999 | 3,074 (20.5%) | 2,766 (9.8%) |
| $150,000 or more | 4,695 (31.4%) | 5,572 (19.7%) |
| Total | 14,963 (100.0%) | 28,273 (100.0%) |
Property Value to Household Income Ratio in Huntington Beach
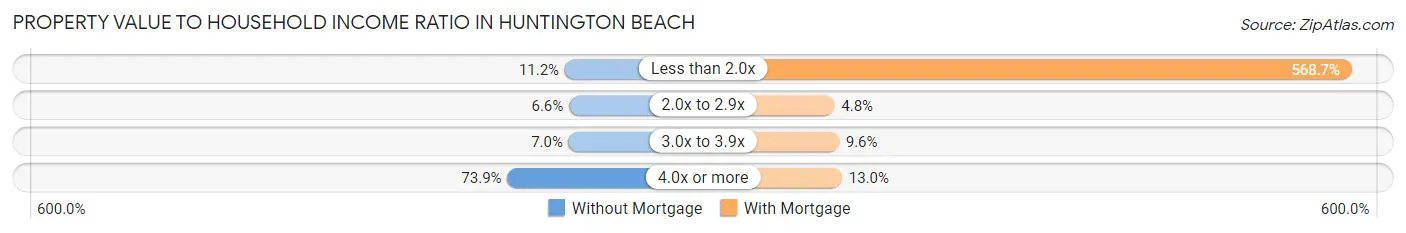
| Value-to-Income Ratio | Without Mortgage | With Mortgage |
| Less than 2.0x | 1,676 (11.2%) | 160,797 (568.7%) |
| 2.0x to 2.9x | 991 (6.6%) | 1,354 (4.8%) |
| 3.0x to 3.9x | 1,045 (7.0%) | 2,721 (9.6%) |
| 4.0x or more | 11,058 (73.9%) | 3,684 (13.0%) |
| Total | 14,963 (100.0%) | 28,273 (100.0%) |
Real Estate Taxes by Mortgage Status in Huntington Beach
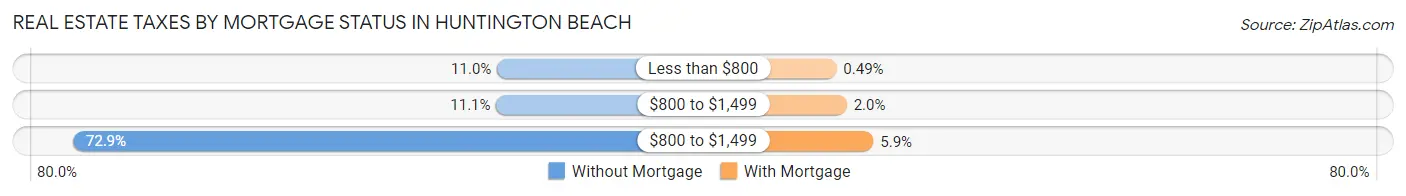
| Property Taxes | Without Mortgage | With Mortgage |
| Less than $800 | 1,639 (11.0%) | 139 (0.5%) |
| $800 to $1,499 | 1,656 (11.1%) | 565 (2.0%) |
| $800 to $1,499 | 10,914 (72.9%) | 1,665 (5.9%) |
| Total | 14,963 (100.0%) | 28,273 (100.0%) |
Health & Disability in Huntington Beach
Health Insurance Coverage by Age in Huntington Beach
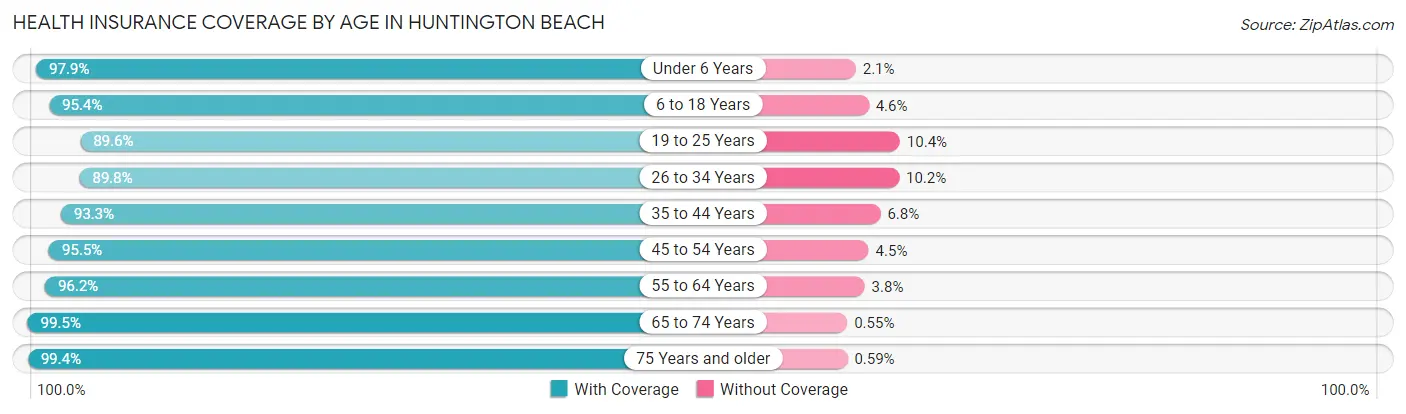
| Age Bracket | With Coverage | Without Coverage |
| Under 6 Years | 10,600 (97.9%) | 232 (2.1%) |
| 6 to 18 Years | 25,431 (95.4%) | 1,216 (4.6%) |
| 19 to 25 Years | 14,531 (89.6%) | 1,682 (10.4%) |
| 26 to 34 Years | 22,812 (89.8%) | 2,595 (10.2%) |
| 35 to 44 Years | 22,422 (93.2%) | 1,624 (6.8%) |
| 45 to 54 Years | 26,492 (95.5%) | 1,261 (4.5%) |
| 55 to 64 Years | 28,426 (96.2%) | 1,124 (3.8%) |
| 65 to 74 Years | 21,121 (99.5%) | 117 (0.5%) |
| 75 Years and older | 15,217 (99.4%) | 90 (0.6%) |
| Total | 187,052 (95.0%) | 9,941 (5.1%) |
Health Insurance Coverage by Citizenship Status in Huntington Beach
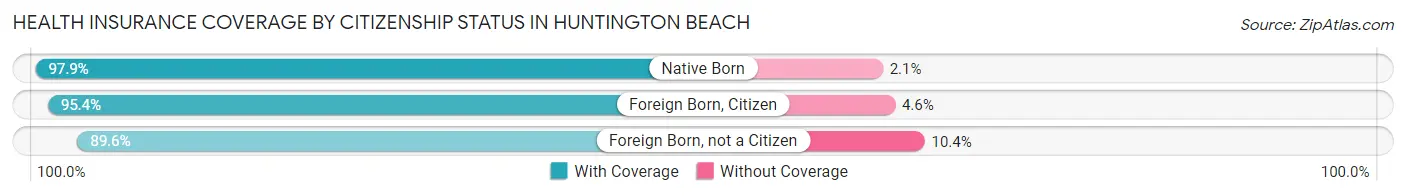
| Citizenship Status | With Coverage | Without Coverage |
| Native Born | 10,600 (97.9%) | 232 (2.1%) |
| Foreign Born, Citizen | 25,431 (95.4%) | 1,216 (4.6%) |
| Foreign Born, not a Citizen | 14,531 (89.6%) | 1,682 (10.4%) |
Health Insurance Coverage by Household Income in Huntington Beach
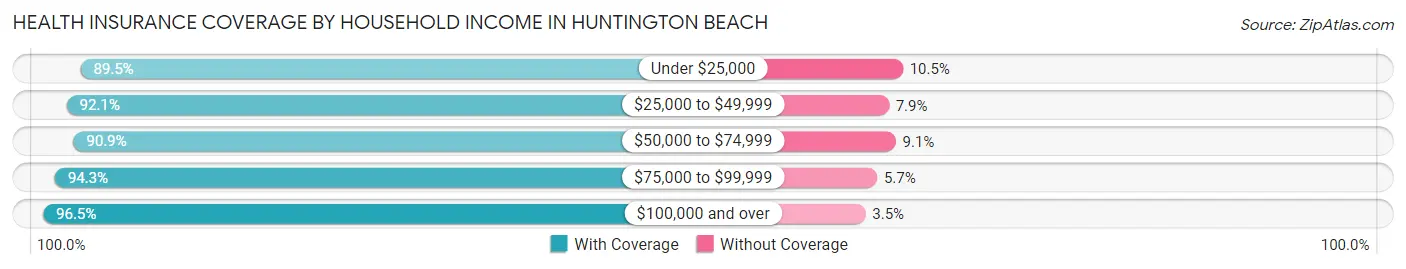
| Household Income | With Coverage | Without Coverage |
| Under $25,000 | 10,308 (89.5%) | 1,205 (10.5%) |
| $25,000 to $49,999 | 14,727 (92.1%) | 1,257 (7.9%) |
| $50,000 to $74,999 | 17,924 (90.9%) | 1,802 (9.1%) |
| $75,000 to $99,999 | 19,968 (94.3%) | 1,197 (5.7%) |
| $100,000 and over | 123,236 (96.5%) | 4,428 (3.5%) |
Public vs Private Health Insurance Coverage by Age in Huntington Beach
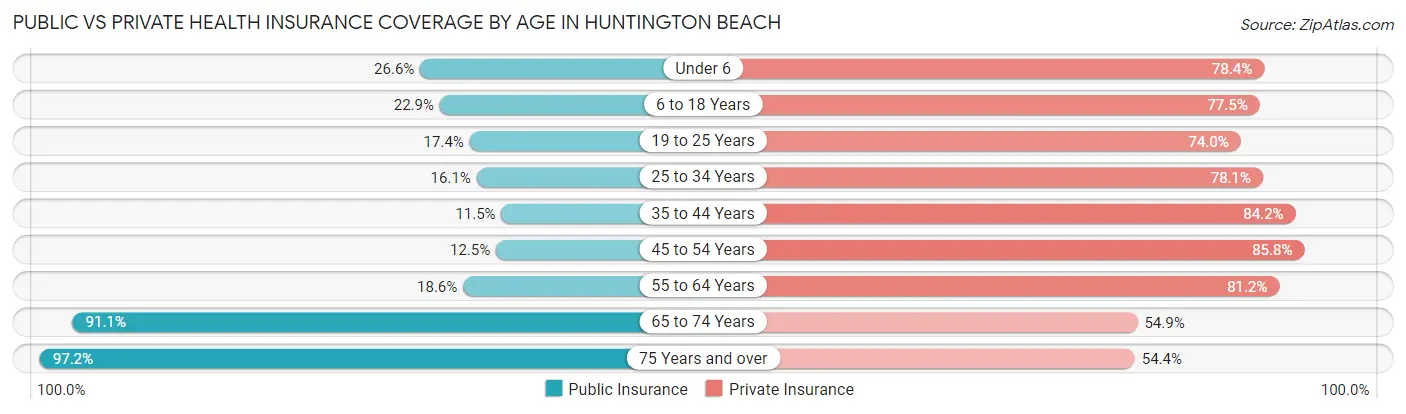
| Age Bracket | Public Insurance | Private Insurance |
| Under 6 | 2,879 (26.6%) | 8,490 (78.4%) |
| 6 to 18 Years | 6,109 (22.9%) | 20,658 (77.5%) |
| 19 to 25 Years | 2,819 (17.4%) | 12,002 (74.0%) |
| 25 to 34 Years | 4,089 (16.1%) | 19,853 (78.1%) |
| 35 to 44 Years | 2,764 (11.5%) | 20,245 (84.2%) |
| 45 to 54 Years | 3,467 (12.5%) | 23,820 (85.8%) |
| 55 to 64 Years | 5,498 (18.6%) | 23,993 (81.2%) |
| 65 to 74 Years | 19,343 (91.1%) | 11,655 (54.9%) |
| 75 Years and over | 14,873 (97.2%) | 8,324 (54.4%) |
| Total | 61,841 (31.4%) | 149,040 (75.7%) |
Disability Status by Sex by Age in Huntington Beach
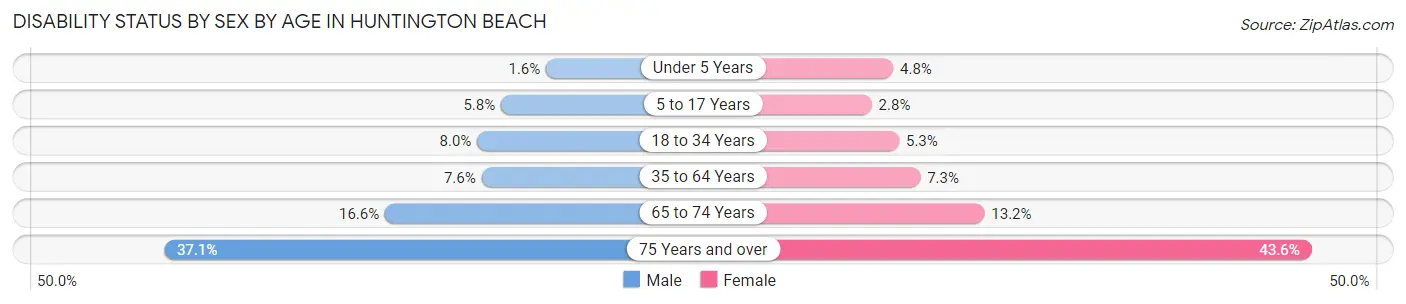
| Age Bracket | Male | Female |
| Under 5 Years | 80 (1.6%) | 204 (4.8%) |
| 5 to 17 Years | 784 (5.8%) | 345 (2.8%) |
| 18 to 34 Years | 1,760 (8.0%) | 1,159 (5.3%) |
| 35 to 64 Years | 3,133 (7.6%) | 2,915 (7.3%) |
| 65 to 74 Years | 1,683 (16.6%) | 1,465 (13.2%) |
| 75 Years and over | 2,499 (37.1%) | 3,734 (43.6%) |
Disability Class by Sex by Age in Huntington Beach
Disability Class: Hearing Difficulty
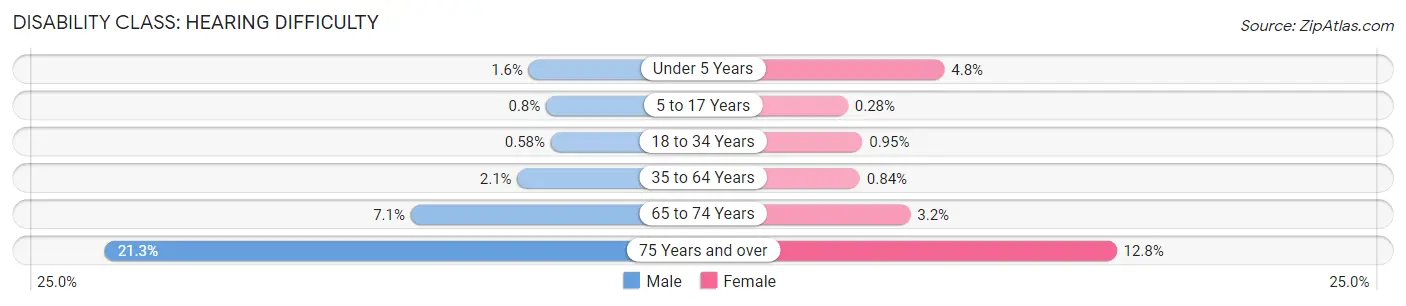
| Age Bracket | Male | Female |
| Under 5 Years | 80 (1.6%) | 204 (4.8%) |
| 5 to 17 Years | 108 (0.8%) | 35 (0.3%) |
| 18 to 34 Years | 128 (0.6%) | 208 (0.9%) |
| 35 to 64 Years | 880 (2.1%) | 335 (0.8%) |
| 65 to 74 Years | 720 (7.1%) | 352 (3.2%) |
| 75 Years and over | 1,435 (21.3%) | 1,092 (12.8%) |
Disability Class: Vision Difficulty
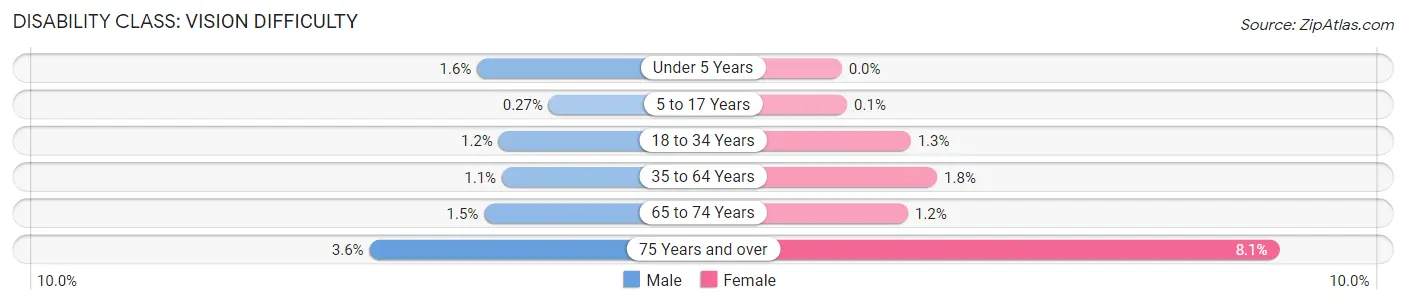
| Age Bracket | Male | Female |
| Under 5 Years | 80 (1.6%) | 0 (0.0%) |
| 5 to 17 Years | 36 (0.3%) | 13 (0.1%) |
| 18 to 34 Years | 265 (1.2%) | 280 (1.3%) |
| 35 to 64 Years | 471 (1.1%) | 708 (1.8%) |
| 65 to 74 Years | 149 (1.5%) | 136 (1.2%) |
| 75 Years and over | 243 (3.6%) | 695 (8.1%) |
Disability Class: Cognitive Difficulty
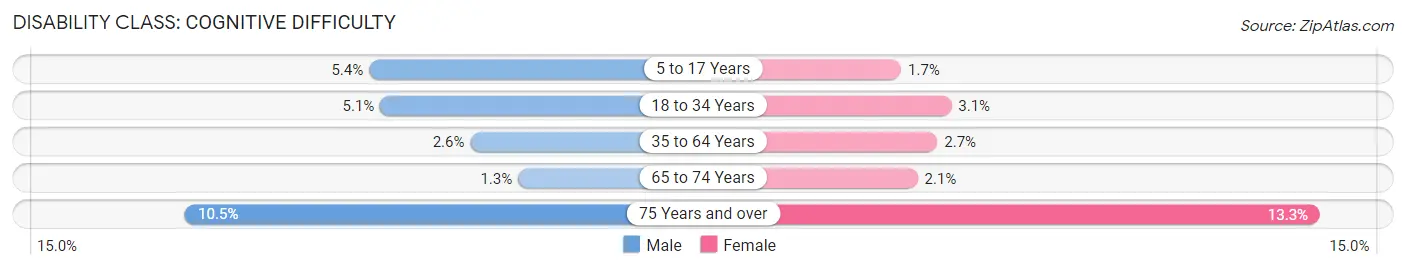
| Age Bracket | Male | Female |
| 5 to 17 Years | 733 (5.4%) | 205 (1.7%) |
| 18 to 34 Years | 1,122 (5.1%) | 665 (3.0%) |
| 35 to 64 Years | 1,070 (2.6%) | 1,064 (2.7%) |
| 65 to 74 Years | 128 (1.3%) | 234 (2.1%) |
| 75 Years and over | 710 (10.5%) | 1,140 (13.3%) |
Disability Class: Ambulatory Difficulty
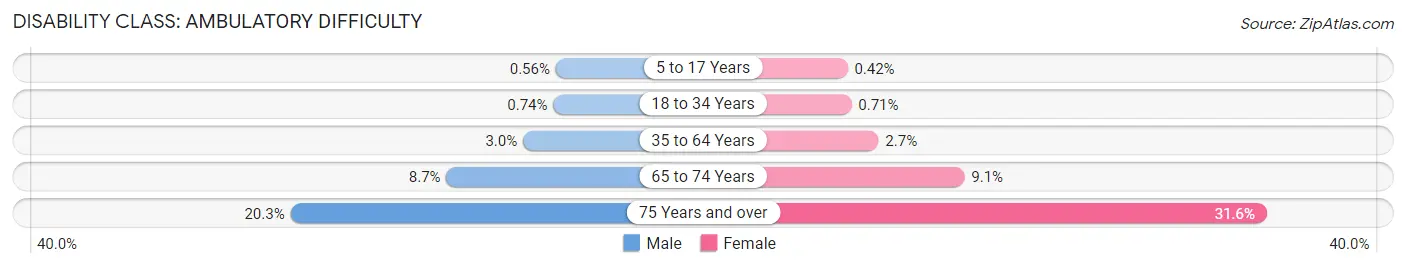
| Age Bracket | Male | Female |
| 5 to 17 Years | 76 (0.6%) | 52 (0.4%) |
| 18 to 34 Years | 163 (0.7%) | 154 (0.7%) |
| 35 to 64 Years | 1,235 (3.0%) | 1,090 (2.7%) |
| 65 to 74 Years | 883 (8.7%) | 1,007 (9.1%) |
| 75 Years and over | 1,366 (20.3%) | 2,702 (31.6%) |
Disability Class: Self-Care Difficulty
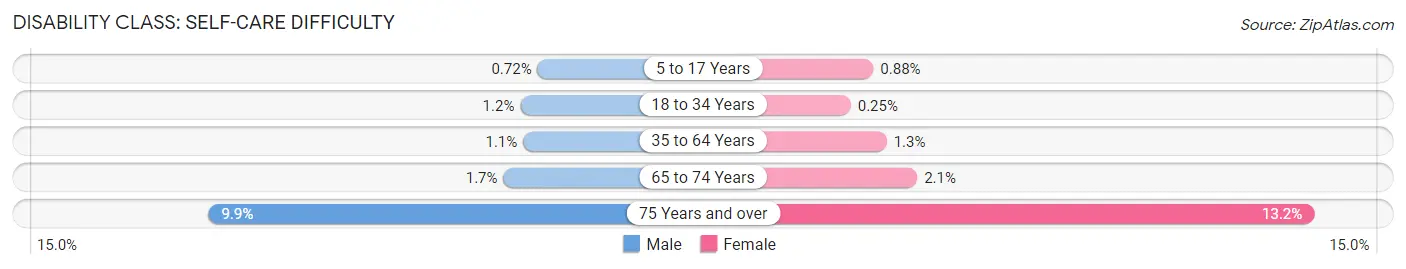
| Age Bracket | Male | Female |
| 5 to 17 Years | 97 (0.7%) | 109 (0.9%) |
| 18 to 34 Years | 265 (1.2%) | 54 (0.3%) |
| 35 to 64 Years | 464 (1.1%) | 501 (1.3%) |
| 65 to 74 Years | 170 (1.7%) | 232 (2.1%) |
| 75 Years and over | 666 (9.9%) | 1,126 (13.2%) |
Technology Access in Huntington Beach
Computing Device Access in Huntington Beach
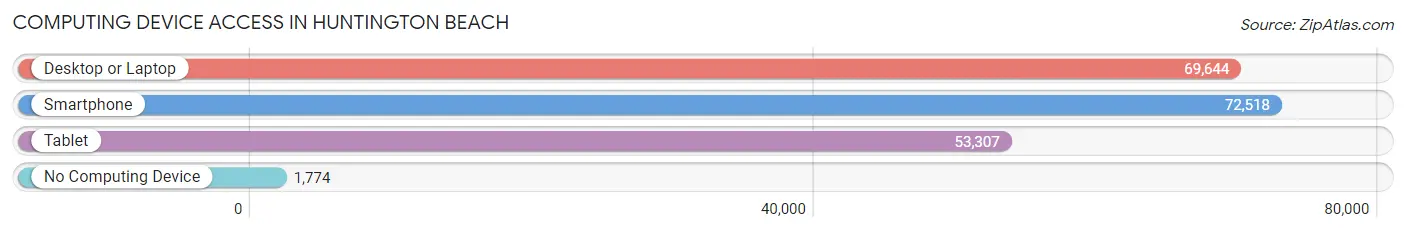
| Device Type | # Households | % Households |
| Desktop or Laptop | 69,644 | 89.7% |
| Smartphone | 72,518 | 93.4% |
| Tablet | 53,307 | 68.7% |
| No Computing Device | 1,774 | 2.3% |
| Total | 77,641 | 100.0% |
Internet Access in Huntington Beach
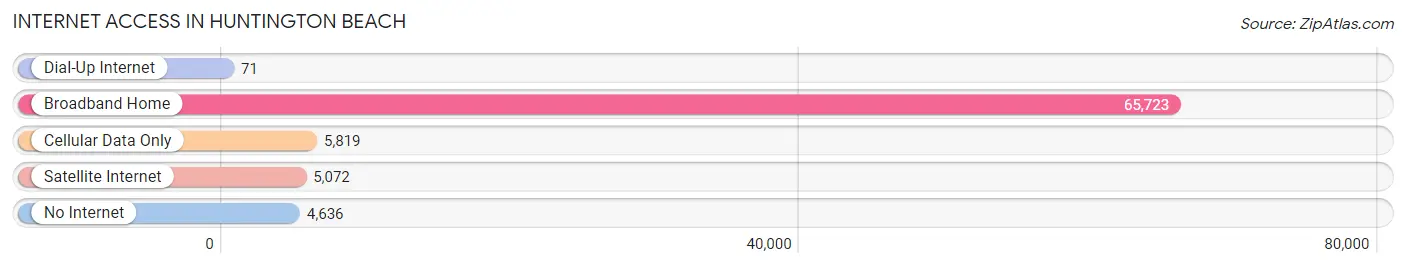
| Internet Type | # Households | % Households |
| Dial-Up Internet | 71 | 0.1% |
| Broadband Home | 65,723 | 84.7% |
| Cellular Data Only | 5,819 | 7.5% |
| Satellite Internet | 5,072 | 6.5% |
| No Internet | 4,636 | 6.0% |
| Total | 77,641 | 100.0% |
Huntington Beach Summary
Huntington Beach, California is a coastal city located in Orange County, California. It is bordered by the Pacific Ocean to the west, the cities of Fountain Valley and Westminster to the north, the cities of Costa Mesa and Newport Beach to the south, and the city of Seal Beach to the northwest. The city is known for its long, sandy beaches, surfing, and its pier, which is the longest pier on the West Coast.
History
The area that is now Huntington Beach was originally inhabited by the Tongva people, who were later displaced by Spanish settlers in the late 1700s. The area was then part of the Rancho Las Bolsas, which was granted to Manuel Nieto in 1784. In 1866, the area was purchased by Henry and William Huntington, who developed the area into a seaside resort. The city was incorporated in 1909 and was named after Henry Huntington.
Geography
Huntington Beach is located in Orange County, California, and is bordered by the Pacific Ocean to the west, the cities of Fountain Valley and Westminster to the north, the cities of Costa Mesa and Newport Beach to the south, and the city of Seal Beach to the northwest. The city covers an area of 31.2 square miles and has a population of over 200,000 people. The city is divided into several distinct neighborhoods, including Downtown, Central Park, and the Bolsa Chica wetlands.
Economy
Huntington Beach is a major tourist destination, with its long, sandy beaches and its pier, which is the longest pier on the West Coast. The city is also home to several major employers, including Boeing, Quiksilver, and the US Navy. The city also has a thriving retail and restaurant scene, with many shops and restaurants located along Main Street and Pacific Coast Highway.
Demographics
As of the 2010 census, the population of Huntington Beach was 189,992, with a population density of 6,068 people per square mile. The racial makeup of the city was 75.3% White, 4.2% African American, 0.7% Native American, 9.2% Asian, 0.3% Pacific Islander, 6.7% from other races, and 3.4% from two or more races. The median household income was $76,845, and the median family income was $90,890. The per capita income was $35,945.
Conclusion
Huntington Beach is a coastal city located in Orange County, California. It is known for its long, sandy beaches, surfing, and its pier, which is the longest pier on the West Coast. The city has a population of over 200,000 people and is a major tourist destination. The city is also home to several major employers, including Boeing, Quiksilver, and the US Navy. The city has a diverse population, with a median household income of $76,845 and a median family income of $90,890.
Common Questions
What is Per Capita Income in Huntington Beach?
Per Capita income in Huntington Beach is $60,654.
What is the Median Family Income in Huntington Beach?
Median Family Income in Huntington Beach is $136,494.
What is the Median Household income in Huntington Beach?
Median Household Income in Huntington Beach is $114,747.
What is Income or Wage Gap in Huntington Beach?
Income or Wage Gap in Huntington Beach is 31.0%.
Women in Huntington Beach earn 69.0 cents for every dollar earned by a man.
What is Family Income Deficit in Huntington Beach?
Family Income Deficit in Huntington Beach is $10,733.
Families that are below poverty line in Huntington Beach earn $10,733 less on average than the poverty threshold level.
What is Inequality or Gini Index in Huntington Beach?
Inequality or Gini Index in Huntington Beach is 0.44.
What is the Total Population of Huntington Beach?
Total Population of Huntington Beach is 197,481.
What is the Total Male Population of Huntington Beach?
Total Male Population of Huntington Beach is 99,061.
What is the Total Female Population of Huntington Beach?
Total Female Population of Huntington Beach is 98,420.
What is the Ratio of Males per 100 Females in Huntington Beach?
There are 100.65 Males per 100 Females in Huntington Beach.
What is the Ratio of Females per 100 Males in Huntington Beach?
There are 99.35 Females per 100 Males in Huntington Beach.
What is the Median Population Age in Huntington Beach?
Median Population Age in Huntington Beach is 43.3 Years.
What is the Average Family Size in Huntington Beach
Average Family Size in Huntington Beach is 3.1 People.
What is the Average Household Size in Huntington Beach
Average Household Size in Huntington Beach is 2.5 People.
How Large is the Labor Force in Huntington Beach?
There are 110,641 People in the Labor Forcein in Huntington Beach.
What is the Percentage of People in the Labor Force in Huntington Beach?
66.3% of People are in the Labor Force in Huntington Beach.
What is the Unemployment Rate in Huntington Beach?
Unemployment Rate in Huntington Beach is 5.4%.