San Gabriel, CA Map & Demographics
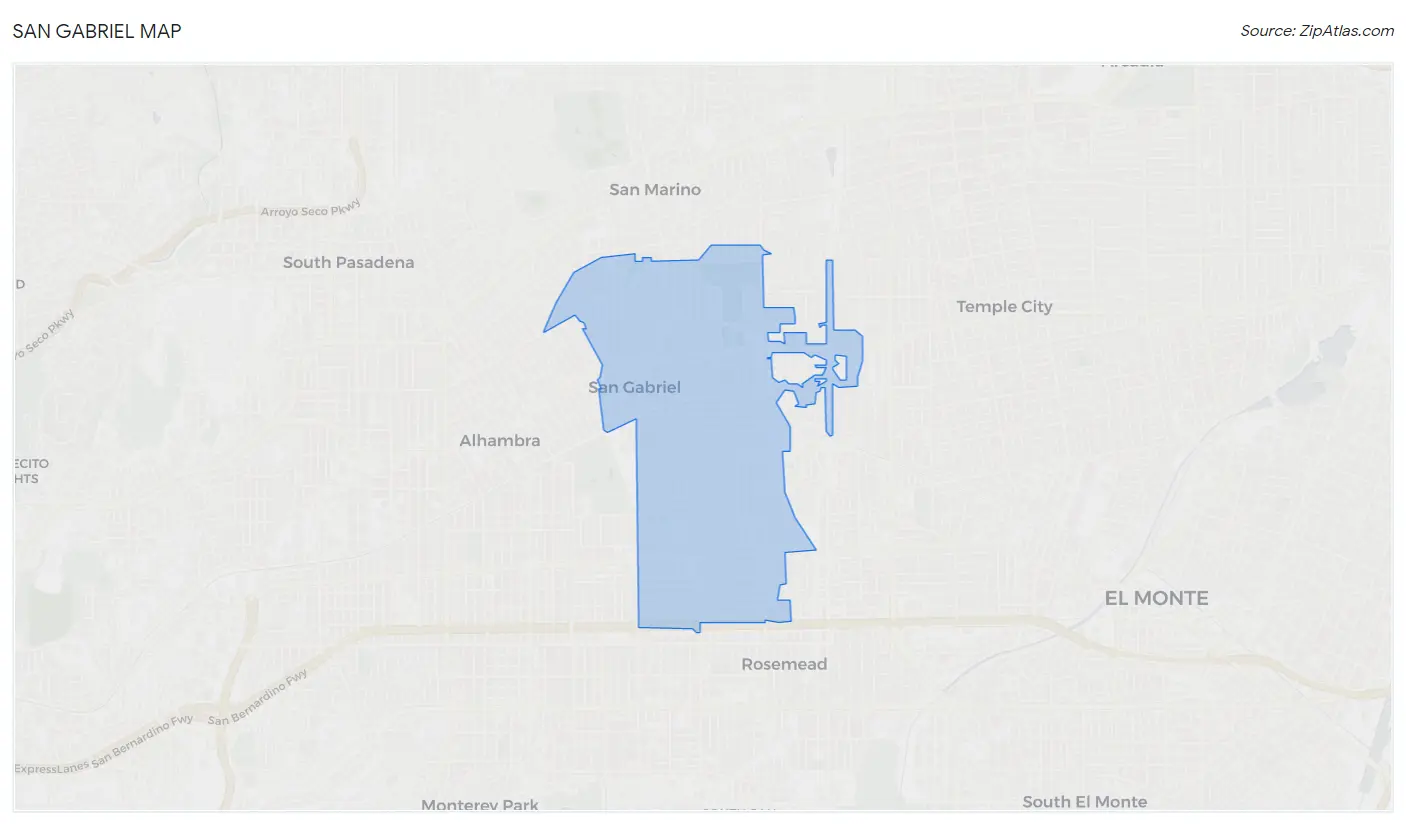
San Gabriel Map
San Gabriel Overview
$35,799
PER CAPITA INCOME
$86,410
AVG FAMILY INCOME
$84,056
AVG HOUSEHOLD INCOME
11.9%
WAGE / INCOME GAP [ % ]
88.1¢/ $1
WAGE / INCOME GAP [ $ ]
$8,847
FAMILY INCOME DEFICIT
0.46
INEQUALITY / GINI INDEX
39,211
TOTAL POPULATION
19,426
MALE POPULATION
19,785
FEMALE POPULATION
98.19
MALES / 100 FEMALES
101.85
FEMALES / 100 MALES
44.3
MEDIAN AGE
3.5
AVG FAMILY SIZE
3.1
AVG HOUSEHOLD SIZE
20,726
LABOR FORCE [ PEOPLE ]
62.0%
PERCENT IN LABOR FORCE
6.8%
UNEMPLOYMENT RATE
San Gabriel Area Codes
Income in San Gabriel
Income Overview in San Gabriel
Per Capita Income in San Gabriel is $35,799, while median incomes of families and households are $86,410 and $84,056 respectively.
| Characteristic | Number | Measure |
| Per Capita Income | 39,211 | $35,799 |
| Median Family Income | 9,183 | $86,410 |
| Mean Family Income | 9,183 | $116,346 |
| Median Household Income | 12,319 | $84,056 |
| Mean Household Income | 12,319 | $109,559 |
| Income Deficit | 9,183 | $8,847 |
| Wage / Income Gap (%) | 39,211 | 11.94% |
| Wage / Income Gap ($) | 39,211 | 88.06¢ per $1 |
| Gini / Inequality Index | 39,211 | 0.46 |
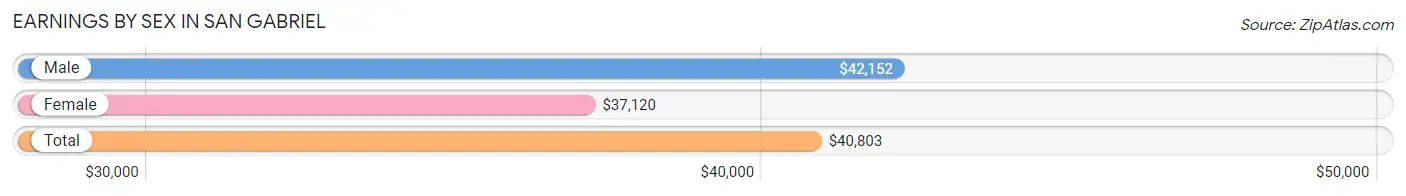
Earnings by Sex in San Gabriel
Average Earnings in San Gabriel are $40,803, $42,152 for men and $37,120 for women, a difference of 11.9%.
| Sex | Number | Average Earnings |
| Male | 11,060 (53.1%) | $42,152 |
| Female | 9,752 (46.9%) | $37,120 |
| Total | 20,812 (100.0%) | $40,803 |
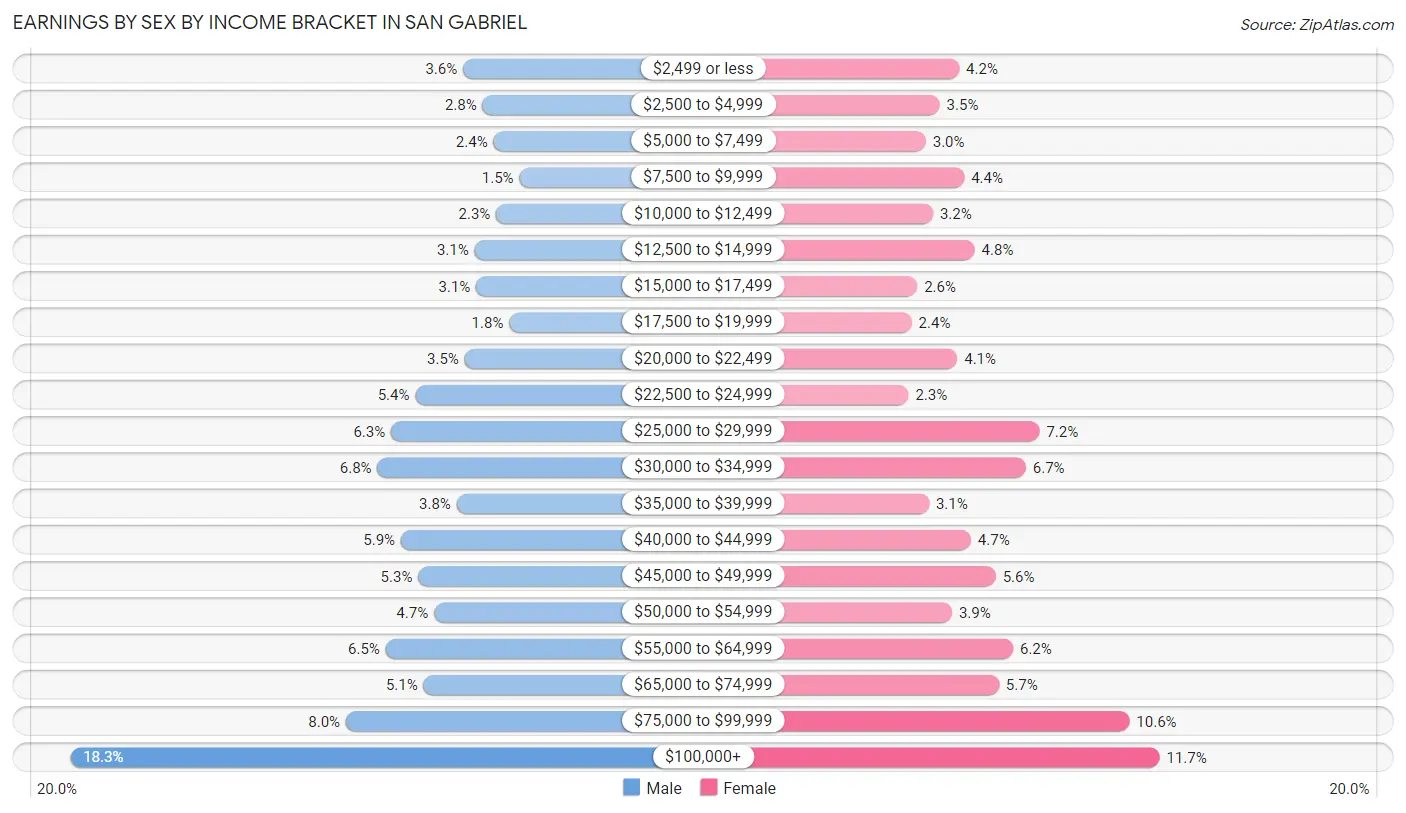
Earnings by Sex by Income Bracket in San Gabriel
The most common earnings brackets in San Gabriel are $100,000+ for men (2,023 | 18.3%) and $100,000+ for women (1,143 | 11.7%).
| Income | Male | Female |
| $2,499 or less | 395 (3.6%) | 411 (4.2%) |
| $2,500 to $4,999 | 314 (2.8%) | 339 (3.5%) |
| $5,000 to $7,499 | 269 (2.4%) | 289 (3.0%) |
| $7,500 to $9,999 | 162 (1.5%) | 429 (4.4%) |
| $10,000 to $12,499 | 258 (2.3%) | 315 (3.2%) |
| $12,500 to $14,999 | 347 (3.1%) | 467 (4.8%) |
| $15,000 to $17,499 | 341 (3.1%) | 257 (2.6%) |
| $17,500 to $19,999 | 203 (1.8%) | 237 (2.4%) |
| $20,000 to $22,499 | 388 (3.5%) | 404 (4.1%) |
| $22,500 to $24,999 | 593 (5.4%) | 225 (2.3%) |
| $25,000 to $29,999 | 693 (6.3%) | 704 (7.2%) |
| $30,000 to $34,999 | 750 (6.8%) | 654 (6.7%) |
| $35,000 to $39,999 | 421 (3.8%) | 300 (3.1%) |
| $40,000 to $44,999 | 652 (5.9%) | 453 (4.6%) |
| $45,000 to $49,999 | 581 (5.2%) | 544 (5.6%) |
| $50,000 to $54,999 | 515 (4.7%) | 384 (3.9%) |
| $55,000 to $64,999 | 716 (6.5%) | 608 (6.2%) |
| $65,000 to $74,999 | 559 (5.1%) | 556 (5.7%) |
| $75,000 to $99,999 | 880 (8.0%) | 1,033 (10.6%) |
| $100,000+ | 2,023 (18.3%) | 1,143 (11.7%) |
| Total | 11,060 (100.0%) | 9,752 (100.0%) |
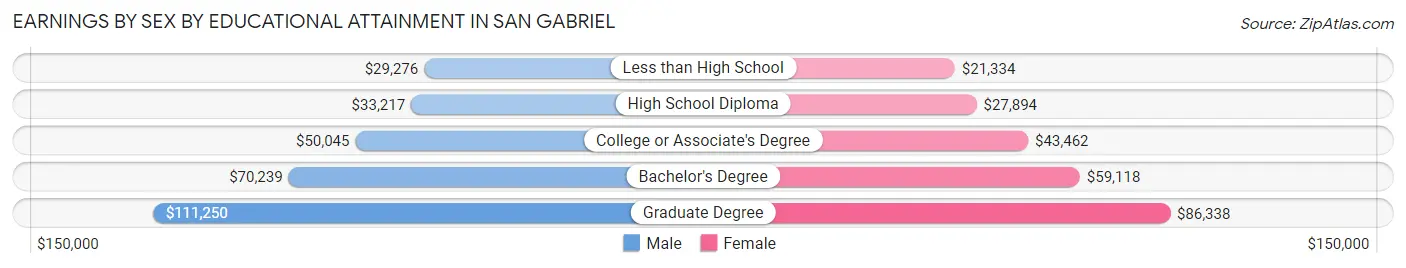
Earnings by Sex by Educational Attainment in San Gabriel
Average earnings in San Gabriel are $46,224 for men and $40,983 for women, a difference of 11.3%. Men with an educational attainment of graduate degree enjoy the highest average annual earnings of $111,250, while those with less than high school education earn the least with $29,276. Women with an educational attainment of graduate degree earn the most with the average annual earnings of $86,338, while those with less than high school education have the smallest earnings of $21,334.
| Educational Attainment | Male Income | Female Income |
| Less than High School | $29,276 | $21,334 |
| High School Diploma | $33,217 | $27,894 |
| College or Associate's Degree | $50,045 | $43,462 |
| Bachelor's Degree | $70,239 | $59,118 |
| Graduate Degree | $111,250 | $86,338 |
| Total | $46,224 | $40,983 |
Family Income in San Gabriel
Family Income Brackets in San Gabriel
According to the San Gabriel family income data, there are 1,561 families falling into the $100,000 to $149,999 income range, which is the most common income bracket and makes up 17.0% of all families. Conversely, the $10,000 to $14,999 income bracket is the least frequent group with only 174 families (1.9%) belonging to this category.
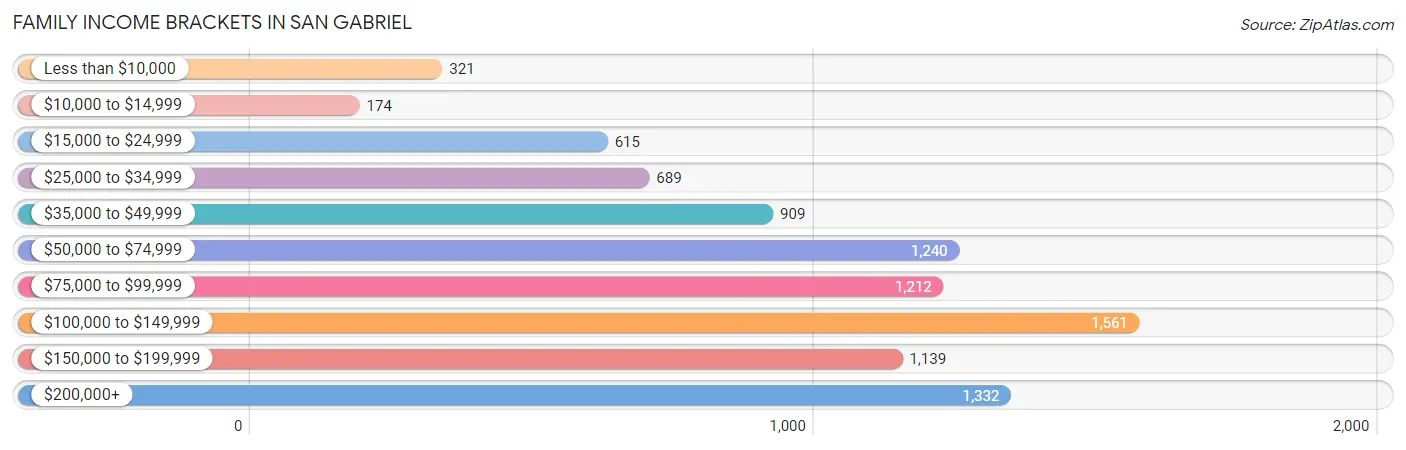
| Income Bracket | # Families | % Families |
| Less than $10,000 | 321 | 3.5% |
| $10,000 to $14,999 | 174 | 1.9% |
| $15,000 to $24,999 | 615 | 6.7% |
| $25,000 to $34,999 | 689 | 7.5% |
| $35,000 to $49,999 | 909 | 9.9% |
| $50,000 to $74,999 | 1,240 | 13.5% |
| $75,000 to $99,999 | 1,212 | 13.2% |
| $100,000 to $149,999 | 1,561 | 17.0% |
| $150,000 to $199,999 | 1,139 | 12.4% |
| $200,000+ | 1,332 | 14.5% |
Family Income by Famaliy Size in San Gabriel
6-person families (324 | 3.5%) account for the highest median family income in San Gabriel with $148,636 per family, while 3-person families (2,441 | 26.6%) have the highest median income of $27,845 per family member.
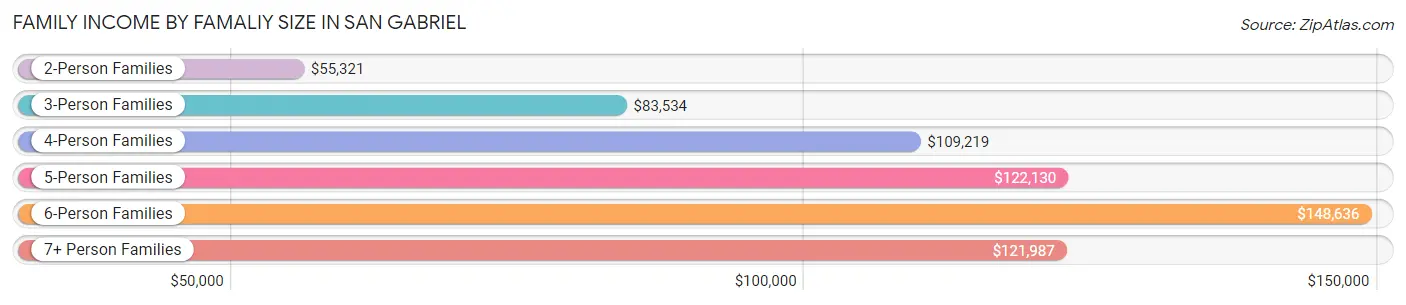
| Income Bracket | # Families | Median Income |
| 2-Person Families | 3,244 (35.3%) | $55,321 |
| 3-Person Families | 2,441 (26.6%) | $83,534 |
| 4-Person Families | 1,956 (21.3%) | $109,219 |
| 5-Person Families | 788 (8.6%) | $122,130 |
| 6-Person Families | 324 (3.5%) | $148,636 |
| 7+ Person Families | 430 (4.7%) | $121,987 |
| Total | 9,183 (100.0%) | $86,410 |
Family Income by Number of Earners in San Gabriel
The median family income in San Gabriel is $86,410, with families comprising 3+ earners (1,729) having the highest median family income of $129,989, while families with no earners (1,151) have the lowest median family income of $28,842, accounting for 18.8% and 12.5% of families, respectively.
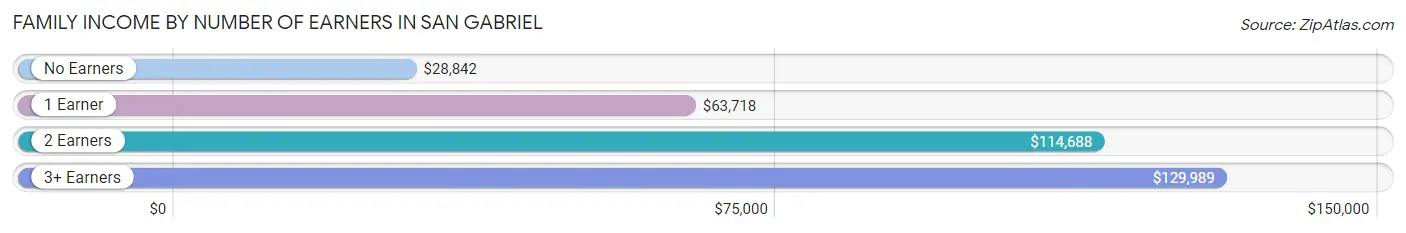
| Number of Earners | # Families | Median Income |
| No Earners | 1,151 (12.5%) | $28,842 |
| 1 Earner | 2,661 (29.0%) | $63,718 |
| 2 Earners | 3,642 (39.7%) | $114,688 |
| 3+ Earners | 1,729 (18.8%) | $129,989 |
| Total | 9,183 (100.0%) | $86,410 |
Household Income in San Gabriel
Household Income Brackets in San Gabriel
With 2,168 households falling in the category, the $100,000 to $149,999 income range is the most frequent in San Gabriel, accounting for 17.6% of all households. In contrast, only 419 households (3.4%) fall into the $10,000 to $14,999 income bracket, making it the least populous group.
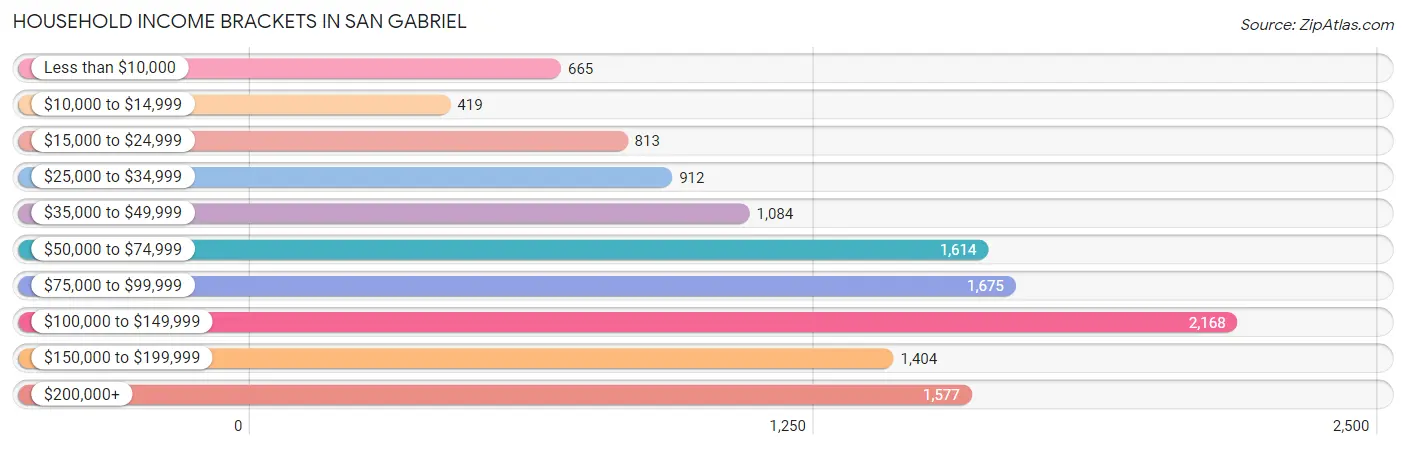
| Income Bracket | # Households | % Households |
| Less than $10,000 | 665 | 5.4% |
| $10,000 to $14,999 | 419 | 3.4% |
| $15,000 to $24,999 | 813 | 6.6% |
| $25,000 to $34,999 | 912 | 7.4% |
| $35,000 to $49,999 | 1,084 | 8.8% |
| $50,000 to $74,999 | 1,614 | 13.1% |
| $75,000 to $99,999 | 1,675 | 13.6% |
| $100,000 to $149,999 | 2,168 | 17.6% |
| $150,000 to $199,999 | 1,404 | 11.4% |
| $200,000+ | 1,577 | 12.8% |
Household Income by Householder Age in San Gabriel
The median household income in San Gabriel is $84,056, with the highest median household income of $99,444 found in the 45 to 64 years age bracket for the primary householder. A total of 5,110 households (41.5%) fall into this category. Meanwhile, the 65+ years age bracket for the primary householder has the lowest median household income of $59,216, with 3,277 households (26.6%) in this group.
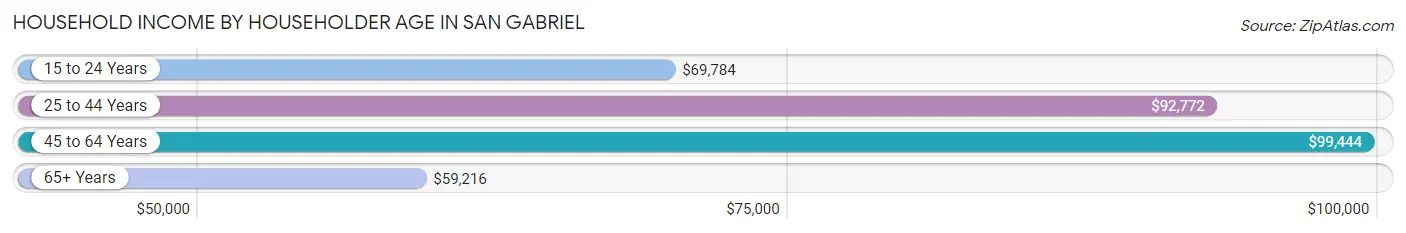
| Income Bracket | # Households | Median Income |
| 15 to 24 Years | 223 (1.8%) | $69,784 |
| 25 to 44 Years | 3,709 (30.1%) | $92,772 |
| 45 to 64 Years | 5,110 (41.5%) | $99,444 |
| 65+ Years | 3,277 (26.6%) | $59,216 |
| Total | 12,319 (100.0%) | $84,056 |
Poverty in San Gabriel
Income Below Poverty by Sex and Age in San Gabriel
With 12.1% poverty level for males and 13.7% for females among the residents of San Gabriel, 75 year old and over males and 16 and 17 year old females are the most vulnerable to poverty, with 201 males (18.5%) and 125 females (30.9%) in their respective age groups living below the poverty level.
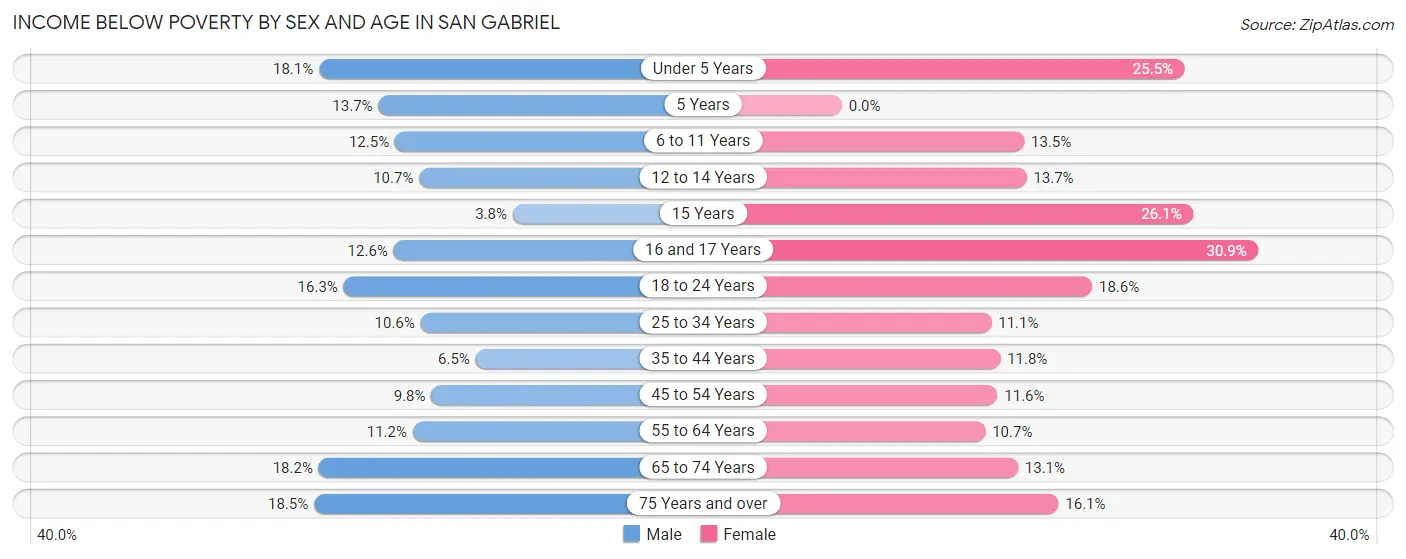
| Age Bracket | Male | Female |
| Under 5 Years | 179 (18.1%) | 205 (25.5%) |
| 5 Years | 35 (13.7%) | 0 (0.0%) |
| 6 to 11 Years | 133 (12.5%) | 127 (13.5%) |
| 12 to 14 Years | 78 (10.7%) | 61 (13.7%) |
| 15 Years | 9 (3.7%) | 59 (26.1%) |
| 16 and 17 Years | 66 (12.6%) | 125 (30.9%) |
| 18 to 24 Years | 250 (16.3%) | 206 (18.6%) |
| 25 to 34 Years | 300 (10.6%) | 304 (11.1%) |
| 35 to 44 Years | 166 (6.5%) | 281 (11.8%) |
| 45 to 54 Years | 269 (9.8%) | 340 (11.6%) |
| 55 to 64 Years | 315 (11.2%) | 358 (10.6%) |
| 65 to 74 Years | 323 (18.2%) | 252 (13.1%) |
| 75 Years and over | 201 (18.5%) | 334 (16.1%) |
| Total | 2,324 (12.1%) | 2,652 (13.7%) |
Income Above Poverty by Sex and Age in San Gabriel
According to the poverty statistics in San Gabriel, males aged 15 years and females aged 5 years are the age groups that are most secure financially, with 96.3% of males and 100.0% of females in these age groups living above the poverty line.
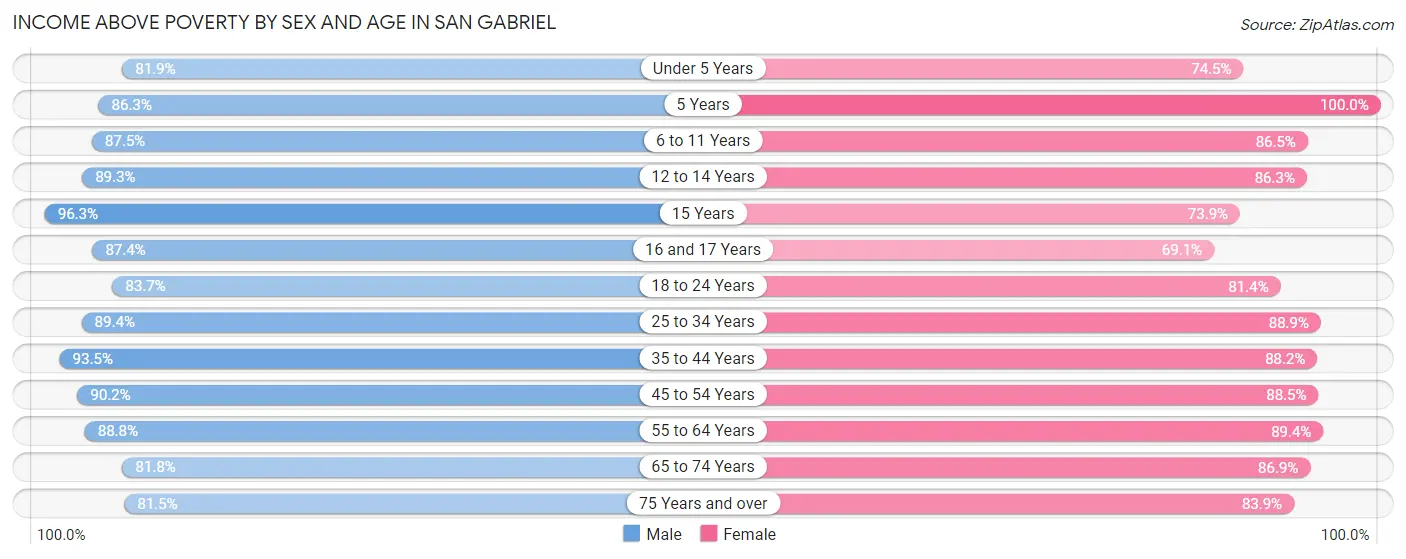
| Age Bracket | Male | Female |
| Under 5 Years | 808 (81.9%) | 600 (74.5%) |
| 5 Years | 220 (86.3%) | 28 (100.0%) |
| 6 to 11 Years | 931 (87.5%) | 812 (86.5%) |
| 12 to 14 Years | 651 (89.3%) | 384 (86.3%) |
| 15 Years | 231 (96.3%) | 167 (73.9%) |
| 16 and 17 Years | 458 (87.4%) | 279 (69.1%) |
| 18 to 24 Years | 1,283 (83.7%) | 903 (81.4%) |
| 25 to 34 Years | 2,529 (89.4%) | 2,435 (88.9%) |
| 35 to 44 Years | 2,385 (93.5%) | 2,108 (88.2%) |
| 45 to 54 Years | 2,477 (90.2%) | 2,604 (88.4%) |
| 55 to 64 Years | 2,502 (88.8%) | 3,003 (89.3%) |
| 65 to 74 Years | 1,456 (81.8%) | 1,676 (86.9%) |
| 75 Years and over | 885 (81.5%) | 1,743 (83.9%) |
| Total | 16,816 (87.9%) | 16,742 (86.3%) |
Income Below Poverty Among Married-Couple Families in San Gabriel
The poverty statistics for married-couple families in San Gabriel show that 9.9% or 613 of the total 6,210 families live below the poverty line. Families with 1 or 2 children have the highest poverty rate of 12.5%, comprising of 280 families. On the other hand, families with no children have the lowest poverty rate of 8.1%, which includes 297 families.
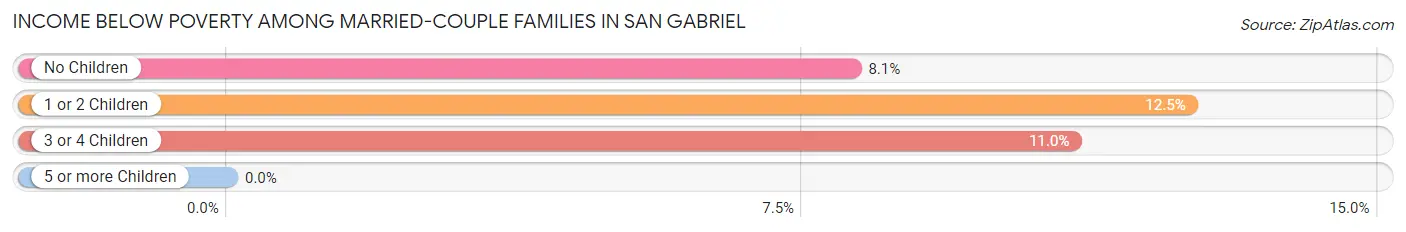
| Children | Above Poverty | Below Poverty |
| No Children | 3,352 (91.9%) | 297 (8.1%) |
| 1 or 2 Children | 1,954 (87.5%) | 280 (12.5%) |
| 3 or 4 Children | 291 (89.0%) | 36 (11.0%) |
| 5 or more Children | 0 (0.0%) | 0 (0.0%) |
| Total | 5,597 (90.1%) | 613 (9.9%) |
Income Below Poverty Among Single-Parent Households in San Gabriel
According to the poverty data in San Gabriel, 12.8% or 138 single-father households and 14.4% or 272 single-mother households are living below the poverty line. Among single-father households, those with 1 or 2 children have the highest poverty rate, with 111 households (24.2%) experiencing poverty. Likewise, among single-mother households, those with 3 or 4 children have the highest poverty rate, with 17 households (70.8%) falling below the poverty line.
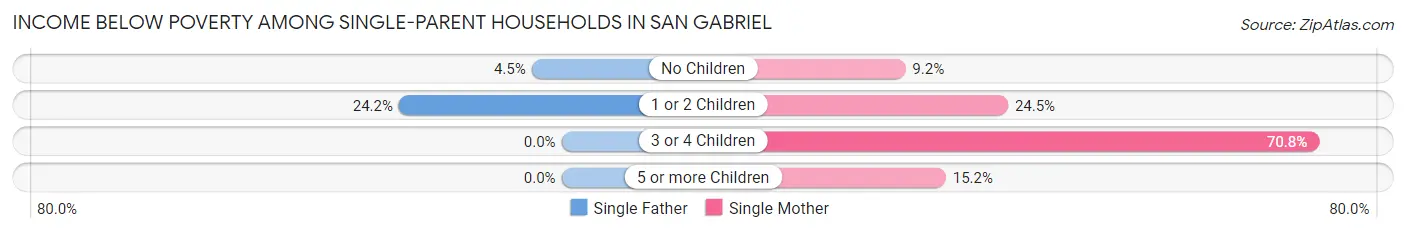
| Children | Single Father | Single Mother |
| No Children | 27 (4.5%) | 119 (9.2%) |
| 1 or 2 Children | 111 (24.2%) | 129 (24.5%) |
| 3 or 4 Children | 0 (0.0%) | 17 (70.8%) |
| 5 or more Children | 0 (0.0%) | 7 (15.2%) |
| Total | 138 (12.8%) | 272 (14.4%) |
Income Below Poverty Among Married-Couple vs Single-Parent Households in San Gabriel
The poverty data for San Gabriel shows that 613 of the married-couple family households (9.9%) and 410 of the single-parent households (13.8%) are living below the poverty level. Within the married-couple family households, those with 1 or 2 children have the highest poverty rate, with 280 households (12.5%) falling below the poverty line. Among the single-parent households, those with 3 or 4 children have the highest poverty rate, with 17 household (40.5%) living below poverty.
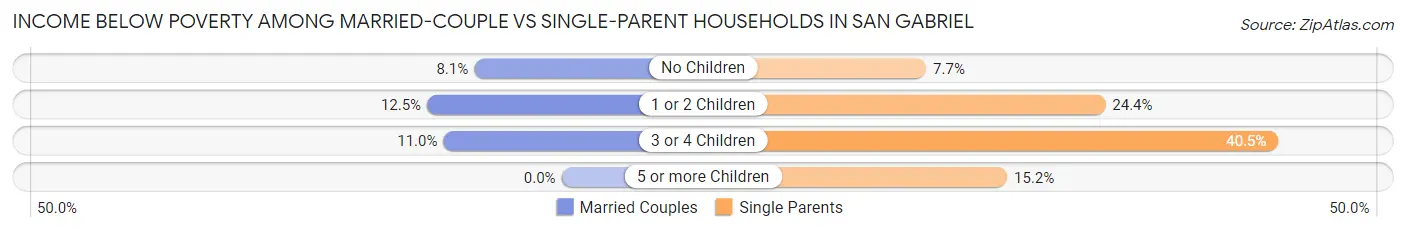
| Children | Married-Couple Families | Single-Parent Households |
| No Children | 297 (8.1%) | 146 (7.7%) |
| 1 or 2 Children | 280 (12.5%) | 240 (24.4%) |
| 3 or 4 Children | 36 (11.0%) | 17 (40.5%) |
| 5 or more Children | 0 (0.0%) | 7 (15.2%) |
| Total | 613 (9.9%) | 410 (13.8%) |
Race in San Gabriel
The most populous races in San Gabriel are Asian (23,301 | 59.4%), Hispanic or Latino (10,398 | 26.5%), and White / Caucasian (6,269 | 16.0%).
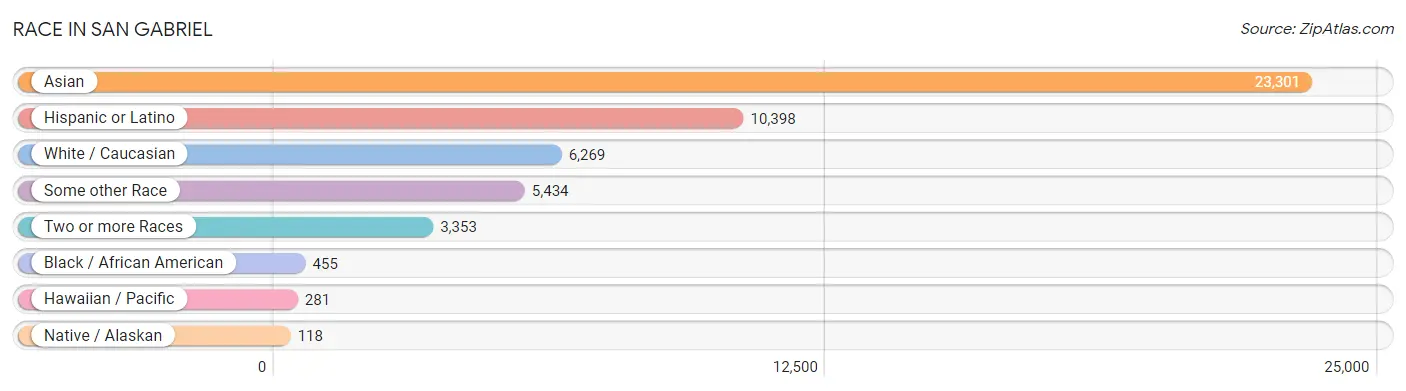
| Race | # Population | % Population |
| Asian | 23,301 | 59.4% |
| Black / African American | 455 | 1.2% |
| Hawaiian / Pacific | 281 | 0.7% |
| Hispanic or Latino | 10,398 | 26.5% |
| Native / Alaskan | 118 | 0.3% |
| White / Caucasian | 6,269 | 16.0% |
| Two or more Races | 3,353 | 8.6% |
| Some other Race | 5,434 | 13.9% |
| Total | 39,211 | 100.0% |
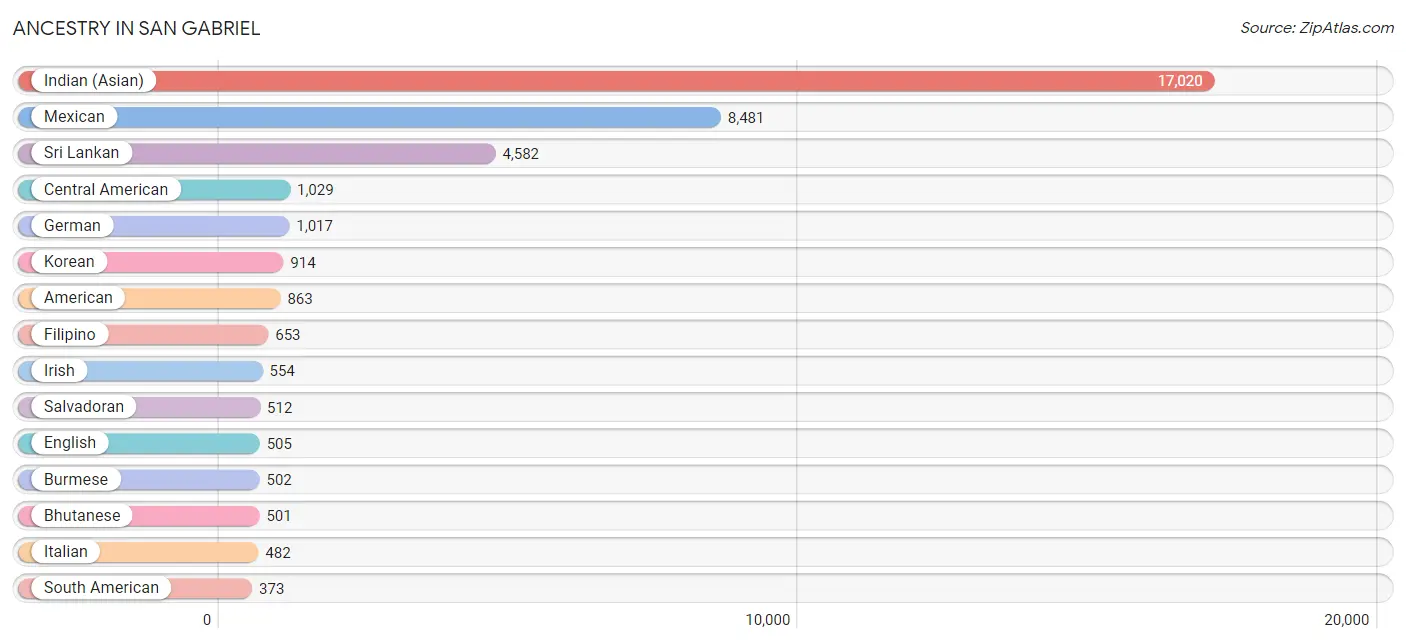
Ancestry in San Gabriel
The most populous ancestries reported in San Gabriel are Indian (Asian) (17,020 | 43.4%), Mexican (8,481 | 21.6%), Sri Lankan (4,582 | 11.7%), Central American (1,029 | 2.6%), and German (1,017 | 2.6%), together accounting for 81.9% of all San Gabriel residents.
| Ancestry | # Population | % Population |
| Afghan | 66 | 0.2% |
| African | 32 | 0.1% |
| American | 863 | 2.2% |
| Apache | 15 | 0.0% |
| Arab | 46 | 0.1% |
| Argentinean | 39 | 0.1% |
| Armenian | 101 | 0.3% |
| Austrian | 11 | 0.0% |
| Bhutanese | 501 | 1.3% |
| Brazilian | 71 | 0.2% |
| British | 40 | 0.1% |
| Burmese | 502 | 1.3% |
| Canadian | 28 | 0.1% |
| Central American | 1,029 | 2.6% |
| Central American Indian | 28 | 0.1% |
| Cherokee | 13 | 0.0% |
| Chilean | 17 | 0.0% |
| Choctaw | 10 | 0.0% |
| Colombian | 73 | 0.2% |
| Creek | 6 | 0.0% |
| Croatian | 23 | 0.1% |
| Cuban | 37 | 0.1% |
| Czech | 45 | 0.1% |
| Czechoslovakian | 50 | 0.1% |
| Danish | 71 | 0.2% |
| Dominican | 30 | 0.1% |
| Dutch | 54 | 0.1% |
| Eastern European | 21 | 0.1% |
| Ecuadorian | 39 | 0.1% |
| English | 505 | 1.3% |
| European | 146 | 0.4% |
| Filipino | 653 | 1.7% |
| French | 132 | 0.3% |
| French Canadian | 16 | 0.0% |
| German | 1,017 | 2.6% |
| Greek | 53 | 0.1% |
| Guatemalan | 143 | 0.4% |
| Guyanese | 64 | 0.2% |
| Haitian | 9 | 0.0% |
| Honduran | 37 | 0.1% |
| Hungarian | 161 | 0.4% |
| Indian (Asian) | 17,020 | 43.4% |
| Indonesian | 205 | 0.5% |
| Iranian | 60 | 0.2% |
| Irish | 554 | 1.4% |
| Iroquois | 6 | 0.0% |
| Italian | 482 | 1.2% |
| Jamaican | 9 | 0.0% |
| Japanese | 210 | 0.5% |
| Korean | 914 | 2.3% |
| Laotian | 267 | 0.7% |
| Lebanese | 24 | 0.1% |
| Lithuanian | 4 | 0.0% |
| Malaysian | 7 | 0.0% |
| Mexican | 8,481 | 21.6% |
| Mexican American Indian | 89 | 0.2% |
| Mongolian | 8 | 0.0% |
| Native Hawaiian | 17 | 0.0% |
| Nicaraguan | 79 | 0.2% |
| Northern European | 45 | 0.1% |
| Norwegian | 74 | 0.2% |
| Pakistani | 172 | 0.4% |
| Palestinian | 17 | 0.0% |
| Paraguayan | 1 | 0.0% |
| Peruvian | 191 | 0.5% |
| Pima | 22 | 0.1% |
| Polish | 136 | 0.4% |
| Portuguese | 9 | 0.0% |
| Puerto Rican | 32 | 0.1% |
| Romanian | 11 | 0.0% |
| Russian | 20 | 0.1% |
| Salvadoran | 512 | 1.3% |
| Samoan | 108 | 0.3% |
| Scandinavian | 30 | 0.1% |
| Scotch-Irish | 67 | 0.2% |
| Scottish | 135 | 0.3% |
| Slovak | 5 | 0.0% |
| South American | 373 | 0.9% |
| Spaniard | 67 | 0.2% |
| Spanish | 79 | 0.2% |
| Sri Lankan | 4,582 | 11.7% |
| Subsaharan African | 32 | 0.1% |
| Swedish | 11 | 0.0% |
| Swiss | 7 | 0.0% |
| Thai | 105 | 0.3% |
| Ukrainian | 21 | 0.1% |
| Vietnamese | 16 | 0.0% |
| Welsh | 36 | 0.1% |
| Yaqui | 87 | 0.2% |
| Yugoslavian | 11 | 0.0% | View All 90 Rows |
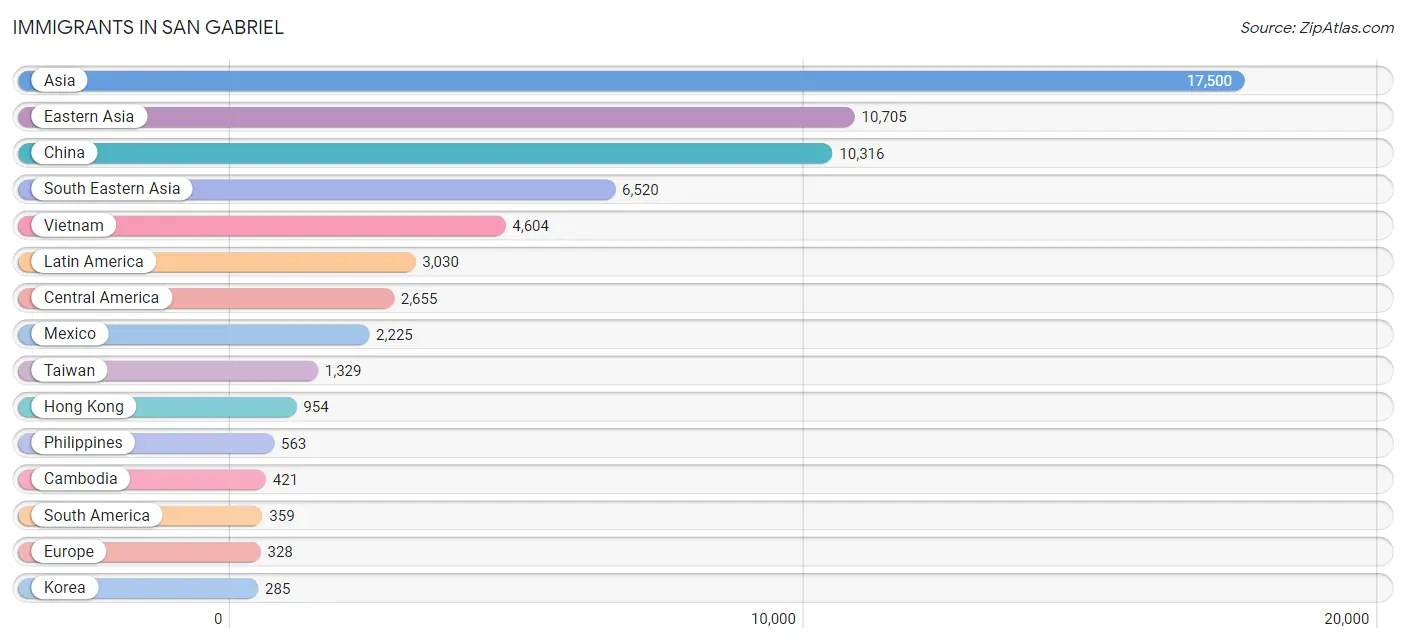
Immigrants in San Gabriel
The most numerous immigrant groups reported in San Gabriel came from Asia (17,500 | 44.6%), Eastern Asia (10,705 | 27.3%), China (10,316 | 26.3%), South Eastern Asia (6,520 | 16.6%), and Vietnam (4,604 | 11.7%), together accounting for 126.6% of all San Gabriel residents.
| Immigration Origin | # Population | % Population |
| Afghanistan | 66 | 0.2% |
| Africa | 72 | 0.2% |
| Argentina | 31 | 0.1% |
| Armenia | 21 | 0.1% |
| Asia | 17,500 | 44.6% |
| Australia | 10 | 0.0% |
| Bangladesh | 11 | 0.0% |
| Brazil | 57 | 0.2% |
| Bulgaria | 7 | 0.0% |
| Cambodia | 421 | 1.1% |
| Canada | 73 | 0.2% |
| Caribbean | 16 | 0.0% |
| Central America | 2,655 | 6.8% |
| Chile | 30 | 0.1% |
| China | 10,316 | 26.3% |
| Colombia | 50 | 0.1% |
| Croatia | 7 | 0.0% |
| Cuba | 7 | 0.0% |
| Czechoslovakia | 33 | 0.1% |
| Denmark | 11 | 0.0% |
| Eastern Africa | 6 | 0.0% |
| Eastern Asia | 10,705 | 27.3% |
| Eastern Europe | 95 | 0.2% |
| Ecuador | 39 | 0.1% |
| El Salvador | 261 | 0.7% |
| England | 18 | 0.1% |
| Europe | 328 | 0.8% |
| Fiji | 138 | 0.4% |
| Germany | 89 | 0.2% |
| Guatemala | 47 | 0.1% |
| Guyana | 10 | 0.0% |
| Haiti | 9 | 0.0% |
| Honduras | 39 | 0.1% |
| Hong Kong | 954 | 2.4% |
| Hungary | 10 | 0.0% |
| India | 57 | 0.2% |
| Indonesia | 262 | 0.7% |
| Iran | 58 | 0.2% |
| Italy | 64 | 0.2% |
| Japan | 104 | 0.3% |
| Korea | 285 | 0.7% |
| Laos | 20 | 0.1% |
| Latin America | 3,030 | 7.7% |
| Lebanon | 18 | 0.1% |
| Malaysia | 118 | 0.3% |
| Mexico | 2,225 | 5.7% |
| Netherlands | 36 | 0.1% |
| Nicaragua | 56 | 0.1% |
| Nigeria | 37 | 0.1% |
| Northern Europe | 42 | 0.1% |
| Oceania | 148 | 0.4% |
| Panama | 8 | 0.0% |
| Peru | 123 | 0.3% |
| Philippines | 563 | 1.4% |
| Poland | 5 | 0.0% |
| Russia | 20 | 0.1% |
| Singapore | 4 | 0.0% |
| South America | 359 | 0.9% |
| South Central Asia | 192 | 0.5% |
| South Eastern Asia | 6,520 | 16.6% |
| Southern Europe | 64 | 0.2% |
| Switzerland | 2 | 0.0% |
| Taiwan | 1,329 | 3.4% |
| Thailand | 142 | 0.4% |
| Ukraine | 13 | 0.0% |
| Venezuela | 5 | 0.0% |
| Vietnam | 4,604 | 11.7% |
| Western Africa | 37 | 0.1% |
| Western Asia | 39 | 0.1% |
| Western Europe | 127 | 0.3% | View All 70 Rows |
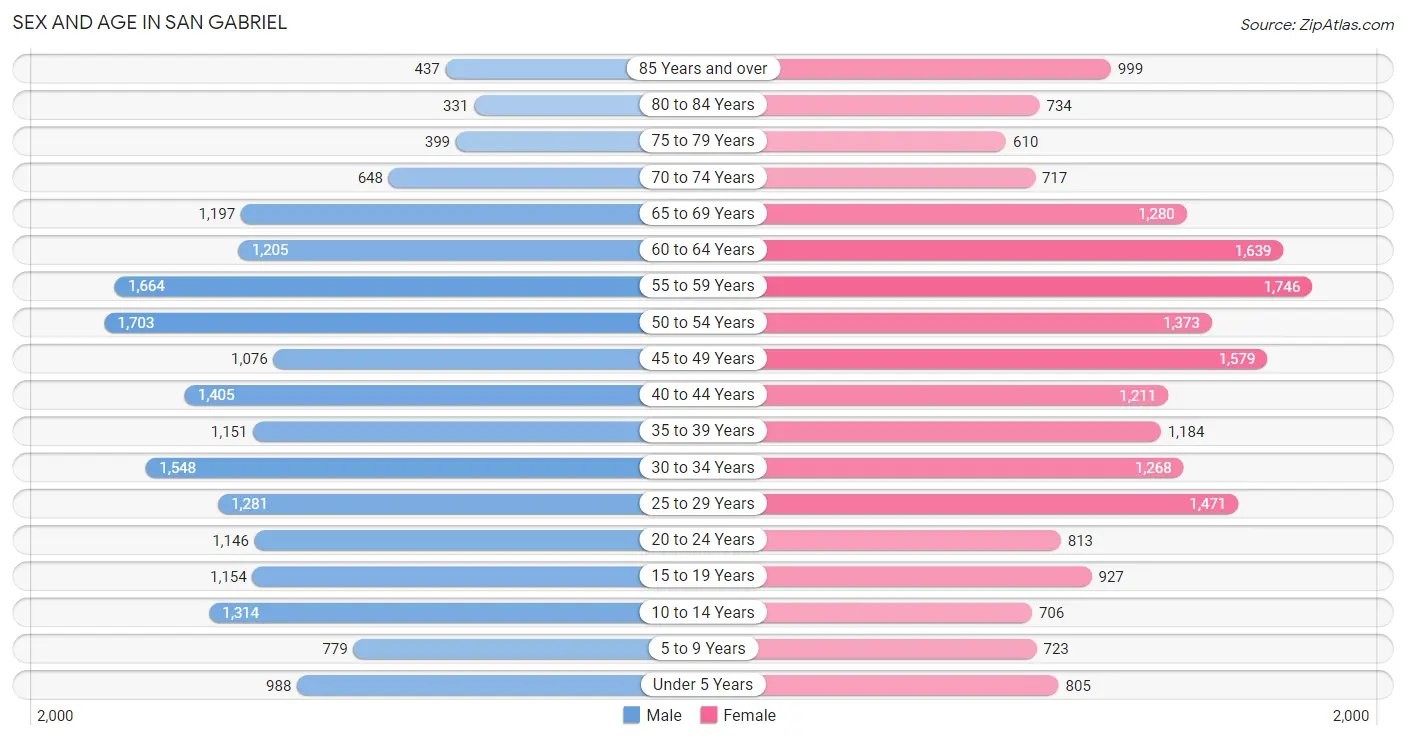
Sex and Age in San Gabriel
Sex and Age in San Gabriel
The most populous age groups in San Gabriel are 50 to 54 Years (1,703 | 8.8%) for men and 55 to 59 Years (1,746 | 8.8%) for women.
| Age Bracket | Male | Female |
| Under 5 Years | 988 (5.1%) | 805 (4.1%) |
| 5 to 9 Years | 779 (4.0%) | 723 (3.6%) |
| 10 to 14 Years | 1,314 (6.8%) | 706 (3.6%) |
| 15 to 19 Years | 1,154 (5.9%) | 927 (4.7%) |
| 20 to 24 Years | 1,146 (5.9%) | 813 (4.1%) |
| 25 to 29 Years | 1,281 (6.6%) | 1,471 (7.4%) |
| 30 to 34 Years | 1,548 (8.0%) | 1,268 (6.4%) |
| 35 to 39 Years | 1,151 (5.9%) | 1,184 (6.0%) |
| 40 to 44 Years | 1,405 (7.2%) | 1,211 (6.1%) |
| 45 to 49 Years | 1,076 (5.5%) | 1,579 (8.0%) |
| 50 to 54 Years | 1,703 (8.8%) | 1,373 (6.9%) |
| 55 to 59 Years | 1,664 (8.6%) | 1,746 (8.8%) |
| 60 to 64 Years | 1,205 (6.2%) | 1,639 (8.3%) |
| 65 to 69 Years | 1,197 (6.2%) | 1,280 (6.5%) |
| 70 to 74 Years | 648 (3.3%) | 717 (3.6%) |
| 75 to 79 Years | 399 (2.1%) | 610 (3.1%) |
| 80 to 84 Years | 331 (1.7%) | 734 (3.7%) |
| 85 Years and over | 437 (2.2%) | 999 (5.1%) |
| Total | 19,426 (100.0%) | 19,785 (100.0%) |
Families and Households in San Gabriel
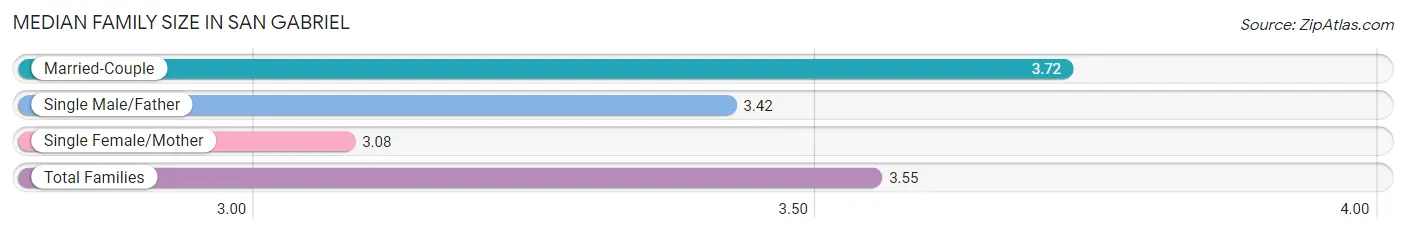
Median Family Size in San Gabriel
The median family size in San Gabriel is 3.55 persons per family, with married-couple families (6,210 | 67.6%) accounting for the largest median family size of 3.72 persons per family. On the other hand, single female/mother families (1,891 | 20.6%) represent the smallest median family size with 3.08 persons per family.
| Family Type | # Families | Family Size |
| Married-Couple | 6,210 (67.6%) | 3.72 |
| Single Male/Father | 1,082 (11.8%) | 3.42 |
| Single Female/Mother | 1,891 (20.6%) | 3.08 |
| Total Families | 9,183 (100.0%) | 3.55 |
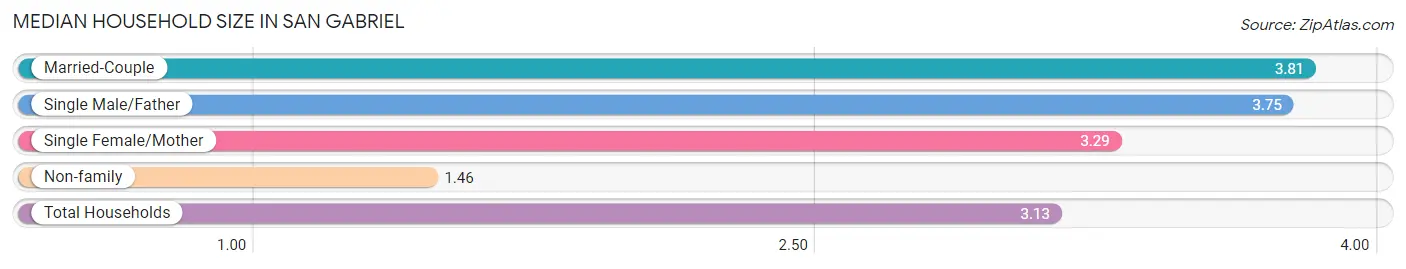
Median Household Size in San Gabriel
The median household size in San Gabriel is 3.13 persons per household, with married-couple households (6,210 | 50.4%) accounting for the largest median household size of 3.81 persons per household. non-family households (3,136 | 25.5%) represent the smallest median household size with 1.46 persons per household.
| Household Type | # Households | Household Size |
| Married-Couple | 6,210 (50.4%) | 3.81 |
| Single Male/Father | 1,082 (8.8%) | 3.75 |
| Single Female/Mother | 1,891 (15.3%) | 3.29 |
| Non-family | 3,136 (25.5%) | 1.46 |
| Total Households | 12,319 (100.0%) | 3.13 |
Household Size by Marriage Status in San Gabriel
Out of a total of 12,319 households in San Gabriel, 9,183 (74.5%) are family households, while 3,136 (25.5%) are nonfamily households. The most numerous type of family households are 2-person households, comprising 2,798, and the most common type of nonfamily households are 1-person households, comprising 2,209.
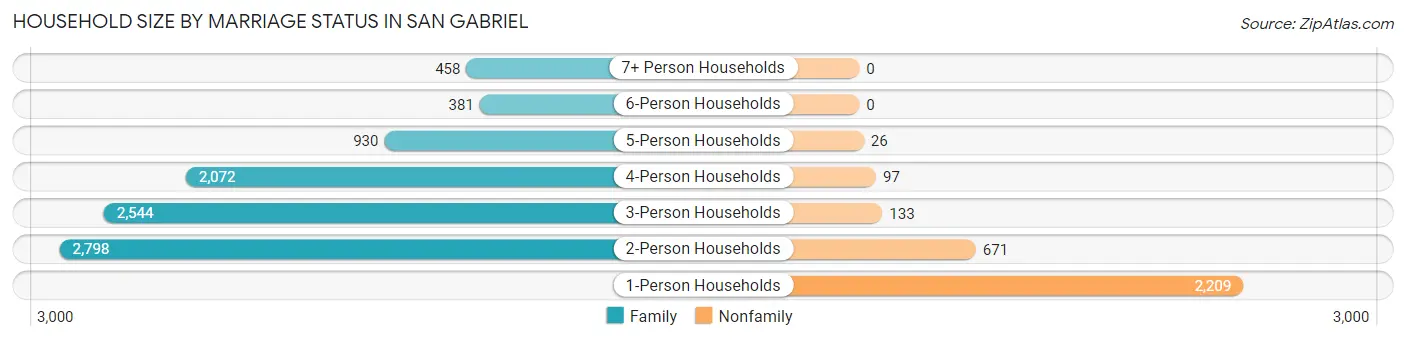
| Household Size | Family Households | Nonfamily Households |
| 1-Person Households | - | 2,209 (17.9%) |
| 2-Person Households | 2,798 (22.7%) | 671 (5.4%) |
| 3-Person Households | 2,544 (20.6%) | 133 (1.1%) |
| 4-Person Households | 2,072 (16.8%) | 97 (0.8%) |
| 5-Person Households | 930 (7.5%) | 26 (0.2%) |
| 6-Person Households | 381 (3.1%) | 0 (0.0%) |
| 7+ Person Households | 458 (3.7%) | 0 (0.0%) |
| Total | 9,183 (74.5%) | 3,136 (25.5%) |
Female Fertility in San Gabriel
Fertility by Age in San Gabriel
Average fertility rate in San Gabriel is 29.0 births per 1,000 women. Women in the age bracket of 20 to 34 years have the highest fertility rate with 56.0 births per 1,000 women. Women in the age bracket of 20 to 34 years acount for 78.3% of all women with births.
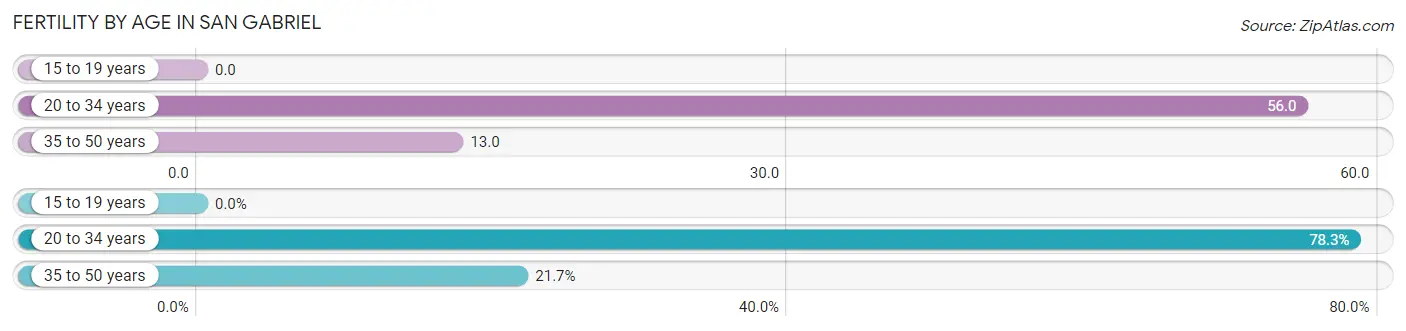
| Age Bracket | Women with Births | Births / 1,000 Women |
| 15 to 19 years | 0 (0.0%) | 0.0 |
| 20 to 34 years | 198 (78.3%) | 56.0 |
| 35 to 50 years | 55 (21.7%) | 13.0 |
| Total | 253 (100.0%) | 29.0 |
Fertility by Age by Marriage Status in San Gabriel
88.1% of women with births (253) in San Gabriel are married. The highest percentage of unmarried women with births falls into 35 to 50 years age bracket with 27.3% of them unmarried at the time of birth, while the lowest percentage of unmarried women with births belong to 20 to 34 years age bracket with 7.6% of them unmarried.
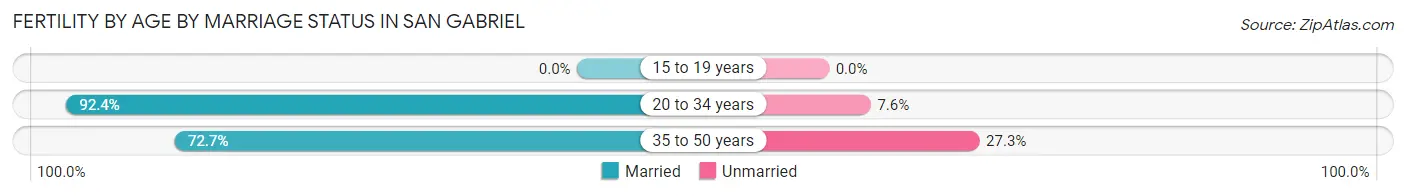
| Age Bracket | Married | Unmarried |
| 15 to 19 years | 0 (0.0%) | 0 (0.0%) |
| 20 to 34 years | 183 (92.4%) | 15 (7.6%) |
| 35 to 50 years | 40 (72.7%) | 15 (27.3%) |
| Total | 223 (88.1%) | 30 (11.9%) |
Fertility by Education in San Gabriel
Average fertility rate in San Gabriel is 29.0 births per 1,000 women. Women with the education attainment of less than high school have the highest fertility rate of 40.0 births per 1,000 women, while women with the education attainment of graduate degree have the lowest fertility at 17.0 births per 1,000 women. Women with the education attainment of bachelor's degree represent 31.6% of all women with births.
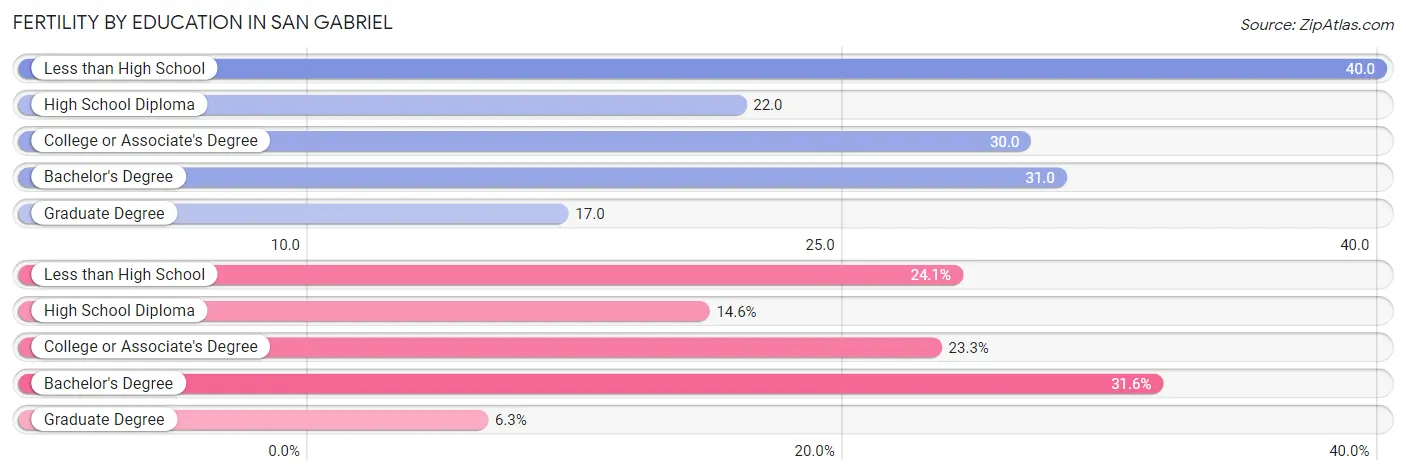
| Educational Attainment | Women with Births | Births / 1,000 Women |
| Less than High School | 61 (24.1%) | 40.0 |
| High School Diploma | 37 (14.6%) | 22.0 |
| College or Associate's Degree | 59 (23.3%) | 30.0 |
| Bachelor's Degree | 80 (31.6%) | 31.0 |
| Graduate Degree | 16 (6.3%) | 17.0 |
| Total | 253 (100.0%) | 29.0 |
Fertility by Education by Marriage Status in San Gabriel
11.9% of women with births in San Gabriel are unmarried. Women with the educational attainment of less than high school are most likely to be married with 100.0% of them married at childbirth, while women with the educational attainment of college or associate's degree are least likely to be married with 25.4% of them unmarried at childbirth.
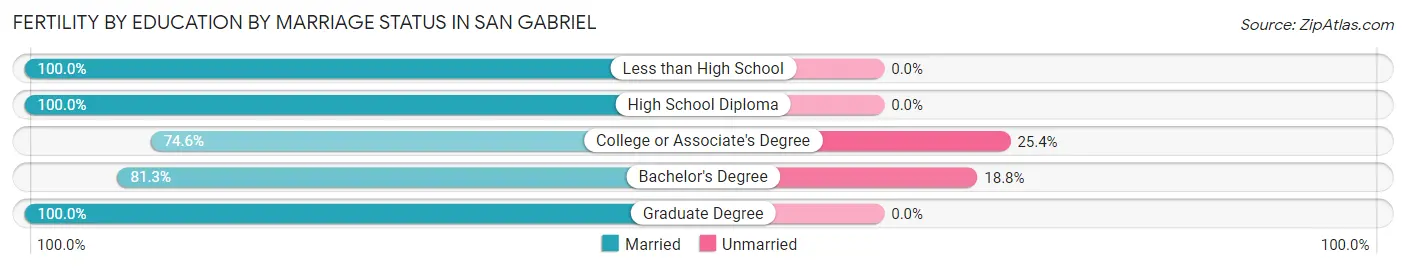
| Educational Attainment | Married | Unmarried |
| Less than High School | 61 (100.0%) | 0 (0.0%) |
| High School Diploma | 37 (100.0%) | 0 (0.0%) |
| College or Associate's Degree | 44 (74.6%) | 15 (25.4%) |
| Bachelor's Degree | 65 (81.2%) | 15 (18.8%) |
| Graduate Degree | 16 (100.0%) | 0 (0.0%) |
| Total | 223 (88.1%) | 30 (11.9%) |
Employment Characteristics in San Gabriel
Employment by Class of Employer in San Gabriel
Among the 18,800 employed individuals in San Gabriel, private company employees (12,768 | 67.9%), local government employees (1,846 | 9.8%), and self-employed (not incorporated) (1,388 | 7.4%) make up the most common classes of employment.
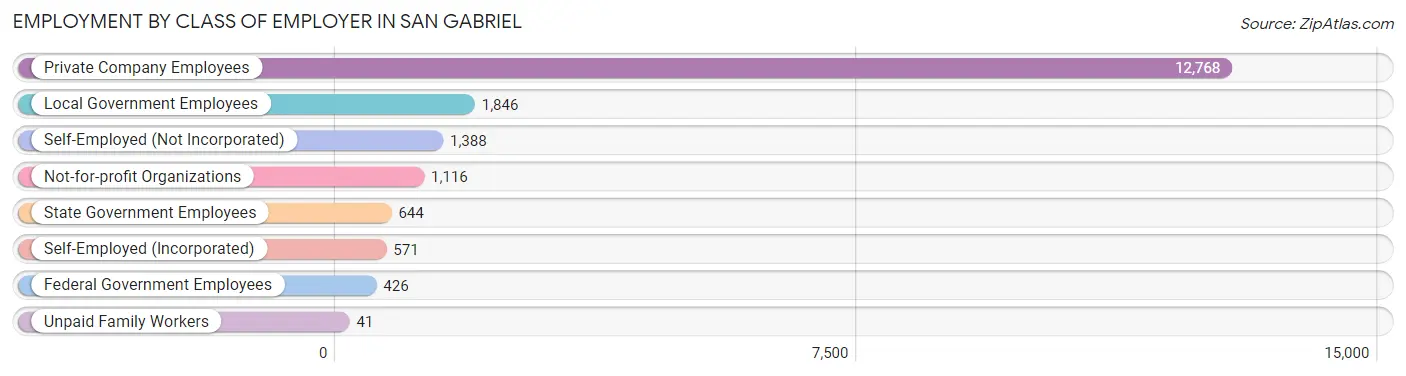
| Employer Class | # Employees | % Employees |
| Private Company Employees | 12,768 | 67.9% |
| Self-Employed (Incorporated) | 571 | 3.0% |
| Self-Employed (Not Incorporated) | 1,388 | 7.4% |
| Not-for-profit Organizations | 1,116 | 5.9% |
| Local Government Employees | 1,846 | 9.8% |
| State Government Employees | 644 | 3.4% |
| Federal Government Employees | 426 | 2.3% |
| Unpaid Family Workers | 41 | 0.2% |
| Total | 18,800 | 100.0% |
Employment Status by Age in San Gabriel
According to the labor force statistics for San Gabriel, out of the total population over 16 years of age (33,429), 62.0% or 20,726 individuals are in the labor force, with 6.8% or 1,409 of them unemployed. The age group with the highest labor force participation rate is 30 to 34 years, with 87.0% or 2,450 individuals in the labor force. Within the labor force, the 60 to 64 years age range has the highest percentage of unemployed individuals, with 10.5% or 215 of them being unemployed.
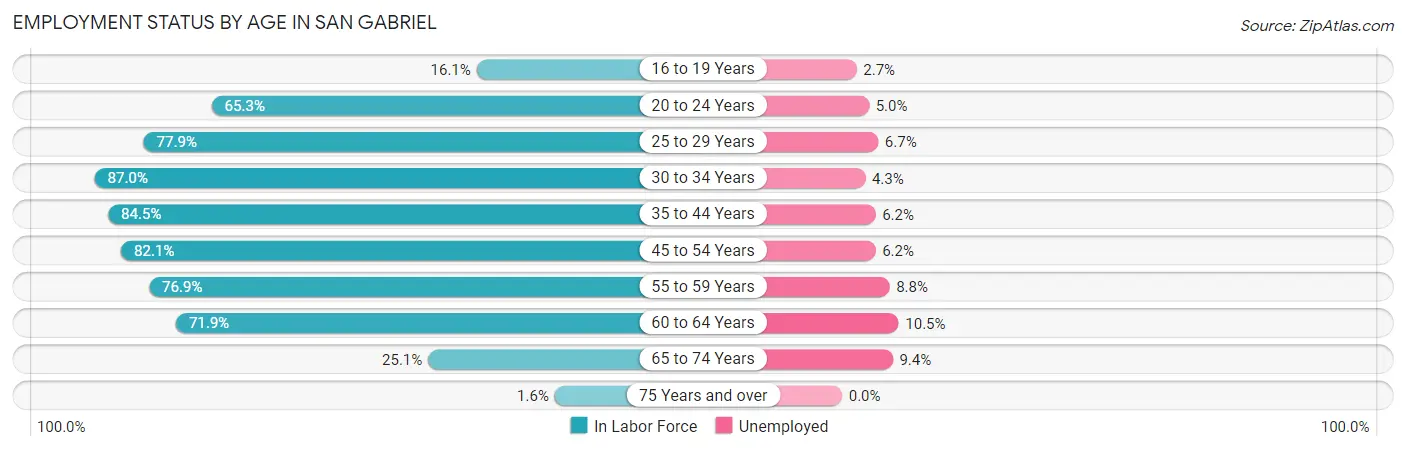
| Age Bracket | In Labor Force | Unemployed |
| 16 to 19 Years | 260 (16.1%) | 7 (2.7%) |
| 20 to 24 Years | 1,279 (65.3%) | 64 (5.0%) |
| 25 to 29 Years | 2,144 (77.9%) | 144 (6.7%) |
| 30 to 34 Years | 2,450 (87.0%) | 105 (4.3%) |
| 35 to 44 Years | 4,184 (84.5%) | 259 (6.2%) |
| 45 to 54 Years | 4,705 (82.1%) | 292 (6.2%) |
| 55 to 59 Years | 2,622 (76.9%) | 231 (8.8%) |
| 60 to 64 Years | 2,045 (71.9%) | 215 (10.5%) |
| 65 to 74 Years | 964 (25.1%) | 91 (9.4%) |
| 75 Years and over | 56 (1.6%) | 0 (0.0%) |
| Total | 20,726 (62.0%) | 1,409 (6.8%) |
Employment Status by Educational Attainment in San Gabriel
According to labor force statistics for San Gabriel, 80.6% of individuals (18,138) out of the total population between 25 and 64 years of age (22,504) are in the labor force, with 6.8% or 1,233 of them being unemployed. The group with the highest labor force participation rate are those with the educational attainment of bachelor's degree or higher, with 85.6% or 7,215 individuals in the labor force. Within the labor force, individuals with college / associate degree education have the highest percentage of unemployment, with 9.3% or 353 of them being unemployed.
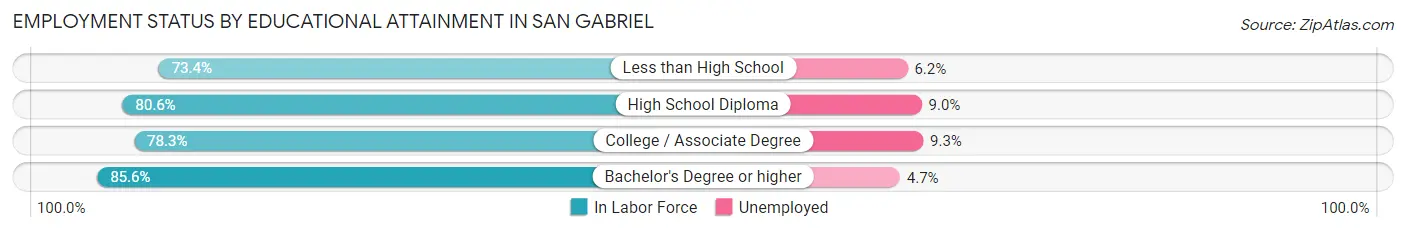
| Educational Attainment | In Labor Force | Unemployed |
| Less than High School | 3,088 (73.4%) | 261 (6.2%) |
| High School Diploma | 4,048 (80.6%) | 452 (9.0%) |
| College / Associate Degree | 3,794 (78.3%) | 451 (9.3%) |
| Bachelor's Degree or higher | 7,215 (85.6%) | 396 (4.7%) |
| Total | 18,138 (80.6%) | 1,530 (6.8%) |
Employment Occupations by Sex in San Gabriel
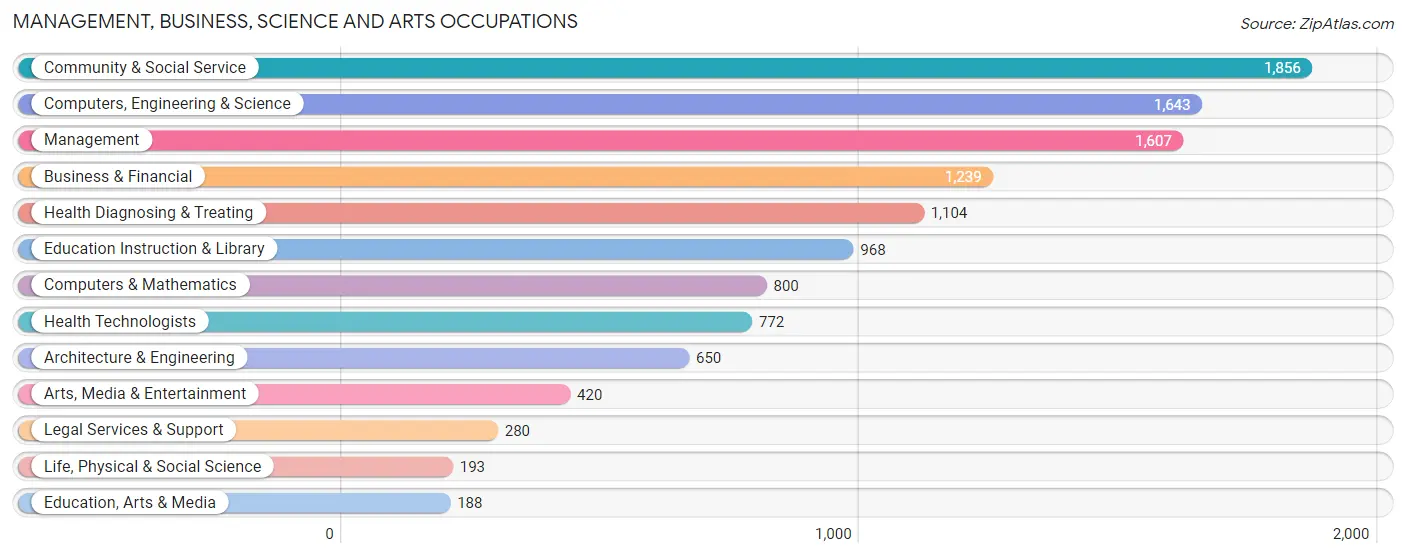
Management, Business, Science and Arts Occupations
The most common Management, Business, Science and Arts occupations in San Gabriel are Community & Social Service (1,856 | 9.6%), Computers, Engineering & Science (1,643 | 8.5%), Management (1,607 | 8.3%), Business & Financial (1,239 | 6.4%), and Health Diagnosing & Treating (1,104 | 5.7%).
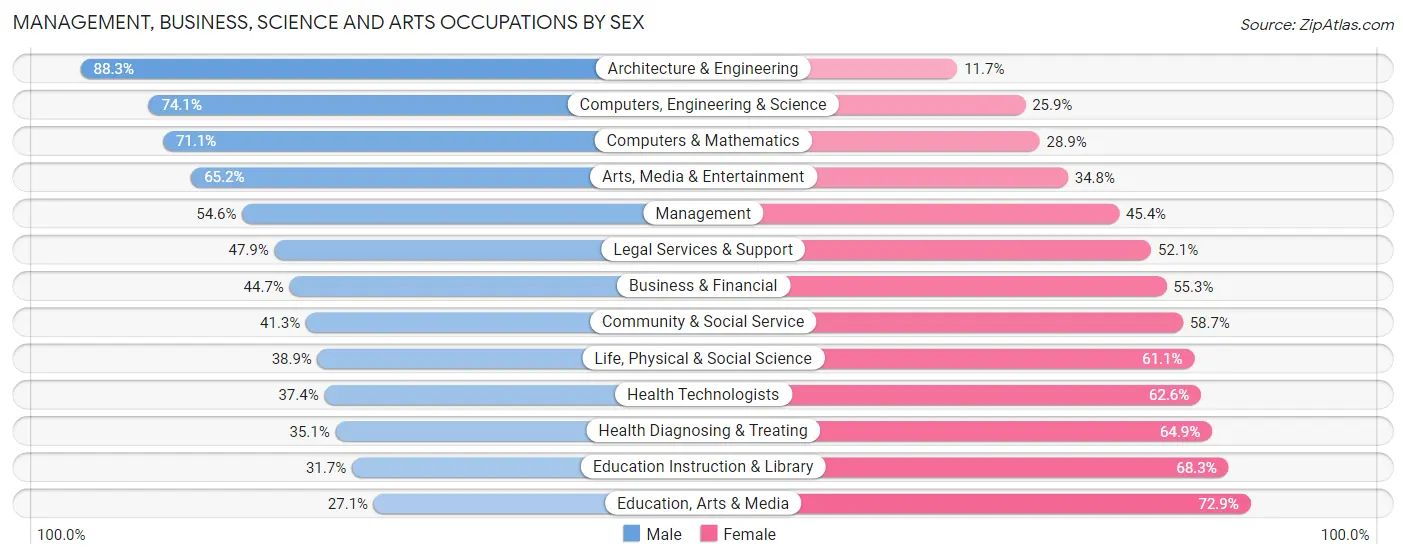
Management, Business, Science and Arts Occupations by Sex
Within the Management, Business, Science and Arts occupations in San Gabriel, the most male-oriented occupations are Architecture & Engineering (88.3%), Computers, Engineering & Science (74.1%), and Computers & Mathematics (71.1%), while the most female-oriented occupations are Education, Arts & Media (72.9%), Education Instruction & Library (68.3%), and Health Diagnosing & Treating (64.9%).
| Occupation | Male | Female |
| Management | 877 (54.6%) | 730 (45.4%) |
| Business & Financial | 554 (44.7%) | 685 (55.3%) |
| Computers, Engineering & Science | 1,218 (74.1%) | 425 (25.9%) |
| Computers & Mathematics | 569 (71.1%) | 231 (28.9%) |
| Architecture & Engineering | 574 (88.3%) | 76 (11.7%) |
| Life, Physical & Social Science | 75 (38.9%) | 118 (61.1%) |
| Community & Social Service | 766 (41.3%) | 1,090 (58.7%) |
| Education, Arts & Media | 51 (27.1%) | 137 (72.9%) |
| Legal Services & Support | 134 (47.9%) | 146 (52.1%) |
| Education Instruction & Library | 307 (31.7%) | 661 (68.3%) |
| Arts, Media & Entertainment | 274 (65.2%) | 146 (34.8%) |
| Health Diagnosing & Treating | 388 (35.1%) | 716 (64.9%) |
| Health Technologists | 289 (37.4%) | 483 (62.6%) |
| Total (Category) | 3,803 (51.0%) | 3,646 (48.9%) |
| Total (Overall) | 10,252 (53.1%) | 9,056 (46.9%) |
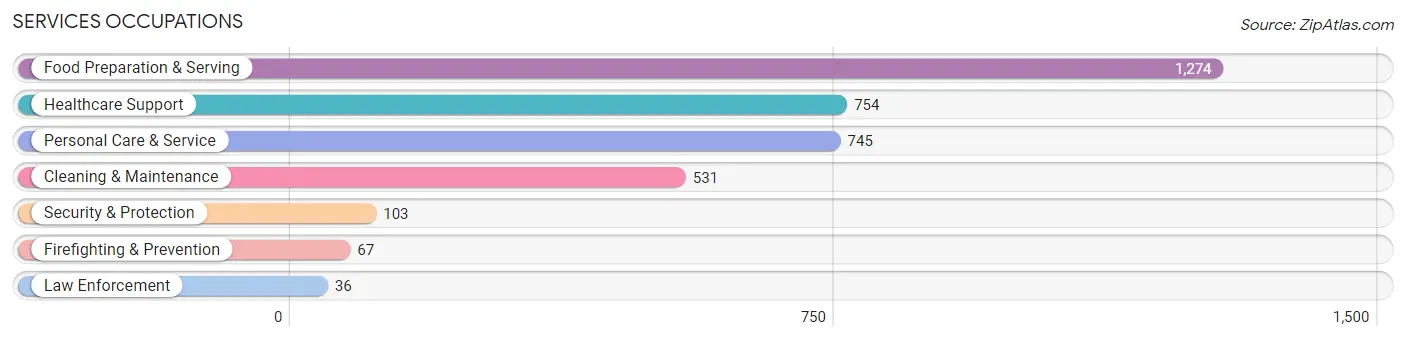
Services Occupations
The most common Services occupations in San Gabriel are Food Preparation & Serving (1,274 | 6.6%), Healthcare Support (754 | 3.9%), Personal Care & Service (745 | 3.9%), Cleaning & Maintenance (531 | 2.8%), and Security & Protection (103 | 0.5%).
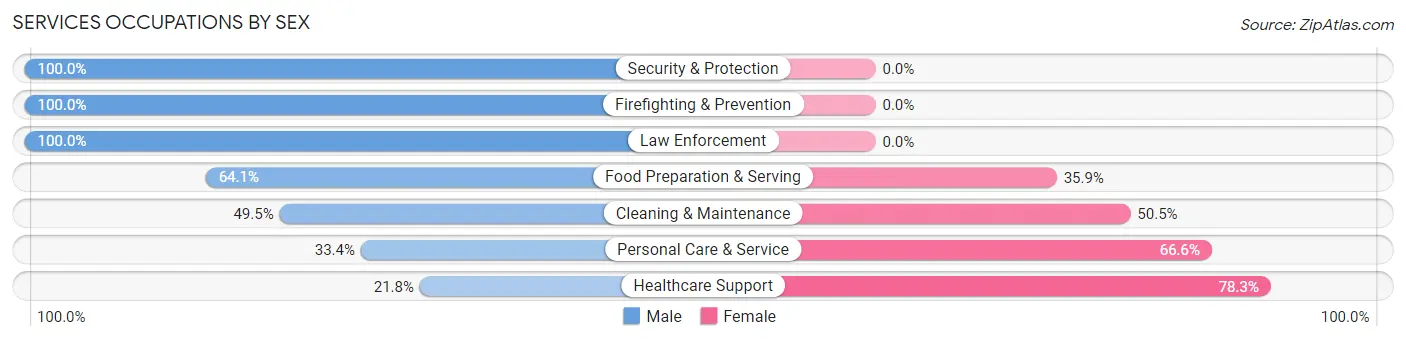
Services Occupations by Sex
Within the Services occupations in San Gabriel, the most male-oriented occupations are Security & Protection (100.0%), Firefighting & Prevention (100.0%), and Law Enforcement (100.0%), while the most female-oriented occupations are Healthcare Support (78.2%), Personal Care & Service (66.6%), and Cleaning & Maintenance (50.5%).
| Occupation | Male | Female |
| Healthcare Support | 164 (21.7%) | 590 (78.2%) |
| Security & Protection | 103 (100.0%) | 0 (0.0%) |
| Firefighting & Prevention | 67 (100.0%) | 0 (0.0%) |
| Law Enforcement | 36 (100.0%) | 0 (0.0%) |
| Food Preparation & Serving | 817 (64.1%) | 457 (35.9%) |
| Cleaning & Maintenance | 263 (49.5%) | 268 (50.5%) |
| Personal Care & Service | 249 (33.4%) | 496 (66.6%) |
| Total (Category) | 1,596 (46.8%) | 1,811 (53.2%) |
| Total (Overall) | 10,252 (53.1%) | 9,056 (46.9%) |
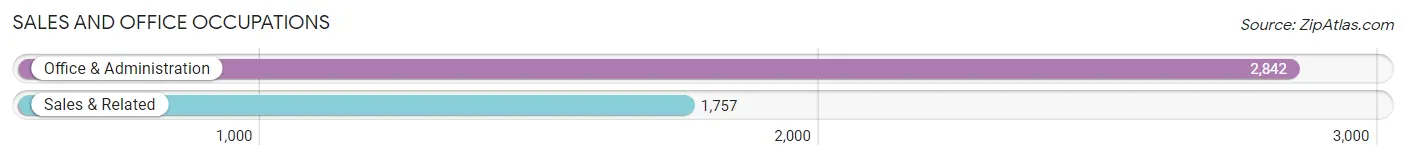
Sales and Office Occupations
The most common Sales and Office occupations in San Gabriel are Office & Administration (2,842 | 14.7%), and Sales & Related (1,757 | 9.1%).
Sales and Office Occupations by Sex
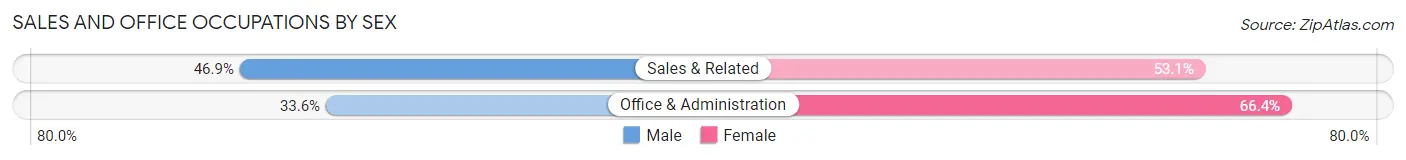
| Occupation | Male | Female |
| Sales & Related | 824 (46.9%) | 933 (53.1%) |
| Office & Administration | 956 (33.6%) | 1,886 (66.4%) |
| Total (Category) | 1,780 (38.7%) | 2,819 (61.3%) |
| Total (Overall) | 10,252 (53.1%) | 9,056 (46.9%) |
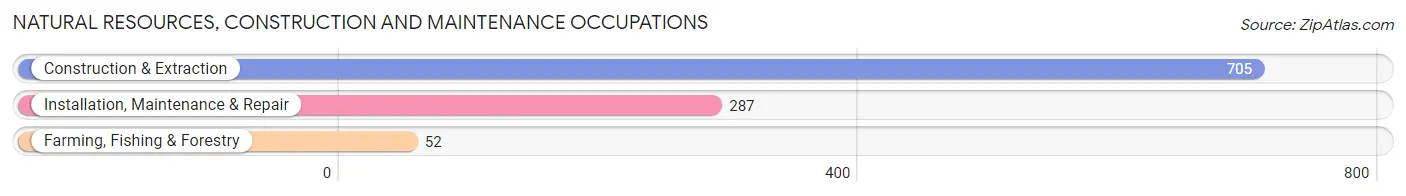
Natural Resources, Construction and Maintenance Occupations
The most common Natural Resources, Construction and Maintenance occupations in San Gabriel are Construction & Extraction (705 | 3.6%), Installation, Maintenance & Repair (287 | 1.5%), and Farming, Fishing & Forestry (52 | 0.3%).
Natural Resources, Construction and Maintenance Occupations by Sex
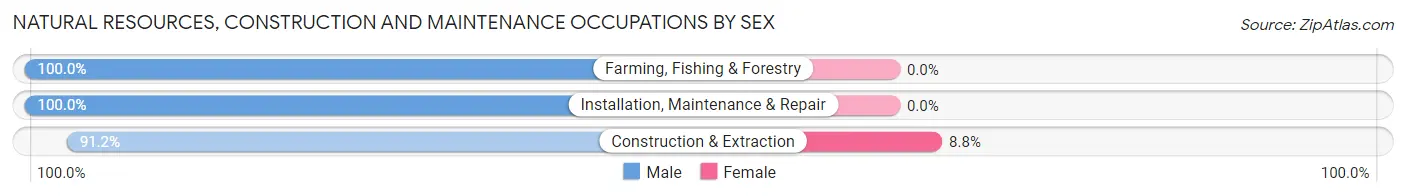
| Occupation | Male | Female |
| Farming, Fishing & Forestry | 52 (100.0%) | 0 (0.0%) |
| Construction & Extraction | 643 (91.2%) | 62 (8.8%) |
| Installation, Maintenance & Repair | 287 (100.0%) | 0 (0.0%) |
| Total (Category) | 982 (94.1%) | 62 (5.9%) |
| Total (Overall) | 10,252 (53.1%) | 9,056 (46.9%) |
Production, Transportation and Moving Occupations
The most common Production, Transportation and Moving occupations in San Gabriel are Transportation (1,150 | 6.0%), Production (1,098 | 5.7%), and Material Moving (561 | 2.9%).
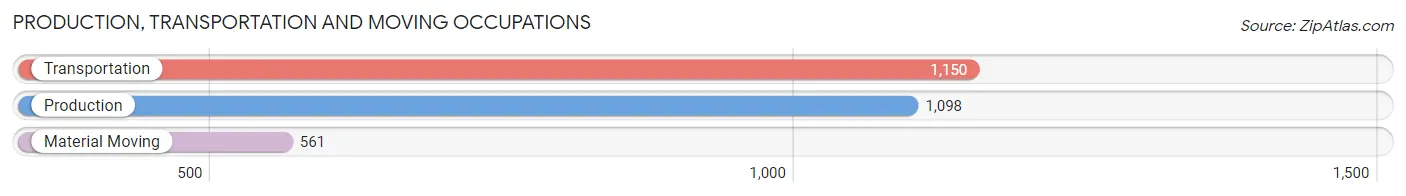
Production, Transportation and Moving Occupations by Sex
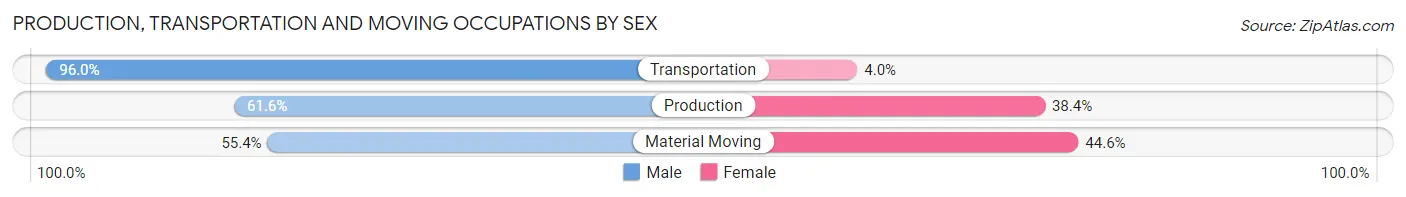
| Occupation | Male | Female |
| Production | 676 (61.6%) | 422 (38.4%) |
| Transportation | 1,104 (96.0%) | 46 (4.0%) |
| Material Moving | 311 (55.4%) | 250 (44.6%) |
| Total (Category) | 2,091 (74.4%) | 718 (25.6%) |
| Total (Overall) | 10,252 (53.1%) | 9,056 (46.9%) |
Employment Industries by Sex in San Gabriel
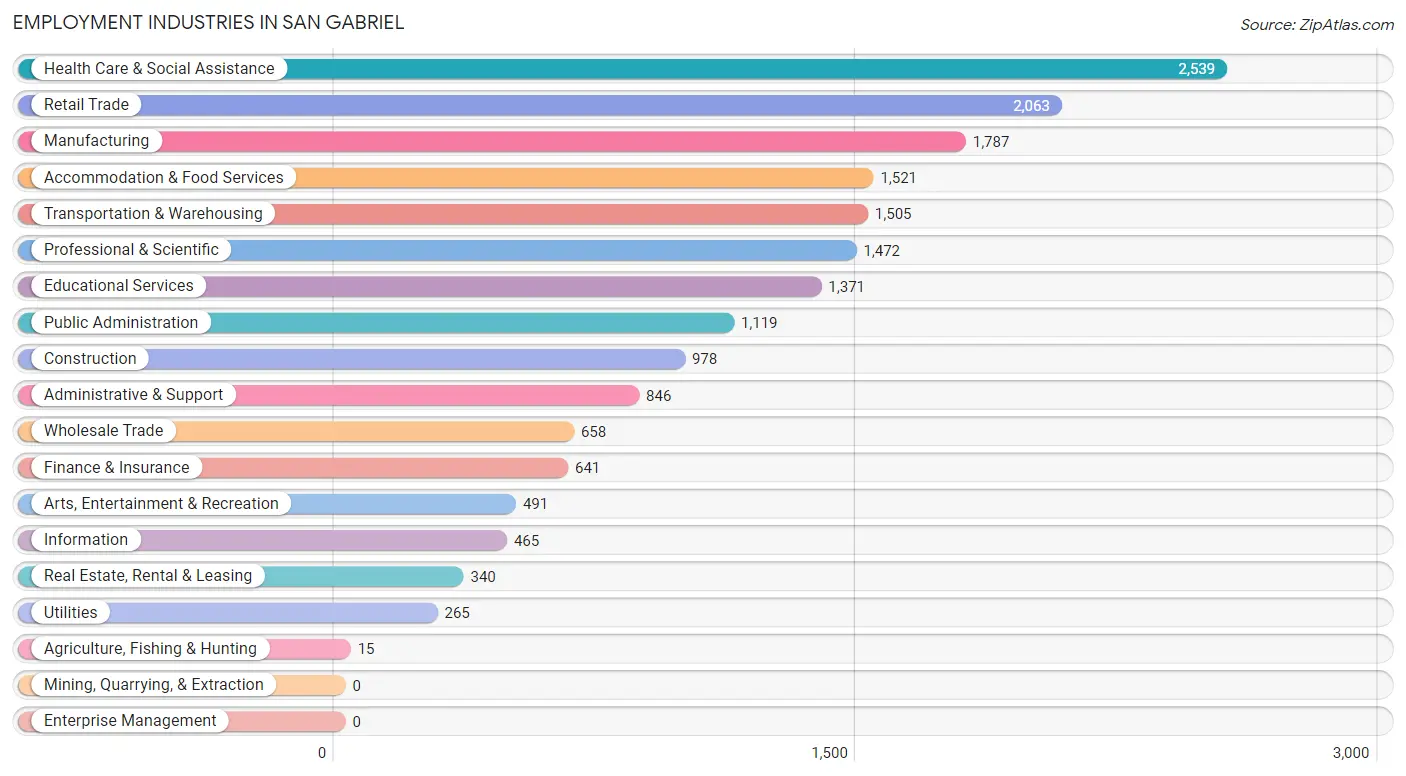
Employment Industries in San Gabriel
The major employment industries in San Gabriel include Health Care & Social Assistance (2,539 | 13.2%), Retail Trade (2,063 | 10.7%), Manufacturing (1,787 | 9.3%), Accommodation & Food Services (1,521 | 7.9%), and Transportation & Warehousing (1,505 | 7.8%).
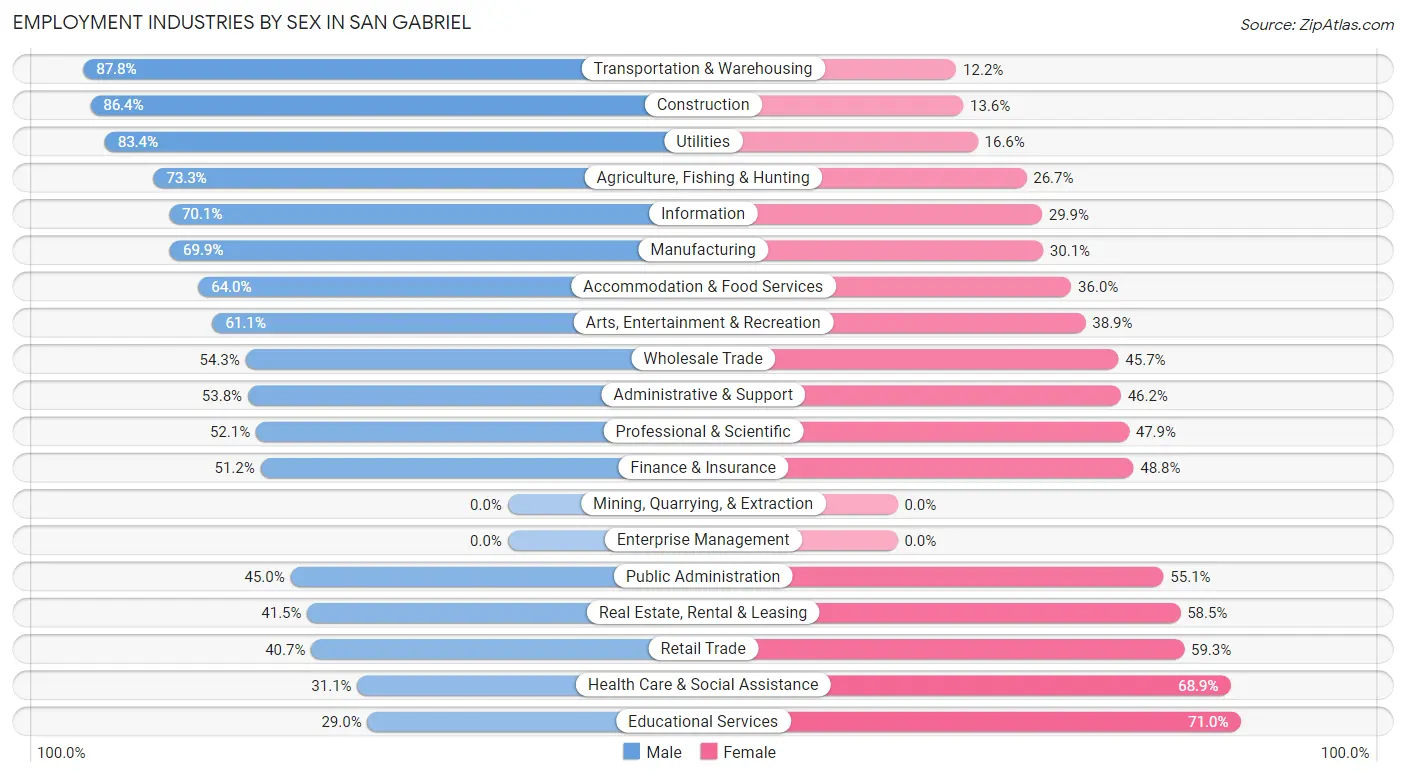
Employment Industries by Sex in San Gabriel
The San Gabriel industries that see more men than women are Transportation & Warehousing (87.8%), Construction (86.4%), and Utilities (83.4%), whereas the industries that tend to have a higher number of women are Educational Services (71.0%), Health Care & Social Assistance (68.9%), and Retail Trade (59.3%).
| Industry | Male | Female |
| Agriculture, Fishing & Hunting | 11 (73.3%) | 4 (26.7%) |
| Mining, Quarrying, & Extraction | 0 (0.0%) | 0 (0.0%) |
| Construction | 845 (86.4%) | 133 (13.6%) |
| Manufacturing | 1,249 (69.9%) | 538 (30.1%) |
| Wholesale Trade | 357 (54.3%) | 301 (45.7%) |
| Retail Trade | 839 (40.7%) | 1,224 (59.3%) |
| Transportation & Warehousing | 1,322 (87.8%) | 183 (12.2%) |
| Utilities | 221 (83.4%) | 44 (16.6%) |
| Information | 326 (70.1%) | 139 (29.9%) |
| Finance & Insurance | 328 (51.2%) | 313 (48.8%) |
| Real Estate, Rental & Leasing | 141 (41.5%) | 199 (58.5%) |
| Professional & Scientific | 767 (52.1%) | 705 (47.9%) |
| Enterprise Management | 0 (0.0%) | 0 (0.0%) |
| Administrative & Support | 455 (53.8%) | 391 (46.2%) |
| Educational Services | 398 (29.0%) | 973 (71.0%) |
| Health Care & Social Assistance | 790 (31.1%) | 1,749 (68.9%) |
| Arts, Entertainment & Recreation | 300 (61.1%) | 191 (38.9%) |
| Accommodation & Food Services | 974 (64.0%) | 547 (36.0%) |
| Public Administration | 503 (45.0%) | 616 (55.0%) |
| Total | 10,252 (53.1%) | 9,056 (46.9%) |
Education in San Gabriel
School Enrollment in San Gabriel
The most common levels of schooling among the 8,510 students in San Gabriel are college / undergraduate (2,252 | 26.5%), high school (1,865 | 21.9%), and elementary school (1,349 | 15.9%).
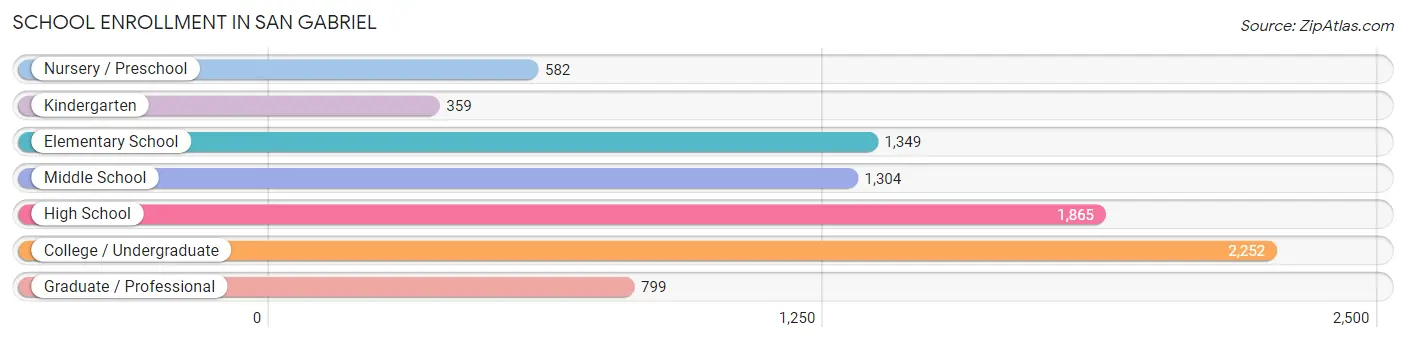
| School Level | # Students | % Students |
| Nursery / Preschool | 582 | 6.8% |
| Kindergarten | 359 | 4.2% |
| Elementary School | 1,349 | 15.9% |
| Middle School | 1,304 | 15.3% |
| High School | 1,865 | 21.9% |
| College / Undergraduate | 2,252 | 26.5% |
| Graduate / Professional | 799 | 9.4% |
| Total | 8,510 | 100.0% |
School Enrollment by Age by Funding Source in San Gabriel
Out of a total of 8,510 students who are enrolled in schools in San Gabriel, 1,098 (12.9%) attend a private institution, while the remaining 7,412 (87.1%) are enrolled in public schools. The age group of 3 to 4 year olds has the highest likelihood of being enrolled in private schools, with 297 (55.9% in the age bracket) enrolled. Conversely, the age group of 18 to 19 year olds has the lowest likelihood of being enrolled in a private school, with 592 (98.3% in the age bracket) attending a public institution.
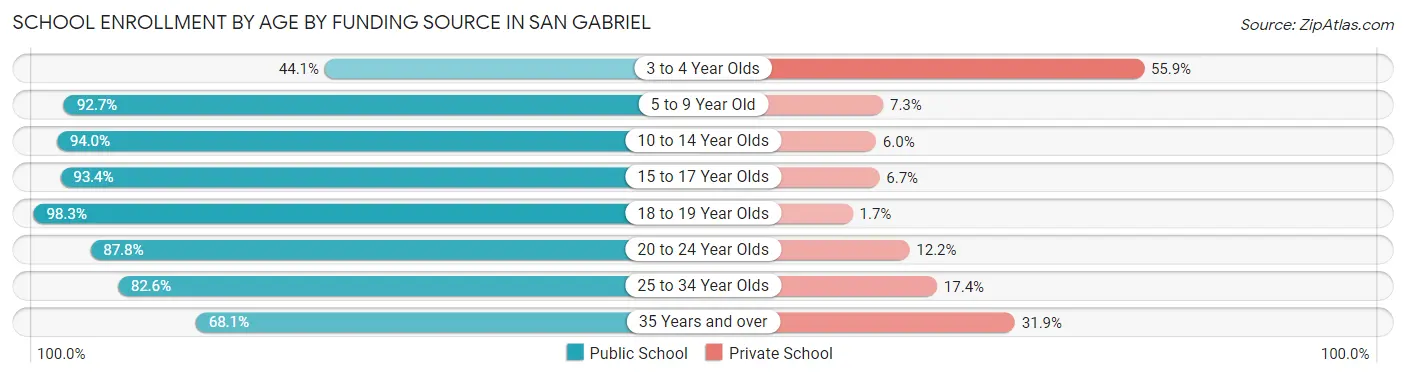
| Age Bracket | Public School | Private School |
| 3 to 4 Year Olds | 234 (44.1%) | 297 (55.9%) |
| 5 to 9 Year Old | 1,379 (92.7%) | 109 (7.3%) |
| 10 to 14 Year Olds | 1,834 (94.0%) | 117 (6.0%) |
| 15 to 17 Year Olds | 1,291 (93.3%) | 92 (6.7%) |
| 18 to 19 Year Olds | 592 (98.3%) | 10 (1.7%) |
| 20 to 24 Year Olds | 946 (87.8%) | 132 (12.2%) |
| 25 to 34 Year Olds | 723 (82.6%) | 152 (17.4%) |
| 35 Years and over | 410 (68.1%) | 192 (31.9%) |
| Total | 7,412 (87.1%) | 1,098 (12.9%) |
Educational Attainment by Field of Study in San Gabriel
Business (2,455 | 22.7%), social sciences (1,157 | 10.7%), engineering (970 | 8.9%), visual & performing arts (926 | 8.6%), and computers & mathematics (903 | 8.3%) are the most common fields of study among 10,833 individuals in San Gabriel who have obtained a bachelor's degree or higher.
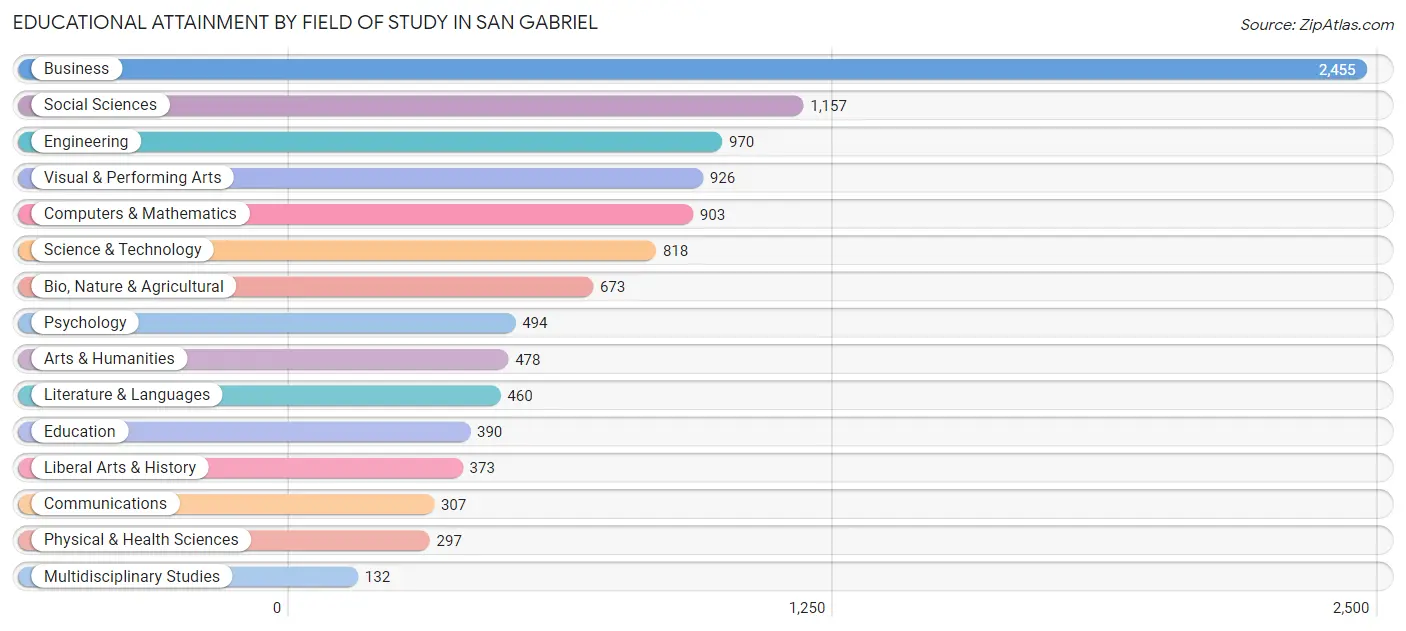
| Field of Study | # Graduates | % Graduates |
| Computers & Mathematics | 903 | 8.3% |
| Bio, Nature & Agricultural | 673 | 6.2% |
| Physical & Health Sciences | 297 | 2.7% |
| Psychology | 494 | 4.6% |
| Social Sciences | 1,157 | 10.7% |
| Engineering | 970 | 8.9% |
| Multidisciplinary Studies | 132 | 1.2% |
| Science & Technology | 818 | 7.5% |
| Business | 2,455 | 22.7% |
| Education | 390 | 3.6% |
| Literature & Languages | 460 | 4.3% |
| Liberal Arts & History | 373 | 3.4% |
| Visual & Performing Arts | 926 | 8.6% |
| Communications | 307 | 2.8% |
| Arts & Humanities | 478 | 4.4% |
| Total | 10,833 | 100.0% |
Transportation & Commute in San Gabriel
Vehicle Availability by Sex in San Gabriel
The most prevalent vehicle ownership categories in San Gabriel are males with 2 vehicles (3,505, accounting for 35.4%) and females with 2 vehicles (2,831, making up 39.4%).
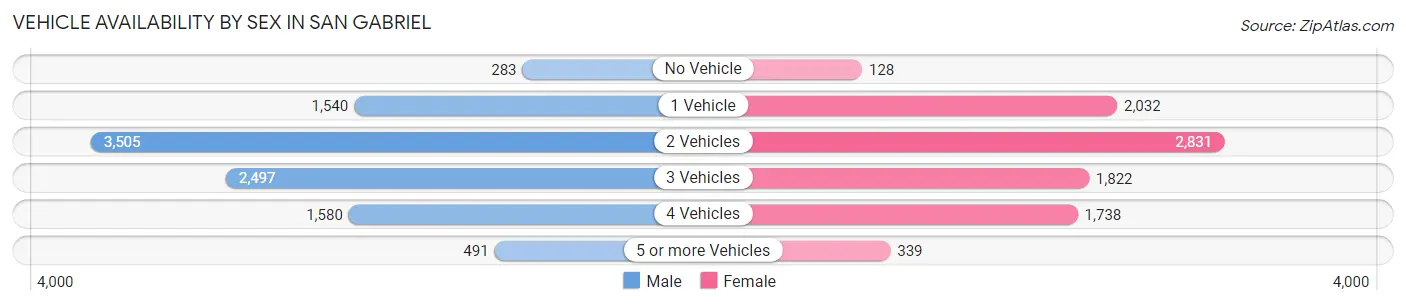
| Vehicles Available | Male | Female |
| No Vehicle | 283 (2.9%) | 128 (1.4%) |
| 1 Vehicle | 1,540 (15.6%) | 2,032 (22.9%) |
| 2 Vehicles | 3,505 (35.4%) | 2,831 (31.8%) |
| 3 Vehicles | 2,497 (25.2%) | 1,822 (20.5%) |
| 4 Vehicles | 1,580 (16.0%) | 1,738 (19.6%) |
| 5 or more Vehicles | 491 (5.0%) | 339 (3.8%) |
| Total | 9,896 (100.0%) | 8,890 (100.0%) |
Commute Time in San Gabriel
The most frequently occuring commute durations in San Gabriel are 30 to 34 minutes (3,277 commuters, 19.6%), 15 to 19 minutes (2,304 commuters, 13.8%), and 20 to 24 minutes (2,267 commuters, 13.5%).
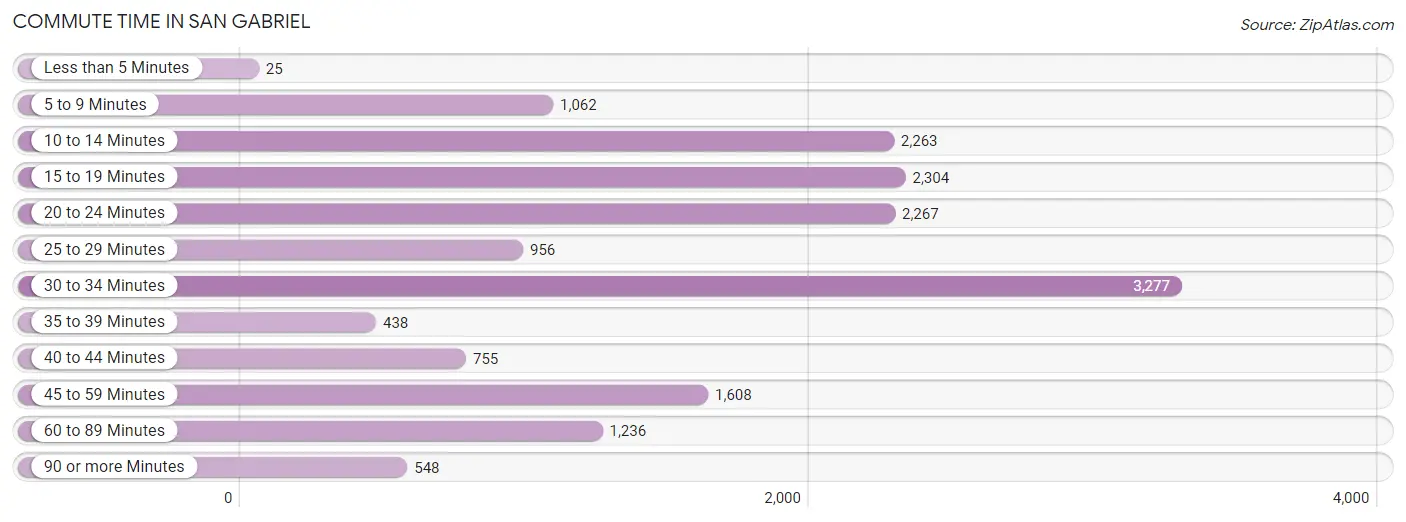
| Commute Time | # Commuters | % Commuters |
| Less than 5 Minutes | 25 | 0.2% |
| 5 to 9 Minutes | 1,062 | 6.3% |
| 10 to 14 Minutes | 2,263 | 13.5% |
| 15 to 19 Minutes | 2,304 | 13.8% |
| 20 to 24 Minutes | 2,267 | 13.5% |
| 25 to 29 Minutes | 956 | 5.7% |
| 30 to 34 Minutes | 3,277 | 19.6% |
| 35 to 39 Minutes | 438 | 2.6% |
| 40 to 44 Minutes | 755 | 4.5% |
| 45 to 59 Minutes | 1,608 | 9.6% |
| 60 to 89 Minutes | 1,236 | 7.4% |
| 90 or more Minutes | 548 | 3.3% |
Commute Time by Sex in San Gabriel
The most common commute times in San Gabriel are 30 to 34 minutes (1,837 commuters, 20.8%) for males and 30 to 34 minutes (1,440 commuters, 18.2%) for females.
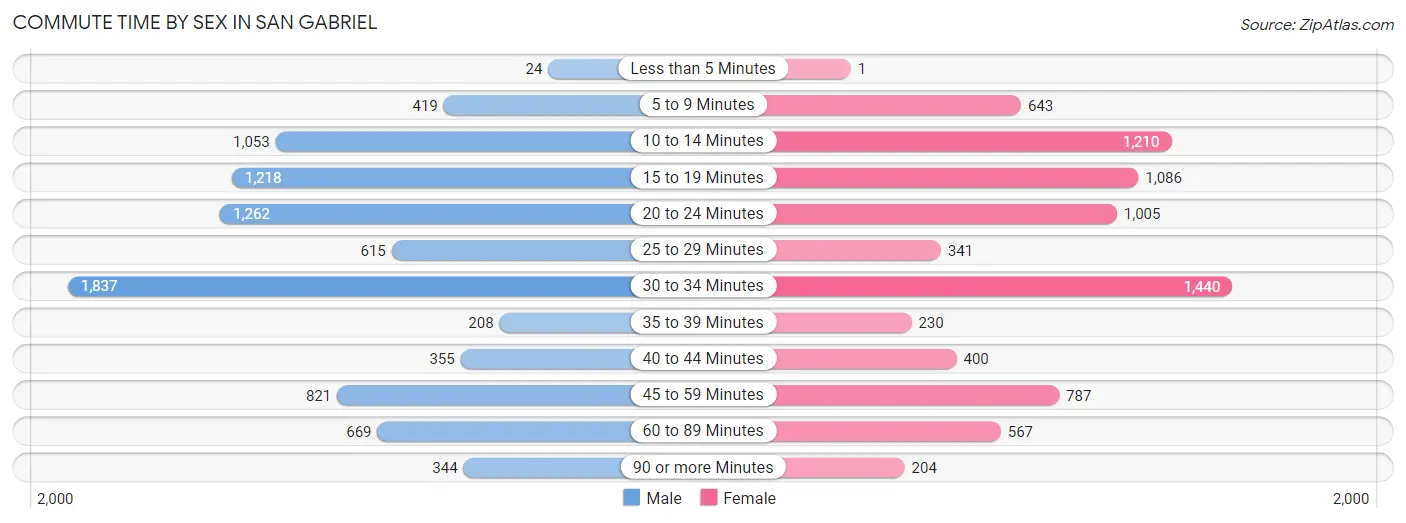
| Commute Time | Male | Female |
| Less than 5 Minutes | 24 (0.3%) | 1 (0.0%) |
| 5 to 9 Minutes | 419 (4.8%) | 643 (8.1%) |
| 10 to 14 Minutes | 1,053 (11.9%) | 1,210 (15.3%) |
| 15 to 19 Minutes | 1,218 (13.8%) | 1,086 (13.7%) |
| 20 to 24 Minutes | 1,262 (14.3%) | 1,005 (12.7%) |
| 25 to 29 Minutes | 615 (7.0%) | 341 (4.3%) |
| 30 to 34 Minutes | 1,837 (20.8%) | 1,440 (18.2%) |
| 35 to 39 Minutes | 208 (2.4%) | 230 (2.9%) |
| 40 to 44 Minutes | 355 (4.0%) | 400 (5.1%) |
| 45 to 59 Minutes | 821 (9.3%) | 787 (9.9%) |
| 60 to 89 Minutes | 669 (7.6%) | 567 (7.2%) |
| 90 or more Minutes | 344 (3.9%) | 204 (2.6%) |
Time of Departure to Work by Sex in San Gabriel
The most frequent times of departure to work in San Gabriel are 8:00 AM to 8:29 AM (1,789, 20.3%) for males and 8:00 AM to 8:29 AM (1,775, 22.4%) for females.
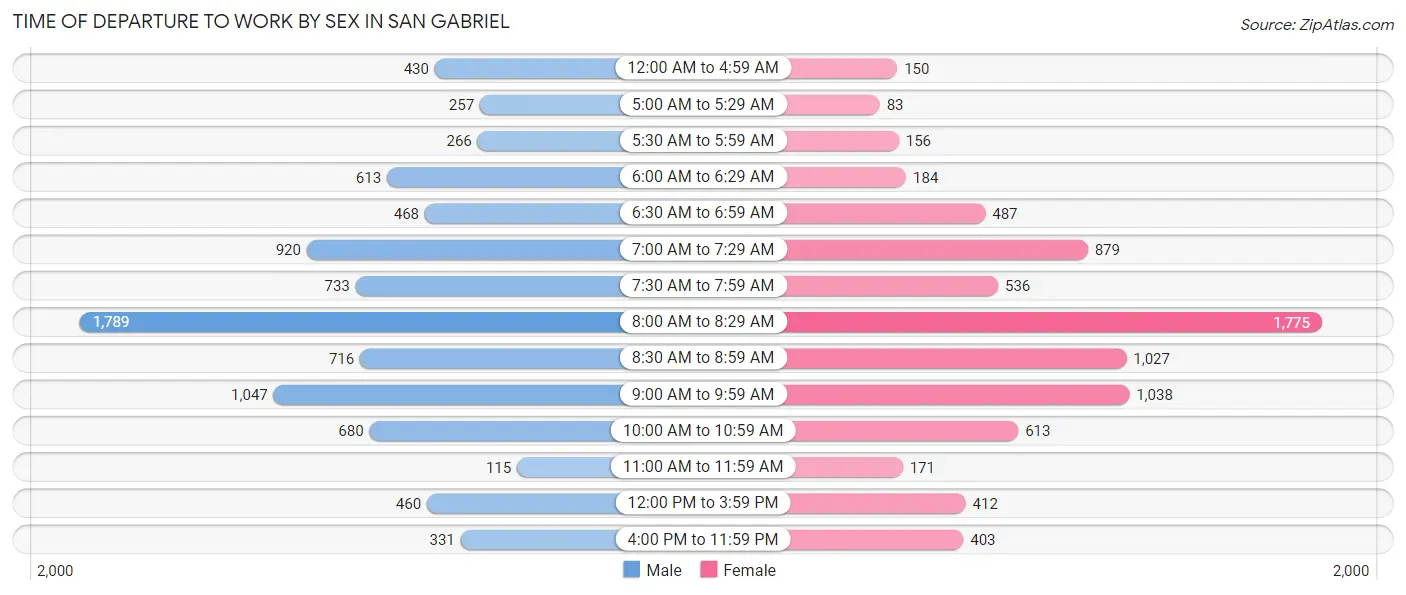
| Time of Departure | Male | Female |
| 12:00 AM to 4:59 AM | 430 (4.9%) | 150 (1.9%) |
| 5:00 AM to 5:29 AM | 257 (2.9%) | 83 (1.1%) |
| 5:30 AM to 5:59 AM | 266 (3.0%) | 156 (2.0%) |
| 6:00 AM to 6:29 AM | 613 (7.0%) | 184 (2.3%) |
| 6:30 AM to 6:59 AM | 468 (5.3%) | 487 (6.1%) |
| 7:00 AM to 7:29 AM | 920 (10.4%) | 879 (11.1%) |
| 7:30 AM to 7:59 AM | 733 (8.3%) | 536 (6.8%) |
| 8:00 AM to 8:29 AM | 1,789 (20.3%) | 1,775 (22.4%) |
| 8:30 AM to 8:59 AM | 716 (8.1%) | 1,027 (13.0%) |
| 9:00 AM to 9:59 AM | 1,047 (11.9%) | 1,038 (13.1%) |
| 10:00 AM to 10:59 AM | 680 (7.7%) | 613 (7.7%) |
| 11:00 AM to 11:59 AM | 115 (1.3%) | 171 (2.2%) |
| 12:00 PM to 3:59 PM | 460 (5.2%) | 412 (5.2%) |
| 4:00 PM to 11:59 PM | 331 (3.7%) | 403 (5.1%) |
| Total | 8,825 (100.0%) | 7,914 (100.0%) |
Housing Occupancy in San Gabriel
Occupancy by Ownership in San Gabriel
Of the total 12,319 dwellings in San Gabriel, owner-occupied units account for 6,128 (49.7%), while renter-occupied units make up 6,191 (50.3%).
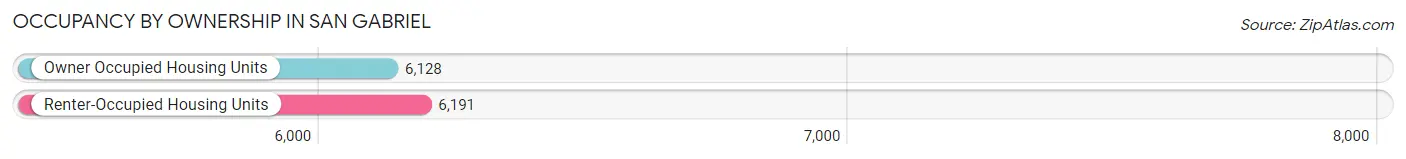
| Occupancy | # Housing Units | % Housing Units |
| Owner Occupied Housing Units | 6,128 | 49.7% |
| Renter-Occupied Housing Units | 6,191 | 50.3% |
| Total Occupied Housing Units | 12,319 | 100.0% |
Occupancy by Household Size in San Gabriel
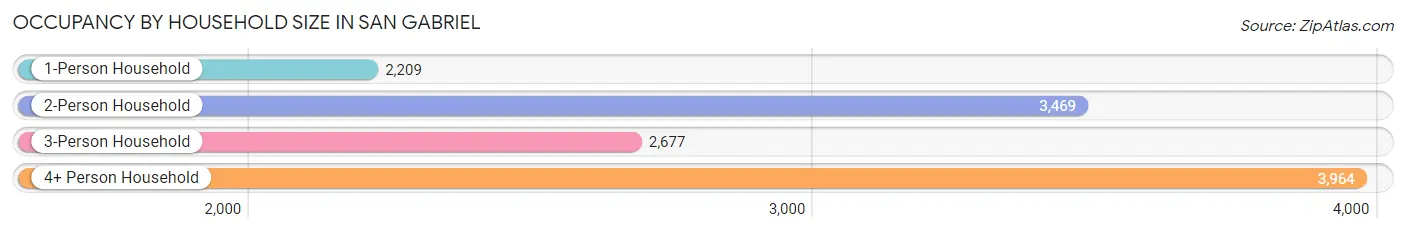
| Household Size | # Housing Units | % Housing Units |
| 1-Person Household | 2,209 | 17.9% |
| 2-Person Household | 3,469 | 28.2% |
| 3-Person Household | 2,677 | 21.7% |
| 4+ Person Household | 3,964 | 32.2% |
| Total Housing Units | 12,319 | 100.0% |
Occupancy by Ownership by Household Size in San Gabriel
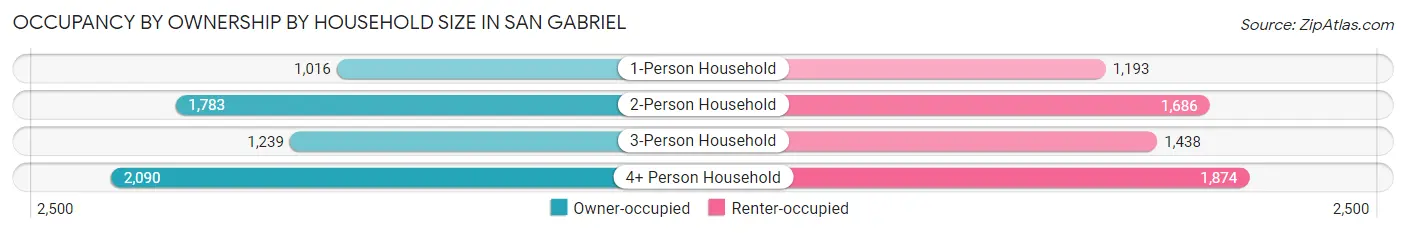
| Household Size | Owner-occupied | Renter-occupied |
| 1-Person Household | 1,016 (46.0%) | 1,193 (54.0%) |
| 2-Person Household | 1,783 (51.4%) | 1,686 (48.6%) |
| 3-Person Household | 1,239 (46.3%) | 1,438 (53.7%) |
| 4+ Person Household | 2,090 (52.7%) | 1,874 (47.3%) |
| Total Housing Units | 6,128 (49.7%) | 6,191 (50.3%) |
Occupancy by Educational Attainment in San Gabriel
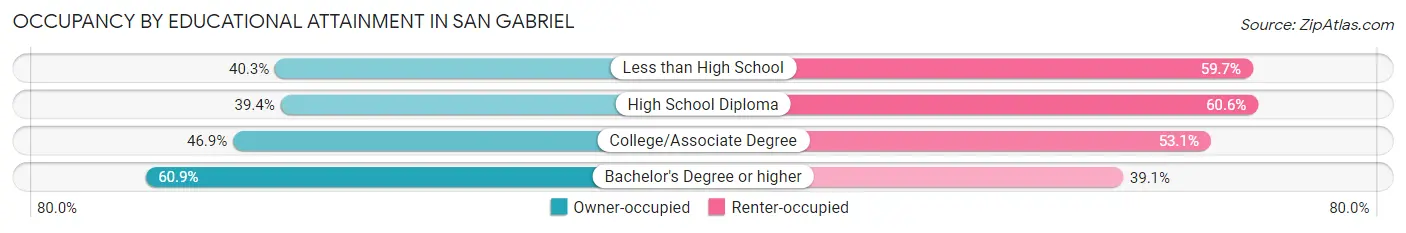
| Household Size | Owner-occupied | Renter-occupied |
| Less than High School | 791 (40.3%) | 1,173 (59.7%) |
| High School Diploma | 1,021 (39.4%) | 1,570 (60.6%) |
| College/Associate Degree | 1,382 (46.9%) | 1,562 (53.1%) |
| Bachelor's Degree or higher | 2,934 (60.9%) | 1,886 (39.1%) |
Occupancy by Age of Householder in San Gabriel
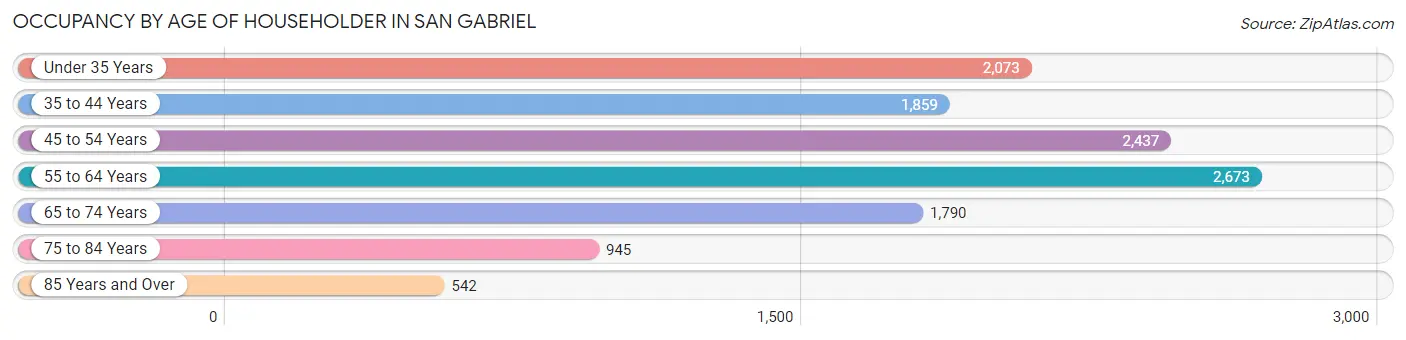
| Age Bracket | # Households | % Households |
| Under 35 Years | 2,073 | 16.8% |
| 35 to 44 Years | 1,859 | 15.1% |
| 45 to 54 Years | 2,437 | 19.8% |
| 55 to 64 Years | 2,673 | 21.7% |
| 65 to 74 Years | 1,790 | 14.5% |
| 75 to 84 Years | 945 | 7.7% |
| 85 Years and Over | 542 | 4.4% |
| Total | 12,319 | 100.0% |
Housing Finances in San Gabriel
Median Income by Occupancy in San Gabriel
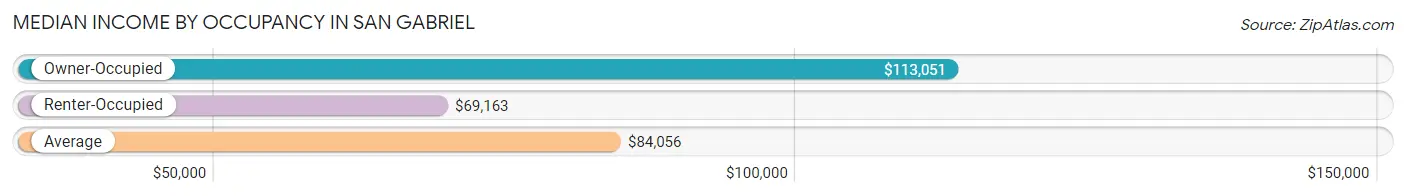
| Occupancy Type | # Households | Median Income |
| Owner-Occupied | 6,128 (49.7%) | $113,051 |
| Renter-Occupied | 6,191 (50.3%) | $69,163 |
| Average | 12,319 (100.0%) | $84,056 |
Occupancy by Householder Income Bracket in San Gabriel
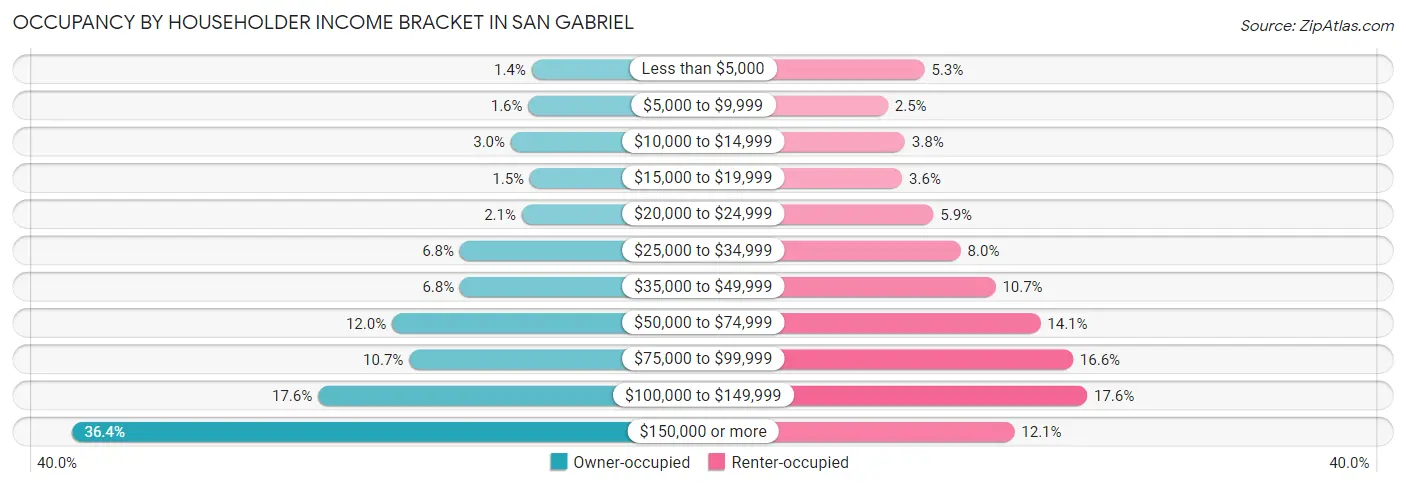
| Income Bracket | Owner-occupied | Renter-occupied |
| Less than $5,000 | 84 (1.4%) | 325 (5.2%) |
| $5,000 to $9,999 | 99 (1.6%) | 152 (2.5%) |
| $10,000 to $14,999 | 181 (2.9%) | 233 (3.8%) |
| $15,000 to $19,999 | 92 (1.5%) | 220 (3.5%) |
| $20,000 to $24,999 | 130 (2.1%) | 367 (5.9%) |
| $25,000 to $34,999 | 419 (6.8%) | 496 (8.0%) |
| $35,000 to $49,999 | 418 (6.8%) | 660 (10.7%) |
| $50,000 to $74,999 | 736 (12.0%) | 872 (14.1%) |
| $75,000 to $99,999 | 656 (10.7%) | 1,025 (16.6%) |
| $100,000 to $149,999 | 1,081 (17.6%) | 1,092 (17.6%) |
| $150,000 or more | 2,232 (36.4%) | 749 (12.1%) |
| Total | 6,128 (100.0%) | 6,191 (100.0%) |
Monthly Housing Cost Tiers in San Gabriel
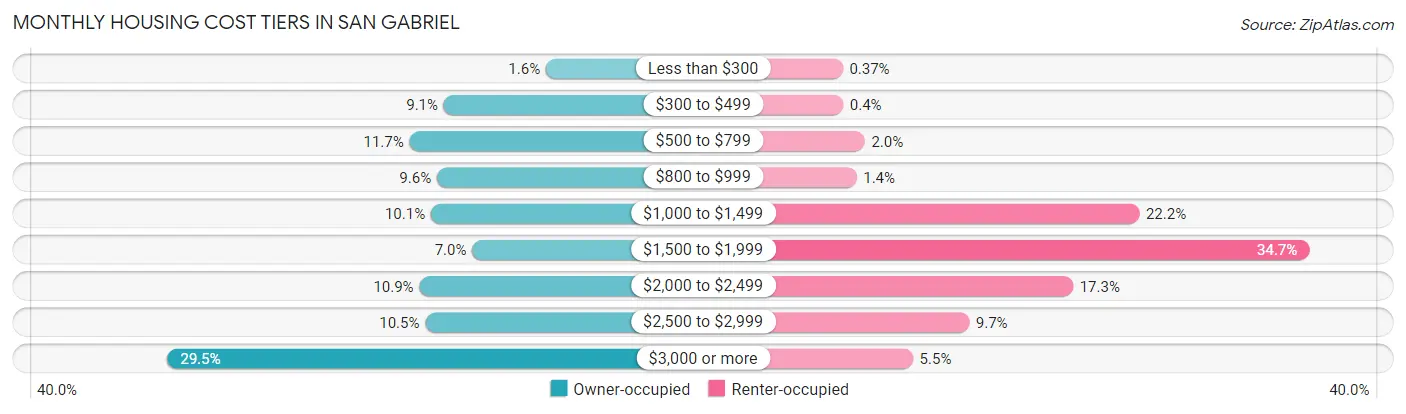
| Monthly Cost | Owner-occupied | Renter-occupied |
| Less than $300 | 98 (1.6%) | 23 (0.4%) |
| $300 to $499 | 559 (9.1%) | 25 (0.4%) |
| $500 to $799 | 714 (11.7%) | 123 (2.0%) |
| $800 to $999 | 590 (9.6%) | 86 (1.4%) |
| $1,000 to $1,499 | 617 (10.1%) | 1,375 (22.2%) |
| $1,500 to $1,999 | 431 (7.0%) | 2,151 (34.7%) |
| $2,000 to $2,499 | 669 (10.9%) | 1,073 (17.3%) |
| $2,500 to $2,999 | 643 (10.5%) | 599 (9.7%) |
| $3,000 or more | 1,807 (29.5%) | 343 (5.5%) |
| Total | 6,128 (100.0%) | 6,191 (100.0%) |
Physical Housing Characteristics in San Gabriel
Housing Structures in San Gabriel
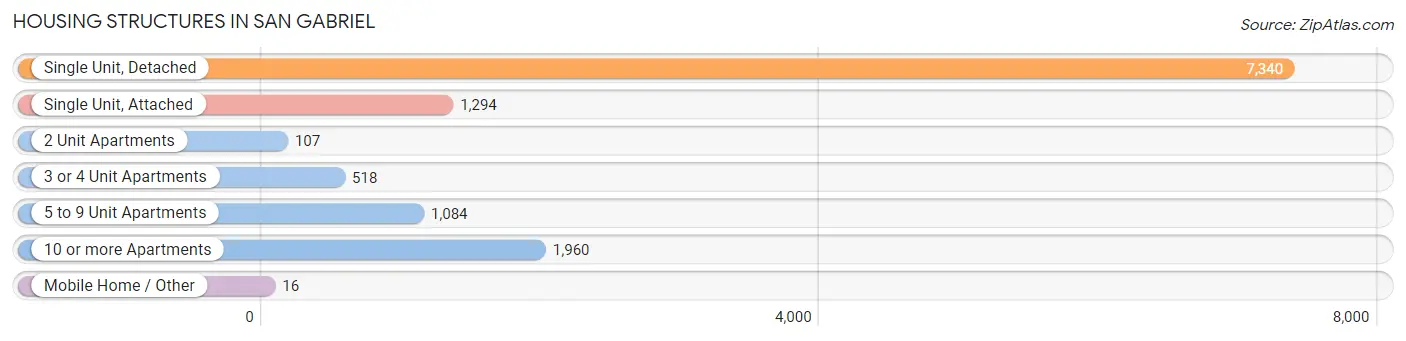
| Structure Type | # Housing Units | % Housing Units |
| Single Unit, Detached | 7,340 | 59.6% |
| Single Unit, Attached | 1,294 | 10.5% |
| 2 Unit Apartments | 107 | 0.9% |
| 3 or 4 Unit Apartments | 518 | 4.2% |
| 5 to 9 Unit Apartments | 1,084 | 8.8% |
| 10 or more Apartments | 1,960 | 15.9% |
| Mobile Home / Other | 16 | 0.1% |
| Total | 12,319 | 100.0% |
Housing Structures by Occupancy in San Gabriel
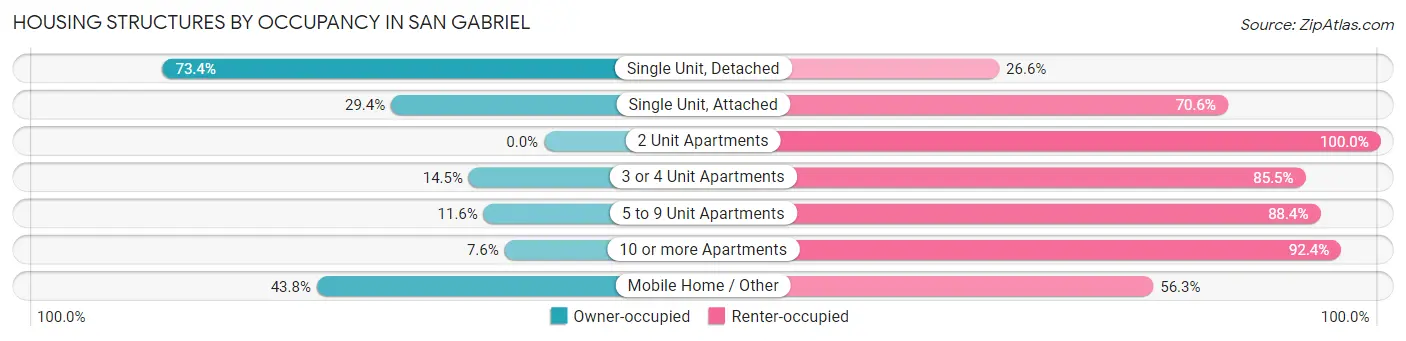
| Structure Type | Owner-occupied | Renter-occupied |
| Single Unit, Detached | 5,390 (73.4%) | 1,950 (26.6%) |
| Single Unit, Attached | 381 (29.4%) | 913 (70.6%) |
| 2 Unit Apartments | 0 (0.0%) | 107 (100.0%) |
| 3 or 4 Unit Apartments | 75 (14.5%) | 443 (85.5%) |
| 5 to 9 Unit Apartments | 126 (11.6%) | 958 (88.4%) |
| 10 or more Apartments | 149 (7.6%) | 1,811 (92.4%) |
| Mobile Home / Other | 7 (43.8%) | 9 (56.2%) |
| Total | 6,128 (49.7%) | 6,191 (50.3%) |
Housing Structures by Number of Rooms in San Gabriel
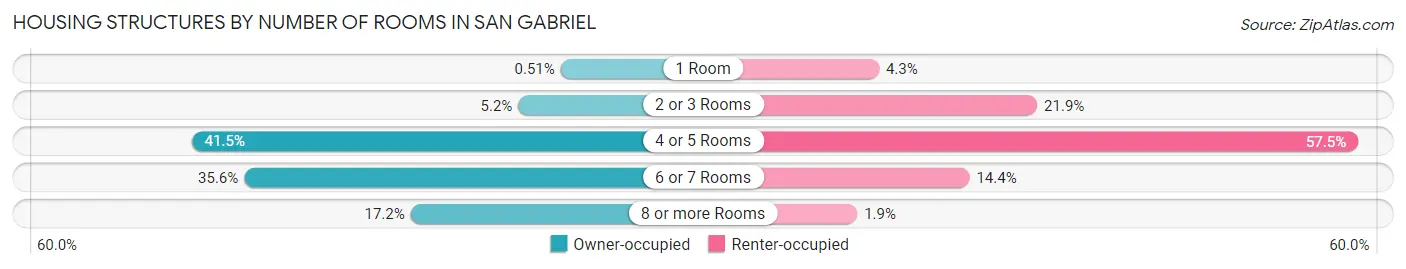
| Number of Rooms | Owner-occupied | Renter-occupied |
| 1 Room | 31 (0.5%) | 268 (4.3%) |
| 2 or 3 Rooms | 320 (5.2%) | 1,355 (21.9%) |
| 4 or 5 Rooms | 2,541 (41.5%) | 3,559 (57.5%) |
| 6 or 7 Rooms | 2,184 (35.6%) | 890 (14.4%) |
| 8 or more Rooms | 1,052 (17.2%) | 119 (1.9%) |
| Total | 6,128 (100.0%) | 6,191 (100.0%) |
Housing Structure by Heating Type in San Gabriel
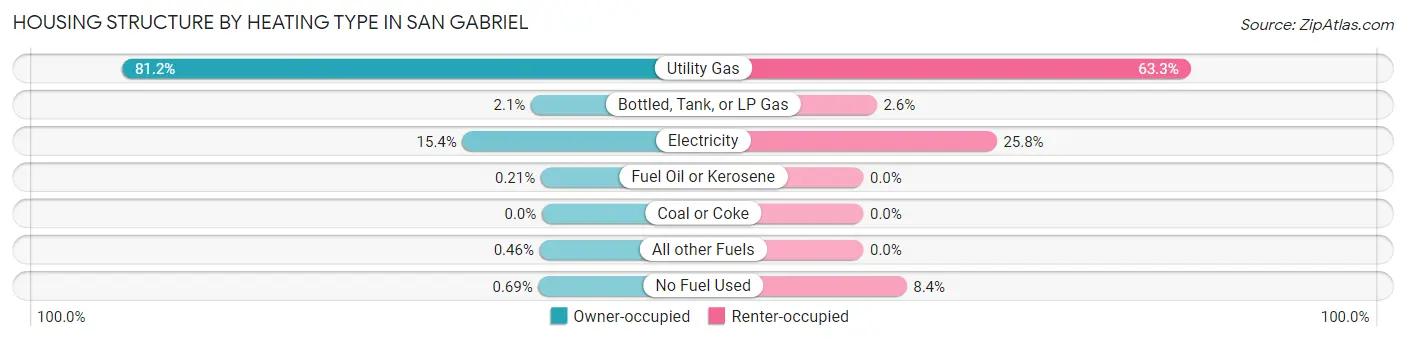
| Heating Type | Owner-occupied | Renter-occupied |
| Utility Gas | 4,975 (81.2%) | 3,917 (63.3%) |
| Bottled, Tank, or LP Gas | 129 (2.1%) | 161 (2.6%) |
| Electricity | 941 (15.4%) | 1,596 (25.8%) |
| Fuel Oil or Kerosene | 13 (0.2%) | 0 (0.0%) |
| Coal or Coke | 0 (0.0%) | 0 (0.0%) |
| All other Fuels | 28 (0.5%) | 0 (0.0%) |
| No Fuel Used | 42 (0.7%) | 517 (8.4%) |
| Total | 6,128 (100.0%) | 6,191 (100.0%) |
Household Vehicle Usage in San Gabriel
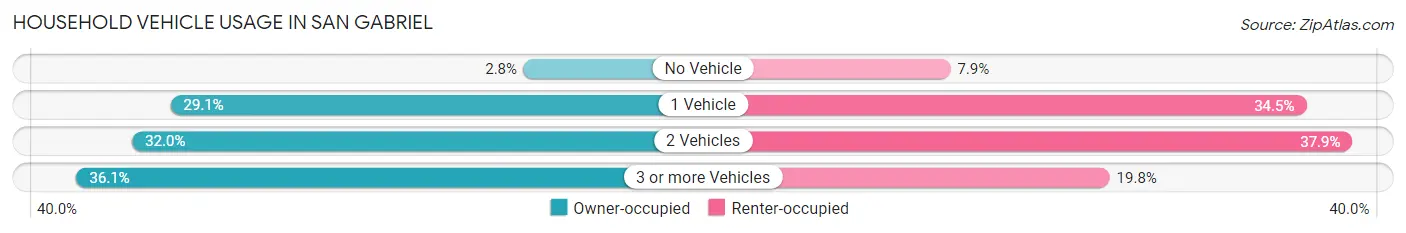
| Vehicles per Household | Owner-occupied | Renter-occupied |
| No Vehicle | 171 (2.8%) | 488 (7.9%) |
| 1 Vehicle | 1,784 (29.1%) | 2,133 (34.4%) |
| 2 Vehicles | 1,959 (32.0%) | 2,346 (37.9%) |
| 3 or more Vehicles | 2,214 (36.1%) | 1,224 (19.8%) |
| Total | 6,128 (100.0%) | 6,191 (100.0%) |
Real Estate & Mortgages in San Gabriel
Real Estate and Mortgage Overview in San Gabriel
| Characteristic | Without Mortgage | With Mortgage |
| Housing Units | 2,496 | 3,632 |
| Median Property Value | $820,200 | $876,800 |
| Median Household Income | $72,250 | $1,588 |
| Monthly Housing Costs | $768 | $1,802 |
| Real Estate Taxes | $5,199 | $16 |
Property Value by Mortgage Status in San Gabriel
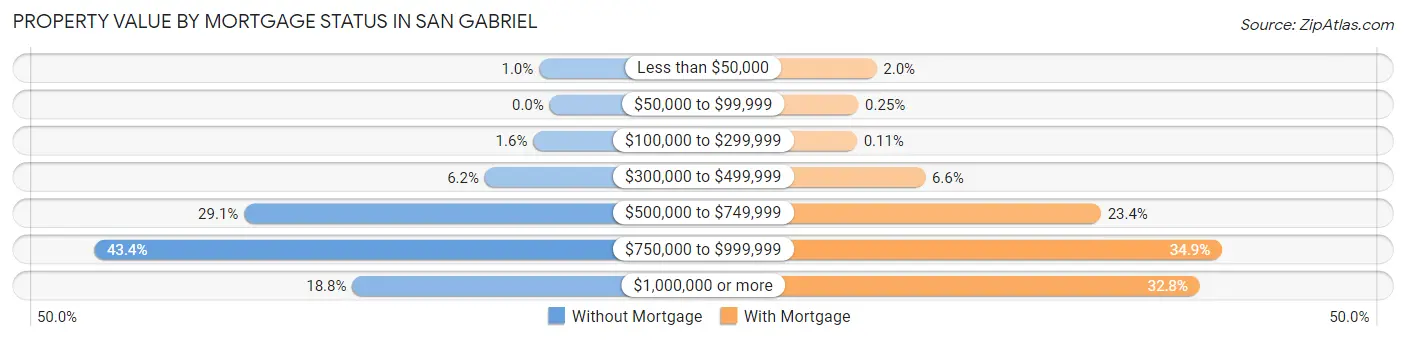
| Property Value | Without Mortgage | With Mortgage |
| Less than $50,000 | 25 (1.0%) | 72 (2.0%) |
| $50,000 to $99,999 | 0 (0.0%) | 9 (0.3%) |
| $100,000 to $299,999 | 39 (1.6%) | 4 (0.1%) |
| $300,000 to $499,999 | 154 (6.2%) | 240 (6.6%) |
| $500,000 to $749,999 | 726 (29.1%) | 848 (23.4%) |
| $750,000 to $999,999 | 1,083 (43.4%) | 1,268 (34.9%) |
| $1,000,000 or more | 469 (18.8%) | 1,191 (32.8%) |
| Total | 2,496 (100.0%) | 3,632 (100.0%) |
Household Income by Mortgage Status in San Gabriel
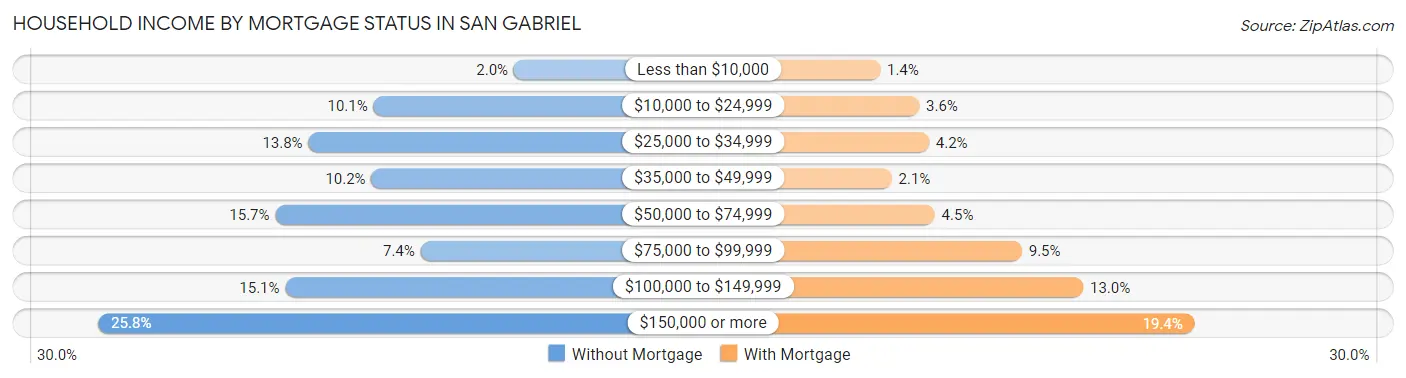
| Household Income | Without Mortgage | With Mortgage |
| Less than $10,000 | 51 (2.0%) | 51 (1.4%) |
| $10,000 to $24,999 | 251 (10.1%) | 132 (3.6%) |
| $25,000 to $34,999 | 344 (13.8%) | 152 (4.2%) |
| $35,000 to $49,999 | 254 (10.2%) | 75 (2.1%) |
| $50,000 to $74,999 | 391 (15.7%) | 164 (4.5%) |
| $75,000 to $99,999 | 184 (7.4%) | 345 (9.5%) |
| $100,000 to $149,999 | 377 (15.1%) | 472 (13.0%) |
| $150,000 or more | 644 (25.8%) | 704 (19.4%) |
| Total | 2,496 (100.0%) | 3,632 (100.0%) |
Property Value to Household Income Ratio in San Gabriel
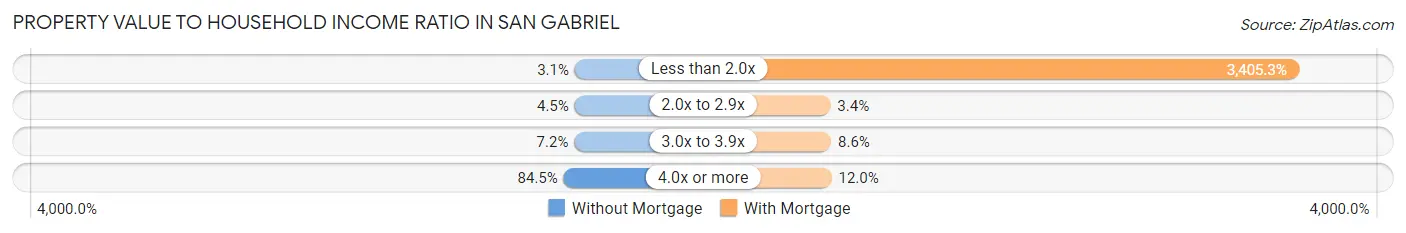
| Value-to-Income Ratio | Without Mortgage | With Mortgage |
| Less than 2.0x | 78 (3.1%) | 123,682 (3,405.3%) |
| 2.0x to 2.9x | 111 (4.4%) | 124 (3.4%) |
| 3.0x to 3.9x | 179 (7.2%) | 313 (8.6%) |
| 4.0x or more | 2,109 (84.5%) | 434 (11.9%) |
| Total | 2,496 (100.0%) | 3,632 (100.0%) |
Real Estate Taxes by Mortgage Status in San Gabriel
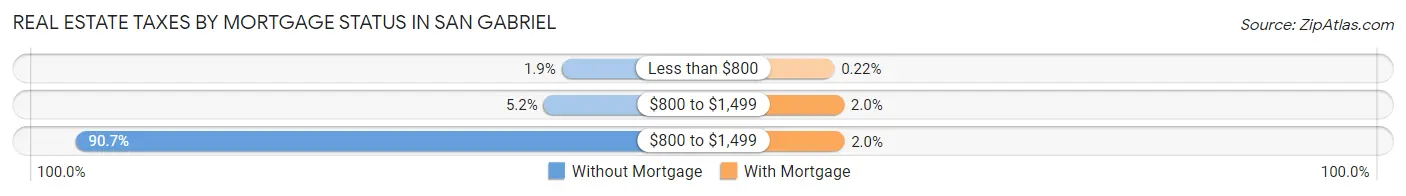
| Property Taxes | Without Mortgage | With Mortgage |
| Less than $800 | 48 (1.9%) | 8 (0.2%) |
| $800 to $1,499 | 130 (5.2%) | 72 (2.0%) |
| $800 to $1,499 | 2,263 (90.7%) | 74 (2.0%) |
| Total | 2,496 (100.0%) | 3,632 (100.0%) |
Health & Disability in San Gabriel
Health Insurance Coverage by Age in San Gabriel
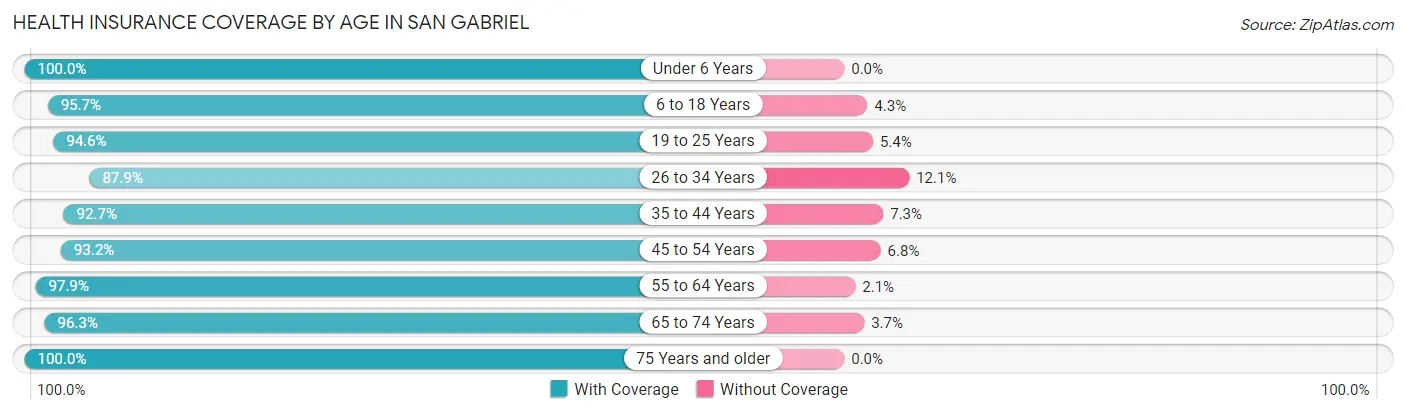
| Age Bracket | With Coverage | Without Coverage |
| Under 6 Years | 2,076 (100.0%) | 0 (0.0%) |
| 6 to 18 Years | 4,731 (95.7%) | 213 (4.3%) |
| 19 to 25 Years | 2,913 (94.6%) | 165 (5.4%) |
| 26 to 34 Years | 4,237 (87.9%) | 584 (12.1%) |
| 35 to 44 Years | 4,581 (92.7%) | 359 (7.3%) |
| 45 to 54 Years | 5,304 (93.2%) | 386 (6.8%) |
| 55 to 64 Years | 6,051 (97.9%) | 127 (2.1%) |
| 65 to 74 Years | 3,569 (96.3%) | 138 (3.7%) |
| 75 Years and older | 3,163 (100.0%) | 0 (0.0%) |
| Total | 36,625 (94.9%) | 1,972 (5.1%) |
Health Insurance Coverage by Citizenship Status in San Gabriel
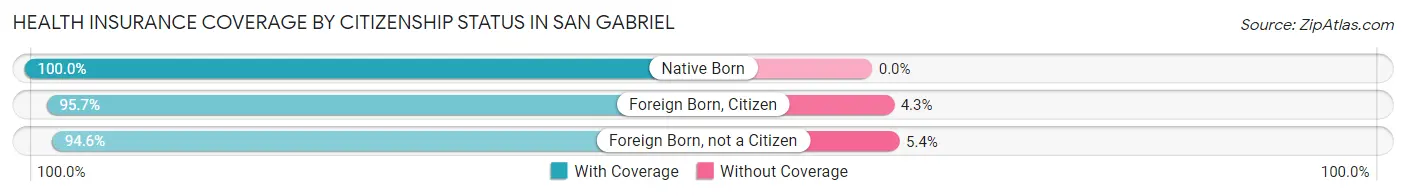
| Citizenship Status | With Coverage | Without Coverage |
| Native Born | 2,076 (100.0%) | 0 (0.0%) |
| Foreign Born, Citizen | 4,731 (95.7%) | 213 (4.3%) |
| Foreign Born, not a Citizen | 2,913 (94.6%) | 165 (5.4%) |
Health Insurance Coverage by Household Income in San Gabriel
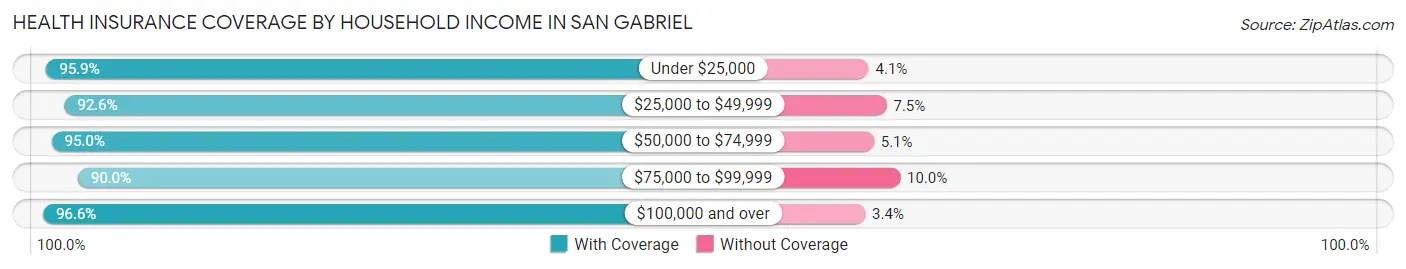
| Household Income | With Coverage | Without Coverage |
| Under $25,000 | 3,640 (95.9%) | 155 (4.1%) |
| $25,000 to $49,999 | 4,873 (92.5%) | 392 (7.4%) |
| $50,000 to $74,999 | 4,173 (95.0%) | 222 (5.1%) |
| $75,000 to $99,999 | 4,642 (90.0%) | 514 (10.0%) |
| $100,000 and over | 19,226 (96.6%) | 685 (3.4%) |
Public vs Private Health Insurance Coverage by Age in San Gabriel
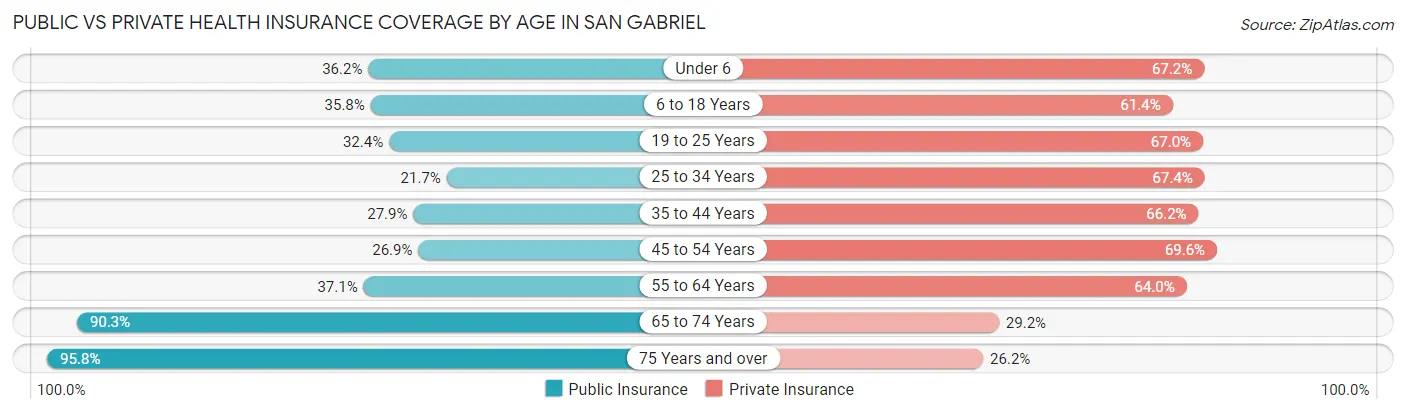
| Age Bracket | Public Insurance | Private Insurance |
| Under 6 | 752 (36.2%) | 1,396 (67.2%) |
| 6 to 18 Years | 1,769 (35.8%) | 3,035 (61.4%) |
| 19 to 25 Years | 996 (32.4%) | 2,063 (67.0%) |
| 25 to 34 Years | 1,044 (21.7%) | 3,247 (67.3%) |
| 35 to 44 Years | 1,376 (27.9%) | 3,270 (66.2%) |
| 45 to 54 Years | 1,532 (26.9%) | 3,962 (69.6%) |
| 55 to 64 Years | 2,292 (37.1%) | 3,953 (64.0%) |
| 65 to 74 Years | 3,347 (90.3%) | 1,081 (29.2%) |
| 75 Years and over | 3,031 (95.8%) | 830 (26.2%) |
| Total | 16,139 (41.8%) | 22,837 (59.2%) |
Disability Status by Sex by Age in San Gabriel
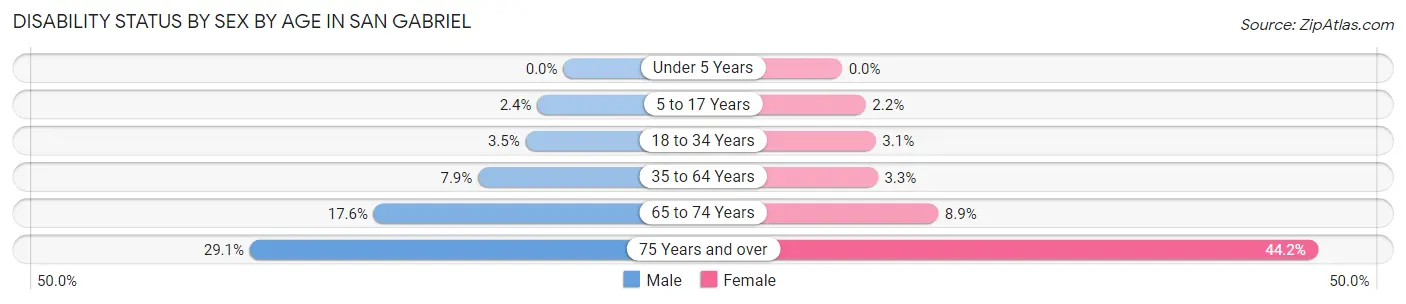
| Age Bracket | Male | Female |
| Under 5 Years | 0 (0.0%) | 0 (0.0%) |
| 5 to 17 Years | 69 (2.4%) | 45 (2.2%) |
| 18 to 34 Years | 153 (3.5%) | 120 (3.1%) |
| 35 to 64 Years | 642 (7.9%) | 288 (3.3%) |
| 65 to 74 Years | 313 (17.6%) | 172 (8.9%) |
| 75 Years and over | 316 (29.1%) | 917 (44.2%) |
Disability Class by Sex by Age in San Gabriel
Disability Class: Hearing Difficulty
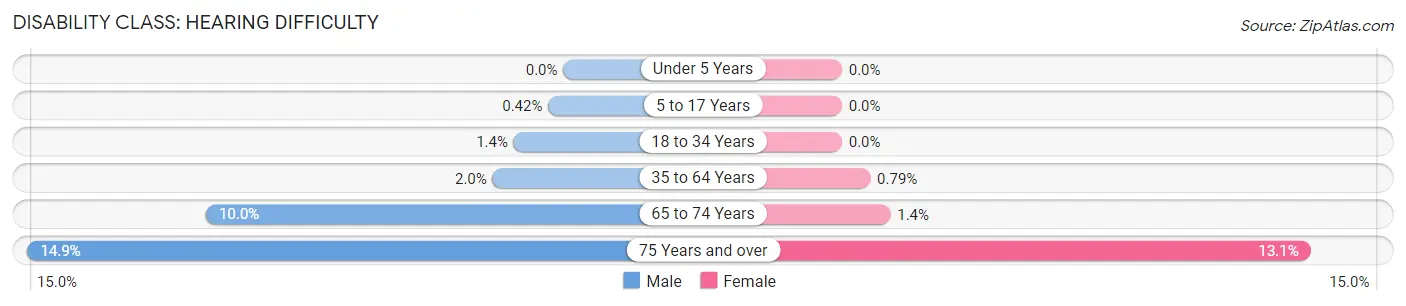
| Age Bracket | Male | Female |
| Under 5 Years | 0 (0.0%) | 0 (0.0%) |
| 5 to 17 Years | 12 (0.4%) | 0 (0.0%) |
| 18 to 34 Years | 60 (1.4%) | 0 (0.0%) |
| 35 to 64 Years | 160 (2.0%) | 69 (0.8%) |
| 65 to 74 Years | 177 (10.0%) | 26 (1.3%) |
| 75 Years and over | 162 (14.9%) | 271 (13.1%) |
Disability Class: Vision Difficulty
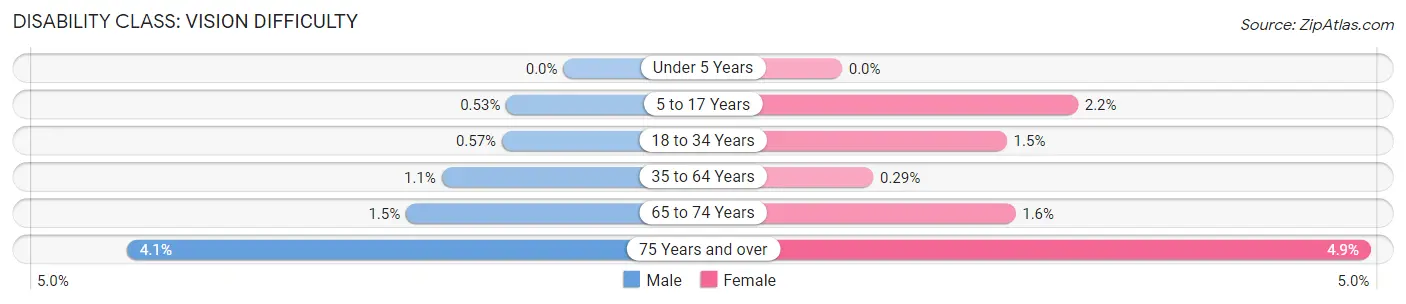
| Age Bracket | Male | Female |
| Under 5 Years | 0 (0.0%) | 0 (0.0%) |
| 5 to 17 Years | 15 (0.5%) | 45 (2.2%) |
| 18 to 34 Years | 25 (0.6%) | 59 (1.5%) |
| 35 to 64 Years | 92 (1.1%) | 25 (0.3%) |
| 65 to 74 Years | 26 (1.5%) | 31 (1.6%) |
| 75 Years and over | 44 (4.1%) | 102 (4.9%) |
Disability Class: Cognitive Difficulty
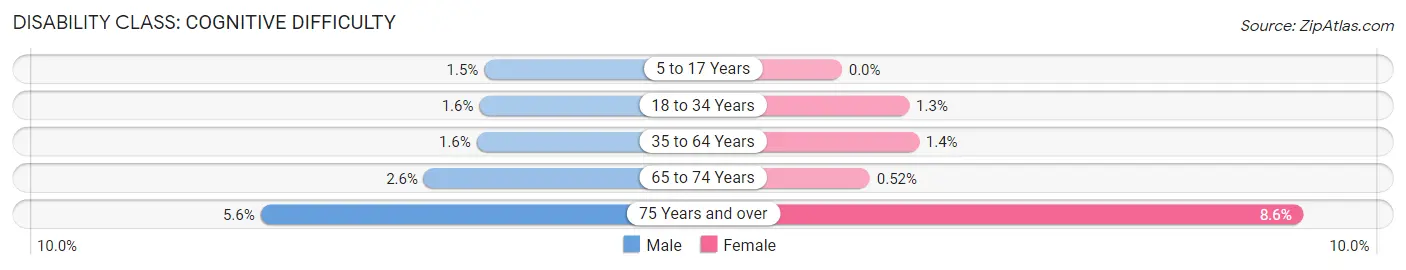
| Age Bracket | Male | Female |
| 5 to 17 Years | 42 (1.5%) | 0 (0.0%) |
| 18 to 34 Years | 68 (1.6%) | 48 (1.3%) |
| 35 to 64 Years | 131 (1.6%) | 124 (1.4%) |
| 65 to 74 Years | 46 (2.6%) | 10 (0.5%) |
| 75 Years and over | 61 (5.6%) | 178 (8.6%) |
Disability Class: Ambulatory Difficulty
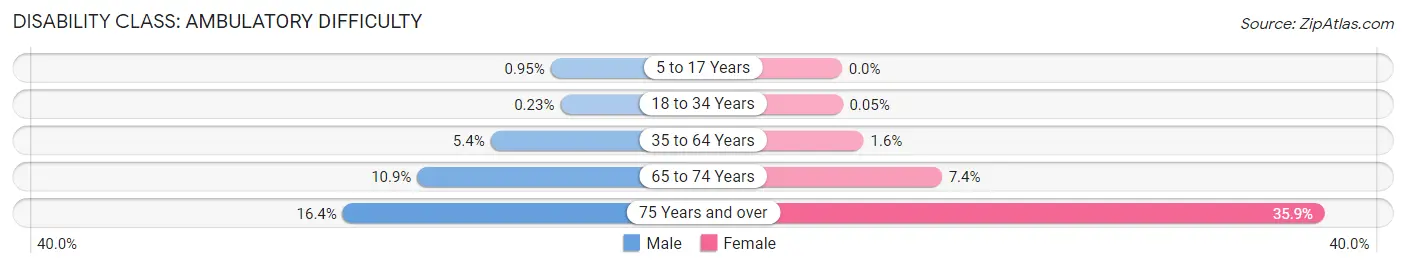
| Age Bracket | Male | Female |
| 5 to 17 Years | 27 (0.9%) | 0 (0.0%) |
| 18 to 34 Years | 10 (0.2%) | 2 (0.1%) |
| 35 to 64 Years | 439 (5.4%) | 141 (1.6%) |
| 65 to 74 Years | 193 (10.8%) | 143 (7.4%) |
| 75 Years and over | 178 (16.4%) | 745 (35.9%) |
Disability Class: Self-Care Difficulty
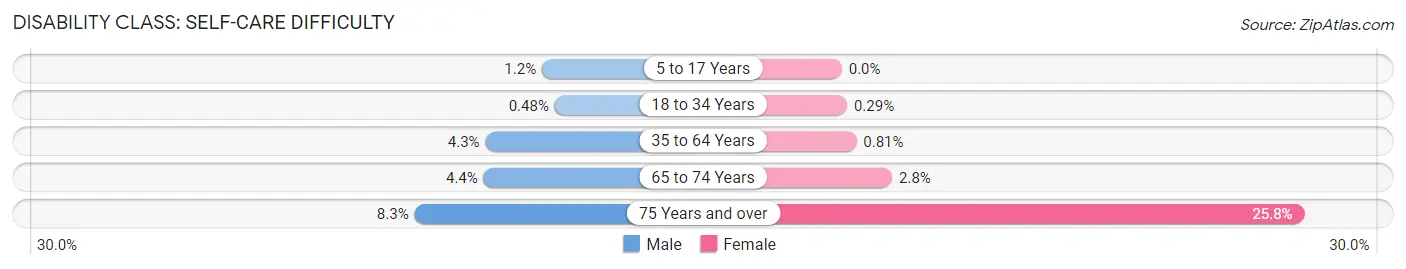
| Age Bracket | Male | Female |
| 5 to 17 Years | 34 (1.2%) | 0 (0.0%) |
| 18 to 34 Years | 21 (0.5%) | 11 (0.3%) |
| 35 to 64 Years | 352 (4.3%) | 70 (0.8%) |
| 65 to 74 Years | 79 (4.4%) | 54 (2.8%) |
| 75 Years and over | 90 (8.3%) | 535 (25.8%) |
Technology Access in San Gabriel
Computing Device Access in San Gabriel
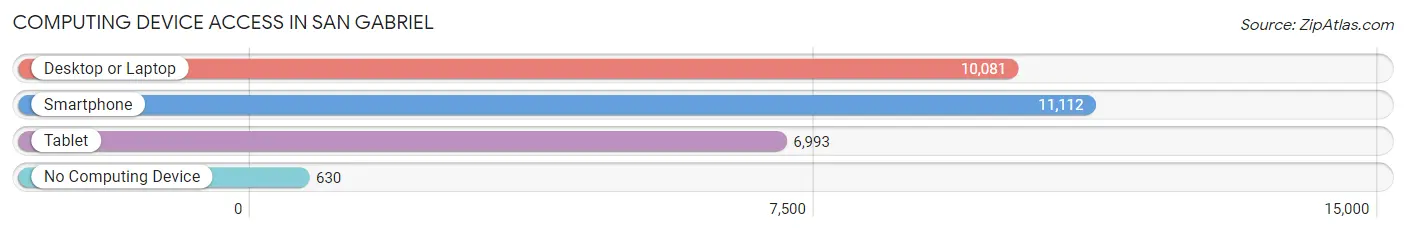
| Device Type | # Households | % Households |
| Desktop or Laptop | 10,081 | 81.8% |
| Smartphone | 11,112 | 90.2% |
| Tablet | 6,993 | 56.8% |
| No Computing Device | 630 | 5.1% |
| Total | 12,319 | 100.0% |
Internet Access in San Gabriel
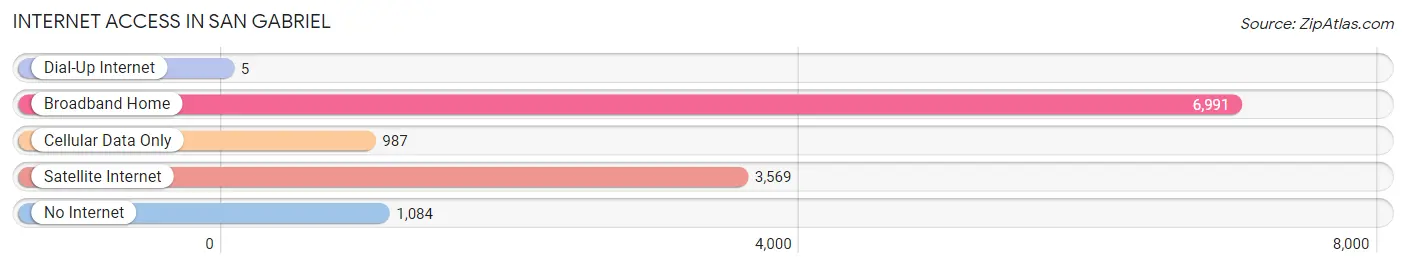
| Internet Type | # Households | % Households |
| Dial-Up Internet | 5 | 0.0% |
| Broadband Home | 6,991 | 56.8% |
| Cellular Data Only | 987 | 8.0% |
| Satellite Internet | 3,569 | 29.0% |
| No Internet | 1,084 | 8.8% |
| Total | 12,319 | 100.0% |
San Gabriel Summary
Introduction
San Gabriel is a city located in Los Angeles County, California. It is situated in the San Gabriel Valley, just east of downtown Los Angeles. The city is known for its rich history, diverse geography, vibrant economy, and diverse demographics. This paper will provide an overview of San Gabriel’s history, geography, economy, and demographics in 2000 words.
History
San Gabriel was founded in 1771 by Spanish missionaries, who named it after the Archangel Gabriel. The city was part of the Spanish mission system, and was the fourth mission to be established in California. The mission was a major center of activity for the Spanish, and was the site of the first public school in California.
The mission was secularized in 1834, and the land was divided into ranchos. The area was then annexed by the United States in 1848, and became part of Los Angeles County in 1850. The city was incorporated in 1913, and has since grown to become a major suburb of Los Angeles.
Geography
San Gabriel is located in the San Gabriel Valley, which is a large alluvial valley located east of downtown Los Angeles. The city is bordered by the cities of Alhambra, Rosemead, and Monterey Park. The city is situated at the base of the San Gabriel Mountains, which provide a scenic backdrop to the city.
The city has a total area of 8.3 square miles, and is located at an elevation of 545 feet. The climate is mild and temperate, with average temperatures ranging from the mid-50s to the mid-80s.
Economy
San Gabriel is a major economic center in the region. The city is home to a number of large employers, including the San Gabriel Valley Medical Center, San Gabriel Valley Water Company, and San Gabriel Valley Tribune. The city is also home to a number of retail and commercial businesses, including the San Gabriel Square Shopping Center.
The city’s economy is also supported by a number of industries, including manufacturing, healthcare, and education. The city is home to a number of educational institutions, including the University of Southern California, California State University Los Angeles, and Pasadena City College.
Demographics
As of the 2010 census, the population of San Gabriel was 39,718. The city has a diverse population, with the largest ethnic groups being Hispanic (47.2%), Asian (37.2%), and White (9.2%). The city also has a large immigrant population, with over 40% of the population being foreign-born.
The median household income in San Gabriel is $60,845, and the median home value is $541,400. The city has a high rate of homeownership, with over 70% of the population owning their own homes.
Conclusion
San Gabriel is a city located in Los Angeles County, California. It is known for its rich history, diverse geography, vibrant economy, and diverse demographics. The city has a long history, dating back to its founding in 1771 by Spanish missionaries. The city is situated in the San Gabriel Valley, and is bordered by the cities of Alhambra, Rosemead, and Monterey Park. The city is home to a number of large employers, and is supported by a number of industries, including manufacturing, healthcare, and education. The city has a diverse population, with the largest ethnic groups being Hispanic, Asian, and White. The median household income in San Gabriel is $60,845, and the median home value is $541,400.
Common Questions
What is Per Capita Income in San Gabriel?
Per Capita income in San Gabriel is $35,799.
What is the Median Family Income in San Gabriel?
Median Family Income in San Gabriel is $86,410.
What is the Median Household income in San Gabriel?
Median Household Income in San Gabriel is $84,056.
What is Income or Wage Gap in San Gabriel?
Income or Wage Gap in San Gabriel is 11.9%.
Women in San Gabriel earn 88.1 cents for every dollar earned by a man.
What is Family Income Deficit in San Gabriel?
Family Income Deficit in San Gabriel is $8,847.
Families that are below poverty line in San Gabriel earn $8,847 less on average than the poverty threshold level.
What is Inequality or Gini Index in San Gabriel?
Inequality or Gini Index in San Gabriel is 0.46.
What is the Total Population of San Gabriel?
Total Population of San Gabriel is 39,211.
What is the Total Male Population of San Gabriel?
Total Male Population of San Gabriel is 19,426.
What is the Total Female Population of San Gabriel?
Total Female Population of San Gabriel is 19,785.
What is the Ratio of Males per 100 Females in San Gabriel?
There are 98.19 Males per 100 Females in San Gabriel.
What is the Ratio of Females per 100 Males in San Gabriel?
There are 101.85 Females per 100 Males in San Gabriel.
What is the Median Population Age in San Gabriel?
Median Population Age in San Gabriel is 44.3 Years.
What is the Average Family Size in San Gabriel
Average Family Size in San Gabriel is 3.5 People.
What is the Average Household Size in San Gabriel
Average Household Size in San Gabriel is 3.1 People.
How Large is the Labor Force in San Gabriel?
There are 20,726 People in the Labor Forcein in San Gabriel.
What is the Percentage of People in the Labor Force in San Gabriel?
62.0% of People are in the Labor Force in San Gabriel.
What is the Unemployment Rate in San Gabriel?
Unemployment Rate in San Gabriel is 6.8%.