Redlands, CA Map & Demographics
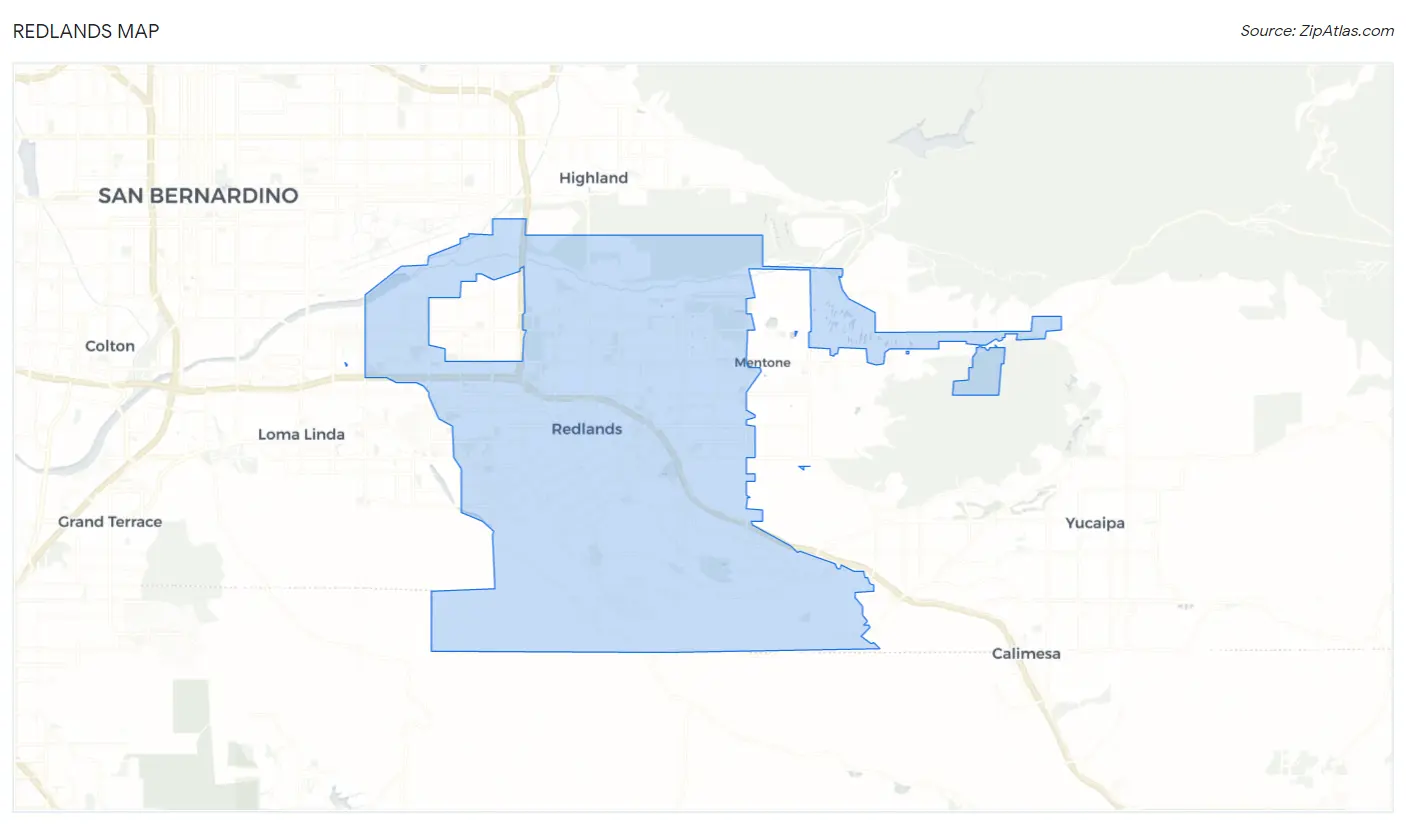
Redlands Map
Redlands Overview
$45,716
PER CAPITA INCOME
$107,409
AVG FAMILY INCOME
$94,473
AVG HOUSEHOLD INCOME
31.0%
WAGE / INCOME GAP [ % ]
69.0¢/ $1
WAGE / INCOME GAP [ $ ]
$11,274
FAMILY INCOME DEFICIT
0.47
INEQUALITY / GINI INDEX
73,234
TOTAL POPULATION
35,383
MALE POPULATION
37,851
FEMALE POPULATION
93.48
MALES / 100 FEMALES
106.98
FEMALES / 100 MALES
35.5
MEDIAN AGE
3.3
AVG FAMILY SIZE
2.8
AVG HOUSEHOLD SIZE
36,943
LABOR FORCE [ PEOPLE ]
63.3%
PERCENT IN LABOR FORCE
6.5%
UNEMPLOYMENT RATE
Redlands Area Codes
Income in Redlands
Income Overview in Redlands
Per Capita Income in Redlands is $45,716, while median incomes of families and households are $107,409 and $94,473 respectively.
| Characteristic | Number | Measure |
| Per Capita Income | 73,234 | $45,716 |
| Median Family Income | 17,295 | $107,409 |
| Mean Family Income | 17,295 | $146,261 |
| Median Household Income | 25,319 | $94,473 |
| Mean Household Income | 25,319 | $129,822 |
| Income Deficit | 17,295 | $11,274 |
| Wage / Income Gap (%) | 73,234 | 31.02% |
| Wage / Income Gap ($) | 73,234 | 68.98¢ per $1 |
| Gini / Inequality Index | 73,234 | 0.47 |
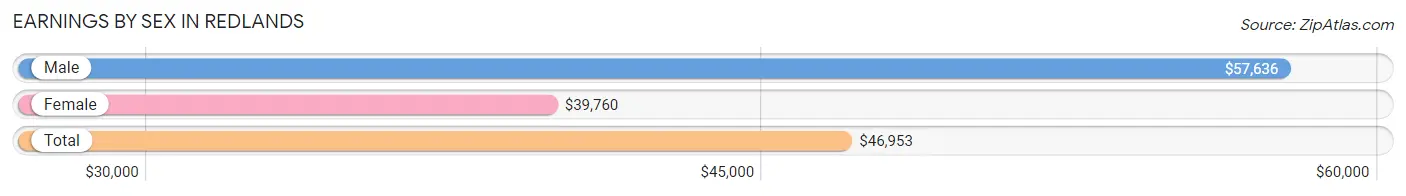
Earnings by Sex in Redlands
Average Earnings in Redlands are $46,953, $57,636 for men and $39,760 for women, a difference of 31.0%.
| Sex | Number | Average Earnings |
| Male | 19,584 (50.7%) | $57,636 |
| Female | 19,043 (49.3%) | $39,760 |
| Total | 38,627 (100.0%) | $46,953 |
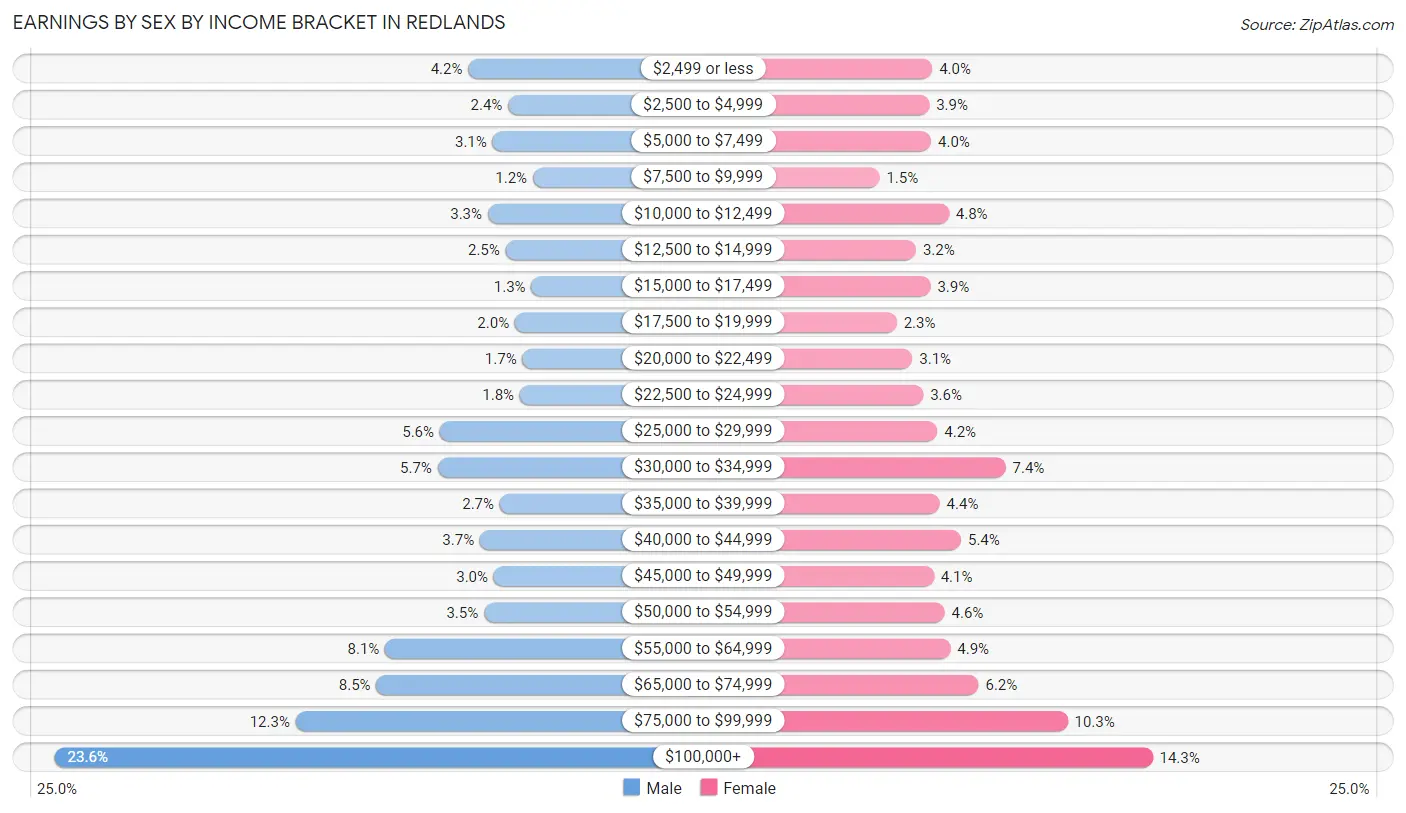
Earnings by Sex by Income Bracket in Redlands
The most common earnings brackets in Redlands are $100,000+ for men (4,620 | 23.6%) and $100,000+ for women (2,727 | 14.3%).
| Income | Male | Female |
| $2,499 or less | 826 (4.2%) | 762 (4.0%) |
| $2,500 to $4,999 | 461 (2.4%) | 736 (3.9%) |
| $5,000 to $7,499 | 604 (3.1%) | 752 (4.0%) |
| $7,500 to $9,999 | 233 (1.2%) | 292 (1.5%) |
| $10,000 to $12,499 | 646 (3.3%) | 911 (4.8%) |
| $12,500 to $14,999 | 483 (2.5%) | 617 (3.2%) |
| $15,000 to $17,499 | 246 (1.3%) | 747 (3.9%) |
| $17,500 to $19,999 | 397 (2.0%) | 446 (2.3%) |
| $20,000 to $22,499 | 329 (1.7%) | 584 (3.1%) |
| $22,500 to $24,999 | 353 (1.8%) | 682 (3.6%) |
| $25,000 to $29,999 | 1,087 (5.6%) | 807 (4.2%) |
| $30,000 to $34,999 | 1,106 (5.7%) | 1,417 (7.4%) |
| $35,000 to $39,999 | 537 (2.7%) | 829 (4.3%) |
| $40,000 to $44,999 | 718 (3.7%) | 1,019 (5.3%) |
| $45,000 to $49,999 | 591 (3.0%) | 775 (4.1%) |
| $50,000 to $54,999 | 682 (3.5%) | 872 (4.6%) |
| $55,000 to $64,999 | 1,589 (8.1%) | 924 (4.9%) |
| $65,000 to $74,999 | 1,668 (8.5%) | 1,175 (6.2%) |
| $75,000 to $99,999 | 2,408 (12.3%) | 1,969 (10.3%) |
| $100,000+ | 4,620 (23.6%) | 2,727 (14.3%) |
| Total | 19,584 (100.0%) | 19,043 (100.0%) |
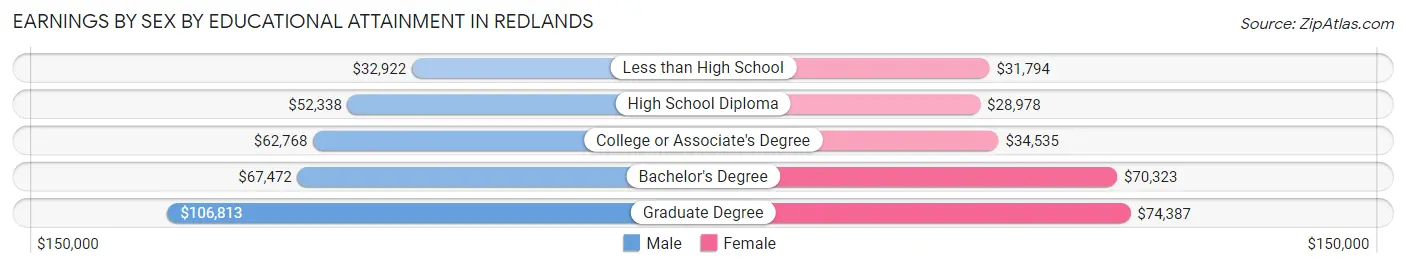
Earnings by Sex by Educational Attainment in Redlands
Average earnings in Redlands are $65,579 for men and $47,214 for women, a difference of 28.0%. Men with an educational attainment of graduate degree enjoy the highest average annual earnings of $106,813, while those with less than high school education earn the least with $32,922. Women with an educational attainment of graduate degree earn the most with the average annual earnings of $74,387, while those with high school diploma education have the smallest earnings of $28,978.
| Educational Attainment | Male Income | Female Income |
| Less than High School | $32,922 | $31,794 |
| High School Diploma | $52,338 | $28,978 |
| College or Associate's Degree | $62,768 | $34,535 |
| Bachelor's Degree | $67,472 | $70,323 |
| Graduate Degree | $106,813 | $74,387 |
| Total | $65,579 | $47,214 |
Family Income in Redlands
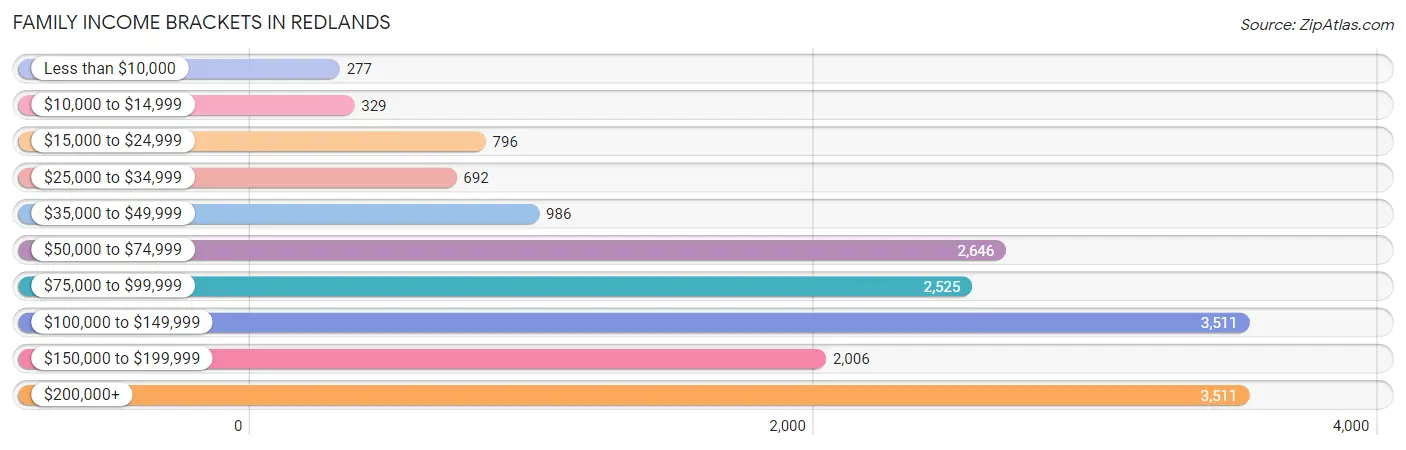
Family Income Brackets in Redlands
According to the Redlands family income data, there are 3,511 families falling into the $100,000 to $149,999 income range, which is the most common income bracket and makes up 20.3% of all families. Conversely, the less than $10,000 income bracket is the least frequent group with only 277 families (1.6%) belonging to this category.
| Income Bracket | # Families | % Families |
| Less than $10,000 | 277 | 1.6% |
| $10,000 to $14,999 | 329 | 1.9% |
| $15,000 to $24,999 | 796 | 4.6% |
| $25,000 to $34,999 | 692 | 4.0% |
| $35,000 to $49,999 | 986 | 5.7% |
| $50,000 to $74,999 | 2,646 | 15.3% |
| $75,000 to $99,999 | 2,525 | 14.6% |
| $100,000 to $149,999 | 3,511 | 20.3% |
| $150,000 to $199,999 | 2,006 | 11.6% |
| $200,000+ | 3,511 | 20.3% |
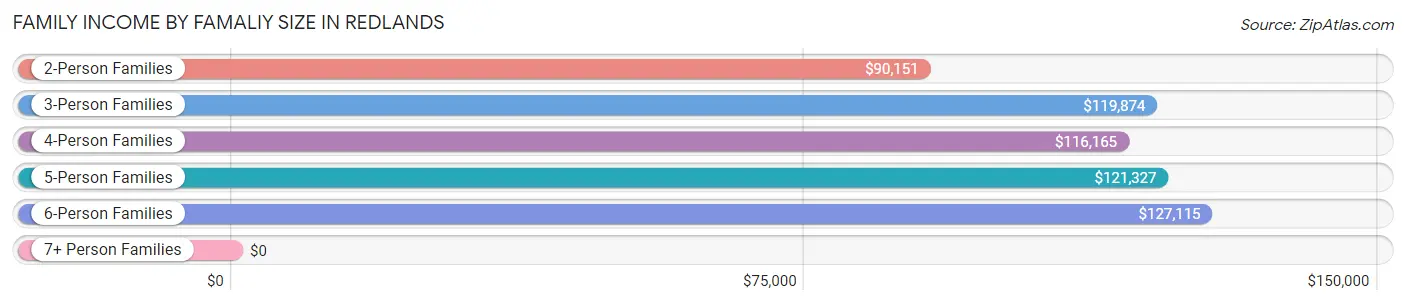
Family Income by Famaliy Size in Redlands
6-person families (560 | 3.2%) account for the highest median family income in Redlands with $127,115 per family, while 2-person families (7,067 | 40.9%) have the highest median income of $45,076 per family member.
| Income Bracket | # Families | Median Income |
| 2-Person Families | 7,067 (40.9%) | $90,151 |
| 3-Person Families | 4,436 (25.7%) | $119,874 |
| 4-Person Families | 3,291 (19.0%) | $116,165 |
| 5-Person Families | 1,486 (8.6%) | $121,327 |
| 6-Person Families | 560 (3.2%) | $127,115 |
| 7+ Person Families | 455 (2.6%) | $0 |
| Total | 17,295 (100.0%) | $107,409 |
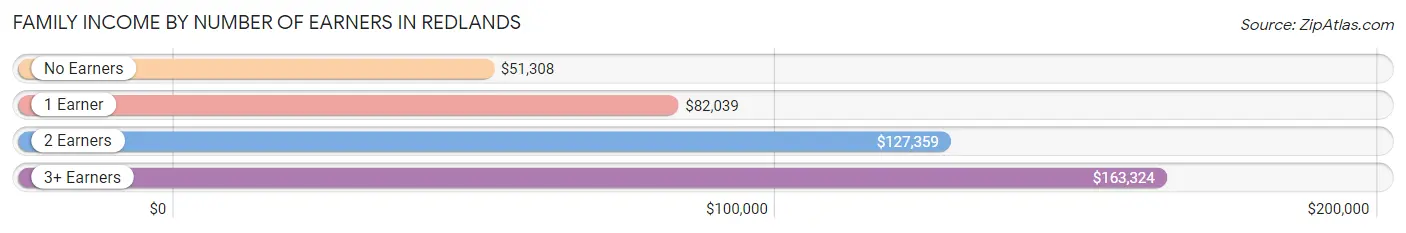
Family Income by Number of Earners in Redlands
The median family income in Redlands is $107,409, with families comprising 3+ earners (2,443) having the highest median family income of $163,324, while families with no earners (2,188) have the lowest median family income of $51,308, accounting for 14.1% and 12.7% of families, respectively.
| Number of Earners | # Families | Median Income |
| No Earners | 2,188 (12.7%) | $51,308 |
| 1 Earner | 5,703 (33.0%) | $82,039 |
| 2 Earners | 6,961 (40.3%) | $127,359 |
| 3+ Earners | 2,443 (14.1%) | $163,324 |
| Total | 17,295 (100.0%) | $107,409 |
Household Income in Redlands
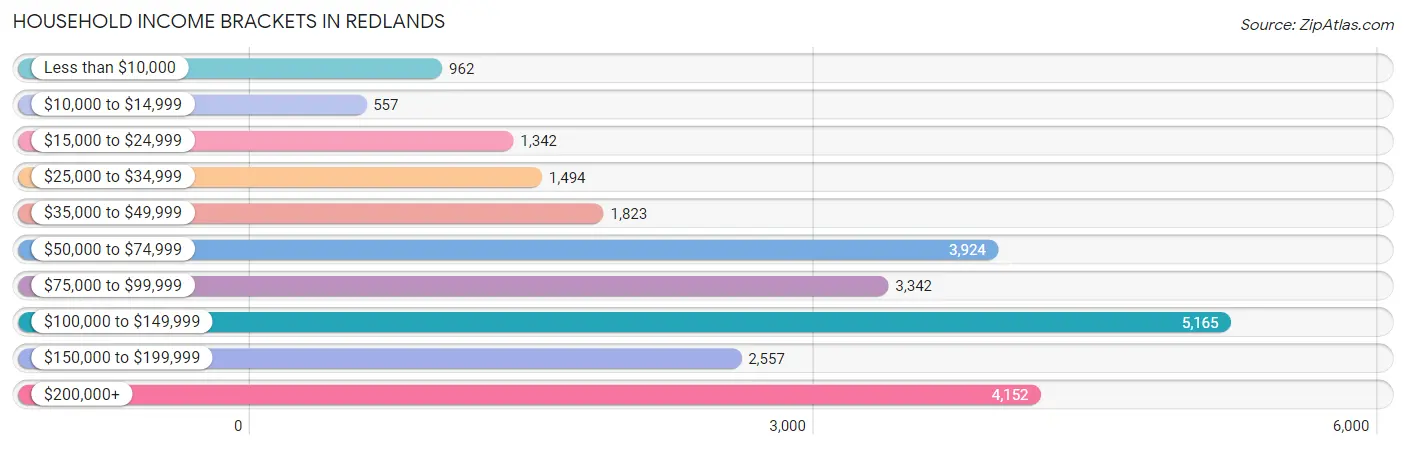
Household Income Brackets in Redlands
With 5,165 households falling in the category, the $100,000 to $149,999 income range is the most frequent in Redlands, accounting for 20.4% of all households. In contrast, only 557 households (2.2%) fall into the $10,000 to $14,999 income bracket, making it the least populous group.
| Income Bracket | # Households | % Households |
| Less than $10,000 | 962 | 3.8% |
| $10,000 to $14,999 | 557 | 2.2% |
| $15,000 to $24,999 | 1,342 | 5.3% |
| $25,000 to $34,999 | 1,494 | 5.9% |
| $35,000 to $49,999 | 1,823 | 7.2% |
| $50,000 to $74,999 | 3,924 | 15.5% |
| $75,000 to $99,999 | 3,342 | 13.2% |
| $100,000 to $149,999 | 5,165 | 20.4% |
| $150,000 to $199,999 | 2,557 | 10.1% |
| $200,000+ | 4,152 | 16.4% |
Household Income by Householder Age in Redlands
The median household income in Redlands is $94,473, with the highest median household income of $117,418 found in the 45 to 64 years age bracket for the primary householder. A total of 9,053 households (35.8%) fall into this category. Meanwhile, the 15 to 24 years age bracket for the primary householder has the lowest median household income of $53,438, with 680 households (2.7%) in this group.
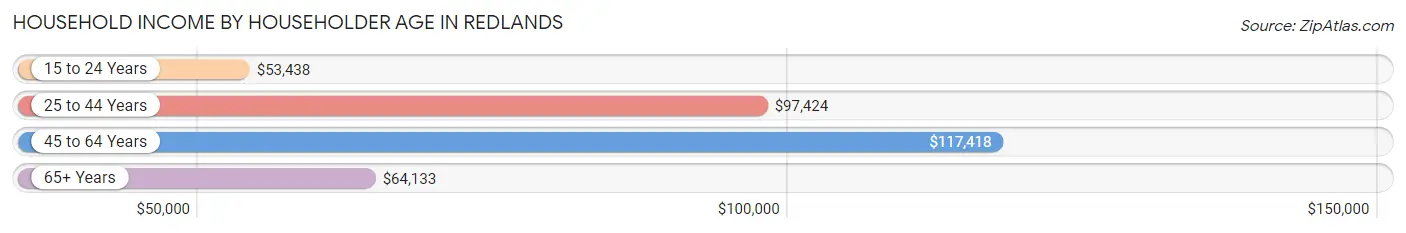
| Income Bracket | # Households | Median Income |
| 15 to 24 Years | 680 (2.7%) | $53,438 |
| 25 to 44 Years | 8,807 (34.8%) | $97,424 |
| 45 to 64 Years | 9,053 (35.8%) | $117,418 |
| 65+ Years | 6,779 (26.8%) | $64,133 |
| Total | 25,319 (100.0%) | $94,473 |
Poverty in Redlands
Income Below Poverty by Sex and Age in Redlands
With 9.1% poverty level for males and 8.1% for females among the residents of Redlands, 15 year old males and 75 year old and over females are the most vulnerable to poverty, with 110 males (20.6%) and 498 females (16.4%) in their respective age groups living below the poverty level.
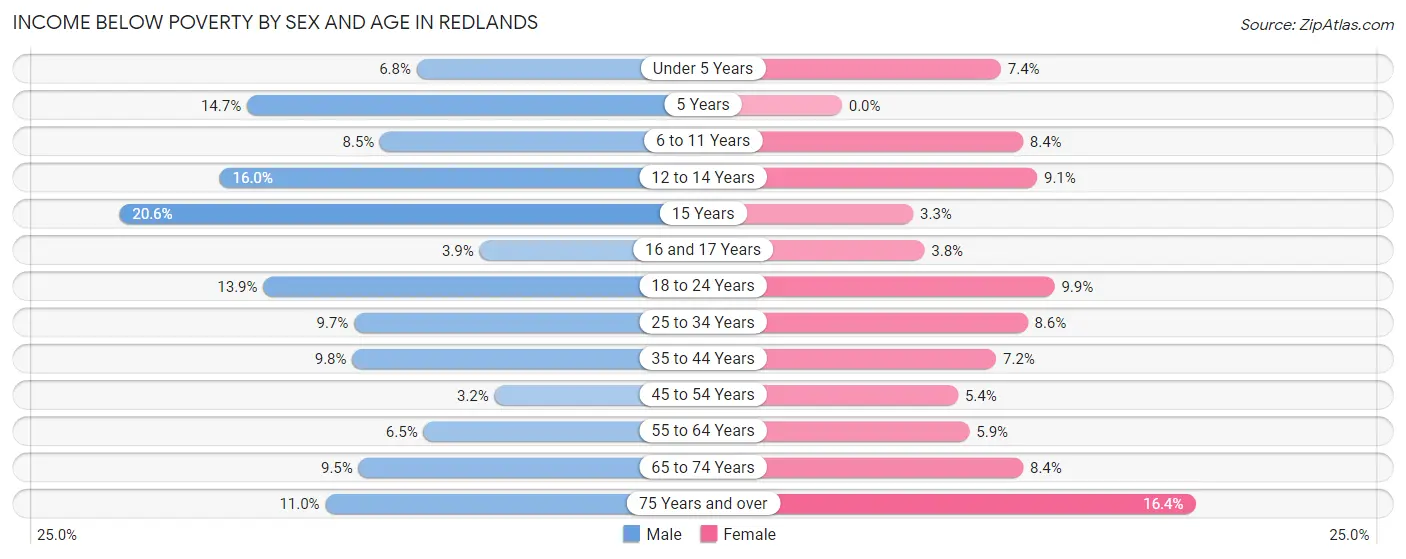
| Age Bracket | Male | Female |
| Under 5 Years | 152 (6.8%) | 153 (7.4%) |
| 5 Years | 48 (14.7%) | 0 (0.0%) |
| 6 to 11 Years | 268 (8.5%) | 192 (8.4%) |
| 12 to 14 Years | 211 (16.0%) | 149 (9.1%) |
| 15 Years | 110 (20.6%) | 13 (3.3%) |
| 16 and 17 Years | 40 (3.9%) | 28 (3.8%) |
| 18 to 24 Years | 466 (13.9%) | 329 (9.9%) |
| 25 to 34 Years | 532 (9.7%) | 492 (8.6%) |
| 35 to 44 Years | 448 (9.8%) | 349 (7.2%) |
| 45 to 54 Years | 120 (3.2%) | 226 (5.4%) |
| 55 to 64 Years | 257 (6.5%) | 253 (5.9%) |
| 65 to 74 Years | 251 (9.5%) | 271 (8.4%) |
| 75 Years and over | 202 (11.0%) | 498 (16.4%) |
| Total | 3,105 (9.1%) | 2,953 (8.1%) |
Income Above Poverty by Sex and Age in Redlands
According to the poverty statistics in Redlands, males aged 45 to 54 years and females aged 5 years are the age groups that are most secure financially, with 96.8% of males and 100.0% of females in these age groups living above the poverty line.
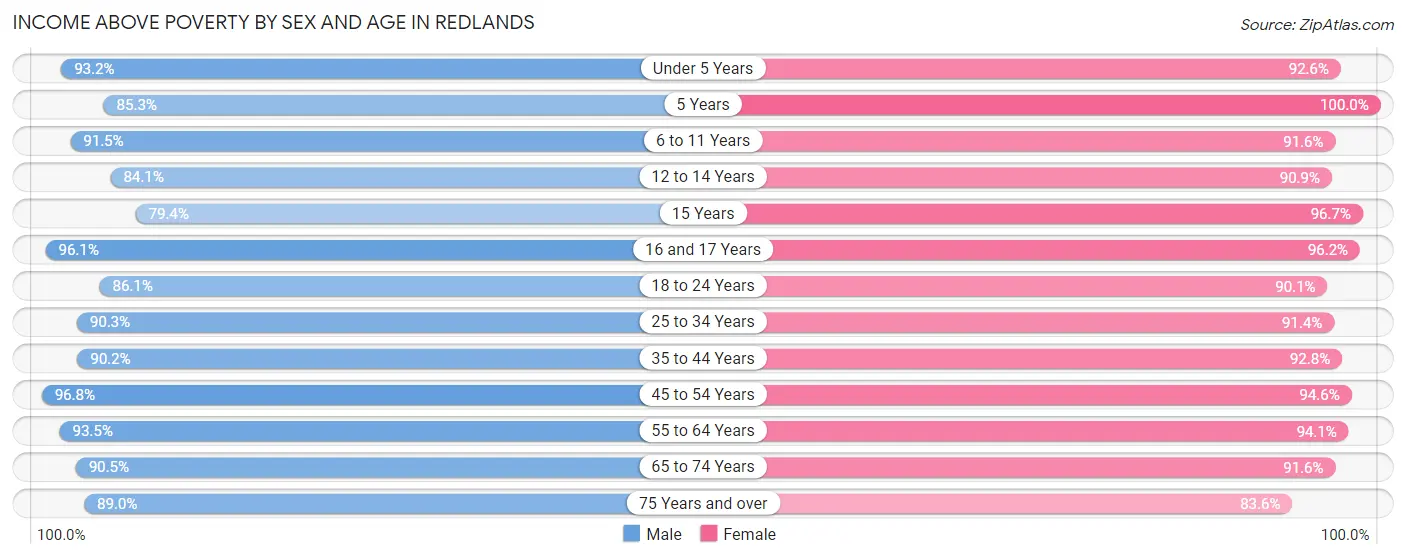
| Age Bracket | Male | Female |
| Under 5 Years | 2,082 (93.2%) | 1,919 (92.6%) |
| 5 Years | 279 (85.3%) | 781 (100.0%) |
| 6 to 11 Years | 2,886 (91.5%) | 2,095 (91.6%) |
| 12 to 14 Years | 1,112 (84.1%) | 1,496 (90.9%) |
| 15 Years | 424 (79.4%) | 380 (96.7%) |
| 16 and 17 Years | 988 (96.1%) | 704 (96.2%) |
| 18 to 24 Years | 2,882 (86.1%) | 3,005 (90.1%) |
| 25 to 34 Years | 4,945 (90.3%) | 5,218 (91.4%) |
| 35 to 44 Years | 4,126 (90.2%) | 4,528 (92.8%) |
| 45 to 54 Years | 3,647 (96.8%) | 3,965 (94.6%) |
| 55 to 64 Years | 3,702 (93.5%) | 4,019 (94.1%) |
| 65 to 74 Years | 2,391 (90.5%) | 2,952 (91.6%) |
| 75 Years and over | 1,628 (89.0%) | 2,538 (83.6%) |
| Total | 31,092 (90.9%) | 33,600 (91.9%) |
Income Below Poverty Among Married-Couple Families in Redlands
The poverty statistics for married-couple families in Redlands show that 4.0% or 509 of the total 12,662 families live below the poverty line. Families with 5 or more children have the highest poverty rate of 40.4%, comprising of 42 families. On the other hand, families with no children have the lowest poverty rate of 3.5%, which includes 251 families.
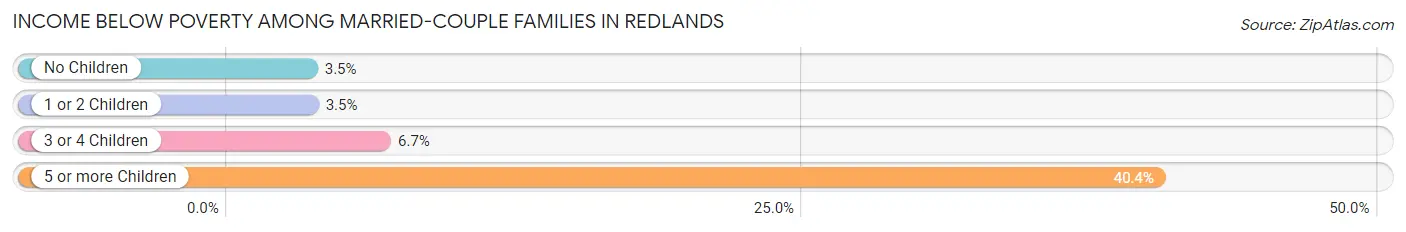
| Children | Above Poverty | Below Poverty |
| No Children | 6,983 (96.5%) | 251 (3.5%) |
| 1 or 2 Children | 4,239 (96.5%) | 154 (3.5%) |
| 3 or 4 Children | 869 (93.3%) | 62 (6.7%) |
| 5 or more Children | 62 (59.6%) | 42 (40.4%) |
| Total | 12,153 (96.0%) | 509 (4.0%) |
Income Below Poverty Among Single-Parent Households in Redlands
According to the poverty data in Redlands, 17.1% or 240 single-father households and 6.5% or 210 single-mother households are living below the poverty line. Among single-father households, those with 5 or more children have the highest poverty rate, with 8 households (22.9%) experiencing poverty. Likewise, among single-mother households, those with 3 or 4 children have the highest poverty rate, with 64 households (22.9%) falling below the poverty line.
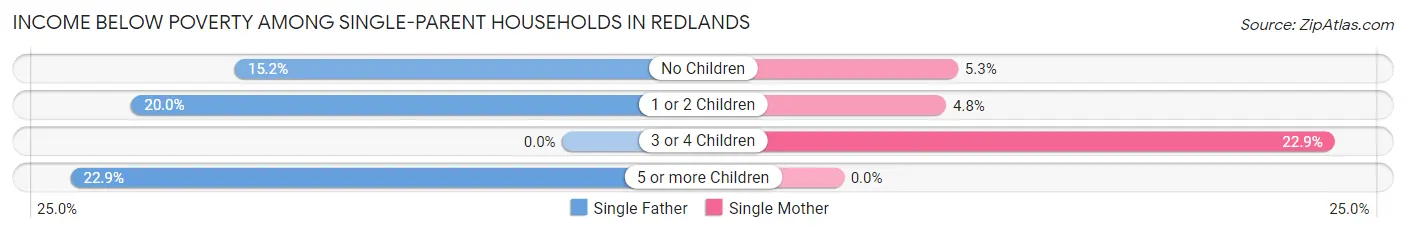
| Children | Single Father | Single Mother |
| No Children | 103 (15.2%) | 75 (5.3%) |
| 1 or 2 Children | 129 (20.0%) | 71 (4.8%) |
| 3 or 4 Children | 0 (0.0%) | 64 (22.9%) |
| 5 or more Children | 8 (22.9%) | 0 (0.0%) |
| Total | 240 (17.1%) | 210 (6.5%) |
Income Below Poverty Among Married-Couple vs Single-Parent Households in Redlands
The poverty data for Redlands shows that 509 of the married-couple family households (4.0%) and 450 of the single-parent households (9.7%) are living below the poverty level. Within the married-couple family households, those with 5 or more children have the highest poverty rate, with 42 households (40.4%) falling below the poverty line. Among the single-parent households, those with 3 or 4 children have the highest poverty rate, with 64 household (19.6%) living below poverty.
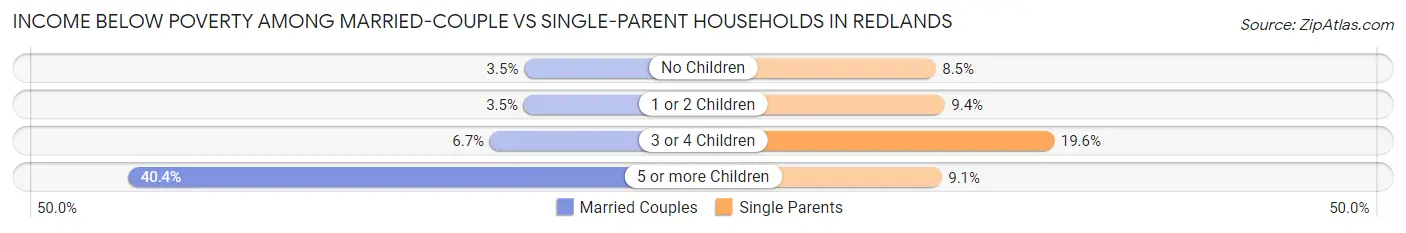
| Children | Married-Couple Families | Single-Parent Households |
| No Children | 251 (3.5%) | 178 (8.5%) |
| 1 or 2 Children | 154 (3.5%) | 200 (9.4%) |
| 3 or 4 Children | 62 (6.7%) | 64 (19.6%) |
| 5 or more Children | 42 (40.4%) | 8 (9.1%) |
| Total | 509 (4.0%) | 450 (9.7%) |
Race in Redlands
The most populous races in Redlands are White / Caucasian (42,307 | 57.8%), Hispanic or Latino (27,560 | 37.6%), and Two or more Races (10,243 | 14.0%).
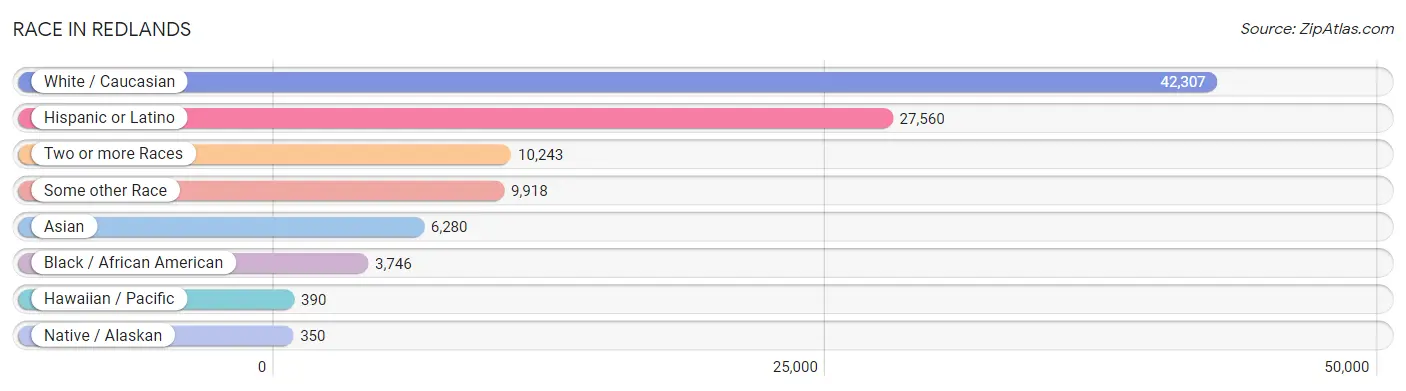
| Race | # Population | % Population |
| Asian | 6,280 | 8.6% |
| Black / African American | 3,746 | 5.1% |
| Hawaiian / Pacific | 390 | 0.5% |
| Hispanic or Latino | 27,560 | 37.6% |
| Native / Alaskan | 350 | 0.5% |
| White / Caucasian | 42,307 | 57.8% |
| Two or more Races | 10,243 | 14.0% |
| Some other Race | 9,918 | 13.5% |
| Total | 73,234 | 100.0% |
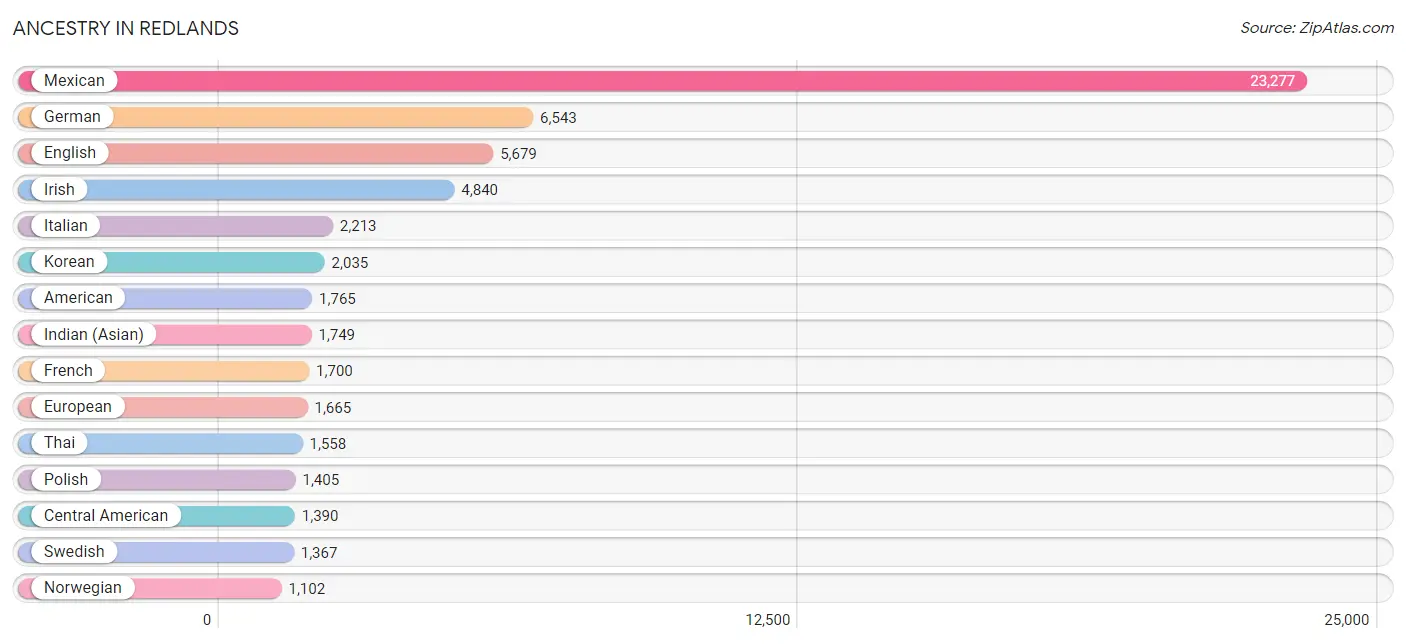
Ancestry in Redlands
The most populous ancestries reported in Redlands are Mexican (23,277 | 31.8%), German (6,543 | 8.9%), English (5,679 | 7.7%), Irish (4,840 | 6.6%), and Italian (2,213 | 3.0%), together accounting for 58.1% of all Redlands residents.
| Ancestry | # Population | % Population |
| Afghan | 125 | 0.2% |
| African | 126 | 0.2% |
| Alaskan Athabascan | 7 | 0.0% |
| American | 1,765 | 2.4% |
| Arab | 640 | 0.9% |
| Argentinean | 24 | 0.0% |
| Armenian | 101 | 0.1% |
| Australian | 16 | 0.0% |
| Austrian | 141 | 0.2% |
| Bangladeshi | 9 | 0.0% |
| Barbadian | 7 | 0.0% |
| Basque | 9 | 0.0% |
| Belgian | 64 | 0.1% |
| Belizean | 71 | 0.1% |
| Bhutanese | 257 | 0.4% |
| Blackfeet | 17 | 0.0% |
| Bolivian | 14 | 0.0% |
| Brazilian | 55 | 0.1% |
| British | 470 | 0.6% |
| British West Indian | 101 | 0.1% |
| Bulgarian | 13 | 0.0% |
| Burmese | 853 | 1.2% |
| Canadian | 178 | 0.2% |
| Cape Verdean | 17 | 0.0% |
| Celtic | 14 | 0.0% |
| Central American | 1,390 | 1.9% |
| Central American Indian | 414 | 0.6% |
| Cherokee | 216 | 0.3% |
| Chickasaw | 48 | 0.1% |
| Chilean | 83 | 0.1% |
| Choctaw | 33 | 0.1% |
| Colombian | 212 | 0.3% |
| Croatian | 24 | 0.0% |
| Cuban | 126 | 0.2% |
| Czech | 31 | 0.0% |
| Czechoslovakian | 22 | 0.0% |
| Danish | 342 | 0.5% |
| Dominican | 128 | 0.2% |
| Dutch | 986 | 1.3% |
| Eastern European | 200 | 0.3% |
| Ecuadorian | 129 | 0.2% |
| Egyptian | 142 | 0.2% |
| English | 5,679 | 7.7% |
| Estonian | 9 | 0.0% |
| Ethiopian | 157 | 0.2% |
| European | 1,665 | 2.3% |
| Filipino | 42 | 0.1% |
| Finnish | 51 | 0.1% |
| French | 1,700 | 2.3% |
| French Canadian | 145 | 0.2% |
| German | 6,543 | 8.9% |
| Ghanaian | 61 | 0.1% |
| Greek | 363 | 0.5% |
| Guamanian / Chamorro | 34 | 0.1% |
| Guatemalan | 426 | 0.6% |
| Haitian | 48 | 0.1% |
| Honduran | 16 | 0.0% |
| Hungarian | 354 | 0.5% |
| Indian (Asian) | 1,749 | 2.4% |
| Indonesian | 56 | 0.1% |
| Iranian | 314 | 0.4% |
| Iraqi | 30 | 0.0% |
| Irish | 4,840 | 6.6% |
| Iroquois | 22 | 0.0% |
| Israeli | 16 | 0.0% |
| Italian | 2,213 | 3.0% |
| Jamaican | 126 | 0.2% |
| Japanese | 35 | 0.1% |
| Jordanian | 8 | 0.0% |
| Korean | 2,035 | 2.8% |
| Laotian | 373 | 0.5% |
| Latvian | 49 | 0.1% |
| Lebanese | 64 | 0.1% |
| Lithuanian | 88 | 0.1% |
| Luxembourger | 9 | 0.0% |
| Malaysian | 52 | 0.1% |
| Mexican | 23,277 | 31.8% |
| Mexican American Indian | 193 | 0.3% |
| Mongolian | 8 | 0.0% |
| Native Hawaiian | 357 | 0.5% |
| Navajo | 104 | 0.1% |
| Nicaraguan | 66 | 0.1% |
| Nigerian | 173 | 0.2% |
| Northern European | 170 | 0.2% |
| Norwegian | 1,102 | 1.5% |
| Pakistani | 112 | 0.2% |
| Panamanian | 48 | 0.1% |
| Pennsylvania German | 40 | 0.1% |
| Peruvian | 192 | 0.3% |
| Polish | 1,405 | 1.9% |
| Portuguese | 246 | 0.3% |
| Potawatomi | 5 | 0.0% |
| Puerto Rican | 542 | 0.7% |
| Romanian | 301 | 0.4% |
| Russian | 504 | 0.7% |
| Salvadoran | 834 | 1.1% |
| Samoan | 380 | 0.5% |
| Scandinavian | 189 | 0.3% |
| Scotch-Irish | 342 | 0.5% |
| Scottish | 917 | 1.3% |
| Serbian | 37 | 0.1% |
| Sioux | 53 | 0.1% |
| Slavic | 6 | 0.0% |
| Slovak | 88 | 0.1% |
| Slovene | 23 | 0.0% |
| South American | 812 | 1.1% |
| South American Indian | 16 | 0.0% |
| Spaniard | 442 | 0.6% |
| Spanish | 527 | 0.7% |
| Spanish American | 49 | 0.1% |
| Sri Lankan | 777 | 1.1% |
| Subsaharan African | 553 | 0.8% |
| Swedish | 1,367 | 1.9% |
| Swiss | 196 | 0.3% |
| Syrian | 105 | 0.1% |
| Thai | 1,558 | 2.1% |
| Turkish | 44 | 0.1% |
| Ukrainian | 180 | 0.3% |
| Venezuelan | 158 | 0.2% |
| Vietnamese | 56 | 0.1% |
| Welsh | 394 | 0.5% |
| Yugoslavian | 34 | 0.1% | View All 122 Rows |
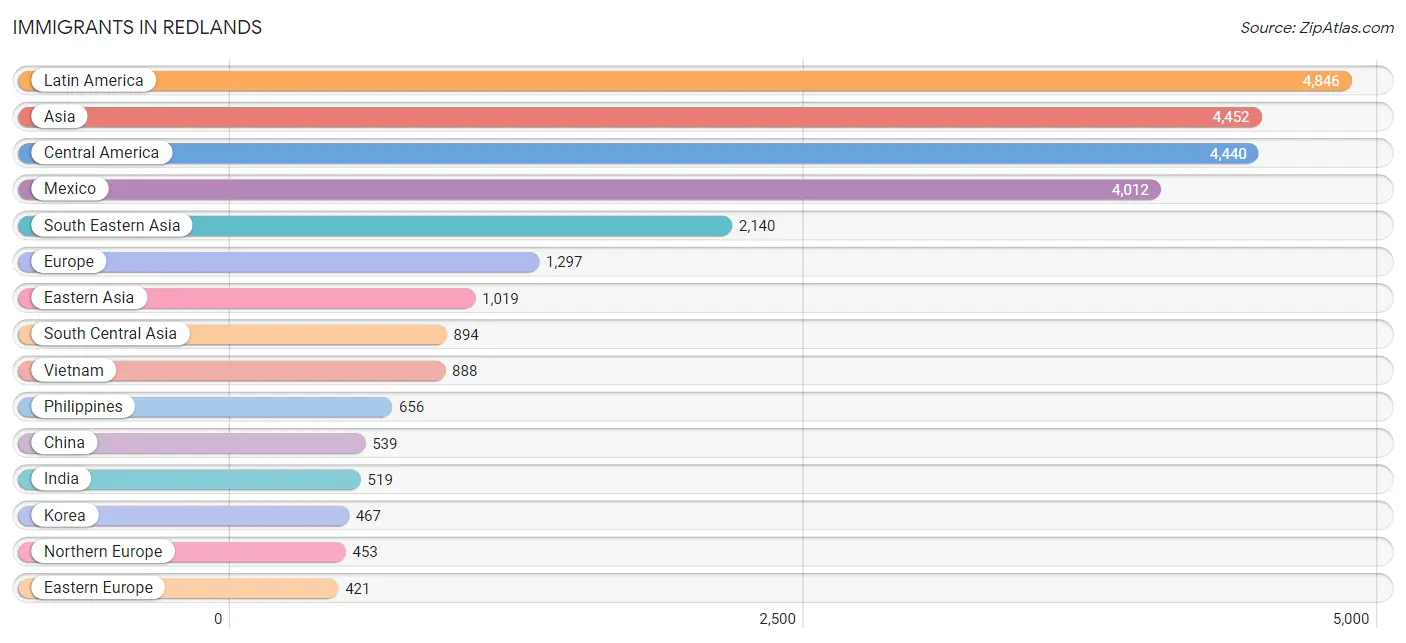
Immigrants in Redlands
The most numerous immigrant groups reported in Redlands came from Latin America (4,846 | 6.6%), Asia (4,452 | 6.1%), Central America (4,440 | 6.1%), Mexico (4,012 | 5.5%), and South Eastern Asia (2,140 | 2.9%), together accounting for 27.2% of all Redlands residents.
| Immigration Origin | # Population | % Population |
| Afghanistan | 53 | 0.1% |
| Africa | 360 | 0.5% |
| Asia | 4,452 | 6.1% |
| Australia | 30 | 0.0% |
| Austria | 16 | 0.0% |
| Azores | 31 | 0.0% |
| Bangladesh | 40 | 0.1% |
| Belize | 36 | 0.1% |
| Bolivia | 10 | 0.0% |
| Brazil | 56 | 0.1% |
| Cambodia | 74 | 0.1% |
| Canada | 202 | 0.3% |
| Caribbean | 97 | 0.1% |
| Central America | 4,440 | 6.1% |
| Chile | 41 | 0.1% |
| China | 539 | 0.7% |
| Cuba | 6 | 0.0% |
| Czechoslovakia | 19 | 0.0% |
| Denmark | 31 | 0.0% |
| Eastern Africa | 86 | 0.1% |
| Eastern Asia | 1,019 | 1.4% |
| Eastern Europe | 421 | 0.6% |
| Ecuador | 44 | 0.1% |
| Egypt | 127 | 0.2% |
| El Salvador | 175 | 0.2% |
| England | 248 | 0.3% |
| Eritrea | 30 | 0.0% |
| Ethiopia | 56 | 0.1% |
| Europe | 1,297 | 1.8% |
| France | 30 | 0.0% |
| Germany | 84 | 0.1% |
| Ghana | 61 | 0.1% |
| Greece | 61 | 0.1% |
| Guatemala | 171 | 0.2% |
| Haiti | 32 | 0.0% |
| Hong Kong | 75 | 0.1% |
| Hungary | 41 | 0.1% |
| India | 519 | 0.7% |
| Indonesia | 177 | 0.2% |
| Iran | 136 | 0.2% |
| Iraq | 35 | 0.1% |
| Israel | 28 | 0.0% |
| Italy | 89 | 0.1% |
| Jamaica | 42 | 0.1% |
| Japan | 13 | 0.0% |
| Jordan | 2 | 0.0% |
| Korea | 467 | 0.6% |
| Kuwait | 44 | 0.1% |
| Laos | 18 | 0.0% |
| Latin America | 4,846 | 6.6% |
| Malaysia | 151 | 0.2% |
| Mexico | 4,012 | 5.5% |
| Netherlands | 10 | 0.0% |
| Nicaragua | 36 | 0.1% |
| Nigeria | 23 | 0.0% |
| Northern Africa | 168 | 0.2% |
| Northern Europe | 453 | 0.6% |
| Oceania | 87 | 0.1% |
| Pakistan | 132 | 0.2% |
| Panama | 10 | 0.0% |
| Peru | 108 | 0.2% |
| Philippines | 656 | 0.9% |
| Poland | 85 | 0.1% |
| Portugal | 42 | 0.1% |
| Romania | 91 | 0.1% |
| Russia | 34 | 0.1% |
| Saudi Arabia | 9 | 0.0% |
| Scotland | 9 | 0.0% |
| Serbia | 3 | 0.0% |
| South Africa | 22 | 0.0% |
| South America | 309 | 0.4% |
| South Central Asia | 894 | 1.2% |
| South Eastern Asia | 2,140 | 2.9% |
| Southern Europe | 206 | 0.3% |
| Spain | 14 | 0.0% |
| Sri Lanka | 14 | 0.0% |
| Sweden | 9 | 0.0% |
| Switzerland | 77 | 0.1% |
| Syria | 209 | 0.3% |
| Taiwan | 105 | 0.1% |
| Thailand | 112 | 0.2% |
| Trinidad and Tobago | 17 | 0.0% |
| Turkey | 56 | 0.1% |
| Ukraine | 27 | 0.0% |
| Venezuela | 50 | 0.1% |
| Vietnam | 888 | 1.2% |
| Western Africa | 84 | 0.1% |
| Western Asia | 383 | 0.5% |
| Western Europe | 217 | 0.3% | View All 89 Rows |
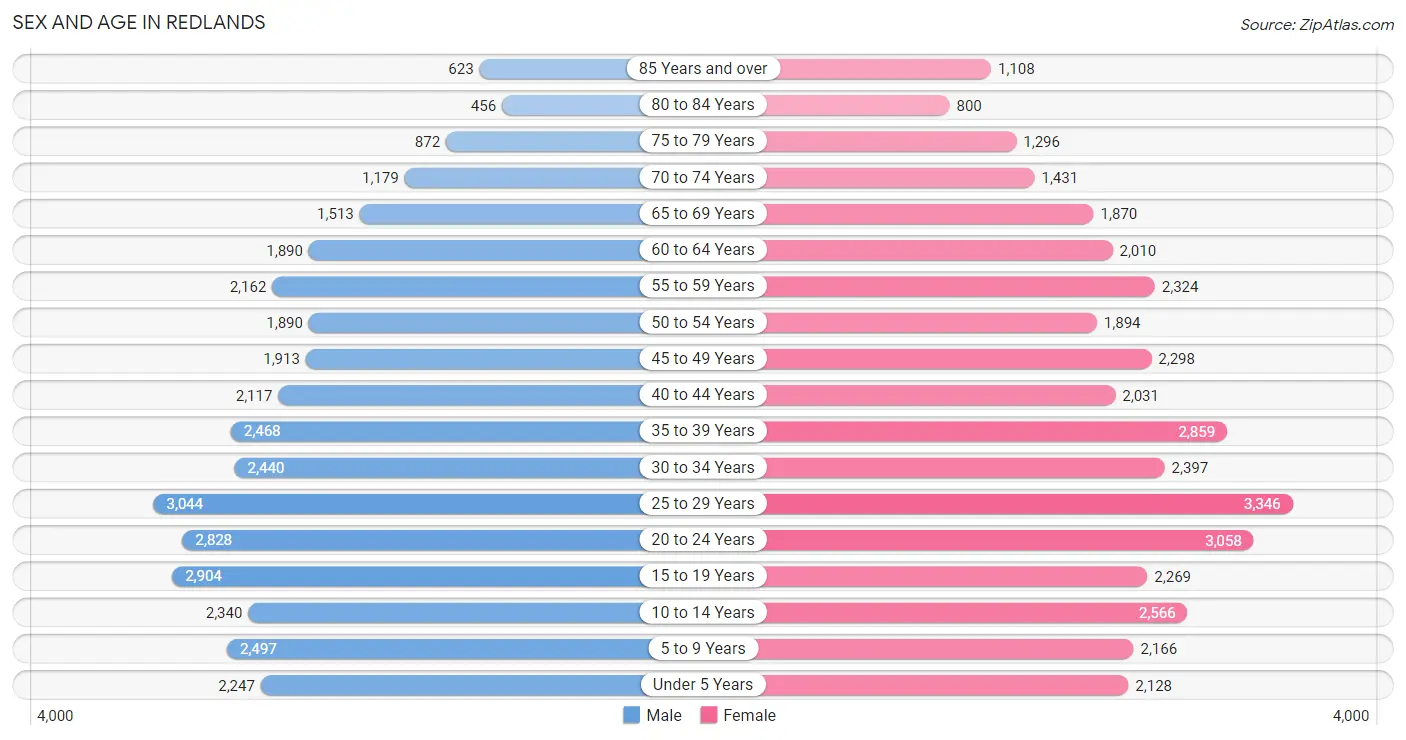
Sex and Age in Redlands
Sex and Age in Redlands
The most populous age groups in Redlands are 25 to 29 Years (3,044 | 8.6%) for men and 25 to 29 Years (3,346 | 8.8%) for women.
| Age Bracket | Male | Female |
| Under 5 Years | 2,247 (6.4%) | 2,128 (5.6%) |
| 5 to 9 Years | 2,497 (7.1%) | 2,166 (5.7%) |
| 10 to 14 Years | 2,340 (6.6%) | 2,566 (6.8%) |
| 15 to 19 Years | 2,904 (8.2%) | 2,269 (6.0%) |
| 20 to 24 Years | 2,828 (8.0%) | 3,058 (8.1%) |
| 25 to 29 Years | 3,044 (8.6%) | 3,346 (8.8%) |
| 30 to 34 Years | 2,440 (6.9%) | 2,397 (6.3%) |
| 35 to 39 Years | 2,468 (7.0%) | 2,859 (7.5%) |
| 40 to 44 Years | 2,117 (6.0%) | 2,031 (5.4%) |
| 45 to 49 Years | 1,913 (5.4%) | 2,298 (6.1%) |
| 50 to 54 Years | 1,890 (5.3%) | 1,894 (5.0%) |
| 55 to 59 Years | 2,162 (6.1%) | 2,324 (6.1%) |
| 60 to 64 Years | 1,890 (5.3%) | 2,010 (5.3%) |
| 65 to 69 Years | 1,513 (4.3%) | 1,870 (4.9%) |
| 70 to 74 Years | 1,179 (3.3%) | 1,431 (3.8%) |
| 75 to 79 Years | 872 (2.5%) | 1,296 (3.4%) |
| 80 to 84 Years | 456 (1.3%) | 800 (2.1%) |
| 85 Years and over | 623 (1.8%) | 1,108 (2.9%) |
| Total | 35,383 (100.0%) | 37,851 (100.0%) |
Families and Households in Redlands
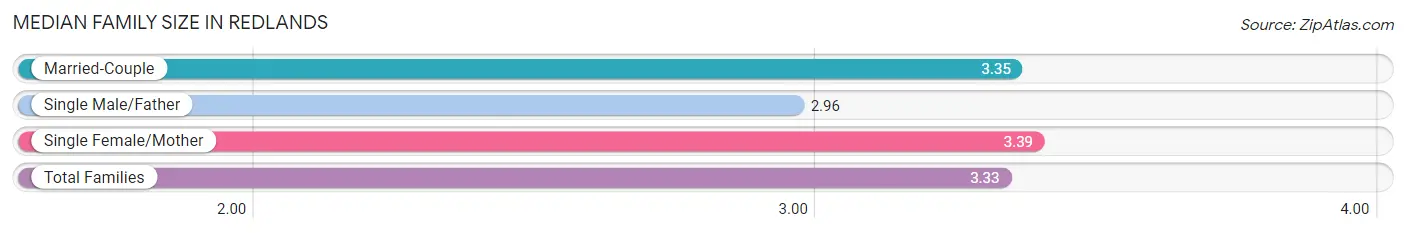
Median Family Size in Redlands
The median family size in Redlands is 3.33 persons per family, with single female/mother families (3,230 | 18.7%) accounting for the largest median family size of 3.39 persons per family. On the other hand, single male/father families (1,403 | 8.1%) represent the smallest median family size with 2.96 persons per family.
| Family Type | # Families | Family Size |
| Married-Couple | 12,662 (73.2%) | 3.35 |
| Single Male/Father | 1,403 (8.1%) | 2.96 |
| Single Female/Mother | 3,230 (18.7%) | 3.39 |
| Total Families | 17,295 (100.0%) | 3.33 |
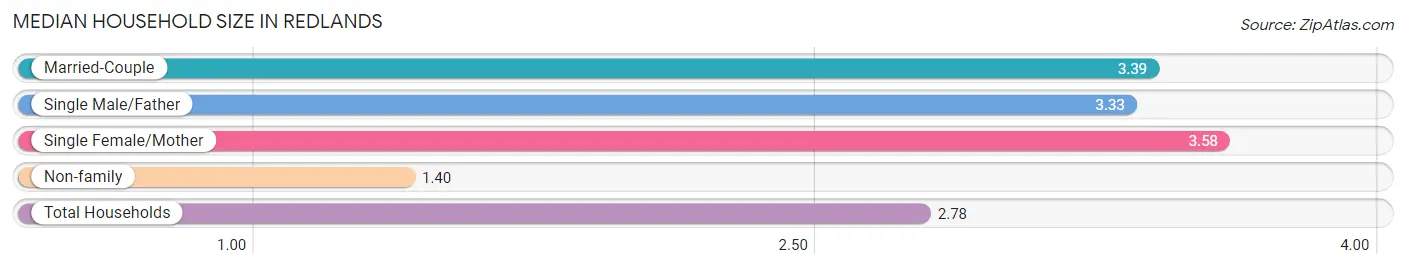
Median Household Size in Redlands
The median household size in Redlands is 2.78 persons per household, with single female/mother households (3,230 | 12.8%) accounting for the largest median household size of 3.58 persons per household. non-family households (8,024 | 31.7%) represent the smallest median household size with 1.40 persons per household.
| Household Type | # Households | Household Size |
| Married-Couple | 12,662 (50.0%) | 3.39 |
| Single Male/Father | 1,403 (5.5%) | 3.33 |
| Single Female/Mother | 3,230 (12.8%) | 3.58 |
| Non-family | 8,024 (31.7%) | 1.40 |
| Total Households | 25,319 (100.0%) | 2.78 |
Household Size by Marriage Status in Redlands
Out of a total of 25,319 households in Redlands, 17,295 (68.3%) are family households, while 8,024 (31.7%) are nonfamily households. The most numerous type of family households are 2-person households, comprising 6,486, and the most common type of nonfamily households are 1-person households, comprising 5,893.
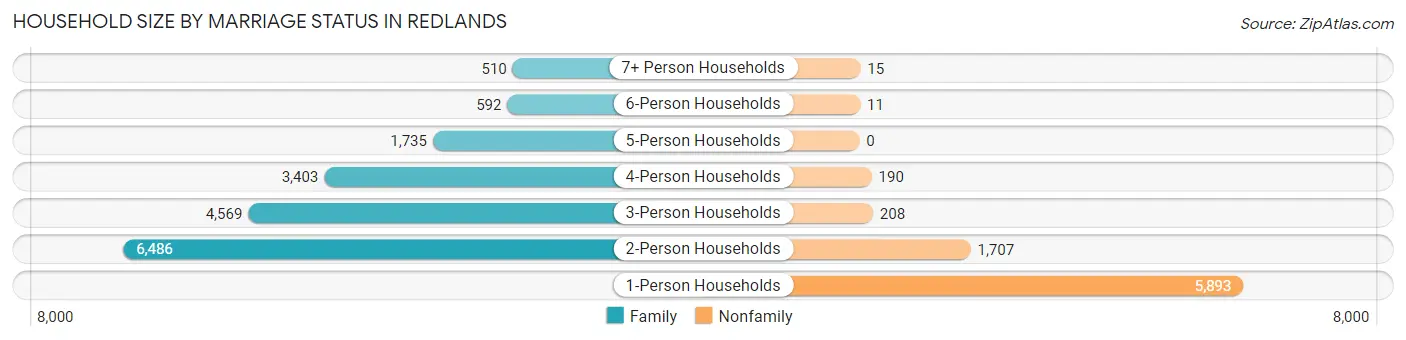
| Household Size | Family Households | Nonfamily Households |
| 1-Person Households | - | 5,893 (23.3%) |
| 2-Person Households | 6,486 (25.6%) | 1,707 (6.7%) |
| 3-Person Households | 4,569 (18.0%) | 208 (0.8%) |
| 4-Person Households | 3,403 (13.4%) | 190 (0.7%) |
| 5-Person Households | 1,735 (6.9%) | 0 (0.0%) |
| 6-Person Households | 592 (2.3%) | 11 (0.0%) |
| 7+ Person Households | 510 (2.0%) | 15 (0.1%) |
| Total | 17,295 (68.3%) | 8,024 (31.7%) |
Female Fertility in Redlands
Fertility by Age in Redlands
Average fertility rate in Redlands is 47.0 births per 1,000 women. Women in the age bracket of 20 to 34 years have the highest fertility rate with 67.0 births per 1,000 women. Women in the age bracket of 20 to 34 years acount for 67.7% of all women with births.
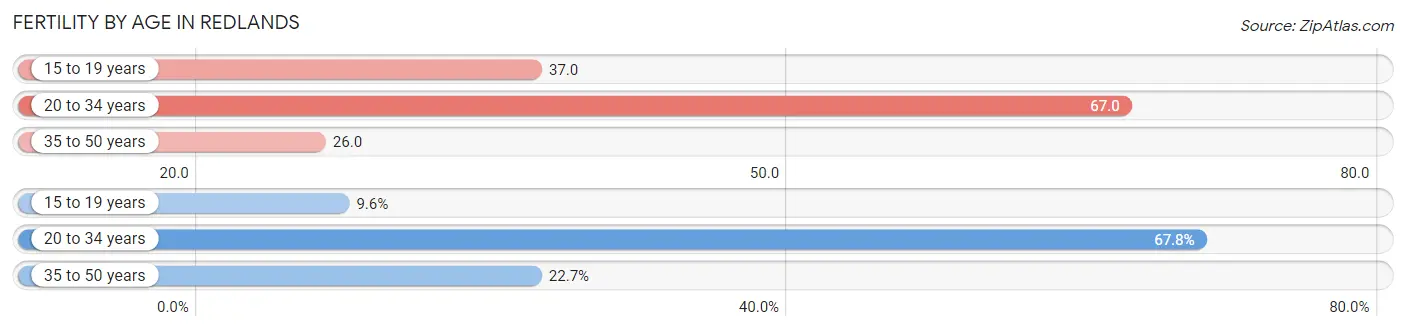
| Age Bracket | Women with Births | Births / 1,000 Women |
| 15 to 19 years | 83 (9.6%) | 37.0 |
| 20 to 34 years | 586 (67.7%) | 67.0 |
| 35 to 50 years | 196 (22.7%) | 26.0 |
| Total | 865 (100.0%) | 47.0 |
Fertility by Age by Marriage Status in Redlands
53.9% of women with births (865) in Redlands are married. The highest percentage of unmarried women with births falls into 15 to 19 years age bracket with 100.0% of them unmarried at the time of birth, while the lowest percentage of unmarried women with births belong to 35 to 50 years age bracket with 16.3% of them unmarried.
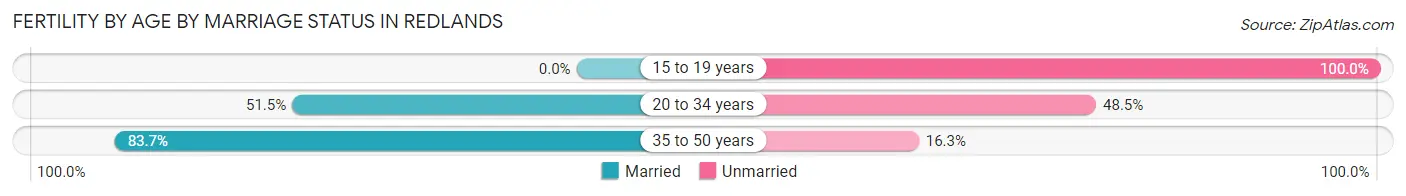
| Age Bracket | Married | Unmarried |
| 15 to 19 years | 0 (0.0%) | 83 (100.0%) |
| 20 to 34 years | 302 (51.5%) | 284 (48.5%) |
| 35 to 50 years | 164 (83.7%) | 32 (16.3%) |
| Total | 466 (53.9%) | 399 (46.1%) |
Fertility by Education in Redlands
Average fertility rate in Redlands is 47.0 births per 1,000 women. Women with the education attainment of high school diploma have the highest fertility rate of 76.0 births per 1,000 women, while women with the education attainment of college or associate's degree have the lowest fertility at 25.0 births per 1,000 women. Women with the education attainment of high school diploma represent 32.4% of all women with births.
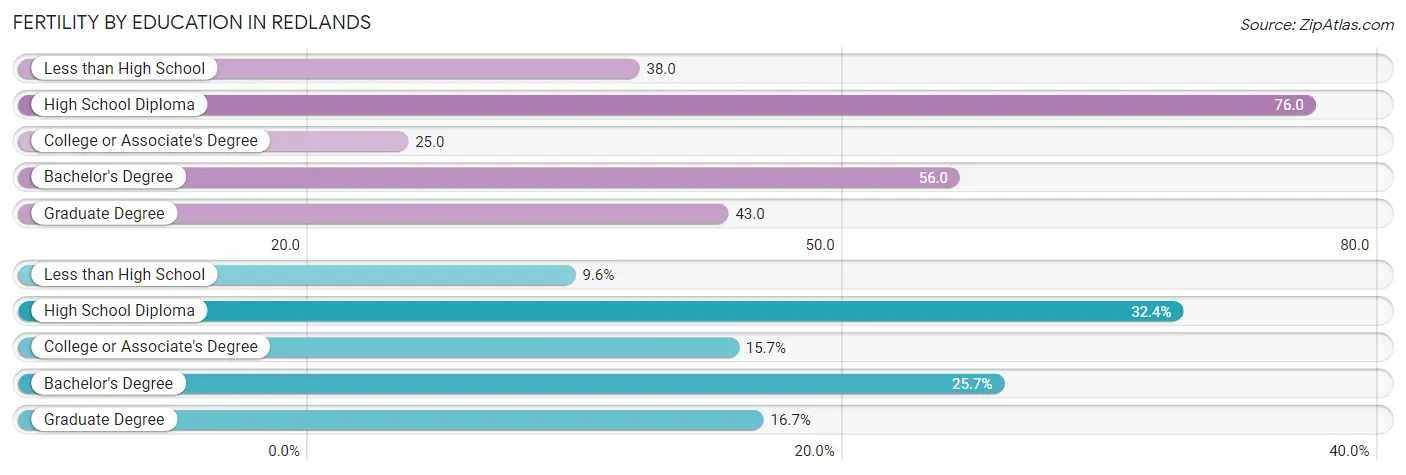
| Educational Attainment | Women with Births | Births / 1,000 Women |
| Less than High School | 83 (9.6%) | 38.0 |
| High School Diploma | 280 (32.4%) | 76.0 |
| College or Associate's Degree | 136 (15.7%) | 25.0 |
| Bachelor's Degree | 222 (25.7%) | 56.0 |
| Graduate Degree | 144 (16.7%) | 43.0 |
| Total | 865 (100.0%) | 47.0 |
Fertility by Education by Marriage Status in Redlands
46.1% of women with births in Redlands are unmarried. Women with the educational attainment of bachelor's degree are most likely to be married with 100.0% of them married at childbirth, while women with the educational attainment of less than high school are least likely to be married with 100.0% of them unmarried at childbirth.
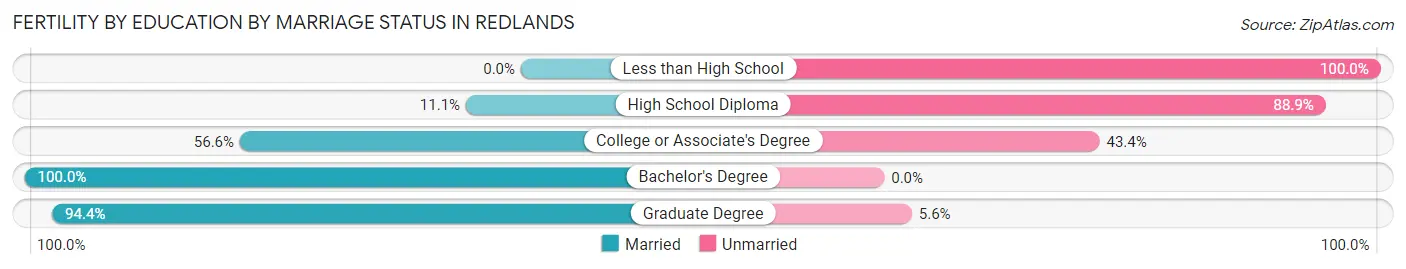
| Educational Attainment | Married | Unmarried |
| Less than High School | 0 (0.0%) | 83 (100.0%) |
| High School Diploma | 31 (11.1%) | 249 (88.9%) |
| College or Associate's Degree | 77 (56.6%) | 59 (43.4%) |
| Bachelor's Degree | 222 (100.0%) | 0 (0.0%) |
| Graduate Degree | 136 (94.4%) | 8 (5.6%) |
| Total | 466 (53.9%) | 399 (46.1%) |
Employment Characteristics in Redlands
Employment by Class of Employer in Redlands
Among the 33,625 employed individuals in Redlands, private company employees (20,103 | 59.8%), local government employees (4,203 | 12.5%), and not-for-profit organizations (3,479 | 10.3%) make up the most common classes of employment.
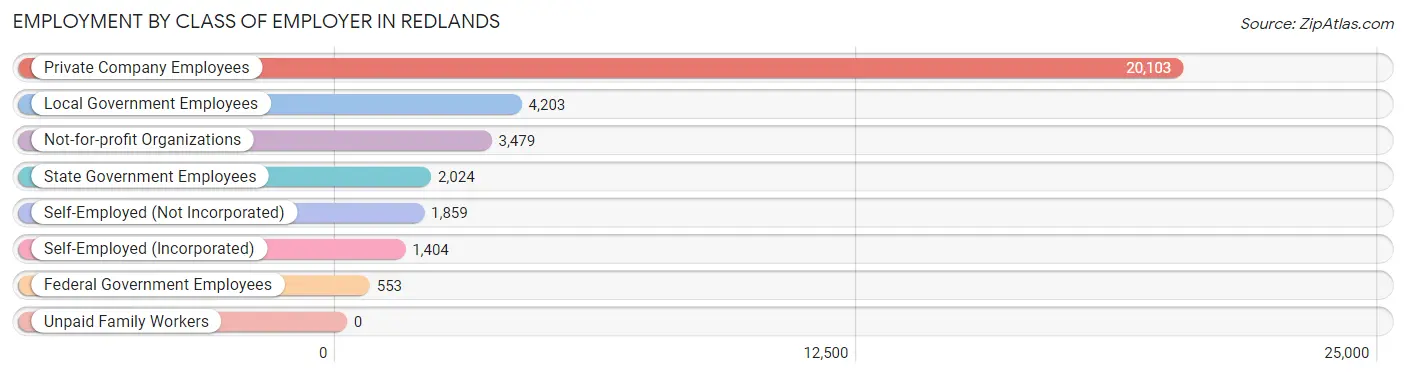
| Employer Class | # Employees | % Employees |
| Private Company Employees | 20,103 | 59.8% |
| Self-Employed (Incorporated) | 1,404 | 4.2% |
| Self-Employed (Not Incorporated) | 1,859 | 5.5% |
| Not-for-profit Organizations | 3,479 | 10.3% |
| Local Government Employees | 4,203 | 12.5% |
| State Government Employees | 2,024 | 6.0% |
| Federal Government Employees | 553 | 1.6% |
| Unpaid Family Workers | 0 | 0.0% |
| Total | 33,625 | 100.0% |
Employment Status by Age in Redlands
According to the labor force statistics for Redlands, out of the total population over 16 years of age (58,361), 63.3% or 36,943 individuals are in the labor force, with 6.5% or 2,401 of them unemployed. The age group with the highest labor force participation rate is 30 to 34 years, with 84.4% or 4,082 individuals in the labor force. Within the labor force, the 16 to 19 years age range has the highest percentage of unemployed individuals, with 23.6% or 317 of them being unemployed.
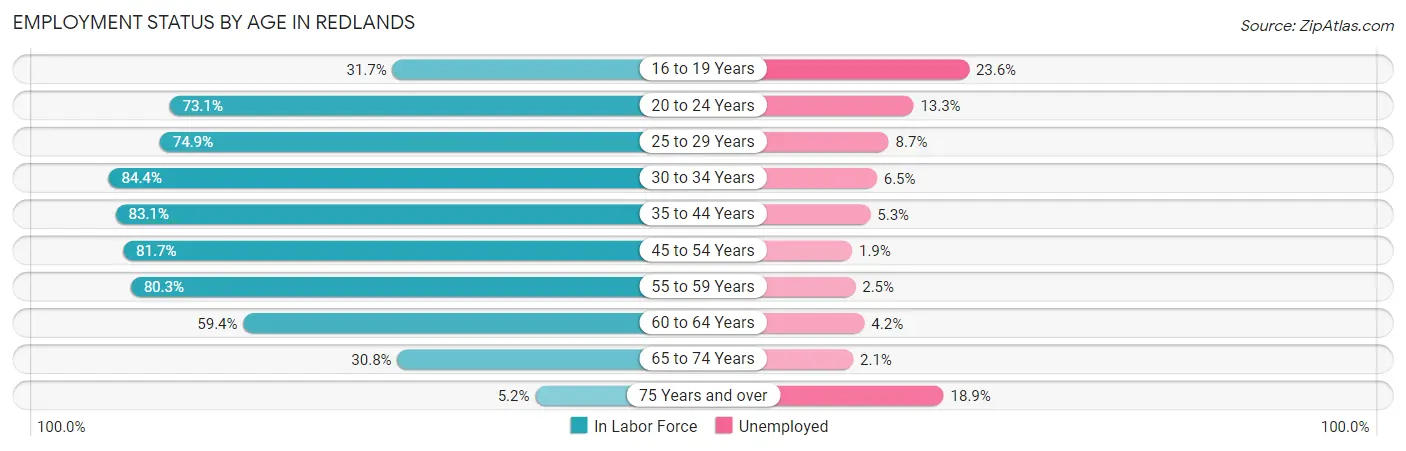
| Age Bracket | In Labor Force | Unemployed |
| 16 to 19 Years | 1,345 (31.7%) | 317 (23.6%) |
| 20 to 24 Years | 4,303 (73.1%) | 572 (13.3%) |
| 25 to 29 Years | 4,786 (74.9%) | 416 (8.7%) |
| 30 to 34 Years | 4,082 (84.4%) | 265 (6.5%) |
| 35 to 44 Years | 7,874 (83.1%) | 417 (5.3%) |
| 45 to 54 Years | 6,532 (81.7%) | 124 (1.9%) |
| 55 to 59 Years | 3,602 (80.3%) | 90 (2.5%) |
| 60 to 64 Years | 2,317 (59.4%) | 97 (4.2%) |
| 65 to 74 Years | 1,846 (30.8%) | 39 (2.1%) |
| 75 Years and over | 268 (5.2%) | 51 (18.9%) |
| Total | 36,943 (63.3%) | 2,401 (6.5%) |
Employment Status by Educational Attainment in Redlands
According to labor force statistics for Redlands, 78.7% of individuals (29,184) out of the total population between 25 and 64 years of age (37,083) are in the labor force, with 4.8% or 1,401 of them being unemployed. The group with the highest labor force participation rate are those with the educational attainment of bachelor's degree or higher, with 86.3% or 14,179 individuals in the labor force. Within the labor force, individuals with high school diploma education have the highest percentage of unemployment, with 10.1% or 539 of them being unemployed.
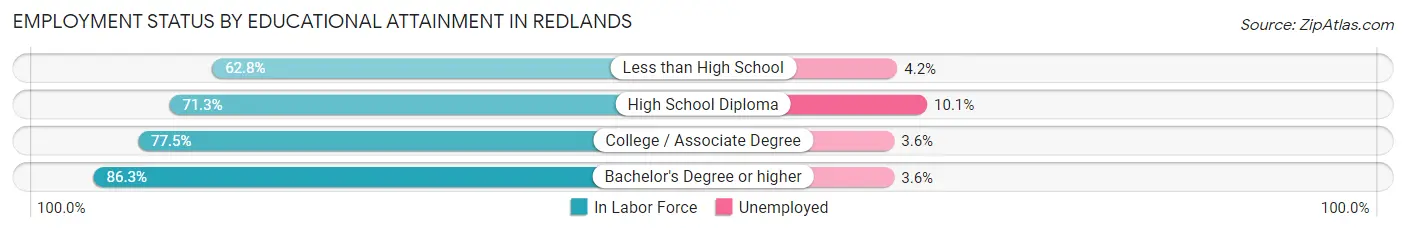
| Educational Attainment | In Labor Force | Unemployed |
| Less than High School | 2,197 (62.8%) | 147 (4.2%) |
| High School Diploma | 5,340 (71.3%) | 756 (10.1%) |
| College / Associate Degree | 7,490 (77.5%) | 348 (3.6%) |
| Bachelor's Degree or higher | 14,179 (86.3%) | 591 (3.6%) |
| Total | 29,184 (78.7%) | 1,780 (4.8%) |
Employment Occupations by Sex in Redlands
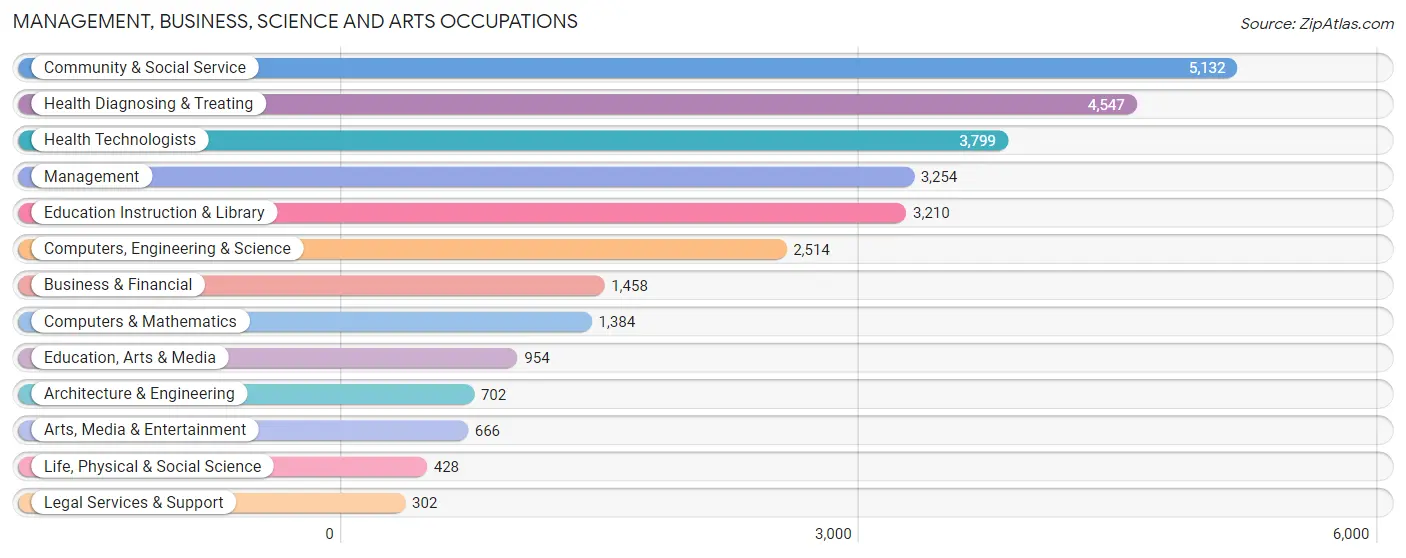
Management, Business, Science and Arts Occupations
The most common Management, Business, Science and Arts occupations in Redlands are Community & Social Service (5,132 | 14.8%), Health Diagnosing & Treating (4,547 | 13.2%), Health Technologists (3,799 | 11.0%), Management (3,254 | 9.4%), and Education Instruction & Library (3,210 | 9.3%).
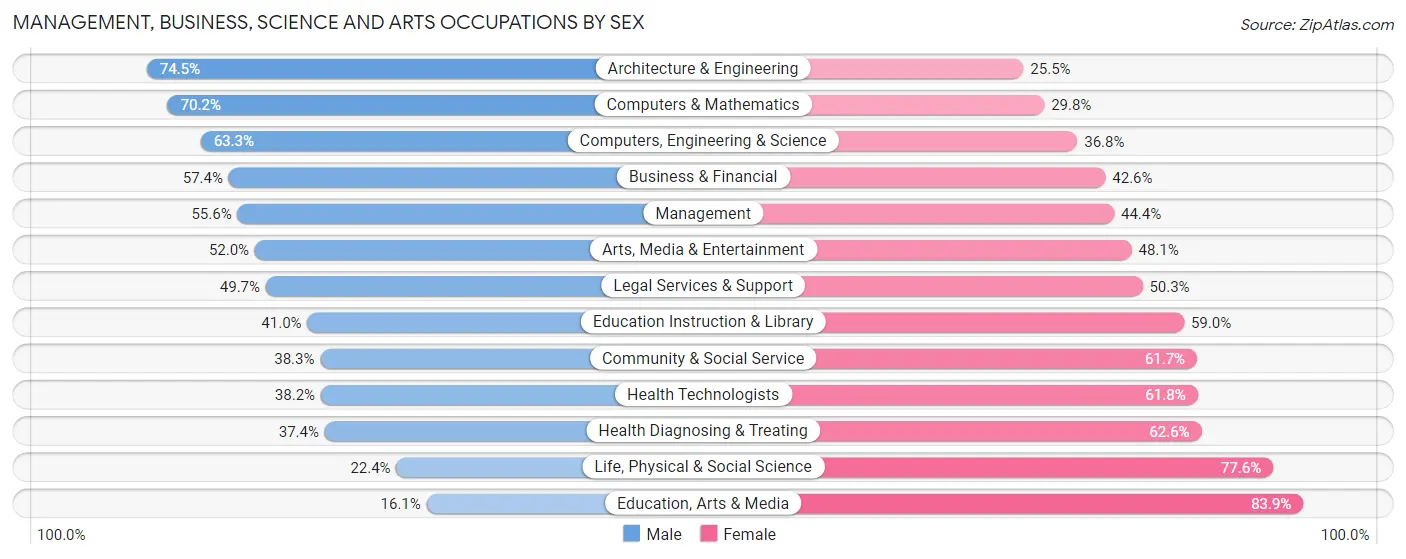
Management, Business, Science and Arts Occupations by Sex
Within the Management, Business, Science and Arts occupations in Redlands, the most male-oriented occupations are Architecture & Engineering (74.5%), Computers & Mathematics (70.2%), and Computers, Engineering & Science (63.2%), while the most female-oriented occupations are Education, Arts & Media (83.9%), Life, Physical & Social Science (77.6%), and Health Diagnosing & Treating (62.6%).
| Occupation | Male | Female |
| Management | 1,809 (55.6%) | 1,445 (44.4%) |
| Business & Financial | 837 (57.4%) | 621 (42.6%) |
| Computers, Engineering & Science | 1,590 (63.2%) | 924 (36.7%) |
| Computers & Mathematics | 971 (70.2%) | 413 (29.8%) |
| Architecture & Engineering | 523 (74.5%) | 179 (25.5%) |
| Life, Physical & Social Science | 96 (22.4%) | 332 (77.6%) |
| Community & Social Service | 1,966 (38.3%) | 3,166 (61.7%) |
| Education, Arts & Media | 154 (16.1%) | 800 (83.9%) |
| Legal Services & Support | 150 (49.7%) | 152 (50.3%) |
| Education Instruction & Library | 1,316 (41.0%) | 1,894 (59.0%) |
| Arts, Media & Entertainment | 346 (51.9%) | 320 (48.0%) |
| Health Diagnosing & Treating | 1,699 (37.4%) | 2,848 (62.6%) |
| Health Technologists | 1,451 (38.2%) | 2,348 (61.8%) |
| Total (Category) | 7,901 (46.7%) | 9,004 (53.3%) |
| Total (Overall) | 17,219 (49.8%) | 17,338 (50.2%) |
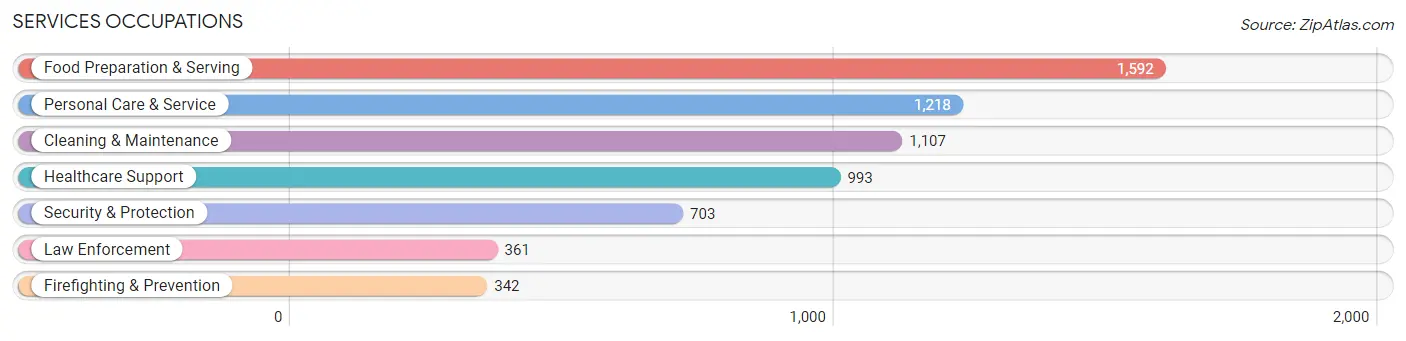
Services Occupations
The most common Services occupations in Redlands are Food Preparation & Serving (1,592 | 4.6%), Personal Care & Service (1,218 | 3.5%), Cleaning & Maintenance (1,107 | 3.2%), Healthcare Support (993 | 2.9%), and Security & Protection (703 | 2.0%).
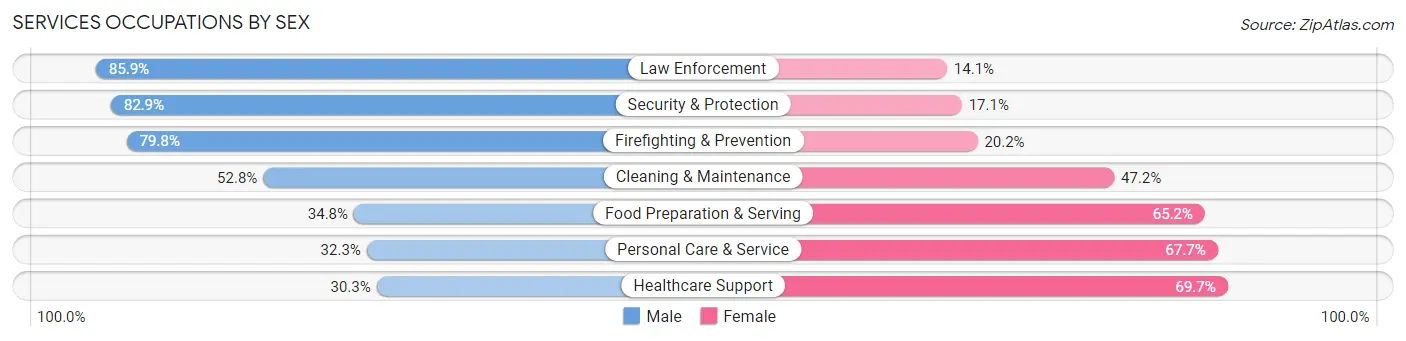
Services Occupations by Sex
Within the Services occupations in Redlands, the most male-oriented occupations are Law Enforcement (85.9%), Security & Protection (82.9%), and Firefighting & Prevention (79.8%), while the most female-oriented occupations are Healthcare Support (69.7%), Personal Care & Service (67.7%), and Food Preparation & Serving (65.2%).
| Occupation | Male | Female |
| Healthcare Support | 301 (30.3%) | 692 (69.7%) |
| Security & Protection | 583 (82.9%) | 120 (17.1%) |
| Firefighting & Prevention | 273 (79.8%) | 69 (20.2%) |
| Law Enforcement | 310 (85.9%) | 51 (14.1%) |
| Food Preparation & Serving | 554 (34.8%) | 1,038 (65.2%) |
| Cleaning & Maintenance | 584 (52.8%) | 523 (47.2%) |
| Personal Care & Service | 393 (32.3%) | 825 (67.7%) |
| Total (Category) | 2,415 (43.0%) | 3,198 (57.0%) |
| Total (Overall) | 17,219 (49.8%) | 17,338 (50.2%) |
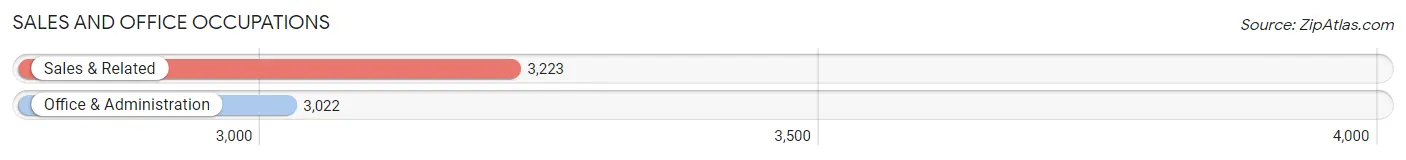
Sales and Office Occupations
The most common Sales and Office occupations in Redlands are Sales & Related (3,223 | 9.3%), and Office & Administration (3,022 | 8.7%).
Sales and Office Occupations by Sex
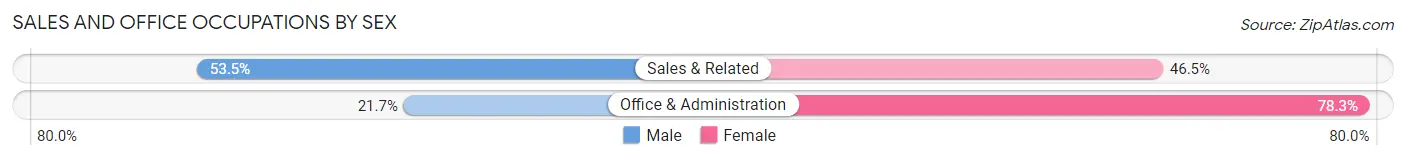
| Occupation | Male | Female |
| Sales & Related | 1,724 (53.5%) | 1,499 (46.5%) |
| Office & Administration | 655 (21.7%) | 2,367 (78.3%) |
| Total (Category) | 2,379 (38.1%) | 3,866 (61.9%) |
| Total (Overall) | 17,219 (49.8%) | 17,338 (50.2%) |
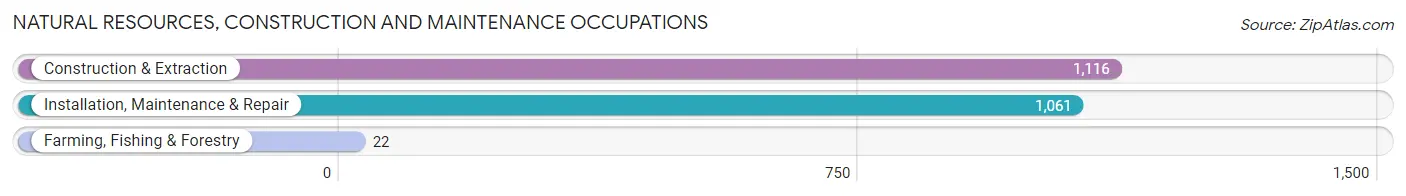
Natural Resources, Construction and Maintenance Occupations
The most common Natural Resources, Construction and Maintenance occupations in Redlands are Construction & Extraction (1,116 | 3.2%), Installation, Maintenance & Repair (1,061 | 3.1%), and Farming, Fishing & Forestry (22 | 0.1%).
Natural Resources, Construction and Maintenance Occupations by Sex
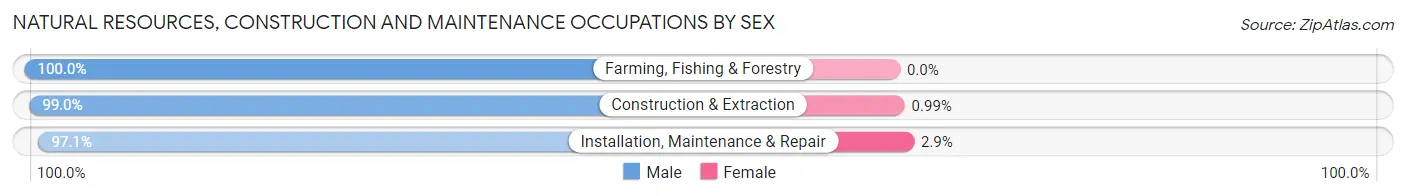
| Occupation | Male | Female |
| Farming, Fishing & Forestry | 22 (100.0%) | 0 (0.0%) |
| Construction & Extraction | 1,105 (99.0%) | 11 (1.0%) |
| Installation, Maintenance & Repair | 1,030 (97.1%) | 31 (2.9%) |
| Total (Category) | 2,157 (98.1%) | 42 (1.9%) |
| Total (Overall) | 17,219 (49.8%) | 17,338 (50.2%) |
Production, Transportation and Moving Occupations
The most common Production, Transportation and Moving occupations in Redlands are Material Moving (1,785 | 5.2%), Transportation (997 | 2.9%), and Production (813 | 2.4%).
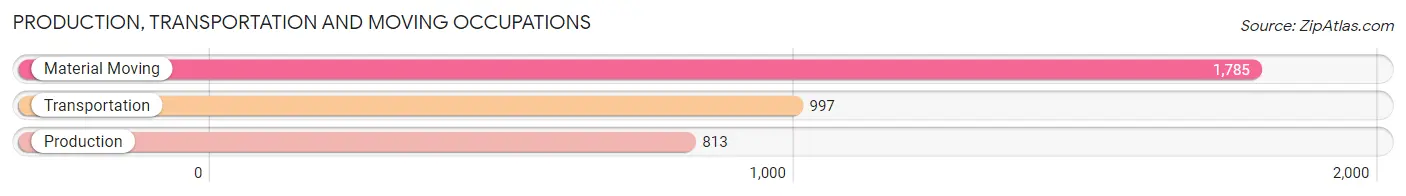
Production, Transportation and Moving Occupations by Sex
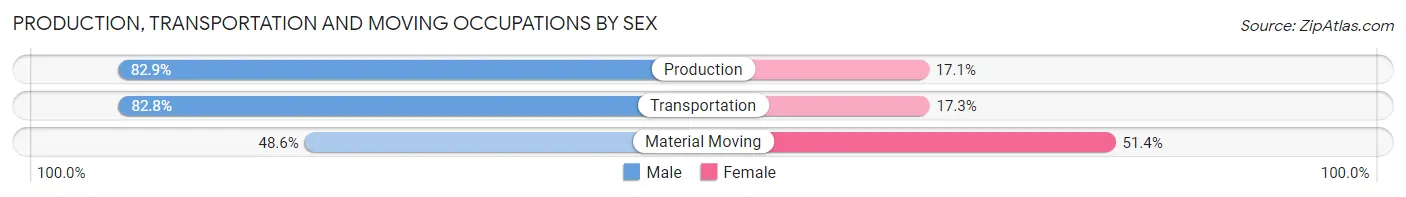
| Occupation | Male | Female |
| Production | 674 (82.9%) | 139 (17.1%) |
| Transportation | 825 (82.8%) | 172 (17.2%) |
| Material Moving | 868 (48.6%) | 917 (51.4%) |
| Total (Category) | 2,367 (65.8%) | 1,228 (34.2%) |
| Total (Overall) | 17,219 (49.8%) | 17,338 (50.2%) |
Employment Industries by Sex in Redlands
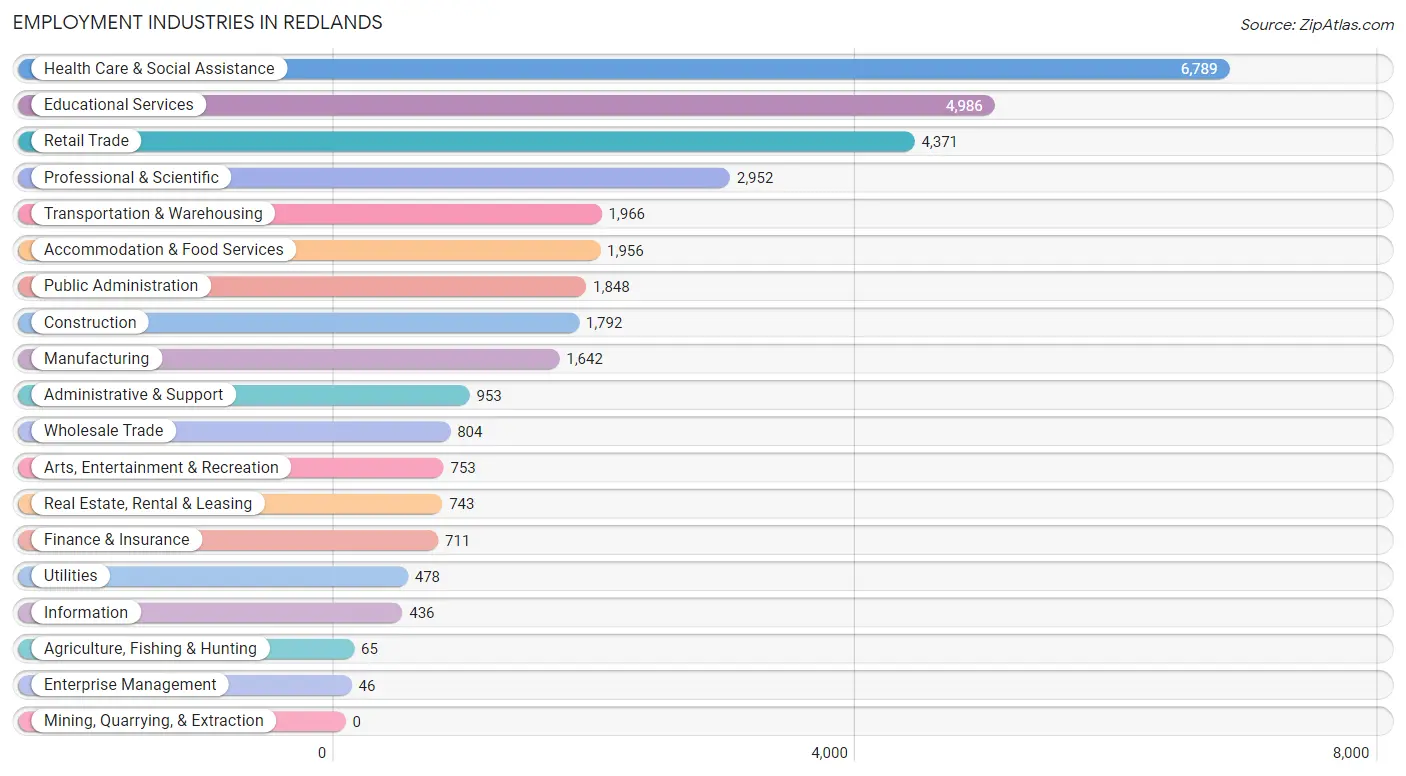
Employment Industries in Redlands
The major employment industries in Redlands include Health Care & Social Assistance (6,789 | 19.7%), Educational Services (4,986 | 14.4%), Retail Trade (4,371 | 12.7%), Professional & Scientific (2,952 | 8.5%), and Transportation & Warehousing (1,966 | 5.7%).
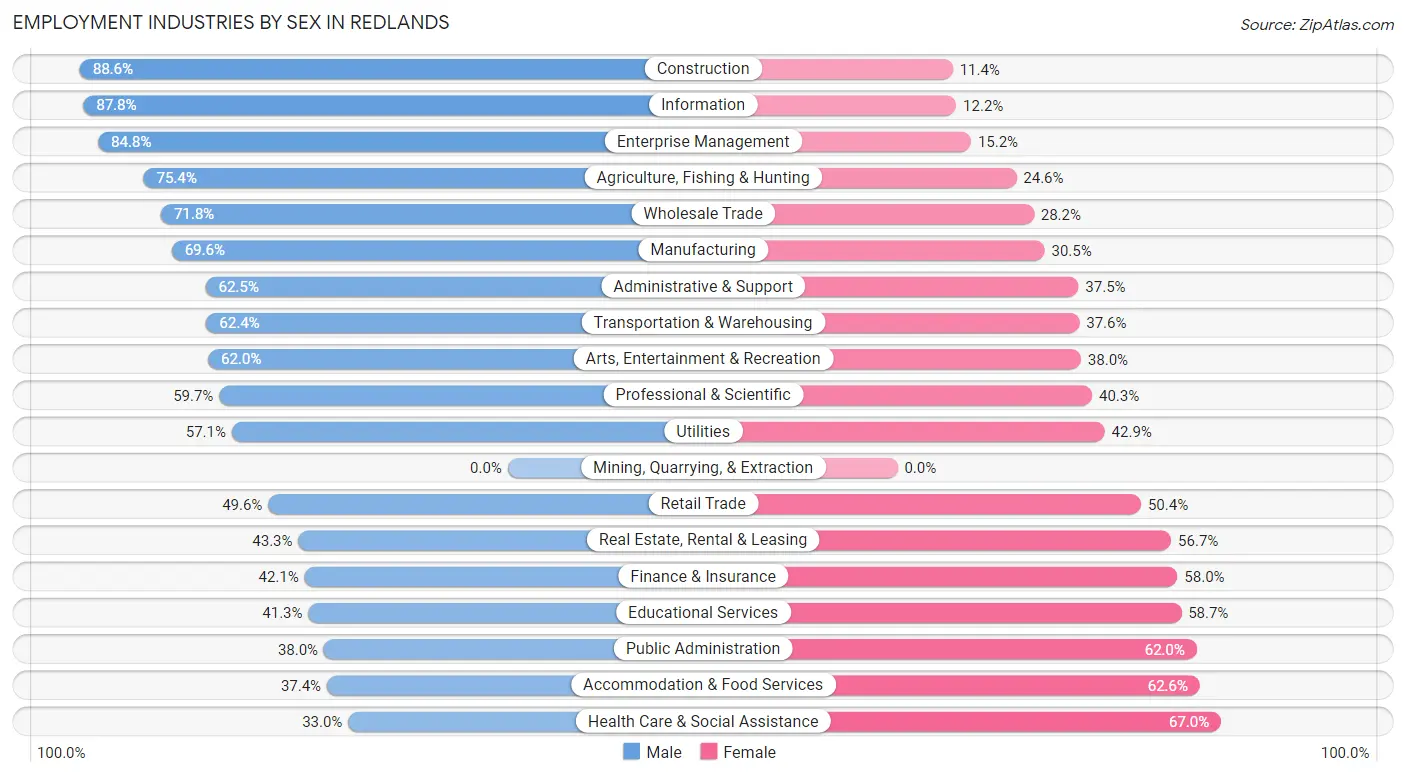
Employment Industries by Sex in Redlands
The Redlands industries that see more men than women are Construction (88.6%), Information (87.8%), and Enterprise Management (84.8%), whereas the industries that tend to have a higher number of women are Health Care & Social Assistance (67.0%), Accommodation & Food Services (62.6%), and Public Administration (62.0%).
| Industry | Male | Female |
| Agriculture, Fishing & Hunting | 49 (75.4%) | 16 (24.6%) |
| Mining, Quarrying, & Extraction | 0 (0.0%) | 0 (0.0%) |
| Construction | 1,587 (88.6%) | 205 (11.4%) |
| Manufacturing | 1,142 (69.6%) | 500 (30.4%) |
| Wholesale Trade | 577 (71.8%) | 227 (28.2%) |
| Retail Trade | 2,167 (49.6%) | 2,204 (50.4%) |
| Transportation & Warehousing | 1,226 (62.4%) | 740 (37.6%) |
| Utilities | 273 (57.1%) | 205 (42.9%) |
| Information | 383 (87.8%) | 53 (12.2%) |
| Finance & Insurance | 299 (42.0%) | 412 (58.0%) |
| Real Estate, Rental & Leasing | 322 (43.3%) | 421 (56.7%) |
| Professional & Scientific | 1,763 (59.7%) | 1,189 (40.3%) |
| Enterprise Management | 39 (84.8%) | 7 (15.2%) |
| Administrative & Support | 596 (62.5%) | 357 (37.5%) |
| Educational Services | 2,057 (41.3%) | 2,929 (58.7%) |
| Health Care & Social Assistance | 2,242 (33.0%) | 4,547 (67.0%) |
| Arts, Entertainment & Recreation | 467 (62.0%) | 286 (38.0%) |
| Accommodation & Food Services | 732 (37.4%) | 1,224 (62.6%) |
| Public Administration | 703 (38.0%) | 1,145 (62.0%) |
| Total | 17,219 (49.8%) | 17,338 (50.2%) |
Education in Redlands
School Enrollment in Redlands
The most common levels of schooling among the 20,655 students in Redlands are college / undergraduate (5,644 | 27.3%), elementary school (4,185 | 20.3%), and high school (3,802 | 18.4%).
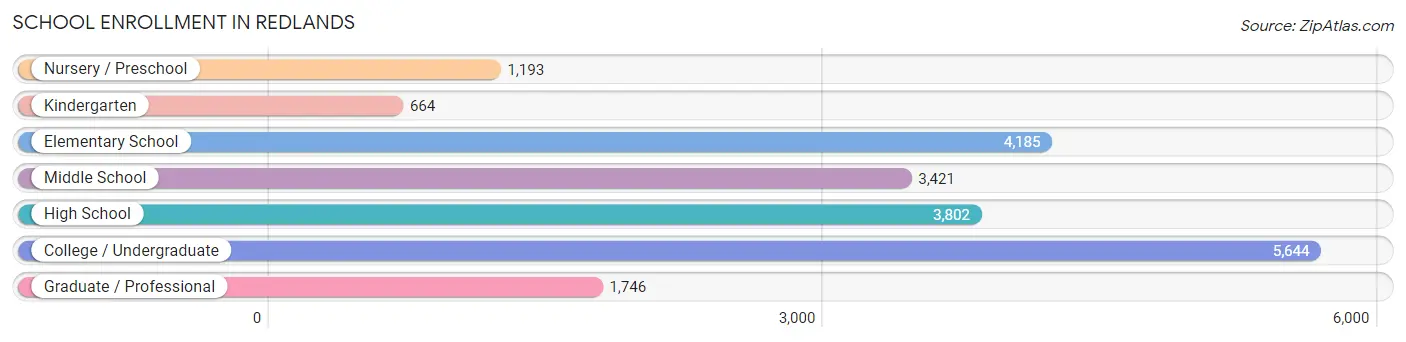
| School Level | # Students | % Students |
| Nursery / Preschool | 1,193 | 5.8% |
| Kindergarten | 664 | 3.2% |
| Elementary School | 4,185 | 20.3% |
| Middle School | 3,421 | 16.6% |
| High School | 3,802 | 18.4% |
| College / Undergraduate | 5,644 | 27.3% |
| Graduate / Professional | 1,746 | 8.5% |
| Total | 20,655 | 100.0% |
School Enrollment by Age by Funding Source in Redlands
Out of a total of 20,655 students who are enrolled in schools in Redlands, 4,833 (23.4%) attend a private institution, while the remaining 15,822 (76.6%) are enrolled in public schools. The age group of 18 to 19 year olds has the highest likelihood of being enrolled in private schools, with 897 (46.6% in the age bracket) enrolled. Conversely, the age group of 15 to 17 year olds has the lowest likelihood of being enrolled in a private school, with 2,441 (92.2% in the age bracket) attending a public institution.
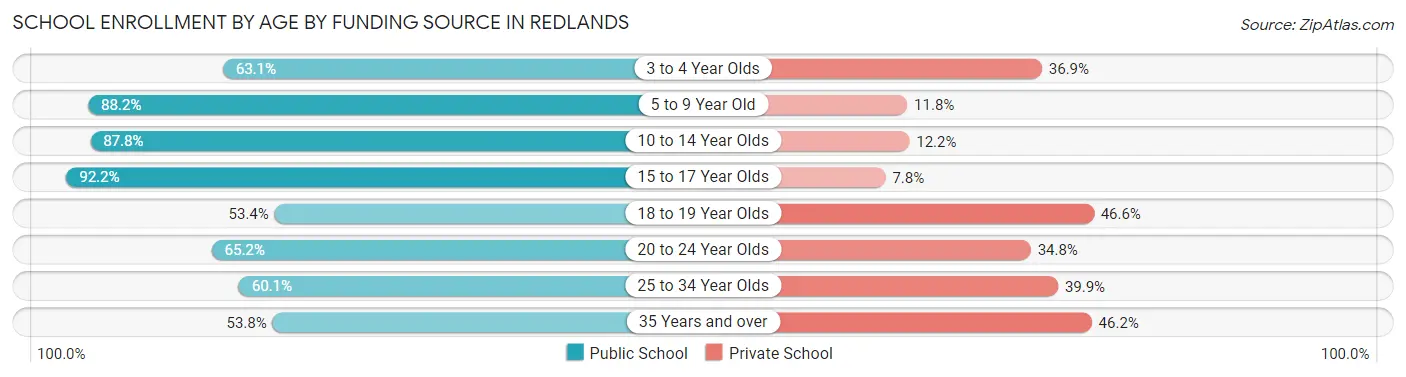
| Age Bracket | Public School | Private School |
| 3 to 4 Year Olds | 634 (63.1%) | 371 (36.9%) |
| 5 to 9 Year Old | 3,999 (88.2%) | 536 (11.8%) |
| 10 to 14 Year Olds | 4,187 (87.8%) | 583 (12.2%) |
| 15 to 17 Year Olds | 2,441 (92.2%) | 206 (7.8%) |
| 18 to 19 Year Olds | 1,029 (53.4%) | 897 (46.6%) |
| 20 to 24 Year Olds | 1,784 (65.2%) | 954 (34.8%) |
| 25 to 34 Year Olds | 1,027 (60.1%) | 682 (39.9%) |
| 35 Years and over | 713 (53.8%) | 612 (46.2%) |
| Total | 15,822 (76.6%) | 4,833 (23.4%) |
Educational Attainment by Field of Study in Redlands
Science & technology (3,229 | 14.5%), business (3,174 | 14.2%), education (2,138 | 9.6%), social sciences (1,992 | 8.9%), and bio, nature & agricultural (1,758 | 7.9%) are the most common fields of study among 22,321 individuals in Redlands who have obtained a bachelor's degree or higher.
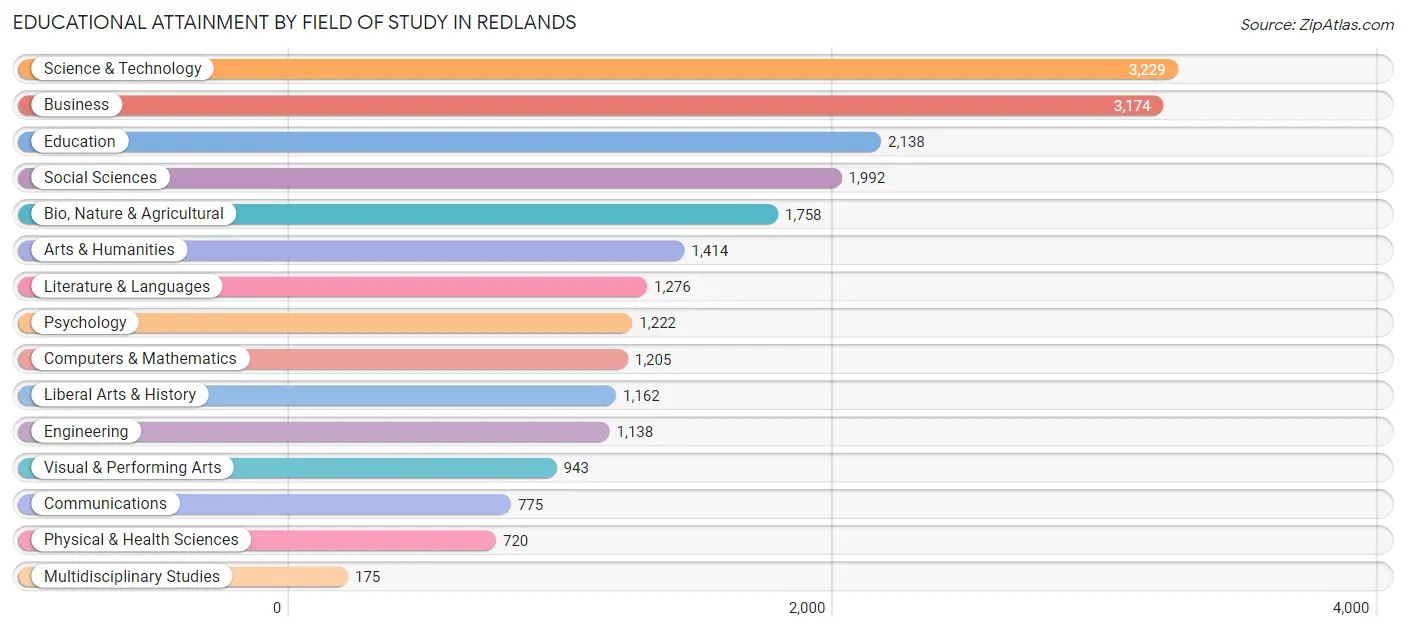
| Field of Study | # Graduates | % Graduates |
| Computers & Mathematics | 1,205 | 5.4% |
| Bio, Nature & Agricultural | 1,758 | 7.9% |
| Physical & Health Sciences | 720 | 3.2% |
| Psychology | 1,222 | 5.5% |
| Social Sciences | 1,992 | 8.9% |
| Engineering | 1,138 | 5.1% |
| Multidisciplinary Studies | 175 | 0.8% |
| Science & Technology | 3,229 | 14.5% |
| Business | 3,174 | 14.2% |
| Education | 2,138 | 9.6% |
| Literature & Languages | 1,276 | 5.7% |
| Liberal Arts & History | 1,162 | 5.2% |
| Visual & Performing Arts | 943 | 4.2% |
| Communications | 775 | 3.5% |
| Arts & Humanities | 1,414 | 6.3% |
| Total | 22,321 | 100.0% |
Transportation & Commute in Redlands
Vehicle Availability by Sex in Redlands
The most prevalent vehicle ownership categories in Redlands are males with 2 vehicles (6,840, accounting for 41.6%) and females with 2 vehicles (6,301, making up 41.4%).
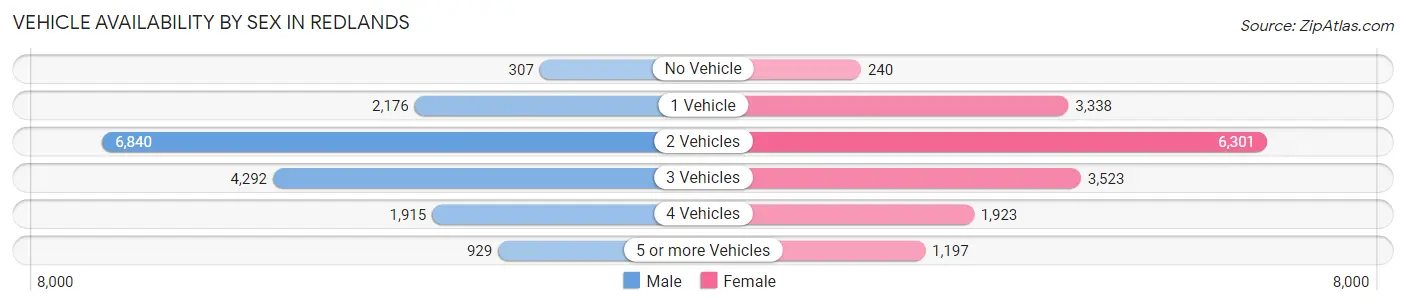
| Vehicles Available | Male | Female |
| No Vehicle | 307 (1.9%) | 240 (1.5%) |
| 1 Vehicle | 2,176 (13.2%) | 3,338 (20.2%) |
| 2 Vehicles | 6,840 (41.6%) | 6,301 (38.1%) |
| 3 Vehicles | 4,292 (26.1%) | 3,523 (21.3%) |
| 4 Vehicles | 1,915 (11.6%) | 1,923 (11.6%) |
| 5 or more Vehicles | 929 (5.6%) | 1,197 (7.2%) |
| Total | 16,459 (100.0%) | 16,522 (100.0%) |
Commute Time in Redlands
The most frequently occuring commute durations in Redlands are 10 to 14 minutes (6,013 commuters, 20.2%), 15 to 19 minutes (4,506 commuters, 15.1%), and 30 to 34 minutes (4,122 commuters, 13.9%).
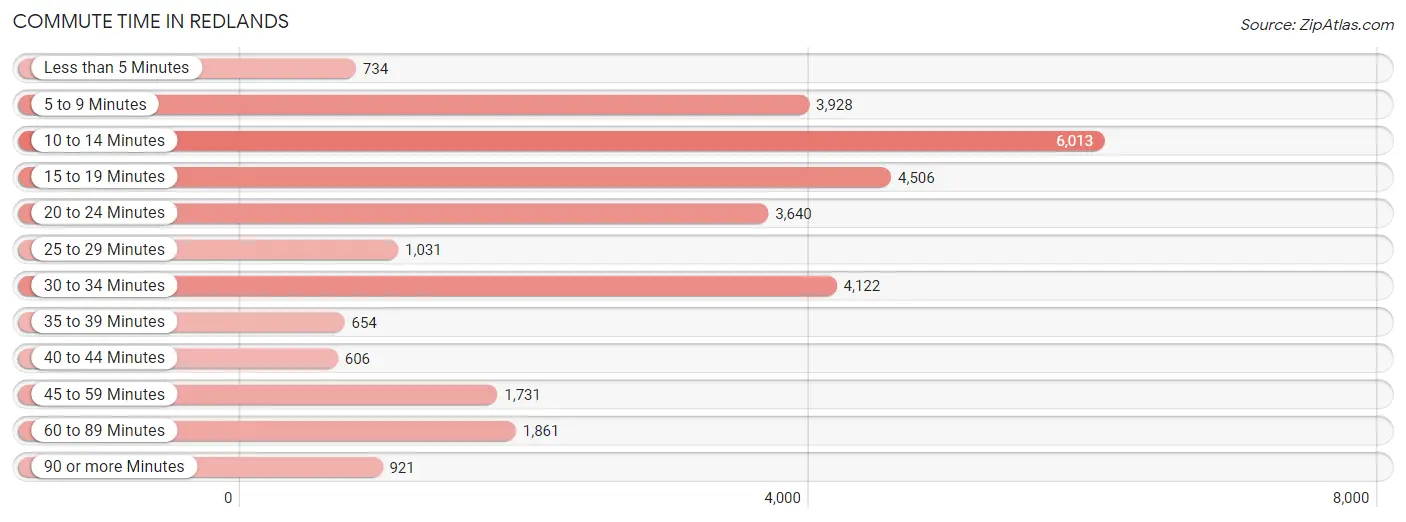
| Commute Time | # Commuters | % Commuters |
| Less than 5 Minutes | 734 | 2.5% |
| 5 to 9 Minutes | 3,928 | 13.2% |
| 10 to 14 Minutes | 6,013 | 20.2% |
| 15 to 19 Minutes | 4,506 | 15.1% |
| 20 to 24 Minutes | 3,640 | 12.2% |
| 25 to 29 Minutes | 1,031 | 3.5% |
| 30 to 34 Minutes | 4,122 | 13.9% |
| 35 to 39 Minutes | 654 | 2.2% |
| 40 to 44 Minutes | 606 | 2.0% |
| 45 to 59 Minutes | 1,731 | 5.8% |
| 60 to 89 Minutes | 1,861 | 6.3% |
| 90 or more Minutes | 921 | 3.1% |
Commute Time by Sex in Redlands
The most common commute times in Redlands are 10 to 14 minutes (2,805 commuters, 19.0%) for males and 10 to 14 minutes (3,208 commuters, 21.4%) for females.
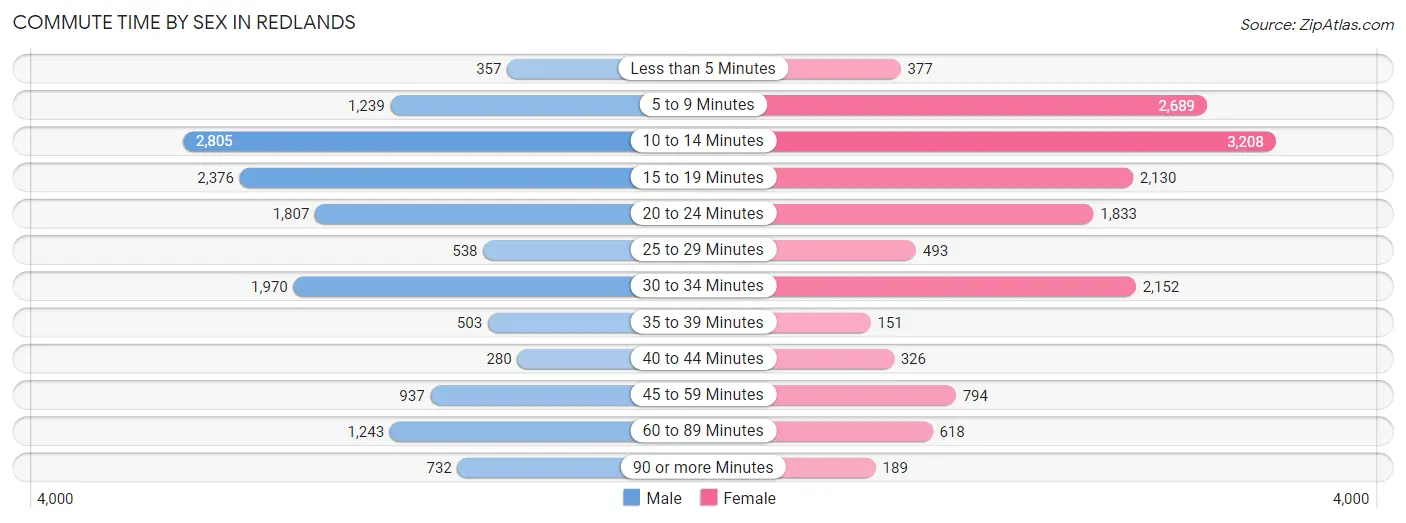
| Commute Time | Male | Female |
| Less than 5 Minutes | 357 (2.4%) | 377 (2.5%) |
| 5 to 9 Minutes | 1,239 (8.4%) | 2,689 (18.0%) |
| 10 to 14 Minutes | 2,805 (19.0%) | 3,208 (21.4%) |
| 15 to 19 Minutes | 2,376 (16.1%) | 2,130 (14.2%) |
| 20 to 24 Minutes | 1,807 (12.2%) | 1,833 (12.2%) |
| 25 to 29 Minutes | 538 (3.6%) | 493 (3.3%) |
| 30 to 34 Minutes | 1,970 (13.3%) | 2,152 (14.4%) |
| 35 to 39 Minutes | 503 (3.4%) | 151 (1.0%) |
| 40 to 44 Minutes | 280 (1.9%) | 326 (2.2%) |
| 45 to 59 Minutes | 937 (6.3%) | 794 (5.3%) |
| 60 to 89 Minutes | 1,243 (8.4%) | 618 (4.1%) |
| 90 or more Minutes | 732 (5.0%) | 189 (1.3%) |
Time of Departure to Work by Sex in Redlands
The most frequent times of departure to work in Redlands are 6:00 AM to 6:29 AM (1,810, 12.2%) for males and 7:00 AM to 7:29 AM (2,492, 16.7%) for females.
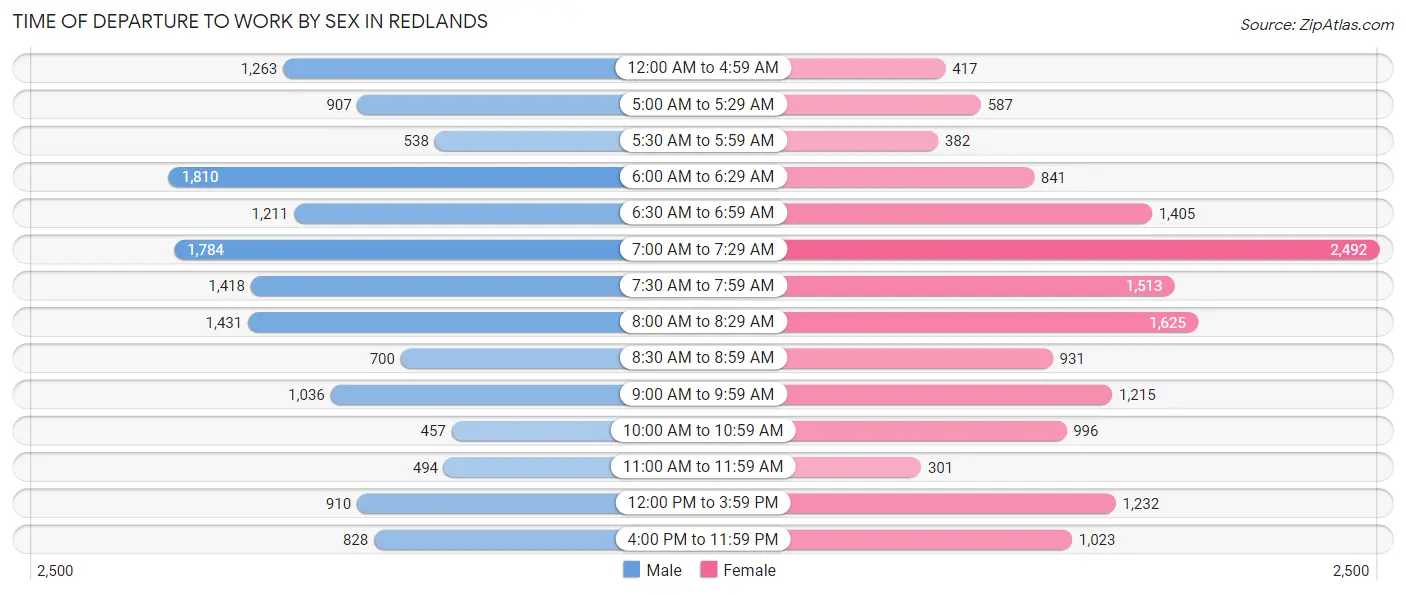
| Time of Departure | Male | Female |
| 12:00 AM to 4:59 AM | 1,263 (8.5%) | 417 (2.8%) |
| 5:00 AM to 5:29 AM | 907 (6.1%) | 587 (3.9%) |
| 5:30 AM to 5:59 AM | 538 (3.6%) | 382 (2.5%) |
| 6:00 AM to 6:29 AM | 1,810 (12.2%) | 841 (5.6%) |
| 6:30 AM to 6:59 AM | 1,211 (8.2%) | 1,405 (9.4%) |
| 7:00 AM to 7:29 AM | 1,784 (12.1%) | 2,492 (16.7%) |
| 7:30 AM to 7:59 AM | 1,418 (9.6%) | 1,513 (10.1%) |
| 8:00 AM to 8:29 AM | 1,431 (9.7%) | 1,625 (10.9%) |
| 8:30 AM to 8:59 AM | 700 (4.7%) | 931 (6.2%) |
| 9:00 AM to 9:59 AM | 1,036 (7.0%) | 1,215 (8.1%) |
| 10:00 AM to 10:59 AM | 457 (3.1%) | 996 (6.7%) |
| 11:00 AM to 11:59 AM | 494 (3.3%) | 301 (2.0%) |
| 12:00 PM to 3:59 PM | 910 (6.1%) | 1,232 (8.2%) |
| 4:00 PM to 11:59 PM | 828 (5.6%) | 1,023 (6.8%) |
| Total | 14,787 (100.0%) | 14,960 (100.0%) |
Housing Occupancy in Redlands
Occupancy by Ownership in Redlands
Of the total 25,319 dwellings in Redlands, owner-occupied units account for 14,761 (58.3%), while renter-occupied units make up 10,558 (41.7%).
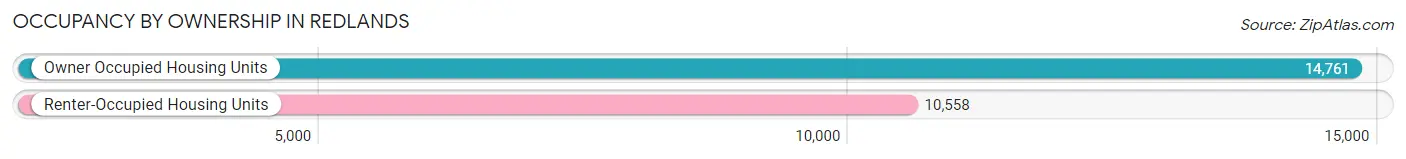
| Occupancy | # Housing Units | % Housing Units |
| Owner Occupied Housing Units | 14,761 | 58.3% |
| Renter-Occupied Housing Units | 10,558 | 41.7% |
| Total Occupied Housing Units | 25,319 | 100.0% |
Occupancy by Household Size in Redlands
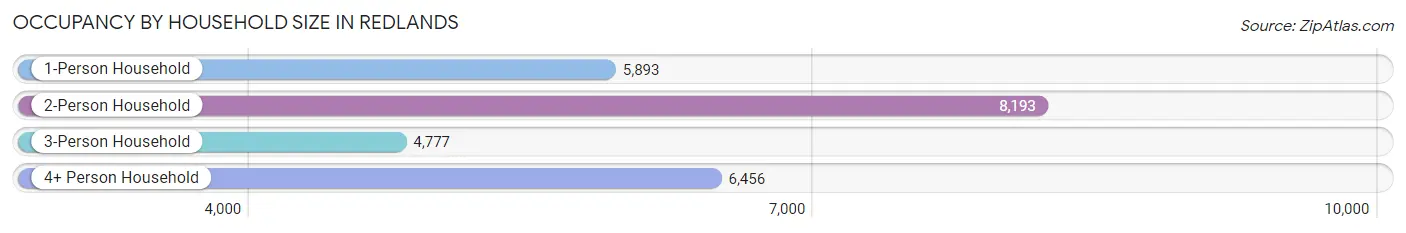
| Household Size | # Housing Units | % Housing Units |
| 1-Person Household | 5,893 | 23.3% |
| 2-Person Household | 8,193 | 32.4% |
| 3-Person Household | 4,777 | 18.9% |
| 4+ Person Household | 6,456 | 25.5% |
| Total Housing Units | 25,319 | 100.0% |
Occupancy by Ownership by Household Size in Redlands
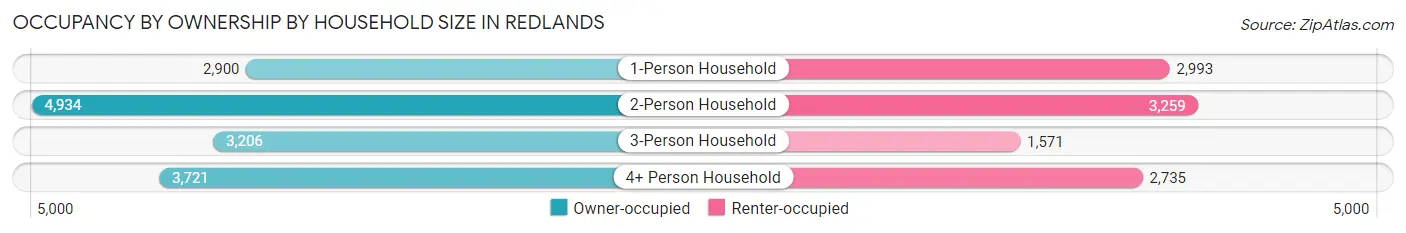
| Household Size | Owner-occupied | Renter-occupied |
| 1-Person Household | 2,900 (49.2%) | 2,993 (50.8%) |
| 2-Person Household | 4,934 (60.2%) | 3,259 (39.8%) |
| 3-Person Household | 3,206 (67.1%) | 1,571 (32.9%) |
| 4+ Person Household | 3,721 (57.6%) | 2,735 (42.4%) |
| Total Housing Units | 14,761 (58.3%) | 10,558 (41.7%) |
Occupancy by Educational Attainment in Redlands
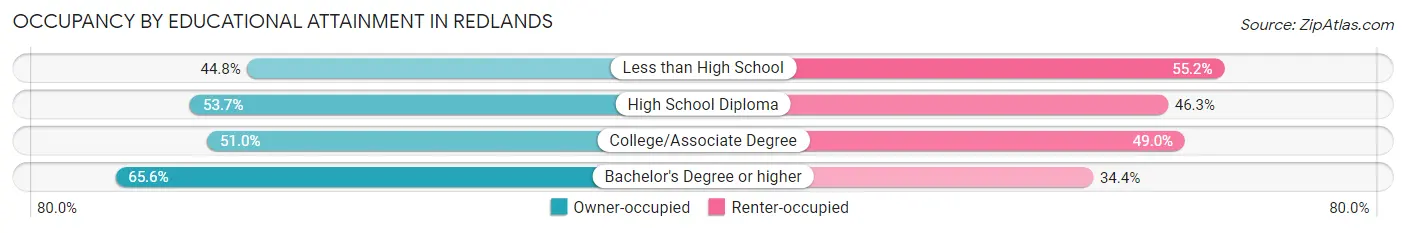
| Household Size | Owner-occupied | Renter-occupied |
| Less than High School | 787 (44.8%) | 970 (55.2%) |
| High School Diploma | 2,133 (53.7%) | 1,836 (46.3%) |
| College/Associate Degree | 3,549 (51.0%) | 3,405 (49.0%) |
| Bachelor's Degree or higher | 8,292 (65.6%) | 4,347 (34.4%) |
Occupancy by Age of Householder in Redlands
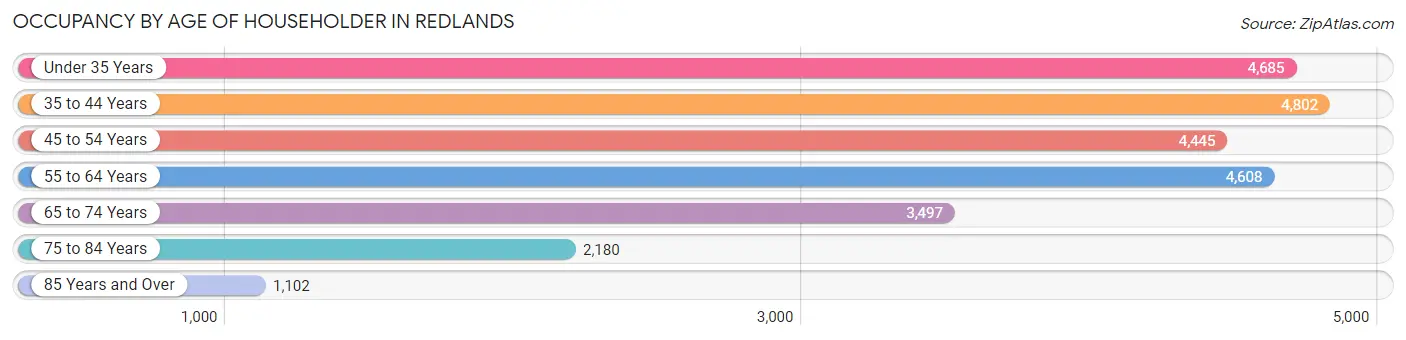
| Age Bracket | # Households | % Households |
| Under 35 Years | 4,685 | 18.5% |
| 35 to 44 Years | 4,802 | 19.0% |
| 45 to 54 Years | 4,445 | 17.6% |
| 55 to 64 Years | 4,608 | 18.2% |
| 65 to 74 Years | 3,497 | 13.8% |
| 75 to 84 Years | 2,180 | 8.6% |
| 85 Years and Over | 1,102 | 4.3% |
| Total | 25,319 | 100.0% |
Housing Finances in Redlands
Median Income by Occupancy in Redlands
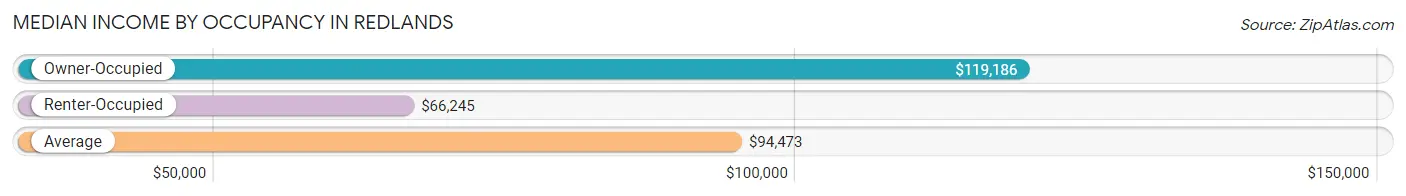
| Occupancy Type | # Households | Median Income |
| Owner-Occupied | 14,761 (58.3%) | $119,186 |
| Renter-Occupied | 10,558 (41.7%) | $66,245 |
| Average | 25,319 (100.0%) | $94,473 |
Occupancy by Householder Income Bracket in Redlands
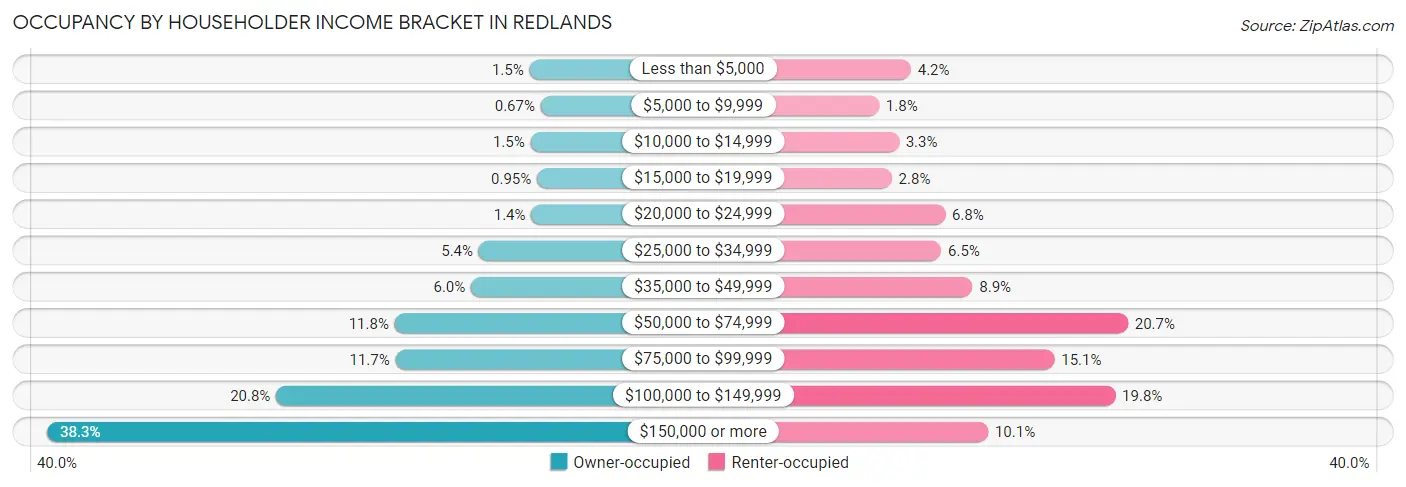
| Income Bracket | Owner-occupied | Renter-occupied |
| Less than $5,000 | 226 (1.5%) | 444 (4.2%) |
| $5,000 to $9,999 | 99 (0.7%) | 188 (1.8%) |
| $10,000 to $14,999 | 214 (1.5%) | 347 (3.3%) |
| $15,000 to $19,999 | 140 (0.9%) | 290 (2.8%) |
| $20,000 to $24,999 | 205 (1.4%) | 719 (6.8%) |
| $25,000 to $34,999 | 796 (5.4%) | 688 (6.5%) |
| $35,000 to $49,999 | 882 (6.0%) | 940 (8.9%) |
| $50,000 to $74,999 | 1,742 (11.8%) | 2,190 (20.7%) |
| $75,000 to $99,999 | 1,733 (11.7%) | 1,599 (15.1%) |
| $100,000 to $149,999 | 3,074 (20.8%) | 2,088 (19.8%) |
| $150,000 or more | 5,650 (38.3%) | 1,065 (10.1%) |
| Total | 14,761 (100.0%) | 10,558 (100.0%) |
Monthly Housing Cost Tiers in Redlands
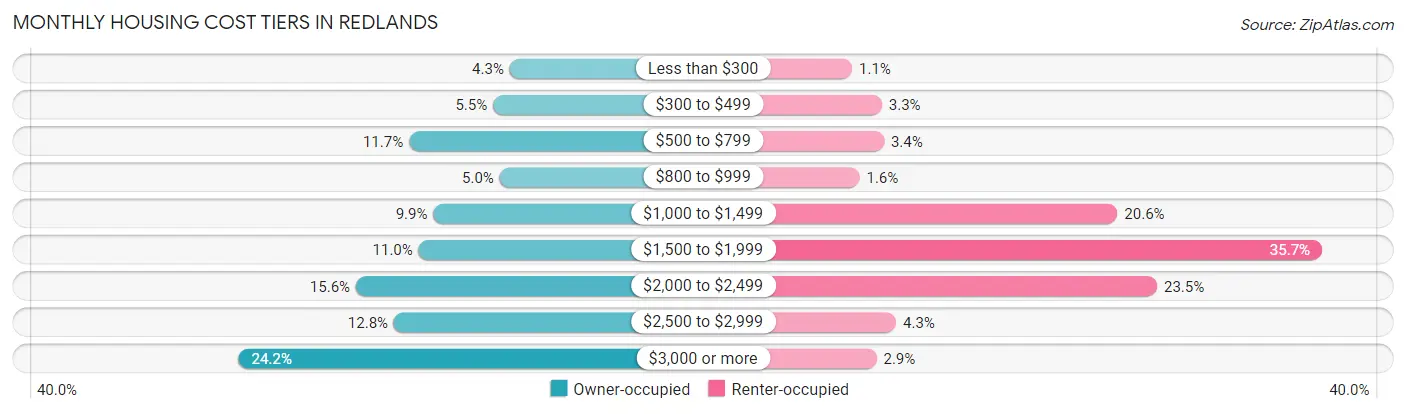
| Monthly Cost | Owner-occupied | Renter-occupied |
| Less than $300 | 631 (4.3%) | 114 (1.1%) |
| $300 to $499 | 812 (5.5%) | 345 (3.3%) |
| $500 to $799 | 1,725 (11.7%) | 362 (3.4%) |
| $800 to $999 | 739 (5.0%) | 172 (1.6%) |
| $1,000 to $1,499 | 1,462 (9.9%) | 2,177 (20.6%) |
| $1,500 to $1,999 | 1,621 (11.0%) | 3,767 (35.7%) |
| $2,000 to $2,499 | 2,303 (15.6%) | 2,485 (23.5%) |
| $2,500 to $2,999 | 1,890 (12.8%) | 456 (4.3%) |
| $3,000 or more | 3,578 (24.2%) | 304 (2.9%) |
| Total | 14,761 (100.0%) | 10,558 (100.0%) |
Physical Housing Characteristics in Redlands
Housing Structures in Redlands
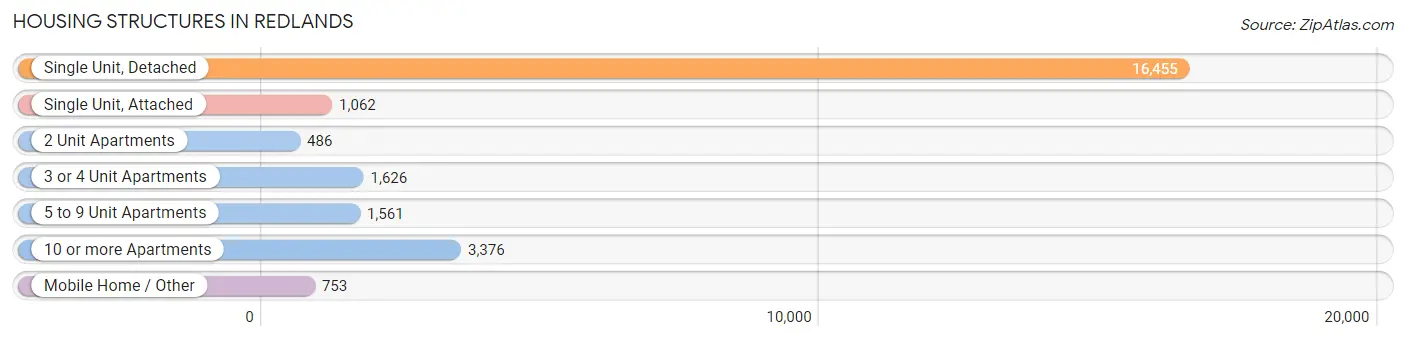
| Structure Type | # Housing Units | % Housing Units |
| Single Unit, Detached | 16,455 | 65.0% |
| Single Unit, Attached | 1,062 | 4.2% |
| 2 Unit Apartments | 486 | 1.9% |
| 3 or 4 Unit Apartments | 1,626 | 6.4% |
| 5 to 9 Unit Apartments | 1,561 | 6.2% |
| 10 or more Apartments | 3,376 | 13.3% |
| Mobile Home / Other | 753 | 3.0% |
| Total | 25,319 | 100.0% |
Housing Structures by Occupancy in Redlands
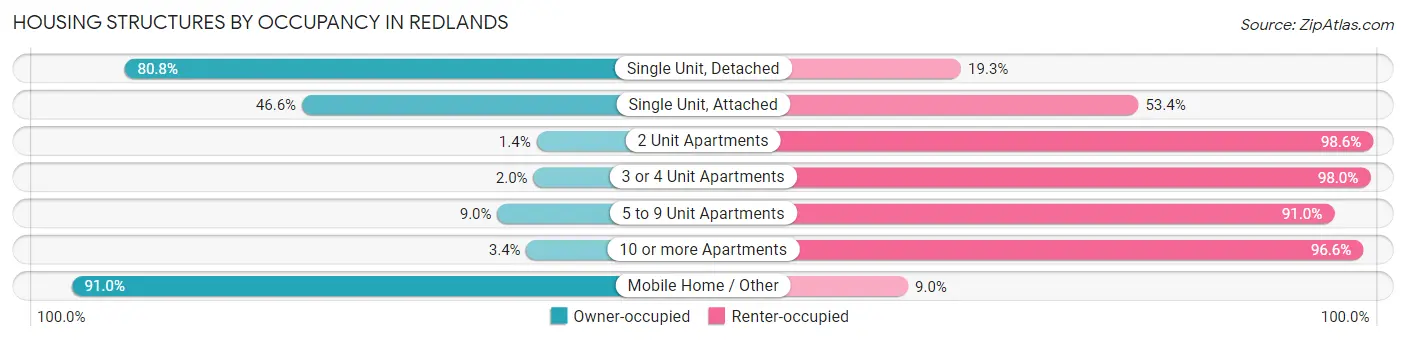
| Structure Type | Owner-occupied | Renter-occupied |
| Single Unit, Detached | 13,287 (80.7%) | 3,168 (19.3%) |
| Single Unit, Attached | 495 (46.6%) | 567 (53.4%) |
| 2 Unit Apartments | 7 (1.4%) | 479 (98.6%) |
| 3 or 4 Unit Apartments | 33 (2.0%) | 1,593 (98.0%) |
| 5 to 9 Unit Apartments | 140 (9.0%) | 1,421 (91.0%) |
| 10 or more Apartments | 114 (3.4%) | 3,262 (96.6%) |
| Mobile Home / Other | 685 (91.0%) | 68 (9.0%) |
| Total | 14,761 (58.3%) | 10,558 (41.7%) |
Housing Structures by Number of Rooms in Redlands
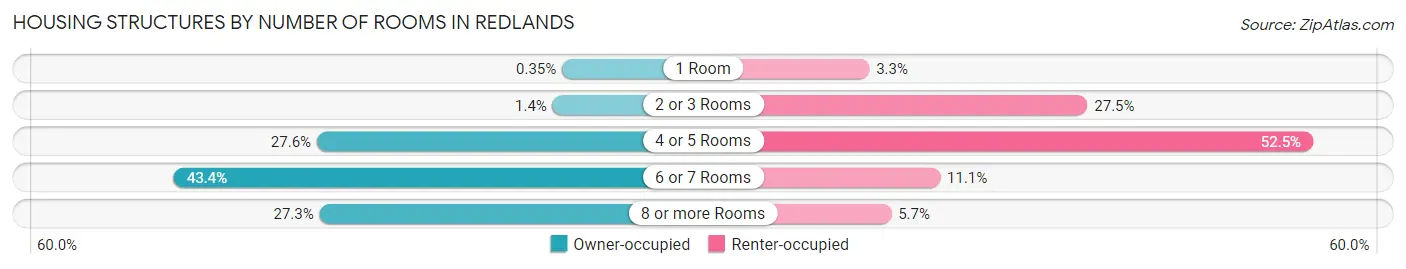
| Number of Rooms | Owner-occupied | Renter-occupied |
| 1 Room | 51 (0.4%) | 343 (3.3%) |
| 2 or 3 Rooms | 205 (1.4%) | 2,899 (27.5%) |
| 4 or 5 Rooms | 4,068 (27.6%) | 5,542 (52.5%) |
| 6 or 7 Rooms | 6,412 (43.4%) | 1,173 (11.1%) |
| 8 or more Rooms | 4,025 (27.3%) | 601 (5.7%) |
| Total | 14,761 (100.0%) | 10,558 (100.0%) |
Housing Structure by Heating Type in Redlands
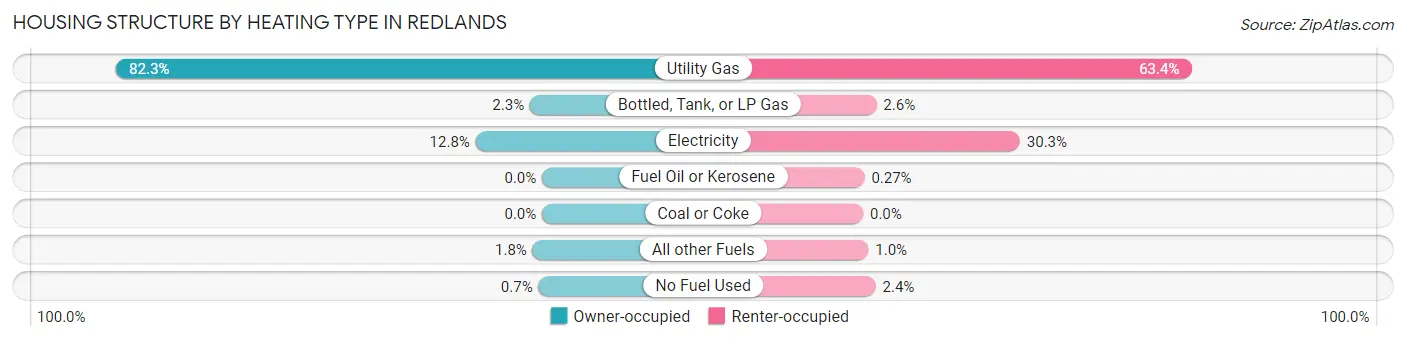
| Heating Type | Owner-occupied | Renter-occupied |
| Utility Gas | 12,148 (82.3%) | 6,695 (63.4%) |
| Bottled, Tank, or LP Gas | 345 (2.3%) | 272 (2.6%) |
| Electricity | 1,896 (12.8%) | 3,199 (30.3%) |
| Fuel Oil or Kerosene | 0 (0.0%) | 28 (0.3%) |
| Coal or Coke | 0 (0.0%) | 0 (0.0%) |
| All other Fuels | 268 (1.8%) | 108 (1.0%) |
| No Fuel Used | 104 (0.7%) | 256 (2.4%) |
| Total | 14,761 (100.0%) | 10,558 (100.0%) |
Household Vehicle Usage in Redlands
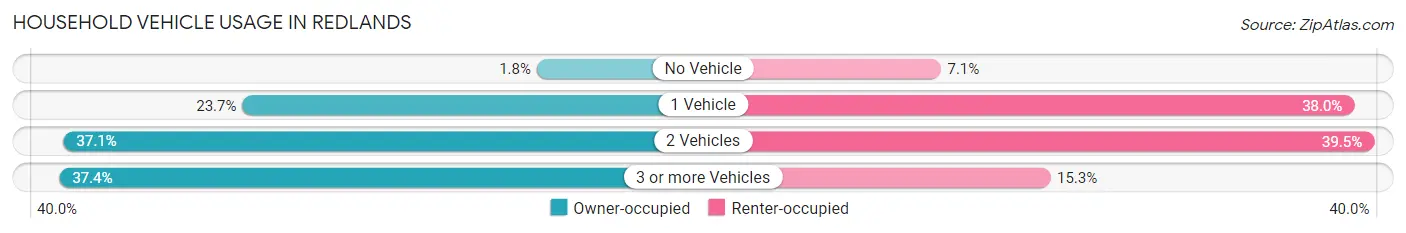
| Vehicles per Household | Owner-occupied | Renter-occupied |
| No Vehicle | 258 (1.8%) | 754 (7.1%) |
| 1 Vehicle | 3,504 (23.7%) | 4,015 (38.0%) |
| 2 Vehicles | 5,477 (37.1%) | 4,171 (39.5%) |
| 3 or more Vehicles | 5,522 (37.4%) | 1,618 (15.3%) |
| Total | 14,761 (100.0%) | 10,558 (100.0%) |
Real Estate & Mortgages in Redlands
Real Estate and Mortgage Overview in Redlands
| Characteristic | Without Mortgage | With Mortgage |
| Housing Units | 4,742 | 10,019 |
| Median Property Value | $454,400 | $574,700 |
| Median Household Income | $71,284 | $4,390 |
| Monthly Housing Costs | $650 | $3,578 |
| Real Estate Taxes | $2,858 | $85 |
Property Value by Mortgage Status in Redlands
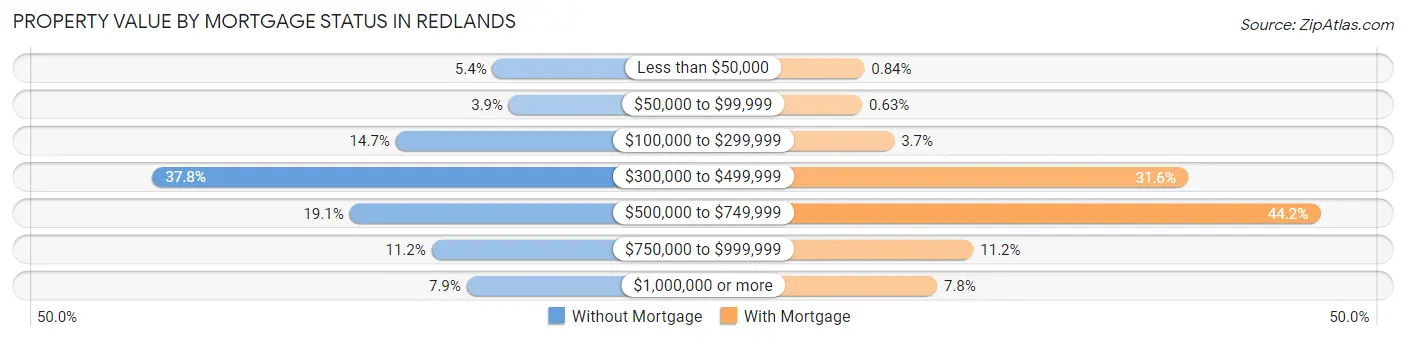
| Property Value | Without Mortgage | With Mortgage |
| Less than $50,000 | 258 (5.4%) | 84 (0.8%) |
| $50,000 to $99,999 | 184 (3.9%) | 63 (0.6%) |
| $100,000 to $299,999 | 695 (14.7%) | 369 (3.7%) |
| $300,000 to $499,999 | 1,793 (37.8%) | 3,170 (31.6%) |
| $500,000 to $749,999 | 904 (19.1%) | 4,432 (44.2%) |
| $750,000 to $999,999 | 533 (11.2%) | 1,124 (11.2%) |
| $1,000,000 or more | 375 (7.9%) | 777 (7.8%) |
| Total | 4,742 (100.0%) | 10,019 (100.0%) |
Household Income by Mortgage Status in Redlands
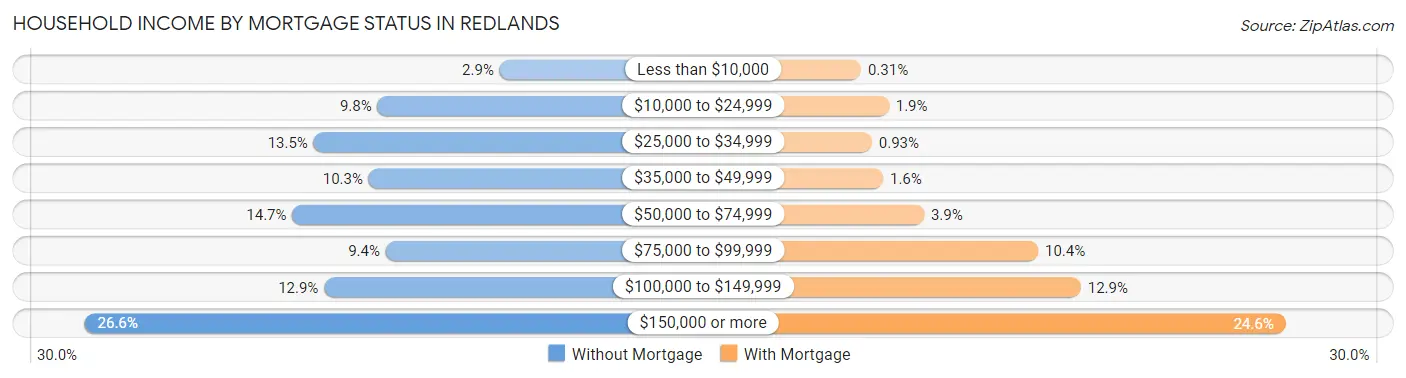
| Household Income | Without Mortgage | With Mortgage |
| Less than $10,000 | 135 (2.9%) | 31 (0.3%) |
| $10,000 to $24,999 | 466 (9.8%) | 190 (1.9%) |
| $25,000 to $34,999 | 639 (13.5%) | 93 (0.9%) |
| $35,000 to $49,999 | 490 (10.3%) | 157 (1.6%) |
| $50,000 to $74,999 | 697 (14.7%) | 392 (3.9%) |
| $75,000 to $99,999 | 444 (9.4%) | 1,045 (10.4%) |
| $100,000 to $149,999 | 611 (12.9%) | 1,289 (12.9%) |
| $150,000 or more | 1,260 (26.6%) | 2,463 (24.6%) |
| Total | 4,742 (100.0%) | 10,019 (100.0%) |
Property Value to Household Income Ratio in Redlands
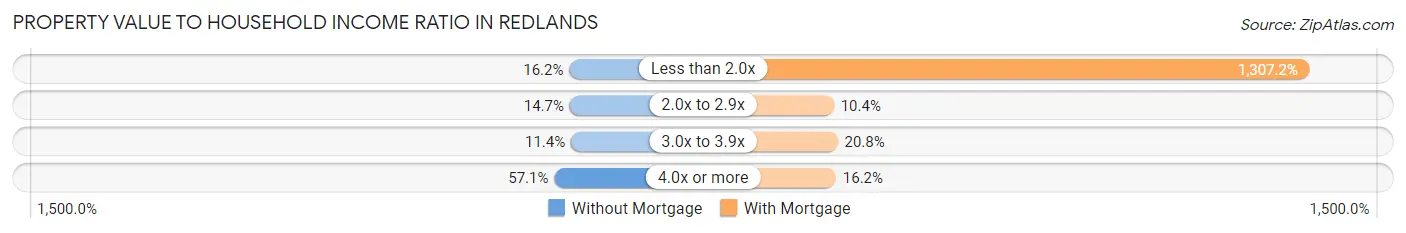
| Value-to-Income Ratio | Without Mortgage | With Mortgage |
| Less than 2.0x | 770 (16.2%) | 130,972 (1,307.2%) |
| 2.0x to 2.9x | 697 (14.7%) | 1,040 (10.4%) |
| 3.0x to 3.9x | 538 (11.4%) | 2,088 (20.8%) |
| 4.0x or more | 2,709 (57.1%) | 1,619 (16.2%) |
| Total | 4,742 (100.0%) | 10,019 (100.0%) |
Real Estate Taxes by Mortgage Status in Redlands
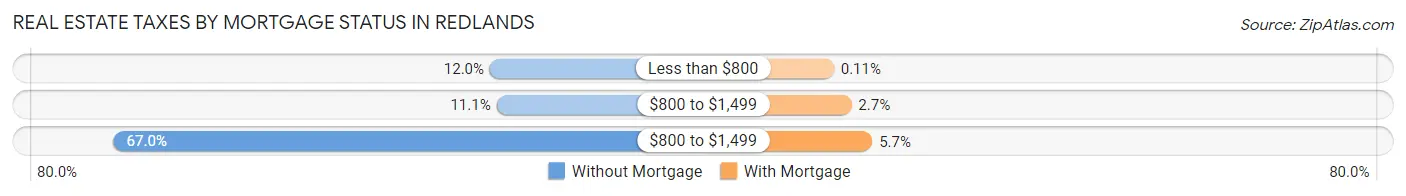
| Property Taxes | Without Mortgage | With Mortgage |
| Less than $800 | 570 (12.0%) | 11 (0.1%) |
| $800 to $1,499 | 524 (11.1%) | 269 (2.7%) |
| $800 to $1,499 | 3,176 (67.0%) | 574 (5.7%) |
| Total | 4,742 (100.0%) | 10,019 (100.0%) |
Health & Disability in Redlands
Health Insurance Coverage by Age in Redlands
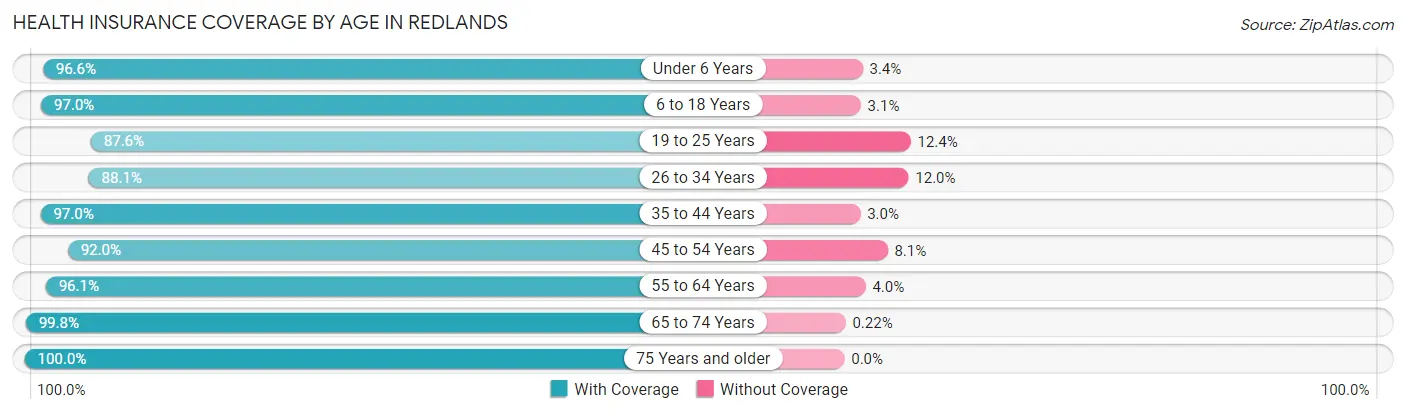
| Age Bracket | With Coverage | Without Coverage |
| Under 6 Years | 5,307 (96.6%) | 187 (3.4%) |
| 6 to 18 Years | 12,123 (97.0%) | 382 (3.0%) |
| 19 to 25 Years | 6,891 (87.6%) | 972 (12.4%) |
| 26 to 34 Years | 9,082 (88.0%) | 1,233 (11.9%) |
| 35 to 44 Years | 9,162 (97.0%) | 280 (3.0%) |
| 45 to 54 Years | 7,317 (91.9%) | 641 (8.1%) |
| 55 to 64 Years | 7,906 (96.1%) | 325 (4.0%) |
| 65 to 74 Years | 5,852 (99.8%) | 13 (0.2%) |
| 75 Years and older | 4,866 (100.0%) | 0 (0.0%) |
| Total | 68,506 (94.4%) | 4,033 (5.6%) |
Health Insurance Coverage by Citizenship Status in Redlands
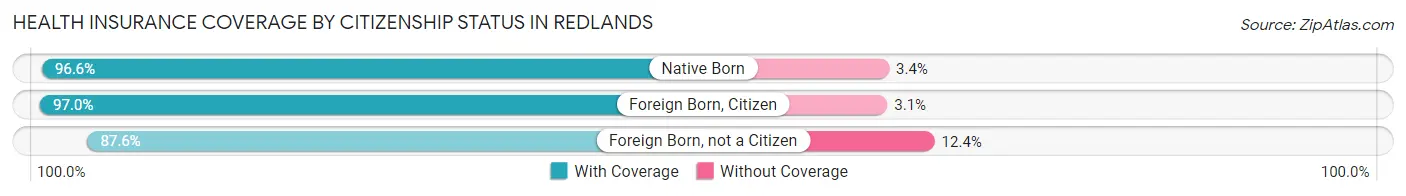
| Citizenship Status | With Coverage | Without Coverage |
| Native Born | 5,307 (96.6%) | 187 (3.4%) |
| Foreign Born, Citizen | 12,123 (97.0%) | 382 (3.0%) |
| Foreign Born, not a Citizen | 6,891 (87.6%) | 972 (12.4%) |
Health Insurance Coverage by Household Income in Redlands
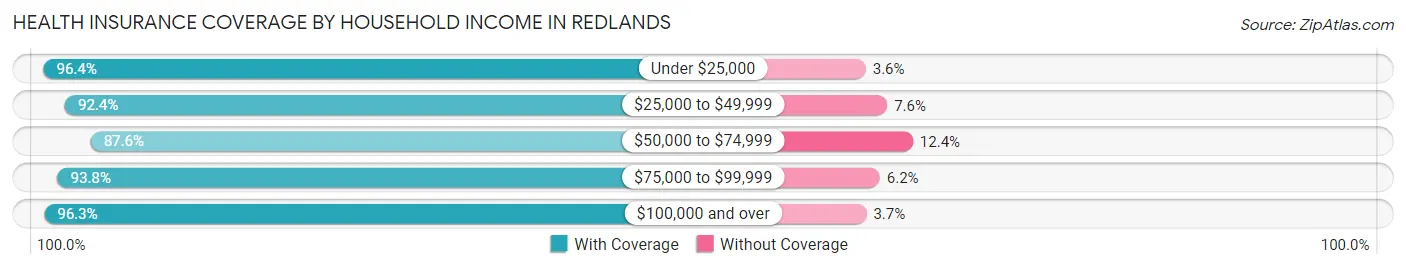
| Household Income | With Coverage | Without Coverage |
| Under $25,000 | 5,065 (96.4%) | 187 (3.6%) |
| $25,000 to $49,999 | 6,202 (92.4%) | 509 (7.6%) |
| $50,000 to $74,999 | 8,920 (87.6%) | 1,261 (12.4%) |
| $75,000 to $99,999 | 9,543 (93.8%) | 630 (6.2%) |
| $100,000 and over | 36,673 (96.3%) | 1,406 (3.7%) |
Public vs Private Health Insurance Coverage by Age in Redlands
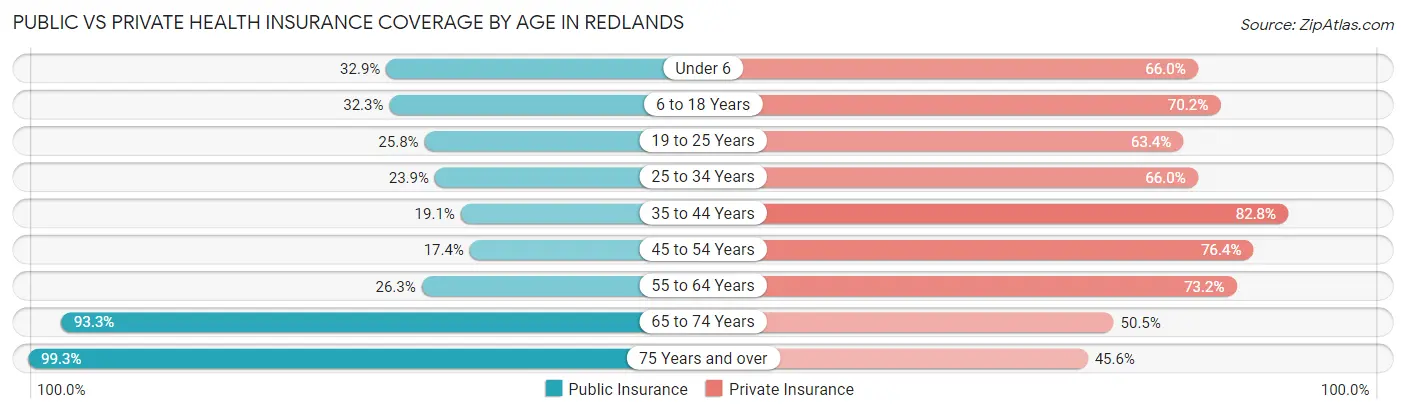
| Age Bracket | Public Insurance | Private Insurance |
| Under 6 | 1,807 (32.9%) | 3,627 (66.0%) |
| 6 to 18 Years | 4,040 (32.3%) | 8,778 (70.2%) |
| 19 to 25 Years | 2,028 (25.8%) | 4,981 (63.3%) |
| 25 to 34 Years | 2,461 (23.9%) | 6,810 (66.0%) |
| 35 to 44 Years | 1,800 (19.1%) | 7,817 (82.8%) |
| 45 to 54 Years | 1,383 (17.4%) | 6,077 (76.4%) |
| 55 to 64 Years | 2,166 (26.3%) | 6,026 (73.2%) |
| 65 to 74 Years | 5,469 (93.2%) | 2,959 (50.4%) |
| 75 Years and over | 4,834 (99.3%) | 2,221 (45.6%) |
| Total | 25,988 (35.8%) | 49,296 (68.0%) |
Disability Status by Sex by Age in Redlands
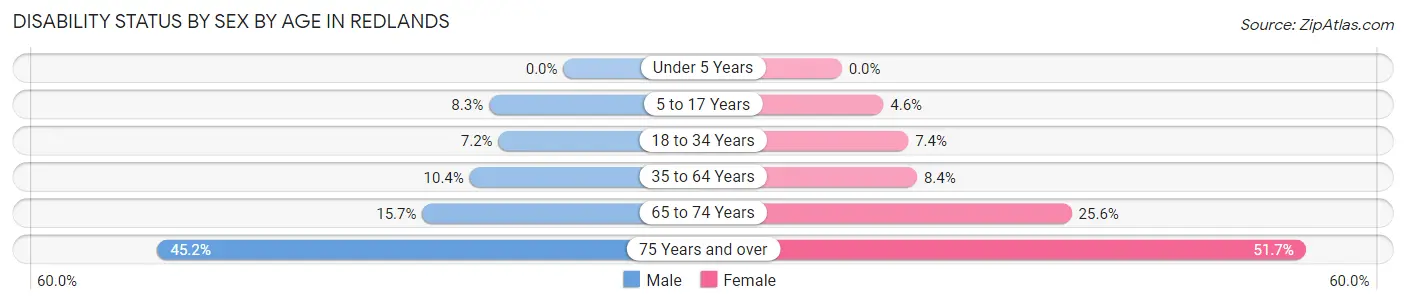
| Age Bracket | Male | Female |
| Under 5 Years | 0 (0.0%) | 0 (0.0%) |
| 5 to 17 Years | 531 (8.3%) | 271 (4.6%) |
| 18 to 34 Years | 694 (7.2%) | 735 (7.4%) |
| 35 to 64 Years | 1,283 (10.4%) | 1,117 (8.4%) |
| 65 to 74 Years | 415 (15.7%) | 825 (25.6%) |
| 75 Years and over | 827 (45.2%) | 1,568 (51.6%) |
Disability Class by Sex by Age in Redlands
Disability Class: Hearing Difficulty
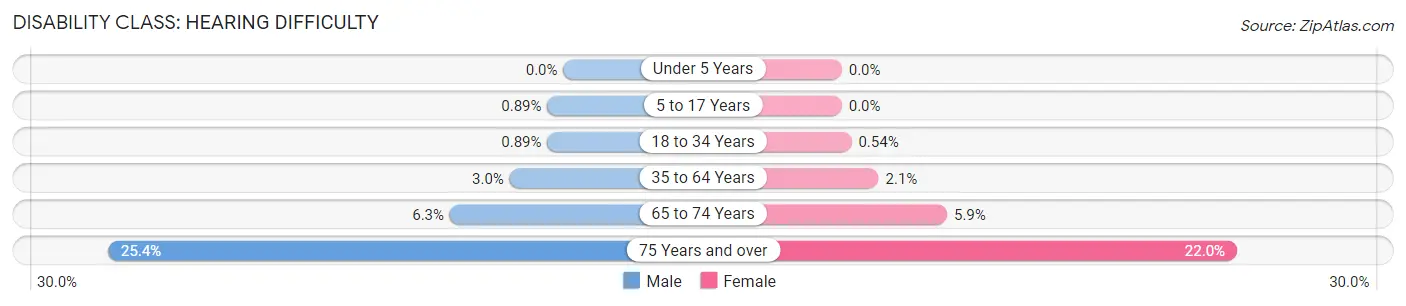
| Age Bracket | Male | Female |
| Under 5 Years | 0 (0.0%) | 0 (0.0%) |
| 5 to 17 Years | 57 (0.9%) | 0 (0.0%) |
| 18 to 34 Years | 85 (0.9%) | 54 (0.5%) |
| 35 to 64 Years | 368 (3.0%) | 274 (2.1%) |
| 65 to 74 Years | 167 (6.3%) | 189 (5.9%) |
| 75 Years and over | 464 (25.4%) | 668 (22.0%) |
Disability Class: Vision Difficulty
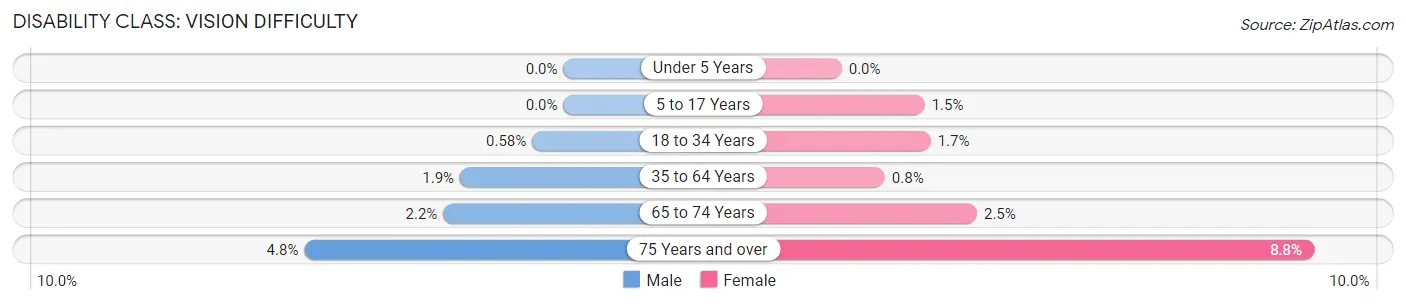
| Age Bracket | Male | Female |
| Under 5 Years | 0 (0.0%) | 0 (0.0%) |
| 5 to 17 Years | 0 (0.0%) | 90 (1.5%) |
| 18 to 34 Years | 56 (0.6%) | 164 (1.7%) |
| 35 to 64 Years | 236 (1.9%) | 107 (0.8%) |
| 65 to 74 Years | 59 (2.2%) | 81 (2.5%) |
| 75 Years and over | 88 (4.8%) | 266 (8.8%) |
Disability Class: Cognitive Difficulty
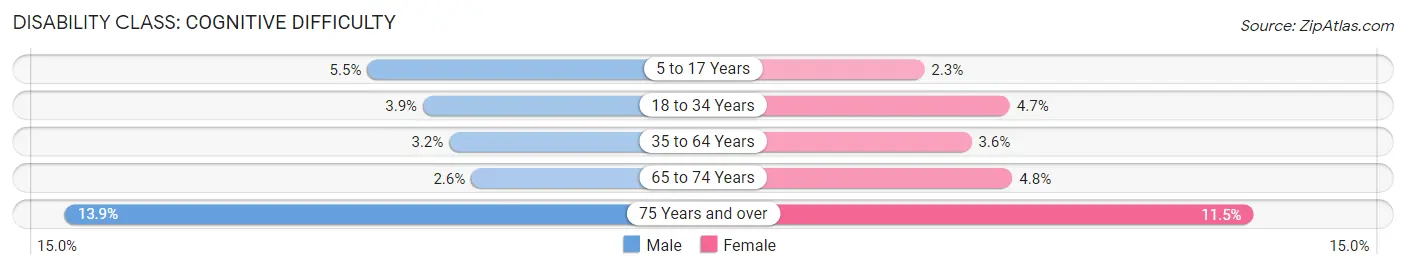
| Age Bracket | Male | Female |
| 5 to 17 Years | 350 (5.5%) | 135 (2.3%) |
| 18 to 34 Years | 375 (3.9%) | 465 (4.7%) |
| 35 to 64 Years | 391 (3.2%) | 481 (3.6%) |
| 65 to 74 Years | 68 (2.6%) | 153 (4.8%) |
| 75 Years and over | 254 (13.9%) | 348 (11.5%) |
Disability Class: Ambulatory Difficulty
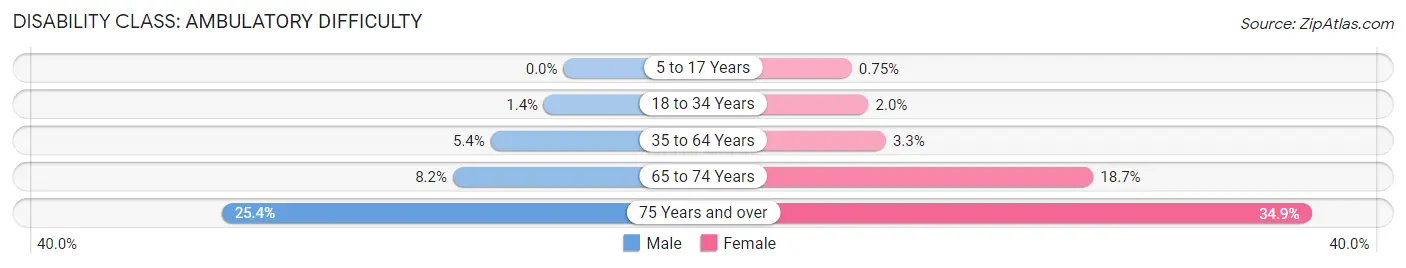
| Age Bracket | Male | Female |
| 5 to 17 Years | 0 (0.0%) | 44 (0.7%) |
| 18 to 34 Years | 138 (1.4%) | 198 (2.0%) |
| 35 to 64 Years | 664 (5.4%) | 438 (3.3%) |
| 65 to 74 Years | 217 (8.2%) | 602 (18.7%) |
| 75 Years and over | 464 (25.4%) | 1,058 (34.8%) |
Disability Class: Self-Care Difficulty
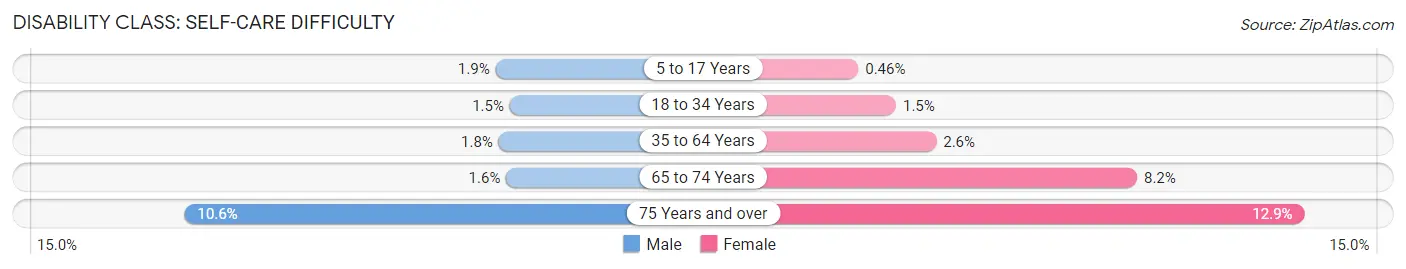
| Age Bracket | Male | Female |
| 5 to 17 Years | 121 (1.9%) | 27 (0.5%) |
| 18 to 34 Years | 143 (1.5%) | 150 (1.5%) |
| 35 to 64 Years | 221 (1.8%) | 351 (2.6%) |
| 65 to 74 Years | 42 (1.6%) | 265 (8.2%) |
| 75 Years and over | 193 (10.5%) | 391 (12.9%) |
Technology Access in Redlands
Computing Device Access in Redlands
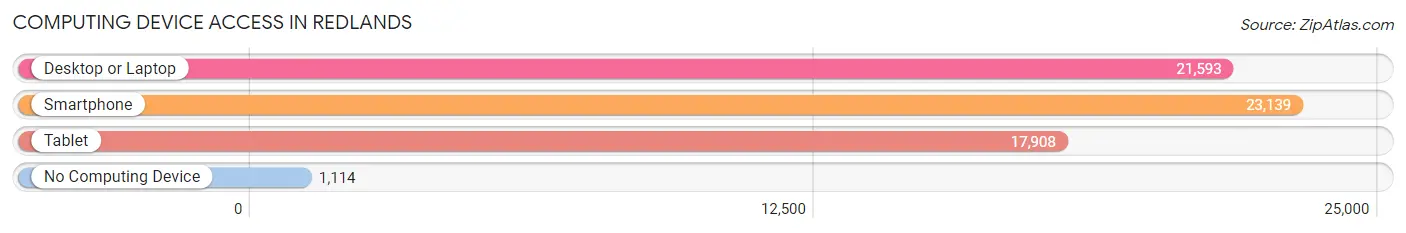
| Device Type | # Households | % Households |
| Desktop or Laptop | 21,593 | 85.3% |
| Smartphone | 23,139 | 91.4% |
| Tablet | 17,908 | 70.7% |
| No Computing Device | 1,114 | 4.4% |
| Total | 25,319 | 100.0% |
Internet Access in Redlands
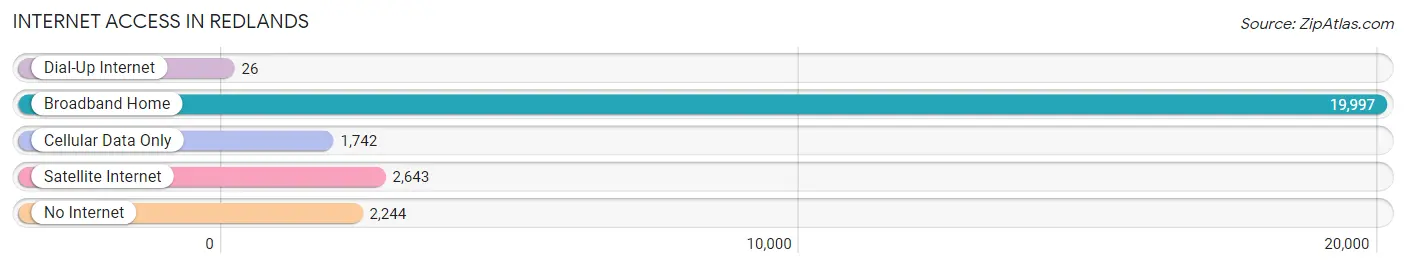
| Internet Type | # Households | % Households |
| Dial-Up Internet | 26 | 0.1% |
| Broadband Home | 19,997 | 79.0% |
| Cellular Data Only | 1,742 | 6.9% |
| Satellite Internet | 2,643 | 10.4% |
| No Internet | 2,244 | 8.9% |
| Total | 25,319 | 100.0% |
Redlands Summary
Redlands, California is a city located in San Bernardino County, California, United States. It is situated in the Inland Empire region of Southern California, approximately 10 miles east of downtown San Bernardino. The city is known for its historic downtown, its citrus groves, and its picturesque mountain views. Redlands is home to the University of Redlands, a private liberal arts college, and the Redlands Bowl, an outdoor amphitheater.
History
The area that is now Redlands was originally inhabited by the Serrano and Cahuilla Native American tribes. The first Europeans to settle in the area were the Spanish, who established the San Bernardino de Sena Estancia in 1819. The area was later part of Mexico until 1848, when it became part of the United States after the Mexican-American War.
In 1851, the area was surveyed by Benjamin Barton, who named the area Redlands after the red soil in the area. The area was then settled by Mormon pioneers in 1852, and the city was officially incorporated in 1888.
Geography
Redlands is located in the Inland Empire region of Southern California, approximately 10 miles east of downtown San Bernardino. The city is situated at the base of the San Bernardino Mountains, and is surrounded by citrus groves and rolling hills. The city has a total area of 30.2 square miles, of which 0.04 square miles is water.
Climate
Redlands has a Mediterranean climate, with hot, dry summers and mild, wet winters. The average high temperature in the summer is around 90°F, and the average low temperature in the winter is around 40°F. The city receives an average of 15 inches of rain per year.
Demographics
As of the 2010 census, Redlands had a population of 68,747. The racial makeup of the city was 68.2% White, 4.3% African American, 1.2% Native American, 4.2% Asian, 0.2% Pacific Islander, 16.2% from other races, and 5.7% from two or more races. Hispanic or Latino of any race were 33.2% of the population.
Economy
Redlands is home to a variety of businesses, including manufacturing, retail, and healthcare. The city is also home to the University of Redlands, which is a major employer in the area. The city is also home to the Redlands Bowl, an outdoor amphitheater that hosts a variety of concerts and performances throughout the year.
Redlands is also home to a variety of agricultural businesses, including citrus groves, nurseries, and wineries. The city is also home to a variety of technology companies, including Esri, a leading provider of geographic information systems.
Conclusion
Redlands, California is a city located in San Bernardino County, California, United States. It is situated in the Inland Empire region of Southern California, approximately 10 miles east of downtown San Bernardino. The city is known for its historic downtown, its citrus groves, and its picturesque mountain views. Redlands is home to the University of Redlands, a private liberal arts college, and the Redlands Bowl, an outdoor amphitheater. The city has a population of 68,747, and is home to a variety of businesses, including manufacturing, retail, and healthcare. Redlands is also home to a variety of agricultural businesses, including citrus groves, nurseries, and wineries. The city is also home to a variety of technology companies, including Esri, a leading provider of geographic information systems.
Common Questions
What is Per Capita Income in Redlands?
Per Capita income in Redlands is $45,716.
What is the Median Family Income in Redlands?
Median Family Income in Redlands is $107,409.
What is the Median Household income in Redlands?
Median Household Income in Redlands is $94,473.
What is Income or Wage Gap in Redlands?
Income or Wage Gap in Redlands is 31.0%.
Women in Redlands earn 69.0 cents for every dollar earned by a man.
What is Family Income Deficit in Redlands?
Family Income Deficit in Redlands is $11,274.
Families that are below poverty line in Redlands earn $11,274 less on average than the poverty threshold level.
What is Inequality or Gini Index in Redlands?
Inequality or Gini Index in Redlands is 0.47.
What is the Total Population of Redlands?
Total Population of Redlands is 73,234.
What is the Total Male Population of Redlands?
Total Male Population of Redlands is 35,383.
What is the Total Female Population of Redlands?
Total Female Population of Redlands is 37,851.
What is the Ratio of Males per 100 Females in Redlands?
There are 93.48 Males per 100 Females in Redlands.
What is the Ratio of Females per 100 Males in Redlands?
There are 106.98 Females per 100 Males in Redlands.
What is the Median Population Age in Redlands?
Median Population Age in Redlands is 35.5 Years.
What is the Average Family Size in Redlands
Average Family Size in Redlands is 3.3 People.
What is the Average Household Size in Redlands
Average Household Size in Redlands is 2.8 People.
How Large is the Labor Force in Redlands?
There are 36,943 People in the Labor Forcein in Redlands.
What is the Percentage of People in the Labor Force in Redlands?
63.3% of People are in the Labor Force in Redlands.
What is the Unemployment Rate in Redlands?
Unemployment Rate in Redlands is 6.5%.