Brea, CA Map & Demographics
Brea Map
Brea Overview
$50,780
PER CAPITA INCOME
$138,599
AVG FAMILY INCOME
$120,226
AVG HOUSEHOLD INCOME
34.3%
WAGE / INCOME GAP [ % ]
65.7¢/ $1
WAGE / INCOME GAP [ $ ]
0.40
INEQUALITY / GINI INDEX
47,099
TOTAL POPULATION
22,434
MALE POPULATION
24,665
FEMALE POPULATION
90.95
MALES / 100 FEMALES
109.94
FEMALES / 100 MALES
39.7
MEDIAN AGE
3.3
AVG FAMILY SIZE
2.9
AVG HOUSEHOLD SIZE
25,372
LABOR FORCE [ PEOPLE ]
67.1%
PERCENT IN LABOR FORCE
5.0%
UNEMPLOYMENT RATE
Brea Area Codes
Income in Brea
Income Overview in Brea
Per Capita Income in Brea is $50,780, while median incomes of families and households are $138,599 and $120,226 respectively.
| Characteristic | Number | Measure |
| Per Capita Income | 47,099 | $50,780 |
| Median Family Income | 12,210 | $138,599 |
| Mean Family Income | 12,210 | $160,123 |
| Median Household Income | 16,454 | $120,226 |
| Mean Household Income | 16,454 | $142,799 |
| Income Deficit | 12,210 | $0 |
| Wage / Income Gap (%) | 47,099 | 34.27% |
| Wage / Income Gap ($) | 47,099 | 65.73¢ per $1 |
| Gini / Inequality Index | 47,099 | 0.40 |
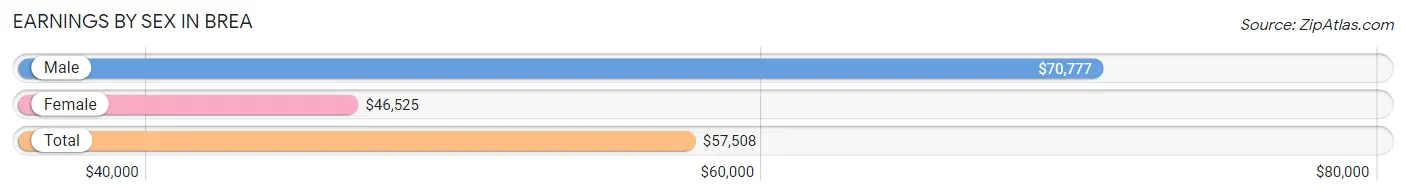
Earnings by Sex in Brea
Average Earnings in Brea are $57,508, $70,777 for men and $46,525 for women, a difference of 34.3%.
| Sex | Number | Average Earnings |
| Male | 13,139 (50.5%) | $70,777 |
| Female | 12,877 (49.5%) | $46,525 |
| Total | 26,016 (100.0%) | $57,508 |
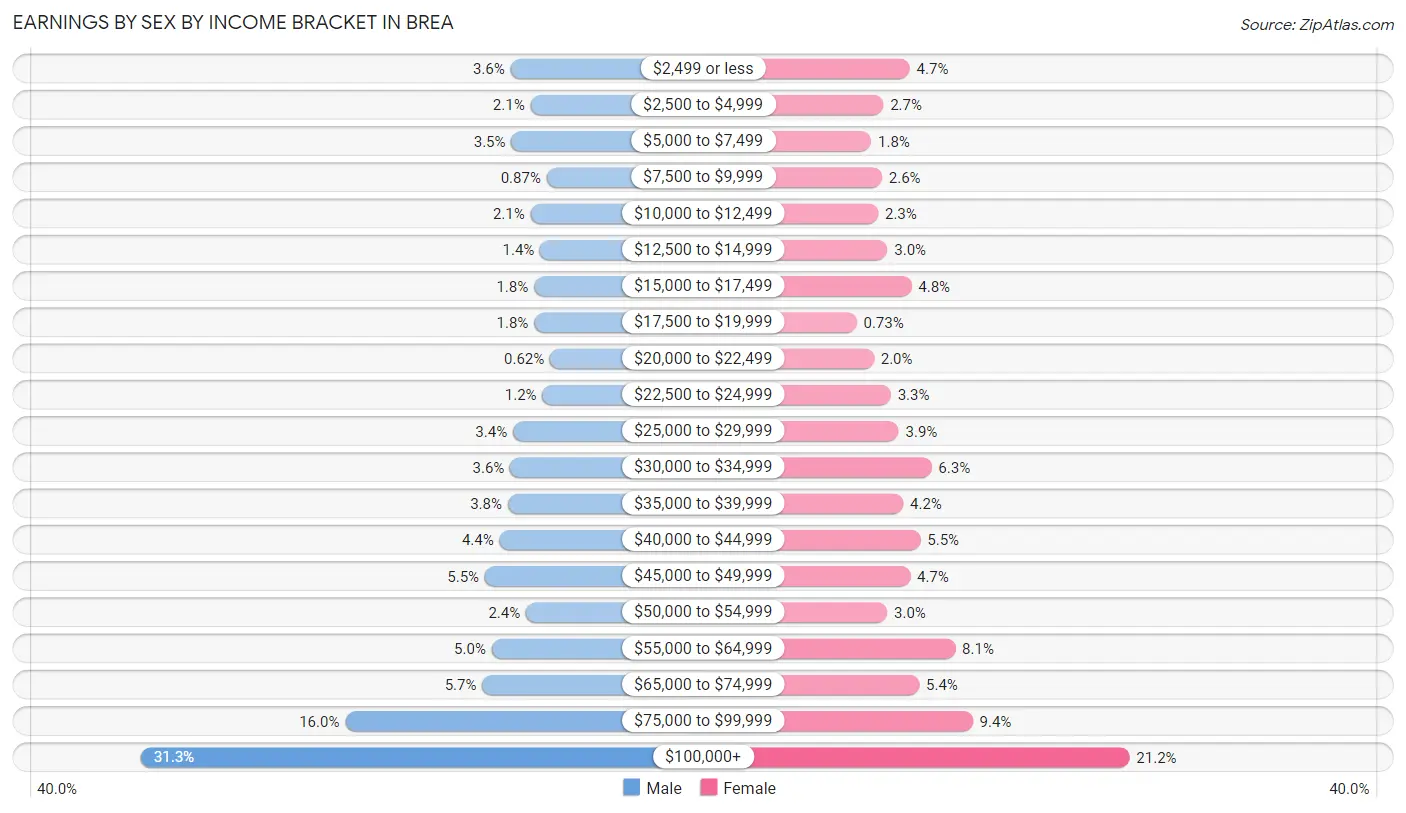
Earnings by Sex by Income Bracket in Brea
The most common earnings brackets in Brea are $100,000+ for men (4,110 | 31.3%) and $100,000+ for women (2,727 | 21.2%).
| Income | Male | Female |
| $2,499 or less | 471 (3.6%) | 606 (4.7%) |
| $2,500 to $4,999 | 275 (2.1%) | 351 (2.7%) |
| $5,000 to $7,499 | 462 (3.5%) | 235 (1.8%) |
| $7,500 to $9,999 | 114 (0.9%) | 339 (2.6%) |
| $10,000 to $12,499 | 273 (2.1%) | 301 (2.3%) |
| $12,500 to $14,999 | 179 (1.4%) | 391 (3.0%) |
| $15,000 to $17,499 | 239 (1.8%) | 623 (4.8%) |
| $17,500 to $19,999 | 238 (1.8%) | 94 (0.7%) |
| $20,000 to $22,499 | 81 (0.6%) | 260 (2.0%) |
| $22,500 to $24,999 | 156 (1.2%) | 424 (3.3%) |
| $25,000 to $29,999 | 447 (3.4%) | 500 (3.9%) |
| $30,000 to $34,999 | 474 (3.6%) | 816 (6.3%) |
| $35,000 to $39,999 | 498 (3.8%) | 543 (4.2%) |
| $40,000 to $44,999 | 580 (4.4%) | 709 (5.5%) |
| $45,000 to $49,999 | 722 (5.5%) | 611 (4.7%) |
| $50,000 to $54,999 | 318 (2.4%) | 389 (3.0%) |
| $55,000 to $64,999 | 655 (5.0%) | 1,046 (8.1%) |
| $65,000 to $74,999 | 749 (5.7%) | 698 (5.4%) |
| $75,000 to $99,999 | 2,098 (16.0%) | 1,214 (9.4%) |
| $100,000+ | 4,110 (31.3%) | 2,727 (21.2%) |
| Total | 13,139 (100.0%) | 12,877 (100.0%) |
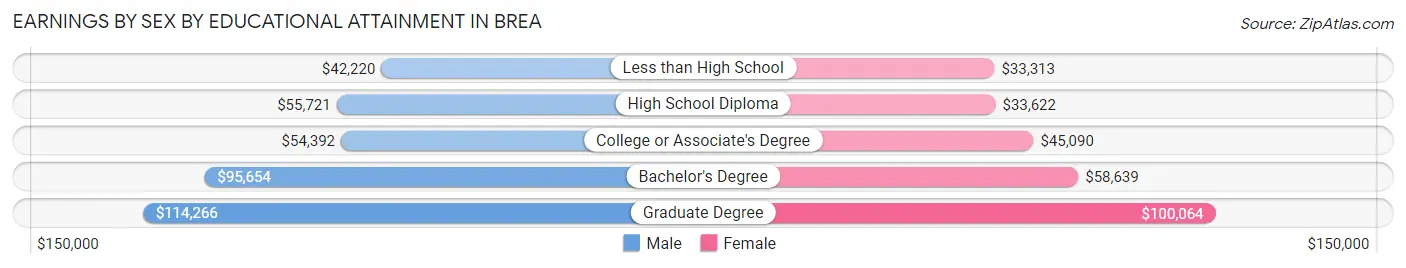
Earnings by Sex by Educational Attainment in Brea
Average earnings in Brea are $76,418 for men and $54,760 for women, a difference of 28.3%. Men with an educational attainment of graduate degree enjoy the highest average annual earnings of $114,266, while those with less than high school education earn the least with $42,220. Women with an educational attainment of graduate degree earn the most with the average annual earnings of $100,064, while those with less than high school education have the smallest earnings of $33,313.
| Educational Attainment | Male Income | Female Income |
| Less than High School | $42,220 | $33,313 |
| High School Diploma | $55,721 | $33,622 |
| College or Associate's Degree | $54,392 | $45,090 |
| Bachelor's Degree | $95,654 | $58,639 |
| Graduate Degree | $114,266 | $100,064 |
| Total | $76,418 | $54,760 |
Family Income in Brea
Family Income Brackets in Brea
According to the Brea family income data, there are 3,382 families falling into the $200,000+ income range, which is the most common income bracket and makes up 27.7% of all families. Conversely, the $10,000 to $14,999 income bracket is the least frequent group with only 73 families (0.6%) belonging to this category.
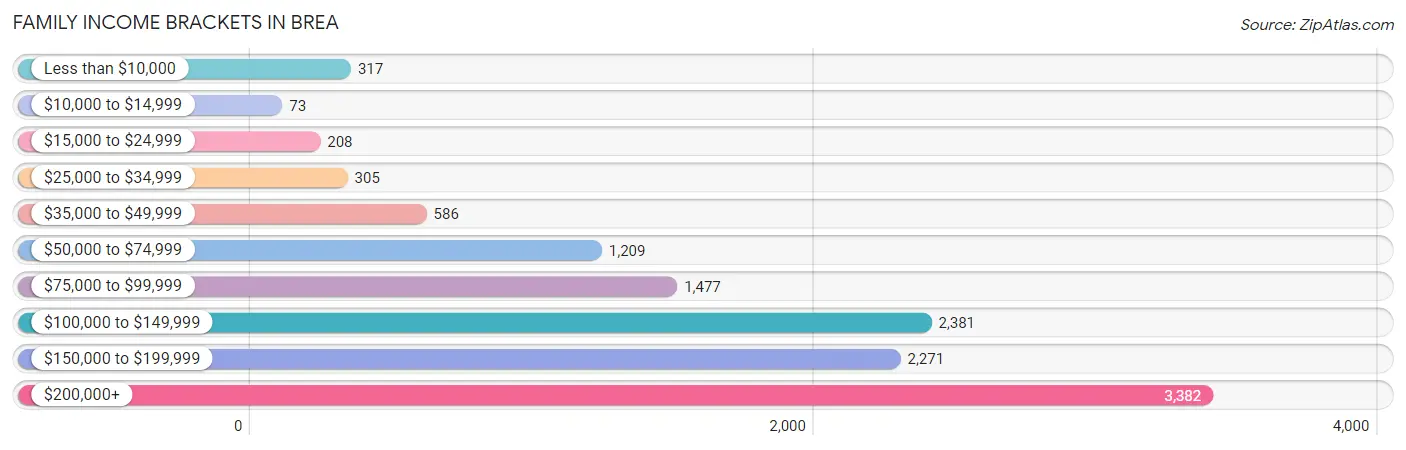
| Income Bracket | # Families | % Families |
| Less than $10,000 | 317 | 2.6% |
| $10,000 to $14,999 | 73 | 0.6% |
| $15,000 to $24,999 | 208 | 1.7% |
| $25,000 to $34,999 | 305 | 2.5% |
| $35,000 to $49,999 | 586 | 4.8% |
| $50,000 to $74,999 | 1,209 | 9.9% |
| $75,000 to $99,999 | 1,477 | 12.1% |
| $100,000 to $149,999 | 2,381 | 19.5% |
| $150,000 to $199,999 | 2,271 | 18.6% |
| $200,000+ | 3,382 | 27.7% |
Family Income by Famaliy Size in Brea
7+ person families (289 | 2.4%) account for the highest median family income in Brea with $168,832 per family, while 2-person families (4,908 | 40.2%) have the highest median income of $60,869 per family member.
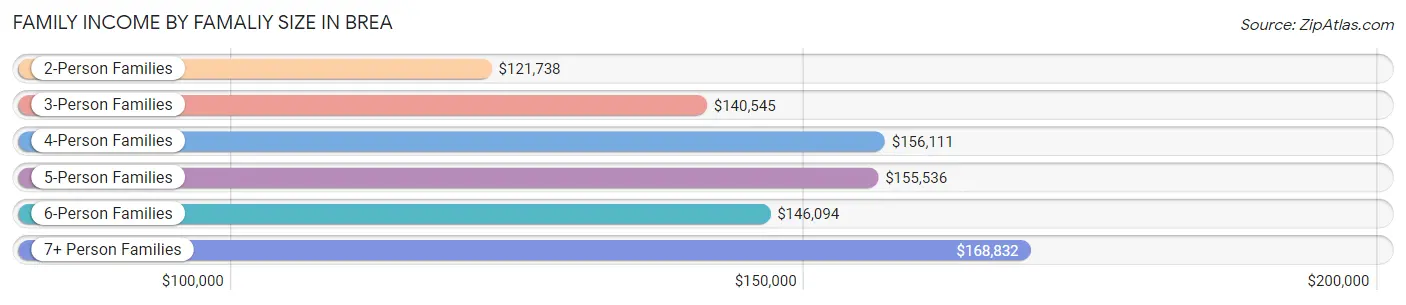
| Income Bracket | # Families | Median Income |
| 2-Person Families | 4,908 (40.2%) | $121,738 |
| 3-Person Families | 2,914 (23.9%) | $140,545 |
| 4-Person Families | 2,648 (21.7%) | $156,111 |
| 5-Person Families | 1,092 (8.9%) | $155,536 |
| 6-Person Families | 359 (2.9%) | $146,094 |
| 7+ Person Families | 289 (2.4%) | $168,832 |
| Total | 12,210 (100.0%) | $138,599 |
Family Income by Number of Earners in Brea
The median family income in Brea is $138,599, with families comprising 3+ earners (1,940) having the highest median family income of $193,205, while families with no earners (1,366) have the lowest median family income of $78,393, accounting for 15.9% and 11.2% of families, respectively.
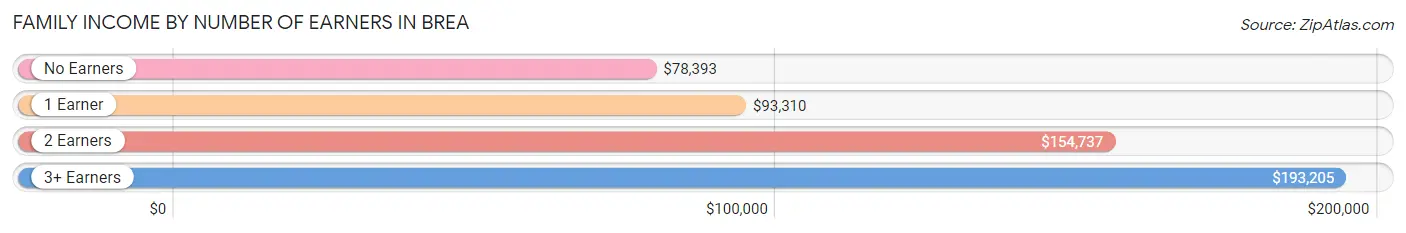
| Number of Earners | # Families | Median Income |
| No Earners | 1,366 (11.2%) | $78,393 |
| 1 Earner | 3,406 (27.9%) | $93,310 |
| 2 Earners | 5,498 (45.0%) | $154,737 |
| 3+ Earners | 1,940 (15.9%) | $193,205 |
| Total | 12,210 (100.0%) | $138,599 |
Household Income in Brea
Household Income Brackets in Brea
With 3,850 households falling in the category, the $200,000+ income range is the most frequent in Brea, accounting for 23.4% of all households. In contrast, only 181 households (1.1%) fall into the $10,000 to $14,999 income bracket, making it the least populous group.
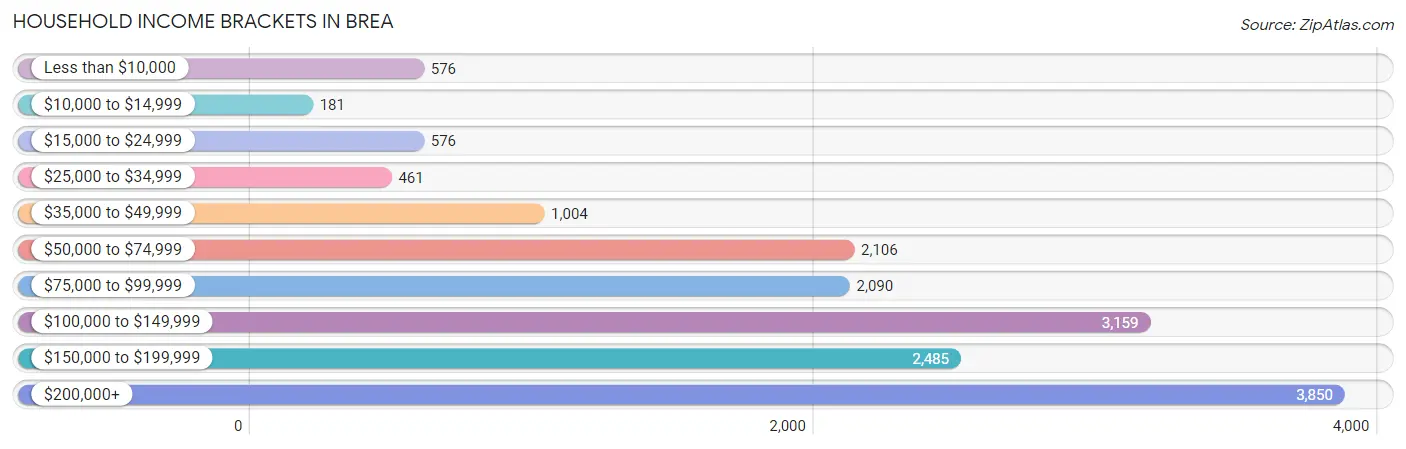
| Income Bracket | # Households | % Households |
| Less than $10,000 | 576 | 3.5% |
| $10,000 to $14,999 | 181 | 1.1% |
| $15,000 to $24,999 | 576 | 3.5% |
| $25,000 to $34,999 | 461 | 2.8% |
| $35,000 to $49,999 | 1,004 | 6.1% |
| $50,000 to $74,999 | 2,106 | 12.8% |
| $75,000 to $99,999 | 2,090 | 12.7% |
| $100,000 to $149,999 | 3,159 | 19.2% |
| $150,000 to $199,999 | 2,485 | 15.1% |
| $200,000+ | 3,850 | 23.4% |
Household Income by Householder Age in Brea
The median household income in Brea is $120,226, with the highest median household income of $141,836 found in the 45 to 64 years age bracket for the primary householder. A total of 6,737 households (40.9%) fall into this category. Meanwhile, the 15 to 24 years age bracket for the primary householder has the lowest median household income of $51,310, with 181 households (1.1%) in this group.
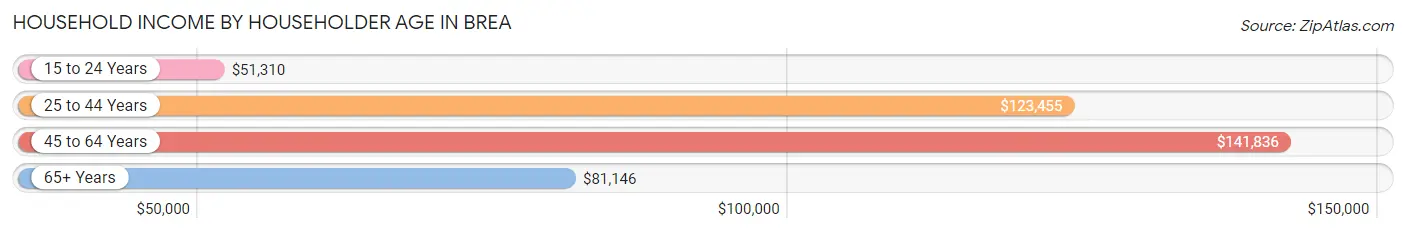
| Income Bracket | # Households | Median Income |
| 15 to 24 Years | 181 (1.1%) | $51,310 |
| 25 to 44 Years | 5,204 (31.6%) | $123,455 |
| 45 to 64 Years | 6,737 (40.9%) | $141,836 |
| 65+ Years | 4,332 (26.3%) | $81,146 |
| Total | 16,454 (100.0%) | $120,226 |
Poverty in Brea
Income Below Poverty by Sex and Age in Brea
With 7.1% poverty level for males and 6.3% for females among the residents of Brea, 12 to 14 year old males and 5 year old females are the most vulnerable to poverty, with 154 males (15.3%) and 48 females (13.3%) in their respective age groups living below the poverty level.
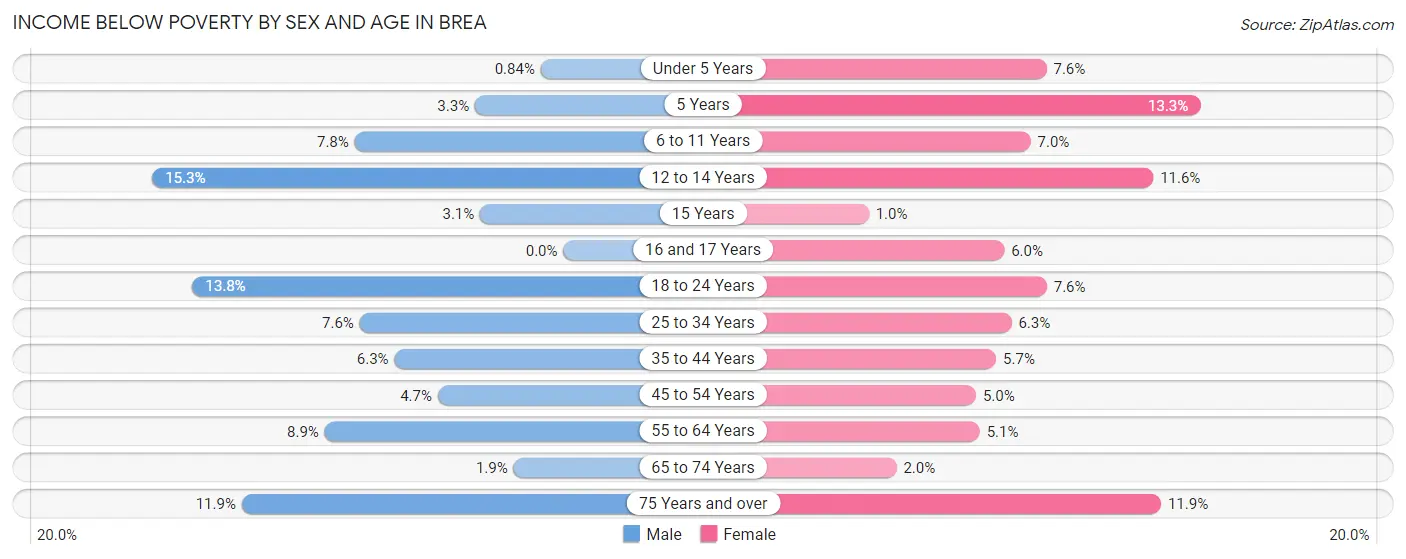
| Age Bracket | Male | Female |
| Under 5 Years | 11 (0.8%) | 81 (7.6%) |
| 5 Years | 9 (3.3%) | 48 (13.3%) |
| 6 to 11 Years | 124 (7.7%) | 120 (7.0%) |
| 12 to 14 Years | 154 (15.3%) | 111 (11.6%) |
| 15 Years | 10 (3.1%) | 6 (1.0%) |
| 16 and 17 Years | 0 (0.0%) | 45 (6.0%) |
| 18 to 24 Years | 264 (13.8%) | 139 (7.6%) |
| 25 to 34 Years | 253 (7.6%) | 211 (6.3%) |
| 35 to 44 Years | 188 (6.3%) | 174 (5.7%) |
| 45 to 54 Years | 139 (4.7%) | 174 (5.0%) |
| 55 to 64 Years | 281 (8.9%) | 160 (5.1%) |
| 65 to 74 Years | 37 (1.8%) | 46 (2.0%) |
| 75 Years and over | 128 (11.9%) | 243 (11.8%) |
| Total | 1,598 (7.1%) | 1,558 (6.3%) |
Income Above Poverty by Sex and Age in Brea
According to the poverty statistics in Brea, males aged 16 and 17 years and females aged 15 years are the age groups that are most secure financially, with 100.0% of males and 99.0% of females in these age groups living above the poverty line.
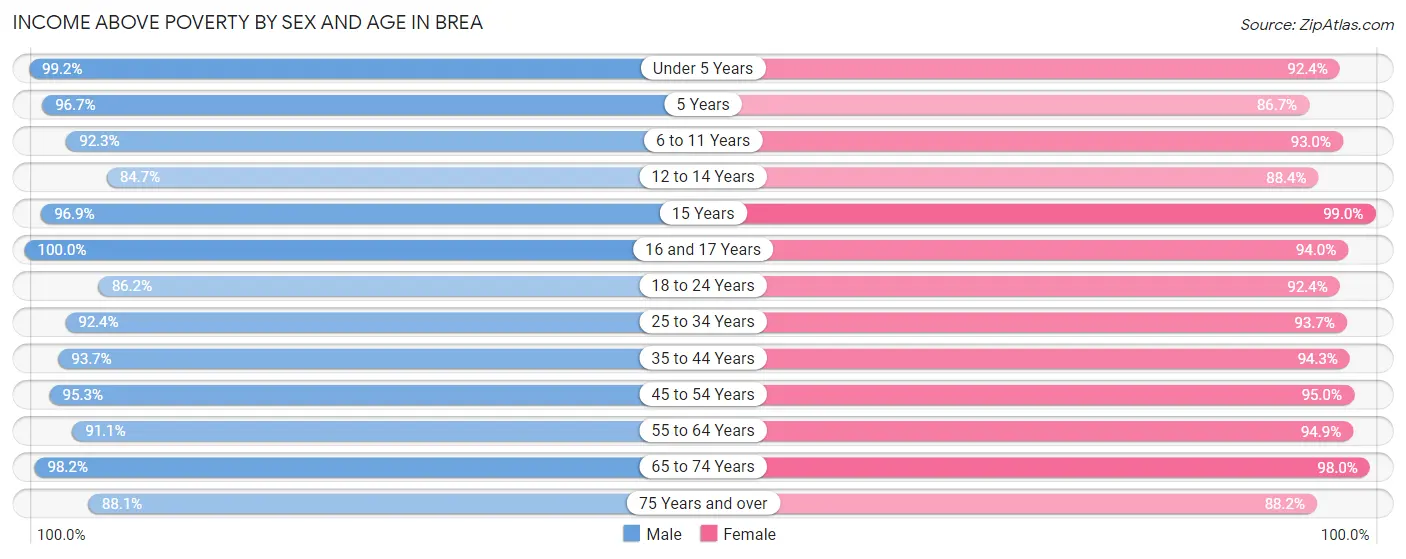
| Age Bracket | Male | Female |
| Under 5 Years | 1,299 (99.2%) | 985 (92.4%) |
| 5 Years | 265 (96.7%) | 313 (86.7%) |
| 6 to 11 Years | 1,477 (92.2%) | 1,593 (93.0%) |
| 12 to 14 Years | 855 (84.7%) | 849 (88.4%) |
| 15 Years | 314 (96.9%) | 594 (99.0%) |
| 16 and 17 Years | 389 (100.0%) | 701 (94.0%) |
| 18 to 24 Years | 1,653 (86.2%) | 1,687 (92.4%) |
| 25 to 34 Years | 3,092 (92.4%) | 3,136 (93.7%) |
| 35 to 44 Years | 2,811 (93.7%) | 2,861 (94.3%) |
| 45 to 54 Years | 2,847 (95.3%) | 3,317 (95.0%) |
| 55 to 64 Years | 2,892 (91.1%) | 2,965 (94.9%) |
| 65 to 74 Years | 1,967 (98.2%) | 2,222 (98.0%) |
| 75 Years and over | 944 (88.1%) | 1,807 (88.1%) |
| Total | 20,805 (92.9%) | 23,030 (93.7%) |
Income Below Poverty Among Married-Couple Families in Brea
The poverty statistics for married-couple families in Brea show that 3.2% or 302 of the total 9,502 families live below the poverty line. Families with 3 or 4 children have the highest poverty rate of 10.7%, comprising of 61 families. On the other hand, families with 5 or more children have the lowest poverty rate of 0.0%, which includes 0 families.
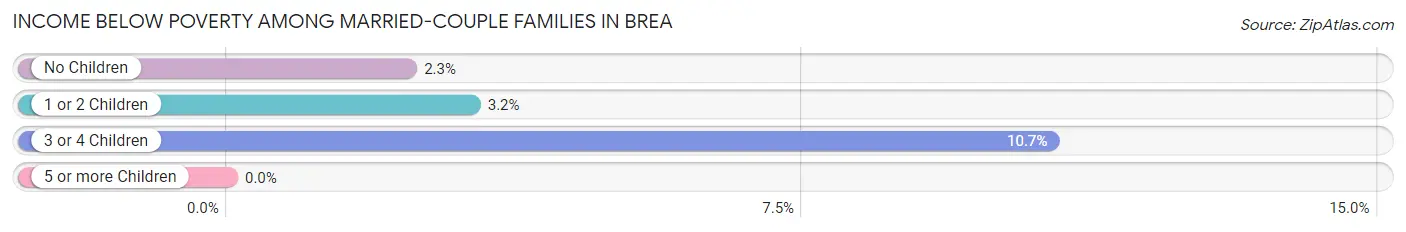
| Children | Above Poverty | Below Poverty |
| No Children | 4,886 (97.7%) | 117 (2.3%) |
| 1 or 2 Children | 3,785 (96.8%) | 124 (3.2%) |
| 3 or 4 Children | 508 (89.3%) | 61 (10.7%) |
| 5 or more Children | 21 (100.0%) | 0 (0.0%) |
| Total | 9,200 (96.8%) | 302 (3.2%) |
Income Below Poverty Among Single-Parent Households in Brea
According to the poverty data in Brea, 7.6% or 43 single-father households and 11.7% or 250 single-mother households are living below the poverty line. Among single-father households, those with no children have the highest poverty rate, with 43 households (10.9%) experiencing poverty. Likewise, among single-mother households, those with 1 or 2 children have the highest poverty rate, with 165 households (19.0%) falling below the poverty line.
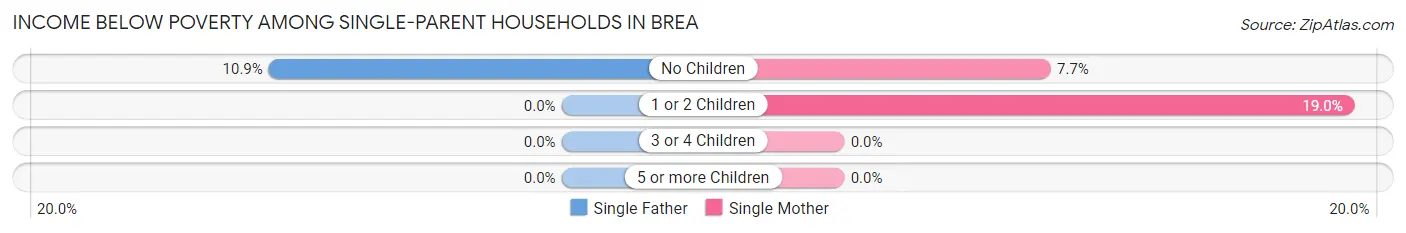
| Children | Single Father | Single Mother |
| No Children | 43 (10.9%) | 85 (7.7%) |
| 1 or 2 Children | 0 (0.0%) | 165 (19.0%) |
| 3 or 4 Children | 0 (0.0%) | 0 (0.0%) |
| 5 or more Children | 0 (0.0%) | 0 (0.0%) |
| Total | 43 (7.6%) | 250 (11.7%) |
Income Below Poverty Among Married-Couple vs Single-Parent Households in Brea
The poverty data for Brea shows that 302 of the married-couple family households (3.2%) and 293 of the single-parent households (10.8%) are living below the poverty level. Within the married-couple family households, those with 3 or 4 children have the highest poverty rate, with 61 households (10.7%) falling below the poverty line. Among the single-parent households, those with 1 or 2 children have the highest poverty rate, with 165 household (15.9%) living below poverty.
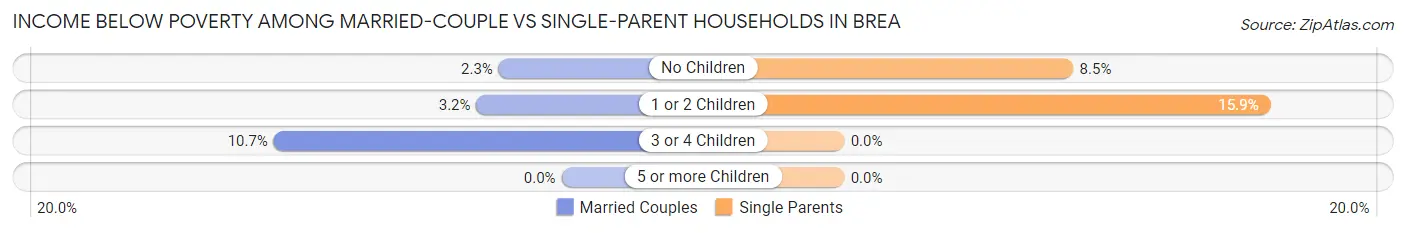
| Children | Married-Couple Families | Single-Parent Households |
| No Children | 117 (2.3%) | 128 (8.5%) |
| 1 or 2 Children | 124 (3.2%) | 165 (15.9%) |
| 3 or 4 Children | 61 (10.7%) | 0 (0.0%) |
| 5 or more Children | 0 (0.0%) | 0 (0.0%) |
| Total | 302 (3.2%) | 293 (10.8%) |
Race in Brea
The most populous races in Brea are White / Caucasian (24,244 | 51.5%), Hispanic or Latino (14,647 | 31.1%), and Asian (12,380 | 26.3%).
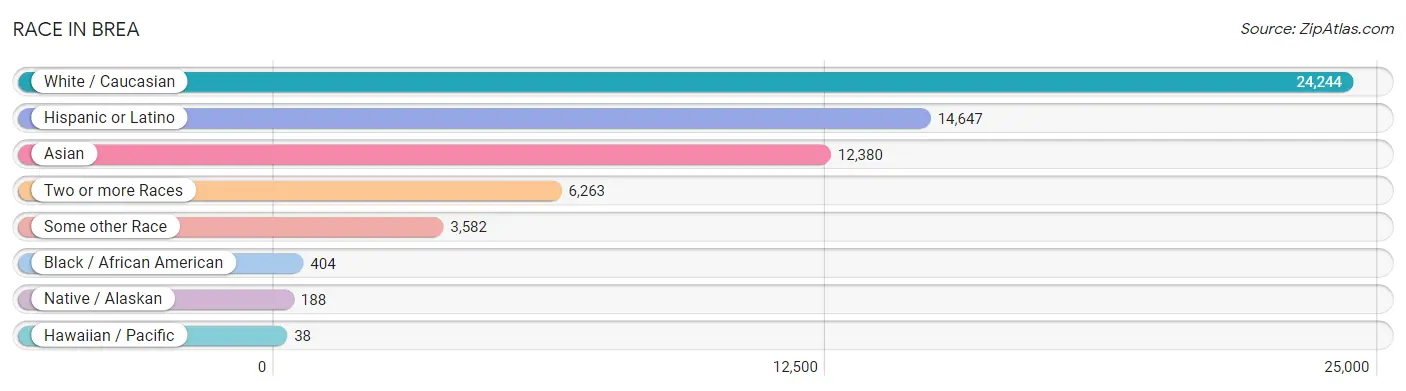
| Race | # Population | % Population |
| Asian | 12,380 | 26.3% |
| Black / African American | 404 | 0.9% |
| Hawaiian / Pacific | 38 | 0.1% |
| Hispanic or Latino | 14,647 | 31.1% |
| Native / Alaskan | 188 | 0.4% |
| White / Caucasian | 24,244 | 51.5% |
| Two or more Races | 6,263 | 13.3% |
| Some other Race | 3,582 | 7.6% |
| Total | 47,099 | 100.0% |
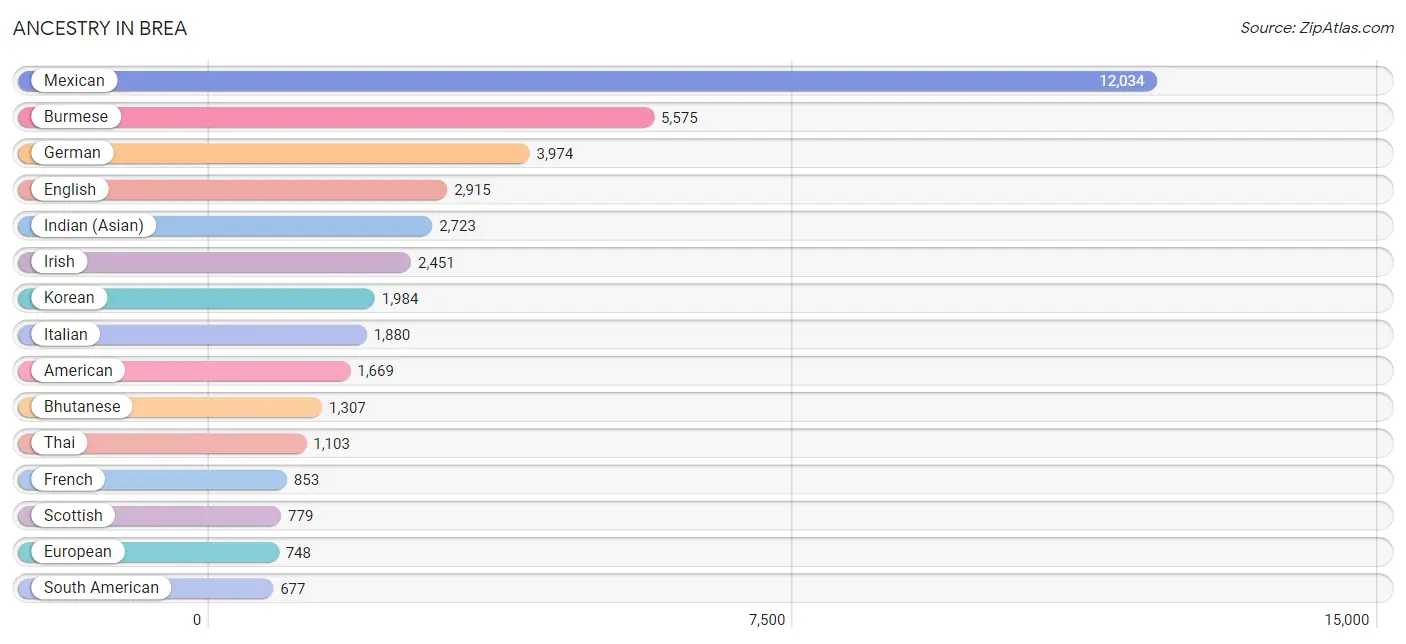
Ancestry in Brea
The most populous ancestries reported in Brea are Mexican (12,034 | 25.6%), Burmese (5,575 | 11.8%), German (3,974 | 8.4%), English (2,915 | 6.2%), and Indian (Asian) (2,723 | 5.8%), together accounting for 57.8% of all Brea residents.
| Ancestry | # Population | % Population |
| Afghan | 7 | 0.0% |
| African | 40 | 0.1% |
| American | 1,669 | 3.5% |
| Apache | 14 | 0.0% |
| Arab | 368 | 0.8% |
| Argentinean | 46 | 0.1% |
| Armenian | 24 | 0.1% |
| Bangladeshi | 36 | 0.1% |
| Basque | 55 | 0.1% |
| Belgian | 129 | 0.3% |
| Belizean | 57 | 0.1% |
| Bhutanese | 1,307 | 2.8% |
| Blackfeet | 22 | 0.1% |
| British | 297 | 0.6% |
| Burmese | 5,575 | 11.8% |
| Canadian | 124 | 0.3% |
| Celtic | 24 | 0.1% |
| Central American | 617 | 1.3% |
| Central American Indian | 33 | 0.1% |
| Cherokee | 12 | 0.0% |
| Choctaw | 5 | 0.0% |
| Colombian | 332 | 0.7% |
| Croatian | 40 | 0.1% |
| Cuban | 167 | 0.4% |
| Czech | 42 | 0.1% |
| Czechoslovakian | 55 | 0.1% |
| Danish | 204 | 0.4% |
| Dutch | 511 | 1.1% |
| Eastern European | 98 | 0.2% |
| Ecuadorian | 104 | 0.2% |
| Egyptian | 212 | 0.4% |
| English | 2,915 | 6.2% |
| European | 748 | 1.6% |
| Filipino | 634 | 1.3% |
| Finnish | 38 | 0.1% |
| French | 853 | 1.8% |
| French Canadian | 144 | 0.3% |
| German | 3,974 | 8.4% |
| Greek | 176 | 0.4% |
| Guatemalan | 256 | 0.5% |
| Hungarian | 372 | 0.8% |
| Indian (Asian) | 2,723 | 5.8% |
| Indonesian | 10 | 0.0% |
| Iranian | 197 | 0.4% |
| Irish | 2,451 | 5.2% |
| Iroquois | 18 | 0.0% |
| Israeli | 36 | 0.1% |
| Italian | 1,880 | 4.0% |
| Japanese | 177 | 0.4% |
| Korean | 1,984 | 4.2% |
| Laotian | 265 | 0.6% |
| Lebanese | 126 | 0.3% |
| Malaysian | 41 | 0.1% |
| Mexican | 12,034 | 25.6% |
| Mexican American Indian | 184 | 0.4% |
| Mongolian | 26 | 0.1% |
| Native Hawaiian | 313 | 0.7% |
| Navajo | 145 | 0.3% |
| Nicaraguan | 18 | 0.0% |
| Nigerian | 10 | 0.0% |
| Northern European | 103 | 0.2% |
| Norwegian | 384 | 0.8% |
| Pakistani | 76 | 0.2% |
| Palestinian | 22 | 0.1% |
| Panamanian | 184 | 0.4% |
| Peruvian | 136 | 0.3% |
| Polish | 616 | 1.3% |
| Portuguese | 38 | 0.1% |
| Puerto Rican | 424 | 0.9% |
| Romanian | 132 | 0.3% |
| Russian | 477 | 1.0% |
| Salvadoran | 159 | 0.3% |
| Samoan | 42 | 0.1% |
| Scandinavian | 324 | 0.7% |
| Scotch-Irish | 101 | 0.2% |
| Scottish | 779 | 1.7% |
| Serbian | 16 | 0.0% |
| Slovak | 97 | 0.2% |
| South American | 677 | 1.4% |
| South American Indian | 15 | 0.0% |
| Spaniard | 237 | 0.5% |
| Spanish | 308 | 0.6% |
| Sri Lankan | 475 | 1.0% |
| Subsaharan African | 58 | 0.1% |
| Swedish | 349 | 0.7% |
| Swiss | 110 | 0.2% |
| Syrian | 8 | 0.0% |
| Thai | 1,103 | 2.3% |
| Turkish | 32 | 0.1% |
| Ugandan | 14 | 0.0% |
| Ukrainian | 18 | 0.0% |
| Venezuelan | 59 | 0.1% |
| Welsh | 188 | 0.4% |
| Yaqui | 51 | 0.1% | View All 94 Rows |
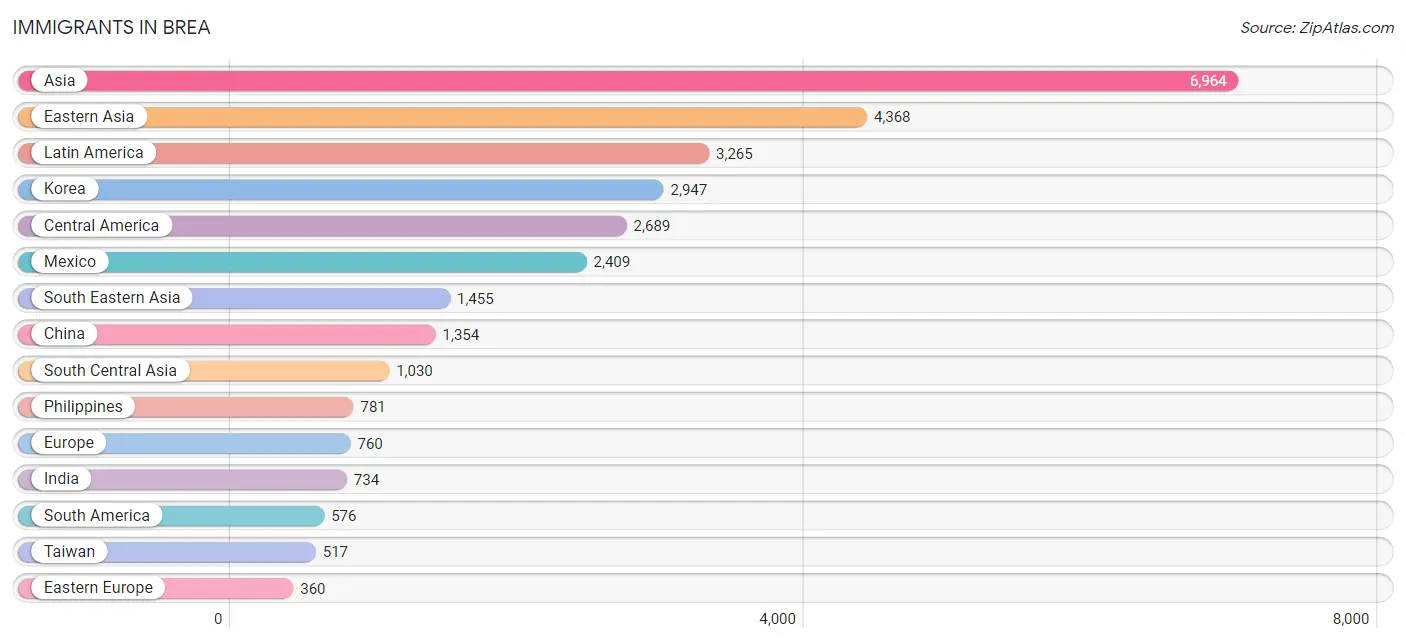
Immigrants in Brea
The most numerous immigrant groups reported in Brea came from Asia (6,964 | 14.8%), Eastern Asia (4,368 | 9.3%), Latin America (3,265 | 6.9%), Korea (2,947 | 6.3%), and Central America (2,689 | 5.7%), together accounting for 43.0% of all Brea residents.
| Immigration Origin | # Population | % Population |
| Afghanistan | 7 | 0.0% |
| Africa | 117 | 0.3% |
| Argentina | 21 | 0.0% |
| Asia | 6,964 | 14.8% |
| Belarus | 20 | 0.0% |
| Bosnia and Herzegovina | 12 | 0.0% |
| Brazil | 45 | 0.1% |
| Cambodia | 138 | 0.3% |
| Canada | 160 | 0.3% |
| Central America | 2,689 | 5.7% |
| Chile | 39 | 0.1% |
| China | 1,354 | 2.9% |
| Colombia | 282 | 0.6% |
| Czechoslovakia | 21 | 0.0% |
| Eastern Africa | 28 | 0.1% |
| Eastern Asia | 4,368 | 9.3% |
| Eastern Europe | 360 | 0.8% |
| Egypt | 88 | 0.2% |
| El Salvador | 36 | 0.1% |
| England | 121 | 0.3% |
| Europe | 760 | 1.6% |
| France | 12 | 0.0% |
| Germany | 164 | 0.4% |
| Guatemala | 187 | 0.4% |
| Guyana | 15 | 0.0% |
| Honduras | 10 | 0.0% |
| Hong Kong | 208 | 0.4% |
| Hungary | 171 | 0.4% |
| India | 734 | 1.6% |
| Indonesia | 171 | 0.4% |
| Iran | 117 | 0.3% |
| Ireland | 60 | 0.1% |
| Israel | 71 | 0.2% |
| Italy | 11 | 0.0% |
| Japan | 67 | 0.1% |
| Kenya | 14 | 0.0% |
| Korea | 2,947 | 6.3% |
| Laos | 10 | 0.0% |
| Latin America | 3,265 | 6.9% |
| Malaysia | 119 | 0.3% |
| Mexico | 2,409 | 5.1% |
| Nepal | 83 | 0.2% |
| Northern Africa | 88 | 0.2% |
| Northern Europe | 213 | 0.4% |
| Pakistan | 89 | 0.2% |
| Panama | 47 | 0.1% |
| Peru | 98 | 0.2% |
| Philippines | 781 | 1.7% |
| Poland | 24 | 0.1% |
| Romania | 78 | 0.2% |
| Russia | 34 | 0.1% |
| Scotland | 32 | 0.1% |
| South America | 576 | 1.2% |
| South Central Asia | 1,030 | 2.2% |
| South Eastern Asia | 1,455 | 3.1% |
| Southern Europe | 11 | 0.0% |
| Syria | 23 | 0.1% |
| Taiwan | 517 | 1.1% |
| Thailand | 76 | 0.2% |
| Uganda | 14 | 0.0% |
| Venezuela | 76 | 0.2% |
| Vietnam | 136 | 0.3% |
| Western Asia | 111 | 0.2% |
| Western Europe | 176 | 0.4% | View All 64 Rows |
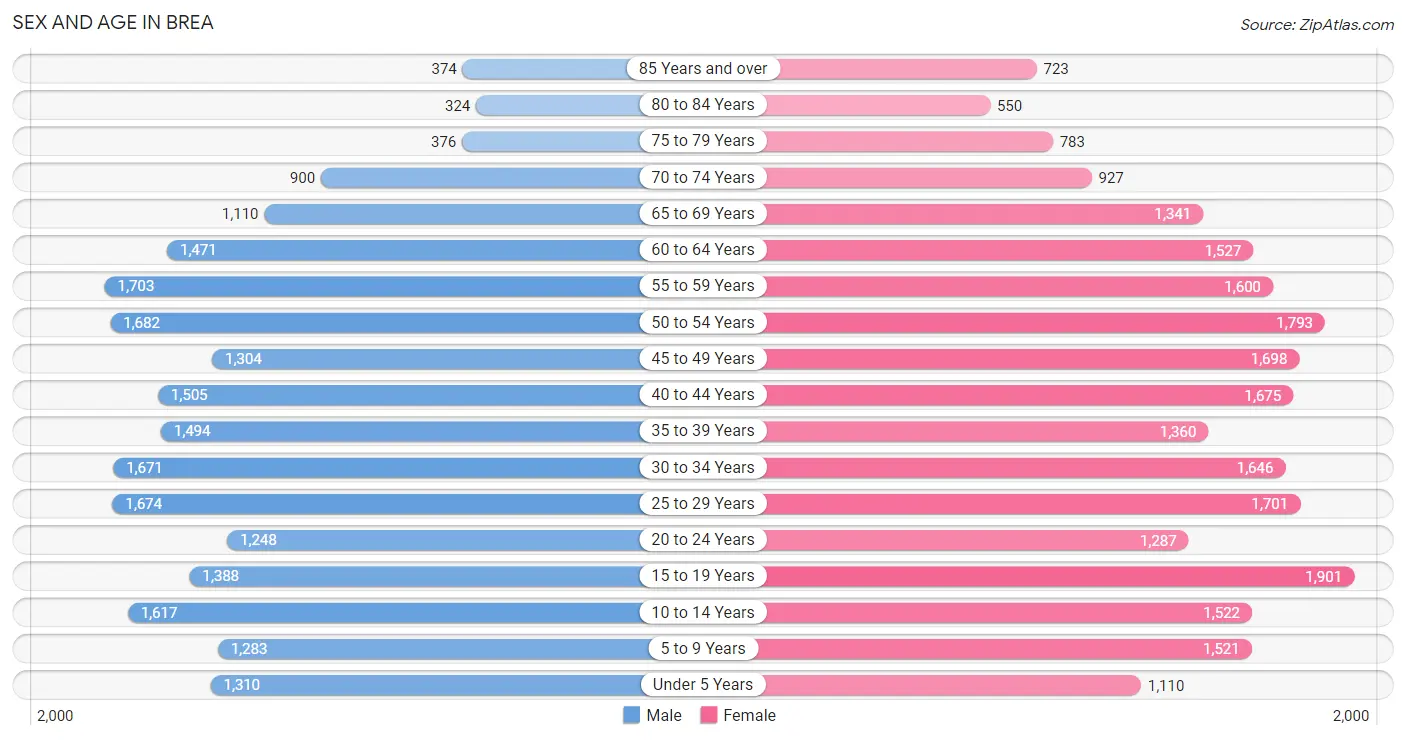
Sex and Age in Brea
Sex and Age in Brea
The most populous age groups in Brea are 55 to 59 Years (1,703 | 7.6%) for men and 15 to 19 Years (1,901 | 7.7%) for women.
| Age Bracket | Male | Female |
| Under 5 Years | 1,310 (5.8%) | 1,110 (4.5%) |
| 5 to 9 Years | 1,283 (5.7%) | 1,521 (6.2%) |
| 10 to 14 Years | 1,617 (7.2%) | 1,522 (6.2%) |
| 15 to 19 Years | 1,388 (6.2%) | 1,901 (7.7%) |
| 20 to 24 Years | 1,248 (5.6%) | 1,287 (5.2%) |
| 25 to 29 Years | 1,674 (7.5%) | 1,701 (6.9%) |
| 30 to 34 Years | 1,671 (7.4%) | 1,646 (6.7%) |
| 35 to 39 Years | 1,494 (6.7%) | 1,360 (5.5%) |
| 40 to 44 Years | 1,505 (6.7%) | 1,675 (6.8%) |
| 45 to 49 Years | 1,304 (5.8%) | 1,698 (6.9%) |
| 50 to 54 Years | 1,682 (7.5%) | 1,793 (7.3%) |
| 55 to 59 Years | 1,703 (7.6%) | 1,600 (6.5%) |
| 60 to 64 Years | 1,471 (6.6%) | 1,527 (6.2%) |
| 65 to 69 Years | 1,110 (5.0%) | 1,341 (5.4%) |
| 70 to 74 Years | 900 (4.0%) | 927 (3.8%) |
| 75 to 79 Years | 376 (1.7%) | 783 (3.2%) |
| 80 to 84 Years | 324 (1.4%) | 550 (2.2%) |
| 85 Years and over | 374 (1.7%) | 723 (2.9%) |
| Total | 22,434 (100.0%) | 24,665 (100.0%) |
Families and Households in Brea
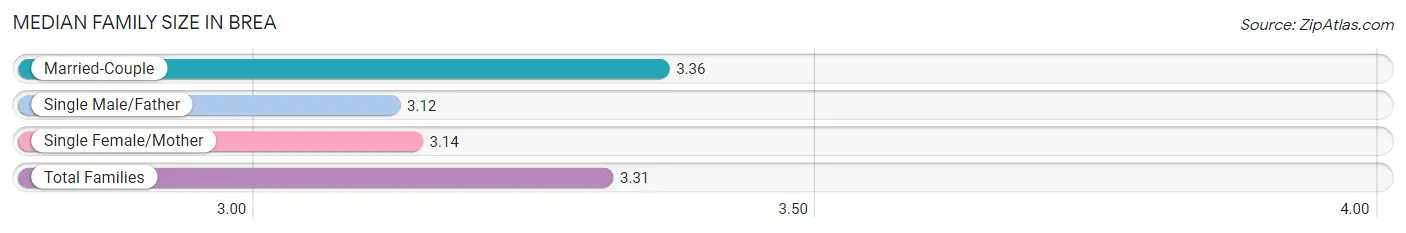
Median Family Size in Brea
The median family size in Brea is 3.31 persons per family, with married-couple families (9,502 | 77.8%) accounting for the largest median family size of 3.36 persons per family. On the other hand, single male/father families (565 | 4.6%) represent the smallest median family size with 3.12 persons per family.
| Family Type | # Families | Family Size |
| Married-Couple | 9,502 (77.8%) | 3.36 |
| Single Male/Father | 565 (4.6%) | 3.12 |
| Single Female/Mother | 2,143 (17.5%) | 3.14 |
| Total Families | 12,210 (100.0%) | 3.31 |
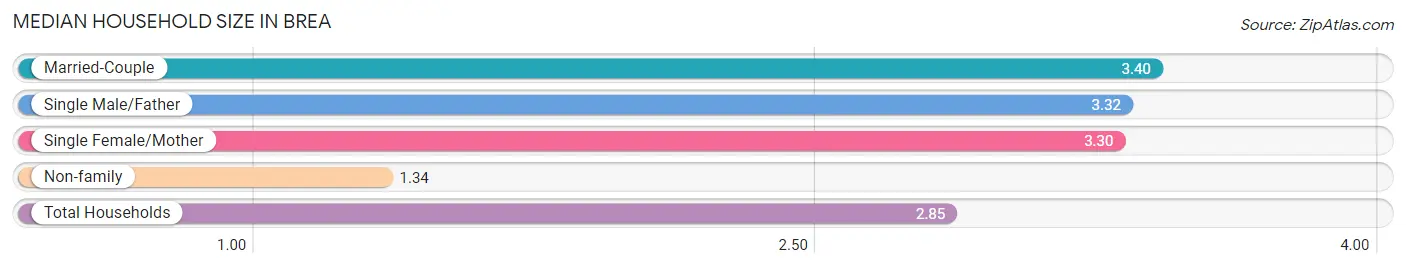
Median Household Size in Brea
The median household size in Brea is 2.85 persons per household, with married-couple households (9,502 | 57.8%) accounting for the largest median household size of 3.4 persons per household. non-family households (4,244 | 25.8%) represent the smallest median household size with 1.34 persons per household.
| Household Type | # Households | Household Size |
| Married-Couple | 9,502 (57.8%) | 3.40 |
| Single Male/Father | 565 (3.4%) | 3.32 |
| Single Female/Mother | 2,143 (13.0%) | 3.30 |
| Non-family | 4,244 (25.8%) | 1.34 |
| Total Households | 16,454 (100.0%) | 2.85 |
Household Size by Marriage Status in Brea
Out of a total of 16,454 households in Brea, 12,210 (74.2%) are family households, while 4,244 (25.8%) are nonfamily households. The most numerous type of family households are 2-person households, comprising 4,750, and the most common type of nonfamily households are 1-person households, comprising 3,235.
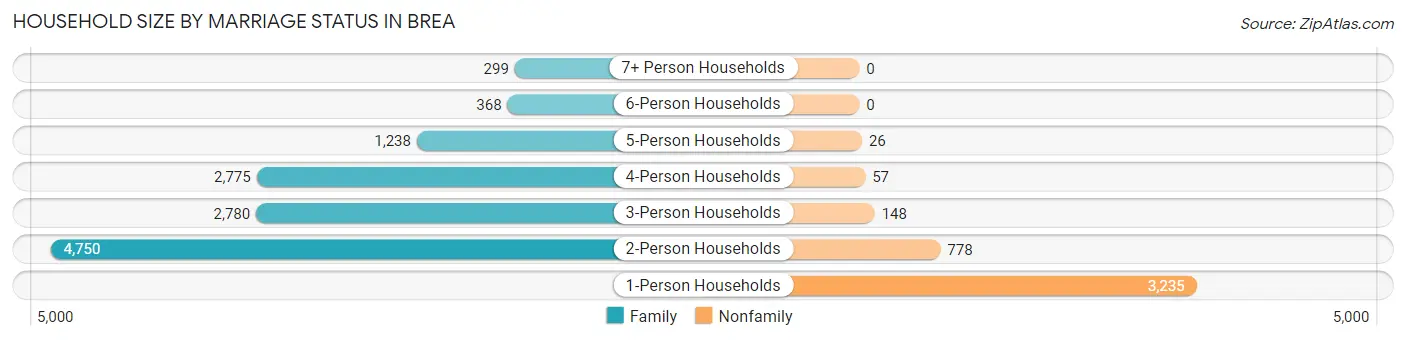
| Household Size | Family Households | Nonfamily Households |
| 1-Person Households | - | 3,235 (19.7%) |
| 2-Person Households | 4,750 (28.9%) | 778 (4.7%) |
| 3-Person Households | 2,780 (16.9%) | 148 (0.9%) |
| 4-Person Households | 2,775 (16.9%) | 57 (0.4%) |
| 5-Person Households | 1,238 (7.5%) | 26 (0.2%) |
| 6-Person Households | 368 (2.2%) | 0 (0.0%) |
| 7+ Person Households | 299 (1.8%) | 0 (0.0%) |
| Total | 12,210 (74.2%) | 4,244 (25.8%) |
Female Fertility in Brea
Fertility by Age in Brea
Average fertility rate in Brea is 70.0 births per 1,000 women. Women in the age bracket of 20 to 34 years have the highest fertility rate with 127.0 births per 1,000 women. Women in the age bracket of 20 to 34 years acount for 72.4% of all women with births.
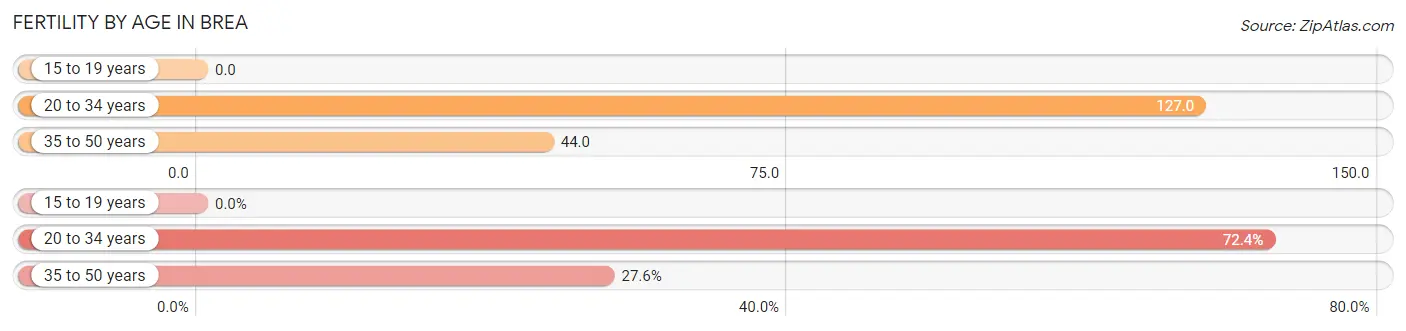
| Age Bracket | Women with Births | Births / 1,000 Women |
| 15 to 19 years | 0 (0.0%) | 0.0 |
| 20 to 34 years | 588 (72.4%) | 127.0 |
| 35 to 50 years | 224 (27.6%) | 44.0 |
| Total | 812 (100.0%) | 70.0 |
Fertility by Age by Marriage Status in Brea
67.9% of women with births (812) in Brea are married. The highest percentage of unmarried women with births falls into 20 to 34 years age bracket with 34.7% of them unmarried at the time of birth, while the lowest percentage of unmarried women with births belong to 35 to 50 years age bracket with 25.4% of them unmarried.
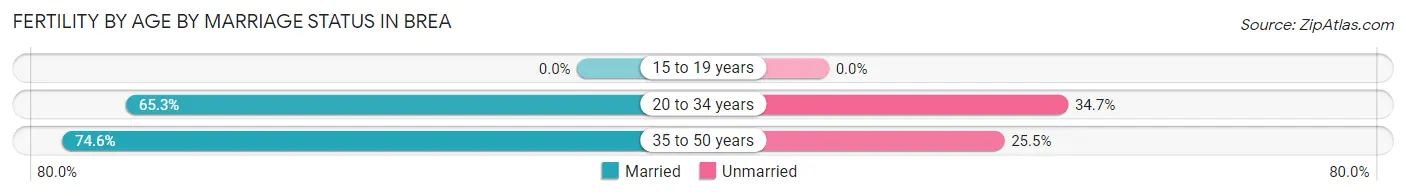
| Age Bracket | Married | Unmarried |
| 15 to 19 years | 0 (0.0%) | 0 (0.0%) |
| 20 to 34 years | 384 (65.3%) | 204 (34.7%) |
| 35 to 50 years | 167 (74.6%) | 57 (25.5%) |
| Total | 551 (67.9%) | 261 (32.1%) |
Fertility by Education in Brea
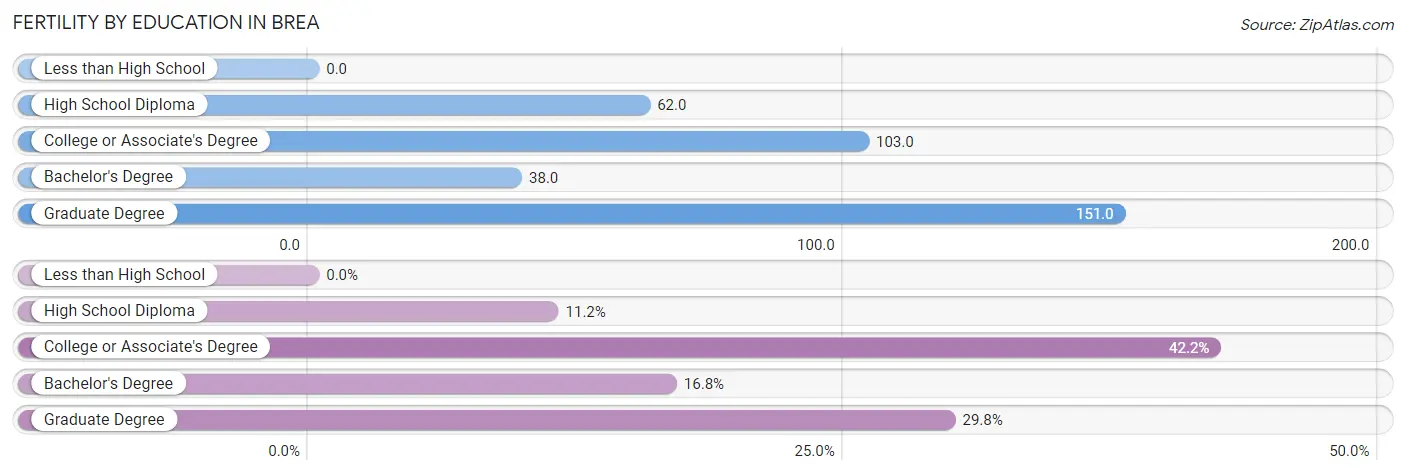
| Educational Attainment | Women with Births | Births / 1,000 Women |
| Less than High School | 0 (0.0%) | 0.0 |
| High School Diploma | 91 (11.2%) | 62.0 |
| College or Associate's Degree | 343 (42.2%) | 103.0 |
| Bachelor's Degree | 136 (16.8%) | 38.0 |
| Graduate Degree | 242 (29.8%) | 151.0 |
| Total | 812 (100.0%) | 70.0 |
Fertility by Education by Marriage Status in Brea
32.1% of women with births in Brea are unmarried. Women with the educational attainment of graduate degree are most likely to be married with 100.0% of them married at childbirth, while women with the educational attainment of high school diploma are least likely to be married with 69.2% of them unmarried at childbirth.
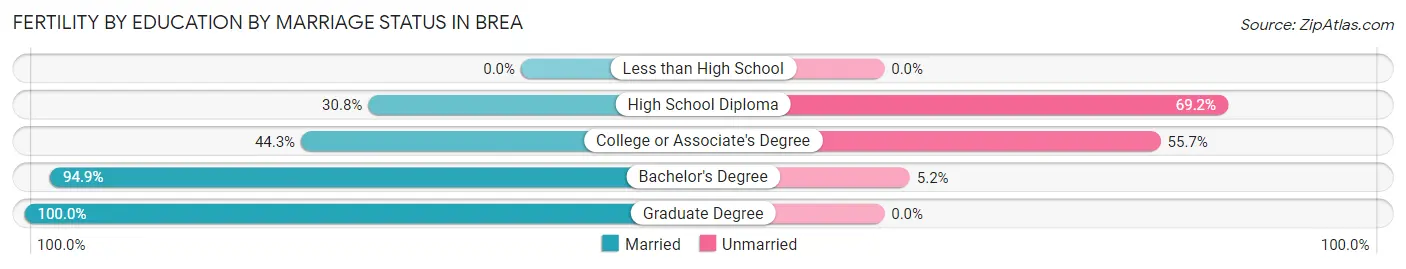
| Educational Attainment | Married | Unmarried |
| Less than High School | 0 (0.0%) | 0 (0.0%) |
| High School Diploma | 28 (30.8%) | 63 (69.2%) |
| College or Associate's Degree | 152 (44.3%) | 191 (55.7%) |
| Bachelor's Degree | 129 (94.9%) | 7 (5.1%) |
| Graduate Degree | 242 (100.0%) | 0 (0.0%) |
| Total | 551 (67.9%) | 261 (32.1%) |
Employment Characteristics in Brea
Employment by Class of Employer in Brea
Among the 23,464 employed individuals in Brea, private company employees (15,095 | 64.3%), local government employees (2,542 | 10.8%), and not-for-profit organizations (2,021 | 8.6%) make up the most common classes of employment.
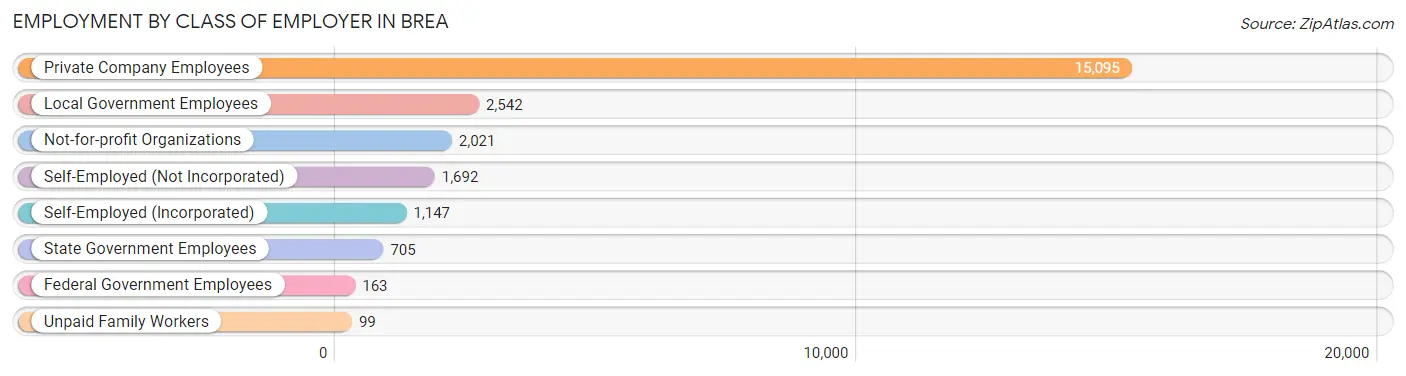
| Employer Class | # Employees | % Employees |
| Private Company Employees | 15,095 | 64.3% |
| Self-Employed (Incorporated) | 1,147 | 4.9% |
| Self-Employed (Not Incorporated) | 1,692 | 7.2% |
| Not-for-profit Organizations | 2,021 | 8.6% |
| Local Government Employees | 2,542 | 10.8% |
| State Government Employees | 705 | 3.0% |
| Federal Government Employees | 163 | 0.7% |
| Unpaid Family Workers | 99 | 0.4% |
| Total | 23,464 | 100.0% |
Employment Status by Age in Brea
According to the labor force statistics for Brea, out of the total population over 16 years of age (37,812), 67.1% or 25,372 individuals are in the labor force, with 5.0% or 1,269 of them unemployed. The age group with the highest labor force participation rate is 35 to 44 years, with 87.2% or 5,262 individuals in the labor force. Within the labor force, the 20 to 24 years age range has the highest percentage of unemployed individuals, with 10.4% or 177 of them being unemployed.
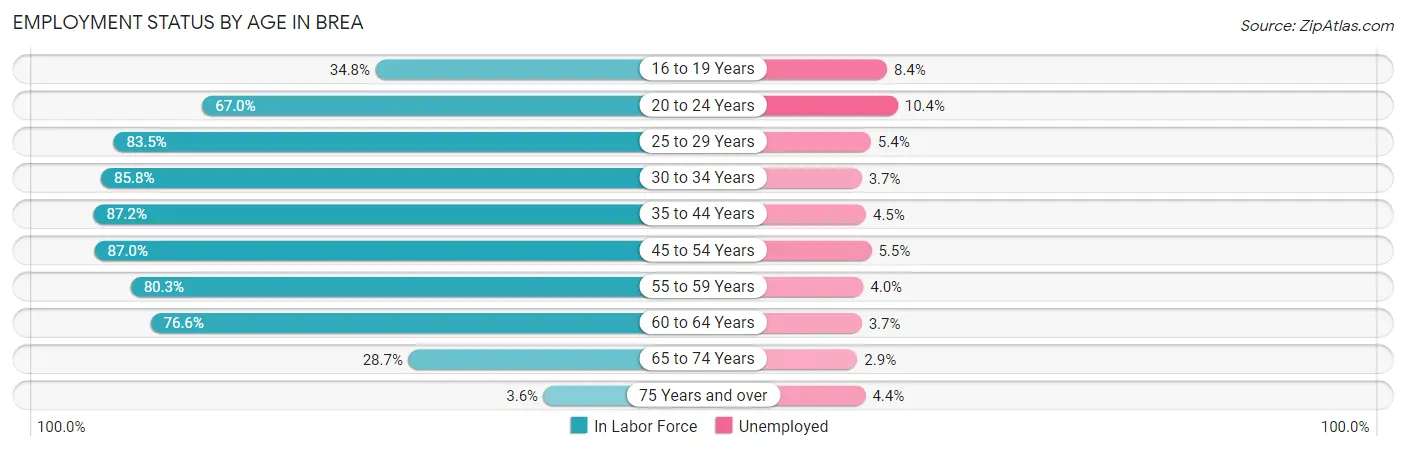
| Age Bracket | In Labor Force | Unemployed |
| 16 to 19 Years | 823 (34.8%) | 69 (8.4%) |
| 20 to 24 Years | 1,698 (67.0%) | 177 (10.4%) |
| 25 to 29 Years | 2,818 (83.5%) | 152 (5.4%) |
| 30 to 34 Years | 2,846 (85.8%) | 105 (3.7%) |
| 35 to 44 Years | 5,262 (87.2%) | 237 (4.5%) |
| 45 to 54 Years | 5,635 (87.0%) | 310 (5.5%) |
| 55 to 59 Years | 2,652 (80.3%) | 106 (4.0%) |
| 60 to 64 Years | 2,296 (76.6%) | 85 (3.7%) |
| 65 to 74 Years | 1,228 (28.7%) | 36 (2.9%) |
| 75 Years and over | 113 (3.6%) | 5 (4.4%) |
| Total | 25,372 (67.1%) | 1,269 (5.0%) |
Employment Status by Educational Attainment in Brea
According to labor force statistics for Brea, 84.3% of individuals (21,500) out of the total population between 25 and 64 years of age (25,504) are in the labor force, with 4.6% or 989 of them being unemployed. The group with the highest labor force participation rate are those with the educational attainment of bachelor's degree or higher, with 88.2% or 11,230 individuals in the labor force. Within the labor force, individuals with less than high school education have the highest percentage of unemployment, with 7.2% or 77 of them being unemployed.
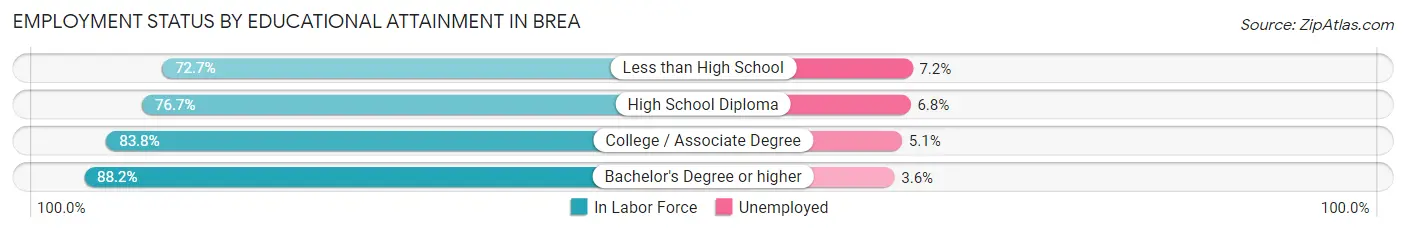
| Educational Attainment | In Labor Force | Unemployed |
| Less than High School | 1,072 (72.7%) | 106 (7.2%) |
| High School Diploma | 2,847 (76.7%) | 252 (6.8%) |
| College / Associate Degree | 6,356 (83.8%) | 387 (5.1%) |
| Bachelor's Degree or higher | 11,230 (88.2%) | 458 (3.6%) |
| Total | 21,500 (84.3%) | 1,173 (4.6%) |
Employment Occupations by Sex in Brea
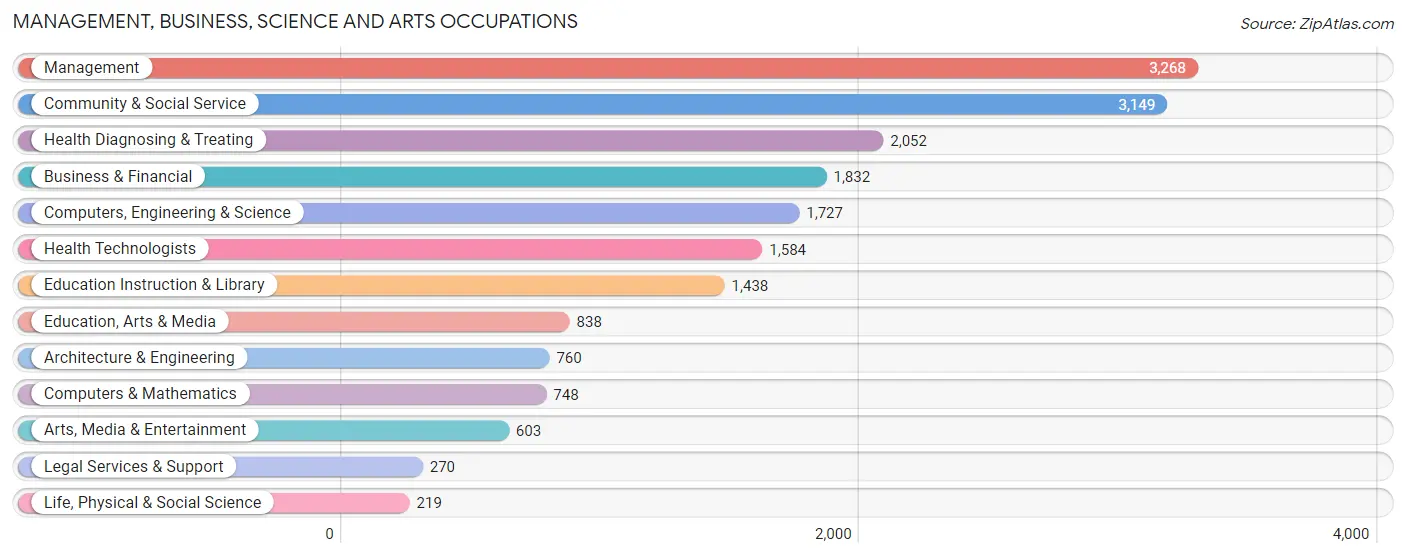
Management, Business, Science and Arts Occupations
The most common Management, Business, Science and Arts occupations in Brea are Management (3,268 | 13.6%), Community & Social Service (3,149 | 13.1%), Health Diagnosing & Treating (2,052 | 8.5%), Business & Financial (1,832 | 7.6%), and Computers, Engineering & Science (1,727 | 7.2%).
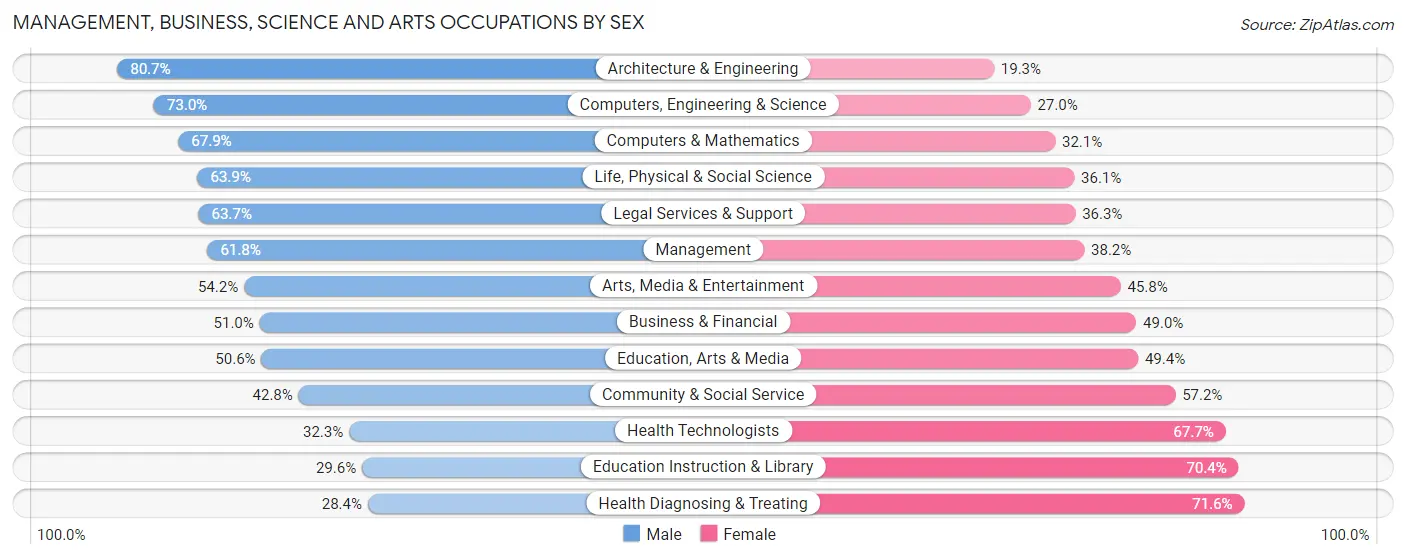
Management, Business, Science and Arts Occupations by Sex
Within the Management, Business, Science and Arts occupations in Brea, the most male-oriented occupations are Architecture & Engineering (80.7%), Computers, Engineering & Science (73.0%), and Computers & Mathematics (67.9%), while the most female-oriented occupations are Health Diagnosing & Treating (71.6%), Education Instruction & Library (70.4%), and Health Technologists (67.7%).
| Occupation | Male | Female |
| Management | 2,021 (61.8%) | 1,247 (38.2%) |
| Business & Financial | 934 (51.0%) | 898 (49.0%) |
| Computers, Engineering & Science | 1,261 (73.0%) | 466 (27.0%) |
| Computers & Mathematics | 508 (67.9%) | 240 (32.1%) |
| Architecture & Engineering | 613 (80.7%) | 147 (19.3%) |
| Life, Physical & Social Science | 140 (63.9%) | 79 (36.1%) |
| Community & Social Service | 1,349 (42.8%) | 1,800 (57.2%) |
| Education, Arts & Media | 424 (50.6%) | 414 (49.4%) |
| Legal Services & Support | 172 (63.7%) | 98 (36.3%) |
| Education Instruction & Library | 426 (29.6%) | 1,012 (70.4%) |
| Arts, Media & Entertainment | 327 (54.2%) | 276 (45.8%) |
| Health Diagnosing & Treating | 583 (28.4%) | 1,469 (71.6%) |
| Health Technologists | 512 (32.3%) | 1,072 (67.7%) |
| Total (Category) | 6,148 (51.1%) | 5,880 (48.9%) |
| Total (Overall) | 12,187 (50.6%) | 11,900 (49.4%) |
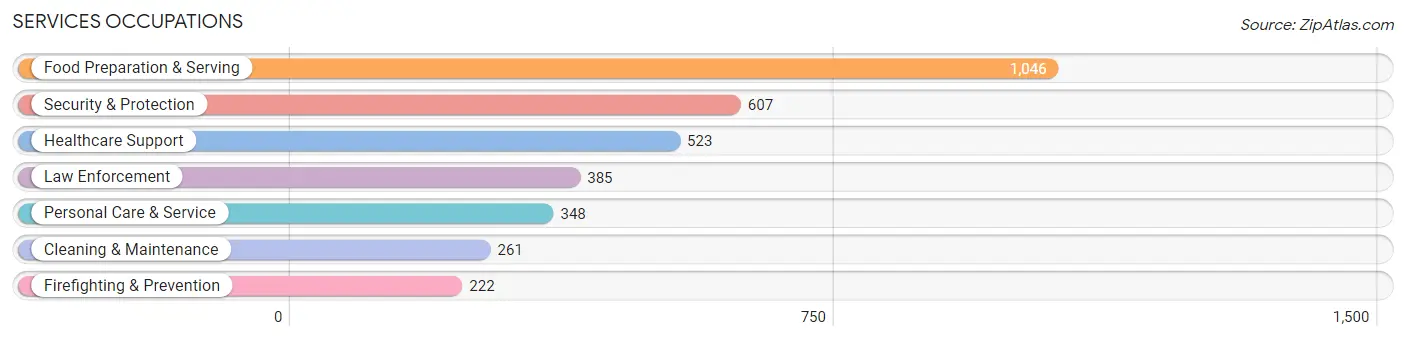
Services Occupations
The most common Services occupations in Brea are Food Preparation & Serving (1,046 | 4.3%), Security & Protection (607 | 2.5%), Healthcare Support (523 | 2.2%), Law Enforcement (385 | 1.6%), and Personal Care & Service (348 | 1.4%).
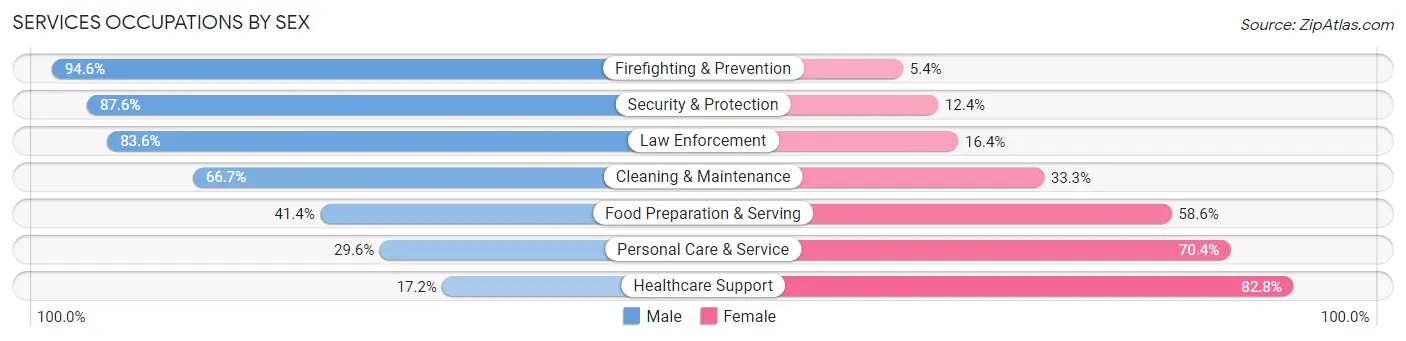
Services Occupations by Sex
Within the Services occupations in Brea, the most male-oriented occupations are Firefighting & Prevention (94.6%), Security & Protection (87.6%), and Law Enforcement (83.6%), while the most female-oriented occupations are Healthcare Support (82.8%), Personal Care & Service (70.4%), and Food Preparation & Serving (58.6%).
| Occupation | Male | Female |
| Healthcare Support | 90 (17.2%) | 433 (82.8%) |
| Security & Protection | 532 (87.6%) | 75 (12.4%) |
| Firefighting & Prevention | 210 (94.6%) | 12 (5.4%) |
| Law Enforcement | 322 (83.6%) | 63 (16.4%) |
| Food Preparation & Serving | 433 (41.4%) | 613 (58.6%) |
| Cleaning & Maintenance | 174 (66.7%) | 87 (33.3%) |
| Personal Care & Service | 103 (29.6%) | 245 (70.4%) |
| Total (Category) | 1,332 (47.8%) | 1,453 (52.2%) |
| Total (Overall) | 12,187 (50.6%) | 11,900 (49.4%) |
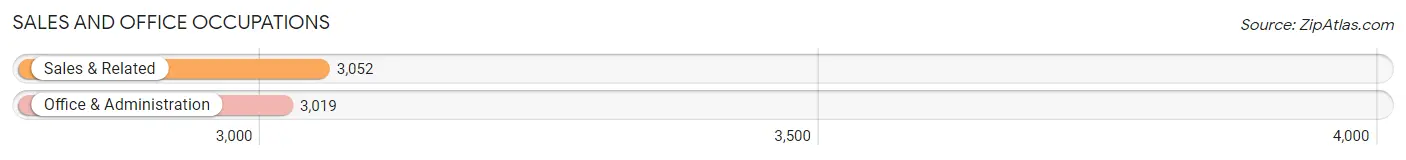
Sales and Office Occupations
The most common Sales and Office occupations in Brea are Sales & Related (3,052 | 12.7%), and Office & Administration (3,019 | 12.5%).
Sales and Office Occupations by Sex
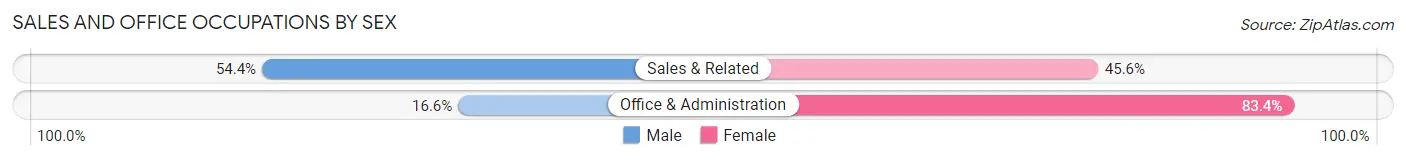
| Occupation | Male | Female |
| Sales & Related | 1,659 (54.4%) | 1,393 (45.6%) |
| Office & Administration | 502 (16.6%) | 2,517 (83.4%) |
| Total (Category) | 2,161 (35.6%) | 3,910 (64.4%) |
| Total (Overall) | 12,187 (50.6%) | 11,900 (49.4%) |
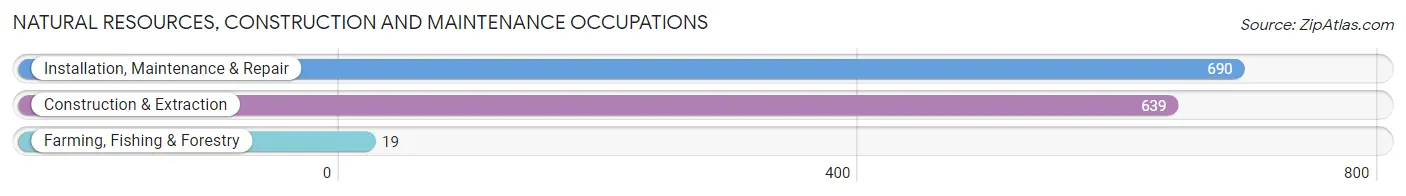
Natural Resources, Construction and Maintenance Occupations
The most common Natural Resources, Construction and Maintenance occupations in Brea are Installation, Maintenance & Repair (690 | 2.9%), Construction & Extraction (639 | 2.6%), and Farming, Fishing & Forestry (19 | 0.1%).
Natural Resources, Construction and Maintenance Occupations by Sex
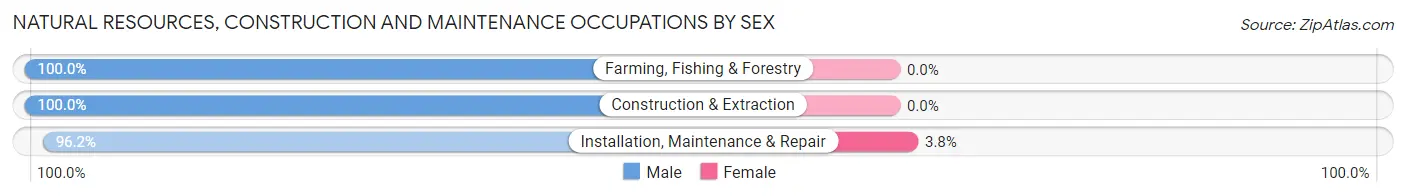
| Occupation | Male | Female |
| Farming, Fishing & Forestry | 19 (100.0%) | 0 (0.0%) |
| Construction & Extraction | 639 (100.0%) | 0 (0.0%) |
| Installation, Maintenance & Repair | 664 (96.2%) | 26 (3.8%) |
| Total (Category) | 1,322 (98.1%) | 26 (1.9%) |
| Total (Overall) | 12,187 (50.6%) | 11,900 (49.4%) |
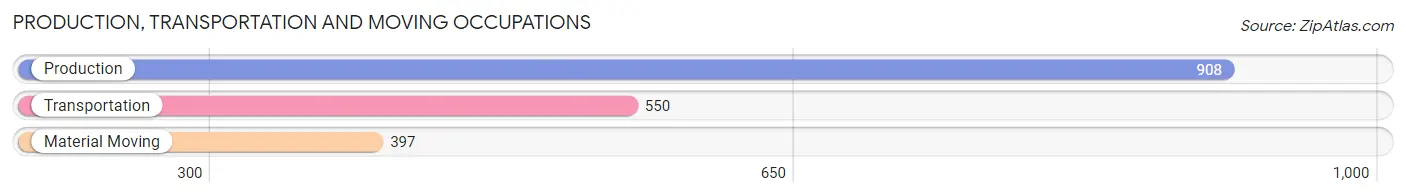
Production, Transportation and Moving Occupations
The most common Production, Transportation and Moving occupations in Brea are Production (908 | 3.8%), Transportation (550 | 2.3%), and Material Moving (397 | 1.7%).
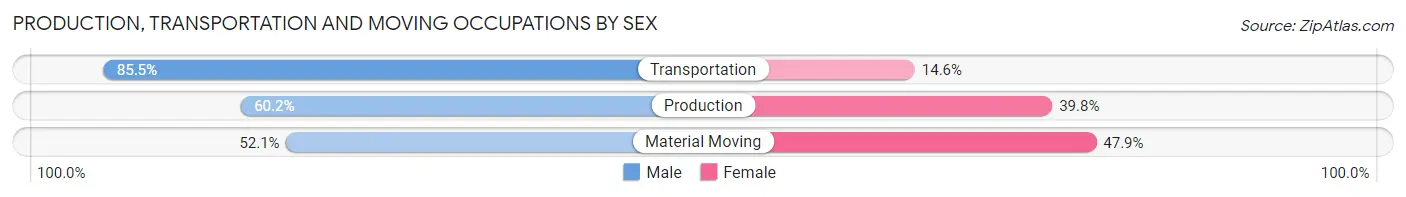
Production, Transportation and Moving Occupations by Sex
| Occupation | Male | Female |
| Production | 547 (60.2%) | 361 (39.8%) |
| Transportation | 470 (85.5%) | 80 (14.5%) |
| Material Moving | 207 (52.1%) | 190 (47.9%) |
| Total (Category) | 1,224 (66.0%) | 631 (34.0%) |
| Total (Overall) | 12,187 (50.6%) | 11,900 (49.4%) |
Employment Industries by Sex in Brea
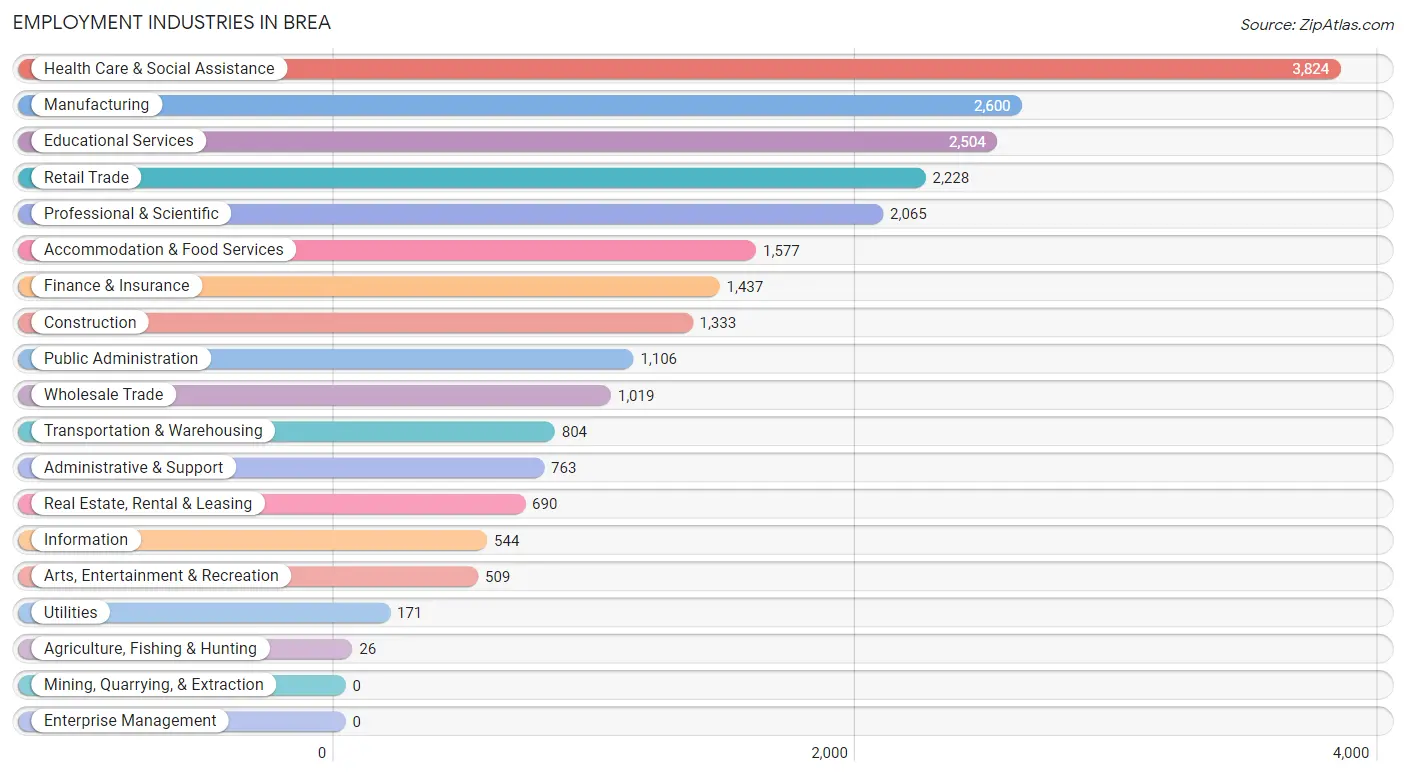
Employment Industries in Brea
The major employment industries in Brea include Health Care & Social Assistance (3,824 | 15.9%), Manufacturing (2,600 | 10.8%), Educational Services (2,504 | 10.4%), Retail Trade (2,228 | 9.2%), and Professional & Scientific (2,065 | 8.6%).
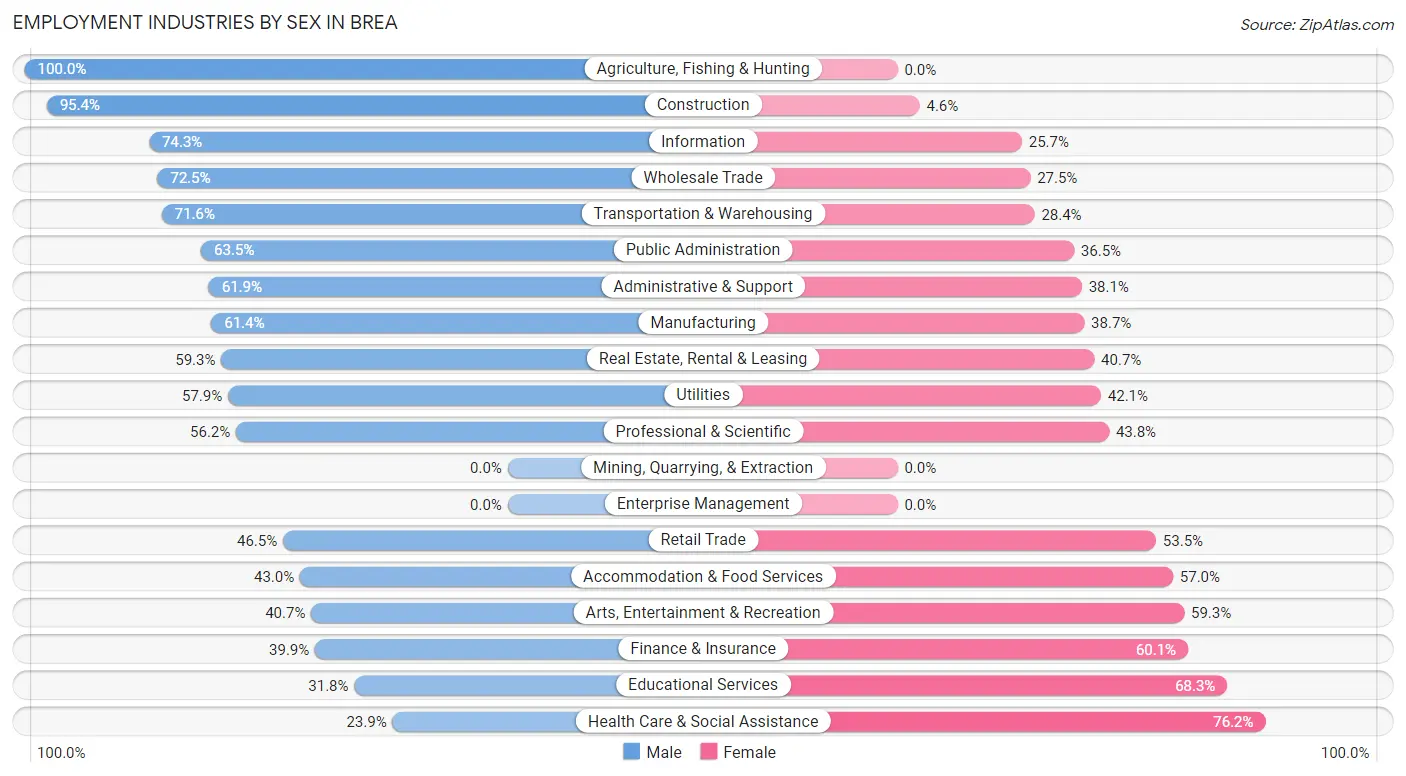
Employment Industries by Sex in Brea
The Brea industries that see more men than women are Agriculture, Fishing & Hunting (100.0%), Construction (95.4%), and Information (74.3%), whereas the industries that tend to have a higher number of women are Health Care & Social Assistance (76.1%), Educational Services (68.2%), and Finance & Insurance (60.1%).
| Industry | Male | Female |
| Agriculture, Fishing & Hunting | 26 (100.0%) | 0 (0.0%) |
| Mining, Quarrying, & Extraction | 0 (0.0%) | 0 (0.0%) |
| Construction | 1,272 (95.4%) | 61 (4.6%) |
| Manufacturing | 1,595 (61.4%) | 1,005 (38.7%) |
| Wholesale Trade | 739 (72.5%) | 280 (27.5%) |
| Retail Trade | 1,036 (46.5%) | 1,192 (53.5%) |
| Transportation & Warehousing | 576 (71.6%) | 228 (28.4%) |
| Utilities | 99 (57.9%) | 72 (42.1%) |
| Information | 404 (74.3%) | 140 (25.7%) |
| Finance & Insurance | 573 (39.9%) | 864 (60.1%) |
| Real Estate, Rental & Leasing | 409 (59.3%) | 281 (40.7%) |
| Professional & Scientific | 1,161 (56.2%) | 904 (43.8%) |
| Enterprise Management | 0 (0.0%) | 0 (0.0%) |
| Administrative & Support | 472 (61.9%) | 291 (38.1%) |
| Educational Services | 795 (31.8%) | 1,709 (68.2%) |
| Health Care & Social Assistance | 912 (23.8%) | 2,912 (76.1%) |
| Arts, Entertainment & Recreation | 207 (40.7%) | 302 (59.3%) |
| Accommodation & Food Services | 678 (43.0%) | 899 (57.0%) |
| Public Administration | 702 (63.5%) | 404 (36.5%) |
| Total | 12,187 (50.6%) | 11,900 (49.4%) |
Education in Brea
School Enrollment in Brea
The most common levels of schooling among the 12,682 students in Brea are college / undergraduate (3,302 | 26.0%), high school (2,836 | 22.4%), and middle school (2,400 | 18.9%).
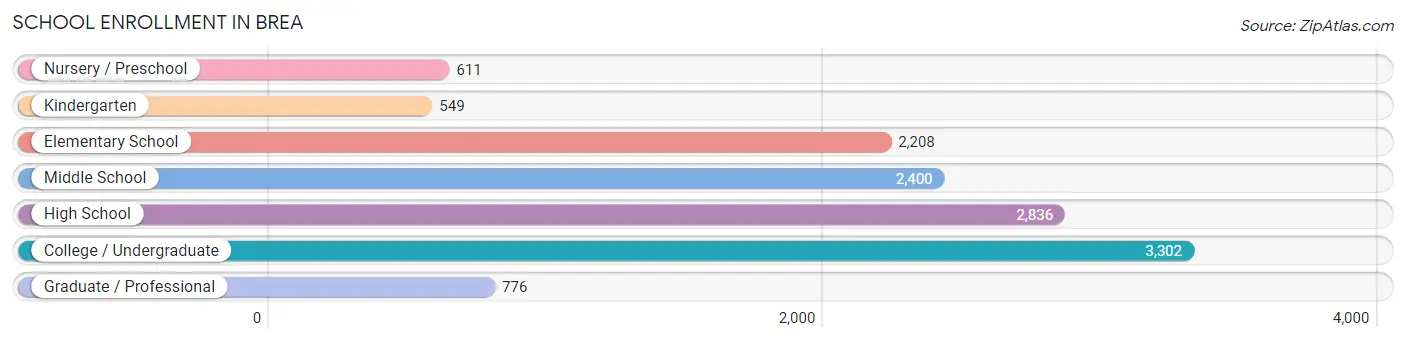
| School Level | # Students | % Students |
| Nursery / Preschool | 611 | 4.8% |
| Kindergarten | 549 | 4.3% |
| Elementary School | 2,208 | 17.4% |
| Middle School | 2,400 | 18.9% |
| High School | 2,836 | 22.4% |
| College / Undergraduate | 3,302 | 26.0% |
| Graduate / Professional | 776 | 6.1% |
| Total | 12,682 | 100.0% |
School Enrollment by Age by Funding Source in Brea
Out of a total of 12,682 students who are enrolled in schools in Brea, 2,321 (18.3%) attend a private institution, while the remaining 10,361 (81.7%) are enrolled in public schools. The age group of 3 to 4 year olds has the highest likelihood of being enrolled in private schools, with 355 (72.0% in the age bracket) enrolled. Conversely, the age group of 18 to 19 year olds has the lowest likelihood of being enrolled in a private school, with 882 (91.0% in the age bracket) attending a public institution.
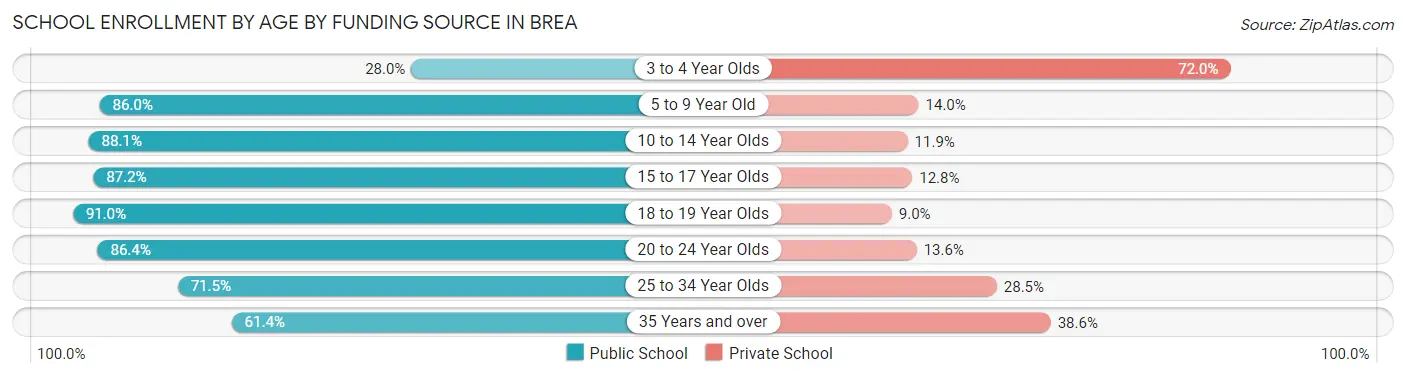
| Age Bracket | Public School | Private School |
| 3 to 4 Year Olds | 138 (28.0%) | 355 (72.0%) |
| 5 to 9 Year Old | 2,261 (86.0%) | 367 (14.0%) |
| 10 to 14 Year Olds | 2,750 (88.1%) | 372 (11.9%) |
| 15 to 17 Year Olds | 1,794 (87.2%) | 263 (12.8%) |
| 18 to 19 Year Olds | 882 (91.0%) | 87 (9.0%) |
| 20 to 24 Year Olds | 1,131 (86.4%) | 178 (13.6%) |
| 25 to 34 Year Olds | 794 (71.5%) | 317 (28.5%) |
| 35 Years and over | 610 (61.4%) | 383 (38.6%) |
| Total | 10,361 (81.7%) | 2,321 (18.3%) |
Educational Attainment by Field of Study in Brea
Business (3,258 | 19.6%), social sciences (1,564 | 9.4%), science & technology (1,446 | 8.7%), engineering (1,430 | 8.6%), and education (1,062 | 6.4%) are the most common fields of study among 16,628 individuals in Brea who have obtained a bachelor's degree or higher.
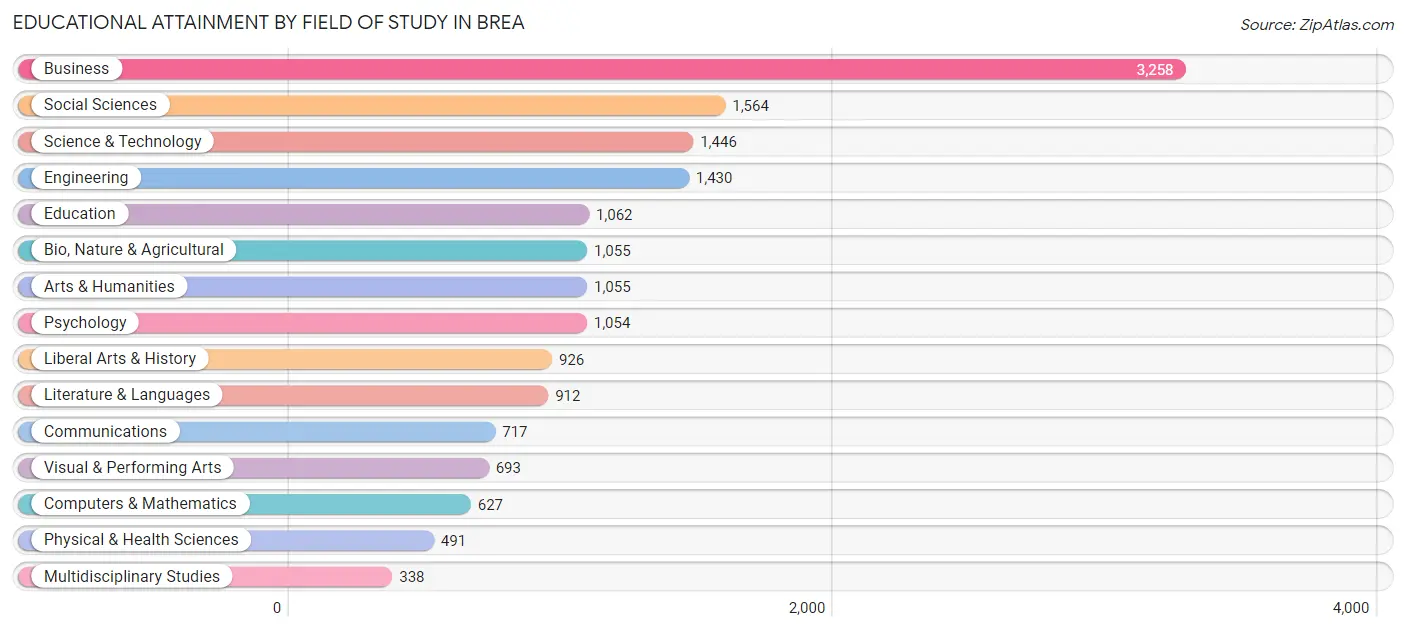
| Field of Study | # Graduates | % Graduates |
| Computers & Mathematics | 627 | 3.8% |
| Bio, Nature & Agricultural | 1,055 | 6.3% |
| Physical & Health Sciences | 491 | 2.9% |
| Psychology | 1,054 | 6.3% |
| Social Sciences | 1,564 | 9.4% |
| Engineering | 1,430 | 8.6% |
| Multidisciplinary Studies | 338 | 2.0% |
| Science & Technology | 1,446 | 8.7% |
| Business | 3,258 | 19.6% |
| Education | 1,062 | 6.4% |
| Literature & Languages | 912 | 5.5% |
| Liberal Arts & History | 926 | 5.6% |
| Visual & Performing Arts | 693 | 4.2% |
| Communications | 717 | 4.3% |
| Arts & Humanities | 1,055 | 6.3% |
| Total | 16,628 | 100.0% |
Transportation & Commute in Brea
Vehicle Availability by Sex in Brea
The most prevalent vehicle ownership categories in Brea are males with 2 vehicles (5,808, accounting for 48.1%) and females with 2 vehicles (4,764, making up 51.0%).
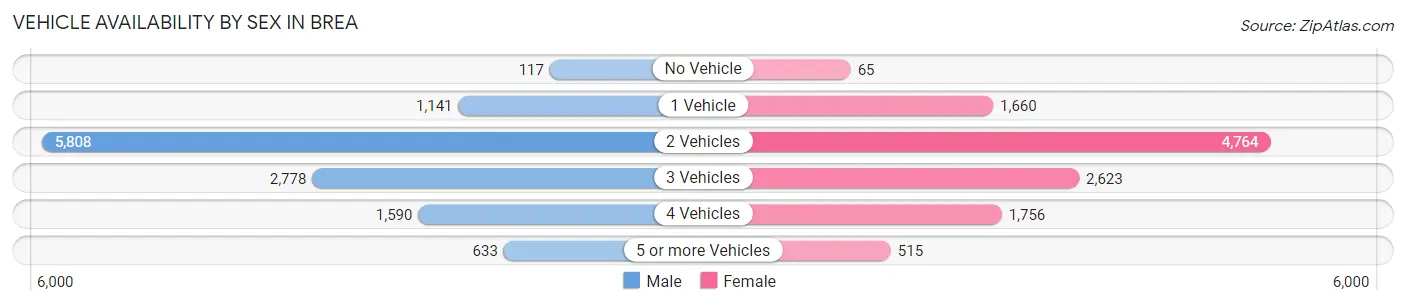
| Vehicles Available | Male | Female |
| No Vehicle | 117 (1.0%) | 65 (0.6%) |
| 1 Vehicle | 1,141 (9.5%) | 1,660 (14.6%) |
| 2 Vehicles | 5,808 (48.1%) | 4,764 (41.8%) |
| 3 Vehicles | 2,778 (23.0%) | 2,623 (23.0%) |
| 4 Vehicles | 1,590 (13.2%) | 1,756 (15.4%) |
| 5 or more Vehicles | 633 (5.2%) | 515 (4.5%) |
| Total | 12,067 (100.0%) | 11,383 (100.0%) |
Commute Time in Brea
The most frequently occuring commute durations in Brea are 30 to 34 minutes (3,426 commuters, 16.4%), 45 to 59 minutes (2,509 commuters, 12.0%), and 20 to 24 minutes (2,363 commuters, 11.3%).
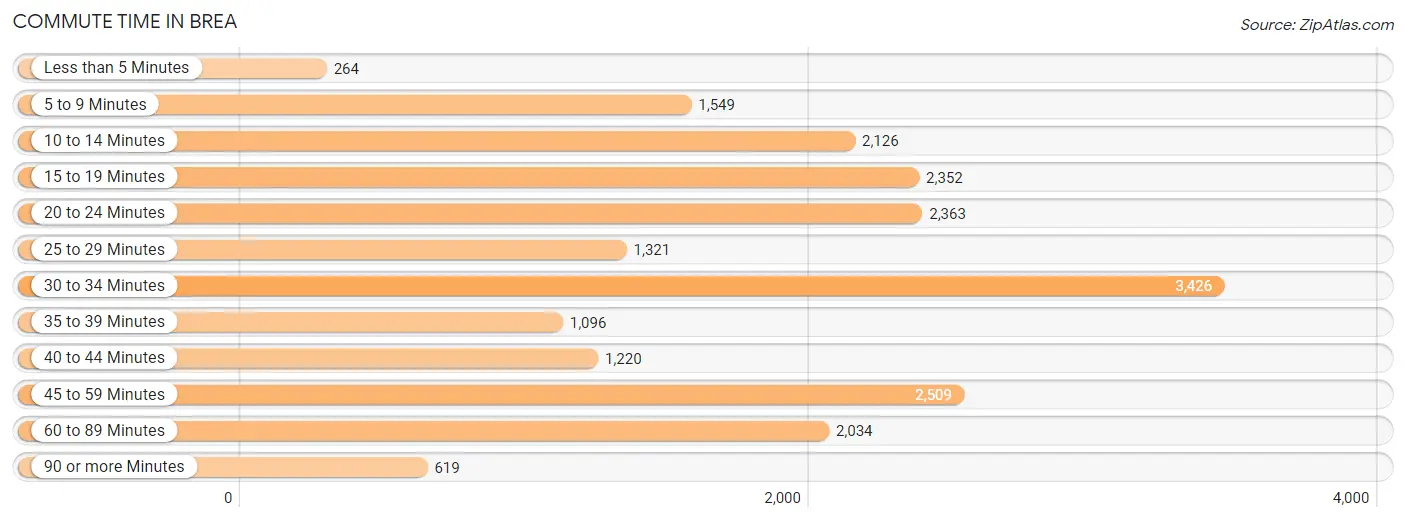
| Commute Time | # Commuters | % Commuters |
| Less than 5 Minutes | 264 | 1.3% |
| 5 to 9 Minutes | 1,549 | 7.4% |
| 10 to 14 Minutes | 2,126 | 10.2% |
| 15 to 19 Minutes | 2,352 | 11.3% |
| 20 to 24 Minutes | 2,363 | 11.3% |
| 25 to 29 Minutes | 1,321 | 6.3% |
| 30 to 34 Minutes | 3,426 | 16.4% |
| 35 to 39 Minutes | 1,096 | 5.2% |
| 40 to 44 Minutes | 1,220 | 5.8% |
| 45 to 59 Minutes | 2,509 | 12.0% |
| 60 to 89 Minutes | 2,034 | 9.7% |
| 90 or more Minutes | 619 | 3.0% |
Commute Time by Sex in Brea
The most common commute times in Brea are 30 to 34 minutes (1,671 commuters, 15.4%) for males and 30 to 34 minutes (1,755 commuters, 17.5%) for females.
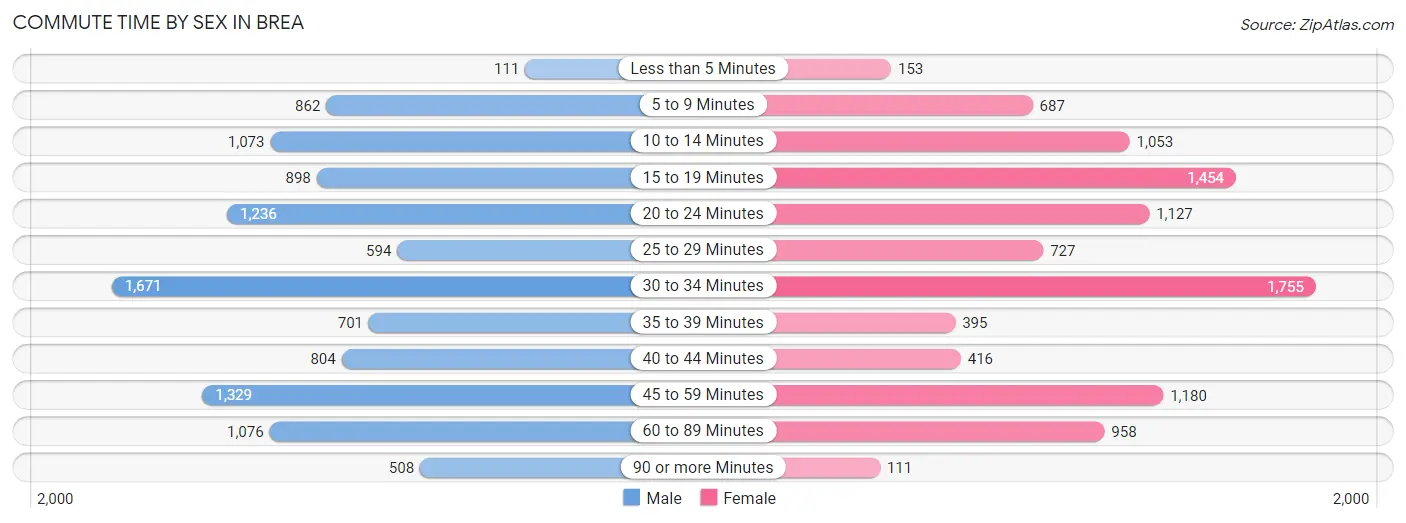
| Commute Time | Male | Female |
| Less than 5 Minutes | 111 (1.0%) | 153 (1.5%) |
| 5 to 9 Minutes | 862 (7.9%) | 687 (6.9%) |
| 10 to 14 Minutes | 1,073 (9.9%) | 1,053 (10.5%) |
| 15 to 19 Minutes | 898 (8.3%) | 1,454 (14.5%) |
| 20 to 24 Minutes | 1,236 (11.4%) | 1,127 (11.3%) |
| 25 to 29 Minutes | 594 (5.5%) | 727 (7.3%) |
| 30 to 34 Minutes | 1,671 (15.4%) | 1,755 (17.5%) |
| 35 to 39 Minutes | 701 (6.5%) | 395 (3.9%) |
| 40 to 44 Minutes | 804 (7.4%) | 416 (4.2%) |
| 45 to 59 Minutes | 1,329 (12.2%) | 1,180 (11.8%) |
| 60 to 89 Minutes | 1,076 (9.9%) | 958 (9.6%) |
| 90 or more Minutes | 508 (4.7%) | 111 (1.1%) |
Time of Departure to Work by Sex in Brea
The most frequent times of departure to work in Brea are 7:00 AM to 7:29 AM (1,766, 16.3%) for males and 8:00 AM to 8:29 AM (1,563, 15.6%) for females.
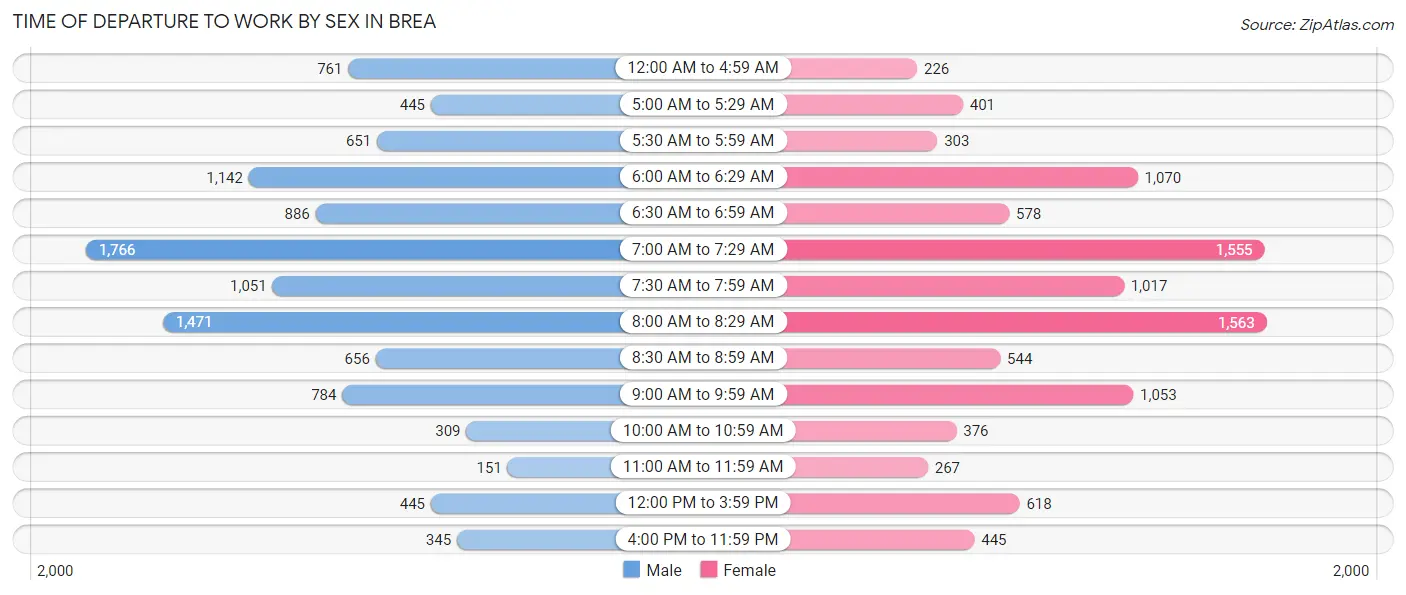
| Time of Departure | Male | Female |
| 12:00 AM to 4:59 AM | 761 (7.0%) | 226 (2.3%) |
| 5:00 AM to 5:29 AM | 445 (4.1%) | 401 (4.0%) |
| 5:30 AM to 5:59 AM | 651 (6.0%) | 303 (3.0%) |
| 6:00 AM to 6:29 AM | 1,142 (10.5%) | 1,070 (10.7%) |
| 6:30 AM to 6:59 AM | 886 (8.2%) | 578 (5.8%) |
| 7:00 AM to 7:29 AM | 1,766 (16.3%) | 1,555 (15.5%) |
| 7:30 AM to 7:59 AM | 1,051 (9.7%) | 1,017 (10.2%) |
| 8:00 AM to 8:29 AM | 1,471 (13.5%) | 1,563 (15.6%) |
| 8:30 AM to 8:59 AM | 656 (6.0%) | 544 (5.4%) |
| 9:00 AM to 9:59 AM | 784 (7.2%) | 1,053 (10.5%) |
| 10:00 AM to 10:59 AM | 309 (2.8%) | 376 (3.7%) |
| 11:00 AM to 11:59 AM | 151 (1.4%) | 267 (2.7%) |
| 12:00 PM to 3:59 PM | 445 (4.1%) | 618 (6.2%) |
| 4:00 PM to 11:59 PM | 345 (3.2%) | 445 (4.4%) |
| Total | 10,863 (100.0%) | 10,016 (100.0%) |
Housing Occupancy in Brea
Occupancy by Ownership in Brea
Of the total 16,454 dwellings in Brea, owner-occupied units account for 10,032 (61.0%), while renter-occupied units make up 6,422 (39.0%).
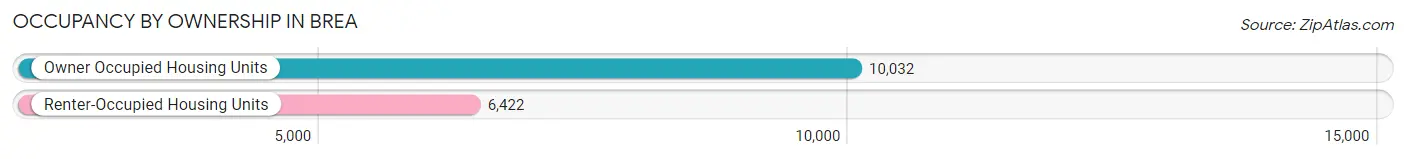
| Occupancy | # Housing Units | % Housing Units |
| Owner Occupied Housing Units | 10,032 | 61.0% |
| Renter-Occupied Housing Units | 6,422 | 39.0% |
| Total Occupied Housing Units | 16,454 | 100.0% |
Occupancy by Household Size in Brea
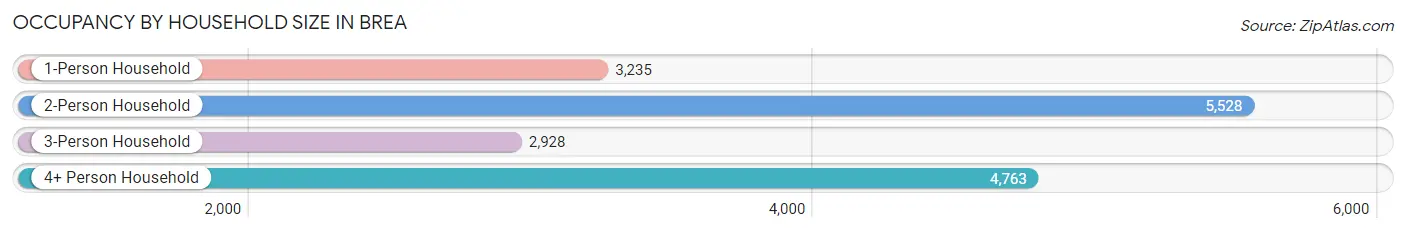
| Household Size | # Housing Units | % Housing Units |
| 1-Person Household | 3,235 | 19.7% |
| 2-Person Household | 5,528 | 33.6% |
| 3-Person Household | 2,928 | 17.8% |
| 4+ Person Household | 4,763 | 28.9% |
| Total Housing Units | 16,454 | 100.0% |
Occupancy by Ownership by Household Size in Brea
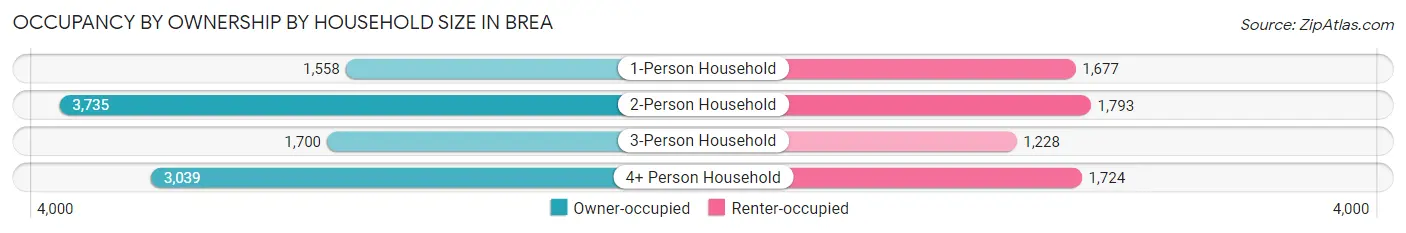
| Household Size | Owner-occupied | Renter-occupied |
| 1-Person Household | 1,558 (48.2%) | 1,677 (51.8%) |
| 2-Person Household | 3,735 (67.6%) | 1,793 (32.4%) |
| 3-Person Household | 1,700 (58.1%) | 1,228 (41.9%) |
| 4+ Person Household | 3,039 (63.8%) | 1,724 (36.2%) |
| Total Housing Units | 10,032 (61.0%) | 6,422 (39.0%) |
Occupancy by Educational Attainment in Brea
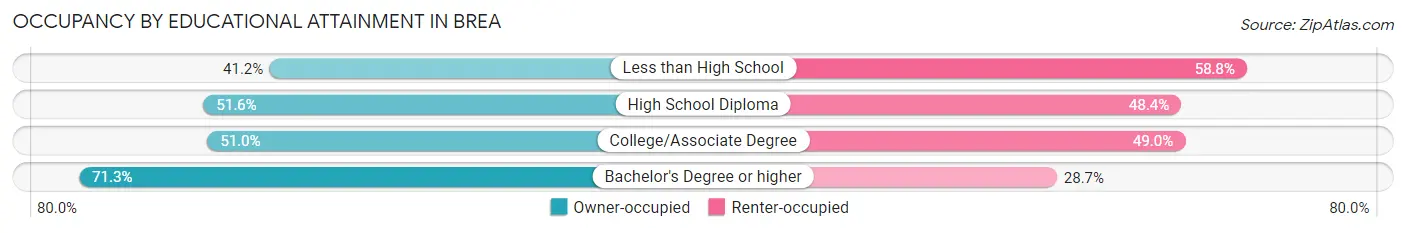
| Household Size | Owner-occupied | Renter-occupied |
| Less than High School | 277 (41.2%) | 395 (58.8%) |
| High School Diploma | 1,118 (51.6%) | 1,047 (48.4%) |
| College/Associate Degree | 2,704 (51.0%) | 2,597 (49.0%) |
| Bachelor's Degree or higher | 5,933 (71.3%) | 2,383 (28.7%) |
Occupancy by Age of Householder in Brea
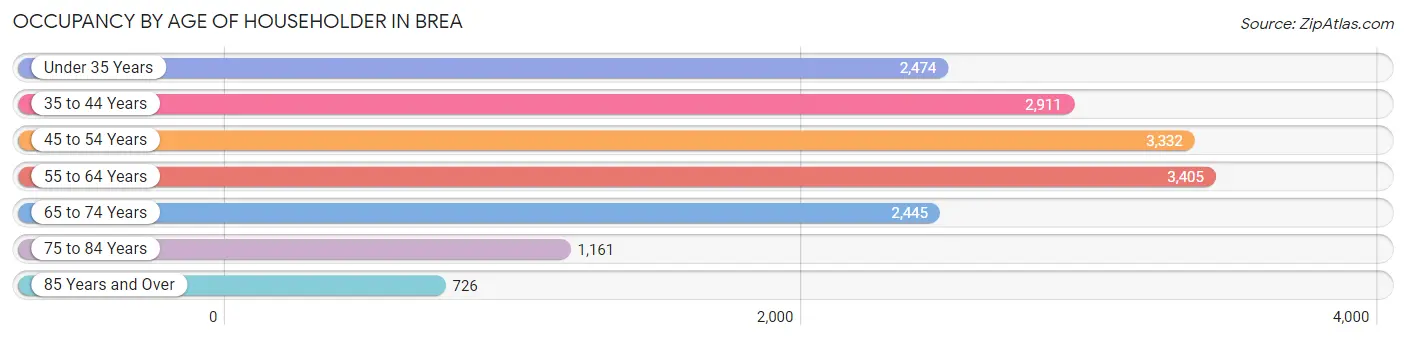
| Age Bracket | # Households | % Households |
| Under 35 Years | 2,474 | 15.0% |
| 35 to 44 Years | 2,911 | 17.7% |
| 45 to 54 Years | 3,332 | 20.3% |
| 55 to 64 Years | 3,405 | 20.7% |
| 65 to 74 Years | 2,445 | 14.9% |
| 75 to 84 Years | 1,161 | 7.1% |
| 85 Years and Over | 726 | 4.4% |
| Total | 16,454 | 100.0% |
Housing Finances in Brea
Median Income by Occupancy in Brea
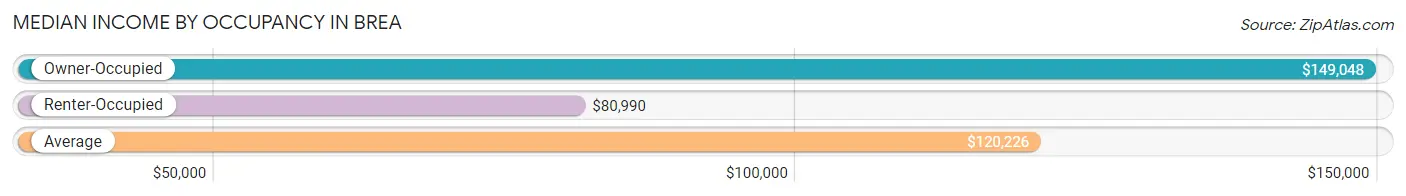
| Occupancy Type | # Households | Median Income |
| Owner-Occupied | 10,032 (61.0%) | $149,048 |
| Renter-Occupied | 6,422 (39.0%) | $80,990 |
| Average | 16,454 (100.0%) | $120,226 |
Occupancy by Householder Income Bracket in Brea
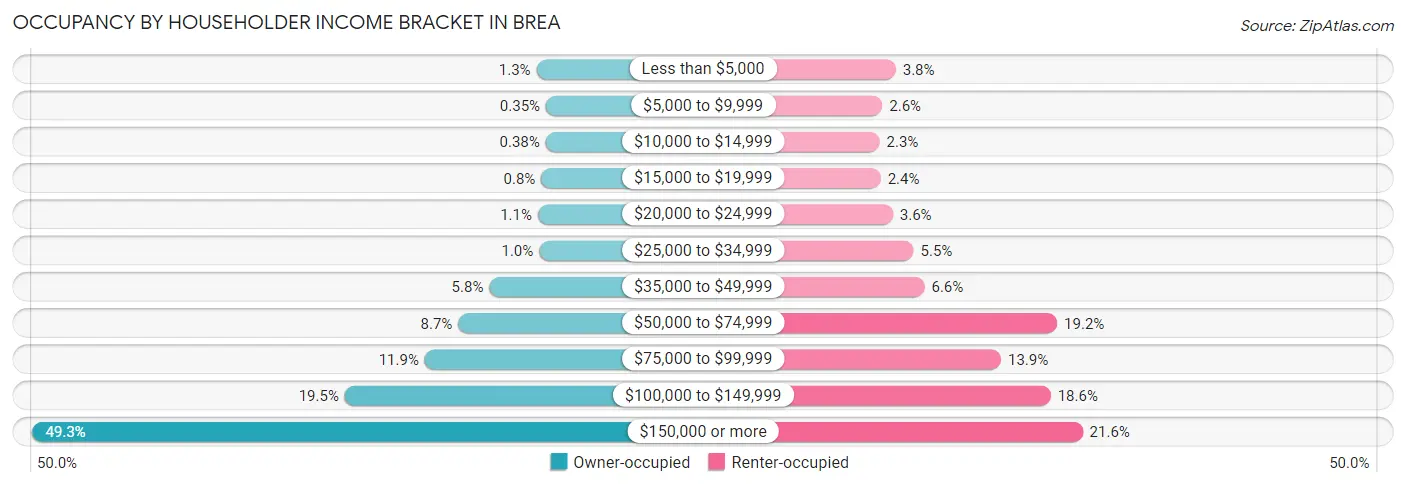
| Income Bracket | Owner-occupied | Renter-occupied |
| Less than $5,000 | 125 (1.3%) | 246 (3.8%) |
| $5,000 to $9,999 | 35 (0.4%) | 164 (2.5%) |
| $10,000 to $14,999 | 38 (0.4%) | 147 (2.3%) |
| $15,000 to $19,999 | 80 (0.8%) | 154 (2.4%) |
| $20,000 to $24,999 | 112 (1.1%) | 228 (3.5%) |
| $25,000 to $34,999 | 100 (1.0%) | 355 (5.5%) |
| $35,000 to $49,999 | 577 (5.8%) | 422 (6.6%) |
| $50,000 to $74,999 | 874 (8.7%) | 1,233 (19.2%) |
| $75,000 to $99,999 | 1,193 (11.9%) | 890 (13.9%) |
| $100,000 to $149,999 | 1,957 (19.5%) | 1,194 (18.6%) |
| $150,000 or more | 4,941 (49.2%) | 1,389 (21.6%) |
| Total | 10,032 (100.0%) | 6,422 (100.0%) |
Monthly Housing Cost Tiers in Brea
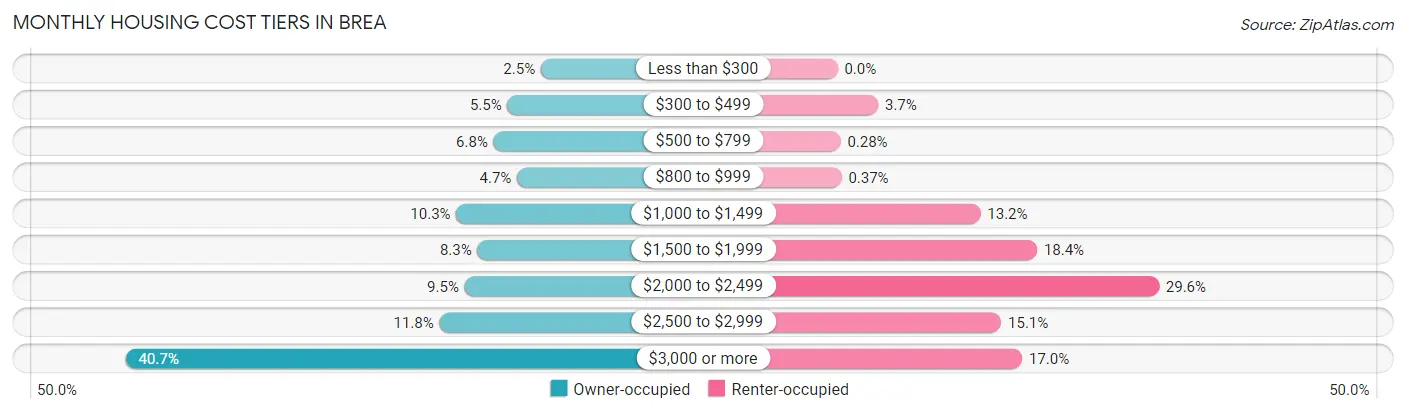
| Monthly Cost | Owner-occupied | Renter-occupied |
| Less than $300 | 247 (2.5%) | 0 (0.0%) |
| $300 to $499 | 556 (5.5%) | 240 (3.7%) |
| $500 to $799 | 683 (6.8%) | 18 (0.3%) |
| $800 to $999 | 466 (4.6%) | 24 (0.4%) |
| $1,000 to $1,499 | 1,028 (10.2%) | 845 (13.2%) |
| $1,500 to $1,999 | 833 (8.3%) | 1,180 (18.4%) |
| $2,000 to $2,499 | 951 (9.5%) | 1,900 (29.6%) |
| $2,500 to $2,999 | 1,184 (11.8%) | 968 (15.1%) |
| $3,000 or more | 4,084 (40.7%) | 1,092 (17.0%) |
| Total | 10,032 (100.0%) | 6,422 (100.0%) |
Physical Housing Characteristics in Brea
Housing Structures in Brea
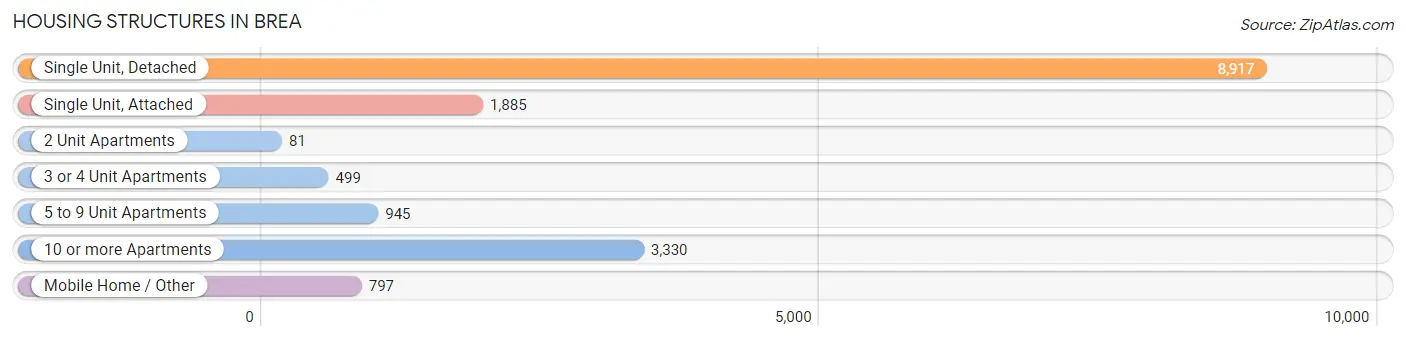
| Structure Type | # Housing Units | % Housing Units |
| Single Unit, Detached | 8,917 | 54.2% |
| Single Unit, Attached | 1,885 | 11.5% |
| 2 Unit Apartments | 81 | 0.5% |
| 3 or 4 Unit Apartments | 499 | 3.0% |
| 5 to 9 Unit Apartments | 945 | 5.7% |
| 10 or more Apartments | 3,330 | 20.2% |
| Mobile Home / Other | 797 | 4.8% |
| Total | 16,454 | 100.0% |
Housing Structures by Occupancy in Brea
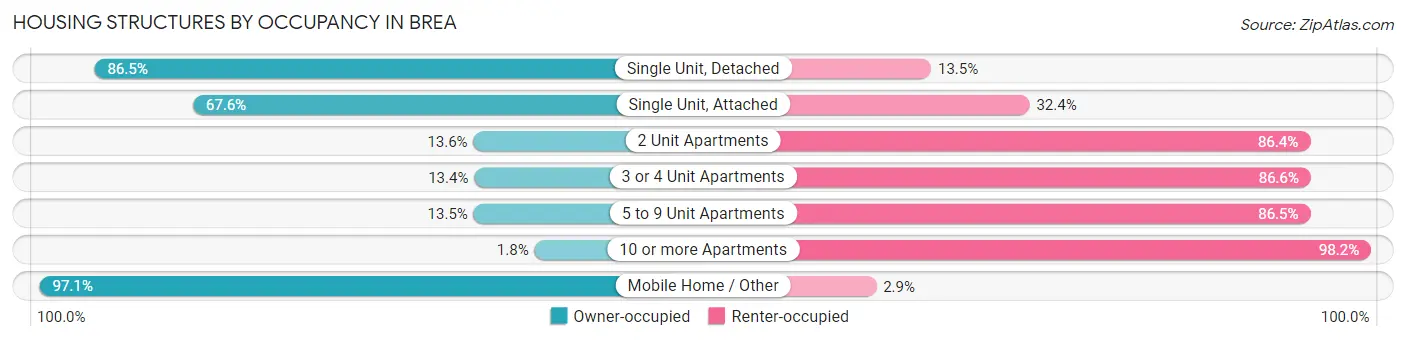
| Structure Type | Owner-occupied | Renter-occupied |
| Single Unit, Detached | 7,717 (86.5%) | 1,200 (13.5%) |
| Single Unit, Attached | 1,274 (67.6%) | 611 (32.4%) |
| 2 Unit Apartments | 11 (13.6%) | 70 (86.4%) |
| 3 or 4 Unit Apartments | 67 (13.4%) | 432 (86.6%) |
| 5 to 9 Unit Apartments | 128 (13.5%) | 817 (86.5%) |
| 10 or more Apartments | 61 (1.8%) | 3,269 (98.2%) |
| Mobile Home / Other | 774 (97.1%) | 23 (2.9%) |
| Total | 10,032 (61.0%) | 6,422 (39.0%) |
Housing Structures by Number of Rooms in Brea
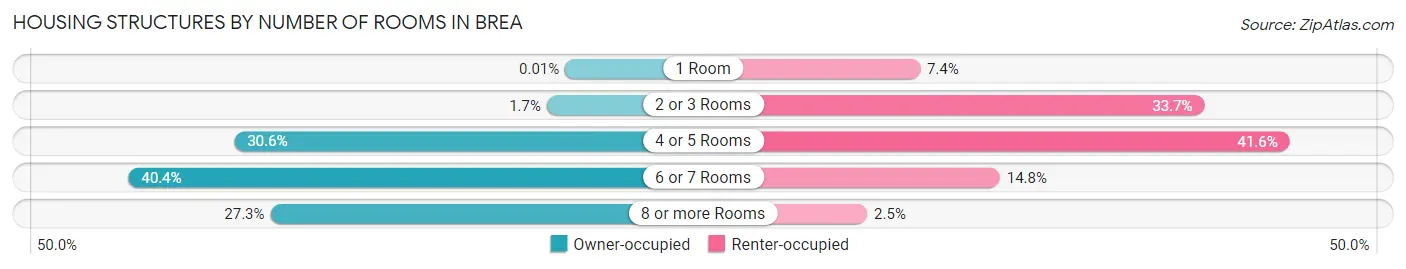
| Number of Rooms | Owner-occupied | Renter-occupied |
| 1 Room | 1 (0.0%) | 475 (7.4%) |
| 2 or 3 Rooms | 171 (1.7%) | 2,165 (33.7%) |
| 4 or 5 Rooms | 3,071 (30.6%) | 2,670 (41.6%) |
| 6 or 7 Rooms | 4,053 (40.4%) | 950 (14.8%) |
| 8 or more Rooms | 2,736 (27.3%) | 162 (2.5%) |
| Total | 10,032 (100.0%) | 6,422 (100.0%) |
Housing Structure by Heating Type in Brea
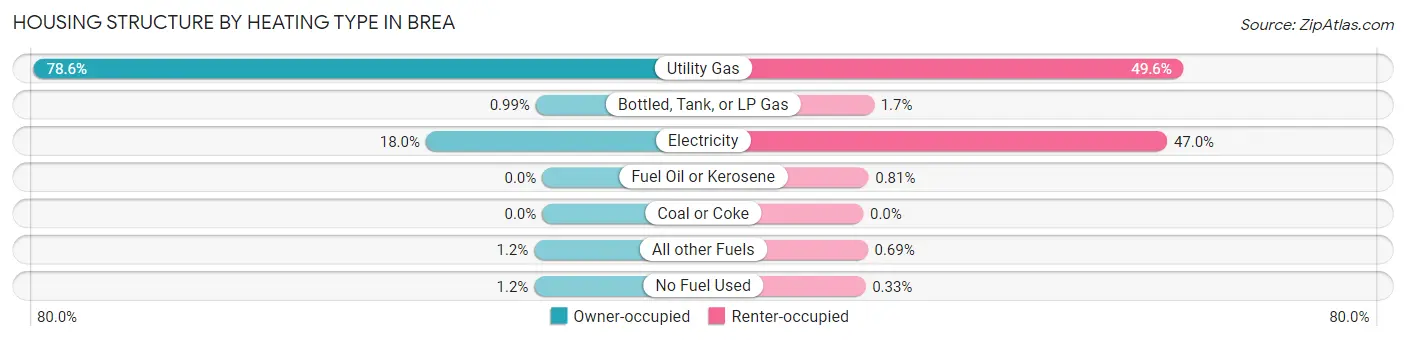
| Heating Type | Owner-occupied | Renter-occupied |
| Utility Gas | 7,884 (78.6%) | 3,182 (49.5%) |
| Bottled, Tank, or LP Gas | 99 (1.0%) | 106 (1.7%) |
| Electricity | 1,804 (18.0%) | 3,017 (47.0%) |
| Fuel Oil or Kerosene | 0 (0.0%) | 52 (0.8%) |
| Coal or Coke | 0 (0.0%) | 0 (0.0%) |
| All other Fuels | 123 (1.2%) | 44 (0.7%) |
| No Fuel Used | 122 (1.2%) | 21 (0.3%) |
| Total | 10,032 (100.0%) | 6,422 (100.0%) |
Household Vehicle Usage in Brea
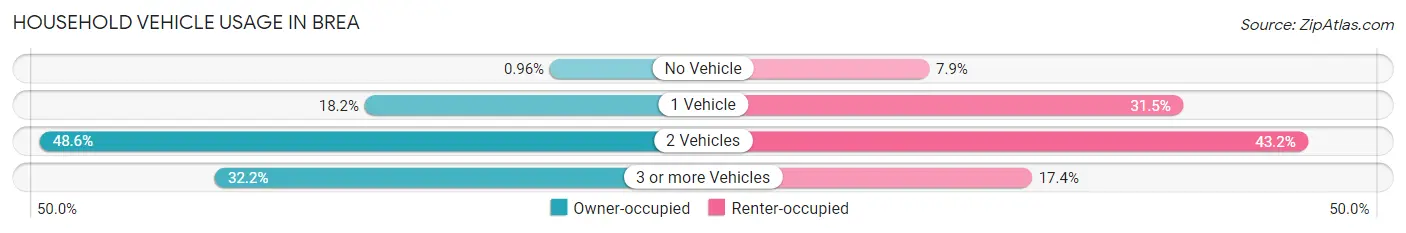
| Vehicles per Household | Owner-occupied | Renter-occupied |
| No Vehicle | 96 (1.0%) | 505 (7.9%) |
| 1 Vehicle | 1,830 (18.2%) | 2,024 (31.5%) |
| 2 Vehicles | 4,874 (48.6%) | 2,773 (43.2%) |
| 3 or more Vehicles | 3,232 (32.2%) | 1,120 (17.4%) |
| Total | 10,032 (100.0%) | 6,422 (100.0%) |
Real Estate & Mortgages in Brea
Real Estate and Mortgage Overview in Brea
| Characteristic | Without Mortgage | With Mortgage |
| Housing Units | 2,787 | 7,245 |
| Median Property Value | $764,600 | $852,100 |
| Median Household Income | $91,729 | $4,090 |
| Monthly Housing Costs | $783 | $4,072 |
| Real Estate Taxes | $3,432 | $116 |
Property Value by Mortgage Status in Brea
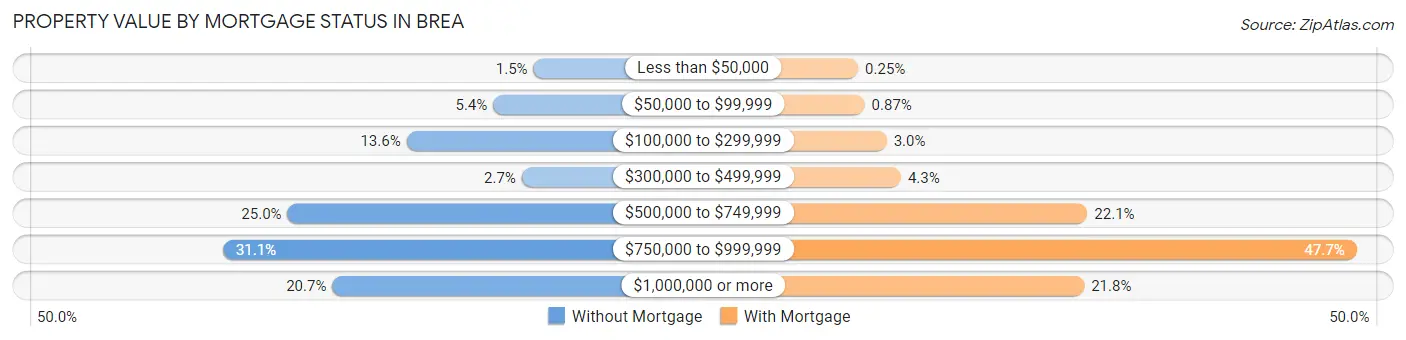
| Property Value | Without Mortgage | With Mortgage |
| Less than $50,000 | 43 (1.5%) | 18 (0.3%) |
| $50,000 to $99,999 | 150 (5.4%) | 63 (0.9%) |
| $100,000 to $299,999 | 380 (13.6%) | 215 (3.0%) |
| $300,000 to $499,999 | 74 (2.7%) | 314 (4.3%) |
| $500,000 to $749,999 | 696 (25.0%) | 1,600 (22.1%) |
| $750,000 to $999,999 | 867 (31.1%) | 3,457 (47.7%) |
| $1,000,000 or more | 577 (20.7%) | 1,578 (21.8%) |
| Total | 2,787 (100.0%) | 7,245 (100.0%) |
Household Income by Mortgage Status in Brea
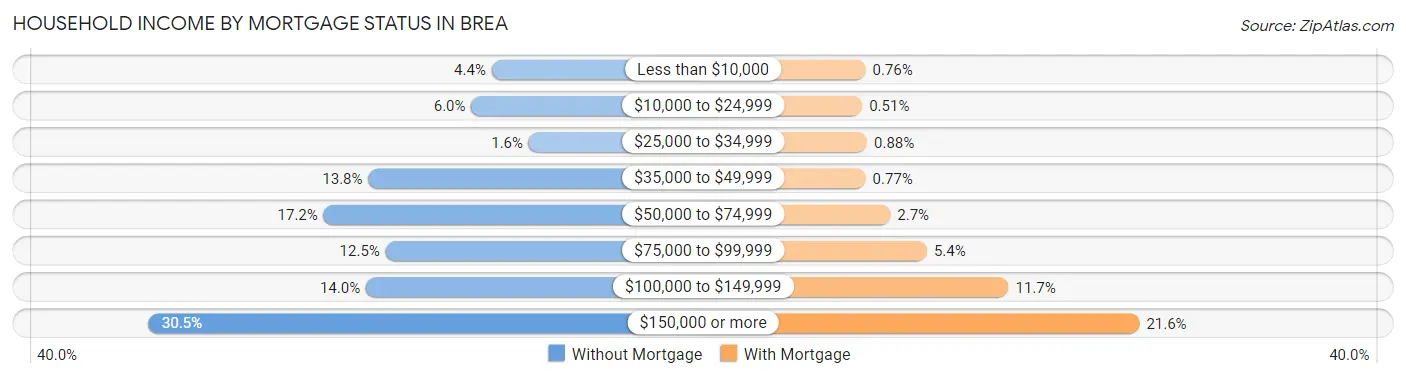
| Household Income | Without Mortgage | With Mortgage |
| Less than $10,000 | 123 (4.4%) | 55 (0.8%) |
| $10,000 to $24,999 | 166 (6.0%) | 37 (0.5%) |
| $25,000 to $34,999 | 44 (1.6%) | 64 (0.9%) |
| $35,000 to $49,999 | 385 (13.8%) | 56 (0.8%) |
| $50,000 to $74,999 | 480 (17.2%) | 192 (2.6%) |
| $75,000 to $99,999 | 348 (12.5%) | 394 (5.4%) |
| $100,000 to $149,999 | 390 (14.0%) | 845 (11.7%) |
| $150,000 or more | 851 (30.5%) | 1,567 (21.6%) |
| Total | 2,787 (100.0%) | 7,245 (100.0%) |
Property Value to Household Income Ratio in Brea
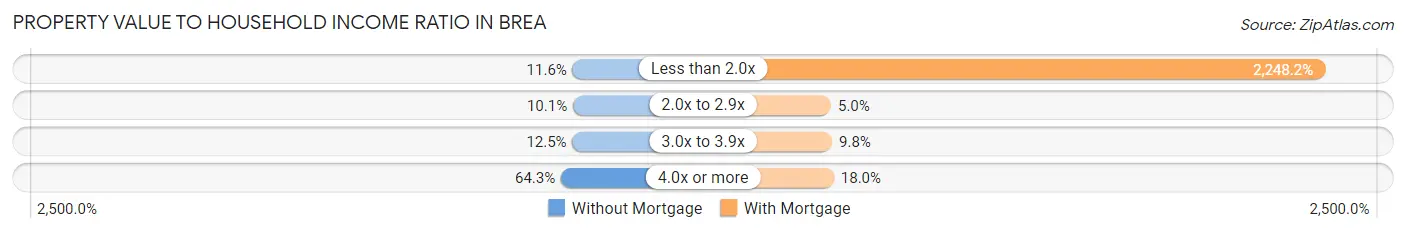
| Value-to-Income Ratio | Without Mortgage | With Mortgage |
| Less than 2.0x | 323 (11.6%) | 162,882 (2,248.2%) |
| 2.0x to 2.9x | 282 (10.1%) | 365 (5.0%) |
| 3.0x to 3.9x | 349 (12.5%) | 711 (9.8%) |
| 4.0x or more | 1,792 (64.3%) | 1,303 (18.0%) |
| Total | 2,787 (100.0%) | 7,245 (100.0%) |
Real Estate Taxes by Mortgage Status in Brea
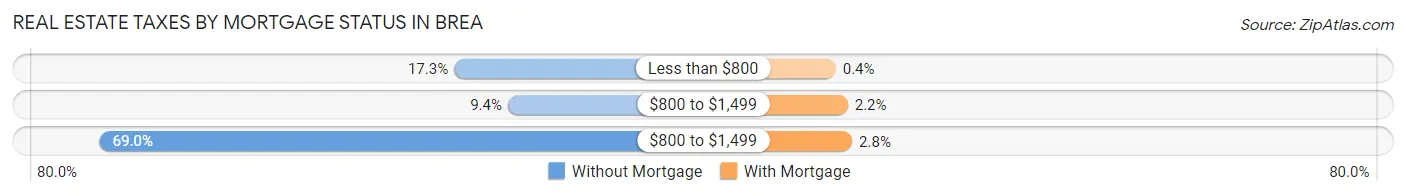
| Property Taxes | Without Mortgage | With Mortgage |
| Less than $800 | 481 (17.3%) | 29 (0.4%) |
| $800 to $1,499 | 262 (9.4%) | 156 (2.1%) |
| $800 to $1,499 | 1,924 (69.0%) | 202 (2.8%) |
| Total | 2,787 (100.0%) | 7,245 (100.0%) |
Health & Disability in Brea
Health Insurance Coverage by Age in Brea
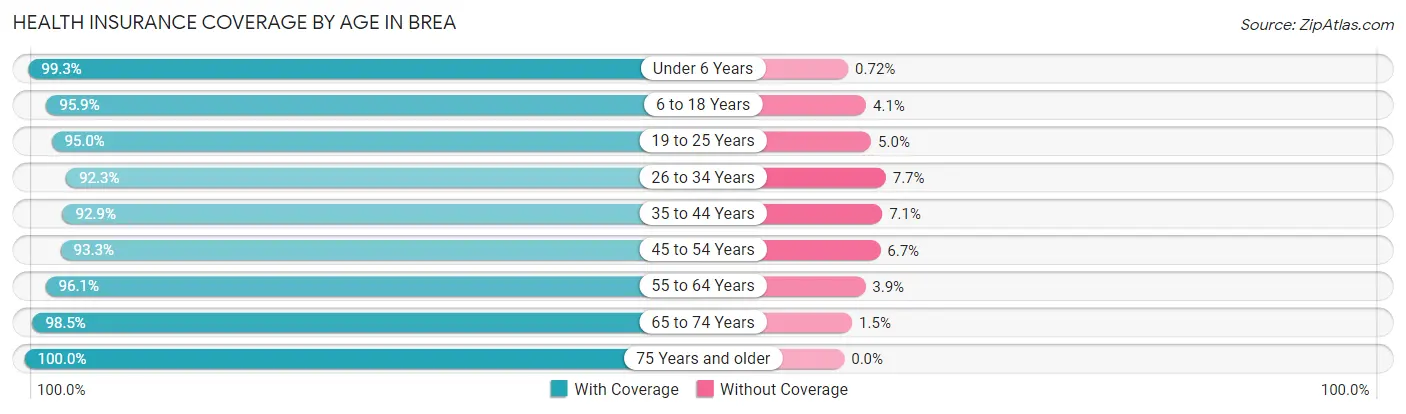
| Age Bracket | With Coverage | Without Coverage |
| Under 6 Years | 3,033 (99.3%) | 22 (0.7%) |
| 6 to 18 Years | 7,776 (95.9%) | 329 (4.1%) |
| 19 to 25 Years | 3,921 (95.0%) | 207 (5.0%) |
| 26 to 34 Years | 5,158 (92.3%) | 433 (7.7%) |
| 35 to 44 Years | 5,607 (92.9%) | 427 (7.1%) |
| 45 to 54 Years | 6,041 (93.3%) | 436 (6.7%) |
| 55 to 64 Years | 6,051 (96.1%) | 247 (3.9%) |
| 65 to 74 Years | 4,209 (98.5%) | 63 (1.5%) |
| 75 Years and older | 3,122 (100.0%) | 0 (0.0%) |
| Total | 44,918 (95.4%) | 2,164 (4.6%) |
Health Insurance Coverage by Citizenship Status in Brea
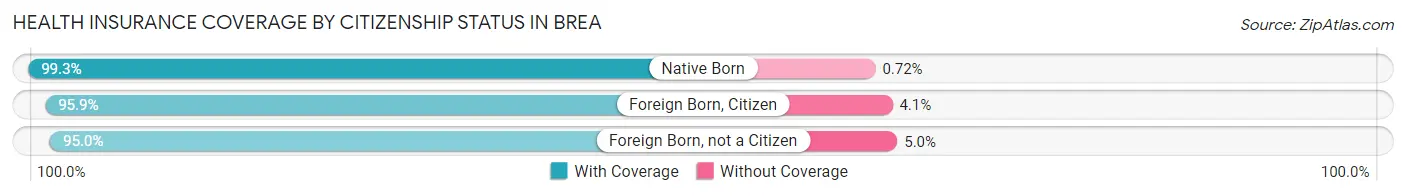
| Citizenship Status | With Coverage | Without Coverage |
| Native Born | 3,033 (99.3%) | 22 (0.7%) |
| Foreign Born, Citizen | 7,776 (95.9%) | 329 (4.1%) |
| Foreign Born, not a Citizen | 3,921 (95.0%) | 207 (5.0%) |
Health Insurance Coverage by Household Income in Brea
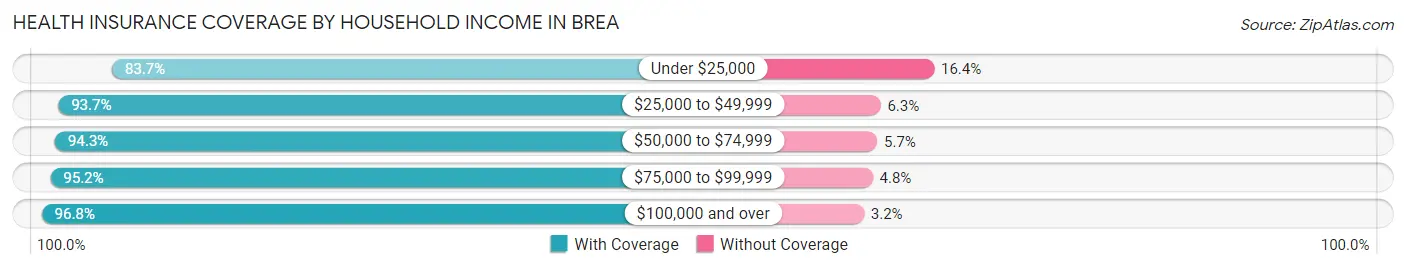
| Household Income | With Coverage | Without Coverage |
| Under $25,000 | 2,133 (83.7%) | 417 (16.4%) |
| $25,000 to $49,999 | 3,205 (93.7%) | 216 (6.3%) |
| $50,000 to $74,999 | 4,486 (94.3%) | 270 (5.7%) |
| $75,000 to $99,999 | 5,710 (95.2%) | 290 (4.8%) |
| $100,000 and over | 29,256 (96.8%) | 963 (3.2%) |
Public vs Private Health Insurance Coverage by Age in Brea
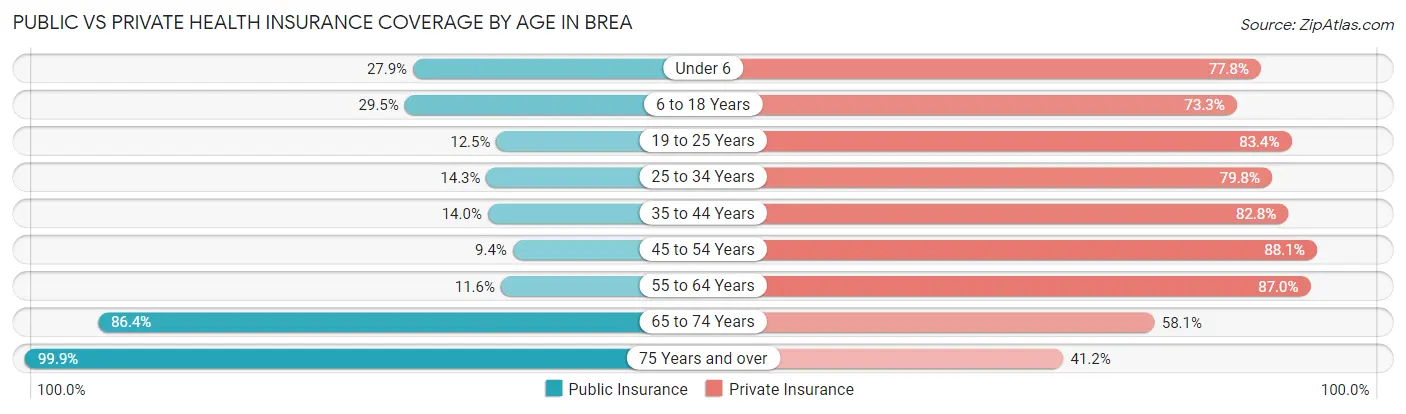
| Age Bracket | Public Insurance | Private Insurance |
| Under 6 | 853 (27.9%) | 2,376 (77.8%) |
| 6 to 18 Years | 2,388 (29.5%) | 5,939 (73.3%) |
| 19 to 25 Years | 514 (12.4%) | 3,444 (83.4%) |
| 25 to 34 Years | 799 (14.3%) | 4,463 (79.8%) |
| 35 to 44 Years | 847 (14.0%) | 4,998 (82.8%) |
| 45 to 54 Years | 609 (9.4%) | 5,706 (88.1%) |
| 55 to 64 Years | 731 (11.6%) | 5,476 (87.0%) |
| 65 to 74 Years | 3,690 (86.4%) | 2,482 (58.1%) |
| 75 Years and over | 3,120 (99.9%) | 1,285 (41.2%) |
| Total | 13,551 (28.8%) | 36,169 (76.8%) |
Disability Status by Sex by Age in Brea
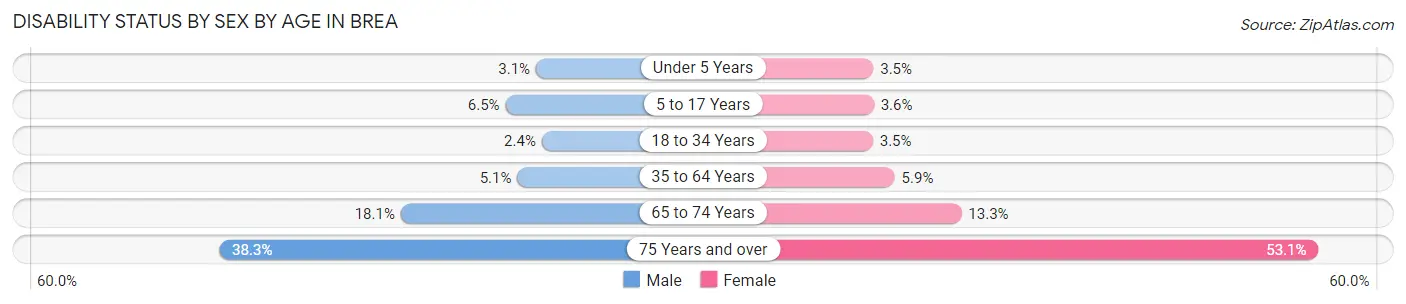
| Age Bracket | Male | Female |
| Under 5 Years | 40 (3.0%) | 39 (3.5%) |
| 5 to 17 Years | 233 (6.5%) | 156 (3.5%) |
| 18 to 34 Years | 127 (2.4%) | 179 (3.5%) |
| 35 to 64 Years | 470 (5.1%) | 568 (5.9%) |
| 65 to 74 Years | 363 (18.1%) | 302 (13.3%) |
| 75 Years and over | 411 (38.3%) | 1,088 (53.1%) |
Disability Class by Sex by Age in Brea
Disability Class: Hearing Difficulty
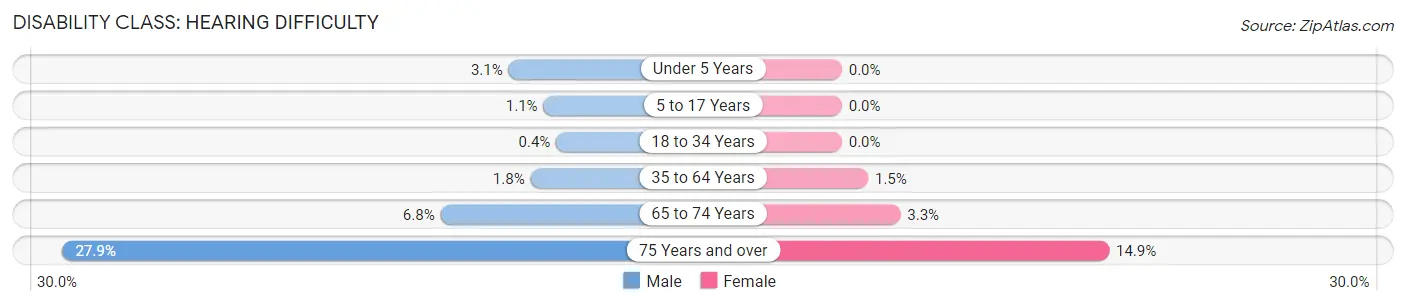
| Age Bracket | Male | Female |
| Under 5 Years | 40 (3.0%) | 0 (0.0%) |
| 5 to 17 Years | 40 (1.1%) | 0 (0.0%) |
| 18 to 34 Years | 21 (0.4%) | 0 (0.0%) |
| 35 to 64 Years | 168 (1.8%) | 141 (1.5%) |
| 65 to 74 Years | 137 (6.8%) | 74 (3.3%) |
| 75 Years and over | 299 (27.9%) | 305 (14.9%) |
Disability Class: Vision Difficulty
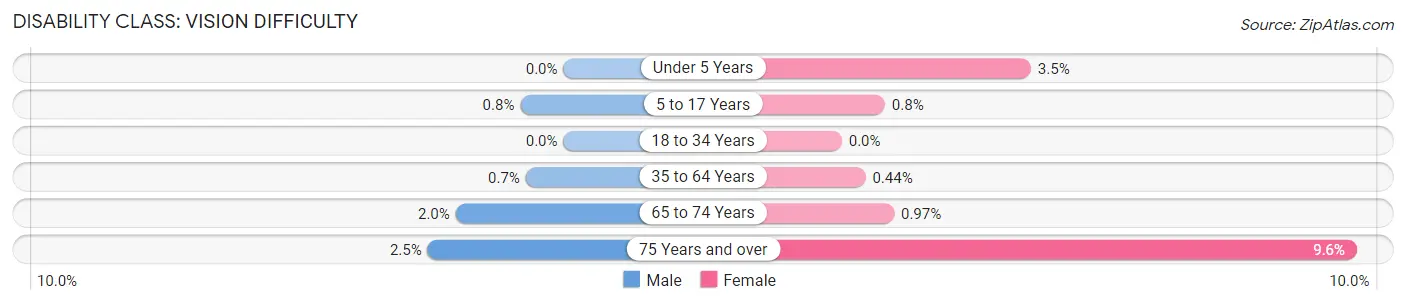
| Age Bracket | Male | Female |
| Under 5 Years | 0 (0.0%) | 39 (3.5%) |
| 5 to 17 Years | 29 (0.8%) | 35 (0.8%) |
| 18 to 34 Years | 0 (0.0%) | 0 (0.0%) |
| 35 to 64 Years | 64 (0.7%) | 42 (0.4%) |
| 65 to 74 Years | 40 (2.0%) | 22 (1.0%) |
| 75 Years and over | 27 (2.5%) | 196 (9.6%) |
Disability Class: Cognitive Difficulty
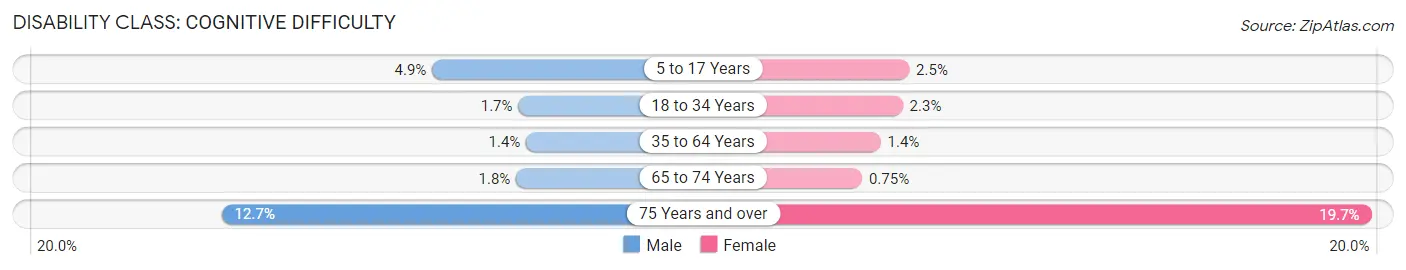
| Age Bracket | Male | Female |
| 5 to 17 Years | 176 (4.9%) | 110 (2.5%) |
| 18 to 34 Years | 88 (1.7%) | 117 (2.3%) |
| 35 to 64 Years | 126 (1.4%) | 139 (1.4%) |
| 65 to 74 Years | 35 (1.8%) | 17 (0.7%) |
| 75 Years and over | 136 (12.7%) | 403 (19.7%) |
Disability Class: Ambulatory Difficulty
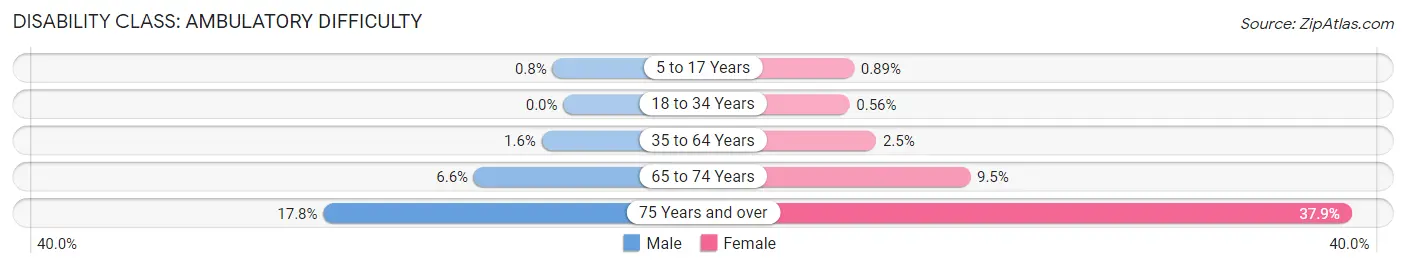
| Age Bracket | Male | Female |
| 5 to 17 Years | 29 (0.8%) | 39 (0.9%) |
| 18 to 34 Years | 0 (0.0%) | 29 (0.6%) |
| 35 to 64 Years | 147 (1.6%) | 245 (2.5%) |
| 65 to 74 Years | 133 (6.6%) | 216 (9.5%) |
| 75 Years and over | 191 (17.8%) | 776 (37.9%) |
Disability Class: Self-Care Difficulty
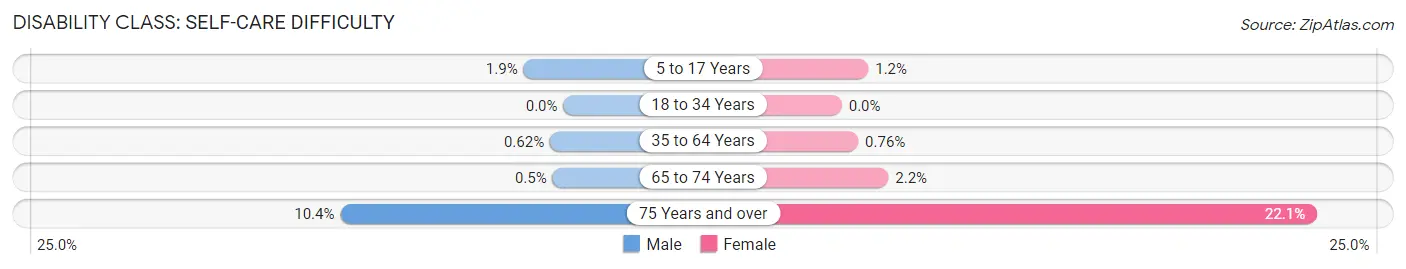
| Age Bracket | Male | Female |
| 5 to 17 Years | 67 (1.8%) | 54 (1.2%) |
| 18 to 34 Years | 0 (0.0%) | 0 (0.0%) |
| 35 to 64 Years | 57 (0.6%) | 73 (0.8%) |
| 65 to 74 Years | 10 (0.5%) | 49 (2.2%) |
| 75 Years and over | 111 (10.3%) | 452 (22.1%) |
Technology Access in Brea
Computing Device Access in Brea
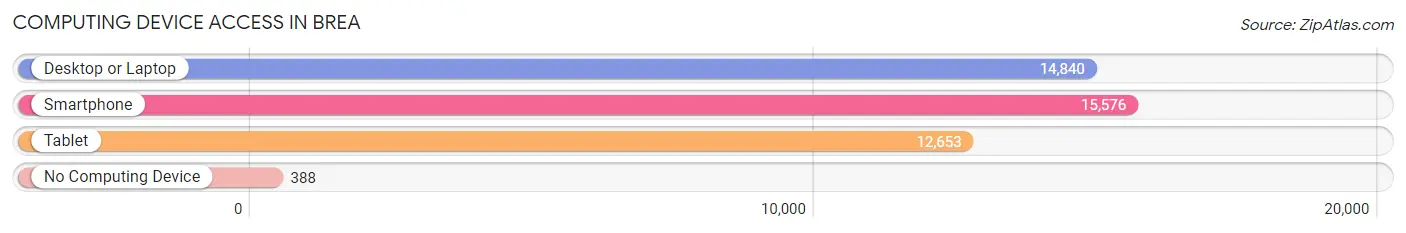
| Device Type | # Households | % Households |
| Desktop or Laptop | 14,840 | 90.2% |
| Smartphone | 15,576 | 94.7% |
| Tablet | 12,653 | 76.9% |
| No Computing Device | 388 | 2.4% |
| Total | 16,454 | 100.0% |
Internet Access in Brea
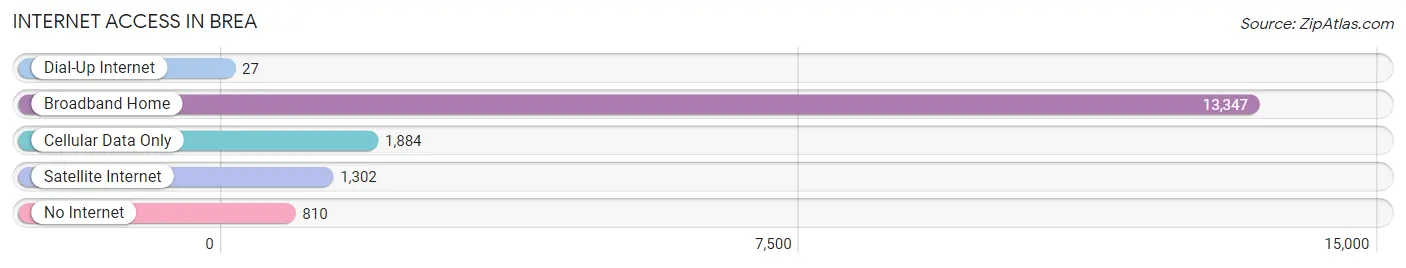
| Internet Type | # Households | % Households |
| Dial-Up Internet | 27 | 0.2% |
| Broadband Home | 13,347 | 81.1% |
| Cellular Data Only | 1,884 | 11.5% |
| Satellite Internet | 1,302 | 7.9% |
| No Internet | 810 | 4.9% |
| Total | 16,454 | 100.0% |
Brea Summary
Brea is a city located in Orange County, California, United States. It is situated in the foothills of the Santa Ana Mountains, approximately 25 miles southeast of Los Angeles. The population of Brea was 37,282 at the 2000 census.
History
The area that is now Brea was originally inhabited by the Tongva Native Americans. The first Europeans to settle in the area were the Spanish, who established a mission in the area in 1771. The area was later part of the Rancho Los Coyotes land grant, which was granted to the Yorba family in 1834. The area was then known as “Olinda”, after the Yorba family’s ranch.
In the late 19th century, the area was developed as an oil-producing region. The first oil well was drilled in 1880, and by the early 1900s, the area was producing more than 100,000 barrels of oil per year. The area was incorporated as the City of Brea in 1917.
Geography
Brea is located at 33°51'25" North, 117°52'45" West (33.856944, -117.879167). According to the United States Census Bureau, the city has a total area of 12.2 square miles, of which 12.1 square miles is land and 0.1 square miles (0.83%) is water.
The city is located in the foothills of the Santa Ana Mountains, and is bordered by the cities of Fullerton, La Habra, Placentia, and Yorba Linda.
Economy
The economy of Brea is largely based on the oil industry. The city is home to several oil companies, including Brea Oil Company, Brea Resources, and Brea Petroleum. The city is also home to several manufacturing companies, including Brea Manufacturing, Brea Industries, and Brea Products.
The city is also home to several retail stores, including Brea Mall, Brea Plaza, and Brea Marketplace.
Demographics
As of the 2000 census, there were 37,282 people, 13,845 households, and 9,845 families residing in the city. The population density was 3,072.3 people per square mile (1,186.3/km²). There were 14,068 housing units at an average density of 1,159.2 per square mile (448.2/km²). The racial makeup of the city was 74.2% White, 1.3% African American, 0.5% Native American, 13.2% Asian, 0.2% Pacific Islander, 7.2% from other races, and 3.5% from two or more races. Hispanic or Latino of any race were 17.7% of the population.
There were 13,845 households out of which 33.2% had children under the age of 18 living with them, 56.2% were married couples living together, 10.2% had a female householder with no husband present, and 29.3% were non-families. 22.7% of all households were made up of individuals and 6.2% had someone living alone who was 65 years of age or older. The average household size was 2.68 and the average family size was 3.19.
In the city, the population was spread out with 24.2% under the age of 18, 8.2% from 18 to 24, 33.2% from 25 to 44, 22.7% from 45 to 64, and 11.7% who were 65 years of age or older. The median age was 36 years. For every 100 females, there were 94.2 males. For every 100 females age 18 and over, there were 90.7 males.
The median income for a household in the city was $60,845, and the median income for a family was $68,945. Males had a median income of $50,845 versus $35,845 for females. The per capita income for the city was $27,845. About 4.2% of families and 6.2% of the population were below the poverty line, including 7.2% of those under age 18 and 4.2% of those age 65 or over.
Common Questions
What is Per Capita Income in Brea?
Per Capita income in Brea is $50,780.
What is the Median Family Income in Brea?
Median Family Income in Brea is $138,599.
What is the Median Household income in Brea?
Median Household Income in Brea is $120,226.
What is Income or Wage Gap in Brea?
Income or Wage Gap in Brea is 34.3%.
Women in Brea earn 65.7 cents for every dollar earned by a man.
What is Inequality or Gini Index in Brea?
Inequality or Gini Index in Brea is 0.40.
What is the Total Population of Brea?
Total Population of Brea is 47,099.
What is the Total Male Population of Brea?
Total Male Population of Brea is 22,434.
What is the Total Female Population of Brea?
Total Female Population of Brea is 24,665.
What is the Ratio of Males per 100 Females in Brea?
There are 90.95 Males per 100 Females in Brea.
What is the Ratio of Females per 100 Males in Brea?
There are 109.94 Females per 100 Males in Brea.
What is the Median Population Age in Brea?
Median Population Age in Brea is 39.7 Years.
What is the Average Family Size in Brea
Average Family Size in Brea is 3.3 People.
What is the Average Household Size in Brea
Average Household Size in Brea is 2.9 People.
How Large is the Labor Force in Brea?
There are 25,372 People in the Labor Forcein in Brea.
What is the Percentage of People in the Labor Force in Brea?
67.1% of People are in the Labor Force in Brea.
What is the Unemployment Rate in Brea?
Unemployment Rate in Brea is 5.0%.