Sugar Land, TX Map & Demographics
Sugar Land Map
Sugar Land Overview
$58,237
PER CAPITA INCOME
$154,209
AVG FAMILY INCOME
$132,247
AVG HOUSEHOLD INCOME
37.8%
WAGE / INCOME GAP [ % ]
62.2¢/ $1
WAGE / INCOME GAP [ $ ]
0.43
INEQUALITY / GINI INDEX
110,077
TOTAL POPULATION
54,167
MALE POPULATION
55,910
FEMALE POPULATION
96.88
MALES / 100 FEMALES
103.22
FEMALES / 100 MALES
42.5
MEDIAN AGE
3.3
AVG FAMILY SIZE
2.9
AVG HOUSEHOLD SIZE
56,564
LABOR FORCE [ PEOPLE ]
63.8%
PERCENT IN LABOR FORCE
5.0%
UNEMPLOYMENT RATE
Income in Sugar Land
Income Overview in Sugar Land
Per Capita Income in Sugar Land is $58,237, while median incomes of families and households are $154,209 and $132,247 respectively.
| Characteristic | Number | Measure |
| Per Capita Income | 110,077 | $58,237 |
| Median Family Income | 29,867 | $154,209 |
| Mean Family Income | 29,867 | $189,879 |
| Median Household Income | 37,481 | $132,247 |
| Mean Household Income | 37,481 | $169,825 |
| Income Deficit | 29,867 | $0 |
| Wage / Income Gap (%) | 110,077 | 37.81% |
| Wage / Income Gap ($) | 110,077 | 62.19¢ per $1 |
| Gini / Inequality Index | 110,077 | 0.43 |
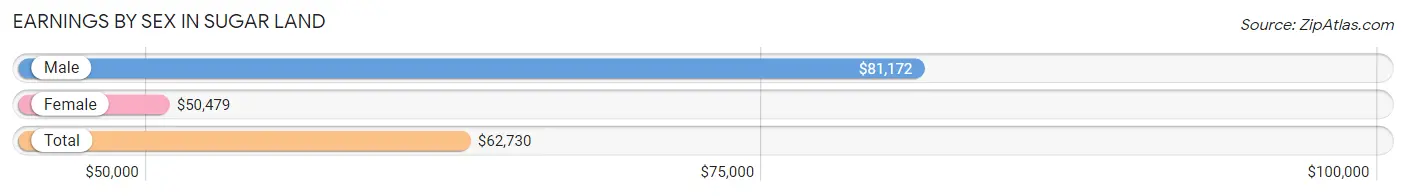
Earnings by Sex in Sugar Land
Average Earnings in Sugar Land are $62,730, $81,172 for men and $50,479 for women, a difference of 37.8%.
| Sex | Number | Average Earnings |
| Male | 30,586 (52.4%) | $81,172 |
| Female | 27,746 (47.6%) | $50,479 |
| Total | 58,332 (100.0%) | $62,730 |
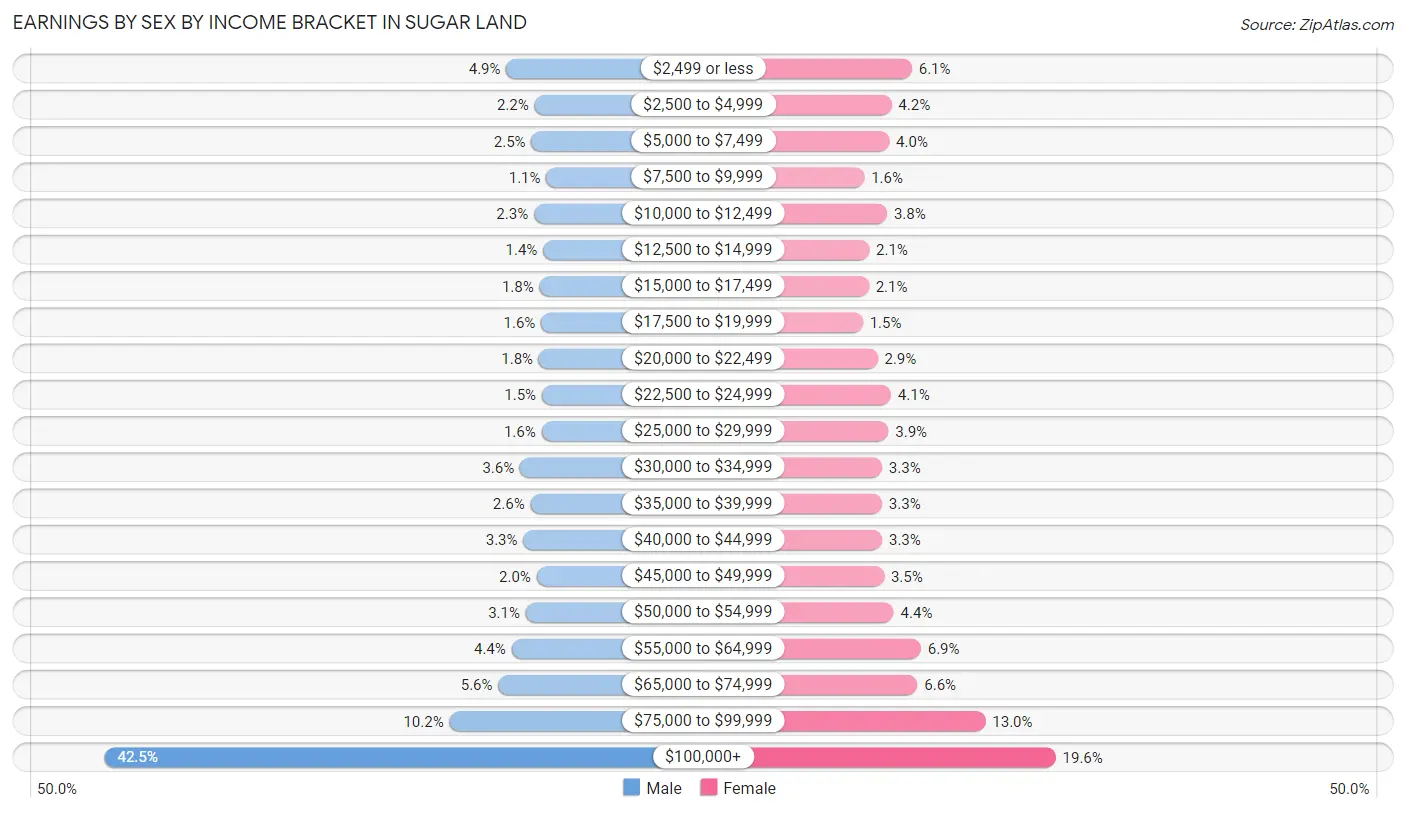
Earnings by Sex by Income Bracket in Sugar Land
The most common earnings brackets in Sugar Land are $100,000+ for men (13,003 | 42.5%) and $100,000+ for women (5,426 | 19.6%).
| Income | Male | Female |
| $2,499 or less | 1,489 (4.9%) | 1,691 (6.1%) |
| $2,500 to $4,999 | 681 (2.2%) | 1,160 (4.2%) |
| $5,000 to $7,499 | 772 (2.5%) | 1,102 (4.0%) |
| $7,500 to $9,999 | 344 (1.1%) | 453 (1.6%) |
| $10,000 to $12,499 | 697 (2.3%) | 1,043 (3.8%) |
| $12,500 to $14,999 | 434 (1.4%) | 580 (2.1%) |
| $15,000 to $17,499 | 537 (1.8%) | 570 (2.1%) |
| $17,500 to $19,999 | 492 (1.6%) | 414 (1.5%) |
| $20,000 to $22,499 | 556 (1.8%) | 798 (2.9%) |
| $22,500 to $24,999 | 471 (1.5%) | 1,147 (4.1%) |
| $25,000 to $29,999 | 480 (1.6%) | 1,078 (3.9%) |
| $30,000 to $34,999 | 1,098 (3.6%) | 913 (3.3%) |
| $35,000 to $39,999 | 799 (2.6%) | 913 (3.3%) |
| $40,000 to $44,999 | 1,004 (3.3%) | 916 (3.3%) |
| $45,000 to $49,999 | 620 (2.0%) | 965 (3.5%) |
| $50,000 to $54,999 | 932 (3.0%) | 1,218 (4.4%) |
| $55,000 to $64,999 | 1,339 (4.4%) | 1,924 (6.9%) |
| $65,000 to $74,999 | 1,718 (5.6%) | 1,834 (6.6%) |
| $75,000 to $99,999 | 3,120 (10.2%) | 3,601 (13.0%) |
| $100,000+ | 13,003 (42.5%) | 5,426 (19.6%) |
| Total | 30,586 (100.0%) | 27,746 (100.0%) |
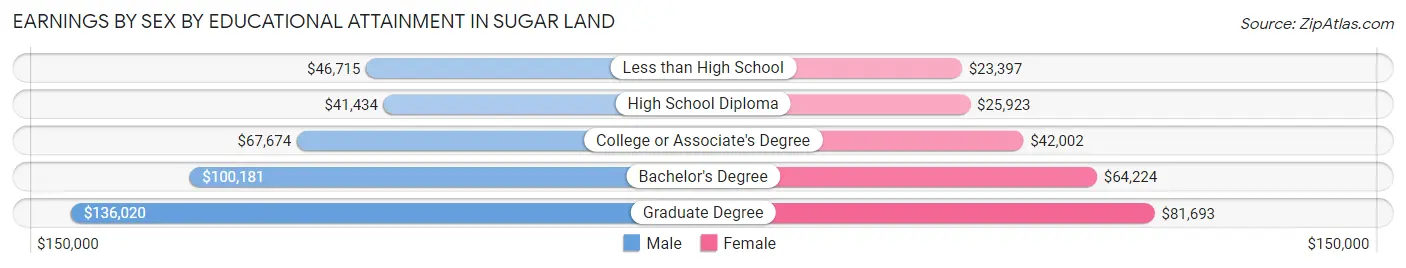
Earnings by Sex by Educational Attainment in Sugar Land
Average earnings in Sugar Land are $93,493 for men and $59,266 for women, a difference of 36.6%. Men with an educational attainment of graduate degree enjoy the highest average annual earnings of $136,020, while those with high school diploma education earn the least with $41,434. Women with an educational attainment of graduate degree earn the most with the average annual earnings of $81,693, while those with less than high school education have the smallest earnings of $23,397.
| Educational Attainment | Male Income | Female Income |
| Less than High School | $46,715 | $23,397 |
| High School Diploma | $41,434 | $25,923 |
| College or Associate's Degree | $67,674 | $42,002 |
| Bachelor's Degree | $100,181 | $64,224 |
| Graduate Degree | $136,020 | $81,693 |
| Total | $93,493 | $59,266 |
Family Income in Sugar Land
Family Income Brackets in Sugar Land
According to the Sugar Land family income data, there are 10,065 families falling into the $200,000+ income range, which is the most common income bracket and makes up 33.7% of all families. Conversely, the $10,000 to $14,999 income bracket is the least frequent group with only 269 families (0.9%) belonging to this category.
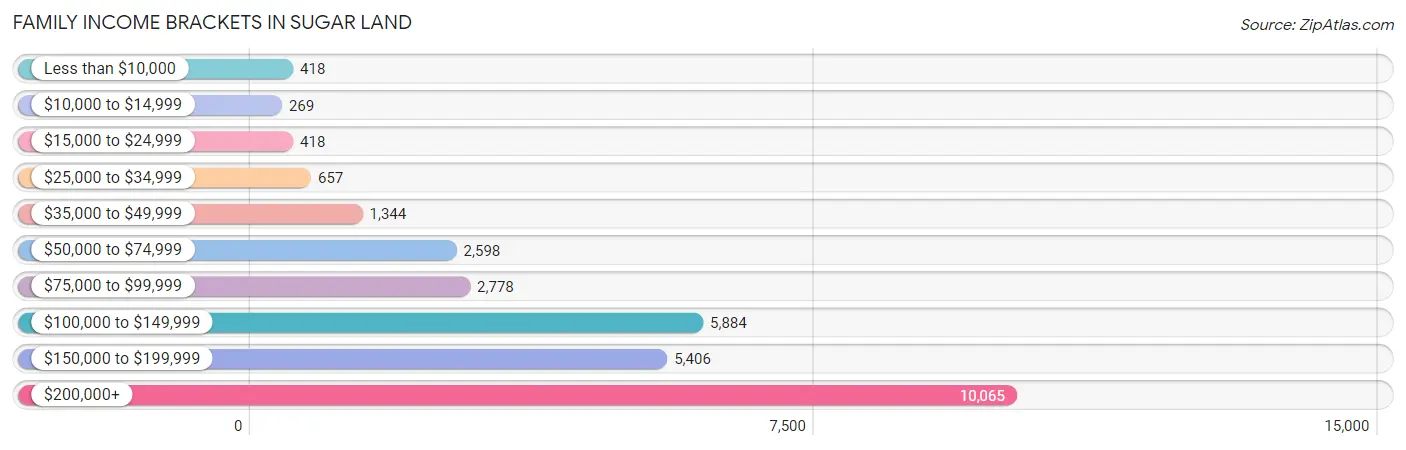
| Income Bracket | # Families | % Families |
| Less than $10,000 | 418 | 1.4% |
| $10,000 to $14,999 | 269 | 0.9% |
| $15,000 to $24,999 | 418 | 1.4% |
| $25,000 to $34,999 | 657 | 2.2% |
| $35,000 to $49,999 | 1,344 | 4.5% |
| $50,000 to $74,999 | 2,598 | 8.7% |
| $75,000 to $99,999 | 2,778 | 9.3% |
| $100,000 to $149,999 | 5,884 | 19.7% |
| $150,000 to $199,999 | 5,406 | 18.1% |
| $200,000+ | 10,065 | 33.7% |
Family Income by Famaliy Size in Sugar Land
6-person families (1,176 | 3.9%) account for the highest median family income in Sugar Land with $206,250 per family, while 2-person families (11,551 | 38.7%) have the highest median income of $63,174 per family member.
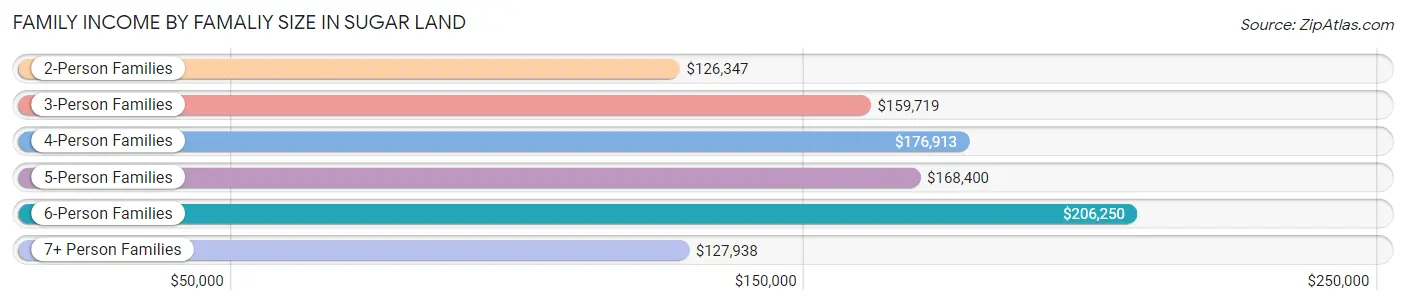
| Income Bracket | # Families | Median Income |
| 2-Person Families | 11,551 (38.7%) | $126,347 |
| 3-Person Families | 6,376 (21.3%) | $159,719 |
| 4-Person Families | 7,693 (25.8%) | $176,913 |
| 5-Person Families | 2,530 (8.5%) | $168,400 |
| 6-Person Families | 1,176 (3.9%) | $206,250 |
| 7+ Person Families | 541 (1.8%) | $127,938 |
| Total | 29,867 (100.0%) | $154,209 |
Family Income by Number of Earners in Sugar Land
The median family income in Sugar Land is $154,209, with families comprising 3+ earners (4,446) having the highest median family income of $182,801, while families with no earners (3,640) have the lowest median family income of $70,000, accounting for 14.9% and 12.2% of families, respectively.
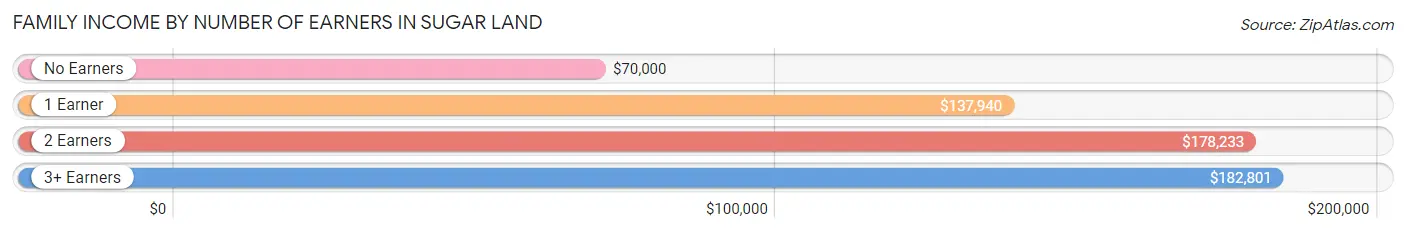
| Number of Earners | # Families | Median Income |
| No Earners | 3,640 (12.2%) | $70,000 |
| 1 Earner | 8,624 (28.9%) | $137,940 |
| 2 Earners | 13,157 (44.1%) | $178,233 |
| 3+ Earners | 4,446 (14.9%) | $182,801 |
| Total | 29,867 (100.0%) | $154,209 |
Household Income in Sugar Land
Household Income Brackets in Sugar Land
With 10,645 households falling in the category, the $200,000+ income range is the most frequent in Sugar Land, accounting for 28.4% of all households. In contrast, only 412 households (1.1%) fall into the $10,000 to $14,999 income bracket, making it the least populous group.
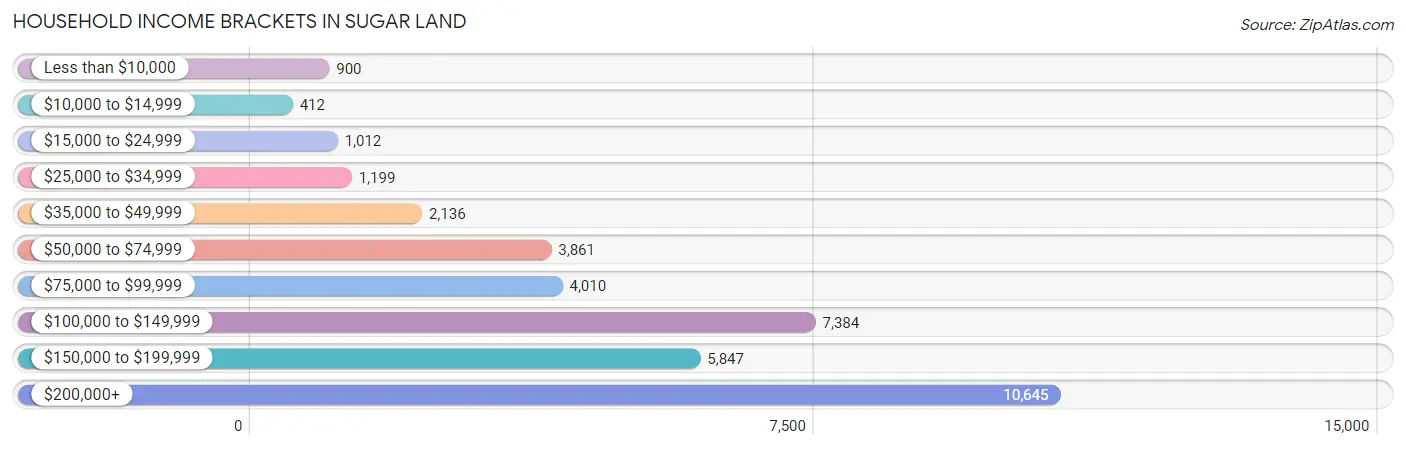
| Income Bracket | # Households | % Households |
| Less than $10,000 | 900 | 2.4% |
| $10,000 to $14,999 | 412 | 1.1% |
| $15,000 to $24,999 | 1,012 | 2.7% |
| $25,000 to $34,999 | 1,199 | 3.2% |
| $35,000 to $49,999 | 2,136 | 5.7% |
| $50,000 to $74,999 | 3,861 | 10.3% |
| $75,000 to $99,999 | 4,010 | 10.7% |
| $100,000 to $149,999 | 7,384 | 19.7% |
| $150,000 to $199,999 | 5,847 | 15.6% |
| $200,000+ | 10,645 | 28.4% |
Household Income by Householder Age in Sugar Land
The median household income in Sugar Land is $132,247, with the highest median household income of $153,907 found in the 45 to 64 years age bracket for the primary householder. A total of 16,429 households (43.8%) fall into this category. Meanwhile, the 15 to 24 years age bracket for the primary householder has the lowest median household income of $63,393, with 405 households (1.1%) in this group.
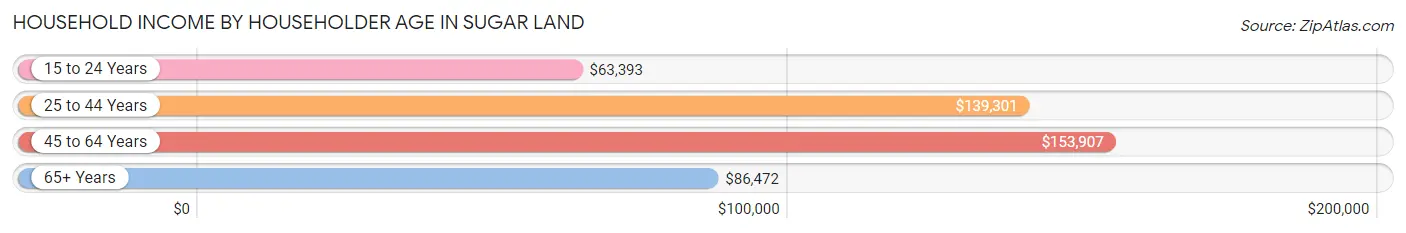
| Income Bracket | # Households | Median Income |
| 15 to 24 Years | 405 (1.1%) | $63,393 |
| 25 to 44 Years | 10,144 (27.1%) | $139,301 |
| 45 to 64 Years | 16,429 (43.8%) | $153,907 |
| 65+ Years | 10,503 (28.0%) | $86,472 |
| Total | 37,481 (100.0%) | $132,247 |
Poverty in Sugar Land
Income Below Poverty by Sex and Age in Sugar Land
With 4.7% poverty level for males and 4.4% for females among the residents of Sugar Land, 35 to 44 year old males and 75 year old and over females are the most vulnerable to poverty, with 553 males (8.1%) and 263 females (8.0%) in their respective age groups living below the poverty level.
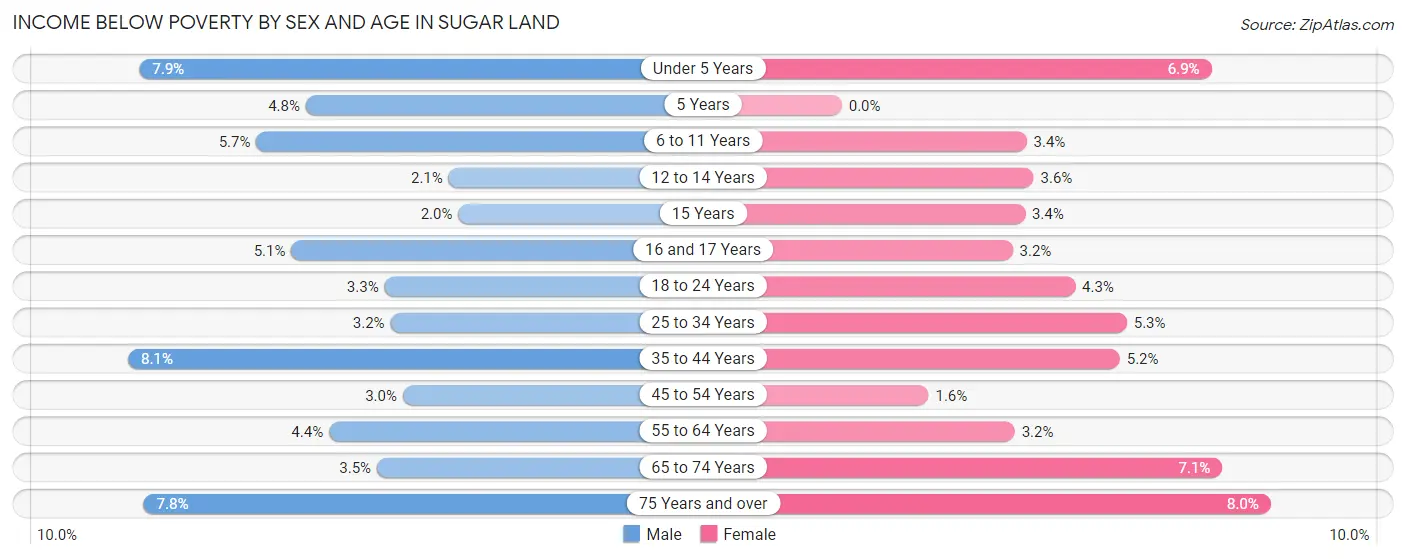
| Age Bracket | Male | Female |
| Under 5 Years | 171 (7.9%) | 150 (6.9%) |
| 5 Years | 36 (4.8%) | 0 (0.0%) |
| 6 to 11 Years | 242 (5.7%) | 140 (3.4%) |
| 12 to 14 Years | 52 (2.1%) | 93 (3.6%) |
| 15 Years | 25 (1.9%) | 26 (3.4%) |
| 16 and 17 Years | 107 (5.1%) | 44 (3.2%) |
| 18 to 24 Years | 123 (3.3%) | 218 (4.3%) |
| 25 to 34 Years | 170 (3.2%) | 286 (5.3%) |
| 35 to 44 Years | 553 (8.1%) | 381 (5.2%) |
| 45 to 54 Years | 239 (3.0%) | 134 (1.6%) |
| 55 to 64 Years | 314 (4.3%) | 256 (3.2%) |
| 65 to 74 Years | 220 (3.5%) | 485 (7.1%) |
| 75 Years and over | 255 (7.8%) | 263 (8.0%) |
| Total | 2,507 (4.7%) | 2,476 (4.4%) |
Income Above Poverty by Sex and Age in Sugar Land
According to the poverty statistics in Sugar Land, males aged 15 years and females aged 5 years are the age groups that are most secure financially, with 98.1% of males and 100.0% of females in these age groups living above the poverty line.
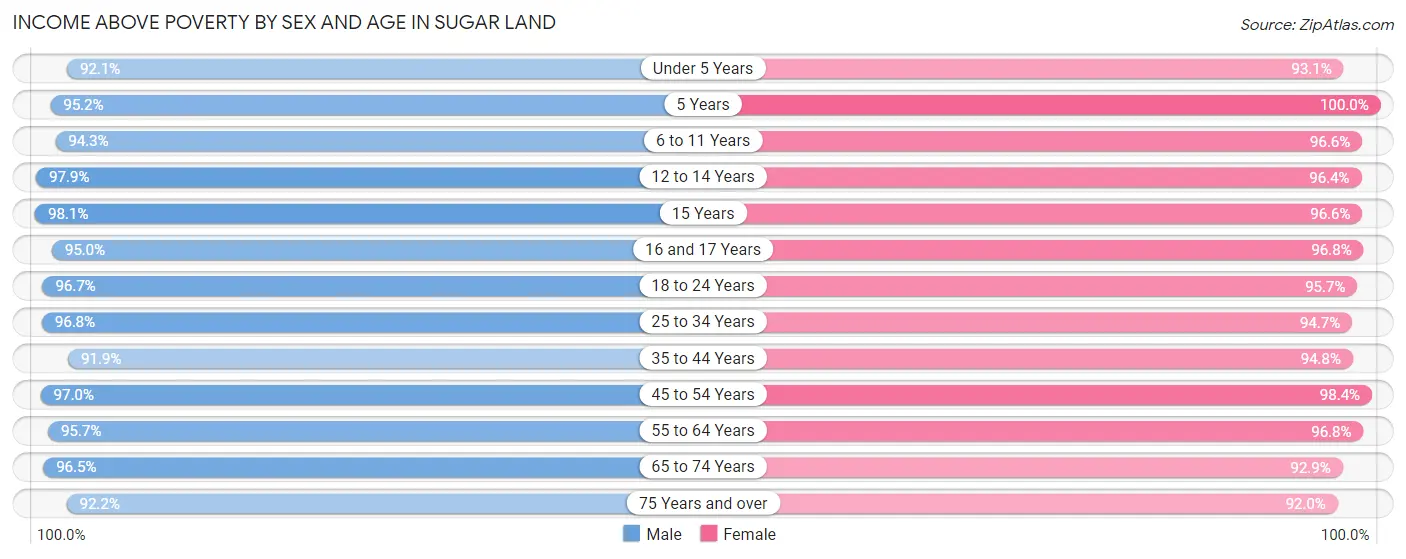
| Age Bracket | Male | Female |
| Under 5 Years | 2,002 (92.1%) | 2,035 (93.1%) |
| 5 Years | 717 (95.2%) | 486 (100.0%) |
| 6 to 11 Years | 4,006 (94.3%) | 3,944 (96.6%) |
| 12 to 14 Years | 2,392 (97.9%) | 2,517 (96.4%) |
| 15 Years | 1,260 (98.1%) | 738 (96.6%) |
| 16 and 17 Years | 2,012 (95.0%) | 1,342 (96.8%) |
| 18 to 24 Years | 3,581 (96.7%) | 4,811 (95.7%) |
| 25 to 34 Years | 5,131 (96.8%) | 5,123 (94.7%) |
| 35 to 44 Years | 6,291 (91.9%) | 7,005 (94.8%) |
| 45 to 54 Years | 7,778 (97.0%) | 8,205 (98.4%) |
| 55 to 64 Years | 6,901 (95.7%) | 7,711 (96.8%) |
| 65 to 74 Years | 6,140 (96.5%) | 6,385 (92.9%) |
| 75 Years and over | 3,017 (92.2%) | 3,041 (92.0%) |
| Total | 51,228 (95.3%) | 53,343 (95.6%) |
Income Below Poverty Among Married-Couple Families in Sugar Land
The poverty statistics for married-couple families in Sugar Land show that 3.6% or 941 of the total 26,356 families live below the poverty line. Families with 3 or 4 children have the highest poverty rate of 5.3%, comprising of 81 families. On the other hand, families with 5 or more children have the lowest poverty rate of 0.0%, which includes 0 families.
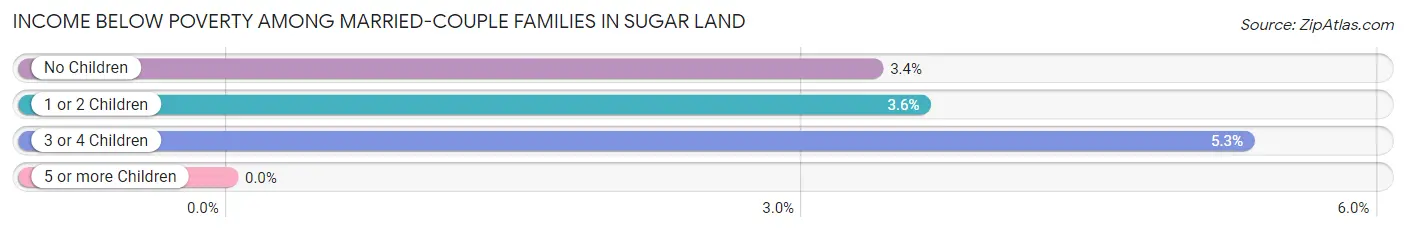
| Children | Above Poverty | Below Poverty |
| No Children | 13,903 (96.6%) | 485 (3.4%) |
| 1 or 2 Children | 9,989 (96.4%) | 375 (3.6%) |
| 3 or 4 Children | 1,443 (94.7%) | 81 (5.3%) |
| 5 or more Children | 80 (100.0%) | 0 (0.0%) |
| Total | 25,415 (96.4%) | 941 (3.6%) |
Income Below Poverty Among Single-Parent Households in Sugar Land
According to the poverty data in Sugar Land, 1.8% or 16 single-father households and 4.6% or 121 single-mother households are living below the poverty line. Among single-father households, those with 1 or 2 children have the highest poverty rate, with 16 households (4.0%) experiencing poverty. Likewise, among single-mother households, those with 3 or 4 children have the highest poverty rate, with 21 households (28.0%) falling below the poverty line.
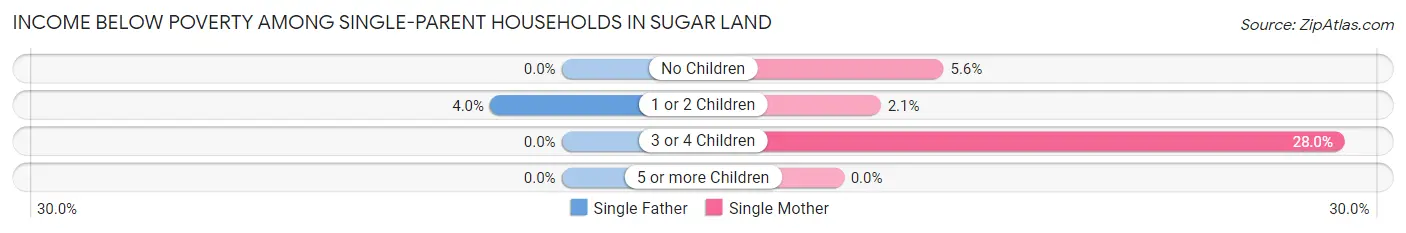
| Children | Single Father | Single Mother |
| No Children | 0 (0.0%) | 76 (5.6%) |
| 1 or 2 Children | 16 (4.0%) | 24 (2.1%) |
| 3 or 4 Children | 0 (0.0%) | 21 (28.0%) |
| 5 or more Children | 0 (0.0%) | 0 (0.0%) |
| Total | 16 (1.8%) | 121 (4.6%) |
Income Below Poverty Among Married-Couple vs Single-Parent Households in Sugar Land
The poverty data for Sugar Land shows that 941 of the married-couple family households (3.6%) and 137 of the single-parent households (3.9%) are living below the poverty level. Within the married-couple family households, those with 3 or 4 children have the highest poverty rate, with 81 households (5.3%) falling below the poverty line. Among the single-parent households, those with 3 or 4 children have the highest poverty rate, with 21 household (19.1%) living below poverty.
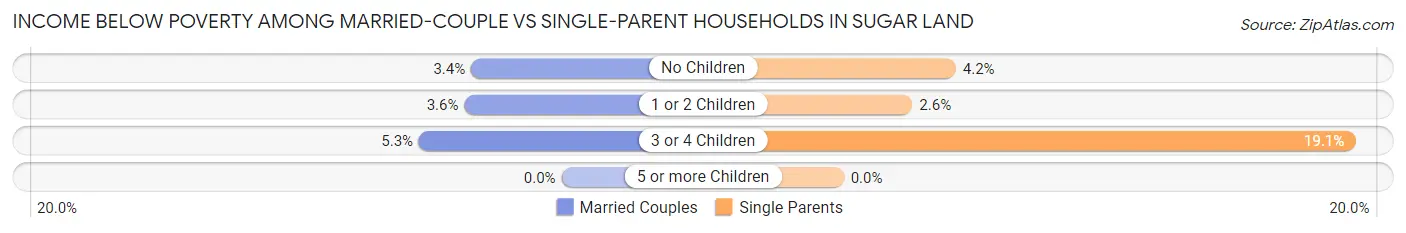
| Children | Married-Couple Families | Single-Parent Households |
| No Children | 485 (3.4%) | 76 (4.2%) |
| 1 or 2 Children | 375 (3.6%) | 40 (2.6%) |
| 3 or 4 Children | 81 (5.3%) | 21 (19.1%) |
| 5 or more Children | 0 (0.0%) | 0 (0.0%) |
| Total | 941 (3.6%) | 137 (3.9%) |
Race in Sugar Land
The most populous races in Sugar Land are White / Caucasian (48,729 | 44.3%), Asian (42,328 | 38.5%), and Hispanic or Latino (14,349 | 13.0%).
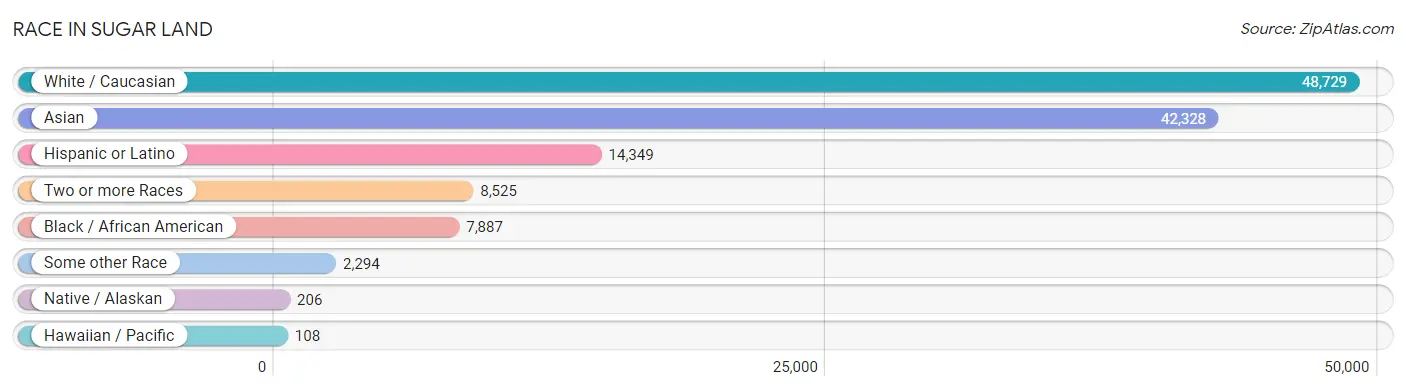
| Race | # Population | % Population |
| Asian | 42,328 | 38.5% |
| Black / African American | 7,887 | 7.2% |
| Hawaiian / Pacific | 108 | 0.1% |
| Hispanic or Latino | 14,349 | 13.0% |
| Native / Alaskan | 206 | 0.2% |
| White / Caucasian | 48,729 | 44.3% |
| Two or more Races | 8,525 | 7.7% |
| Some other Race | 2,294 | 2.1% |
| Total | 110,077 | 100.0% |
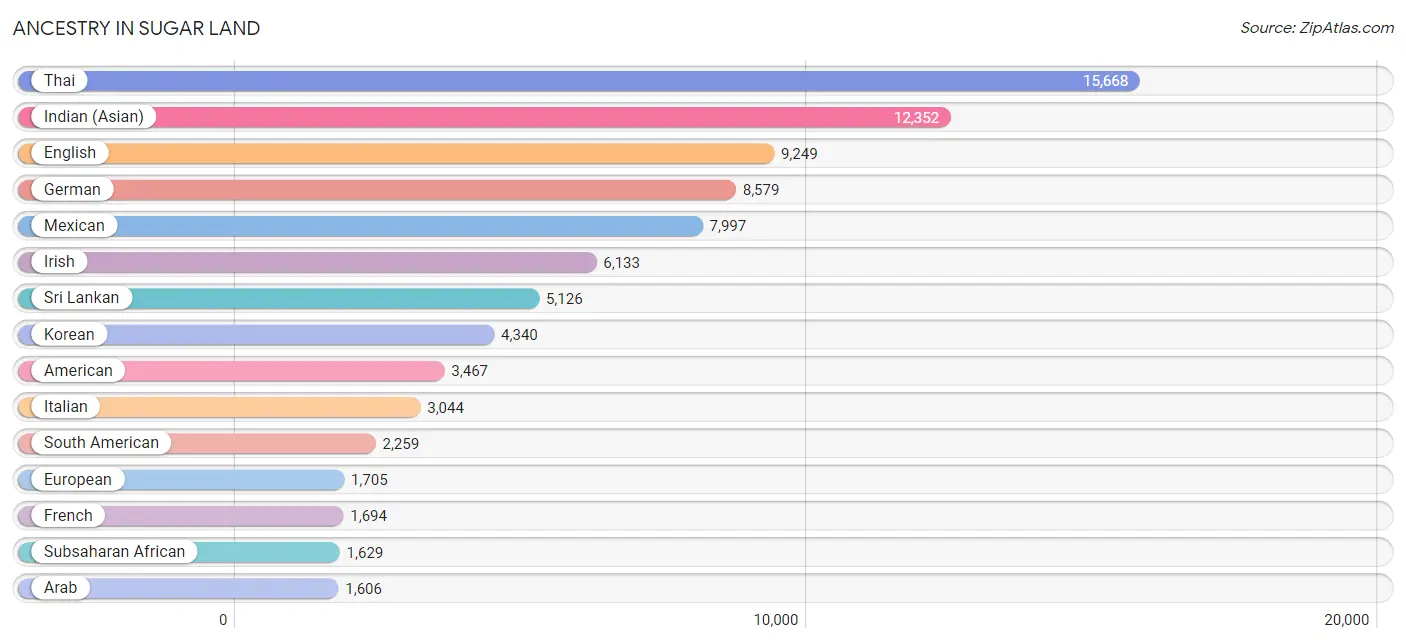
Ancestry in Sugar Land
The most populous ancestries reported in Sugar Land are Thai (15,668 | 14.2%), Indian (Asian) (12,352 | 11.2%), English (9,249 | 8.4%), German (8,579 | 7.8%), and Mexican (7,997 | 7.3%), together accounting for 48.9% of all Sugar Land residents.
| Ancestry | # Population | % Population |
| African | 442 | 0.4% |
| American | 3,467 | 3.2% |
| Arab | 1,606 | 1.5% |
| Argentinean | 255 | 0.2% |
| Armenian | 92 | 0.1% |
| Australian | 13 | 0.0% |
| Austrian | 263 | 0.2% |
| Belgian | 71 | 0.1% |
| Bhutanese | 378 | 0.3% |
| Bolivian | 32 | 0.0% |
| Brazilian | 265 | 0.2% |
| British | 596 | 0.5% |
| British West Indian | 27 | 0.0% |
| Bulgarian | 95 | 0.1% |
| Burmese | 385 | 0.4% |
| Cajun | 61 | 0.1% |
| Cambodian | 28 | 0.0% |
| Canadian | 254 | 0.2% |
| Celtic | 5 | 0.0% |
| Central American | 913 | 0.8% |
| Central American Indian | 104 | 0.1% |
| Cherokee | 248 | 0.2% |
| Chilean | 56 | 0.1% |
| Choctaw | 55 | 0.1% |
| Colombian | 641 | 0.6% |
| Comanche | 50 | 0.1% |
| Costa Rican | 20 | 0.0% |
| Creek | 9 | 0.0% |
| Croatian | 85 | 0.1% |
| Cuban | 291 | 0.3% |
| Czech | 1,121 | 1.0% |
| Czechoslovakian | 169 | 0.2% |
| Danish | 178 | 0.2% |
| Dutch | 923 | 0.8% |
| Eastern European | 250 | 0.2% |
| Ecuadorian | 72 | 0.1% |
| Egyptian | 316 | 0.3% |
| English | 9,249 | 8.4% |
| Ethiopian | 268 | 0.2% |
| European | 1,705 | 1.5% |
| Filipino | 1,051 | 0.9% |
| Finnish | 38 | 0.0% |
| French | 1,694 | 1.5% |
| French Canadian | 366 | 0.3% |
| German | 8,579 | 7.8% |
| German Russian | 86 | 0.1% |
| Ghanaian | 42 | 0.0% |
| Greek | 302 | 0.3% |
| Guamanian / Chamorro | 5 | 0.0% |
| Guatemalan | 90 | 0.1% |
| Haitian | 35 | 0.0% |
| Hmong | 28 | 0.0% |
| Honduran | 122 | 0.1% |
| Hopi | 28 | 0.0% |
| Hungarian | 211 | 0.2% |
| Indian (Asian) | 12,352 | 11.2% |
| Iranian | 408 | 0.4% |
| Irish | 6,133 | 5.6% |
| Italian | 3,044 | 2.8% |
| Jamaican | 185 | 0.2% |
| Japanese | 72 | 0.1% |
| Jordanian | 129 | 0.1% |
| Kenyan | 12 | 0.0% |
| Korean | 4,340 | 3.9% |
| Laotian | 289 | 0.3% |
| Lebanese | 534 | 0.5% |
| Lithuanian | 92 | 0.1% |
| Mexican | 7,997 | 7.3% |
| Mexican American Indian | 6 | 0.0% |
| Mongolian | 142 | 0.1% |
| Moroccan | 21 | 0.0% |
| Native Hawaiian | 85 | 0.1% |
| Navajo | 288 | 0.3% |
| Nicaraguan | 74 | 0.1% |
| Nigerian | 629 | 0.6% |
| Northern European | 77 | 0.1% |
| Norwegian | 514 | 0.5% |
| Osage | 22 | 0.0% |
| Pakistani | 155 | 0.1% |
| Palestinian | 15 | 0.0% |
| Panamanian | 71 | 0.1% |
| Peruvian | 345 | 0.3% |
| Polish | 1,338 | 1.2% |
| Portuguese | 206 | 0.2% |
| Pueblo | 15 | 0.0% |
| Puerto Rican | 438 | 0.4% |
| Romanian | 249 | 0.2% |
| Russian | 788 | 0.7% |
| Salvadoran | 536 | 0.5% |
| Scandinavian | 96 | 0.1% |
| Scotch-Irish | 538 | 0.5% |
| Scottish | 1,242 | 1.1% |
| Seminole | 13 | 0.0% |
| Serbian | 15 | 0.0% |
| Slovak | 96 | 0.1% |
| Somali | 10 | 0.0% |
| South American | 2,259 | 2.1% |
| South American Indian | 61 | 0.1% |
| Spaniard | 831 | 0.7% |
| Spanish | 865 | 0.8% |
| Spanish American | 5 | 0.0% |
| Sri Lankan | 5,126 | 4.7% |
| Subsaharan African | 1,629 | 1.5% |
| Sudanese | 126 | 0.1% |
| Swedish | 604 | 0.5% |
| Swiss | 144 | 0.1% |
| Syrian | 105 | 0.1% |
| Thai | 15,668 | 14.2% |
| Trinidadian and Tobagonian | 19 | 0.0% |
| Turkish | 818 | 0.7% |
| Ukrainian | 36 | 0.0% |
| Venezuelan | 858 | 0.8% |
| Vietnamese | 142 | 0.1% |
| Welsh | 443 | 0.4% |
| West Indian | 27 | 0.0% |
| Yaqui | 14 | 0.0% |
| Yugoslavian | 1 | 0.0% |
| Zimbabwean | 44 | 0.0% | View All 118 Rows |
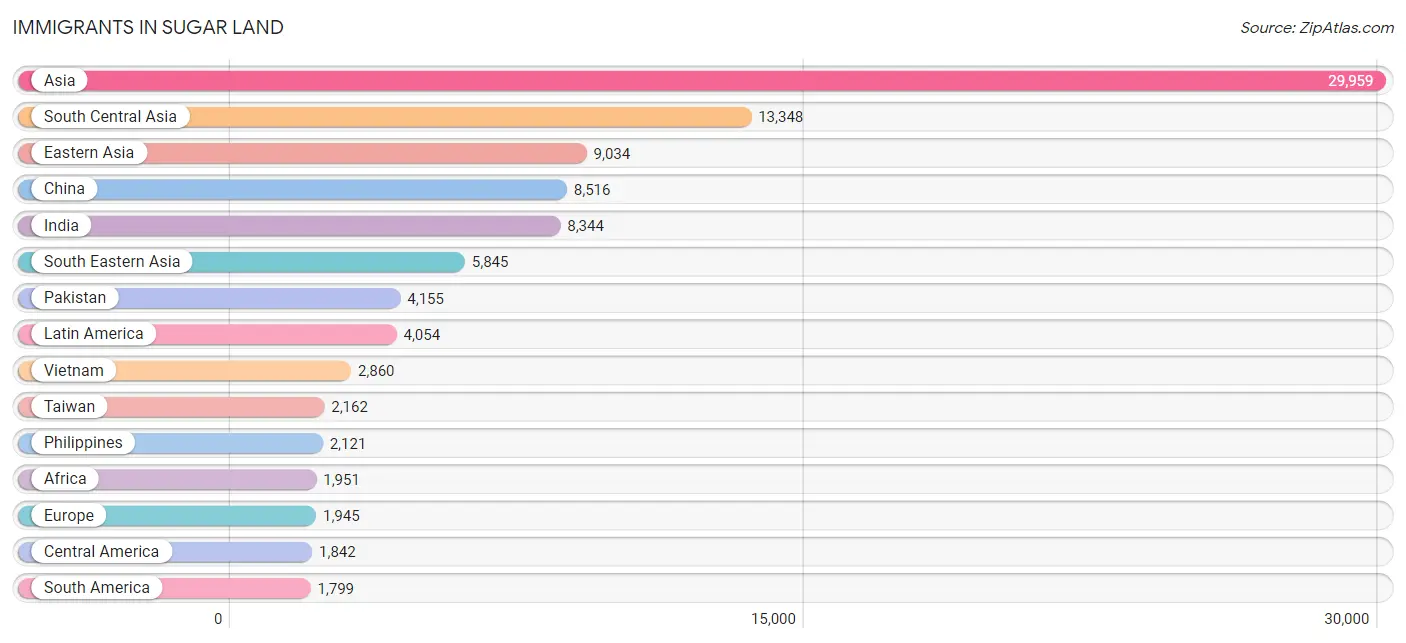
Immigrants in Sugar Land
The most numerous immigrant groups reported in Sugar Land came from Asia (29,959 | 27.2%), South Central Asia (13,348 | 12.1%), Eastern Asia (9,034 | 8.2%), China (8,516 | 7.7%), and India (8,344 | 7.6%), together accounting for 62.9% of all Sugar Land residents.
| Immigration Origin | # Population | % Population |
| Afghanistan | 27 | 0.0% |
| Africa | 1,951 | 1.8% |
| Argentina | 180 | 0.2% |
| Armenia | 43 | 0.0% |
| Asia | 29,959 | 27.2% |
| Australia | 49 | 0.0% |
| Austria | 14 | 0.0% |
| Bangladesh | 96 | 0.1% |
| Belgium | 16 | 0.0% |
| Bolivia | 25 | 0.0% |
| Brazil | 350 | 0.3% |
| Bulgaria | 3 | 0.0% |
| Cambodia | 87 | 0.1% |
| Canada | 731 | 0.7% |
| Caribbean | 413 | 0.4% |
| Central America | 1,842 | 1.7% |
| Chile | 56 | 0.1% |
| China | 8,516 | 7.7% |
| Colombia | 330 | 0.3% |
| Costa Rica | 20 | 0.0% |
| Croatia | 21 | 0.0% |
| Cuba | 213 | 0.2% |
| Denmark | 44 | 0.0% |
| Eastern Africa | 384 | 0.4% |
| Eastern Asia | 9,034 | 8.2% |
| Eastern Europe | 530 | 0.5% |
| Ecuador | 42 | 0.0% |
| Egypt | 292 | 0.3% |
| El Salvador | 232 | 0.2% |
| England | 85 | 0.1% |
| Eritrea | 110 | 0.1% |
| Ethiopia | 38 | 0.0% |
| Europe | 1,945 | 1.8% |
| Fiji | 15 | 0.0% |
| France | 31 | 0.0% |
| Germany | 78 | 0.1% |
| Ghana | 120 | 0.1% |
| Greece | 64 | 0.1% |
| Grenada | 27 | 0.0% |
| Guatemala | 85 | 0.1% |
| Honduras | 118 | 0.1% |
| Hong Kong | 663 | 0.6% |
| Hungary | 17 | 0.0% |
| India | 8,344 | 7.6% |
| Indonesia | 323 | 0.3% |
| Iran | 514 | 0.5% |
| Iraq | 47 | 0.0% |
| Ireland | 8 | 0.0% |
| Israel | 129 | 0.1% |
| Italy | 270 | 0.3% |
| Jamaica | 146 | 0.1% |
| Japan | 267 | 0.2% |
| Jordan | 147 | 0.1% |
| Kazakhstan | 134 | 0.1% |
| Kenya | 59 | 0.1% |
| Korea | 166 | 0.2% |
| Kuwait | 25 | 0.0% |
| Latin America | 4,054 | 3.7% |
| Latvia | 30 | 0.0% |
| Lebanon | 208 | 0.2% |
| Liberia | 30 | 0.0% |
| Malaysia | 313 | 0.3% |
| Mexico | 1,360 | 1.2% |
| Micronesia | 78 | 0.1% |
| Middle Africa | 11 | 0.0% |
| Morocco | 21 | 0.0% |
| Nepal | 18 | 0.0% |
| Netherlands | 9 | 0.0% |
| Nicaragua | 14 | 0.0% |
| Nigeria | 740 | 0.7% |
| Northern Africa | 547 | 0.5% |
| Northern Europe | 838 | 0.8% |
| Norway | 29 | 0.0% |
| Oceania | 150 | 0.1% |
| Pakistan | 4,155 | 3.8% |
| Panama | 13 | 0.0% |
| Peru | 147 | 0.1% |
| Philippines | 2,121 | 1.9% |
| Poland | 75 | 0.1% |
| Portugal | 47 | 0.0% |
| Romania | 27 | 0.0% |
| Russia | 238 | 0.2% |
| Saudi Arabia | 124 | 0.1% |
| Scotland | 14 | 0.0% |
| Senegal | 24 | 0.0% |
| Sierra Leone | 70 | 0.1% |
| Singapore | 24 | 0.0% |
| Somalia | 14 | 0.0% |
| South America | 1,799 | 1.6% |
| South Central Asia | 13,348 | 12.1% |
| South Eastern Asia | 5,845 | 5.3% |
| Southern Europe | 418 | 0.4% |
| Spain | 37 | 0.0% |
| Sri Lanka | 60 | 0.1% |
| Sudan | 35 | 0.0% |
| Sweden | 192 | 0.2% |
| Switzerland | 11 | 0.0% |
| Syria | 33 | 0.0% |
| Taiwan | 2,162 | 2.0% |
| Thailand | 117 | 0.1% |
| Trinidad and Tobago | 27 | 0.0% |
| Turkey | 678 | 0.6% |
| Uganda | 79 | 0.1% |
| Ukraine | 55 | 0.1% |
| Uruguay | 11 | 0.0% |
| Venezuela | 642 | 0.6% |
| Vietnam | 2,860 | 2.6% |
| Western Africa | 984 | 0.9% |
| Western Asia | 1,605 | 1.5% |
| Western Europe | 159 | 0.1% |
| Yemen | 14 | 0.0% |
| Zimbabwe | 44 | 0.0% | View All 112 Rows |
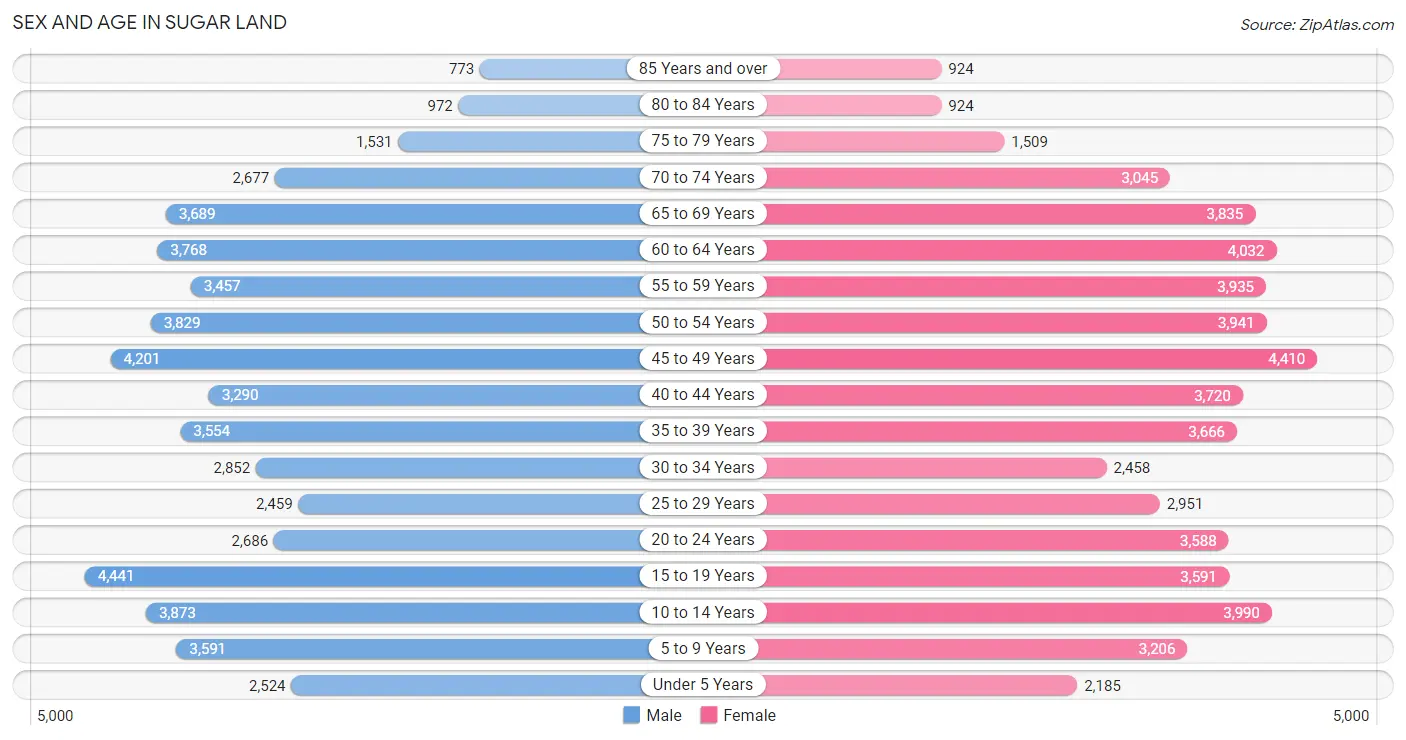
Sex and Age in Sugar Land
Sex and Age in Sugar Land
The most populous age groups in Sugar Land are 15 to 19 Years (4,441 | 8.2%) for men and 45 to 49 Years (4,410 | 7.9%) for women.
| Age Bracket | Male | Female |
| Under 5 Years | 2,524 (4.7%) | 2,185 (3.9%) |
| 5 to 9 Years | 3,591 (6.6%) | 3,206 (5.7%) |
| 10 to 14 Years | 3,873 (7.1%) | 3,990 (7.1%) |
| 15 to 19 Years | 4,441 (8.2%) | 3,591 (6.4%) |
| 20 to 24 Years | 2,686 (5.0%) | 3,588 (6.4%) |
| 25 to 29 Years | 2,459 (4.5%) | 2,951 (5.3%) |
| 30 to 34 Years | 2,852 (5.3%) | 2,458 (4.4%) |
| 35 to 39 Years | 3,554 (6.6%) | 3,666 (6.6%) |
| 40 to 44 Years | 3,290 (6.1%) | 3,720 (6.7%) |
| 45 to 49 Years | 4,201 (7.8%) | 4,410 (7.9%) |
| 50 to 54 Years | 3,829 (7.1%) | 3,941 (7.0%) |
| 55 to 59 Years | 3,457 (6.4%) | 3,935 (7.0%) |
| 60 to 64 Years | 3,768 (7.0%) | 4,032 (7.2%) |
| 65 to 69 Years | 3,689 (6.8%) | 3,835 (6.9%) |
| 70 to 74 Years | 2,677 (4.9%) | 3,045 (5.4%) |
| 75 to 79 Years | 1,531 (2.8%) | 1,509 (2.7%) |
| 80 to 84 Years | 972 (1.8%) | 924 (1.7%) |
| 85 Years and over | 773 (1.4%) | 924 (1.7%) |
| Total | 54,167 (100.0%) | 55,910 (100.0%) |
Families and Households in Sugar Land
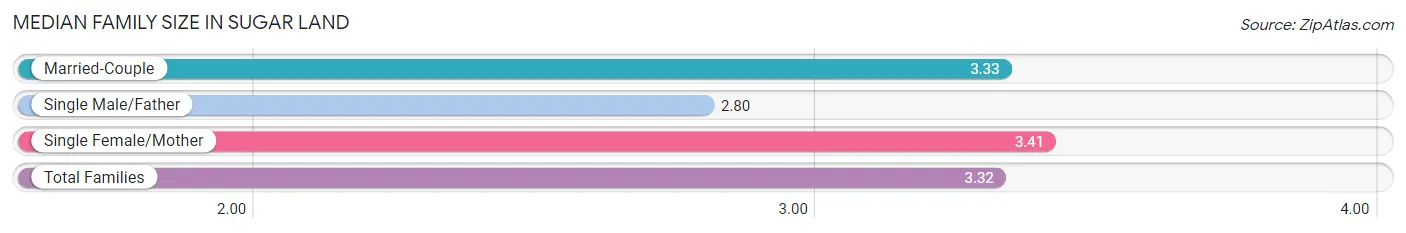
Median Family Size in Sugar Land
The median family size in Sugar Land is 3.32 persons per family, with single female/mother families (2,621 | 8.8%) accounting for the largest median family size of 3.41 persons per family. On the other hand, single male/father families (890 | 3.0%) represent the smallest median family size with 2.80 persons per family.
| Family Type | # Families | Family Size |
| Married-Couple | 26,356 (88.2%) | 3.33 |
| Single Male/Father | 890 (3.0%) | 2.80 |
| Single Female/Mother | 2,621 (8.8%) | 3.41 |
| Total Families | 29,867 (100.0%) | 3.32 |
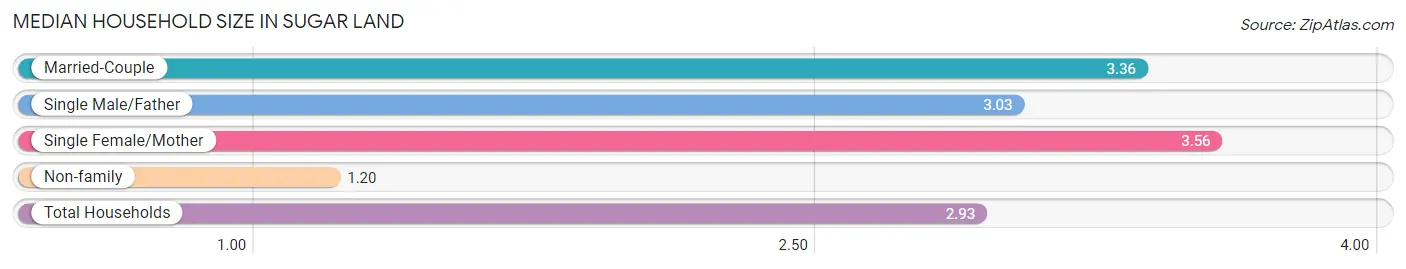
Median Household Size in Sugar Land
The median household size in Sugar Land is 2.93 persons per household, with single female/mother households (2,621 | 7.0%) accounting for the largest median household size of 3.56 persons per household. non-family households (7,614 | 20.3%) represent the smallest median household size with 1.20 persons per household.
| Household Type | # Households | Household Size |
| Married-Couple | 26,356 (70.3%) | 3.36 |
| Single Male/Father | 890 (2.4%) | 3.03 |
| Single Female/Mother | 2,621 (7.0%) | 3.56 |
| Non-family | 7,614 (20.3%) | 1.20 |
| Total Households | 37,481 (100.0%) | 2.93 |
Household Size by Marriage Status in Sugar Land
Out of a total of 37,481 households in Sugar Land, 29,867 (79.7%) are family households, while 7,614 (20.3%) are nonfamily households. The most numerous type of family households are 2-person households, comprising 11,256, and the most common type of nonfamily households are 1-person households, comprising 6,228.
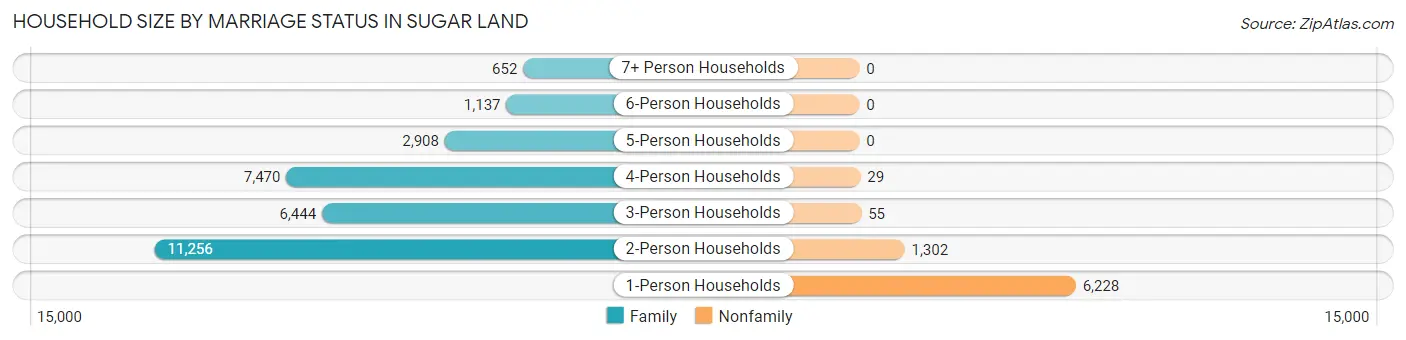
| Household Size | Family Households | Nonfamily Households |
| 1-Person Households | - | 6,228 (16.6%) |
| 2-Person Households | 11,256 (30.0%) | 1,302 (3.5%) |
| 3-Person Households | 6,444 (17.2%) | 55 (0.2%) |
| 4-Person Households | 7,470 (19.9%) | 29 (0.1%) |
| 5-Person Households | 2,908 (7.8%) | 0 (0.0%) |
| 6-Person Households | 1,137 (3.0%) | 0 (0.0%) |
| 7+ Person Households | 652 (1.7%) | 0 (0.0%) |
| Total | 29,867 (79.7%) | 7,614 (20.3%) |
Female Fertility in Sugar Land
Fertility by Age in Sugar Land
Average fertility rate in Sugar Land is 30.0 births per 1,000 women. Women in the age bracket of 20 to 34 years have the highest fertility rate with 37.0 births per 1,000 women. Women in the age bracket of 35 to 50 years acount for 54.8% of all women with births.
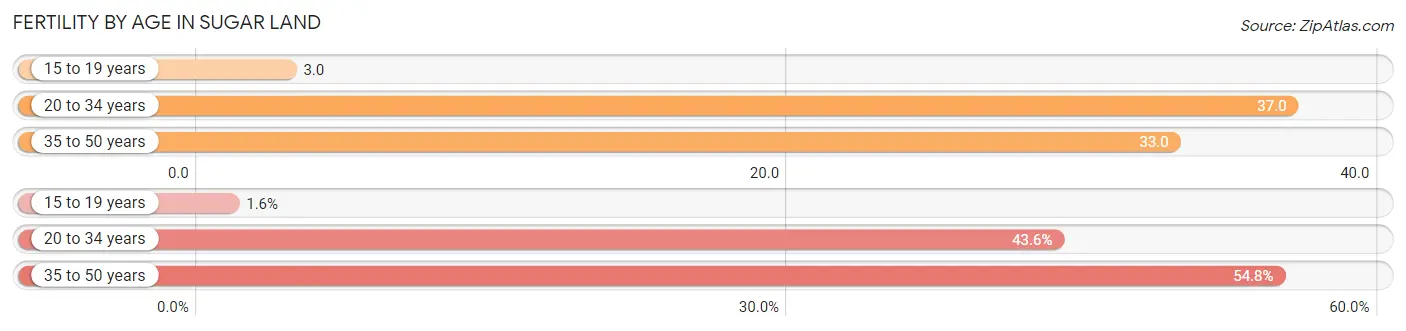
| Age Bracket | Women with Births | Births / 1,000 Women |
| 15 to 19 years | 12 (1.6%) | 3.0 |
| 20 to 34 years | 329 (43.6%) | 37.0 |
| 35 to 50 years | 414 (54.8%) | 33.0 |
| Total | 755 (100.0%) | 30.0 |
Fertility by Age by Marriage Status in Sugar Land
93.9% of women with births (755) in Sugar Land are married. The highest percentage of unmarried women with births falls into 15 to 19 years age bracket with 100.0% of them unmarried at the time of birth, while the lowest percentage of unmarried women with births belong to 35 to 50 years age bracket with 0.2% of them unmarried.
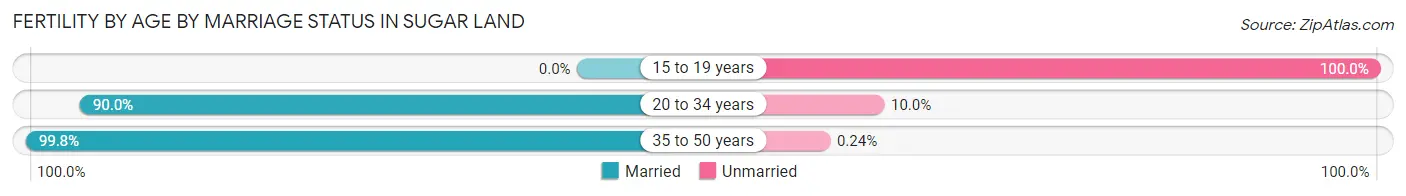
| Age Bracket | Married | Unmarried |
| 15 to 19 years | 0 (0.0%) | 12 (100.0%) |
| 20 to 34 years | 296 (90.0%) | 33 (10.0%) |
| 35 to 50 years | 413 (99.8%) | 1 (0.2%) |
| Total | 709 (93.9%) | 46 (6.1%) |
Fertility by Education in Sugar Land
Average fertility rate in Sugar Land is 30.0 births per 1,000 women. Women with the education attainment of college or associate's degree have the highest fertility rate of 49.0 births per 1,000 women, while women with the education attainment of less than high school have the lowest fertility at 4.0 births per 1,000 women. Women with the education attainment of college or associate's degree represent 32.9% of all women with births.
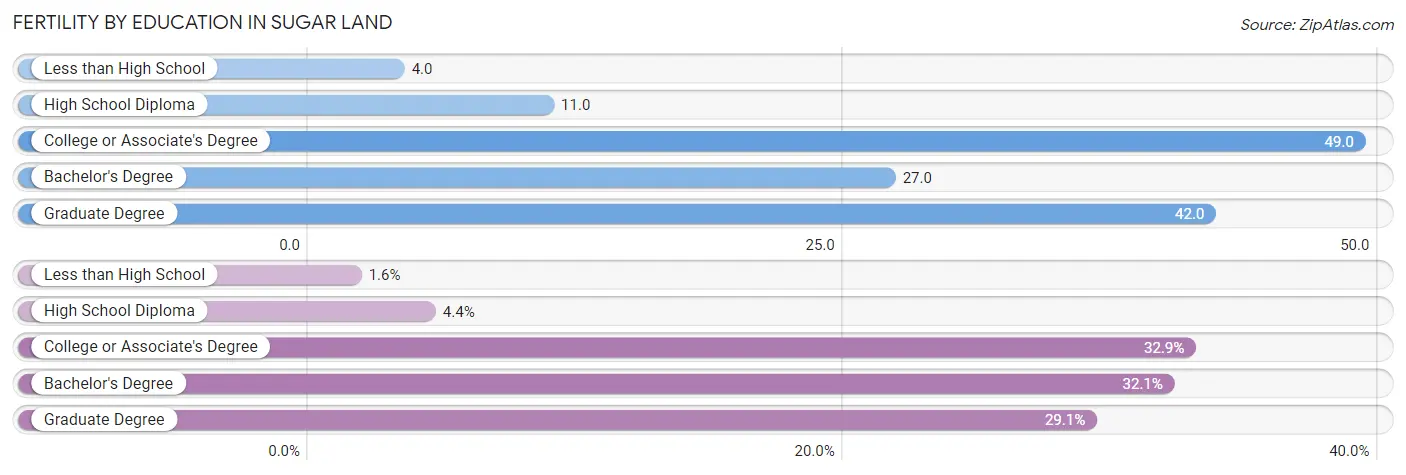
| Educational Attainment | Women with Births | Births / 1,000 Women |
| Less than High School | 12 (1.6%) | 4.0 |
| High School Diploma | 33 (4.4%) | 11.0 |
| College or Associate's Degree | 248 (32.9%) | 49.0 |
| Bachelor's Degree | 242 (32.1%) | 27.0 |
| Graduate Degree | 220 (29.1%) | 42.0 |
| Total | 755 (100.0%) | 30.0 |
Fertility by Education by Marriage Status in Sugar Land
6.1% of women with births in Sugar Land are unmarried. Women with the educational attainment of college or associate's degree are most likely to be married with 100.0% of them married at childbirth, while women with the educational attainment of less than high school are least likely to be married with 100.0% of them unmarried at childbirth.
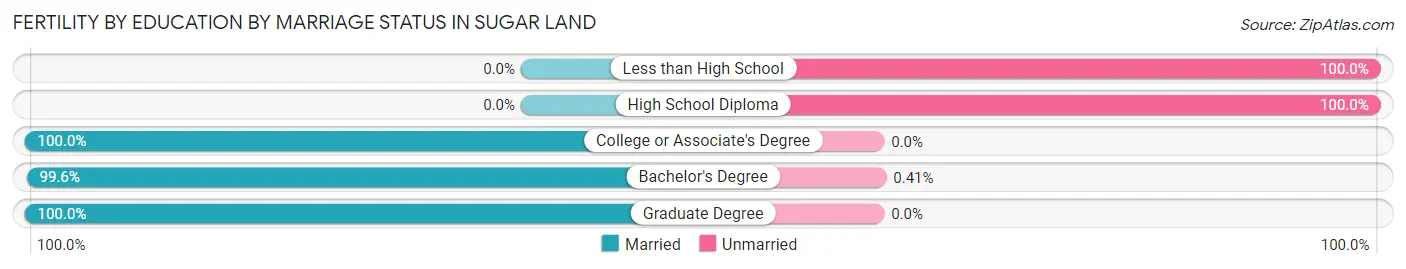
| Educational Attainment | Married | Unmarried |
| Less than High School | 0 (0.0%) | 12 (100.0%) |
| High School Diploma | 0 (0.0%) | 33 (100.0%) |
| College or Associate's Degree | 248 (100.0%) | 0 (0.0%) |
| Bachelor's Degree | 241 (99.6%) | 1 (0.4%) |
| Graduate Degree | 220 (100.0%) | 0 (0.0%) |
| Total | 709 (93.9%) | 46 (6.1%) |
Employment Characteristics in Sugar Land
Employment by Class of Employer in Sugar Land
Among the 53,070 employed individuals in Sugar Land, private company employees (36,474 | 68.7%), not-for-profit organizations (3,646 | 6.9%), and local government employees (3,584 | 6.8%) make up the most common classes of employment.
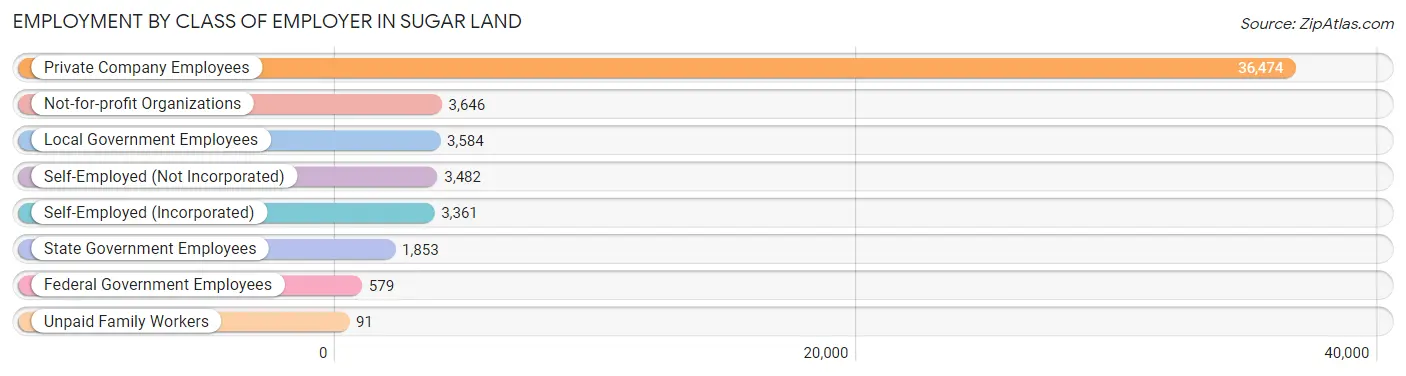
| Employer Class | # Employees | % Employees |
| Private Company Employees | 36,474 | 68.7% |
| Self-Employed (Incorporated) | 3,361 | 6.3% |
| Self-Employed (Not Incorporated) | 3,482 | 6.6% |
| Not-for-profit Organizations | 3,646 | 6.9% |
| Local Government Employees | 3,584 | 6.8% |
| State Government Employees | 1,853 | 3.5% |
| Federal Government Employees | 579 | 1.1% |
| Unpaid Family Workers | 91 | 0.2% |
| Total | 53,070 | 100.0% |
Employment Status by Age in Sugar Land
According to the labor force statistics for Sugar Land, out of the total population over 16 years of age (88,659), 63.8% or 56,564 individuals are in the labor force, with 5.0% or 2,828 of them unemployed. The age group with the highest labor force participation rate is 45 to 54 years, with 87.5% or 14,333 individuals in the labor force. Within the labor force, the 20 to 24 years age range has the highest percentage of unemployed individuals, with 9.9% or 450 of them being unemployed.
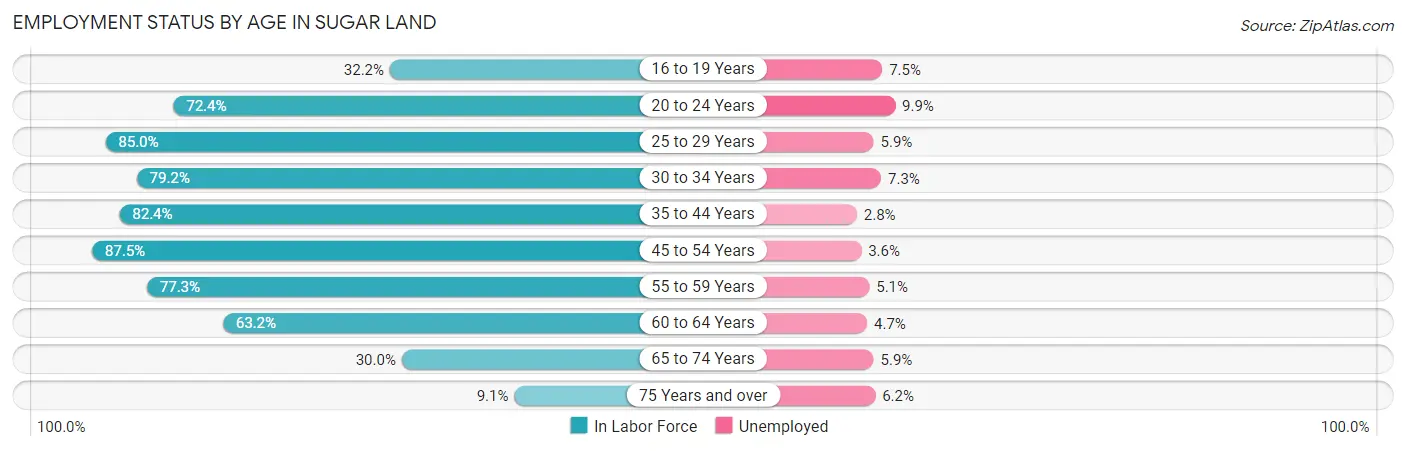
| Age Bracket | In Labor Force | Unemployed |
| 16 to 19 Years | 1,927 (32.2%) | 145 (7.5%) |
| 20 to 24 Years | 4,542 (72.4%) | 450 (9.9%) |
| 25 to 29 Years | 4,598 (85.0%) | 271 (5.9%) |
| 30 to 34 Years | 4,206 (79.2%) | 307 (7.3%) |
| 35 to 44 Years | 11,726 (82.4%) | 328 (2.8%) |
| 45 to 54 Years | 14,333 (87.5%) | 516 (3.6%) |
| 55 to 59 Years | 5,714 (77.3%) | 291 (5.1%) |
| 60 to 64 Years | 4,930 (63.2%) | 232 (4.7%) |
| 65 to 74 Years | 3,974 (30.0%) | 234 (5.9%) |
| 75 Years and over | 604 (9.1%) | 37 (6.2%) |
| Total | 56,564 (63.8%) | 2,828 (5.0%) |
Employment Status by Educational Attainment in Sugar Land
According to labor force statistics for Sugar Land, 80.5% of individuals (45,501) out of the total population between 25 and 64 years of age (56,523) are in the labor force, with 4.3% or 1,957 of them being unemployed. The group with the highest labor force participation rate are those with the educational attainment of bachelor's degree or higher, with 84.5% or 30,408 individuals in the labor force. Within the labor force, individuals with college / associate degree education have the highest percentage of unemployment, with 6.4% or 589 of them being unemployed.
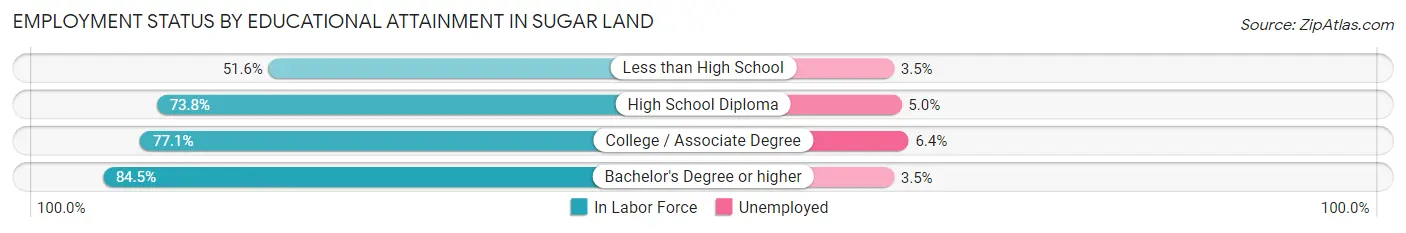
| Educational Attainment | In Labor Force | Unemployed |
| Less than High School | 1,081 (51.6%) | 73 (3.5%) |
| High School Diploma | 4,795 (73.8%) | 325 (5.0%) |
| College / Associate Degree | 9,210 (77.1%) | 764 (6.4%) |
| Bachelor's Degree or higher | 30,408 (84.5%) | 1,260 (3.5%) |
| Total | 45,501 (80.5%) | 2,430 (4.3%) |
Employment Occupations by Sex in Sugar Land
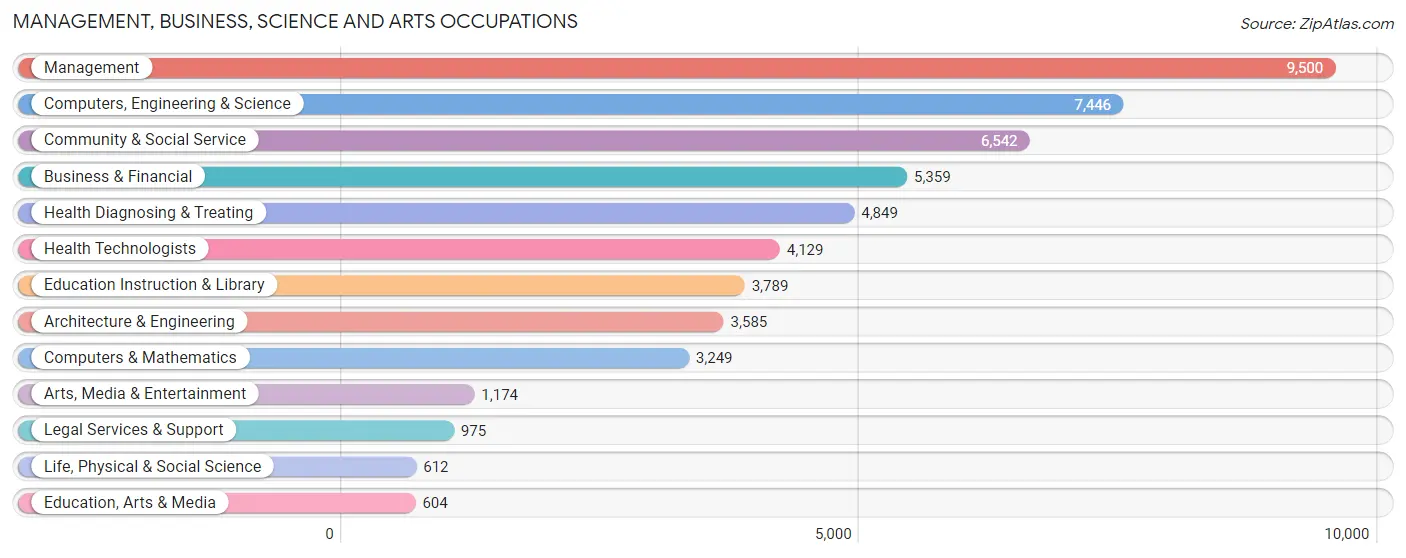
Management, Business, Science and Arts Occupations
The most common Management, Business, Science and Arts occupations in Sugar Land are Management (9,500 | 17.7%), Computers, Engineering & Science (7,446 | 13.9%), Community & Social Service (6,542 | 12.2%), Business & Financial (5,359 | 10.0%), and Health Diagnosing & Treating (4,849 | 9.0%).
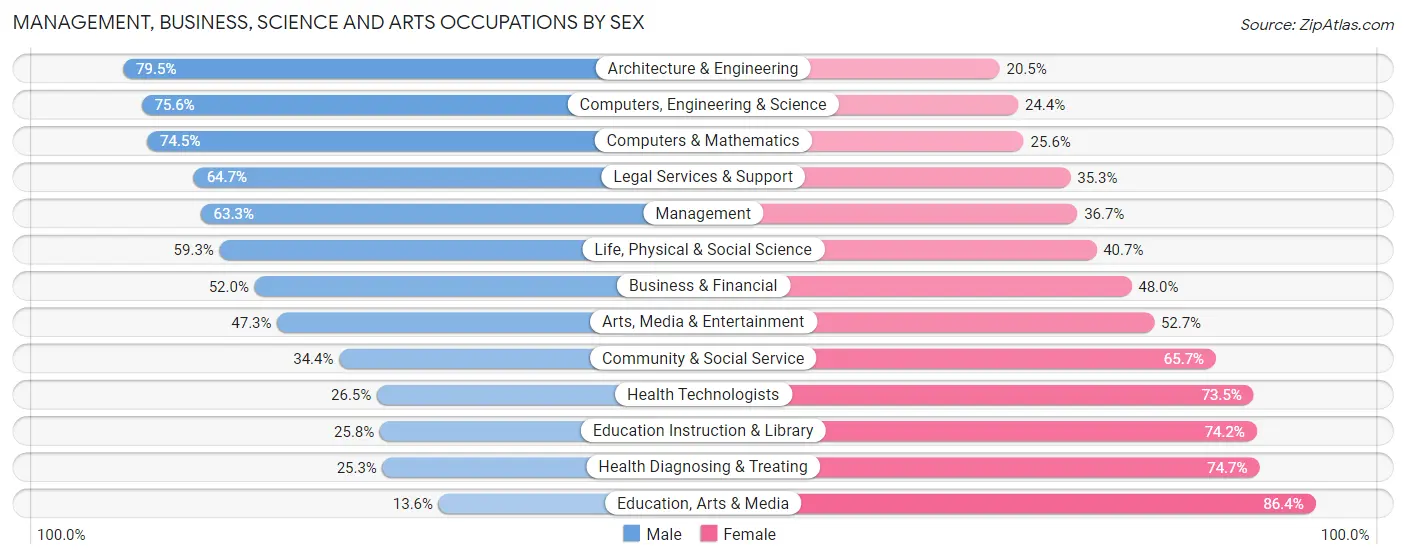
Management, Business, Science and Arts Occupations by Sex
Within the Management, Business, Science and Arts occupations in Sugar Land, the most male-oriented occupations are Architecture & Engineering (79.5%), Computers, Engineering & Science (75.6%), and Computers & Mathematics (74.5%), while the most female-oriented occupations are Education, Arts & Media (86.4%), Health Diagnosing & Treating (74.7%), and Education Instruction & Library (74.2%).
| Occupation | Male | Female |
| Management | 6,012 (63.3%) | 3,488 (36.7%) |
| Business & Financial | 2,786 (52.0%) | 2,573 (48.0%) |
| Computers, Engineering & Science | 5,631 (75.6%) | 1,815 (24.4%) |
| Computers & Mathematics | 2,419 (74.5%) | 830 (25.6%) |
| Architecture & Engineering | 2,849 (79.5%) | 736 (20.5%) |
| Life, Physical & Social Science | 363 (59.3%) | 249 (40.7%) |
| Community & Social Service | 2,247 (34.4%) | 4,295 (65.6%) |
| Education, Arts & Media | 82 (13.6%) | 522 (86.4%) |
| Legal Services & Support | 631 (64.7%) | 344 (35.3%) |
| Education Instruction & Library | 979 (25.8%) | 2,810 (74.2%) |
| Arts, Media & Entertainment | 555 (47.3%) | 619 (52.7%) |
| Health Diagnosing & Treating | 1,227 (25.3%) | 3,622 (74.7%) |
| Health Technologists | 1,093 (26.5%) | 3,036 (73.5%) |
| Total (Category) | 17,903 (53.1%) | 15,793 (46.9%) |
| Total (Overall) | 28,437 (52.9%) | 25,275 (47.1%) |
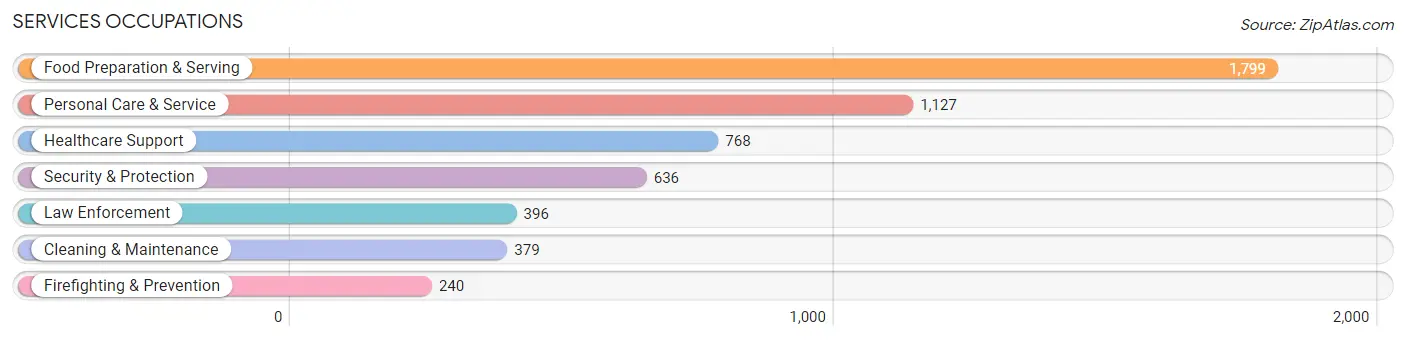
Services Occupations
The most common Services occupations in Sugar Land are Food Preparation & Serving (1,799 | 3.4%), Personal Care & Service (1,127 | 2.1%), Healthcare Support (768 | 1.4%), Security & Protection (636 | 1.2%), and Law Enforcement (396 | 0.7%).
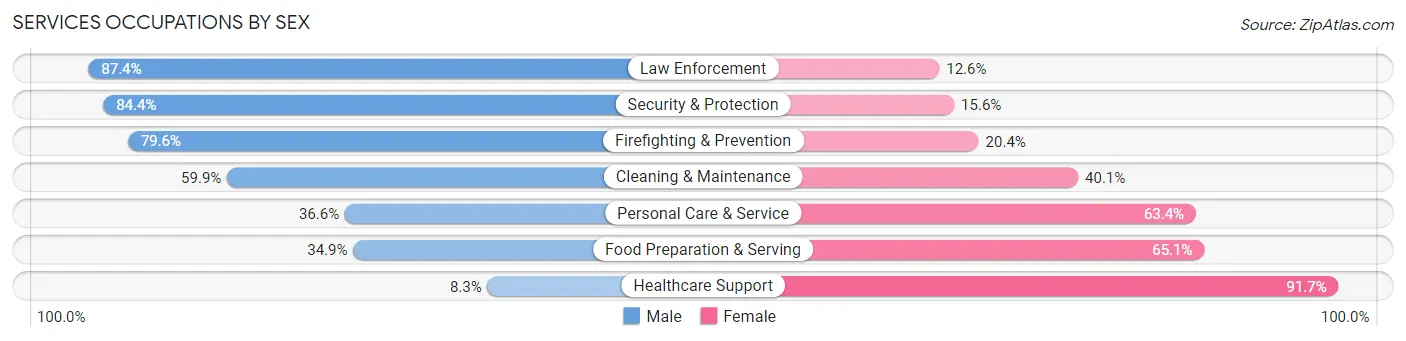
Services Occupations by Sex
Within the Services occupations in Sugar Land, the most male-oriented occupations are Law Enforcement (87.4%), Security & Protection (84.4%), and Firefighting & Prevention (79.6%), while the most female-oriented occupations are Healthcare Support (91.7%), Food Preparation & Serving (65.1%), and Personal Care & Service (63.4%).
| Occupation | Male | Female |
| Healthcare Support | 64 (8.3%) | 704 (91.7%) |
| Security & Protection | 537 (84.4%) | 99 (15.6%) |
| Firefighting & Prevention | 191 (79.6%) | 49 (20.4%) |
| Law Enforcement | 346 (87.4%) | 50 (12.6%) |
| Food Preparation & Serving | 628 (34.9%) | 1,171 (65.1%) |
| Cleaning & Maintenance | 227 (59.9%) | 152 (40.1%) |
| Personal Care & Service | 412 (36.6%) | 715 (63.4%) |
| Total (Category) | 1,868 (39.7%) | 2,841 (60.3%) |
| Total (Overall) | 28,437 (52.9%) | 25,275 (47.1%) |
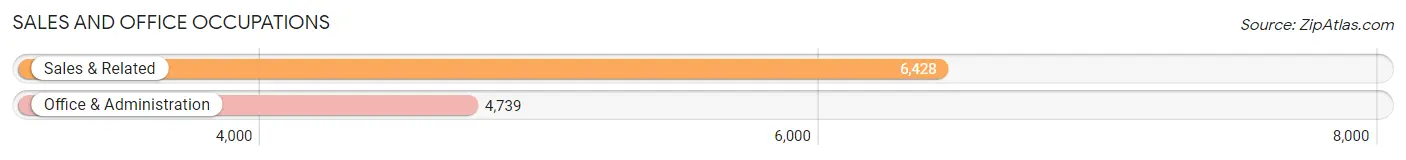
Sales and Office Occupations
The most common Sales and Office occupations in Sugar Land are Sales & Related (6,428 | 12.0%), and Office & Administration (4,739 | 8.8%).
Sales and Office Occupations by Sex
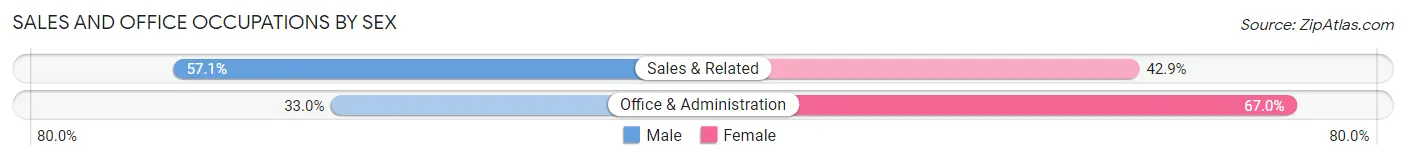
| Occupation | Male | Female |
| Sales & Related | 3,670 (57.1%) | 2,758 (42.9%) |
| Office & Administration | 1,563 (33.0%) | 3,176 (67.0%) |
| Total (Category) | 5,233 (46.9%) | 5,934 (53.1%) |
| Total (Overall) | 28,437 (52.9%) | 25,275 (47.1%) |
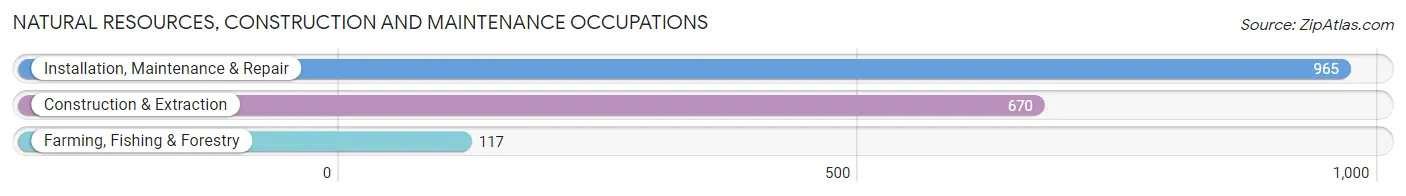
Natural Resources, Construction and Maintenance Occupations
The most common Natural Resources, Construction and Maintenance occupations in Sugar Land are Installation, Maintenance & Repair (965 | 1.8%), Construction & Extraction (670 | 1.3%), and Farming, Fishing & Forestry (117 | 0.2%).
Natural Resources, Construction and Maintenance Occupations by Sex
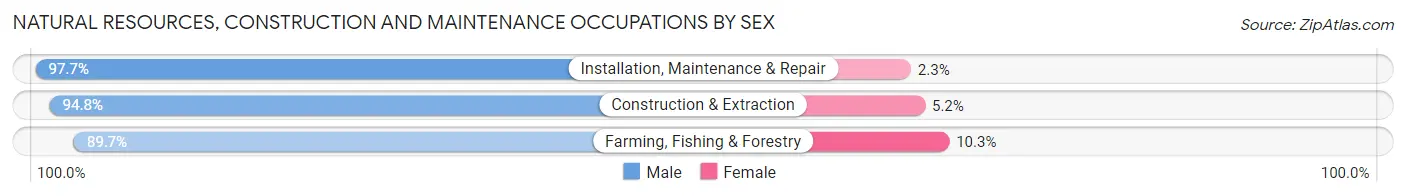
| Occupation | Male | Female |
| Farming, Fishing & Forestry | 105 (89.7%) | 12 (10.3%) |
| Construction & Extraction | 635 (94.8%) | 35 (5.2%) |
| Installation, Maintenance & Repair | 943 (97.7%) | 22 (2.3%) |
| Total (Category) | 1,683 (96.1%) | 69 (3.9%) |
| Total (Overall) | 28,437 (52.9%) | 25,275 (47.1%) |
Production, Transportation and Moving Occupations
The most common Production, Transportation and Moving occupations in Sugar Land are Transportation (1,018 | 1.9%), Production (873 | 1.6%), and Material Moving (497 | 0.9%).
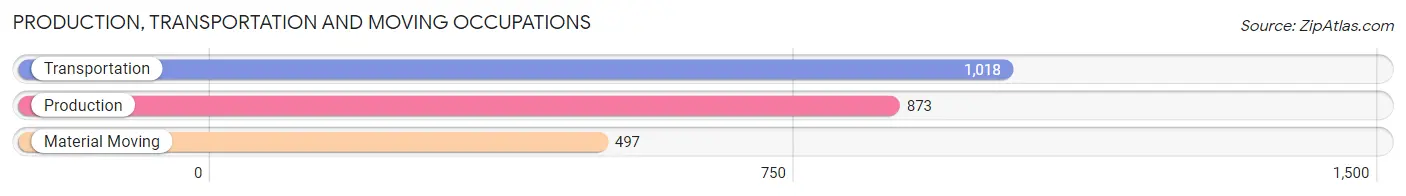
Production, Transportation and Moving Occupations by Sex
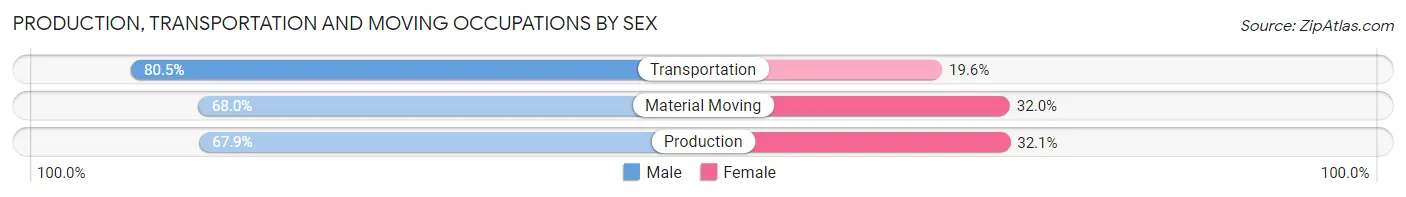
| Occupation | Male | Female |
| Production | 593 (67.9%) | 280 (32.1%) |
| Transportation | 819 (80.4%) | 199 (19.6%) |
| Material Moving | 338 (68.0%) | 159 (32.0%) |
| Total (Category) | 1,750 (73.3%) | 638 (26.7%) |
| Total (Overall) | 28,437 (52.9%) | 25,275 (47.1%) |
Employment Industries by Sex in Sugar Land
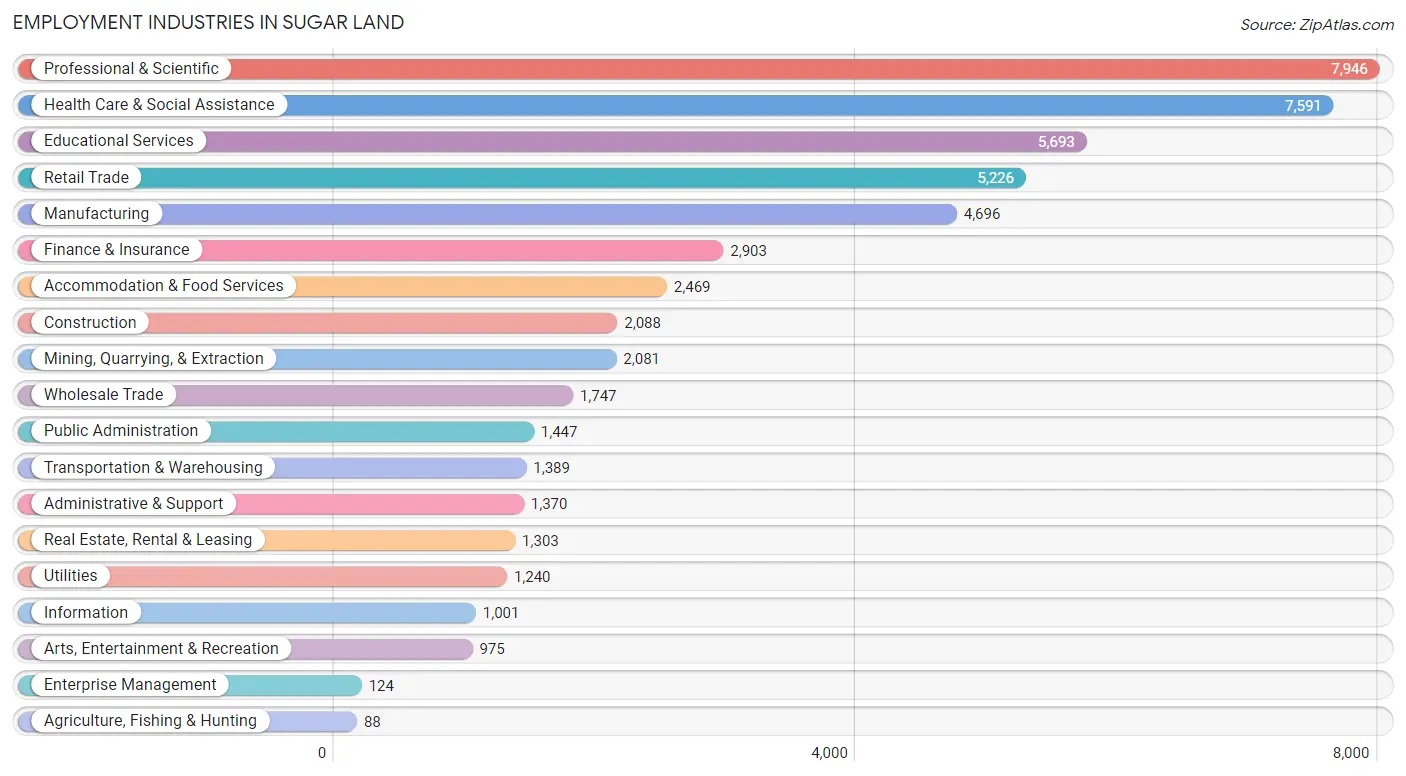
Employment Industries in Sugar Land
The major employment industries in Sugar Land include Professional & Scientific (7,946 | 14.8%), Health Care & Social Assistance (7,591 | 14.1%), Educational Services (5,693 | 10.6%), Retail Trade (5,226 | 9.7%), and Manufacturing (4,696 | 8.7%).
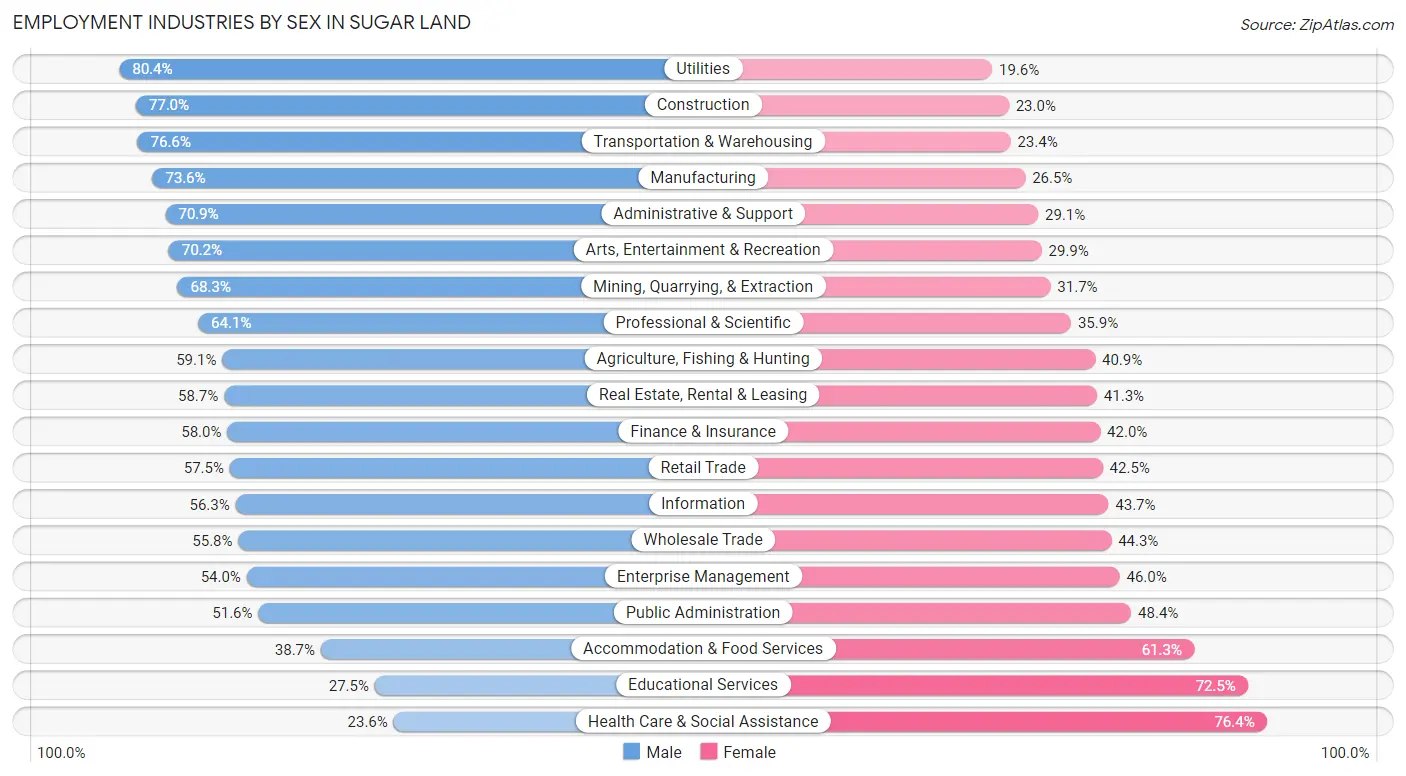
Employment Industries by Sex in Sugar Land
The Sugar Land industries that see more men than women are Utilities (80.4%), Construction (77.0%), and Transportation & Warehousing (76.6%), whereas the industries that tend to have a higher number of women are Health Care & Social Assistance (76.4%), Educational Services (72.5%), and Accommodation & Food Services (61.3%).
| Industry | Male | Female |
| Agriculture, Fishing & Hunting | 52 (59.1%) | 36 (40.9%) |
| Mining, Quarrying, & Extraction | 1,422 (68.3%) | 659 (31.7%) |
| Construction | 1,607 (77.0%) | 481 (23.0%) |
| Manufacturing | 3,454 (73.6%) | 1,242 (26.5%) |
| Wholesale Trade | 974 (55.7%) | 773 (44.3%) |
| Retail Trade | 3,006 (57.5%) | 2,220 (42.5%) |
| Transportation & Warehousing | 1,064 (76.6%) | 325 (23.4%) |
| Utilities | 997 (80.4%) | 243 (19.6%) |
| Information | 564 (56.3%) | 437 (43.7%) |
| Finance & Insurance | 1,685 (58.0%) | 1,218 (42.0%) |
| Real Estate, Rental & Leasing | 765 (58.7%) | 538 (41.3%) |
| Professional & Scientific | 5,092 (64.1%) | 2,854 (35.9%) |
| Enterprise Management | 67 (54.0%) | 57 (46.0%) |
| Administrative & Support | 971 (70.9%) | 399 (29.1%) |
| Educational Services | 1,566 (27.5%) | 4,127 (72.5%) |
| Health Care & Social Assistance | 1,793 (23.6%) | 5,798 (76.4%) |
| Arts, Entertainment & Recreation | 684 (70.2%) | 291 (29.8%) |
| Accommodation & Food Services | 955 (38.7%) | 1,514 (61.3%) |
| Public Administration | 747 (51.6%) | 700 (48.4%) |
| Total | 28,437 (52.9%) | 25,275 (47.1%) |
Education in Sugar Land
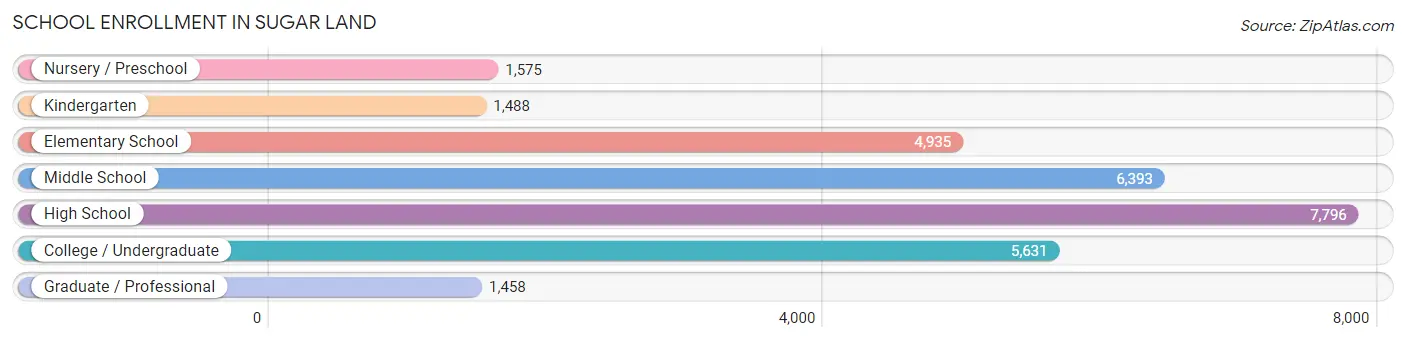
School Enrollment in Sugar Land
The most common levels of schooling among the 29,276 students in Sugar Land are high school (7,796 | 26.6%), middle school (6,393 | 21.8%), and college / undergraduate (5,631 | 19.2%).
| School Level | # Students | % Students |
| Nursery / Preschool | 1,575 | 5.4% |
| Kindergarten | 1,488 | 5.1% |
| Elementary School | 4,935 | 16.9% |
| Middle School | 6,393 | 21.8% |
| High School | 7,796 | 26.6% |
| College / Undergraduate | 5,631 | 19.2% |
| Graduate / Professional | 1,458 | 5.0% |
| Total | 29,276 | 100.0% |
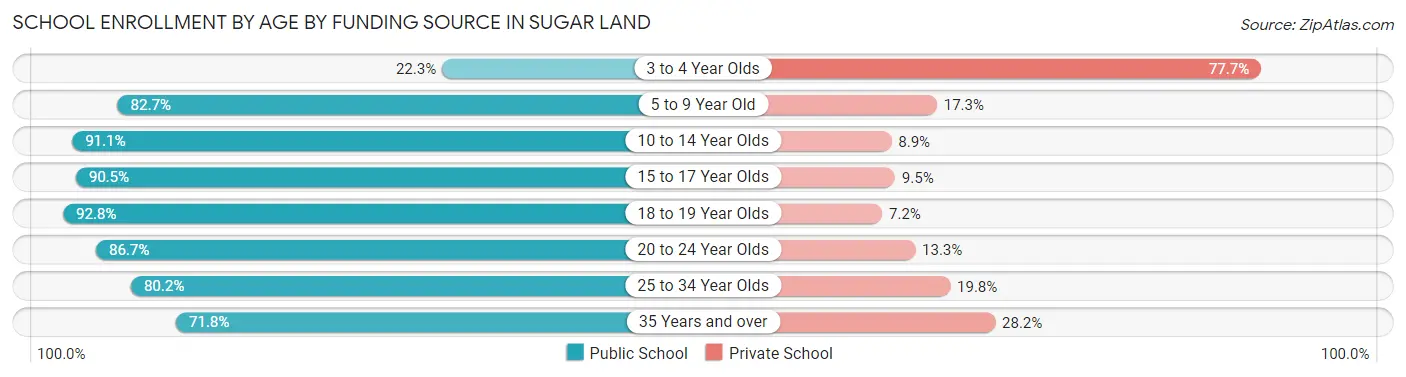
School Enrollment by Age by Funding Source in Sugar Land
Out of a total of 29,276 students who are enrolled in schools in Sugar Land, 4,479 (15.3%) attend a private institution, while the remaining 24,797 (84.7%) are enrolled in public schools. The age group of 3 to 4 year olds has the highest likelihood of being enrolled in private schools, with 852 (77.7% in the age bracket) enrolled. Conversely, the age group of 18 to 19 year olds has the lowest likelihood of being enrolled in a private school, with 1,998 (92.8% in the age bracket) attending a public institution.
| Age Bracket | Public School | Private School |
| 3 to 4 Year Olds | 244 (22.3%) | 852 (77.7%) |
| 5 to 9 Year Old | 5,459 (82.7%) | 1,145 (17.3%) |
| 10 to 14 Year Olds | 7,150 (91.1%) | 697 (8.9%) |
| 15 to 17 Year Olds | 4,920 (90.5%) | 519 (9.5%) |
| 18 to 19 Year Olds | 1,998 (92.8%) | 154 (7.2%) |
| 20 to 24 Year Olds | 3,087 (86.7%) | 474 (13.3%) |
| 25 to 34 Year Olds | 878 (80.2%) | 217 (19.8%) |
| 35 Years and over | 1,064 (71.8%) | 418 (28.2%) |
| Total | 24,797 (84.7%) | 4,479 (15.3%) |
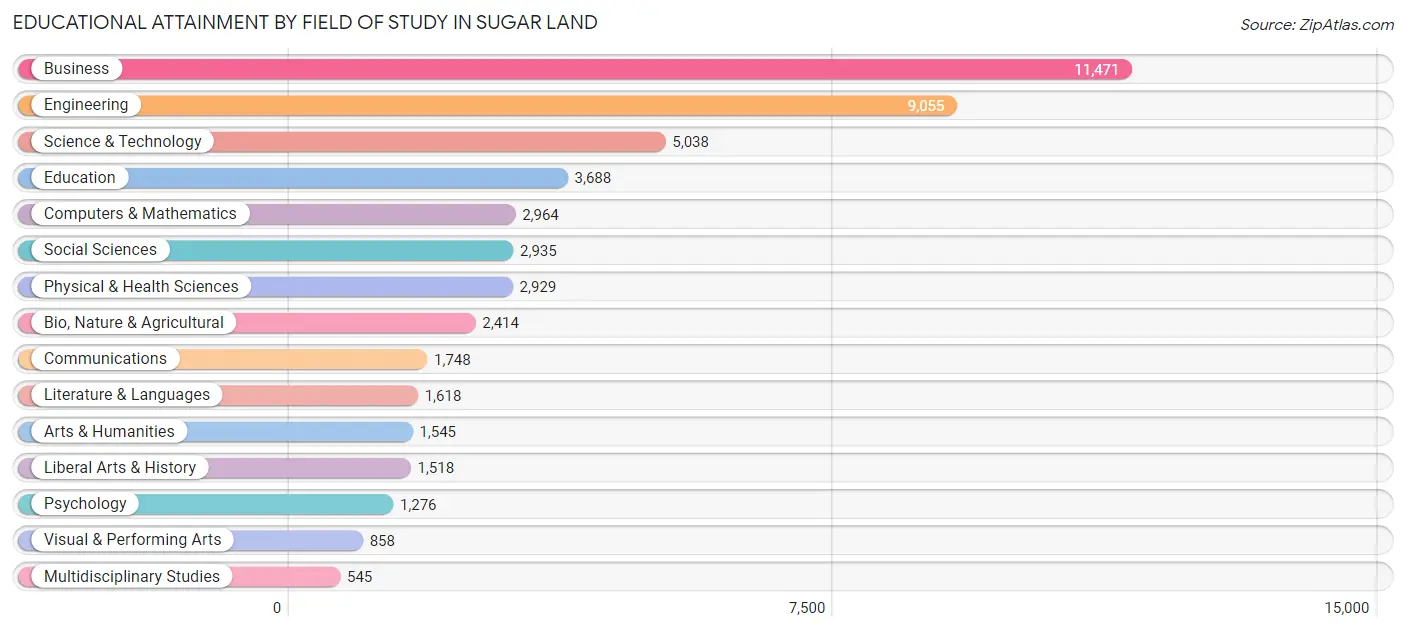
Educational Attainment by Field of Study in Sugar Land
Business (11,471 | 23.1%), engineering (9,055 | 18.3%), science & technology (5,038 | 10.2%), education (3,688 | 7.4%), and computers & mathematics (2,964 | 6.0%) are the most common fields of study among 49,602 individuals in Sugar Land who have obtained a bachelor's degree or higher.
| Field of Study | # Graduates | % Graduates |
| Computers & Mathematics | 2,964 | 6.0% |
| Bio, Nature & Agricultural | 2,414 | 4.9% |
| Physical & Health Sciences | 2,929 | 5.9% |
| Psychology | 1,276 | 2.6% |
| Social Sciences | 2,935 | 5.9% |
| Engineering | 9,055 | 18.3% |
| Multidisciplinary Studies | 545 | 1.1% |
| Science & Technology | 5,038 | 10.2% |
| Business | 11,471 | 23.1% |
| Education | 3,688 | 7.4% |
| Literature & Languages | 1,618 | 3.3% |
| Liberal Arts & History | 1,518 | 3.1% |
| Visual & Performing Arts | 858 | 1.7% |
| Communications | 1,748 | 3.5% |
| Arts & Humanities | 1,545 | 3.1% |
| Total | 49,602 | 100.0% |
Transportation & Commute in Sugar Land
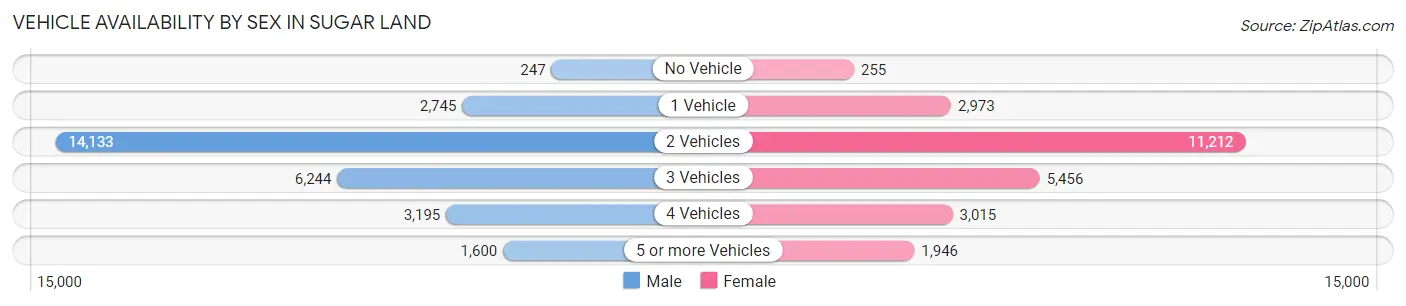
Vehicle Availability by Sex in Sugar Land
The most prevalent vehicle ownership categories in Sugar Land are males with 2 vehicles (14,133, accounting for 50.2%) and females with 2 vehicles (11,212, making up 56.9%).
| Vehicles Available | Male | Female |
| No Vehicle | 247 (0.9%) | 255 (1.0%) |
| 1 Vehicle | 2,745 (9.8%) | 2,973 (12.0%) |
| 2 Vehicles | 14,133 (50.2%) | 11,212 (45.1%) |
| 3 Vehicles | 6,244 (22.2%) | 5,456 (22.0%) |
| 4 Vehicles | 3,195 (11.3%) | 3,015 (12.1%) |
| 5 or more Vehicles | 1,600 (5.7%) | 1,946 (7.8%) |
| Total | 28,164 (100.0%) | 24,857 (100.0%) |
Commute Time in Sugar Land
The most frequently occuring commute durations in Sugar Land are 30 to 34 minutes (6,933 commuters, 15.7%), 45 to 59 minutes (6,892 commuters, 15.6%), and 15 to 19 minutes (5,796 commuters, 13.1%).
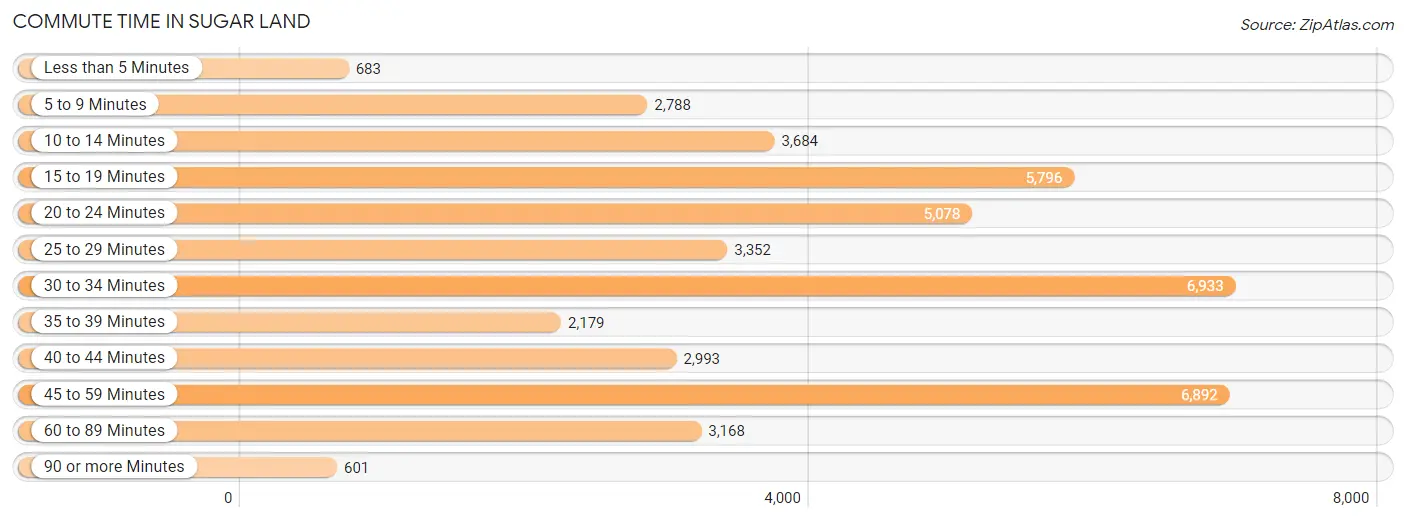
| Commute Time | # Commuters | % Commuters |
| Less than 5 Minutes | 683 | 1.5% |
| 5 to 9 Minutes | 2,788 | 6.3% |
| 10 to 14 Minutes | 3,684 | 8.3% |
| 15 to 19 Minutes | 5,796 | 13.1% |
| 20 to 24 Minutes | 5,078 | 11.5% |
| 25 to 29 Minutes | 3,352 | 7.6% |
| 30 to 34 Minutes | 6,933 | 15.7% |
| 35 to 39 Minutes | 2,179 | 4.9% |
| 40 to 44 Minutes | 2,993 | 6.8% |
| 45 to 59 Minutes | 6,892 | 15.6% |
| 60 to 89 Minutes | 3,168 | 7.2% |
| 90 or more Minutes | 601 | 1.4% |
Commute Time by Sex in Sugar Land
The most common commute times in Sugar Land are 30 to 34 minutes (4,170 commuters, 17.8%) for males and 15 to 19 minutes (3,408 commuters, 16.4%) for females.
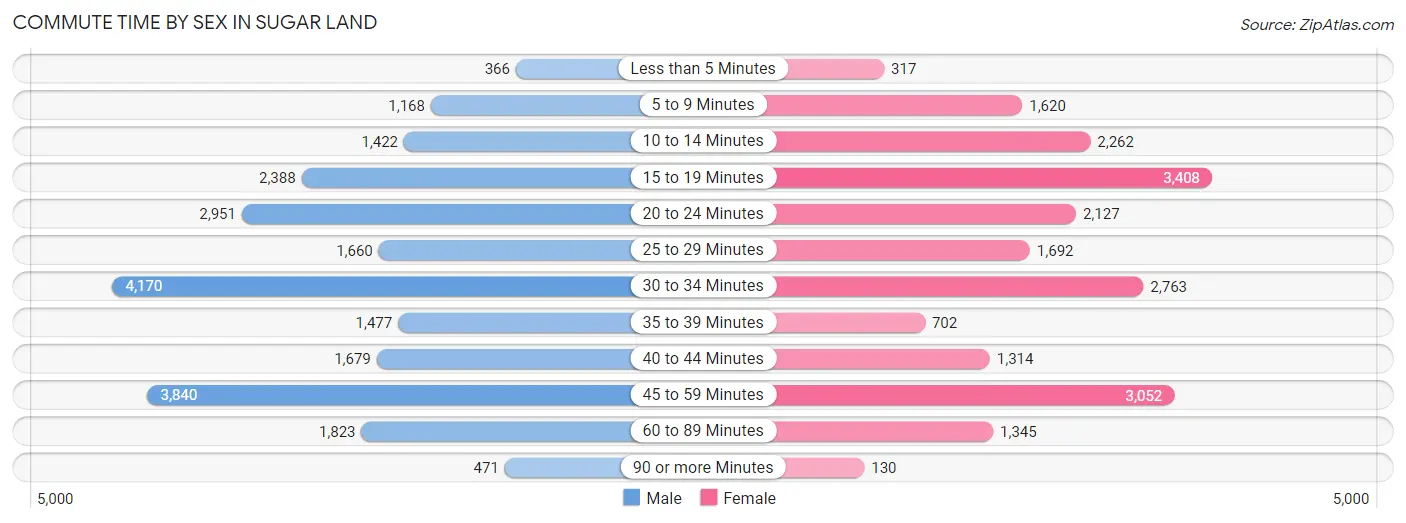
| Commute Time | Male | Female |
| Less than 5 Minutes | 366 (1.6%) | 317 (1.5%) |
| 5 to 9 Minutes | 1,168 (5.0%) | 1,620 (7.8%) |
| 10 to 14 Minutes | 1,422 (6.1%) | 2,262 (10.9%) |
| 15 to 19 Minutes | 2,388 (10.2%) | 3,408 (16.4%) |
| 20 to 24 Minutes | 2,951 (12.6%) | 2,127 (10.3%) |
| 25 to 29 Minutes | 1,660 (7.1%) | 1,692 (8.2%) |
| 30 to 34 Minutes | 4,170 (17.8%) | 2,763 (13.3%) |
| 35 to 39 Minutes | 1,477 (6.3%) | 702 (3.4%) |
| 40 to 44 Minutes | 1,679 (7.2%) | 1,314 (6.3%) |
| 45 to 59 Minutes | 3,840 (16.4%) | 3,052 (14.7%) |
| 60 to 89 Minutes | 1,823 (7.8%) | 1,345 (6.5%) |
| 90 or more Minutes | 471 (2.0%) | 130 (0.6%) |
Time of Departure to Work by Sex in Sugar Land
The most frequent times of departure to work in Sugar Land are 7:00 AM to 7:29 AM (3,667, 15.7%) for males and 8:00 AM to 8:29 AM (3,406, 16.4%) for females.
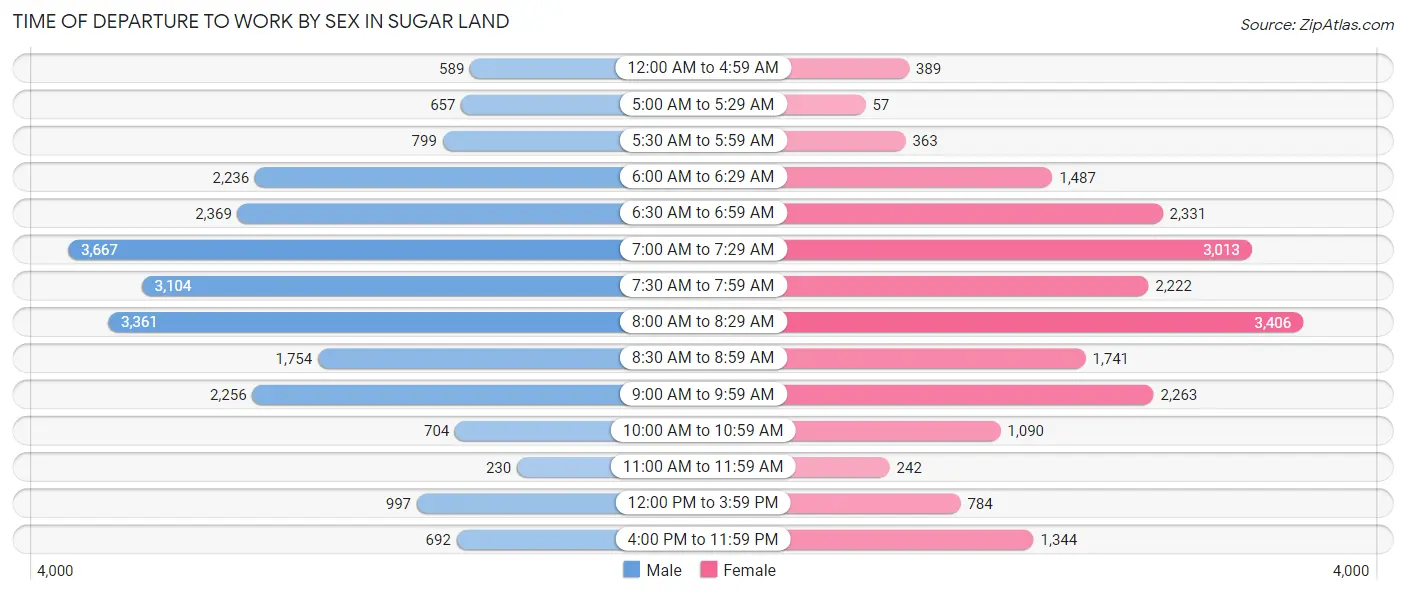
| Time of Departure | Male | Female |
| 12:00 AM to 4:59 AM | 589 (2.5%) | 389 (1.9%) |
| 5:00 AM to 5:29 AM | 657 (2.8%) | 57 (0.3%) |
| 5:30 AM to 5:59 AM | 799 (3.4%) | 363 (1.8%) |
| 6:00 AM to 6:29 AM | 2,236 (9.6%) | 1,487 (7.2%) |
| 6:30 AM to 6:59 AM | 2,369 (10.1%) | 2,331 (11.2%) |
| 7:00 AM to 7:29 AM | 3,667 (15.7%) | 3,013 (14.5%) |
| 7:30 AM to 7:59 AM | 3,104 (13.3%) | 2,222 (10.7%) |
| 8:00 AM to 8:29 AM | 3,361 (14.3%) | 3,406 (16.4%) |
| 8:30 AM to 8:59 AM | 1,754 (7.5%) | 1,741 (8.4%) |
| 9:00 AM to 9:59 AM | 2,256 (9.6%) | 2,263 (10.9%) |
| 10:00 AM to 10:59 AM | 704 (3.0%) | 1,090 (5.3%) |
| 11:00 AM to 11:59 AM | 230 (1.0%) | 242 (1.2%) |
| 12:00 PM to 3:59 PM | 997 (4.3%) | 784 (3.8%) |
| 4:00 PM to 11:59 PM | 692 (3.0%) | 1,344 (6.5%) |
| Total | 23,415 (100.0%) | 20,732 (100.0%) |
Housing Occupancy in Sugar Land
Occupancy by Ownership in Sugar Land
Of the total 37,481 dwellings in Sugar Land, owner-occupied units account for 30,442 (81.2%), while renter-occupied units make up 7,039 (18.8%).
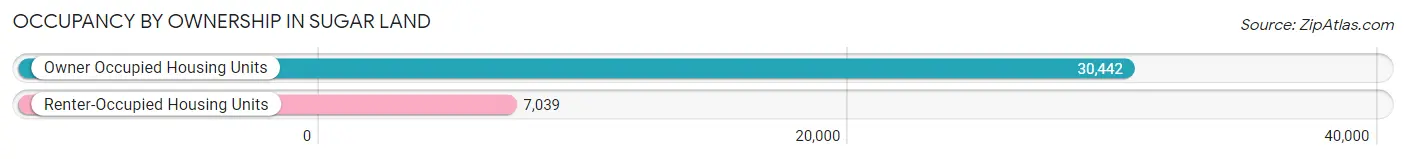
| Occupancy | # Housing Units | % Housing Units |
| Owner Occupied Housing Units | 30,442 | 81.2% |
| Renter-Occupied Housing Units | 7,039 | 18.8% |
| Total Occupied Housing Units | 37,481 | 100.0% |
Occupancy by Household Size in Sugar Land
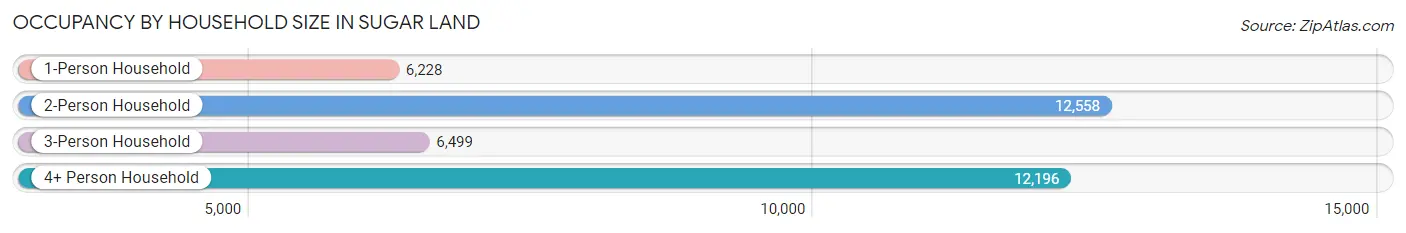
| Household Size | # Housing Units | % Housing Units |
| 1-Person Household | 6,228 | 16.6% |
| 2-Person Household | 12,558 | 33.5% |
| 3-Person Household | 6,499 | 17.3% |
| 4+ Person Household | 12,196 | 32.5% |
| Total Housing Units | 37,481 | 100.0% |
Occupancy by Ownership by Household Size in Sugar Land
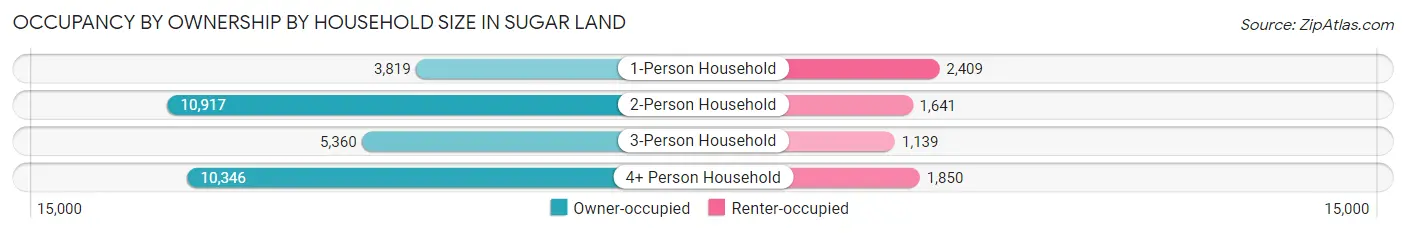
| Household Size | Owner-occupied | Renter-occupied |
| 1-Person Household | 3,819 (61.3%) | 2,409 (38.7%) |
| 2-Person Household | 10,917 (86.9%) | 1,641 (13.1%) |
| 3-Person Household | 5,360 (82.5%) | 1,139 (17.5%) |
| 4+ Person Household | 10,346 (84.8%) | 1,850 (15.2%) |
| Total Housing Units | 30,442 (81.2%) | 7,039 (18.8%) |
Occupancy by Educational Attainment in Sugar Land
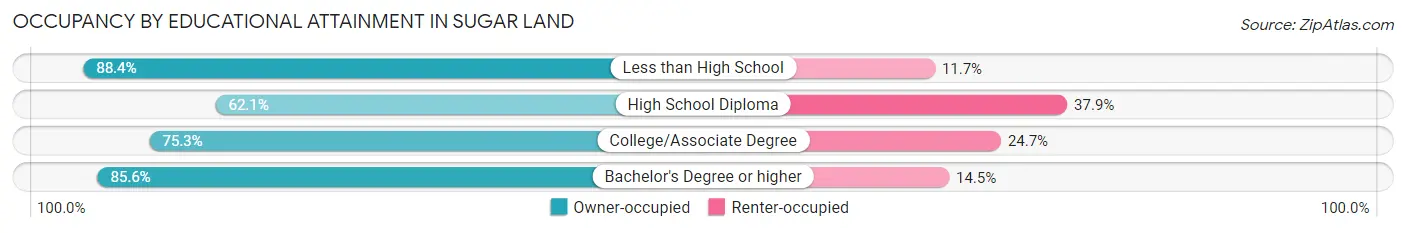
| Household Size | Owner-occupied | Renter-occupied |
| Less than High School | 956 (88.3%) | 126 (11.7%) |
| High School Diploma | 2,256 (62.1%) | 1,375 (37.9%) |
| College/Associate Degree | 5,865 (75.3%) | 1,928 (24.7%) |
| Bachelor's Degree or higher | 21,365 (85.6%) | 3,610 (14.4%) |
Occupancy by Age of Householder in Sugar Land
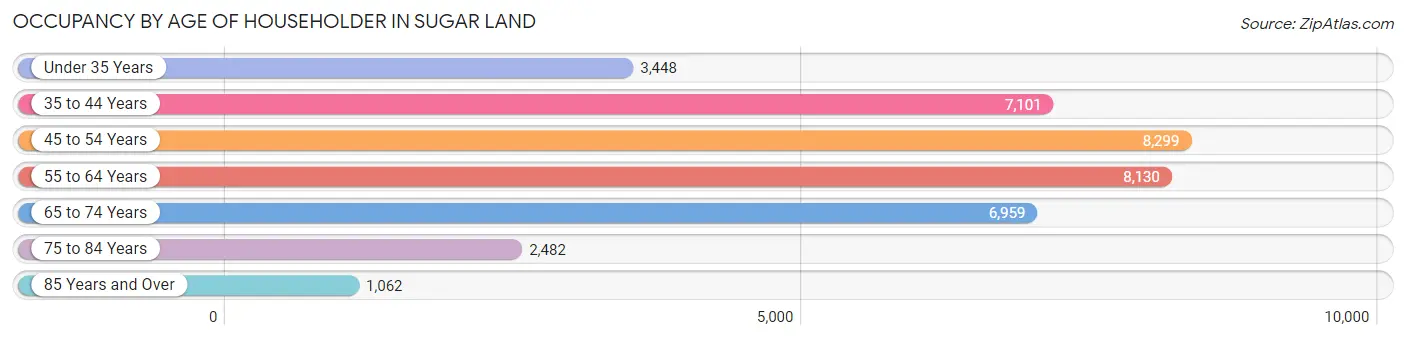
| Age Bracket | # Households | % Households |
| Under 35 Years | 3,448 | 9.2% |
| 35 to 44 Years | 7,101 | 19.0% |
| 45 to 54 Years | 8,299 | 22.1% |
| 55 to 64 Years | 8,130 | 21.7% |
| 65 to 74 Years | 6,959 | 18.6% |
| 75 to 84 Years | 2,482 | 6.6% |
| 85 Years and Over | 1,062 | 2.8% |
| Total | 37,481 | 100.0% |
Housing Finances in Sugar Land
Median Income by Occupancy in Sugar Land
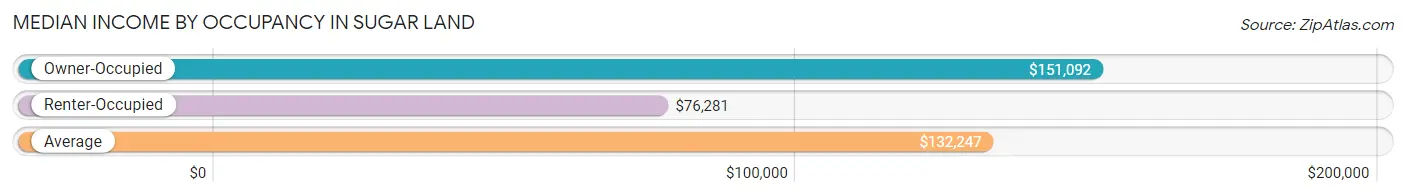
| Occupancy Type | # Households | Median Income |
| Owner-Occupied | 30,442 (81.2%) | $151,092 |
| Renter-Occupied | 7,039 (18.8%) | $76,281 |
| Average | 37,481 (100.0%) | $132,247 |
Occupancy by Householder Income Bracket in Sugar Land
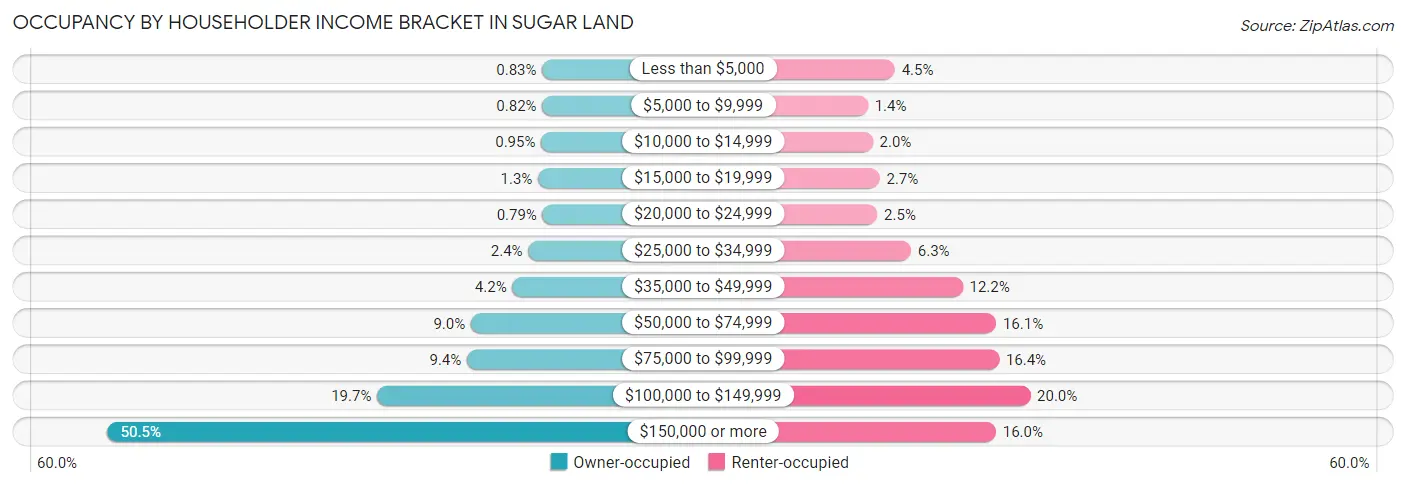
| Income Bracket | Owner-occupied | Renter-occupied |
| Less than $5,000 | 254 (0.8%) | 315 (4.5%) |
| $5,000 to $9,999 | 250 (0.8%) | 98 (1.4%) |
| $10,000 to $14,999 | 288 (0.9%) | 137 (1.9%) |
| $15,000 to $19,999 | 399 (1.3%) | 193 (2.7%) |
| $20,000 to $24,999 | 242 (0.8%) | 174 (2.5%) |
| $25,000 to $34,999 | 738 (2.4%) | 445 (6.3%) |
| $35,000 to $49,999 | 1,292 (4.2%) | 861 (12.2%) |
| $50,000 to $74,999 | 2,733 (9.0%) | 1,130 (16.1%) |
| $75,000 to $99,999 | 2,871 (9.4%) | 1,154 (16.4%) |
| $100,000 to $149,999 | 5,998 (19.7%) | 1,404 (20.0%) |
| $150,000 or more | 15,377 (50.5%) | 1,128 (16.0%) |
| Total | 30,442 (100.0%) | 7,039 (100.0%) |
Monthly Housing Cost Tiers in Sugar Land
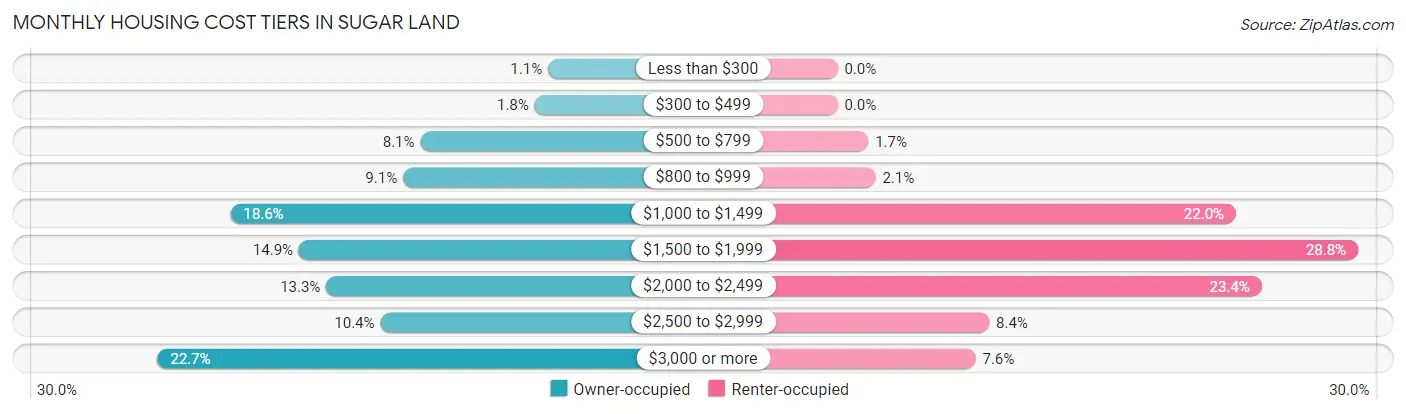
| Monthly Cost | Owner-occupied | Renter-occupied |
| Less than $300 | 331 (1.1%) | 0 (0.0%) |
| $300 to $499 | 558 (1.8%) | 0 (0.0%) |
| $500 to $799 | 2,479 (8.1%) | 120 (1.7%) |
| $800 to $999 | 2,769 (9.1%) | 148 (2.1%) |
| $1,000 to $1,499 | 5,671 (18.6%) | 1,549 (22.0%) |
| $1,500 to $1,999 | 4,521 (14.8%) | 2,024 (28.7%) |
| $2,000 to $2,499 | 4,061 (13.3%) | 1,649 (23.4%) |
| $2,500 to $2,999 | 3,152 (10.3%) | 590 (8.4%) |
| $3,000 or more | 6,900 (22.7%) | 537 (7.6%) |
| Total | 30,442 (100.0%) | 7,039 (100.0%) |
Physical Housing Characteristics in Sugar Land
Housing Structures in Sugar Land
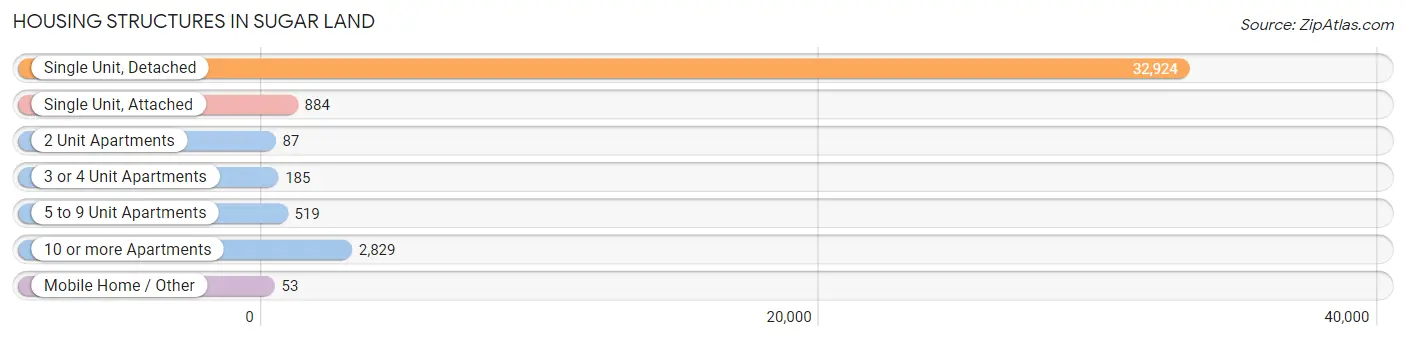
| Structure Type | # Housing Units | % Housing Units |
| Single Unit, Detached | 32,924 | 87.8% |
| Single Unit, Attached | 884 | 2.4% |
| 2 Unit Apartments | 87 | 0.2% |
| 3 or 4 Unit Apartments | 185 | 0.5% |
| 5 to 9 Unit Apartments | 519 | 1.4% |
| 10 or more Apartments | 2,829 | 7.5% |
| Mobile Home / Other | 53 | 0.1% |
| Total | 37,481 | 100.0% |
Housing Structures by Occupancy in Sugar Land
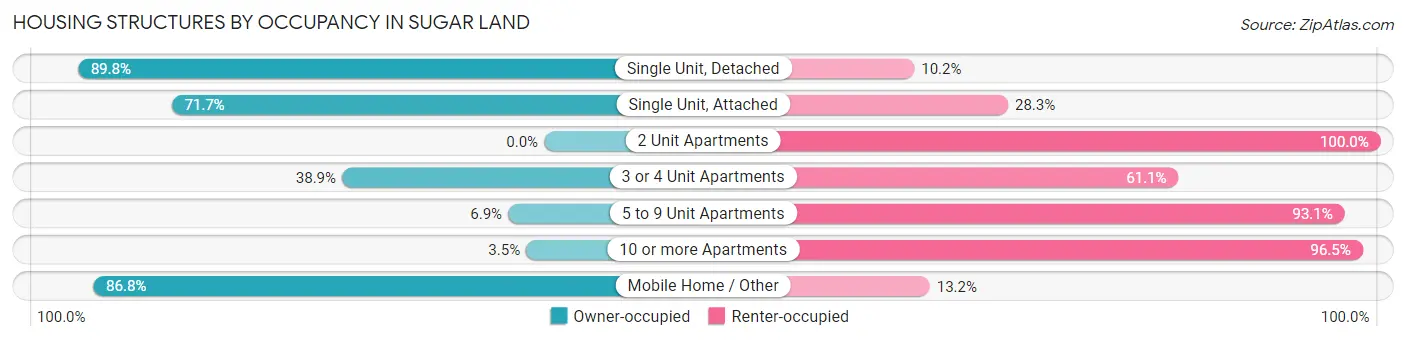
| Structure Type | Owner-occupied | Renter-occupied |
| Single Unit, Detached | 29,556 (89.8%) | 3,368 (10.2%) |
| Single Unit, Attached | 634 (71.7%) | 250 (28.3%) |
| 2 Unit Apartments | 0 (0.0%) | 87 (100.0%) |
| 3 or 4 Unit Apartments | 72 (38.9%) | 113 (61.1%) |
| 5 to 9 Unit Apartments | 36 (6.9%) | 483 (93.1%) |
| 10 or more Apartments | 98 (3.5%) | 2,731 (96.5%) |
| Mobile Home / Other | 46 (86.8%) | 7 (13.2%) |
| Total | 30,442 (81.2%) | 7,039 (18.8%) |
Housing Structures by Number of Rooms in Sugar Land
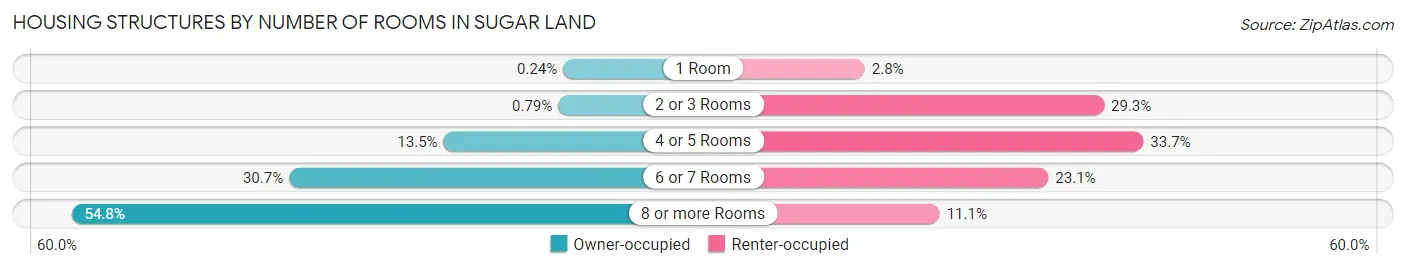
| Number of Rooms | Owner-occupied | Renter-occupied |
| 1 Room | 74 (0.2%) | 195 (2.8%) |
| 2 or 3 Rooms | 241 (0.8%) | 2,064 (29.3%) |
| 4 or 5 Rooms | 4,115 (13.5%) | 2,371 (33.7%) |
| 6 or 7 Rooms | 9,332 (30.7%) | 1,629 (23.1%) |
| 8 or more Rooms | 16,680 (54.8%) | 780 (11.1%) |
| Total | 30,442 (100.0%) | 7,039 (100.0%) |
Housing Structure by Heating Type in Sugar Land
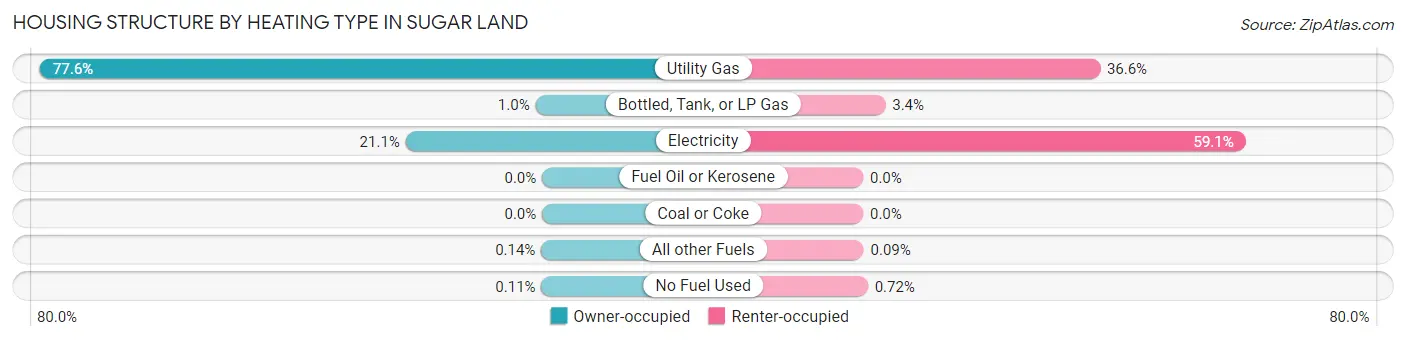
| Heating Type | Owner-occupied | Renter-occupied |
| Utility Gas | 23,633 (77.6%) | 2,578 (36.6%) |
| Bottled, Tank, or LP Gas | 312 (1.0%) | 242 (3.4%) |
| Electricity | 6,421 (21.1%) | 4,162 (59.1%) |
| Fuel Oil or Kerosene | 0 (0.0%) | 0 (0.0%) |
| Coal or Coke | 0 (0.0%) | 0 (0.0%) |
| All other Fuels | 44 (0.1%) | 6 (0.1%) |
| No Fuel Used | 32 (0.1%) | 51 (0.7%) |
| Total | 30,442 (100.0%) | 7,039 (100.0%) |
Household Vehicle Usage in Sugar Land
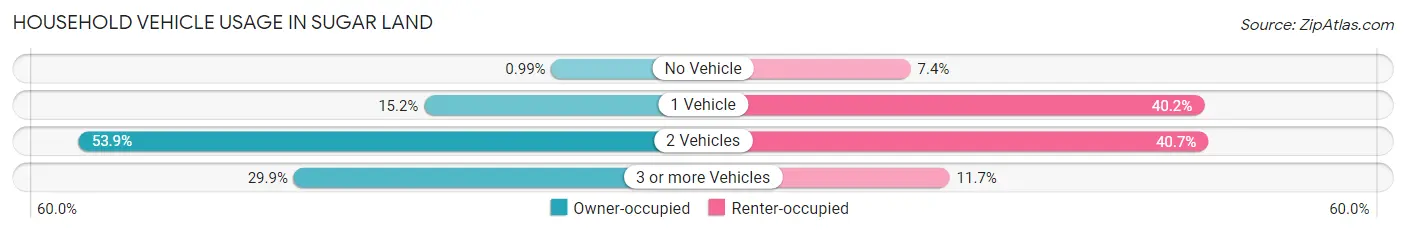
| Vehicles per Household | Owner-occupied | Renter-occupied |
| No Vehicle | 300 (1.0%) | 518 (7.4%) |
| 1 Vehicle | 4,639 (15.2%) | 2,831 (40.2%) |
| 2 Vehicles | 16,415 (53.9%) | 2,864 (40.7%) |
| 3 or more Vehicles | 9,088 (29.8%) | 826 (11.7%) |
| Total | 30,442 (100.0%) | 7,039 (100.0%) |
Real Estate & Mortgages in Sugar Land
Real Estate and Mortgage Overview in Sugar Land
| Characteristic | Without Mortgage | With Mortgage |
| Housing Units | 13,096 | 17,346 |
| Median Property Value | $374,000 | $397,900 |
| Median Household Income | $124,364 | $9,833 |
| Monthly Housing Costs | $1,059 | $6,747 |
| Real Estate Taxes | $6,557 | $163 |
Property Value by Mortgage Status in Sugar Land
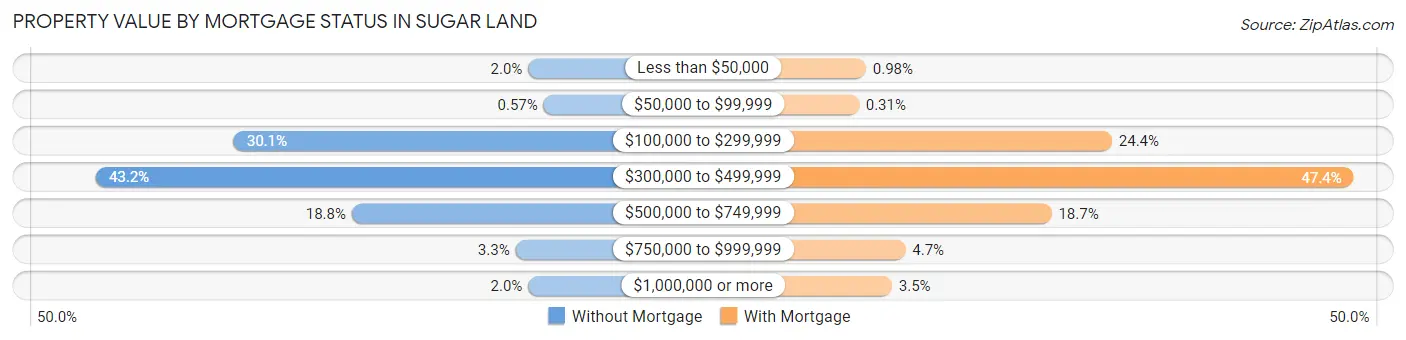
| Property Value | Without Mortgage | With Mortgage |
| Less than $50,000 | 267 (2.0%) | 170 (1.0%) |
| $50,000 to $99,999 | 75 (0.6%) | 54 (0.3%) |
| $100,000 to $299,999 | 3,938 (30.1%) | 4,235 (24.4%) |
| $300,000 to $499,999 | 5,657 (43.2%) | 8,228 (47.4%) |
| $500,000 to $749,999 | 2,467 (18.8%) | 3,236 (18.7%) |
| $750,000 to $999,999 | 425 (3.3%) | 823 (4.7%) |
| $1,000,000 or more | 267 (2.0%) | 600 (3.5%) |
| Total | 13,096 (100.0%) | 17,346 (100.0%) |
Household Income by Mortgage Status in Sugar Land
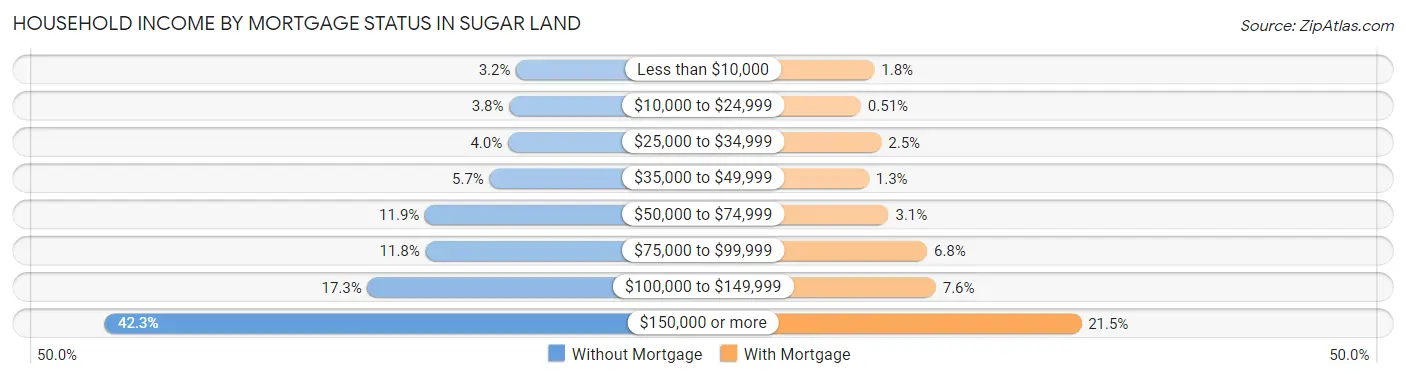
| Household Income | Without Mortgage | With Mortgage |
| Less than $10,000 | 415 (3.2%) | 310 (1.8%) |
| $10,000 to $24,999 | 502 (3.8%) | 89 (0.5%) |
| $25,000 to $34,999 | 518 (4.0%) | 427 (2.5%) |
| $35,000 to $49,999 | 748 (5.7%) | 220 (1.3%) |
| $50,000 to $74,999 | 1,552 (11.8%) | 544 (3.1%) |
| $75,000 to $99,999 | 1,546 (11.8%) | 1,181 (6.8%) |
| $100,000 to $149,999 | 2,271 (17.3%) | 1,325 (7.6%) |
| $150,000 or more | 5,544 (42.3%) | 3,727 (21.5%) |
| Total | 13,096 (100.0%) | 17,346 (100.0%) |
Property Value to Household Income Ratio in Sugar Land
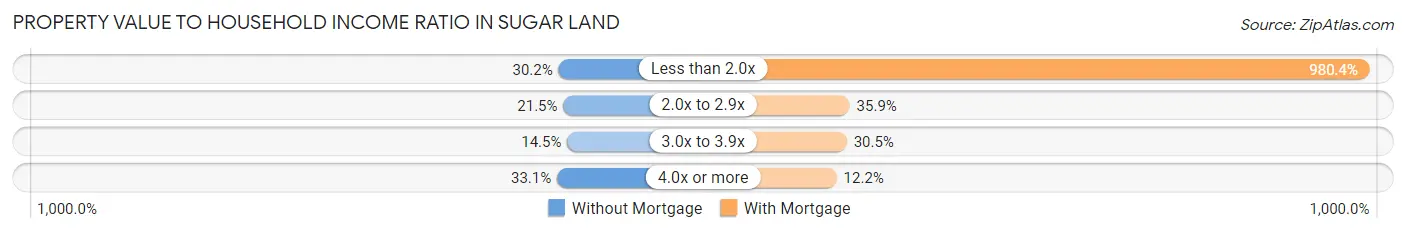
| Value-to-Income Ratio | Without Mortgage | With Mortgage |
| Less than 2.0x | 3,959 (30.2%) | 170,064 (980.4%) |
| 2.0x to 2.9x | 2,821 (21.5%) | 6,224 (35.9%) |
| 3.0x to 3.9x | 1,895 (14.5%) | 5,285 (30.5%) |
| 4.0x or more | 4,328 (33.1%) | 2,122 (12.2%) |
| Total | 13,096 (100.0%) | 17,346 (100.0%) |
Real Estate Taxes by Mortgage Status in Sugar Land
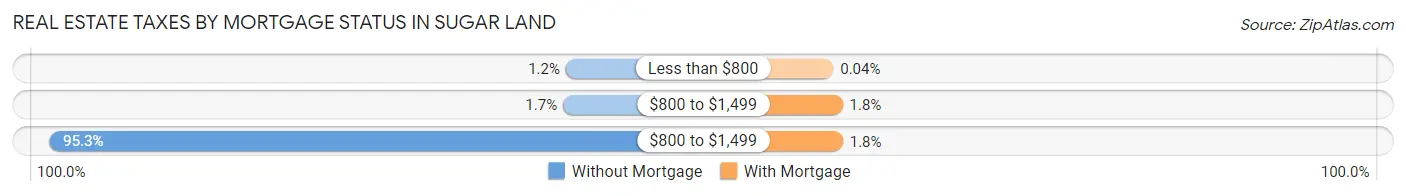
| Property Taxes | Without Mortgage | With Mortgage |
| Less than $800 | 151 (1.1%) | 7 (0.0%) |
| $800 to $1,499 | 217 (1.7%) | 303 (1.8%) |
| $800 to $1,499 | 12,484 (95.3%) | 308 (1.8%) |
| Total | 13,096 (100.0%) | 17,346 (100.0%) |
Health & Disability in Sugar Land
Health Insurance Coverage by Age in Sugar Land
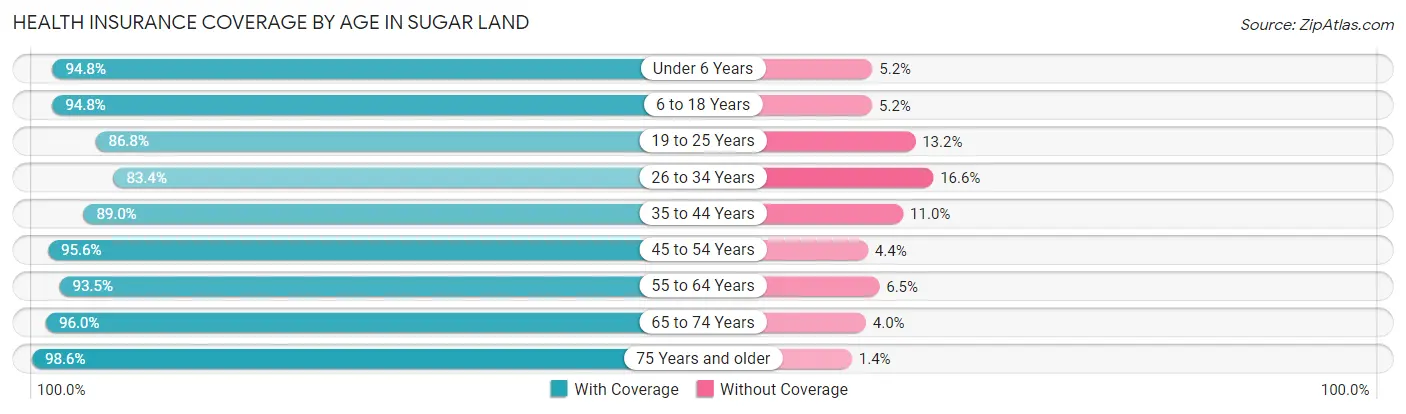
| Age Bracket | With Coverage | Without Coverage |
| Under 6 Years | 5,637 (94.8%) | 311 (5.2%) |
| 6 to 18 Years | 19,234 (94.8%) | 1,053 (5.2%) |
| 19 to 25 Years | 7,385 (86.8%) | 1,126 (13.2%) |
| 26 to 34 Years | 8,001 (83.4%) | 1,590 (16.6%) |
| 35 to 44 Years | 12,667 (89.0%) | 1,563 (11.0%) |
| 45 to 54 Years | 15,636 (95.6%) | 720 (4.4%) |
| 55 to 64 Years | 14,190 (93.5%) | 992 (6.5%) |
| 65 to 74 Years | 12,698 (96.0%) | 532 (4.0%) |
| 75 Years and older | 6,483 (98.6%) | 93 (1.4%) |
| Total | 101,931 (92.7%) | 7,980 (7.3%) |
Health Insurance Coverage by Citizenship Status in Sugar Land
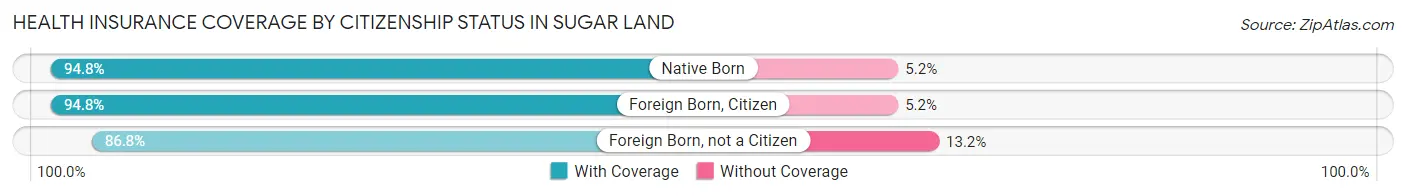
| Citizenship Status | With Coverage | Without Coverage |
| Native Born | 5,637 (94.8%) | 311 (5.2%) |
| Foreign Born, Citizen | 19,234 (94.8%) | 1,053 (5.2%) |
| Foreign Born, not a Citizen | 7,385 (86.8%) | 1,126 (13.2%) |
Health Insurance Coverage by Household Income in Sugar Land
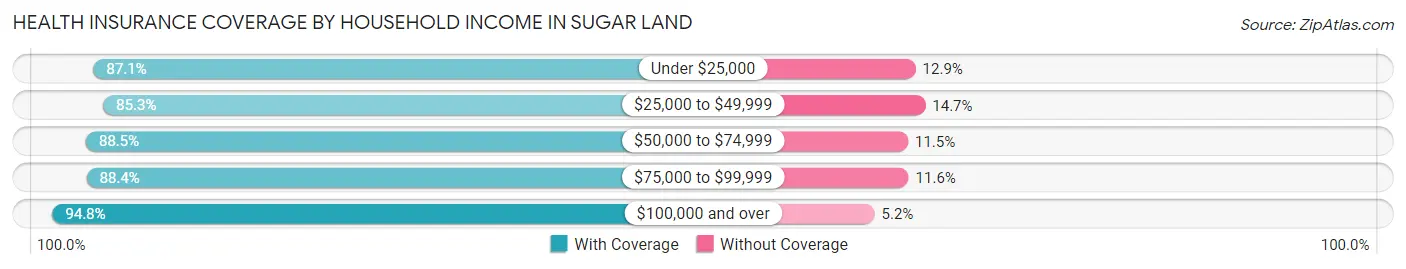
| Household Income | With Coverage | Without Coverage |
| Under $25,000 | 3,888 (87.1%) | 576 (12.9%) |
| $25,000 to $49,999 | 5,703 (85.3%) | 984 (14.7%) |
| $50,000 to $74,999 | 8,866 (88.5%) | 1,149 (11.5%) |
| $75,000 to $99,999 | 8,580 (88.4%) | 1,125 (11.6%) |
| $100,000 and over | 74,802 (94.8%) | 4,114 (5.2%) |
Public vs Private Health Insurance Coverage by Age in Sugar Land
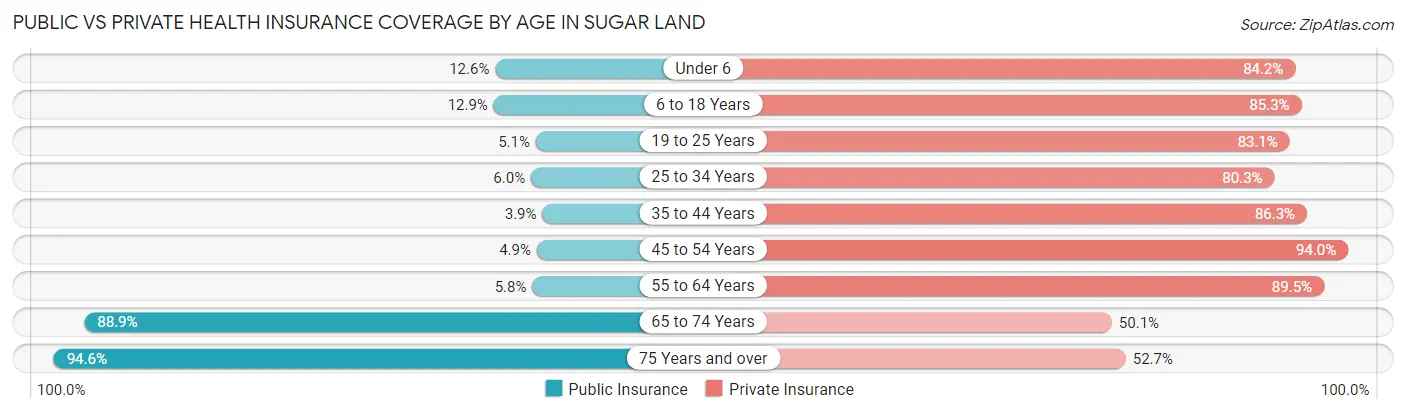
| Age Bracket | Public Insurance | Private Insurance |
| Under 6 | 752 (12.6%) | 5,005 (84.2%) |
| 6 to 18 Years | 2,623 (12.9%) | 17,306 (85.3%) |
| 19 to 25 Years | 436 (5.1%) | 7,075 (83.1%) |
| 25 to 34 Years | 576 (6.0%) | 7,701 (80.3%) |
| 35 to 44 Years | 553 (3.9%) | 12,285 (86.3%) |
| 45 to 54 Years | 805 (4.9%) | 15,370 (94.0%) |
| 55 to 64 Years | 876 (5.8%) | 13,585 (89.5%) |
| 65 to 74 Years | 11,761 (88.9%) | 6,633 (50.1%) |
| 75 Years and over | 6,220 (94.6%) | 3,467 (52.7%) |
| Total | 24,602 (22.4%) | 88,427 (80.4%) |
Disability Status by Sex by Age in Sugar Land
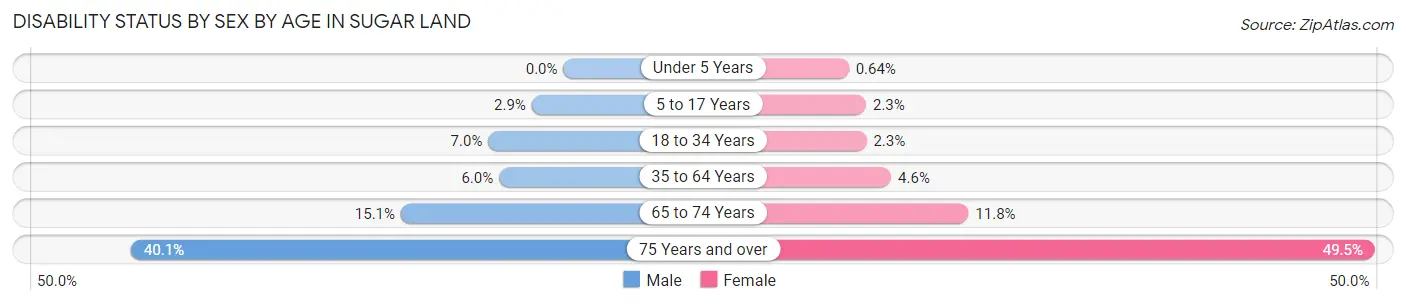
| Age Bracket | Male | Female |
| Under 5 Years | 0 (0.0%) | 14 (0.6%) |
| 5 to 17 Years | 319 (2.9%) | 210 (2.2%) |
| 18 to 34 Years | 626 (7.0%) | 239 (2.3%) |
| 35 to 64 Years | 1,318 (6.0%) | 1,085 (4.6%) |
| 65 to 74 Years | 959 (15.1%) | 807 (11.7%) |
| 75 Years and over | 1,313 (40.1%) | 1,634 (49.5%) |
Disability Class by Sex by Age in Sugar Land
Disability Class: Hearing Difficulty
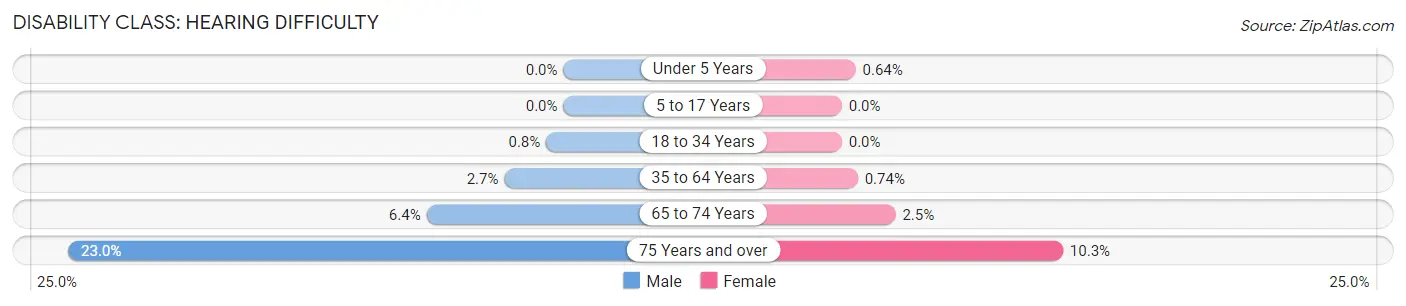
| Age Bracket | Male | Female |
| Under 5 Years | 0 (0.0%) | 14 (0.6%) |
| 5 to 17 Years | 0 (0.0%) | 0 (0.0%) |
| 18 to 34 Years | 72 (0.8%) | 0 (0.0%) |
| 35 to 64 Years | 604 (2.7%) | 175 (0.7%) |
| 65 to 74 Years | 404 (6.4%) | 171 (2.5%) |
| 75 Years and over | 752 (23.0%) | 339 (10.3%) |
Disability Class: Vision Difficulty
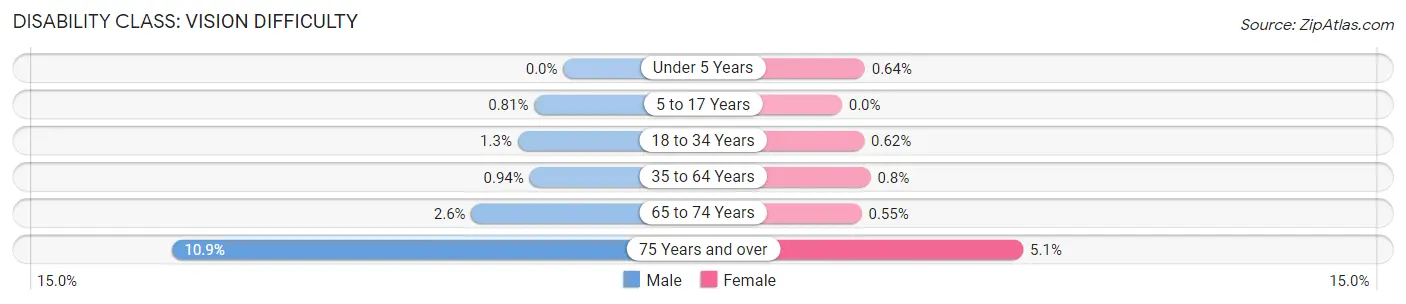
| Age Bracket | Male | Female |
| Under 5 Years | 0 (0.0%) | 14 (0.6%) |
| 5 to 17 Years | 88 (0.8%) | 0 (0.0%) |
| 18 to 34 Years | 114 (1.3%) | 65 (0.6%) |
| 35 to 64 Years | 208 (0.9%) | 189 (0.8%) |
| 65 to 74 Years | 163 (2.6%) | 38 (0.5%) |
| 75 Years and over | 357 (10.9%) | 167 (5.1%) |
Disability Class: Cognitive Difficulty
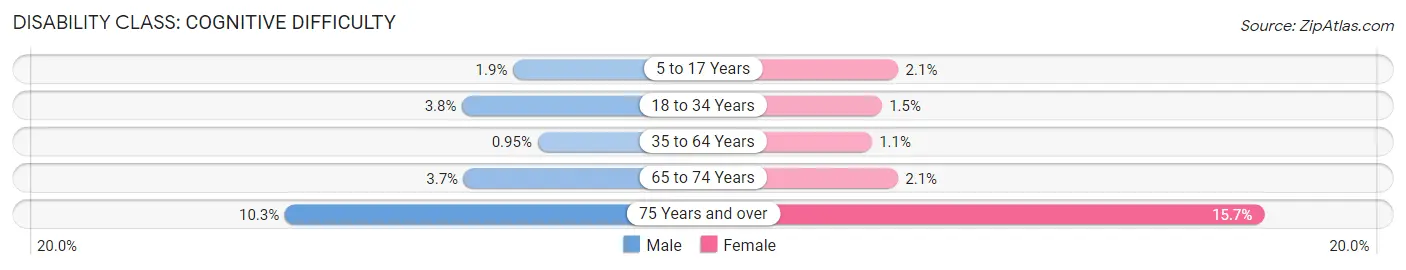
| Age Bracket | Male | Female |
| 5 to 17 Years | 202 (1.9%) | 197 (2.1%) |
| 18 to 34 Years | 337 (3.7%) | 157 (1.5%) |
| 35 to 64 Years | 209 (0.9%) | 267 (1.1%) |
| 65 to 74 Years | 235 (3.7%) | 144 (2.1%) |
| 75 Years and over | 338 (10.3%) | 518 (15.7%) |
Disability Class: Ambulatory Difficulty
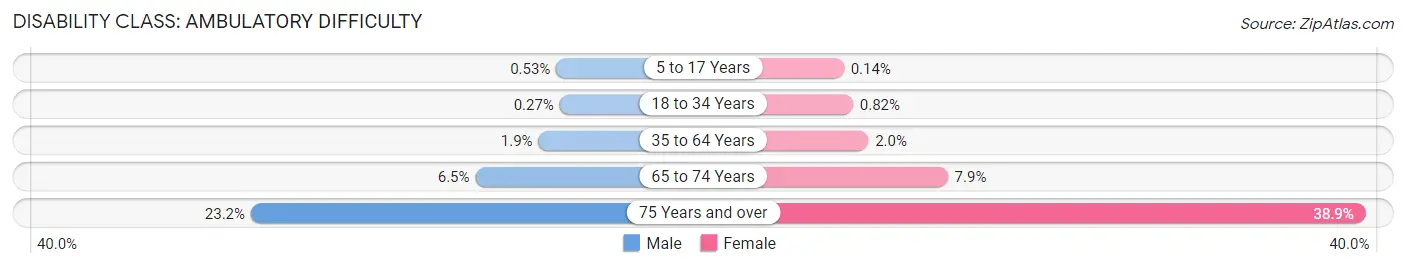
| Age Bracket | Male | Female |
| 5 to 17 Years | 58 (0.5%) | 13 (0.1%) |
| 18 to 34 Years | 24 (0.3%) | 86 (0.8%) |
| 35 to 64 Years | 408 (1.8%) | 465 (2.0%) |
| 65 to 74 Years | 415 (6.5%) | 540 (7.9%) |
| 75 Years and over | 759 (23.2%) | 1,285 (38.9%) |
Disability Class: Self-Care Difficulty
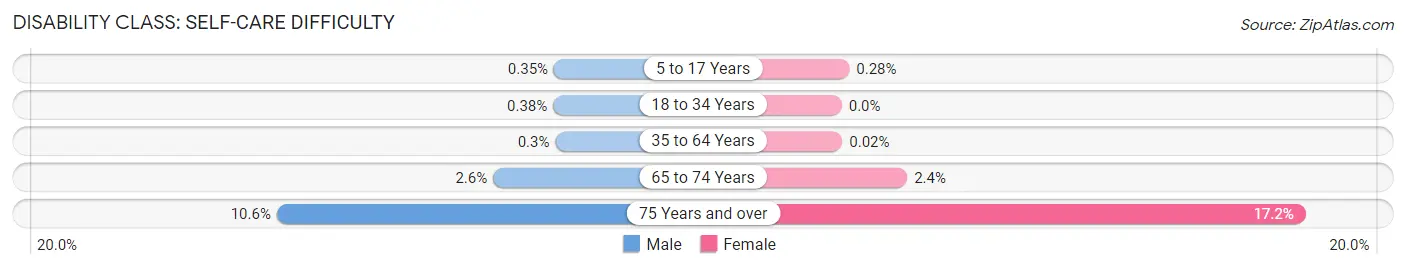
| Age Bracket | Male | Female |
| 5 to 17 Years | 38 (0.4%) | 26 (0.3%) |
| 18 to 34 Years | 34 (0.4%) | 0 (0.0%) |
| 35 to 64 Years | 67 (0.3%) | 4 (0.0%) |
| 65 to 74 Years | 166 (2.6%) | 167 (2.4%) |
| 75 Years and over | 348 (10.6%) | 569 (17.2%) |
Technology Access in Sugar Land
Computing Device Access in Sugar Land
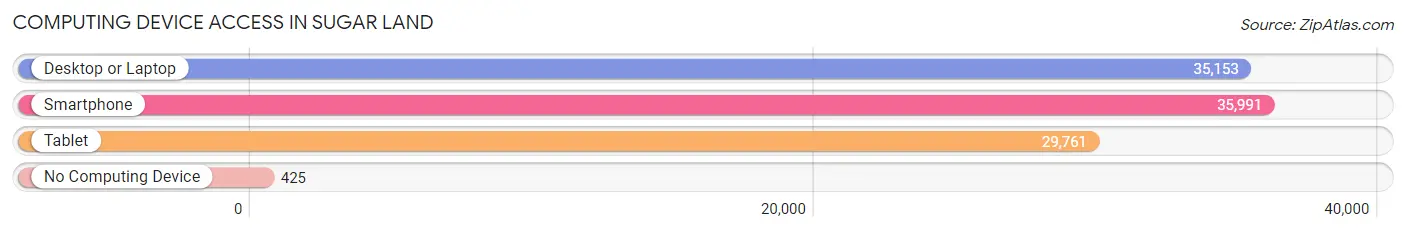
| Device Type | # Households | % Households |
| Desktop or Laptop | 35,153 | 93.8% |
| Smartphone | 35,991 | 96.0% |
| Tablet | 29,761 | 79.4% |
| No Computing Device | 425 | 1.1% |
| Total | 37,481 | 100.0% |
Internet Access in Sugar Land
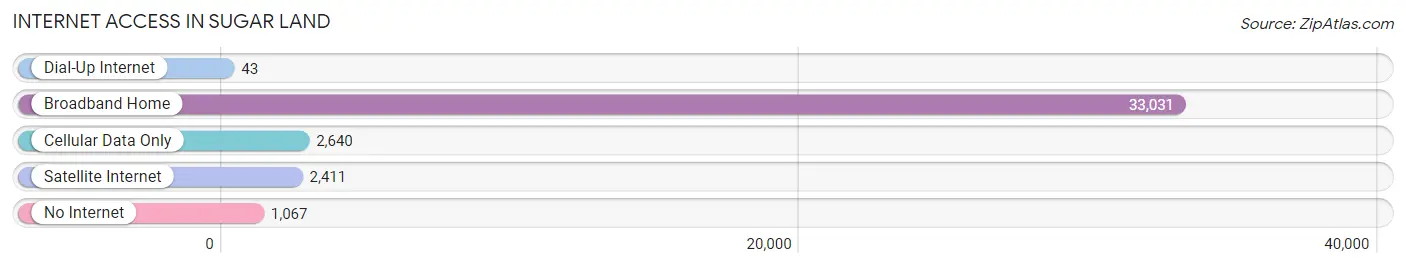
| Internet Type | # Households | % Households |
| Dial-Up Internet | 43 | 0.1% |
| Broadband Home | 33,031 | 88.1% |
| Cellular Data Only | 2,640 | 7.0% |
| Satellite Internet | 2,411 | 6.4% |
| No Internet | 1,067 | 2.9% |
| Total | 37,481 | 100.0% |
Sugar Land Summary
Sugar Land, Texas is a city located in Fort Bend County, Texas, United States. It is part of the Houston–The Woodlands–Sugar Land metropolitan area. As of the 2010 census, the city's population was 78,817. The city is located in the southeastern part of the state, about 19 miles (31 km) southwest of downtown Houston.
History
Sugar Land was founded as a sugar plantation in the early 1800s by William and Mary Williams. The Williams family had purchased land in the area from Stephen F. Austin, the founder of Texas. The plantation was a success, and the Williams family soon became one of the wealthiest in the state. In 1853, the town of Sugar Land was established, and the Williams family continued to operate the plantation until the early 1900s.
In the early 1900s, the Imperial Sugar Company purchased the plantation and began to develop the area into a modern city. The company built a sugar refinery, which became the largest in the world, and the city of Sugar Land was incorporated in 1959.
Geography
Sugar Land is located in southeastern Texas, about 19 miles (31 km) southwest of downtown Houston. It is part of the Houston–The Woodlands–Sugar Land metropolitan area. The city is situated on the banks of the Brazos River and is bordered by the cities of Missouri City, Stafford, and Richmond.
The city has a total area of 24.4 square miles (63.2 km2), of which 24.2 square miles (62.6 km2) is land and 0.2 square miles (0.6 km2) is water.
Economy
Sugar Land is a major economic center in the Houston metropolitan area. The city is home to several large corporations, including Imperial Sugar, Schlumberger, Fluor Corporation, and Minute Maid. The city is also home to several large shopping centers, including First Colony Mall and Sugar Land Town Square.
The city's economy is also supported by a strong tourism industry. Sugar Land is home to several attractions, including the Sugar Land Heritage Museum, the Imperial Sugar Refinery, and the Sugar Land Skeeters minor league baseball team.
Demographics
As of the 2010 census, the city's population was 78,817. The racial makeup of the city was 57.2% White, 24.3% Asian, 11.3% African American, 0.4% Native American, 0.1% Pacific Islander, 4.2% from other races, and 2.5% from two or more races. Hispanic or Latino of any race were 18.2% of the population.
The median income for a household in the city was $87,811, and the median income for a family was $103,945. The per capita income for the city was $41,945. About 5.2% of families and 7.2% of the population were below the poverty line, including 8.2% of those under age 18 and 5.2% of those age 65 or over.
Common Questions
What is Per Capita Income in Sugar Land?
Per Capita income in Sugar Land is $58,237.
What is the Median Family Income in Sugar Land?
Median Family Income in Sugar Land is $154,209.
What is the Median Household income in Sugar Land?
Median Household Income in Sugar Land is $132,247.
What is Income or Wage Gap in Sugar Land?
Income or Wage Gap in Sugar Land is 37.8%.
Women in Sugar Land earn 62.2 cents for every dollar earned by a man.
What is Inequality or Gini Index in Sugar Land?
Inequality or Gini Index in Sugar Land is 0.43.
What is the Total Population of Sugar Land?
Total Population of Sugar Land is 110,077.
What is the Total Male Population of Sugar Land?
Total Male Population of Sugar Land is 54,167.
What is the Total Female Population of Sugar Land?
Total Female Population of Sugar Land is 55,910.
What is the Ratio of Males per 100 Females in Sugar Land?
There are 96.88 Males per 100 Females in Sugar Land.
What is the Ratio of Females per 100 Males in Sugar Land?
There are 103.22 Females per 100 Males in Sugar Land.
What is the Median Population Age in Sugar Land?
Median Population Age in Sugar Land is 42.5 Years.
What is the Average Family Size in Sugar Land
Average Family Size in Sugar Land is 3.3 People.
What is the Average Household Size in Sugar Land
Average Household Size in Sugar Land is 2.9 People.
How Large is the Labor Force in Sugar Land?
There are 56,564 People in the Labor Forcein in Sugar Land.
What is the Percentage of People in the Labor Force in Sugar Land?
63.8% of People are in the Labor Force in Sugar Land.
What is the Unemployment Rate in Sugar Land?
Unemployment Rate in Sugar Land is 5.0%.