Allen, TX Map & Demographics
Allen Map
Allen Overview
$51,413
PER CAPITA INCOME
$138,731
AVG FAMILY INCOME
$121,259
AVG HOUSEHOLD INCOME
42.8%
WAGE / INCOME GAP [ % ]
57.2¢/ $1
WAGE / INCOME GAP [ $ ]
0.40
INEQUALITY / GINI INDEX
105,444
TOTAL POPULATION
53,451
MALE POPULATION
51,993
FEMALE POPULATION
102.80
MALES / 100 FEMALES
97.27
FEMALES / 100 MALES
37.8
MEDIAN AGE
3.4
AVG FAMILY SIZE
3.0
AVG HOUSEHOLD SIZE
57,340
LABOR FORCE [ PEOPLE ]
70.5%
PERCENT IN LABOR FORCE
4.3%
UNEMPLOYMENT RATE
Income in Allen
Income Overview in Allen
Per Capita Income in Allen is $51,413, while median incomes of families and households are $138,731 and $121,259 respectively.
| Characteristic | Number | Measure |
| Per Capita Income | 105,444 | $51,413 |
| Median Family Income | 27,379 | $138,731 |
| Mean Family Income | 27,379 | $165,125 |
| Median Household Income | 35,111 | $121,259 |
| Mean Household Income | 35,111 | $150,270 |
| Income Deficit | 27,379 | $0 |
| Wage / Income Gap (%) | 105,444 | 42.75% |
| Wage / Income Gap ($) | 105,444 | 57.25¢ per $1 |
| Gini / Inequality Index | 105,444 | 0.40 |
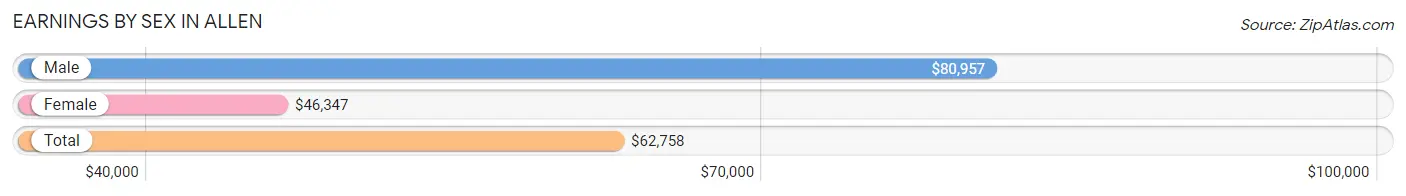
Earnings by Sex in Allen
Average Earnings in Allen are $62,758, $80,957 for men and $46,347 for women, a difference of 42.7%.
| Sex | Number | Average Earnings |
| Male | 32,550 (55.5%) | $80,957 |
| Female | 26,125 (44.5%) | $46,347 |
| Total | 58,675 (100.0%) | $62,758 |
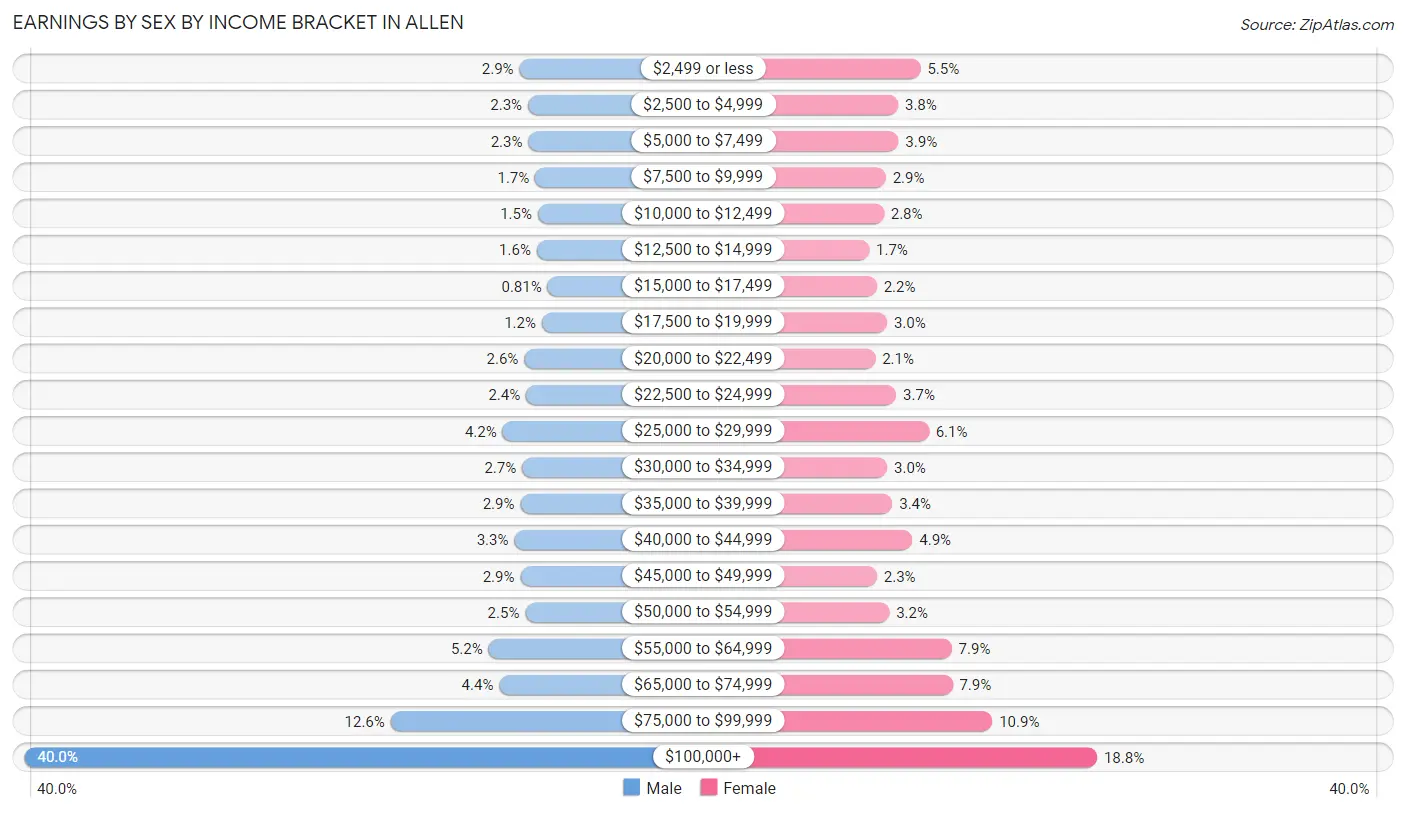
Earnings by Sex by Income Bracket in Allen
The most common earnings brackets in Allen are $100,000+ for men (13,021 | 40.0%) and $100,000+ for women (4,898 | 18.8%).
| Income | Male | Female |
| $2,499 or less | 950 (2.9%) | 1,442 (5.5%) |
| $2,500 to $4,999 | 743 (2.3%) | 1,004 (3.8%) |
| $5,000 to $7,499 | 732 (2.2%) | 1,011 (3.9%) |
| $7,500 to $9,999 | 565 (1.7%) | 762 (2.9%) |
| $10,000 to $12,499 | 502 (1.5%) | 724 (2.8%) |
| $12,500 to $14,999 | 526 (1.6%) | 436 (1.7%) |
| $15,000 to $17,499 | 265 (0.8%) | 585 (2.2%) |
| $17,500 to $19,999 | 403 (1.2%) | 787 (3.0%) |
| $20,000 to $22,499 | 833 (2.6%) | 557 (2.1%) |
| $22,500 to $24,999 | 789 (2.4%) | 967 (3.7%) |
| $25,000 to $29,999 | 1,361 (4.2%) | 1,603 (6.1%) |
| $30,000 to $34,999 | 885 (2.7%) | 788 (3.0%) |
| $35,000 to $39,999 | 929 (2.9%) | 891 (3.4%) |
| $40,000 to $44,999 | 1,074 (3.3%) | 1,284 (4.9%) |
| $45,000 to $49,999 | 929 (2.9%) | 587 (2.2%) |
| $50,000 to $54,999 | 807 (2.5%) | 831 (3.2%) |
| $55,000 to $64,999 | 1,702 (5.2%) | 2,053 (7.9%) |
| $65,000 to $74,999 | 1,442 (4.4%) | 2,068 (7.9%) |
| $75,000 to $99,999 | 4,092 (12.6%) | 2,847 (10.9%) |
| $100,000+ | 13,021 (40.0%) | 4,898 (18.8%) |
| Total | 32,550 (100.0%) | 26,125 (100.0%) |
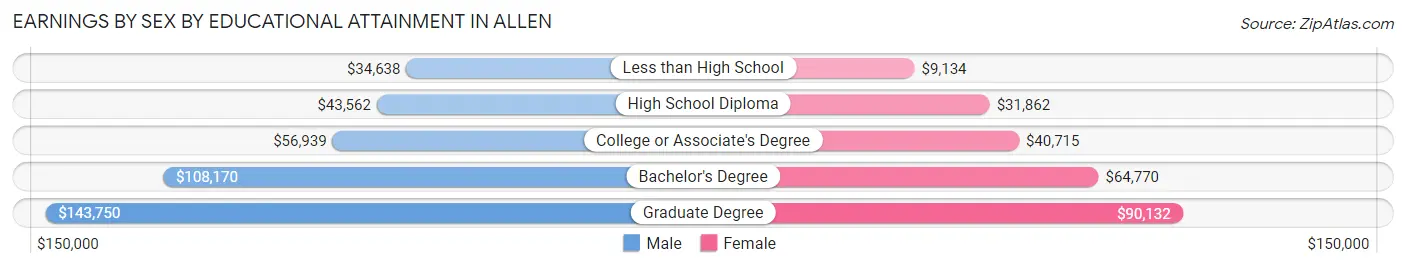
Earnings by Sex by Educational Attainment in Allen
Average earnings in Allen are $92,892 for men and $55,854 for women, a difference of 39.9%. Men with an educational attainment of graduate degree enjoy the highest average annual earnings of $143,750, while those with less than high school education earn the least with $34,638. Women with an educational attainment of graduate degree earn the most with the average annual earnings of $90,132, while those with less than high school education have the smallest earnings of $9,134.
| Educational Attainment | Male Income | Female Income |
| Less than High School | $34,638 | $9,134 |
| High School Diploma | $43,562 | $31,862 |
| College or Associate's Degree | $56,939 | $40,715 |
| Bachelor's Degree | $108,170 | $64,770 |
| Graduate Degree | $143,750 | $90,132 |
| Total | $92,892 | $55,854 |
Family Income in Allen
Family Income Brackets in Allen
According to the Allen family income data, there are 7,803 families falling into the $200,000+ income range, which is the most common income bracket and makes up 28.5% of all families. Conversely, the $10,000 to $14,999 income bracket is the least frequent group with only 137 families (0.5%) belonging to this category.
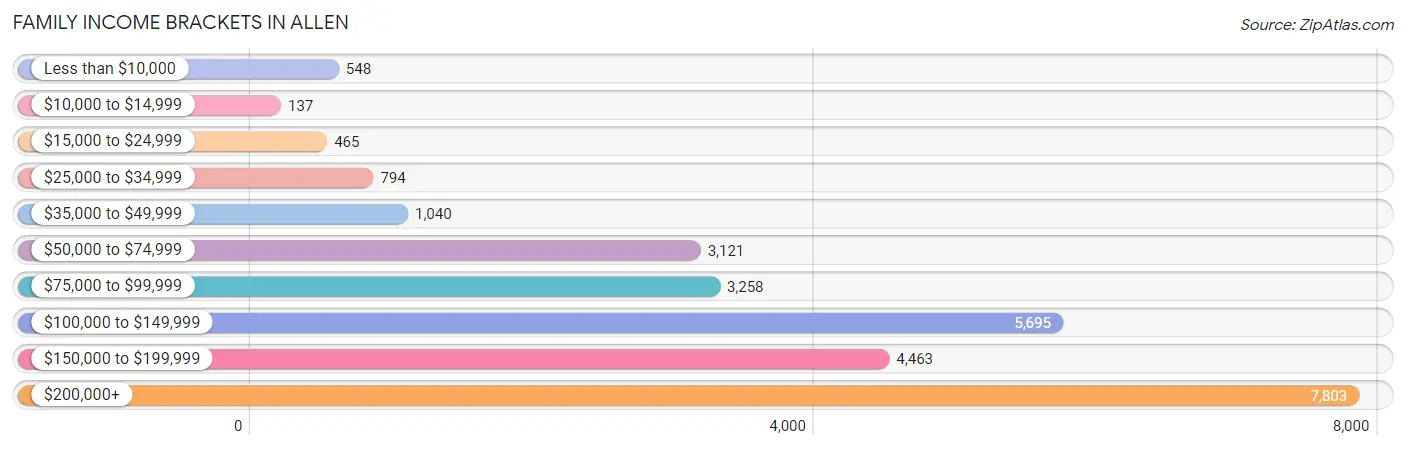
| Income Bracket | # Families | % Families |
| Less than $10,000 | 548 | 2.0% |
| $10,000 to $14,999 | 137 | 0.5% |
| $15,000 to $24,999 | 465 | 1.7% |
| $25,000 to $34,999 | 794 | 2.9% |
| $35,000 to $49,999 | 1,040 | 3.8% |
| $50,000 to $74,999 | 3,121 | 11.4% |
| $75,000 to $99,999 | 3,258 | 11.9% |
| $100,000 to $149,999 | 5,695 | 20.8% |
| $150,000 to $199,999 | 4,463 | 16.3% |
| $200,000+ | 7,803 | 28.5% |
Family Income by Famaliy Size in Allen
7+ person families (384 | 1.4%) account for the highest median family income in Allen with $250,001 per family, while 2-person families (9,393 | 34.3%) have the highest median income of $53,142 per family member.
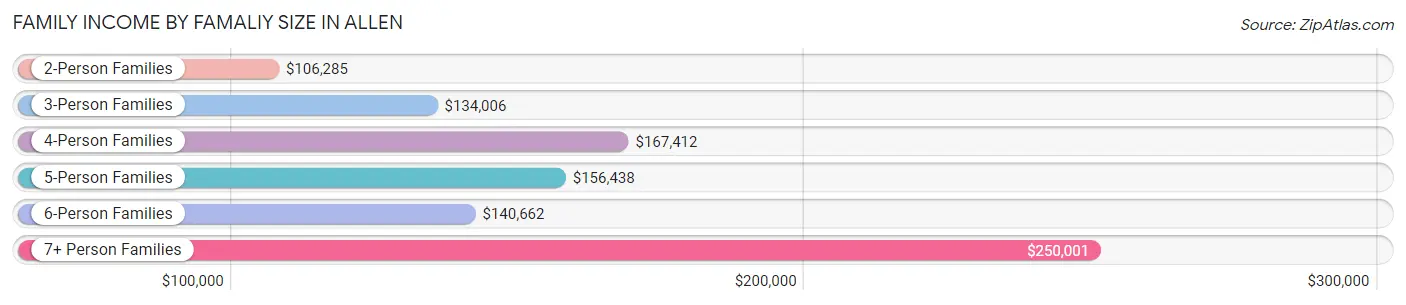
| Income Bracket | # Families | Median Income |
| 2-Person Families | 9,393 (34.3%) | $106,285 |
| 3-Person Families | 6,738 (24.6%) | $134,006 |
| 4-Person Families | 6,410 (23.4%) | $167,412 |
| 5-Person Families | 3,325 (12.1%) | $156,438 |
| 6-Person Families | 1,129 (4.1%) | $140,662 |
| 7+ Person Families | 384 (1.4%) | $250,001 |
| Total | 27,379 (100.0%) | $138,731 |
Family Income by Number of Earners in Allen
The median family income in Allen is $138,731, with families comprising 3+ earners (4,232) having the highest median family income of $188,625, while families with no earners (1,673) have the lowest median family income of $54,477, accounting for 15.5% and 6.1% of families, respectively.
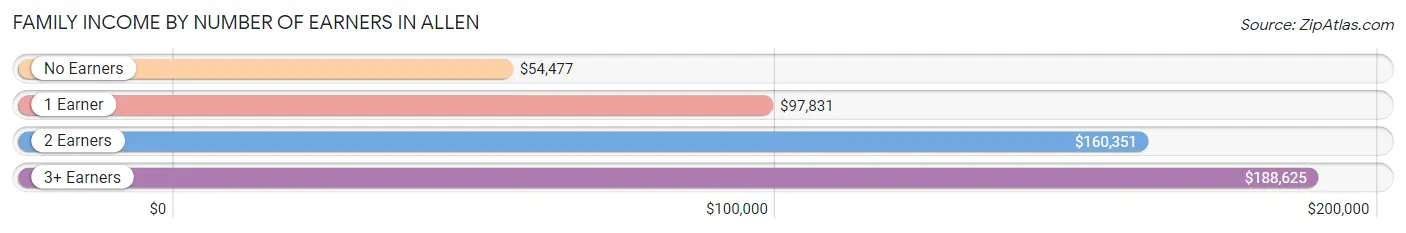
| Number of Earners | # Families | Median Income |
| No Earners | 1,673 (6.1%) | $54,477 |
| 1 Earner | 8,778 (32.1%) | $97,831 |
| 2 Earners | 12,696 (46.4%) | $160,351 |
| 3+ Earners | 4,232 (15.5%) | $188,625 |
| Total | 27,379 (100.0%) | $138,731 |
Household Income in Allen
Household Income Brackets in Allen
With 8,532 households falling in the category, the $200,000+ income range is the most frequent in Allen, accounting for 24.3% of all households. In contrast, only 316 households (0.9%) fall into the $10,000 to $14,999 income bracket, making it the least populous group.
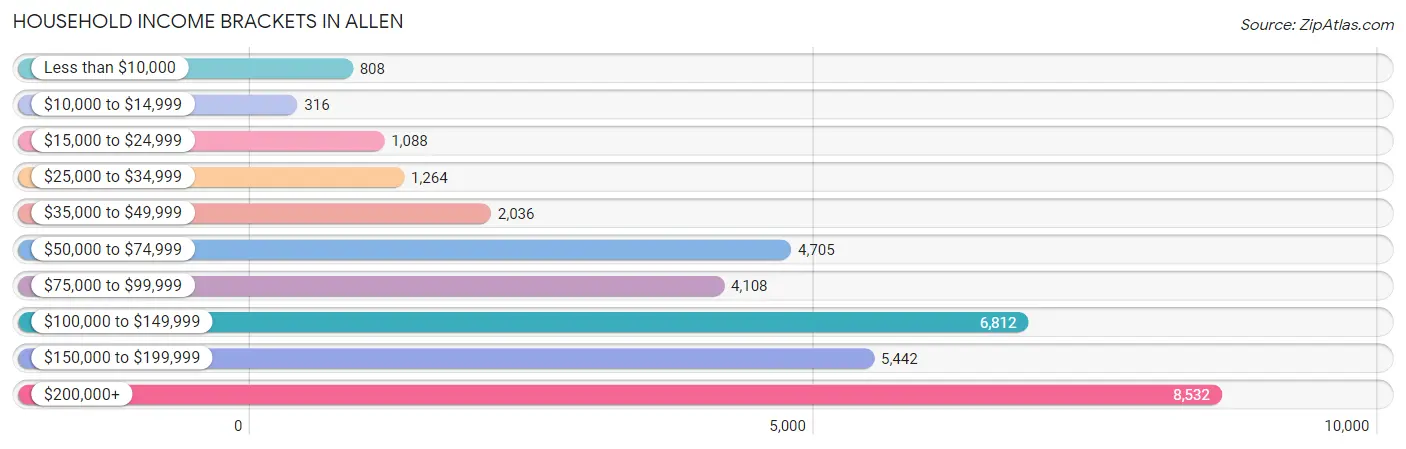
| Income Bracket | # Households | % Households |
| Less than $10,000 | 808 | 2.3% |
| $10,000 to $14,999 | 316 | 0.9% |
| $15,000 to $24,999 | 1,088 | 3.1% |
| $25,000 to $34,999 | 1,264 | 3.6% |
| $35,000 to $49,999 | 2,036 | 5.8% |
| $50,000 to $74,999 | 4,705 | 13.4% |
| $75,000 to $99,999 | 4,108 | 11.7% |
| $100,000 to $149,999 | 6,812 | 19.4% |
| $150,000 to $199,999 | 5,442 | 15.5% |
| $200,000+ | 8,532 | 24.3% |
Household Income by Householder Age in Allen
The median household income in Allen is $121,259, with the highest median household income of $140,279 found in the 25 to 44 years age bracket for the primary householder. A total of 11,965 households (34.1%) fall into this category. Meanwhile, the 15 to 24 years age bracket for the primary householder has the lowest median household income of $46,250, with 771 households (2.2%) in this group.
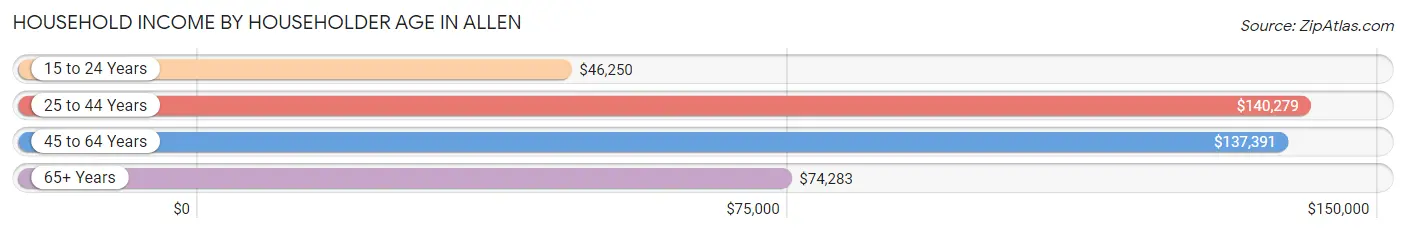
| Income Bracket | # Households | Median Income |
| 15 to 24 Years | 771 (2.2%) | $46,250 |
| 25 to 44 Years | 11,965 (34.1%) | $140,279 |
| 45 to 64 Years | 16,563 (47.2%) | $137,391 |
| 65+ Years | 5,812 (16.6%) | $74,283 |
| Total | 35,111 (100.0%) | $121,259 |
Poverty in Allen
Income Below Poverty by Sex and Age in Allen
With 3.4% poverty level for males and 7.0% for females among the residents of Allen, 5 year old males and under 5 year old females are the most vulnerable to poverty, with 64 males (8.7%) and 444 females (16.8%) in their respective age groups living below the poverty level.
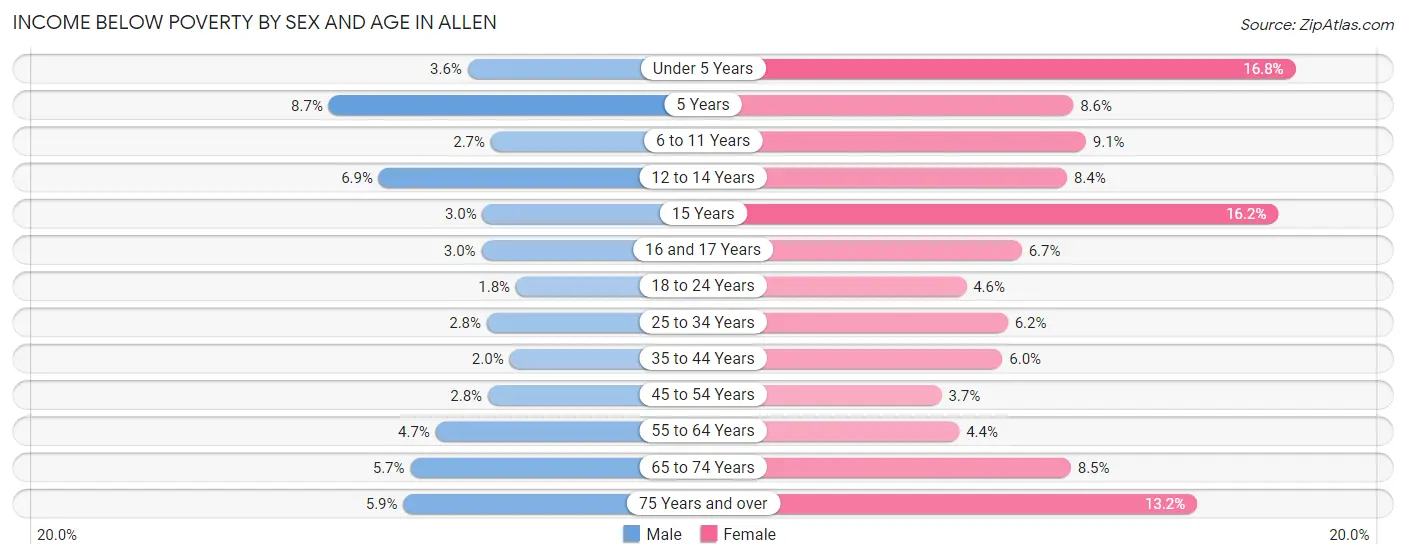
| Age Bracket | Male | Female |
| Under 5 Years | 102 (3.5%) | 444 (16.8%) |
| 5 Years | 64 (8.7%) | 51 (8.6%) |
| 6 to 11 Years | 142 (2.7%) | 450 (9.1%) |
| 12 to 14 Years | 173 (6.9%) | 236 (8.4%) |
| 15 Years | 23 (3.0%) | 109 (16.2%) |
| 16 and 17 Years | 56 (3.0%) | 89 (6.7%) |
| 18 to 24 Years | 94 (1.8%) | 194 (4.6%) |
| 25 to 34 Years | 182 (2.8%) | 339 (6.2%) |
| 35 to 44 Years | 136 (2.0%) | 483 (6.0%) |
| 45 to 54 Years | 246 (2.8%) | 339 (3.7%) |
| 55 to 64 Years | 324 (4.7%) | 262 (4.4%) |
| 65 to 74 Years | 193 (5.7%) | 292 (8.5%) |
| 75 Years and over | 95 (5.9%) | 307 (13.2%) |
| Total | 1,830 (3.4%) | 3,595 (7.0%) |
Income Above Poverty by Sex and Age in Allen
According to the poverty statistics in Allen, males aged 18 to 24 years and females aged 45 to 54 years are the age groups that are most secure financially, with 98.2% of males and 96.3% of females in these age groups living above the poverty line.
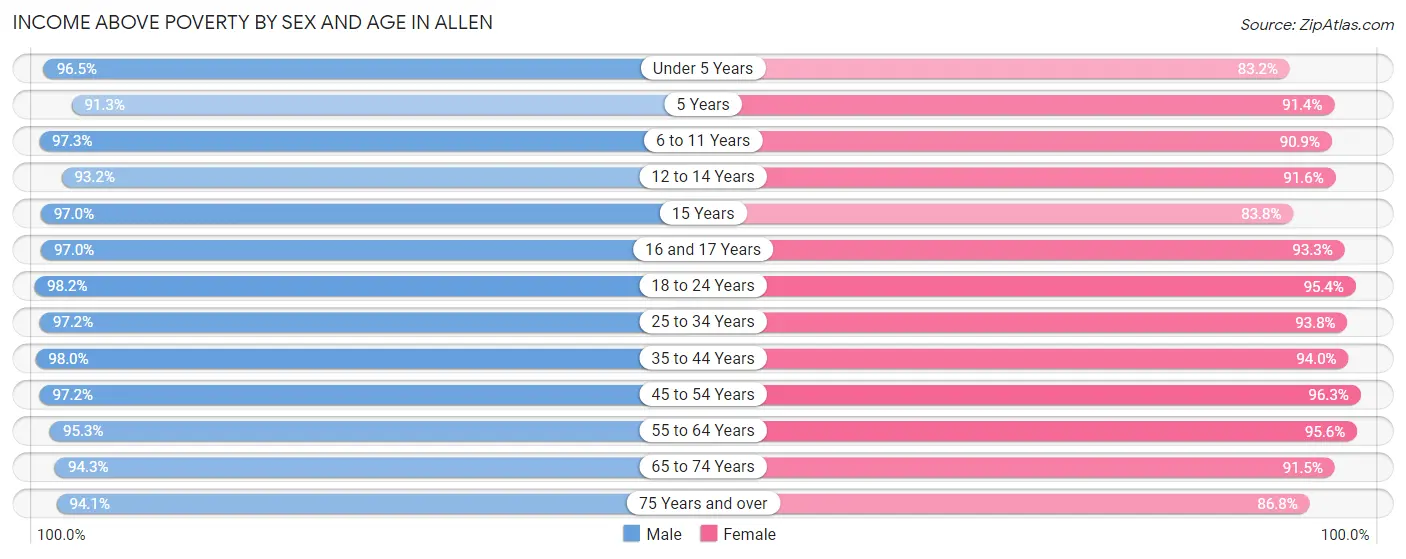
| Age Bracket | Male | Female |
| Under 5 Years | 2,772 (96.5%) | 2,193 (83.2%) |
| 5 Years | 671 (91.3%) | 543 (91.4%) |
| 6 to 11 Years | 5,129 (97.3%) | 4,519 (90.9%) |
| 12 to 14 Years | 2,351 (93.1%) | 2,587 (91.6%) |
| 15 Years | 744 (97.0%) | 564 (83.8%) |
| 16 and 17 Years | 1,786 (97.0%) | 1,243 (93.3%) |
| 18 to 24 Years | 5,235 (98.2%) | 4,007 (95.4%) |
| 25 to 34 Years | 6,221 (97.2%) | 5,161 (93.8%) |
| 35 to 44 Years | 6,673 (98.0%) | 7,615 (94.0%) |
| 45 to 54 Years | 8,536 (97.2%) | 8,815 (96.3%) |
| 55 to 64 Years | 6,513 (95.3%) | 5,747 (95.6%) |
| 65 to 74 Years | 3,202 (94.3%) | 3,142 (91.5%) |
| 75 Years and over | 1,503 (94.1%) | 2,021 (86.8%) |
| Total | 51,336 (96.6%) | 48,157 (93.0%) |
Income Below Poverty Among Married-Couple Families in Allen
The poverty statistics for married-couple families in Allen show that 2.2% or 508 of the total 23,103 families live below the poverty line. Families with 3 or 4 children have the highest poverty rate of 4.0%, comprising of 106 families. On the other hand, families with 5 or more children have the lowest poverty rate of 0.0%, which includes 0 families.
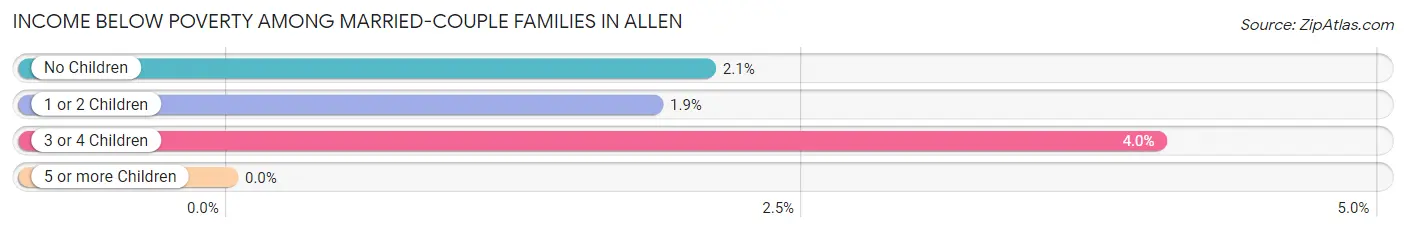
| Children | Above Poverty | Below Poverty |
| No Children | 10,416 (97.9%) | 221 (2.1%) |
| 1 or 2 Children | 9,578 (98.2%) | 181 (1.8%) |
| 3 or 4 Children | 2,521 (96.0%) | 106 (4.0%) |
| 5 or more Children | 80 (100.0%) | 0 (0.0%) |
| Total | 22,595 (97.8%) | 508 (2.2%) |
Income Below Poverty Among Single-Parent Households in Allen
According to the poverty data in Allen, 5.9% or 77 single-father households and 18.4% or 548 single-mother households are living below the poverty line. Among single-father households, those with 1 or 2 children have the highest poverty rate, with 46 households (8.6%) experiencing poverty. Likewise, among single-mother households, those with 3 or 4 children have the highest poverty rate, with 203 households (46.0%) falling below the poverty line.
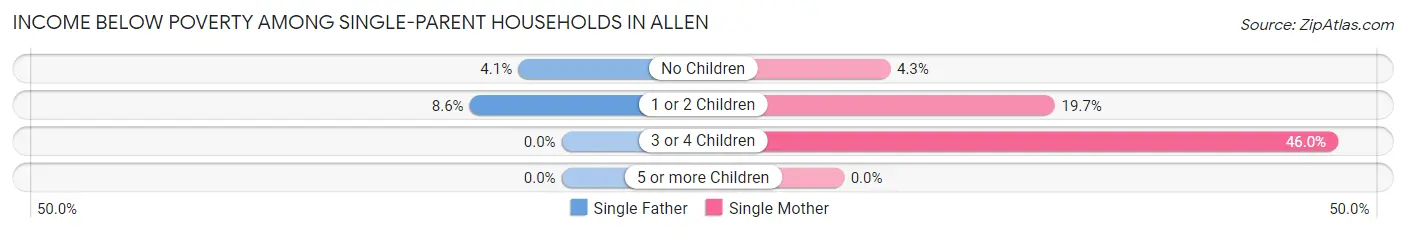
| Children | Single Father | Single Mother |
| No Children | 31 (4.1%) | 43 (4.3%) |
| 1 or 2 Children | 46 (8.6%) | 302 (19.7%) |
| 3 or 4 Children | 0 (0.0%) | 203 (46.0%) |
| 5 or more Children | 0 (0.0%) | 0 (0.0%) |
| Total | 77 (5.9%) | 548 (18.4%) |
Income Below Poverty Among Married-Couple vs Single-Parent Households in Allen
The poverty data for Allen shows that 508 of the married-couple family households (2.2%) and 625 of the single-parent households (14.6%) are living below the poverty level. Within the married-couple family households, those with 3 or 4 children have the highest poverty rate, with 106 households (4.0%) falling below the poverty line. Among the single-parent households, those with 3 or 4 children have the highest poverty rate, with 203 household (46.0%) living below poverty.
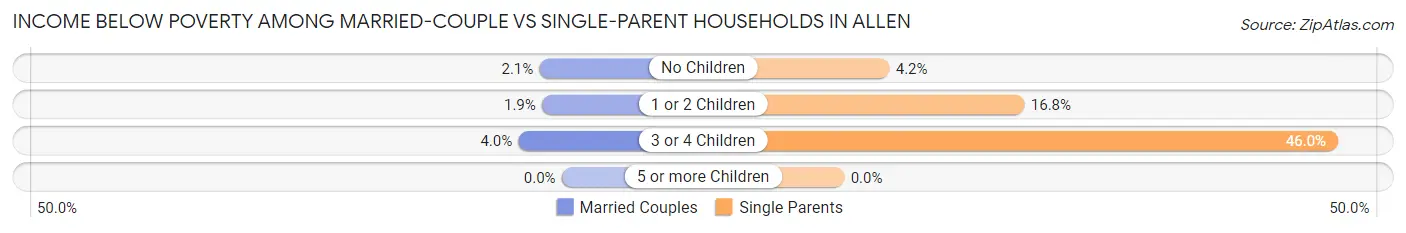
| Children | Married-Couple Families | Single-Parent Households |
| No Children | 221 (2.1%) | 74 (4.2%) |
| 1 or 2 Children | 181 (1.8%) | 348 (16.8%) |
| 3 or 4 Children | 106 (4.0%) | 203 (46.0%) |
| 5 or more Children | 0 (0.0%) | 0 (0.0%) |
| Total | 508 (2.2%) | 625 (14.6%) |
Race in Allen
The most populous races in Allen are White / Caucasian (60,533 | 57.4%), Asian (20,063 | 19.0%), and Hispanic or Latino (12,516 | 11.9%).
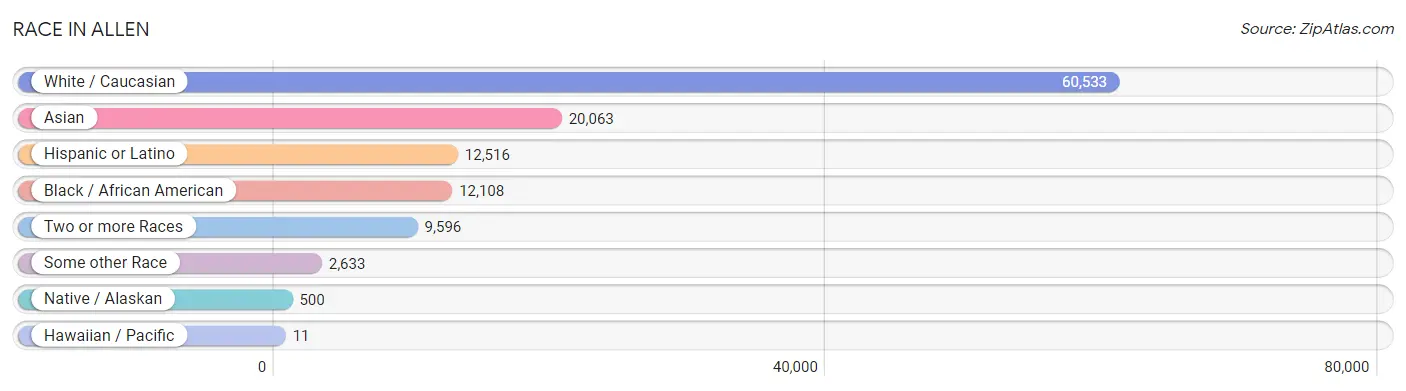
| Race | # Population | % Population |
| Asian | 20,063 | 19.0% |
| Black / African American | 12,108 | 11.5% |
| Hawaiian / Pacific | 11 | 0.0% |
| Hispanic or Latino | 12,516 | 11.9% |
| Native / Alaskan | 500 | 0.5% |
| White / Caucasian | 60,533 | 57.4% |
| Two or more Races | 9,596 | 9.1% |
| Some other Race | 2,633 | 2.5% |
| Total | 105,444 | 100.0% |
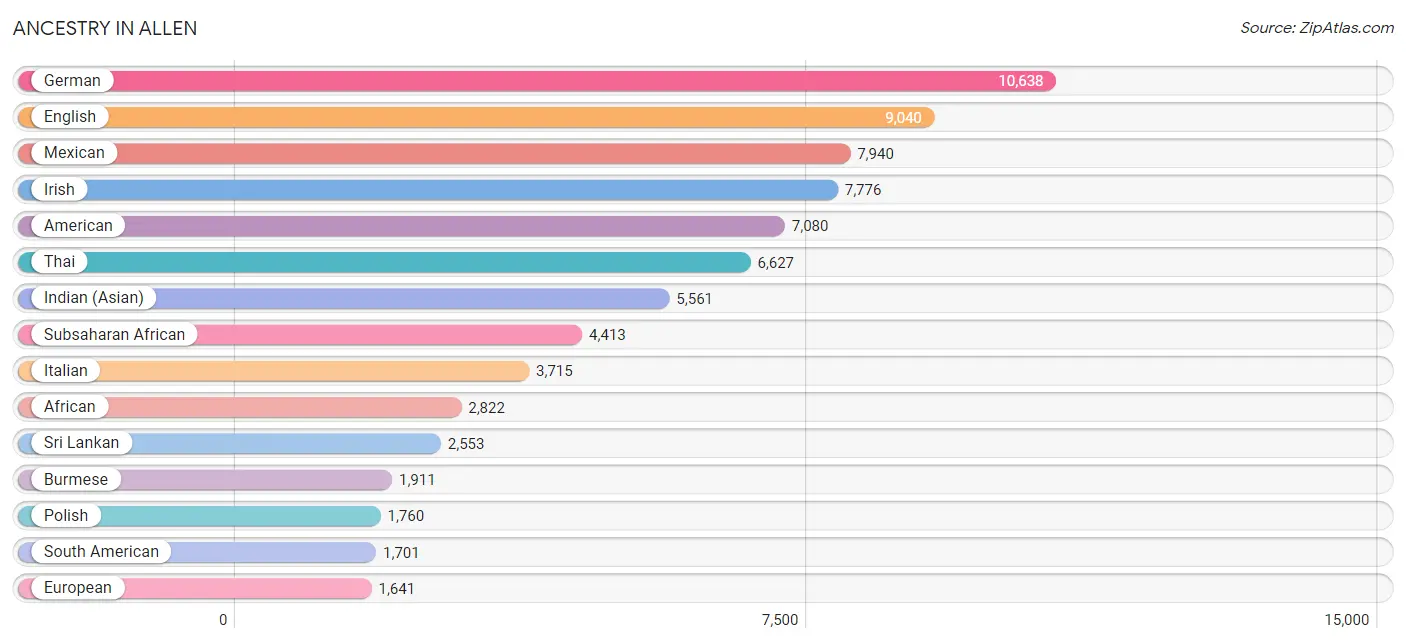
Ancestry in Allen
The most populous ancestries reported in Allen are German (10,638 | 10.1%), English (9,040 | 8.6%), Mexican (7,940 | 7.5%), Irish (7,776 | 7.4%), and American (7,080 | 6.7%), together accounting for 40.3% of all Allen residents.
| Ancestry | # Population | % Population |
| Afghan | 121 | 0.1% |
| African | 2,822 | 2.7% |
| Albanian | 17 | 0.0% |
| American | 7,080 | 6.7% |
| Apache | 45 | 0.0% |
| Arab | 1,463 | 1.4% |
| Argentinean | 124 | 0.1% |
| Australian | 16 | 0.0% |
| Austrian | 91 | 0.1% |
| Barbadian | 15 | 0.0% |
| Belgian | 111 | 0.1% |
| Bhutanese | 770 | 0.7% |
| Brazilian | 252 | 0.2% |
| British | 736 | 0.7% |
| Burmese | 1,911 | 1.8% |
| Cajun | 171 | 0.2% |
| Canadian | 122 | 0.1% |
| Central American | 829 | 0.8% |
| Central American Indian | 320 | 0.3% |
| Cherokee | 452 | 0.4% |
| Chilean | 264 | 0.3% |
| Choctaw | 66 | 0.1% |
| Colombian | 405 | 0.4% |
| Comanche | 24 | 0.0% |
| Costa Rican | 20 | 0.0% |
| Croatian | 34 | 0.0% |
| Cuban | 115 | 0.1% |
| Czech | 1,590 | 1.5% |
| Czechoslovakian | 78 | 0.1% |
| Danish | 435 | 0.4% |
| Dominican | 50 | 0.1% |
| Dutch | 538 | 0.5% |
| Dutch West Indian | 10 | 0.0% |
| Eastern European | 223 | 0.2% |
| Ecuadorian | 43 | 0.0% |
| Egyptian | 100 | 0.1% |
| English | 9,040 | 8.6% |
| Ethiopian | 592 | 0.6% |
| European | 1,641 | 1.6% |
| Filipino | 475 | 0.4% |
| Finnish | 75 | 0.1% |
| French | 1,580 | 1.5% |
| French Canadian | 234 | 0.2% |
| German | 10,638 | 10.1% |
| Ghanaian | 77 | 0.1% |
| Greek | 202 | 0.2% |
| Guatemalan | 405 | 0.4% |
| Guyanese | 23 | 0.0% |
| Haitian | 15 | 0.0% |
| Honduran | 154 | 0.2% |
| Hopi | 34 | 0.0% |
| Hungarian | 226 | 0.2% |
| Indian (Asian) | 5,561 | 5.3% |
| Iranian | 619 | 0.6% |
| Iraqi | 426 | 0.4% |
| Irish | 7,776 | 7.4% |
| Israeli | 54 | 0.1% |
| Italian | 3,715 | 3.5% |
| Jamaican | 140 | 0.1% |
| Japanese | 183 | 0.2% |
| Jordanian | 66 | 0.1% |
| Korean | 1,092 | 1.0% |
| Laotian | 428 | 0.4% |
| Lebanese | 232 | 0.2% |
| Lithuanian | 117 | 0.1% |
| Lumbee | 11 | 0.0% |
| Malaysian | 263 | 0.3% |
| Mexican | 7,940 | 7.5% |
| Mexican American Indian | 61 | 0.1% |
| Moroccan | 20 | 0.0% |
| Native Hawaiian | 68 | 0.1% |
| Navajo | 72 | 0.1% |
| Nigerian | 643 | 0.6% |
| Northern European | 51 | 0.1% |
| Norwegian | 496 | 0.5% |
| Osage | 24 | 0.0% |
| Pakistani | 187 | 0.2% |
| Palestinian | 128 | 0.1% |
| Panamanian | 69 | 0.1% |
| Pennsylvania German | 15 | 0.0% |
| Peruvian | 684 | 0.6% |
| Polish | 1,760 | 1.7% |
| Portuguese | 327 | 0.3% |
| Pueblo | 112 | 0.1% |
| Puerto Rican | 650 | 0.6% |
| Romanian | 170 | 0.2% |
| Russian | 255 | 0.2% |
| Salvadoran | 181 | 0.2% |
| Scandinavian | 560 | 0.5% |
| Scotch-Irish | 1,616 | 1.5% |
| Scottish | 1,523 | 1.4% |
| Serbian | 15 | 0.0% |
| Slavic | 21 | 0.0% |
| Slovak | 107 | 0.1% |
| Slovene | 90 | 0.1% |
| South African | 152 | 0.1% |
| South American | 1,701 | 1.6% |
| Spaniard | 245 | 0.2% |
| Spanish | 544 | 0.5% |
| Spanish American Indian | 59 | 0.1% |
| Sri Lankan | 2,553 | 2.4% |
| Subsaharan African | 4,413 | 4.2% |
| Swedish | 763 | 0.7% |
| Swiss | 232 | 0.2% |
| Syrian | 20 | 0.0% |
| Thai | 6,627 | 6.3% |
| Trinidadian and Tobagonian | 11 | 0.0% |
| Turkish | 614 | 0.6% |
| Ukrainian | 158 | 0.2% |
| Venezuelan | 181 | 0.2% |
| Vietnamese | 380 | 0.4% |
| Welsh | 718 | 0.7% |
| West Indian | 26 | 0.0% |
| Yaqui | 65 | 0.1% |
| Yugoslavian | 8 | 0.0% | View All 115 Rows |
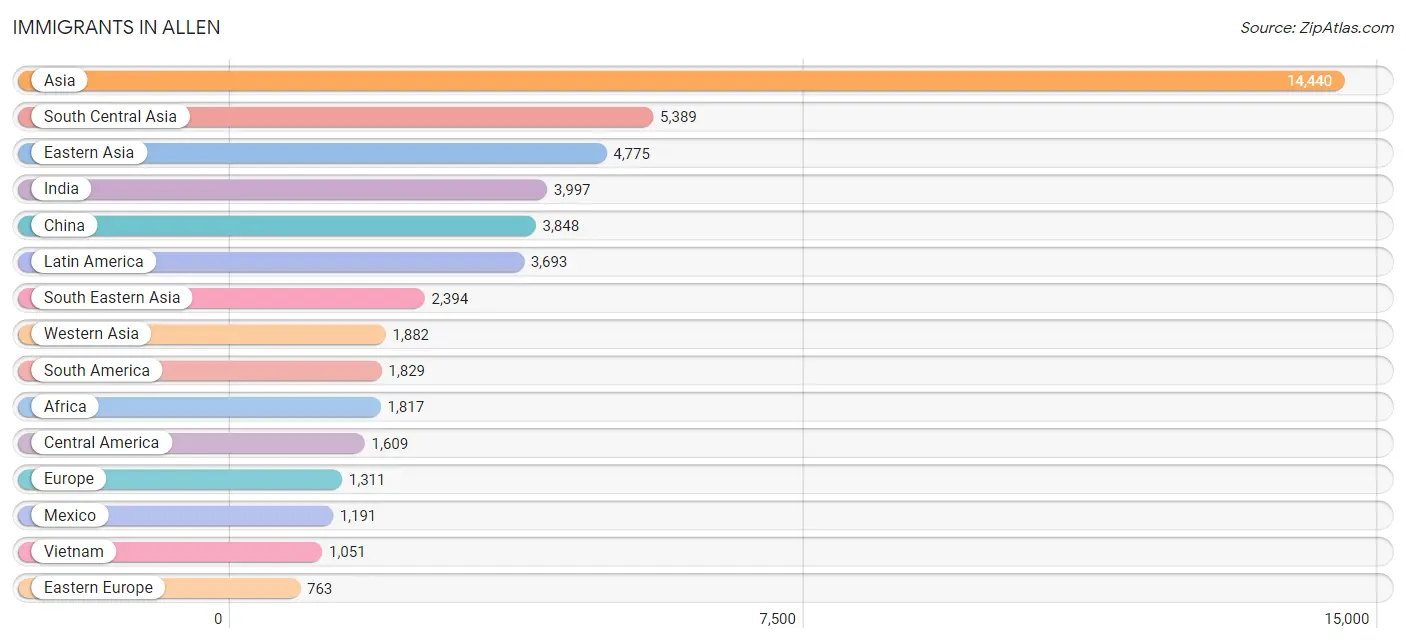
Immigrants in Allen
The most numerous immigrant groups reported in Allen came from Asia (14,440 | 13.7%), South Central Asia (5,389 | 5.1%), Eastern Asia (4,775 | 4.5%), India (3,997 | 3.8%), and China (3,848 | 3.6%), together accounting for 30.8% of all Allen residents.
| Immigration Origin | # Population | % Population |
| Afghanistan | 89 | 0.1% |
| Africa | 1,817 | 1.7% |
| Argentina | 110 | 0.1% |
| Asia | 14,440 | 13.7% |
| Australia | 16 | 0.0% |
| Bahamas | 14 | 0.0% |
| Bangladesh | 404 | 0.4% |
| Barbados | 15 | 0.0% |
| Brazil | 460 | 0.4% |
| Cambodia | 199 | 0.2% |
| Cameroon | 67 | 0.1% |
| Canada | 472 | 0.4% |
| Caribbean | 255 | 0.2% |
| Central America | 1,609 | 1.5% |
| Chile | 253 | 0.2% |
| China | 3,848 | 3.6% |
| Colombia | 124 | 0.1% |
| Costa Rica | 20 | 0.0% |
| Cuba | 30 | 0.0% |
| Dominican Republic | 33 | 0.0% |
| Eastern Africa | 392 | 0.4% |
| Eastern Asia | 4,775 | 4.5% |
| Eastern Europe | 763 | 0.7% |
| Ecuador | 43 | 0.0% |
| Egypt | 57 | 0.1% |
| El Salvador | 154 | 0.2% |
| England | 27 | 0.0% |
| Eritrea | 75 | 0.1% |
| Ethiopia | 271 | 0.3% |
| Europe | 1,311 | 1.2% |
| France | 49 | 0.1% |
| Germany | 105 | 0.1% |
| Guatemala | 92 | 0.1% |
| Guyana | 23 | 0.0% |
| Honduras | 124 | 0.1% |
| Hong Kong | 118 | 0.1% |
| India | 3,997 | 3.8% |
| Indonesia | 208 | 0.2% |
| Iran | 308 | 0.3% |
| Iraq | 430 | 0.4% |
| Israel | 166 | 0.2% |
| Italy | 19 | 0.0% |
| Jamaica | 126 | 0.1% |
| Japan | 288 | 0.3% |
| Jordan | 66 | 0.1% |
| Kenya | 46 | 0.0% |
| Korea | 639 | 0.6% |
| Kuwait | 227 | 0.2% |
| Laos | 165 | 0.2% |
| Latin America | 3,693 | 3.5% |
| Latvia | 11 | 0.0% |
| Lebanon | 411 | 0.4% |
| Mexico | 1,191 | 1.1% |
| Middle Africa | 67 | 0.1% |
| Moldova | 29 | 0.0% |
| Morocco | 21 | 0.0% |
| Netherlands | 69 | 0.1% |
| Nigeria | 118 | 0.1% |
| North Macedonia | 17 | 0.0% |
| Northern Africa | 162 | 0.2% |
| Northern Europe | 306 | 0.3% |
| Oceania | 33 | 0.0% |
| Pakistan | 494 | 0.5% |
| Panama | 28 | 0.0% |
| Peru | 441 | 0.4% |
| Philippines | 661 | 0.6% |
| Poland | 205 | 0.2% |
| Romania | 234 | 0.2% |
| Russia | 112 | 0.1% |
| Scotland | 22 | 0.0% |
| Sierra Leone | 89 | 0.1% |
| South Africa | 148 | 0.1% |
| South America | 1,829 | 1.7% |
| South Central Asia | 5,389 | 5.1% |
| South Eastern Asia | 2,394 | 2.3% |
| Southern Europe | 19 | 0.0% |
| Sri Lanka | 5 | 0.0% |
| Sudan | 42 | 0.0% |
| Sweden | 84 | 0.1% |
| Syria | 16 | 0.0% |
| Taiwan | 597 | 0.6% |
| Thailand | 110 | 0.1% |
| Trinidad and Tobago | 11 | 0.0% |
| Turkey | 566 | 0.5% |
| Ukraine | 155 | 0.2% |
| Uzbekistan | 92 | 0.1% |
| Venezuela | 375 | 0.4% |
| Vietnam | 1,051 | 1.0% |
| Western Africa | 311 | 0.3% |
| Western Asia | 1,882 | 1.8% |
| Western Europe | 223 | 0.2% | View All 91 Rows |
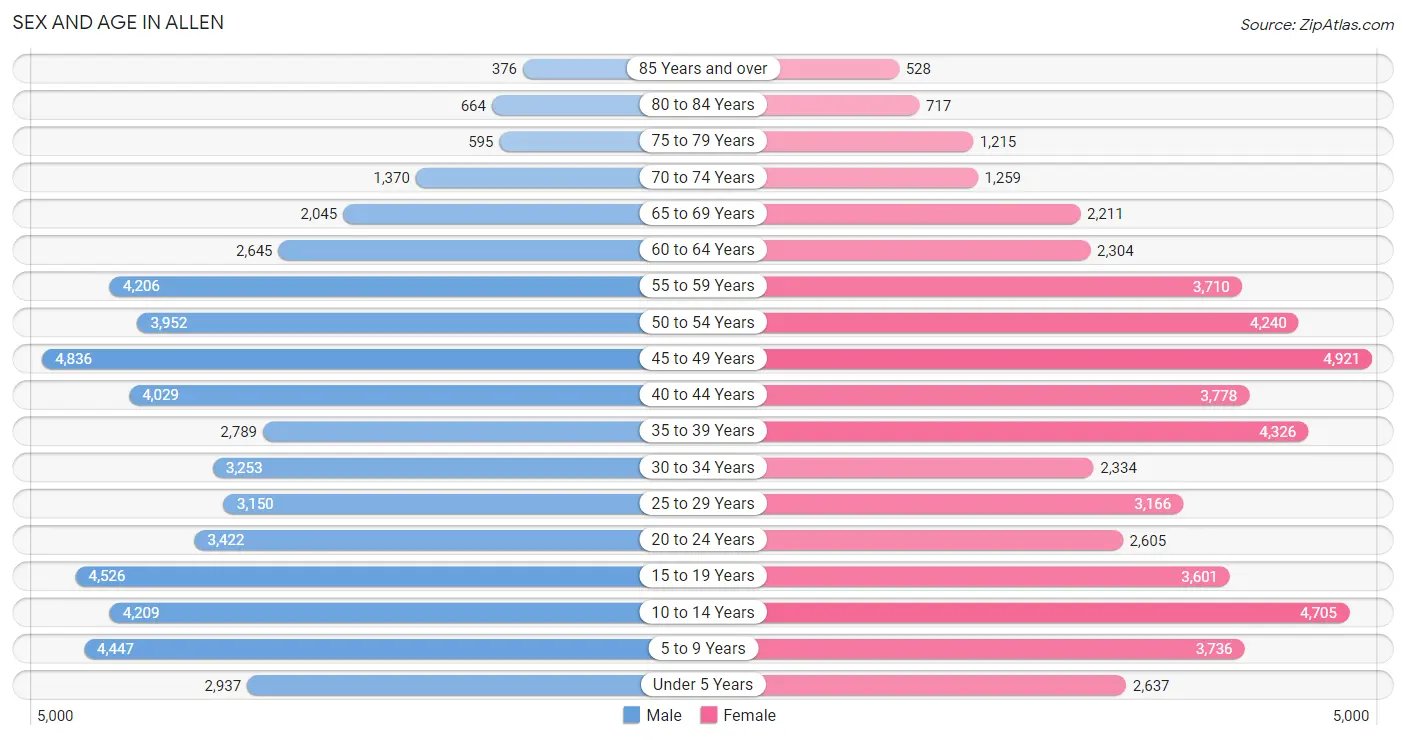
Sex and Age in Allen
Sex and Age in Allen
The most populous age groups in Allen are 45 to 49 Years (4,836 | 9.0%) for men and 45 to 49 Years (4,921 | 9.5%) for women.
| Age Bracket | Male | Female |
| Under 5 Years | 2,937 (5.5%) | 2,637 (5.1%) |
| 5 to 9 Years | 4,447 (8.3%) | 3,736 (7.2%) |
| 10 to 14 Years | 4,209 (7.9%) | 4,705 (9.0%) |
| 15 to 19 Years | 4,526 (8.5%) | 3,601 (6.9%) |
| 20 to 24 Years | 3,422 (6.4%) | 2,605 (5.0%) |
| 25 to 29 Years | 3,150 (5.9%) | 3,166 (6.1%) |
| 30 to 34 Years | 3,253 (6.1%) | 2,334 (4.5%) |
| 35 to 39 Years | 2,789 (5.2%) | 4,326 (8.3%) |
| 40 to 44 Years | 4,029 (7.5%) | 3,778 (7.3%) |
| 45 to 49 Years | 4,836 (9.0%) | 4,921 (9.5%) |
| 50 to 54 Years | 3,952 (7.4%) | 4,240 (8.2%) |
| 55 to 59 Years | 4,206 (7.9%) | 3,710 (7.1%) |
| 60 to 64 Years | 2,645 (5.0%) | 2,304 (4.4%) |
| 65 to 69 Years | 2,045 (3.8%) | 2,211 (4.3%) |
| 70 to 74 Years | 1,370 (2.6%) | 1,259 (2.4%) |
| 75 to 79 Years | 595 (1.1%) | 1,215 (2.3%) |
| 80 to 84 Years | 664 (1.2%) | 717 (1.4%) |
| 85 Years and over | 376 (0.7%) | 528 (1.0%) |
| Total | 53,451 (100.0%) | 51,993 (100.0%) |
Families and Households in Allen
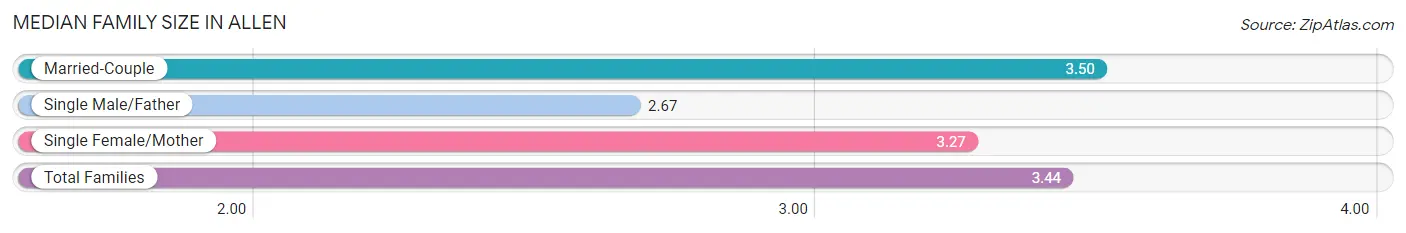
Median Family Size in Allen
The median family size in Allen is 3.44 persons per family, with married-couple families (23,103 | 84.4%) accounting for the largest median family size of 3.5 persons per family. On the other hand, single male/father families (1,303 | 4.8%) represent the smallest median family size with 2.67 persons per family.
| Family Type | # Families | Family Size |
| Married-Couple | 23,103 (84.4%) | 3.50 |
| Single Male/Father | 1,303 (4.8%) | 2.67 |
| Single Female/Mother | 2,973 (10.9%) | 3.27 |
| Total Families | 27,379 (100.0%) | 3.44 |
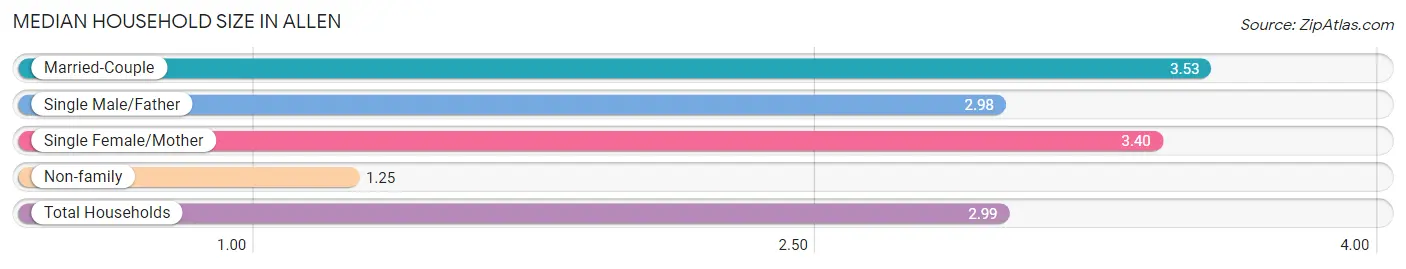
Median Household Size in Allen
The median household size in Allen is 2.99 persons per household, with married-couple households (23,103 | 65.8%) accounting for the largest median household size of 3.53 persons per household. non-family households (7,732 | 22.0%) represent the smallest median household size with 1.25 persons per household.
| Household Type | # Households | Household Size |
| Married-Couple | 23,103 (65.8%) | 3.53 |
| Single Male/Father | 1,303 (3.7%) | 2.98 |
| Single Female/Mother | 2,973 (8.5%) | 3.40 |
| Non-family | 7,732 (22.0%) | 1.25 |
| Total Households | 35,111 (100.0%) | 2.99 |
Household Size by Marriage Status in Allen
Out of a total of 35,111 households in Allen, 27,379 (78.0%) are family households, while 7,732 (22.0%) are nonfamily households. The most numerous type of family households are 2-person households, comprising 9,052, and the most common type of nonfamily households are 1-person households, comprising 6,217.
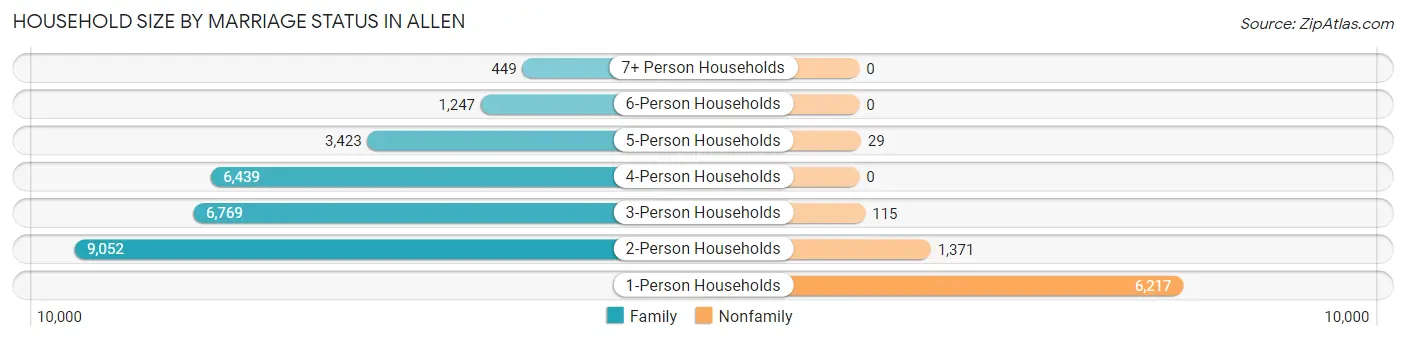
| Household Size | Family Households | Nonfamily Households |
| 1-Person Households | - | 6,217 (17.7%) |
| 2-Person Households | 9,052 (25.8%) | 1,371 (3.9%) |
| 3-Person Households | 6,769 (19.3%) | 115 (0.3%) |
| 4-Person Households | 6,439 (18.3%) | 0 (0.0%) |
| 5-Person Households | 3,423 (9.8%) | 29 (0.1%) |
| 6-Person Households | 1,247 (3.5%) | 0 (0.0%) |
| 7+ Person Households | 449 (1.3%) | 0 (0.0%) |
| Total | 27,379 (78.0%) | 7,732 (22.0%) |
Female Fertility in Allen
Fertility by Age in Allen
Average fertility rate in Allen is 31.0 births per 1,000 women. Women in the age bracket of 20 to 34 years have the highest fertility rate with 57.0 births per 1,000 women. Women in the age bracket of 20 to 34 years acount for 58.2% of all women with births.
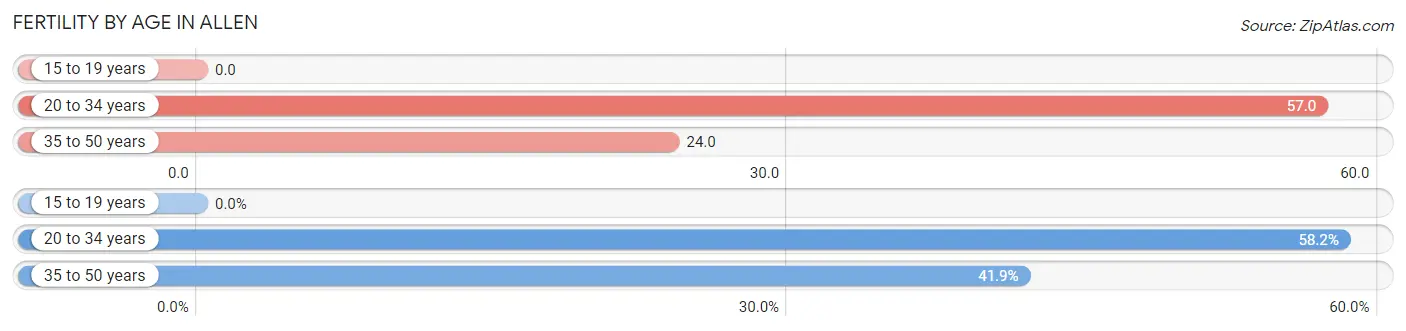
| Age Bracket | Women with Births | Births / 1,000 Women |
| 15 to 19 years | 0 (0.0%) | 0.0 |
| 20 to 34 years | 464 (58.2%) | 57.0 |
| 35 to 50 years | 334 (41.8%) | 24.0 |
| Total | 798 (100.0%) | 31.0 |
Fertility by Age by Marriage Status in Allen
81.1% of women with births (798) in Allen are married. The highest percentage of unmarried women with births falls into 20 to 34 years age bracket with 29.1% of them unmarried at the time of birth, while the lowest percentage of unmarried women with births belong to 35 to 50 years age bracket with 4.8% of them unmarried.
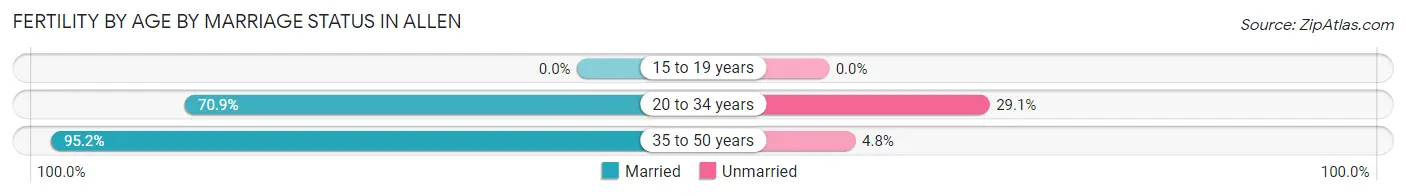
| Age Bracket | Married | Unmarried |
| 15 to 19 years | 0 (0.0%) | 0 (0.0%) |
| 20 to 34 years | 329 (70.9%) | 135 (29.1%) |
| 35 to 50 years | 318 (95.2%) | 16 (4.8%) |
| Total | 647 (81.1%) | 151 (18.9%) |
Fertility by Education in Allen
Average fertility rate in Allen is 31.0 births per 1,000 women. Women with the education attainment of graduate degree have the highest fertility rate of 56.0 births per 1,000 women, while women with the education attainment of high school diploma have the lowest fertility at 13.0 births per 1,000 women. Women with the education attainment of bachelor's degree represent 36.2% of all women with births.
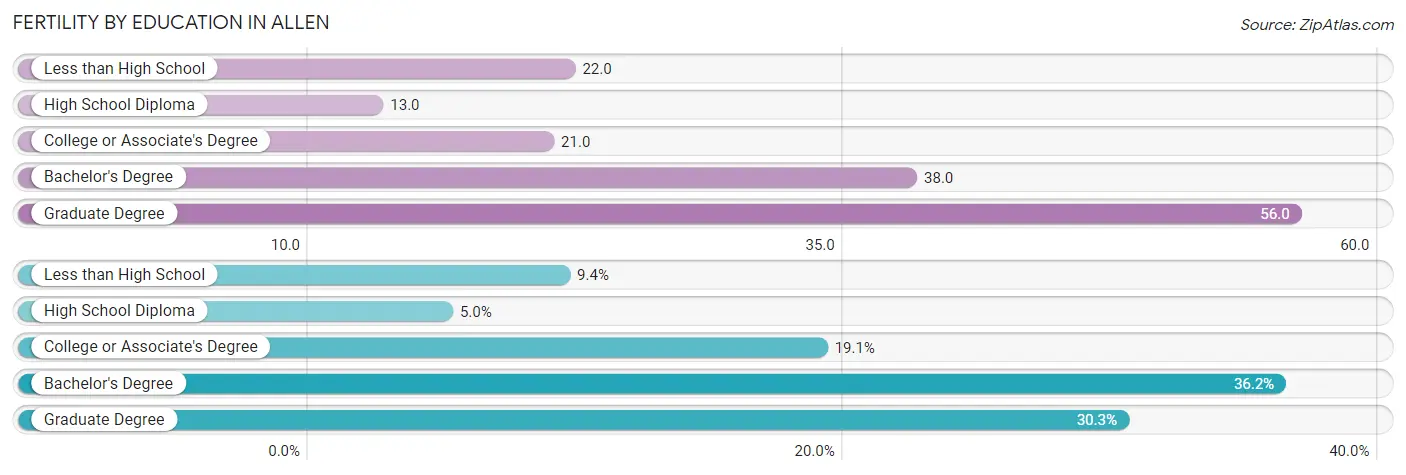
| Educational Attainment | Women with Births | Births / 1,000 Women |
| Less than High School | 75 (9.4%) | 22.0 |
| High School Diploma | 40 (5.0%) | 13.0 |
| College or Associate's Degree | 152 (19.1%) | 21.0 |
| Bachelor's Degree | 289 (36.2%) | 38.0 |
| Graduate Degree | 242 (30.3%) | 56.0 |
| Total | 798 (100.0%) | 31.0 |
Fertility by Education by Marriage Status in Allen
18.9% of women with births in Allen are unmarried. Women with the educational attainment of bachelor's degree are most likely to be married with 100.0% of them married at childbirth, while women with the educational attainment of less than high school are least likely to be married with 100.0% of them unmarried at childbirth.
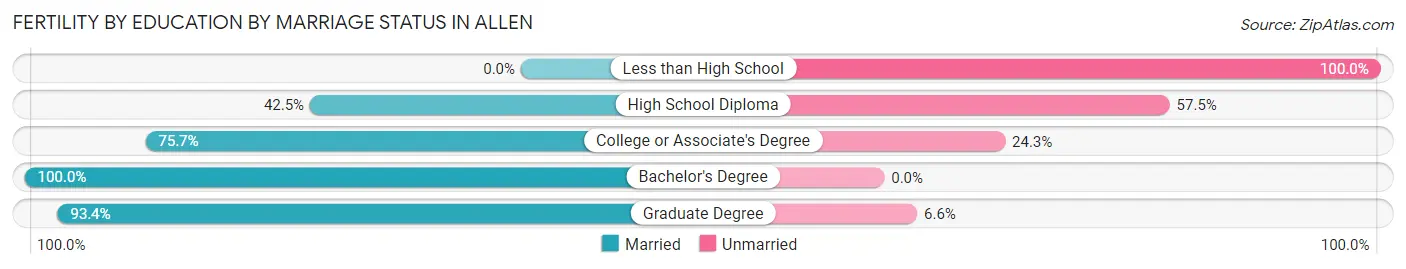
| Educational Attainment | Married | Unmarried |
| Less than High School | 0 (0.0%) | 75 (100.0%) |
| High School Diploma | 17 (42.5%) | 23 (57.5%) |
| College or Associate's Degree | 115 (75.7%) | 37 (24.3%) |
| Bachelor's Degree | 289 (100.0%) | 0 (0.0%) |
| Graduate Degree | 226 (93.4%) | 16 (6.6%) |
| Total | 647 (81.1%) | 151 (18.9%) |
Employment Characteristics in Allen
Employment by Class of Employer in Allen
Among the 53,875 employed individuals in Allen, private company employees (38,810 | 72.0%), local government employees (3,574 | 6.6%), and self-employed (incorporated) (3,269 | 6.1%) make up the most common classes of employment.
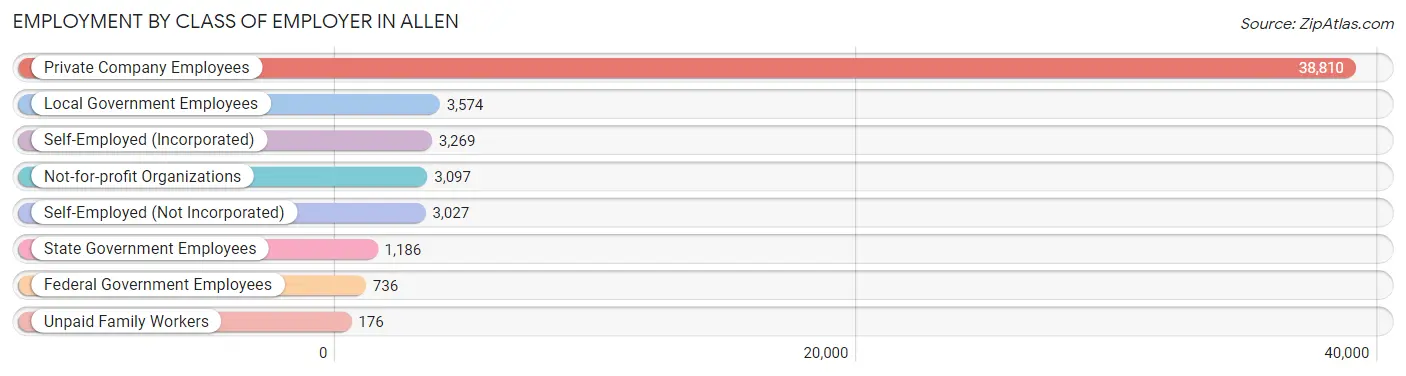
| Employer Class | # Employees | % Employees |
| Private Company Employees | 38,810 | 72.0% |
| Self-Employed (Incorporated) | 3,269 | 6.1% |
| Self-Employed (Not Incorporated) | 3,027 | 5.6% |
| Not-for-profit Organizations | 3,097 | 5.8% |
| Local Government Employees | 3,574 | 6.6% |
| State Government Employees | 1,186 | 2.2% |
| Federal Government Employees | 736 | 1.4% |
| Unpaid Family Workers | 176 | 0.3% |
| Total | 53,875 | 100.0% |
Employment Status by Age in Allen
According to the labor force statistics for Allen, out of the total population over 16 years of age (81,333), 70.5% or 57,340 individuals are in the labor force, with 4.3% or 2,466 of them unemployed. The age group with the highest labor force participation rate is 30 to 34 years, with 91.5% or 5,112 individuals in the labor force. Within the labor force, the 20 to 24 years age range has the highest percentage of unemployed individuals, with 10.3% or 431 of them being unemployed.
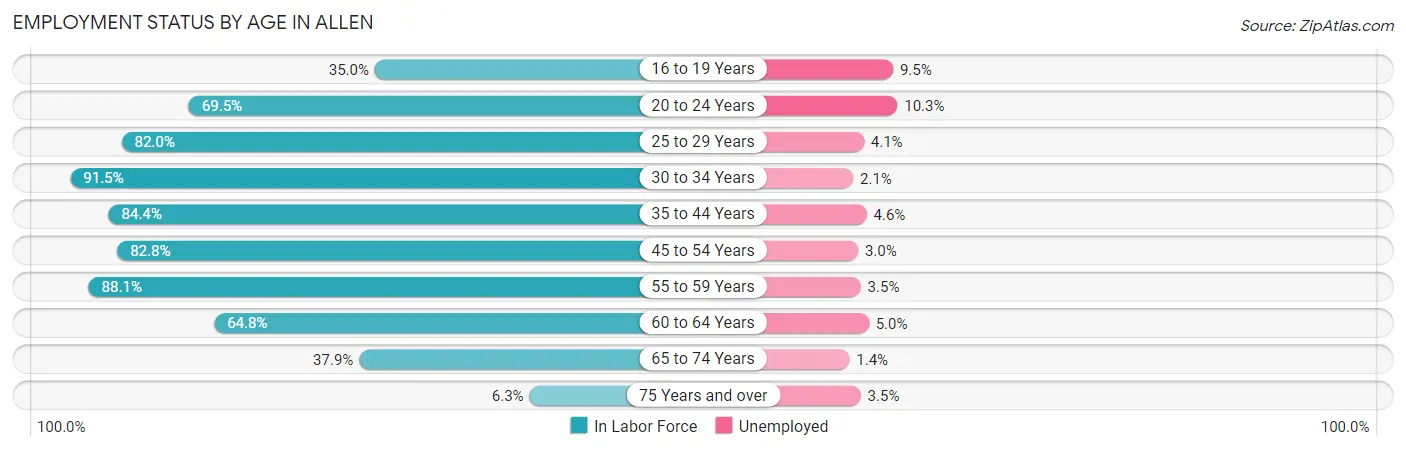
| Age Bracket | In Labor Force | Unemployed |
| 16 to 19 Years | 2,340 (35.0%) | 222 (9.5%) |
| 20 to 24 Years | 4,189 (69.5%) | 431 (10.3%) |
| 25 to 29 Years | 5,179 (82.0%) | 212 (4.1%) |
| 30 to 34 Years | 5,112 (91.5%) | 107 (2.1%) |
| 35 to 44 Years | 12,594 (84.4%) | 579 (4.6%) |
| 45 to 54 Years | 14,862 (82.8%) | 446 (3.0%) |
| 55 to 59 Years | 6,974 (88.1%) | 244 (3.5%) |
| 60 to 64 Years | 3,207 (64.8%) | 160 (5.0%) |
| 65 to 74 Years | 2,609 (37.9%) | 37 (1.4%) |
| 75 Years and over | 258 (6.3%) | 9 (3.5%) |
| Total | 57,340 (70.5%) | 2,466 (4.3%) |
Employment Status by Educational Attainment in Allen
According to labor force statistics for Allen, 83.2% of individuals (47,956) out of the total population between 25 and 64 years of age (57,639) are in the labor force, with 3.7% or 1,774 of them being unemployed. The group with the highest labor force participation rate are those with the educational attainment of bachelor's degree or higher, with 86.5% or 28,897 individuals in the labor force. Within the labor force, individuals with less than high school education have the highest percentage of unemployment, with 8.9% or 131 of them being unemployed.
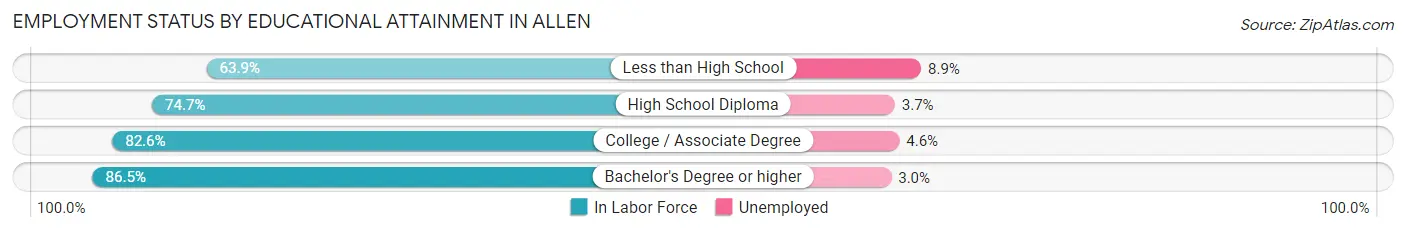
| Educational Attainment | In Labor Force | Unemployed |
| Less than High School | 1,475 (63.9%) | 205 (8.9%) |
| High School Diploma | 5,359 (74.7%) | 265 (3.7%) |
| College / Associate Degree | 12,184 (82.6%) | 678 (4.6%) |
| Bachelor's Degree or higher | 28,897 (86.5%) | 1,002 (3.0%) |
| Total | 47,956 (83.2%) | 2,133 (3.7%) |
Employment Occupations by Sex in Allen
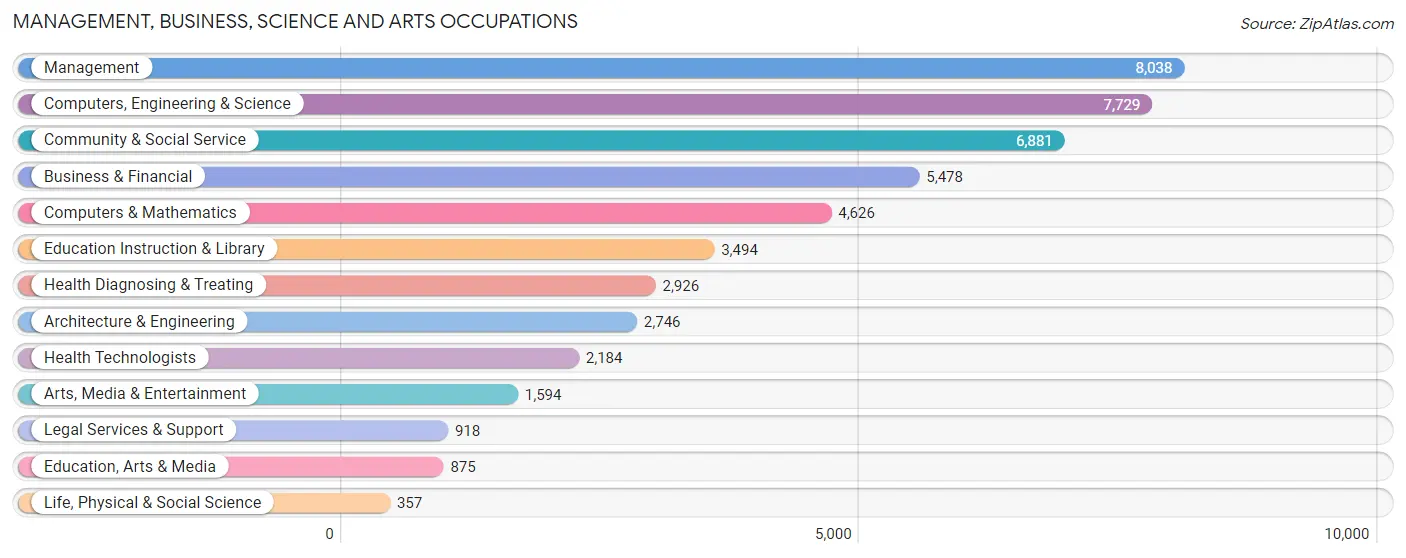
Management, Business, Science and Arts Occupations
The most common Management, Business, Science and Arts occupations in Allen are Management (8,038 | 14.7%), Computers, Engineering & Science (7,729 | 14.1%), Community & Social Service (6,881 | 12.6%), Business & Financial (5,478 | 10.0%), and Computers & Mathematics (4,626 | 8.4%).
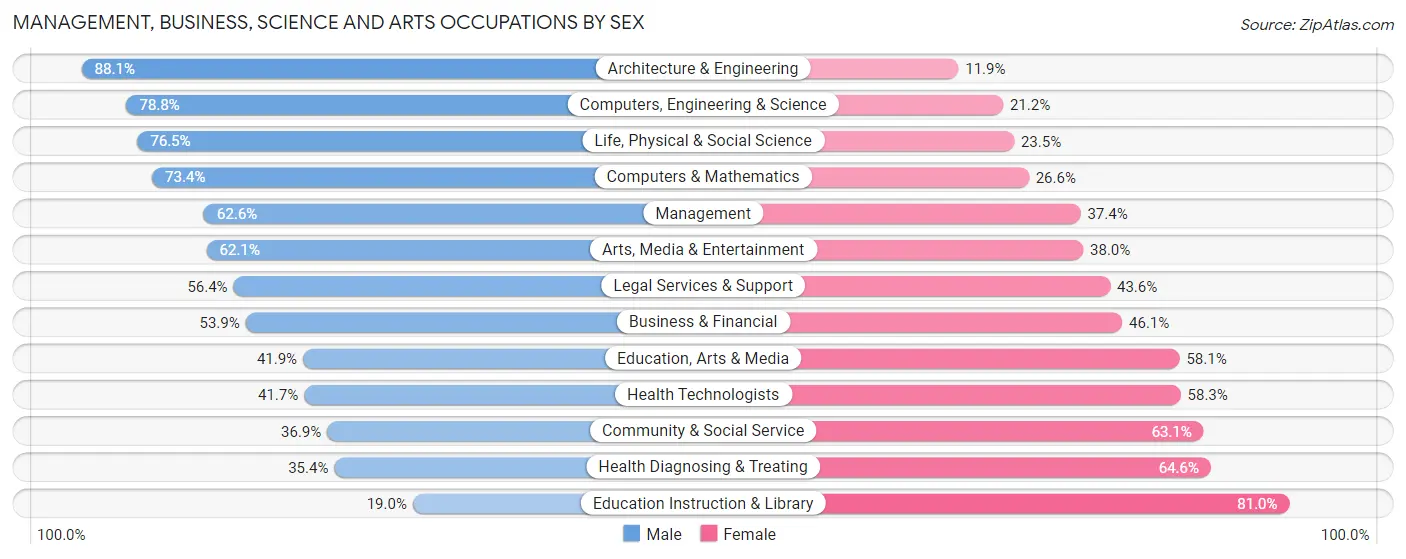
Management, Business, Science and Arts Occupations by Sex
Within the Management, Business, Science and Arts occupations in Allen, the most male-oriented occupations are Architecture & Engineering (88.1%), Computers, Engineering & Science (78.8%), and Life, Physical & Social Science (76.5%), while the most female-oriented occupations are Education Instruction & Library (81.0%), Health Diagnosing & Treating (64.6%), and Community & Social Service (63.1%).
| Occupation | Male | Female |
| Management | 5,031 (62.6%) | 3,007 (37.4%) |
| Business & Financial | 2,953 (53.9%) | 2,525 (46.1%) |
| Computers, Engineering & Science | 6,087 (78.8%) | 1,642 (21.2%) |
| Computers & Mathematics | 3,395 (73.4%) | 1,231 (26.6%) |
| Architecture & Engineering | 2,419 (88.1%) | 327 (11.9%) |
| Life, Physical & Social Science | 273 (76.5%) | 84 (23.5%) |
| Community & Social Service | 2,539 (36.9%) | 4,342 (63.1%) |
| Education, Arts & Media | 367 (41.9%) | 508 (58.1%) |
| Legal Services & Support | 518 (56.4%) | 400 (43.6%) |
| Education Instruction & Library | 665 (19.0%) | 2,829 (81.0%) |
| Arts, Media & Entertainment | 989 (62.1%) | 605 (38.0%) |
| Health Diagnosing & Treating | 1,036 (35.4%) | 1,890 (64.6%) |
| Health Technologists | 911 (41.7%) | 1,273 (58.3%) |
| Total (Category) | 17,646 (56.8%) | 13,406 (43.2%) |
| Total (Overall) | 30,948 (56.4%) | 23,884 (43.6%) |
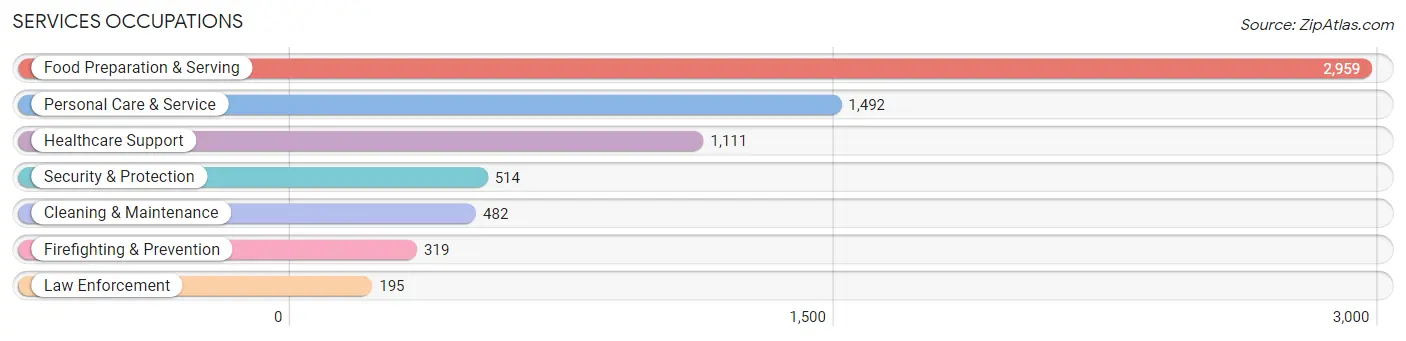
Services Occupations
The most common Services occupations in Allen are Food Preparation & Serving (2,959 | 5.4%), Personal Care & Service (1,492 | 2.7%), Healthcare Support (1,111 | 2.0%), Security & Protection (514 | 0.9%), and Cleaning & Maintenance (482 | 0.9%).
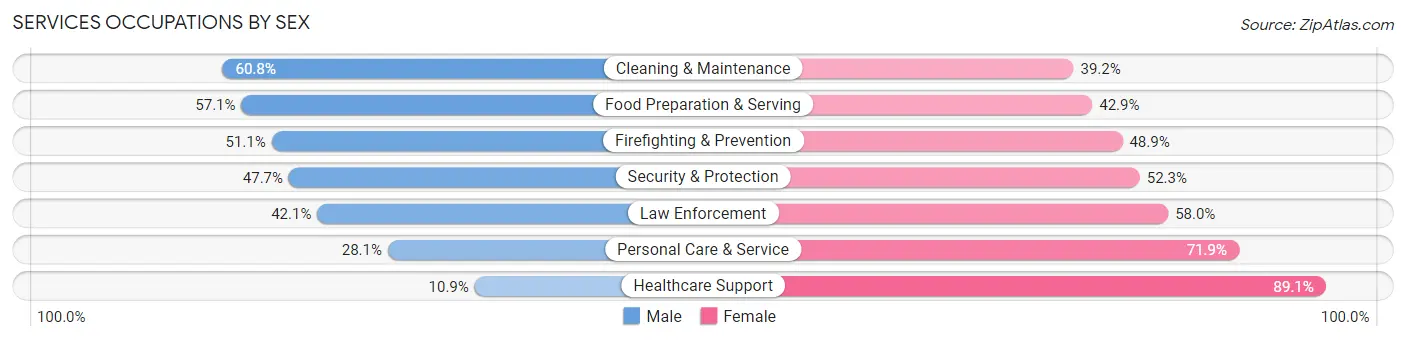
Services Occupations by Sex
Within the Services occupations in Allen, the most male-oriented occupations are Cleaning & Maintenance (60.8%), Food Preparation & Serving (57.1%), and Firefighting & Prevention (51.1%), while the most female-oriented occupations are Healthcare Support (89.1%), Personal Care & Service (71.9%), and Law Enforcement (58.0%).
| Occupation | Male | Female |
| Healthcare Support | 121 (10.9%) | 990 (89.1%) |
| Security & Protection | 245 (47.7%) | 269 (52.3%) |
| Firefighting & Prevention | 163 (51.1%) | 156 (48.9%) |
| Law Enforcement | 82 (42.0%) | 113 (58.0%) |
| Food Preparation & Serving | 1,689 (57.1%) | 1,270 (42.9%) |
| Cleaning & Maintenance | 293 (60.8%) | 189 (39.2%) |
| Personal Care & Service | 419 (28.1%) | 1,073 (71.9%) |
| Total (Category) | 2,767 (42.2%) | 3,791 (57.8%) |
| Total (Overall) | 30,948 (56.4%) | 23,884 (43.6%) |
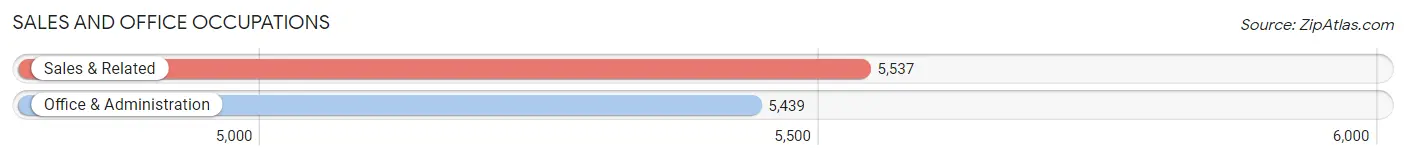
Sales and Office Occupations
The most common Sales and Office occupations in Allen are Sales & Related (5,537 | 10.1%), and Office & Administration (5,439 | 9.9%).
Sales and Office Occupations by Sex
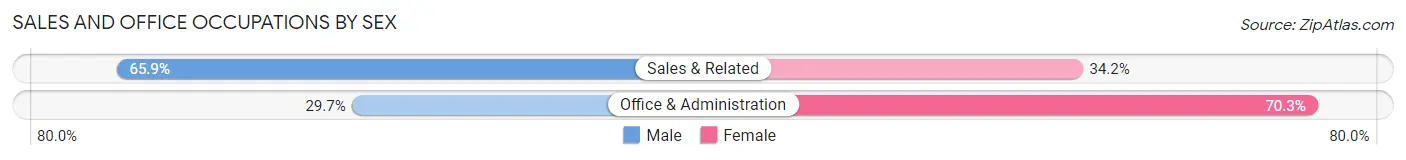
| Occupation | Male | Female |
| Sales & Related | 3,646 (65.8%) | 1,891 (34.2%) |
| Office & Administration | 1,616 (29.7%) | 3,823 (70.3%) |
| Total (Category) | 5,262 (47.9%) | 5,714 (52.1%) |
| Total (Overall) | 30,948 (56.4%) | 23,884 (43.6%) |
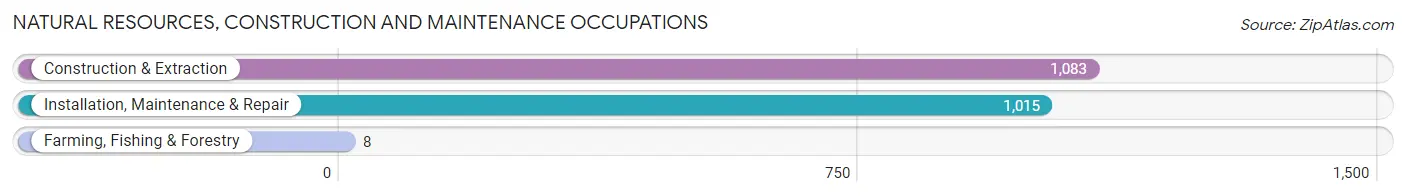
Natural Resources, Construction and Maintenance Occupations
The most common Natural Resources, Construction and Maintenance occupations in Allen are Construction & Extraction (1,083 | 2.0%), Installation, Maintenance & Repair (1,015 | 1.8%), and Farming, Fishing & Forestry (8 | 0.0%).
Natural Resources, Construction and Maintenance Occupations by Sex
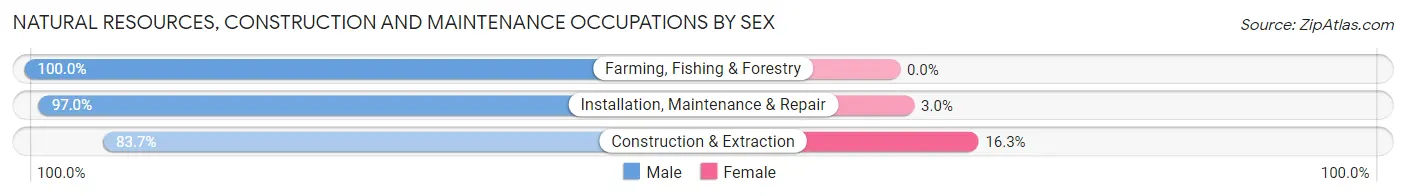
| Occupation | Male | Female |
| Farming, Fishing & Forestry | 8 (100.0%) | 0 (0.0%) |
| Construction & Extraction | 906 (83.7%) | 177 (16.3%) |
| Installation, Maintenance & Repair | 985 (97.0%) | 30 (3.0%) |
| Total (Category) | 1,899 (90.2%) | 207 (9.8%) |
| Total (Overall) | 30,948 (56.4%) | 23,884 (43.6%) |
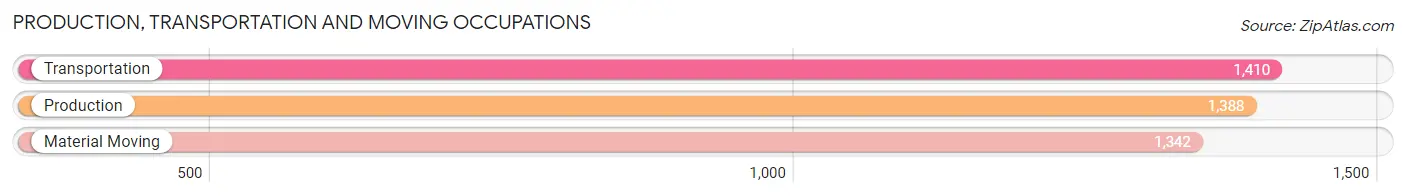
Production, Transportation and Moving Occupations
The most common Production, Transportation and Moving occupations in Allen are Transportation (1,410 | 2.6%), Production (1,388 | 2.5%), and Material Moving (1,342 | 2.5%).
Production, Transportation and Moving Occupations by Sex
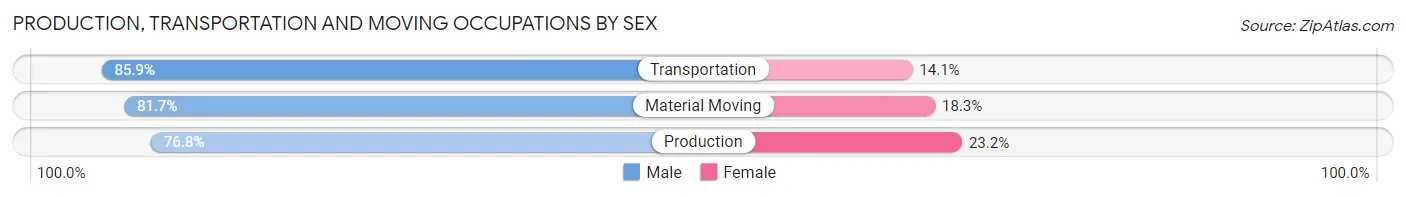
| Occupation | Male | Female |
| Production | 1,066 (76.8%) | 322 (23.2%) |
| Transportation | 1,211 (85.9%) | 199 (14.1%) |
| Material Moving | 1,097 (81.7%) | 245 (18.3%) |
| Total (Category) | 3,374 (81.5%) | 766 (18.5%) |
| Total (Overall) | 30,948 (56.4%) | 23,884 (43.6%) |
Employment Industries by Sex in Allen
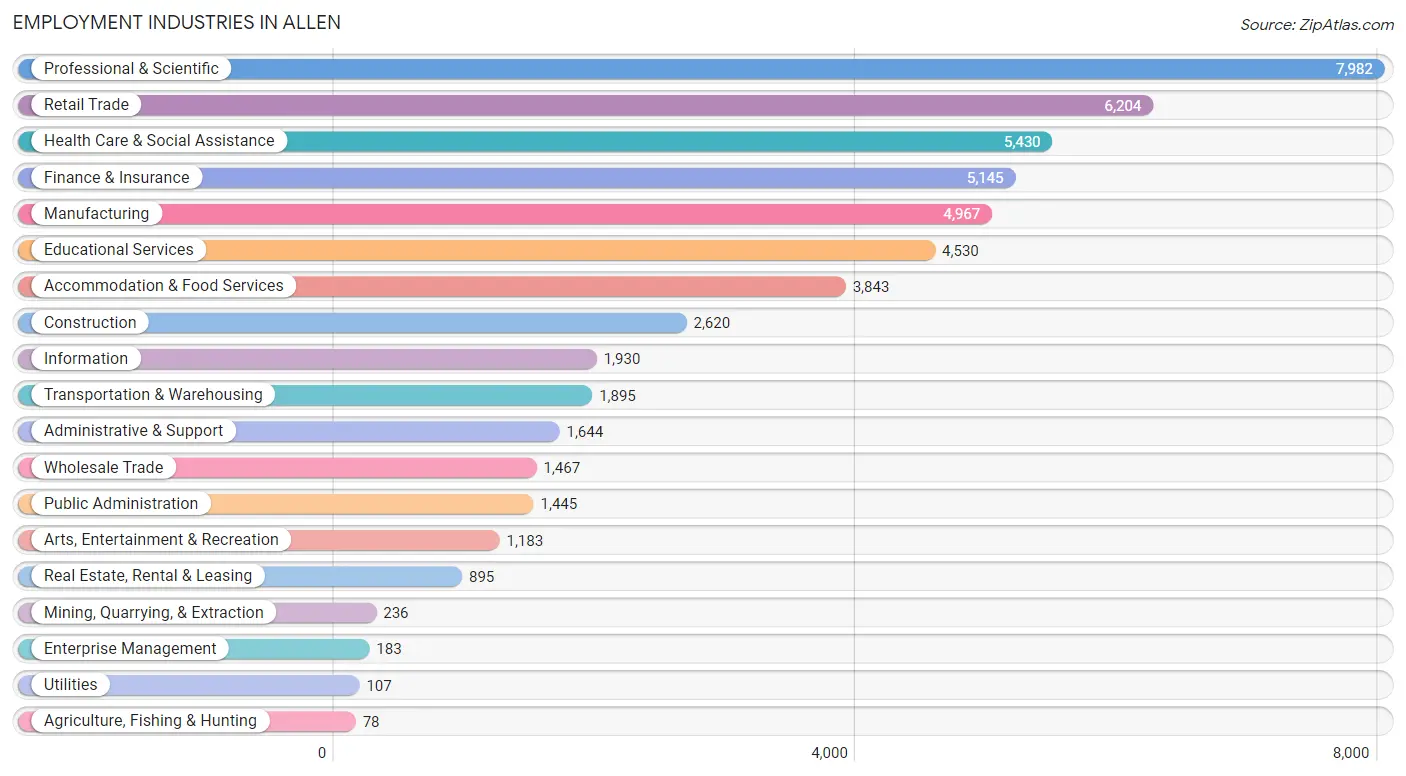
Employment Industries in Allen
The major employment industries in Allen include Professional & Scientific (7,982 | 14.6%), Retail Trade (6,204 | 11.3%), Health Care & Social Assistance (5,430 | 9.9%), Finance & Insurance (5,145 | 9.4%), and Manufacturing (4,967 | 9.1%).
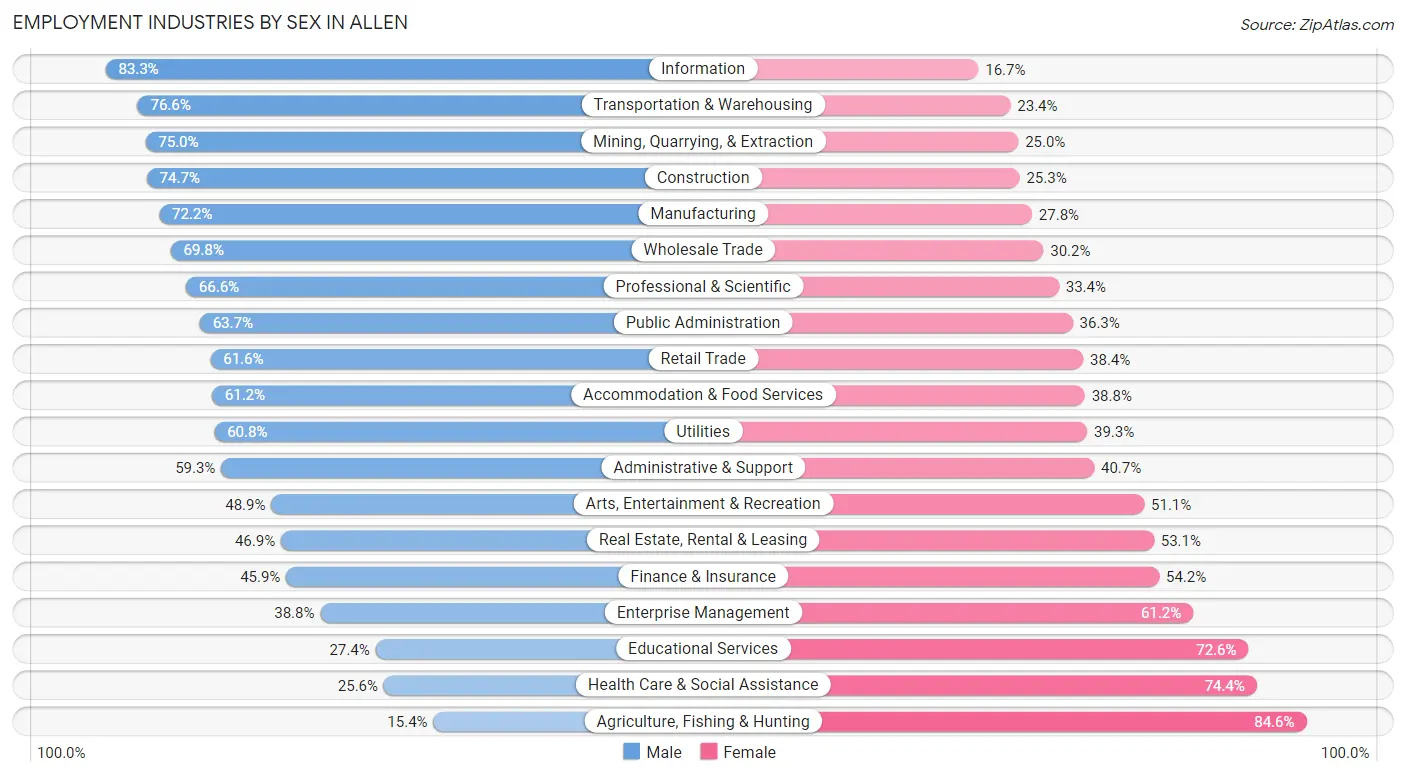
Employment Industries by Sex in Allen
The Allen industries that see more men than women are Information (83.3%), Transportation & Warehousing (76.6%), and Mining, Quarrying, & Extraction (75.0%), whereas the industries that tend to have a higher number of women are Agriculture, Fishing & Hunting (84.6%), Health Care & Social Assistance (74.4%), and Educational Services (72.6%).
| Industry | Male | Female |
| Agriculture, Fishing & Hunting | 12 (15.4%) | 66 (84.6%) |
| Mining, Quarrying, & Extraction | 177 (75.0%) | 59 (25.0%) |
| Construction | 1,958 (74.7%) | 662 (25.3%) |
| Manufacturing | 3,584 (72.2%) | 1,383 (27.8%) |
| Wholesale Trade | 1,024 (69.8%) | 443 (30.2%) |
| Retail Trade | 3,819 (61.6%) | 2,385 (38.4%) |
| Transportation & Warehousing | 1,452 (76.6%) | 443 (23.4%) |
| Utilities | 65 (60.8%) | 42 (39.3%) |
| Information | 1,607 (83.3%) | 323 (16.7%) |
| Finance & Insurance | 2,359 (45.9%) | 2,786 (54.1%) |
| Real Estate, Rental & Leasing | 420 (46.9%) | 475 (53.1%) |
| Professional & Scientific | 5,316 (66.6%) | 2,666 (33.4%) |
| Enterprise Management | 71 (38.8%) | 112 (61.2%) |
| Administrative & Support | 975 (59.3%) | 669 (40.7%) |
| Educational Services | 1,240 (27.4%) | 3,290 (72.6%) |
| Health Care & Social Assistance | 1,392 (25.6%) | 4,038 (74.4%) |
| Arts, Entertainment & Recreation | 579 (48.9%) | 604 (51.1%) |
| Accommodation & Food Services | 2,353 (61.2%) | 1,490 (38.8%) |
| Public Administration | 921 (63.7%) | 524 (36.3%) |
| Total | 30,948 (56.4%) | 23,884 (43.6%) |
Education in Allen
School Enrollment in Allen
The most common levels of schooling among the 31,589 students in Allen are high school (7,074 | 22.4%), elementary school (7,062 | 22.4%), and middle school (6,617 | 20.9%).
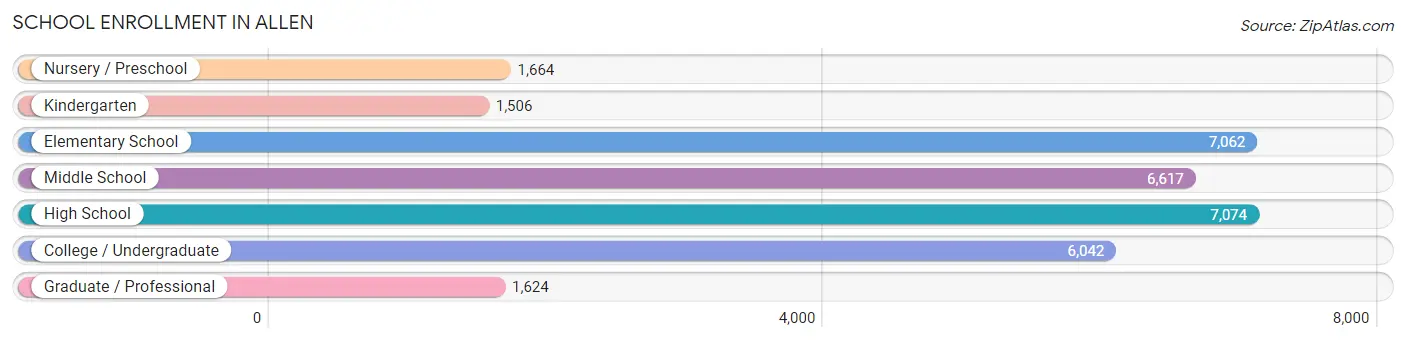
| School Level | # Students | % Students |
| Nursery / Preschool | 1,664 | 5.3% |
| Kindergarten | 1,506 | 4.8% |
| Elementary School | 7,062 | 22.4% |
| Middle School | 6,617 | 20.9% |
| High School | 7,074 | 22.4% |
| College / Undergraduate | 6,042 | 19.1% |
| Graduate / Professional | 1,624 | 5.1% |
| Total | 31,589 | 100.0% |
School Enrollment by Age by Funding Source in Allen
Out of a total of 31,589 students who are enrolled in schools in Allen, 4,075 (12.9%) attend a private institution, while the remaining 27,514 (87.1%) are enrolled in public schools. The age group of 3 to 4 year olds has the highest likelihood of being enrolled in private schools, with 929 (60.3% in the age bracket) enrolled. Conversely, the age group of 18 to 19 year olds has the lowest likelihood of being enrolled in a private school, with 2,609 (93.3% in the age bracket) attending a public institution.
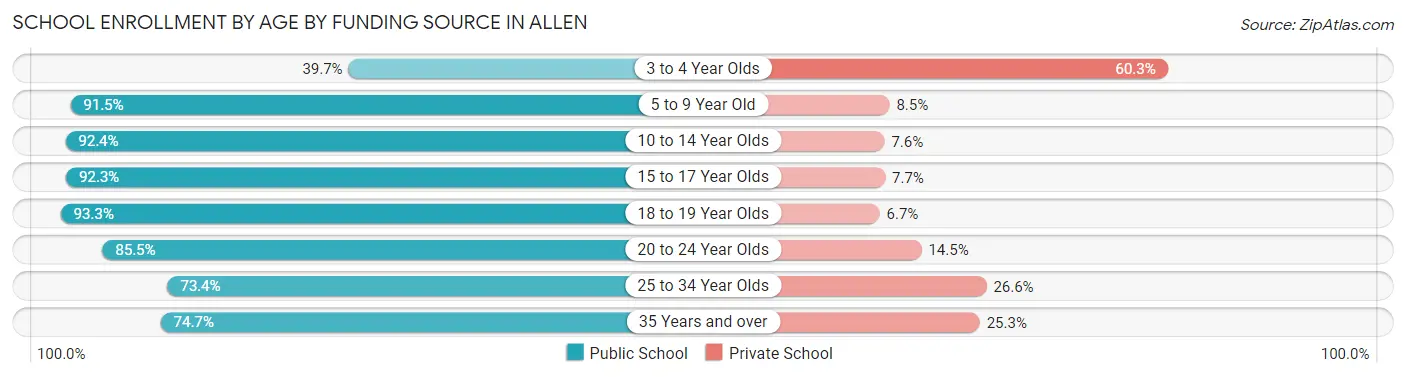
| Age Bracket | Public School | Private School |
| 3 to 4 Year Olds | 611 (39.7%) | 929 (60.3%) |
| 5 to 9 Year Old | 7,133 (91.5%) | 665 (8.5%) |
| 10 to 14 Year Olds | 8,157 (92.4%) | 671 (7.6%) |
| 15 to 17 Year Olds | 4,213 (92.3%) | 352 (7.7%) |
| 18 to 19 Year Olds | 2,609 (93.3%) | 187 (6.7%) |
| 20 to 24 Year Olds | 2,225 (85.5%) | 377 (14.5%) |
| 25 to 34 Year Olds | 1,071 (73.4%) | 388 (26.6%) |
| 35 Years and over | 1,494 (74.7%) | 507 (25.3%) |
| Total | 27,514 (87.1%) | 4,075 (12.9%) |
Educational Attainment by Field of Study in Allen
Business (10,923 | 27.4%), engineering (6,022 | 15.1%), computers & mathematics (3,295 | 8.3%), education (2,827 | 7.1%), and science & technology (2,793 | 7.0%) are the most common fields of study among 39,860 individuals in Allen who have obtained a bachelor's degree or higher.
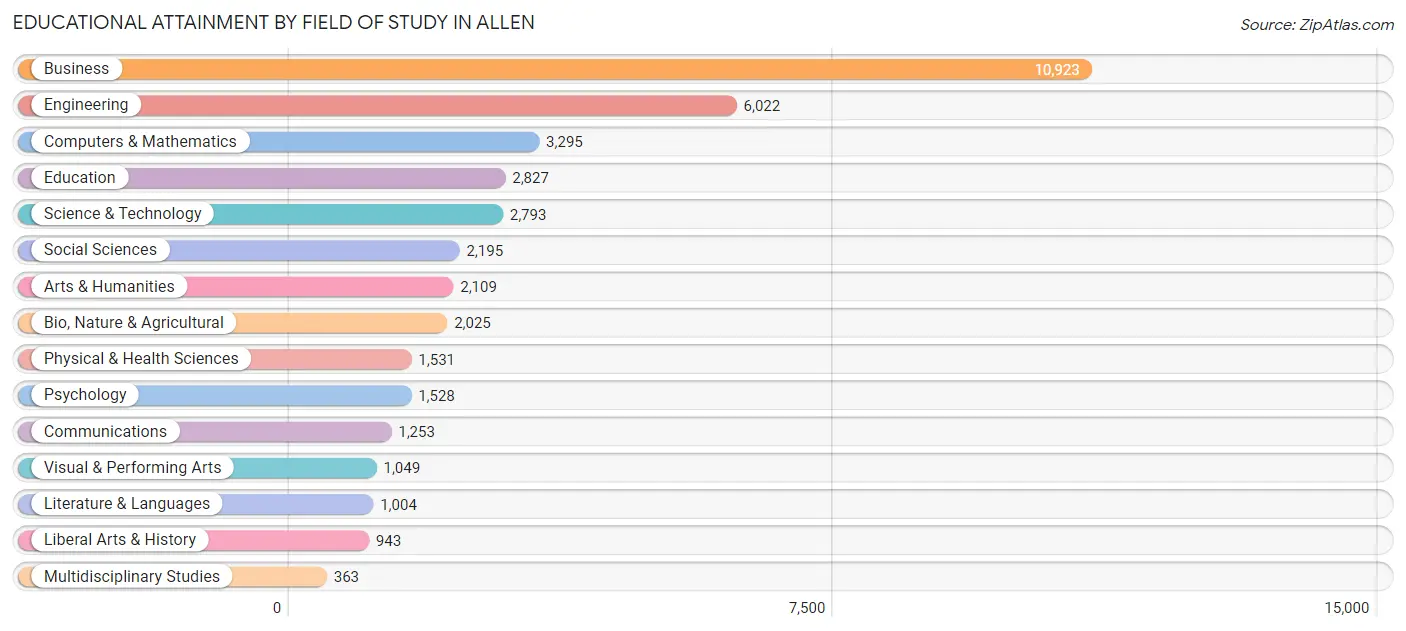
| Field of Study | # Graduates | % Graduates |
| Computers & Mathematics | 3,295 | 8.3% |
| Bio, Nature & Agricultural | 2,025 | 5.1% |
| Physical & Health Sciences | 1,531 | 3.8% |
| Psychology | 1,528 | 3.8% |
| Social Sciences | 2,195 | 5.5% |
| Engineering | 6,022 | 15.1% |
| Multidisciplinary Studies | 363 | 0.9% |
| Science & Technology | 2,793 | 7.0% |
| Business | 10,923 | 27.4% |
| Education | 2,827 | 7.1% |
| Literature & Languages | 1,004 | 2.5% |
| Liberal Arts & History | 943 | 2.4% |
| Visual & Performing Arts | 1,049 | 2.6% |
| Communications | 1,253 | 3.1% |
| Arts & Humanities | 2,109 | 5.3% |
| Total | 39,860 | 100.0% |
Transportation & Commute in Allen
Vehicle Availability by Sex in Allen
The most prevalent vehicle ownership categories in Allen are males with 2 vehicles (15,011, accounting for 49.3%) and females with 2 vehicles (10,957, making up 64.1%).
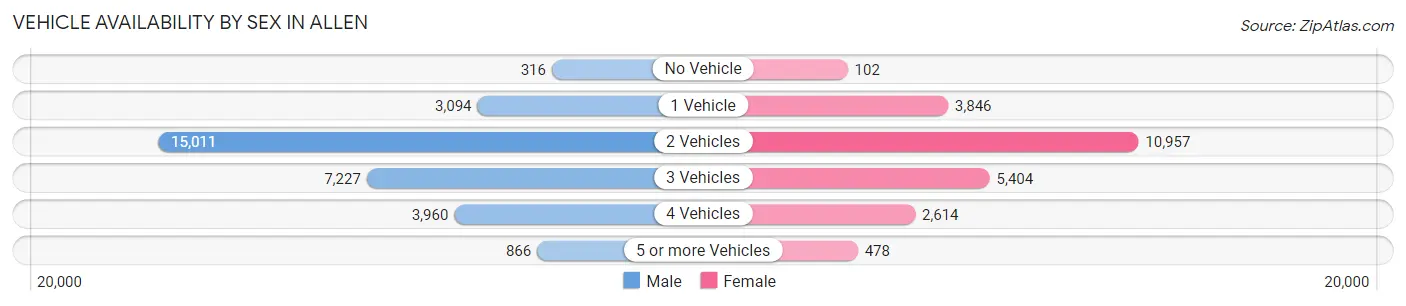
| Vehicles Available | Male | Female |
| No Vehicle | 316 (1.0%) | 102 (0.4%) |
| 1 Vehicle | 3,094 (10.2%) | 3,846 (16.4%) |
| 2 Vehicles | 15,011 (49.3%) | 10,957 (46.8%) |
| 3 Vehicles | 7,227 (23.7%) | 5,404 (23.1%) |
| 4 Vehicles | 3,960 (13.0%) | 2,614 (11.2%) |
| 5 or more Vehicles | 866 (2.8%) | 478 (2.0%) |
| Total | 30,474 (100.0%) | 23,401 (100.0%) |
Commute Time in Allen
The most frequently occuring commute durations in Allen are 30 to 34 minutes (7,126 commuters, 16.8%), 15 to 19 minutes (6,478 commuters, 15.3%), and 20 to 24 minutes (5,641 commuters, 13.3%).
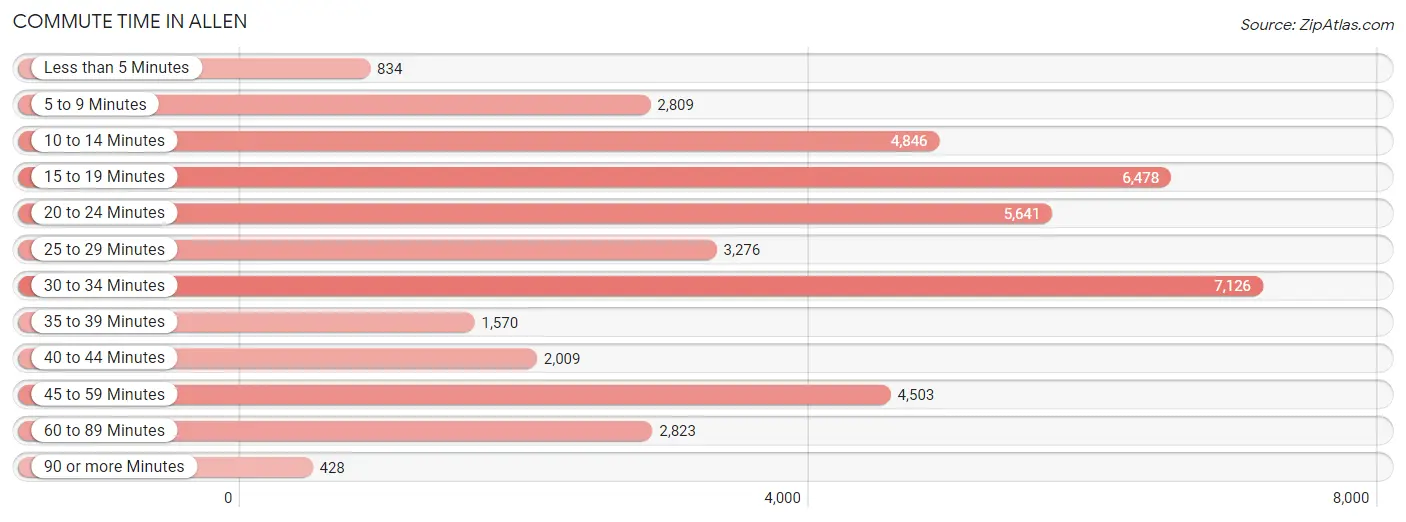
| Commute Time | # Commuters | % Commuters |
| Less than 5 Minutes | 834 | 2.0% |
| 5 to 9 Minutes | 2,809 | 6.6% |
| 10 to 14 Minutes | 4,846 | 11.4% |
| 15 to 19 Minutes | 6,478 | 15.3% |
| 20 to 24 Minutes | 5,641 | 13.3% |
| 25 to 29 Minutes | 3,276 | 7.7% |
| 30 to 34 Minutes | 7,126 | 16.8% |
| 35 to 39 Minutes | 1,570 | 3.7% |
| 40 to 44 Minutes | 2,009 | 4.7% |
| 45 to 59 Minutes | 4,503 | 10.6% |
| 60 to 89 Minutes | 2,823 | 6.7% |
| 90 or more Minutes | 428 | 1.0% |
Commute Time by Sex in Allen
The most common commute times in Allen are 30 to 34 minutes (4,108 commuters, 17.4%) for males and 30 to 34 minutes (3,018 commuters, 16.1%) for females.
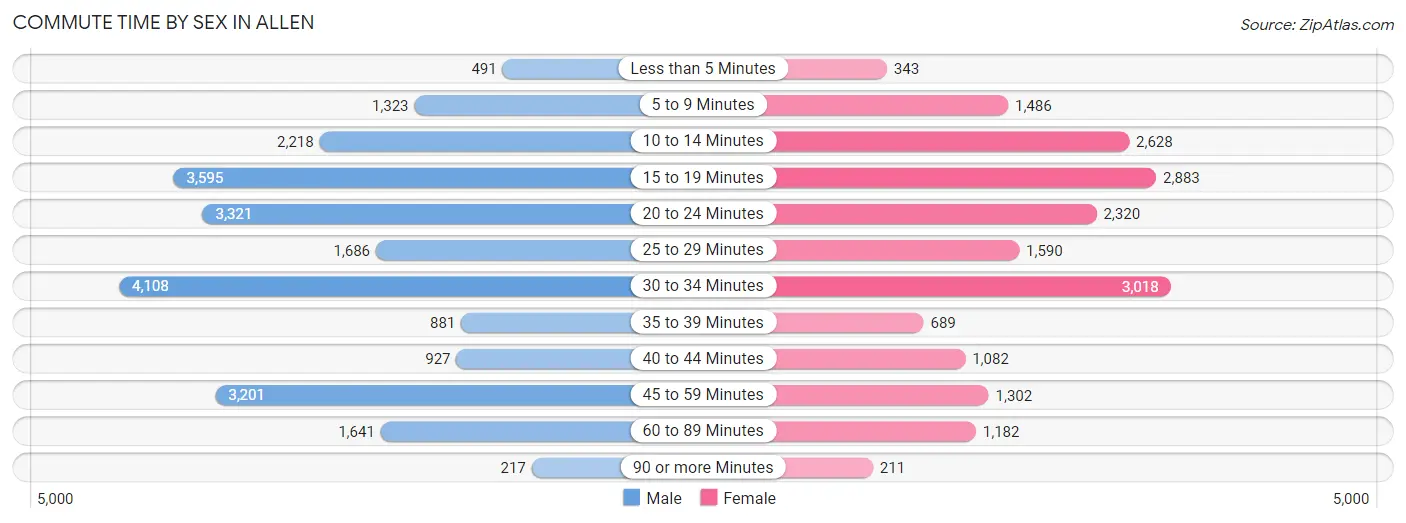
| Commute Time | Male | Female |
| Less than 5 Minutes | 491 (2.1%) | 343 (1.8%) |
| 5 to 9 Minutes | 1,323 (5.6%) | 1,486 (7.9%) |
| 10 to 14 Minutes | 2,218 (9.4%) | 2,628 (14.0%) |
| 15 to 19 Minutes | 3,595 (15.2%) | 2,883 (15.4%) |
| 20 to 24 Minutes | 3,321 (14.1%) | 2,320 (12.4%) |
| 25 to 29 Minutes | 1,686 (7.1%) | 1,590 (8.5%) |
| 30 to 34 Minutes | 4,108 (17.4%) | 3,018 (16.1%) |
| 35 to 39 Minutes | 881 (3.7%) | 689 (3.7%) |
| 40 to 44 Minutes | 927 (3.9%) | 1,082 (5.8%) |
| 45 to 59 Minutes | 3,201 (13.6%) | 1,302 (7.0%) |
| 60 to 89 Minutes | 1,641 (7.0%) | 1,182 (6.3%) |
| 90 or more Minutes | 217 (0.9%) | 211 (1.1%) |
Time of Departure to Work by Sex in Allen
The most frequent times of departure to work in Allen are 7:00 AM to 7:29 AM (4,089, 17.3%) for males and 7:30 AM to 7:59 AM (3,452, 18.4%) for females.
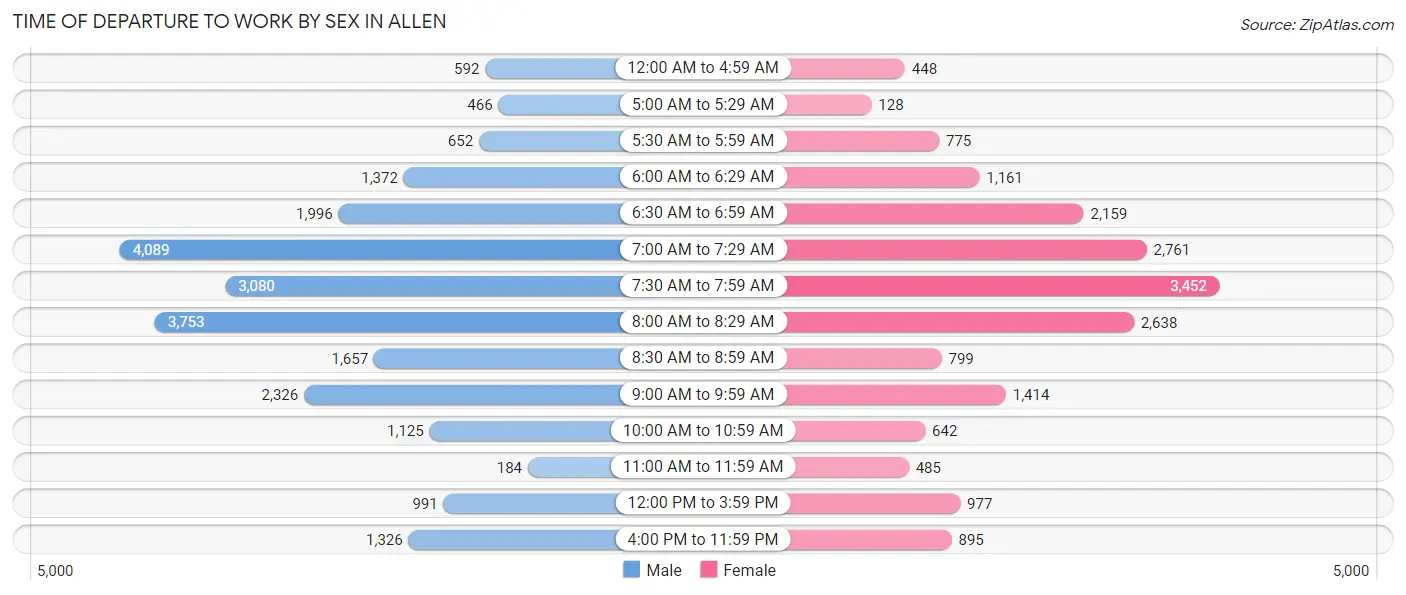
| Time of Departure | Male | Female |
| 12:00 AM to 4:59 AM | 592 (2.5%) | 448 (2.4%) |
| 5:00 AM to 5:29 AM | 466 (2.0%) | 128 (0.7%) |
| 5:30 AM to 5:59 AM | 652 (2.8%) | 775 (4.1%) |
| 6:00 AM to 6:29 AM | 1,372 (5.8%) | 1,161 (6.2%) |
| 6:30 AM to 6:59 AM | 1,996 (8.5%) | 2,159 (11.5%) |
| 7:00 AM to 7:29 AM | 4,089 (17.3%) | 2,761 (14.7%) |
| 7:30 AM to 7:59 AM | 3,080 (13.1%) | 3,452 (18.4%) |
| 8:00 AM to 8:29 AM | 3,753 (15.9%) | 2,638 (14.1%) |
| 8:30 AM to 8:59 AM | 1,657 (7.0%) | 799 (4.3%) |
| 9:00 AM to 9:59 AM | 2,326 (9.9%) | 1,414 (7.5%) |
| 10:00 AM to 10:59 AM | 1,125 (4.8%) | 642 (3.4%) |
| 11:00 AM to 11:59 AM | 184 (0.8%) | 485 (2.6%) |
| 12:00 PM to 3:59 PM | 991 (4.2%) | 977 (5.2%) |
| 4:00 PM to 11:59 PM | 1,326 (5.6%) | 895 (4.8%) |
| Total | 23,609 (100.0%) | 18,734 (100.0%) |
Housing Occupancy in Allen
Occupancy by Ownership in Allen
Of the total 35,111 dwellings in Allen, owner-occupied units account for 24,890 (70.9%), while renter-occupied units make up 10,221 (29.1%).
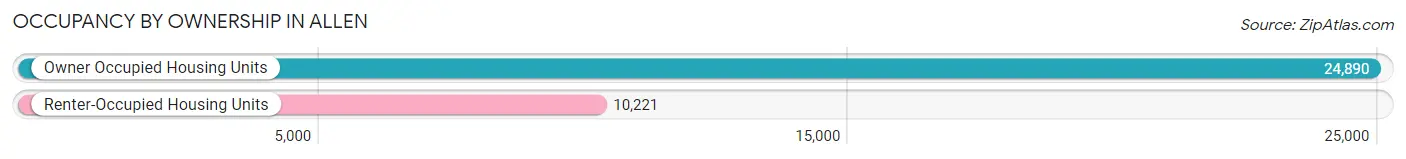
| Occupancy | # Housing Units | % Housing Units |
| Owner Occupied Housing Units | 24,890 | 70.9% |
| Renter-Occupied Housing Units | 10,221 | 29.1% |
| Total Occupied Housing Units | 35,111 | 100.0% |
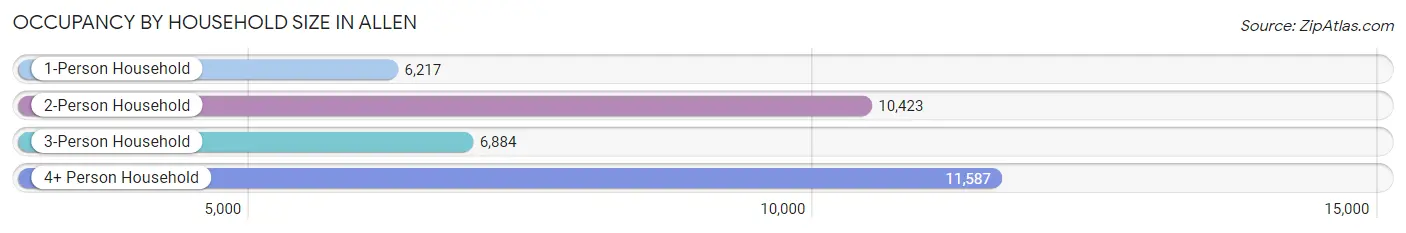
Occupancy by Household Size in Allen
| Household Size | # Housing Units | % Housing Units |
| 1-Person Household | 6,217 | 17.7% |
| 2-Person Household | 10,423 | 29.7% |
| 3-Person Household | 6,884 | 19.6% |
| 4+ Person Household | 11,587 | 33.0% |
| Total Housing Units | 35,111 | 100.0% |
Occupancy by Ownership by Household Size in Allen
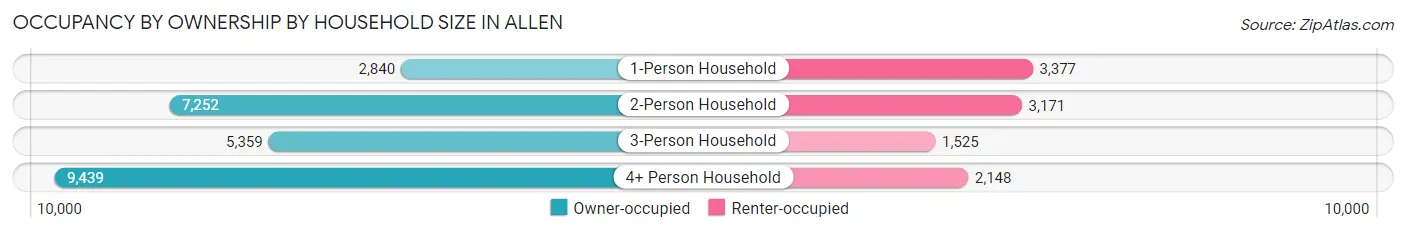
| Household Size | Owner-occupied | Renter-occupied |
| 1-Person Household | 2,840 (45.7%) | 3,377 (54.3%) |
| 2-Person Household | 7,252 (69.6%) | 3,171 (30.4%) |
| 3-Person Household | 5,359 (77.8%) | 1,525 (22.2%) |
| 4+ Person Household | 9,439 (81.5%) | 2,148 (18.5%) |
| Total Housing Units | 24,890 (70.9%) | 10,221 (29.1%) |
Occupancy by Educational Attainment in Allen
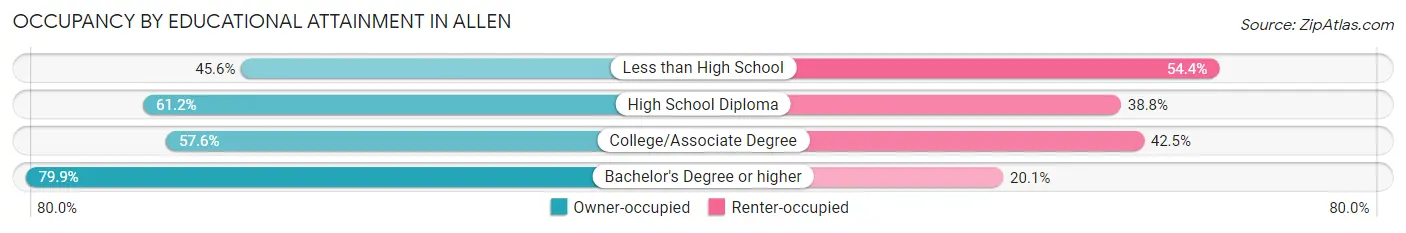
| Household Size | Owner-occupied | Renter-occupied |
| Less than High School | 569 (45.6%) | 678 (54.4%) |
| High School Diploma | 2,075 (61.2%) | 1,316 (38.8%) |
| College/Associate Degree | 5,394 (57.6%) | 3,978 (42.4%) |
| Bachelor's Degree or higher | 16,852 (79.9%) | 4,249 (20.1%) |
Occupancy by Age of Householder in Allen
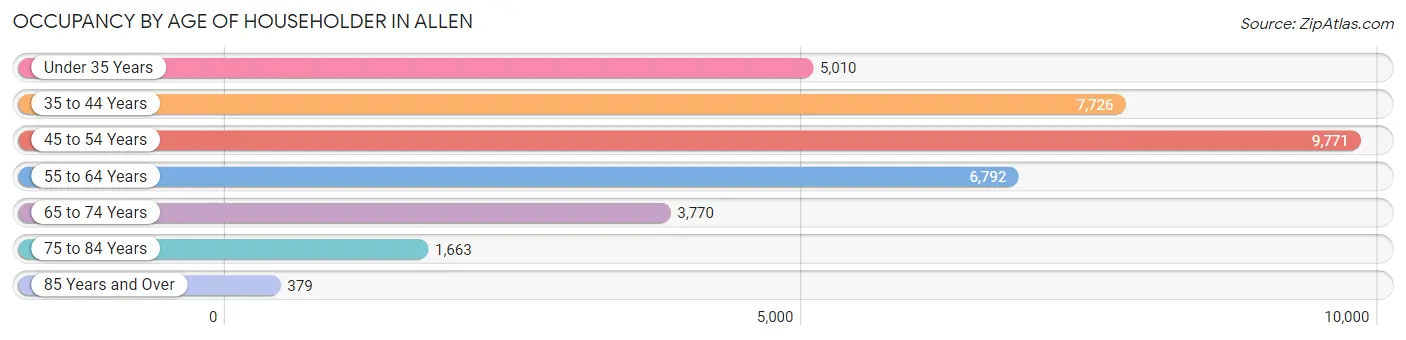
| Age Bracket | # Households | % Households |
| Under 35 Years | 5,010 | 14.3% |
| 35 to 44 Years | 7,726 | 22.0% |
| 45 to 54 Years | 9,771 | 27.8% |
| 55 to 64 Years | 6,792 | 19.3% |
| 65 to 74 Years | 3,770 | 10.7% |
| 75 to 84 Years | 1,663 | 4.7% |
| 85 Years and Over | 379 | 1.1% |
| Total | 35,111 | 100.0% |
Housing Finances in Allen
Median Income by Occupancy in Allen
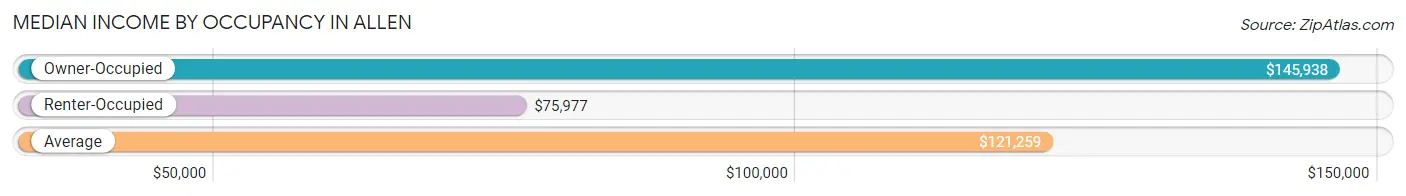
| Occupancy Type | # Households | Median Income |
| Owner-Occupied | 24,890 (70.9%) | $145,938 |
| Renter-Occupied | 10,221 (29.1%) | $75,977 |
| Average | 35,111 (100.0%) | $121,259 |
Occupancy by Householder Income Bracket in Allen
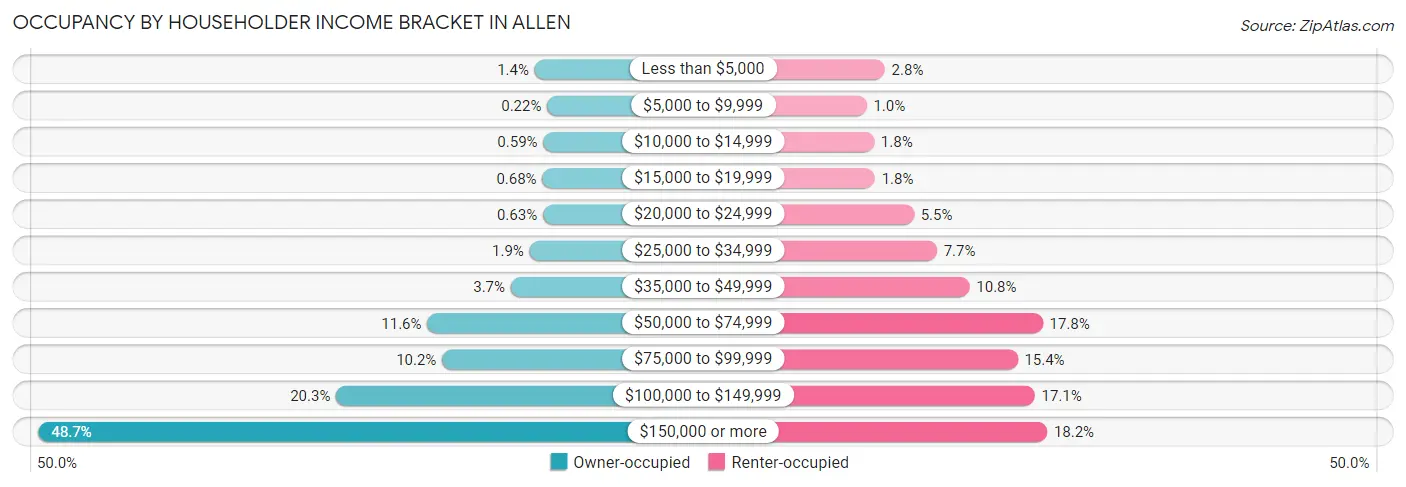
| Income Bracket | Owner-occupied | Renter-occupied |
| Less than $5,000 | 351 (1.4%) | 283 (2.8%) |
| $5,000 to $9,999 | 56 (0.2%) | 106 (1.0%) |
| $10,000 to $14,999 | 147 (0.6%) | 179 (1.8%) |
| $15,000 to $19,999 | 170 (0.7%) | 187 (1.8%) |
| $20,000 to $24,999 | 156 (0.6%) | 566 (5.5%) |
| $25,000 to $34,999 | 474 (1.9%) | 790 (7.7%) |
| $35,000 to $49,999 | 919 (3.7%) | 1,108 (10.8%) |
| $50,000 to $74,999 | 2,898 (11.6%) | 1,820 (17.8%) |
| $75,000 to $99,999 | 2,546 (10.2%) | 1,576 (15.4%) |
| $100,000 to $149,999 | 5,057 (20.3%) | 1,743 (17.1%) |
| $150,000 or more | 12,116 (48.7%) | 1,863 (18.2%) |
| Total | 24,890 (100.0%) | 10,221 (100.0%) |
Monthly Housing Cost Tiers in Allen
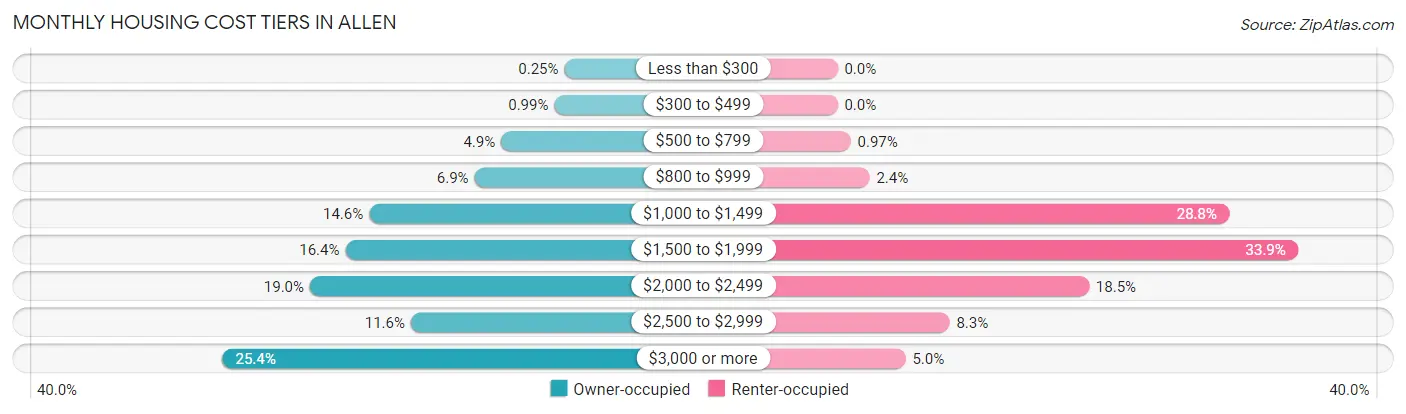
| Monthly Cost | Owner-occupied | Renter-occupied |
| Less than $300 | 62 (0.3%) | 0 (0.0%) |
| $300 to $499 | 246 (1.0%) | 0 (0.0%) |
| $500 to $799 | 1,222 (4.9%) | 99 (1.0%) |
| $800 to $999 | 1,711 (6.9%) | 241 (2.4%) |
| $1,000 to $1,499 | 3,641 (14.6%) | 2,946 (28.8%) |
| $1,500 to $1,999 | 4,076 (16.4%) | 3,464 (33.9%) |
| $2,000 to $2,499 | 4,726 (19.0%) | 1,893 (18.5%) |
| $2,500 to $2,999 | 2,878 (11.6%) | 843 (8.3%) |
| $3,000 or more | 6,328 (25.4%) | 512 (5.0%) |
| Total | 24,890 (100.0%) | 10,221 (100.0%) |
Physical Housing Characteristics in Allen
Housing Structures in Allen
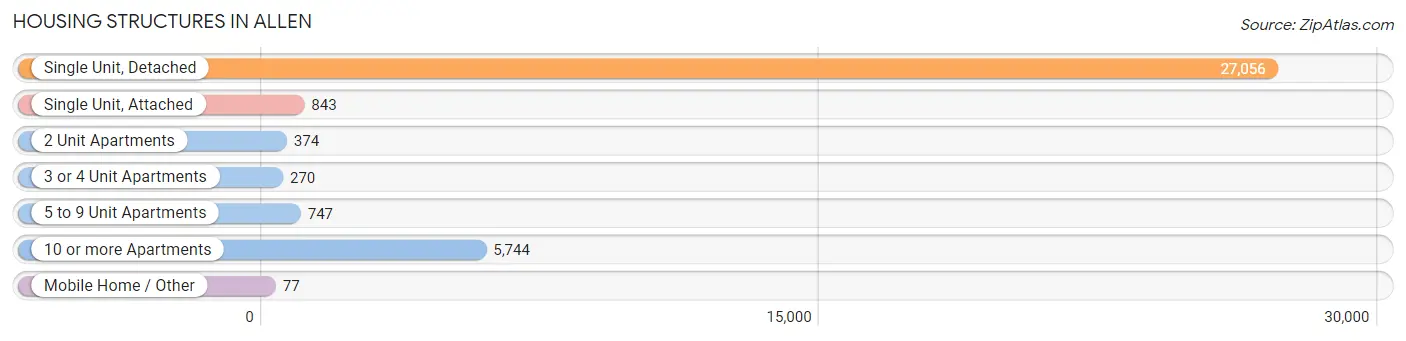
| Structure Type | # Housing Units | % Housing Units |
| Single Unit, Detached | 27,056 | 77.1% |
| Single Unit, Attached | 843 | 2.4% |
| 2 Unit Apartments | 374 | 1.1% |
| 3 or 4 Unit Apartments | 270 | 0.8% |
| 5 to 9 Unit Apartments | 747 | 2.1% |
| 10 or more Apartments | 5,744 | 16.4% |
| Mobile Home / Other | 77 | 0.2% |
| Total | 35,111 | 100.0% |
Housing Structures by Occupancy in Allen
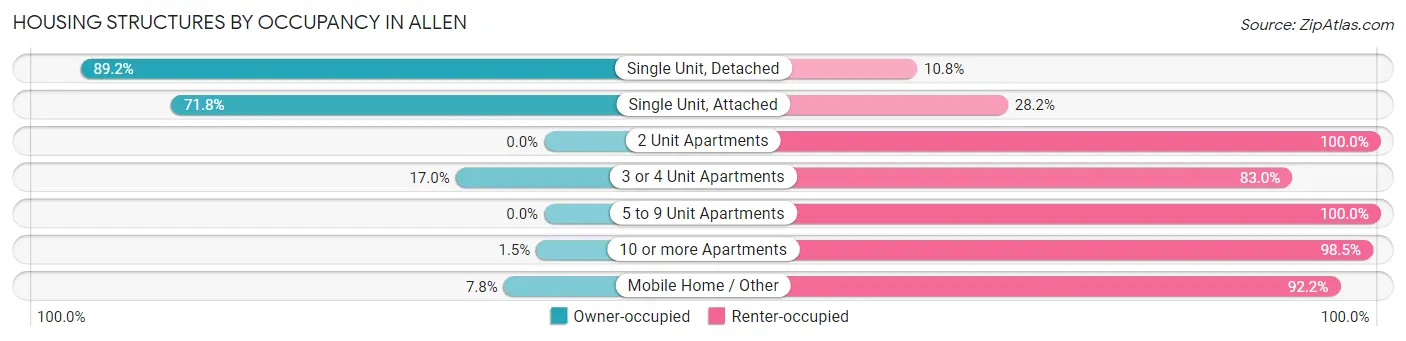
| Structure Type | Owner-occupied | Renter-occupied |
| Single Unit, Detached | 24,146 (89.2%) | 2,910 (10.8%) |
| Single Unit, Attached | 605 (71.8%) | 238 (28.2%) |
| 2 Unit Apartments | 0 (0.0%) | 374 (100.0%) |
| 3 or 4 Unit Apartments | 46 (17.0%) | 224 (83.0%) |
| 5 to 9 Unit Apartments | 0 (0.0%) | 747 (100.0%) |
| 10 or more Apartments | 87 (1.5%) | 5,657 (98.5%) |
| Mobile Home / Other | 6 (7.8%) | 71 (92.2%) |
| Total | 24,890 (70.9%) | 10,221 (29.1%) |
Housing Structures by Number of Rooms in Allen
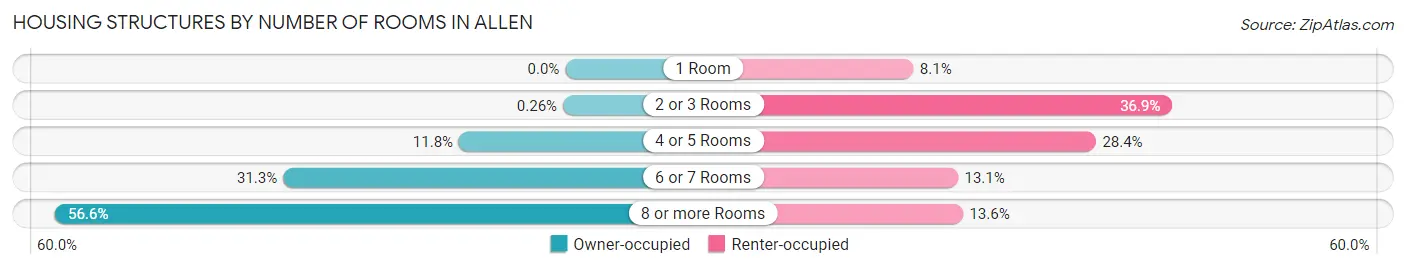
| Number of Rooms | Owner-occupied | Renter-occupied |
| 1 Room | 0 (0.0%) | 828 (8.1%) |
| 2 or 3 Rooms | 65 (0.3%) | 3,770 (36.9%) |
| 4 or 5 Rooms | 2,937 (11.8%) | 2,899 (28.4%) |
| 6 or 7 Rooms | 7,795 (31.3%) | 1,334 (13.1%) |
| 8 or more Rooms | 14,093 (56.6%) | 1,390 (13.6%) |
| Total | 24,890 (100.0%) | 10,221 (100.0%) |
Housing Structure by Heating Type in Allen
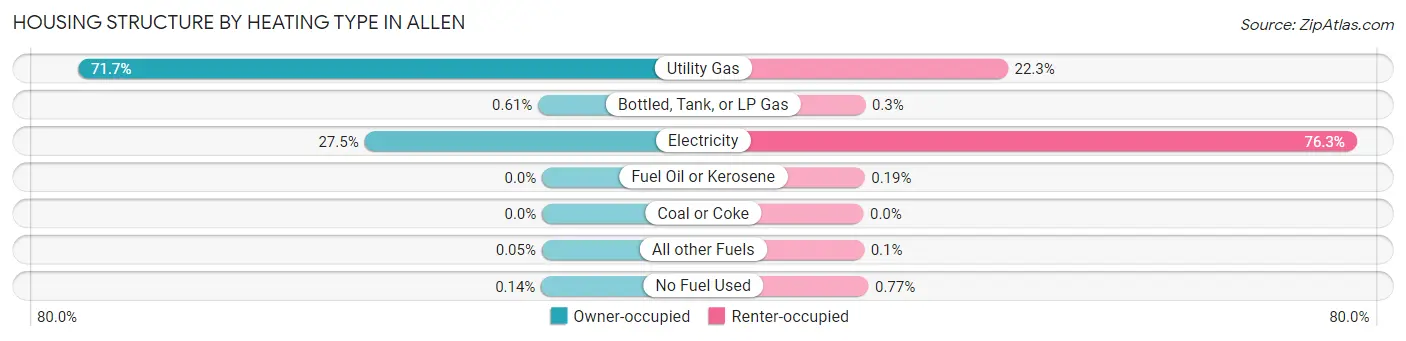
| Heating Type | Owner-occupied | Renter-occupied |
| Utility Gas | 17,852 (71.7%) | 2,283 (22.3%) |
| Bottled, Tank, or LP Gas | 153 (0.6%) | 31 (0.3%) |
| Electricity | 6,836 (27.5%) | 7,799 (76.3%) |
| Fuel Oil or Kerosene | 0 (0.0%) | 19 (0.2%) |
| Coal or Coke | 0 (0.0%) | 0 (0.0%) |
| All other Fuels | 13 (0.1%) | 10 (0.1%) |
| No Fuel Used | 36 (0.1%) | 79 (0.8%) |
| Total | 24,890 (100.0%) | 10,221 (100.0%) |
Household Vehicle Usage in Allen
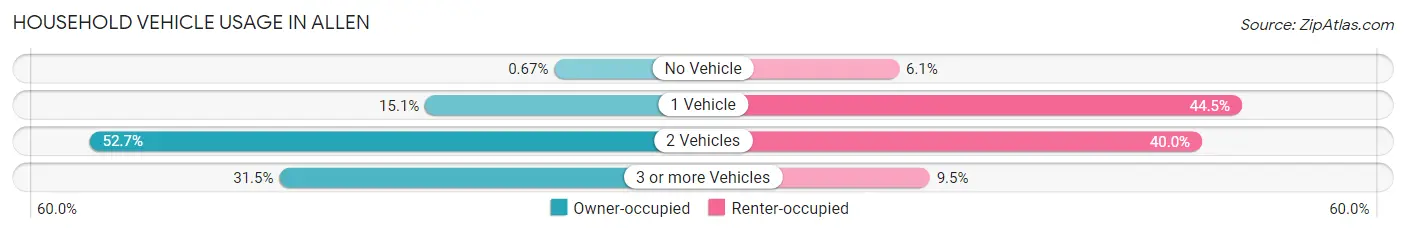
| Vehicles per Household | Owner-occupied | Renter-occupied |
| No Vehicle | 168 (0.7%) | 619 (6.1%) |
| 1 Vehicle | 3,766 (15.1%) | 4,544 (44.5%) |
| 2 Vehicles | 13,123 (52.7%) | 4,087 (40.0%) |
| 3 or more Vehicles | 7,833 (31.5%) | 971 (9.5%) |
| Total | 24,890 (100.0%) | 10,221 (100.0%) |
Real Estate & Mortgages in Allen
Real Estate and Mortgage Overview in Allen
| Characteristic | Without Mortgage | With Mortgage |
| Housing Units | 6,755 | 18,135 |
| Median Property Value | $375,900 | $395,400 |
| Median Household Income | $112,877 | $9,564 |
| Monthly Housing Costs | $1,039 | $6,296 |
| Real Estate Taxes | $6,739 | $158 |
Property Value by Mortgage Status in Allen
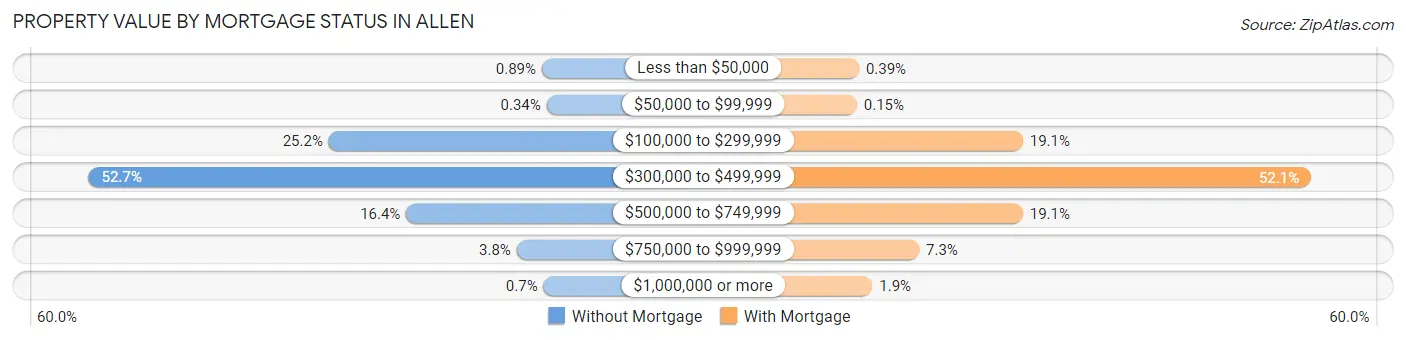
| Property Value | Without Mortgage | With Mortgage |
| Less than $50,000 | 60 (0.9%) | 71 (0.4%) |
| $50,000 to $99,999 | 23 (0.3%) | 27 (0.2%) |
| $100,000 to $299,999 | 1,705 (25.2%) | 3,465 (19.1%) |
| $300,000 to $499,999 | 3,559 (52.7%) | 9,441 (52.1%) |
| $500,000 to $749,999 | 1,107 (16.4%) | 3,465 (19.1%) |
| $750,000 to $999,999 | 254 (3.8%) | 1,317 (7.3%) |
| $1,000,000 or more | 47 (0.7%) | 349 (1.9%) |
| Total | 6,755 (100.0%) | 18,135 (100.0%) |
Household Income by Mortgage Status in Allen
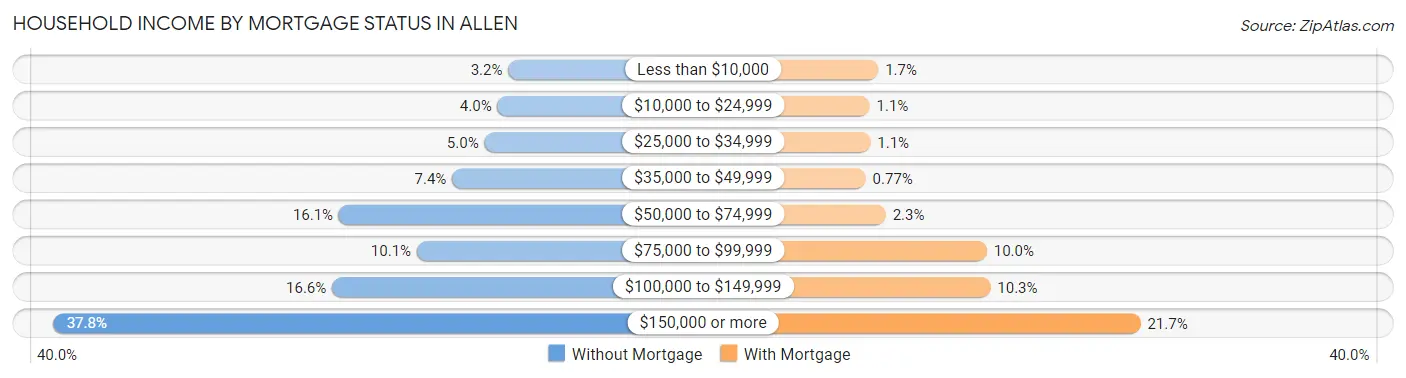
| Household Income | Without Mortgage | With Mortgage |
| Less than $10,000 | 213 (3.2%) | 313 (1.7%) |
| $10,000 to $24,999 | 268 (4.0%) | 194 (1.1%) |
| $25,000 to $34,999 | 335 (5.0%) | 205 (1.1%) |
| $35,000 to $49,999 | 501 (7.4%) | 139 (0.8%) |
| $50,000 to $74,999 | 1,084 (16.1%) | 418 (2.3%) |
| $75,000 to $99,999 | 683 (10.1%) | 1,814 (10.0%) |
| $100,000 to $149,999 | 1,119 (16.6%) | 1,863 (10.3%) |
| $150,000 or more | 2,552 (37.8%) | 3,938 (21.7%) |
| Total | 6,755 (100.0%) | 18,135 (100.0%) |
Property Value to Household Income Ratio in Allen
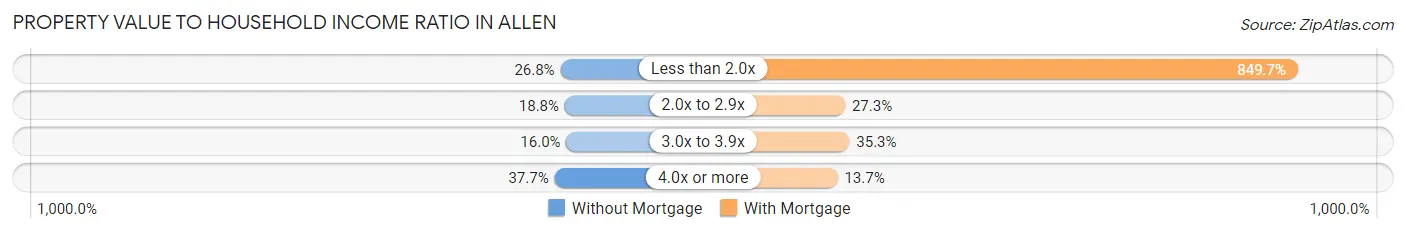
| Value-to-Income Ratio | Without Mortgage | With Mortgage |
| Less than 2.0x | 1,813 (26.8%) | 154,089 (849.7%) |
| 2.0x to 2.9x | 1,269 (18.8%) | 4,959 (27.3%) |
| 3.0x to 3.9x | 1,080 (16.0%) | 6,398 (35.3%) |
| 4.0x or more | 2,544 (37.7%) | 2,487 (13.7%) |
| Total | 6,755 (100.0%) | 18,135 (100.0%) |
Real Estate Taxes by Mortgage Status in Allen
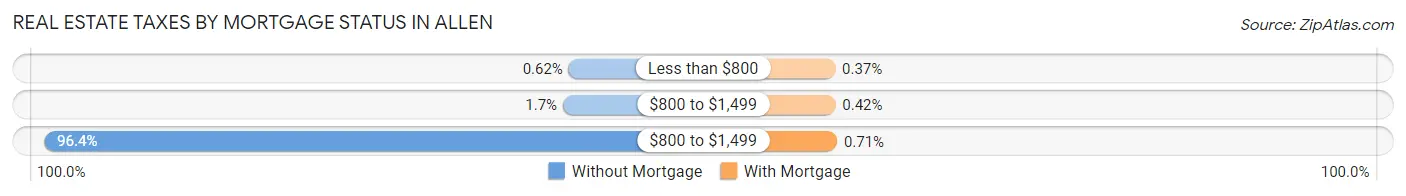
| Property Taxes | Without Mortgage | With Mortgage |
| Less than $800 | 42 (0.6%) | 68 (0.4%) |
| $800 to $1,499 | 113 (1.7%) | 76 (0.4%) |
| $800 to $1,499 | 6,513 (96.4%) | 129 (0.7%) |
| Total | 6,755 (100.0%) | 18,135 (100.0%) |
Health & Disability in Allen
Health Insurance Coverage by Age in Allen
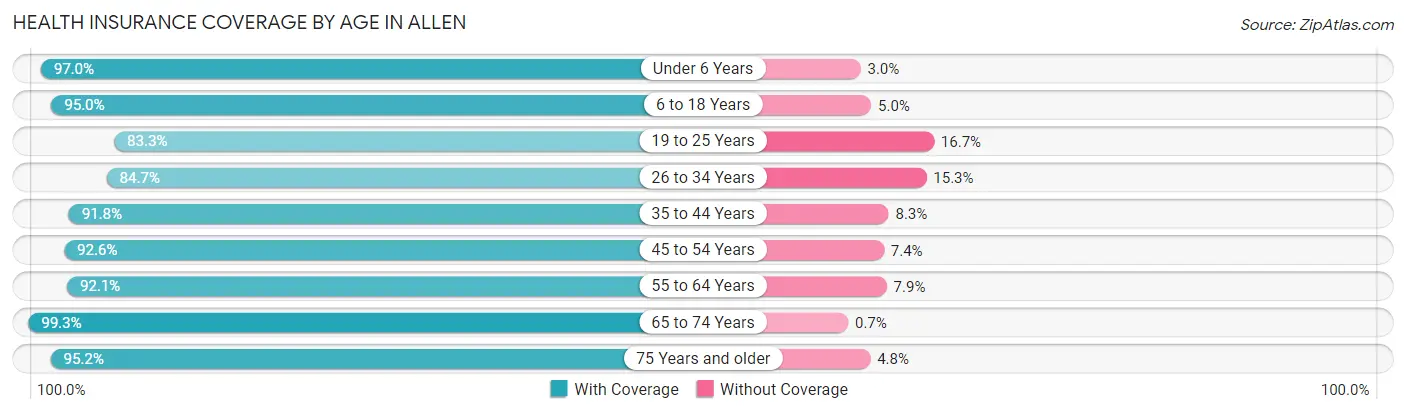
| Age Bracket | With Coverage | Without Coverage |
| Under 6 Years | 6,747 (97.0%) | 211 (3.0%) |
| 6 to 18 Years | 20,930 (95.0%) | 1,101 (5.0%) |
| 19 to 25 Years | 7,295 (83.3%) | 1,464 (16.7%) |
| 26 to 34 Years | 9,267 (84.7%) | 1,674 (15.3%) |
| 35 to 44 Years | 13,674 (91.7%) | 1,229 (8.3%) |
| 45 to 54 Years | 16,615 (92.6%) | 1,321 (7.4%) |
| 55 to 64 Years | 11,831 (92.1%) | 1,015 (7.9%) |
| 65 to 74 Years | 6,781 (99.3%) | 48 (0.7%) |
| 75 Years and older | 3,736 (95.2%) | 190 (4.8%) |
| Total | 96,876 (92.1%) | 8,253 (7.9%) |
Health Insurance Coverage by Citizenship Status in Allen
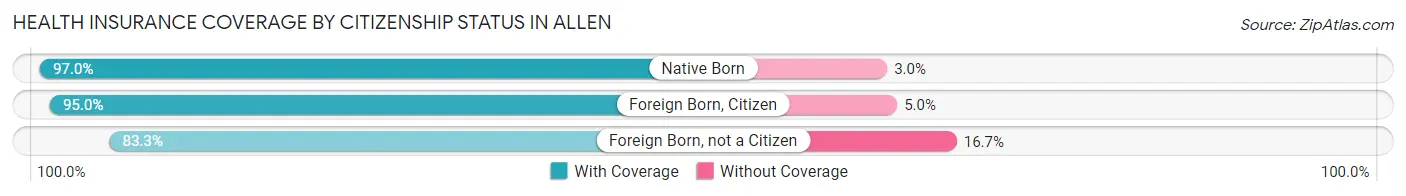
| Citizenship Status | With Coverage | Without Coverage |
| Native Born | 6,747 (97.0%) | 211 (3.0%) |
| Foreign Born, Citizen | 20,930 (95.0%) | 1,101 (5.0%) |
| Foreign Born, not a Citizen | 7,295 (83.3%) | 1,464 (16.7%) |
Health Insurance Coverage by Household Income in Allen
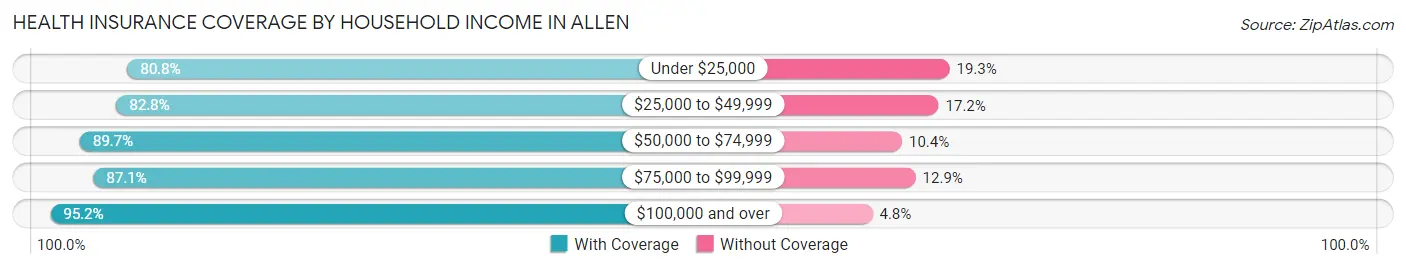
| Household Income | With Coverage | Without Coverage |
| Under $25,000 | 4,202 (80.7%) | 1,002 (19.3%) |
| $25,000 to $49,999 | 5,658 (82.8%) | 1,175 (17.2%) |
| $50,000 to $74,999 | 10,658 (89.6%) | 1,231 (10.3%) |
| $75,000 to $99,999 | 10,057 (87.1%) | 1,490 (12.9%) |
| $100,000 and over | 66,258 (95.2%) | 3,354 (4.8%) |
Public vs Private Health Insurance Coverage by Age in Allen
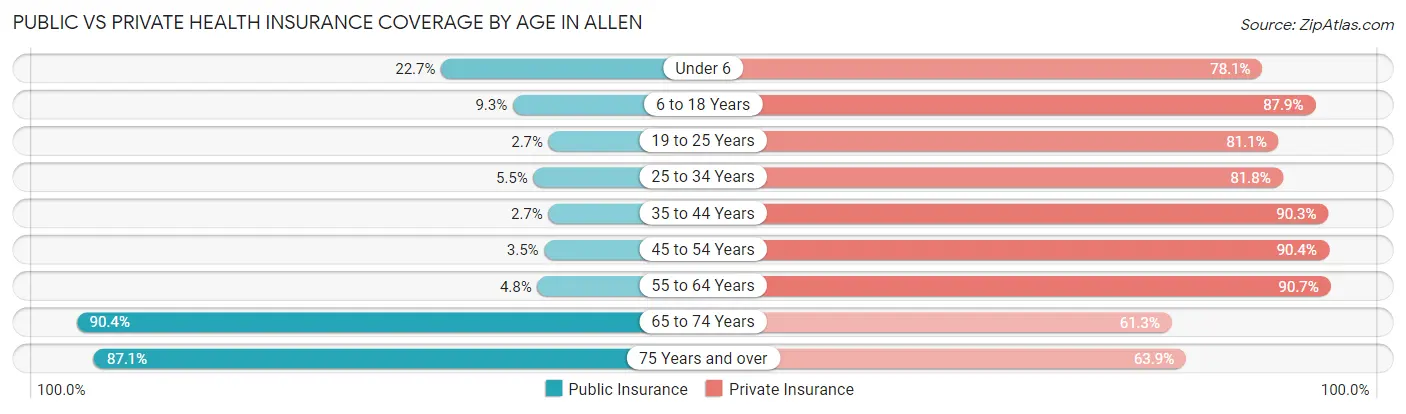
| Age Bracket | Public Insurance | Private Insurance |
| Under 6 | 1,576 (22.7%) | 5,432 (78.1%) |
| 6 to 18 Years | 2,055 (9.3%) | 19,358 (87.9%) |
| 19 to 25 Years | 236 (2.7%) | 7,099 (81.0%) |
| 25 to 34 Years | 604 (5.5%) | 8,949 (81.8%) |
| 35 to 44 Years | 408 (2.7%) | 13,456 (90.3%) |
| 45 to 54 Years | 630 (3.5%) | 16,211 (90.4%) |
| 55 to 64 Years | 615 (4.8%) | 11,655 (90.7%) |
| 65 to 74 Years | 6,170 (90.3%) | 4,183 (61.3%) |
| 75 Years and over | 3,421 (87.1%) | 2,508 (63.9%) |
| Total | 15,715 (14.9%) | 88,851 (84.5%) |
Disability Status by Sex by Age in Allen
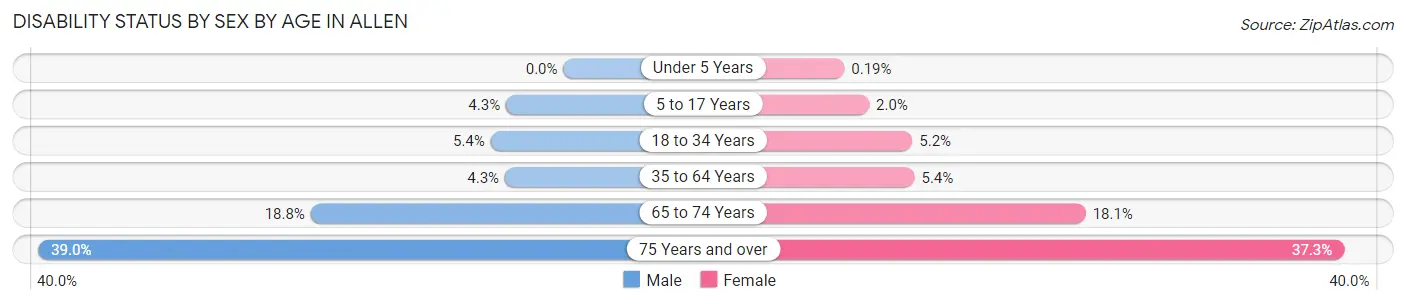
| Age Bracket | Male | Female |
| Under 5 Years | 0 (0.0%) | 5 (0.2%) |
| 5 to 17 Years | 480 (4.3%) | 212 (2.0%) |
| 18 to 34 Years | 632 (5.4%) | 508 (5.2%) |
| 35 to 64 Years | 974 (4.3%) | 1,256 (5.4%) |
| 65 to 74 Years | 637 (18.8%) | 622 (18.1%) |
| 75 Years and over | 623 (39.0%) | 868 (37.3%) |
Disability Class by Sex by Age in Allen
Disability Class: Hearing Difficulty
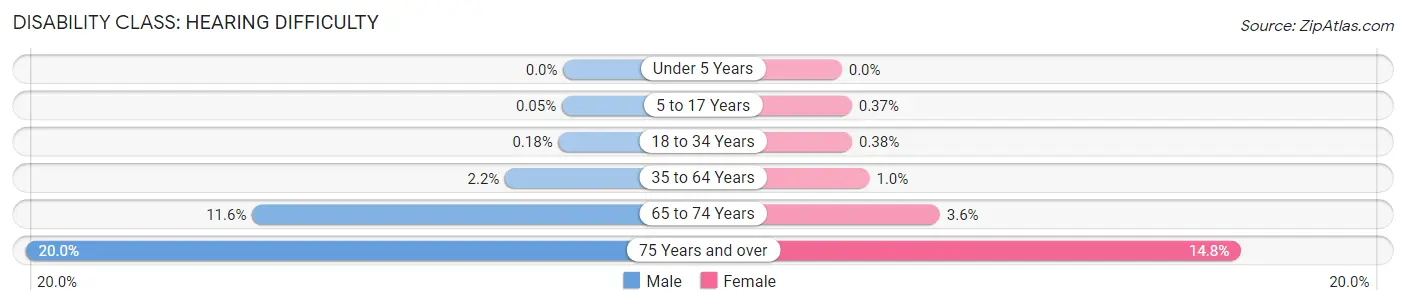
| Age Bracket | Male | Female |
| Under 5 Years | 0 (0.0%) | 0 (0.0%) |
| 5 to 17 Years | 6 (0.1%) | 39 (0.4%) |
| 18 to 34 Years | 21 (0.2%) | 37 (0.4%) |
| 35 to 64 Years | 484 (2.2%) | 240 (1.0%) |
| 65 to 74 Years | 392 (11.6%) | 125 (3.6%) |
| 75 Years and over | 319 (20.0%) | 345 (14.8%) |
Disability Class: Vision Difficulty
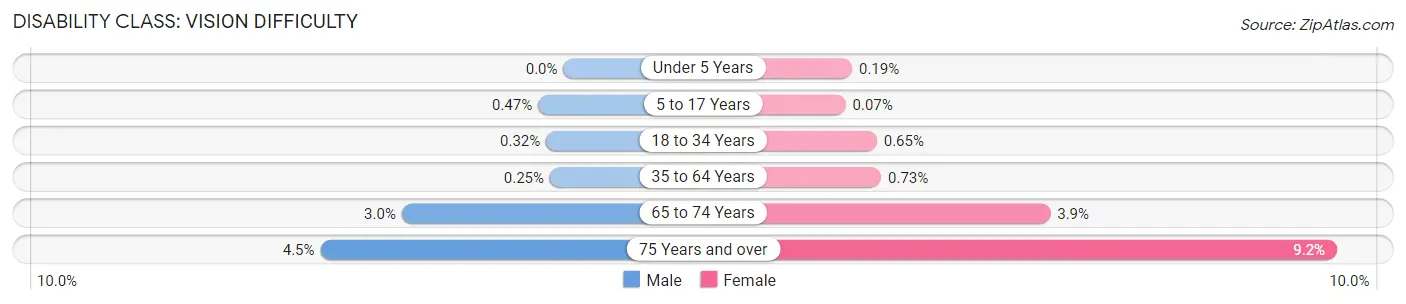
| Age Bracket | Male | Female |
| Under 5 Years | 0 (0.0%) | 5 (0.2%) |
| 5 to 17 Years | 53 (0.5%) | 7 (0.1%) |
| 18 to 34 Years | 38 (0.3%) | 63 (0.6%) |
| 35 to 64 Years | 57 (0.3%) | 169 (0.7%) |
| 65 to 74 Years | 102 (3.0%) | 133 (3.9%) |
| 75 Years and over | 72 (4.5%) | 214 (9.2%) |
Disability Class: Cognitive Difficulty
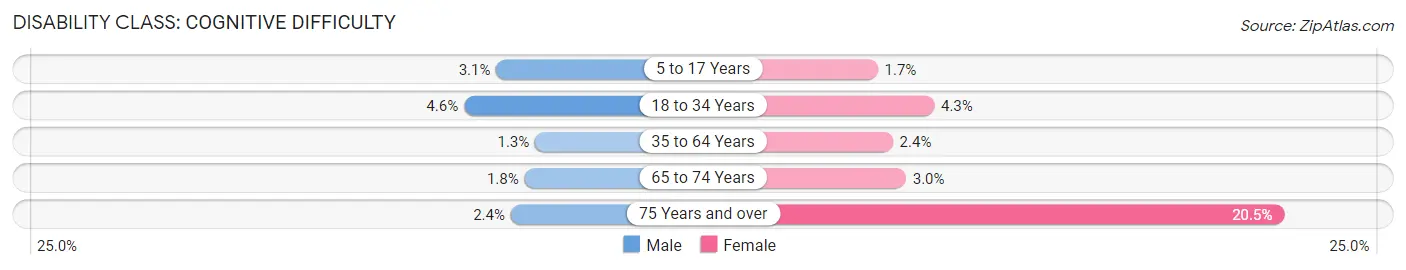
| Age Bracket | Male | Female |
| 5 to 17 Years | 350 (3.1%) | 173 (1.7%) |
| 18 to 34 Years | 540 (4.6%) | 415 (4.3%) |
| 35 to 64 Years | 293 (1.3%) | 549 (2.4%) |
| 65 to 74 Years | 61 (1.8%) | 102 (3.0%) |
| 75 Years and over | 39 (2.4%) | 478 (20.5%) |
Disability Class: Ambulatory Difficulty
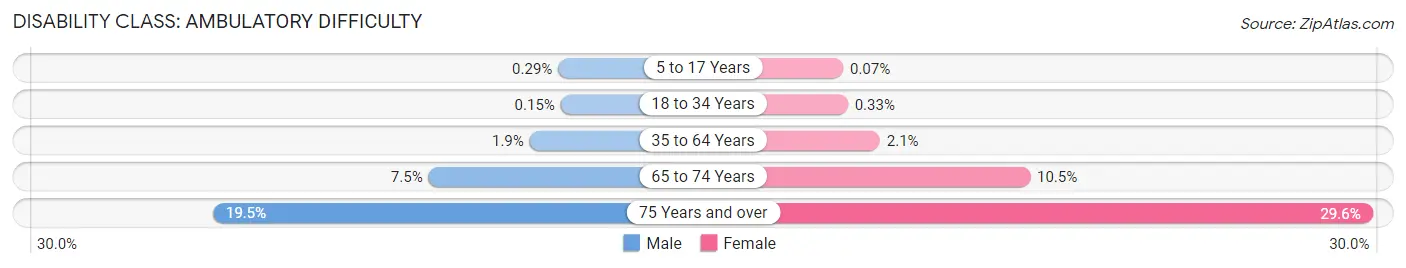
| Age Bracket | Male | Female |
| 5 to 17 Years | 33 (0.3%) | 7 (0.1%) |
| 18 to 34 Years | 17 (0.2%) | 32 (0.3%) |
| 35 to 64 Years | 421 (1.9%) | 493 (2.1%) |
| 65 to 74 Years | 255 (7.5%) | 360 (10.5%) |
| 75 Years and over | 312 (19.5%) | 688 (29.5%) |
Disability Class: Self-Care Difficulty
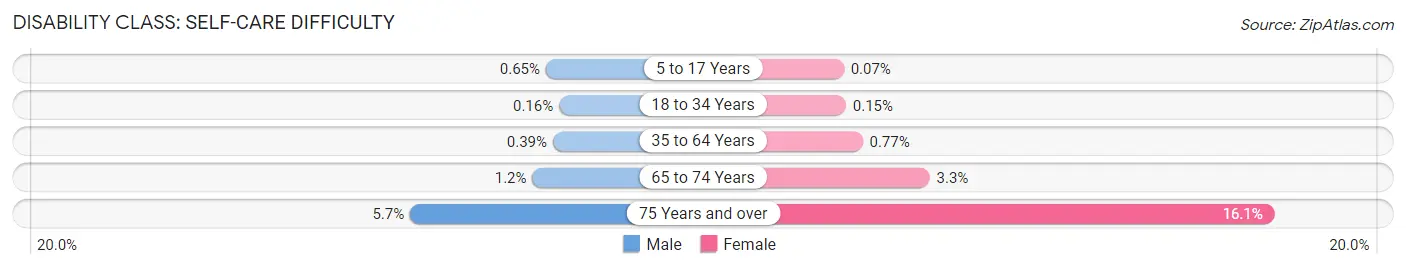
| Age Bracket | Male | Female |
| 5 to 17 Years | 73 (0.6%) | 7 (0.1%) |
| 18 to 34 Years | 19 (0.2%) | 15 (0.2%) |
| 35 to 64 Years | 88 (0.4%) | 179 (0.8%) |
| 65 to 74 Years | 39 (1.1%) | 112 (3.3%) |
| 75 Years and over | 91 (5.7%) | 374 (16.1%) |
Technology Access in Allen
Computing Device Access in Allen
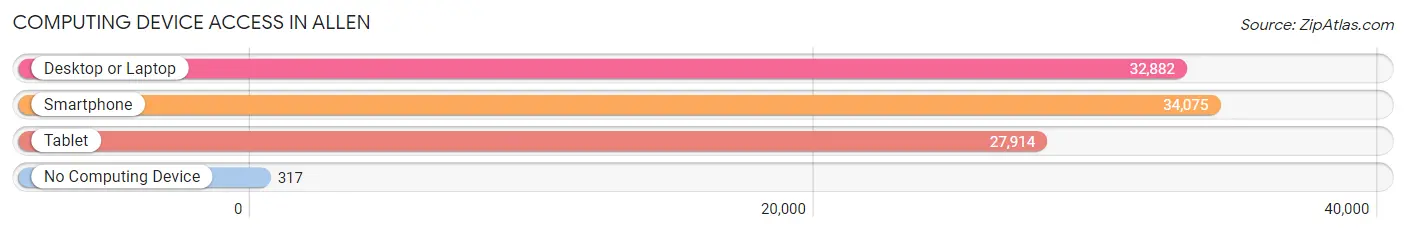
| Device Type | # Households | % Households |
| Desktop or Laptop | 32,882 | 93.6% |
| Smartphone | 34,075 | 97.1% |
| Tablet | 27,914 | 79.5% |
| No Computing Device | 317 | 0.9% |
| Total | 35,111 | 100.0% |
Internet Access in Allen
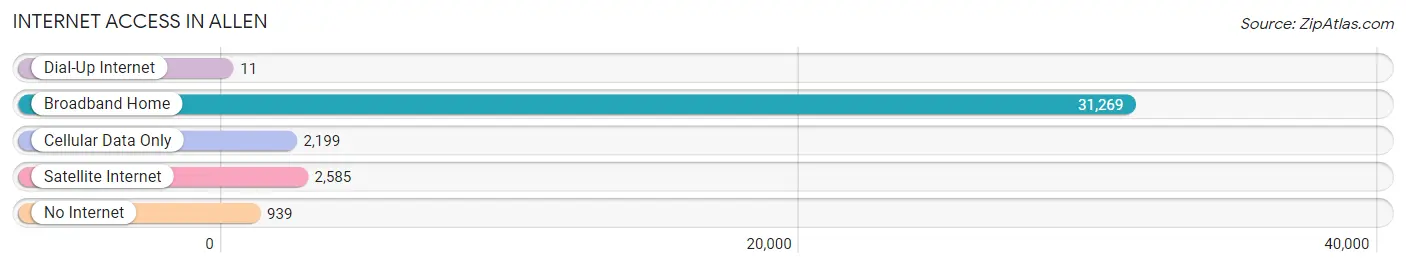
| Internet Type | # Households | % Households |
| Dial-Up Internet | 11 | 0.0% |
| Broadband Home | 31,269 | 89.1% |
| Cellular Data Only | 2,199 | 6.3% |
| Satellite Internet | 2,585 | 7.4% |
| No Internet | 939 | 2.7% |
| Total | 35,111 | 100.0% |
Allen Summary
Allen, Texas is a city located in Collin County, Texas, United States. It is an affluent northern suburb of Dallas, and is a part of the Dallas-Fort Worth metropolitan area. The city had a population of 84,246 at the 2010 census, making it the twenty-fourth most populous city in the state of Texas.
History
The area now known as Allen was originally home to the Caddo, Comanche, and other indigenous peoples. The first immigrants to the area were of European descent, arriving in the 1840s. The town of Allen was established in 1872 by the Houston and Central Texas Railroad and named in honor of Ebenezer Allen, a state politician and railroad promoter.
In the early 1900s, the town began to grow rapidly, and by the 1950s, it had become a major agricultural center. In the 1970s, the city began to experience a population boom, and by the 1990s, it had become a major suburb of Dallas.
Geography
Allen is located in Collin County, Texas, at 33°07'N 96°39'W. It is situated at the intersection of US Highway 75 and State Highway 121. The city has a total area of 27.1 square miles, of which 26.9 square miles is land and 0.2 square miles is water.
The city is located in the Blackland Prairie region of Texas, and is characterized by rolling hills and prairies. The city is also home to several creeks, including the East Fork of the Trinity River, which runs through the city.
Economy
Allen is a major economic center in the Dallas-Fort Worth metropolitan area. The city is home to several major employers, including the Allen Independent School District, the Allen Economic Development Corporation, and the Allen Public Library.
The city is also home to several major retail centers, including the Allen Premium Outlets, the Allen Event Center, and the Allen Town Center. Additionally, the city is home to several major corporate headquarters, including the headquarters of the Dr Pepper Snapple Group, the headquarters of the J.C. Penney Company, and the headquarters of the Texas Instruments Corporation.
Demographics
As of the 2010 census, the city of Allen had a population of 84,246. The racial makeup of the city was 75.2% White, 8.3% African American, 0.5% Native American, 6.3% Asian, 0.1% Pacific Islander, 5.2% from other races, and 4.4% from two or more races. Hispanic or Latino of any race were 16.5% of the population.
The median income for a household in the city was $87,821, and the median income for a family was $103,945. The per capita income for the city was $37,945. About 4.2% of families and 5.7% of the population were below the poverty line, including 6.3% of those under age 18 and 4.2% of those age 65 or over.
Common Questions
What is Per Capita Income in Allen?
Per Capita income in Allen is $51,413.
What is the Median Family Income in Allen?
Median Family Income in Allen is $138,731.
What is the Median Household income in Allen?
Median Household Income in Allen is $121,259.
What is Income or Wage Gap in Allen?
Income or Wage Gap in Allen is 42.8%.
Women in Allen earn 57.2 cents for every dollar earned by a man.
What is Inequality or Gini Index in Allen?
Inequality or Gini Index in Allen is 0.40.
What is the Total Population of Allen?
Total Population of Allen is 105,444.
What is the Total Male Population of Allen?
Total Male Population of Allen is 53,451.
What is the Total Female Population of Allen?
Total Female Population of Allen is 51,993.
What is the Ratio of Males per 100 Females in Allen?
There are 102.80 Males per 100 Females in Allen.
What is the Ratio of Females per 100 Males in Allen?
There are 97.27 Females per 100 Males in Allen.
What is the Median Population Age in Allen?
Median Population Age in Allen is 37.8 Years.
What is the Average Family Size in Allen
Average Family Size in Allen is 3.4 People.
What is the Average Household Size in Allen
Average Household Size in Allen is 3.0 People.
How Large is the Labor Force in Allen?
There are 57,340 People in the Labor Forcein in Allen.
What is the Percentage of People in the Labor Force in Allen?
70.5% of People are in the Labor Force in Allen.
What is the Unemployment Rate in Allen?
Unemployment Rate in Allen is 4.3%.