Reno, NV Map & Demographics
Reno Map
Reno Overview
$43,245
PER CAPITA INCOME
$93,109
AVG FAMILY INCOME
$73,073
AVG HOUSEHOLD INCOME
21.6%
WAGE / INCOME GAP [ % ]
78.4¢/ $1
WAGE / INCOME GAP [ $ ]
$10,787
FAMILY INCOME DEFICIT
0.47
INEQUALITY / GINI INDEX
265,196
TOTAL POPULATION
134,102
MALE POPULATION
131,094
FEMALE POPULATION
102.29
MALES / 100 FEMALES
97.76
FEMALES / 100 MALES
36.9
MEDIAN AGE
3.0
AVG FAMILY SIZE
2.4
AVG HOUSEHOLD SIZE
147,831
LABOR FORCE [ PEOPLE ]
67.6%
PERCENT IN LABOR FORCE
5.0%
UNEMPLOYMENT RATE
Reno Zip Codes
Reno Area Codes
Income in Reno
Income Overview in Reno
Per Capita Income in Reno is $43,245, while median incomes of families and households are $93,109 and $73,073 respectively.
| Characteristic | Number | Measure |
| Per Capita Income | 265,196 | $43,245 |
| Median Family Income | 60,885 | $93,109 |
| Mean Family Income | 60,885 | $125,183 |
| Median Household Income | 110,480 | $73,073 |
| Mean Household Income | 110,480 | $102,354 |
| Income Deficit | 60,885 | $10,787 |
| Wage / Income Gap (%) | 265,196 | 21.61% |
| Wage / Income Gap ($) | 265,196 | 78.39¢ per $1 |
| Gini / Inequality Index | 265,196 | 0.47 |
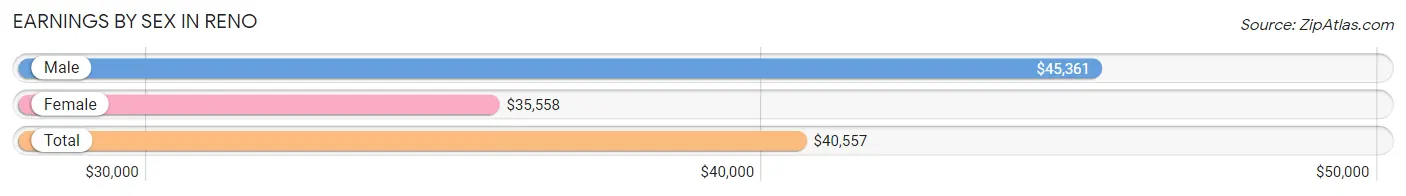
Earnings by Sex in Reno
Average Earnings in Reno are $40,557, $45,361 for men and $35,558 for women, a difference of 21.6%.
| Sex | Number | Average Earnings |
| Male | 82,936 (54.0%) | $45,361 |
| Female | 70,648 (46.0%) | $35,558 |
| Total | 153,584 (100.0%) | $40,557 |
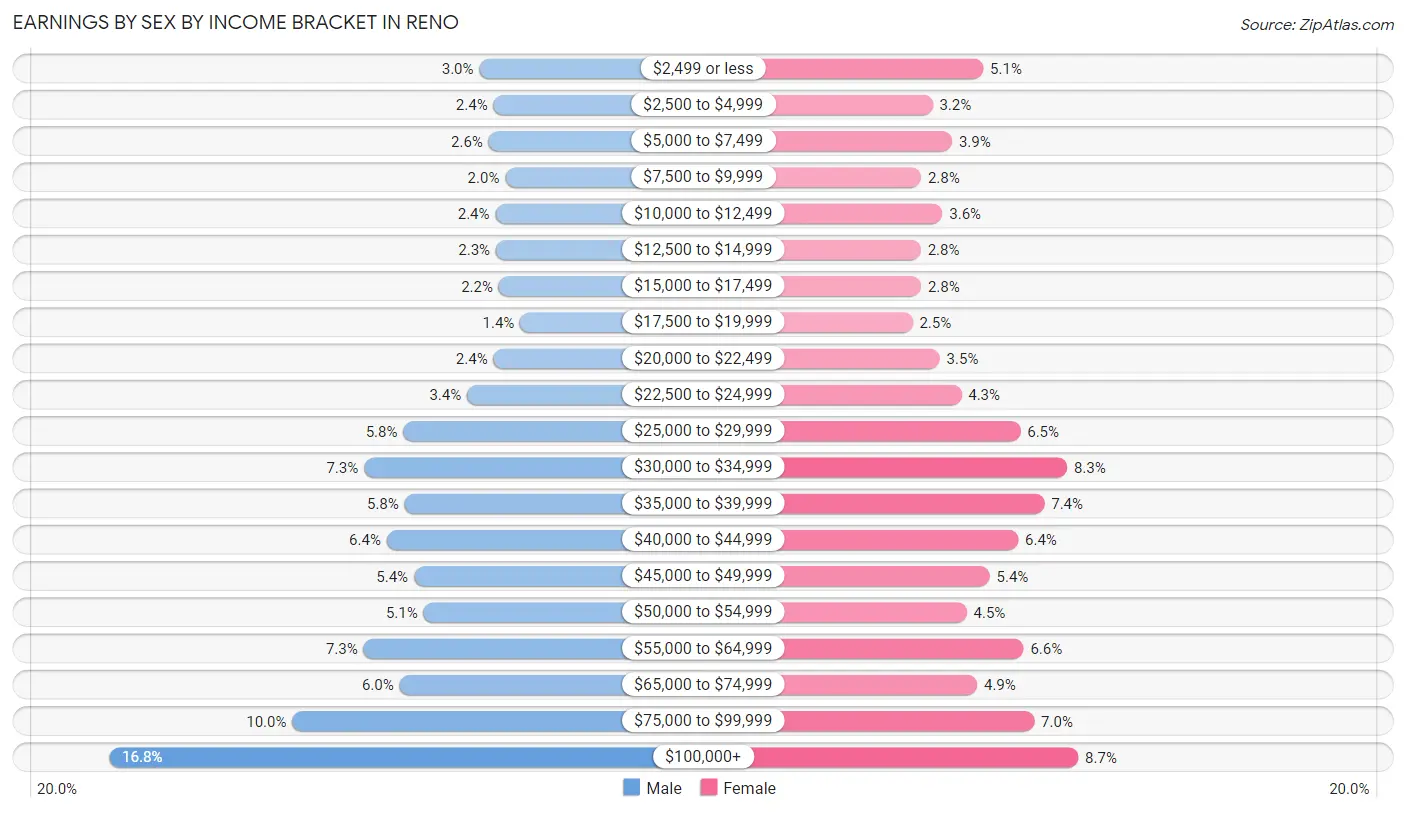
Earnings by Sex by Income Bracket in Reno
The most common earnings brackets in Reno are $100,000+ for men (13,955 | 16.8%) and $100,000+ for women (6,125 | 8.7%).
| Income | Male | Female |
| $2,499 or less | 2,452 (3.0%) | 3,609 (5.1%) |
| $2,500 to $4,999 | 2,012 (2.4%) | 2,271 (3.2%) |
| $5,000 to $7,499 | 2,166 (2.6%) | 2,786 (3.9%) |
| $7,500 to $9,999 | 1,651 (2.0%) | 1,961 (2.8%) |
| $10,000 to $12,499 | 1,959 (2.4%) | 2,527 (3.6%) |
| $12,500 to $14,999 | 1,940 (2.3%) | 1,957 (2.8%) |
| $15,000 to $17,499 | 1,853 (2.2%) | 1,963 (2.8%) |
| $17,500 to $19,999 | 1,188 (1.4%) | 1,738 (2.5%) |
| $20,000 to $22,499 | 2,016 (2.4%) | 2,459 (3.5%) |
| $22,500 to $24,999 | 2,837 (3.4%) | 3,030 (4.3%) |
| $25,000 to $29,999 | 4,822 (5.8%) | 4,595 (6.5%) |
| $30,000 to $34,999 | 6,039 (7.3%) | 5,826 (8.3%) |
| $35,000 to $39,999 | 4,778 (5.8%) | 5,227 (7.4%) |
| $40,000 to $44,999 | 5,335 (6.4%) | 4,536 (6.4%) |
| $45,000 to $49,999 | 4,487 (5.4%) | 3,778 (5.3%) |
| $50,000 to $54,999 | 4,192 (5.1%) | 3,172 (4.5%) |
| $55,000 to $64,999 | 6,051 (7.3%) | 4,680 (6.6%) |
| $65,000 to $74,999 | 4,934 (5.9%) | 3,446 (4.9%) |
| $75,000 to $99,999 | 8,269 (10.0%) | 4,962 (7.0%) |
| $100,000+ | 13,955 (16.8%) | 6,125 (8.7%) |
| Total | 82,936 (100.0%) | 70,648 (100.0%) |
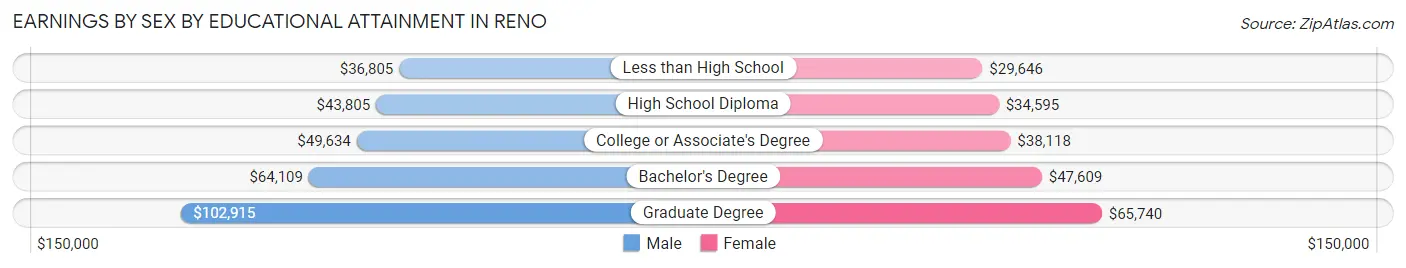
Earnings by Sex by Educational Attainment in Reno
Average earnings in Reno are $52,307 for men and $40,560 for women, a difference of 22.5%. Men with an educational attainment of graduate degree enjoy the highest average annual earnings of $102,915, while those with less than high school education earn the least with $36,805. Women with an educational attainment of graduate degree earn the most with the average annual earnings of $65,740, while those with less than high school education have the smallest earnings of $29,646.
| Educational Attainment | Male Income | Female Income |
| Less than High School | $36,805 | $29,646 |
| High School Diploma | $43,805 | $34,595 |
| College or Associate's Degree | $49,634 | $38,118 |
| Bachelor's Degree | $64,109 | $47,609 |
| Graduate Degree | $102,915 | $65,740 |
| Total | $52,307 | $40,560 |
Family Income in Reno
Family Income Brackets in Reno
According to the Reno family income data, there are 12,969 families falling into the $100,000 to $149,999 income range, which is the most common income bracket and makes up 21.3% of all families. Conversely, the $10,000 to $14,999 income bracket is the least frequent group with only 1,035 families (1.7%) belonging to this category.
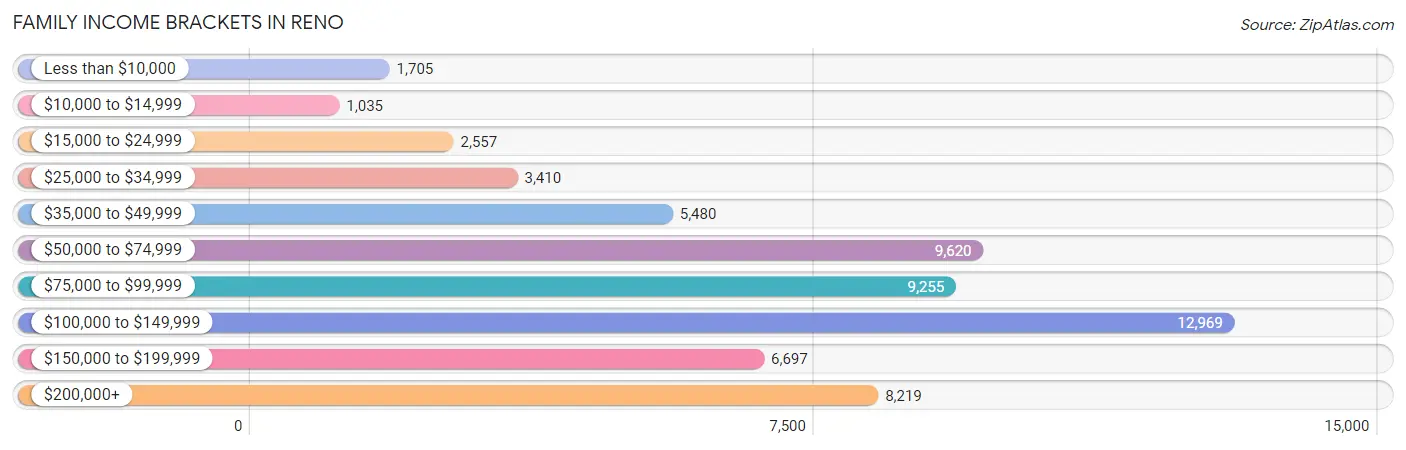
| Income Bracket | # Families | % Families |
| Less than $10,000 | 1,705 | 2.8% |
| $10,000 to $14,999 | 1,035 | 1.7% |
| $15,000 to $24,999 | 2,557 | 4.2% |
| $25,000 to $34,999 | 3,410 | 5.6% |
| $35,000 to $49,999 | 5,480 | 9.0% |
| $50,000 to $74,999 | 9,620 | 15.8% |
| $75,000 to $99,999 | 9,255 | 15.2% |
| $100,000 to $149,999 | 12,969 | 21.3% |
| $150,000 to $199,999 | 6,697 | 11.0% |
| $200,000+ | 8,219 | 13.5% |
Family Income by Famaliy Size in Reno
7+ person families (869 | 1.4%) account for the highest median family income in Reno with $122,599 per family, while 2-person families (29,937 | 49.2%) have the highest median income of $41,434 per family member.
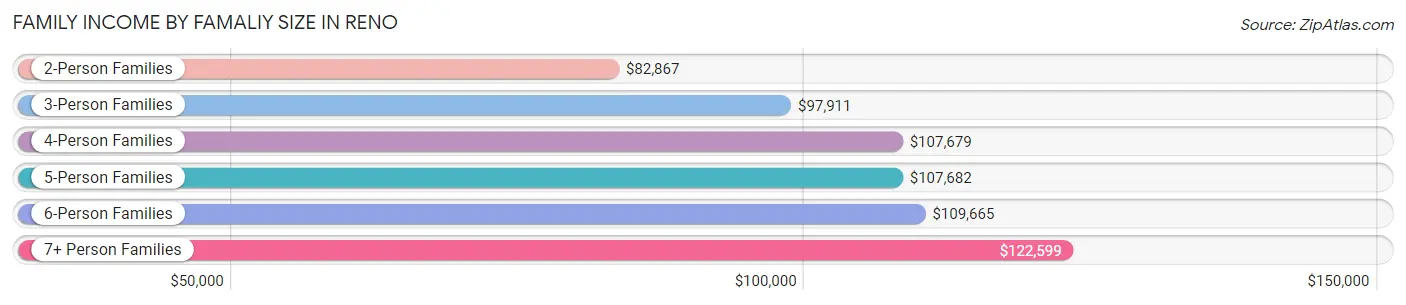
| Income Bracket | # Families | Median Income |
| 2-Person Families | 29,937 (49.2%) | $82,867 |
| 3-Person Families | 13,643 (22.4%) | $97,911 |
| 4-Person Families | 10,722 (17.6%) | $107,679 |
| 5-Person Families | 4,705 (7.7%) | $107,682 |
| 6-Person Families | 1,009 (1.7%) | $109,665 |
| 7+ Person Families | 869 (1.4%) | $122,599 |
| Total | 60,885 (100.0%) | $93,109 |
Family Income by Number of Earners in Reno
The median family income in Reno is $93,109, with families comprising 3+ earners (6,974) having the highest median family income of $138,780, while families with 1 earner (18,938) have the lowest median family income of $61,089, accounting for 11.5% and 31.1% of families, respectively.
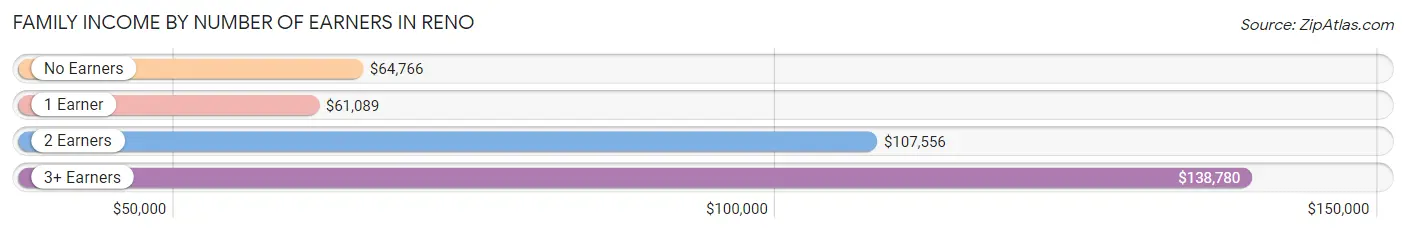
| Number of Earners | # Families | Median Income |
| No Earners | 8,325 (13.7%) | $64,766 |
| 1 Earner | 18,938 (31.1%) | $61,089 |
| 2 Earners | 26,648 (43.8%) | $107,556 |
| 3+ Earners | 6,974 (11.5%) | $138,780 |
| Total | 60,885 (100.0%) | $93,109 |
Household Income in Reno
Household Income Brackets in Reno
With 19,886 households falling in the category, the $100,000 to $149,999 income range is the most frequent in Reno, accounting for 18.0% of all households. In contrast, only 3,535 households (3.2%) fall into the $10,000 to $14,999 income bracket, making it the least populous group.
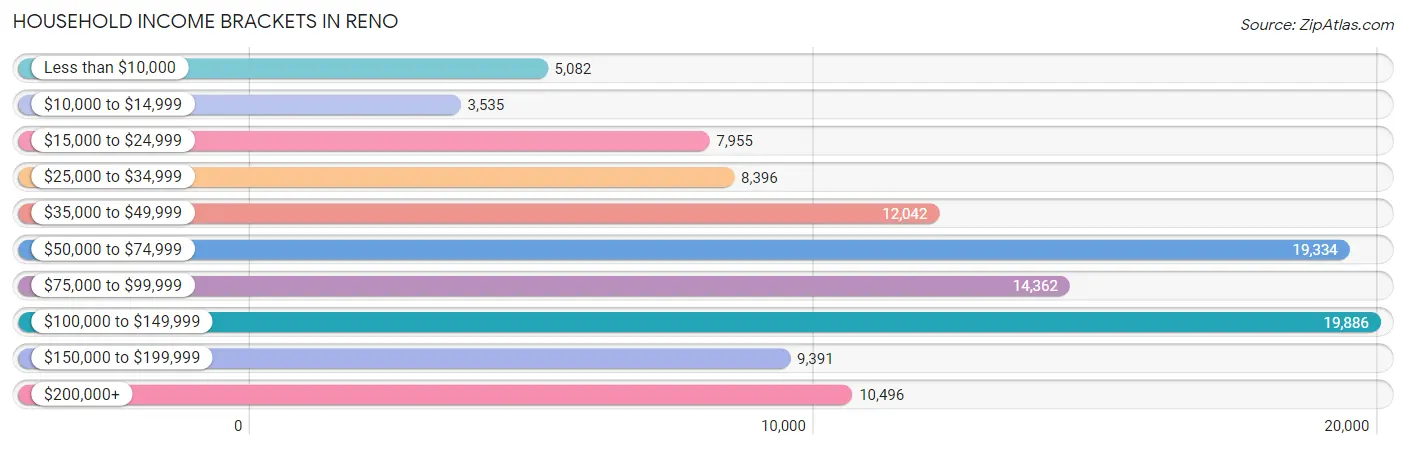
| Income Bracket | # Households | % Households |
| Less than $10,000 | 5,082 | 4.6% |
| $10,000 to $14,999 | 3,535 | 3.2% |
| $15,000 to $24,999 | 7,955 | 7.2% |
| $25,000 to $34,999 | 8,396 | 7.6% |
| $35,000 to $49,999 | 12,042 | 10.9% |
| $50,000 to $74,999 | 19,334 | 17.5% |
| $75,000 to $99,999 | 14,362 | 13.0% |
| $100,000 to $149,999 | 19,886 | 18.0% |
| $150,000 to $199,999 | 9,391 | 8.5% |
| $200,000+ | 10,496 | 9.5% |
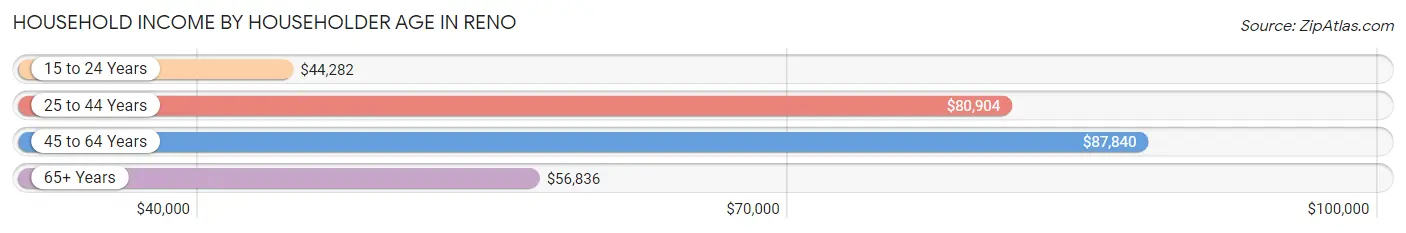
Household Income by Householder Age in Reno
The median household income in Reno is $73,073, with the highest median household income of $87,840 found in the 45 to 64 years age bracket for the primary householder. A total of 35,553 households (32.2%) fall into this category. Meanwhile, the 15 to 24 years age bracket for the primary householder has the lowest median household income of $44,282, with 7,045 households (6.4%) in this group.
| Income Bracket | # Households | Median Income |
| 15 to 24 Years | 7,045 (6.4%) | $44,282 |
| 25 to 44 Years | 40,510 (36.7%) | $80,904 |
| 45 to 64 Years | 35,553 (32.2%) | $87,840 |
| 65+ Years | 27,372 (24.8%) | $56,836 |
| Total | 110,480 (100.0%) | $73,073 |
Poverty in Reno
Income Below Poverty by Sex and Age in Reno
With 11.9% poverty level for males and 13.6% for females among the residents of Reno, 18 to 24 year old males and 18 to 24 year old females are the most vulnerable to poverty, with 3,524 males (25.6%) and 3,509 females (28.8%) in their respective age groups living below the poverty level.
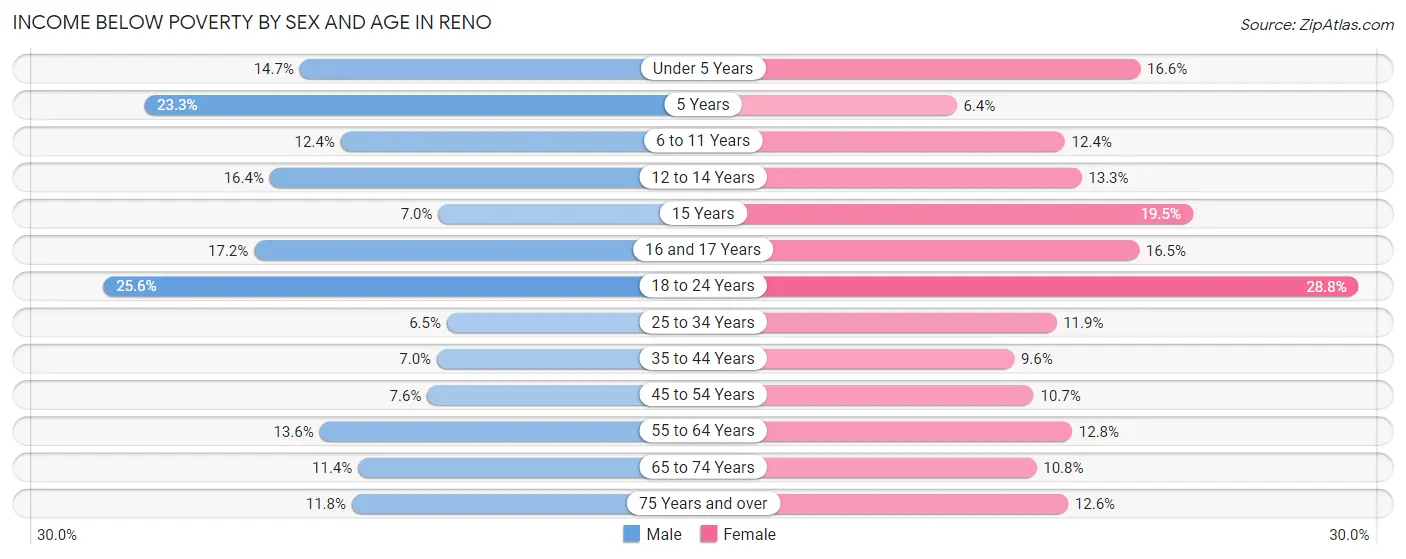
| Age Bracket | Male | Female |
| Under 5 Years | 936 (14.7%) | 1,146 (16.6%) |
| 5 Years | 270 (23.3%) | 125 (6.4%) |
| 6 to 11 Years | 1,038 (12.4%) | 1,015 (12.4%) |
| 12 to 14 Years | 734 (16.4%) | 633 (13.3%) |
| 15 Years | 106 (7.0%) | 299 (19.5%) |
| 16 and 17 Years | 507 (17.2%) | 480 (16.5%) |
| 18 to 24 Years | 3,524 (25.6%) | 3,509 (28.8%) |
| 25 to 34 Years | 1,457 (6.5%) | 2,504 (11.9%) |
| 35 to 44 Years | 1,318 (7.0%) | 1,596 (9.6%) |
| 45 to 54 Years | 1,127 (7.6%) | 1,516 (10.7%) |
| 55 to 64 Years | 2,275 (13.6%) | 2,103 (12.8%) |
| 65 to 74 Years | 1,412 (11.4%) | 1,450 (10.8%) |
| 75 Years and over | 849 (11.8%) | 1,082 (12.6%) |
| Total | 15,553 (11.9%) | 17,458 (13.6%) |
Income Above Poverty by Sex and Age in Reno
According to the poverty statistics in Reno, males aged 25 to 34 years and females aged 5 years are the age groups that are most secure financially, with 93.5% of males and 93.6% of females in these age groups living above the poverty line.
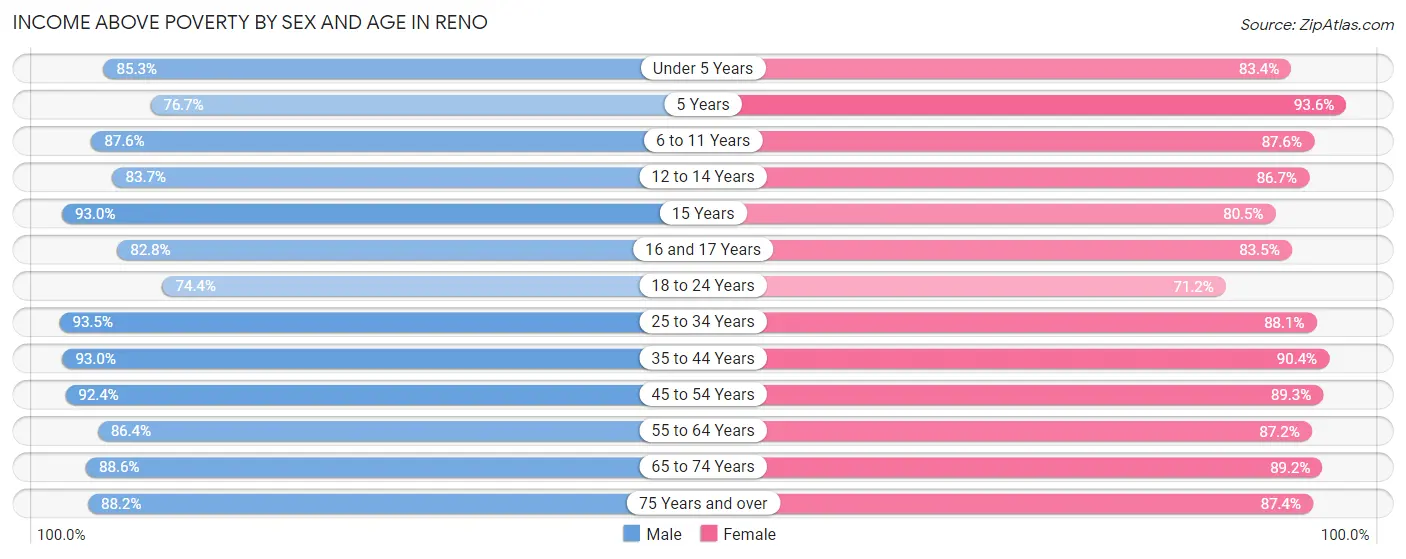
| Age Bracket | Male | Female |
| Under 5 Years | 5,438 (85.3%) | 5,753 (83.4%) |
| 5 Years | 887 (76.7%) | 1,832 (93.6%) |
| 6 to 11 Years | 7,334 (87.6%) | 7,162 (87.6%) |
| 12 to 14 Years | 3,756 (83.7%) | 4,113 (86.7%) |
| 15 Years | 1,416 (93.0%) | 1,231 (80.5%) |
| 16 and 17 Years | 2,438 (82.8%) | 2,422 (83.5%) |
| 18 to 24 Years | 10,233 (74.4%) | 8,687 (71.2%) |
| 25 to 34 Years | 20,985 (93.5%) | 18,460 (88.1%) |
| 35 to 44 Years | 17,392 (93.0%) | 15,044 (90.4%) |
| 45 to 54 Years | 13,748 (92.4%) | 12,674 (89.3%) |
| 55 to 64 Years | 14,473 (86.4%) | 14,310 (87.2%) |
| 65 to 74 Years | 10,940 (88.6%) | 11,944 (89.2%) |
| 75 Years and over | 6,360 (88.2%) | 7,510 (87.4%) |
| Total | 115,400 (88.1%) | 111,142 (86.4%) |
Income Below Poverty Among Married-Couple Families in Reno
The poverty statistics for married-couple families in Reno show that 3.6% or 1,505 of the total 42,145 families live below the poverty line. Families with 5 or more children have the highest poverty rate of 15.3%, comprising of 21 families. On the other hand, families with 1 or 2 children have the lowest poverty rate of 2.6%, which includes 341 families.
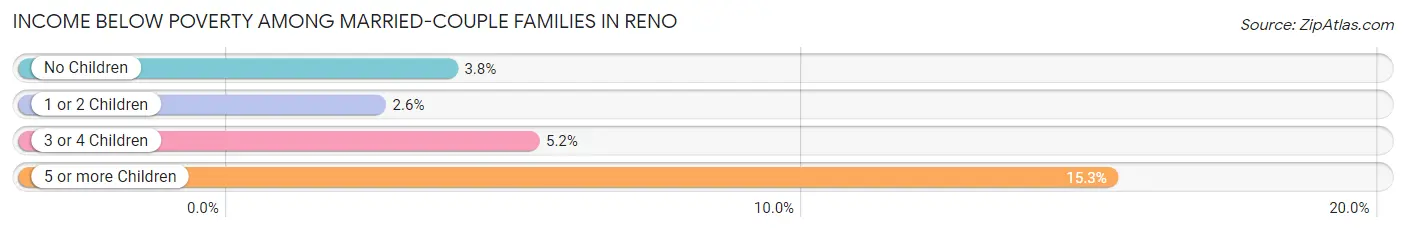
| Children | Above Poverty | Below Poverty |
| No Children | 24,675 (96.2%) | 981 (3.8%) |
| 1 or 2 Children | 12,922 (97.4%) | 341 (2.6%) |
| 3 or 4 Children | 2,927 (94.8%) | 162 (5.2%) |
| 5 or more Children | 116 (84.7%) | 21 (15.3%) |
| Total | 40,640 (96.4%) | 1,505 (3.6%) |
Income Below Poverty Among Single-Parent Households in Reno
According to the poverty data in Reno, 10.1% or 703 single-father households and 19.1% or 2,250 single-mother households are living below the poverty line. Among single-father households, those with 3 or 4 children have the highest poverty rate, with 201 households (27.0%) experiencing poverty. Likewise, among single-mother households, those with 5 or more children have the highest poverty rate, with 88 households (60.7%) falling below the poverty line.
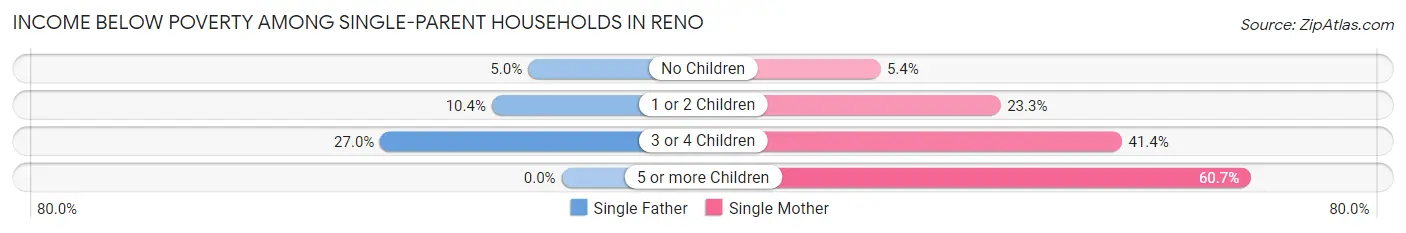
| Children | Single Father | Single Mother |
| No Children | 133 (5.0%) | 237 (5.4%) |
| 1 or 2 Children | 369 (10.4%) | 1,380 (23.3%) |
| 3 or 4 Children | 201 (27.0%) | 545 (41.4%) |
| 5 or more Children | 0 (0.0%) | 88 (60.7%) |
| Total | 703 (10.1%) | 2,250 (19.1%) |
Income Below Poverty Among Married-Couple vs Single-Parent Households in Reno
The poverty data for Reno shows that 1,505 of the married-couple family households (3.6%) and 2,953 of the single-parent households (15.8%) are living below the poverty level. Within the married-couple family households, those with 5 or more children have the highest poverty rate, with 21 households (15.3%) falling below the poverty line. Among the single-parent households, those with 5 or more children have the highest poverty rate, with 88 household (53.0%) living below poverty.
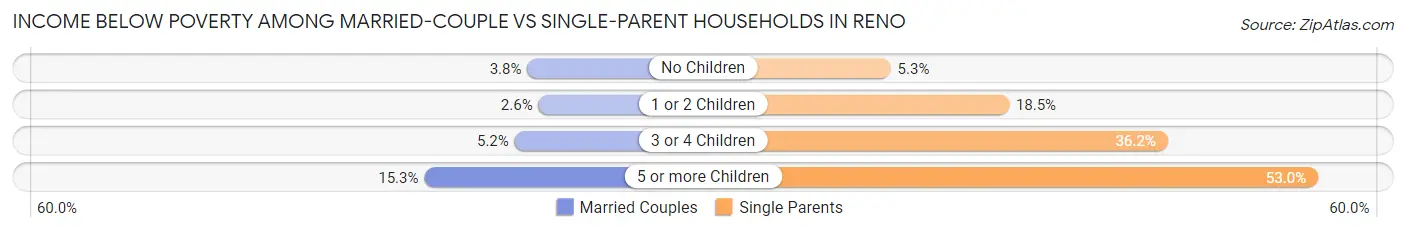
| Children | Married-Couple Families | Single-Parent Households |
| No Children | 981 (3.8%) | 370 (5.2%) |
| 1 or 2 Children | 341 (2.6%) | 1,749 (18.5%) |
| 3 or 4 Children | 162 (5.2%) | 746 (36.2%) |
| 5 or more Children | 21 (15.3%) | 88 (53.0%) |
| Total | 1,505 (3.6%) | 2,953 (15.8%) |
Race in Reno
The most populous races in Reno are White / Caucasian (175,296 | 66.1%), Hispanic or Latino (62,518 | 23.6%), and Some other Race (29,806 | 11.2%).
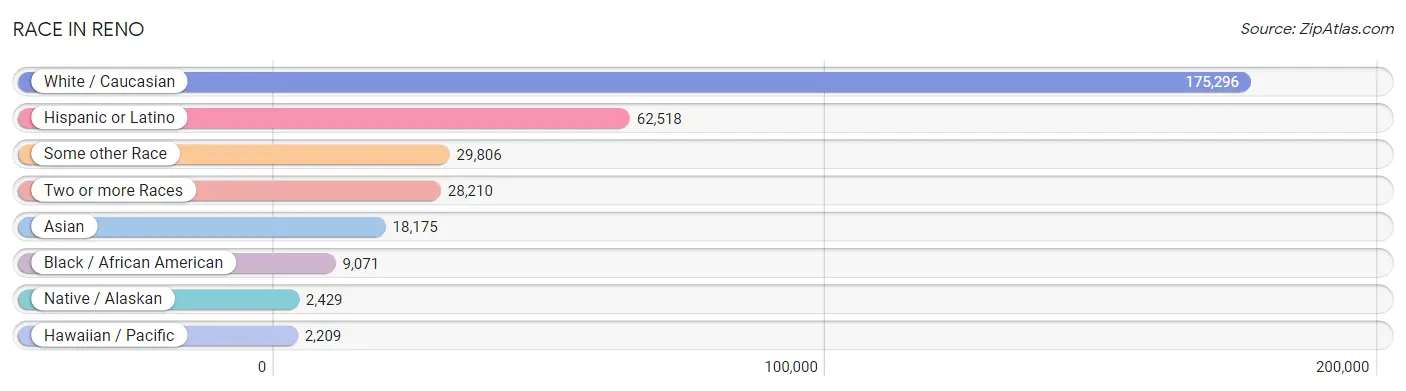
| Race | # Population | % Population |
| Asian | 18,175 | 6.9% |
| Black / African American | 9,071 | 3.4% |
| Hawaiian / Pacific | 2,209 | 0.8% |
| Hispanic or Latino | 62,518 | 23.6% |
| Native / Alaskan | 2,429 | 0.9% |
| White / Caucasian | 175,296 | 66.1% |
| Two or more Races | 28,210 | 10.6% |
| Some other Race | 29,806 | 11.2% |
| Total | 265,196 | 100.0% |
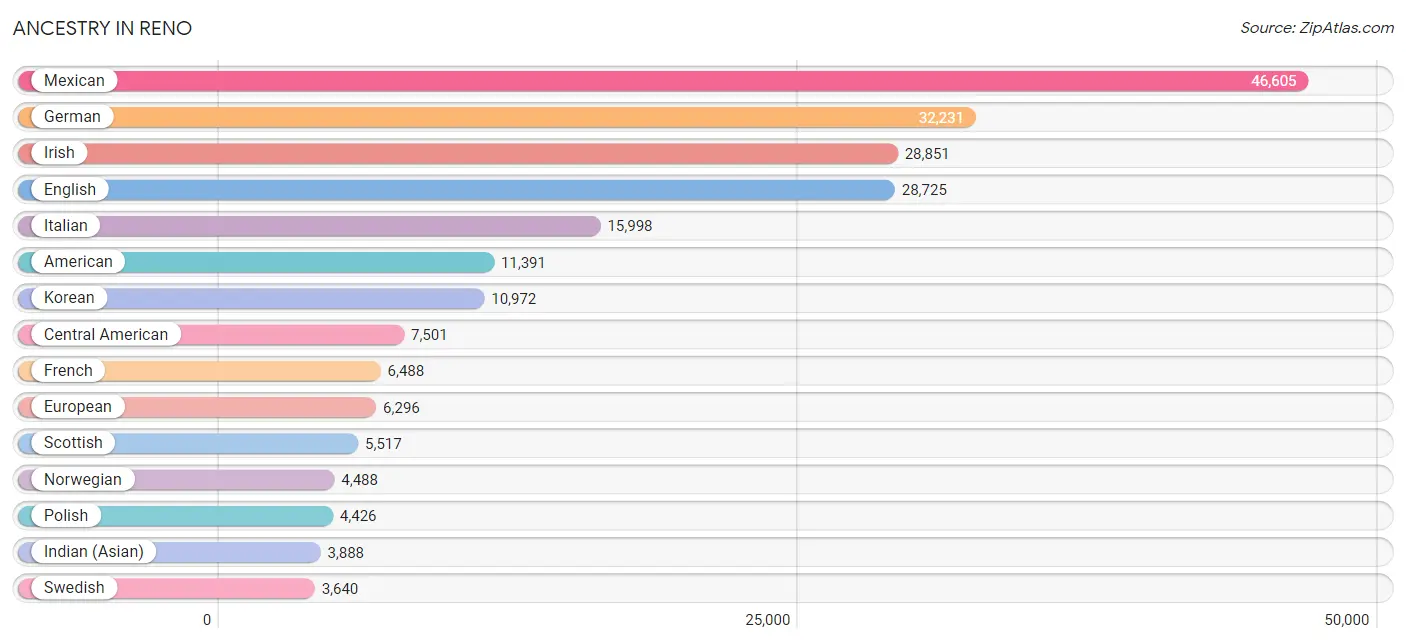
Ancestry in Reno
The most populous ancestries reported in Reno are Mexican (46,605 | 17.6%), German (32,231 | 12.1%), Irish (28,851 | 10.9%), English (28,725 | 10.8%), and Italian (15,998 | 6.0%), together accounting for 57.5% of all Reno residents.
| Ancestry | # Population | % Population |
| Afghan | 20 | 0.0% |
| African | 587 | 0.2% |
| Alaskan Athabascan | 60 | 0.0% |
| Albanian | 4 | 0.0% |
| American | 11,391 | 4.3% |
| Apache | 40 | 0.0% |
| Arab | 1,006 | 0.4% |
| Arapaho | 30 | 0.0% |
| Argentinean | 92 | 0.0% |
| Armenian | 577 | 0.2% |
| Assyrian / Chaldean / Syriac | 55 | 0.0% |
| Australian | 148 | 0.1% |
| Austrian | 686 | 0.3% |
| Bahamian | 14 | 0.0% |
| Bangladeshi | 43 | 0.0% |
| Barbadian | 3 | 0.0% |
| Basque | 931 | 0.4% |
| Belgian | 95 | 0.0% |
| Belizean | 7 | 0.0% |
| Bhutanese | 2,463 | 0.9% |
| Blackfeet | 601 | 0.2% |
| Bolivian | 66 | 0.0% |
| Brazilian | 111 | 0.0% |
| British | 1,716 | 0.6% |
| Bulgarian | 128 | 0.1% |
| Burmese | 1,038 | 0.4% |
| Cajun | 17 | 0.0% |
| Canadian | 618 | 0.2% |
| Carpatho Rusyn | 29 | 0.0% |
| Celtic | 66 | 0.0% |
| Central American | 7,501 | 2.8% |
| Central American Indian | 308 | 0.1% |
| Cherokee | 832 | 0.3% |
| Cheyenne | 20 | 0.0% |
| Chickasaw | 111 | 0.0% |
| Chilean | 134 | 0.1% |
| Chippewa | 108 | 0.0% |
| Choctaw | 205 | 0.1% |
| Colombian | 594 | 0.2% |
| Colville | 78 | 0.0% |
| Comanche | 3 | 0.0% |
| Costa Rican | 387 | 0.2% |
| Cree | 15 | 0.0% |
| Creek | 61 | 0.0% |
| Croatian | 557 | 0.2% |
| Crow | 183 | 0.1% |
| Cuban | 975 | 0.4% |
| Czech | 785 | 0.3% |
| Czechoslovakian | 178 | 0.1% |
| Danish | 1,627 | 0.6% |
| Delaware | 7 | 0.0% |
| Dominican | 202 | 0.1% |
| Dutch | 3,194 | 1.2% |
| Dutch West Indian | 13 | 0.0% |
| Eastern European | 1,050 | 0.4% |
| Ecuadorian | 119 | 0.0% |
| Egyptian | 95 | 0.0% |
| English | 28,725 | 10.8% |
| Estonian | 36 | 0.0% |
| Ethiopian | 565 | 0.2% |
| European | 6,296 | 2.4% |
| Fijian | 137 | 0.1% |
| Filipino | 164 | 0.1% |
| Finnish | 600 | 0.2% |
| French | 6,488 | 2.5% |
| French American Indian | 9 | 0.0% |
| French Canadian | 1,518 | 0.6% |
| German | 32,231 | 12.1% |
| German Russian | 51 | 0.0% |
| Ghanaian | 12 | 0.0% |
| Greek | 944 | 0.4% |
| Guamanian / Chamorro | 359 | 0.1% |
| Guatemalan | 2,721 | 1.0% |
| Haitian | 225 | 0.1% |
| Honduran | 455 | 0.2% |
| Houma | 75 | 0.0% |
| Hungarian | 986 | 0.4% |
| Icelander | 55 | 0.0% |
| Indian (Asian) | 3,888 | 1.5% |
| Inupiat | 40 | 0.0% |
| Iranian | 655 | 0.3% |
| Iraqi | 48 | 0.0% |
| Irish | 28,851 | 10.9% |
| Iroquois | 63 | 0.0% |
| Israeli | 12 | 0.0% |
| Italian | 15,998 | 6.0% |
| Jamaican | 103 | 0.0% |
| Japanese | 79 | 0.0% |
| Kenyan | 158 | 0.1% |
| Korean | 10,972 | 4.1% |
| Laotian | 265 | 0.1% |
| Latvian | 46 | 0.0% |
| Lebanese | 504 | 0.2% |
| Liberian | 100 | 0.0% |
| Lithuanian | 379 | 0.1% |
| Lumbee | 19 | 0.0% |
| Luxembourger | 46 | 0.0% |
| Macedonian | 58 | 0.0% |
| Malaysian | 21 | 0.0% |
| Maltese | 13 | 0.0% |
| Marshallese | 29 | 0.0% |
| Mexican | 46,605 | 17.6% |
| Mexican American Indian | 433 | 0.2% |
| Moroccan | 20 | 0.0% |
| Native Hawaiian | 1,470 | 0.5% |
| Navajo | 166 | 0.1% |
| New Zealander | 68 | 0.0% |
| Nicaraguan | 432 | 0.2% |
| Nigerian | 271 | 0.1% |
| Northern European | 1,502 | 0.6% |
| Norwegian | 4,488 | 1.7% |
| Osage | 104 | 0.0% |
| Paiute | 376 | 0.1% |
| Pakistani | 594 | 0.2% |
| Palestinian | 19 | 0.0% |
| Panamanian | 30 | 0.0% |
| Paraguayan | 39 | 0.0% |
| Pennsylvania German | 30 | 0.0% |
| Peruvian | 438 | 0.2% |
| Pima | 16 | 0.0% |
| Polish | 4,426 | 1.7% |
| Portuguese | 2,393 | 0.9% |
| Potawatomi | 54 | 0.0% |
| Pueblo | 14 | 0.0% |
| Puerto Rican | 1,606 | 0.6% |
| Romanian | 845 | 0.3% |
| Russian | 1,577 | 0.6% |
| Salvadoran | 3,408 | 1.3% |
| Samoan | 323 | 0.1% |
| Scandinavian | 1,442 | 0.5% |
| Scotch-Irish | 1,761 | 0.7% |
| Scottish | 5,517 | 2.1% |
| Serbian | 241 | 0.1% |
| Shoshone | 71 | 0.0% |
| Sioux | 222 | 0.1% |
| Slavic | 402 | 0.2% |
| Slovak | 72 | 0.0% |
| Slovene | 95 | 0.0% |
| Somali | 25 | 0.0% |
| South American | 1,653 | 0.6% |
| South American Indian | 47 | 0.0% |
| Spaniard | 1,405 | 0.5% |
| Spanish | 1,142 | 0.4% |
| Spanish American | 47 | 0.0% |
| Sri Lankan | 1,717 | 0.6% |
| Subsaharan African | 1,874 | 0.7% |
| Swedish | 3,640 | 1.4% |
| Swiss | 1,242 | 0.5% |
| Syrian | 76 | 0.0% |
| Taiwanese | 35 | 0.0% |
| Thai | 3,622 | 1.4% |
| Tohono O'Odham | 14 | 0.0% |
| Tongan | 809 | 0.3% |
| Trinidadian and Tobagonian | 146 | 0.1% |
| Turkish | 28 | 0.0% |
| Ugandan | 9 | 0.0% |
| Ukrainian | 691 | 0.3% |
| Uruguayan | 16 | 0.0% |
| Venezuelan | 46 | 0.0% |
| Vietnamese | 382 | 0.1% |
| Welsh | 1,365 | 0.5% |
| Yugoslavian | 266 | 0.1% |
| Yuman | 33 | 0.0% |
| Zimbabwean | 31 | 0.0% | View All 164 Rows |
Immigrants in Reno
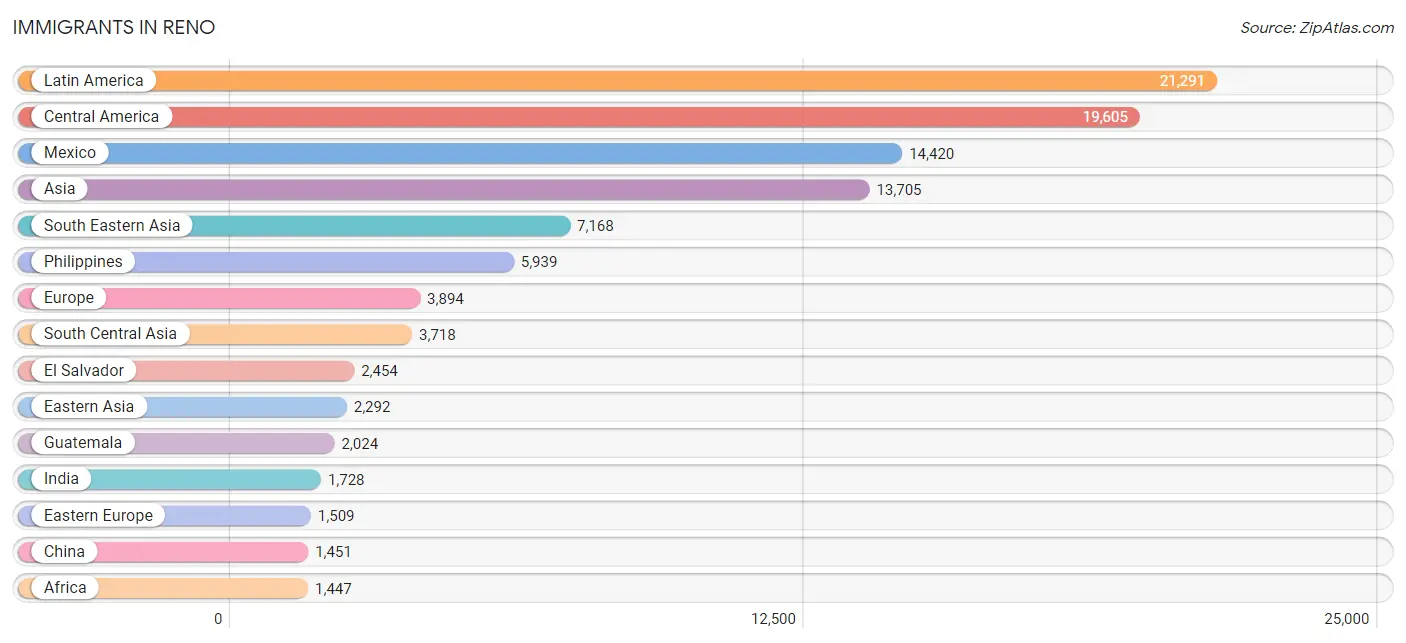
The most numerous immigrant groups reported in Reno came from Latin America (21,291 | 8.0%), Central America (19,605 | 7.4%), Mexico (14,420 | 5.4%), Asia (13,705 | 5.2%), and South Eastern Asia (7,168 | 2.7%), together accounting for 28.7% of all Reno residents.
| Immigration Origin | # Population | % Population |
| Afghanistan | 28 | 0.0% |
| Africa | 1,447 | 0.5% |
| Argentina | 82 | 0.0% |
| Armenia | 122 | 0.1% |
| Asia | 13,705 | 5.2% |
| Australia | 86 | 0.0% |
| Austria | 105 | 0.0% |
| Azores | 8 | 0.0% |
| Bahamas | 4 | 0.0% |
| Bangladesh | 955 | 0.4% |
| Barbados | 11 | 0.0% |
| Belarus | 7 | 0.0% |
| Belize | 10 | 0.0% |
| Bolivia | 25 | 0.0% |
| Bosnia and Herzegovina | 58 | 0.0% |
| Brazil | 121 | 0.1% |
| Bulgaria | 60 | 0.0% |
| Cambodia | 38 | 0.0% |
| Cameroon | 217 | 0.1% |
| Canada | 918 | 0.4% |
| Caribbean | 614 | 0.2% |
| Central America | 19,605 | 7.4% |
| Chile | 123 | 0.1% |
| China | 1,451 | 0.5% |
| Colombia | 300 | 0.1% |
| Costa Rica | 132 | 0.1% |
| Croatia | 43 | 0.0% |
| Cuba | 272 | 0.1% |
| Czechoslovakia | 95 | 0.0% |
| Denmark | 5 | 0.0% |
| Dominican Republic | 89 | 0.0% |
| Eastern Africa | 574 | 0.2% |
| Eastern Asia | 2,292 | 0.9% |
| Eastern Europe | 1,509 | 0.6% |
| Ecuador | 65 | 0.0% |
| Egypt | 31 | 0.0% |
| El Salvador | 2,454 | 0.9% |
| England | 352 | 0.1% |
| Eritrea | 58 | 0.0% |
| Ethiopia | 309 | 0.1% |
| Europe | 3,894 | 1.5% |
| Fiji | 78 | 0.0% |
| France | 172 | 0.1% |
| Germany | 635 | 0.2% |
| Ghana | 177 | 0.1% |
| Greece | 46 | 0.0% |
| Guatemala | 2,024 | 0.8% |
| Guyana | 12 | 0.0% |
| Haiti | 92 | 0.0% |
| Honduras | 291 | 0.1% |
| Hong Kong | 144 | 0.1% |
| Hungary | 98 | 0.0% |
| India | 1,728 | 0.6% |
| Indonesia | 133 | 0.1% |
| Iran | 573 | 0.2% |
| Iraq | 38 | 0.0% |
| Ireland | 170 | 0.1% |
| Israel | 93 | 0.0% |
| Italy | 112 | 0.0% |
| Jamaica | 58 | 0.0% |
| Japan | 335 | 0.1% |
| Kazakhstan | 14 | 0.0% |
| Kenya | 158 | 0.1% |
| Korea | 506 | 0.2% |
| Kuwait | 18 | 0.0% |
| Latin America | 21,291 | 8.0% |
| Latvia | 9 | 0.0% |
| Lebanon | 68 | 0.0% |
| Liberia | 19 | 0.0% |
| Lithuania | 60 | 0.0% |
| Malaysia | 13 | 0.0% |
| Mexico | 14,420 | 5.4% |
| Micronesia | 168 | 0.1% |
| Middle Africa | 217 | 0.1% |
| Moldova | 23 | 0.0% |
| Morocco | 25 | 0.0% |
| Nepal | 32 | 0.0% |
| Netherlands | 120 | 0.1% |
| Nicaragua | 246 | 0.1% |
| Nigeria | 319 | 0.1% |
| Northern Africa | 105 | 0.0% |
| Northern Europe | 946 | 0.4% |
| Norway | 15 | 0.0% |
| Oceania | 832 | 0.3% |
| Pakistan | 164 | 0.1% |
| Panama | 28 | 0.0% |
| Peru | 259 | 0.1% |
| Philippines | 5,939 | 2.2% |
| Poland | 341 | 0.1% |
| Portugal | 65 | 0.0% |
| Romania | 469 | 0.2% |
| Russia | 85 | 0.0% |
| Saudi Arabia | 47 | 0.0% |
| Scotland | 38 | 0.0% |
| Serbia | 27 | 0.0% |
| Singapore | 41 | 0.0% |
| South Africa | 16 | 0.0% |
| South America | 1,072 | 0.4% |
| South Central Asia | 3,718 | 1.4% |
| South Eastern Asia | 7,168 | 2.7% |
| Southern Europe | 305 | 0.1% |
| Spain | 60 | 0.0% |
| Sri Lanka | 7 | 0.0% |
| Sweden | 17 | 0.0% |
| Switzerland | 86 | 0.0% |
| Syria | 62 | 0.0% |
| Taiwan | 261 | 0.1% |
| Thailand | 262 | 0.1% |
| Trinidad and Tobago | 88 | 0.0% |
| Turkey | 6 | 0.0% |
| Uganda | 9 | 0.0% |
| Ukraine | 70 | 0.0% |
| Uzbekistan | 36 | 0.0% |
| Venezuela | 46 | 0.0% |
| Vietnam | 742 | 0.3% |
| Western Africa | 524 | 0.2% |
| Western Asia | 505 | 0.2% |
| Western Europe | 1,118 | 0.4% |
| Zimbabwe | 31 | 0.0% | View All 119 Rows |
Sex and Age in Reno
Sex and Age in Reno
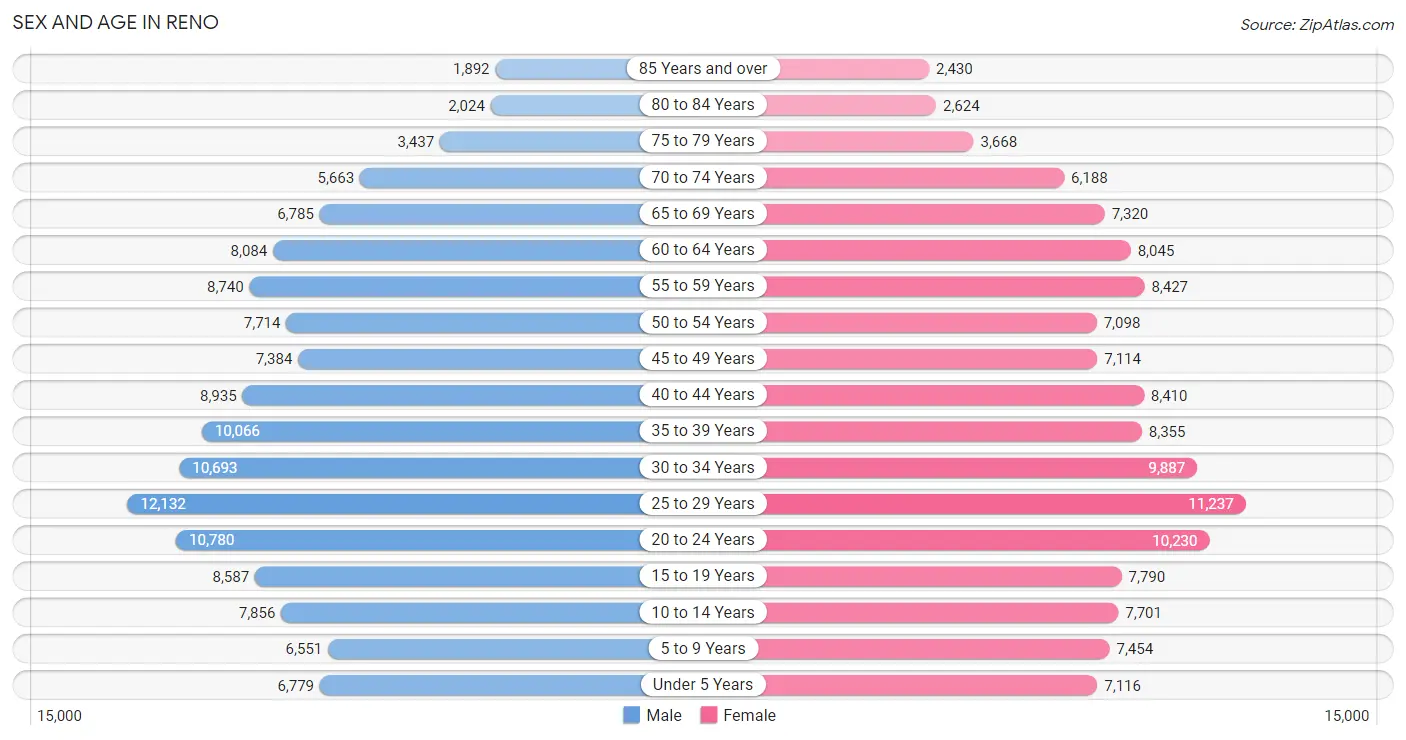
The most populous age groups in Reno are 25 to 29 Years (12,132 | 9.0%) for men and 25 to 29 Years (11,237 | 8.6%) for women.
| Age Bracket | Male | Female |
| Under 5 Years | 6,779 (5.1%) | 7,116 (5.4%) |
| 5 to 9 Years | 6,551 (4.9%) | 7,454 (5.7%) |
| 10 to 14 Years | 7,856 (5.9%) | 7,701 (5.9%) |
| 15 to 19 Years | 8,587 (6.4%) | 7,790 (5.9%) |
| 20 to 24 Years | 10,780 (8.0%) | 10,230 (7.8%) |
| 25 to 29 Years | 12,132 (9.0%) | 11,237 (8.6%) |
| 30 to 34 Years | 10,693 (8.0%) | 9,887 (7.5%) |
| 35 to 39 Years | 10,066 (7.5%) | 8,355 (6.4%) |
| 40 to 44 Years | 8,935 (6.7%) | 8,410 (6.4%) |
| 45 to 49 Years | 7,384 (5.5%) | 7,114 (5.4%) |
| 50 to 54 Years | 7,714 (5.8%) | 7,098 (5.4%) |
| 55 to 59 Years | 8,740 (6.5%) | 8,427 (6.4%) |
| 60 to 64 Years | 8,084 (6.0%) | 8,045 (6.1%) |
| 65 to 69 Years | 6,785 (5.1%) | 7,320 (5.6%) |
| 70 to 74 Years | 5,663 (4.2%) | 6,188 (4.7%) |
| 75 to 79 Years | 3,437 (2.6%) | 3,668 (2.8%) |
| 80 to 84 Years | 2,024 (1.5%) | 2,624 (2.0%) |
| 85 Years and over | 1,892 (1.4%) | 2,430 (1.8%) |
| Total | 134,102 (100.0%) | 131,094 (100.0%) |
Families and Households in Reno
Median Family Size in Reno
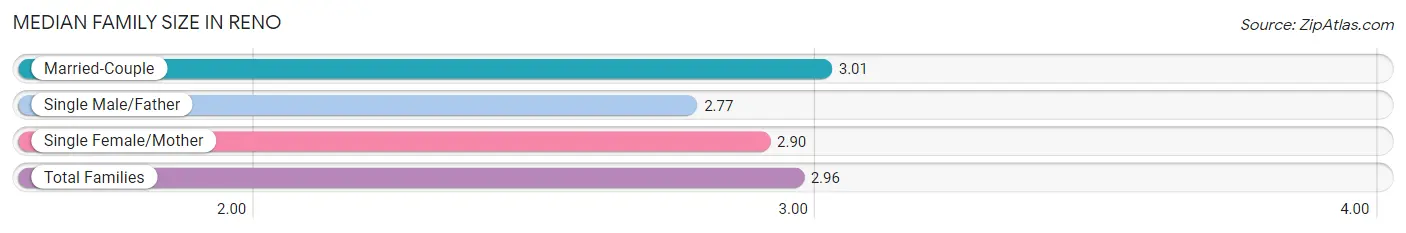
The median family size in Reno is 2.96 persons per family, with married-couple families (42,145 | 69.2%) accounting for the largest median family size of 3.01 persons per family. On the other hand, single male/father families (6,980 | 11.5%) represent the smallest median family size with 2.77 persons per family.
| Family Type | # Families | Family Size |
| Married-Couple | 42,145 (69.2%) | 3.01 |
| Single Male/Father | 6,980 (11.5%) | 2.77 |
| Single Female/Mother | 11,760 (19.3%) | 2.90 |
| Total Families | 60,885 (100.0%) | 2.96 |
Median Household Size in Reno
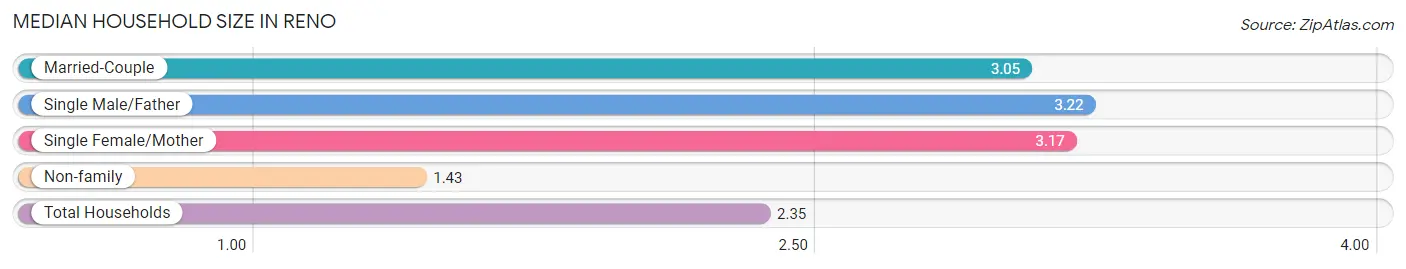
The median household size in Reno is 2.35 persons per household, with single male/father households (6,980 | 6.3%) accounting for the largest median household size of 3.22 persons per household. non-family households (49,595 | 44.9%) represent the smallest median household size with 1.43 persons per household.
| Household Type | # Households | Household Size |
| Married-Couple | 42,145 (38.2%) | 3.05 |
| Single Male/Father | 6,980 (6.3%) | 3.22 |
| Single Female/Mother | 11,760 (10.6%) | 3.17 |
| Non-family | 49,595 (44.9%) | 1.43 |
| Total Households | 110,480 (100.0%) | 2.35 |
Household Size by Marriage Status in Reno
Out of a total of 110,480 households in Reno, 60,885 (55.1%) are family households, while 49,595 (44.9%) are nonfamily households. The most numerous type of family households are 2-person households, comprising 26,930, and the most common type of nonfamily households are 1-person households, comprising 35,368.
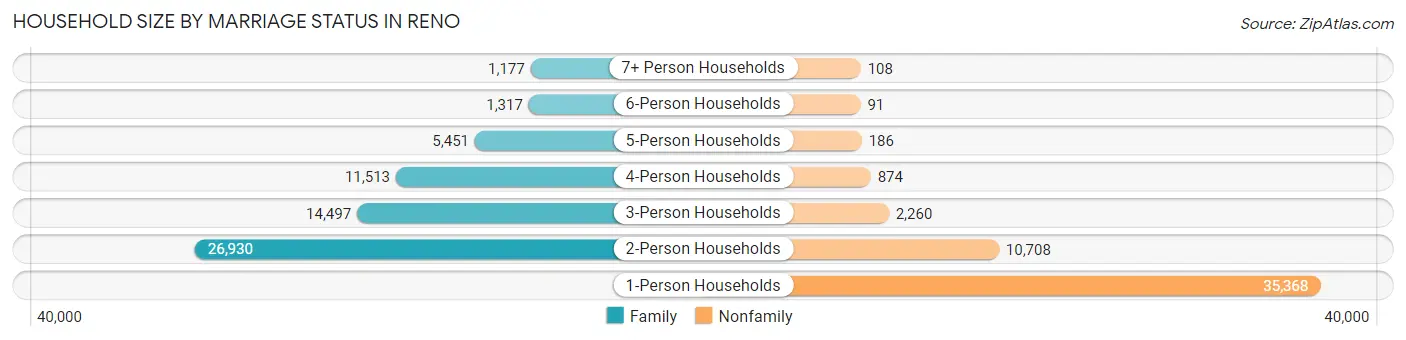
| Household Size | Family Households | Nonfamily Households |
| 1-Person Households | - | 35,368 (32.0%) |
| 2-Person Households | 26,930 (24.4%) | 10,708 (9.7%) |
| 3-Person Households | 14,497 (13.1%) | 2,260 (2.1%) |
| 4-Person Households | 11,513 (10.4%) | 874 (0.8%) |
| 5-Person Households | 5,451 (4.9%) | 186 (0.2%) |
| 6-Person Households | 1,317 (1.2%) | 91 (0.1%) |
| 7+ Person Households | 1,177 (1.1%) | 108 (0.1%) |
| Total | 60,885 (55.1%) | 49,595 (44.9%) |
Female Fertility in Reno
Fertility by Age in Reno
Average fertility rate in Reno is 44.0 births per 1,000 women. Women in the age bracket of 20 to 34 years have the highest fertility rate with 64.0 births per 1,000 women. Women in the age bracket of 20 to 34 years acount for 70.5% of all women with births.
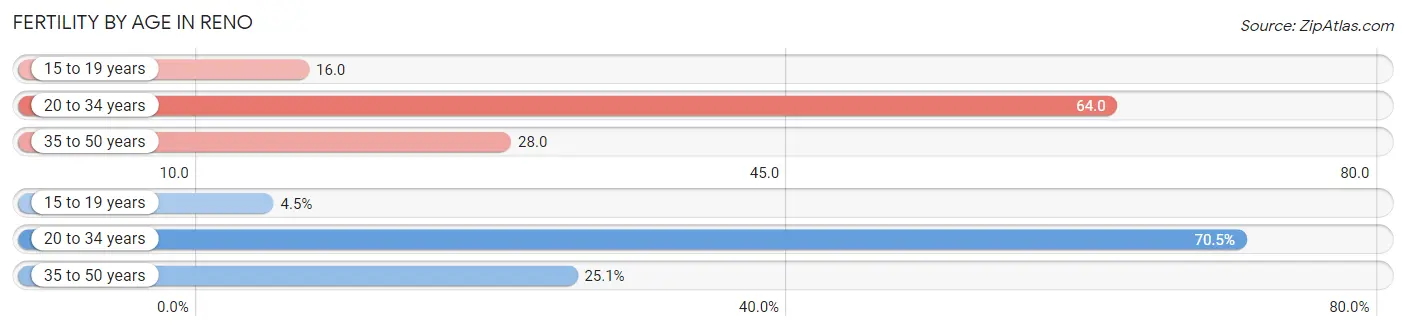
| Age Bracket | Women with Births | Births / 1,000 Women |
| 15 to 19 years | 127 (4.4%) | 16.0 |
| 20 to 34 years | 2,013 (70.5%) | 64.0 |
| 35 to 50 years | 716 (25.1%) | 28.0 |
| Total | 2,856 (100.0%) | 44.0 |
Fertility by Age by Marriage Status in Reno
58.6% of women with births (2,856) in Reno are married. The highest percentage of unmarried women with births falls into 15 to 19 years age bracket with 85.0% of them unmarried at the time of birth, while the lowest percentage of unmarried women with births belong to 35 to 50 years age bracket with 29.3% of them unmarried.
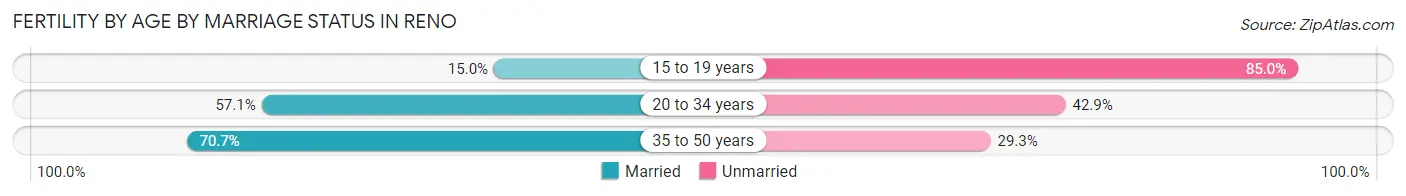
| Age Bracket | Married | Unmarried |
| 15 to 19 years | 19 (15.0%) | 108 (85.0%) |
| 20 to 34 years | 1,149 (57.1%) | 864 (42.9%) |
| 35 to 50 years | 506 (70.7%) | 210 (29.3%) |
| Total | 1,674 (58.6%) | 1,182 (41.4%) |
Fertility by Education in Reno
Average fertility rate in Reno is 44.0 births per 1,000 women. Women with the education attainment of high school diploma have the highest fertility rate of 57.0 births per 1,000 women, while women with the education attainment of college or associate's degree have the lowest fertility at 34.0 births per 1,000 women. Women with the education attainment of high school diploma represent 26.8% of all women with births.
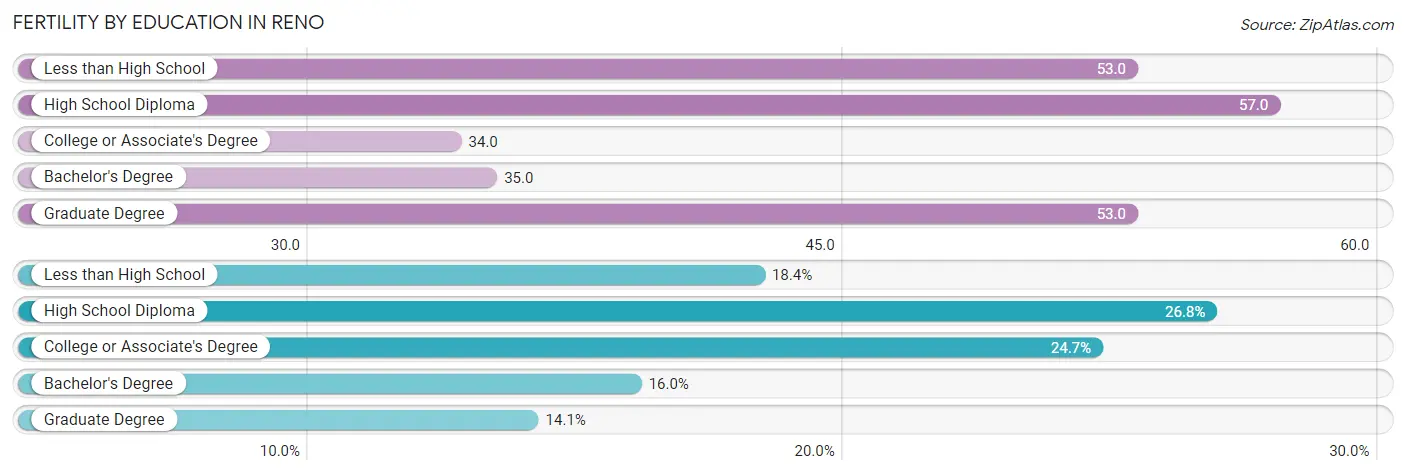
| Educational Attainment | Women with Births | Births / 1,000 Women |
| Less than High School | 524 (18.3%) | 53.0 |
| High School Diploma | 766 (26.8%) | 57.0 |
| College or Associate's Degree | 705 (24.7%) | 34.0 |
| Bachelor's Degree | 458 (16.0%) | 35.0 |
| Graduate Degree | 403 (14.1%) | 53.0 |
| Total | 2,856 (100.0%) | 44.0 |
Fertility by Education by Marriage Status in Reno
41.4% of women with births in Reno are unmarried. Women with the educational attainment of bachelor's degree are most likely to be married with 98.5% of them married at childbirth, while women with the educational attainment of less than high school are least likely to be married with 75.6% of them unmarried at childbirth.
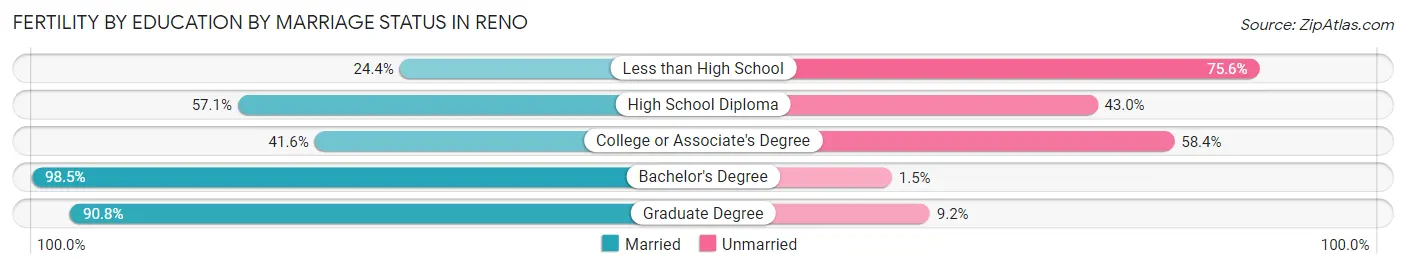
| Educational Attainment | Married | Unmarried |
| Less than High School | 128 (24.4%) | 396 (75.6%) |
| High School Diploma | 437 (57.1%) | 329 (42.9%) |
| College or Associate's Degree | 293 (41.6%) | 412 (58.4%) |
| Bachelor's Degree | 451 (98.5%) | 7 (1.5%) |
| Graduate Degree | 366 (90.8%) | 37 (9.2%) |
| Total | 1,674 (58.6%) | 1,182 (41.4%) |
Employment Characteristics in Reno
Employment by Class of Employer in Reno
Among the 137,919 employed individuals in Reno, private company employees (99,506 | 72.2%), not-for-profit organizations (8,633 | 6.3%), and state government employees (8,345 | 6.0%) make up the most common classes of employment.
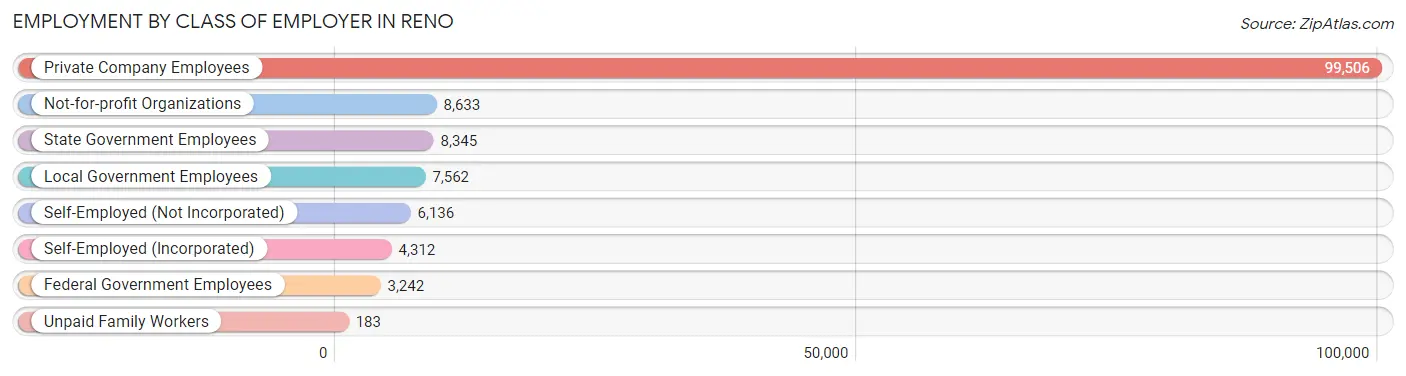
| Employer Class | # Employees | % Employees |
| Private Company Employees | 99,506 | 72.2% |
| Self-Employed (Incorporated) | 4,312 | 3.1% |
| Self-Employed (Not Incorporated) | 6,136 | 4.4% |
| Not-for-profit Organizations | 8,633 | 6.3% |
| Local Government Employees | 7,562 | 5.5% |
| State Government Employees | 8,345 | 6.0% |
| Federal Government Employees | 3,242 | 2.4% |
| Unpaid Family Workers | 183 | 0.1% |
| Total | 137,919 | 100.0% |
Employment Status by Age in Reno
According to the labor force statistics for Reno, out of the total population over 16 years of age (218,685), 67.6% or 147,831 individuals are in the labor force, with 5.0% or 7,392 of them unemployed. The age group with the highest labor force participation rate is 25 to 29 years, with 89.5% or 20,915 individuals in the labor force. Within the labor force, the 16 to 19 years age range has the highest percentage of unemployed individuals, with 16.4% or 1,018 of them being unemployed.
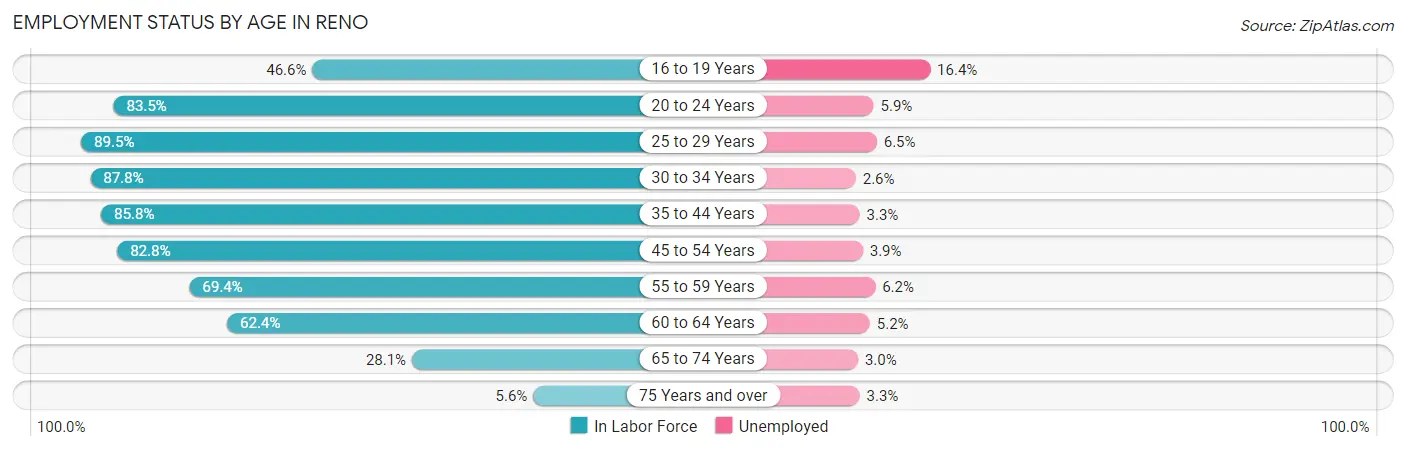
| Age Bracket | In Labor Force | Unemployed |
| 16 to 19 Years | 6,209 (46.6%) | 1,018 (16.4%) |
| 20 to 24 Years | 17,543 (83.5%) | 1,035 (5.9%) |
| 25 to 29 Years | 20,915 (89.5%) | 1,359 (6.5%) |
| 30 to 34 Years | 18,069 (87.8%) | 470 (2.6%) |
| 35 to 44 Years | 30,687 (85.8%) | 1,013 (3.3%) |
| 45 to 54 Years | 24,269 (82.8%) | 946 (3.9%) |
| 55 to 59 Years | 11,914 (69.4%) | 739 (6.2%) |
| 60 to 64 Years | 10,064 (62.4%) | 523 (5.2%) |
| 65 to 74 Years | 7,294 (28.1%) | 219 (3.0%) |
| 75 Years and over | 900 (5.6%) | 30 (3.3%) |
| Total | 147,831 (67.6%) | 7,392 (5.0%) |
Employment Status by Educational Attainment in Reno
According to labor force statistics for Reno, 81.4% of individuals (115,849) out of the total population between 25 and 64 years of age (142,321) are in the labor force, with 4.4% or 5,097 of them being unemployed. The group with the highest labor force participation rate are those with the educational attainment of bachelor's degree or higher, with 87.9% or 43,977 individuals in the labor force. Within the labor force, individuals with less than high school education have the highest percentage of unemployment, with 6.8% or 740 of them being unemployed.
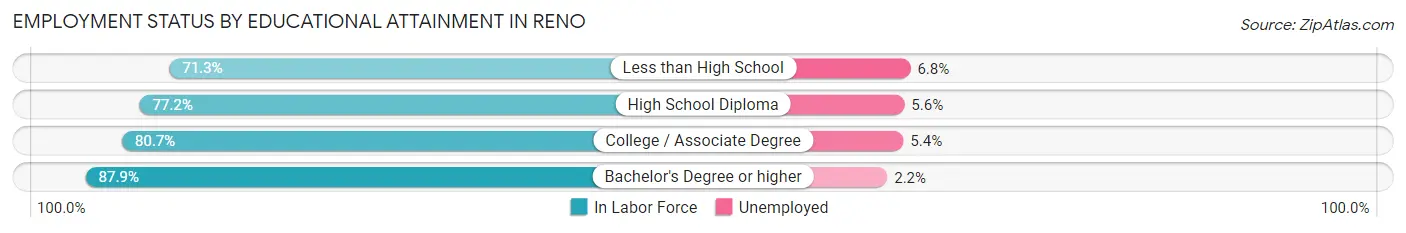
| Educational Attainment | In Labor Force | Unemployed |
| Less than High School | 10,877 (71.3%) | 1,037 (6.8%) |
| High School Diploma | 25,174 (77.2%) | 1,826 (5.6%) |
| College / Associate Degree | 35,852 (80.7%) | 2,399 (5.4%) |
| Bachelor's Degree or higher | 43,977 (87.9%) | 1,101 (2.2%) |
| Total | 115,849 (81.4%) | 6,262 (4.4%) |
Employment Occupations by Sex in Reno
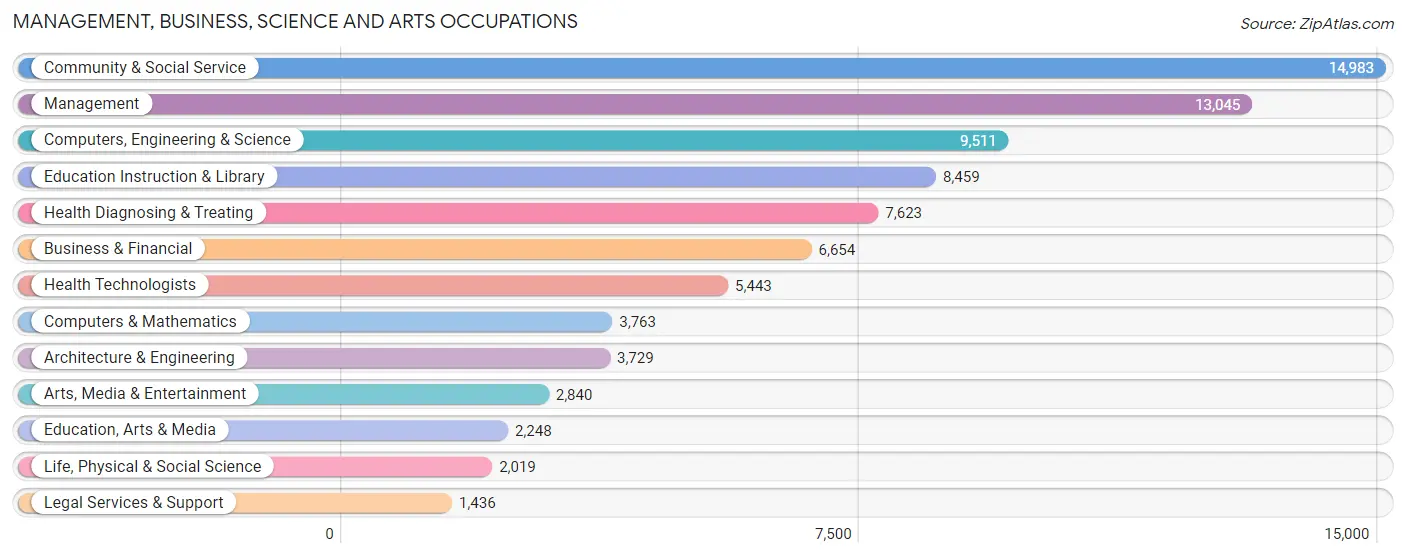
Management, Business, Science and Arts Occupations
The most common Management, Business, Science and Arts occupations in Reno are Community & Social Service (14,983 | 10.7%), Management (13,045 | 9.3%), Computers, Engineering & Science (9,511 | 6.8%), Education Instruction & Library (8,459 | 6.0%), and Health Diagnosing & Treating (7,623 | 5.4%).
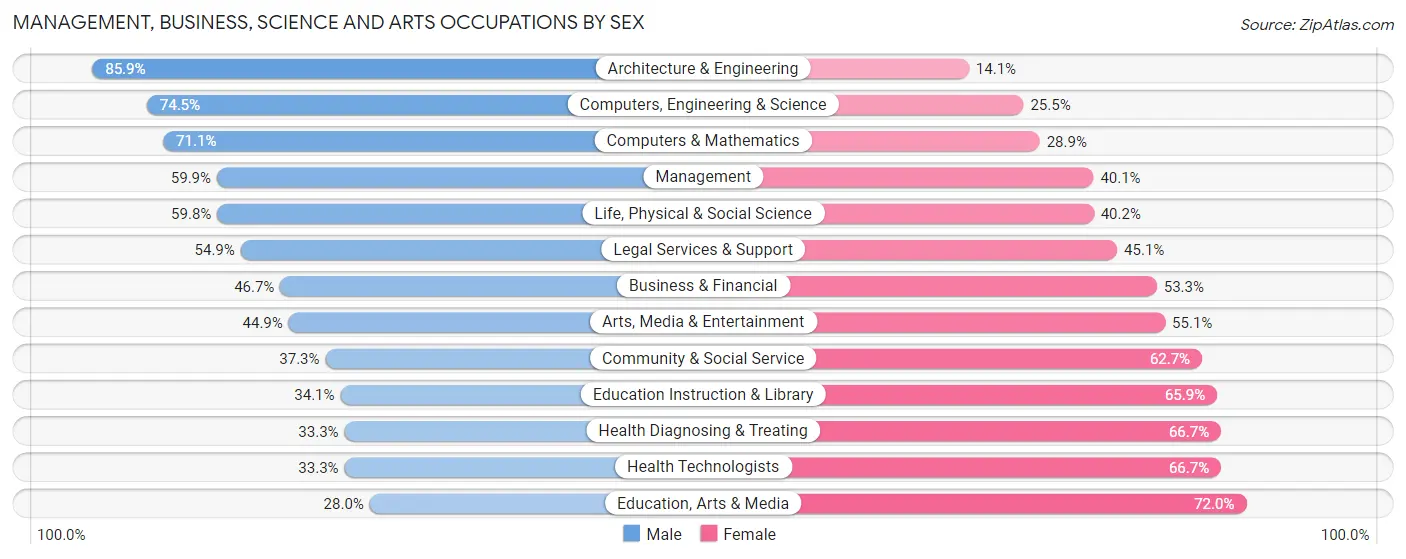
Management, Business, Science and Arts Occupations by Sex
Within the Management, Business, Science and Arts occupations in Reno, the most male-oriented occupations are Architecture & Engineering (85.9%), Computers, Engineering & Science (74.5%), and Computers & Mathematics (71.1%), while the most female-oriented occupations are Education, Arts & Media (72.0%), Health Diagnosing & Treating (66.7%), and Health Technologists (66.7%).
| Occupation | Male | Female |
| Management | 7,812 (59.9%) | 5,233 (40.1%) |
| Business & Financial | 3,106 (46.7%) | 3,548 (53.3%) |
| Computers, Engineering & Science | 7,085 (74.5%) | 2,426 (25.5%) |
| Computers & Mathematics | 2,675 (71.1%) | 1,088 (28.9%) |
| Architecture & Engineering | 3,202 (85.9%) | 527 (14.1%) |
| Life, Physical & Social Science | 1,208 (59.8%) | 811 (40.2%) |
| Community & Social Service | 5,582 (37.3%) | 9,401 (62.7%) |
| Education, Arts & Media | 630 (28.0%) | 1,618 (72.0%) |
| Legal Services & Support | 789 (54.9%) | 647 (45.1%) |
| Education Instruction & Library | 2,887 (34.1%) | 5,572 (65.9%) |
| Arts, Media & Entertainment | 1,276 (44.9%) | 1,564 (55.1%) |
| Health Diagnosing & Treating | 2,538 (33.3%) | 5,085 (66.7%) |
| Health Technologists | 1,812 (33.3%) | 3,631 (66.7%) |
| Total (Category) | 26,123 (50.4%) | 25,693 (49.6%) |
| Total (Overall) | 75,631 (54.0%) | 64,407 (46.0%) |
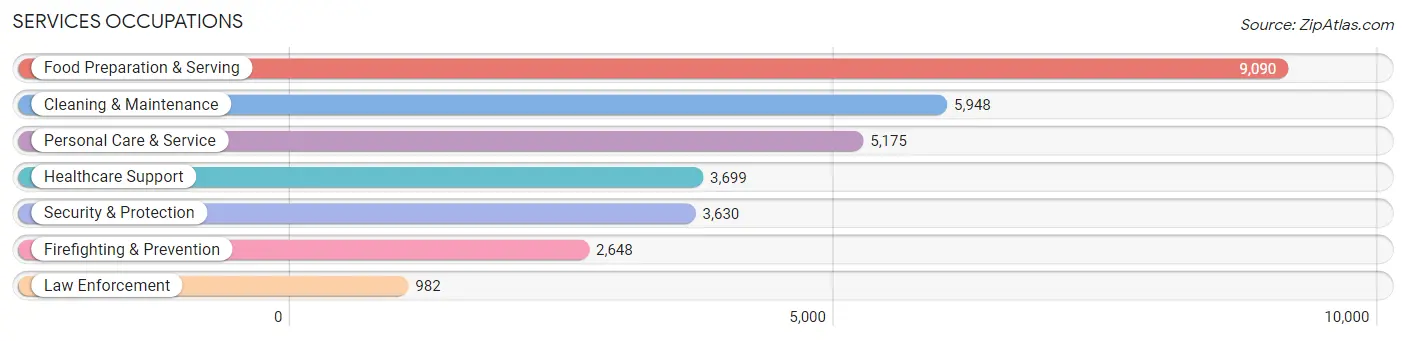
Services Occupations
The most common Services occupations in Reno are Food Preparation & Serving (9,090 | 6.5%), Cleaning & Maintenance (5,948 | 4.3%), Personal Care & Service (5,175 | 3.7%), Healthcare Support (3,699 | 2.6%), and Security & Protection (3,630 | 2.6%).
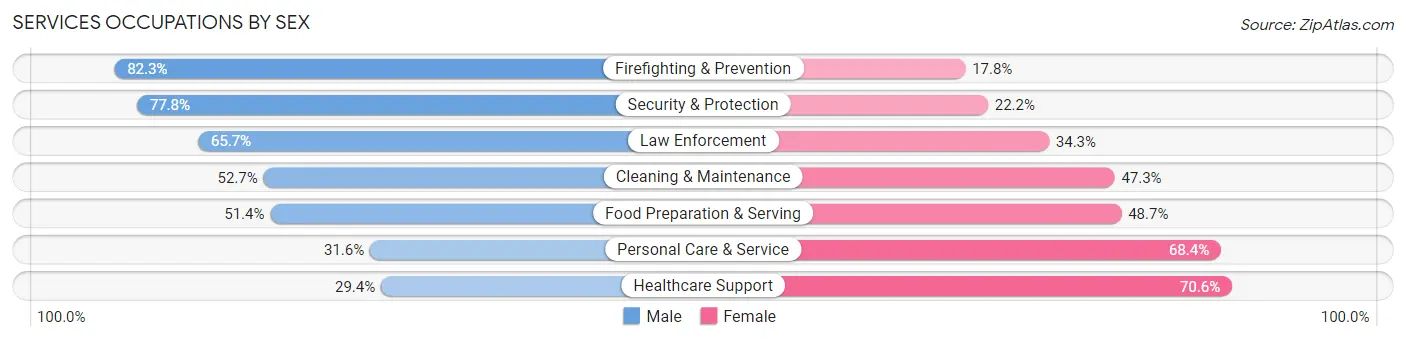
Services Occupations by Sex
Within the Services occupations in Reno, the most male-oriented occupations are Firefighting & Prevention (82.3%), Security & Protection (77.8%), and Law Enforcement (65.7%), while the most female-oriented occupations are Healthcare Support (70.6%), Personal Care & Service (68.4%), and Food Preparation & Serving (48.6%).
| Occupation | Male | Female |
| Healthcare Support | 1,088 (29.4%) | 2,611 (70.6%) |
| Security & Protection | 2,823 (77.8%) | 807 (22.2%) |
| Firefighting & Prevention | 2,178 (82.3%) | 470 (17.7%) |
| Law Enforcement | 645 (65.7%) | 337 (34.3%) |
| Food Preparation & Serving | 4,668 (51.3%) | 4,422 (48.6%) |
| Cleaning & Maintenance | 3,134 (52.7%) | 2,814 (47.3%) |
| Personal Care & Service | 1,635 (31.6%) | 3,540 (68.4%) |
| Total (Category) | 13,348 (48.5%) | 14,194 (51.5%) |
| Total (Overall) | 75,631 (54.0%) | 64,407 (46.0%) |
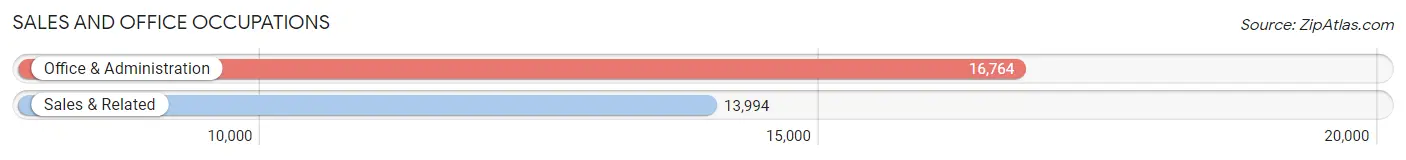
Sales and Office Occupations
The most common Sales and Office occupations in Reno are Office & Administration (16,764 | 12.0%), and Sales & Related (13,994 | 10.0%).
Sales and Office Occupations by Sex
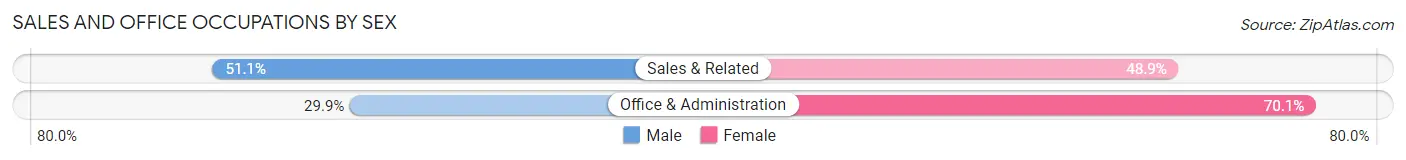
| Occupation | Male | Female |
| Sales & Related | 7,147 (51.1%) | 6,847 (48.9%) |
| Office & Administration | 5,014 (29.9%) | 11,750 (70.1%) |
| Total (Category) | 12,161 (39.5%) | 18,597 (60.5%) |
| Total (Overall) | 75,631 (54.0%) | 64,407 (46.0%) |
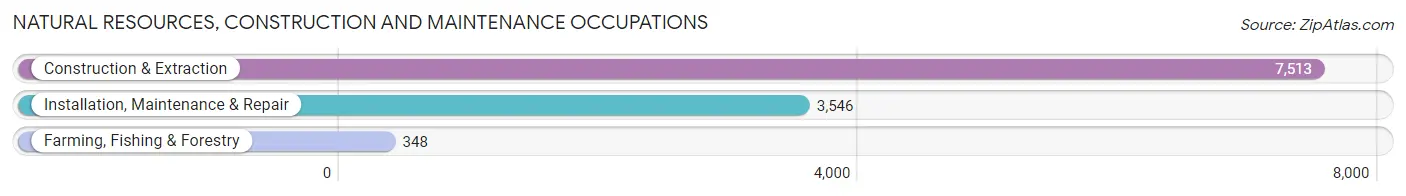
Natural Resources, Construction and Maintenance Occupations
The most common Natural Resources, Construction and Maintenance occupations in Reno are Construction & Extraction (7,513 | 5.4%), Installation, Maintenance & Repair (3,546 | 2.5%), and Farming, Fishing & Forestry (348 | 0.3%).
Natural Resources, Construction and Maintenance Occupations by Sex
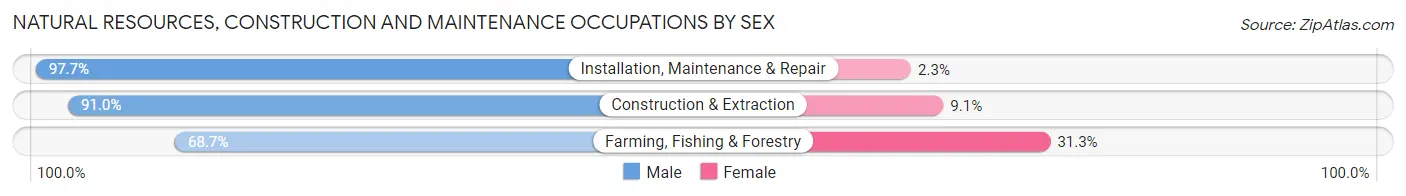
| Occupation | Male | Female |
| Farming, Fishing & Forestry | 239 (68.7%) | 109 (31.3%) |
| Construction & Extraction | 6,833 (90.9%) | 680 (9.0%) |
| Installation, Maintenance & Repair | 3,463 (97.7%) | 83 (2.3%) |
| Total (Category) | 10,535 (92.4%) | 872 (7.6%) |
| Total (Overall) | 75,631 (54.0%) | 64,407 (46.0%) |
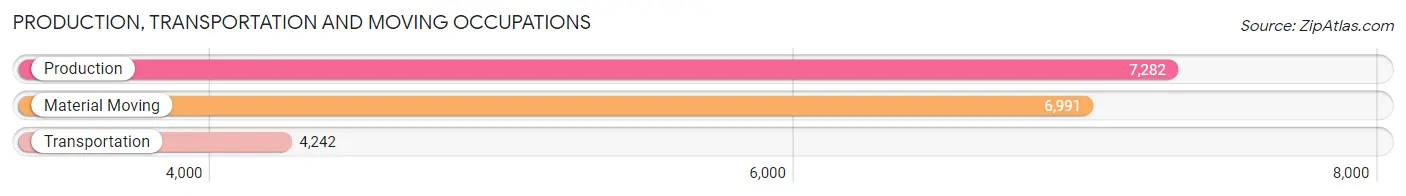
Production, Transportation and Moving Occupations
The most common Production, Transportation and Moving occupations in Reno are Production (7,282 | 5.2%), Material Moving (6,991 | 5.0%), and Transportation (4,242 | 3.0%).
Production, Transportation and Moving Occupations by Sex
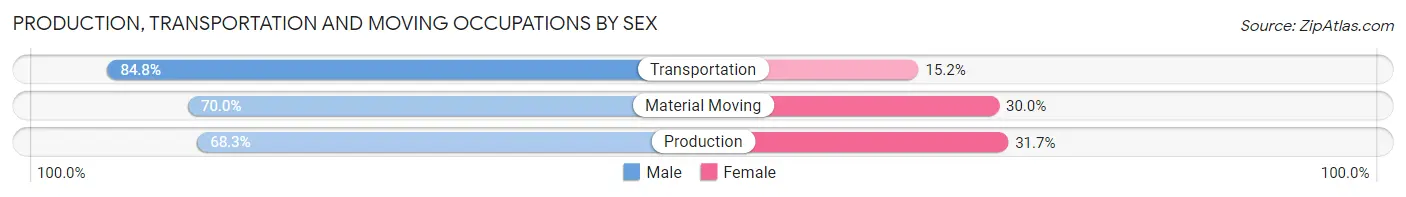
| Occupation | Male | Female |
| Production | 4,974 (68.3%) | 2,308 (31.7%) |
| Transportation | 3,596 (84.8%) | 646 (15.2%) |
| Material Moving | 4,894 (70.0%) | 2,097 (30.0%) |
| Total (Category) | 13,464 (72.7%) | 5,051 (27.3%) |
| Total (Overall) | 75,631 (54.0%) | 64,407 (46.0%) |
Employment Industries by Sex in Reno
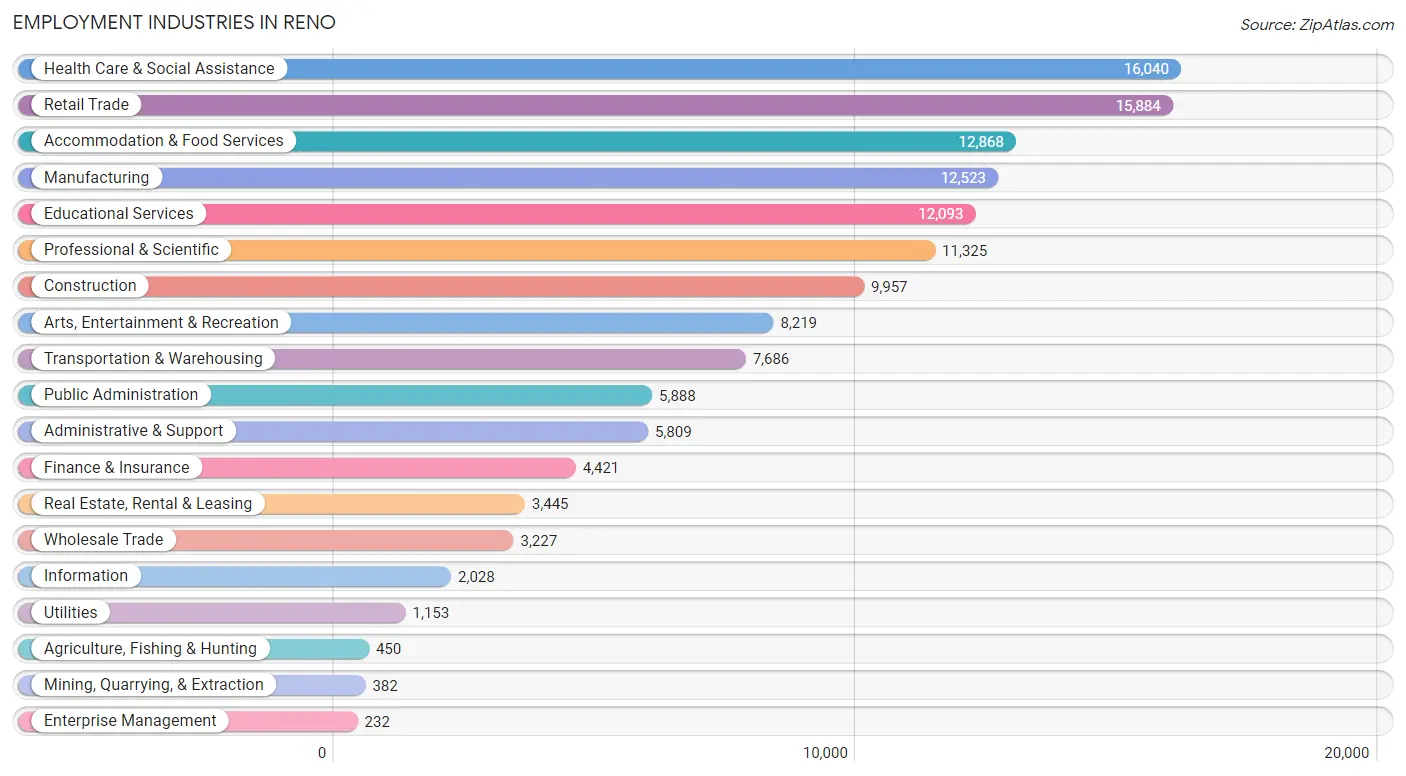
Employment Industries in Reno
The major employment industries in Reno include Health Care & Social Assistance (16,040 | 11.5%), Retail Trade (15,884 | 11.3%), Accommodation & Food Services (12,868 | 9.2%), Manufacturing (12,523 | 8.9%), and Educational Services (12,093 | 8.6%).
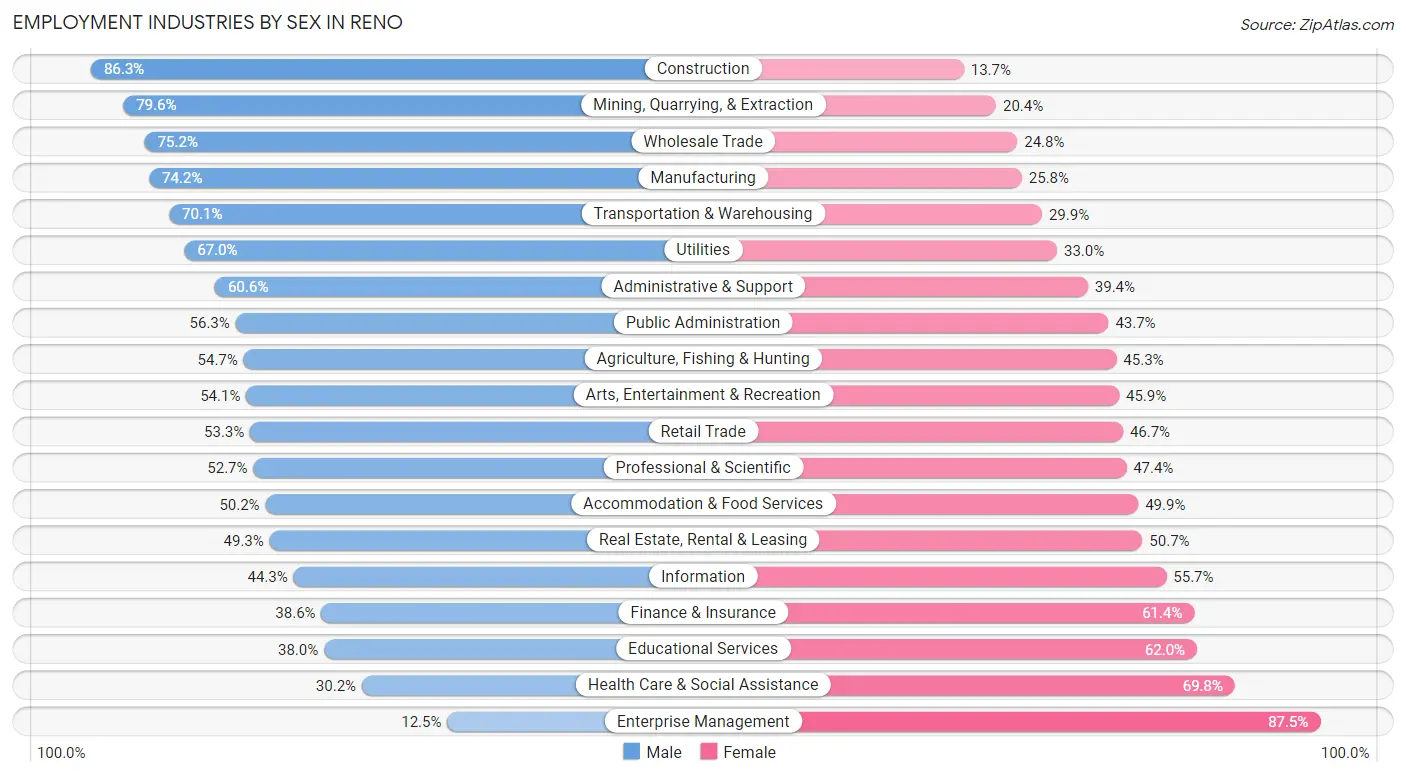
Employment Industries by Sex in Reno
The Reno industries that see more men than women are Construction (86.3%), Mining, Quarrying, & Extraction (79.6%), and Wholesale Trade (75.2%), whereas the industries that tend to have a higher number of women are Enterprise Management (87.5%), Health Care & Social Assistance (69.8%), and Educational Services (62.0%).
| Industry | Male | Female |
| Agriculture, Fishing & Hunting | 246 (54.7%) | 204 (45.3%) |
| Mining, Quarrying, & Extraction | 304 (79.6%) | 78 (20.4%) |
| Construction | 8,589 (86.3%) | 1,368 (13.7%) |
| Manufacturing | 9,297 (74.2%) | 3,226 (25.8%) |
| Wholesale Trade | 2,426 (75.2%) | 801 (24.8%) |
| Retail Trade | 8,470 (53.3%) | 7,414 (46.7%) |
| Transportation & Warehousing | 5,386 (70.1%) | 2,300 (29.9%) |
| Utilities | 772 (67.0%) | 381 (33.0%) |
| Information | 899 (44.3%) | 1,129 (55.7%) |
| Finance & Insurance | 1,705 (38.6%) | 2,716 (61.4%) |
| Real Estate, Rental & Leasing | 1,698 (49.3%) | 1,747 (50.7%) |
| Professional & Scientific | 5,963 (52.6%) | 5,362 (47.3%) |
| Enterprise Management | 29 (12.5%) | 203 (87.5%) |
| Administrative & Support | 3,519 (60.6%) | 2,290 (39.4%) |
| Educational Services | 4,596 (38.0%) | 7,497 (62.0%) |
| Health Care & Social Assistance | 4,841 (30.2%) | 11,199 (69.8%) |
| Arts, Entertainment & Recreation | 4,448 (54.1%) | 3,771 (45.9%) |
| Accommodation & Food Services | 6,453 (50.1%) | 6,415 (49.8%) |
| Public Administration | 3,316 (56.3%) | 2,572 (43.7%) |
| Total | 75,631 (54.0%) | 64,407 (46.0%) |
Education in Reno
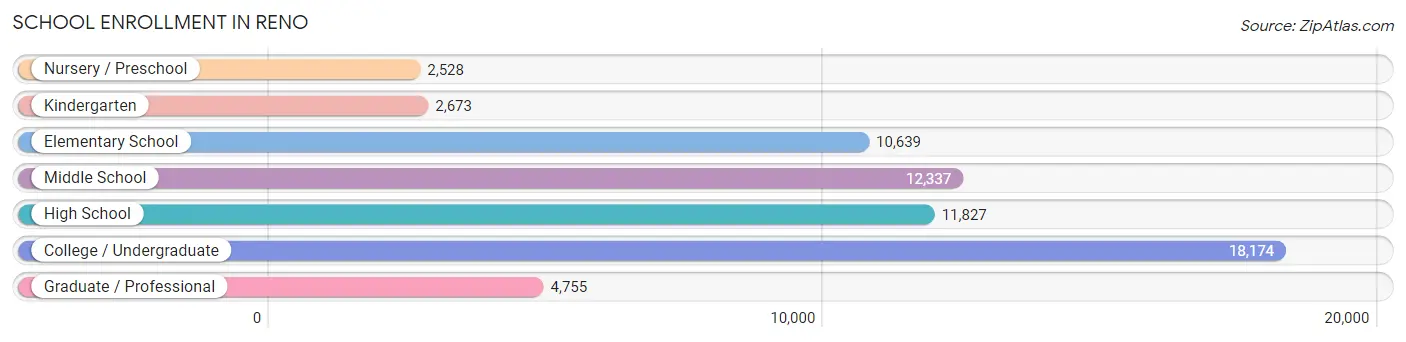
School Enrollment in Reno
The most common levels of schooling among the 62,933 students in Reno are college / undergraduate (18,174 | 28.9%), middle school (12,337 | 19.6%), and high school (11,827 | 18.8%).
| School Level | # Students | % Students |
| Nursery / Preschool | 2,528 | 4.0% |
| Kindergarten | 2,673 | 4.3% |
| Elementary School | 10,639 | 16.9% |
| Middle School | 12,337 | 19.6% |
| High School | 11,827 | 18.8% |
| College / Undergraduate | 18,174 | 28.9% |
| Graduate / Professional | 4,755 | 7.6% |
| Total | 62,933 | 100.0% |
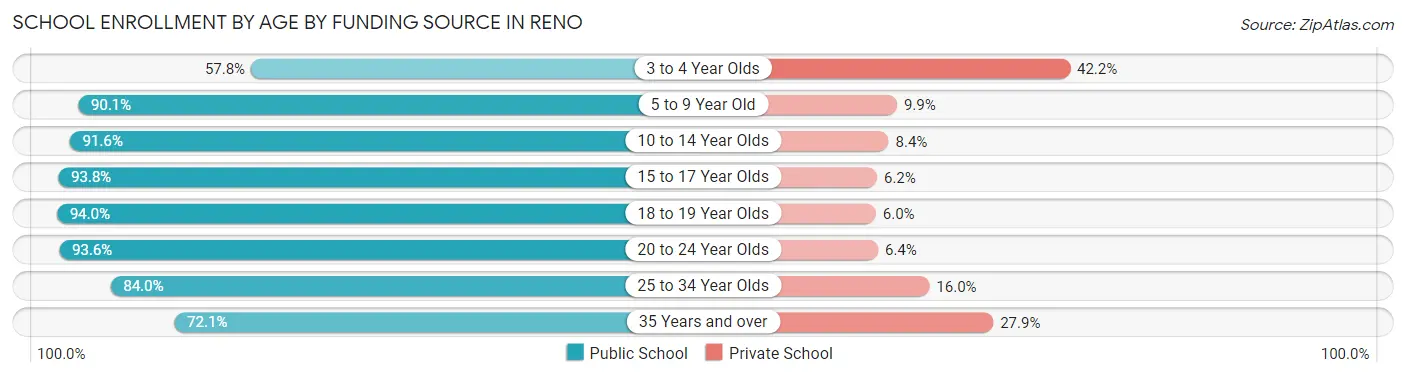
School Enrollment by Age by Funding Source in Reno
Out of a total of 62,933 students who are enrolled in schools in Reno, 6,923 (11.0%) attend a private institution, while the remaining 56,010 (89.0%) are enrolled in public schools. The age group of 3 to 4 year olds has the highest likelihood of being enrolled in private schools, with 955 (42.2% in the age bracket) enrolled. Conversely, the age group of 18 to 19 year olds has the lowest likelihood of being enrolled in a private school, with 5,555 (94.0% in the age bracket) attending a public institution.
| Age Bracket | Public School | Private School |
| 3 to 4 Year Olds | 1,310 (57.8%) | 955 (42.2%) |
| 5 to 9 Year Old | 11,297 (90.1%) | 1,245 (9.9%) |
| 10 to 14 Year Olds | 13,604 (91.6%) | 1,242 (8.4%) |
| 15 to 17 Year Olds | 7,939 (93.8%) | 527 (6.2%) |
| 18 to 19 Year Olds | 5,555 (94.0%) | 354 (6.0%) |
| 20 to 24 Year Olds | 8,530 (93.6%) | 583 (6.4%) |
| 25 to 34 Year Olds | 4,898 (84.0%) | 931 (16.0%) |
| 35 Years and over | 2,859 (72.1%) | 1,104 (27.9%) |
| Total | 56,010 (89.0%) | 6,923 (11.0%) |
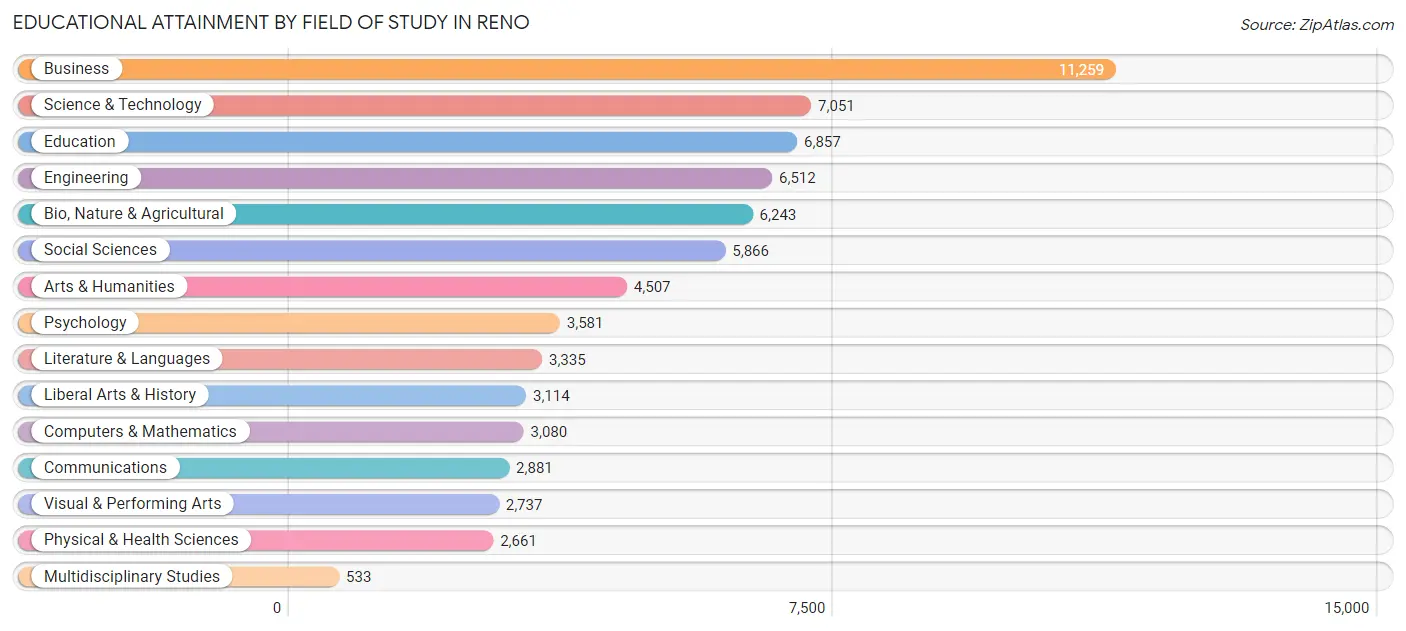
Educational Attainment by Field of Study in Reno
Business (11,259 | 16.0%), science & technology (7,051 | 10.0%), education (6,857 | 9.8%), engineering (6,512 | 9.3%), and bio, nature & agricultural (6,243 | 8.9%) are the most common fields of study among 70,217 individuals in Reno who have obtained a bachelor's degree or higher.
| Field of Study | # Graduates | % Graduates |
| Computers & Mathematics | 3,080 | 4.4% |
| Bio, Nature & Agricultural | 6,243 | 8.9% |
| Physical & Health Sciences | 2,661 | 3.8% |
| Psychology | 3,581 | 5.1% |
| Social Sciences | 5,866 | 8.4% |
| Engineering | 6,512 | 9.3% |
| Multidisciplinary Studies | 533 | 0.8% |
| Science & Technology | 7,051 | 10.0% |
| Business | 11,259 | 16.0% |
| Education | 6,857 | 9.8% |
| Literature & Languages | 3,335 | 4.8% |
| Liberal Arts & History | 3,114 | 4.4% |
| Visual & Performing Arts | 2,737 | 3.9% |
| Communications | 2,881 | 4.1% |
| Arts & Humanities | 4,507 | 6.4% |
| Total | 70,217 | 100.0% |
Transportation & Commute in Reno
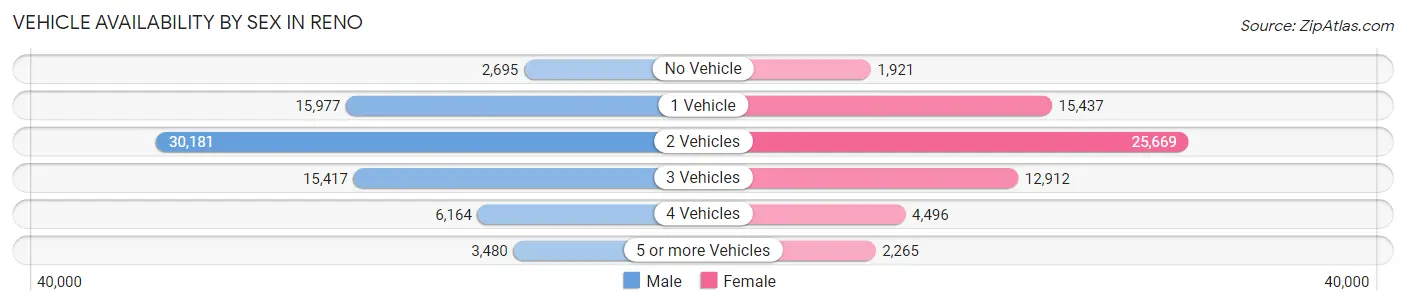
Vehicle Availability by Sex in Reno
The most prevalent vehicle ownership categories in Reno are males with 2 vehicles (30,181, accounting for 40.8%) and females with 2 vehicles (25,669, making up 48.1%).
| Vehicles Available | Male | Female |
| No Vehicle | 2,695 (3.6%) | 1,921 (3.1%) |
| 1 Vehicle | 15,977 (21.6%) | 15,437 (24.6%) |
| 2 Vehicles | 30,181 (40.8%) | 25,669 (40.9%) |
| 3 Vehicles | 15,417 (20.9%) | 12,912 (20.6%) |
| 4 Vehicles | 6,164 (8.3%) | 4,496 (7.2%) |
| 5 or more Vehicles | 3,480 (4.7%) | 2,265 (3.6%) |
| Total | 73,914 (100.0%) | 62,700 (100.0%) |
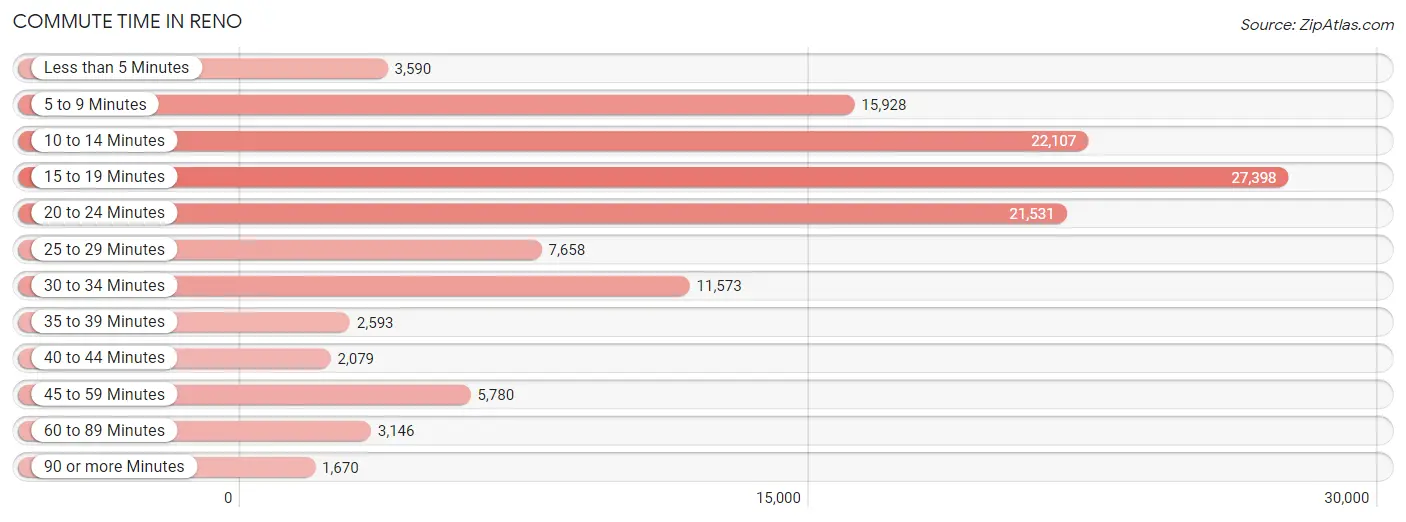
Commute Time in Reno
The most frequently occuring commute durations in Reno are 15 to 19 minutes (27,398 commuters, 21.9%), 10 to 14 minutes (22,107 commuters, 17.7%), and 20 to 24 minutes (21,531 commuters, 17.2%).
| Commute Time | # Commuters | % Commuters |
| Less than 5 Minutes | 3,590 | 2.9% |
| 5 to 9 Minutes | 15,928 | 12.7% |
| 10 to 14 Minutes | 22,107 | 17.7% |
| 15 to 19 Minutes | 27,398 | 21.9% |
| 20 to 24 Minutes | 21,531 | 17.2% |
| 25 to 29 Minutes | 7,658 | 6.1% |
| 30 to 34 Minutes | 11,573 | 9.2% |
| 35 to 39 Minutes | 2,593 | 2.1% |
| 40 to 44 Minutes | 2,079 | 1.7% |
| 45 to 59 Minutes | 5,780 | 4.6% |
| 60 to 89 Minutes | 3,146 | 2.5% |
| 90 or more Minutes | 1,670 | 1.3% |
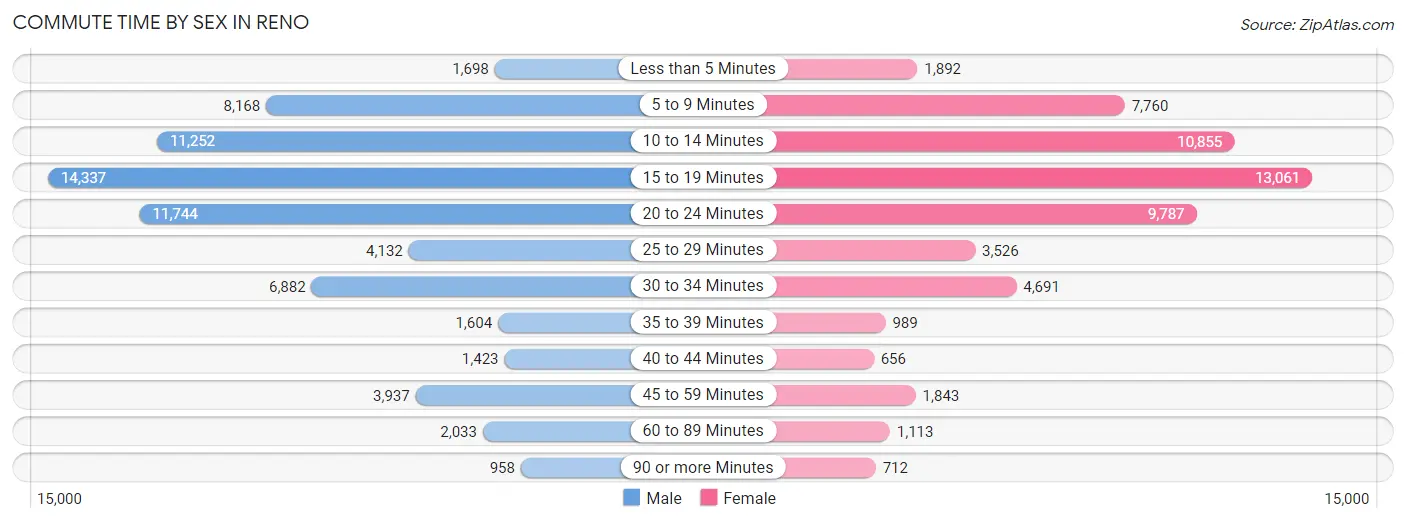
Commute Time by Sex in Reno
The most common commute times in Reno are 15 to 19 minutes (14,337 commuters, 21.0%) for males and 15 to 19 minutes (13,061 commuters, 23.0%) for females.
| Commute Time | Male | Female |
| Less than 5 Minutes | 1,698 (2.5%) | 1,892 (3.3%) |
| 5 to 9 Minutes | 8,168 (12.0%) | 7,760 (13.6%) |
| 10 to 14 Minutes | 11,252 (16.5%) | 10,855 (19.1%) |
| 15 to 19 Minutes | 14,337 (21.0%) | 13,061 (23.0%) |
| 20 to 24 Minutes | 11,744 (17.2%) | 9,787 (17.2%) |
| 25 to 29 Minutes | 4,132 (6.1%) | 3,526 (6.2%) |
| 30 to 34 Minutes | 6,882 (10.1%) | 4,691 (8.3%) |
| 35 to 39 Minutes | 1,604 (2.4%) | 989 (1.7%) |
| 40 to 44 Minutes | 1,423 (2.1%) | 656 (1.1%) |
| 45 to 59 Minutes | 3,937 (5.8%) | 1,843 (3.2%) |
| 60 to 89 Minutes | 2,033 (3.0%) | 1,113 (2.0%) |
| 90 or more Minutes | 958 (1.4%) | 712 (1.3%) |
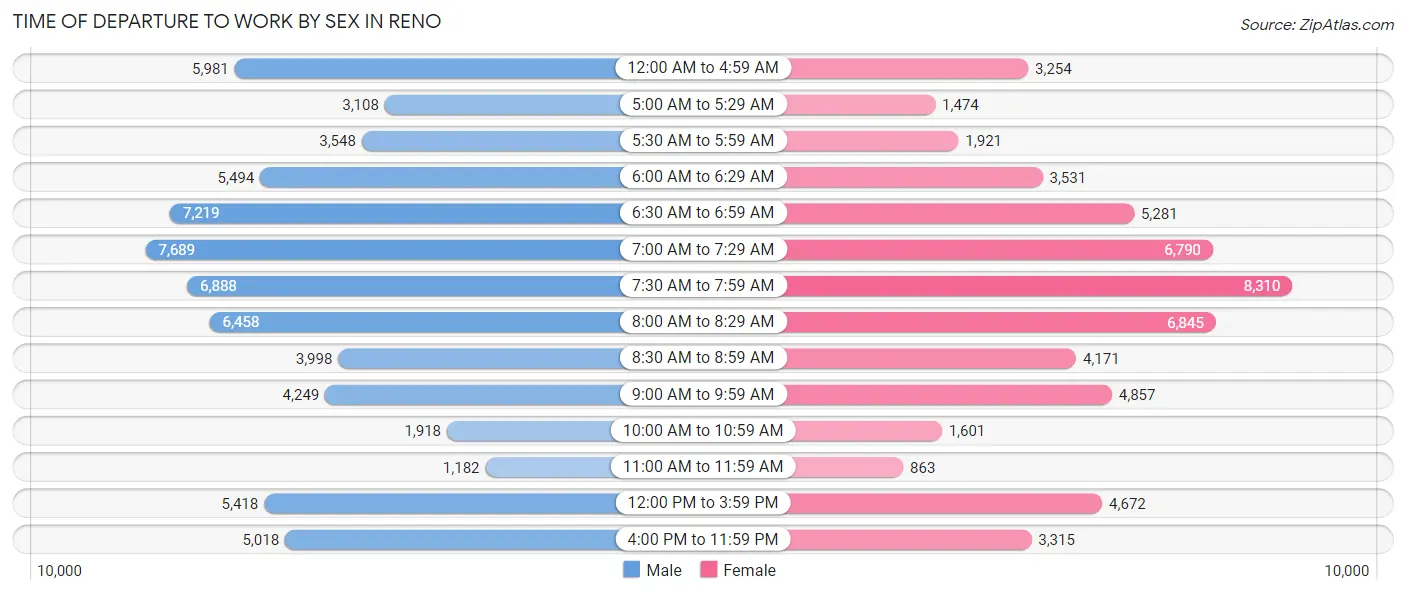
Time of Departure to Work by Sex in Reno
The most frequent times of departure to work in Reno are 7:00 AM to 7:29 AM (7,689, 11.3%) for males and 7:30 AM to 7:59 AM (8,310, 14.6%) for females.
| Time of Departure | Male | Female |
| 12:00 AM to 4:59 AM | 5,981 (8.8%) | 3,254 (5.7%) |
| 5:00 AM to 5:29 AM | 3,108 (4.6%) | 1,474 (2.6%) |
| 5:30 AM to 5:59 AM | 3,548 (5.2%) | 1,921 (3.4%) |
| 6:00 AM to 6:29 AM | 5,494 (8.1%) | 3,531 (6.2%) |
| 6:30 AM to 6:59 AM | 7,219 (10.6%) | 5,281 (9.3%) |
| 7:00 AM to 7:29 AM | 7,689 (11.3%) | 6,790 (11.9%) |
| 7:30 AM to 7:59 AM | 6,888 (10.1%) | 8,310 (14.6%) |
| 8:00 AM to 8:29 AM | 6,458 (9.5%) | 6,845 (12.0%) |
| 8:30 AM to 8:59 AM | 3,998 (5.9%) | 4,171 (7.3%) |
| 9:00 AM to 9:59 AM | 4,249 (6.2%) | 4,857 (8.5%) |
| 10:00 AM to 10:59 AM | 1,918 (2.8%) | 1,601 (2.8%) |
| 11:00 AM to 11:59 AM | 1,182 (1.7%) | 863 (1.5%) |
| 12:00 PM to 3:59 PM | 5,418 (8.0%) | 4,672 (8.2%) |
| 4:00 PM to 11:59 PM | 5,018 (7.4%) | 3,315 (5.8%) |
| Total | 68,168 (100.0%) | 56,885 (100.0%) |
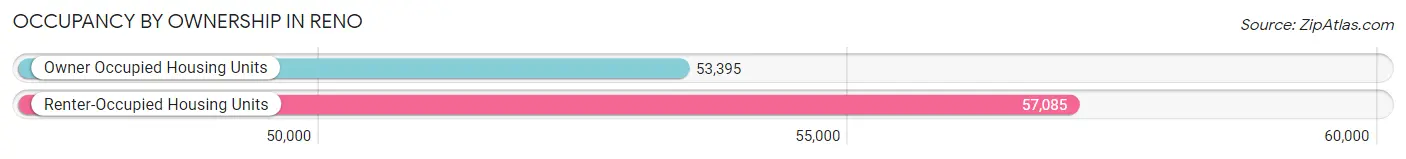
Housing Occupancy in Reno
Occupancy by Ownership in Reno
Of the total 110,480 dwellings in Reno, owner-occupied units account for 53,395 (48.3%), while renter-occupied units make up 57,085 (51.7%).
| Occupancy | # Housing Units | % Housing Units |
| Owner Occupied Housing Units | 53,395 | 48.3% |
| Renter-Occupied Housing Units | 57,085 | 51.7% |
| Total Occupied Housing Units | 110,480 | 100.0% |
Occupancy by Household Size in Reno
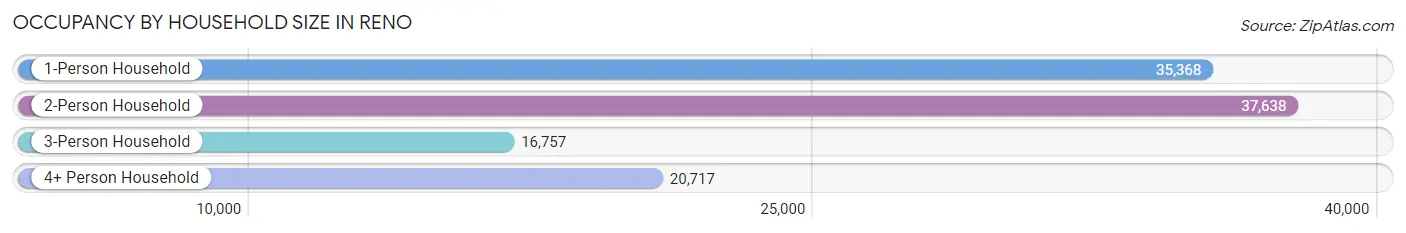
| Household Size | # Housing Units | % Housing Units |
| 1-Person Household | 35,368 | 32.0% |
| 2-Person Household | 37,638 | 34.1% |
| 3-Person Household | 16,757 | 15.2% |
| 4+ Person Household | 20,717 | 18.8% |
| Total Housing Units | 110,480 | 100.0% |
Occupancy by Ownership by Household Size in Reno
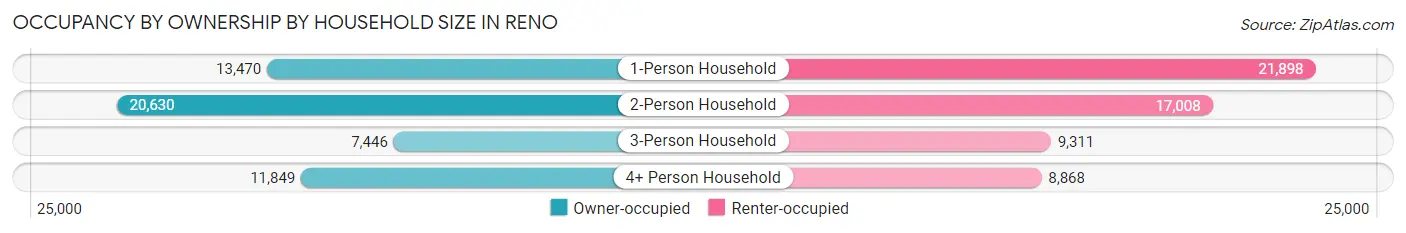
| Household Size | Owner-occupied | Renter-occupied |
| 1-Person Household | 13,470 (38.1%) | 21,898 (61.9%) |
| 2-Person Household | 20,630 (54.8%) | 17,008 (45.2%) |
| 3-Person Household | 7,446 (44.4%) | 9,311 (55.6%) |
| 4+ Person Household | 11,849 (57.2%) | 8,868 (42.8%) |
| Total Housing Units | 53,395 (48.3%) | 57,085 (51.7%) |
Occupancy by Educational Attainment in Reno
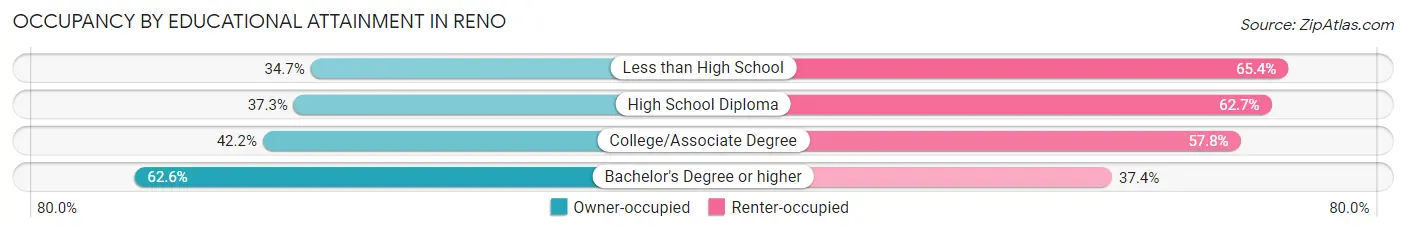
| Household Size | Owner-occupied | Renter-occupied |
| Less than High School | 3,204 (34.6%) | 6,042 (65.3%) |
| High School Diploma | 8,322 (37.3%) | 13,978 (62.7%) |
| College/Associate Degree | 15,624 (42.2%) | 21,374 (57.8%) |
| Bachelor's Degree or higher | 26,245 (62.6%) | 15,691 (37.4%) |
Occupancy by Age of Householder in Reno
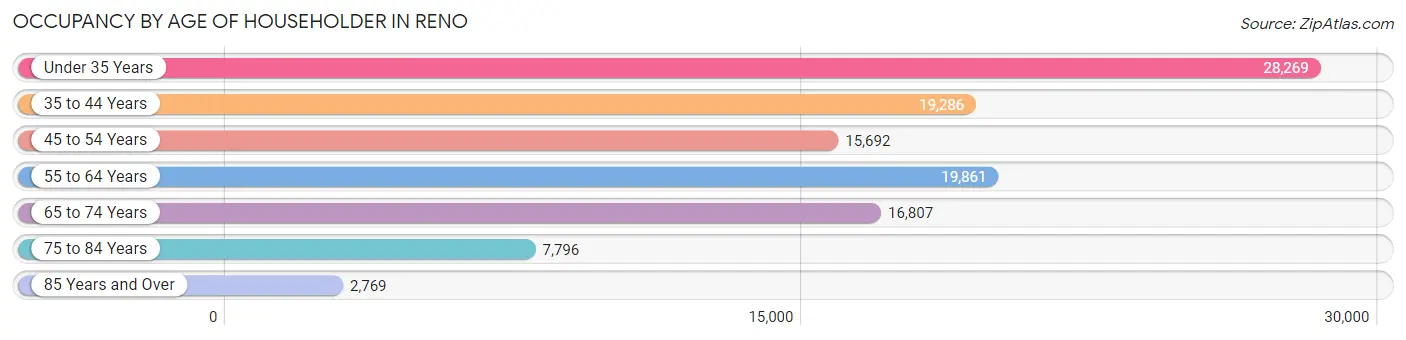
| Age Bracket | # Households | % Households |
| Under 35 Years | 28,269 | 25.6% |
| 35 to 44 Years | 19,286 | 17.5% |
| 45 to 54 Years | 15,692 | 14.2% |
| 55 to 64 Years | 19,861 | 18.0% |
| 65 to 74 Years | 16,807 | 15.2% |
| 75 to 84 Years | 7,796 | 7.1% |
| 85 Years and Over | 2,769 | 2.5% |
| Total | 110,480 | 100.0% |
Housing Finances in Reno
Median Income by Occupancy in Reno
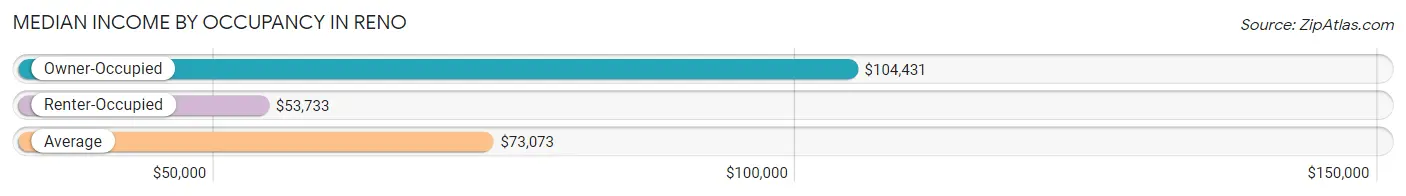
| Occupancy Type | # Households | Median Income |
| Owner-Occupied | 53,395 (48.3%) | $104,431 |
| Renter-Occupied | 57,085 (51.7%) | $53,733 |
| Average | 110,480 (100.0%) | $73,073 |
Occupancy by Householder Income Bracket in Reno
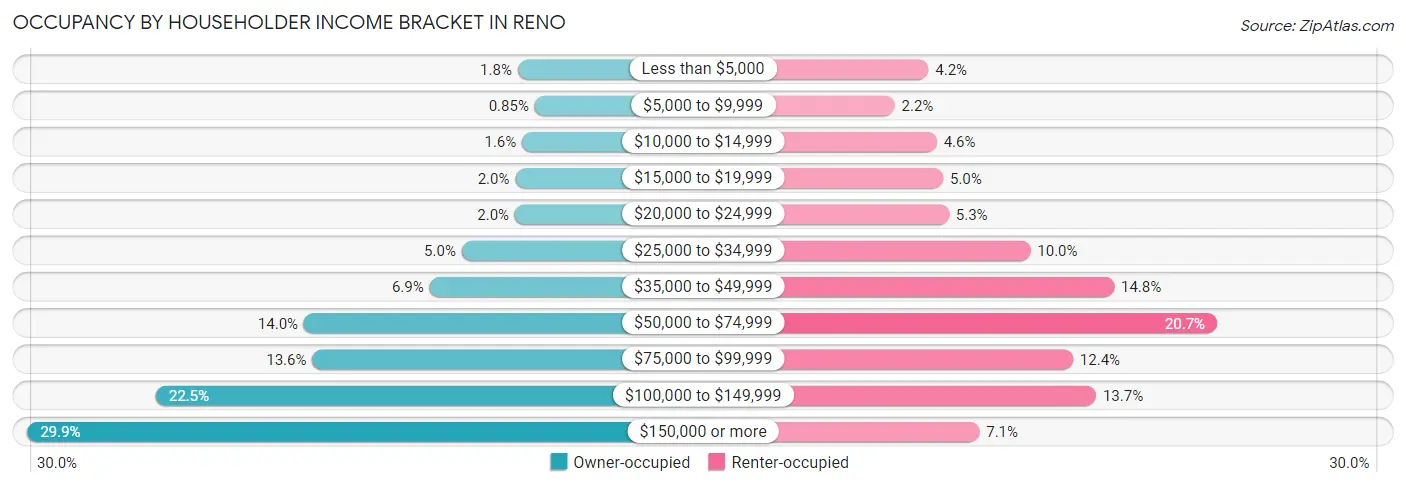
| Income Bracket | Owner-occupied | Renter-occupied |
| Less than $5,000 | 972 (1.8%) | 2,375 (4.2%) |
| $5,000 to $9,999 | 453 (0.9%) | 1,275 (2.2%) |
| $10,000 to $14,999 | 836 (1.6%) | 2,646 (4.6%) |
| $15,000 to $19,999 | 1,049 (2.0%) | 2,855 (5.0%) |
| $20,000 to $24,999 | 1,059 (2.0%) | 3,043 (5.3%) |
| $25,000 to $34,999 | 2,680 (5.0%) | 5,701 (10.0%) |
| $35,000 to $49,999 | 3,662 (6.9%) | 8,430 (14.8%) |
| $50,000 to $74,999 | 7,494 (14.0%) | 11,790 (20.6%) |
| $75,000 to $99,999 | 7,242 (13.6%) | 7,092 (12.4%) |
| $100,000 to $149,999 | 12,012 (22.5%) | 7,841 (13.7%) |
| $150,000 or more | 15,936 (29.8%) | 4,037 (7.1%) |
| Total | 53,395 (100.0%) | 57,085 (100.0%) |
Monthly Housing Cost Tiers in Reno
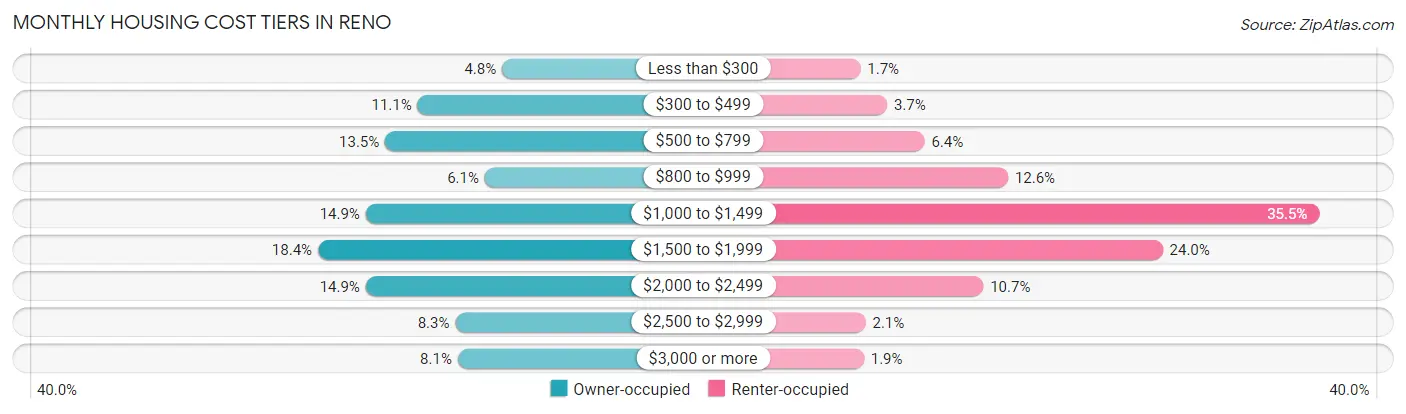
| Monthly Cost | Owner-occupied | Renter-occupied |
| Less than $300 | 2,586 (4.8%) | 966 (1.7%) |
| $300 to $499 | 5,903 (11.1%) | 2,084 (3.6%) |
| $500 to $799 | 7,183 (13.5%) | 3,657 (6.4%) |
| $800 to $999 | 3,260 (6.1%) | 7,169 (12.6%) |
| $1,000 to $1,499 | 7,943 (14.9%) | 20,254 (35.5%) |
| $1,500 to $1,999 | 9,827 (18.4%) | 13,670 (23.9%) |
| $2,000 to $2,499 | 7,947 (14.9%) | 6,132 (10.7%) |
| $2,500 to $2,999 | 4,423 (8.3%) | 1,179 (2.1%) |
| $3,000 or more | 4,323 (8.1%) | 1,108 (1.9%) |
| Total | 53,395 (100.0%) | 57,085 (100.0%) |
Physical Housing Characteristics in Reno
Housing Structures in Reno
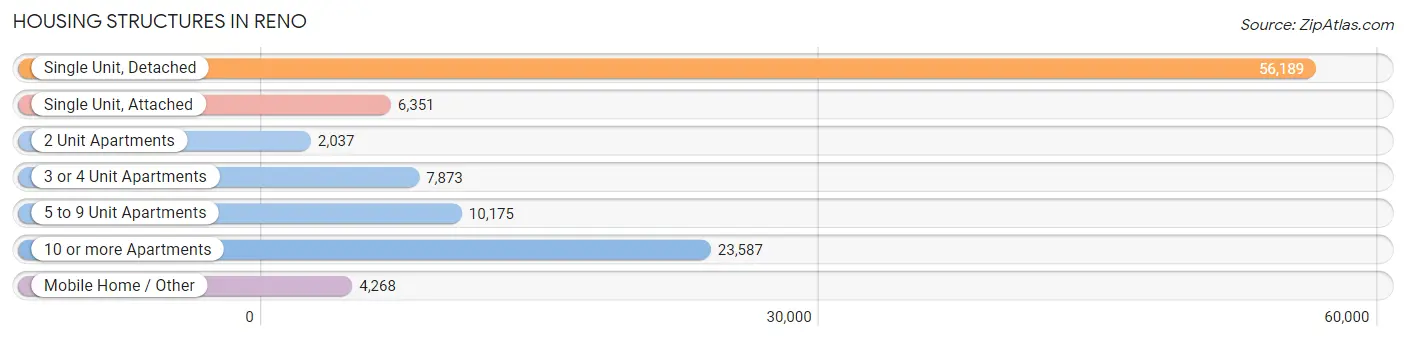
| Structure Type | # Housing Units | % Housing Units |
| Single Unit, Detached | 56,189 | 50.9% |
| Single Unit, Attached | 6,351 | 5.8% |
| 2 Unit Apartments | 2,037 | 1.8% |
| 3 or 4 Unit Apartments | 7,873 | 7.1% |
| 5 to 9 Unit Apartments | 10,175 | 9.2% |
| 10 or more Apartments | 23,587 | 21.3% |
| Mobile Home / Other | 4,268 | 3.9% |
| Total | 110,480 | 100.0% |
Housing Structures by Occupancy in Reno
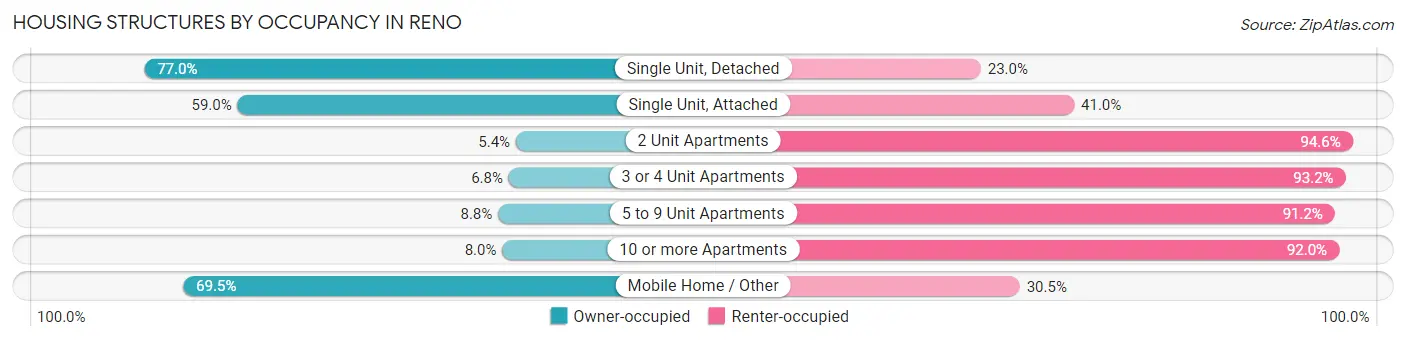
| Structure Type | Owner-occupied | Renter-occupied |
| Single Unit, Detached | 43,250 (77.0%) | 12,939 (23.0%) |
| Single Unit, Attached | 3,747 (59.0%) | 2,604 (41.0%) |
| 2 Unit Apartments | 110 (5.4%) | 1,927 (94.6%) |
| 3 or 4 Unit Apartments | 533 (6.8%) | 7,340 (93.2%) |
| 5 to 9 Unit Apartments | 898 (8.8%) | 9,277 (91.2%) |
| 10 or more Apartments | 1,892 (8.0%) | 21,695 (92.0%) |
| Mobile Home / Other | 2,965 (69.5%) | 1,303 (30.5%) |
| Total | 53,395 (48.3%) | 57,085 (51.7%) |
Housing Structures by Number of Rooms in Reno
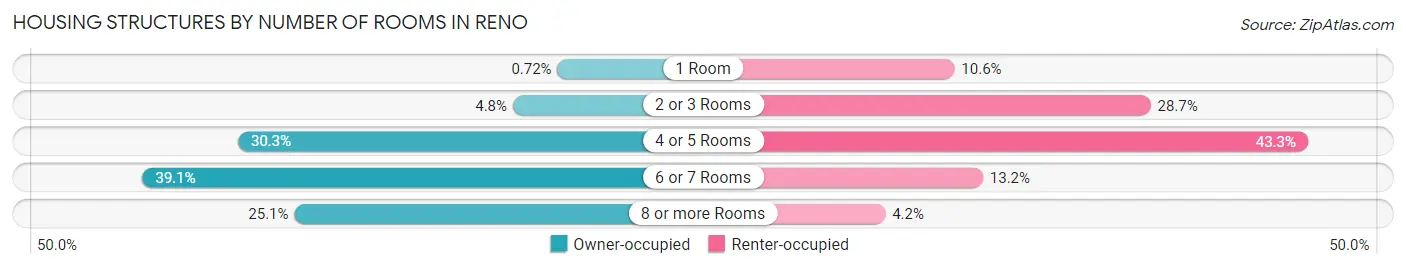
| Number of Rooms | Owner-occupied | Renter-occupied |
| 1 Room | 384 (0.7%) | 6,045 (10.6%) |
| 2 or 3 Rooms | 2,583 (4.8%) | 16,399 (28.7%) |
| 4 or 5 Rooms | 16,168 (30.3%) | 24,703 (43.3%) |
| 6 or 7 Rooms | 20,882 (39.1%) | 7,544 (13.2%) |
| 8 or more Rooms | 13,378 (25.1%) | 2,394 (4.2%) |
| Total | 53,395 (100.0%) | 57,085 (100.0%) |
Housing Structure by Heating Type in Reno
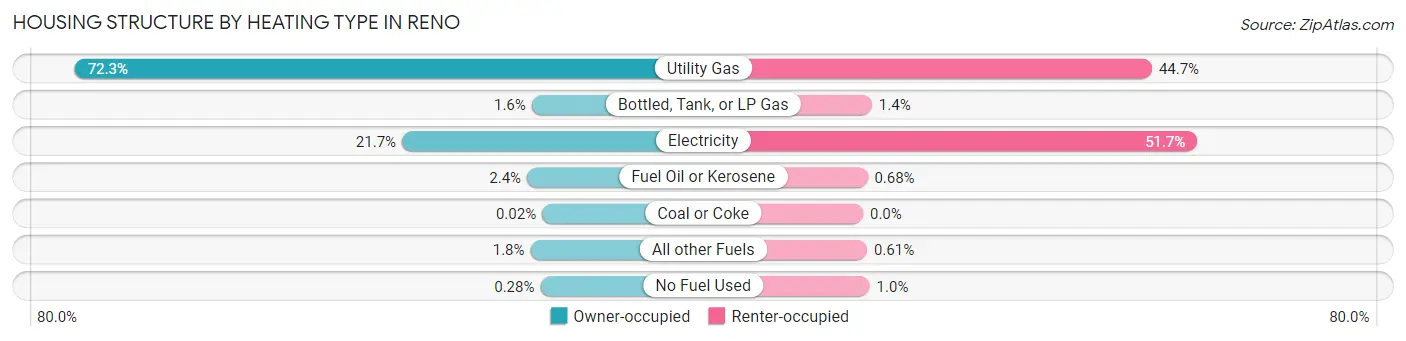
| Heating Type | Owner-occupied | Renter-occupied |
| Utility Gas | 38,580 (72.3%) | 25,497 (44.7%) |
| Bottled, Tank, or LP Gas | 863 (1.6%) | 780 (1.4%) |
| Electricity | 11,571 (21.7%) | 29,485 (51.6%) |
| Fuel Oil or Kerosene | 1,254 (2.4%) | 387 (0.7%) |
| Coal or Coke | 9 (0.0%) | 0 (0.0%) |
| All other Fuels | 967 (1.8%) | 351 (0.6%) |
| No Fuel Used | 151 (0.3%) | 585 (1.0%) |
| Total | 53,395 (100.0%) | 57,085 (100.0%) |
Household Vehicle Usage in Reno
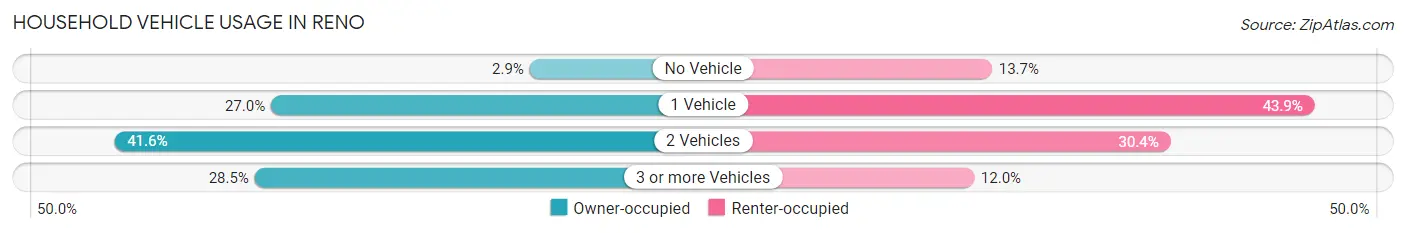
| Vehicles per Household | Owner-occupied | Renter-occupied |
| No Vehicle | 1,521 (2.9%) | 7,826 (13.7%) |
| 1 Vehicle | 14,415 (27.0%) | 25,033 (43.9%) |
| 2 Vehicles | 22,229 (41.6%) | 17,354 (30.4%) |
| 3 or more Vehicles | 15,230 (28.5%) | 6,872 (12.0%) |
| Total | 53,395 (100.0%) | 57,085 (100.0%) |
Real Estate & Mortgages in Reno
Real Estate and Mortgage Overview in Reno
| Characteristic | Without Mortgage | With Mortgage |
| Housing Units | 18,525 | 34,870 |
| Median Property Value | $440,700 | $471,300 |
| Median Household Income | $77,156 | $12,072 |
| Monthly Housing Costs | $540 | $4,268 |
| Real Estate Taxes | $1,930 | $800 |
Property Value by Mortgage Status in Reno
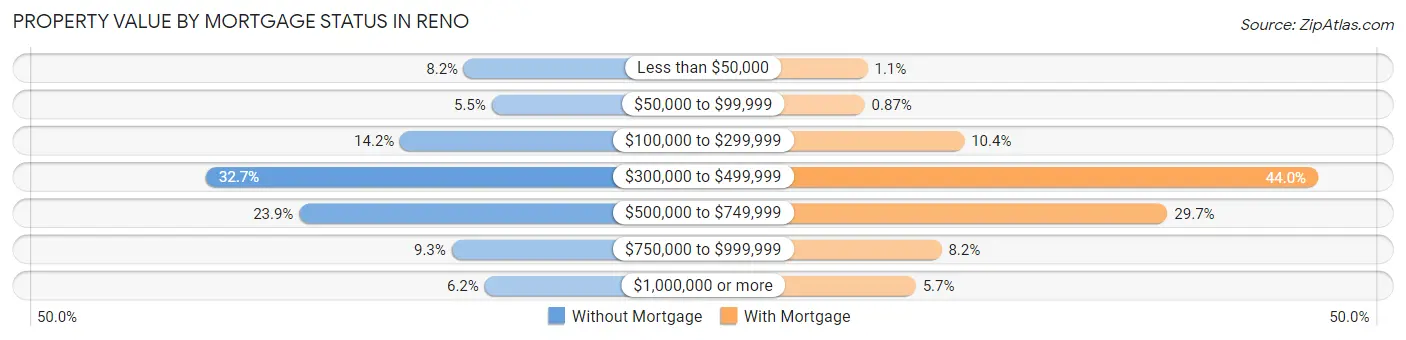
| Property Value | Without Mortgage | With Mortgage |
| Less than $50,000 | 1,511 (8.2%) | 397 (1.1%) |
| $50,000 to $99,999 | 1,022 (5.5%) | 304 (0.9%) |
| $100,000 to $299,999 | 2,636 (14.2%) | 3,609 (10.3%) |
| $300,000 to $499,999 | 6,063 (32.7%) | 15,354 (44.0%) |
| $500,000 to $749,999 | 4,419 (23.8%) | 10,357 (29.7%) |
| $750,000 to $999,999 | 1,728 (9.3%) | 2,851 (8.2%) |
| $1,000,000 or more | 1,146 (6.2%) | 1,998 (5.7%) |
| Total | 18,525 (100.0%) | 34,870 (100.0%) |
Household Income by Mortgage Status in Reno
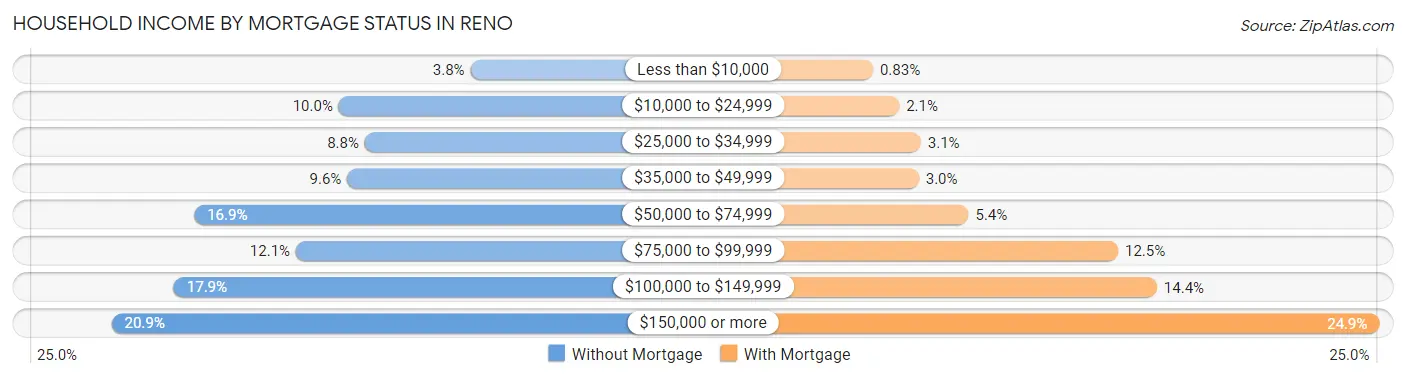
| Household Income | Without Mortgage | With Mortgage |
| Less than $10,000 | 699 (3.8%) | 290 (0.8%) |
| $10,000 to $24,999 | 1,860 (10.0%) | 726 (2.1%) |
| $25,000 to $34,999 | 1,630 (8.8%) | 1,084 (3.1%) |
| $35,000 to $49,999 | 1,786 (9.6%) | 1,050 (3.0%) |
| $50,000 to $74,999 | 3,134 (16.9%) | 1,876 (5.4%) |
| $75,000 to $99,999 | 2,238 (12.1%) | 4,360 (12.5%) |
| $100,000 to $149,999 | 3,314 (17.9%) | 5,004 (14.3%) |
| $150,000 or more | 3,864 (20.9%) | 8,698 (24.9%) |
| Total | 18,525 (100.0%) | 34,870 (100.0%) |
Property Value to Household Income Ratio in Reno
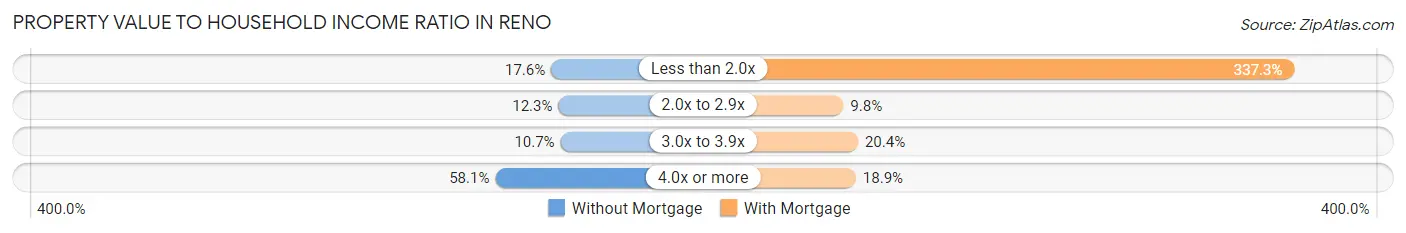
| Value-to-Income Ratio | Without Mortgage | With Mortgage |
| Less than 2.0x | 3,259 (17.6%) | 117,629 (337.3%) |
| 2.0x to 2.9x | 2,283 (12.3%) | 3,409 (9.8%) |
| 3.0x to 3.9x | 1,989 (10.7%) | 7,110 (20.4%) |
| 4.0x or more | 10,764 (58.1%) | 6,585 (18.9%) |
| Total | 18,525 (100.0%) | 34,870 (100.0%) |
Real Estate Taxes by Mortgage Status in Reno
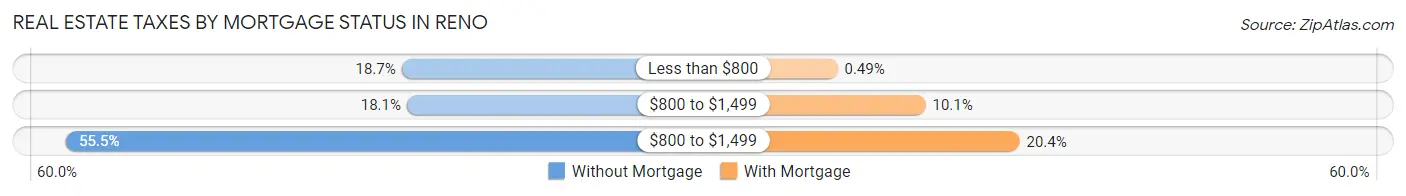
| Property Taxes | Without Mortgage | With Mortgage |
| Less than $800 | 3,463 (18.7%) | 172 (0.5%) |
| $800 to $1,499 | 3,357 (18.1%) | 3,535 (10.1%) |
| $800 to $1,499 | 10,274 (55.5%) | 7,127 (20.4%) |
| Total | 18,525 (100.0%) | 34,870 (100.0%) |
Health & Disability in Reno
Health Insurance Coverage by Age in Reno
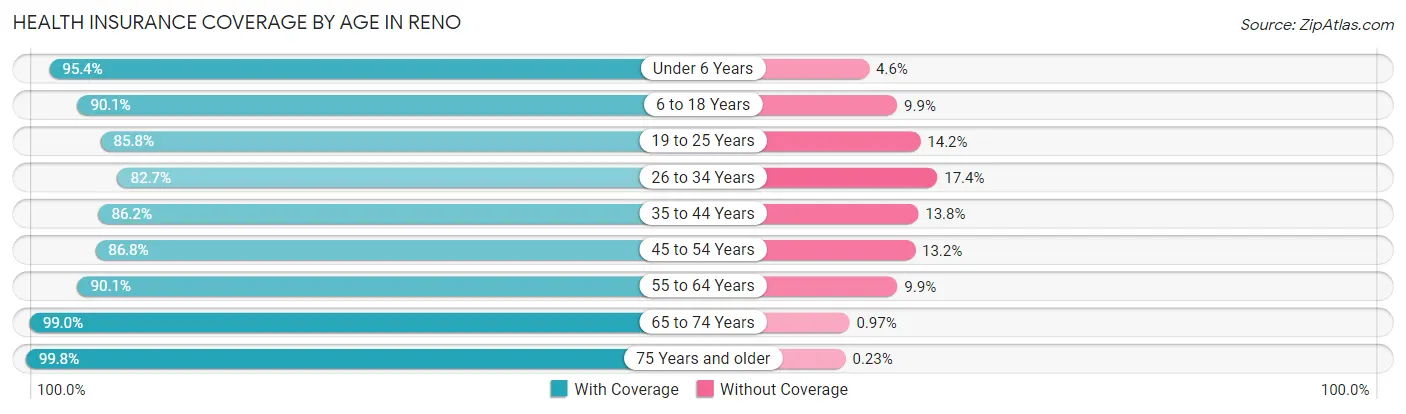
| Age Bracket | With Coverage | Without Coverage |
| Under 6 Years | 16,251 (95.4%) | 787 (4.6%) |
| 6 to 18 Years | 34,525 (90.1%) | 3,778 (9.9%) |
| 19 to 25 Years | 25,518 (85.8%) | 4,216 (14.2%) |
| 26 to 34 Years | 31,888 (82.7%) | 6,696 (17.3%) |
| 35 to 44 Years | 30,464 (86.2%) | 4,876 (13.8%) |
| 45 to 54 Years | 25,171 (86.8%) | 3,826 (13.2%) |
| 55 to 64 Years | 29,877 (90.1%) | 3,284 (9.9%) |
| 65 to 74 Years | 25,496 (99.0%) | 250 (1.0%) |
| 75 Years and older | 15,764 (99.8%) | 37 (0.2%) |
| Total | 234,954 (89.4%) | 27,750 (10.6%) |
Health Insurance Coverage by Citizenship Status in Reno
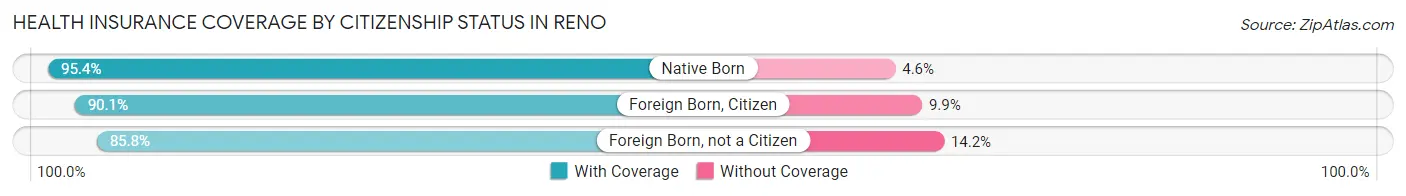
| Citizenship Status | With Coverage | Without Coverage |
| Native Born | 16,251 (95.4%) | 787 (4.6%) |
| Foreign Born, Citizen | 34,525 (90.1%) | 3,778 (9.9%) |
| Foreign Born, not a Citizen | 25,518 (85.8%) | 4,216 (14.2%) |
Health Insurance Coverage by Household Income in Reno
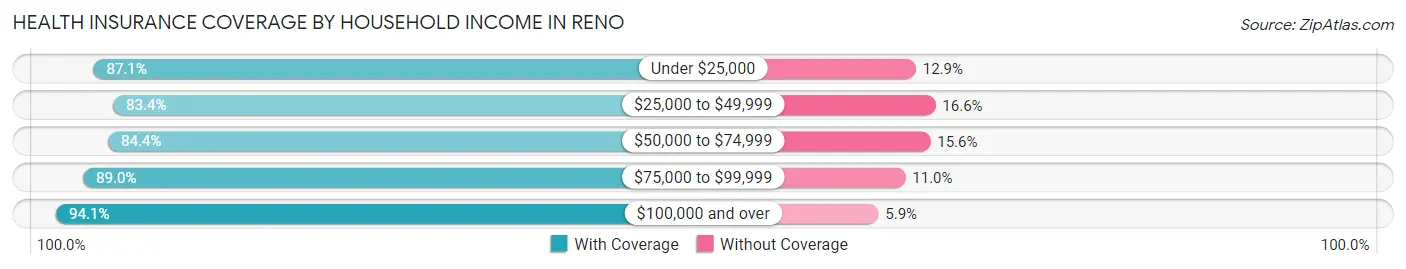
| Household Income | With Coverage | Without Coverage |
| Under $25,000 | 23,707 (87.1%) | 3,519 (12.9%) |
| $25,000 to $49,999 | 33,463 (83.4%) | 6,659 (16.6%) |
| $50,000 to $74,999 | 35,797 (84.4%) | 6,639 (15.6%) |
| $75,000 to $99,999 | 32,943 (89.0%) | 4,061 (11.0%) |
| $100,000 and over | 105,310 (94.1%) | 6,611 (5.9%) |
Public vs Private Health Insurance Coverage by Age in Reno
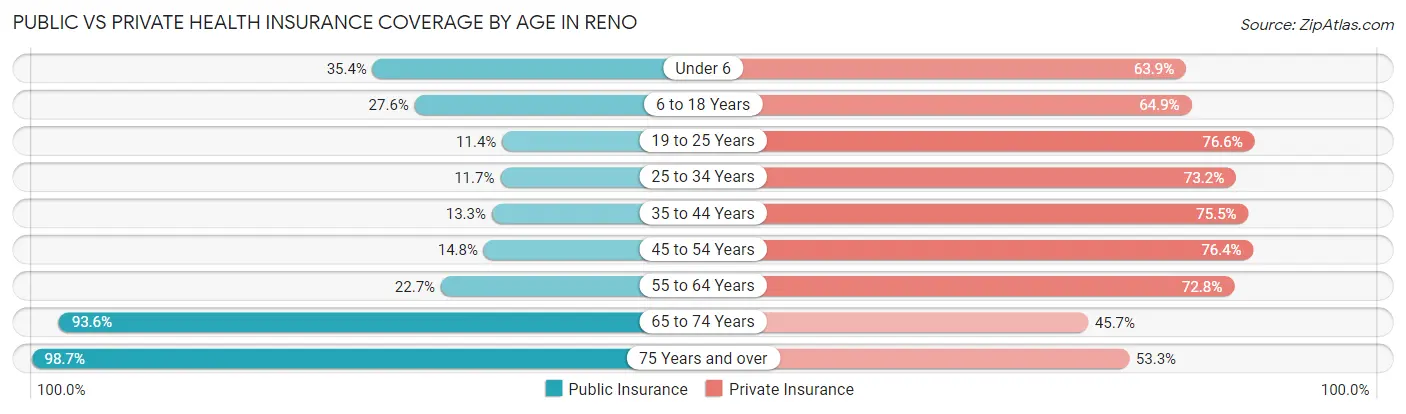
| Age Bracket | Public Insurance | Private Insurance |
| Under 6 | 6,030 (35.4%) | 10,886 (63.9%) |
| 6 to 18 Years | 10,572 (27.6%) | 24,854 (64.9%) |
| 19 to 25 Years | 3,377 (11.4%) | 22,778 (76.6%) |
| 25 to 34 Years | 4,517 (11.7%) | 28,237 (73.2%) |
| 35 to 44 Years | 4,694 (13.3%) | 26,670 (75.5%) |
| 45 to 54 Years | 4,283 (14.8%) | 22,154 (76.4%) |
| 55 to 64 Years | 7,539 (22.7%) | 24,140 (72.8%) |
| 65 to 74 Years | 24,109 (93.6%) | 11,759 (45.7%) |
| 75 Years and over | 15,595 (98.7%) | 8,420 (53.3%) |
| Total | 80,716 (30.7%) | 179,898 (68.5%) |
Disability Status by Sex by Age in Reno
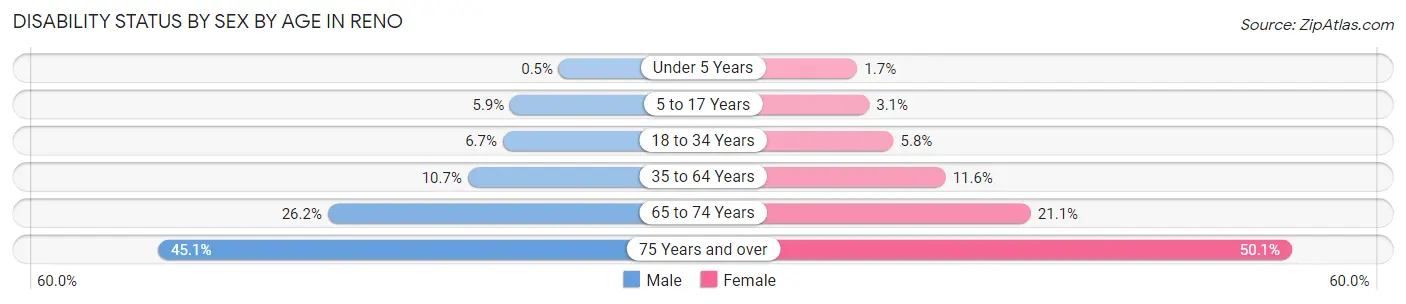
| Age Bracket | Male | Female |
| Under 5 Years | 34 (0.5%) | 124 (1.7%) |
| 5 to 17 Years | 1,117 (5.9%) | 599 (3.1%) |
| 18 to 34 Years | 2,485 (6.7%) | 1,988 (5.8%) |
| 35 to 64 Years | 5,351 (10.6%) | 5,467 (11.6%) |
| 65 to 74 Years | 3,241 (26.2%) | 2,821 (21.1%) |
| 75 Years and over | 3,254 (45.1%) | 4,306 (50.1%) |
Disability Class by Sex by Age in Reno
Disability Class: Hearing Difficulty
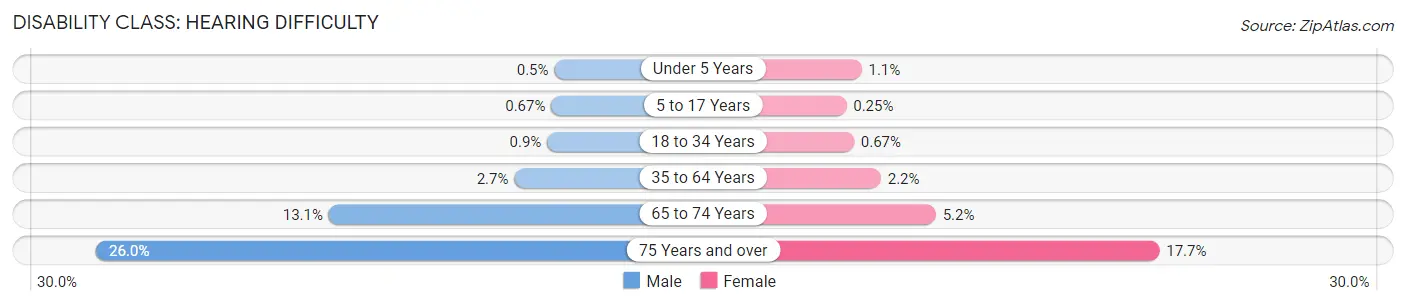
| Age Bracket | Male | Female |
| Under 5 Years | 34 (0.5%) | 78 (1.1%) |
| 5 to 17 Years | 126 (0.7%) | 49 (0.3%) |
| 18 to 34 Years | 332 (0.9%) | 232 (0.7%) |
| 35 to 64 Years | 1,374 (2.7%) | 1,024 (2.2%) |
| 65 to 74 Years | 1,613 (13.1%) | 701 (5.2%) |
| 75 Years and over | 1,876 (26.0%) | 1,519 (17.7%) |
Disability Class: Vision Difficulty
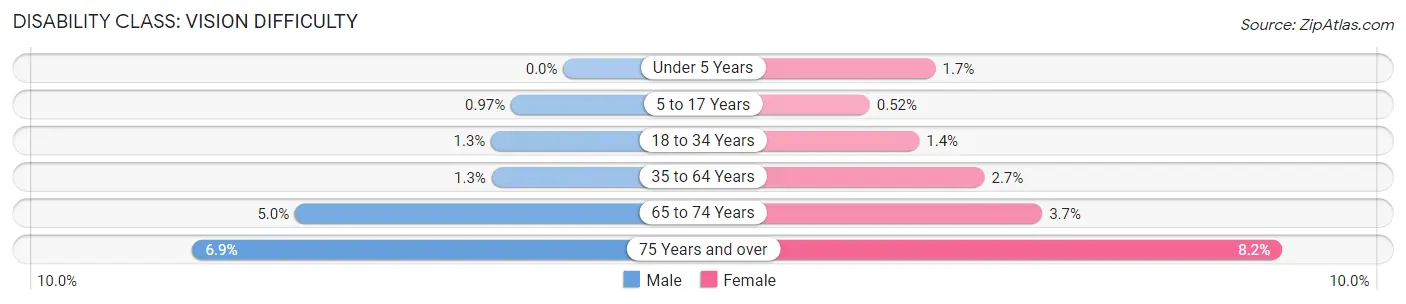
| Age Bracket | Male | Female |
| Under 5 Years | 0 (0.0%) | 124 (1.7%) |
| 5 to 17 Years | 182 (1.0%) | 101 (0.5%) |
| 18 to 34 Years | 495 (1.3%) | 497 (1.4%) |
| 35 to 64 Years | 669 (1.3%) | 1,253 (2.6%) |
| 65 to 74 Years | 615 (5.0%) | 498 (3.7%) |
| 75 Years and over | 496 (6.9%) | 702 (8.2%) |
Disability Class: Cognitive Difficulty
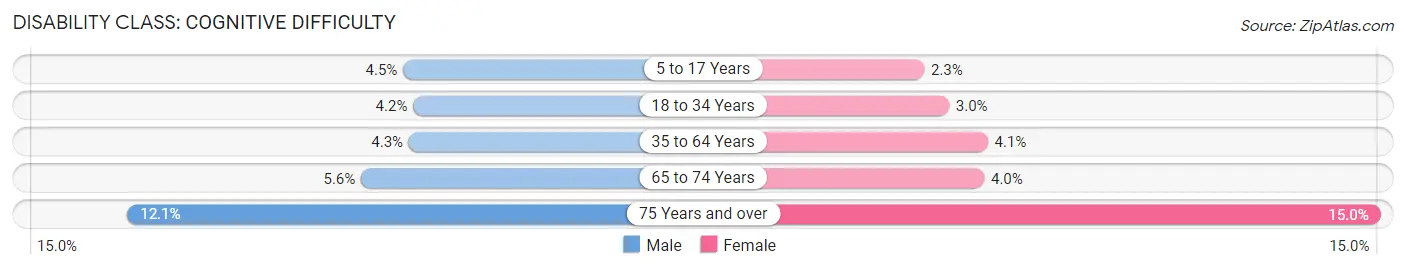
| Age Bracket | Male | Female |
| 5 to 17 Years | 840 (4.5%) | 448 (2.3%) |
| 18 to 34 Years | 1,542 (4.2%) | 1,026 (3.0%) |
| 35 to 64 Years | 2,162 (4.3%) | 1,917 (4.1%) |
| 65 to 74 Years | 695 (5.6%) | 531 (4.0%) |
| 75 Years and over | 875 (12.1%) | 1,289 (15.0%) |
Disability Class: Ambulatory Difficulty
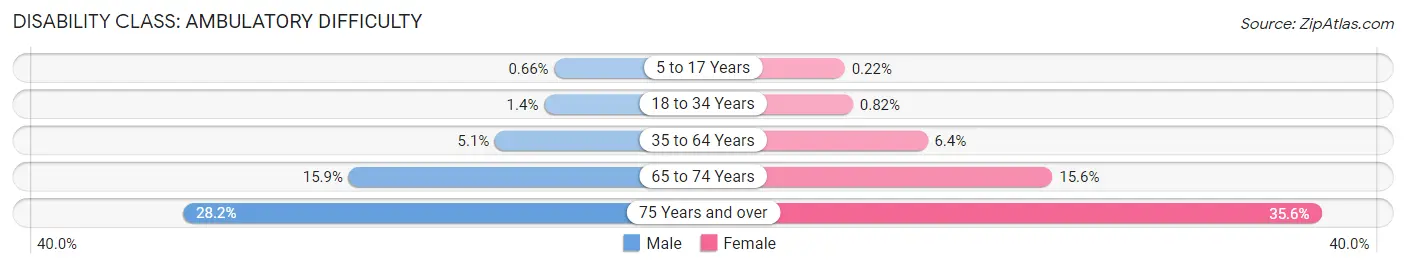
| Age Bracket | Male | Female |
| 5 to 17 Years | 124 (0.7%) | 43 (0.2%) |
| 18 to 34 Years | 523 (1.4%) | 282 (0.8%) |
| 35 to 64 Years | 2,544 (5.1%) | 3,007 (6.4%) |
| 65 to 74 Years | 1,968 (15.9%) | 2,094 (15.6%) |
| 75 Years and over | 2,035 (28.2%) | 3,059 (35.6%) |
Disability Class: Self-Care Difficulty
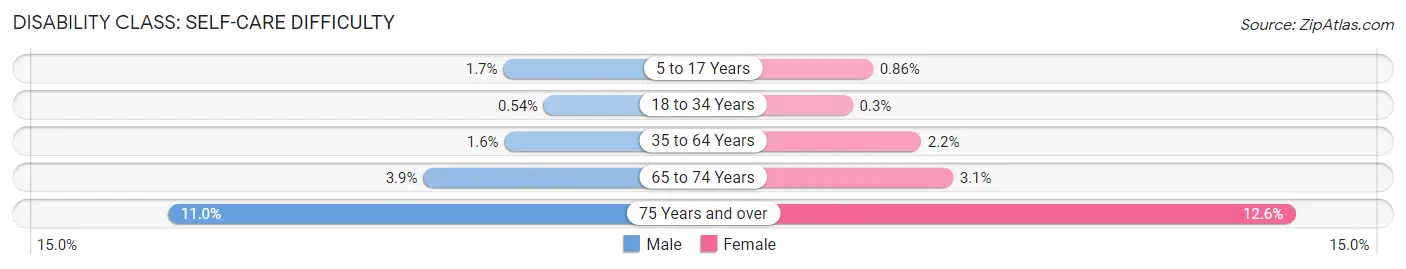
| Age Bracket | Male | Female |
| 5 to 17 Years | 315 (1.7%) | 168 (0.9%) |
| 18 to 34 Years | 199 (0.5%) | 105 (0.3%) |
| 35 to 64 Years | 825 (1.6%) | 1,039 (2.2%) |
| 65 to 74 Years | 482 (3.9%) | 414 (3.1%) |
| 75 Years and over | 794 (11.0%) | 1,084 (12.6%) |
Technology Access in Reno
Computing Device Access in Reno
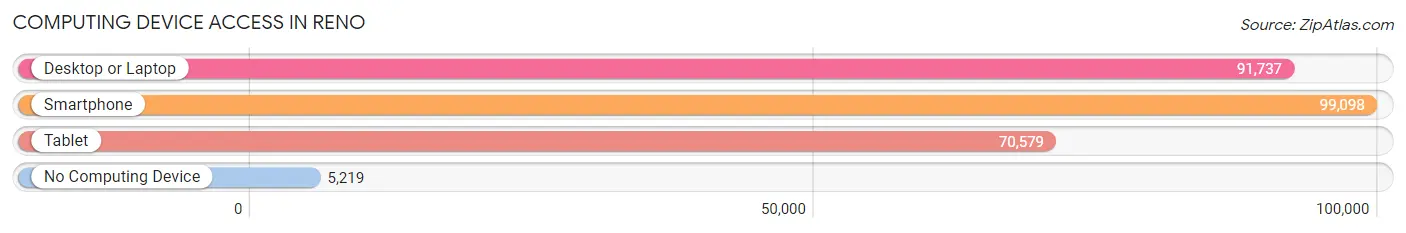
| Device Type | # Households | % Households |
| Desktop or Laptop | 91,737 | 83.0% |
| Smartphone | 99,098 | 89.7% |
| Tablet | 70,579 | 63.9% |
| No Computing Device | 5,219 | 4.7% |
| Total | 110,480 | 100.0% |
Internet Access in Reno
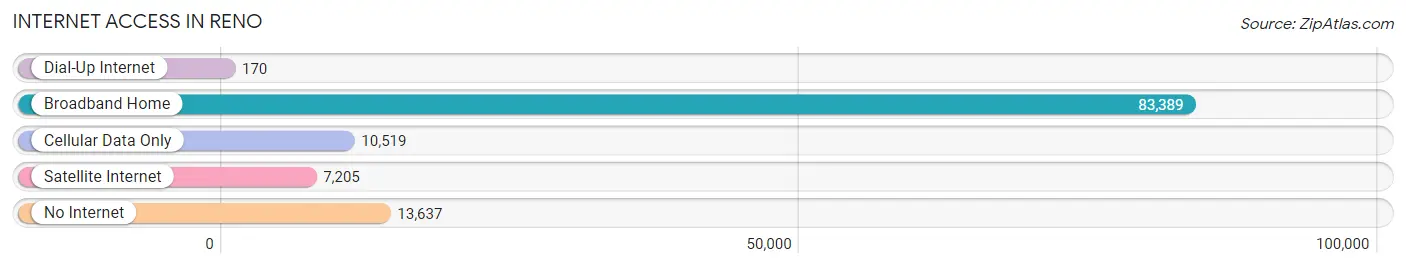
| Internet Type | # Households | % Households |
| Dial-Up Internet | 170 | 0.2% |
| Broadband Home | 83,389 | 75.5% |
| Cellular Data Only | 10,519 | 9.5% |
| Satellite Internet | 7,205 | 6.5% |
| No Internet | 13,637 | 12.3% |
| Total | 110,480 | 100.0% |
Reno Summary
Reno, Nevada is a city located in the western United States, in the state of Nevada. It is the county seat of Washoe County and is the second-largest city in the state, after Las Vegas. Reno is situated in a high desert at the foot of the Sierra Nevada mountain range, and is known for its casinos and vibrant nightlife. The city has a population of about 250,000 people, and is the fourth-largest metropolitan area in Nevada.
History
Reno was founded in 1868 by Myron C. Lake, a former Union Army officer. The city was named after Major General Jesse Lee Reno, a Union officer who was killed in the Civil War. Reno quickly became a popular destination for miners and ranchers, and the city was incorporated in 1903.
In the early 20th century, Reno became a popular destination for gamblers, and the city was known as the “Divorce Capital of the World” due to its lenient divorce laws. The city also became a popular destination for celebrities, including the likes of Frank Sinatra and Marilyn Monroe.
In the 1950s, Reno began to experience a decline in its gambling industry, as Las Vegas began to take over as the premier gambling destination in the United States. However, Reno was able to reinvent itself as a tourist destination, and the city began to experience a resurgence in the late 20th century.
Geography
Reno is located in the western United States, in the state of Nevada. It is situated in a high desert at the foot of the Sierra Nevada mountain range. The city is located at the intersection of Interstate 80 and U.S. Route 395, and is about 22 miles from Lake Tahoe.
The city has a total area of 101.2 square miles, of which 99.8 square miles is land and 1.4 square miles is water. Reno is located at an elevation of 4,505 feet above sea level.
Economy
Reno’s economy is largely based on tourism, gaming, and manufacturing. The city is home to several major casinos, including the Silver Legacy, the Eldorado, and the Peppermill. Reno is also home to several major manufacturing companies, including Tesla Motors, Apple, and Amazon.
The city is also home to the University of Nevada, Reno, which is the state’s flagship university. The university is a major employer in the city, and is a major contributor to the local economy.
Demographics
As of the 2010 census, Reno had a population of 225,221 people. The racial makeup of the city was 73.2% White, 8.2% African American, 1.2% Native American, 5.3% Asian, 0.3% Pacific Islander, and 11.0% from other races. Hispanic or Latino of any race were 22.8% of the population.
The median income for a household in Reno was $45,936, and the median income for a family was $54,845. The per capita income for the city was $25,845. About 13.2% of families and 17.2% of the population were below the poverty line, including 25.5% of those under age 18 and 8.3% of those age 65 or over.
Common Questions
What is Per Capita Income in Reno?
Per Capita income in Reno is $43,245.
What is the Median Family Income in Reno?
Median Family Income in Reno is $93,109.
What is the Median Household income in Reno?
Median Household Income in Reno is $73,073.
What is Income or Wage Gap in Reno?
Income or Wage Gap in Reno is 21.6%.
Women in Reno earn 78.4 cents for every dollar earned by a man.
What is Family Income Deficit in Reno?
Family Income Deficit in Reno is $10,787.
Families that are below poverty line in Reno earn $10,787 less on average than the poverty threshold level.
What is Inequality or Gini Index in Reno?
Inequality or Gini Index in Reno is 0.47.
What is the Total Population of Reno?
Total Population of Reno is 265,196.
What is the Total Male Population of Reno?
Total Male Population of Reno is 134,102.
What is the Total Female Population of Reno?
Total Female Population of Reno is 131,094.
What is the Ratio of Males per 100 Females in Reno?
There are 102.29 Males per 100 Females in Reno.
What is the Ratio of Females per 100 Males in Reno?
There are 97.76 Females per 100 Males in Reno.
What is the Median Population Age in Reno?
Median Population Age in Reno is 36.9 Years.
What is the Average Family Size in Reno
Average Family Size in Reno is 3.0 People.
What is the Average Household Size in Reno
Average Household Size in Reno is 2.4 People.
How Large is the Labor Force in Reno?
There are 147,831 People in the Labor Forcein in Reno.
What is the Percentage of People in the Labor Force in Reno?
67.6% of People are in the Labor Force in Reno.
What is the Unemployment Rate in Reno?
Unemployment Rate in Reno is 5.0%.