Covina, CA Map & Demographics
Covina Map
Covina Overview
$37,234
PER CAPITA INCOME
$104,750
AVG FAMILY INCOME
$89,650
AVG HOUSEHOLD INCOME
2.8%
WAGE / INCOME GAP [ % ]
97.2¢/ $1
WAGE / INCOME GAP [ $ ]
$9,584
FAMILY INCOME DEFICIT
0.41
INEQUALITY / GINI INDEX
50,717
TOTAL POPULATION
25,840
MALE POPULATION
24,877
FEMALE POPULATION
103.87
MALES / 100 FEMALES
96.27
FEMALES / 100 MALES
37.6
MEDIAN AGE
3.6
AVG FAMILY SIZE
3.1
AVG HOUSEHOLD SIZE
28,550
LABOR FORCE [ PEOPLE ]
69.4%
PERCENT IN LABOR FORCE
5.7%
UNEMPLOYMENT RATE
Income in Covina
Income Overview in Covina
Per Capita Income in Covina is $37,234, while median incomes of families and households are $104,750 and $89,650 respectively.
| Characteristic | Number | Measure |
| Per Capita Income | 50,717 | $37,234 |
| Median Family Income | 11,803 | $104,750 |
| Mean Family Income | 11,803 | $121,904 |
| Median Household Income | 16,313 | $89,650 |
| Mean Household Income | 16,313 | $113,143 |
| Income Deficit | 11,803 | $9,584 |
| Wage / Income Gap (%) | 50,717 | 2.77% |
| Wage / Income Gap ($) | 50,717 | 97.23¢ per $1 |
| Gini / Inequality Index | 50,717 | 0.41 |
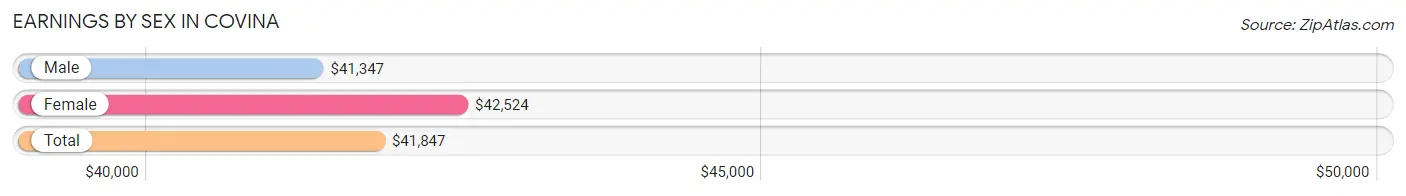
Earnings by Sex in Covina
Average Earnings in Covina are $41,847, $41,347 for men and $42,524 for women, a difference of 2.8%.
| Sex | Number | Average Earnings |
| Male | 15,664 (54.1%) | $41,347 |
| Female | 13,278 (45.9%) | $42,524 |
| Total | 28,942 (100.0%) | $41,847 |
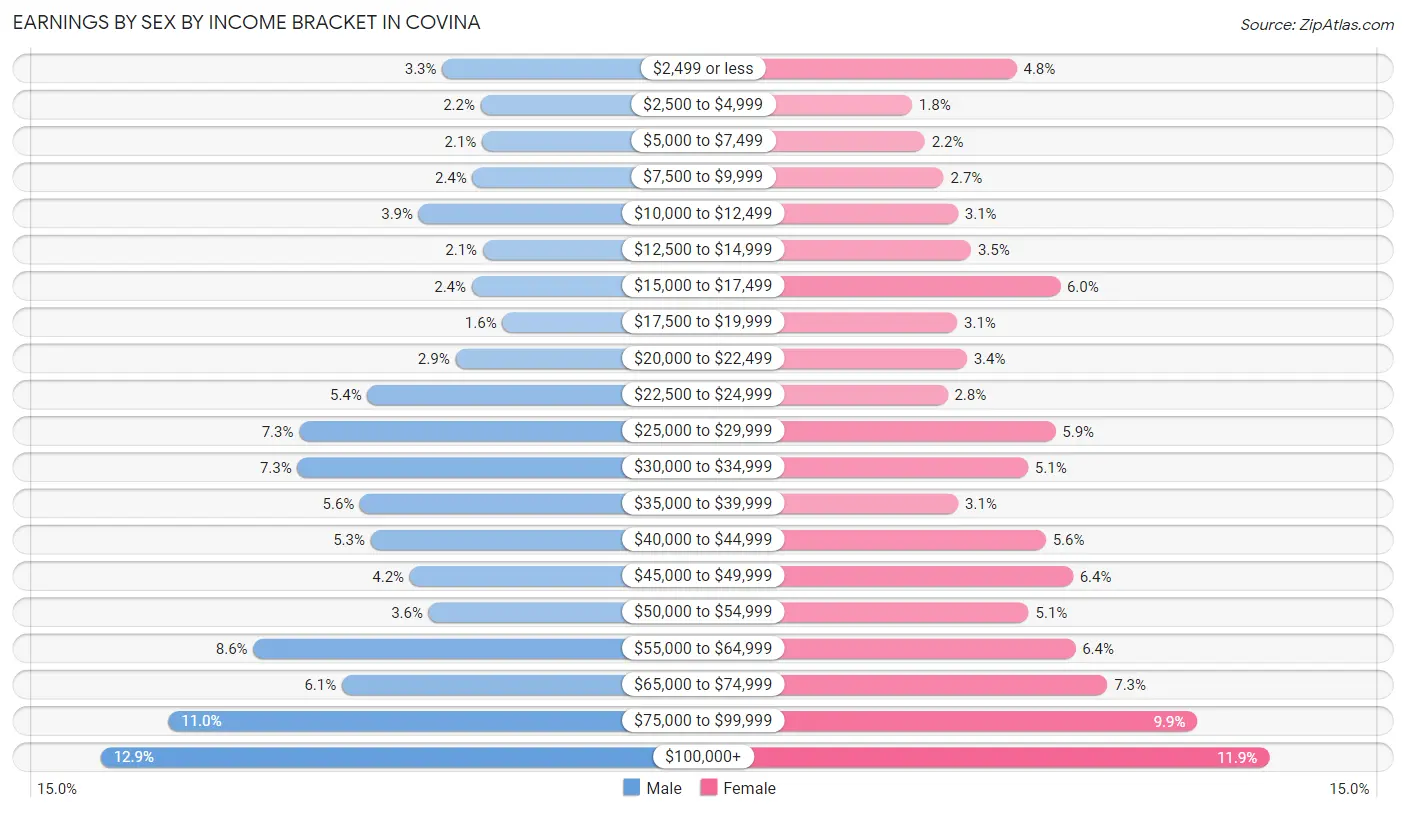
Earnings by Sex by Income Bracket in Covina
The most common earnings brackets in Covina are $100,000+ for men (2,015 | 12.9%) and $100,000+ for women (1,576 | 11.9%).
| Income | Male | Female |
| $2,499 or less | 511 (3.3%) | 633 (4.8%) |
| $2,500 to $4,999 | 341 (2.2%) | 243 (1.8%) |
| $5,000 to $7,499 | 335 (2.1%) | 291 (2.2%) |
| $7,500 to $9,999 | 377 (2.4%) | 361 (2.7%) |
| $10,000 to $12,499 | 614 (3.9%) | 414 (3.1%) |
| $12,500 to $14,999 | 332 (2.1%) | 463 (3.5%) |
| $15,000 to $17,499 | 380 (2.4%) | 795 (6.0%) |
| $17,500 to $19,999 | 246 (1.6%) | 412 (3.1%) |
| $20,000 to $22,499 | 452 (2.9%) | 448 (3.4%) |
| $22,500 to $24,999 | 840 (5.4%) | 376 (2.8%) |
| $25,000 to $29,999 | 1,141 (7.3%) | 778 (5.9%) |
| $30,000 to $34,999 | 1,148 (7.3%) | 676 (5.1%) |
| $35,000 to $39,999 | 872 (5.6%) | 415 (3.1%) |
| $40,000 to $44,999 | 826 (5.3%) | 742 (5.6%) |
| $45,000 to $49,999 | 653 (4.2%) | 843 (6.4%) |
| $50,000 to $54,999 | 570 (3.6%) | 679 (5.1%) |
| $55,000 to $64,999 | 1,343 (8.6%) | 853 (6.4%) |
| $65,000 to $74,999 | 952 (6.1%) | 972 (7.3%) |
| $75,000 to $99,999 | 1,716 (11.0%) | 1,308 (9.9%) |
| $100,000+ | 2,015 (12.9%) | 1,576 (11.9%) |
| Total | 15,664 (100.0%) | 13,278 (100.0%) |
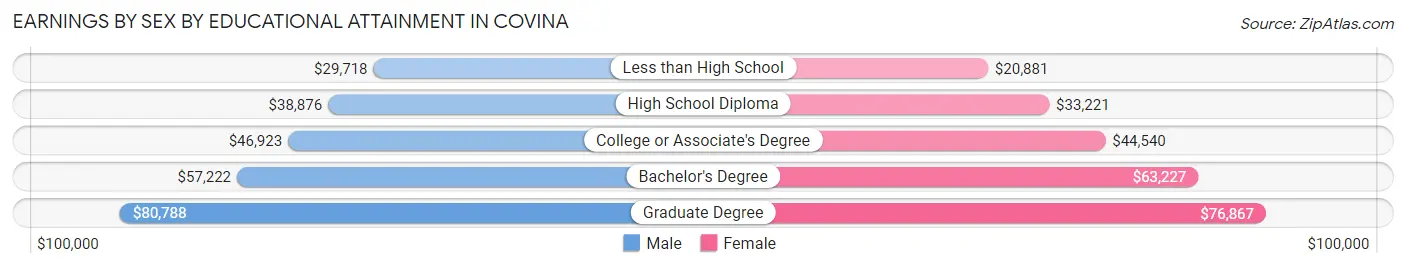
Earnings by Sex by Educational Attainment in Covina
Average earnings in Covina are $46,046 for men and $46,616 for women, a difference of 1.2%. Men with an educational attainment of graduate degree enjoy the highest average annual earnings of $80,788, while those with less than high school education earn the least with $29,718. Women with an educational attainment of graduate degree earn the most with the average annual earnings of $76,867, while those with less than high school education have the smallest earnings of $20,881.
| Educational Attainment | Male Income | Female Income |
| Less than High School | $29,718 | $20,881 |
| High School Diploma | $38,876 | $33,221 |
| College or Associate's Degree | $46,923 | $44,540 |
| Bachelor's Degree | $57,222 | $63,227 |
| Graduate Degree | $80,788 | $76,867 |
| Total | $46,046 | $46,616 |
Family Income in Covina
Family Income Brackets in Covina
According to the Covina family income data, there are 2,632 families falling into the $100,000 to $149,999 income range, which is the most common income bracket and makes up 22.3% of all families. Conversely, the $10,000 to $14,999 income bracket is the least frequent group with only 106 families (0.9%) belonging to this category.
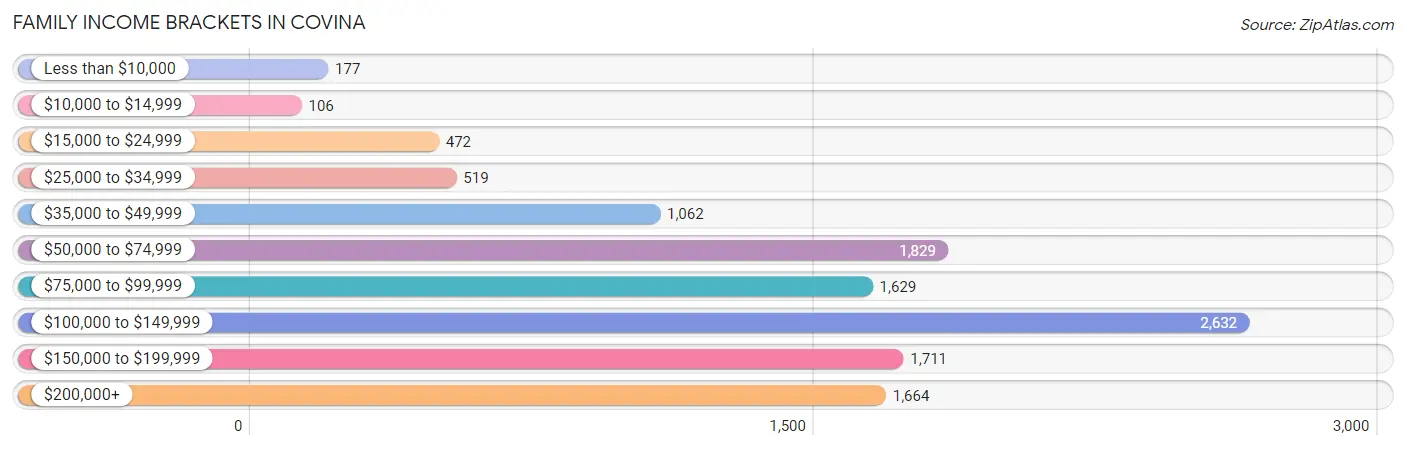
| Income Bracket | # Families | % Families |
| Less than $10,000 | 177 | 1.5% |
| $10,000 to $14,999 | 106 | 0.9% |
| $15,000 to $24,999 | 472 | 4.0% |
| $25,000 to $34,999 | 519 | 4.4% |
| $35,000 to $49,999 | 1,062 | 9.0% |
| $50,000 to $74,999 | 1,829 | 15.5% |
| $75,000 to $99,999 | 1,629 | 13.8% |
| $100,000 to $149,999 | 2,632 | 22.3% |
| $150,000 to $199,999 | 1,711 | 14.5% |
| $200,000+ | 1,664 | 14.1% |
Family Income by Famaliy Size in Covina
7+ person families (440 | 3.7%) account for the highest median family income in Covina with $200,227 per family, while 2-person families (4,097 | 34.7%) have the highest median income of $40,756 per family member.
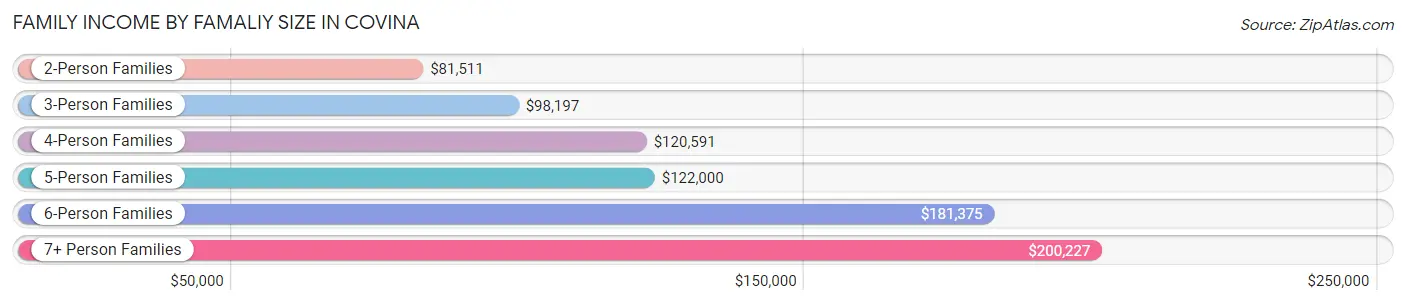
| Income Bracket | # Families | Median Income |
| 2-Person Families | 4,097 (34.7%) | $81,511 |
| 3-Person Families | 2,657 (22.5%) | $98,197 |
| 4-Person Families | 2,526 (21.4%) | $120,591 |
| 5-Person Families | 1,536 (13.0%) | $122,000 |
| 6-Person Families | 547 (4.6%) | $181,375 |
| 7+ Person Families | 440 (3.7%) | $200,227 |
| Total | 11,803 (100.0%) | $104,750 |
Family Income by Number of Earners in Covina
The median family income in Covina is $104,750, with families comprising 3+ earners (2,856) having the highest median family income of $165,833, while families with no earners (1,095) have the lowest median family income of $56,131, accounting for 24.2% and 9.3% of families, respectively.
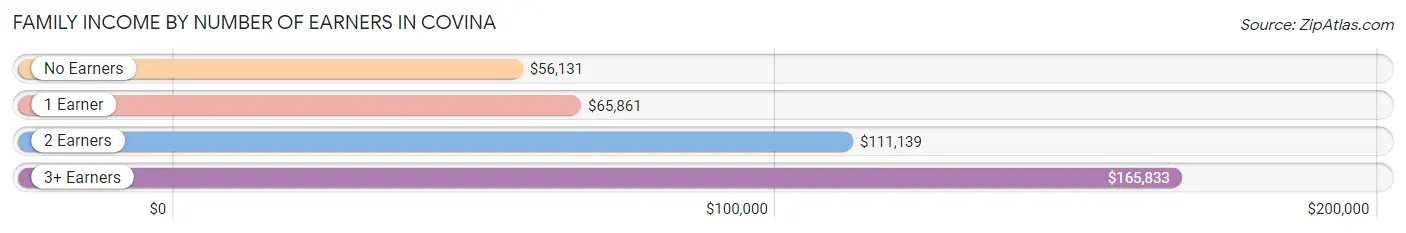
| Number of Earners | # Families | Median Income |
| No Earners | 1,095 (9.3%) | $56,131 |
| 1 Earner | 2,834 (24.0%) | $65,861 |
| 2 Earners | 5,018 (42.5%) | $111,139 |
| 3+ Earners | 2,856 (24.2%) | $165,833 |
| Total | 11,803 (100.0%) | $104,750 |
Household Income in Covina
Household Income Brackets in Covina
With 3,099 households falling in the category, the $100,000 to $149,999 income range is the most frequent in Covina, accounting for 19.0% of all households. In contrast, only 343 households (2.1%) fall into the $10,000 to $14,999 income bracket, making it the least populous group.
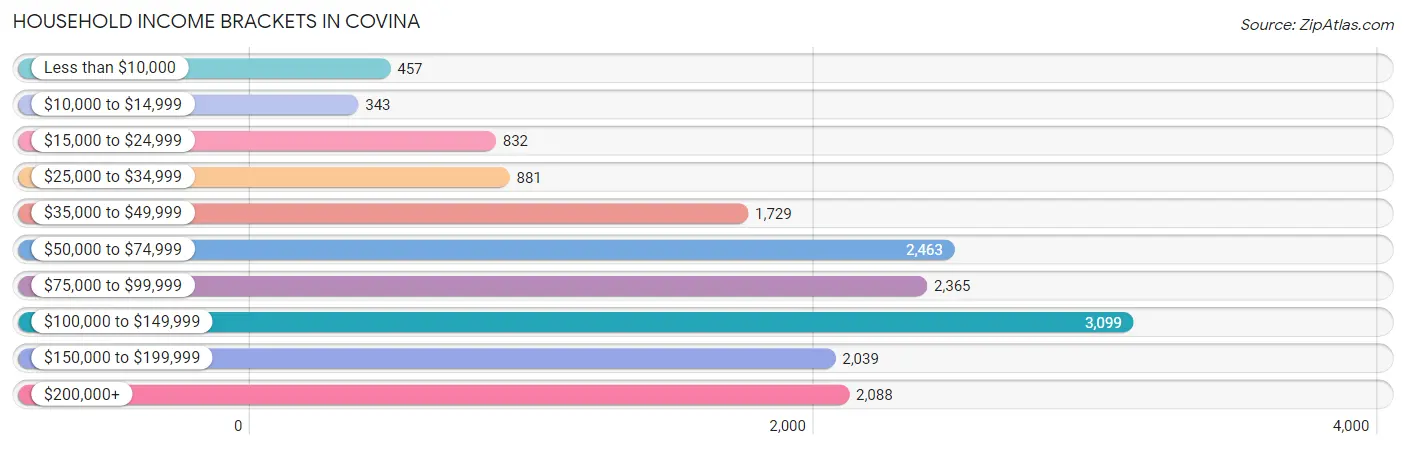
| Income Bracket | # Households | % Households |
| Less than $10,000 | 457 | 2.8% |
| $10,000 to $14,999 | 343 | 2.1% |
| $15,000 to $24,999 | 832 | 5.1% |
| $25,000 to $34,999 | 881 | 5.4% |
| $35,000 to $49,999 | 1,729 | 10.6% |
| $50,000 to $74,999 | 2,463 | 15.1% |
| $75,000 to $99,999 | 2,365 | 14.5% |
| $100,000 to $149,999 | 3,099 | 19.0% |
| $150,000 to $199,999 | 2,039 | 12.5% |
| $200,000+ | 2,088 | 12.8% |
Household Income by Householder Age in Covina
The median household income in Covina is $89,650, with the highest median household income of $106,754 found in the 45 to 64 years age bracket for the primary householder. A total of 6,840 households (41.9%) fall into this category. Meanwhile, the 65+ years age bracket for the primary householder has the lowest median household income of $65,759, with 3,740 households (22.9%) in this group.
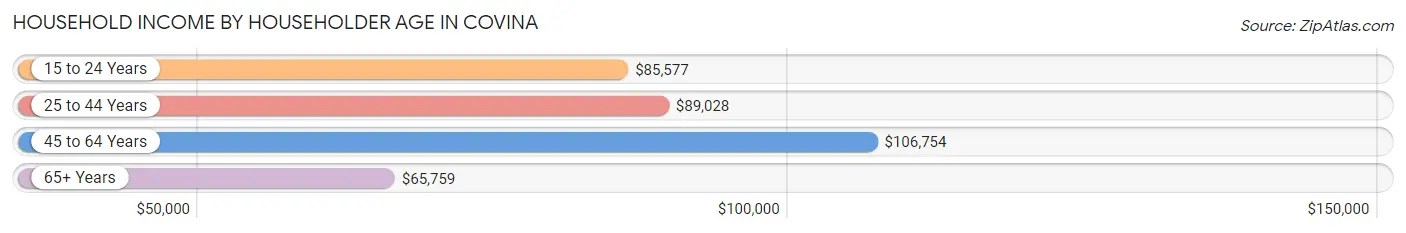
| Income Bracket | # Households | Median Income |
| 15 to 24 Years | 228 (1.4%) | $85,577 |
| 25 to 44 Years | 5,505 (33.8%) | $89,028 |
| 45 to 64 Years | 6,840 (41.9%) | $106,754 |
| 65+ Years | 3,740 (22.9%) | $65,759 |
| Total | 16,313 (100.0%) | $89,650 |
Poverty in Covina
Income Below Poverty by Sex and Age in Covina
With 6.9% poverty level for males and 8.6% for females among the residents of Covina, 5 year old males and 18 to 24 year old females are the most vulnerable to poverty, with 80 males (20.8%) and 296 females (14.5%) in their respective age groups living below the poverty level.
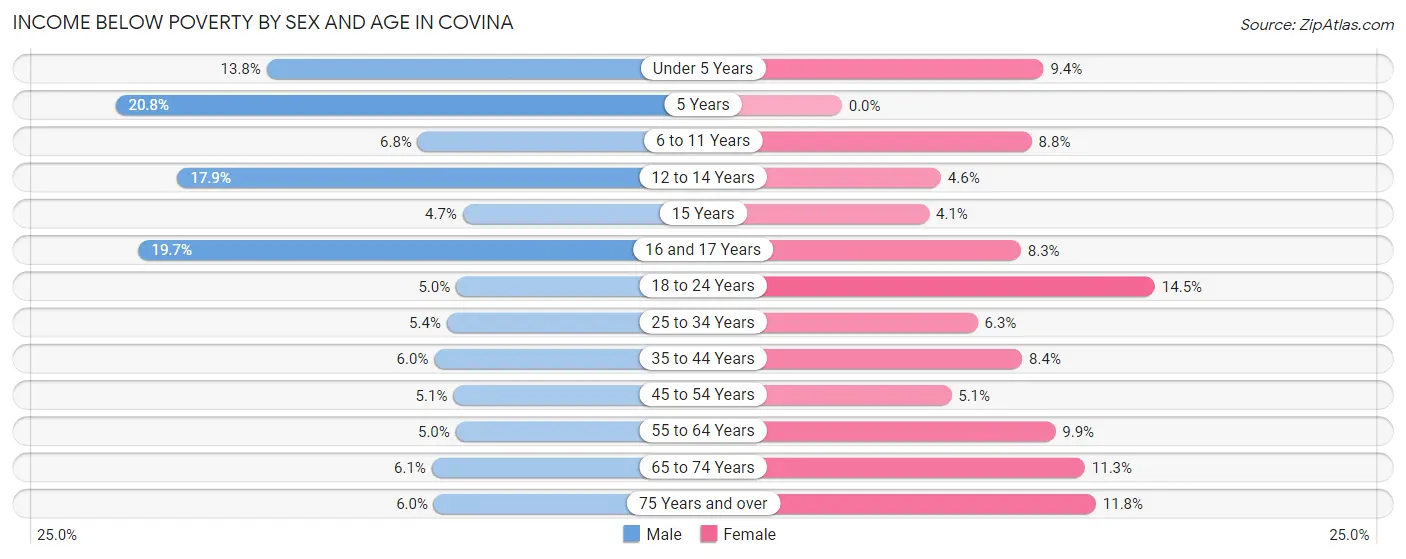
| Age Bracket | Male | Female |
| Under 5 Years | 181 (13.8%) | 132 (9.4%) |
| 5 Years | 80 (20.8%) | 0 (0.0%) |
| 6 to 11 Years | 129 (6.8%) | 143 (8.8%) |
| 12 to 14 Years | 147 (17.9%) | 42 (4.6%) |
| 15 Years | 23 (4.7%) | 20 (4.1%) |
| 16 and 17 Years | 95 (19.7%) | 49 (8.3%) |
| 18 to 24 Years | 131 (5.0%) | 296 (14.5%) |
| 25 to 34 Years | 238 (5.4%) | 218 (6.3%) |
| 35 to 44 Years | 222 (6.0%) | 324 (8.4%) |
| 45 to 54 Years | 178 (5.1%) | 168 (5.1%) |
| 55 to 64 Years | 150 (5.0%) | 335 (9.9%) |
| 65 to 74 Years | 108 (6.1%) | 203 (11.3%) |
| 75 Years and over | 78 (6.0%) | 193 (11.8%) |
| Total | 1,760 (6.9%) | 2,123 (8.6%) |
Income Above Poverty by Sex and Age in Covina
According to the poverty statistics in Covina, males aged 15 years and females aged 5 years are the age groups that are most secure financially, with 95.3% of males and 100.0% of females in these age groups living above the poverty line.
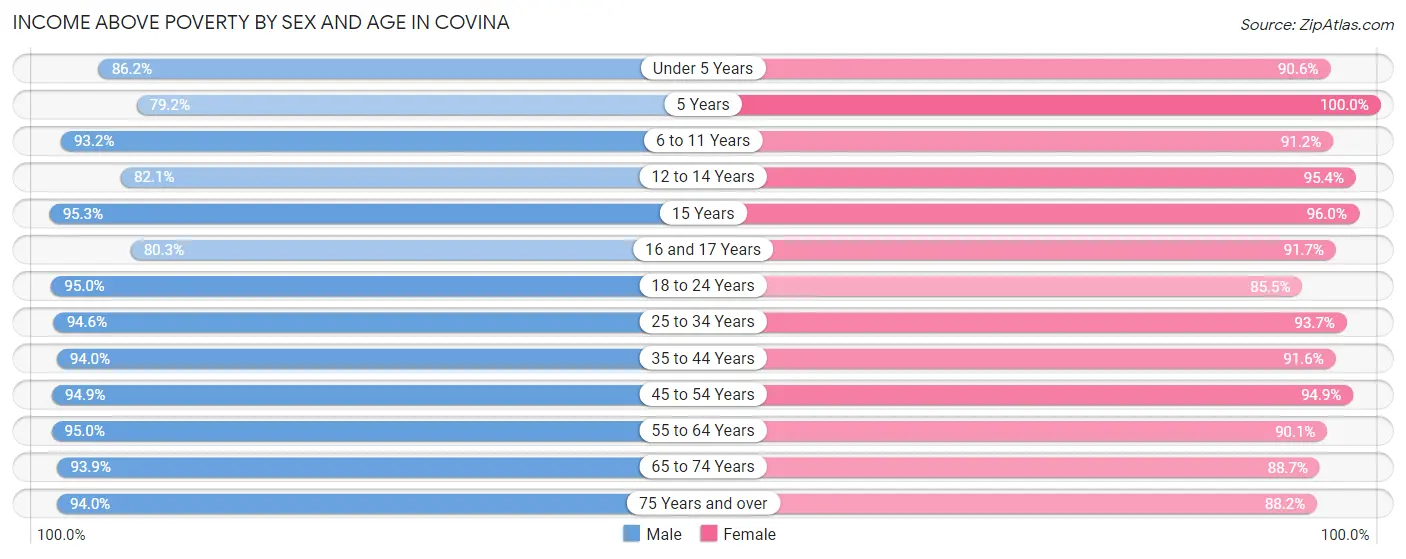
| Age Bracket | Male | Female |
| Under 5 Years | 1,133 (86.2%) | 1,278 (90.6%) |
| 5 Years | 305 (79.2%) | 159 (100.0%) |
| 6 to 11 Years | 1,780 (93.2%) | 1,481 (91.2%) |
| 12 to 14 Years | 674 (82.1%) | 871 (95.4%) |
| 15 Years | 470 (95.3%) | 474 (96.0%) |
| 16 and 17 Years | 387 (80.3%) | 541 (91.7%) |
| 18 to 24 Years | 2,501 (95.0%) | 1,741 (85.5%) |
| 25 to 34 Years | 4,165 (94.6%) | 3,243 (93.7%) |
| 35 to 44 Years | 3,484 (94.0%) | 3,548 (91.6%) |
| 45 to 54 Years | 3,305 (94.9%) | 3,139 (94.9%) |
| 55 to 64 Years | 2,849 (95.0%) | 3,044 (90.1%) |
| 65 to 74 Years | 1,660 (93.9%) | 1,597 (88.7%) |
| 75 Years and over | 1,220 (94.0%) | 1,444 (88.2%) |
| Total | 23,933 (93.1%) | 22,560 (91.4%) |
Income Below Poverty Among Married-Couple Families in Covina
The poverty statistics for married-couple families in Covina show that 1.9% or 147 of the total 7,858 families live below the poverty line. Families with 3 or 4 children have the highest poverty rate of 2.8%, comprising of 15 families. On the other hand, families with 5 or more children have the lowest poverty rate of 0.0%, which includes 0 families.
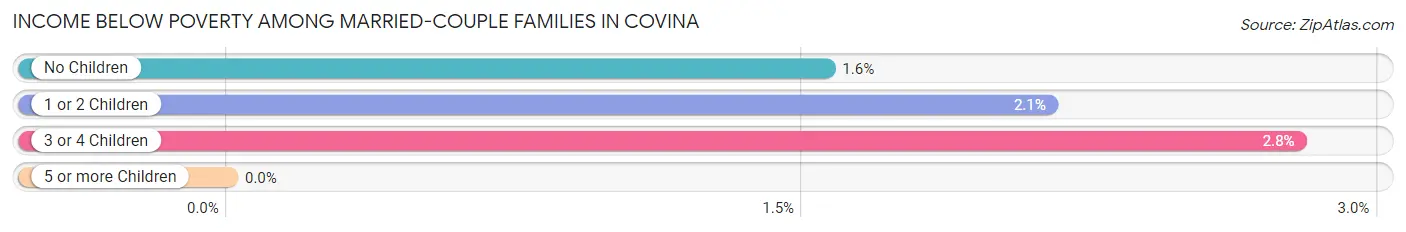
| Children | Above Poverty | Below Poverty |
| No Children | 4,102 (98.4%) | 65 (1.6%) |
| 1 or 2 Children | 3,062 (97.9%) | 67 (2.1%) |
| 3 or 4 Children | 523 (97.2%) | 15 (2.8%) |
| 5 or more Children | 24 (100.0%) | 0 (0.0%) |
| Total | 7,711 (98.1%) | 147 (1.9%) |
Income Below Poverty Among Single-Parent Households in Covina
According to the poverty data in Covina, 12.1% or 168 single-father households and 11.6% or 296 single-mother households are living below the poverty line. Among single-father households, those with 5 or more children have the highest poverty rate, with 21 households (100.0%) experiencing poverty. Likewise, among single-mother households, those with 5 or more children have the highest poverty rate, with 26 households (100.0%) falling below the poverty line.
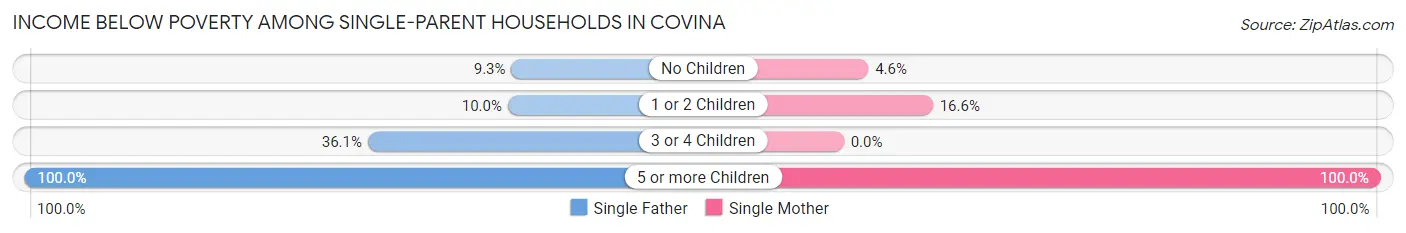
| Children | Single Father | Single Mother |
| No Children | 81 (9.3%) | 51 (4.6%) |
| 1 or 2 Children | 44 (10.0%) | 219 (16.6%) |
| 3 or 4 Children | 22 (36.1%) | 0 (0.0%) |
| 5 or more Children | 21 (100.0%) | 26 (100.0%) |
| Total | 168 (12.1%) | 296 (11.6%) |
Income Below Poverty Among Married-Couple vs Single-Parent Households in Covina
The poverty data for Covina shows that 147 of the married-couple family households (1.9%) and 464 of the single-parent households (11.8%) are living below the poverty level. Within the married-couple family households, those with 3 or 4 children have the highest poverty rate, with 15 households (2.8%) falling below the poverty line. Among the single-parent households, those with 5 or more children have the highest poverty rate, with 47 household (100.0%) living below poverty.
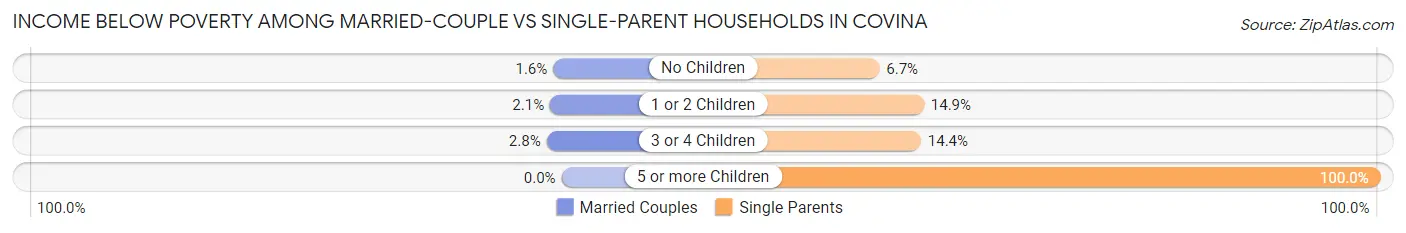
| Children | Married-Couple Families | Single-Parent Households |
| No Children | 65 (1.6%) | 132 (6.7%) |
| 1 or 2 Children | 67 (2.1%) | 263 (14.9%) |
| 3 or 4 Children | 15 (2.8%) | 22 (14.4%) |
| 5 or more Children | 0 (0.0%) | 47 (100.0%) |
| Total | 147 (1.9%) | 464 (11.8%) |
Race in Covina
The most populous races in Covina are Hispanic or Latino (31,320 | 61.8%), White / Caucasian (20,727 | 40.9%), and Some other Race (11,120 | 21.9%).
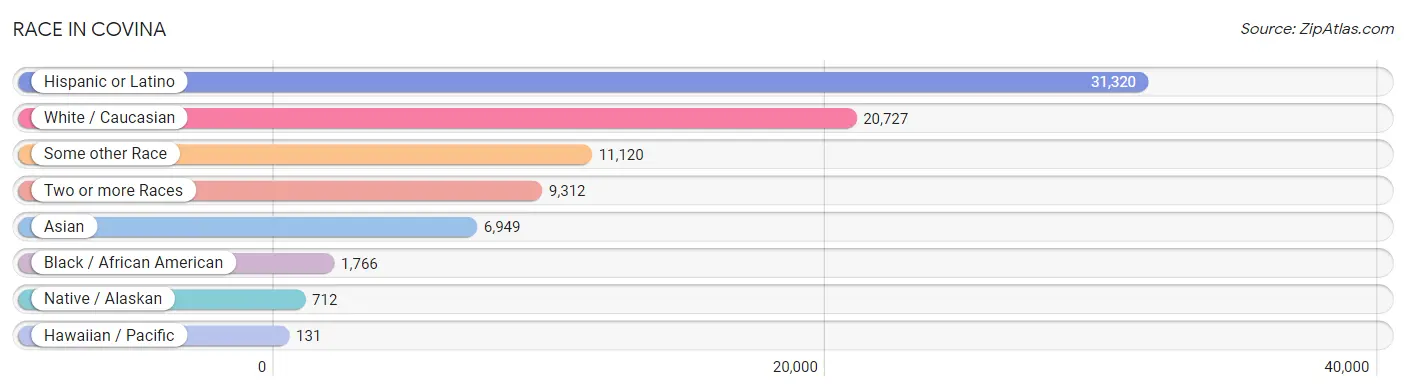
| Race | # Population | % Population |
| Asian | 6,949 | 13.7% |
| Black / African American | 1,766 | 3.5% |
| Hawaiian / Pacific | 131 | 0.3% |
| Hispanic or Latino | 31,320 | 61.8% |
| Native / Alaskan | 712 | 1.4% |
| White / Caucasian | 20,727 | 40.9% |
| Two or more Races | 9,312 | 18.4% |
| Some other Race | 11,120 | 21.9% |
| Total | 50,717 | 100.0% |
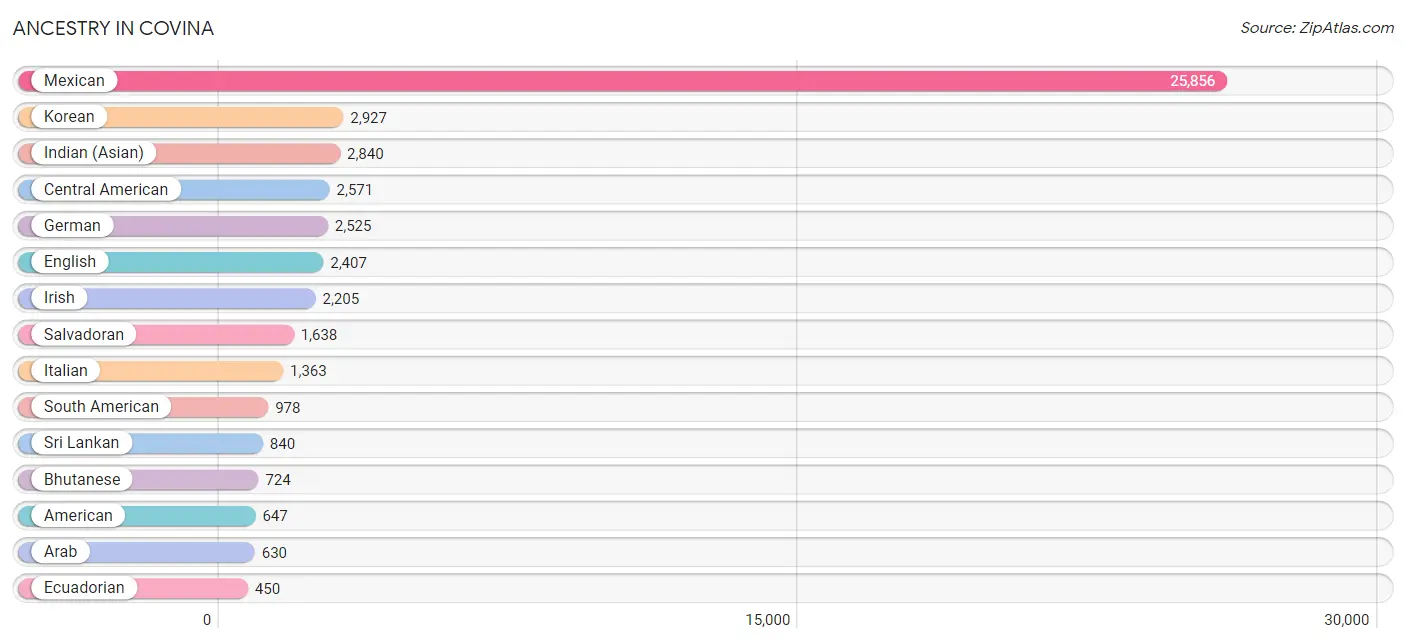
Ancestry in Covina
The most populous ancestries reported in Covina are Mexican (25,856 | 51.0%), Korean (2,927 | 5.8%), Indian (Asian) (2,840 | 5.6%), Central American (2,571 | 5.1%), and German (2,525 | 5.0%), together accounting for 72.4% of all Covina residents.
| Ancestry | # Population | % Population |
| African | 109 | 0.2% |
| American | 647 | 1.3% |
| Apache | 43 | 0.1% |
| Arab | 630 | 1.2% |
| Argentinean | 38 | 0.1% |
| Armenian | 44 | 0.1% |
| Austrian | 33 | 0.1% |
| Basque | 54 | 0.1% |
| Bhutanese | 724 | 1.4% |
| Blackfeet | 9 | 0.0% |
| Bolivian | 21 | 0.0% |
| Brazilian | 56 | 0.1% |
| British | 56 | 0.1% |
| British West Indian | 46 | 0.1% |
| Burmese | 173 | 0.3% |
| Cajun | 8 | 0.0% |
| Canadian | 14 | 0.0% |
| Celtic | 12 | 0.0% |
| Central American | 2,571 | 5.1% |
| Central American Indian | 126 | 0.3% |
| Cherokee | 163 | 0.3% |
| Chilean | 17 | 0.0% |
| Colombian | 165 | 0.3% |
| Costa Rican | 56 | 0.1% |
| Croatian | 35 | 0.1% |
| Cuban | 361 | 0.7% |
| Czechoslovakian | 12 | 0.0% |
| Danish | 283 | 0.6% |
| Dominican | 25 | 0.1% |
| Dutch | 380 | 0.7% |
| Eastern European | 40 | 0.1% |
| Ecuadorian | 450 | 0.9% |
| Egyptian | 193 | 0.4% |
| English | 2,407 | 4.8% |
| Ethiopian | 32 | 0.1% |
| European | 336 | 0.7% |
| Filipino | 164 | 0.3% |
| Finnish | 6 | 0.0% |
| French | 407 | 0.8% |
| French Canadian | 34 | 0.1% |
| German | 2,525 | 5.0% |
| Greek | 11 | 0.0% |
| Guatemalan | 341 | 0.7% |
| Haitian | 7 | 0.0% |
| Honduran | 47 | 0.1% |
| Hungarian | 41 | 0.1% |
| Indian (Asian) | 2,840 | 5.6% |
| Indonesian | 218 | 0.4% |
| Iranian | 11 | 0.0% |
| Irish | 2,205 | 4.3% |
| Italian | 1,363 | 2.7% |
| Jamaican | 27 | 0.1% |
| Japanese | 147 | 0.3% |
| Jordanian | 37 | 0.1% |
| Kenyan | 33 | 0.1% |
| Korean | 2,927 | 5.8% |
| Laotian | 270 | 0.5% |
| Lebanese | 202 | 0.4% |
| Macedonian | 5 | 0.0% |
| Malaysian | 23 | 0.1% |
| Mexican | 25,856 | 51.0% |
| Mexican American Indian | 362 | 0.7% |
| Mongolian | 14 | 0.0% |
| Native Hawaiian | 127 | 0.3% |
| Navajo | 229 | 0.4% |
| Nicaraguan | 360 | 0.7% |
| Nigerian | 51 | 0.1% |
| Norwegian | 370 | 0.7% |
| Pakistani | 108 | 0.2% |
| Palestinian | 55 | 0.1% |
| Panamanian | 79 | 0.2% |
| Paraguayan | 12 | 0.0% |
| Pennsylvania German | 21 | 0.0% |
| Peruvian | 275 | 0.5% |
| Polish | 284 | 0.6% |
| Portuguese | 143 | 0.3% |
| Puerto Rican | 259 | 0.5% |
| Russian | 222 | 0.4% |
| Salvadoran | 1,638 | 3.2% |
| Samoan | 139 | 0.3% |
| Scandinavian | 71 | 0.1% |
| Scotch-Irish | 161 | 0.3% |
| Scottish | 359 | 0.7% |
| Seminole | 9 | 0.0% |
| Slovak | 6 | 0.0% |
| South American | 978 | 1.9% |
| Spaniard | 322 | 0.6% |
| Spanish | 198 | 0.4% |
| Spanish American Indian | 30 | 0.1% |
| Sri Lankan | 840 | 1.7% |
| Subsaharan African | 225 | 0.4% |
| Swedish | 210 | 0.4% |
| Swiss | 17 | 0.0% |
| Syrian | 16 | 0.0% |
| Thai | 152 | 0.3% |
| Turkish | 24 | 0.1% |
| Ukrainian | 36 | 0.1% |
| Vietnamese | 16 | 0.0% |
| Welsh | 108 | 0.2% |
| Yaqui | 56 | 0.1% | View All 100 Rows |
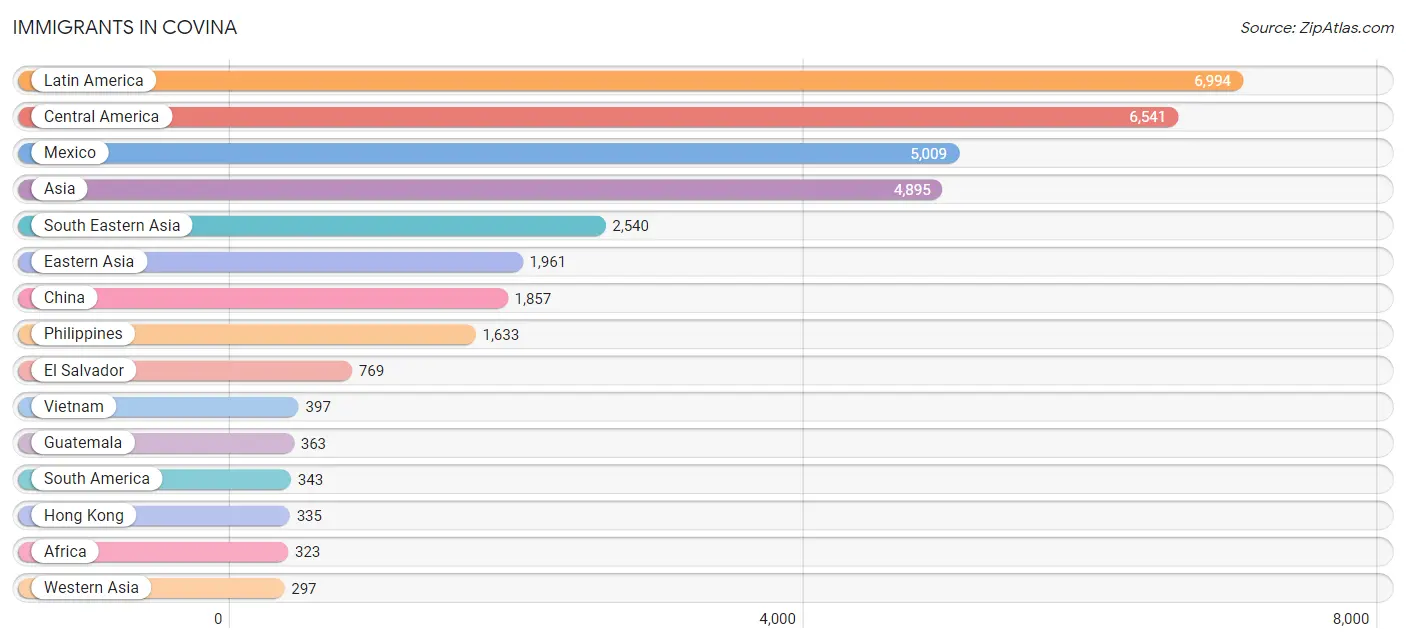
Immigrants in Covina
The most numerous immigrant groups reported in Covina came from Latin America (6,994 | 13.8%), Central America (6,541 | 12.9%), Mexico (5,009 | 9.9%), Asia (4,895 | 9.7%), and South Eastern Asia (2,540 | 5.0%), together accounting for 51.2% of all Covina residents.
| Immigration Origin | # Population | % Population |
| Africa | 323 | 0.6% |
| Armenia | 65 | 0.1% |
| Asia | 4,895 | 9.7% |
| Bangladesh | 10 | 0.0% |
| Bolivia | 8 | 0.0% |
| Brazil | 69 | 0.1% |
| Cambodia | 25 | 0.1% |
| Canada | 33 | 0.1% |
| Caribbean | 110 | 0.2% |
| Central America | 6,541 | 12.9% |
| Chile | 17 | 0.0% |
| China | 1,857 | 3.7% |
| Colombia | 85 | 0.2% |
| Costa Rica | 53 | 0.1% |
| Cuba | 88 | 0.2% |
| Czechoslovakia | 6 | 0.0% |
| Denmark | 11 | 0.0% |
| Eastern Africa | 61 | 0.1% |
| Eastern Asia | 1,961 | 3.9% |
| Eastern Europe | 75 | 0.2% |
| Ecuador | 59 | 0.1% |
| Egypt | 113 | 0.2% |
| El Salvador | 769 | 1.5% |
| England | 8 | 0.0% |
| Ethiopia | 20 | 0.0% |
| Europe | 223 | 0.4% |
| Germany | 9 | 0.0% |
| Greece | 5 | 0.0% |
| Guatemala | 363 | 0.7% |
| Guyana | 8 | 0.0% |
| Haiti | 7 | 0.0% |
| Honduras | 8 | 0.0% |
| Hong Kong | 335 | 0.7% |
| India | 24 | 0.1% |
| Indonesia | 164 | 0.3% |
| Iran | 30 | 0.1% |
| Italy | 8 | 0.0% |
| Jamaica | 15 | 0.0% |
| Japan | 58 | 0.1% |
| Jordan | 11 | 0.0% |
| Kenya | 41 | 0.1% |
| Korea | 46 | 0.1% |
| Laos | 5 | 0.0% |
| Latin America | 6,994 | 13.8% |
| Lebanon | 95 | 0.2% |
| Mexico | 5,009 | 9.9% |
| Netherlands | 30 | 0.1% |
| Nicaragua | 212 | 0.4% |
| Nigeria | 35 | 0.1% |
| Northern Africa | 113 | 0.2% |
| Northern Europe | 76 | 0.2% |
| Pakistan | 16 | 0.0% |
| Panama | 32 | 0.1% |
| Peru | 97 | 0.2% |
| Philippines | 1,633 | 3.2% |
| Poland | 11 | 0.0% |
| Russia | 26 | 0.1% |
| South America | 343 | 0.7% |
| South Central Asia | 97 | 0.2% |
| South Eastern Asia | 2,540 | 5.0% |
| Southern Europe | 33 | 0.1% |
| Spain | 20 | 0.0% |
| Sri Lanka | 17 | 0.0% |
| Syria | 115 | 0.2% |
| Taiwan | 205 | 0.4% |
| Thailand | 94 | 0.2% |
| Turkey | 11 | 0.0% |
| Ukraine | 32 | 0.1% |
| Vietnam | 397 | 0.8% |
| Western Africa | 35 | 0.1% |
| Western Asia | 297 | 0.6% |
| Western Europe | 39 | 0.1% | View All 72 Rows |
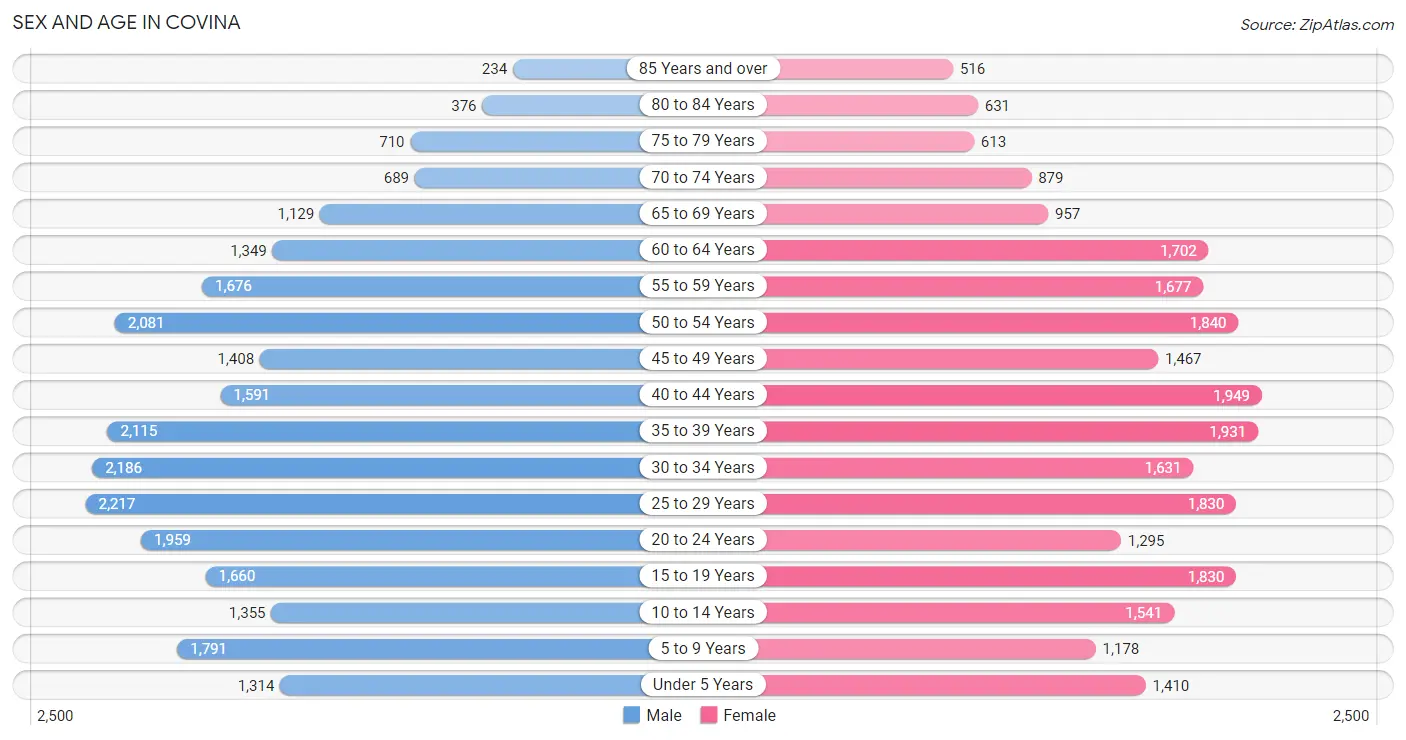
Sex and Age in Covina
Sex and Age in Covina
The most populous age groups in Covina are 25 to 29 Years (2,217 | 8.6%) for men and 40 to 44 Years (1,949 | 7.8%) for women.
| Age Bracket | Male | Female |
| Under 5 Years | 1,314 (5.1%) | 1,410 (5.7%) |
| 5 to 9 Years | 1,791 (6.9%) | 1,178 (4.7%) |
| 10 to 14 Years | 1,355 (5.2%) | 1,541 (6.2%) |
| 15 to 19 Years | 1,660 (6.4%) | 1,830 (7.4%) |
| 20 to 24 Years | 1,959 (7.6%) | 1,295 (5.2%) |
| 25 to 29 Years | 2,217 (8.6%) | 1,830 (7.4%) |
| 30 to 34 Years | 2,186 (8.5%) | 1,631 (6.6%) |
| 35 to 39 Years | 2,115 (8.2%) | 1,931 (7.8%) |
| 40 to 44 Years | 1,591 (6.2%) | 1,949 (7.8%) |
| 45 to 49 Years | 1,408 (5.4%) | 1,467 (5.9%) |
| 50 to 54 Years | 2,081 (8.1%) | 1,840 (7.4%) |
| 55 to 59 Years | 1,676 (6.5%) | 1,677 (6.7%) |
| 60 to 64 Years | 1,349 (5.2%) | 1,702 (6.8%) |
| 65 to 69 Years | 1,129 (4.4%) | 957 (3.8%) |
| 70 to 74 Years | 689 (2.7%) | 879 (3.5%) |
| 75 to 79 Years | 710 (2.8%) | 613 (2.5%) |
| 80 to 84 Years | 376 (1.5%) | 631 (2.5%) |
| 85 Years and over | 234 (0.9%) | 516 (2.1%) |
| Total | 25,840 (100.0%) | 24,877 (100.0%) |
Families and Households in Covina
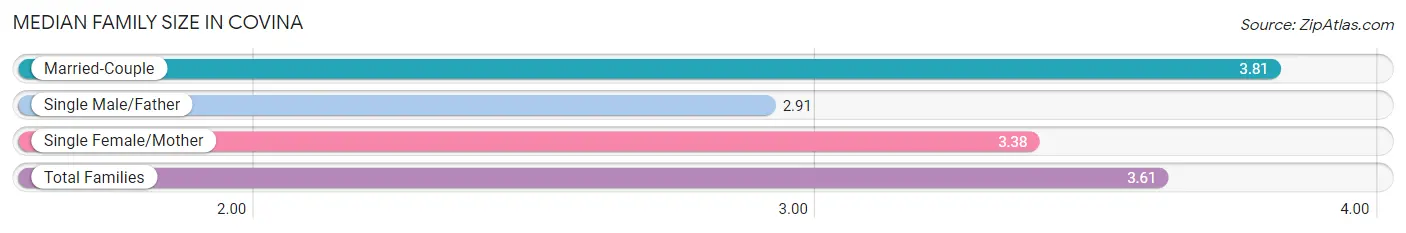
Median Family Size in Covina
The median family size in Covina is 3.61 persons per family, with married-couple families (7,858 | 66.6%) accounting for the largest median family size of 3.81 persons per family. On the other hand, single male/father families (1,390 | 11.8%) represent the smallest median family size with 2.91 persons per family.
| Family Type | # Families | Family Size |
| Married-Couple | 7,858 (66.6%) | 3.81 |
| Single Male/Father | 1,390 (11.8%) | 2.91 |
| Single Female/Mother | 2,555 (21.6%) | 3.38 |
| Total Families | 11,803 (100.0%) | 3.61 |
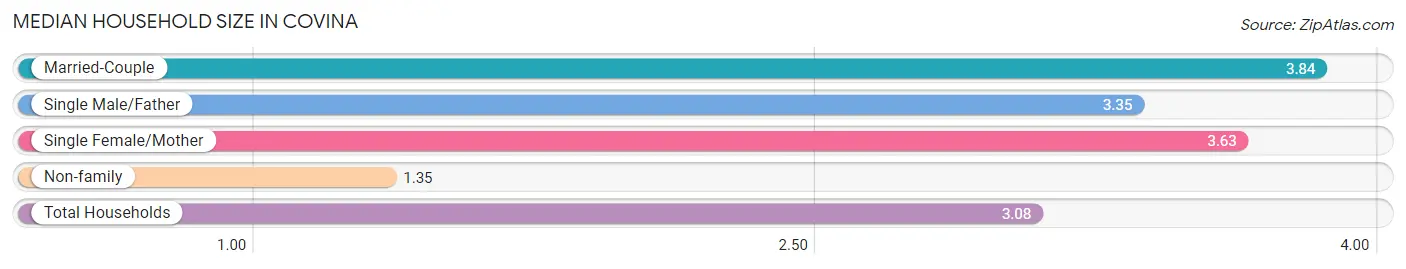
Median Household Size in Covina
The median household size in Covina is 3.08 persons per household, with married-couple households (7,858 | 48.2%) accounting for the largest median household size of 3.84 persons per household. non-family households (4,510 | 27.7%) represent the smallest median household size with 1.35 persons per household.
| Household Type | # Households | Household Size |
| Married-Couple | 7,858 (48.2%) | 3.84 |
| Single Male/Father | 1,390 (8.5%) | 3.35 |
| Single Female/Mother | 2,555 (15.7%) | 3.63 |
| Non-family | 4,510 (27.7%) | 1.35 |
| Total Households | 16,313 (100.0%) | 3.08 |
Household Size by Marriage Status in Covina
Out of a total of 16,313 households in Covina, 11,803 (72.4%) are family households, while 4,510 (27.7%) are nonfamily households. The most numerous type of family households are 2-person households, comprising 3,519, and the most common type of nonfamily households are 1-person households, comprising 3,476.
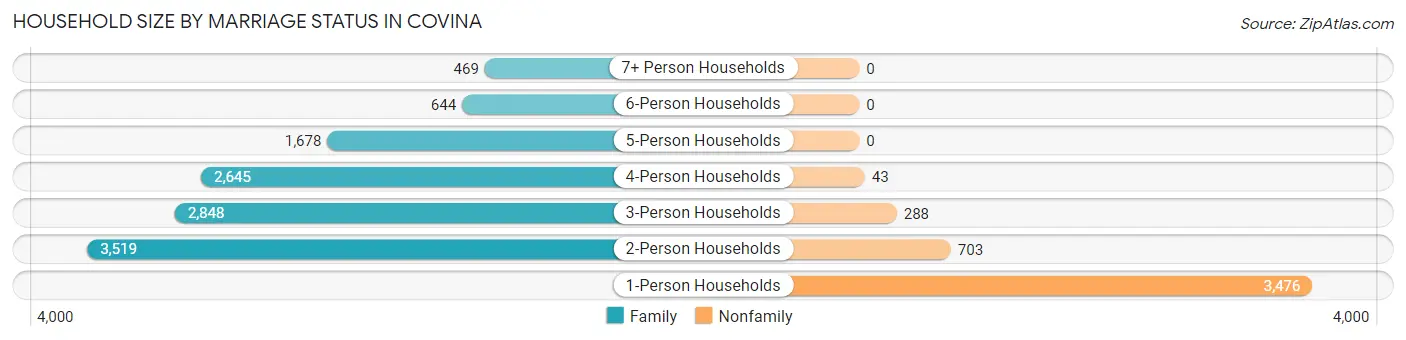
| Household Size | Family Households | Nonfamily Households |
| 1-Person Households | - | 3,476 (21.3%) |
| 2-Person Households | 3,519 (21.6%) | 703 (4.3%) |
| 3-Person Households | 2,848 (17.5%) | 288 (1.8%) |
| 4-Person Households | 2,645 (16.2%) | 43 (0.3%) |
| 5-Person Households | 1,678 (10.3%) | 0 (0.0%) |
| 6-Person Households | 644 (4.0%) | 0 (0.0%) |
| 7+ Person Households | 469 (2.9%) | 0 (0.0%) |
| Total | 11,803 (72.4%) | 4,510 (27.7%) |
Female Fertility in Covina
Fertility by Age in Covina
Average fertility rate in Covina is 53.0 births per 1,000 women. Women in the age bracket of 20 to 34 years have the highest fertility rate with 115.0 births per 1,000 women. Women in the age bracket of 20 to 34 years acount for 83.5% of all women with births.
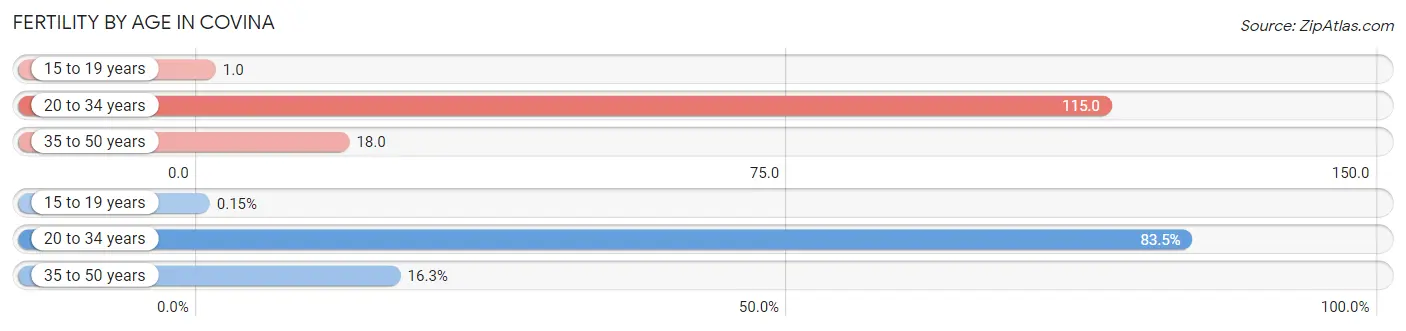
| Age Bracket | Women with Births | Births / 1,000 Women |
| 15 to 19 years | 1 (0.2%) | 1.0 |
| 20 to 34 years | 547 (83.5%) | 115.0 |
| 35 to 50 years | 107 (16.3%) | 18.0 |
| Total | 655 (100.0%) | 53.0 |
Fertility by Age by Marriage Status in Covina
75.0% of women with births (655) in Covina are married. The highest percentage of unmarried women with births falls into 15 to 19 years age bracket with 100.0% of them unmarried at the time of birth, while the lowest percentage of unmarried women with births belong to 35 to 50 years age bracket with 19.6% of them unmarried.
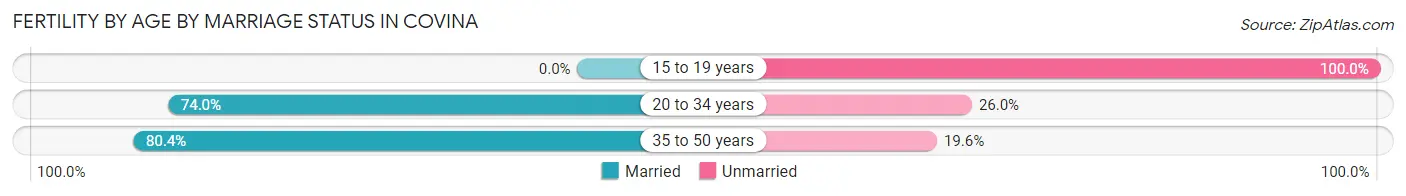
| Age Bracket | Married | Unmarried |
| 15 to 19 years | 0 (0.0%) | 1 (100.0%) |
| 20 to 34 years | 405 (74.0%) | 142 (26.0%) |
| 35 to 50 years | 86 (80.4%) | 21 (19.6%) |
| Total | 491 (75.0%) | 164 (25.0%) |
Fertility by Education in Covina
Average fertility rate in Covina is 53.0 births per 1,000 women. Women with the education attainment of high school diploma have the highest fertility rate of 82.0 births per 1,000 women, while women with the education attainment of less than high school have the lowest fertility at 19.0 births per 1,000 women. Women with the education attainment of high school diploma represent 37.6% of all women with births.
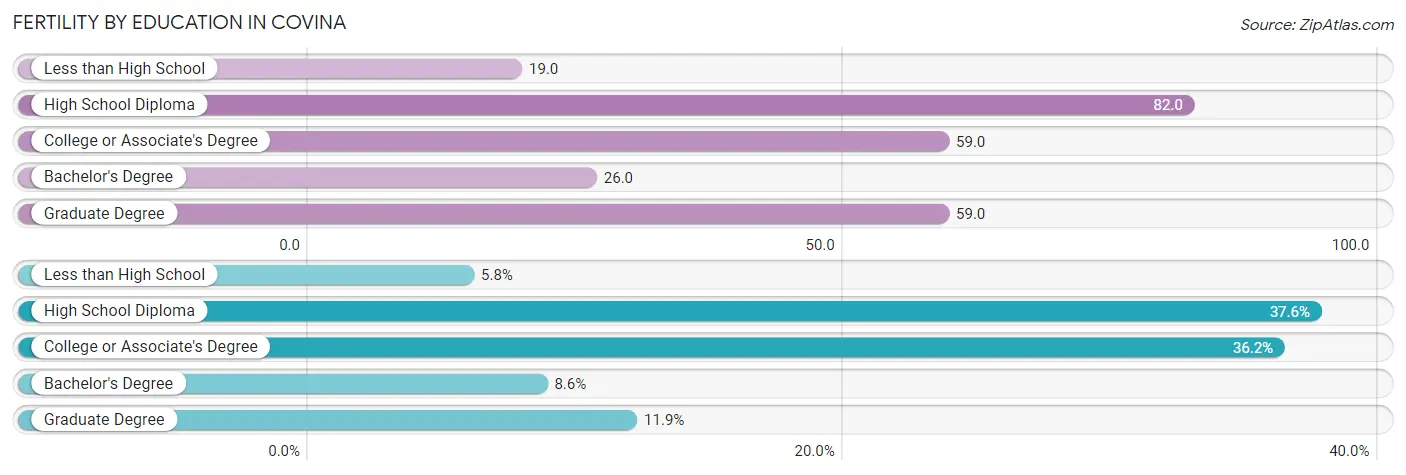
| Educational Attainment | Women with Births | Births / 1,000 Women |
| Less than High School | 38 (5.8%) | 19.0 |
| High School Diploma | 246 (37.6%) | 82.0 |
| College or Associate's Degree | 237 (36.2%) | 59.0 |
| Bachelor's Degree | 56 (8.6%) | 26.0 |
| Graduate Degree | 78 (11.9%) | 59.0 |
| Total | 655 (100.0%) | 53.0 |
Fertility by Education by Marriage Status in Covina
25.0% of women with births in Covina are unmarried. Women with the educational attainment of bachelor's degree are most likely to be married with 100.0% of them married at childbirth, while women with the educational attainment of high school diploma are least likely to be married with 45.9% of them unmarried at childbirth.
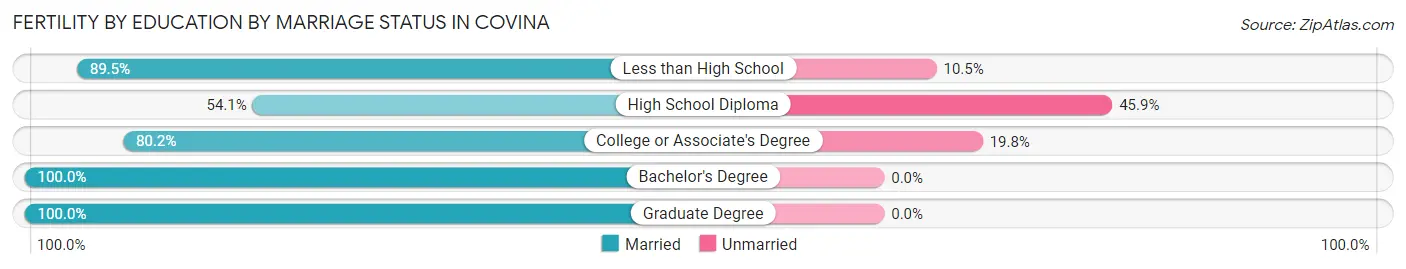
| Educational Attainment | Married | Unmarried |
| Less than High School | 34 (89.5%) | 4 (10.5%) |
| High School Diploma | 133 (54.1%) | 113 (45.9%) |
| College or Associate's Degree | 190 (80.2%) | 47 (19.8%) |
| Bachelor's Degree | 56 (100.0%) | 0 (0.0%) |
| Graduate Degree | 78 (100.0%) | 0 (0.0%) |
| Total | 491 (75.0%) | 164 (25.0%) |
Employment Characteristics in Covina
Employment by Class of Employer in Covina
Among the 26,350 employed individuals in Covina, private company employees (17,509 | 66.4%), not-for-profit organizations (2,610 | 9.9%), and local government employees (2,594 | 9.8%) make up the most common classes of employment.
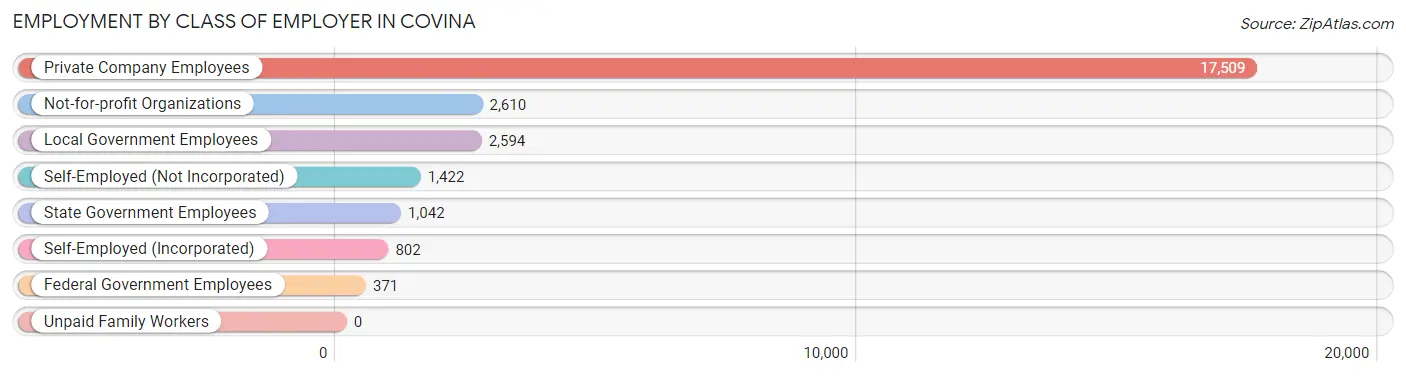
| Employer Class | # Employees | % Employees |
| Private Company Employees | 17,509 | 66.4% |
| Self-Employed (Incorporated) | 802 | 3.0% |
| Self-Employed (Not Incorporated) | 1,422 | 5.4% |
| Not-for-profit Organizations | 2,610 | 9.9% |
| Local Government Employees | 2,594 | 9.8% |
| State Government Employees | 1,042 | 4.0% |
| Federal Government Employees | 371 | 1.4% |
| Unpaid Family Workers | 0 | 0.0% |
| Total | 26,350 | 100.0% |
Employment Status by Age in Covina
According to the labor force statistics for Covina, out of the total population over 16 years of age (41,138), 69.4% or 28,550 individuals are in the labor force, with 5.7% or 1,627 of them unemployed. The age group with the highest labor force participation rate is 25 to 29 years, with 92.4% or 3,739 individuals in the labor force. Within the labor force, the 20 to 24 years age range has the highest percentage of unemployed individuals, with 18.7% or 469 of them being unemployed.
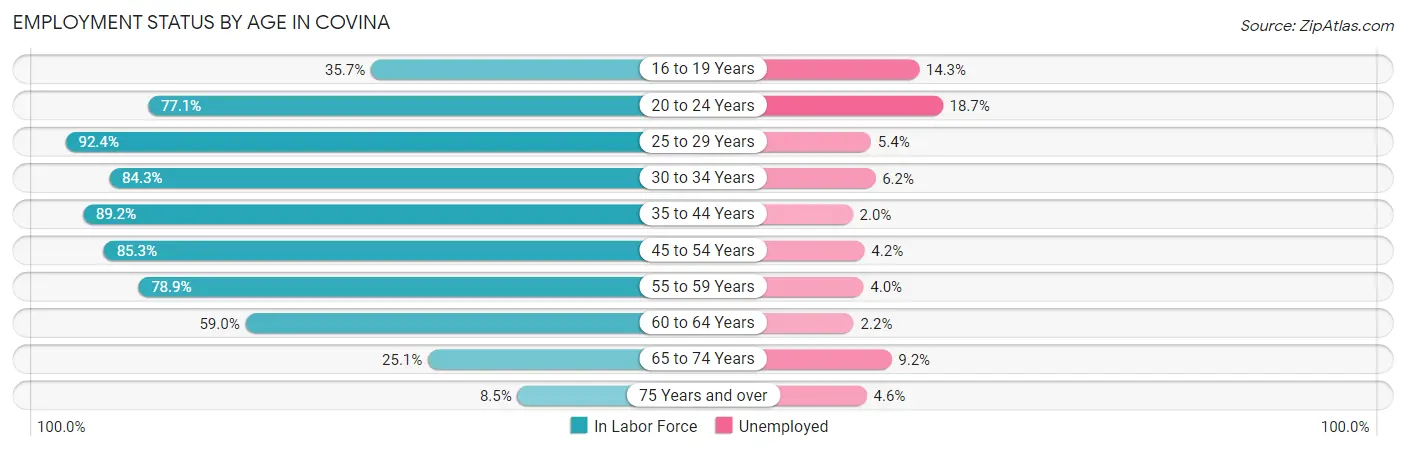
| Age Bracket | In Labor Force | Unemployed |
| 16 to 19 Years | 892 (35.7%) | 128 (14.3%) |
| 20 to 24 Years | 2,509 (77.1%) | 469 (18.7%) |
| 25 to 29 Years | 3,739 (92.4%) | 202 (5.4%) |
| 30 to 34 Years | 3,218 (84.3%) | 200 (6.2%) |
| 35 to 44 Years | 6,767 (89.2%) | 135 (2.0%) |
| 45 to 54 Years | 5,797 (85.3%) | 243 (4.2%) |
| 55 to 59 Years | 2,646 (78.9%) | 106 (4.0%) |
| 60 to 64 Years | 1,800 (59.0%) | 40 (2.2%) |
| 65 to 74 Years | 917 (25.1%) | 84 (9.2%) |
| 75 Years and over | 262 (8.5%) | 12 (4.6%) |
| Total | 28,550 (69.4%) | 1,627 (5.7%) |
Employment Status by Educational Attainment in Covina
According to labor force statistics for Covina, 83.7% of individuals (23,980) out of the total population between 25 and 64 years of age (28,650) are in the labor force, with 3.9% or 935 of them being unemployed. The group with the highest labor force participation rate are those with the educational attainment of bachelor's degree or higher, with 89.5% or 7,022 individuals in the labor force. Within the labor force, individuals with college / associate degree education have the highest percentage of unemployment, with 6.5% or 538 of them being unemployed.
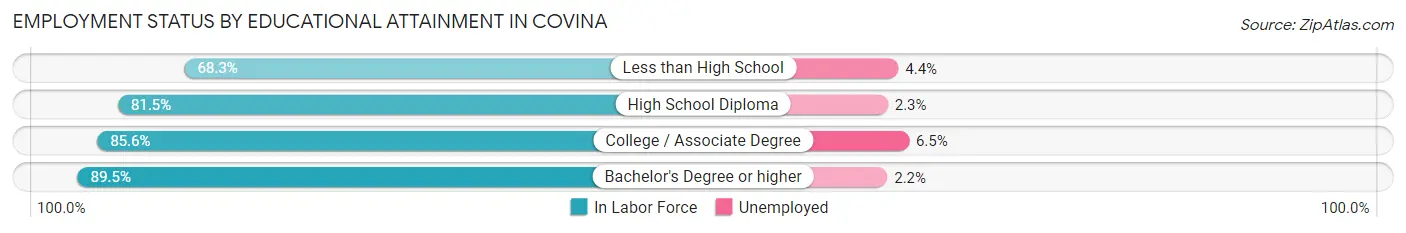
| Educational Attainment | In Labor Force | Unemployed |
| Less than High School | 2,113 (68.3%) | 136 (4.4%) |
| High School Diploma | 6,557 (81.5%) | 185 (2.3%) |
| College / Associate Degree | 8,274 (85.6%) | 628 (6.5%) |
| Bachelor's Degree or higher | 7,022 (89.5%) | 173 (2.2%) |
| Total | 23,980 (83.7%) | 1,117 (3.9%) |
Employment Occupations by Sex in Covina
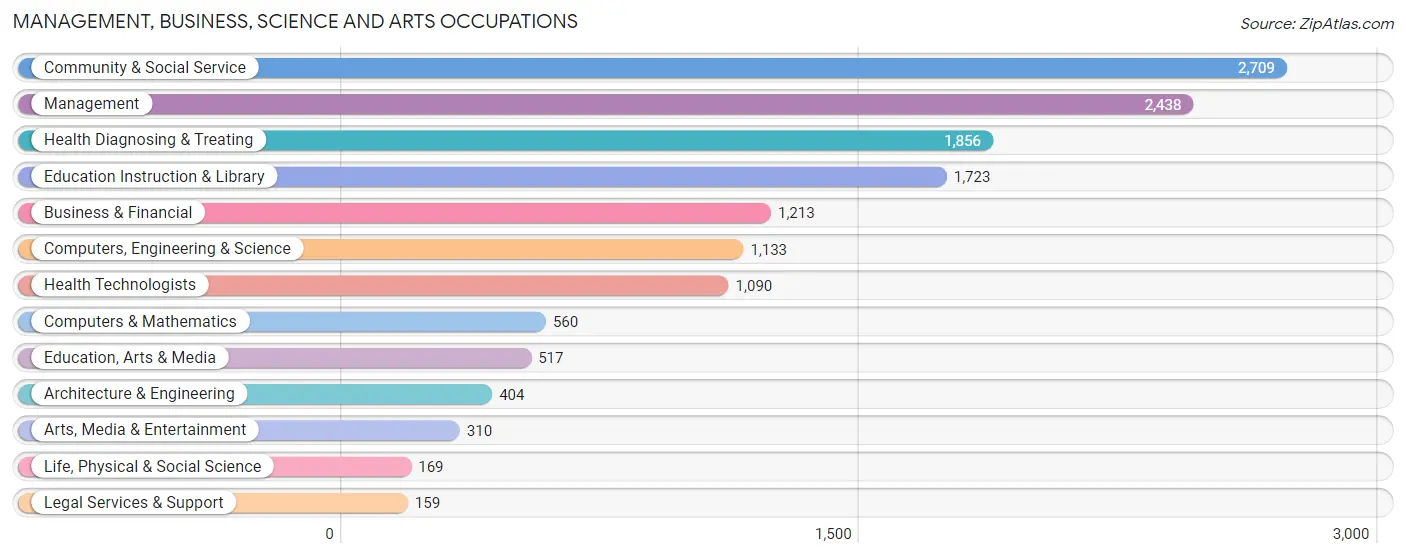
Management, Business, Science and Arts Occupations
The most common Management, Business, Science and Arts occupations in Covina are Community & Social Service (2,709 | 10.1%), Management (2,438 | 9.1%), Health Diagnosing & Treating (1,856 | 6.9%), Education Instruction & Library (1,723 | 6.4%), and Business & Financial (1,213 | 4.5%).
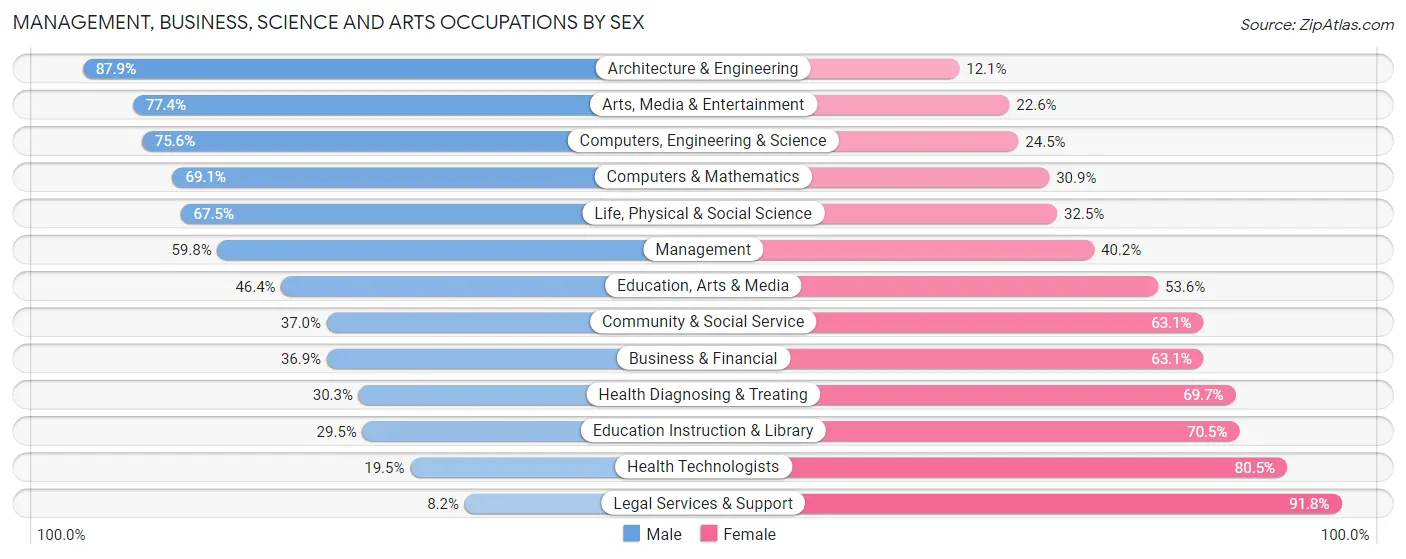
Management, Business, Science and Arts Occupations by Sex
Within the Management, Business, Science and Arts occupations in Covina, the most male-oriented occupations are Architecture & Engineering (87.9%), Arts, Media & Entertainment (77.4%), and Computers, Engineering & Science (75.5%), while the most female-oriented occupations are Legal Services & Support (91.8%), Health Technologists (80.5%), and Education Instruction & Library (70.5%).
| Occupation | Male | Female |
| Management | 1,457 (59.8%) | 981 (40.2%) |
| Business & Financial | 448 (36.9%) | 765 (63.1%) |
| Computers, Engineering & Science | 856 (75.5%) | 277 (24.4%) |
| Computers & Mathematics | 387 (69.1%) | 173 (30.9%) |
| Architecture & Engineering | 355 (87.9%) | 49 (12.1%) |
| Life, Physical & Social Science | 114 (67.5%) | 55 (32.5%) |
| Community & Social Service | 1,001 (36.9%) | 1,708 (63.0%) |
| Education, Arts & Media | 240 (46.4%) | 277 (53.6%) |
| Legal Services & Support | 13 (8.2%) | 146 (91.8%) |
| Education Instruction & Library | 508 (29.5%) | 1,215 (70.5%) |
| Arts, Media & Entertainment | 240 (77.4%) | 70 (22.6%) |
| Health Diagnosing & Treating | 562 (30.3%) | 1,294 (69.7%) |
| Health Technologists | 213 (19.5%) | 877 (80.5%) |
| Total (Category) | 4,324 (46.3%) | 5,025 (53.7%) |
| Total (Overall) | 14,433 (53.7%) | 12,460 (46.3%) |
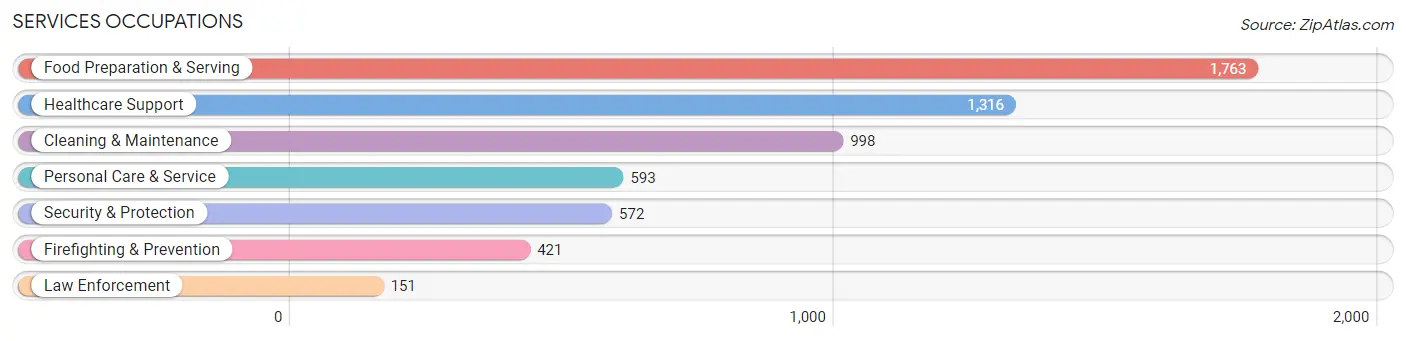
Services Occupations
The most common Services occupations in Covina are Food Preparation & Serving (1,763 | 6.6%), Healthcare Support (1,316 | 4.9%), Cleaning & Maintenance (998 | 3.7%), Personal Care & Service (593 | 2.2%), and Security & Protection (572 | 2.1%).
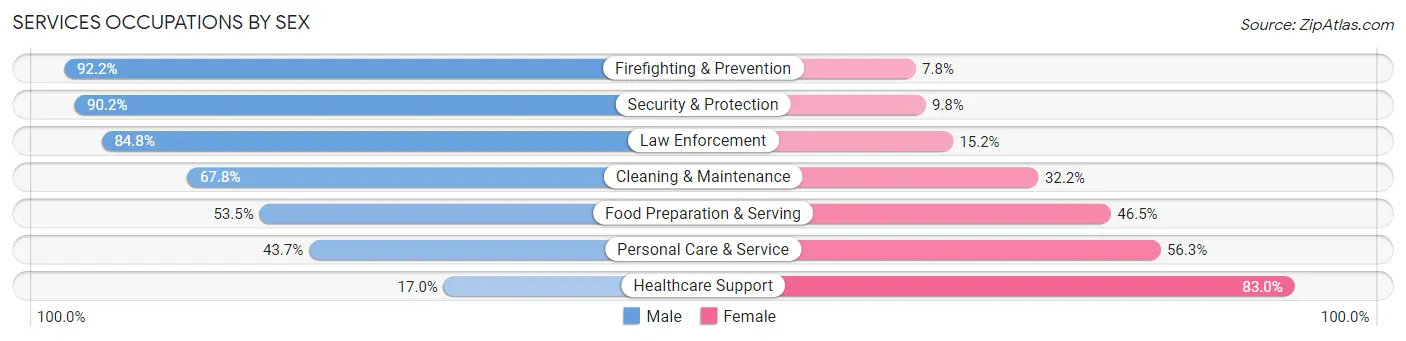
Services Occupations by Sex
Within the Services occupations in Covina, the most male-oriented occupations are Firefighting & Prevention (92.2%), Security & Protection (90.2%), and Law Enforcement (84.8%), while the most female-oriented occupations are Healthcare Support (83.0%), Personal Care & Service (56.3%), and Food Preparation & Serving (46.5%).
| Occupation | Male | Female |
| Healthcare Support | 224 (17.0%) | 1,092 (83.0%) |
| Security & Protection | 516 (90.2%) | 56 (9.8%) |
| Firefighting & Prevention | 388 (92.2%) | 33 (7.8%) |
| Law Enforcement | 128 (84.8%) | 23 (15.2%) |
| Food Preparation & Serving | 943 (53.5%) | 820 (46.5%) |
| Cleaning & Maintenance | 677 (67.8%) | 321 (32.2%) |
| Personal Care & Service | 259 (43.7%) | 334 (56.3%) |
| Total (Category) | 2,619 (50.0%) | 2,623 (50.0%) |
| Total (Overall) | 14,433 (53.7%) | 12,460 (46.3%) |
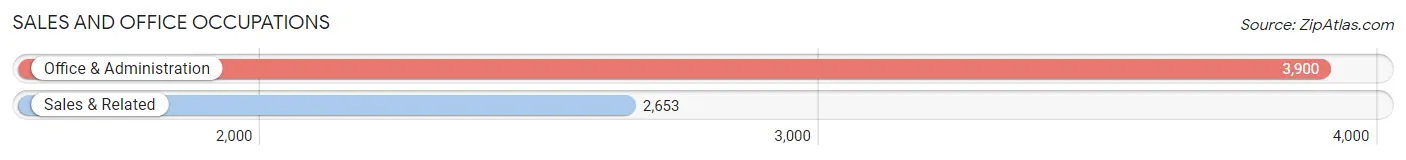
Sales and Office Occupations
The most common Sales and Office occupations in Covina are Office & Administration (3,900 | 14.5%), and Sales & Related (2,653 | 9.9%).
Sales and Office Occupations by Sex
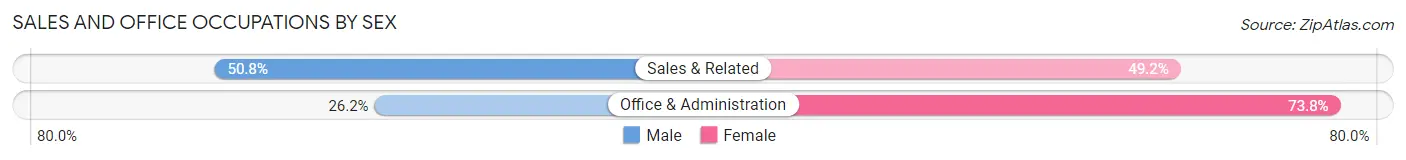
| Occupation | Male | Female |
| Sales & Related | 1,347 (50.8%) | 1,306 (49.2%) |
| Office & Administration | 1,021 (26.2%) | 2,879 (73.8%) |
| Total (Category) | 2,368 (36.1%) | 4,185 (63.9%) |
| Total (Overall) | 14,433 (53.7%) | 12,460 (46.3%) |
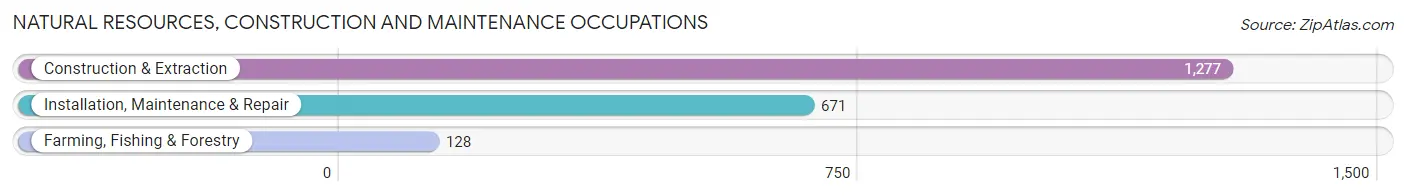
Natural Resources, Construction and Maintenance Occupations
The most common Natural Resources, Construction and Maintenance occupations in Covina are Construction & Extraction (1,277 | 4.8%), Installation, Maintenance & Repair (671 | 2.5%), and Farming, Fishing & Forestry (128 | 0.5%).
Natural Resources, Construction and Maintenance Occupations by Sex
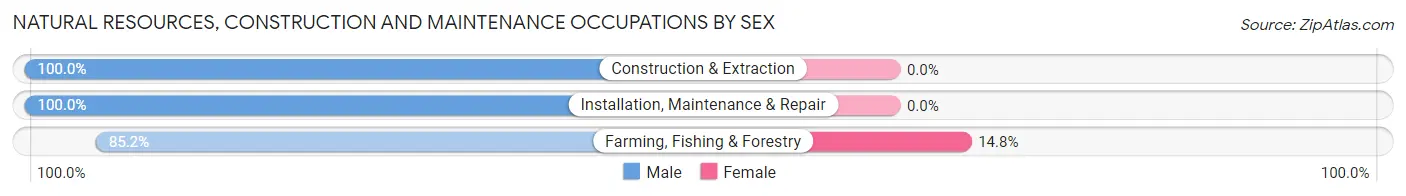
| Occupation | Male | Female |
| Farming, Fishing & Forestry | 109 (85.2%) | 19 (14.8%) |
| Construction & Extraction | 1,277 (100.0%) | 0 (0.0%) |
| Installation, Maintenance & Repair | 671 (100.0%) | 0 (0.0%) |
| Total (Category) | 2,057 (99.1%) | 19 (0.9%) |
| Total (Overall) | 14,433 (53.7%) | 12,460 (46.3%) |
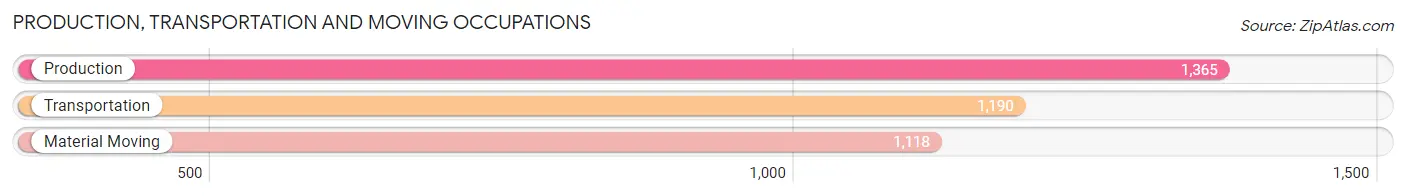
Production, Transportation and Moving Occupations
The most common Production, Transportation and Moving occupations in Covina are Production (1,365 | 5.1%), Transportation (1,190 | 4.4%), and Material Moving (1,118 | 4.2%).
Production, Transportation and Moving Occupations by Sex
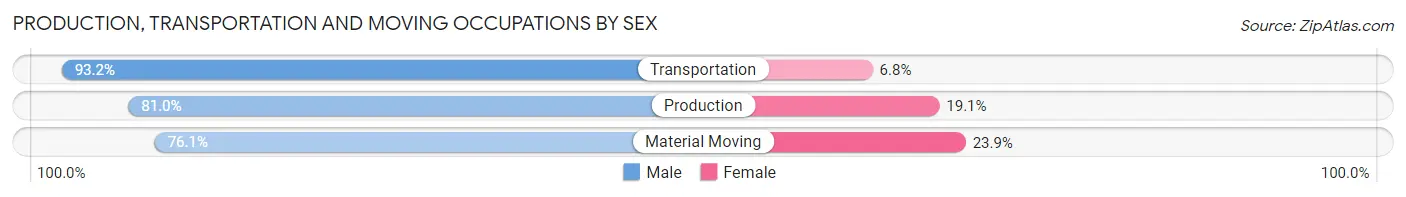
| Occupation | Male | Female |
| Production | 1,105 (80.9%) | 260 (19.1%) |
| Transportation | 1,109 (93.2%) | 81 (6.8%) |
| Material Moving | 851 (76.1%) | 267 (23.9%) |
| Total (Category) | 3,065 (83.5%) | 608 (16.6%) |
| Total (Overall) | 14,433 (53.7%) | 12,460 (46.3%) |
Employment Industries by Sex in Covina
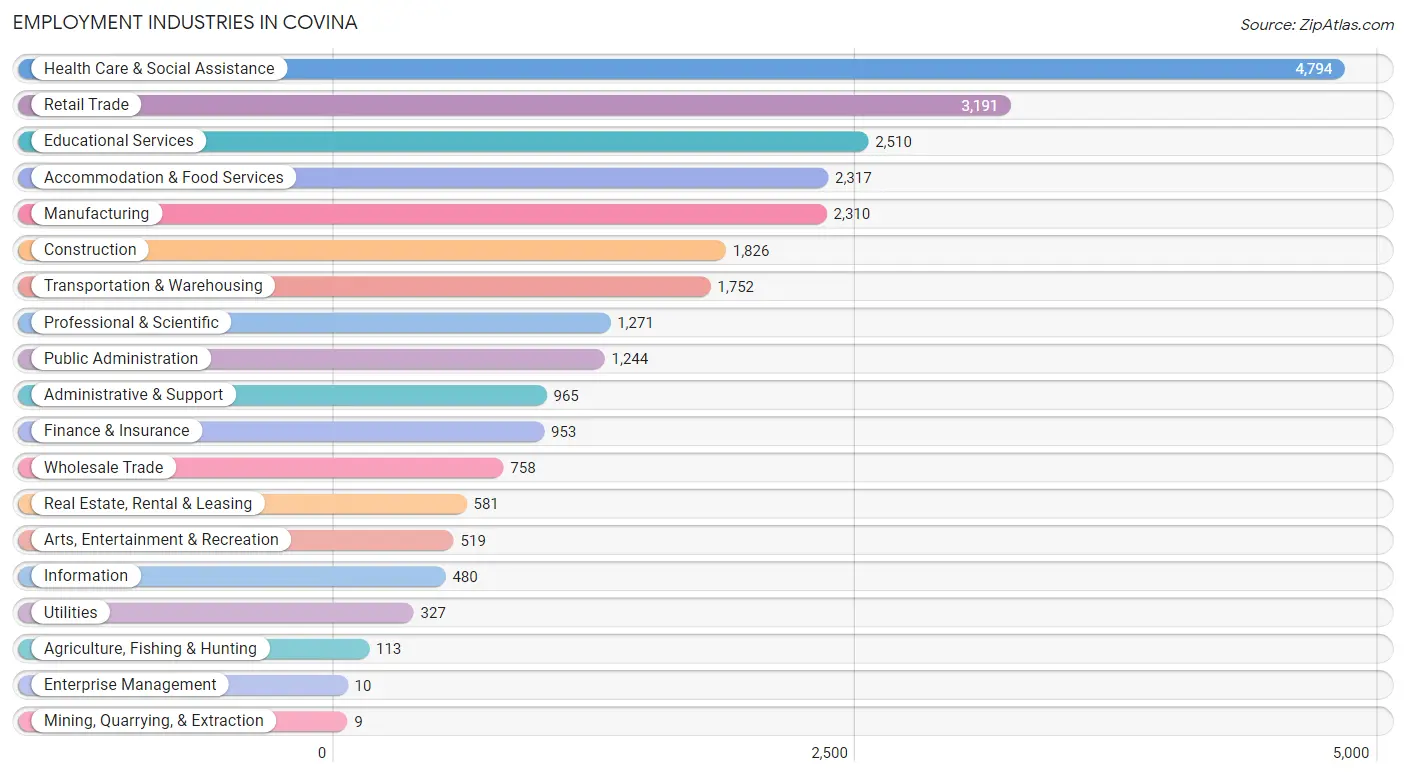
Employment Industries in Covina
The major employment industries in Covina include Health Care & Social Assistance (4,794 | 17.8%), Retail Trade (3,191 | 11.9%), Educational Services (2,510 | 9.3%), Accommodation & Food Services (2,317 | 8.6%), and Manufacturing (2,310 | 8.6%).
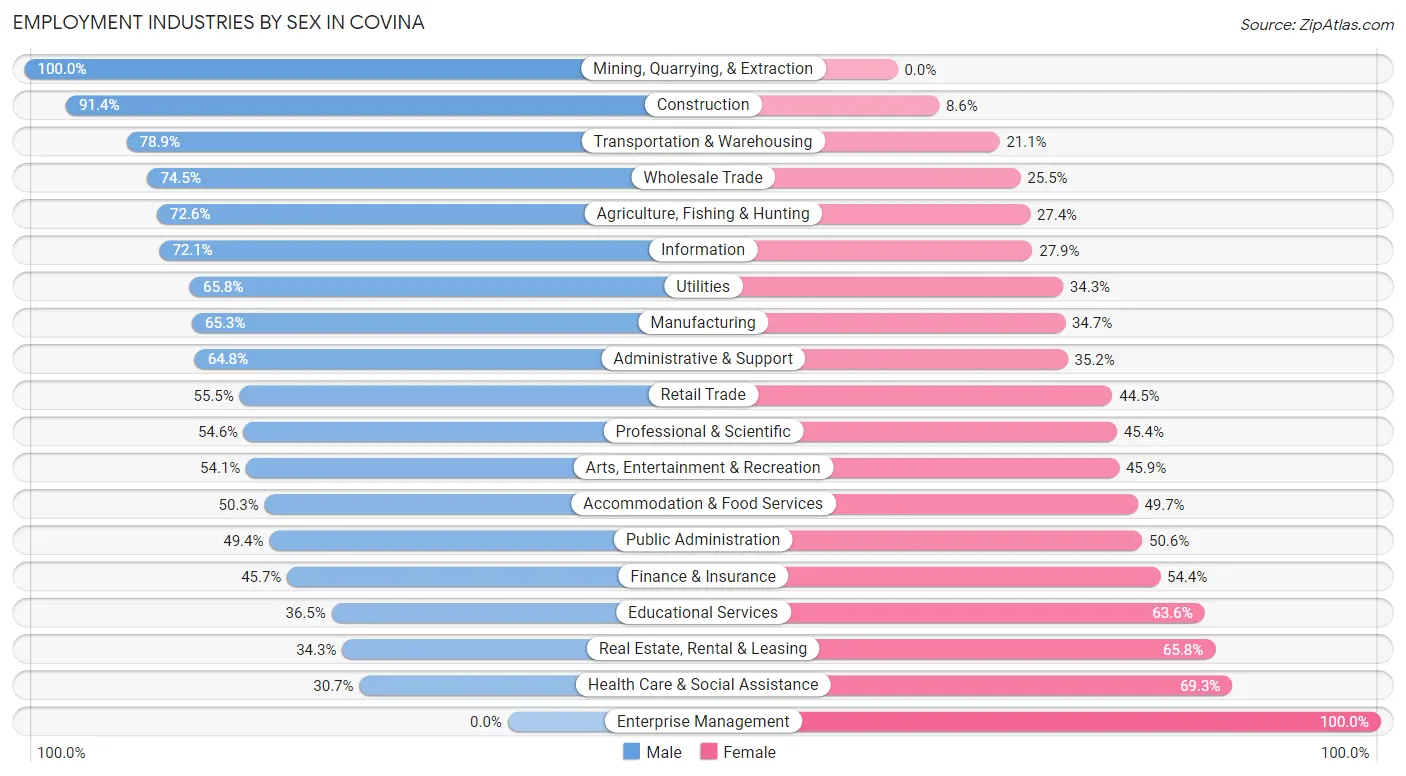
Employment Industries by Sex in Covina
The Covina industries that see more men than women are Mining, Quarrying, & Extraction (100.0%), Construction (91.4%), and Transportation & Warehousing (78.9%), whereas the industries that tend to have a higher number of women are Enterprise Management (100.0%), Health Care & Social Assistance (69.3%), and Real Estate, Rental & Leasing (65.7%).
| Industry | Male | Female |
| Agriculture, Fishing & Hunting | 82 (72.6%) | 31 (27.4%) |
| Mining, Quarrying, & Extraction | 9 (100.0%) | 0 (0.0%) |
| Construction | 1,669 (91.4%) | 157 (8.6%) |
| Manufacturing | 1,509 (65.3%) | 801 (34.7%) |
| Wholesale Trade | 565 (74.5%) | 193 (25.5%) |
| Retail Trade | 1,771 (55.5%) | 1,420 (44.5%) |
| Transportation & Warehousing | 1,382 (78.9%) | 370 (21.1%) |
| Utilities | 215 (65.7%) | 112 (34.3%) |
| Information | 346 (72.1%) | 134 (27.9%) |
| Finance & Insurance | 435 (45.7%) | 518 (54.3%) |
| Real Estate, Rental & Leasing | 199 (34.3%) | 382 (65.7%) |
| Professional & Scientific | 694 (54.6%) | 577 (45.4%) |
| Enterprise Management | 0 (0.0%) | 10 (100.0%) |
| Administrative & Support | 625 (64.8%) | 340 (35.2%) |
| Educational Services | 915 (36.4%) | 1,595 (63.5%) |
| Health Care & Social Assistance | 1,472 (30.7%) | 3,322 (69.3%) |
| Arts, Entertainment & Recreation | 281 (54.1%) | 238 (45.9%) |
| Accommodation & Food Services | 1,166 (50.3%) | 1,151 (49.7%) |
| Public Administration | 614 (49.4%) | 630 (50.6%) |
| Total | 14,433 (53.7%) | 12,460 (46.3%) |
Education in Covina
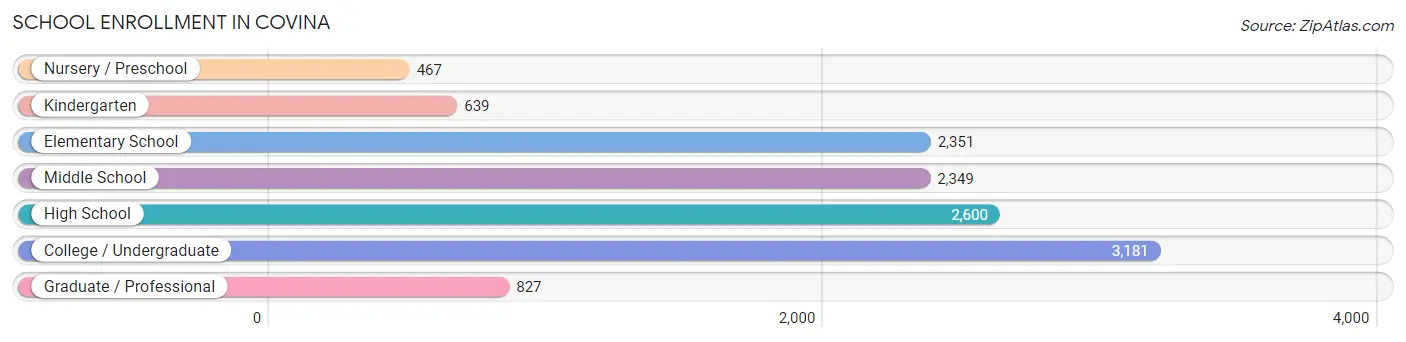
School Enrollment in Covina
The most common levels of schooling among the 12,414 students in Covina are college / undergraduate (3,181 | 25.6%), high school (2,600 | 20.9%), and elementary school (2,351 | 18.9%).
| School Level | # Students | % Students |
| Nursery / Preschool | 467 | 3.8% |
| Kindergarten | 639 | 5.1% |
| Elementary School | 2,351 | 18.9% |
| Middle School | 2,349 | 18.9% |
| High School | 2,600 | 20.9% |
| College / Undergraduate | 3,181 | 25.6% |
| Graduate / Professional | 827 | 6.7% |
| Total | 12,414 | 100.0% |
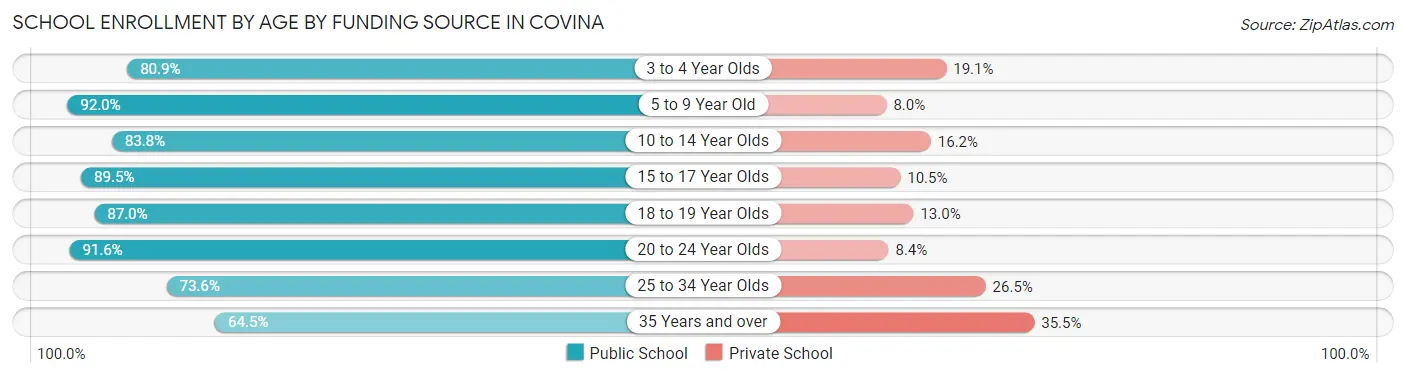
School Enrollment by Age by Funding Source in Covina
Out of a total of 12,414 students who are enrolled in schools in Covina, 1,825 (14.7%) attend a private institution, while the remaining 10,589 (85.3%) are enrolled in public schools. The age group of 35 years and over has the highest likelihood of being enrolled in private schools, with 355 (35.5% in the age bracket) enrolled. Conversely, the age group of 5 to 9 year old has the lowest likelihood of being enrolled in a private school, with 2,564 (92.0% in the age bracket) attending a public institution.
| Age Bracket | Public School | Private School |
| 3 to 4 Year Olds | 351 (80.9%) | 83 (19.1%) |
| 5 to 9 Year Old | 2,564 (92.0%) | 222 (8.0%) |
| 10 to 14 Year Olds | 2,388 (83.8%) | 463 (16.2%) |
| 15 to 17 Year Olds | 1,800 (89.5%) | 212 (10.5%) |
| 18 to 19 Year Olds | 1,024 (87.0%) | 153 (13.0%) |
| 20 to 24 Year Olds | 1,184 (91.6%) | 108 (8.4%) |
| 25 to 34 Year Olds | 634 (73.6%) | 228 (26.5%) |
| 35 Years and over | 645 (64.5%) | 355 (35.5%) |
| Total | 10,589 (85.3%) | 1,825 (14.7%) |
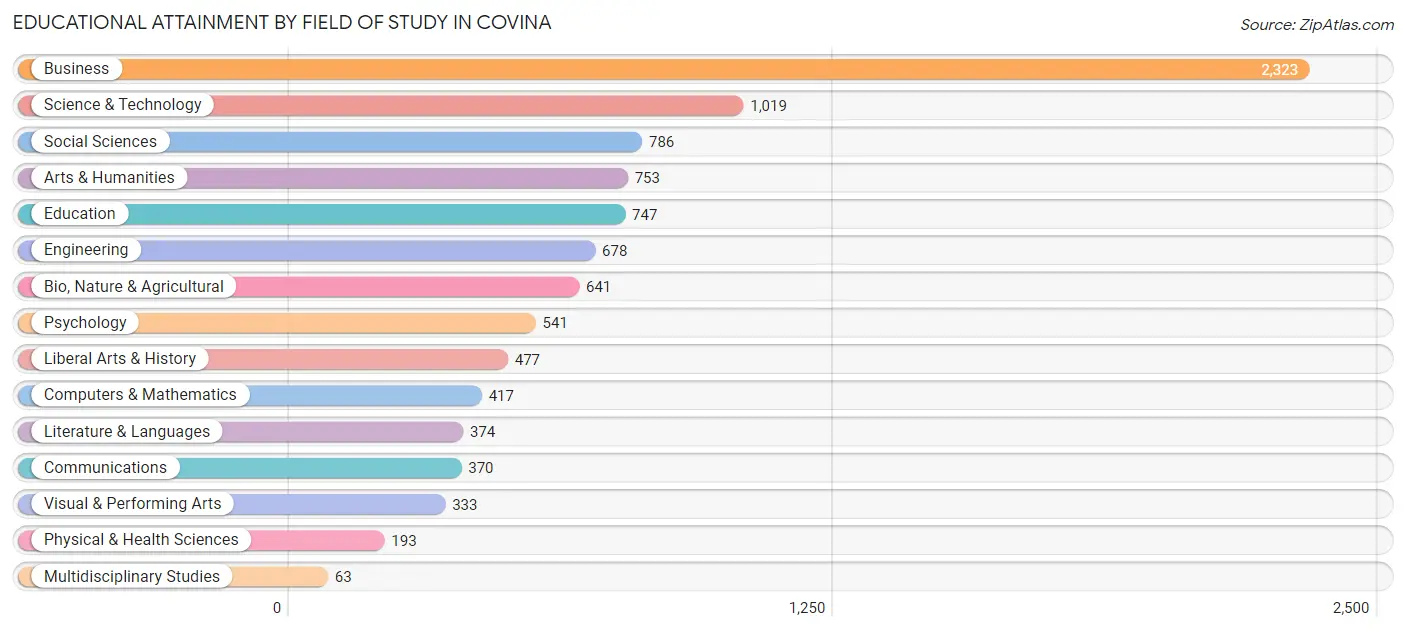
Educational Attainment by Field of Study in Covina
Business (2,323 | 23.9%), science & technology (1,019 | 10.5%), social sciences (786 | 8.1%), arts & humanities (753 | 7.7%), and education (747 | 7.7%) are the most common fields of study among 9,715 individuals in Covina who have obtained a bachelor's degree or higher.
| Field of Study | # Graduates | % Graduates |
| Computers & Mathematics | 417 | 4.3% |
| Bio, Nature & Agricultural | 641 | 6.6% |
| Physical & Health Sciences | 193 | 2.0% |
| Psychology | 541 | 5.6% |
| Social Sciences | 786 | 8.1% |
| Engineering | 678 | 7.0% |
| Multidisciplinary Studies | 63 | 0.6% |
| Science & Technology | 1,019 | 10.5% |
| Business | 2,323 | 23.9% |
| Education | 747 | 7.7% |
| Literature & Languages | 374 | 3.8% |
| Liberal Arts & History | 477 | 4.9% |
| Visual & Performing Arts | 333 | 3.4% |
| Communications | 370 | 3.8% |
| Arts & Humanities | 753 | 7.7% |
| Total | 9,715 | 100.0% |
Transportation & Commute in Covina
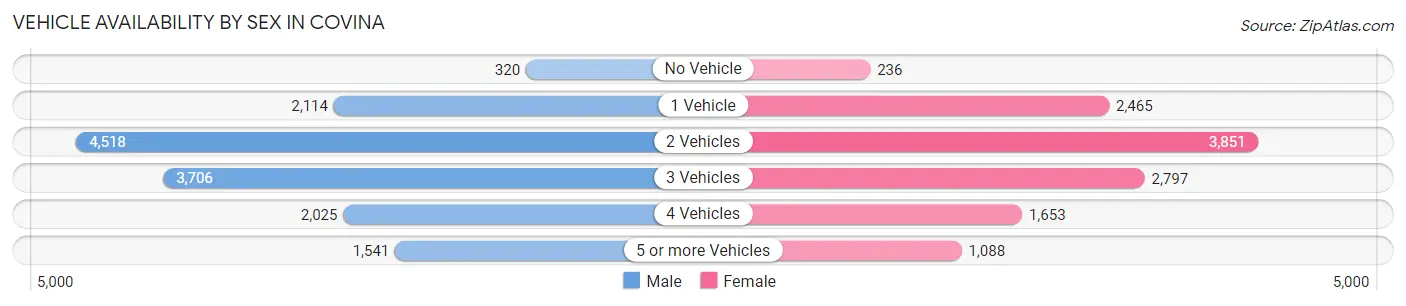
Vehicle Availability by Sex in Covina
The most prevalent vehicle ownership categories in Covina are males with 2 vehicles (4,518, accounting for 31.8%) and females with 2 vehicles (3,851, making up 37.4%).
| Vehicles Available | Male | Female |
| No Vehicle | 320 (2.2%) | 236 (1.9%) |
| 1 Vehicle | 2,114 (14.9%) | 2,465 (20.4%) |
| 2 Vehicles | 4,518 (31.8%) | 3,851 (31.9%) |
| 3 Vehicles | 3,706 (26.1%) | 2,797 (23.1%) |
| 4 Vehicles | 2,025 (14.2%) | 1,653 (13.7%) |
| 5 or more Vehicles | 1,541 (10.8%) | 1,088 (9.0%) |
| Total | 14,224 (100.0%) | 12,090 (100.0%) |
Commute Time in Covina
The most frequently occuring commute durations in Covina are 30 to 34 minutes (3,575 commuters, 15.3%), 20 to 24 minutes (3,325 commuters, 14.2%), and 60 to 89 minutes (2,803 commuters, 12.0%).
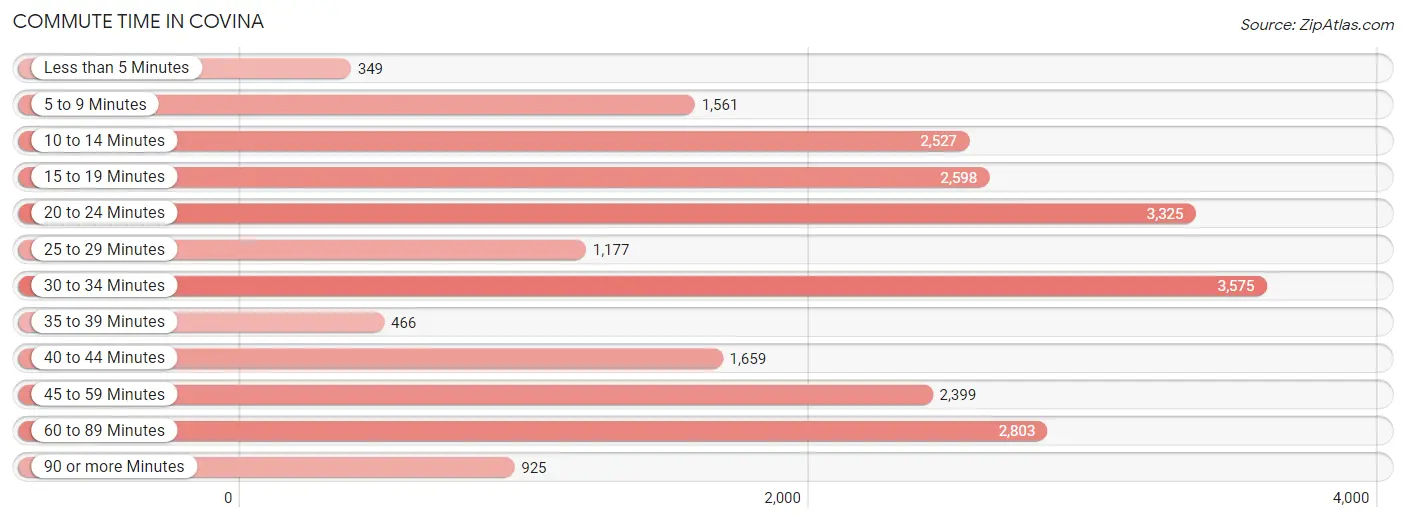
| Commute Time | # Commuters | % Commuters |
| Less than 5 Minutes | 349 | 1.5% |
| 5 to 9 Minutes | 1,561 | 6.7% |
| 10 to 14 Minutes | 2,527 | 10.8% |
| 15 to 19 Minutes | 2,598 | 11.1% |
| 20 to 24 Minutes | 3,325 | 14.2% |
| 25 to 29 Minutes | 1,177 | 5.0% |
| 30 to 34 Minutes | 3,575 | 15.3% |
| 35 to 39 Minutes | 466 | 2.0% |
| 40 to 44 Minutes | 1,659 | 7.1% |
| 45 to 59 Minutes | 2,399 | 10.3% |
| 60 to 89 Minutes | 2,803 | 12.0% |
| 90 or more Minutes | 925 | 4.0% |
Commute Time by Sex in Covina
The most common commute times in Covina are 30 to 34 minutes (2,245 commuters, 17.1%) for males and 10 to 14 minutes (1,537 commuters, 15.0%) for females.
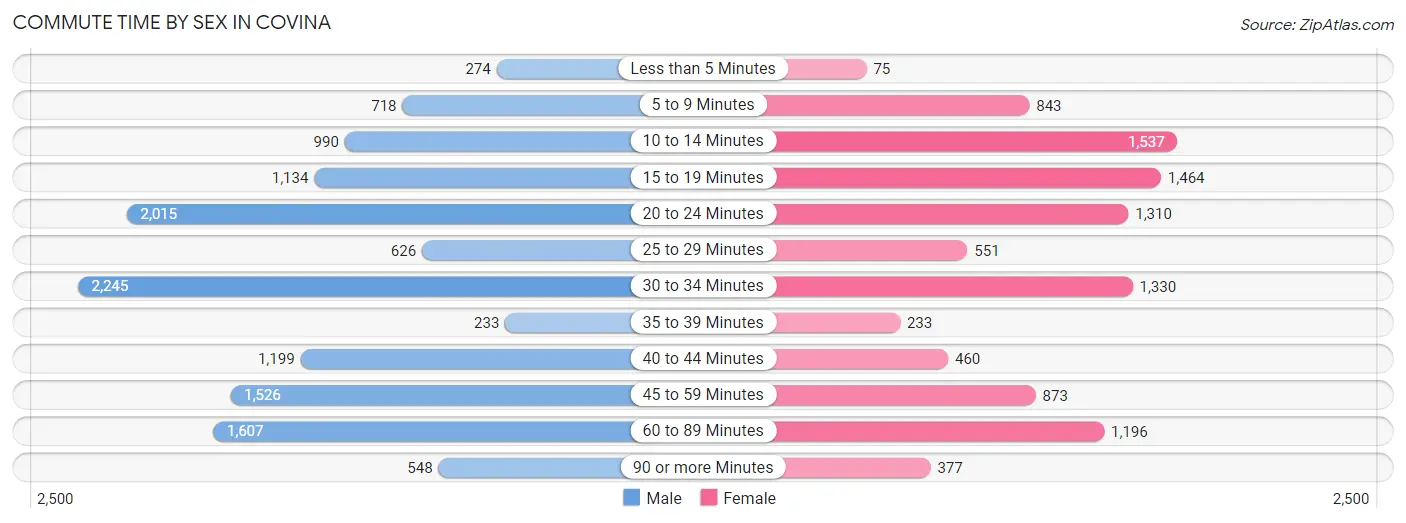
| Commute Time | Male | Female |
| Less than 5 Minutes | 274 (2.1%) | 75 (0.7%) |
| 5 to 9 Minutes | 718 (5.5%) | 843 (8.2%) |
| 10 to 14 Minutes | 990 (7.5%) | 1,537 (15.0%) |
| 15 to 19 Minutes | 1,134 (8.6%) | 1,464 (14.3%) |
| 20 to 24 Minutes | 2,015 (15.4%) | 1,310 (12.8%) |
| 25 to 29 Minutes | 626 (4.8%) | 551 (5.4%) |
| 30 to 34 Minutes | 2,245 (17.1%) | 1,330 (13.0%) |
| 35 to 39 Minutes | 233 (1.8%) | 233 (2.3%) |
| 40 to 44 Minutes | 1,199 (9.1%) | 460 (4.5%) |
| 45 to 59 Minutes | 1,526 (11.6%) | 873 (8.5%) |
| 60 to 89 Minutes | 1,607 (12.2%) | 1,196 (11.7%) |
| 90 or more Minutes | 548 (4.2%) | 377 (3.7%) |
Time of Departure to Work by Sex in Covina
The most frequent times of departure to work in Covina are 7:00 AM to 7:29 AM (1,679, 12.8%) for males and 7:00 AM to 7:29 AM (1,769, 17.3%) for females.
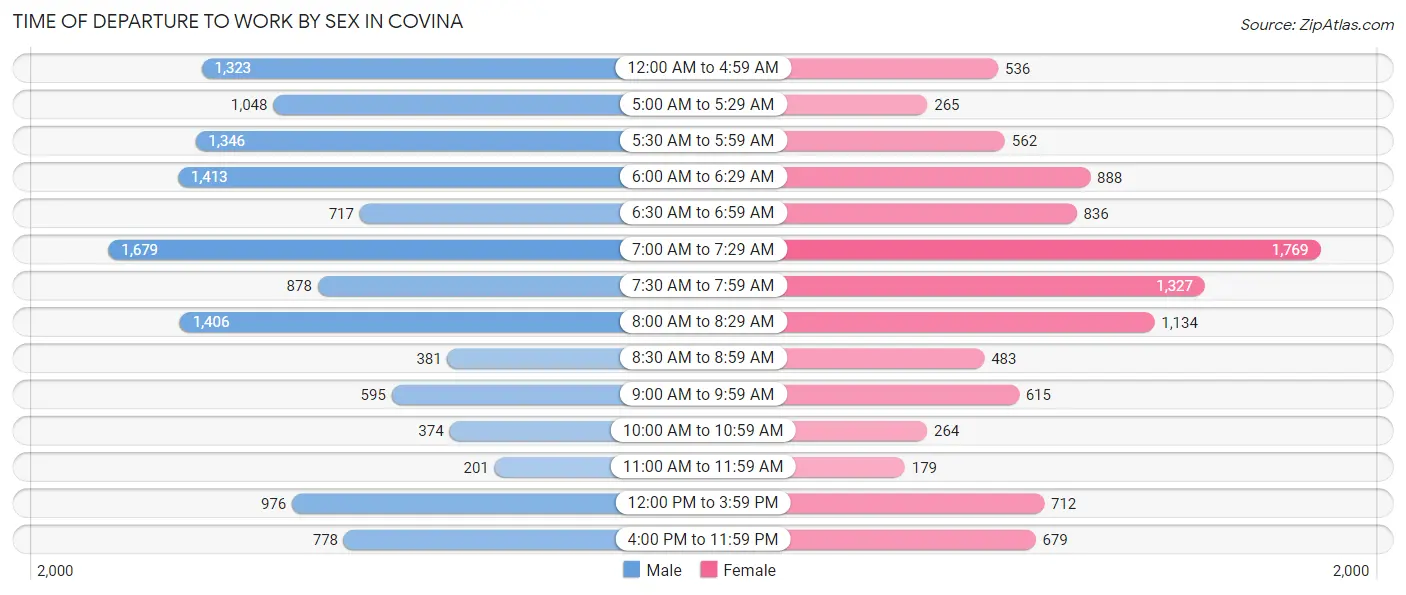
| Time of Departure | Male | Female |
| 12:00 AM to 4:59 AM | 1,323 (10.1%) | 536 (5.2%) |
| 5:00 AM to 5:29 AM | 1,048 (8.0%) | 265 (2.6%) |
| 5:30 AM to 5:59 AM | 1,346 (10.3%) | 562 (5.5%) |
| 6:00 AM to 6:29 AM | 1,413 (10.8%) | 888 (8.7%) |
| 6:30 AM to 6:59 AM | 717 (5.5%) | 836 (8.2%) |
| 7:00 AM to 7:29 AM | 1,679 (12.8%) | 1,769 (17.3%) |
| 7:30 AM to 7:59 AM | 878 (6.7%) | 1,327 (13.0%) |
| 8:00 AM to 8:29 AM | 1,406 (10.7%) | 1,134 (11.1%) |
| 8:30 AM to 8:59 AM | 381 (2.9%) | 483 (4.7%) |
| 9:00 AM to 9:59 AM | 595 (4.5%) | 615 (6.0%) |
| 10:00 AM to 10:59 AM | 374 (2.9%) | 264 (2.6%) |
| 11:00 AM to 11:59 AM | 201 (1.5%) | 179 (1.8%) |
| 12:00 PM to 3:59 PM | 976 (7.4%) | 712 (7.0%) |
| 4:00 PM to 11:59 PM | 778 (5.9%) | 679 (6.6%) |
| Total | 13,115 (100.0%) | 10,249 (100.0%) |
Housing Occupancy in Covina
Occupancy by Ownership in Covina
Of the total 16,313 dwellings in Covina, owner-occupied units account for 9,078 (55.6%), while renter-occupied units make up 7,235 (44.4%).
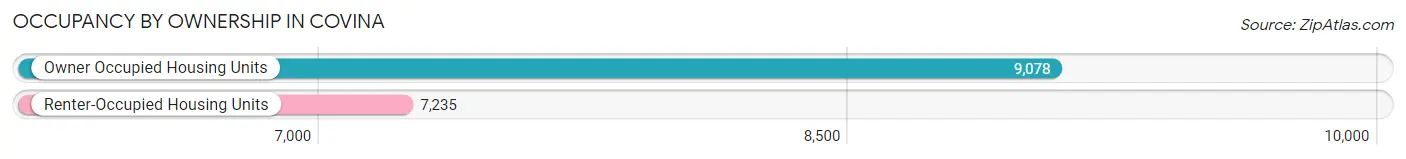
| Occupancy | # Housing Units | % Housing Units |
| Owner Occupied Housing Units | 9,078 | 55.6% |
| Renter-Occupied Housing Units | 7,235 | 44.4% |
| Total Occupied Housing Units | 16,313 | 100.0% |
Occupancy by Household Size in Covina
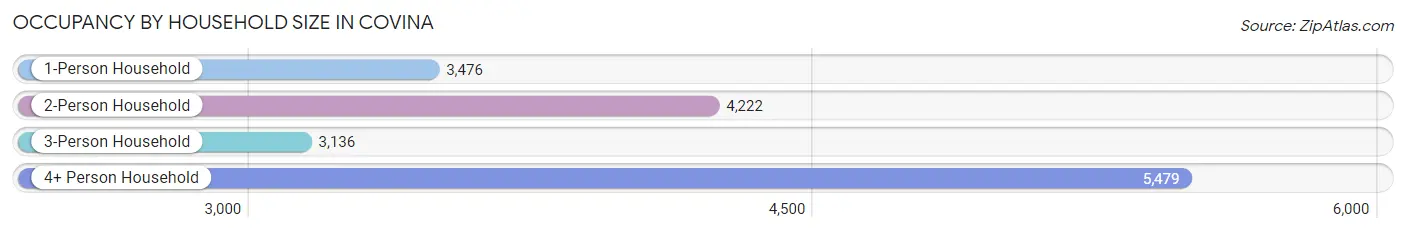
| Household Size | # Housing Units | % Housing Units |
| 1-Person Household | 3,476 | 21.3% |
| 2-Person Household | 4,222 | 25.9% |
| 3-Person Household | 3,136 | 19.2% |
| 4+ Person Household | 5,479 | 33.6% |
| Total Housing Units | 16,313 | 100.0% |
Occupancy by Ownership by Household Size in Covina
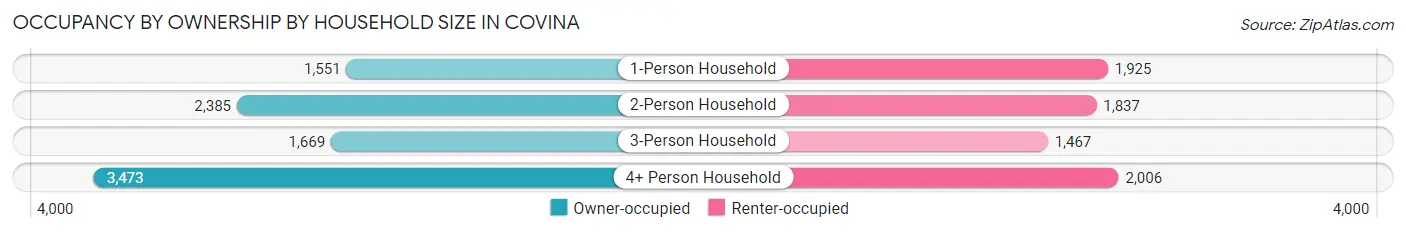
| Household Size | Owner-occupied | Renter-occupied |
| 1-Person Household | 1,551 (44.6%) | 1,925 (55.4%) |
| 2-Person Household | 2,385 (56.5%) | 1,837 (43.5%) |
| 3-Person Household | 1,669 (53.2%) | 1,467 (46.8%) |
| 4+ Person Household | 3,473 (63.4%) | 2,006 (36.6%) |
| Total Housing Units | 9,078 (55.6%) | 7,235 (44.4%) |
Occupancy by Educational Attainment in Covina
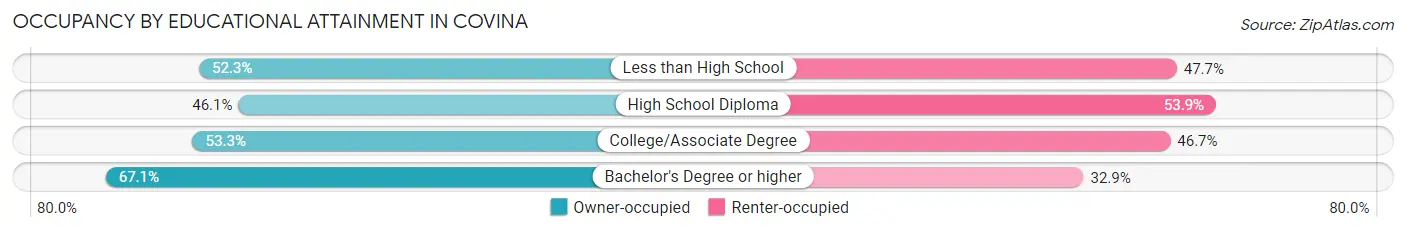
| Household Size | Owner-occupied | Renter-occupied |
| Less than High School | 1,004 (52.3%) | 915 (47.7%) |
| High School Diploma | 1,665 (46.1%) | 1,946 (53.9%) |
| College/Associate Degree | 3,207 (53.3%) | 2,805 (46.7%) |
| Bachelor's Degree or higher | 3,202 (67.1%) | 1,569 (32.9%) |
Occupancy by Age of Householder in Covina
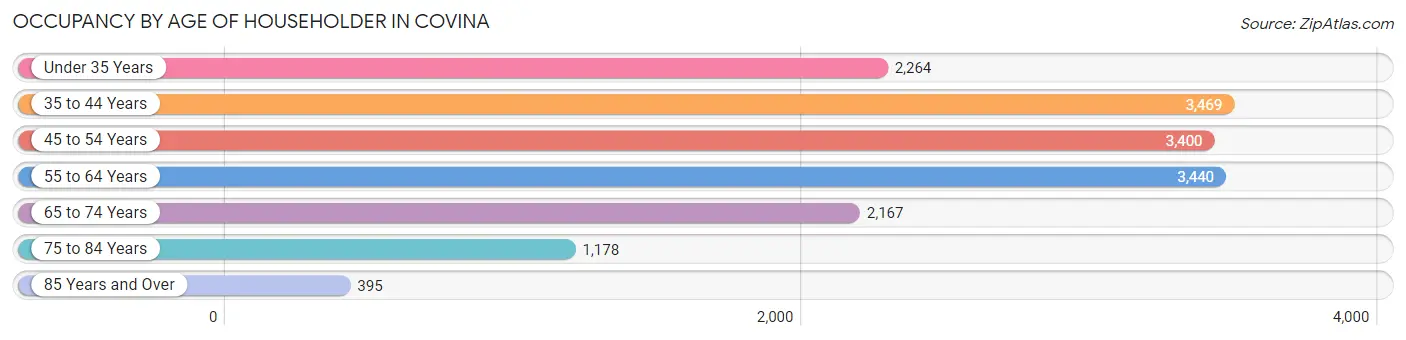
| Age Bracket | # Households | % Households |
| Under 35 Years | 2,264 | 13.9% |
| 35 to 44 Years | 3,469 | 21.3% |
| 45 to 54 Years | 3,400 | 20.8% |
| 55 to 64 Years | 3,440 | 21.1% |
| 65 to 74 Years | 2,167 | 13.3% |
| 75 to 84 Years | 1,178 | 7.2% |
| 85 Years and Over | 395 | 2.4% |
| Total | 16,313 | 100.0% |
Housing Finances in Covina
Median Income by Occupancy in Covina
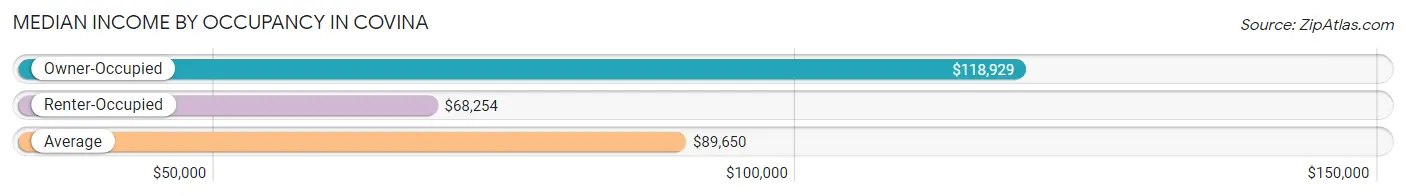
| Occupancy Type | # Households | Median Income |
| Owner-Occupied | 9,078 (55.6%) | $118,929 |
| Renter-Occupied | 7,235 (44.4%) | $68,254 |
| Average | 16,313 (100.0%) | $89,650 |
Occupancy by Householder Income Bracket in Covina
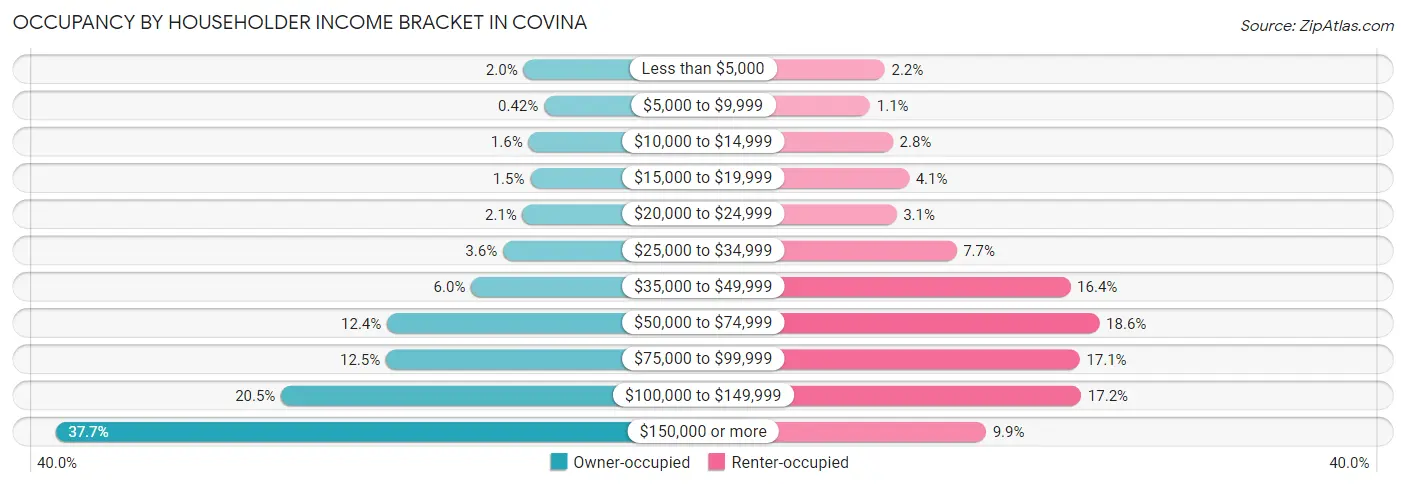
| Income Bracket | Owner-occupied | Renter-occupied |
| Less than $5,000 | 181 (2.0%) | 160 (2.2%) |
| $5,000 to $9,999 | 38 (0.4%) | 79 (1.1%) |
| $10,000 to $14,999 | 146 (1.6%) | 204 (2.8%) |
| $15,000 to $19,999 | 133 (1.5%) | 293 (4.1%) |
| $20,000 to $24,999 | 186 (2.1%) | 224 (3.1%) |
| $25,000 to $34,999 | 322 (3.5%) | 555 (7.7%) |
| $35,000 to $49,999 | 542 (6.0%) | 1,183 (16.4%) |
| $50,000 to $74,999 | 1,124 (12.4%) | 1,343 (18.6%) |
| $75,000 to $99,999 | 1,131 (12.5%) | 1,234 (17.1%) |
| $100,000 to $149,999 | 1,856 (20.4%) | 1,242 (17.2%) |
| $150,000 or more | 3,419 (37.7%) | 718 (9.9%) |
| Total | 9,078 (100.0%) | 7,235 (100.0%) |
Monthly Housing Cost Tiers in Covina
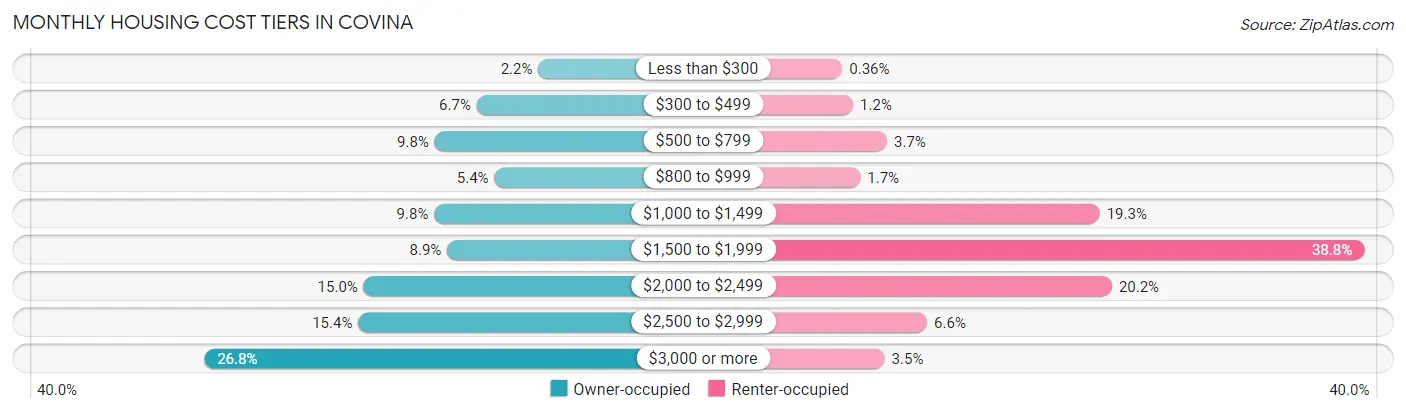
| Monthly Cost | Owner-occupied | Renter-occupied |
| Less than $300 | 197 (2.2%) | 26 (0.4%) |
| $300 to $499 | 608 (6.7%) | 84 (1.2%) |
| $500 to $799 | 890 (9.8%) | 265 (3.7%) |
| $800 to $999 | 490 (5.4%) | 122 (1.7%) |
| $1,000 to $1,499 | 892 (9.8%) | 1,398 (19.3%) |
| $1,500 to $1,999 | 806 (8.9%) | 2,806 (38.8%) |
| $2,000 to $2,499 | 1,364 (15.0%) | 1,463 (20.2%) |
| $2,500 to $2,999 | 1,401 (15.4%) | 478 (6.6%) |
| $3,000 or more | 2,430 (26.8%) | 252 (3.5%) |
| Total | 9,078 (100.0%) | 7,235 (100.0%) |
Physical Housing Characteristics in Covina
Housing Structures in Covina
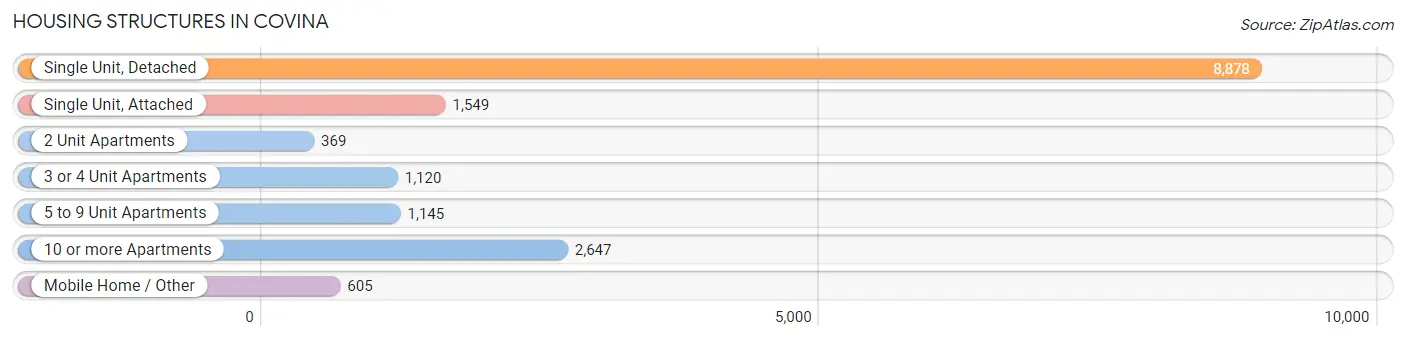
| Structure Type | # Housing Units | % Housing Units |
| Single Unit, Detached | 8,878 | 54.4% |
| Single Unit, Attached | 1,549 | 9.5% |
| 2 Unit Apartments | 369 | 2.3% |
| 3 or 4 Unit Apartments | 1,120 | 6.9% |
| 5 to 9 Unit Apartments | 1,145 | 7.0% |
| 10 or more Apartments | 2,647 | 16.2% |
| Mobile Home / Other | 605 | 3.7% |
| Total | 16,313 | 100.0% |
Housing Structures by Occupancy in Covina
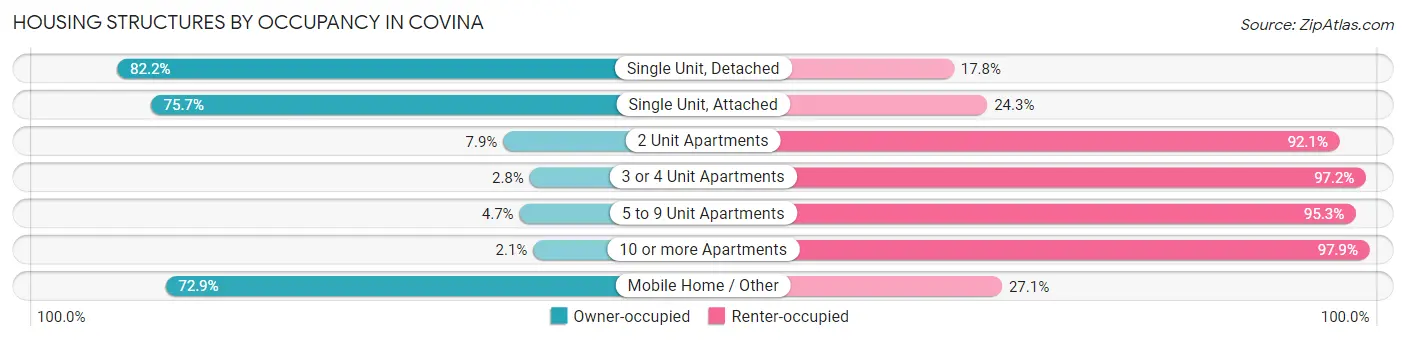
| Structure Type | Owner-occupied | Renter-occupied |
| Single Unit, Detached | 7,295 (82.2%) | 1,583 (17.8%) |
| Single Unit, Attached | 1,173 (75.7%) | 376 (24.3%) |
| 2 Unit Apartments | 29 (7.9%) | 340 (92.1%) |
| 3 or 4 Unit Apartments | 31 (2.8%) | 1,089 (97.2%) |
| 5 to 9 Unit Apartments | 54 (4.7%) | 1,091 (95.3%) |
| 10 or more Apartments | 55 (2.1%) | 2,592 (97.9%) |
| Mobile Home / Other | 441 (72.9%) | 164 (27.1%) |
| Total | 9,078 (55.6%) | 7,235 (44.4%) |
Housing Structures by Number of Rooms in Covina
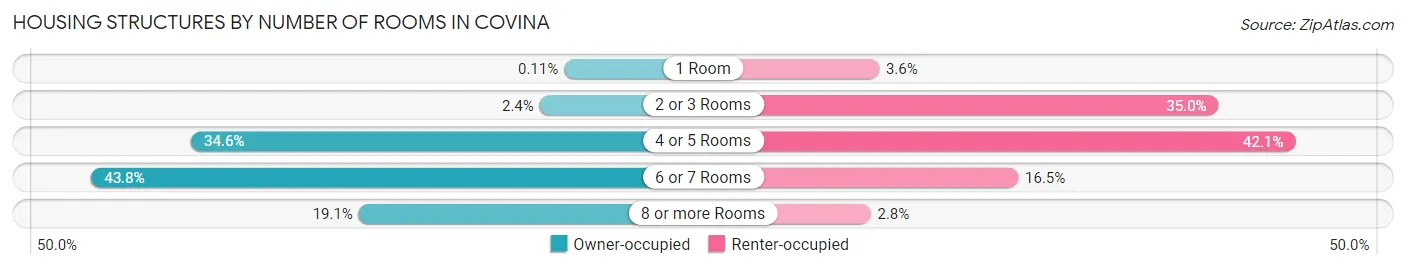
| Number of Rooms | Owner-occupied | Renter-occupied |
| 1 Room | 10 (0.1%) | 261 (3.6%) |
| 2 or 3 Rooms | 215 (2.4%) | 2,532 (35.0%) |
| 4 or 5 Rooms | 3,140 (34.6%) | 3,045 (42.1%) |
| 6 or 7 Rooms | 3,979 (43.8%) | 1,192 (16.5%) |
| 8 or more Rooms | 1,734 (19.1%) | 205 (2.8%) |
| Total | 9,078 (100.0%) | 7,235 (100.0%) |
Housing Structure by Heating Type in Covina
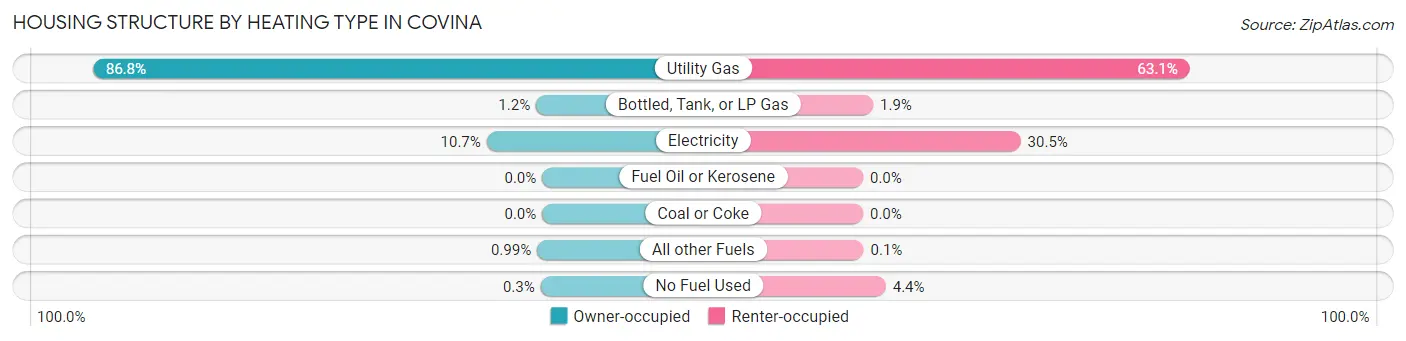
| Heating Type | Owner-occupied | Renter-occupied |
| Utility Gas | 7,881 (86.8%) | 4,566 (63.1%) |
| Bottled, Tank, or LP Gas | 107 (1.2%) | 140 (1.9%) |
| Electricity | 973 (10.7%) | 2,204 (30.5%) |
| Fuel Oil or Kerosene | 0 (0.0%) | 0 (0.0%) |
| Coal or Coke | 0 (0.0%) | 0 (0.0%) |
| All other Fuels | 90 (1.0%) | 7 (0.1%) |
| No Fuel Used | 27 (0.3%) | 318 (4.4%) |
| Total | 9,078 (100.0%) | 7,235 (100.0%) |
Household Vehicle Usage in Covina
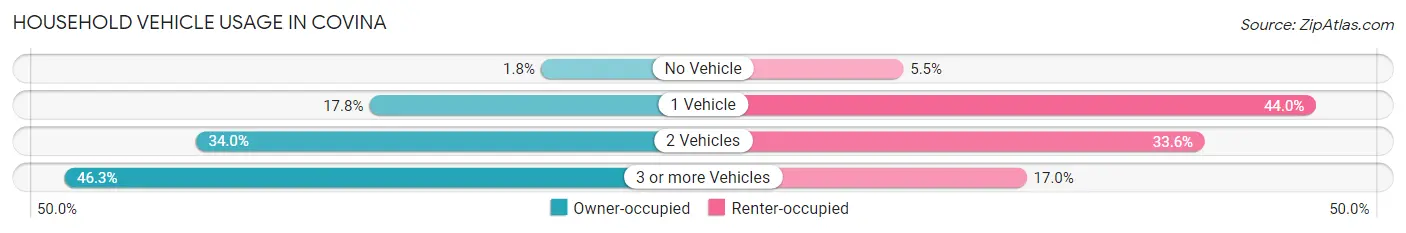
| Vehicles per Household | Owner-occupied | Renter-occupied |
| No Vehicle | 165 (1.8%) | 394 (5.4%) |
| 1 Vehicle | 1,619 (17.8%) | 3,183 (44.0%) |
| 2 Vehicles | 3,090 (34.0%) | 2,431 (33.6%) |
| 3 or more Vehicles | 4,204 (46.3%) | 1,227 (17.0%) |
| Total | 9,078 (100.0%) | 7,235 (100.0%) |
Real Estate & Mortgages in Covina
Real Estate and Mortgage Overview in Covina
| Characteristic | Without Mortgage | With Mortgage |
| Housing Units | 2,547 | 6,531 |
| Median Property Value | $567,800 | $648,600 |
| Median Household Income | $85,231 | $2,868 |
| Monthly Housing Costs | $696 | $2,422 |
| Real Estate Taxes | $3,145 | $165 |
Property Value by Mortgage Status in Covina
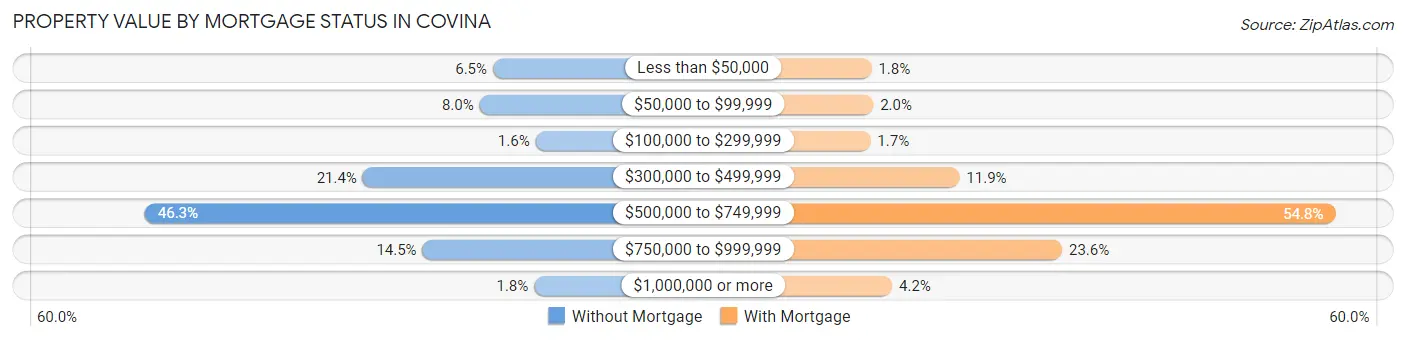
| Property Value | Without Mortgage | With Mortgage |
| Less than $50,000 | 165 (6.5%) | 119 (1.8%) |
| $50,000 to $99,999 | 204 (8.0%) | 132 (2.0%) |
| $100,000 to $299,999 | 41 (1.6%) | 111 (1.7%) |
| $300,000 to $499,999 | 544 (21.4%) | 775 (11.9%) |
| $500,000 to $749,999 | 1,178 (46.3%) | 3,580 (54.8%) |
| $750,000 to $999,999 | 370 (14.5%) | 1,541 (23.6%) |
| $1,000,000 or more | 45 (1.8%) | 273 (4.2%) |
| Total | 2,547 (100.0%) | 6,531 (100.0%) |
Household Income by Mortgage Status in Covina
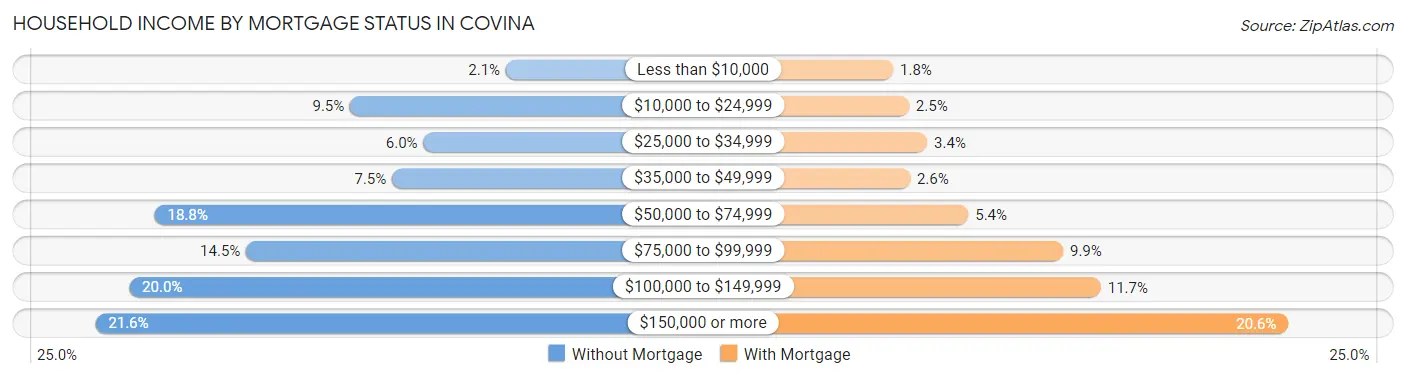
| Household Income | Without Mortgage | With Mortgage |
| Less than $10,000 | 53 (2.1%) | 117 (1.8%) |
| $10,000 to $24,999 | 242 (9.5%) | 166 (2.5%) |
| $25,000 to $34,999 | 153 (6.0%) | 223 (3.4%) |
| $35,000 to $49,999 | 191 (7.5%) | 169 (2.6%) |
| $50,000 to $74,999 | 479 (18.8%) | 351 (5.4%) |
| $75,000 to $99,999 | 368 (14.4%) | 645 (9.9%) |
| $100,000 to $149,999 | 510 (20.0%) | 763 (11.7%) |
| $150,000 or more | 551 (21.6%) | 1,346 (20.6%) |
| Total | 2,547 (100.0%) | 6,531 (100.0%) |
Property Value to Household Income Ratio in Covina
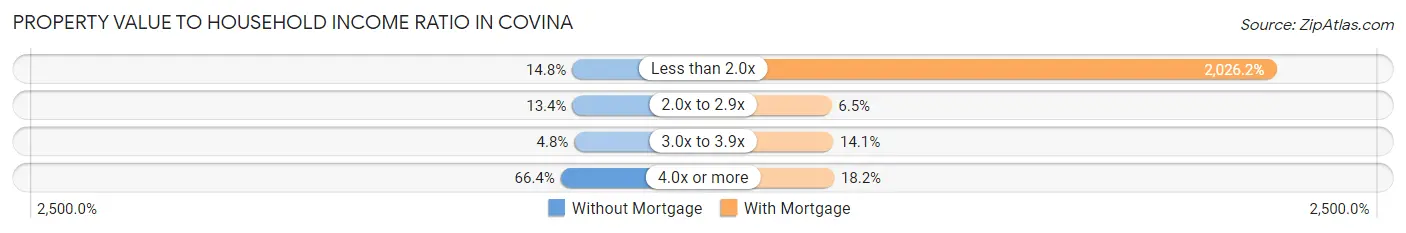
| Value-to-Income Ratio | Without Mortgage | With Mortgage |
| Less than 2.0x | 377 (14.8%) | 132,331 (2,026.2%) |
| 2.0x to 2.9x | 340 (13.4%) | 426 (6.5%) |
| 3.0x to 3.9x | 121 (4.8%) | 920 (14.1%) |
| 4.0x or more | 1,690 (66.3%) | 1,191 (18.2%) |
| Total | 2,547 (100.0%) | 6,531 (100.0%) |
Real Estate Taxes by Mortgage Status in Covina
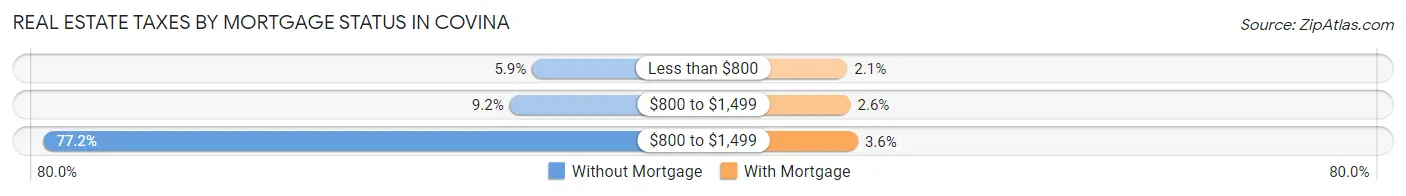
| Property Taxes | Without Mortgage | With Mortgage |
| Less than $800 | 149 (5.9%) | 137 (2.1%) |
| $800 to $1,499 | 233 (9.1%) | 167 (2.6%) |
| $800 to $1,499 | 1,967 (77.2%) | 238 (3.6%) |
| Total | 2,547 (100.0%) | 6,531 (100.0%) |
Health & Disability in Covina
Health Insurance Coverage by Age in Covina
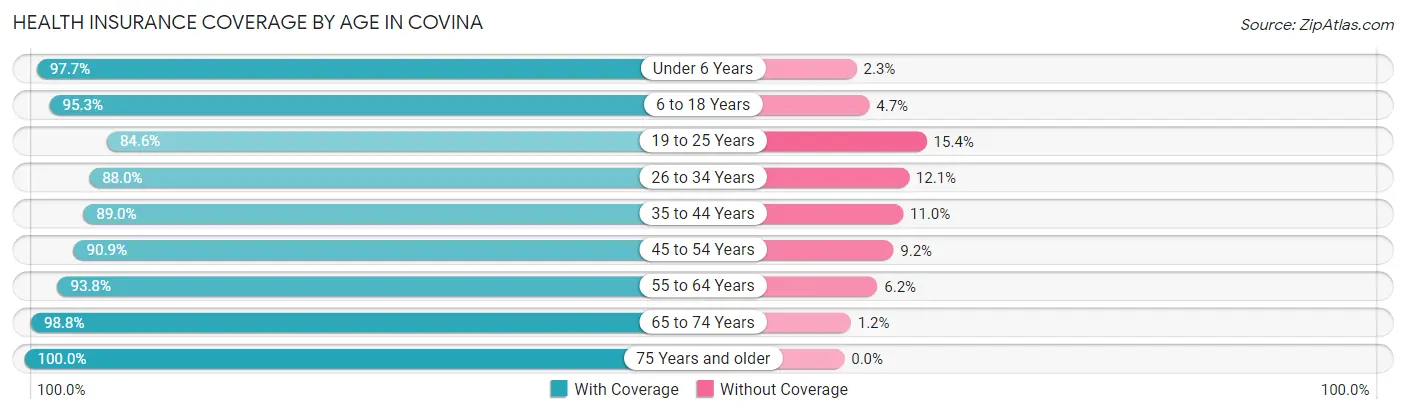
| Age Bracket | With Coverage | Without Coverage |
| Under 6 Years | 3,193 (97.7%) | 75 (2.3%) |
| 6 to 18 Years | 7,701 (95.3%) | 378 (4.7%) |
| 19 to 25 Years | 4,044 (84.6%) | 734 (15.4%) |
| 26 to 34 Years | 6,177 (87.9%) | 846 (12.0%) |
| 35 to 44 Years | 6,747 (89.0%) | 831 (11.0%) |
| 45 to 54 Years | 6,169 (90.8%) | 621 (9.1%) |
| 55 to 64 Years | 5,985 (93.8%) | 393 (6.2%) |
| 65 to 74 Years | 3,525 (98.8%) | 43 (1.2%) |
| 75 Years and older | 2,935 (100.0%) | 0 (0.0%) |
| Total | 46,476 (92.2%) | 3,921 (7.8%) |
Health Insurance Coverage by Citizenship Status in Covina
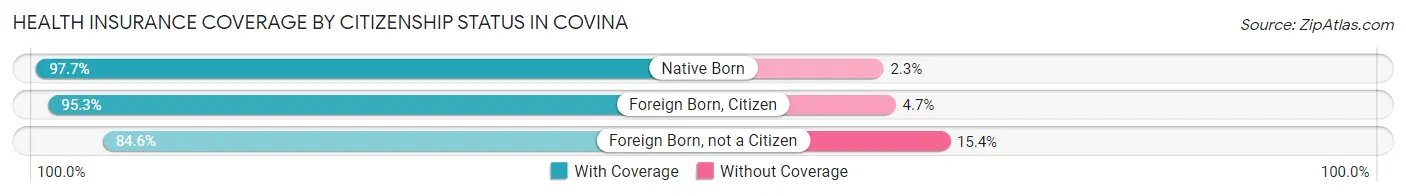
| Citizenship Status | With Coverage | Without Coverage |
| Native Born | 3,193 (97.7%) | 75 (2.3%) |
| Foreign Born, Citizen | 7,701 (95.3%) | 378 (4.7%) |
| Foreign Born, not a Citizen | 4,044 (84.6%) | 734 (15.4%) |
Health Insurance Coverage by Household Income in Covina
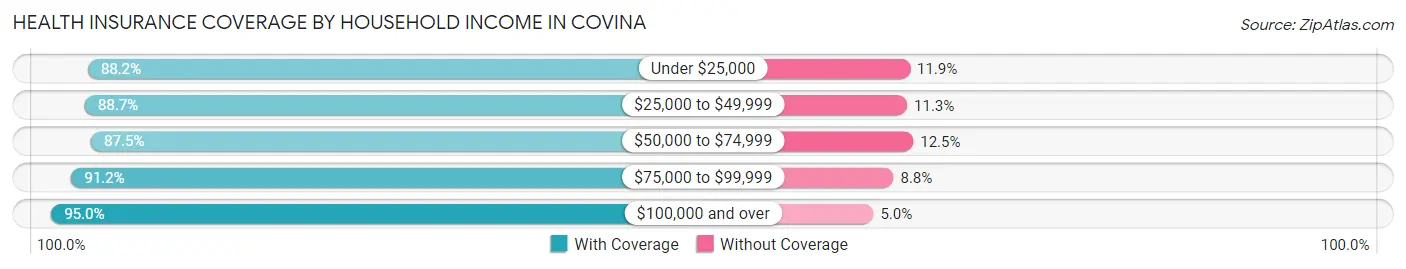
| Household Income | With Coverage | Without Coverage |
| Under $25,000 | 2,625 (88.1%) | 353 (11.8%) |
| $25,000 to $49,999 | 5,614 (88.7%) | 715 (11.3%) |
| $50,000 to $74,999 | 6,005 (87.5%) | 855 (12.5%) |
| $75,000 to $99,999 | 6,539 (91.2%) | 628 (8.8%) |
| $100,000 and over | 25,518 (95.0%) | 1,342 (5.0%) |
Public vs Private Health Insurance Coverage by Age in Covina
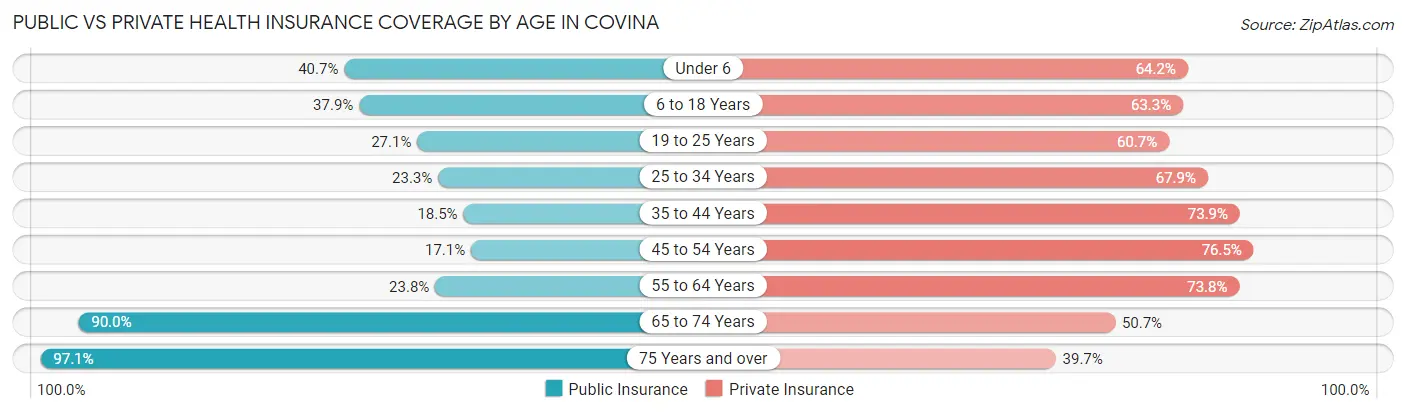
| Age Bracket | Public Insurance | Private Insurance |
| Under 6 | 1,329 (40.7%) | 2,098 (64.2%) |
| 6 to 18 Years | 3,062 (37.9%) | 5,117 (63.3%) |
| 19 to 25 Years | 1,296 (27.1%) | 2,902 (60.7%) |
| 25 to 34 Years | 1,633 (23.3%) | 4,771 (67.9%) |
| 35 to 44 Years | 1,405 (18.5%) | 5,599 (73.9%) |
| 45 to 54 Years | 1,164 (17.1%) | 5,191 (76.4%) |
| 55 to 64 Years | 1,518 (23.8%) | 4,705 (73.8%) |
| 65 to 74 Years | 3,212 (90.0%) | 1,809 (50.7%) |
| 75 Years and over | 2,849 (97.1%) | 1,165 (39.7%) |
| Total | 17,468 (34.7%) | 33,357 (66.2%) |
Disability Status by Sex by Age in Covina
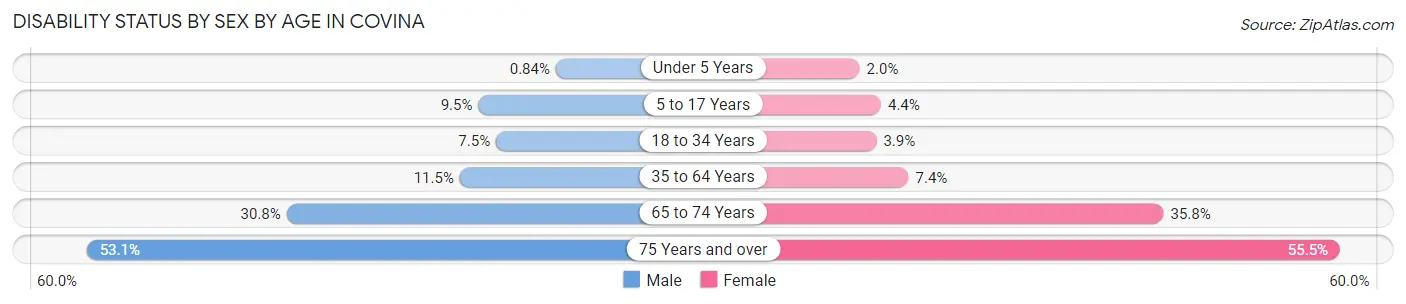
| Age Bracket | Male | Female |
| Under 5 Years | 11 (0.8%) | 28 (2.0%) |
| 5 to 17 Years | 390 (9.5%) | 166 (4.4%) |
| 18 to 34 Years | 525 (7.5%) | 212 (3.9%) |
| 35 to 64 Years | 1,176 (11.5%) | 786 (7.4%) |
| 65 to 74 Years | 545 (30.8%) | 645 (35.8%) |
| 75 Years and over | 689 (53.1%) | 908 (55.5%) |
Disability Class by Sex by Age in Covina
Disability Class: Hearing Difficulty
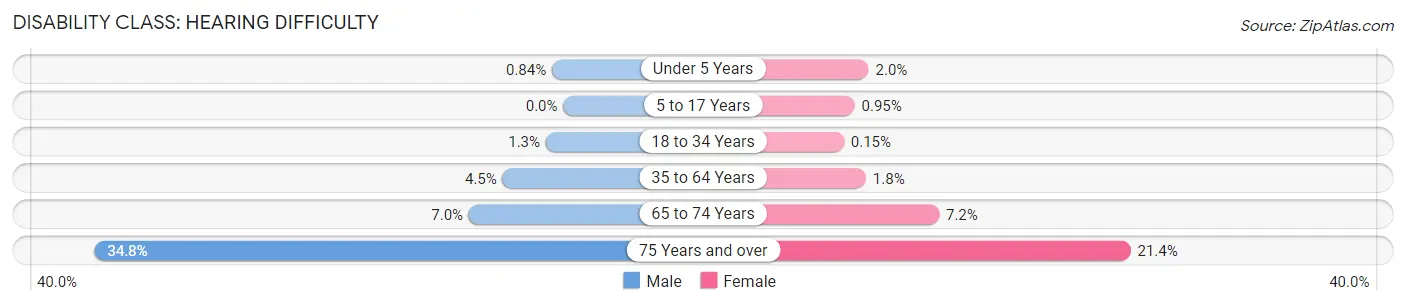
| Age Bracket | Male | Female |
| Under 5 Years | 11 (0.8%) | 28 (2.0%) |
| 5 to 17 Years | 0 (0.0%) | 36 (0.9%) |
| 18 to 34 Years | 91 (1.3%) | 8 (0.2%) |
| 35 to 64 Years | 459 (4.5%) | 189 (1.8%) |
| 65 to 74 Years | 124 (7.0%) | 130 (7.2%) |
| 75 Years and over | 452 (34.8%) | 351 (21.4%) |
Disability Class: Vision Difficulty
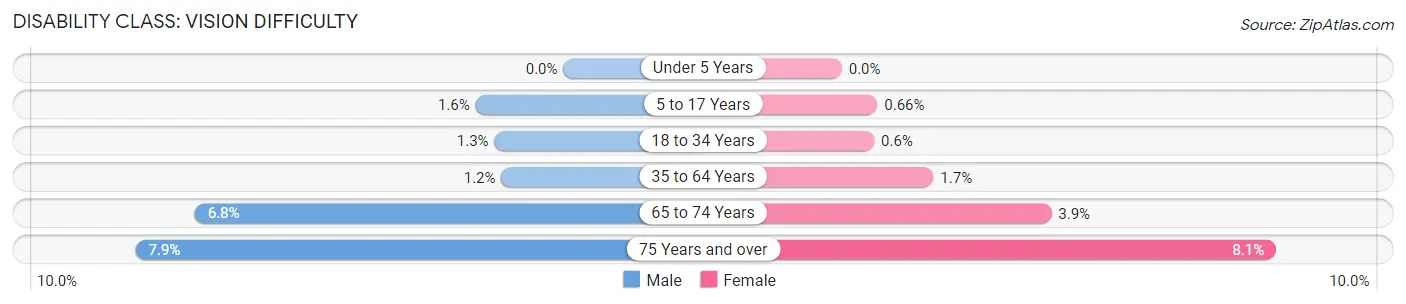
| Age Bracket | Male | Female |
| Under 5 Years | 0 (0.0%) | 0 (0.0%) |
| 5 to 17 Years | 67 (1.6%) | 25 (0.7%) |
| 18 to 34 Years | 90 (1.3%) | 33 (0.6%) |
| 35 to 64 Years | 117 (1.1%) | 179 (1.7%) |
| 65 to 74 Years | 121 (6.8%) | 70 (3.9%) |
| 75 Years and over | 103 (7.9%) | 132 (8.1%) |
Disability Class: Cognitive Difficulty
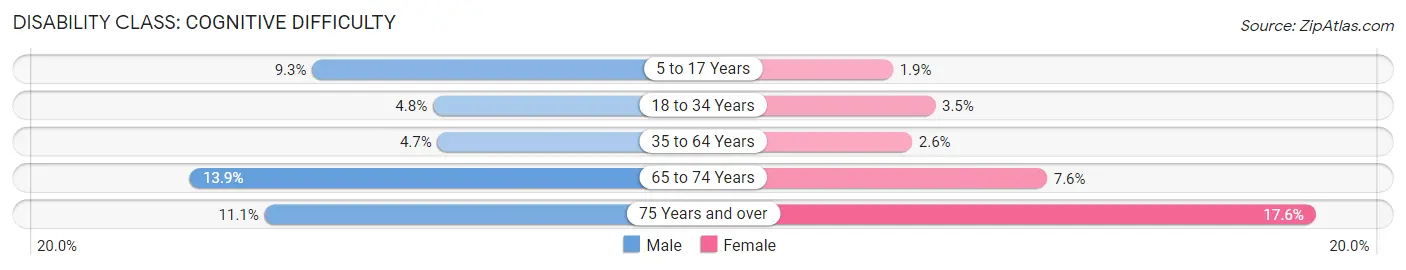
| Age Bracket | Male | Female |
| 5 to 17 Years | 384 (9.3%) | 72 (1.9%) |
| 18 to 34 Years | 339 (4.8%) | 190 (3.5%) |
| 35 to 64 Years | 476 (4.7%) | 274 (2.6%) |
| 65 to 74 Years | 245 (13.9%) | 137 (7.6%) |
| 75 Years and over | 144 (11.1%) | 288 (17.6%) |
Disability Class: Ambulatory Difficulty
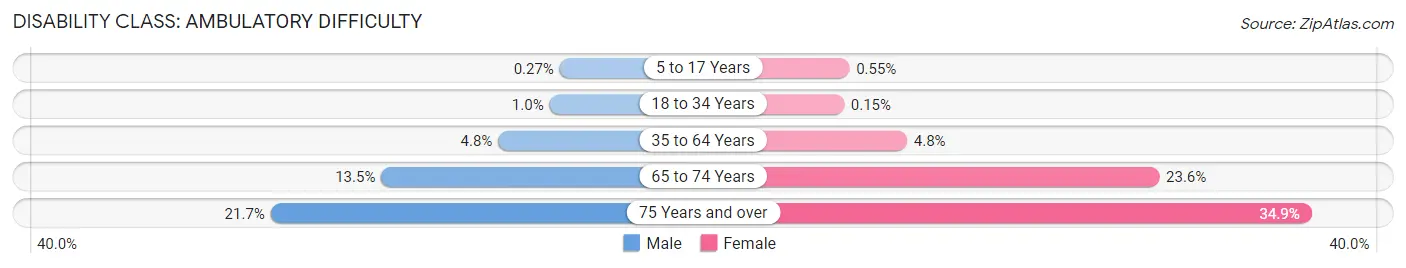
| Age Bracket | Male | Female |
| 5 to 17 Years | 11 (0.3%) | 21 (0.5%) |
| 18 to 34 Years | 72 (1.0%) | 8 (0.2%) |
| 35 to 64 Years | 493 (4.8%) | 510 (4.8%) |
| 65 to 74 Years | 239 (13.5%) | 424 (23.6%) |
| 75 Years and over | 282 (21.7%) | 571 (34.9%) |
Disability Class: Self-Care Difficulty
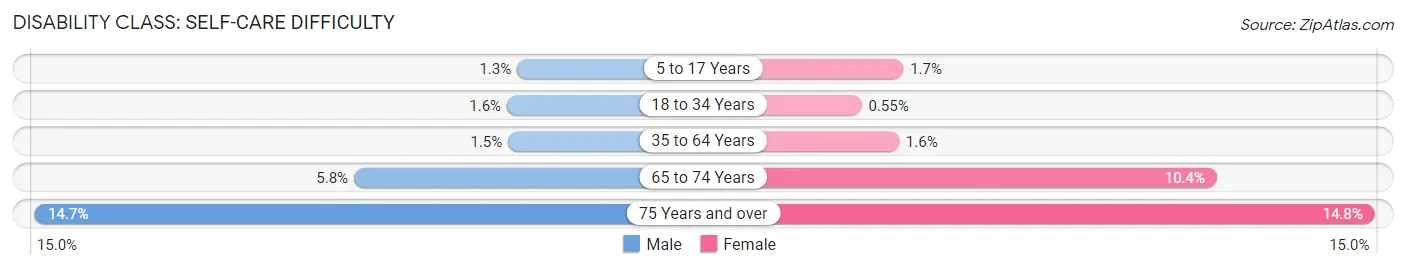
| Age Bracket | Male | Female |
| 5 to 17 Years | 53 (1.3%) | 65 (1.7%) |
| 18 to 34 Years | 110 (1.6%) | 30 (0.5%) |
| 35 to 64 Years | 157 (1.5%) | 168 (1.6%) |
| 65 to 74 Years | 103 (5.8%) | 188 (10.4%) |
| 75 Years and over | 191 (14.7%) | 243 (14.8%) |
Technology Access in Covina
Computing Device Access in Covina
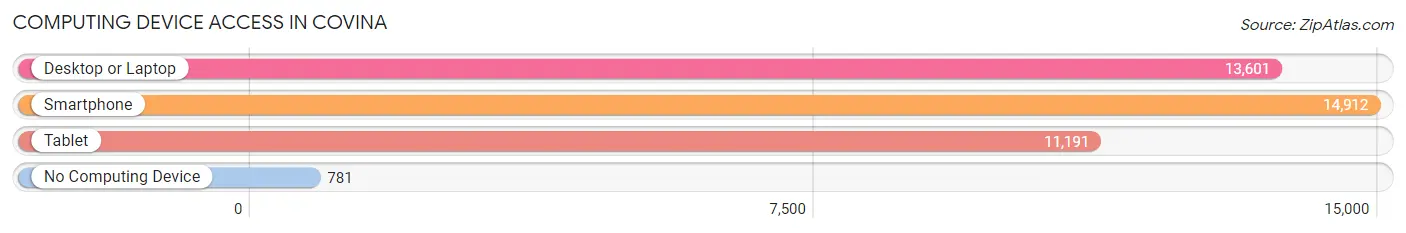
| Device Type | # Households | % Households |
| Desktop or Laptop | 13,601 | 83.4% |
| Smartphone | 14,912 | 91.4% |
| Tablet | 11,191 | 68.6% |
| No Computing Device | 781 | 4.8% |
| Total | 16,313 | 100.0% |
Internet Access in Covina
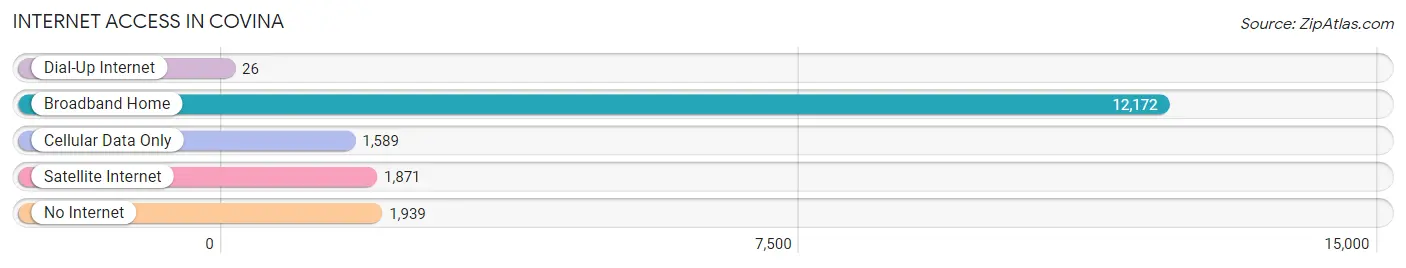
| Internet Type | # Households | % Households |
| Dial-Up Internet | 26 | 0.2% |
| Broadband Home | 12,172 | 74.6% |
| Cellular Data Only | 1,589 | 9.7% |
| Satellite Internet | 1,871 | 11.5% |
| No Internet | 1,939 | 11.9% |
| Total | 16,313 | 100.0% |
Covina Summary
Covina is a city located in Los Angeles County, California, United States. It is located about 22 miles east of downtown Los Angeles. The population was 47,796 at the 2010 census, up from 46,837 at the 2000 census. The city's slogan, "One Mile Square and All There", was coined when the incorporated area of the city was only (some say slightly less than) one square mile.
Geography
Covina is located at 34°5′39″N 117°52′57″W (34.094167, -117.882500). According to the United States Census Bureau, the city has a total area of 7.5 square miles (19.4 km2), all land.
Covina is bordered by West Covina to the north and east, San Dimas to the south, and Azusa and Glendora to the west. The San Gabriel Mountains range to the north and east, and the San Jose Hills to the south and west.
Economy
Covina s economy is largely based on retail and services The top employers in the city are
1 Wal Mart
2 Covina Valley Unified School District
3 St Francis Medical Center
4 City of Covina
5 Home Depot
6 Target
7 Lowe s
8 Walgreens
9 Covina Valley Medical Center
10 Kaiser Permanente
Demographics
As of the census of 2000, there were 46,837 people, 15,967 households, and 11,755 families residing in the city. The population density was 6,232.4 inhabitants per square mile (2,405.2/km2). There were 16,330 housing units at an average density of 2,182.3 per square mile (841.3/km2). The racial makeup of the city was 63.32% White, 4.00% African American, 1.20% Native American, 6.00% Asian, 0.26% Pacific Islander, 21.04% from other races, and 4.18% from two or more races. Hispanic or Latino of any race were 41.04% of the population.
There were 15,967 households, out of which 39.7% had children under the age of 18 living with them, 54.2% were married couples living together, 14.2% had a female householder with no husband present, and 25.2% were non-families. 20.7% of all households were made up of individuals, and 8.9% had someone living alone who was 65 years of age or older. The average household size was 2.92 and the average family size was 3.39.
In the city, the population was spread out, with 28.3% under the age of 18, 9.7% from 18 to 24, 30.6% from 25 to 44, 19.9% from 45 to 64, and 11.5% who were 65 years of age or older. The median age was 33 years. For every 100 females, there were 93.2 males. For every 100 females age 18 and over, there were 89.7 males.
The median income for a household in the city was $49,156, and the median income for a family was $55,539. Males had a median income of $40,939 versus $31,831 for females. The per capita income for the city was $20,945. About 8.7% of families and 11.2% of the population were below the poverty line, including 15.2% of those under age 18 and 7.7% of those age 65 or over.
Common Questions
What is Per Capita Income in Covina?
Per Capita income in Covina is $37,234.
What is the Median Family Income in Covina?
Median Family Income in Covina is $104,750.
What is the Median Household income in Covina?
Median Household Income in Covina is $89,650.
What is Income or Wage Gap in Covina?
Income or Wage Gap in Covina is 2.8%.
Women in Covina earn 97.2 cents for every dollar earned by a man.
What is Family Income Deficit in Covina?
Family Income Deficit in Covina is $9,584.
Families that are below poverty line in Covina earn $9,584 less on average than the poverty threshold level.
What is Inequality or Gini Index in Covina?
Inequality or Gini Index in Covina is 0.41.
What is the Total Population of Covina?
Total Population of Covina is 50,717.
What is the Total Male Population of Covina?
Total Male Population of Covina is 25,840.
What is the Total Female Population of Covina?
Total Female Population of Covina is 24,877.
What is the Ratio of Males per 100 Females in Covina?
There are 103.87 Males per 100 Females in Covina.
What is the Ratio of Females per 100 Males in Covina?
There are 96.27 Females per 100 Males in Covina.
What is the Median Population Age in Covina?
Median Population Age in Covina is 37.6 Years.
What is the Average Family Size in Covina
Average Family Size in Covina is 3.6 People.
What is the Average Household Size in Covina
Average Household Size in Covina is 3.1 People.
How Large is the Labor Force in Covina?
There are 28,550 People in the Labor Forcein in Covina.
What is the Percentage of People in the Labor Force in Covina?
69.4% of People are in the Labor Force in Covina.
What is the Unemployment Rate in Covina?
Unemployment Rate in Covina is 5.7%.