South San Francisco, CA Map & Demographics
South San Francisco Map
South San Francisco Overview
$58,031
PER CAPITA INCOME
$139,181
AVG FAMILY INCOME
$127,062
AVG HOUSEHOLD INCOME
13.0%
WAGE / INCOME GAP [ % ]
87.0¢/ $1
WAGE / INCOME GAP [ $ ]
$11,323
FAMILY INCOME DEFICIT
0.45
INEQUALITY / GINI INDEX
65,596
TOTAL POPULATION
32,737
MALE POPULATION
32,859
FEMALE POPULATION
99.63
MALES / 100 FEMALES
100.37
FEMALES / 100 MALES
42.3
MEDIAN AGE
3.4
AVG FAMILY SIZE
2.9
AVG HOUSEHOLD SIZE
37,506
LABOR FORCE [ PEOPLE ]
67.2%
PERCENT IN LABOR FORCE
2.4%
UNEMPLOYMENT RATE
South San Francisco Zip Codes
South San Francisco Area Codes
Income in South San Francisco
Income Overview in South San Francisco
Per Capita Income in South San Francisco is $58,031, while median incomes of families and households are $139,181 and $127,062 respectively.
| Characteristic | Number | Measure |
| Per Capita Income | 65,596 | $58,031 |
| Median Family Income | 15,823 | $139,181 |
| Mean Family Income | 15,823 | $165,362 |
| Median Household Income | 22,036 | $127,062 |
| Mean Household Income | 22,036 | $166,256 |
| Income Deficit | 15,823 | $11,323 |
| Wage / Income Gap (%) | 65,596 | 12.95% |
| Wage / Income Gap ($) | 65,596 | 87.05¢ per $1 |
| Gini / Inequality Index | 65,596 | 0.45 |
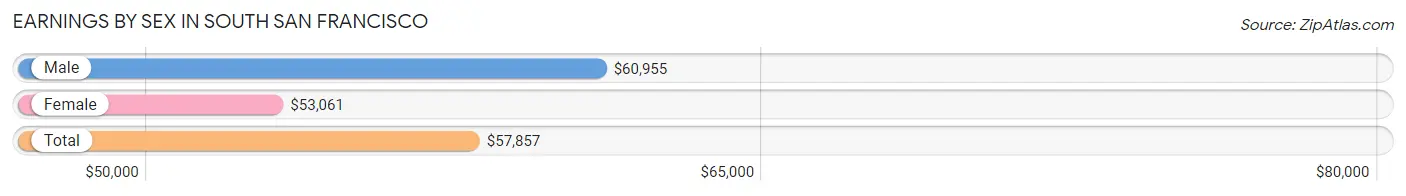
Earnings by Sex in South San Francisco
Average Earnings in South San Francisco are $57,857, $60,955 for men and $53,061 for women, a difference of 13.0%.
| Sex | Number | Average Earnings |
| Male | 20,597 (53.2%) | $60,955 |
| Female | 18,128 (46.8%) | $53,061 |
| Total | 38,725 (100.0%) | $57,857 |
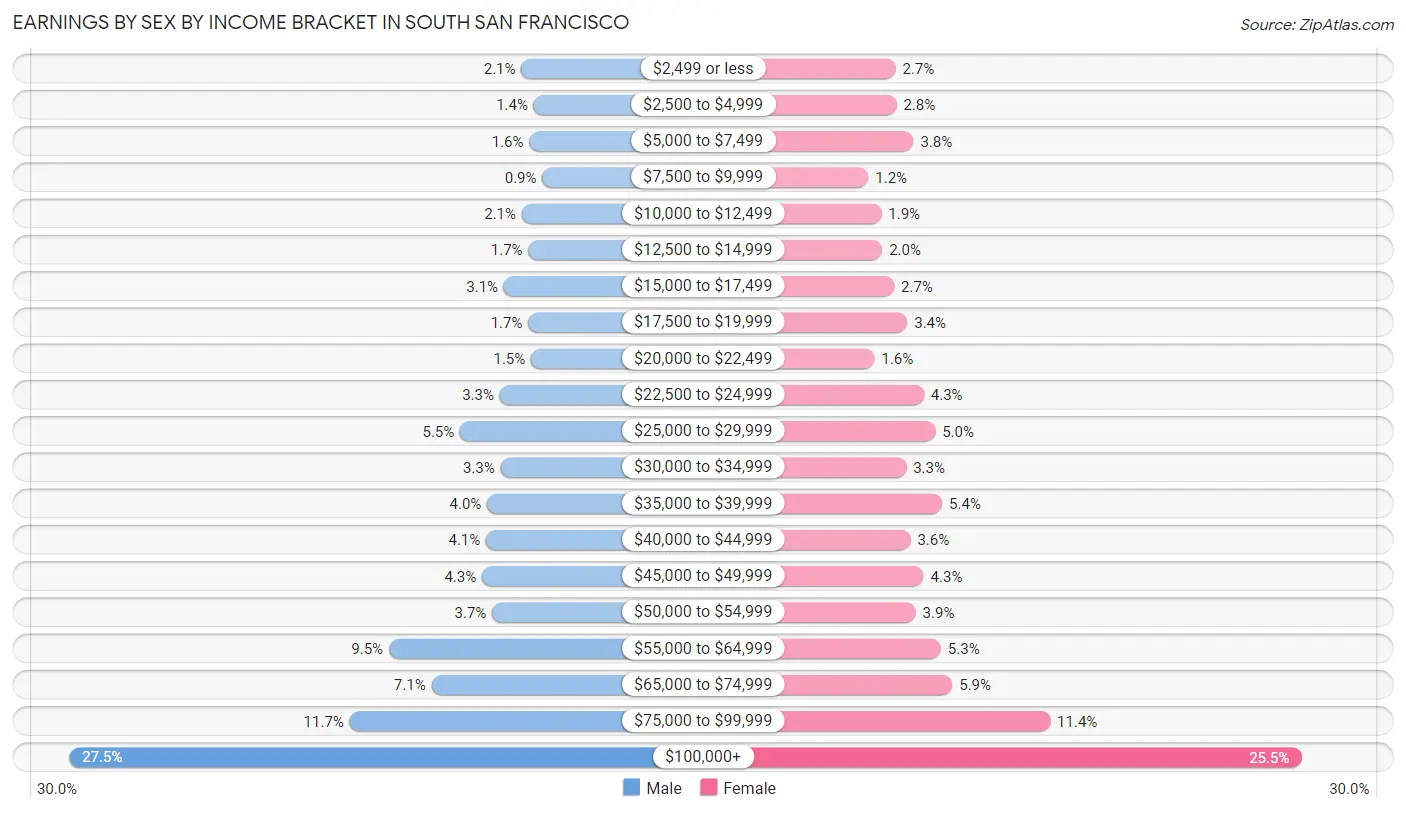
Earnings by Sex by Income Bracket in South San Francisco
The most common earnings brackets in South San Francisco are $100,000+ for men (5,664 | 27.5%) and $100,000+ for women (4,630 | 25.5%).
| Income | Male | Female |
| $2,499 or less | 429 (2.1%) | 497 (2.7%) |
| $2,500 to $4,999 | 284 (1.4%) | 505 (2.8%) |
| $5,000 to $7,499 | 336 (1.6%) | 679 (3.7%) |
| $7,500 to $9,999 | 185 (0.9%) | 220 (1.2%) |
| $10,000 to $12,499 | 422 (2.1%) | 352 (1.9%) |
| $12,500 to $14,999 | 347 (1.7%) | 361 (2.0%) |
| $15,000 to $17,499 | 630 (3.1%) | 482 (2.7%) |
| $17,500 to $19,999 | 349 (1.7%) | 617 (3.4%) |
| $20,000 to $22,499 | 315 (1.5%) | 282 (1.6%) |
| $22,500 to $24,999 | 677 (3.3%) | 785 (4.3%) |
| $25,000 to $29,999 | 1,136 (5.5%) | 901 (5.0%) |
| $30,000 to $34,999 | 670 (3.3%) | 605 (3.3%) |
| $35,000 to $39,999 | 824 (4.0%) | 971 (5.4%) |
| $40,000 to $44,999 | 836 (4.1%) | 649 (3.6%) |
| $45,000 to $49,999 | 883 (4.3%) | 784 (4.3%) |
| $50,000 to $54,999 | 766 (3.7%) | 702 (3.9%) |
| $55,000 to $64,999 | 1,960 (9.5%) | 959 (5.3%) |
| $65,000 to $74,999 | 1,468 (7.1%) | 1,075 (5.9%) |
| $75,000 to $99,999 | 2,416 (11.7%) | 2,072 (11.4%) |
| $100,000+ | 5,664 (27.5%) | 4,630 (25.5%) |
| Total | 20,597 (100.0%) | 18,128 (100.0%) |
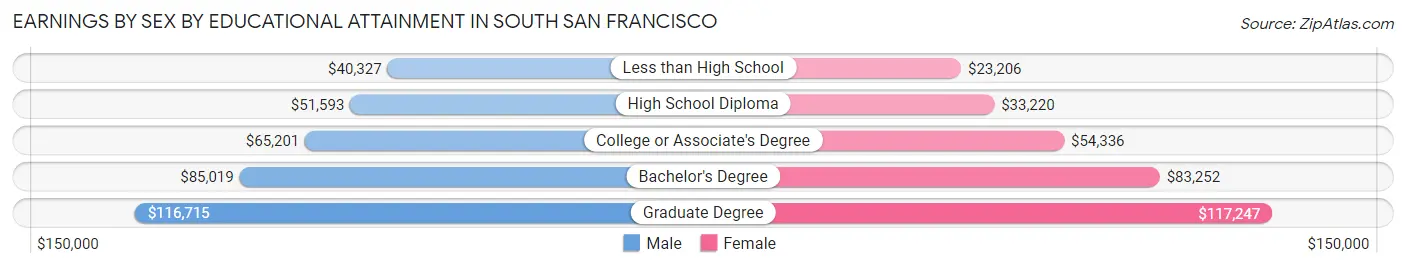
Earnings by Sex by Educational Attainment in South San Francisco
Average earnings in South San Francisco are $66,740 for men and $59,719 for women, a difference of 10.5%. Men with an educational attainment of graduate degree enjoy the highest average annual earnings of $116,715, while those with less than high school education earn the least with $40,327. Women with an educational attainment of graduate degree earn the most with the average annual earnings of $117,247, while those with less than high school education have the smallest earnings of $23,206.
| Educational Attainment | Male Income | Female Income |
| Less than High School | $40,327 | $23,206 |
| High School Diploma | $51,593 | $33,220 |
| College or Associate's Degree | $65,201 | $54,336 |
| Bachelor's Degree | $85,019 | $83,252 |
| Graduate Degree | $116,715 | $117,247 |
| Total | $66,740 | $59,719 |
Family Income in South San Francisco
Family Income Brackets in South San Francisco
According to the South San Francisco family income data, there are 4,842 families falling into the $200,000+ income range, which is the most common income bracket and makes up 30.6% of all families. Conversely, the $10,000 to $14,999 income bracket is the least frequent group with only 63 families (0.4%) belonging to this category.
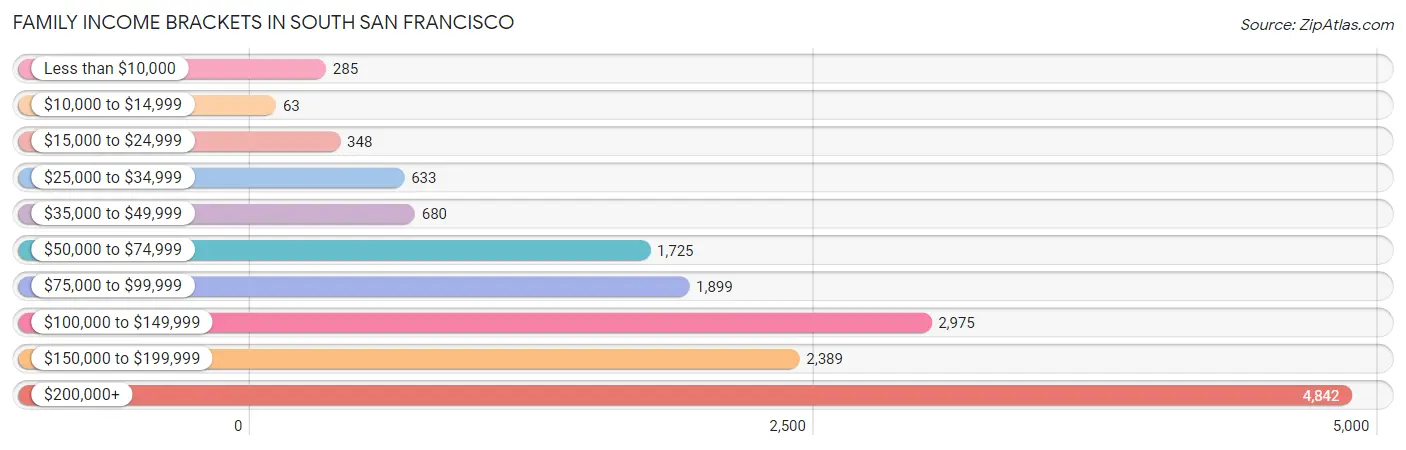
| Income Bracket | # Families | % Families |
| Less than $10,000 | 285 | 1.8% |
| $10,000 to $14,999 | 63 | 0.4% |
| $15,000 to $24,999 | 348 | 2.2% |
| $25,000 to $34,999 | 633 | 4.0% |
| $35,000 to $49,999 | 680 | 4.3% |
| $50,000 to $74,999 | 1,725 | 10.9% |
| $75,000 to $99,999 | 1,899 | 12.0% |
| $100,000 to $149,999 | 2,975 | 18.8% |
| $150,000 to $199,999 | 2,389 | 15.1% |
| $200,000+ | 4,842 | 30.6% |
Family Income by Famaliy Size in South San Francisco
7+ person families (215 | 1.4%) account for the highest median family income in South San Francisco with $231,971 per family, while 2-person families (6,560 | 41.5%) have the highest median income of $50,318 per family member.
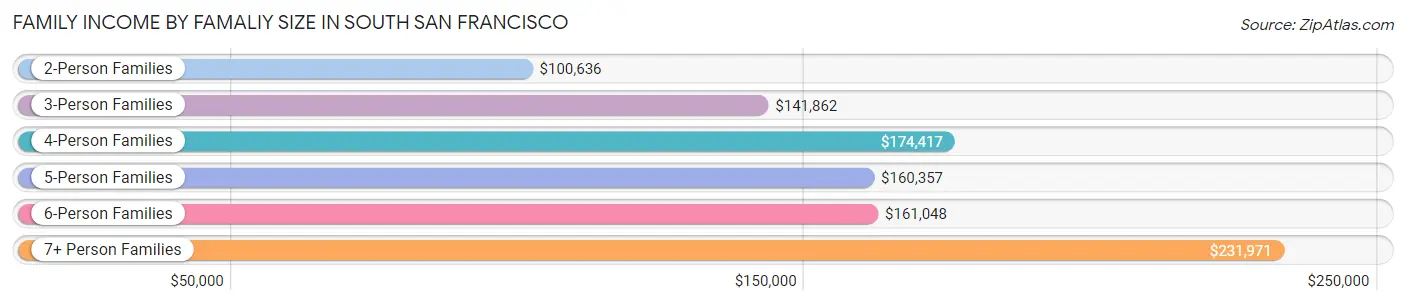
| Income Bracket | # Families | Median Income |
| 2-Person Families | 6,560 (41.5%) | $100,636 |
| 3-Person Families | 3,572 (22.6%) | $141,862 |
| 4-Person Families | 3,323 (21.0%) | $174,417 |
| 5-Person Families | 1,526 (9.6%) | $160,357 |
| 6-Person Families | 627 (4.0%) | $161,048 |
| 7+ Person Families | 215 (1.4%) | $231,971 |
| Total | 15,823 (100.0%) | $139,181 |
Family Income by Number of Earners in South San Francisco
The median family income in South San Francisco is $139,181, with families comprising 3+ earners (2,848) having the highest median family income of $205,619, while families with no earners (1,524) have the lowest median family income of $54,315, accounting for 18.0% and 9.6% of families, respectively.
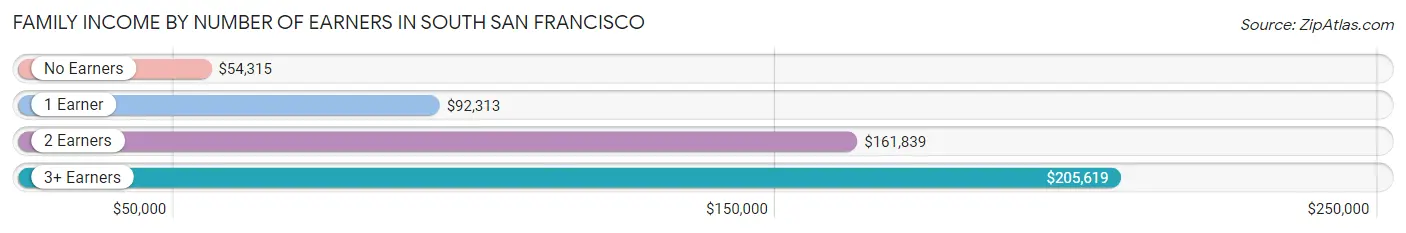
| Number of Earners | # Families | Median Income |
| No Earners | 1,524 (9.6%) | $54,315 |
| 1 Earner | 4,060 (25.7%) | $92,313 |
| 2 Earners | 7,391 (46.7%) | $161,839 |
| 3+ Earners | 2,848 (18.0%) | $205,619 |
| Total | 15,823 (100.0%) | $139,181 |
Household Income in South San Francisco
Household Income Brackets in South San Francisco
With 6,368 households falling in the category, the $200,000+ income range is the most frequent in South San Francisco, accounting for 28.9% of all households. In contrast, only 397 households (1.8%) fall into the $10,000 to $14,999 income bracket, making it the least populous group.
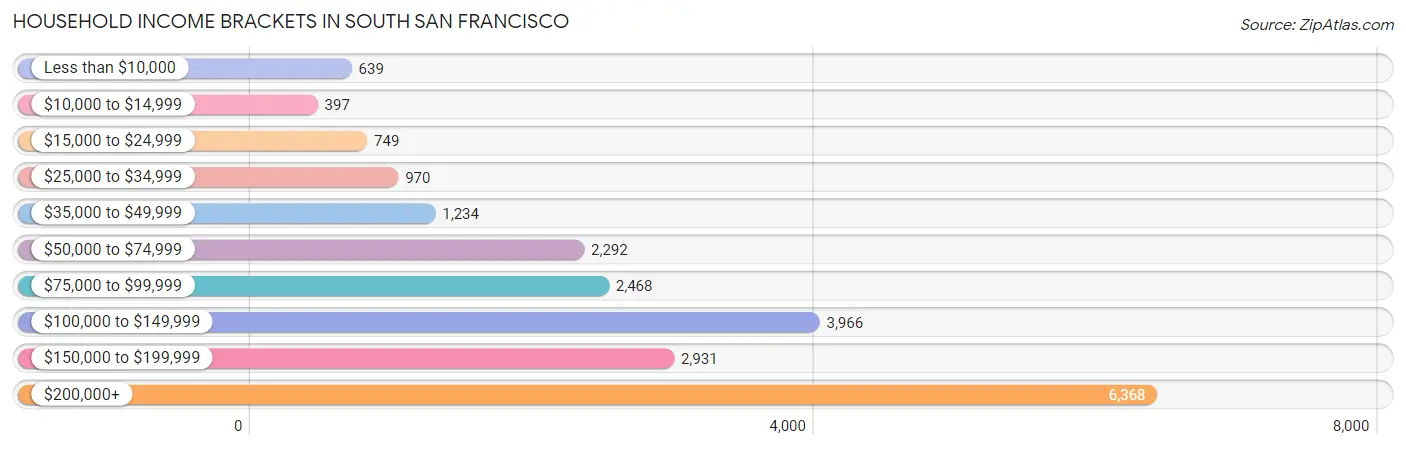
| Income Bracket | # Households | % Households |
| Less than $10,000 | 639 | 2.9% |
| $10,000 to $14,999 | 397 | 1.8% |
| $15,000 to $24,999 | 749 | 3.4% |
| $25,000 to $34,999 | 970 | 4.4% |
| $35,000 to $49,999 | 1,234 | 5.6% |
| $50,000 to $74,999 | 2,292 | 10.4% |
| $75,000 to $99,999 | 2,468 | 11.2% |
| $100,000 to $149,999 | 3,966 | 18.0% |
| $150,000 to $199,999 | 2,931 | 13.3% |
| $200,000+ | 6,368 | 28.9% |
Household Income by Householder Age in South San Francisco
The median household income in South San Francisco is $127,062, with the highest median household income of $170,898 found in the 25 to 44 years age bracket for the primary householder. A total of 6,327 households (28.7%) fall into this category. Meanwhile, the 65+ years age bracket for the primary householder has the lowest median household income of $80,328, with 6,098 households (27.7%) in this group.
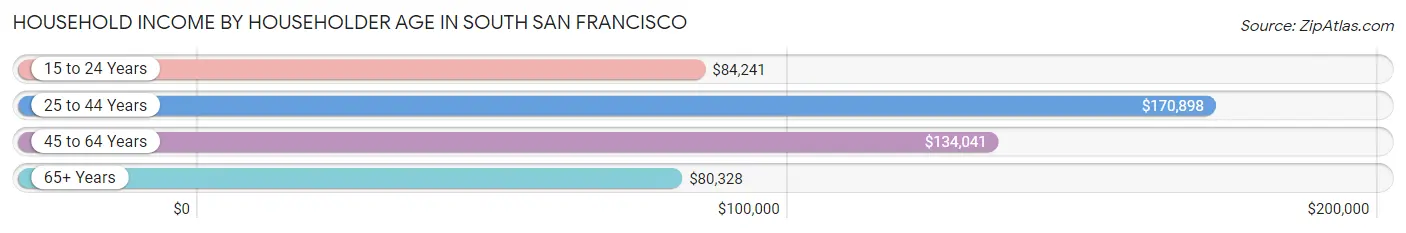
| Income Bracket | # Households | Median Income |
| 15 to 24 Years | 285 (1.3%) | $84,241 |
| 25 to 44 Years | 6,327 (28.7%) | $170,898 |
| 45 to 64 Years | 9,326 (42.3%) | $134,041 |
| 65+ Years | 6,098 (27.7%) | $80,328 |
| Total | 22,036 (100.0%) | $127,062 |
Poverty in South San Francisco
Income Below Poverty by Sex and Age in South San Francisco
With 4.9% poverty level for males and 8.6% for females among the residents of South San Francisco, 16 and 17 year old males and 75 year old and over females are the most vulnerable to poverty, with 116 males (15.7%) and 415 females (14.9%) in their respective age groups living below the poverty level.
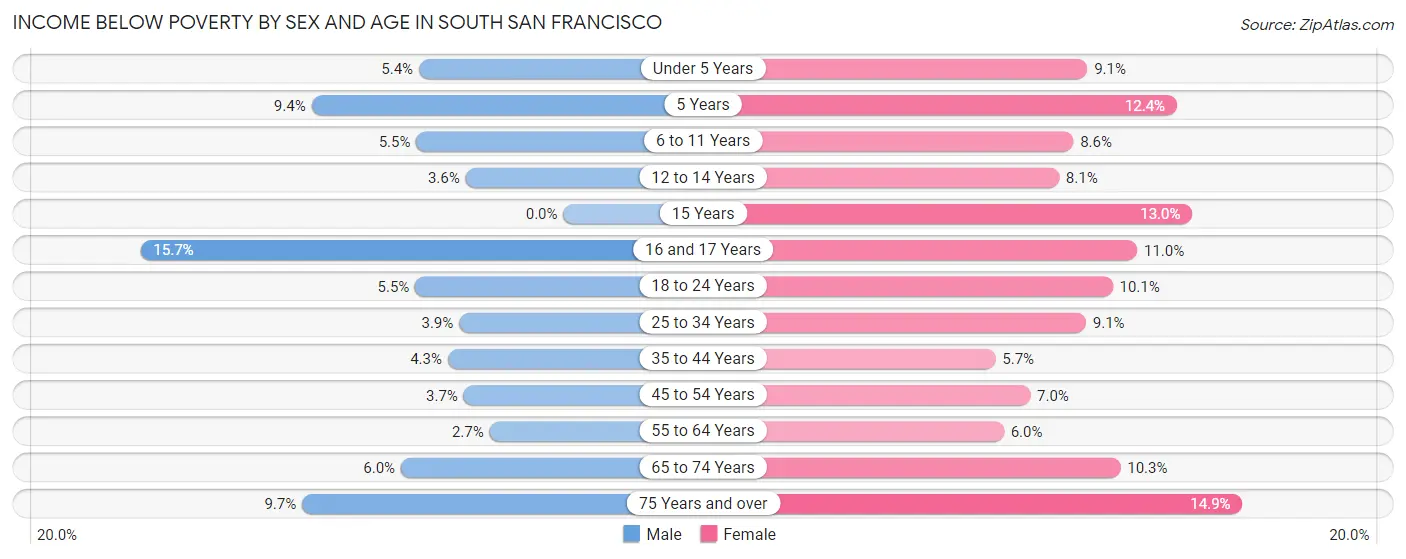
| Age Bracket | Male | Female |
| Under 5 Years | 89 (5.4%) | 113 (9.1%) |
| 5 Years | 40 (9.3%) | 27 (12.4%) |
| 6 to 11 Years | 98 (5.5%) | 177 (8.6%) |
| 12 to 14 Years | 28 (3.6%) | 78 (8.1%) |
| 15 Years | 0 (0.0%) | 32 (13.0%) |
| 16 and 17 Years | 116 (15.7%) | 74 (11.0%) |
| 18 to 24 Years | 155 (5.5%) | 264 (10.1%) |
| 25 to 34 Years | 171 (3.9%) | 419 (9.1%) |
| 35 to 44 Years | 221 (4.3%) | 247 (5.7%) |
| 45 to 54 Years | 193 (3.7%) | 297 (7.0%) |
| 55 to 64 Years | 122 (2.7%) | 308 (6.0%) |
| 65 to 74 Years | 187 (6.0%) | 378 (10.3%) |
| 75 Years and over | 175 (9.7%) | 415 (14.9%) |
| Total | 1,595 (4.9%) | 2,829 (8.6%) |
Income Above Poverty by Sex and Age in South San Francisco
According to the poverty statistics in South San Francisco, males aged 15 years and females aged 35 to 44 years are the age groups that are most secure financially, with 100.0% of males and 94.3% of females in these age groups living above the poverty line.
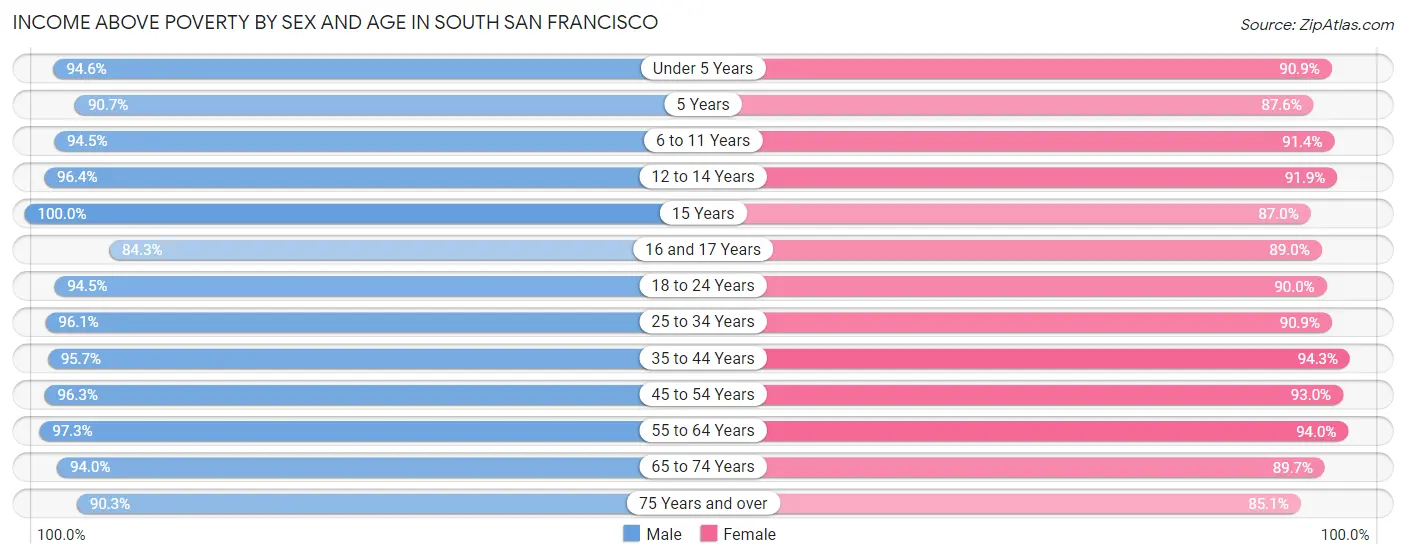
| Age Bracket | Male | Female |
| Under 5 Years | 1,570 (94.6%) | 1,127 (90.9%) |
| 5 Years | 388 (90.6%) | 190 (87.6%) |
| 6 to 11 Years | 1,696 (94.5%) | 1,884 (91.4%) |
| 12 to 14 Years | 743 (96.4%) | 890 (91.9%) |
| 15 Years | 232 (100.0%) | 214 (87.0%) |
| 16 and 17 Years | 623 (84.3%) | 601 (89.0%) |
| 18 to 24 Years | 2,662 (94.5%) | 2,364 (89.9%) |
| 25 to 34 Years | 4,250 (96.1%) | 4,206 (90.9%) |
| 35 to 44 Years | 4,925 (95.7%) | 4,090 (94.3%) |
| 45 to 54 Years | 5,019 (96.3%) | 3,952 (93.0%) |
| 55 to 64 Years | 4,333 (97.3%) | 4,815 (94.0%) |
| 65 to 74 Years | 2,914 (94.0%) | 3,279 (89.7%) |
| 75 Years and over | 1,630 (90.3%) | 2,375 (85.1%) |
| Total | 30,985 (95.1%) | 29,987 (91.4%) |
Income Below Poverty Among Married-Couple Families in South San Francisco
The poverty statistics for married-couple families in South San Francisco show that 2.3% or 275 of the total 11,866 families live below the poverty line. Families with 3 or 4 children have the highest poverty rate of 8.4%, comprising of 51 families. On the other hand, families with no children have the lowest poverty rate of 1.9%, which includes 137 families.
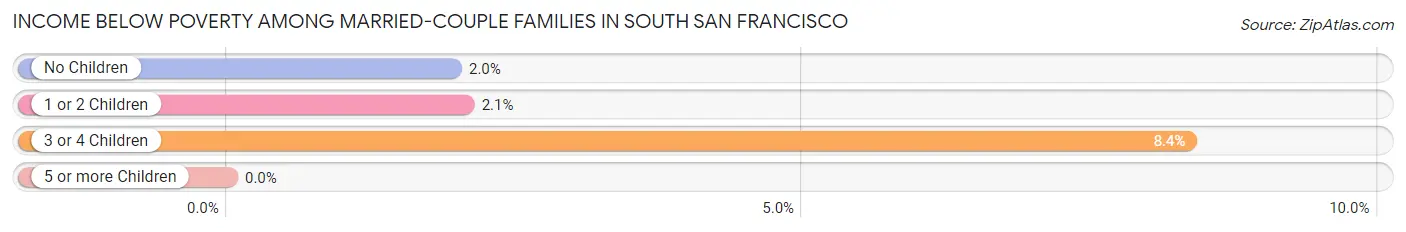
| Children | Above Poverty | Below Poverty |
| No Children | 6,903 (98.1%) | 137 (1.9%) |
| 1 or 2 Children | 4,128 (97.9%) | 87 (2.1%) |
| 3 or 4 Children | 560 (91.6%) | 51 (8.4%) |
| 5 or more Children | 0 (0.0%) | 0 (0.0%) |
| Total | 11,591 (97.7%) | 275 (2.3%) |
Income Below Poverty Among Single-Parent Households in South San Francisco
According to the poverty data in South San Francisco, 6.5% or 90 single-father households and 12.5% or 320 single-mother households are living below the poverty line. Among single-father households, those with 3 or 4 children have the highest poverty rate, with 34 households (100.0%) experiencing poverty. Likewise, among single-mother households, those with 3 or 4 children have the highest poverty rate, with 34 households (70.8%) falling below the poverty line.
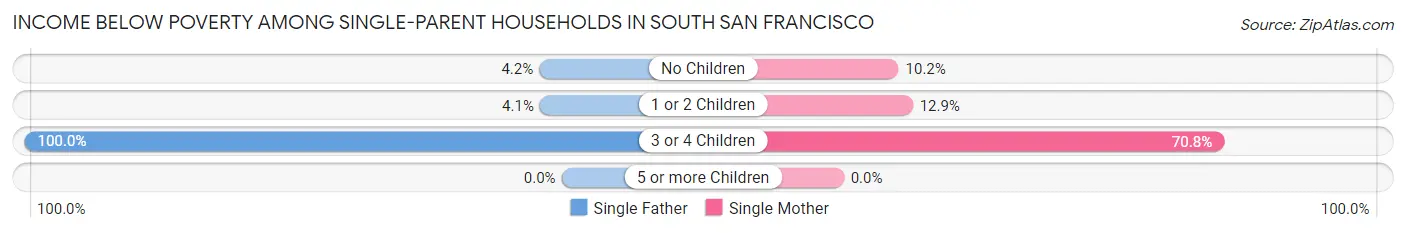
| Children | Single Father | Single Mother |
| No Children | 38 (4.2%) | 148 (10.2%) |
| 1 or 2 Children | 18 (4.1%) | 138 (12.9%) |
| 3 or 4 Children | 34 (100.0%) | 34 (70.8%) |
| 5 or more Children | 0 (0.0%) | 0 (0.0%) |
| Total | 90 (6.5%) | 320 (12.5%) |
Income Below Poverty Among Married-Couple vs Single-Parent Households in South San Francisco
The poverty data for South San Francisco shows that 275 of the married-couple family households (2.3%) and 410 of the single-parent households (10.4%) are living below the poverty level. Within the married-couple family households, those with 3 or 4 children have the highest poverty rate, with 51 households (8.4%) falling below the poverty line. Among the single-parent households, those with 3 or 4 children have the highest poverty rate, with 68 household (82.9%) living below poverty.
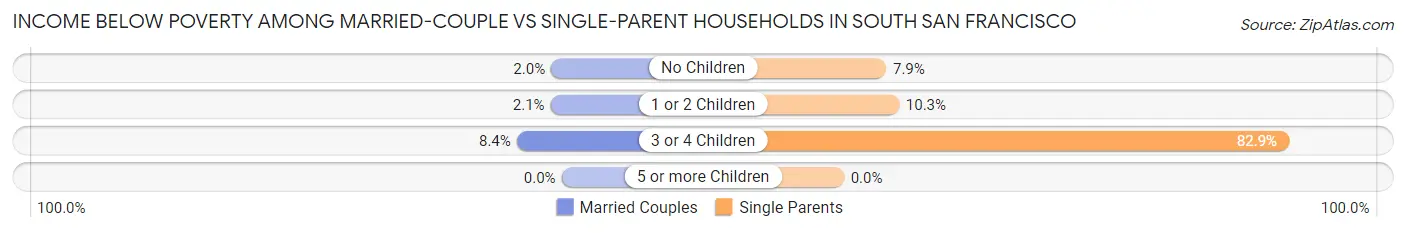
| Children | Married-Couple Families | Single-Parent Households |
| No Children | 137 (1.9%) | 186 (7.9%) |
| 1 or 2 Children | 87 (2.1%) | 156 (10.3%) |
| 3 or 4 Children | 51 (8.4%) | 68 (82.9%) |
| 5 or more Children | 0 (0.0%) | 0 (0.0%) |
| Total | 275 (2.3%) | 410 (10.4%) |
Race in South San Francisco
The most populous races in South San Francisco are Asian (28,501 | 43.4%), Hispanic or Latino (19,120 | 29.1%), and White / Caucasian (19,060 | 29.1%).
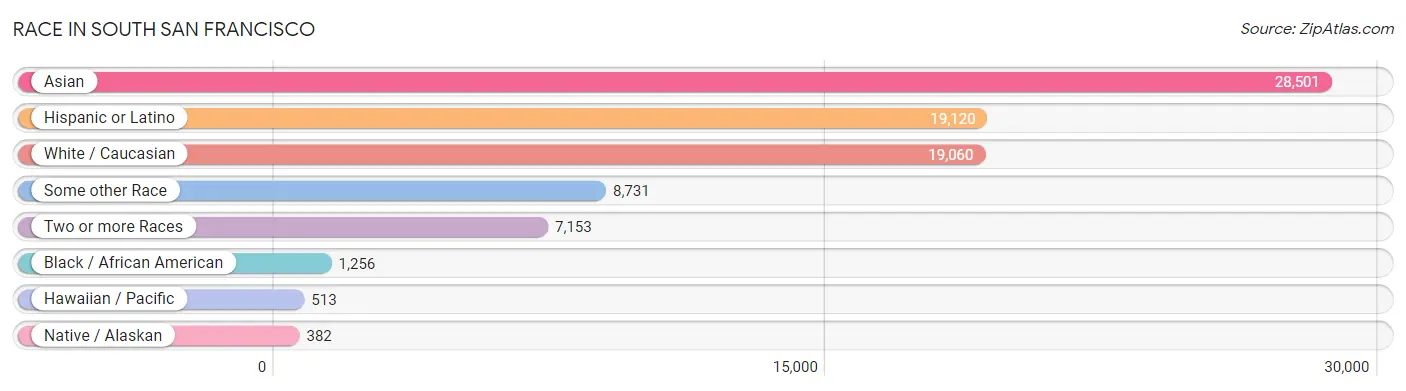
| Race | # Population | % Population |
| Asian | 28,501 | 43.4% |
| Black / African American | 1,256 | 1.9% |
| Hawaiian / Pacific | 513 | 0.8% |
| Hispanic or Latino | 19,120 | 29.1% |
| Native / Alaskan | 382 | 0.6% |
| White / Caucasian | 19,060 | 29.1% |
| Two or more Races | 7,153 | 10.9% |
| Some other Race | 8,731 | 13.3% |
| Total | 65,596 | 100.0% |
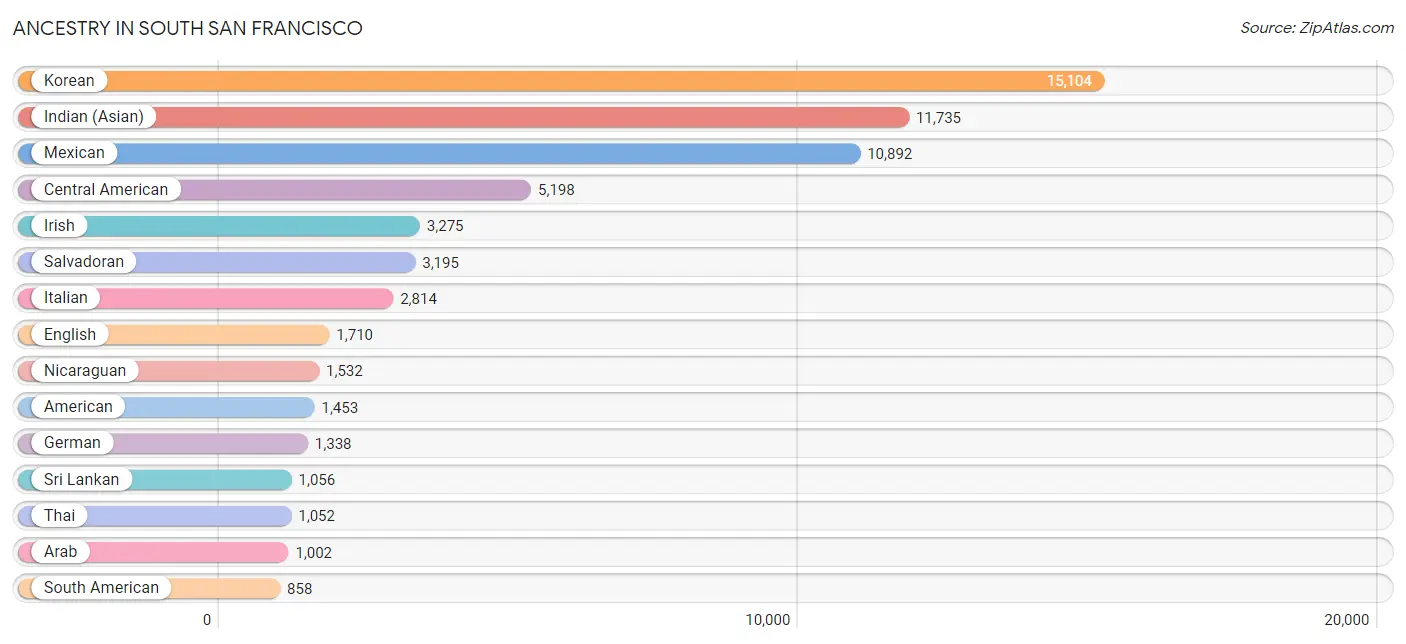
Ancestry in South San Francisco
The most populous ancestries reported in South San Francisco are Korean (15,104 | 23.0%), Indian (Asian) (11,735 | 17.9%), Mexican (10,892 | 16.6%), Central American (5,198 | 7.9%), and Irish (3,275 | 5.0%), together accounting for 70.4% of all South San Francisco residents.
| Ancestry | # Population | % Population |
| African | 78 | 0.1% |
| Alaskan Athabascan | 7 | 0.0% |
| American | 1,453 | 2.2% |
| Apache | 34 | 0.1% |
| Arab | 1,002 | 1.5% |
| Argentinean | 3 | 0.0% |
| Armenian | 280 | 0.4% |
| Assyrian / Chaldean / Syriac | 7 | 0.0% |
| Australian | 6 | 0.0% |
| Austrian | 54 | 0.1% |
| Bangladeshi | 132 | 0.2% |
| Basque | 138 | 0.2% |
| Belgian | 103 | 0.2% |
| Bhutanese | 819 | 1.3% |
| Blackfeet | 17 | 0.0% |
| Brazilian | 289 | 0.4% |
| British | 413 | 0.6% |
| Bulgarian | 95 | 0.1% |
| Burmese | 493 | 0.7% |
| Cambodian | 42 | 0.1% |
| Canadian | 25 | 0.0% |
| Central American | 5,198 | 7.9% |
| Central American Indian | 49 | 0.1% |
| Cherokee | 121 | 0.2% |
| Chilean | 99 | 0.2% |
| Colombian | 128 | 0.2% |
| Costa Rican | 14 | 0.0% |
| Creek | 6 | 0.0% |
| Croatian | 117 | 0.2% |
| Cuban | 51 | 0.1% |
| Czech | 49 | 0.1% |
| Dominican | 20 | 0.0% |
| Dutch | 77 | 0.1% |
| Eastern European | 38 | 0.1% |
| Ecuadorian | 24 | 0.0% |
| Egyptian | 13 | 0.0% |
| English | 1,710 | 2.6% |
| European | 765 | 1.2% |
| Filipino | 108 | 0.2% |
| Finnish | 27 | 0.0% |
| French | 714 | 1.1% |
| French Canadian | 40 | 0.1% |
| German | 1,338 | 2.0% |
| Greek | 477 | 0.7% |
| Guamanian / Chamorro | 10 | 0.0% |
| Guatemalan | 420 | 0.6% |
| Honduran | 9 | 0.0% |
| Hungarian | 192 | 0.3% |
| Icelander | 27 | 0.0% |
| Indian (Asian) | 11,735 | 17.9% |
| Indonesian | 350 | 0.5% |
| Iranian | 301 | 0.5% |
| Iraqi | 158 | 0.2% |
| Irish | 3,275 | 5.0% |
| Israeli | 9 | 0.0% |
| Italian | 2,814 | 4.3% |
| Jamaican | 68 | 0.1% |
| Japanese | 233 | 0.4% |
| Jordanian | 58 | 0.1% |
| Korean | 15,104 | 23.0% |
| Laotian | 281 | 0.4% |
| Lithuanian | 31 | 0.1% |
| Malaysian | 28 | 0.0% |
| Maltese | 30 | 0.1% |
| Mexican | 10,892 | 16.6% |
| Mexican American Indian | 282 | 0.4% |
| Mongolian | 28 | 0.0% |
| Native Hawaiian | 370 | 0.6% |
| Navajo | 73 | 0.1% |
| Nepalese | 20 | 0.0% |
| Nicaraguan | 1,532 | 2.3% |
| Nigerian | 47 | 0.1% |
| Northern European | 86 | 0.1% |
| Norwegian | 125 | 0.2% |
| Paiute | 15 | 0.0% |
| Pakistani | 68 | 0.1% |
| Palestinian | 318 | 0.5% |
| Panamanian | 28 | 0.0% |
| Pennsylvania German | 83 | 0.1% |
| Peruvian | 585 | 0.9% |
| Polish | 452 | 0.7% |
| Portuguese | 234 | 0.4% |
| Puerto Rican | 306 | 0.5% |
| Russian | 471 | 0.7% |
| Salvadoran | 3,195 | 4.9% |
| Samoan | 179 | 0.3% |
| Scandinavian | 52 | 0.1% |
| Scotch-Irish | 76 | 0.1% |
| Scottish | 371 | 0.6% |
| Serbian | 4 | 0.0% |
| Sioux | 35 | 0.1% |
| Slovak | 12 | 0.0% |
| Slovene | 19 | 0.0% |
| South American | 858 | 1.3% |
| South American Indian | 46 | 0.1% |
| Spaniard | 587 | 0.9% |
| Spanish | 305 | 0.5% |
| Spanish American | 4 | 0.0% |
| Sri Lankan | 1,056 | 1.6% |
| Subsaharan African | 125 | 0.2% |
| Swedish | 289 | 0.4% |
| Swiss | 122 | 0.2% |
| Syrian | 145 | 0.2% |
| Thai | 1,052 | 1.6% |
| Tlingit-Haida | 25 | 0.0% |
| Tongan | 122 | 0.2% |
| Turkish | 19 | 0.0% |
| Ukrainian | 157 | 0.2% |
| Venezuelan | 19 | 0.0% |
| Welsh | 160 | 0.2% |
| Yaqui | 10 | 0.0% |
| Yugoslavian | 16 | 0.0% | View All 112 Rows |
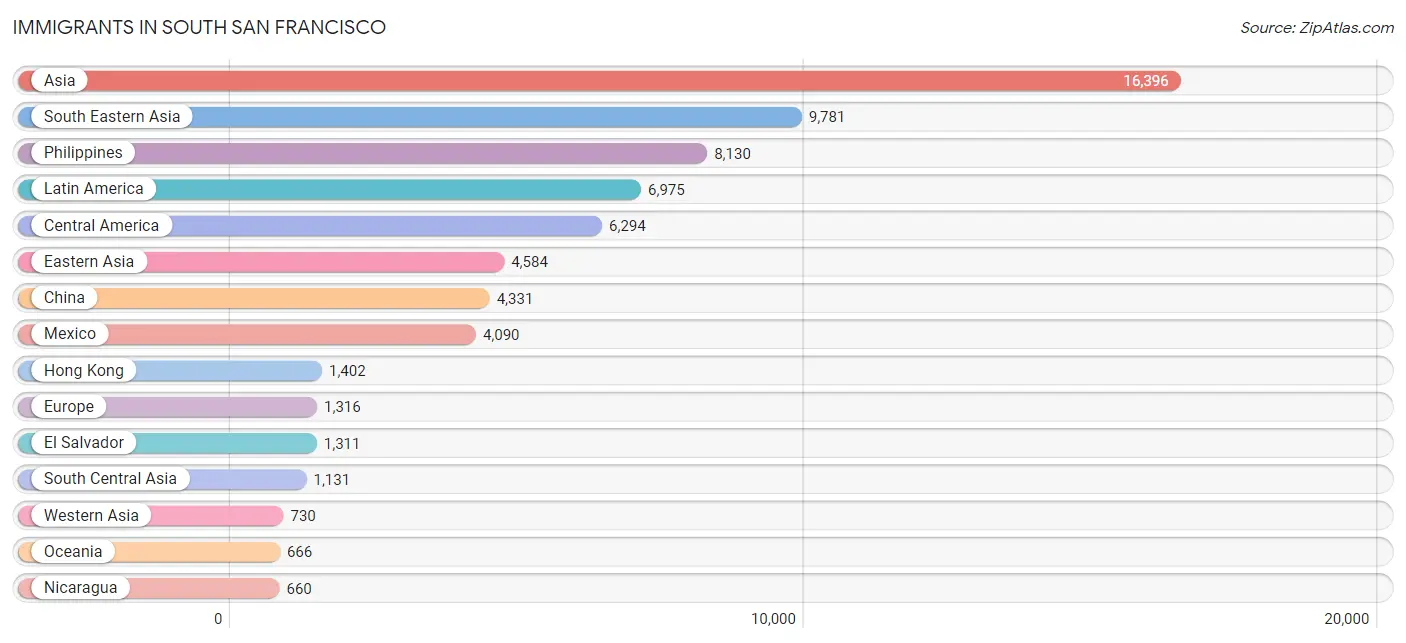
Immigrants in South San Francisco
The most numerous immigrant groups reported in South San Francisco came from Asia (16,396 | 25.0%), South Eastern Asia (9,781 | 14.9%), Philippines (8,130 | 12.4%), Latin America (6,975 | 10.6%), and Central America (6,294 | 9.6%), together accounting for 72.5% of all South San Francisco residents.
| Immigration Origin | # Population | % Population |
| Africa | 109 | 0.2% |
| Albania | 9 | 0.0% |
| Asia | 16,396 | 25.0% |
| Australia | 31 | 0.1% |
| Austria | 13 | 0.0% |
| Belarus | 128 | 0.2% |
| Brazil | 287 | 0.4% |
| Bulgaria | 128 | 0.2% |
| Cambodia | 82 | 0.1% |
| Canada | 56 | 0.1% |
| Caribbean | 97 | 0.2% |
| Central America | 6,294 | 9.6% |
| China | 4,331 | 6.6% |
| Colombia | 114 | 0.2% |
| Croatia | 62 | 0.1% |
| Dominican Republic | 35 | 0.1% |
| Eastern Africa | 33 | 0.1% |
| Eastern Asia | 4,584 | 7.0% |
| Eastern Europe | 625 | 0.9% |
| Egypt | 13 | 0.0% |
| El Salvador | 1,311 | 2.0% |
| England | 11 | 0.0% |
| Europe | 1,316 | 2.0% |
| Fiji | 488 | 0.7% |
| France | 107 | 0.2% |
| Germany | 30 | 0.1% |
| Ghana | 34 | 0.1% |
| Greece | 37 | 0.1% |
| Guatemala | 224 | 0.3% |
| Honduras | 9 | 0.0% |
| Hong Kong | 1,402 | 2.1% |
| Hungary | 15 | 0.0% |
| India | 623 | 0.9% |
| Indonesia | 236 | 0.4% |
| Iran | 251 | 0.4% |
| Iraq | 7 | 0.0% |
| Ireland | 36 | 0.1% |
| Israel | 179 | 0.3% |
| Italy | 261 | 0.4% |
| Jamaica | 62 | 0.1% |
| Japan | 133 | 0.2% |
| Jordan | 94 | 0.1% |
| Korea | 106 | 0.2% |
| Kuwait | 41 | 0.1% |
| Laos | 57 | 0.1% |
| Latin America | 6,975 | 10.6% |
| Lebanon | 59 | 0.1% |
| Liberia | 2 | 0.0% |
| Malaysia | 32 | 0.1% |
| Mexico | 4,090 | 6.2% |
| Micronesia | 30 | 0.1% |
| Nepal | 92 | 0.1% |
| Nicaragua | 660 | 1.0% |
| Nigeria | 27 | 0.0% |
| Northern Africa | 13 | 0.0% |
| Northern Europe | 168 | 0.3% |
| Oceania | 666 | 1.0% |
| Pakistan | 106 | 0.2% |
| Peru | 145 | 0.2% |
| Philippines | 8,130 | 12.4% |
| Poland | 33 | 0.1% |
| Portugal | 34 | 0.1% |
| Romania | 29 | 0.0% |
| Russia | 97 | 0.2% |
| Saudi Arabia | 28 | 0.0% |
| Scotland | 11 | 0.0% |
| Singapore | 34 | 0.1% |
| South America | 584 | 0.9% |
| South Central Asia | 1,131 | 1.7% |
| South Eastern Asia | 9,781 | 14.9% |
| Southern Europe | 348 | 0.5% |
| Switzerland | 25 | 0.0% |
| Syria | 84 | 0.1% |
| Taiwan | 193 | 0.3% |
| Thailand | 150 | 0.2% |
| Turkey | 20 | 0.0% |
| Ukraine | 115 | 0.2% |
| Uzbekistan | 59 | 0.1% |
| Vietnam | 605 | 0.9% |
| Western Africa | 63 | 0.1% |
| Western Asia | 730 | 1.1% |
| Western Europe | 175 | 0.3% |
| Yemen | 62 | 0.1% | View All 83 Rows |
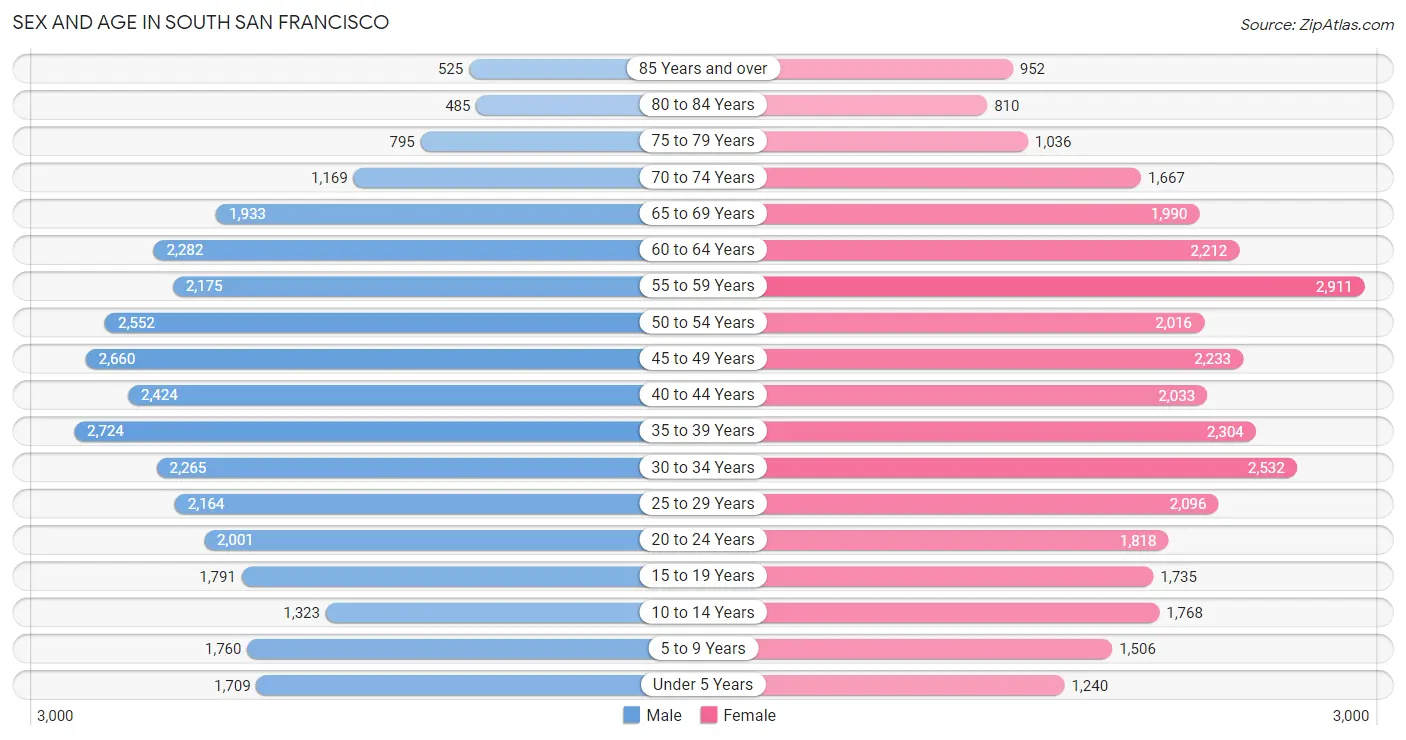
Sex and Age in South San Francisco
Sex and Age in South San Francisco
The most populous age groups in South San Francisco are 35 to 39 Years (2,724 | 8.3%) for men and 55 to 59 Years (2,911 | 8.9%) for women.
| Age Bracket | Male | Female |
| Under 5 Years | 1,709 (5.2%) | 1,240 (3.8%) |
| 5 to 9 Years | 1,760 (5.4%) | 1,506 (4.6%) |
| 10 to 14 Years | 1,323 (4.0%) | 1,768 (5.4%) |
| 15 to 19 Years | 1,791 (5.5%) | 1,735 (5.3%) |
| 20 to 24 Years | 2,001 (6.1%) | 1,818 (5.5%) |
| 25 to 29 Years | 2,164 (6.6%) | 2,096 (6.4%) |
| 30 to 34 Years | 2,265 (6.9%) | 2,532 (7.7%) |
| 35 to 39 Years | 2,724 (8.3%) | 2,304 (7.0%) |
| 40 to 44 Years | 2,424 (7.4%) | 2,033 (6.2%) |
| 45 to 49 Years | 2,660 (8.1%) | 2,233 (6.8%) |
| 50 to 54 Years | 2,552 (7.8%) | 2,016 (6.1%) |
| 55 to 59 Years | 2,175 (6.6%) | 2,911 (8.9%) |
| 60 to 64 Years | 2,282 (7.0%) | 2,212 (6.7%) |
| 65 to 69 Years | 1,933 (5.9%) | 1,990 (6.1%) |
| 70 to 74 Years | 1,169 (3.6%) | 1,667 (5.1%) |
| 75 to 79 Years | 795 (2.4%) | 1,036 (3.2%) |
| 80 to 84 Years | 485 (1.5%) | 810 (2.5%) |
| 85 Years and over | 525 (1.6%) | 952 (2.9%) |
| Total | 32,737 (100.0%) | 32,859 (100.0%) |
Families and Households in South San Francisco
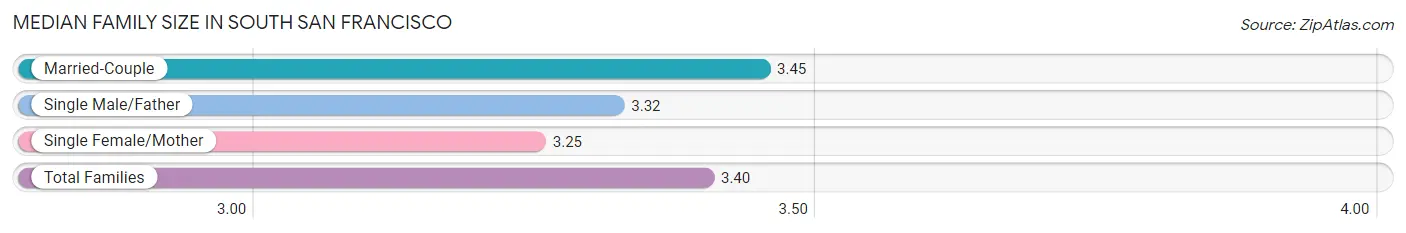
Median Family Size in South San Francisco
The median family size in South San Francisco is 3.40 persons per family, with married-couple families (11,866 | 75.0%) accounting for the largest median family size of 3.45 persons per family. On the other hand, single female/mother families (2,568 | 16.2%) represent the smallest median family size with 3.25 persons per family.
| Family Type | # Families | Family Size |
| Married-Couple | 11,866 (75.0%) | 3.45 |
| Single Male/Father | 1,389 (8.8%) | 3.32 |
| Single Female/Mother | 2,568 (16.2%) | 3.25 |
| Total Families | 15,823 (100.0%) | 3.40 |
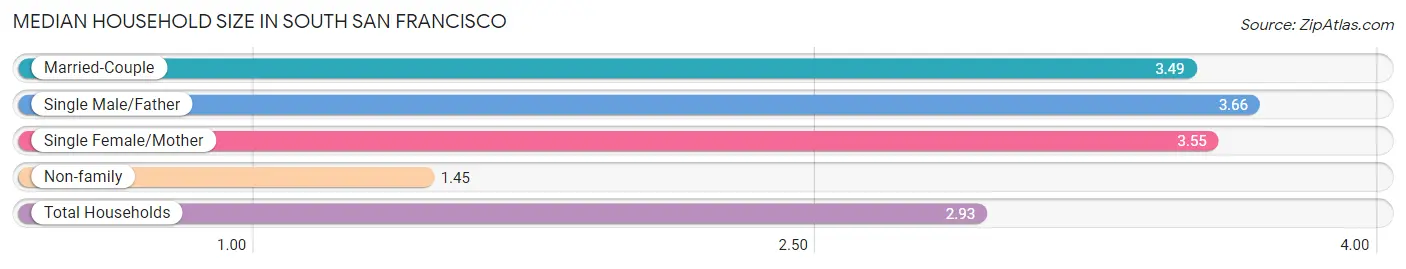
Median Household Size in South San Francisco
The median household size in South San Francisco is 2.93 persons per household, with single male/father households (1,389 | 6.3%) accounting for the largest median household size of 3.66 persons per household. non-family households (6,213 | 28.2%) represent the smallest median household size with 1.45 persons per household.
| Household Type | # Households | Household Size |
| Married-Couple | 11,866 (53.8%) | 3.49 |
| Single Male/Father | 1,389 (6.3%) | 3.66 |
| Single Female/Mother | 2,568 (11.7%) | 3.55 |
| Non-family | 6,213 (28.2%) | 1.45 |
| Total Households | 22,036 (100.0%) | 2.93 |
Household Size by Marriage Status in South San Francisco
Out of a total of 22,036 households in South San Francisco, 15,823 (71.8%) are family households, while 6,213 (28.2%) are nonfamily households. The most numerous type of family households are 2-person households, comprising 6,004, and the most common type of nonfamily households are 1-person households, comprising 4,458.
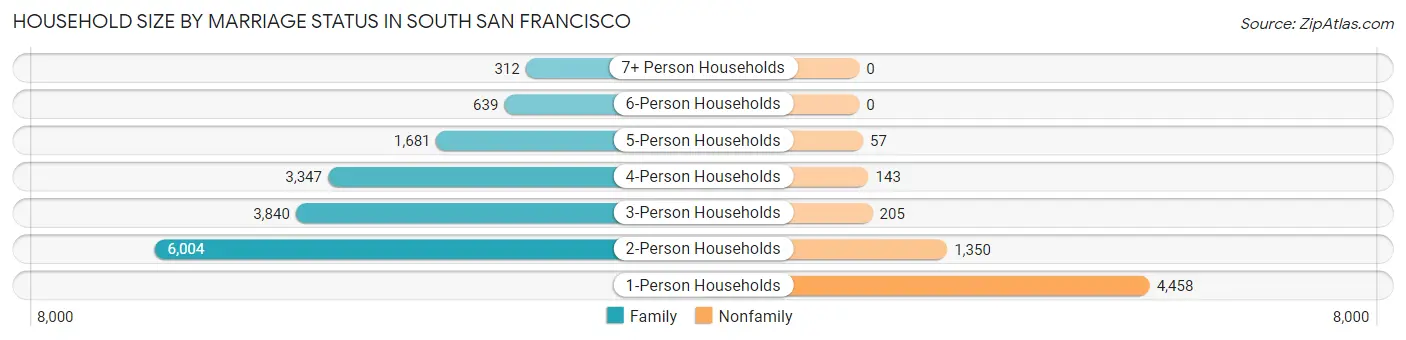
| Household Size | Family Households | Nonfamily Households |
| 1-Person Households | - | 4,458 (20.2%) |
| 2-Person Households | 6,004 (27.3%) | 1,350 (6.1%) |
| 3-Person Households | 3,840 (17.4%) | 205 (0.9%) |
| 4-Person Households | 3,347 (15.2%) | 143 (0.6%) |
| 5-Person Households | 1,681 (7.6%) | 57 (0.3%) |
| 6-Person Households | 639 (2.9%) | 0 (0.0%) |
| 7+ Person Households | 312 (1.4%) | 0 (0.0%) |
| Total | 15,823 (71.8%) | 6,213 (28.2%) |
Female Fertility in South San Francisco
Fertility by Age in South San Francisco
Average fertility rate in South San Francisco is 38.0 births per 1,000 women. Women in the age bracket of 20 to 34 years have the highest fertility rate with 51.0 births per 1,000 women. Women in the age bracket of 20 to 34 years acount for 57.5% of all women with births.
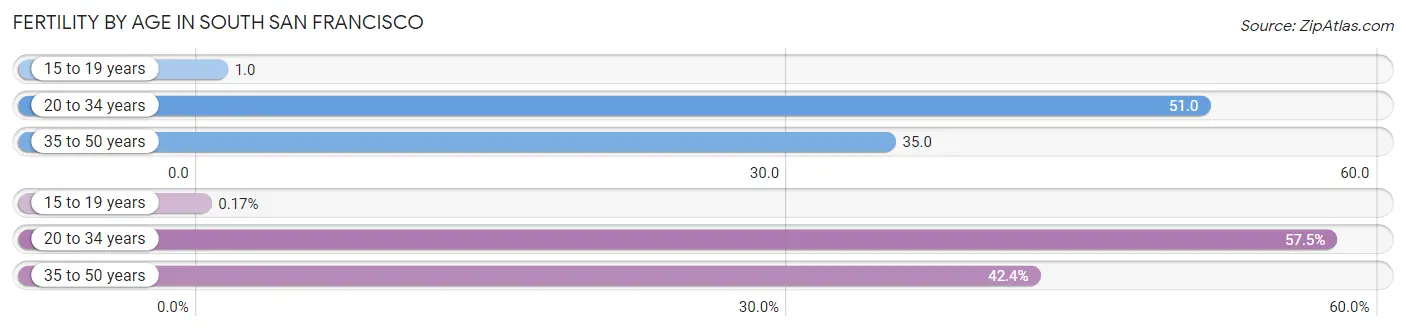
| Age Bracket | Women with Births | Births / 1,000 Women |
| 15 to 19 years | 1 (0.2%) | 1.0 |
| 20 to 34 years | 331 (57.5%) | 51.0 |
| 35 to 50 years | 244 (42.4%) | 35.0 |
| Total | 576 (100.0%) | 38.0 |
Fertility by Age by Marriage Status in South San Francisco
59.0% of women with births (576) in South San Francisco are married. The highest percentage of unmarried women with births falls into 15 to 19 years age bracket with 100.0% of them unmarried at the time of birth, while the lowest percentage of unmarried women with births belong to 35 to 50 years age bracket with 18.4% of them unmarried.
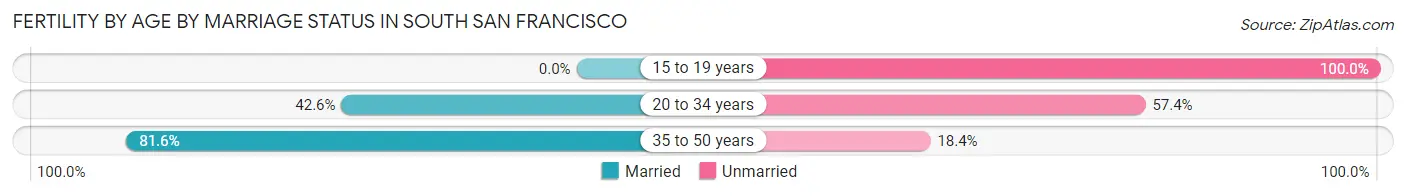
| Age Bracket | Married | Unmarried |
| 15 to 19 years | 0 (0.0%) | 1 (100.0%) |
| 20 to 34 years | 141 (42.6%) | 190 (57.4%) |
| 35 to 50 years | 199 (81.6%) | 45 (18.4%) |
| Total | 340 (59.0%) | 236 (41.0%) |
Fertility by Education in South San Francisco
Average fertility rate in South San Francisco is 38.0 births per 1,000 women. Women with the education attainment of graduate degree have the highest fertility rate of 59.0 births per 1,000 women, while women with the education attainment of less than high school have the lowest fertility at 20.0 births per 1,000 women. Women with the education attainment of bachelor's degree represent 30.4% of all women with births.
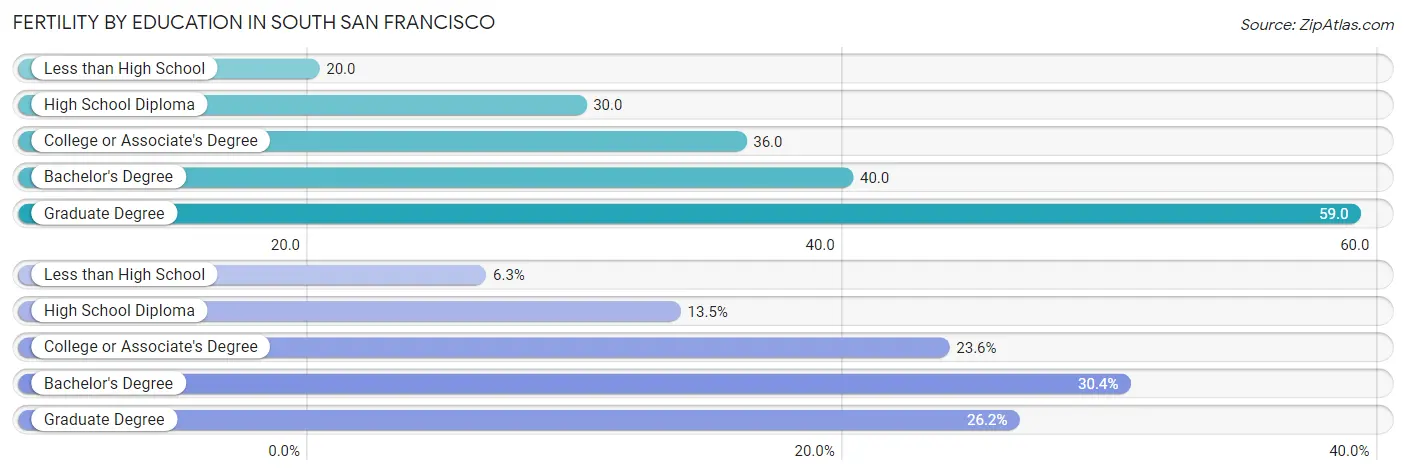
| Educational Attainment | Women with Births | Births / 1,000 Women |
| Less than High School | 36 (6.2%) | 20.0 |
| High School Diploma | 78 (13.5%) | 30.0 |
| College or Associate's Degree | 136 (23.6%) | 36.0 |
| Bachelor's Degree | 175 (30.4%) | 40.0 |
| Graduate Degree | 151 (26.2%) | 59.0 |
| Total | 576 (100.0%) | 38.0 |
Fertility by Education by Marriage Status in South San Francisco
41.0% of women with births in South San Francisco are unmarried. Women with the educational attainment of less than high school are most likely to be married with 97.2% of them married at childbirth, while women with the educational attainment of college or associate's degree are least likely to be married with 61.0% of them unmarried at childbirth.
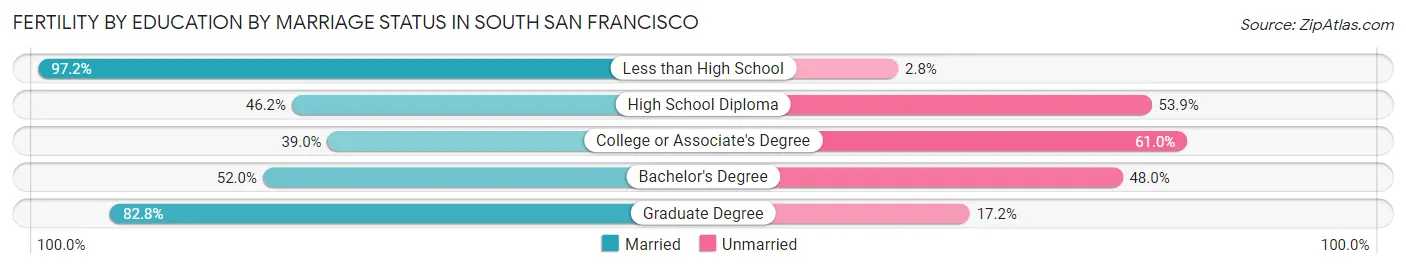
| Educational Attainment | Married | Unmarried |
| Less than High School | 35 (97.2%) | 1 (2.8%) |
| High School Diploma | 36 (46.2%) | 42 (53.8%) |
| College or Associate's Degree | 53 (39.0%) | 83 (61.0%) |
| Bachelor's Degree | 91 (52.0%) | 84 (48.0%) |
| Graduate Degree | 125 (82.8%) | 26 (17.2%) |
| Total | 340 (59.0%) | 236 (41.0%) |
Employment Characteristics in South San Francisco
Employment by Class of Employer in South San Francisco
Among the 35,431 employed individuals in South San Francisco, private company employees (24,364 | 68.8%), not-for-profit organizations (3,264 | 9.2%), and local government employees (2,576 | 7.3%) make up the most common classes of employment.
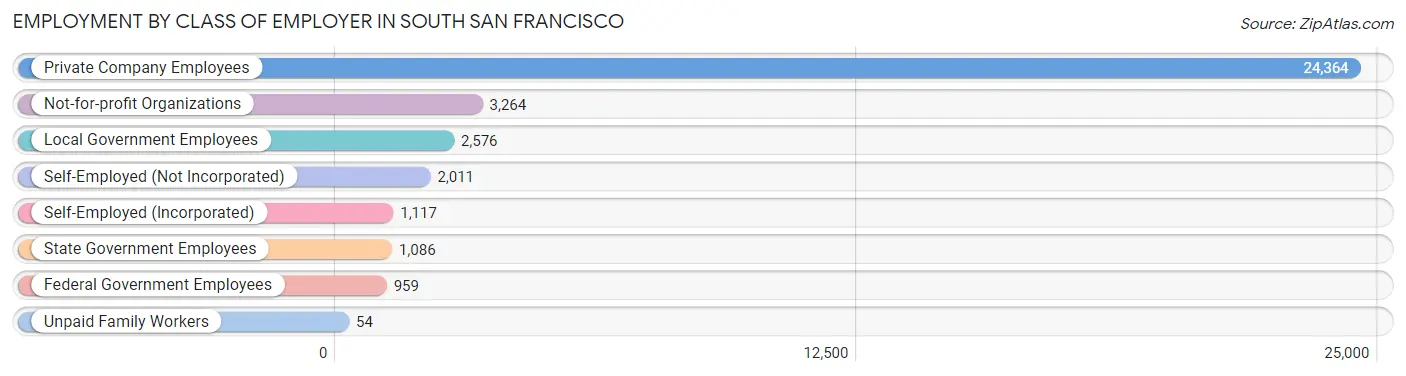
| Employer Class | # Employees | % Employees |
| Private Company Employees | 24,364 | 68.8% |
| Self-Employed (Incorporated) | 1,117 | 3.2% |
| Self-Employed (Not Incorporated) | 2,011 | 5.7% |
| Not-for-profit Organizations | 3,264 | 9.2% |
| Local Government Employees | 2,576 | 7.3% |
| State Government Employees | 1,086 | 3.1% |
| Federal Government Employees | 959 | 2.7% |
| Unpaid Family Workers | 54 | 0.2% |
| Total | 35,431 | 100.0% |
Employment Status by Age in South San Francisco
According to the labor force statistics for South San Francisco, out of the total population over 16 years of age (55,812), 67.2% or 37,506 individuals are in the labor force, with 2.4% or 900 of them unemployed. The age group with the highest labor force participation rate is 45 to 54 years, with 89.7% or 8,487 individuals in the labor force. Within the labor force, the 16 to 19 years age range has the highest percentage of unemployed individuals, with 5.5% or 51 of them being unemployed.
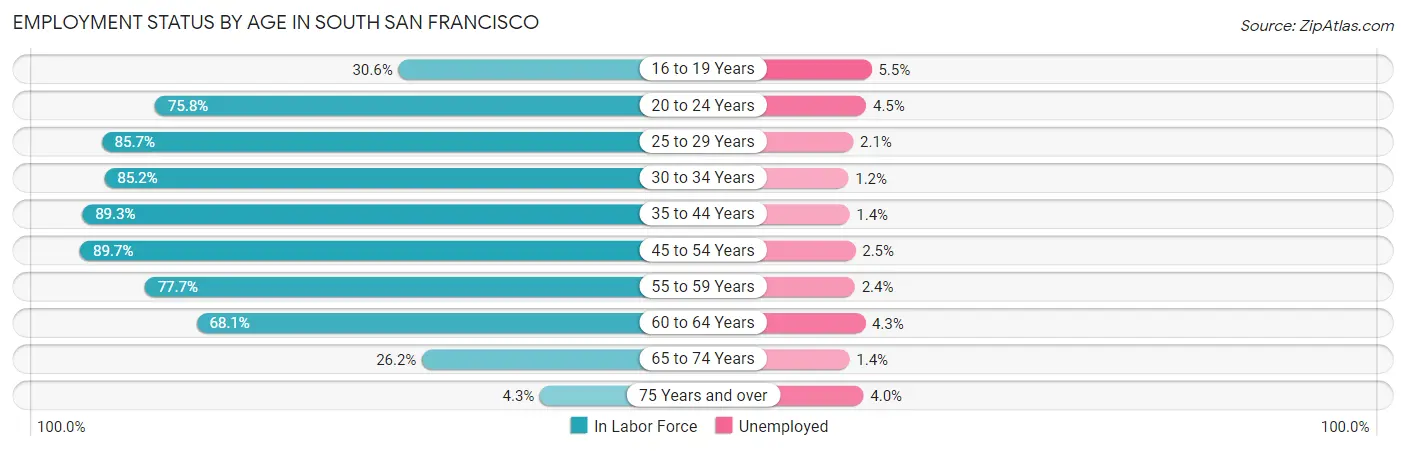
| Age Bracket | In Labor Force | Unemployed |
| 16 to 19 Years | 933 (30.6%) | 51 (5.5%) |
| 20 to 24 Years | 2,895 (75.8%) | 130 (4.5%) |
| 25 to 29 Years | 3,651 (85.7%) | 77 (2.1%) |
| 30 to 34 Years | 4,087 (85.2%) | 49 (1.2%) |
| 35 to 44 Years | 8,470 (89.3%) | 119 (1.4%) |
| 45 to 54 Years | 8,487 (89.7%) | 212 (2.5%) |
| 55 to 59 Years | 3,952 (77.7%) | 95 (2.4%) |
| 60 to 64 Years | 3,060 (68.1%) | 132 (4.3%) |
| 65 to 74 Years | 1,771 (26.2%) | 25 (1.4%) |
| 75 Years and over | 198 (4.3%) | 8 (4.0%) |
| Total | 37,506 (67.2%) | 900 (2.4%) |
Employment Status by Educational Attainment in South San Francisco
According to labor force statistics for South San Francisco, 84.4% of individuals (31,720) out of the total population between 25 and 64 years of age (37,583) are in the labor force, with 2.2% or 698 of them being unemployed. The group with the highest labor force participation rate are those with the educational attainment of bachelor's degree or higher, with 91.6% or 14,458 individuals in the labor force. Within the labor force, individuals with less than high school education have the highest percentage of unemployment, with 4.0% or 86 of them being unemployed.
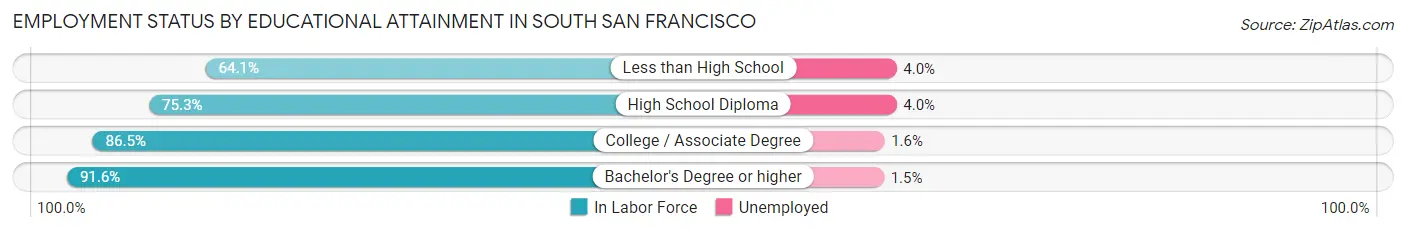
| Educational Attainment | In Labor Force | Unemployed |
| Less than High School | 2,151 (64.1%) | 134 (4.0%) |
| High School Diploma | 5,805 (75.3%) | 308 (4.0%) |
| College / Associate Degree | 9,286 (86.5%) | 172 (1.6%) |
| Bachelor's Degree or higher | 14,458 (91.6%) | 237 (1.5%) |
| Total | 31,720 (84.4%) | 827 (2.2%) |
Employment Occupations by Sex in South San Francisco
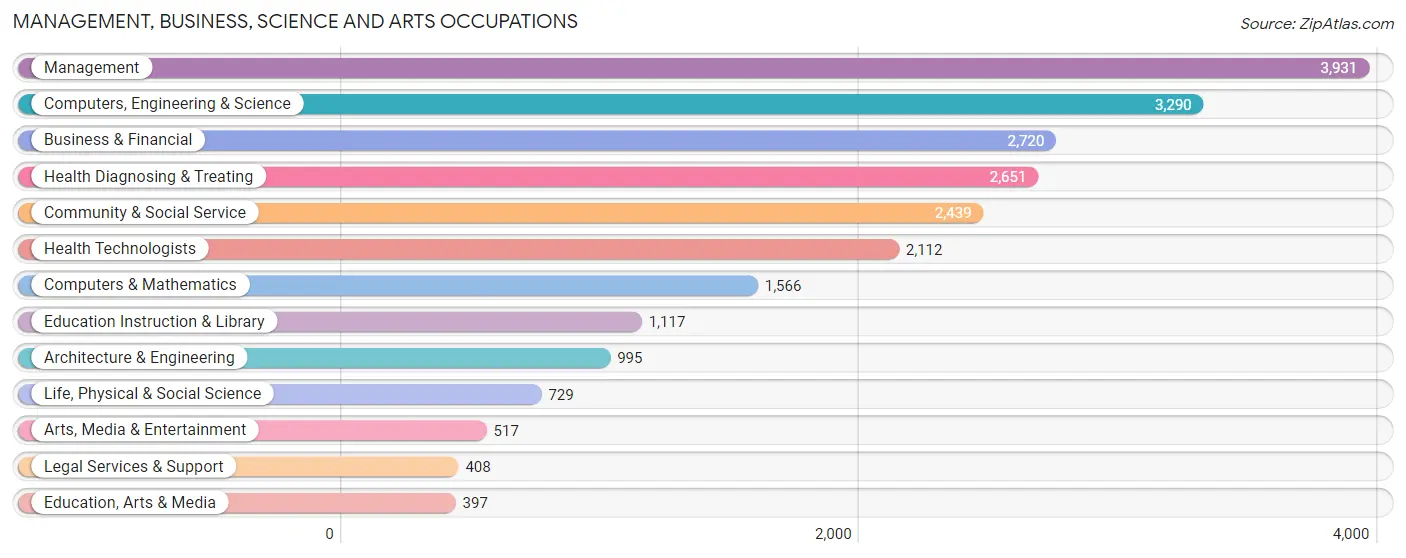
Management, Business, Science and Arts Occupations
The most common Management, Business, Science and Arts occupations in South San Francisco are Management (3,931 | 10.7%), Computers, Engineering & Science (3,290 | 9.0%), Business & Financial (2,720 | 7.4%), Health Diagnosing & Treating (2,651 | 7.2%), and Community & Social Service (2,439 | 6.7%).
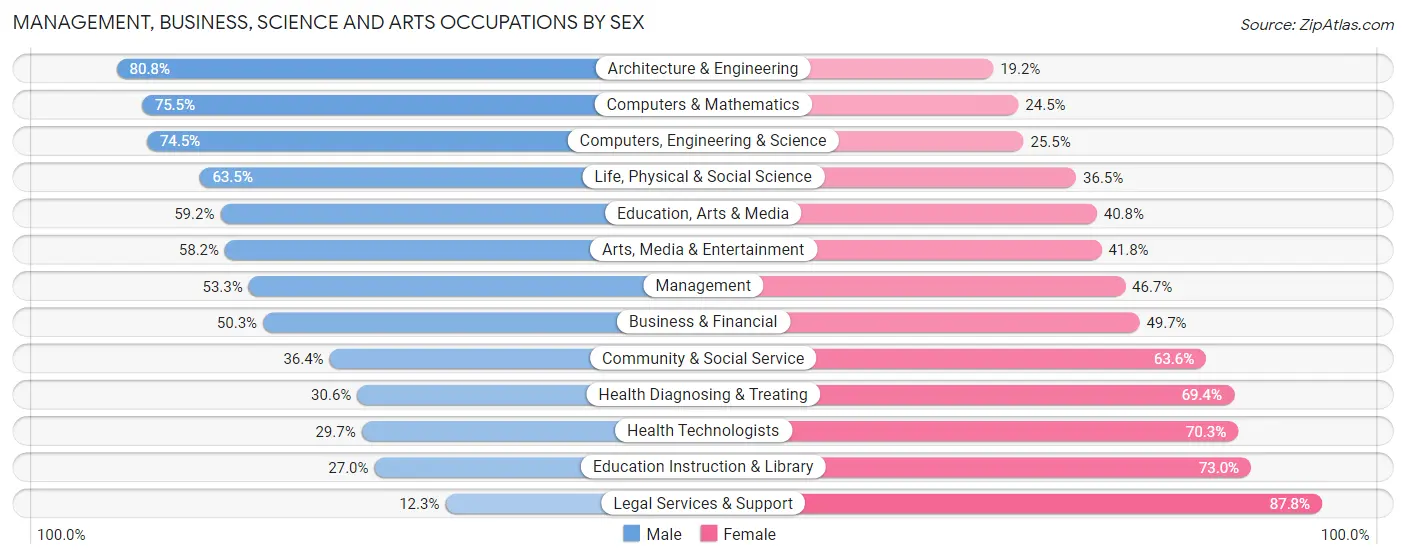
Management, Business, Science and Arts Occupations by Sex
Within the Management, Business, Science and Arts occupations in South San Francisco, the most male-oriented occupations are Architecture & Engineering (80.8%), Computers & Mathematics (75.5%), and Computers, Engineering & Science (74.5%), while the most female-oriented occupations are Legal Services & Support (87.7%), Education Instruction & Library (73.0%), and Health Technologists (70.3%).
| Occupation | Male | Female |
| Management | 2,095 (53.3%) | 1,836 (46.7%) |
| Business & Financial | 1,368 (50.3%) | 1,352 (49.7%) |
| Computers, Engineering & Science | 2,450 (74.5%) | 840 (25.5%) |
| Computers & Mathematics | 1,183 (75.5%) | 383 (24.5%) |
| Architecture & Engineering | 804 (80.8%) | 191 (19.2%) |
| Life, Physical & Social Science | 463 (63.5%) | 266 (36.5%) |
| Community & Social Service | 888 (36.4%) | 1,551 (63.6%) |
| Education, Arts & Media | 235 (59.2%) | 162 (40.8%) |
| Legal Services & Support | 50 (12.2%) | 358 (87.7%) |
| Education Instruction & Library | 302 (27.0%) | 815 (73.0%) |
| Arts, Media & Entertainment | 301 (58.2%) | 216 (41.8%) |
| Health Diagnosing & Treating | 812 (30.6%) | 1,839 (69.4%) |
| Health Technologists | 628 (29.7%) | 1,484 (70.3%) |
| Total (Category) | 7,613 (50.6%) | 7,418 (49.3%) |
| Total (Overall) | 19,328 (52.8%) | 17,256 (47.2%) |
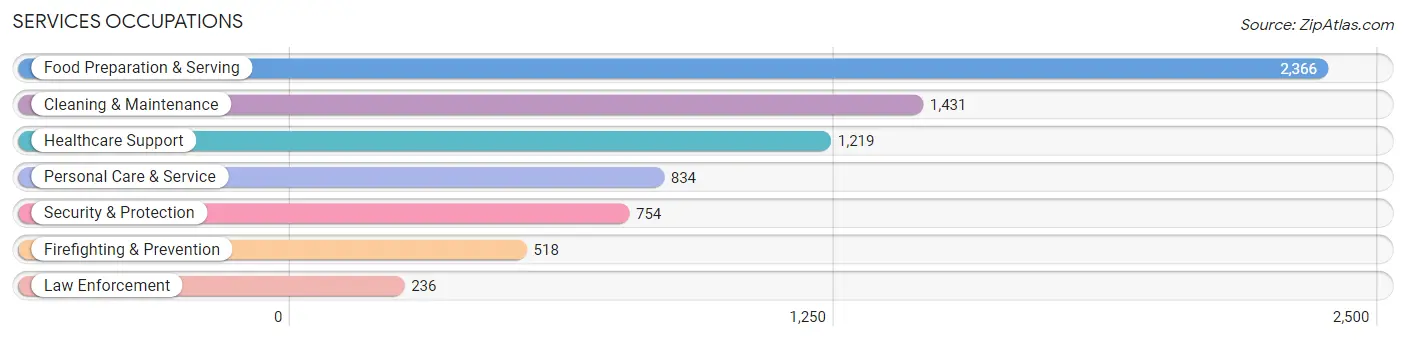
Services Occupations
The most common Services occupations in South San Francisco are Food Preparation & Serving (2,366 | 6.5%), Cleaning & Maintenance (1,431 | 3.9%), Healthcare Support (1,219 | 3.3%), Personal Care & Service (834 | 2.3%), and Security & Protection (754 | 2.1%).
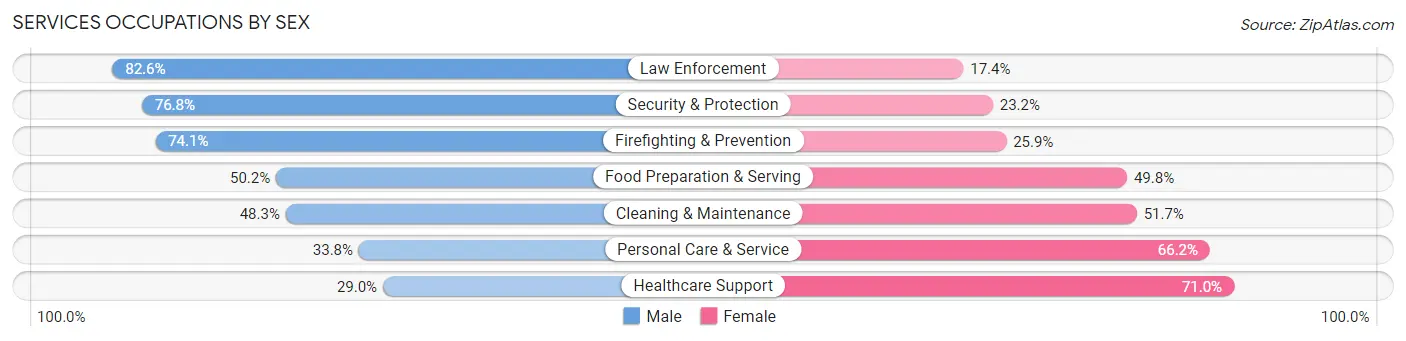
Services Occupations by Sex
Within the Services occupations in South San Francisco, the most male-oriented occupations are Law Enforcement (82.6%), Security & Protection (76.8%), and Firefighting & Prevention (74.1%), while the most female-oriented occupations are Healthcare Support (71.0%), Personal Care & Service (66.2%), and Cleaning & Maintenance (51.7%).
| Occupation | Male | Female |
| Healthcare Support | 354 (29.0%) | 865 (71.0%) |
| Security & Protection | 579 (76.8%) | 175 (23.2%) |
| Firefighting & Prevention | 384 (74.1%) | 134 (25.9%) |
| Law Enforcement | 195 (82.6%) | 41 (17.4%) |
| Food Preparation & Serving | 1,188 (50.2%) | 1,178 (49.8%) |
| Cleaning & Maintenance | 691 (48.3%) | 740 (51.7%) |
| Personal Care & Service | 282 (33.8%) | 552 (66.2%) |
| Total (Category) | 3,094 (46.9%) | 3,510 (53.1%) |
| Total (Overall) | 19,328 (52.8%) | 17,256 (47.2%) |
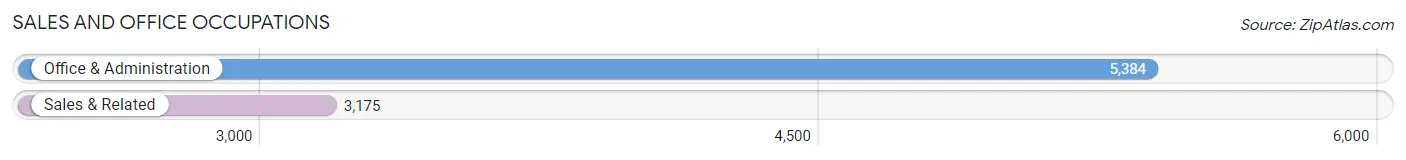
Sales and Office Occupations
The most common Sales and Office occupations in South San Francisco are Office & Administration (5,384 | 14.7%), and Sales & Related (3,175 | 8.7%).
Sales and Office Occupations by Sex
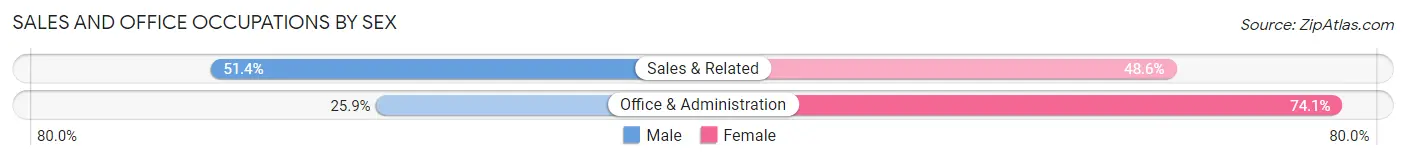
| Occupation | Male | Female |
| Sales & Related | 1,633 (51.4%) | 1,542 (48.6%) |
| Office & Administration | 1,393 (25.9%) | 3,991 (74.1%) |
| Total (Category) | 3,026 (35.3%) | 5,533 (64.6%) |
| Total (Overall) | 19,328 (52.8%) | 17,256 (47.2%) |
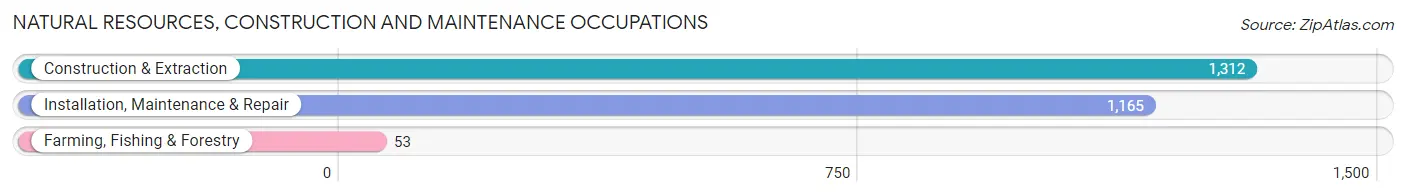
Natural Resources, Construction and Maintenance Occupations
The most common Natural Resources, Construction and Maintenance occupations in South San Francisco are Construction & Extraction (1,312 | 3.6%), Installation, Maintenance & Repair (1,165 | 3.2%), and Farming, Fishing & Forestry (53 | 0.1%).
Natural Resources, Construction and Maintenance Occupations by Sex
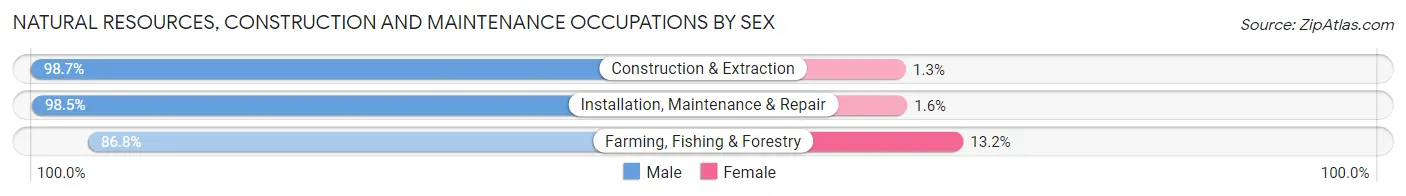
| Occupation | Male | Female |
| Farming, Fishing & Forestry | 46 (86.8%) | 7 (13.2%) |
| Construction & Extraction | 1,295 (98.7%) | 17 (1.3%) |
| Installation, Maintenance & Repair | 1,147 (98.5%) | 18 (1.5%) |
| Total (Category) | 2,488 (98.3%) | 42 (1.7%) |
| Total (Overall) | 19,328 (52.8%) | 17,256 (47.2%) |
Production, Transportation and Moving Occupations
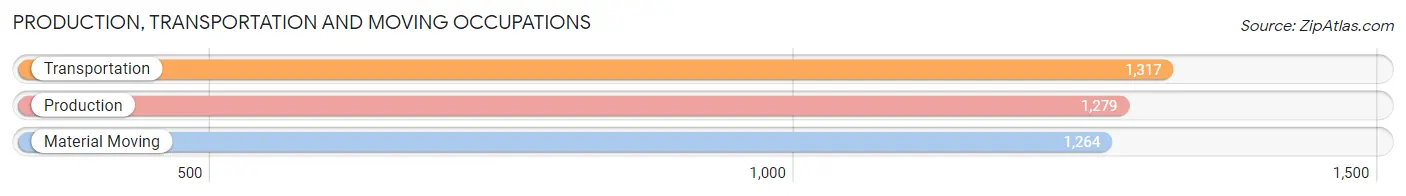
The most common Production, Transportation and Moving occupations in South San Francisco are Transportation (1,317 | 3.6%), Production (1,279 | 3.5%), and Material Moving (1,264 | 3.5%).
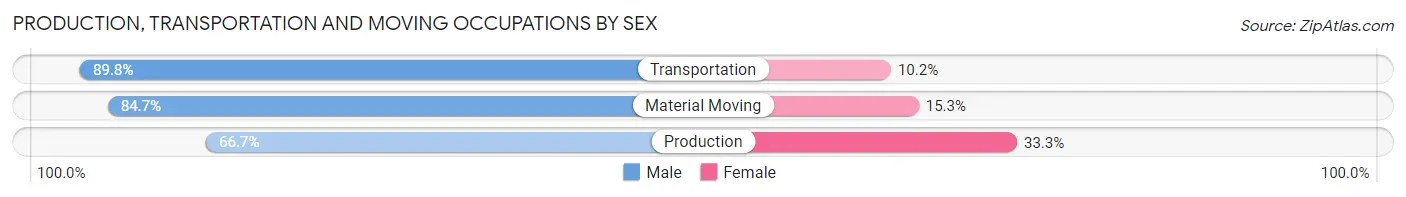
Production, Transportation and Moving Occupations by Sex
| Occupation | Male | Female |
| Production | 853 (66.7%) | 426 (33.3%) |
| Transportation | 1,183 (89.8%) | 134 (10.2%) |
| Material Moving | 1,071 (84.7%) | 193 (15.3%) |
| Total (Category) | 3,107 (80.5%) | 753 (19.5%) |
| Total (Overall) | 19,328 (52.8%) | 17,256 (47.2%) |
Employment Industries by Sex in South San Francisco
Employment Industries in South San Francisco
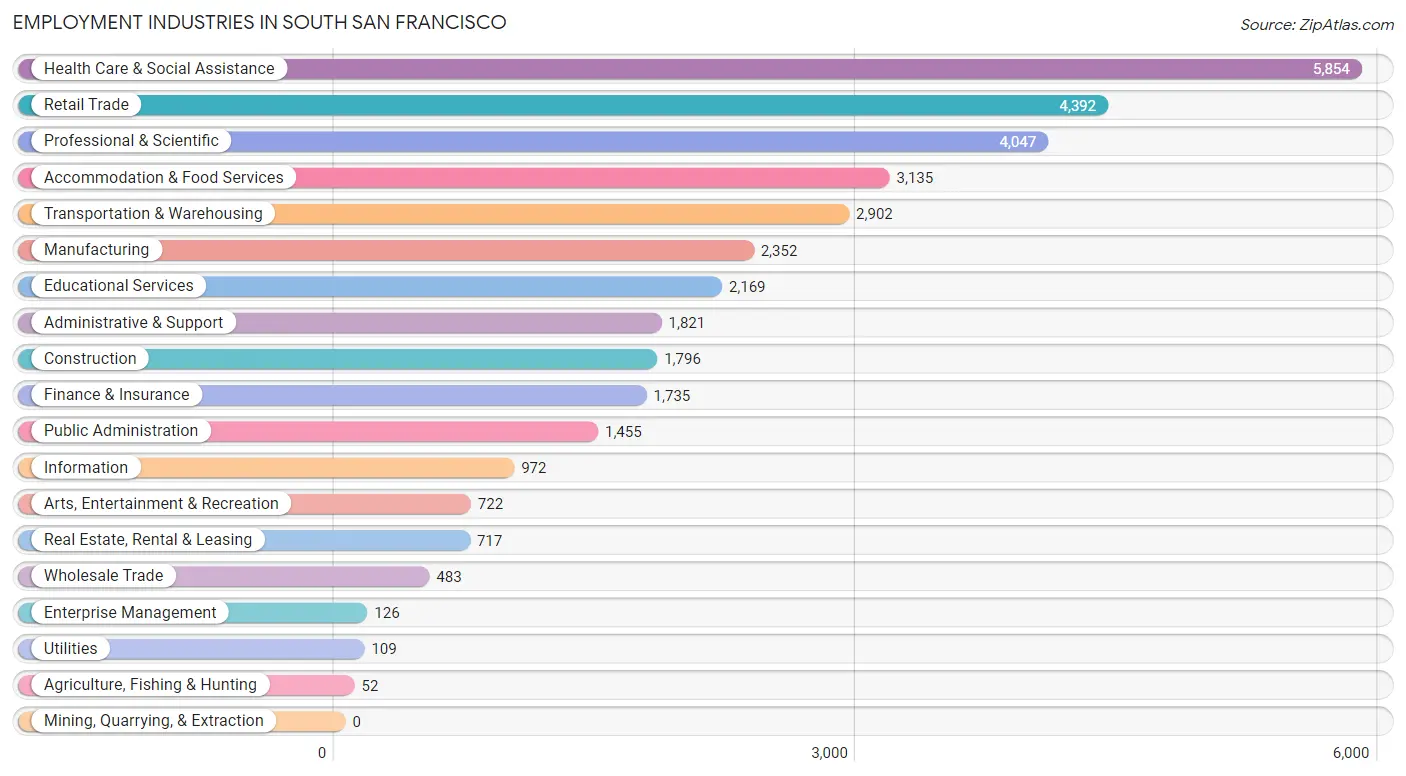
The major employment industries in South San Francisco include Health Care & Social Assistance (5,854 | 16.0%), Retail Trade (4,392 | 12.0%), Professional & Scientific (4,047 | 11.1%), Accommodation & Food Services (3,135 | 8.6%), and Transportation & Warehousing (2,902 | 7.9%).
Employment Industries by Sex in South San Francisco
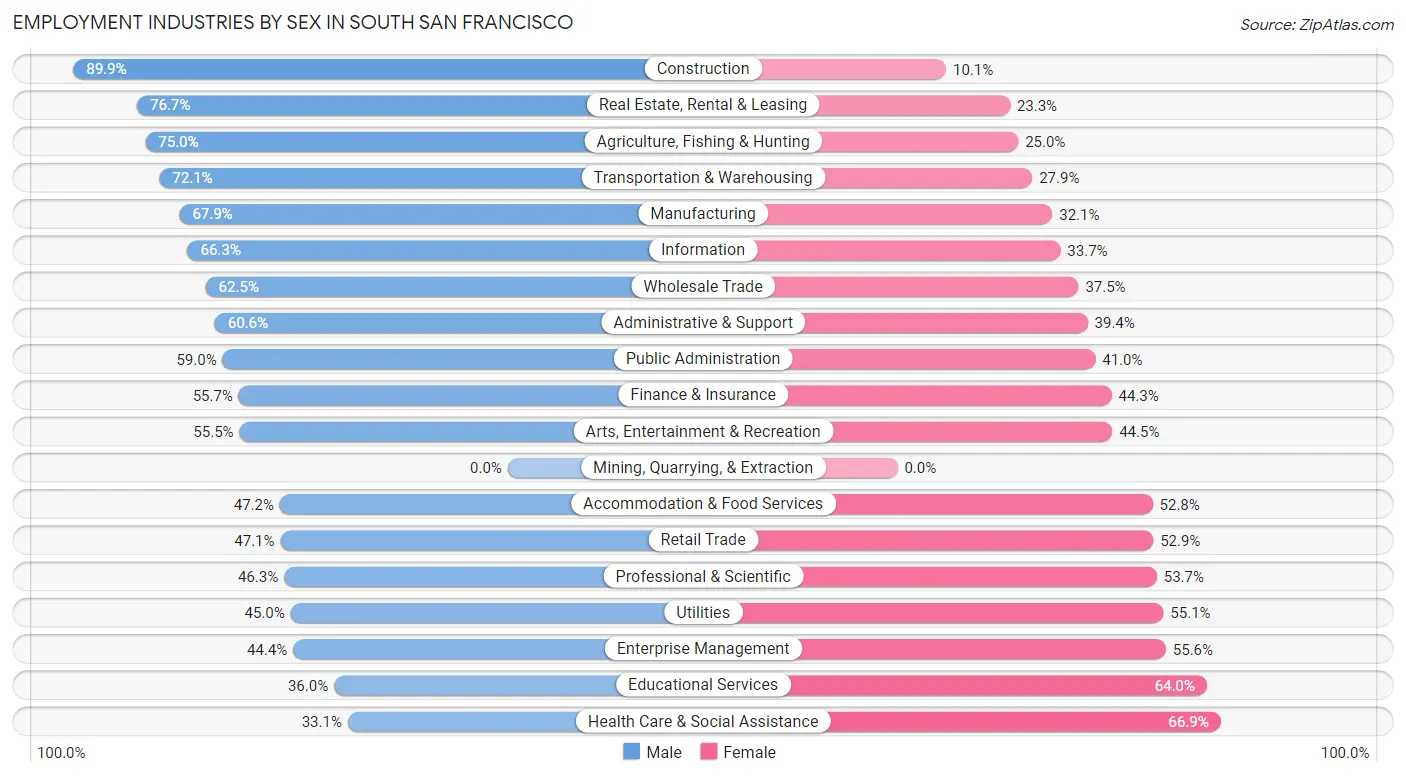
The South San Francisco industries that see more men than women are Construction (89.9%), Real Estate, Rental & Leasing (76.7%), and Agriculture, Fishing & Hunting (75.0%), whereas the industries that tend to have a higher number of women are Health Care & Social Assistance (66.9%), Educational Services (64.0%), and Enterprise Management (55.6%).
| Industry | Male | Female |
| Agriculture, Fishing & Hunting | 39 (75.0%) | 13 (25.0%) |
| Mining, Quarrying, & Extraction | 0 (0.0%) | 0 (0.0%) |
| Construction | 1,615 (89.9%) | 181 (10.1%) |
| Manufacturing | 1,598 (67.9%) | 754 (32.1%) |
| Wholesale Trade | 302 (62.5%) | 181 (37.5%) |
| Retail Trade | 2,067 (47.1%) | 2,325 (52.9%) |
| Transportation & Warehousing | 2,092 (72.1%) | 810 (27.9%) |
| Utilities | 49 (45.0%) | 60 (55.0%) |
| Information | 644 (66.3%) | 328 (33.7%) |
| Finance & Insurance | 966 (55.7%) | 769 (44.3%) |
| Real Estate, Rental & Leasing | 550 (76.7%) | 167 (23.3%) |
| Professional & Scientific | 1,874 (46.3%) | 2,173 (53.7%) |
| Enterprise Management | 56 (44.4%) | 70 (55.6%) |
| Administrative & Support | 1,104 (60.6%) | 717 (39.4%) |
| Educational Services | 780 (36.0%) | 1,389 (64.0%) |
| Health Care & Social Assistance | 1,938 (33.1%) | 3,916 (66.9%) |
| Arts, Entertainment & Recreation | 401 (55.5%) | 321 (44.5%) |
| Accommodation & Food Services | 1,479 (47.2%) | 1,656 (52.8%) |
| Public Administration | 859 (59.0%) | 596 (41.0%) |
| Total | 19,328 (52.8%) | 17,256 (47.2%) |
Education in South San Francisco
School Enrollment in South San Francisco
The most common levels of schooling among the 13,792 students in South San Francisco are college / undergraduate (3,962 | 28.7%), high school (2,618 | 19.0%), and middle school (2,516 | 18.2%).
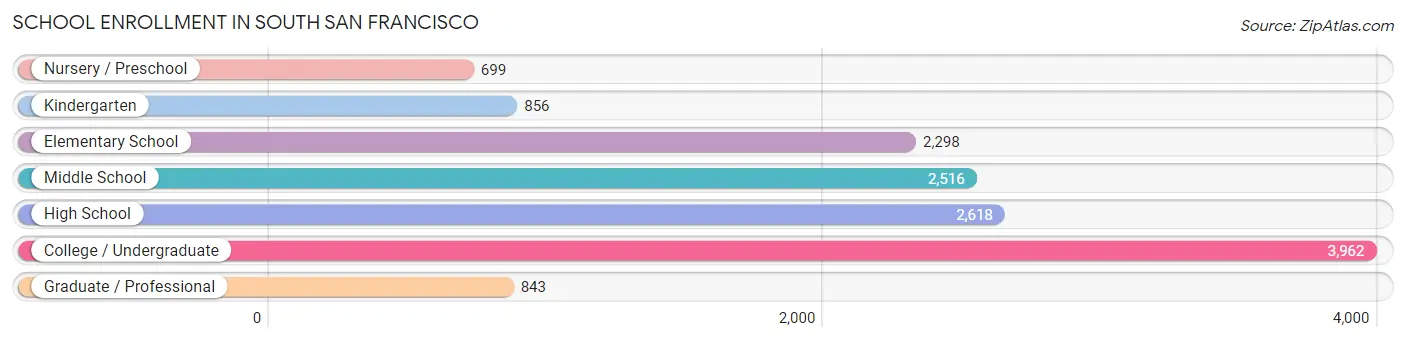
| School Level | # Students | % Students |
| Nursery / Preschool | 699 | 5.1% |
| Kindergarten | 856 | 6.2% |
| Elementary School | 2,298 | 16.7% |
| Middle School | 2,516 | 18.2% |
| High School | 2,618 | 19.0% |
| College / Undergraduate | 3,962 | 28.7% |
| Graduate / Professional | 843 | 6.1% |
| Total | 13,792 | 100.0% |
School Enrollment by Age by Funding Source in South San Francisco
Out of a total of 13,792 students who are enrolled in schools in South San Francisco, 3,034 (22.0%) attend a private institution, while the remaining 10,758 (78.0%) are enrolled in public schools. The age group of 3 to 4 year olds has the highest likelihood of being enrolled in private schools, with 355 (70.7% in the age bracket) enrolled. Conversely, the age group of 18 to 19 year olds has the lowest likelihood of being enrolled in a private school, with 1,254 (92.8% in the age bracket) attending a public institution.
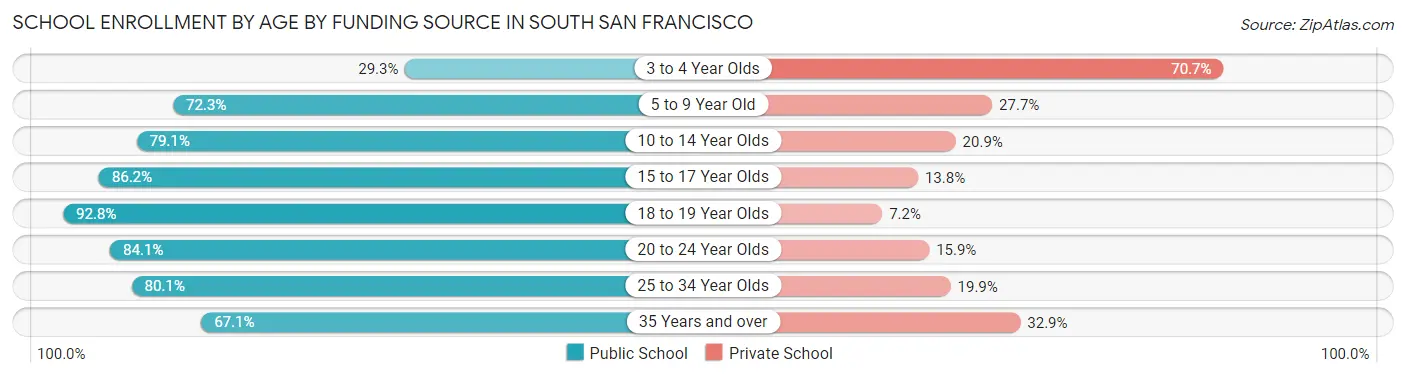
| Age Bracket | Public School | Private School |
| 3 to 4 Year Olds | 147 (29.3%) | 355 (70.7%) |
| 5 to 9 Year Old | 2,330 (72.3%) | 891 (27.7%) |
| 10 to 14 Year Olds | 2,439 (79.1%) | 643 (20.9%) |
| 15 to 17 Year Olds | 1,625 (86.2%) | 261 (13.8%) |
| 18 to 19 Year Olds | 1,254 (92.8%) | 97 (7.2%) |
| 20 to 24 Year Olds | 1,436 (84.1%) | 272 (15.9%) |
| 25 to 34 Year Olds | 949 (80.1%) | 236 (19.9%) |
| 35 Years and over | 575 (67.1%) | 282 (32.9%) |
| Total | 10,758 (78.0%) | 3,034 (22.0%) |
Educational Attainment by Field of Study in South San Francisco
Business (5,222 | 25.6%), science & technology (2,620 | 12.9%), engineering (1,893 | 9.3%), social sciences (1,681 | 8.3%), and bio, nature & agricultural (1,577 | 7.7%) are the most common fields of study among 20,363 individuals in South San Francisco who have obtained a bachelor's degree or higher.
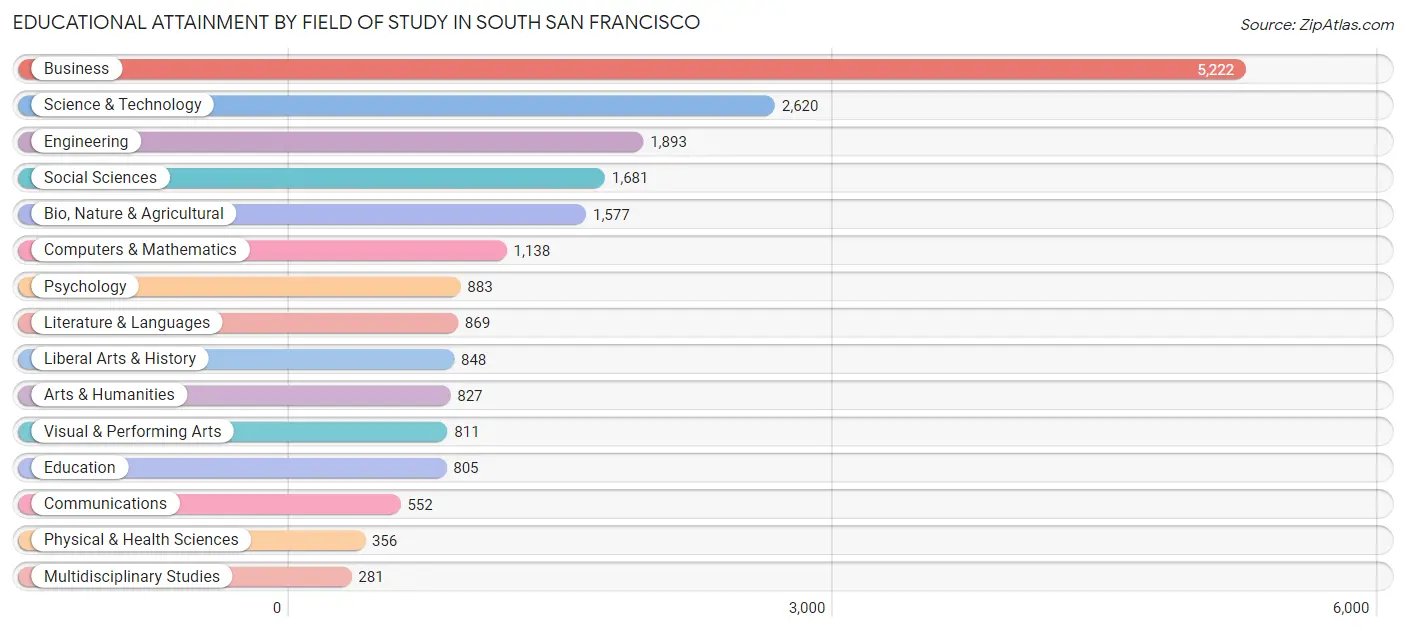
| Field of Study | # Graduates | % Graduates |
| Computers & Mathematics | 1,138 | 5.6% |
| Bio, Nature & Agricultural | 1,577 | 7.7% |
| Physical & Health Sciences | 356 | 1.8% |
| Psychology | 883 | 4.3% |
| Social Sciences | 1,681 | 8.3% |
| Engineering | 1,893 | 9.3% |
| Multidisciplinary Studies | 281 | 1.4% |
| Science & Technology | 2,620 | 12.9% |
| Business | 5,222 | 25.6% |
| Education | 805 | 4.0% |
| Literature & Languages | 869 | 4.3% |
| Liberal Arts & History | 848 | 4.2% |
| Visual & Performing Arts | 811 | 4.0% |
| Communications | 552 | 2.7% |
| Arts & Humanities | 827 | 4.1% |
| Total | 20,363 | 100.0% |
Transportation & Commute in South San Francisco
Vehicle Availability by Sex in South San Francisco
The most prevalent vehicle ownership categories in South San Francisco are males with 2 vehicles (5,933, accounting for 31.8%) and females with 2 vehicles (5,955, making up 35.9%).
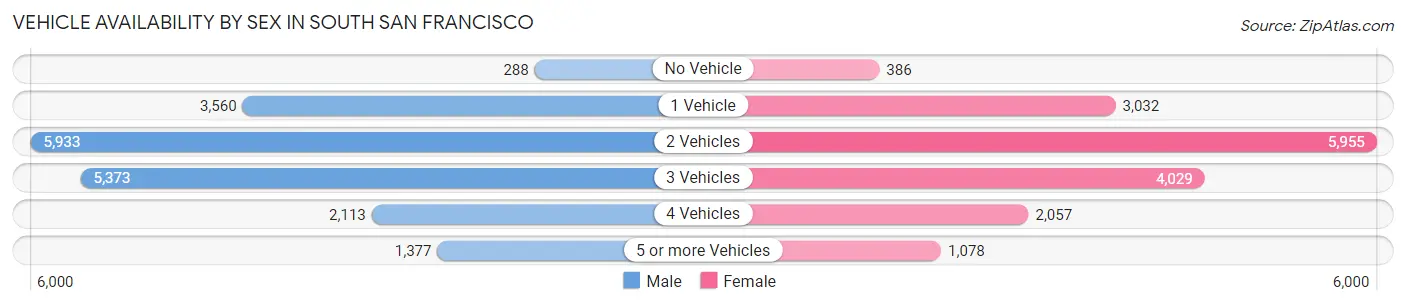
| Vehicles Available | Male | Female |
| No Vehicle | 288 (1.5%) | 386 (2.3%) |
| 1 Vehicle | 3,560 (19.1%) | 3,032 (18.3%) |
| 2 Vehicles | 5,933 (31.8%) | 5,955 (36.0%) |
| 3 Vehicles | 5,373 (28.8%) | 4,029 (24.4%) |
| 4 Vehicles | 2,113 (11.3%) | 2,057 (12.4%) |
| 5 or more Vehicles | 1,377 (7.4%) | 1,078 (6.5%) |
| Total | 18,644 (100.0%) | 16,537 (100.0%) |
Commute Time in South San Francisco
The most frequently occuring commute durations in South San Francisco are 15 to 19 minutes (5,040 commuters, 16.3%), 30 to 34 minutes (5,028 commuters, 16.3%), and 20 to 24 minutes (4,842 commuters, 15.7%).
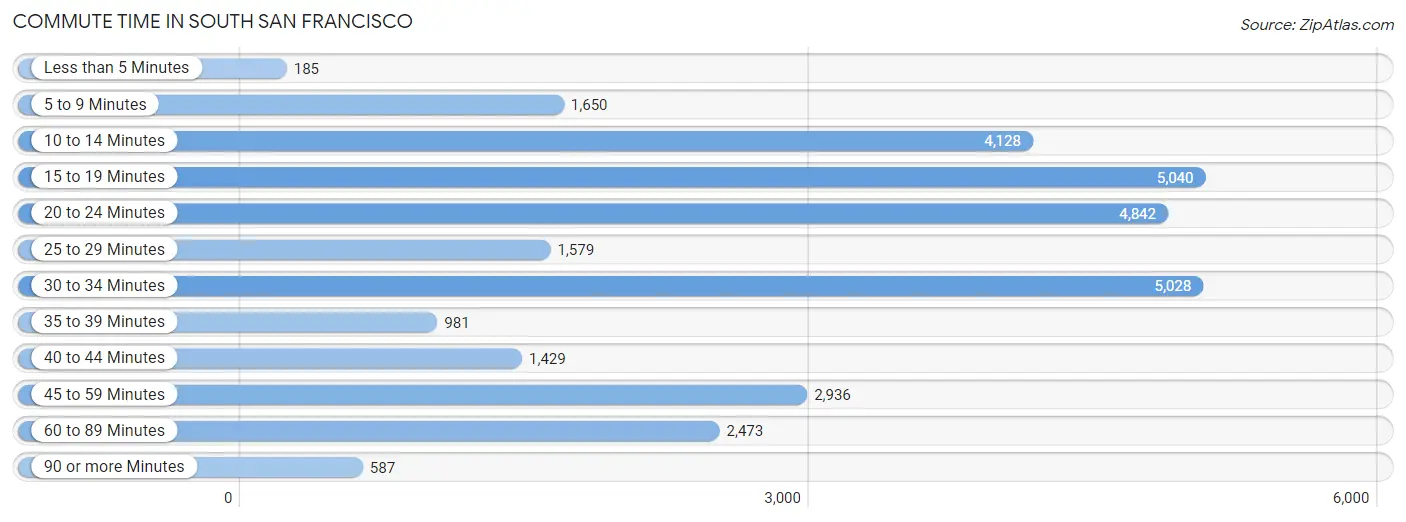
| Commute Time | # Commuters | % Commuters |
| Less than 5 Minutes | 185 | 0.6% |
| 5 to 9 Minutes | 1,650 | 5.3% |
| 10 to 14 Minutes | 4,128 | 13.4% |
| 15 to 19 Minutes | 5,040 | 16.3% |
| 20 to 24 Minutes | 4,842 | 15.7% |
| 25 to 29 Minutes | 1,579 | 5.1% |
| 30 to 34 Minutes | 5,028 | 16.3% |
| 35 to 39 Minutes | 981 | 3.2% |
| 40 to 44 Minutes | 1,429 | 4.6% |
| 45 to 59 Minutes | 2,936 | 9.5% |
| 60 to 89 Minutes | 2,473 | 8.0% |
| 90 or more Minutes | 587 | 1.9% |
Commute Time by Sex in South San Francisco
The most common commute times in South San Francisco are 20 to 24 minutes (2,563 commuters, 15.7%) for males and 30 to 34 minutes (2,582 commuters, 17.7%) for females.
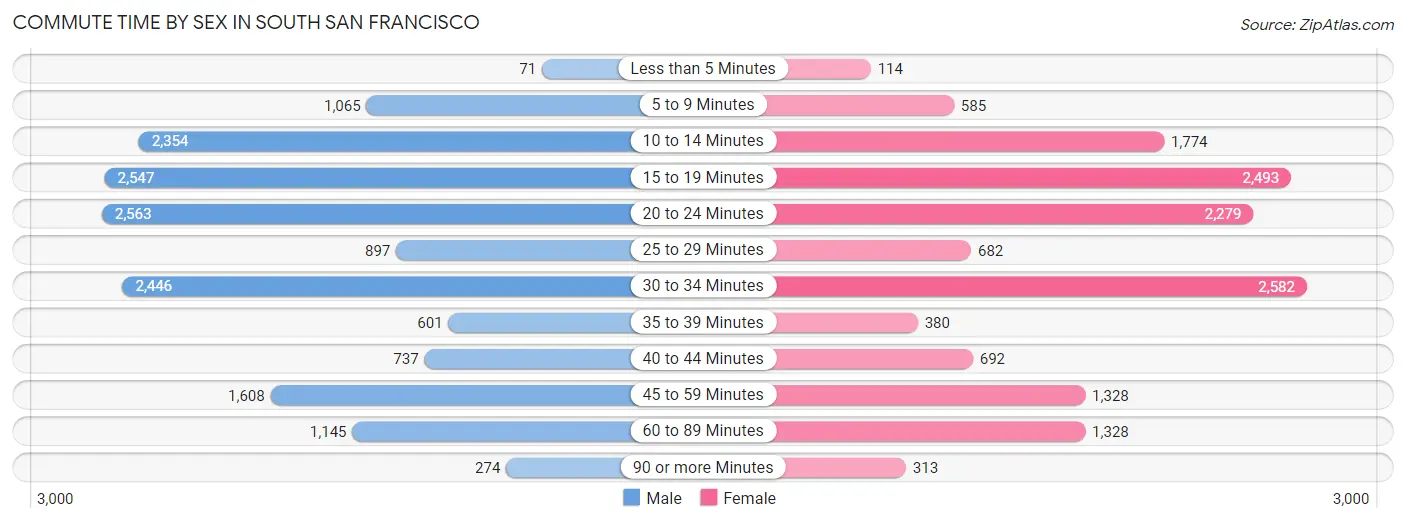
| Commute Time | Male | Female |
| Less than 5 Minutes | 71 (0.4%) | 114 (0.8%) |
| 5 to 9 Minutes | 1,065 (6.5%) | 585 (4.0%) |
| 10 to 14 Minutes | 2,354 (14.4%) | 1,774 (12.2%) |
| 15 to 19 Minutes | 2,547 (15.6%) | 2,493 (17.1%) |
| 20 to 24 Minutes | 2,563 (15.7%) | 2,279 (15.7%) |
| 25 to 29 Minutes | 897 (5.5%) | 682 (4.7%) |
| 30 to 34 Minutes | 2,446 (15.0%) | 2,582 (17.7%) |
| 35 to 39 Minutes | 601 (3.7%) | 380 (2.6%) |
| 40 to 44 Minutes | 737 (4.5%) | 692 (4.8%) |
| 45 to 59 Minutes | 1,608 (9.9%) | 1,328 (9.1%) |
| 60 to 89 Minutes | 1,145 (7.0%) | 1,328 (9.1%) |
| 90 or more Minutes | 274 (1.7%) | 313 (2.1%) |
Time of Departure to Work by Sex in South San Francisco
The most frequent times of departure to work in South San Francisco are 8:00 AM to 8:29 AM (2,143, 13.1%) for males and 7:30 AM to 7:59 AM (2,410, 16.6%) for females.
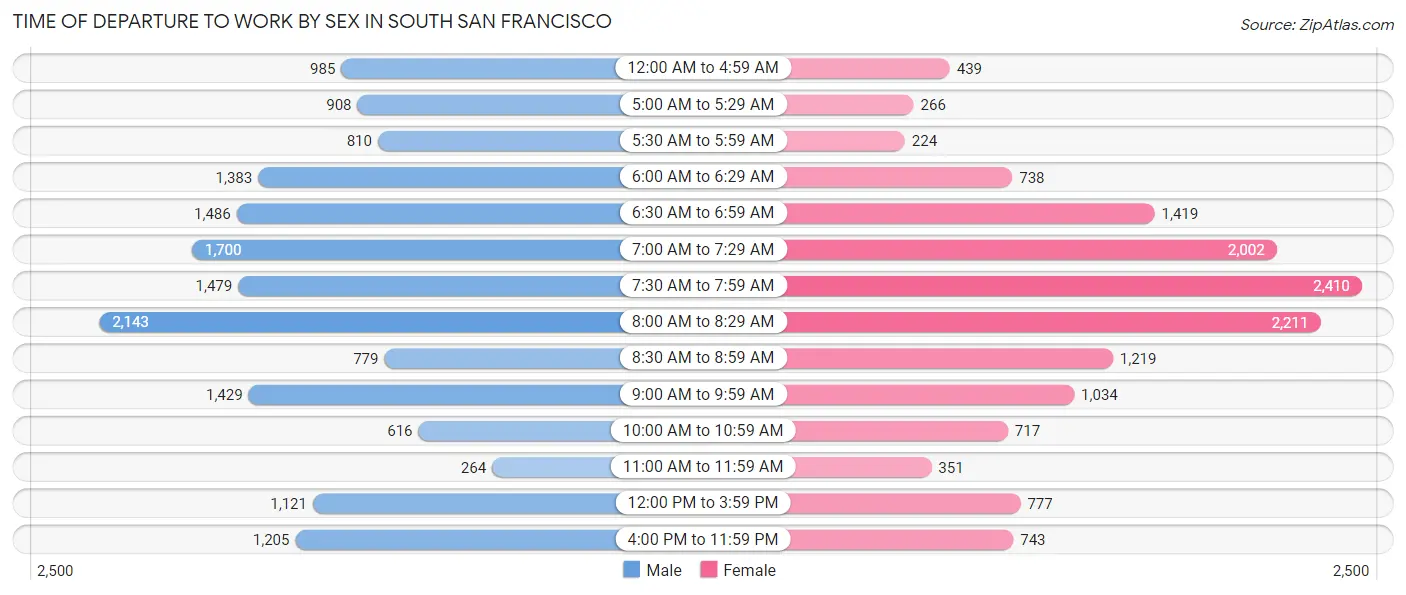
| Time of Departure | Male | Female |
| 12:00 AM to 4:59 AM | 985 (6.0%) | 439 (3.0%) |
| 5:00 AM to 5:29 AM | 908 (5.6%) | 266 (1.8%) |
| 5:30 AM to 5:59 AM | 810 (5.0%) | 224 (1.5%) |
| 6:00 AM to 6:29 AM | 1,383 (8.5%) | 738 (5.1%) |
| 6:30 AM to 6:59 AM | 1,486 (9.1%) | 1,419 (9.8%) |
| 7:00 AM to 7:29 AM | 1,700 (10.4%) | 2,002 (13.8%) |
| 7:30 AM to 7:59 AM | 1,479 (9.1%) | 2,410 (16.6%) |
| 8:00 AM to 8:29 AM | 2,143 (13.1%) | 2,211 (15.2%) |
| 8:30 AM to 8:59 AM | 779 (4.8%) | 1,219 (8.4%) |
| 9:00 AM to 9:59 AM | 1,429 (8.8%) | 1,034 (7.1%) |
| 10:00 AM to 10:59 AM | 616 (3.8%) | 717 (4.9%) |
| 11:00 AM to 11:59 AM | 264 (1.6%) | 351 (2.4%) |
| 12:00 PM to 3:59 PM | 1,121 (6.9%) | 777 (5.3%) |
| 4:00 PM to 11:59 PM | 1,205 (7.4%) | 743 (5.1%) |
| Total | 16,308 (100.0%) | 14,550 (100.0%) |
Housing Occupancy in South San Francisco
Occupancy by Ownership in South San Francisco
Of the total 22,036 dwellings in South San Francisco, owner-occupied units account for 13,585 (61.7%), while renter-occupied units make up 8,451 (38.4%).
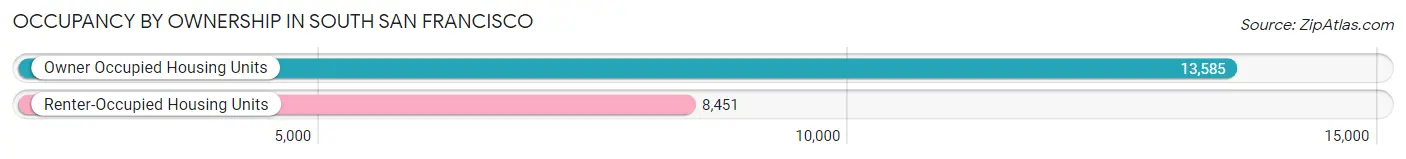
| Occupancy | # Housing Units | % Housing Units |
| Owner Occupied Housing Units | 13,585 | 61.7% |
| Renter-Occupied Housing Units | 8,451 | 38.4% |
| Total Occupied Housing Units | 22,036 | 100.0% |
Occupancy by Household Size in South San Francisco
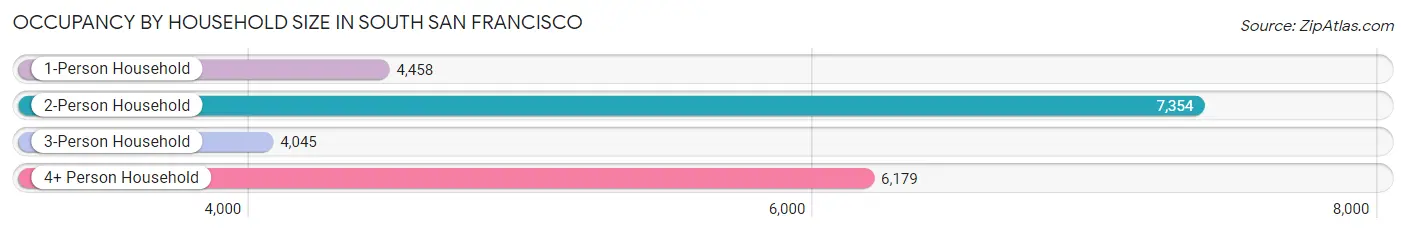
| Household Size | # Housing Units | % Housing Units |
| 1-Person Household | 4,458 | 20.2% |
| 2-Person Household | 7,354 | 33.4% |
| 3-Person Household | 4,045 | 18.4% |
| 4+ Person Household | 6,179 | 28.0% |
| Total Housing Units | 22,036 | 100.0% |
Occupancy by Ownership by Household Size in South San Francisco
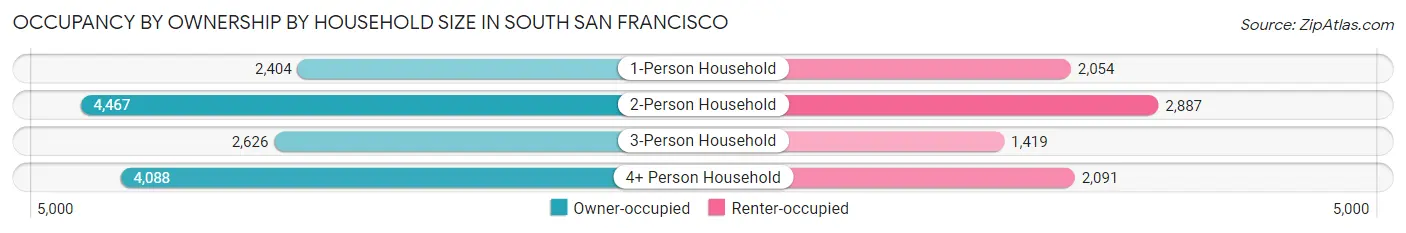
| Household Size | Owner-occupied | Renter-occupied |
| 1-Person Household | 2,404 (53.9%) | 2,054 (46.1%) |
| 2-Person Household | 4,467 (60.7%) | 2,887 (39.3%) |
| 3-Person Household | 2,626 (64.9%) | 1,419 (35.1%) |
| 4+ Person Household | 4,088 (66.2%) | 2,091 (33.8%) |
| Total Housing Units | 13,585 (61.7%) | 8,451 (38.4%) |
Occupancy by Educational Attainment in South San Francisco
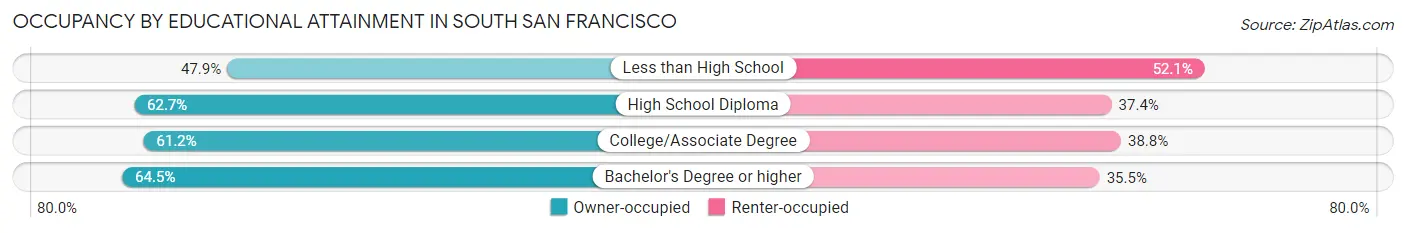
| Household Size | Owner-occupied | Renter-occupied |
| Less than High School | 954 (47.9%) | 1,038 (52.1%) |
| High School Diploma | 2,256 (62.6%) | 1,345 (37.3%) |
| College/Associate Degree | 4,288 (61.2%) | 2,723 (38.8%) |
| Bachelor's Degree or higher | 6,087 (64.5%) | 3,345 (35.5%) |
Occupancy by Age of Householder in South San Francisco
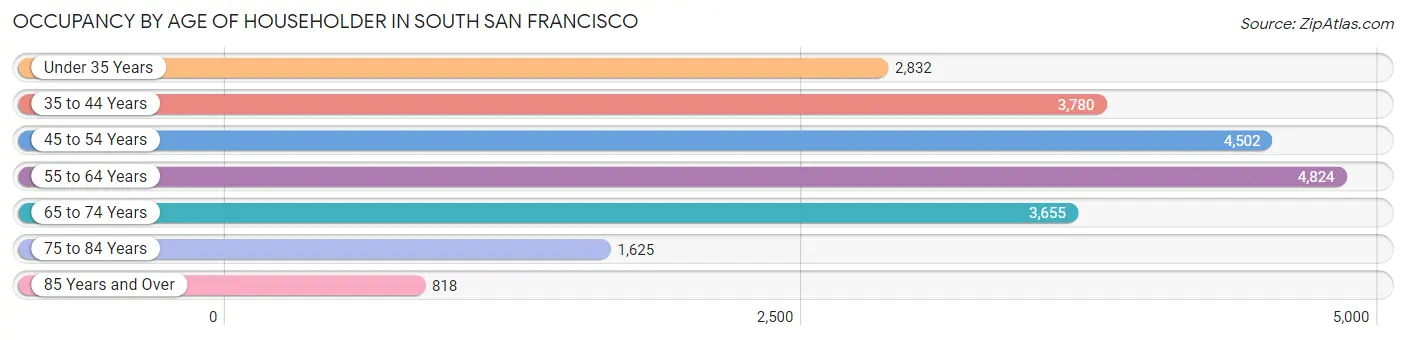
| Age Bracket | # Households | % Households |
| Under 35 Years | 2,832 | 12.9% |
| 35 to 44 Years | 3,780 | 17.2% |
| 45 to 54 Years | 4,502 | 20.4% |
| 55 to 64 Years | 4,824 | 21.9% |
| 65 to 74 Years | 3,655 | 16.6% |
| 75 to 84 Years | 1,625 | 7.4% |
| 85 Years and Over | 818 | 3.7% |
| Total | 22,036 | 100.0% |
Housing Finances in South San Francisco
Median Income by Occupancy in South San Francisco
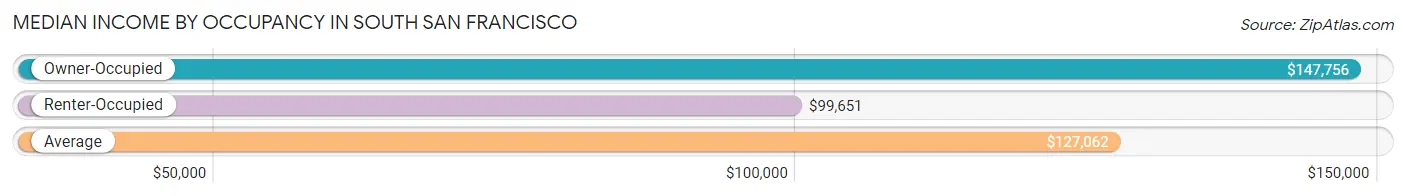
| Occupancy Type | # Households | Median Income |
| Owner-Occupied | 13,585 (61.7%) | $147,756 |
| Renter-Occupied | 8,451 (38.4%) | $99,651 |
| Average | 22,036 (100.0%) | $127,062 |
Occupancy by Householder Income Bracket in South San Francisco
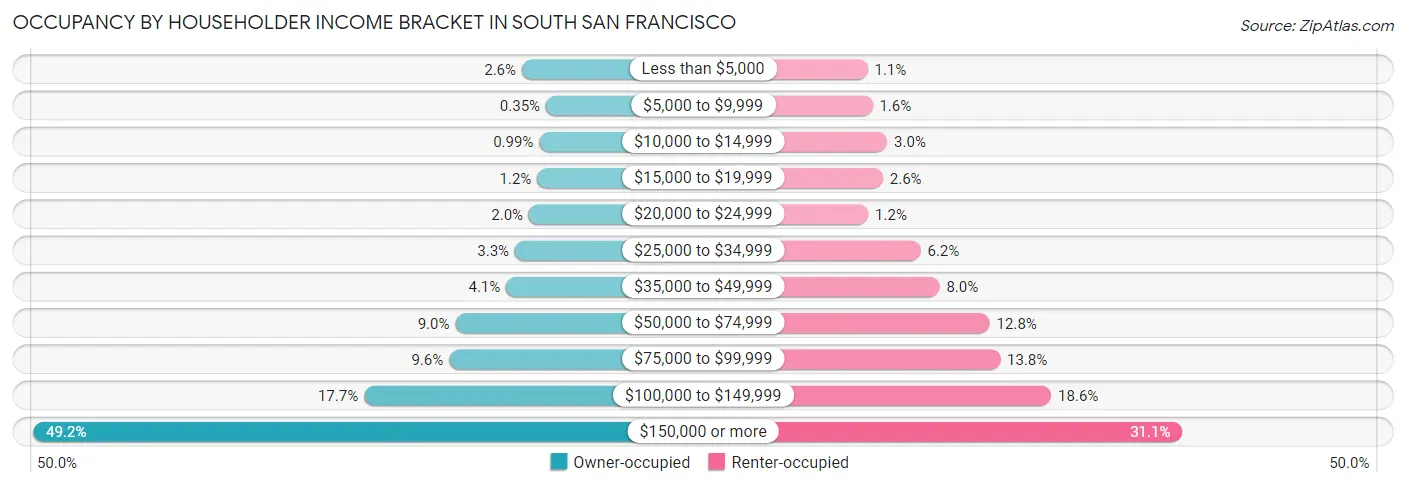
| Income Bracket | Owner-occupied | Renter-occupied |
| Less than $5,000 | 359 (2.6%) | 96 (1.1%) |
| $5,000 to $9,999 | 48 (0.4%) | 136 (1.6%) |
| $10,000 to $14,999 | 135 (1.0%) | 254 (3.0%) |
| $15,000 to $19,999 | 160 (1.2%) | 220 (2.6%) |
| $20,000 to $24,999 | 267 (2.0%) | 101 (1.2%) |
| $25,000 to $34,999 | 448 (3.3%) | 523 (6.2%) |
| $35,000 to $49,999 | 563 (4.1%) | 675 (8.0%) |
| $50,000 to $74,999 | 1,220 (9.0%) | 1,079 (12.8%) |
| $75,000 to $99,999 | 1,300 (9.6%) | 1,164 (13.8%) |
| $100,000 to $149,999 | 2,402 (17.7%) | 1,574 (18.6%) |
| $150,000 or more | 6,683 (49.2%) | 2,629 (31.1%) |
| Total | 13,585 (100.0%) | 8,451 (100.0%) |
Monthly Housing Cost Tiers in South San Francisco
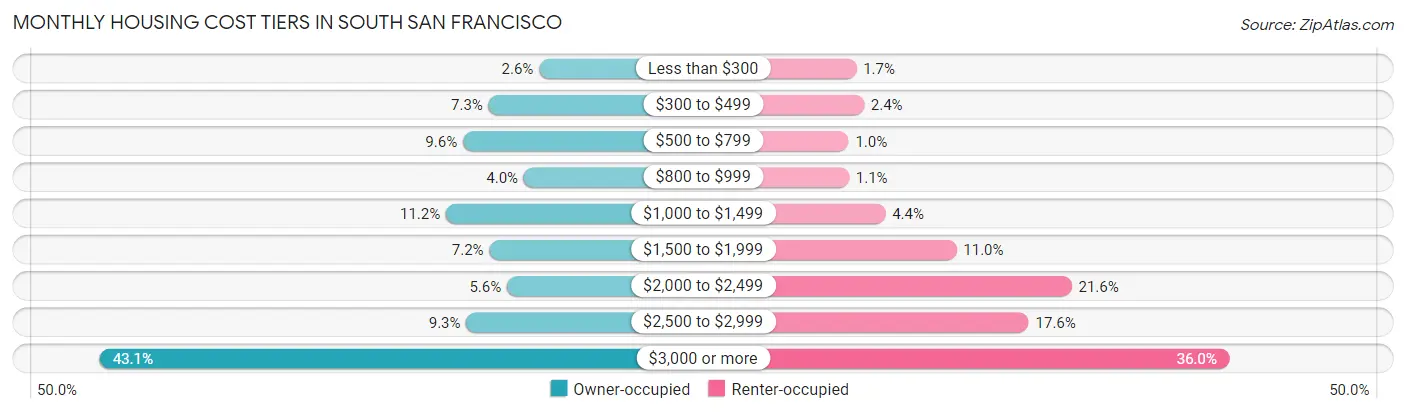
| Monthly Cost | Owner-occupied | Renter-occupied |
| Less than $300 | 357 (2.6%) | 146 (1.7%) |
| $300 to $499 | 989 (7.3%) | 205 (2.4%) |
| $500 to $799 | 1,310 (9.6%) | 86 (1.0%) |
| $800 to $999 | 548 (4.0%) | 89 (1.1%) |
| $1,000 to $1,499 | 1,521 (11.2%) | 372 (4.4%) |
| $1,500 to $1,999 | 980 (7.2%) | 925 (11.0%) |
| $2,000 to $2,499 | 760 (5.6%) | 1,821 (21.5%) |
| $2,500 to $2,999 | 1,268 (9.3%) | 1,487 (17.6%) |
| $3,000 or more | 5,852 (43.1%) | 3,045 (36.0%) |
| Total | 13,585 (100.0%) | 8,451 (100.0%) |
Physical Housing Characteristics in South San Francisco
Housing Structures in South San Francisco
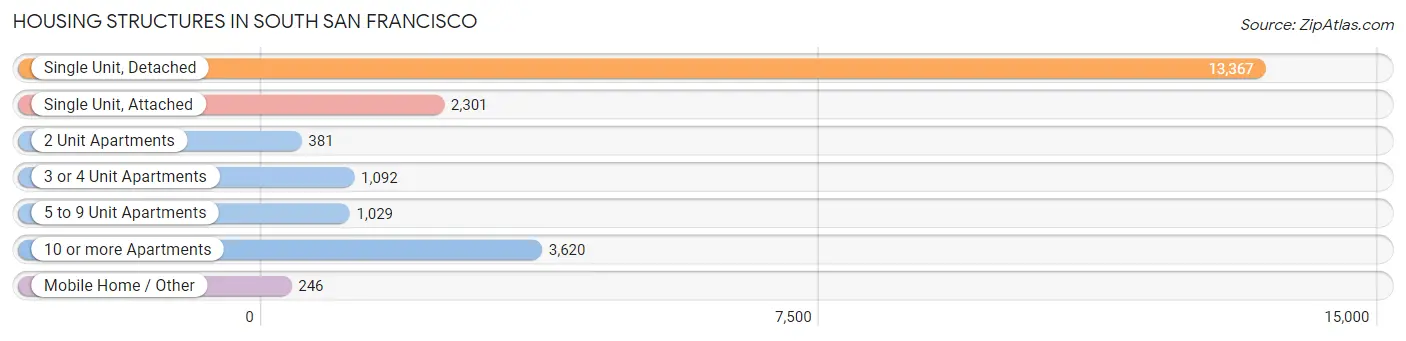
| Structure Type | # Housing Units | % Housing Units |
| Single Unit, Detached | 13,367 | 60.7% |
| Single Unit, Attached | 2,301 | 10.4% |
| 2 Unit Apartments | 381 | 1.7% |
| 3 or 4 Unit Apartments | 1,092 | 5.0% |
| 5 to 9 Unit Apartments | 1,029 | 4.7% |
| 10 or more Apartments | 3,620 | 16.4% |
| Mobile Home / Other | 246 | 1.1% |
| Total | 22,036 | 100.0% |
Housing Structures by Occupancy in South San Francisco
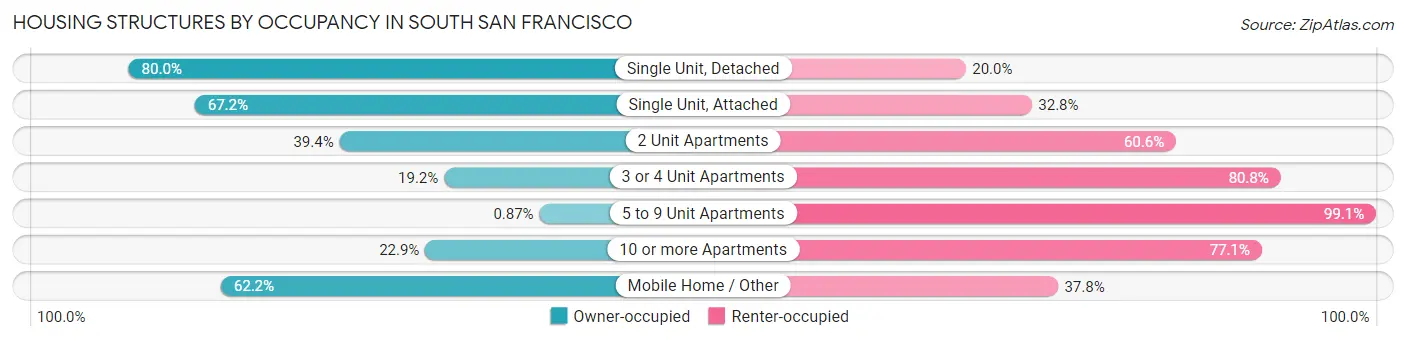
| Structure Type | Owner-occupied | Renter-occupied |
| Single Unit, Detached | 10,688 (80.0%) | 2,679 (20.0%) |
| Single Unit, Attached | 1,547 (67.2%) | 754 (32.8%) |
| 2 Unit Apartments | 150 (39.4%) | 231 (60.6%) |
| 3 or 4 Unit Apartments | 210 (19.2%) | 882 (80.8%) |
| 5 to 9 Unit Apartments | 9 (0.9%) | 1,020 (99.1%) |
| 10 or more Apartments | 828 (22.9%) | 2,792 (77.1%) |
| Mobile Home / Other | 153 (62.2%) | 93 (37.8%) |
| Total | 13,585 (61.7%) | 8,451 (38.4%) |
Housing Structures by Number of Rooms in South San Francisco
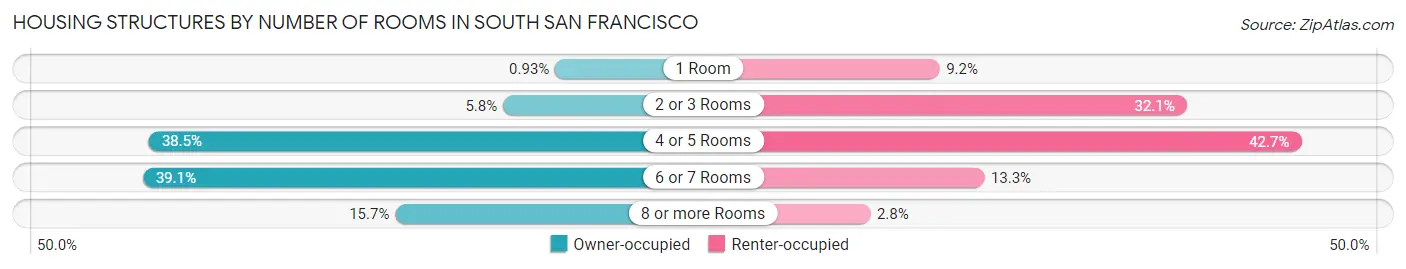
| Number of Rooms | Owner-occupied | Renter-occupied |
| 1 Room | 127 (0.9%) | 776 (9.2%) |
| 2 or 3 Rooms | 781 (5.8%) | 2,709 (32.1%) |
| 4 or 5 Rooms | 5,233 (38.5%) | 3,605 (42.7%) |
| 6 or 7 Rooms | 5,308 (39.1%) | 1,126 (13.3%) |
| 8 or more Rooms | 2,136 (15.7%) | 235 (2.8%) |
| Total | 13,585 (100.0%) | 8,451 (100.0%) |
Housing Structure by Heating Type in South San Francisco
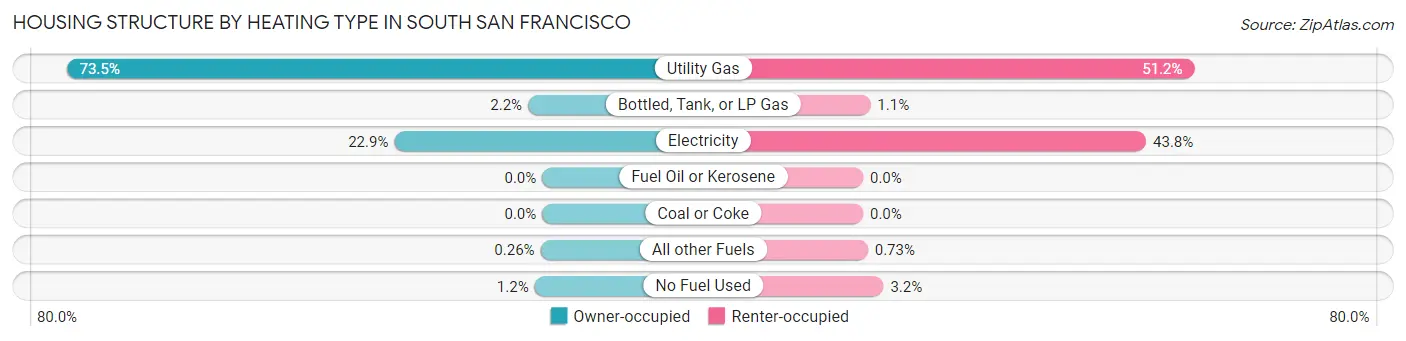
| Heating Type | Owner-occupied | Renter-occupied |
| Utility Gas | 9,987 (73.5%) | 4,328 (51.2%) |
| Bottled, Tank, or LP Gas | 297 (2.2%) | 96 (1.1%) |
| Electricity | 3,106 (22.9%) | 3,698 (43.8%) |
| Fuel Oil or Kerosene | 0 (0.0%) | 0 (0.0%) |
| Coal or Coke | 0 (0.0%) | 0 (0.0%) |
| All other Fuels | 35 (0.3%) | 62 (0.7%) |
| No Fuel Used | 160 (1.2%) | 267 (3.2%) |
| Total | 13,585 (100.0%) | 8,451 (100.0%) |
Household Vehicle Usage in South San Francisco
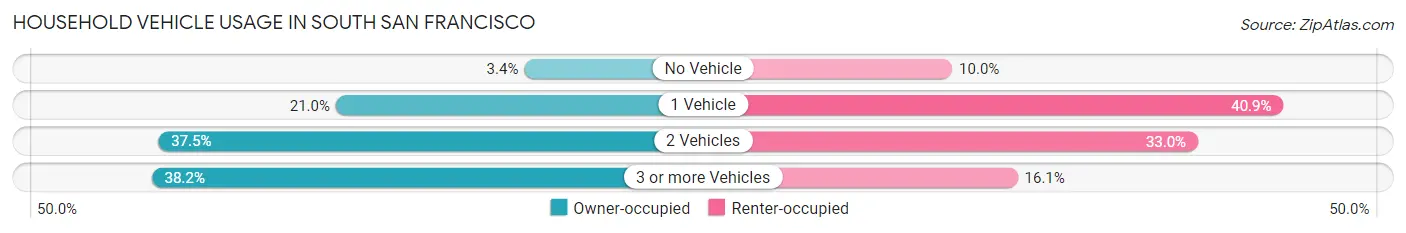
| Vehicles per Household | Owner-occupied | Renter-occupied |
| No Vehicle | 457 (3.4%) | 846 (10.0%) |
| 1 Vehicle | 2,846 (20.9%) | 3,458 (40.9%) |
| 2 Vehicles | 5,099 (37.5%) | 2,785 (33.0%) |
| 3 or more Vehicles | 5,183 (38.2%) | 1,362 (16.1%) |
| Total | 13,585 (100.0%) | 8,451 (100.0%) |
Real Estate & Mortgages in South San Francisco
Real Estate and Mortgage Overview in South San Francisco
| Characteristic | Without Mortgage | With Mortgage |
| Housing Units | 4,532 | 9,053 |
| Median Property Value | $1,083,000 | $1,130,700 |
| Median Household Income | $103,941 | $5,217 |
| Monthly Housing Costs | $732 | $5,840 |
| Real Estate Taxes | $4,550 | $81 |
Property Value by Mortgage Status in South San Francisco
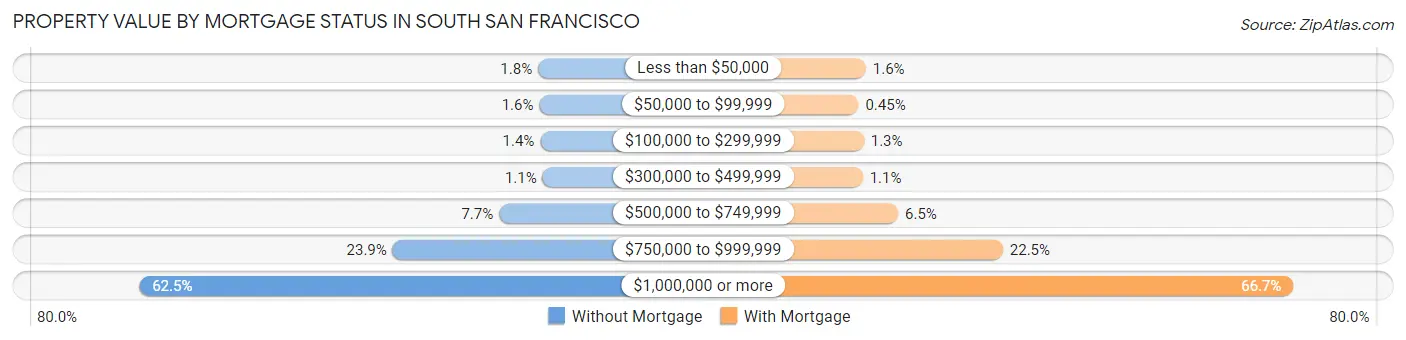
| Property Value | Without Mortgage | With Mortgage |
| Less than $50,000 | 80 (1.8%) | 142 (1.6%) |
| $50,000 to $99,999 | 71 (1.6%) | 41 (0.4%) |
| $100,000 to $299,999 | 65 (1.4%) | 113 (1.3%) |
| $300,000 to $499,999 | 49 (1.1%) | 99 (1.1%) |
| $500,000 to $749,999 | 349 (7.7%) | 587 (6.5%) |
| $750,000 to $999,999 | 1,084 (23.9%) | 2,032 (22.5%) |
| $1,000,000 or more | 2,834 (62.5%) | 6,039 (66.7%) |
| Total | 4,532 (100.0%) | 9,053 (100.0%) |
Household Income by Mortgage Status in South San Francisco
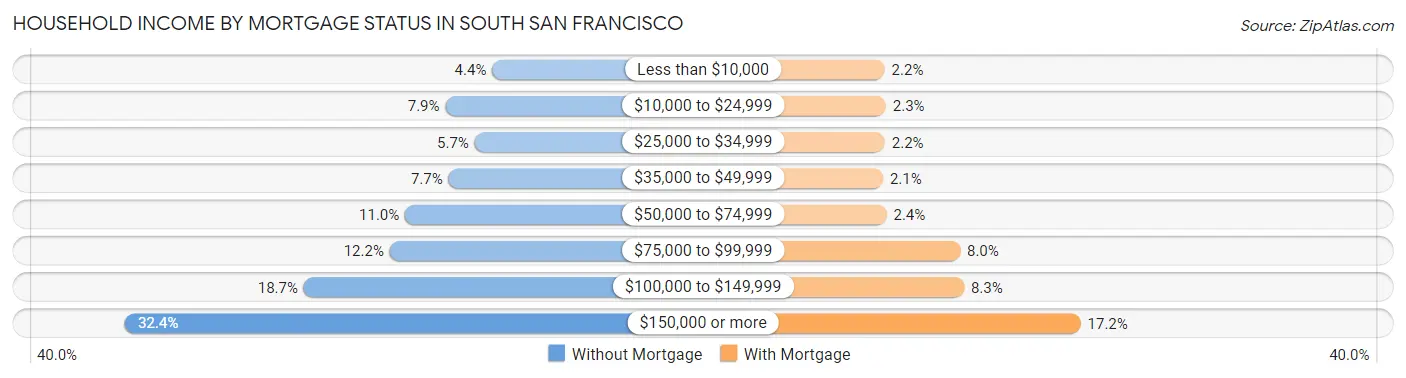
| Household Income | Without Mortgage | With Mortgage |
| Less than $10,000 | 198 (4.4%) | 201 (2.2%) |
| $10,000 to $24,999 | 360 (7.9%) | 209 (2.3%) |
| $25,000 to $34,999 | 259 (5.7%) | 202 (2.2%) |
| $35,000 to $49,999 | 349 (7.7%) | 189 (2.1%) |
| $50,000 to $74,999 | 499 (11.0%) | 214 (2.4%) |
| $75,000 to $99,999 | 552 (12.2%) | 721 (8.0%) |
| $100,000 to $149,999 | 849 (18.7%) | 748 (8.3%) |
| $150,000 or more | 1,466 (32.4%) | 1,553 (17.2%) |
| Total | 4,532 (100.0%) | 9,053 (100.0%) |
Property Value to Household Income Ratio in South San Francisco
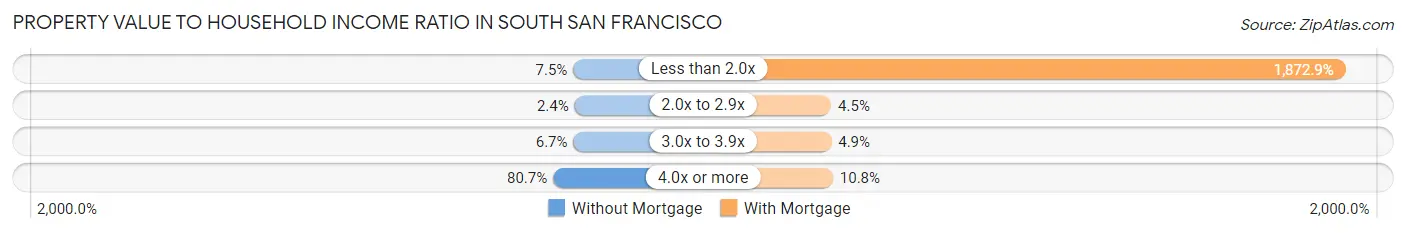
| Value-to-Income Ratio | Without Mortgage | With Mortgage |
| Less than 2.0x | 341 (7.5%) | 169,556 (1,872.9%) |
| 2.0x to 2.9x | 110 (2.4%) | 403 (4.4%) |
| 3.0x to 3.9x | 303 (6.7%) | 441 (4.9%) |
| 4.0x or more | 3,655 (80.6%) | 976 (10.8%) |
| Total | 4,532 (100.0%) | 9,053 (100.0%) |
Real Estate Taxes by Mortgage Status in South San Francisco
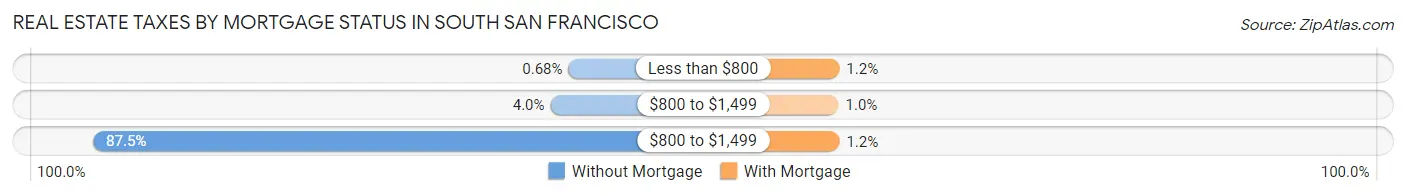
| Property Taxes | Without Mortgage | With Mortgage |
| Less than $800 | 31 (0.7%) | 105 (1.2%) |
| $800 to $1,499 | 180 (4.0%) | 92 (1.0%) |
| $800 to $1,499 | 3,964 (87.5%) | 107 (1.2%) |
| Total | 4,532 (100.0%) | 9,053 (100.0%) |
Health & Disability in South San Francisco
Health Insurance Coverage by Age in South San Francisco
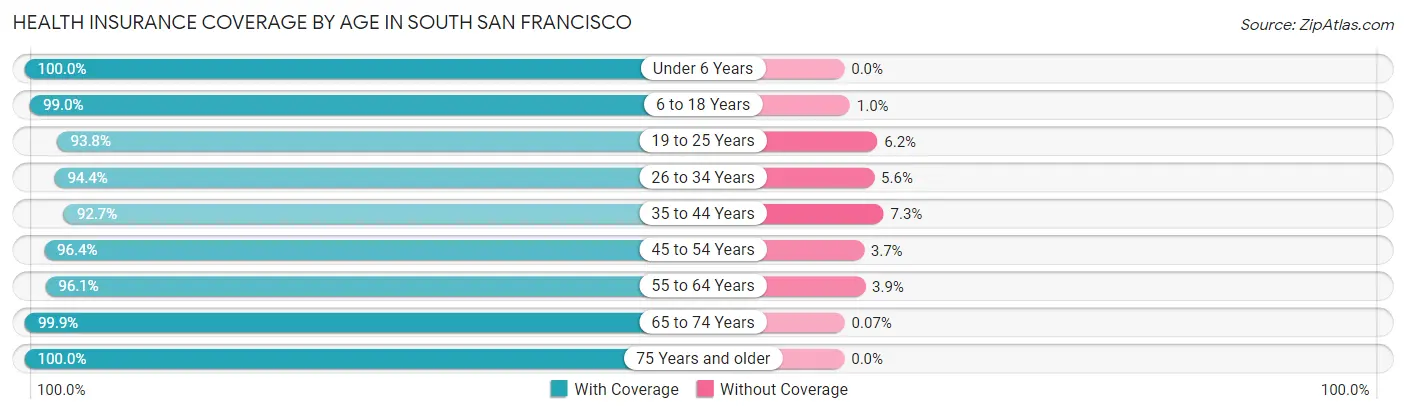
| Age Bracket | With Coverage | Without Coverage |
| Under 6 Years | 3,600 (100.0%) | 0 (0.0%) |
| 6 to 18 Years | 8,413 (99.0%) | 88 (1.0%) |
| 19 to 25 Years | 5,045 (93.8%) | 331 (6.2%) |
| 26 to 34 Years | 7,754 (94.4%) | 457 (5.6%) |
| 35 to 44 Years | 8,773 (92.7%) | 694 (7.3%) |
| 45 to 54 Years | 9,116 (96.4%) | 345 (3.6%) |
| 55 to 64 Years | 9,206 (96.1%) | 372 (3.9%) |
| 65 to 74 Years | 6,753 (99.9%) | 5 (0.1%) |
| 75 Years and older | 4,595 (100.0%) | 0 (0.0%) |
| Total | 63,255 (96.5%) | 2,292 (3.5%) |
Health Insurance Coverage by Citizenship Status in South San Francisco
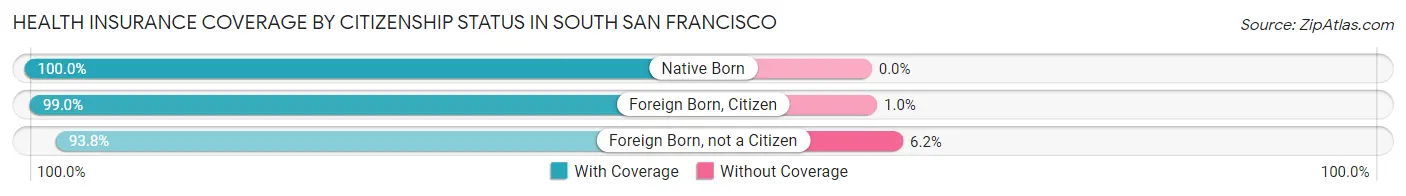
| Citizenship Status | With Coverage | Without Coverage |
| Native Born | 3,600 (100.0%) | 0 (0.0%) |
| Foreign Born, Citizen | 8,413 (99.0%) | 88 (1.0%) |
| Foreign Born, not a Citizen | 5,045 (93.8%) | 331 (6.2%) |
Health Insurance Coverage by Household Income in South San Francisco
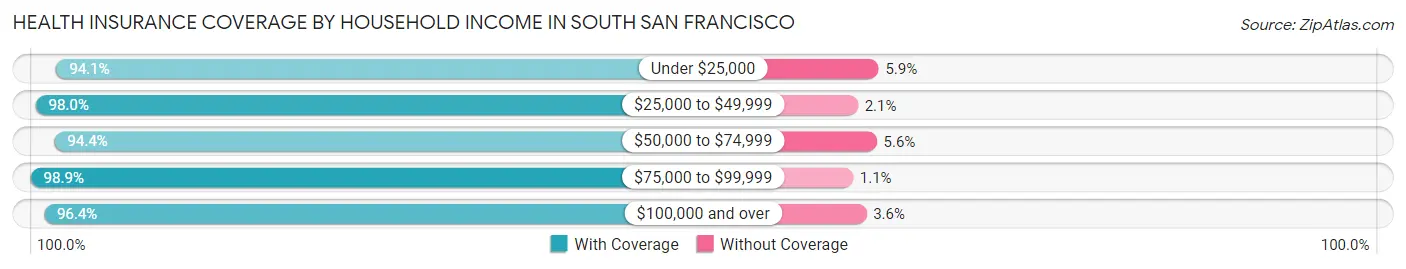
| Household Income | With Coverage | Without Coverage |
| Under $25,000 | 2,646 (94.1%) | 167 (5.9%) |
| $25,000 to $49,999 | 4,972 (98.0%) | 104 (2.1%) |
| $50,000 to $74,999 | 5,355 (94.4%) | 317 (5.6%) |
| $75,000 to $99,999 | 6,509 (98.9%) | 75 (1.1%) |
| $100,000 and over | 42,836 (96.4%) | 1,615 (3.6%) |
Public vs Private Health Insurance Coverage by Age in South San Francisco
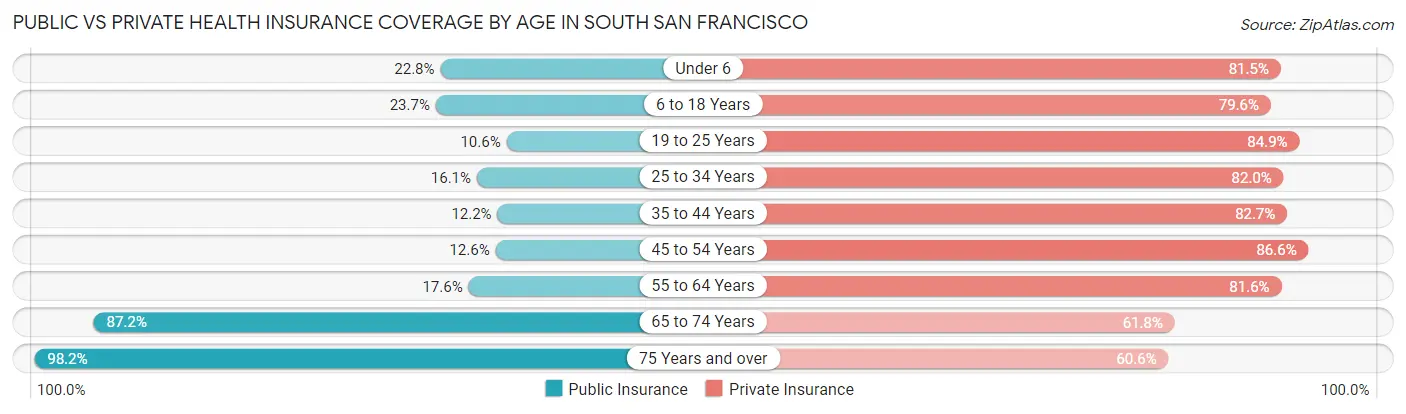
| Age Bracket | Public Insurance | Private Insurance |
| Under 6 | 822 (22.8%) | 2,933 (81.5%) |
| 6 to 18 Years | 2,014 (23.7%) | 6,770 (79.6%) |
| 19 to 25 Years | 567 (10.5%) | 4,566 (84.9%) |
| 25 to 34 Years | 1,319 (16.1%) | 6,734 (82.0%) |
| 35 to 44 Years | 1,158 (12.2%) | 7,826 (82.7%) |
| 45 to 54 Years | 1,192 (12.6%) | 8,195 (86.6%) |
| 55 to 64 Years | 1,687 (17.6%) | 7,815 (81.6%) |
| 65 to 74 Years | 5,892 (87.2%) | 4,177 (61.8%) |
| 75 Years and over | 4,512 (98.2%) | 2,786 (60.6%) |
| Total | 19,163 (29.2%) | 51,802 (79.0%) |
Disability Status by Sex by Age in South San Francisco
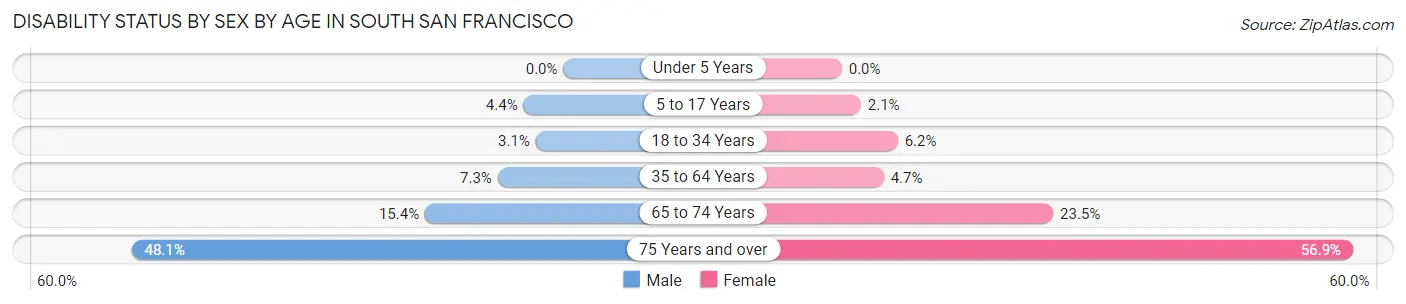
| Age Bracket | Male | Female |
| Under 5 Years | 0 (0.0%) | 0 (0.0%) |
| 5 to 17 Years | 180 (4.4%) | 89 (2.1%) |
| 18 to 34 Years | 223 (3.1%) | 452 (6.2%) |
| 35 to 64 Years | 1,082 (7.3%) | 640 (4.7%) |
| 65 to 74 Years | 478 (15.4%) | 861 (23.5%) |
| 75 Years and over | 868 (48.1%) | 1,588 (56.9%) |
Disability Class by Sex by Age in South San Francisco
Disability Class: Hearing Difficulty
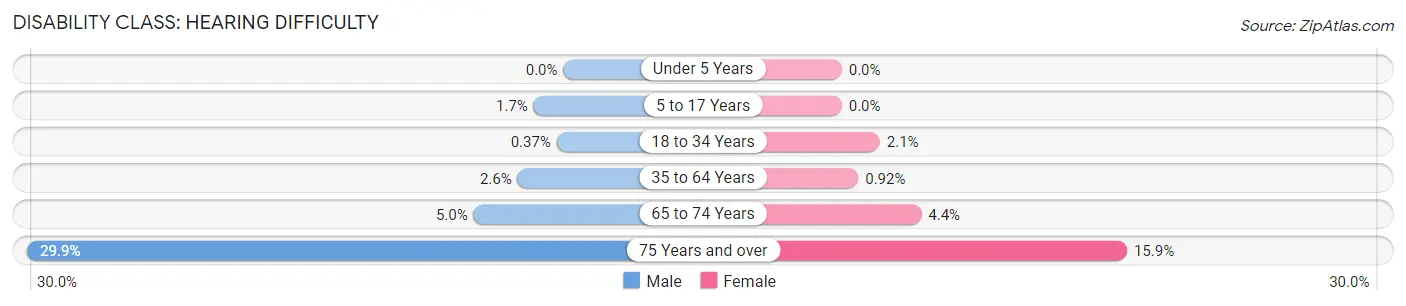
| Age Bracket | Male | Female |
| Under 5 Years | 0 (0.0%) | 0 (0.0%) |
| 5 to 17 Years | 67 (1.7%) | 0 (0.0%) |
| 18 to 34 Years | 27 (0.4%) | 154 (2.1%) |
| 35 to 64 Years | 377 (2.5%) | 126 (0.9%) |
| 65 to 74 Years | 155 (5.0%) | 162 (4.4%) |
| 75 Years and over | 539 (29.9%) | 443 (15.9%) |
Disability Class: Vision Difficulty
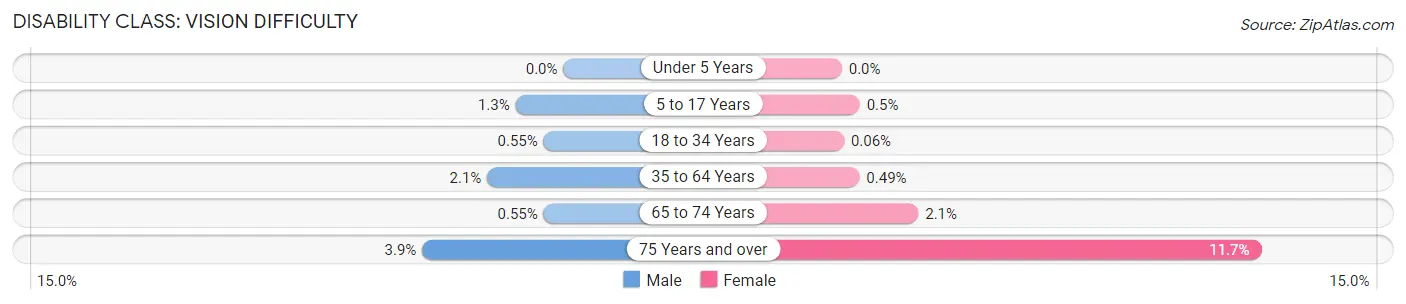
| Age Bracket | Male | Female |
| Under 5 Years | 0 (0.0%) | 0 (0.0%) |
| 5 to 17 Years | 54 (1.3%) | 21 (0.5%) |
| 18 to 34 Years | 40 (0.5%) | 4 (0.1%) |
| 35 to 64 Years | 314 (2.1%) | 67 (0.5%) |
| 65 to 74 Years | 17 (0.5%) | 78 (2.1%) |
| 75 Years and over | 71 (3.9%) | 326 (11.7%) |
Disability Class: Cognitive Difficulty
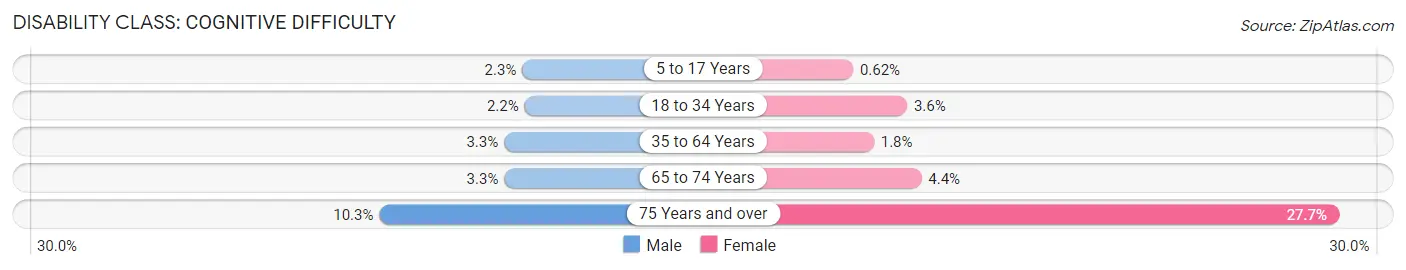
| Age Bracket | Male | Female |
| 5 to 17 Years | 93 (2.3%) | 26 (0.6%) |
| 18 to 34 Years | 156 (2.2%) | 263 (3.6%) |
| 35 to 64 Years | 489 (3.3%) | 244 (1.8%) |
| 65 to 74 Years | 102 (3.3%) | 162 (4.4%) |
| 75 Years and over | 185 (10.2%) | 772 (27.7%) |
Disability Class: Ambulatory Difficulty
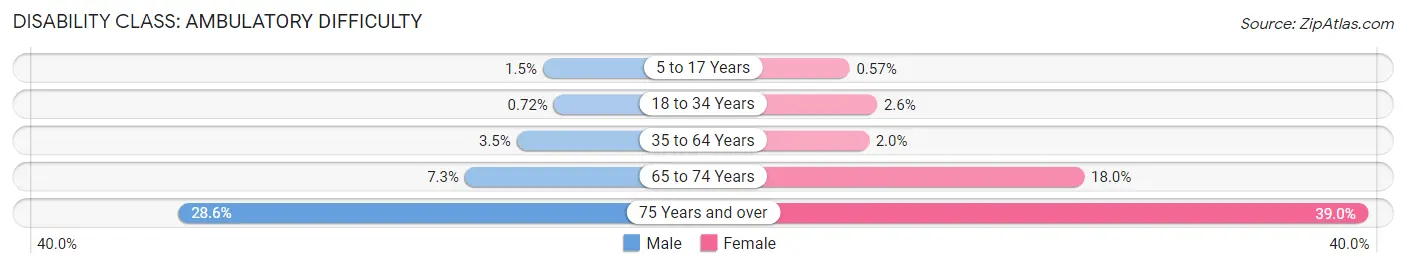
| Age Bracket | Male | Female |
| 5 to 17 Years | 62 (1.5%) | 24 (0.6%) |
| 18 to 34 Years | 52 (0.7%) | 189 (2.6%) |
| 35 to 64 Years | 514 (3.5%) | 274 (2.0%) |
| 65 to 74 Years | 227 (7.3%) | 658 (18.0%) |
| 75 Years and over | 516 (28.6%) | 1,089 (39.0%) |
Disability Class: Self-Care Difficulty
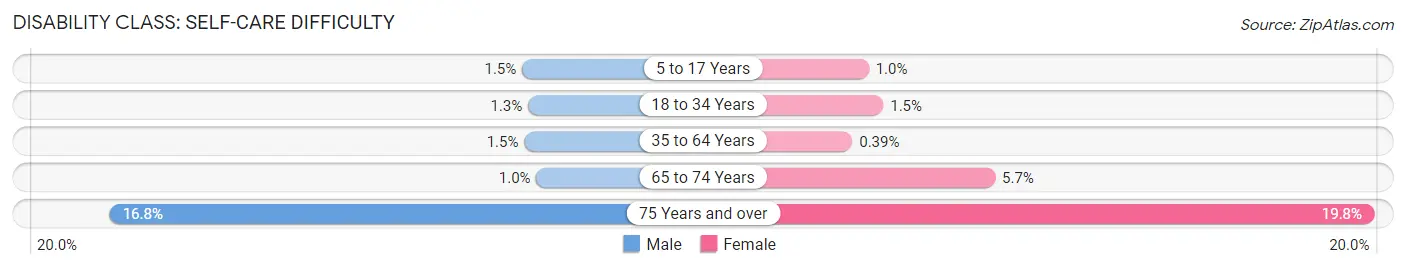
| Age Bracket | Male | Female |
| 5 to 17 Years | 62 (1.5%) | 42 (1.0%) |
| 18 to 34 Years | 95 (1.3%) | 112 (1.5%) |
| 35 to 64 Years | 215 (1.5%) | 54 (0.4%) |
| 65 to 74 Years | 31 (1.0%) | 208 (5.7%) |
| 75 Years and over | 304 (16.8%) | 551 (19.8%) |
Technology Access in South San Francisco
Computing Device Access in South San Francisco
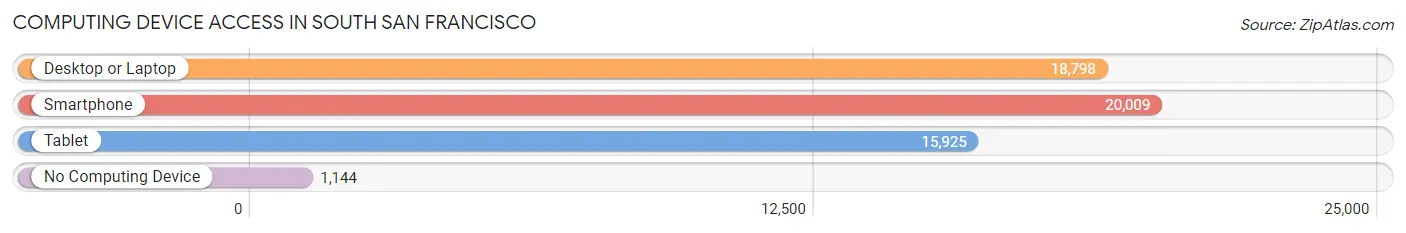
| Device Type | # Households | % Households |
| Desktop or Laptop | 18,798 | 85.3% |
| Smartphone | 20,009 | 90.8% |
| Tablet | 15,925 | 72.3% |
| No Computing Device | 1,144 | 5.2% |
| Total | 22,036 | 100.0% |
Internet Access in South San Francisco
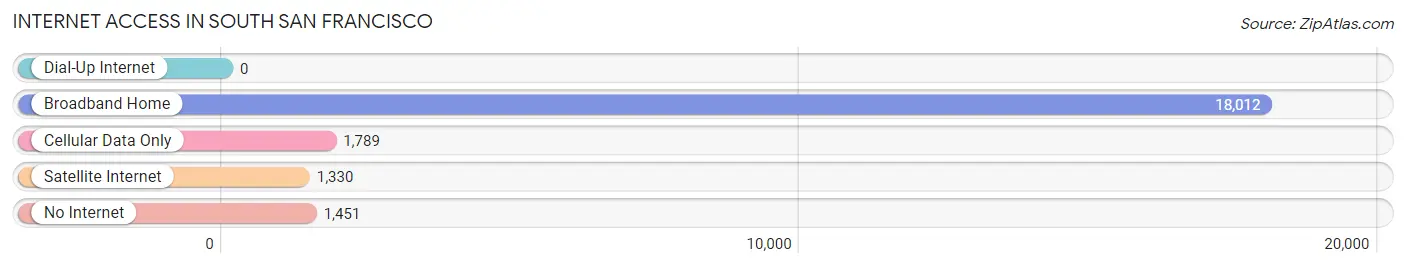
| Internet Type | # Households | % Households |
| Dial-Up Internet | 0 | 0.0% |
| Broadband Home | 18,012 | 81.7% |
| Cellular Data Only | 1,789 | 8.1% |
| Satellite Internet | 1,330 | 6.0% |
| No Internet | 1,451 | 6.6% |
| Total | 22,036 | 100.0% |
South San Francisco Summary
San Francisco is a city located in the San Francisco Bay Area of California. It is the second most populous city in the state and the fourth most populous in the United States. San Francisco is known for its diverse culture, vibrant neighborhoods, and iconic landmarks. It is a major financial and cultural center of the West Coast and is home to many of the world’s most influential companies and organizations.
History
San Francisco was founded in 1776 by Spanish colonists, who named it Yerba Buena. The city was later renamed San Francisco in 1846, after the Mexican-American War. The city quickly grew in population and importance, becoming a major port and commercial center. In 1848, gold was discovered in the area, leading to the California Gold Rush and a massive influx of people. The city was incorporated in 1850 and quickly became a major financial and cultural center.
In 1906, a devastating earthquake and fire destroyed much of the city. However, the city was quickly rebuilt and continued to grow. In the 1950s and 1960s, San Francisco became a major center of the counterculture movement, with the rise of the hippie movement and the Summer of Love.
Geography
San Francisco is located on the northern end of the San Francisco Peninsula, which is surrounded by the Pacific Ocean to the west and the San Francisco Bay to the east. The city is divided into several distinct neighborhoods, including the Financial District, Chinatown, North Beach, and the Mission District. The city is also home to several iconic landmarks, including the Golden Gate Bridge, Alcatraz Island, and the Transamerica Pyramid.
Economy
San Francisco is a major financial and cultural center of the West Coast. It is home to many of the world’s most influential companies and organizations, including Apple, Google, Twitter, and Uber. The city is also a major center for technology, finance, and tourism.
San Francisco is home to several major industries, including finance, technology, tourism, and manufacturing. The city is also a major center for the arts, with numerous museums, galleries, and theaters.
Demographics
As of 2019, San Francisco had an estimated population of 883,305. The city is highly diverse, with a population that is 44.2% White, 33.3% Asian, 15.1% Hispanic or Latino, and 6.3% African American. The median household income is $96,265, and the median home value is $1,092,400.
San Francisco is a major center of culture and diversity. The city is home to numerous ethnic and cultural festivals, including the Chinese New Year Parade, the Carnaval San Francisco, and the Folsom Street Fair. The city is also home to a vibrant LGBT community, with numerous bars, clubs, and organizations.
Conclusion
San Francisco is a major financial and cultural center of the West Coast. It is home to many of the world’s most influential companies and organizations, and is a major center for technology, finance, and tourism. The city is highly diverse, with a population that is 44.2% White, 33.3% Asian, 15.1% Hispanic or Latino, and 6.3% African American. San Francisco is also a major center of culture and diversity, with numerous ethnic and cultural festivals, and a vibrant LGBT community.
Common Questions
What is Per Capita Income in South San Francisco?
Per Capita income in South San Francisco is $58,031.
What is the Median Family Income in South San Francisco?
Median Family Income in South San Francisco is $139,181.
What is the Median Household income in South San Francisco?
Median Household Income in South San Francisco is $127,062.
What is Income or Wage Gap in South San Francisco?
Income or Wage Gap in South San Francisco is 13.0%.
Women in South San Francisco earn 87.0 cents for every dollar earned by a man.
What is Family Income Deficit in South San Francisco?
Family Income Deficit in South San Francisco is $11,323.
Families that are below poverty line in South San Francisco earn $11,323 less on average than the poverty threshold level.
What is Inequality or Gini Index in South San Francisco?
Inequality or Gini Index in South San Francisco is 0.45.
What is the Total Population of South San Francisco?
Total Population of South San Francisco is 65,596.
What is the Total Male Population of South San Francisco?
Total Male Population of South San Francisco is 32,737.
What is the Total Female Population of South San Francisco?
Total Female Population of South San Francisco is 32,859.
What is the Ratio of Males per 100 Females in South San Francisco?
There are 99.63 Males per 100 Females in South San Francisco.
What is the Ratio of Females per 100 Males in South San Francisco?
There are 100.37 Females per 100 Males in South San Francisco.
What is the Median Population Age in South San Francisco?
Median Population Age in South San Francisco is 42.3 Years.
What is the Average Family Size in South San Francisco
Average Family Size in South San Francisco is 3.4 People.
What is the Average Household Size in South San Francisco
Average Household Size in South San Francisco is 2.9 People.
How Large is the Labor Force in South San Francisco?
There are 37,506 People in the Labor Forcein in South San Francisco.
What is the Percentage of People in the Labor Force in South San Francisco?
67.2% of People are in the Labor Force in South San Francisco.
What is the Unemployment Rate in South San Francisco?
Unemployment Rate in South San Francisco is 2.4%.