Costa Mesa, CA Map & Demographics
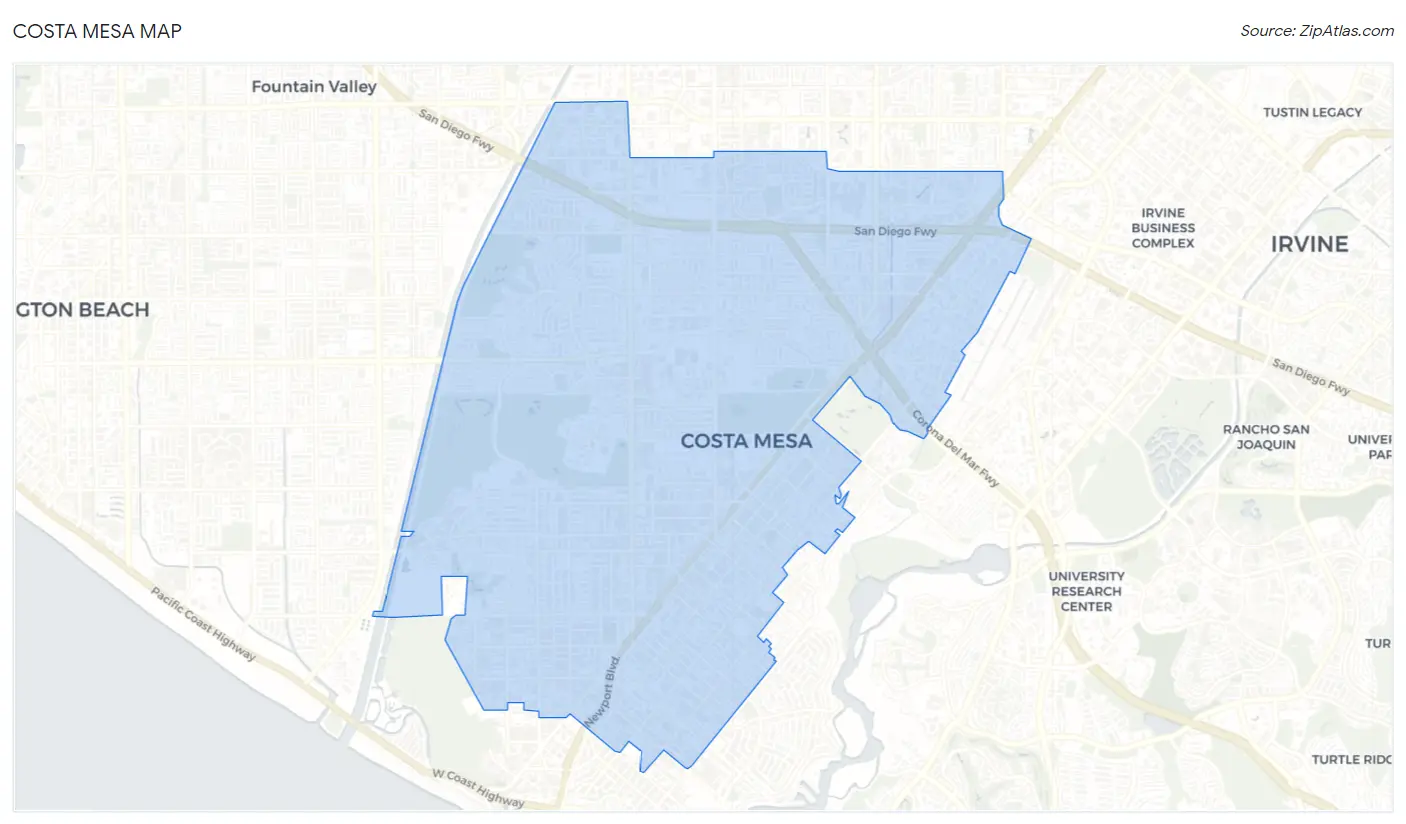
Costa Mesa Map
Costa Mesa Overview
$53,888
PER CAPITA INCOME
$115,798
AVG FAMILY INCOME
$104,981
AVG HOUSEHOLD INCOME
20.4%
WAGE / INCOME GAP [ % ]
79.6¢/ $1
WAGE / INCOME GAP [ $ ]
$11,531
FAMILY INCOME DEFICIT
0.45
INEQUALITY / GINI INDEX
111,490
TOTAL POPULATION
57,488
MALE POPULATION
54,002
FEMALE POPULATION
106.46
MALES / 100 FEMALES
93.94
FEMALES / 100 MALES
36.4
MEDIAN AGE
3.2
AVG FAMILY SIZE
2.6
AVG HOUSEHOLD SIZE
67,880
LABOR FORCE [ PEOPLE ]
73.2%
PERCENT IN LABOR FORCE
5.0%
UNEMPLOYMENT RATE
Costa Mesa Area Codes
Income in Costa Mesa
Income Overview in Costa Mesa
Per Capita Income in Costa Mesa is $53,888, while median incomes of families and households are $115,798 and $104,981 respectively.
| Characteristic | Number | Measure |
| Per Capita Income | 111,490 | $53,888 |
| Median Family Income | 24,327 | $115,798 |
| Mean Family Income | 24,327 | $158,336 |
| Median Household Income | 41,407 | $104,981 |
| Mean Household Income | 41,407 | $140,818 |
| Income Deficit | 24,327 | $11,531 |
| Wage / Income Gap (%) | 111,490 | 20.41% |
| Wage / Income Gap ($) | 111,490 | 79.59¢ per $1 |
| Gini / Inequality Index | 111,490 | 0.45 |
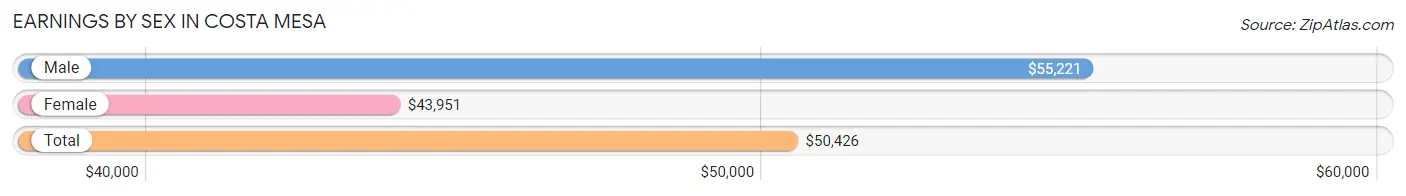
Earnings by Sex in Costa Mesa
Average Earnings in Costa Mesa are $50,426, $55,221 for men and $43,951 for women, a difference of 20.4%.
| Sex | Number | Average Earnings |
| Male | 38,013 (55.3%) | $55,221 |
| Female | 30,720 (44.7%) | $43,951 |
| Total | 68,733 (100.0%) | $50,426 |
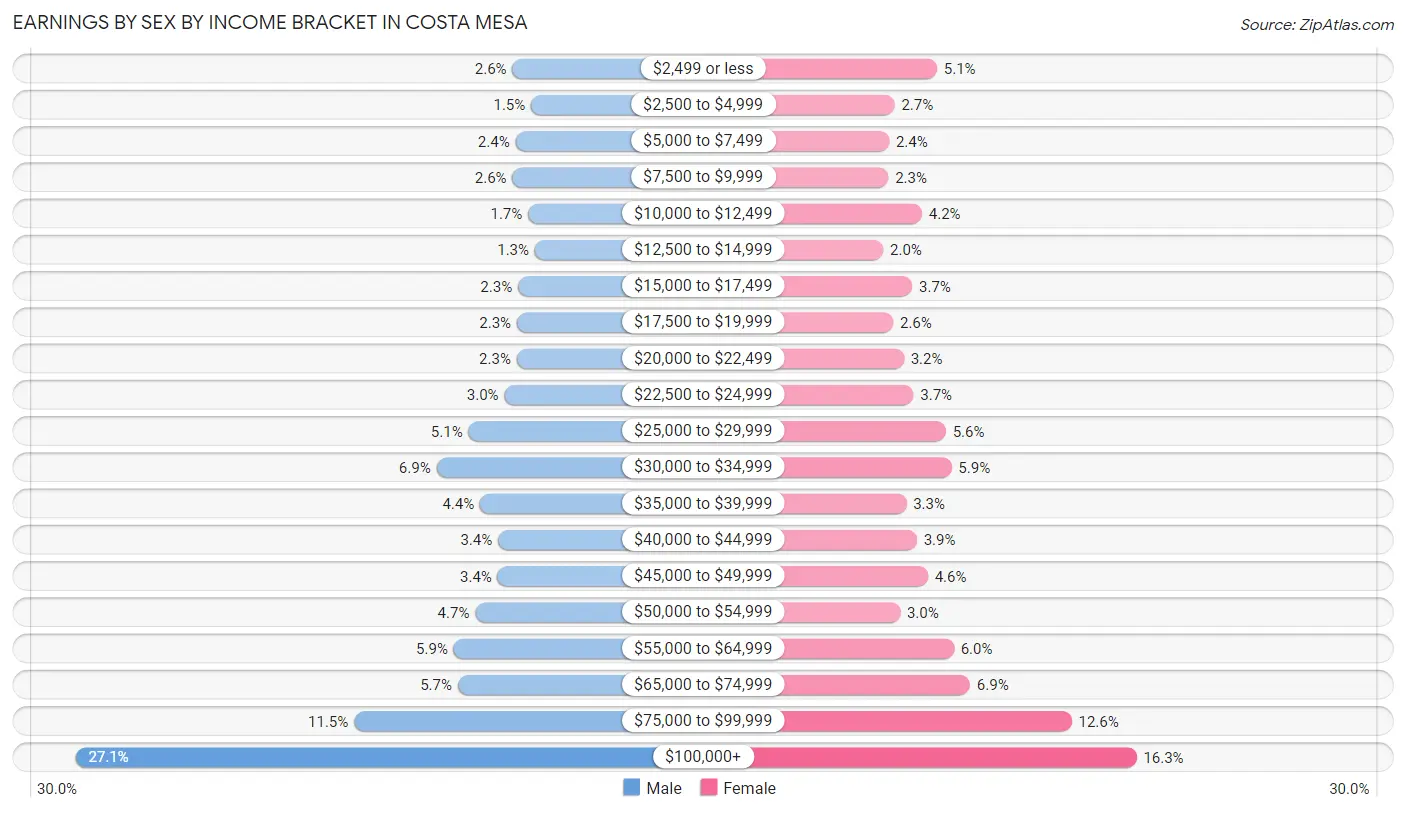
Earnings by Sex by Income Bracket in Costa Mesa
The most common earnings brackets in Costa Mesa are $100,000+ for men (10,317 | 27.1%) and $100,000+ for women (5,001 | 16.3%).
| Income | Male | Female |
| $2,499 or less | 982 (2.6%) | 1,555 (5.1%) |
| $2,500 to $4,999 | 582 (1.5%) | 824 (2.7%) |
| $5,000 to $7,499 | 918 (2.4%) | 728 (2.4%) |
| $7,500 to $9,999 | 980 (2.6%) | 717 (2.3%) |
| $10,000 to $12,499 | 646 (1.7%) | 1,297 (4.2%) |
| $12,500 to $14,999 | 501 (1.3%) | 626 (2.0%) |
| $15,000 to $17,499 | 863 (2.3%) | 1,126 (3.7%) |
| $17,500 to $19,999 | 884 (2.3%) | 800 (2.6%) |
| $20,000 to $22,499 | 888 (2.3%) | 982 (3.2%) |
| $22,500 to $24,999 | 1,153 (3.0%) | 1,148 (3.7%) |
| $25,000 to $29,999 | 1,920 (5.1%) | 1,709 (5.6%) |
| $30,000 to $34,999 | 2,603 (6.9%) | 1,805 (5.9%) |
| $35,000 to $39,999 | 1,672 (4.4%) | 1,027 (3.3%) |
| $40,000 to $44,999 | 1,289 (3.4%) | 1,207 (3.9%) |
| $45,000 to $49,999 | 1,296 (3.4%) | 1,398 (4.5%) |
| $50,000 to $54,999 | 1,774 (4.7%) | 919 (3.0%) |
| $55,000 to $64,999 | 2,234 (5.9%) | 1,845 (6.0%) |
| $65,000 to $74,999 | 2,148 (5.7%) | 2,125 (6.9%) |
| $75,000 to $99,999 | 4,363 (11.5%) | 3,881 (12.6%) |
| $100,000+ | 10,317 (27.1%) | 5,001 (16.3%) |
| Total | 38,013 (100.0%) | 30,720 (100.0%) |
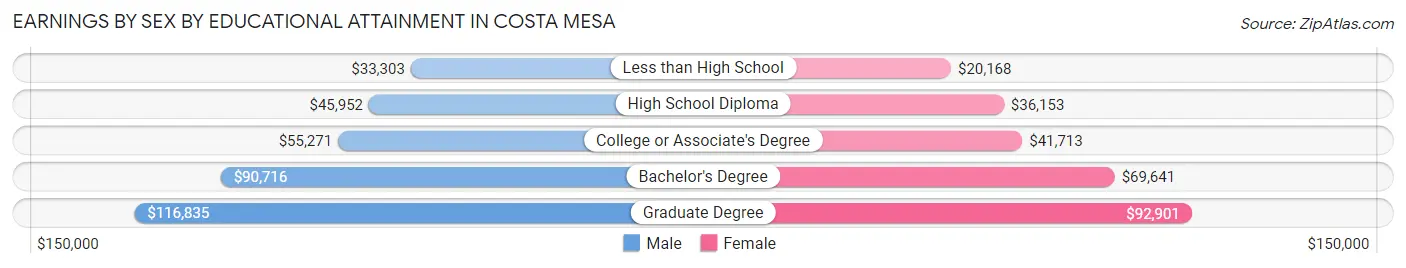
Earnings by Sex by Educational Attainment in Costa Mesa
Average earnings in Costa Mesa are $64,736 for men and $50,805 for women, a difference of 21.5%. Men with an educational attainment of graduate degree enjoy the highest average annual earnings of $116,835, while those with less than high school education earn the least with $33,303. Women with an educational attainment of graduate degree earn the most with the average annual earnings of $92,901, while those with less than high school education have the smallest earnings of $20,168.
| Educational Attainment | Male Income | Female Income |
| Less than High School | $33,303 | $20,168 |
| High School Diploma | $45,952 | $36,153 |
| College or Associate's Degree | $55,271 | $41,713 |
| Bachelor's Degree | $90,716 | $69,641 |
| Graduate Degree | $116,835 | $92,901 |
| Total | $64,736 | $50,805 |
Family Income in Costa Mesa
Family Income Brackets in Costa Mesa
According to the Costa Mesa family income data, there are 5,644 families falling into the $200,000+ income range, which is the most common income bracket and makes up 23.2% of all families. Conversely, the $10,000 to $14,999 income bracket is the least frequent group with only 219 families (0.9%) belonging to this category.
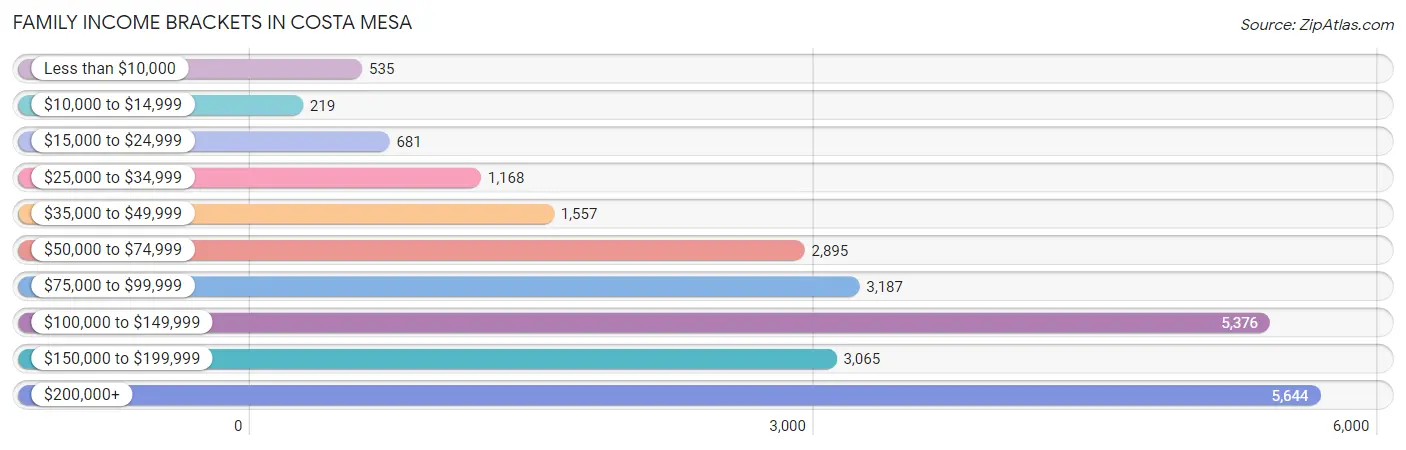
| Income Bracket | # Families | % Families |
| Less than $10,000 | 535 | 2.2% |
| $10,000 to $14,999 | 219 | 0.9% |
| $15,000 to $24,999 | 681 | 2.8% |
| $25,000 to $34,999 | 1,168 | 4.8% |
| $35,000 to $49,999 | 1,557 | 6.4% |
| $50,000 to $74,999 | 2,895 | 11.9% |
| $75,000 to $99,999 | 3,187 | 13.1% |
| $100,000 to $149,999 | 5,376 | 22.1% |
| $150,000 to $199,999 | 3,065 | 12.6% |
| $200,000+ | 5,644 | 23.2% |
Family Income by Famaliy Size in Costa Mesa
3-person families (5,789 | 23.8%) account for the highest median family income in Costa Mesa with $128,839 per family, while 2-person families (10,690 | 43.9%) have the highest median income of $54,107 per family member.
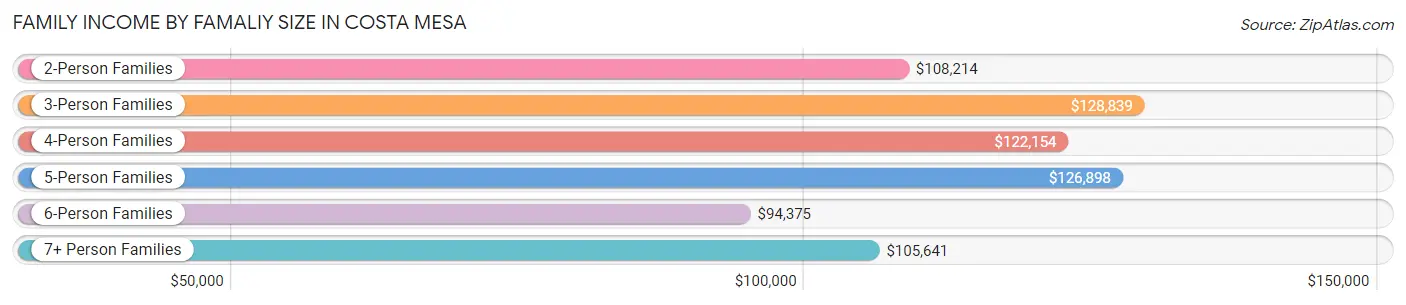
| Income Bracket | # Families | Median Income |
| 2-Person Families | 10,690 (43.9%) | $108,214 |
| 3-Person Families | 5,789 (23.8%) | $128,839 |
| 4-Person Families | 4,292 (17.6%) | $122,154 |
| 5-Person Families | 2,314 (9.5%) | $126,898 |
| 6-Person Families | 724 (3.0%) | $94,375 |
| 7+ Person Families | 518 (2.1%) | $105,641 |
| Total | 24,327 (100.0%) | $115,798 |
Family Income by Number of Earners in Costa Mesa
The median family income in Costa Mesa is $115,798, with families comprising 3+ earners (3,619) having the highest median family income of $145,837, while families with no earners (2,111) have the lowest median family income of $56,026, accounting for 14.9% and 8.7% of families, respectively.
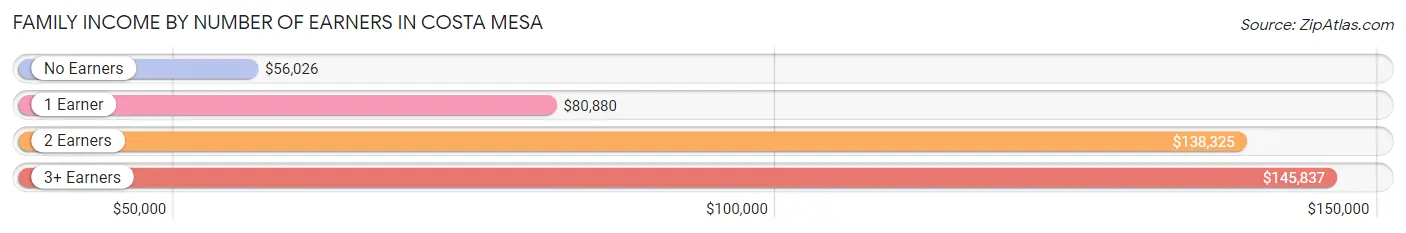
| Number of Earners | # Families | Median Income |
| No Earners | 2,111 (8.7%) | $56,026 |
| 1 Earner | 6,658 (27.4%) | $80,880 |
| 2 Earners | 11,939 (49.1%) | $138,325 |
| 3+ Earners | 3,619 (14.9%) | $145,837 |
| Total | 24,327 (100.0%) | $115,798 |
Household Income in Costa Mesa
Household Income Brackets in Costa Mesa
With 8,737 households falling in the category, the $100,000 to $149,999 income range is the most frequent in Costa Mesa, accounting for 21.1% of all households. In contrast, only 828 households (2.0%) fall into the $10,000 to $14,999 income bracket, making it the least populous group.
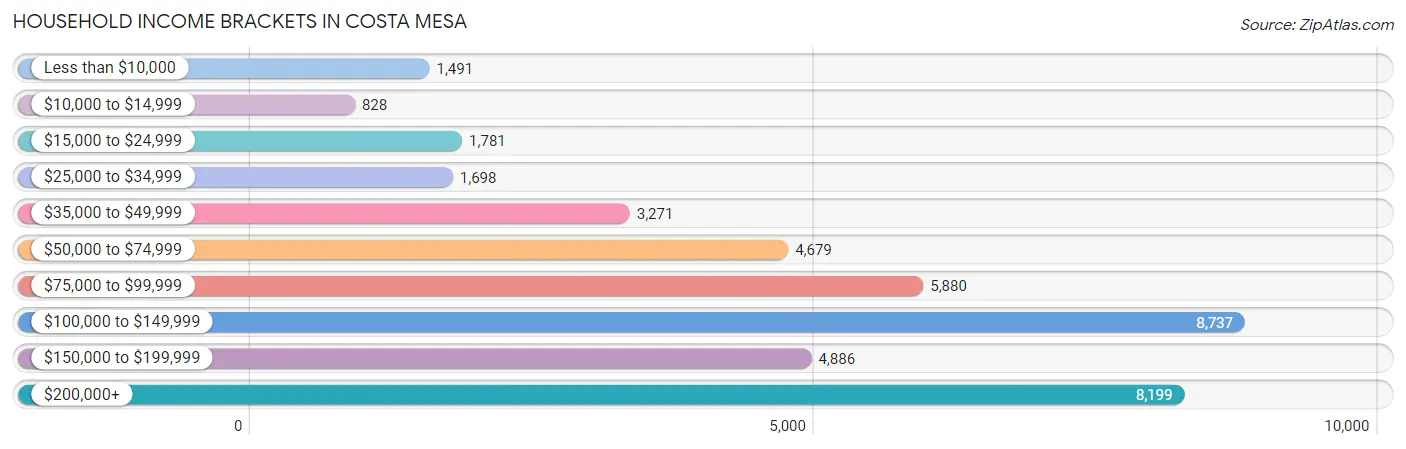
| Income Bracket | # Households | % Households |
| Less than $10,000 | 1,491 | 3.6% |
| $10,000 to $14,999 | 828 | 2.0% |
| $15,000 to $24,999 | 1,781 | 4.3% |
| $25,000 to $34,999 | 1,698 | 4.1% |
| $35,000 to $49,999 | 3,271 | 7.9% |
| $50,000 to $74,999 | 4,679 | 11.3% |
| $75,000 to $99,999 | 5,880 | 14.2% |
| $100,000 to $149,999 | 8,737 | 21.1% |
| $150,000 to $199,999 | 4,886 | 11.8% |
| $200,000+ | 8,199 | 19.8% |
Household Income by Householder Age in Costa Mesa
The median household income in Costa Mesa is $104,981, with the highest median household income of $120,991 found in the 25 to 44 years age bracket for the primary householder. A total of 16,534 households (39.9%) fall into this category. Meanwhile, the 15 to 24 years age bracket for the primary householder has the lowest median household income of $62,770, with 1,388 households (3.4%) in this group.
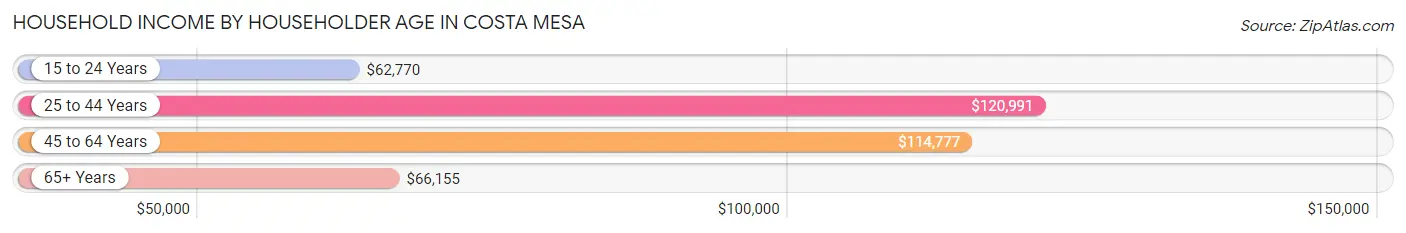
| Income Bracket | # Households | Median Income |
| 15 to 24 Years | 1,388 (3.4%) | $62,770 |
| 25 to 44 Years | 16,534 (39.9%) | $120,991 |
| 45 to 64 Years | 15,000 (36.2%) | $114,777 |
| 65+ Years | 8,485 (20.5%) | $66,155 |
| Total | 41,407 (100.0%) | $104,981 |
Poverty in Costa Mesa
Income Below Poverty by Sex and Age in Costa Mesa
With 8.9% poverty level for males and 10.1% for females among the residents of Costa Mesa, 15 year old males and 18 to 24 year old females are the most vulnerable to poverty, with 136 males (19.0%) and 659 females (15.5%) in their respective age groups living below the poverty level.
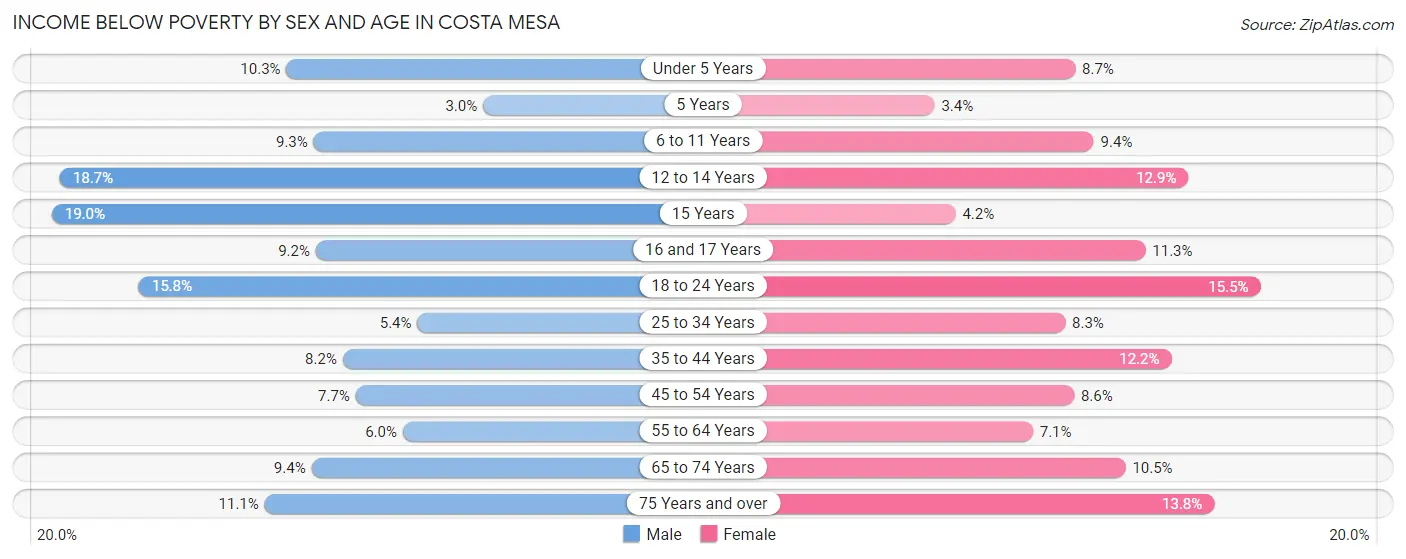
| Age Bracket | Male | Female |
| Under 5 Years | 297 (10.3%) | 245 (8.7%) |
| 5 Years | 17 (3.0%) | 17 (3.4%) |
| 6 to 11 Years | 306 (9.3%) | 282 (9.3%) |
| 12 to 14 Years | 333 (18.7%) | 265 (12.9%) |
| 15 Years | 136 (19.0%) | 25 (4.2%) |
| 16 and 17 Years | 94 (9.2%) | 147 (11.3%) |
| 18 to 24 Years | 888 (15.8%) | 659 (15.5%) |
| 25 to 34 Years | 615 (5.4%) | 850 (8.3%) |
| 35 to 44 Years | 741 (8.2%) | 961 (12.2%) |
| 45 to 54 Years | 598 (7.7%) | 559 (8.6%) |
| 55 to 64 Years | 384 (6.0%) | 465 (7.1%) |
| 65 to 74 Years | 400 (9.3%) | 465 (10.5%) |
| 75 Years and over | 257 (11.1%) | 453 (13.8%) |
| Total | 5,066 (8.9%) | 5,393 (10.1%) |
Income Above Poverty by Sex and Age in Costa Mesa
According to the poverty statistics in Costa Mesa, males aged 5 years and females aged 5 years are the age groups that are most secure financially, with 97.0% of males and 96.6% of females in these age groups living above the poverty line.
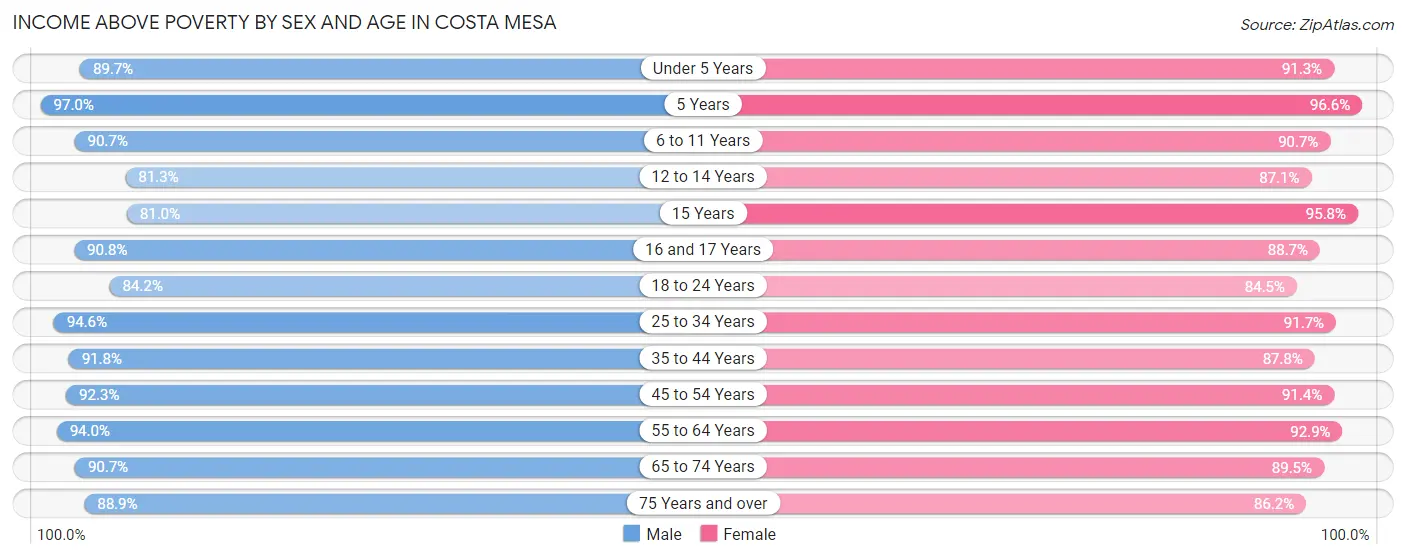
| Age Bracket | Male | Female |
| Under 5 Years | 2,593 (89.7%) | 2,585 (91.3%) |
| 5 Years | 553 (97.0%) | 477 (96.6%) |
| 6 to 11 Years | 2,994 (90.7%) | 2,735 (90.6%) |
| 12 to 14 Years | 1,449 (81.3%) | 1,796 (87.1%) |
| 15 Years | 580 (81.0%) | 568 (95.8%) |
| 16 and 17 Years | 929 (90.8%) | 1,157 (88.7%) |
| 18 to 24 Years | 4,746 (84.2%) | 3,583 (84.5%) |
| 25 to 34 Years | 10,735 (94.6%) | 9,405 (91.7%) |
| 35 to 44 Years | 8,307 (91.8%) | 6,894 (87.8%) |
| 45 to 54 Years | 7,158 (92.3%) | 5,929 (91.4%) |
| 55 to 64 Years | 6,063 (94.0%) | 6,092 (92.9%) |
| 65 to 74 Years | 3,876 (90.6%) | 3,952 (89.5%) |
| 75 Years and over | 2,060 (88.9%) | 2,824 (86.2%) |
| Total | 52,043 (91.1%) | 47,997 (89.9%) |
Income Below Poverty Among Married-Couple Families in Costa Mesa
The poverty statistics for married-couple families in Costa Mesa show that 3.3% or 581 of the total 17,549 families live below the poverty line. Families with 5 or more children have the highest poverty rate of 28.3%, comprising of 15 families. On the other hand, families with no children have the lowest poverty rate of 1.9%, which includes 190 families.
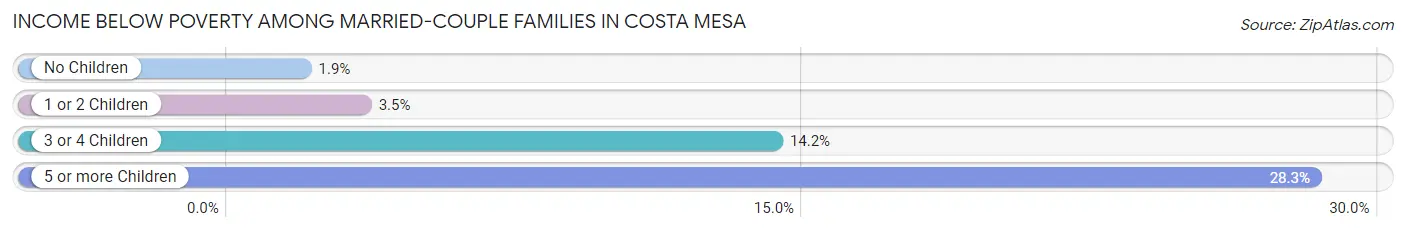
| Children | Above Poverty | Below Poverty |
| No Children | 9,725 (98.1%) | 190 (1.9%) |
| 1 or 2 Children | 6,313 (96.5%) | 228 (3.5%) |
| 3 or 4 Children | 892 (85.8%) | 148 (14.2%) |
| 5 or more Children | 38 (71.7%) | 15 (28.3%) |
| Total | 16,968 (96.7%) | 581 (3.3%) |
Income Below Poverty Among Single-Parent Households in Costa Mesa
According to the poverty data in Costa Mesa, 5.0% or 120 single-father households and 16.8% or 732 single-mother households are living below the poverty line. Among single-father households, those with 3 or 4 children have the highest poverty rate, with 11 households (7.0%) experiencing poverty. Likewise, among single-mother households, those with 3 or 4 children have the highest poverty rate, with 170 households (39.5%) falling below the poverty line.
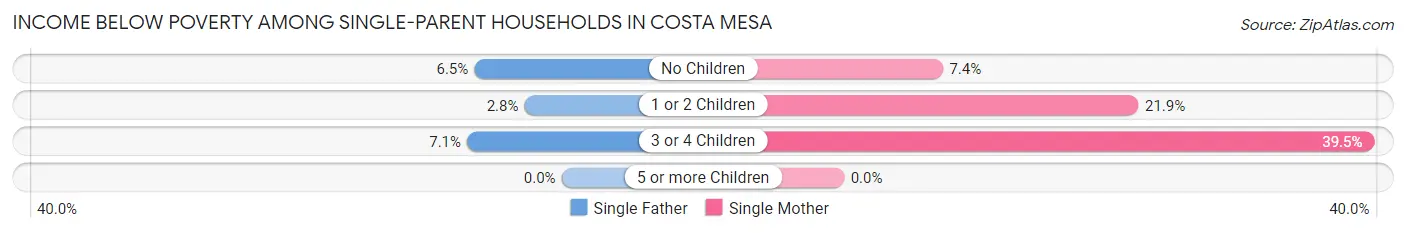
| Children | Single Father | Single Mother |
| No Children | 81 (6.5%) | 152 (7.4%) |
| 1 or 2 Children | 28 (2.8%) | 410 (21.9%) |
| 3 or 4 Children | 11 (7.0%) | 170 (39.5%) |
| 5 or more Children | 0 (0.0%) | 0 (0.0%) |
| Total | 120 (5.0%) | 732 (16.8%) |
Income Below Poverty Among Married-Couple vs Single-Parent Households in Costa Mesa
The poverty data for Costa Mesa shows that 581 of the married-couple family households (3.3%) and 852 of the single-parent households (12.6%) are living below the poverty level. Within the married-couple family households, those with 5 or more children have the highest poverty rate, with 15 households (28.3%) falling below the poverty line. Among the single-parent households, those with 3 or 4 children have the highest poverty rate, with 181 household (30.9%) living below poverty.
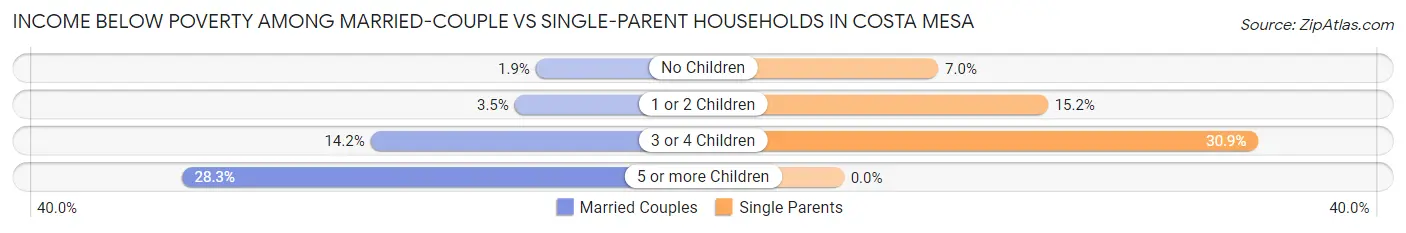
| Children | Married-Couple Families | Single-Parent Households |
| No Children | 190 (1.9%) | 233 (7.0%) |
| 1 or 2 Children | 228 (3.5%) | 438 (15.2%) |
| 3 or 4 Children | 148 (14.2%) | 181 (30.9%) |
| 5 or more Children | 15 (28.3%) | 0 (0.0%) |
| Total | 581 (3.3%) | 852 (12.6%) |
Race in Costa Mesa
The most populous races in Costa Mesa are White / Caucasian (63,470 | 56.9%), Hispanic or Latino (40,388 | 36.2%), and Some other Race (21,162 | 19.0%).
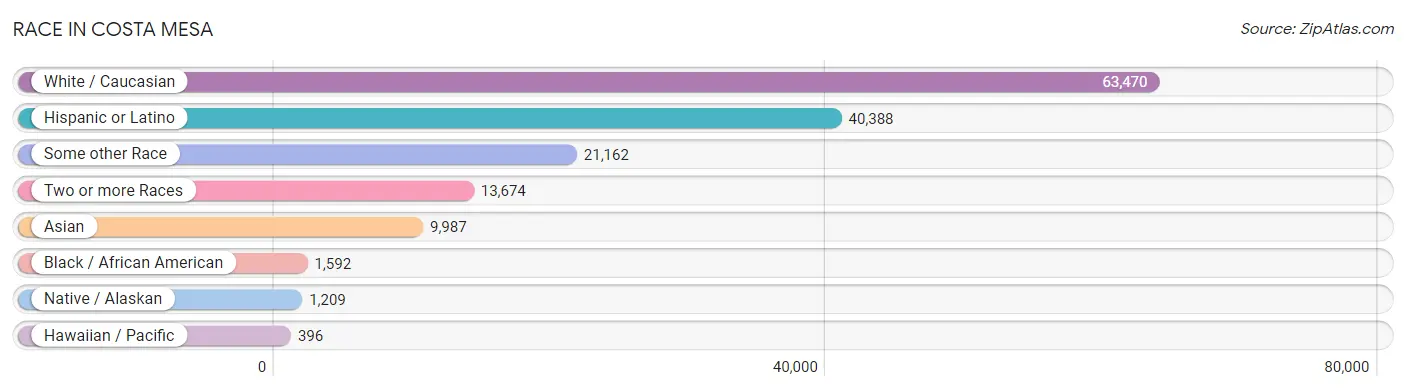
| Race | # Population | % Population |
| Asian | 9,987 | 9.0% |
| Black / African American | 1,592 | 1.4% |
| Hawaiian / Pacific | 396 | 0.4% |
| Hispanic or Latino | 40,388 | 36.2% |
| Native / Alaskan | 1,209 | 1.1% |
| White / Caucasian | 63,470 | 56.9% |
| Two or more Races | 13,674 | 12.3% |
| Some other Race | 21,162 | 19.0% |
| Total | 111,490 | 100.0% |
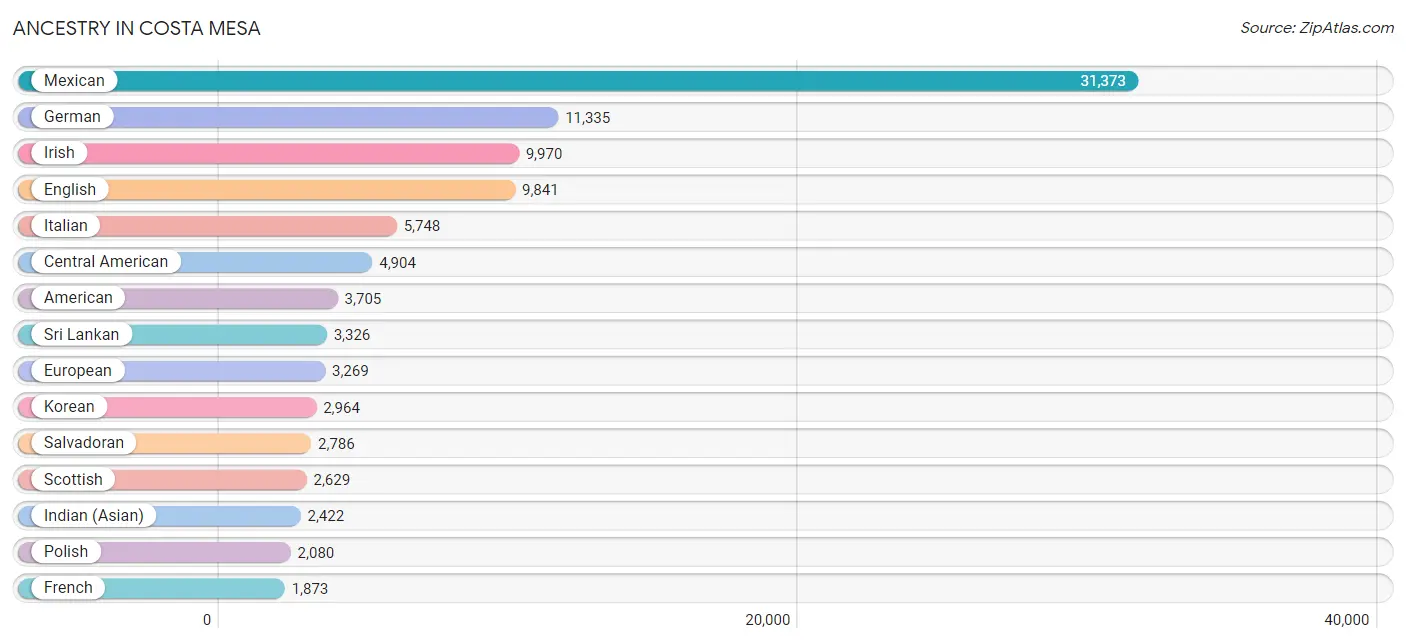
Ancestry in Costa Mesa
The most populous ancestries reported in Costa Mesa are Mexican (31,373 | 28.1%), German (11,335 | 10.2%), Irish (9,970 | 8.9%), English (9,841 | 8.8%), and Italian (5,748 | 5.2%), together accounting for 61.2% of all Costa Mesa residents.
| Ancestry | # Population | % Population |
| Afghan | 140 | 0.1% |
| African | 142 | 0.1% |
| American | 3,705 | 3.3% |
| Apache | 14 | 0.0% |
| Arab | 1,054 | 0.9% |
| Argentinean | 200 | 0.2% |
| Armenian | 332 | 0.3% |
| Australian | 142 | 0.1% |
| Austrian | 202 | 0.2% |
| Bangladeshi | 116 | 0.1% |
| Basque | 37 | 0.0% |
| Belgian | 65 | 0.1% |
| Belizean | 55 | 0.1% |
| Bhutanese | 1,803 | 1.6% |
| Blackfeet | 39 | 0.0% |
| Bolivian | 96 | 0.1% |
| Brazilian | 248 | 0.2% |
| British | 734 | 0.7% |
| Bulgarian | 37 | 0.0% |
| Burmese | 944 | 0.9% |
| Cambodian | 9 | 0.0% |
| Canadian | 298 | 0.3% |
| Central American | 4,904 | 4.4% |
| Central American Indian | 227 | 0.2% |
| Cherokee | 244 | 0.2% |
| Chilean | 58 | 0.1% |
| Chippewa | 12 | 0.0% |
| Choctaw | 72 | 0.1% |
| Colombian | 494 | 0.4% |
| Costa Rican | 27 | 0.0% |
| Creek | 44 | 0.0% |
| Croatian | 196 | 0.2% |
| Cuban | 234 | 0.2% |
| Czech | 713 | 0.6% |
| Czechoslovakian | 55 | 0.1% |
| Danish | 414 | 0.4% |
| Dominican | 133 | 0.1% |
| Dutch | 1,125 | 1.0% |
| Eastern European | 413 | 0.4% |
| Ecuadorian | 86 | 0.1% |
| Egyptian | 251 | 0.2% |
| English | 9,841 | 8.8% |
| Estonian | 50 | 0.0% |
| Ethiopian | 16 | 0.0% |
| European | 3,269 | 2.9% |
| Fijian | 33 | 0.0% |
| Filipino | 295 | 0.3% |
| Finnish | 200 | 0.2% |
| French | 1,873 | 1.7% |
| French American Indian | 21 | 0.0% |
| French Canadian | 281 | 0.3% |
| German | 11,335 | 10.2% |
| Greek | 407 | 0.4% |
| Guamanian / Chamorro | 69 | 0.1% |
| Guatemalan | 1,531 | 1.4% |
| Haitian | 32 | 0.0% |
| Honduran | 185 | 0.2% |
| Hopi | 7 | 0.0% |
| Hungarian | 374 | 0.3% |
| Icelander | 14 | 0.0% |
| Indian (Asian) | 2,422 | 2.2% |
| Indonesian | 9 | 0.0% |
| Iranian | 424 | 0.4% |
| Iraqi | 15 | 0.0% |
| Irish | 9,970 | 8.9% |
| Israeli | 11 | 0.0% |
| Italian | 5,748 | 5.2% |
| Jamaican | 28 | 0.0% |
| Japanese | 366 | 0.3% |
| Jordanian | 44 | 0.0% |
| Korean | 2,964 | 2.7% |
| Laotian | 280 | 0.3% |
| Latvian | 47 | 0.0% |
| Lebanese | 301 | 0.3% |
| Lithuanian | 210 | 0.2% |
| Mexican | 31,373 | 28.1% |
| Mexican American Indian | 672 | 0.6% |
| Moroccan | 49 | 0.0% |
| Native Hawaiian | 339 | 0.3% |
| Navajo | 36 | 0.0% |
| New Zealander | 33 | 0.0% |
| Nicaraguan | 64 | 0.1% |
| Nigerian | 30 | 0.0% |
| Northern European | 491 | 0.4% |
| Norwegian | 1,184 | 1.1% |
| Pakistani | 52 | 0.1% |
| Palestinian | 19 | 0.0% |
| Panamanian | 8 | 0.0% |
| Peruvian | 305 | 0.3% |
| Polish | 2,080 | 1.9% |
| Portuguese | 578 | 0.5% |
| Potawatomi | 14 | 0.0% |
| Puerto Rican | 469 | 0.4% |
| Romanian | 265 | 0.2% |
| Russian | 1,124 | 1.0% |
| Salvadoran | 2,786 | 2.5% |
| Samoan | 319 | 0.3% |
| Scandinavian | 565 | 0.5% |
| Scotch-Irish | 743 | 0.7% |
| Scottish | 2,629 | 2.4% |
| Seminole | 3 | 0.0% |
| Serbian | 24 | 0.0% |
| Sioux | 32 | 0.0% |
| Slavic | 102 | 0.1% |
| Slovak | 94 | 0.1% |
| Slovene | 64 | 0.1% |
| South African | 34 | 0.0% |
| South American | 1,340 | 1.2% |
| South American Indian | 84 | 0.1% |
| Spaniard | 586 | 0.5% |
| Spanish | 470 | 0.4% |
| Spanish American | 76 | 0.1% |
| Sri Lankan | 3,326 | 3.0% |
| Subsaharan African | 294 | 0.3% |
| Swedish | 1,419 | 1.3% |
| Swiss | 364 | 0.3% |
| Syrian | 167 | 0.2% |
| Thai | 911 | 0.8% |
| Turkish | 180 | 0.2% |
| Ukrainian | 345 | 0.3% |
| Venezuelan | 50 | 0.0% |
| Welsh | 664 | 0.6% |
| West Indian | 23 | 0.0% |
| Yaqui | 30 | 0.0% |
| Yugoslavian | 180 | 0.2% | View All 125 Rows |
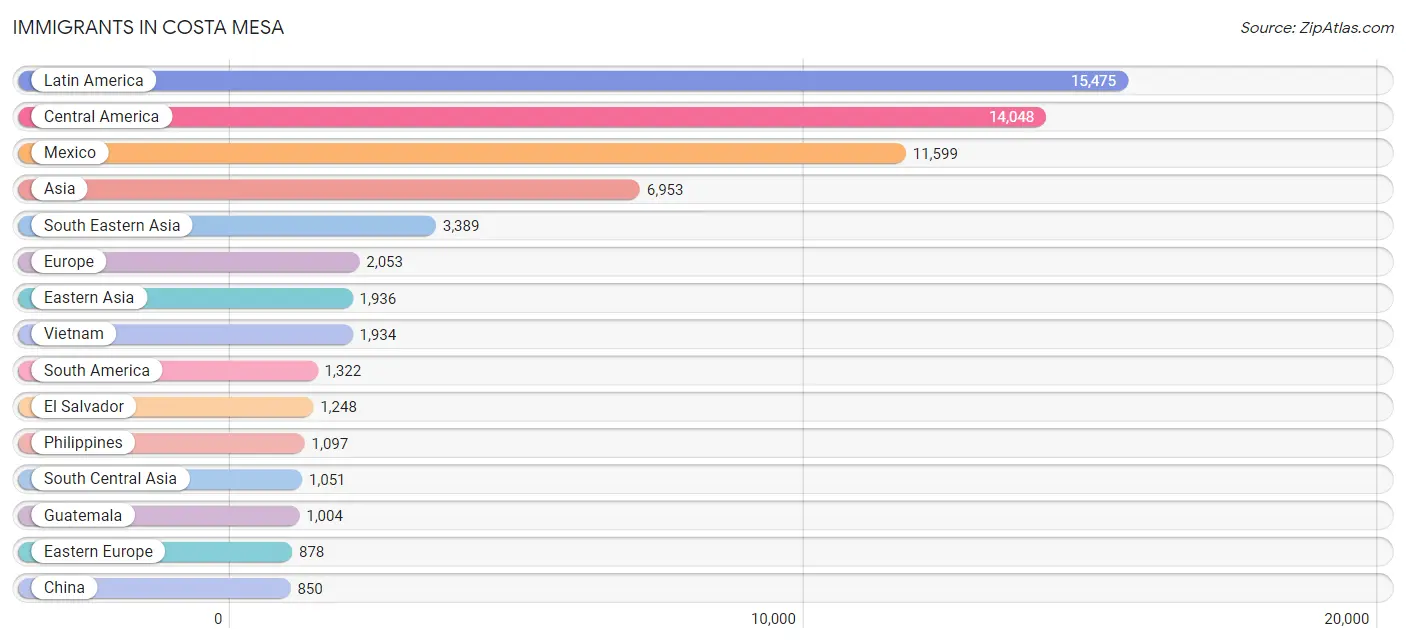
Immigrants in Costa Mesa
The most numerous immigrant groups reported in Costa Mesa came from Latin America (15,475 | 13.9%), Central America (14,048 | 12.6%), Mexico (11,599 | 10.4%), Asia (6,953 | 6.2%), and South Eastern Asia (3,389 | 3.0%), together accounting for 46.2% of all Costa Mesa residents.
| Immigration Origin | # Population | % Population |
| Afghanistan | 89 | 0.1% |
| Africa | 609 | 0.5% |
| Argentina | 163 | 0.2% |
| Armenia | 91 | 0.1% |
| Asia | 6,953 | 6.2% |
| Australia | 111 | 0.1% |
| Austria | 6 | 0.0% |
| Belgium | 5 | 0.0% |
| Belize | 5 | 0.0% |
| Bolivia | 57 | 0.1% |
| Brazil | 278 | 0.3% |
| Bulgaria | 60 | 0.1% |
| Cambodia | 164 | 0.2% |
| Cameroon | 20 | 0.0% |
| Canada | 525 | 0.5% |
| Caribbean | 105 | 0.1% |
| Central America | 14,048 | 12.6% |
| Chile | 15 | 0.0% |
| China | 850 | 0.8% |
| Colombia | 479 | 0.4% |
| Congo | 34 | 0.0% |
| Costa Rica | 10 | 0.0% |
| Croatia | 11 | 0.0% |
| Cuba | 32 | 0.0% |
| Czechoslovakia | 139 | 0.1% |
| Denmark | 38 | 0.0% |
| Dominican Republic | 18 | 0.0% |
| Eastern Africa | 164 | 0.2% |
| Eastern Asia | 1,936 | 1.7% |
| Eastern Europe | 878 | 0.8% |
| Ecuador | 31 | 0.0% |
| Egypt | 176 | 0.2% |
| El Salvador | 1,248 | 1.1% |
| England | 194 | 0.2% |
| Ethiopia | 16 | 0.0% |
| Europe | 2,053 | 1.8% |
| Fiji | 108 | 0.1% |
| France | 135 | 0.1% |
| Germany | 255 | 0.2% |
| Greece | 39 | 0.0% |
| Guatemala | 1,004 | 0.9% |
| Guyana | 8 | 0.0% |
| Haiti | 46 | 0.0% |
| Honduras | 173 | 0.2% |
| Hong Kong | 110 | 0.1% |
| Hungary | 24 | 0.0% |
| India | 448 | 0.4% |
| Indonesia | 57 | 0.1% |
| Iran | 489 | 0.4% |
| Iraq | 27 | 0.0% |
| Ireland | 83 | 0.1% |
| Israel | 25 | 0.0% |
| Italy | 93 | 0.1% |
| Japan | 661 | 0.6% |
| Jordan | 84 | 0.1% |
| Kazakhstan | 10 | 0.0% |
| Kenya | 84 | 0.1% |
| Korea | 425 | 0.4% |
| Kuwait | 24 | 0.0% |
| Laos | 10 | 0.0% |
| Latin America | 15,475 | 13.9% |
| Latvia | 11 | 0.0% |
| Lebanon | 62 | 0.1% |
| Malaysia | 8 | 0.0% |
| Mexico | 11,599 | 10.4% |
| Middle Africa | 54 | 0.1% |
| Netherlands | 33 | 0.0% |
| Nicaragua | 9 | 0.0% |
| Northern Africa | 269 | 0.2% |
| Northern Europe | 580 | 0.5% |
| Norway | 9 | 0.0% |
| Oceania | 248 | 0.2% |
| Pakistan | 15 | 0.0% |
| Peru | 241 | 0.2% |
| Philippines | 1,097 | 1.0% |
| Poland | 78 | 0.1% |
| Romania | 92 | 0.1% |
| Russia | 163 | 0.2% |
| Saudi Arabia | 24 | 0.0% |
| Scotland | 46 | 0.0% |
| Serbia | 41 | 0.0% |
| Singapore | 51 | 0.1% |
| South Africa | 122 | 0.1% |
| South America | 1,322 | 1.2% |
| South Central Asia | 1,051 | 0.9% |
| South Eastern Asia | 3,389 | 3.0% |
| Southern Europe | 155 | 0.1% |
| Spain | 23 | 0.0% |
| Sudan | 7 | 0.0% |
| Sweden | 38 | 0.0% |
| Syria | 61 | 0.1% |
| Taiwan | 223 | 0.2% |
| Thailand | 59 | 0.1% |
| Turkey | 163 | 0.2% |
| Ukraine | 185 | 0.2% |
| Venezuela | 50 | 0.0% |
| Vietnam | 1,934 | 1.7% |
| West Indies | 4 | 0.0% |
| Western Asia | 568 | 0.5% |
| Western Europe | 434 | 0.4% | View All 100 Rows |
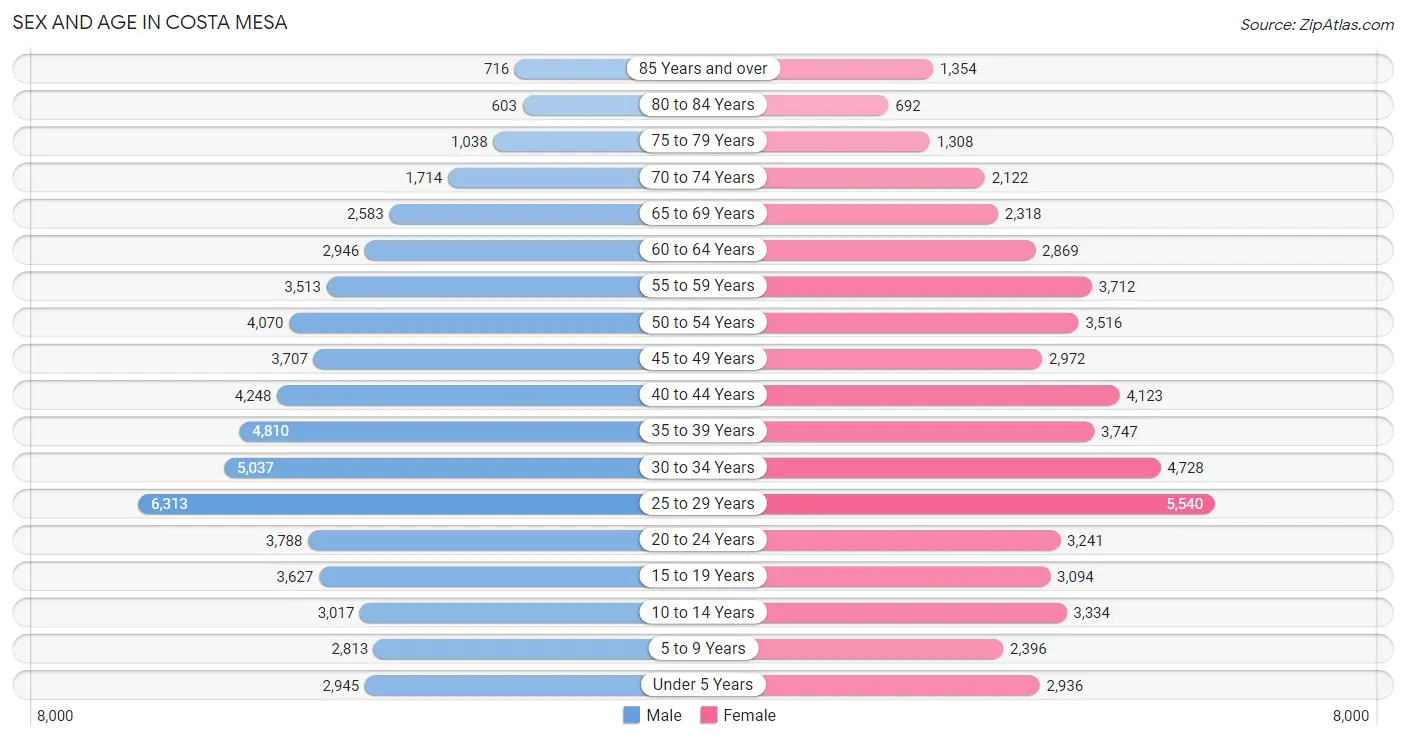
Sex and Age in Costa Mesa
Sex and Age in Costa Mesa
The most populous age groups in Costa Mesa are 25 to 29 Years (6,313 | 11.0%) for men and 25 to 29 Years (5,540 | 10.3%) for women.
| Age Bracket | Male | Female |
| Under 5 Years | 2,945 (5.1%) | 2,936 (5.4%) |
| 5 to 9 Years | 2,813 (4.9%) | 2,396 (4.4%) |
| 10 to 14 Years | 3,017 (5.2%) | 3,334 (6.2%) |
| 15 to 19 Years | 3,627 (6.3%) | 3,094 (5.7%) |
| 20 to 24 Years | 3,788 (6.6%) | 3,241 (6.0%) |
| 25 to 29 Years | 6,313 (11.0%) | 5,540 (10.3%) |
| 30 to 34 Years | 5,037 (8.8%) | 4,728 (8.8%) |
| 35 to 39 Years | 4,810 (8.4%) | 3,747 (6.9%) |
| 40 to 44 Years | 4,248 (7.4%) | 4,123 (7.6%) |
| 45 to 49 Years | 3,707 (6.5%) | 2,972 (5.5%) |
| 50 to 54 Years | 4,070 (7.1%) | 3,516 (6.5%) |
| 55 to 59 Years | 3,513 (6.1%) | 3,712 (6.9%) |
| 60 to 64 Years | 2,946 (5.1%) | 2,869 (5.3%) |
| 65 to 69 Years | 2,583 (4.5%) | 2,318 (4.3%) |
| 70 to 74 Years | 1,714 (3.0%) | 2,122 (3.9%) |
| 75 to 79 Years | 1,038 (1.8%) | 1,308 (2.4%) |
| 80 to 84 Years | 603 (1.1%) | 692 (1.3%) |
| 85 Years and over | 716 (1.3%) | 1,354 (2.5%) |
| Total | 57,488 (100.0%) | 54,002 (100.0%) |
Families and Households in Costa Mesa
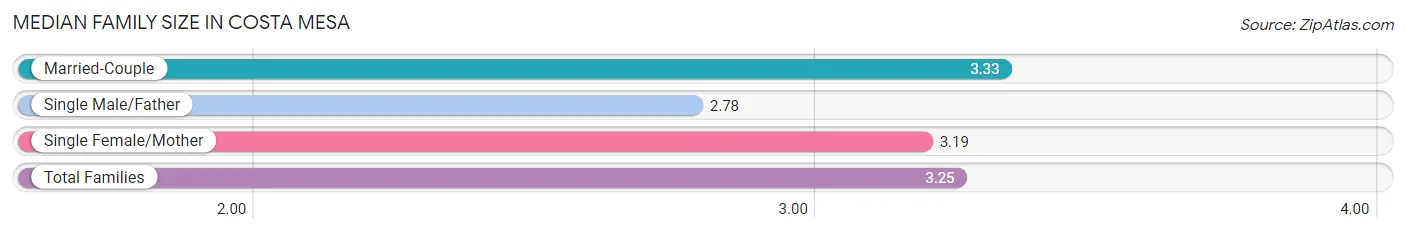
Median Family Size in Costa Mesa
The median family size in Costa Mesa is 3.25 persons per family, with married-couple families (17,549 | 72.1%) accounting for the largest median family size of 3.33 persons per family. On the other hand, single male/father families (2,413 | 9.9%) represent the smallest median family size with 2.78 persons per family.
| Family Type | # Families | Family Size |
| Married-Couple | 17,549 (72.1%) | 3.33 |
| Single Male/Father | 2,413 (9.9%) | 2.78 |
| Single Female/Mother | 4,365 (17.9%) | 3.19 |
| Total Families | 24,327 (100.0%) | 3.25 |
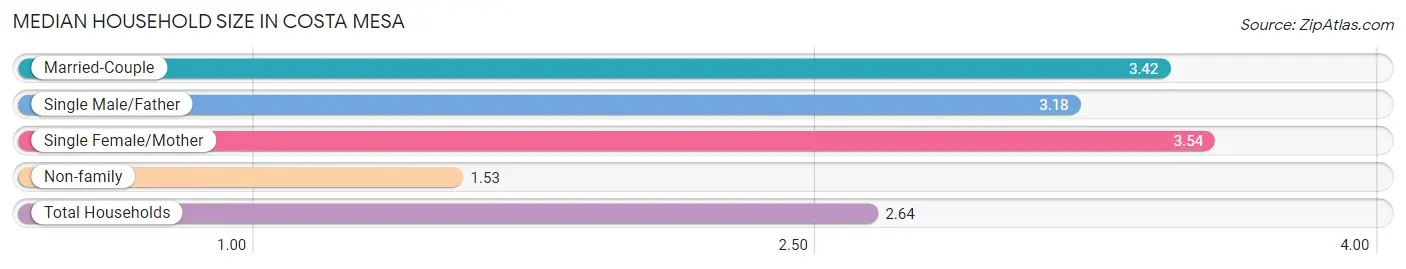
Median Household Size in Costa Mesa
The median household size in Costa Mesa is 2.64 persons per household, with single female/mother households (4,365 | 10.5%) accounting for the largest median household size of 3.54 persons per household. non-family households (17,080 | 41.2%) represent the smallest median household size with 1.53 persons per household.
| Household Type | # Households | Household Size |
| Married-Couple | 17,549 (42.4%) | 3.42 |
| Single Male/Father | 2,413 (5.8%) | 3.18 |
| Single Female/Mother | 4,365 (10.5%) | 3.54 |
| Non-family | 17,080 (41.2%) | 1.53 |
| Total Households | 41,407 (100.0%) | 2.64 |
Household Size by Marriage Status in Costa Mesa
Out of a total of 41,407 households in Costa Mesa, 24,327 (58.8%) are family households, while 17,080 (41.2%) are nonfamily households. The most numerous type of family households are 2-person households, comprising 9,415, and the most common type of nonfamily households are 1-person households, comprising 11,088.
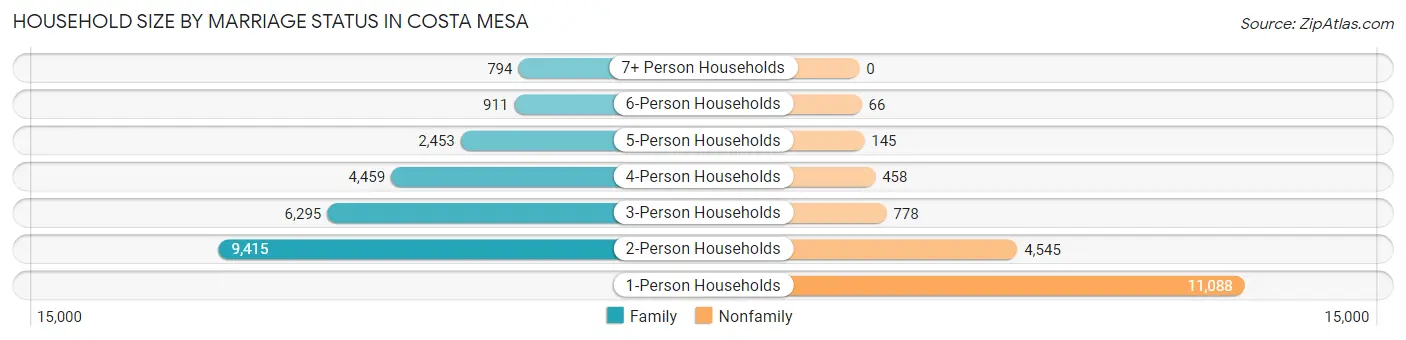
| Household Size | Family Households | Nonfamily Households |
| 1-Person Households | - | 11,088 (26.8%) |
| 2-Person Households | 9,415 (22.7%) | 4,545 (11.0%) |
| 3-Person Households | 6,295 (15.2%) | 778 (1.9%) |
| 4-Person Households | 4,459 (10.8%) | 458 (1.1%) |
| 5-Person Households | 2,453 (5.9%) | 145 (0.4%) |
| 6-Person Households | 911 (2.2%) | 66 (0.2%) |
| 7+ Person Households | 794 (1.9%) | 0 (0.0%) |
| Total | 24,327 (58.8%) | 17,080 (41.2%) |
Female Fertility in Costa Mesa
Fertility by Age in Costa Mesa
Average fertility rate in Costa Mesa is 46.0 births per 1,000 women. Women in the age bracket of 20 to 34 years have the highest fertility rate with 59.0 births per 1,000 women. Women in the age bracket of 20 to 34 years acount for 61.5% of all women with births.
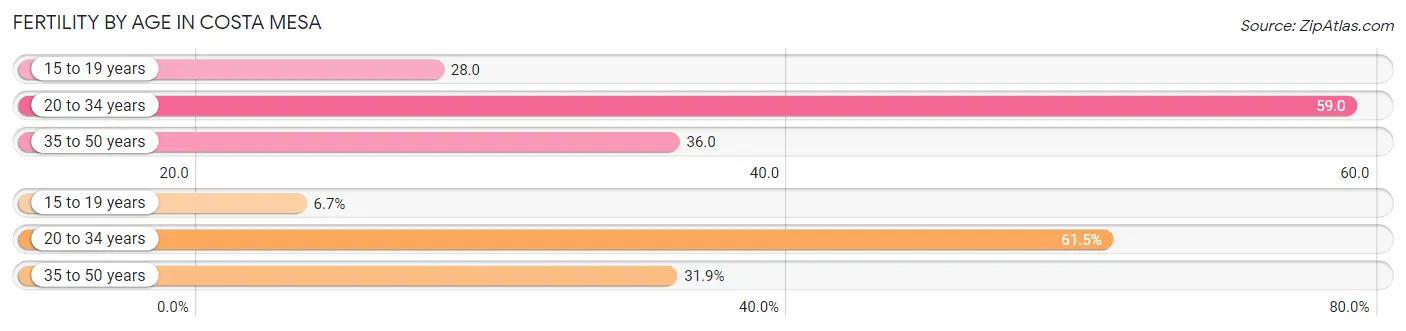
| Age Bracket | Women with Births | Births / 1,000 Women |
| 15 to 19 years | 87 (6.7%) | 28.0 |
| 20 to 34 years | 799 (61.5%) | 59.0 |
| 35 to 50 years | 414 (31.9%) | 36.0 |
| Total | 1,300 (100.0%) | 46.0 |
Fertility by Age by Marriage Status in Costa Mesa
80.8% of women with births (1,300) in Costa Mesa are married. The highest percentage of unmarried women with births falls into 15 to 19 years age bracket with 48.3% of them unmarried at the time of birth, while the lowest percentage of unmarried women with births belong to 35 to 50 years age bracket with 1.7% of them unmarried.
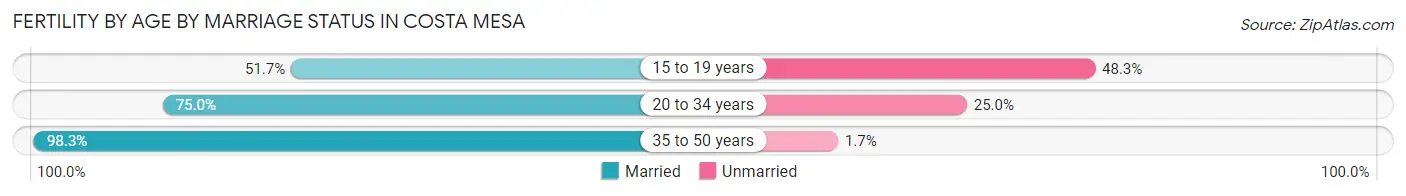
| Age Bracket | Married | Unmarried |
| 15 to 19 years | 45 (51.7%) | 42 (48.3%) |
| 20 to 34 years | 599 (75.0%) | 200 (25.0%) |
| 35 to 50 years | 407 (98.3%) | 7 (1.7%) |
| Total | 1,050 (80.8%) | 250 (19.2%) |
Fertility by Education in Costa Mesa
Average fertility rate in Costa Mesa is 46.0 births per 1,000 women. Women with the education attainment of bachelor's degree have the highest fertility rate of 82.0 births per 1,000 women, while women with the education attainment of high school diploma have the lowest fertility at 22.0 births per 1,000 women. Women with the education attainment of bachelor's degree represent 52.9% of all women with births.
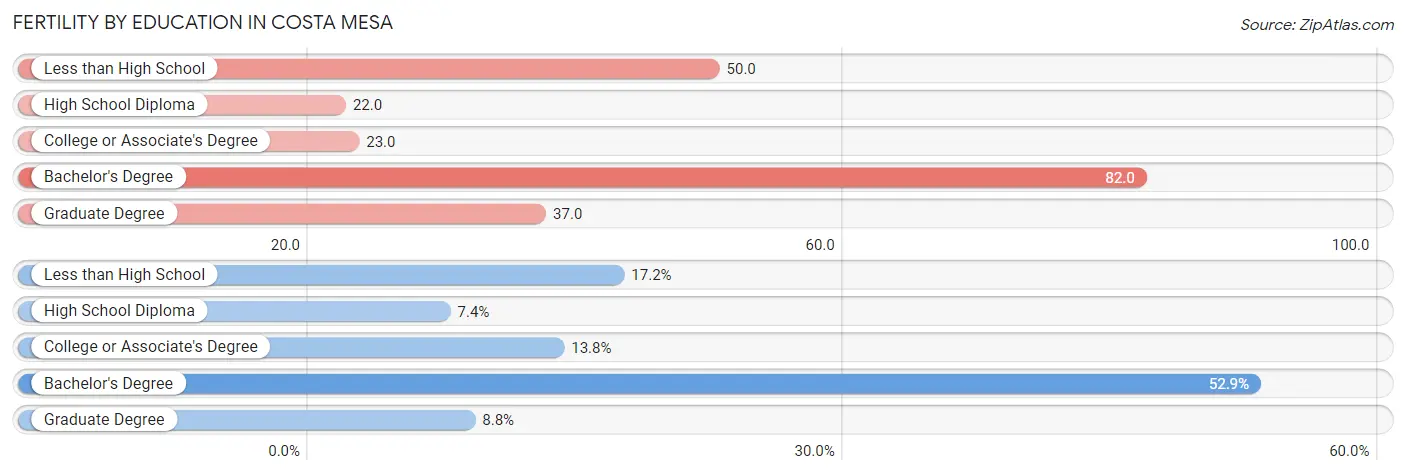
| Educational Attainment | Women with Births | Births / 1,000 Women |
| Less than High School | 223 (17.2%) | 50.0 |
| High School Diploma | 96 (7.4%) | 22.0 |
| College or Associate's Degree | 179 (13.8%) | 23.0 |
| Bachelor's Degree | 688 (52.9%) | 82.0 |
| Graduate Degree | 114 (8.8%) | 37.0 |
| Total | 1,300 (100.0%) | 46.0 |
Fertility by Education by Marriage Status in Costa Mesa
19.2% of women with births in Costa Mesa are unmarried. Women with the educational attainment of graduate degree are most likely to be married with 100.0% of them married at childbirth, while women with the educational attainment of less than high school are least likely to be married with 50.2% of them unmarried at childbirth.
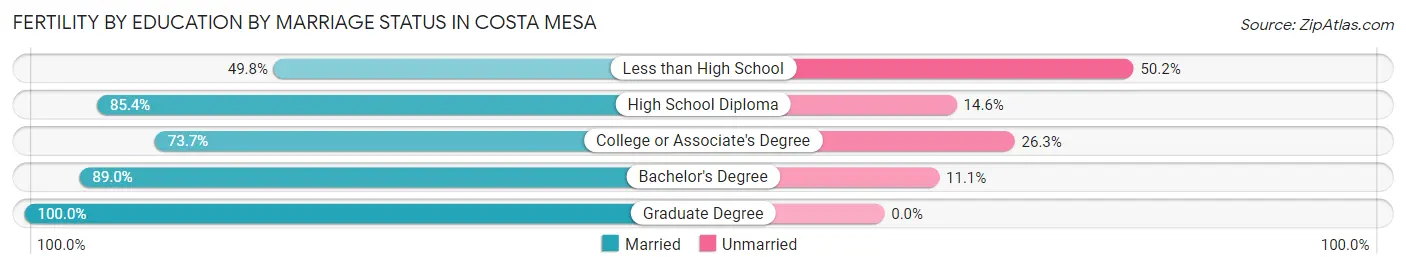
| Educational Attainment | Married | Unmarried |
| Less than High School | 111 (49.8%) | 112 (50.2%) |
| High School Diploma | 82 (85.4%) | 14 (14.6%) |
| College or Associate's Degree | 132 (73.7%) | 47 (26.3%) |
| Bachelor's Degree | 612 (88.9%) | 76 (11.1%) |
| Graduate Degree | 114 (100.0%) | 0 (0.0%) |
| Total | 1,050 (80.8%) | 250 (19.2%) |
Employment Characteristics in Costa Mesa
Employment by Class of Employer in Costa Mesa
Among the 63,032 employed individuals in Costa Mesa, private company employees (44,453 | 70.5%), self-employed (not incorporated) (5,837 | 9.3%), and not-for-profit organizations (3,585 | 5.7%) make up the most common classes of employment.
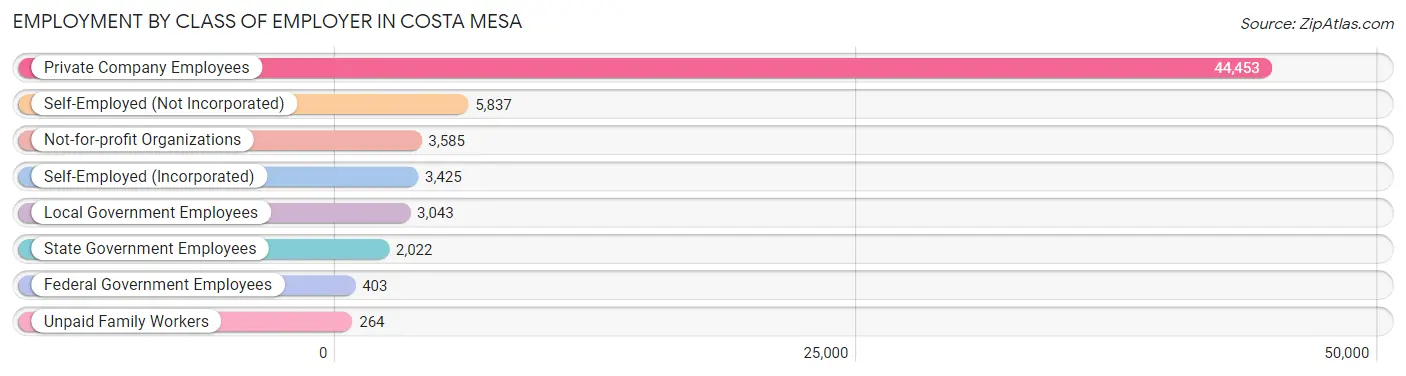
| Employer Class | # Employees | % Employees |
| Private Company Employees | 44,453 | 70.5% |
| Self-Employed (Incorporated) | 3,425 | 5.4% |
| Self-Employed (Not Incorporated) | 5,837 | 9.3% |
| Not-for-profit Organizations | 3,585 | 5.7% |
| Local Government Employees | 3,043 | 4.8% |
| State Government Employees | 2,022 | 3.2% |
| Federal Government Employees | 403 | 0.6% |
| Unpaid Family Workers | 264 | 0.4% |
| Total | 63,032 | 100.0% |
Employment Status by Age in Costa Mesa
According to the labor force statistics for Costa Mesa, out of the total population over 16 years of age (92,732), 73.2% or 67,880 individuals are in the labor force, with 5.0% or 3,394 of them unemployed. The age group with the highest labor force participation rate is 30 to 34 years, with 90.3% or 8,818 individuals in the labor force. Within the labor force, the 75 years and over age range has the highest percentage of unemployed individuals, with 17.4% or 112 of them being unemployed.
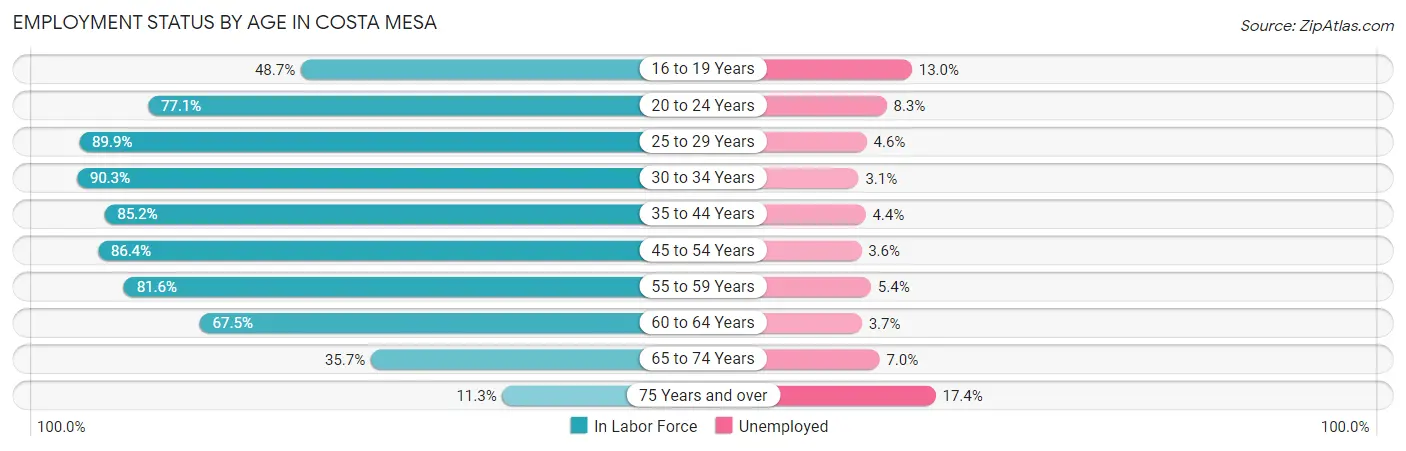
| Age Bracket | In Labor Force | Unemployed |
| 16 to 19 Years | 2,632 (48.7%) | 342 (13.0%) |
| 20 to 24 Years | 5,419 (77.1%) | 450 (8.3%) |
| 25 to 29 Years | 10,656 (89.9%) | 490 (4.6%) |
| 30 to 34 Years | 8,818 (90.3%) | 273 (3.1%) |
| 35 to 44 Years | 14,423 (85.2%) | 635 (4.4%) |
| 45 to 54 Years | 12,325 (86.4%) | 444 (3.6%) |
| 55 to 59 Years | 5,896 (81.6%) | 318 (5.4%) |
| 60 to 64 Years | 3,925 (67.5%) | 145 (3.7%) |
| 65 to 74 Years | 3,119 (35.7%) | 218 (7.0%) |
| 75 Years and over | 645 (11.3%) | 112 (17.4%) |
| Total | 67,880 (73.2%) | 3,394 (5.0%) |
Employment Status by Educational Attainment in Costa Mesa
According to labor force statistics for Costa Mesa, 85.1% of individuals (56,039) out of the total population between 25 and 64 years of age (65,851) are in the labor force, with 4.1% or 2,298 of them being unemployed. The group with the highest labor force participation rate are those with the educational attainment of bachelor's degree or higher, with 89.4% or 25,780 individuals in the labor force. Within the labor force, individuals with college / associate degree education have the highest percentage of unemployment, with 7.1% or 1,079 of them being unemployed.
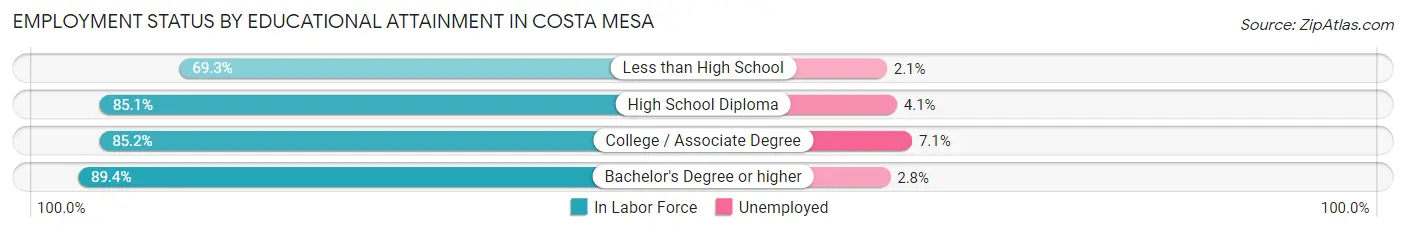
| Educational Attainment | In Labor Force | Unemployed |
| Less than High School | 5,563 (69.3%) | 169 (2.1%) |
| High School Diploma | 9,490 (85.1%) | 457 (4.1%) |
| College / Associate Degree | 15,195 (85.2%) | 1,266 (7.1%) |
| Bachelor's Degree or higher | 25,780 (89.4%) | 807 (2.8%) |
| Total | 56,039 (85.1%) | 2,700 (4.1%) |
Employment Occupations by Sex in Costa Mesa
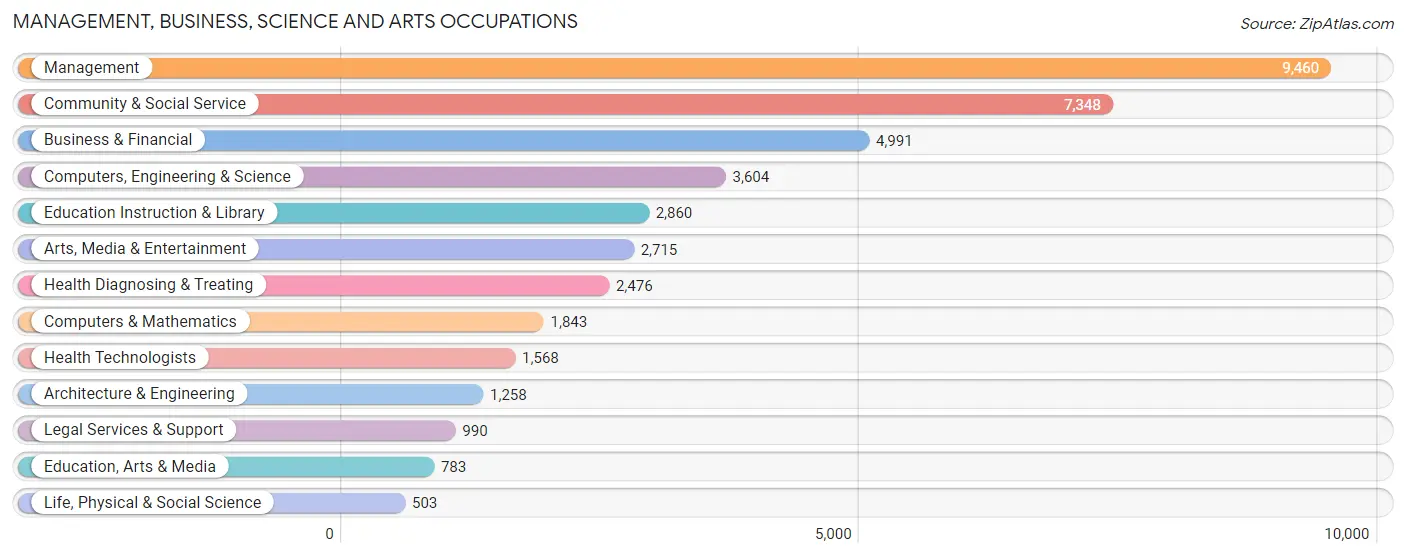
Management, Business, Science and Arts Occupations
The most common Management, Business, Science and Arts occupations in Costa Mesa are Management (9,460 | 14.7%), Community & Social Service (7,348 | 11.4%), Business & Financial (4,991 | 7.7%), Computers, Engineering & Science (3,604 | 5.6%), and Education Instruction & Library (2,860 | 4.4%).
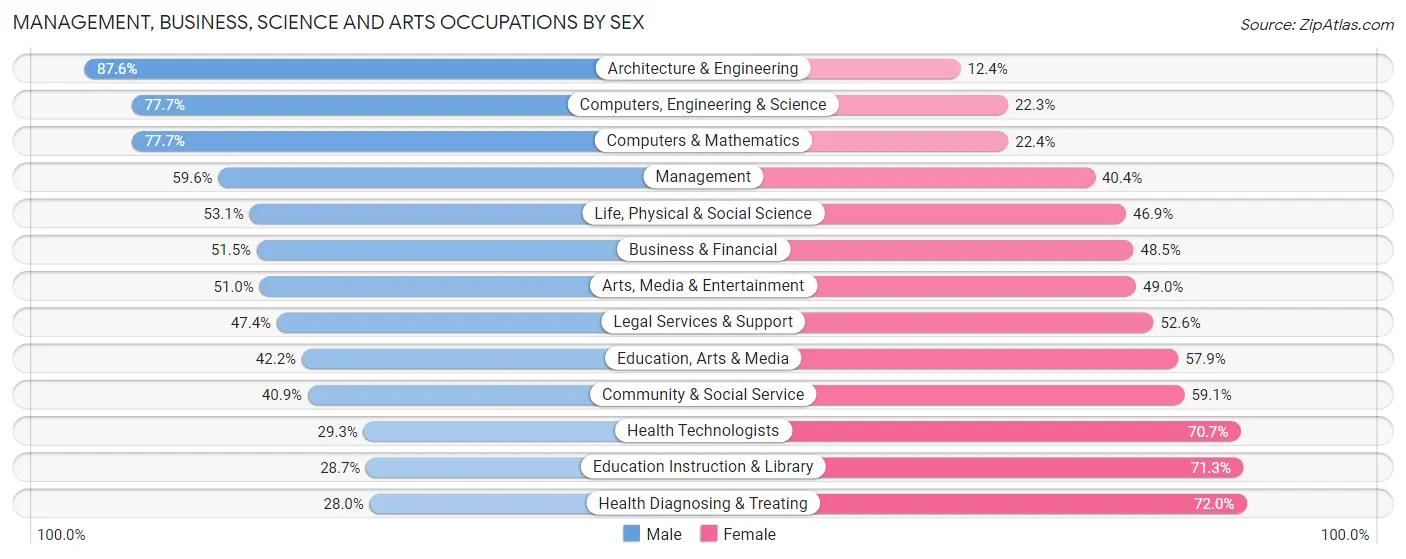
Management, Business, Science and Arts Occupations by Sex
Within the Management, Business, Science and Arts occupations in Costa Mesa, the most male-oriented occupations are Architecture & Engineering (87.6%), Computers, Engineering & Science (77.7%), and Computers & Mathematics (77.6%), while the most female-oriented occupations are Health Diagnosing & Treating (72.0%), Education Instruction & Library (71.3%), and Health Technologists (70.7%).
| Occupation | Male | Female |
| Management | 5,635 (59.6%) | 3,825 (40.4%) |
| Business & Financial | 2,572 (51.5%) | 2,419 (48.5%) |
| Computers, Engineering & Science | 2,800 (77.7%) | 804 (22.3%) |
| Computers & Mathematics | 1,431 (77.6%) | 412 (22.4%) |
| Architecture & Engineering | 1,102 (87.6%) | 156 (12.4%) |
| Life, Physical & Social Science | 267 (53.1%) | 236 (46.9%) |
| Community & Social Service | 3,005 (40.9%) | 4,343 (59.1%) |
| Education, Arts & Media | 330 (42.1%) | 453 (57.9%) |
| Legal Services & Support | 469 (47.4%) | 521 (52.6%) |
| Education Instruction & Library | 822 (28.7%) | 2,038 (71.3%) |
| Arts, Media & Entertainment | 1,384 (51.0%) | 1,331 (49.0%) |
| Health Diagnosing & Treating | 694 (28.0%) | 1,782 (72.0%) |
| Health Technologists | 459 (29.3%) | 1,109 (70.7%) |
| Total (Category) | 14,706 (52.7%) | 13,173 (47.2%) |
| Total (Overall) | 36,113 (56.1%) | 28,249 (43.9%) |
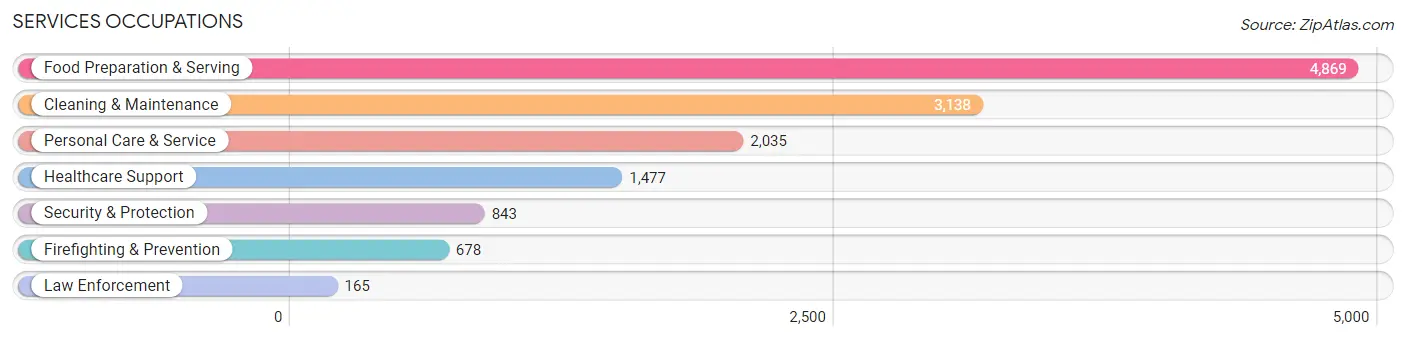
Services Occupations
The most common Services occupations in Costa Mesa are Food Preparation & Serving (4,869 | 7.6%), Cleaning & Maintenance (3,138 | 4.9%), Personal Care & Service (2,035 | 3.2%), Healthcare Support (1,477 | 2.3%), and Security & Protection (843 | 1.3%).
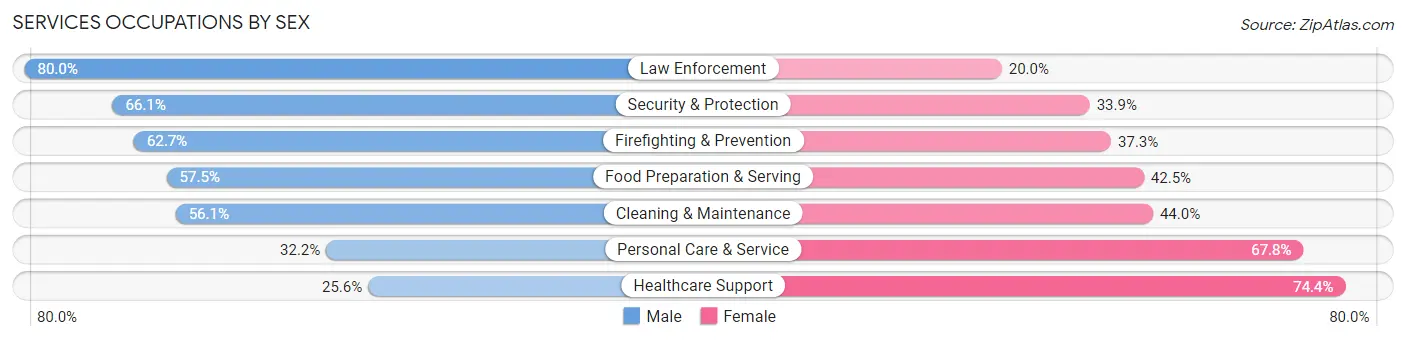
Services Occupations by Sex
Within the Services occupations in Costa Mesa, the most male-oriented occupations are Law Enforcement (80.0%), Security & Protection (66.1%), and Firefighting & Prevention (62.7%), while the most female-oriented occupations are Healthcare Support (74.4%), Personal Care & Service (67.8%), and Cleaning & Maintenance (44.0%).
| Occupation | Male | Female |
| Healthcare Support | 378 (25.6%) | 1,099 (74.4%) |
| Security & Protection | 557 (66.1%) | 286 (33.9%) |
| Firefighting & Prevention | 425 (62.7%) | 253 (37.3%) |
| Law Enforcement | 132 (80.0%) | 33 (20.0%) |
| Food Preparation & Serving | 2,799 (57.5%) | 2,070 (42.5%) |
| Cleaning & Maintenance | 1,759 (56.0%) | 1,379 (44.0%) |
| Personal Care & Service | 656 (32.2%) | 1,379 (67.8%) |
| Total (Category) | 6,149 (49.7%) | 6,213 (50.3%) |
| Total (Overall) | 36,113 (56.1%) | 28,249 (43.9%) |
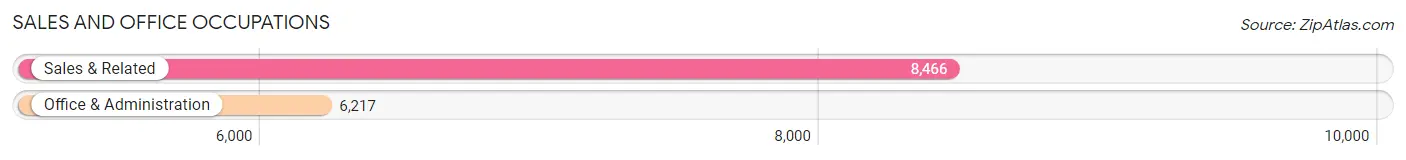
Sales and Office Occupations
The most common Sales and Office occupations in Costa Mesa are Sales & Related (8,466 | 13.2%), and Office & Administration (6,217 | 9.7%).
Sales and Office Occupations by Sex
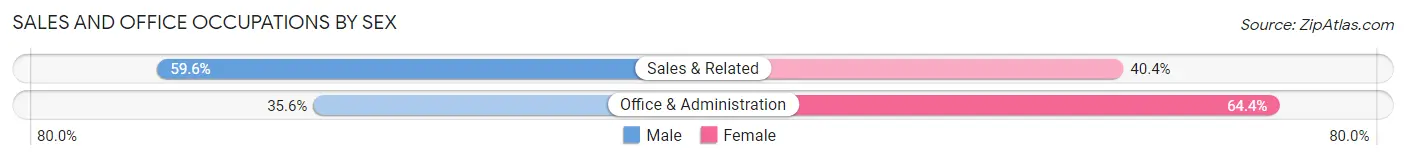
| Occupation | Male | Female |
| Sales & Related | 5,042 (59.6%) | 3,424 (40.4%) |
| Office & Administration | 2,213 (35.6%) | 4,004 (64.4%) |
| Total (Category) | 7,255 (49.4%) | 7,428 (50.6%) |
| Total (Overall) | 36,113 (56.1%) | 28,249 (43.9%) |
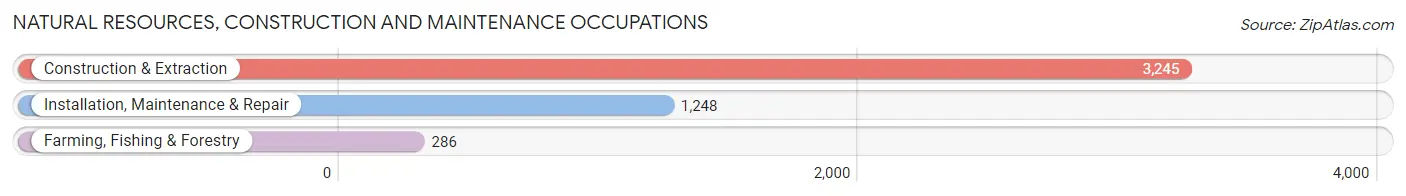
Natural Resources, Construction and Maintenance Occupations
The most common Natural Resources, Construction and Maintenance occupations in Costa Mesa are Construction & Extraction (3,245 | 5.0%), Installation, Maintenance & Repair (1,248 | 1.9%), and Farming, Fishing & Forestry (286 | 0.4%).
Natural Resources, Construction and Maintenance Occupations by Sex
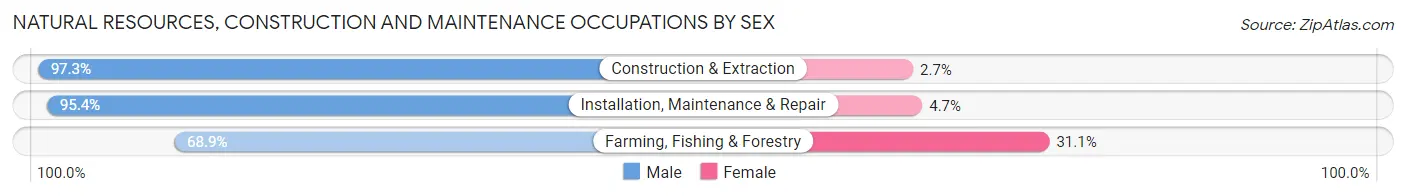
| Occupation | Male | Female |
| Farming, Fishing & Forestry | 197 (68.9%) | 89 (31.1%) |
| Construction & Extraction | 3,156 (97.3%) | 89 (2.7%) |
| Installation, Maintenance & Repair | 1,190 (95.4%) | 58 (4.6%) |
| Total (Category) | 4,543 (95.1%) | 236 (4.9%) |
| Total (Overall) | 36,113 (56.1%) | 28,249 (43.9%) |
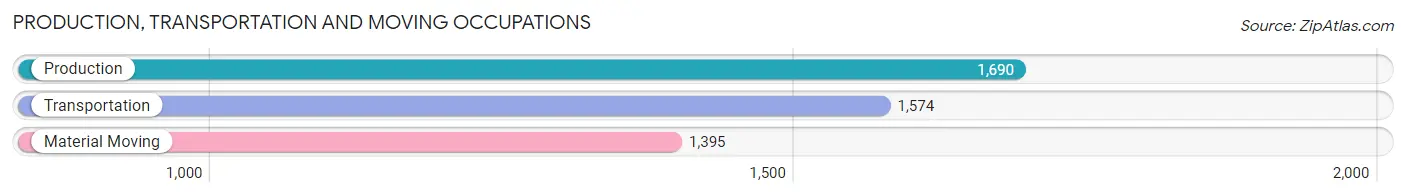
Production, Transportation and Moving Occupations
The most common Production, Transportation and Moving occupations in Costa Mesa are Production (1,690 | 2.6%), Transportation (1,574 | 2.5%), and Material Moving (1,395 | 2.2%).
Production, Transportation and Moving Occupations by Sex
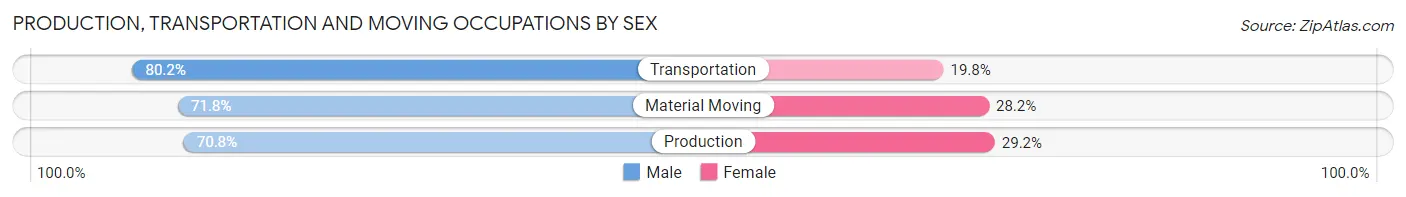
| Occupation | Male | Female |
| Production | 1,196 (70.8%) | 494 (29.2%) |
| Transportation | 1,262 (80.2%) | 312 (19.8%) |
| Material Moving | 1,002 (71.8%) | 393 (28.2%) |
| Total (Category) | 3,460 (74.3%) | 1,199 (25.7%) |
| Total (Overall) | 36,113 (56.1%) | 28,249 (43.9%) |
Employment Industries by Sex in Costa Mesa
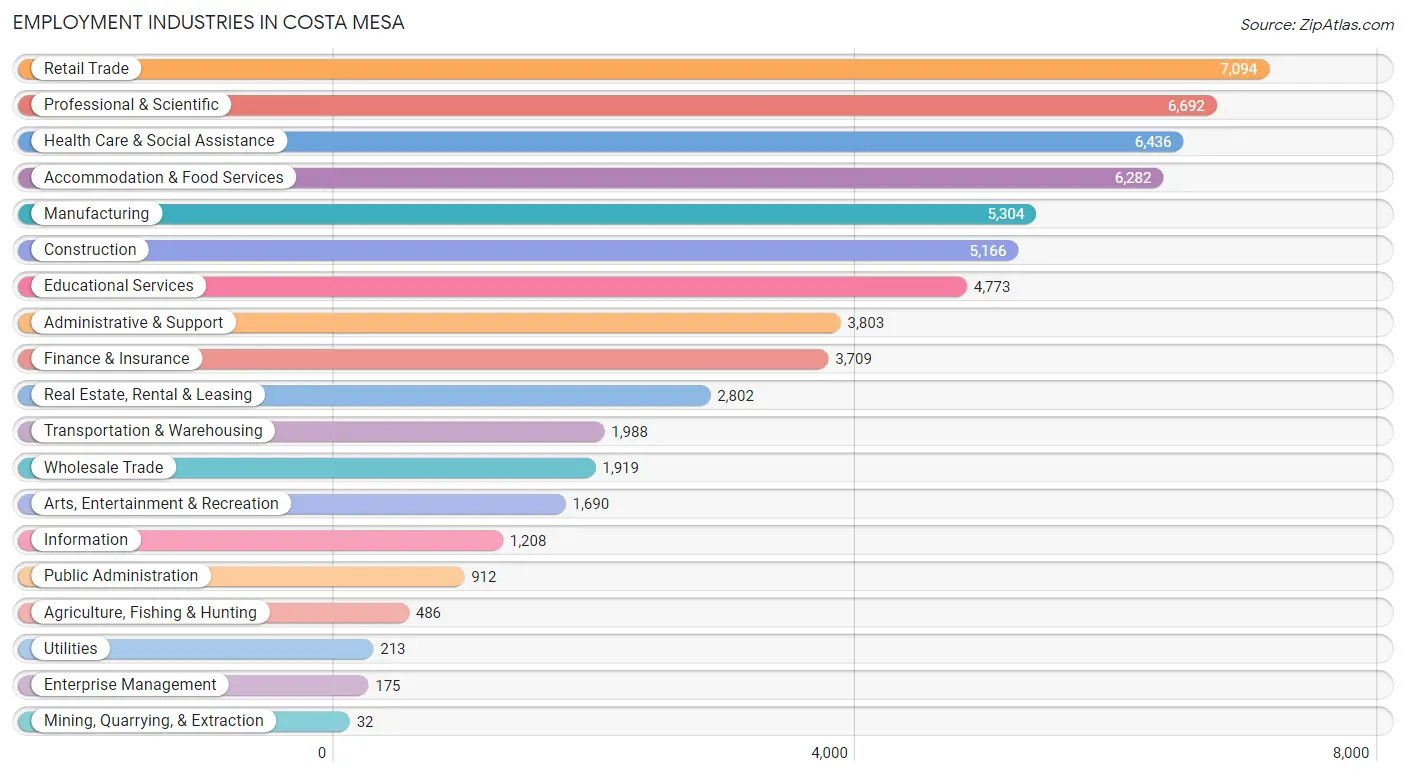
Employment Industries in Costa Mesa
The major employment industries in Costa Mesa include Retail Trade (7,094 | 11.0%), Professional & Scientific (6,692 | 10.4%), Health Care & Social Assistance (6,436 | 10.0%), Accommodation & Food Services (6,282 | 9.8%), and Manufacturing (5,304 | 8.2%).
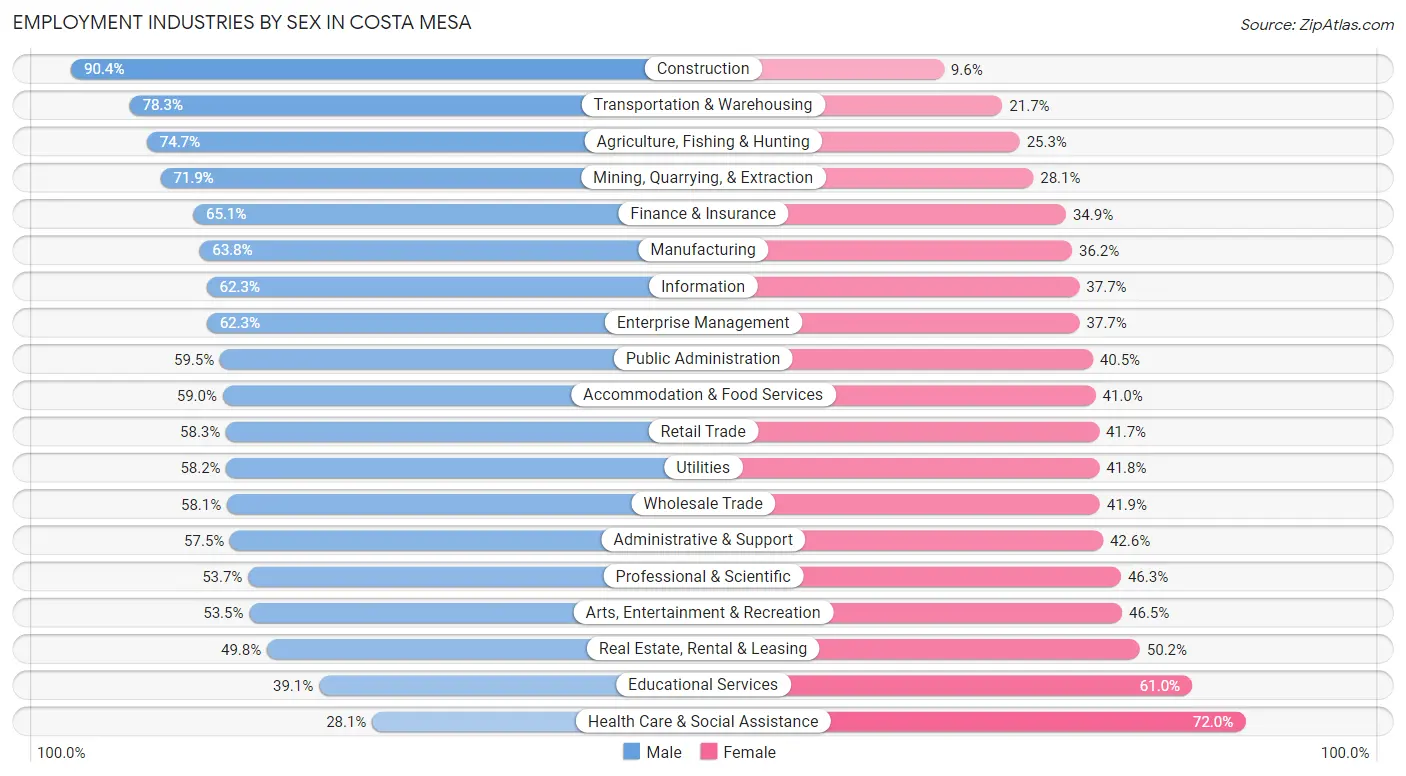
Employment Industries by Sex in Costa Mesa
The Costa Mesa industries that see more men than women are Construction (90.4%), Transportation & Warehousing (78.3%), and Agriculture, Fishing & Hunting (74.7%), whereas the industries that tend to have a higher number of women are Health Care & Social Assistance (72.0%), Educational Services (61.0%), and Real Estate, Rental & Leasing (50.2%).
| Industry | Male | Female |
| Agriculture, Fishing & Hunting | 363 (74.7%) | 123 (25.3%) |
| Mining, Quarrying, & Extraction | 23 (71.9%) | 9 (28.1%) |
| Construction | 4,669 (90.4%) | 497 (9.6%) |
| Manufacturing | 3,386 (63.8%) | 1,918 (36.2%) |
| Wholesale Trade | 1,115 (58.1%) | 804 (41.9%) |
| Retail Trade | 4,135 (58.3%) | 2,959 (41.7%) |
| Transportation & Warehousing | 1,556 (78.3%) | 432 (21.7%) |
| Utilities | 124 (58.2%) | 89 (41.8%) |
| Information | 753 (62.3%) | 455 (37.7%) |
| Finance & Insurance | 2,415 (65.1%) | 1,294 (34.9%) |
| Real Estate, Rental & Leasing | 1,396 (49.8%) | 1,406 (50.2%) |
| Professional & Scientific | 3,595 (53.7%) | 3,097 (46.3%) |
| Enterprise Management | 109 (62.3%) | 66 (37.7%) |
| Administrative & Support | 2,185 (57.5%) | 1,618 (42.5%) |
| Educational Services | 1,864 (39.1%) | 2,909 (61.0%) |
| Health Care & Social Assistance | 1,805 (28.1%) | 4,631 (72.0%) |
| Arts, Entertainment & Recreation | 904 (53.5%) | 786 (46.5%) |
| Accommodation & Food Services | 3,705 (59.0%) | 2,577 (41.0%) |
| Public Administration | 543 (59.5%) | 369 (40.5%) |
| Total | 36,113 (56.1%) | 28,249 (43.9%) |
Education in Costa Mesa
School Enrollment in Costa Mesa
The most common levels of schooling among the 26,039 students in Costa Mesa are college / undergraduate (7,766 | 29.8%), high school (5,011 | 19.2%), and middle school (4,952 | 19.0%).
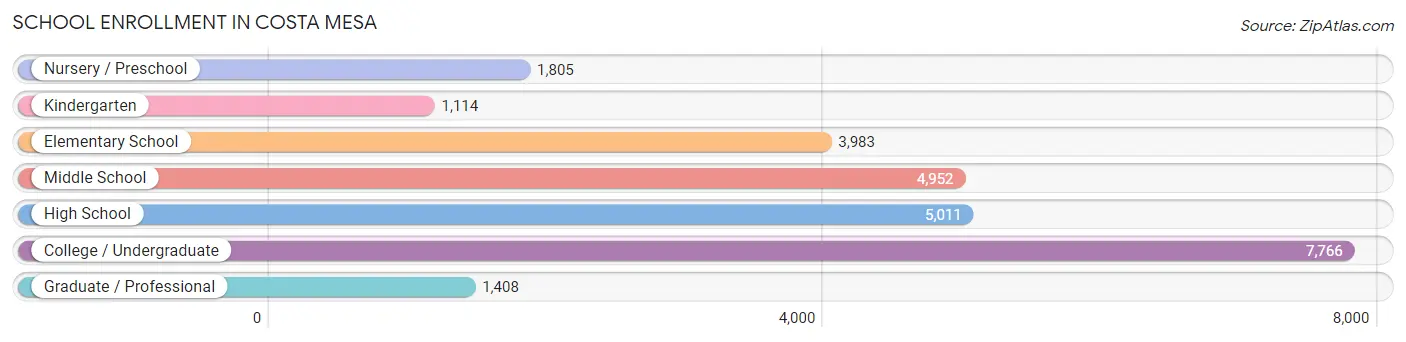
| School Level | # Students | % Students |
| Nursery / Preschool | 1,805 | 6.9% |
| Kindergarten | 1,114 | 4.3% |
| Elementary School | 3,983 | 15.3% |
| Middle School | 4,952 | 19.0% |
| High School | 5,011 | 19.2% |
| College / Undergraduate | 7,766 | 29.8% |
| Graduate / Professional | 1,408 | 5.4% |
| Total | 26,039 | 100.0% |
School Enrollment by Age by Funding Source in Costa Mesa
Out of a total of 26,039 students who are enrolled in schools in Costa Mesa, 4,791 (18.4%) attend a private institution, while the remaining 21,248 (81.6%) are enrolled in public schools. The age group of 3 to 4 year olds has the highest likelihood of being enrolled in private schools, with 676 (46.6% in the age bracket) enrolled. Conversely, the age group of 10 to 14 year olds has the lowest likelihood of being enrolled in a private school, with 5,607 (88.9% in the age bracket) attending a public institution.
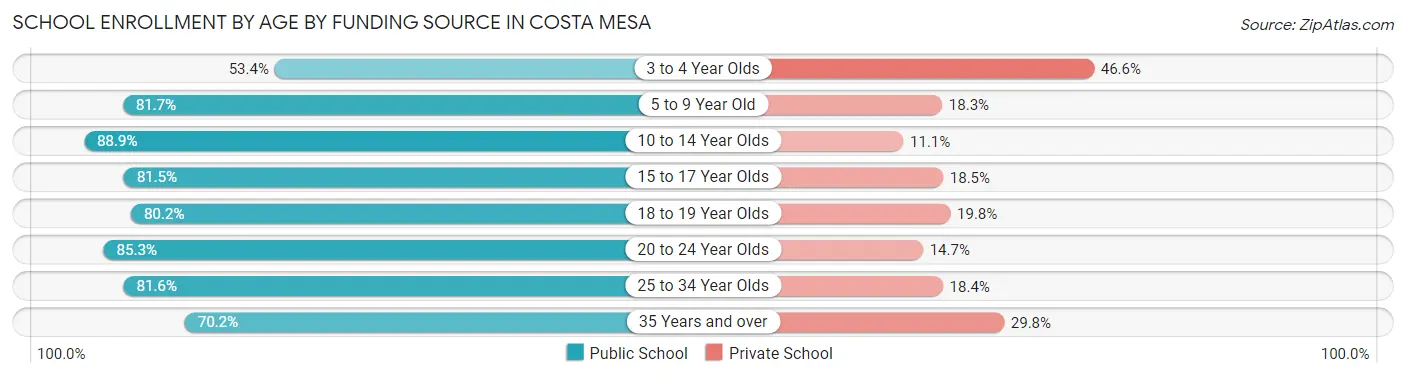
| Age Bracket | Public School | Private School |
| 3 to 4 Year Olds | 775 (53.4%) | 676 (46.6%) |
| 5 to 9 Year Old | 4,111 (81.7%) | 921 (18.3%) |
| 10 to 14 Year Olds | 5,607 (88.9%) | 698 (11.1%) |
| 15 to 17 Year Olds | 2,874 (81.5%) | 651 (18.5%) |
| 18 to 19 Year Olds | 1,736 (80.2%) | 429 (19.8%) |
| 20 to 24 Year Olds | 2,830 (85.3%) | 489 (14.7%) |
| 25 to 34 Year Olds | 2,339 (81.6%) | 529 (18.4%) |
| 35 Years and over | 964 (70.2%) | 410 (29.8%) |
| Total | 21,248 (81.6%) | 4,791 (18.4%) |
Educational Attainment by Field of Study in Costa Mesa
Business (9,586 | 26.1%), social sciences (3,797 | 10.3%), communications (2,800 | 7.6%), engineering (2,408 | 6.6%), and science & technology (2,308 | 6.3%) are the most common fields of study among 36,710 individuals in Costa Mesa who have obtained a bachelor's degree or higher.
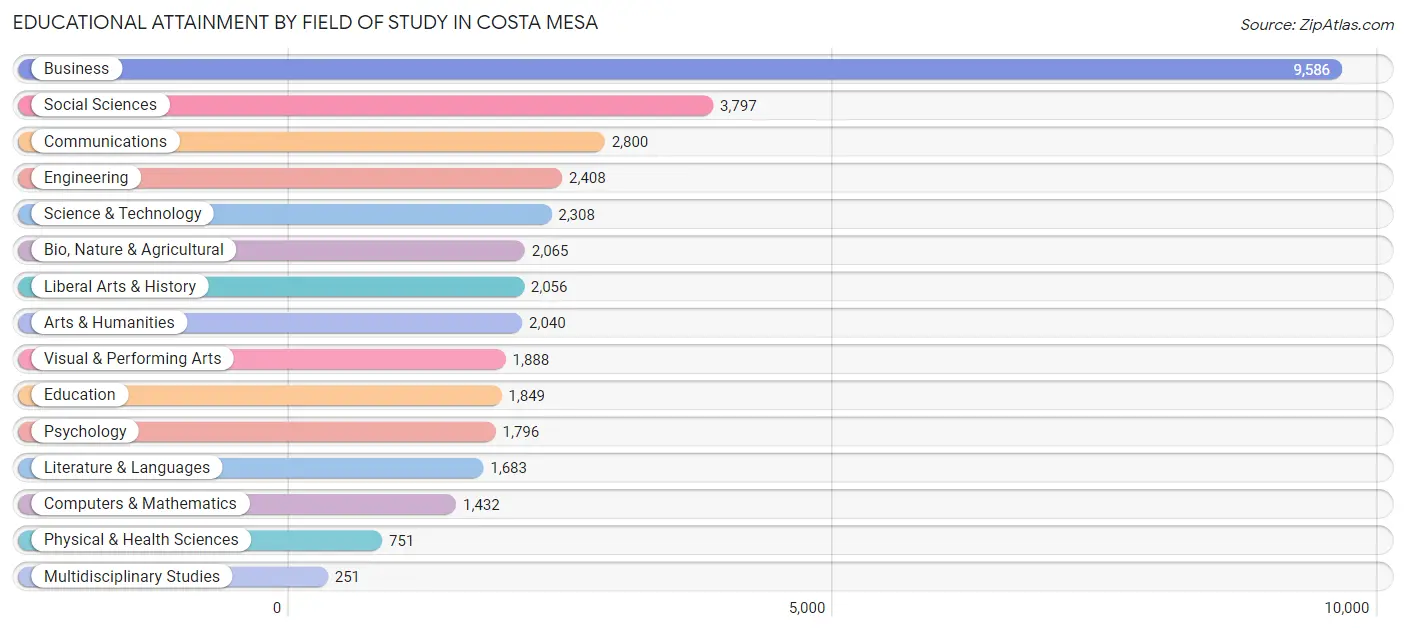
| Field of Study | # Graduates | % Graduates |
| Computers & Mathematics | 1,432 | 3.9% |
| Bio, Nature & Agricultural | 2,065 | 5.6% |
| Physical & Health Sciences | 751 | 2.1% |
| Psychology | 1,796 | 4.9% |
| Social Sciences | 3,797 | 10.3% |
| Engineering | 2,408 | 6.6% |
| Multidisciplinary Studies | 251 | 0.7% |
| Science & Technology | 2,308 | 6.3% |
| Business | 9,586 | 26.1% |
| Education | 1,849 | 5.0% |
| Literature & Languages | 1,683 | 4.6% |
| Liberal Arts & History | 2,056 | 5.6% |
| Visual & Performing Arts | 1,888 | 5.1% |
| Communications | 2,800 | 7.6% |
| Arts & Humanities | 2,040 | 5.6% |
| Total | 36,710 | 100.0% |
Transportation & Commute in Costa Mesa
Vehicle Availability by Sex in Costa Mesa
The most prevalent vehicle ownership categories in Costa Mesa are males with 2 vehicles (15,071, accounting for 42.8%) and females with 2 vehicles (12,456, making up 54.7%).
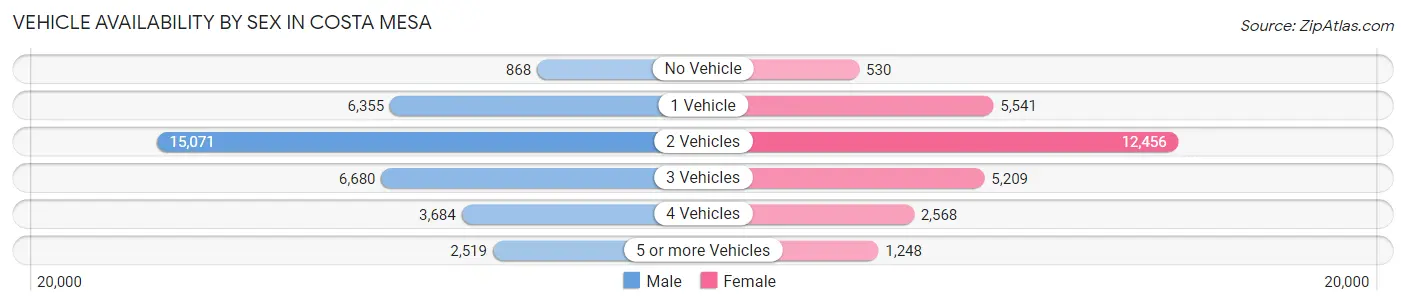
| Vehicles Available | Male | Female |
| No Vehicle | 868 (2.5%) | 530 (1.9%) |
| 1 Vehicle | 6,355 (18.1%) | 5,541 (20.1%) |
| 2 Vehicles | 15,071 (42.8%) | 12,456 (45.2%) |
| 3 Vehicles | 6,680 (19.0%) | 5,209 (18.9%) |
| 4 Vehicles | 3,684 (10.5%) | 2,568 (9.3%) |
| 5 or more Vehicles | 2,519 (7.2%) | 1,248 (4.5%) |
| Total | 35,177 (100.0%) | 27,552 (100.0%) |
Commute Time in Costa Mesa
The most frequently occuring commute durations in Costa Mesa are 15 to 19 minutes (10,836 commuters, 20.7%), 20 to 24 minutes (9,642 commuters, 18.4%), and 10 to 14 minutes (9,042 commuters, 17.3%).
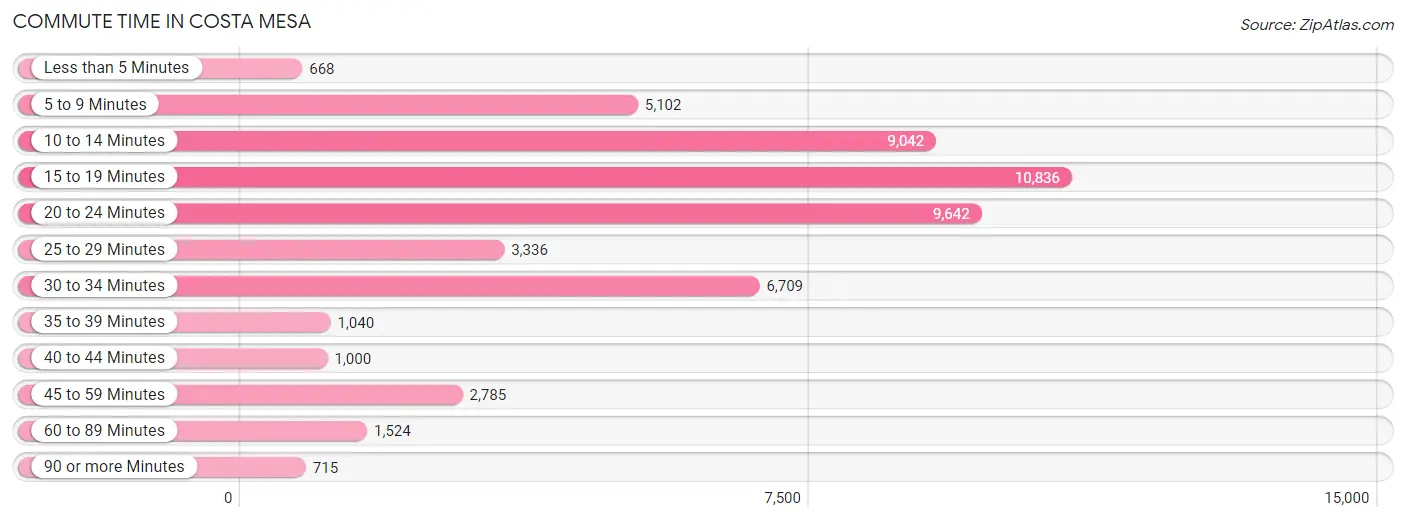
| Commute Time | # Commuters | % Commuters |
| Less than 5 Minutes | 668 | 1.3% |
| 5 to 9 Minutes | 5,102 | 9.7% |
| 10 to 14 Minutes | 9,042 | 17.3% |
| 15 to 19 Minutes | 10,836 | 20.7% |
| 20 to 24 Minutes | 9,642 | 18.4% |
| 25 to 29 Minutes | 3,336 | 6.4% |
| 30 to 34 Minutes | 6,709 | 12.8% |
| 35 to 39 Minutes | 1,040 | 2.0% |
| 40 to 44 Minutes | 1,000 | 1.9% |
| 45 to 59 Minutes | 2,785 | 5.3% |
| 60 to 89 Minutes | 1,524 | 2.9% |
| 90 or more Minutes | 715 | 1.4% |
Commute Time by Sex in Costa Mesa
The most common commute times in Costa Mesa are 15 to 19 minutes (5,807 commuters, 19.5%) for males and 15 to 19 minutes (5,029 commuters, 22.2%) for females.
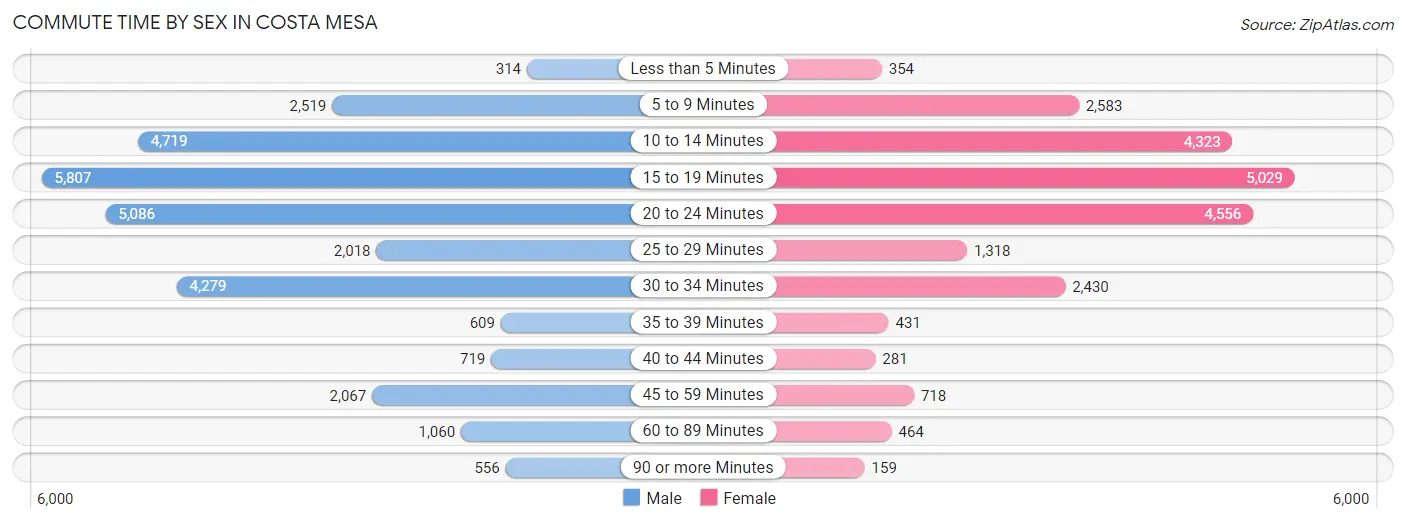
| Commute Time | Male | Female |
| Less than 5 Minutes | 314 (1.1%) | 354 (1.6%) |
| 5 to 9 Minutes | 2,519 (8.5%) | 2,583 (11.4%) |
| 10 to 14 Minutes | 4,719 (15.9%) | 4,323 (19.1%) |
| 15 to 19 Minutes | 5,807 (19.5%) | 5,029 (22.2%) |
| 20 to 24 Minutes | 5,086 (17.1%) | 4,556 (20.1%) |
| 25 to 29 Minutes | 2,018 (6.8%) | 1,318 (5.8%) |
| 30 to 34 Minutes | 4,279 (14.4%) | 2,430 (10.7%) |
| 35 to 39 Minutes | 609 (2.1%) | 431 (1.9%) |
| 40 to 44 Minutes | 719 (2.4%) | 281 (1.2%) |
| 45 to 59 Minutes | 2,067 (7.0%) | 718 (3.2%) |
| 60 to 89 Minutes | 1,060 (3.6%) | 464 (2.1%) |
| 90 or more Minutes | 556 (1.9%) | 159 (0.7%) |
Time of Departure to Work by Sex in Costa Mesa
The most frequent times of departure to work in Costa Mesa are 8:00 AM to 8:29 AM (4,080, 13.7%) for males and 8:00 AM to 8:29 AM (3,302, 14.6%) for females.
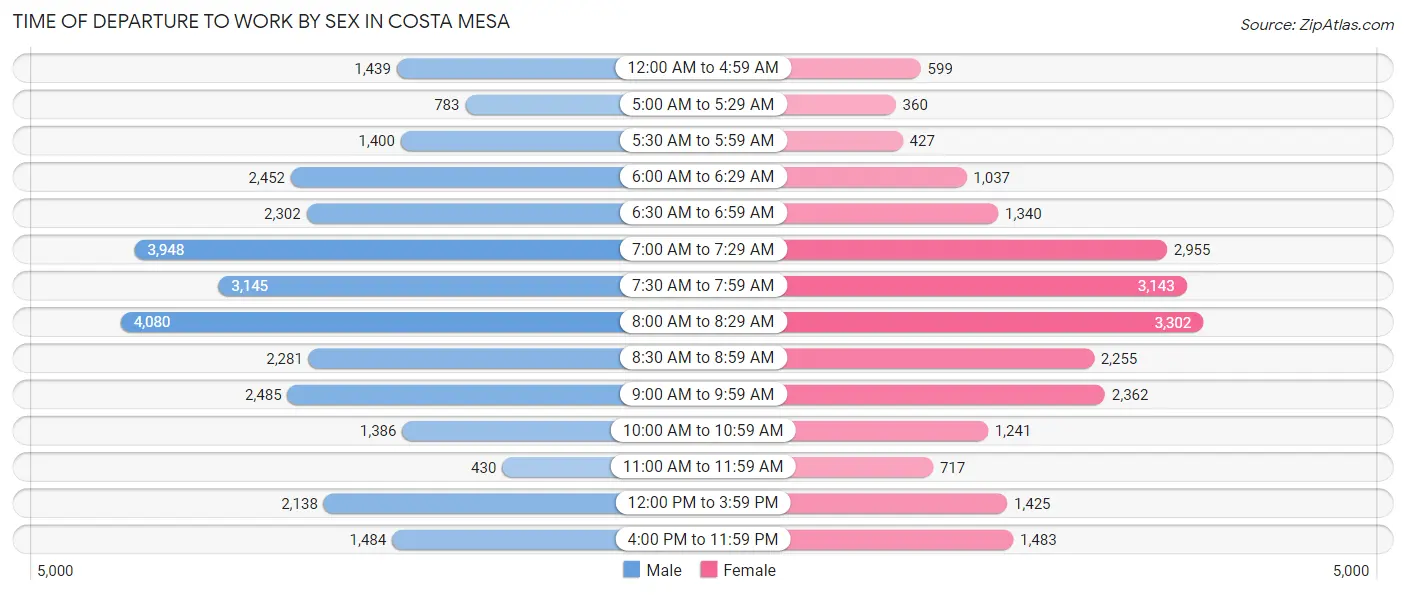
| Time of Departure | Male | Female |
| 12:00 AM to 4:59 AM | 1,439 (4.8%) | 599 (2.6%) |
| 5:00 AM to 5:29 AM | 783 (2.6%) | 360 (1.6%) |
| 5:30 AM to 5:59 AM | 1,400 (4.7%) | 427 (1.9%) |
| 6:00 AM to 6:29 AM | 2,452 (8.2%) | 1,037 (4.6%) |
| 6:30 AM to 6:59 AM | 2,302 (7.7%) | 1,340 (5.9%) |
| 7:00 AM to 7:29 AM | 3,948 (13.3%) | 2,955 (13.1%) |
| 7:30 AM to 7:59 AM | 3,145 (10.6%) | 3,143 (13.9%) |
| 8:00 AM to 8:29 AM | 4,080 (13.7%) | 3,302 (14.6%) |
| 8:30 AM to 8:59 AM | 2,281 (7.7%) | 2,255 (10.0%) |
| 9:00 AM to 9:59 AM | 2,485 (8.4%) | 2,362 (10.4%) |
| 10:00 AM to 10:59 AM | 1,386 (4.7%) | 1,241 (5.5%) |
| 11:00 AM to 11:59 AM | 430 (1.5%) | 717 (3.2%) |
| 12:00 PM to 3:59 PM | 2,138 (7.2%) | 1,425 (6.3%) |
| 4:00 PM to 11:59 PM | 1,484 (5.0%) | 1,483 (6.6%) |
| Total | 29,753 (100.0%) | 22,646 (100.0%) |
Housing Occupancy in Costa Mesa
Occupancy by Ownership in Costa Mesa
Of the total 41,407 dwellings in Costa Mesa, owner-occupied units account for 16,427 (39.7%), while renter-occupied units make up 24,980 (60.3%).
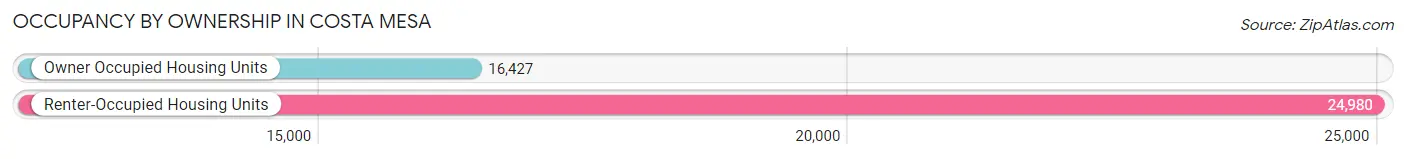
| Occupancy | # Housing Units | % Housing Units |
| Owner Occupied Housing Units | 16,427 | 39.7% |
| Renter-Occupied Housing Units | 24,980 | 60.3% |
| Total Occupied Housing Units | 41,407 | 100.0% |
Occupancy by Household Size in Costa Mesa
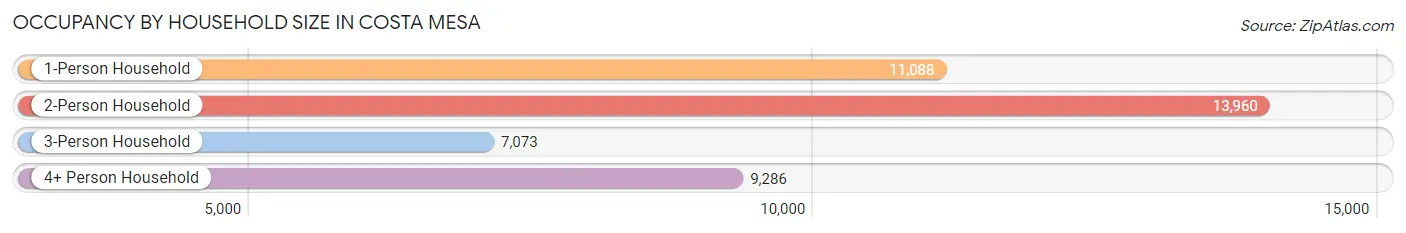
| Household Size | # Housing Units | % Housing Units |
| 1-Person Household | 11,088 | 26.8% |
| 2-Person Household | 13,960 | 33.7% |
| 3-Person Household | 7,073 | 17.1% |
| 4+ Person Household | 9,286 | 22.4% |
| Total Housing Units | 41,407 | 100.0% |
Occupancy by Ownership by Household Size in Costa Mesa
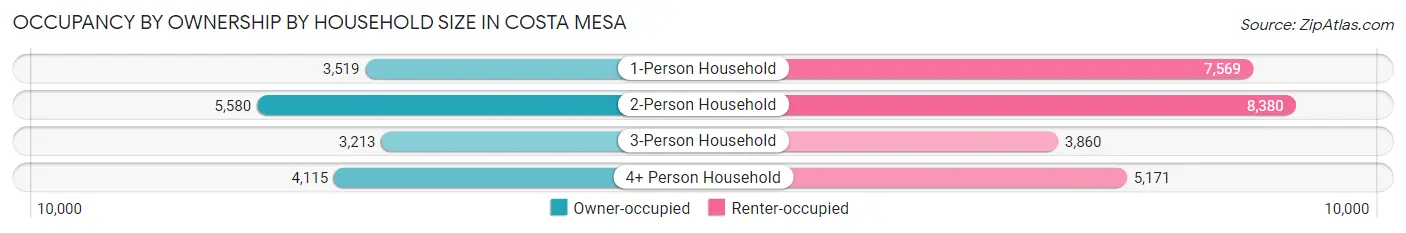
| Household Size | Owner-occupied | Renter-occupied |
| 1-Person Household | 3,519 (31.7%) | 7,569 (68.3%) |
| 2-Person Household | 5,580 (40.0%) | 8,380 (60.0%) |
| 3-Person Household | 3,213 (45.4%) | 3,860 (54.6%) |
| 4+ Person Household | 4,115 (44.3%) | 5,171 (55.7%) |
| Total Housing Units | 16,427 (39.7%) | 24,980 (60.3%) |
Occupancy by Educational Attainment in Costa Mesa
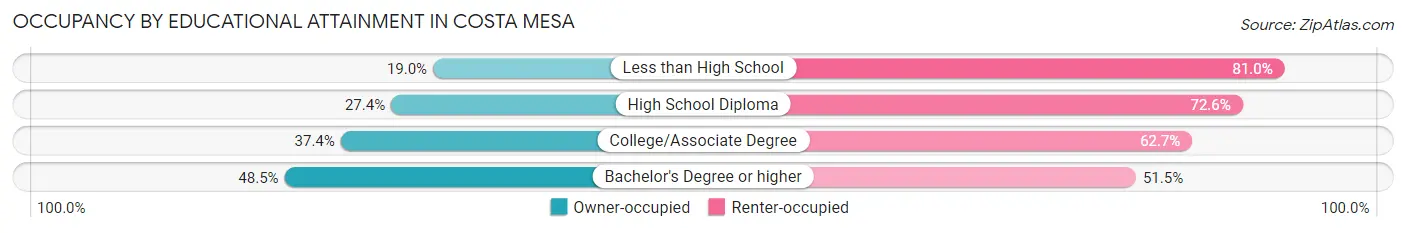
| Household Size | Owner-occupied | Renter-occupied |
| Less than High School | 652 (19.0%) | 2,773 (81.0%) |
| High School Diploma | 1,570 (27.4%) | 4,168 (72.6%) |
| College/Associate Degree | 4,793 (37.3%) | 8,039 (62.6%) |
| Bachelor's Degree or higher | 9,412 (48.5%) | 10,000 (51.5%) |
Occupancy by Age of Householder in Costa Mesa
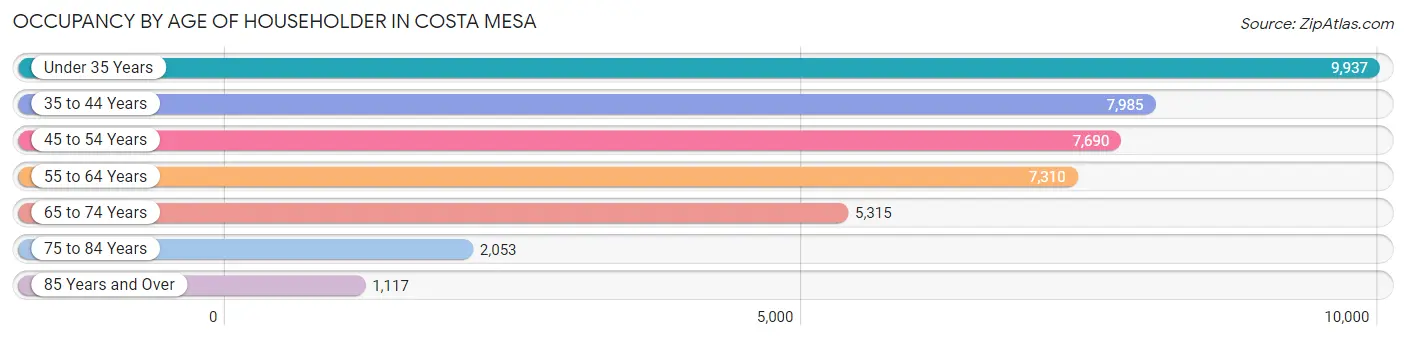
| Age Bracket | # Households | % Households |
| Under 35 Years | 9,937 | 24.0% |
| 35 to 44 Years | 7,985 | 19.3% |
| 45 to 54 Years | 7,690 | 18.6% |
| 55 to 64 Years | 7,310 | 17.6% |
| 65 to 74 Years | 5,315 | 12.8% |
| 75 to 84 Years | 2,053 | 5.0% |
| 85 Years and Over | 1,117 | 2.7% |
| Total | 41,407 | 100.0% |
Housing Finances in Costa Mesa
Median Income by Occupancy in Costa Mesa
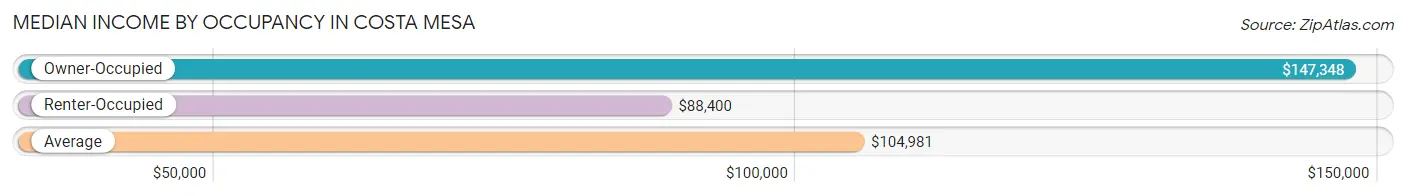
| Occupancy Type | # Households | Median Income |
| Owner-Occupied | 16,427 (39.7%) | $147,348 |
| Renter-Occupied | 24,980 (60.3%) | $88,400 |
| Average | 41,407 (100.0%) | $104,981 |
Occupancy by Householder Income Bracket in Costa Mesa
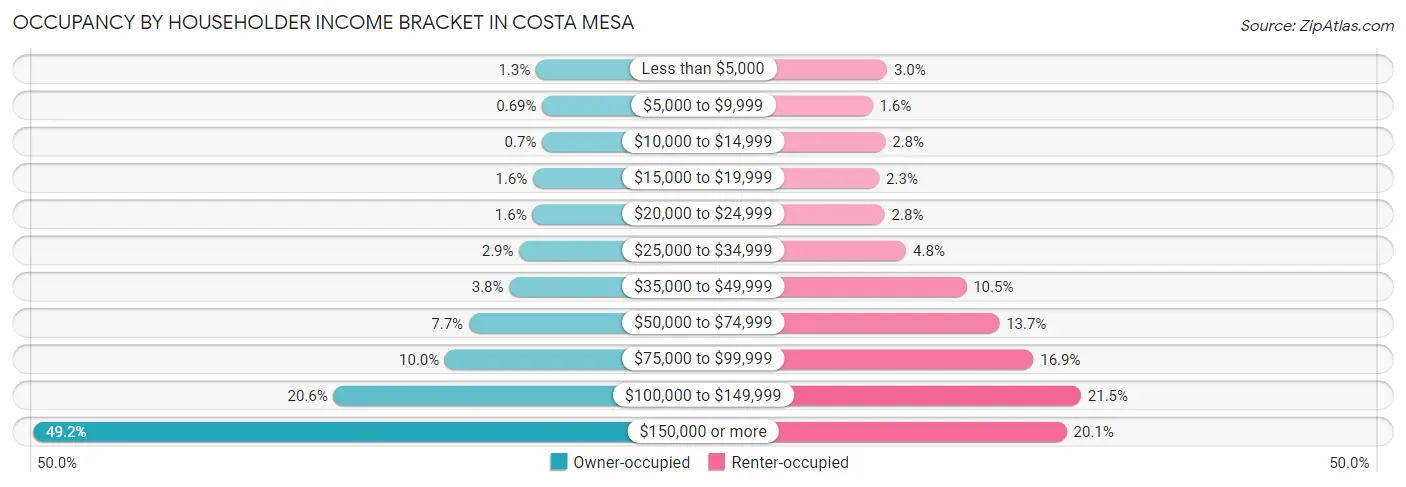
| Income Bracket | Owner-occupied | Renter-occupied |
| Less than $5,000 | 212 (1.3%) | 750 (3.0%) |
| $5,000 to $9,999 | 114 (0.7%) | 403 (1.6%) |
| $10,000 to $14,999 | 115 (0.7%) | 706 (2.8%) |
| $15,000 to $19,999 | 260 (1.6%) | 562 (2.2%) |
| $20,000 to $24,999 | 268 (1.6%) | 693 (2.8%) |
| $25,000 to $34,999 | 473 (2.9%) | 1,205 (4.8%) |
| $35,000 to $49,999 | 629 (3.8%) | 2,634 (10.5%) |
| $50,000 to $74,999 | 1,262 (7.7%) | 3,417 (13.7%) |
| $75,000 to $99,999 | 1,635 (10.0%) | 4,228 (16.9%) |
| $100,000 to $149,999 | 3,380 (20.6%) | 5,361 (21.5%) |
| $150,000 or more | 8,079 (49.2%) | 5,021 (20.1%) |
| Total | 16,427 (100.0%) | 24,980 (100.0%) |
Monthly Housing Cost Tiers in Costa Mesa
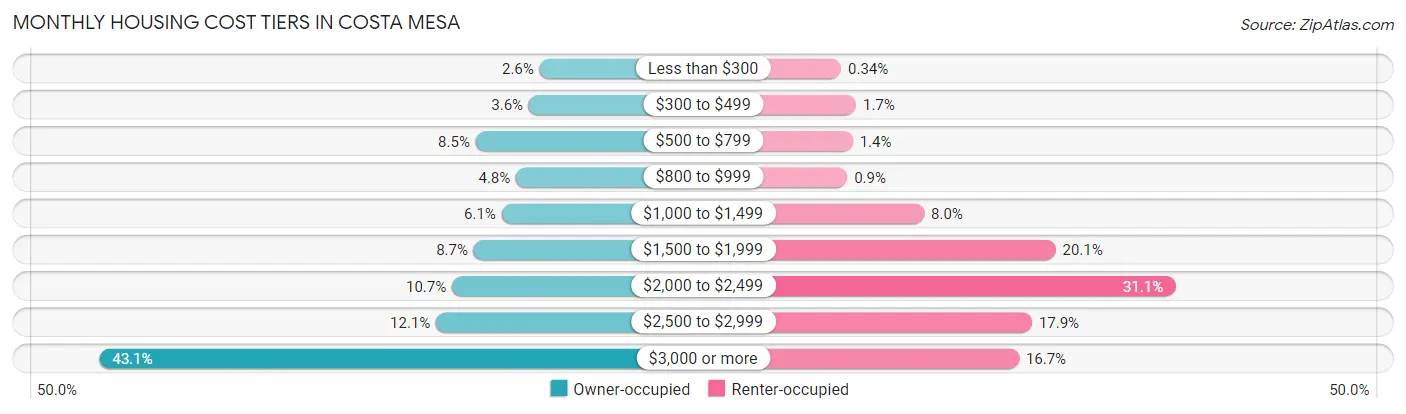
| Monthly Cost | Owner-occupied | Renter-occupied |
| Less than $300 | 426 (2.6%) | 84 (0.3%) |
| $300 to $499 | 586 (3.6%) | 430 (1.7%) |
| $500 to $799 | 1,392 (8.5%) | 351 (1.4%) |
| $800 to $999 | 781 (4.8%) | 225 (0.9%) |
| $1,000 to $1,499 | 999 (6.1%) | 1,994 (8.0%) |
| $1,500 to $1,999 | 1,421 (8.6%) | 5,015 (20.1%) |
| $2,000 to $2,499 | 1,749 (10.6%) | 7,764 (31.1%) |
| $2,500 to $2,999 | 1,989 (12.1%) | 4,474 (17.9%) |
| $3,000 or more | 7,084 (43.1%) | 4,175 (16.7%) |
| Total | 16,427 (100.0%) | 24,980 (100.0%) |
Physical Housing Characteristics in Costa Mesa
Housing Structures in Costa Mesa
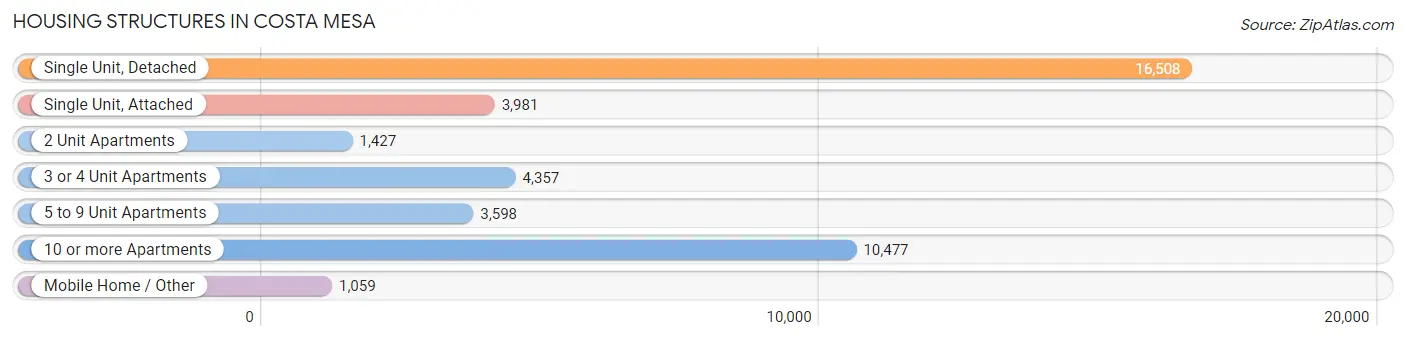
| Structure Type | # Housing Units | % Housing Units |
| Single Unit, Detached | 16,508 | 39.9% |
| Single Unit, Attached | 3,981 | 9.6% |
| 2 Unit Apartments | 1,427 | 3.5% |
| 3 or 4 Unit Apartments | 4,357 | 10.5% |
| 5 to 9 Unit Apartments | 3,598 | 8.7% |
| 10 or more Apartments | 10,477 | 25.3% |
| Mobile Home / Other | 1,059 | 2.6% |
| Total | 41,407 | 100.0% |
Housing Structures by Occupancy in Costa Mesa
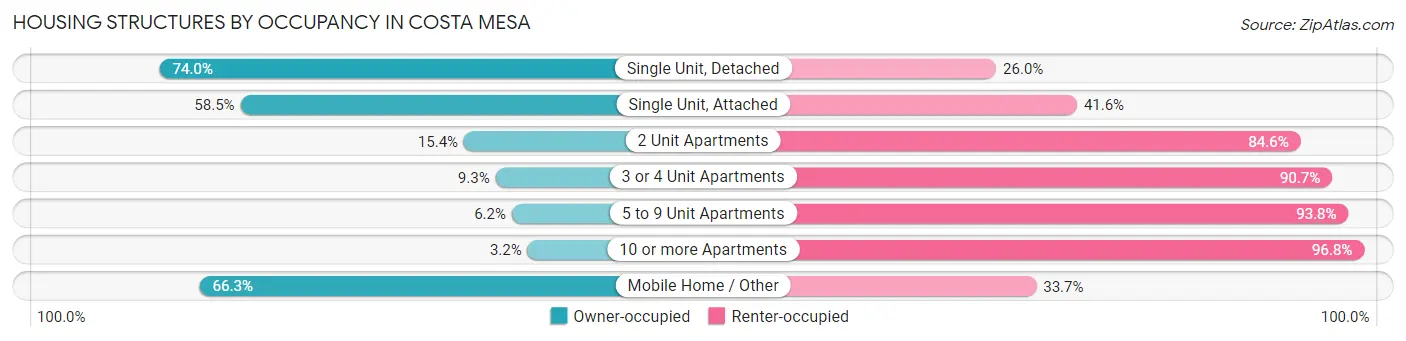
| Structure Type | Owner-occupied | Renter-occupied |
| Single Unit, Detached | 12,217 (74.0%) | 4,291 (26.0%) |
| Single Unit, Attached | 2,327 (58.5%) | 1,654 (41.5%) |
| 2 Unit Apartments | 220 (15.4%) | 1,207 (84.6%) |
| 3 or 4 Unit Apartments | 407 (9.3%) | 3,950 (90.7%) |
| 5 to 9 Unit Apartments | 223 (6.2%) | 3,375 (93.8%) |
| 10 or more Apartments | 331 (3.2%) | 10,146 (96.8%) |
| Mobile Home / Other | 702 (66.3%) | 357 (33.7%) |
| Total | 16,427 (39.7%) | 24,980 (60.3%) |
Housing Structures by Number of Rooms in Costa Mesa
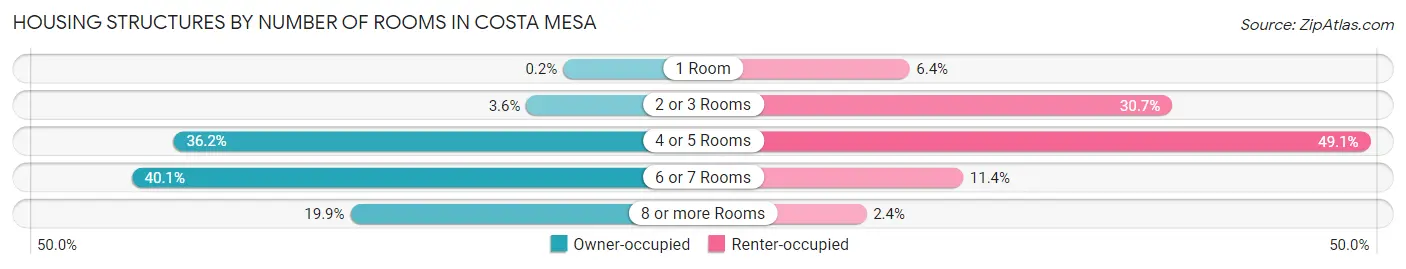
| Number of Rooms | Owner-occupied | Renter-occupied |
| 1 Room | 33 (0.2%) | 1,604 (6.4%) |
| 2 or 3 Rooms | 591 (3.6%) | 7,673 (30.7%) |
| 4 or 5 Rooms | 5,952 (36.2%) | 12,256 (49.1%) |
| 6 or 7 Rooms | 6,587 (40.1%) | 2,840 (11.4%) |
| 8 or more Rooms | 3,264 (19.9%) | 607 (2.4%) |
| Total | 16,427 (100.0%) | 24,980 (100.0%) |
Housing Structure by Heating Type in Costa Mesa
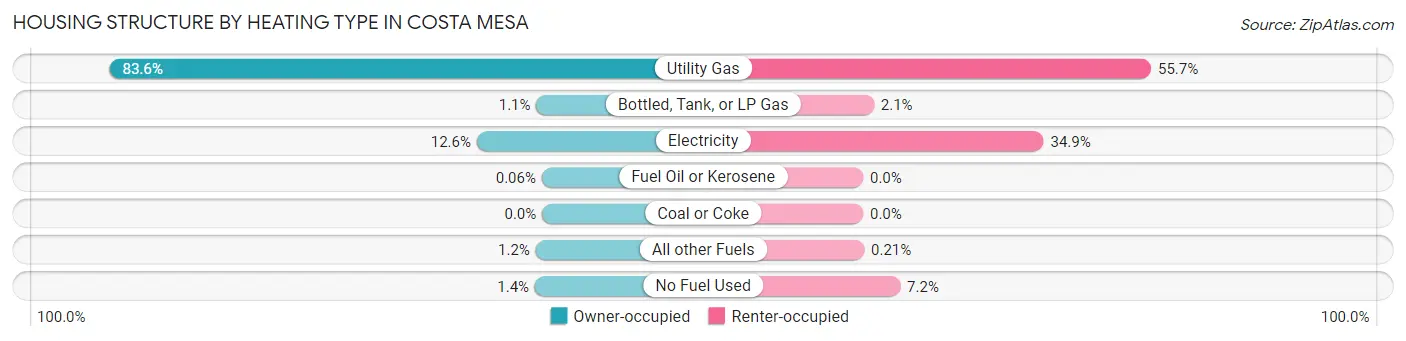
| Heating Type | Owner-occupied | Renter-occupied |
| Utility Gas | 13,730 (83.6%) | 13,902 (55.6%) |
| Bottled, Tank, or LP Gas | 183 (1.1%) | 522 (2.1%) |
| Electricity | 2,073 (12.6%) | 8,713 (34.9%) |
| Fuel Oil or Kerosene | 10 (0.1%) | 0 (0.0%) |
| Coal or Coke | 0 (0.0%) | 0 (0.0%) |
| All other Fuels | 203 (1.2%) | 52 (0.2%) |
| No Fuel Used | 228 (1.4%) | 1,791 (7.2%) |
| Total | 16,427 (100.0%) | 24,980 (100.0%) |
Household Vehicle Usage in Costa Mesa
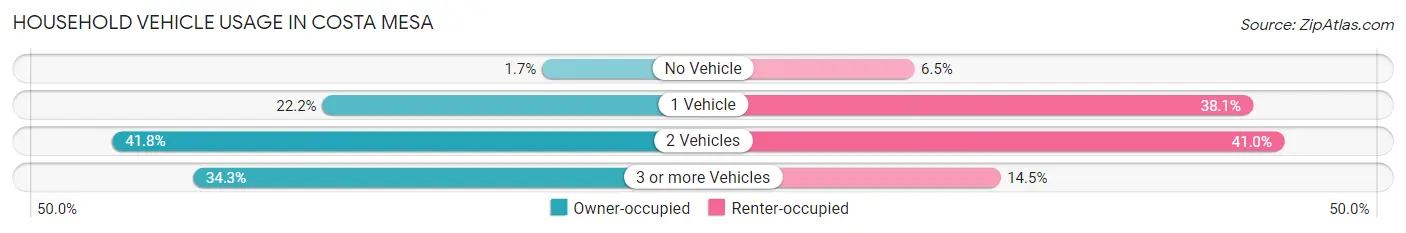
| Vehicles per Household | Owner-occupied | Renter-occupied |
| No Vehicle | 280 (1.7%) | 1,614 (6.5%) |
| 1 Vehicle | 3,646 (22.2%) | 9,509 (38.1%) |
| 2 Vehicles | 6,868 (41.8%) | 10,234 (41.0%) |
| 3 or more Vehicles | 5,633 (34.3%) | 3,623 (14.5%) |
| Total | 16,427 (100.0%) | 24,980 (100.0%) |
Real Estate & Mortgages in Costa Mesa
Real Estate and Mortgage Overview in Costa Mesa
| Characteristic | Without Mortgage | With Mortgage |
| Housing Units | 3,845 | 12,582 |
| Median Property Value | $899,500 | $974,700 |
| Median Household Income | $86,359 | $7,015 |
| Monthly Housing Costs | $713 | $7,040 |
| Real Estate Taxes | $3,873 | $96 |
Property Value by Mortgage Status in Costa Mesa
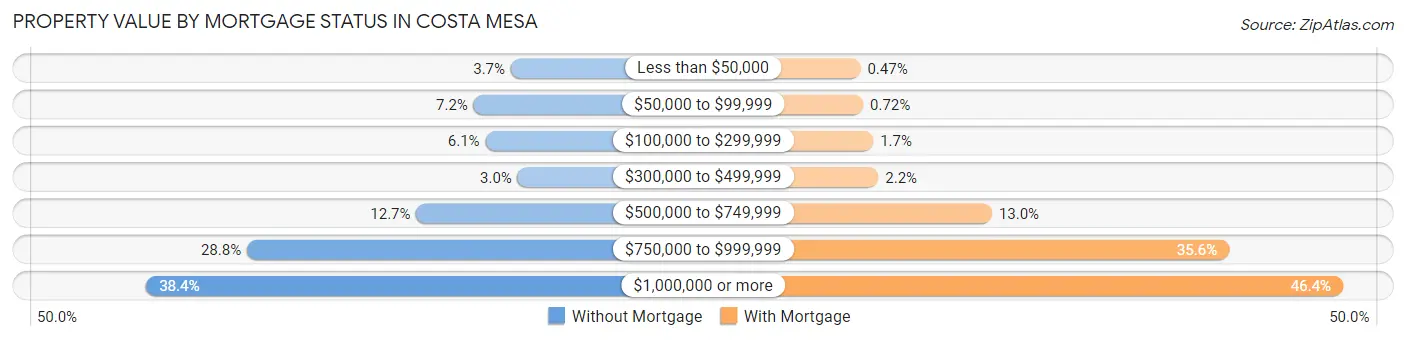
| Property Value | Without Mortgage | With Mortgage |
| Less than $50,000 | 142 (3.7%) | 59 (0.5%) |
| $50,000 to $99,999 | 278 (7.2%) | 91 (0.7%) |
| $100,000 to $299,999 | 235 (6.1%) | 211 (1.7%) |
| $300,000 to $499,999 | 117 (3.0%) | 273 (2.2%) |
| $500,000 to $749,999 | 488 (12.7%) | 1,635 (13.0%) |
| $750,000 to $999,999 | 1,108 (28.8%) | 4,474 (35.6%) |
| $1,000,000 or more | 1,477 (38.4%) | 5,839 (46.4%) |
| Total | 3,845 (100.0%) | 12,582 (100.0%) |
Household Income by Mortgage Status in Costa Mesa
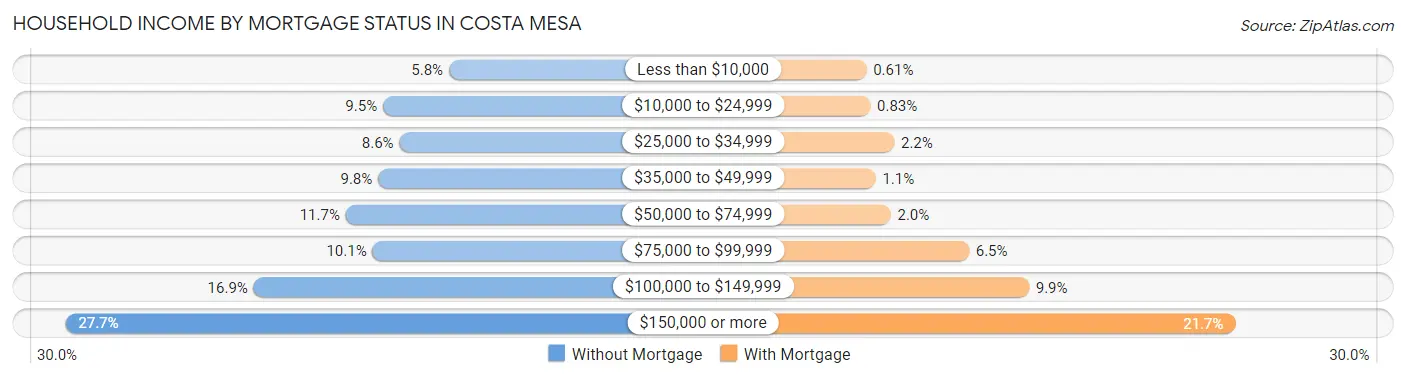
| Household Income | Without Mortgage | With Mortgage |
| Less than $10,000 | 221 (5.8%) | 77 (0.6%) |
| $10,000 to $24,999 | 366 (9.5%) | 105 (0.8%) |
| $25,000 to $34,999 | 330 (8.6%) | 277 (2.2%) |
| $35,000 to $49,999 | 377 (9.8%) | 143 (1.1%) |
| $50,000 to $74,999 | 448 (11.7%) | 252 (2.0%) |
| $75,000 to $99,999 | 389 (10.1%) | 814 (6.5%) |
| $100,000 to $149,999 | 650 (16.9%) | 1,246 (9.9%) |
| $150,000 or more | 1,064 (27.7%) | 2,730 (21.7%) |
| Total | 3,845 (100.0%) | 12,582 (100.0%) |
Property Value to Household Income Ratio in Costa Mesa
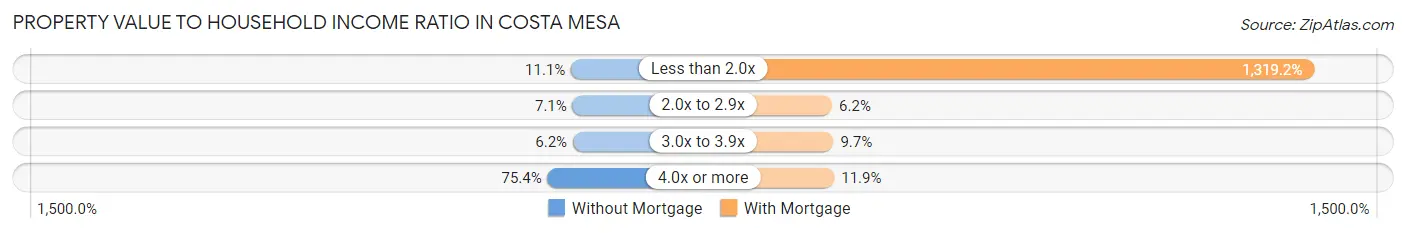
| Value-to-Income Ratio | Without Mortgage | With Mortgage |
| Less than 2.0x | 426 (11.1%) | 165,985 (1,319.2%) |
| 2.0x to 2.9x | 273 (7.1%) | 774 (6.1%) |
| 3.0x to 3.9x | 238 (6.2%) | 1,225 (9.7%) |
| 4.0x or more | 2,899 (75.4%) | 1,495 (11.9%) |
| Total | 3,845 (100.0%) | 12,582 (100.0%) |
Real Estate Taxes by Mortgage Status in Costa Mesa
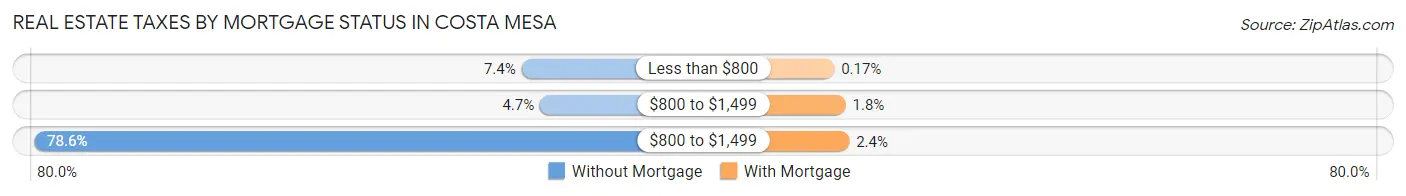
| Property Taxes | Without Mortgage | With Mortgage |
| Less than $800 | 284 (7.4%) | 21 (0.2%) |
| $800 to $1,499 | 180 (4.7%) | 231 (1.8%) |
| $800 to $1,499 | 3,022 (78.6%) | 297 (2.4%) |
| Total | 3,845 (100.0%) | 12,582 (100.0%) |
Health & Disability in Costa Mesa
Health Insurance Coverage by Age in Costa Mesa
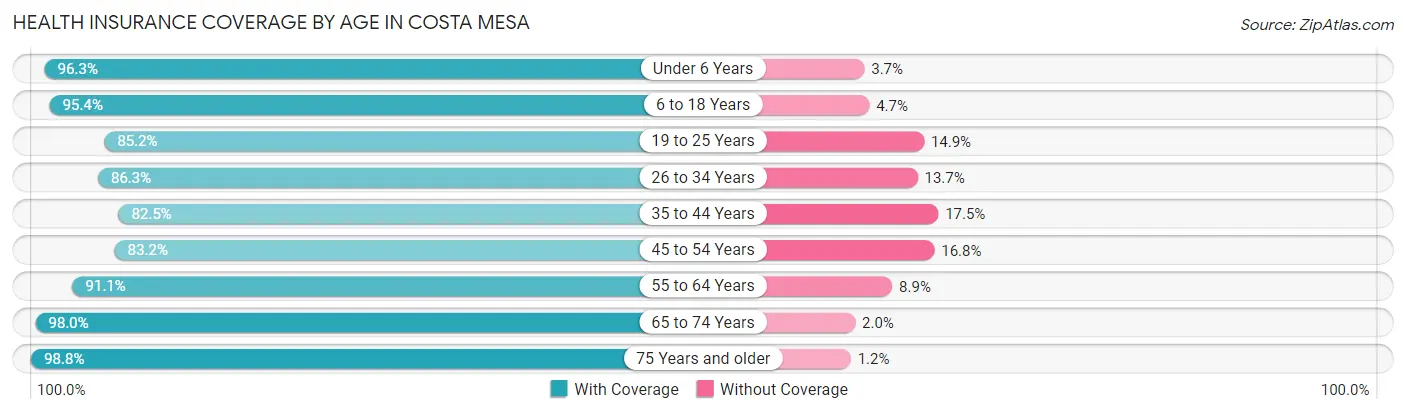
| Age Bracket | With Coverage | Without Coverage |
| Under 6 Years | 6,707 (96.3%) | 260 (3.7%) |
| 6 to 18 Years | 14,853 (95.4%) | 725 (4.6%) |
| 19 to 25 Years | 9,154 (85.2%) | 1,596 (14.8%) |
| 26 to 34 Years | 16,734 (86.3%) | 2,647 (13.7%) |
| 35 to 44 Years | 13,945 (82.5%) | 2,960 (17.5%) |
| 45 to 54 Years | 11,852 (83.2%) | 2,392 (16.8%) |
| 55 to 64 Years | 11,844 (91.1%) | 1,160 (8.9%) |
| 65 to 74 Years | 8,518 (98.0%) | 175 (2.0%) |
| 75 Years and older | 5,527 (98.8%) | 67 (1.2%) |
| Total | 99,134 (89.2%) | 11,982 (10.8%) |
Health Insurance Coverage by Citizenship Status in Costa Mesa
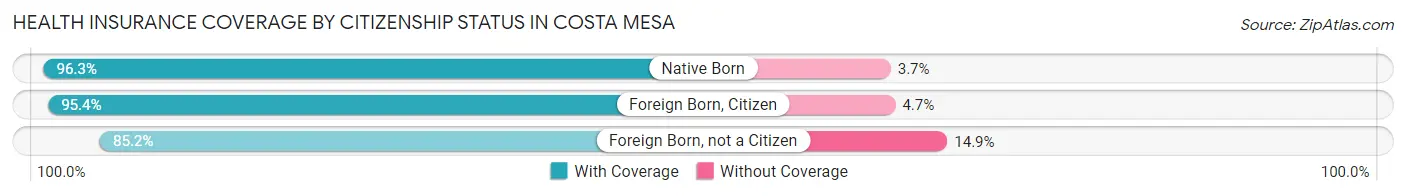
| Citizenship Status | With Coverage | Without Coverage |
| Native Born | 6,707 (96.3%) | 260 (3.7%) |
| Foreign Born, Citizen | 14,853 (95.4%) | 725 (4.6%) |
| Foreign Born, not a Citizen | 9,154 (85.2%) | 1,596 (14.8%) |
Health Insurance Coverage by Household Income in Costa Mesa
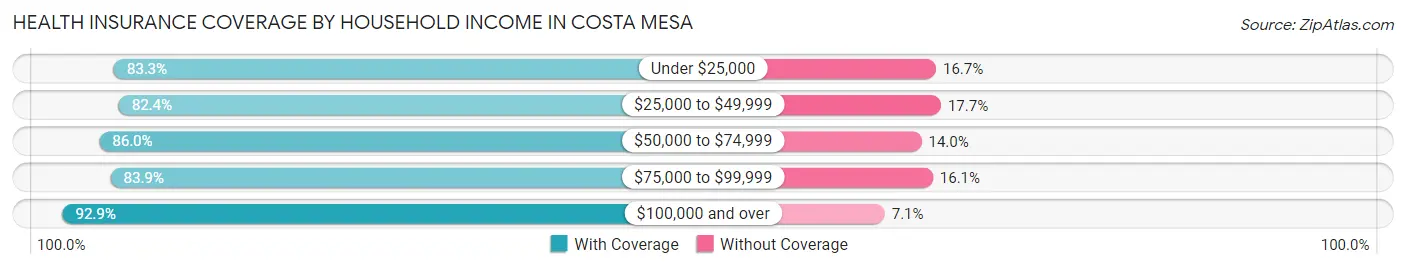
| Household Income | With Coverage | Without Coverage |
| Under $25,000 | 5,665 (83.3%) | 1,138 (16.7%) |
| $25,000 to $49,999 | 9,417 (82.4%) | 2,018 (17.6%) |
| $50,000 to $74,999 | 9,888 (86.0%) | 1,611 (14.0%) |
| $75,000 to $99,999 | 13,070 (83.9%) | 2,511 (16.1%) |
| $100,000 and over | 59,309 (92.9%) | 4,547 (7.1%) |
Public vs Private Health Insurance Coverage by Age in Costa Mesa
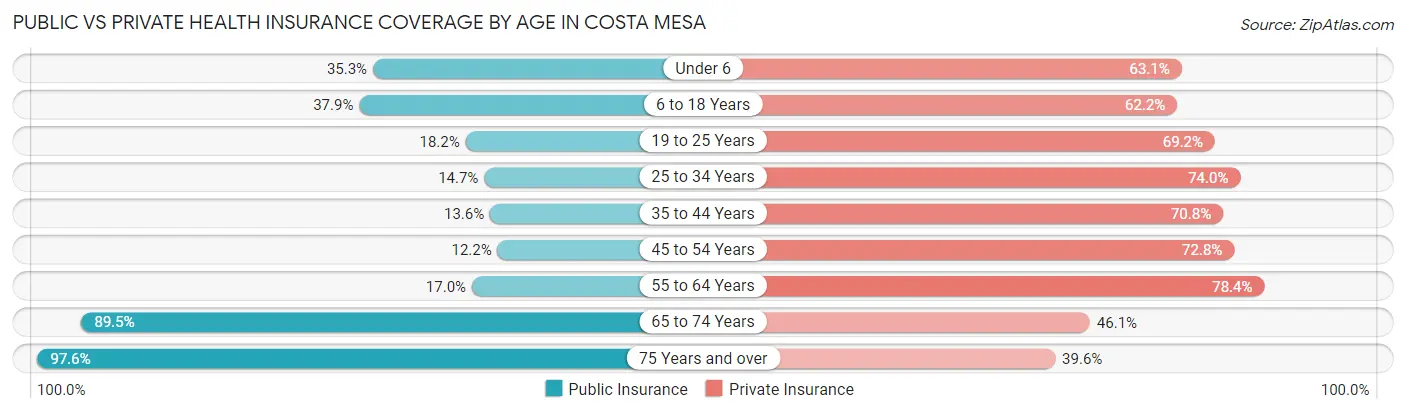
| Age Bracket | Public Insurance | Private Insurance |
| Under 6 | 2,462 (35.3%) | 4,395 (63.1%) |
| 6 to 18 Years | 5,902 (37.9%) | 9,696 (62.2%) |
| 19 to 25 Years | 1,952 (18.2%) | 7,443 (69.2%) |
| 25 to 34 Years | 2,847 (14.7%) | 14,333 (74.0%) |
| 35 to 44 Years | 2,301 (13.6%) | 11,961 (70.8%) |
| 45 to 54 Years | 1,739 (12.2%) | 10,373 (72.8%) |
| 55 to 64 Years | 2,207 (17.0%) | 10,197 (78.4%) |
| 65 to 74 Years | 7,778 (89.5%) | 4,003 (46.1%) |
| 75 Years and over | 5,462 (97.6%) | 2,215 (39.6%) |
| Total | 32,650 (29.4%) | 74,616 (67.1%) |
Disability Status by Sex by Age in Costa Mesa
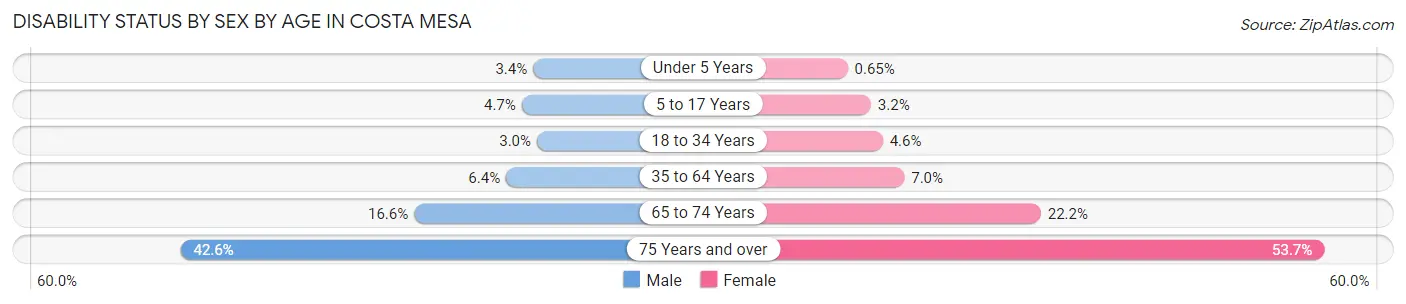
| Age Bracket | Male | Female |
| Under 5 Years | 99 (3.4%) | 19 (0.6%) |
| 5 to 17 Years | 352 (4.6%) | 247 (3.2%) |
| 18 to 34 Years | 500 (2.9%) | 668 (4.6%) |
| 35 to 64 Years | 1,485 (6.4%) | 1,454 (7.0%) |
| 65 to 74 Years | 711 (16.6%) | 979 (22.2%) |
| 75 Years and over | 988 (42.6%) | 1,760 (53.7%) |
Disability Class by Sex by Age in Costa Mesa
Disability Class: Hearing Difficulty
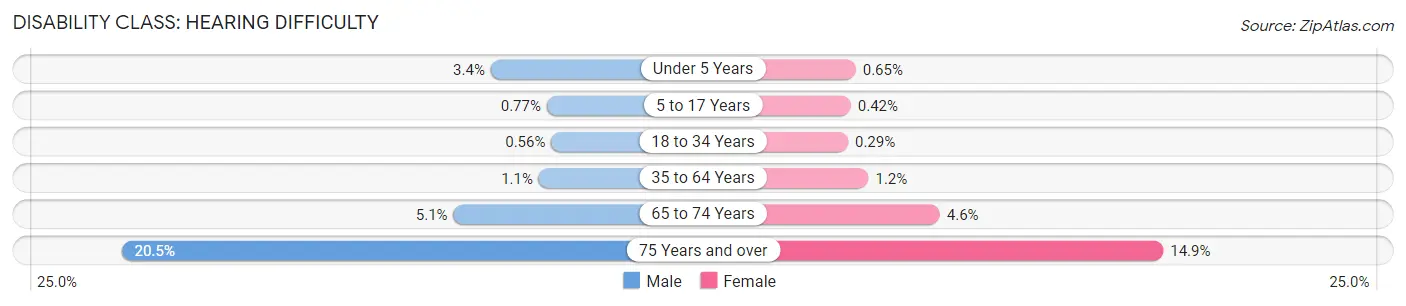
| Age Bracket | Male | Female |
| Under 5 Years | 99 (3.4%) | 19 (0.6%) |
| 5 to 17 Years | 58 (0.8%) | 32 (0.4%) |
| 18 to 34 Years | 95 (0.6%) | 43 (0.3%) |
| 35 to 64 Years | 264 (1.1%) | 259 (1.2%) |
| 65 to 74 Years | 218 (5.1%) | 201 (4.5%) |
| 75 Years and over | 475 (20.5%) | 489 (14.9%) |
Disability Class: Vision Difficulty
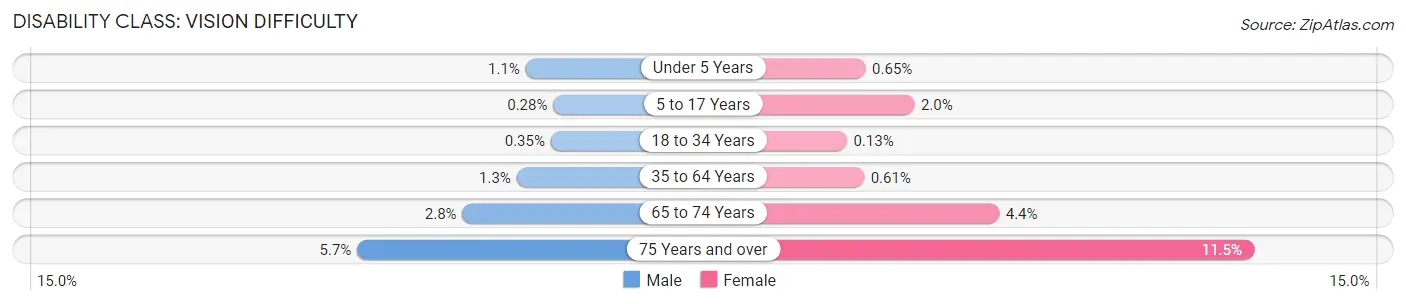
| Age Bracket | Male | Female |
| Under 5 Years | 31 (1.1%) | 19 (0.6%) |
| 5 to 17 Years | 21 (0.3%) | 153 (2.0%) |
| 18 to 34 Years | 60 (0.4%) | 19 (0.1%) |
| 35 to 64 Years | 303 (1.3%) | 127 (0.6%) |
| 65 to 74 Years | 120 (2.8%) | 193 (4.4%) |
| 75 Years and over | 133 (5.7%) | 376 (11.5%) |
Disability Class: Cognitive Difficulty
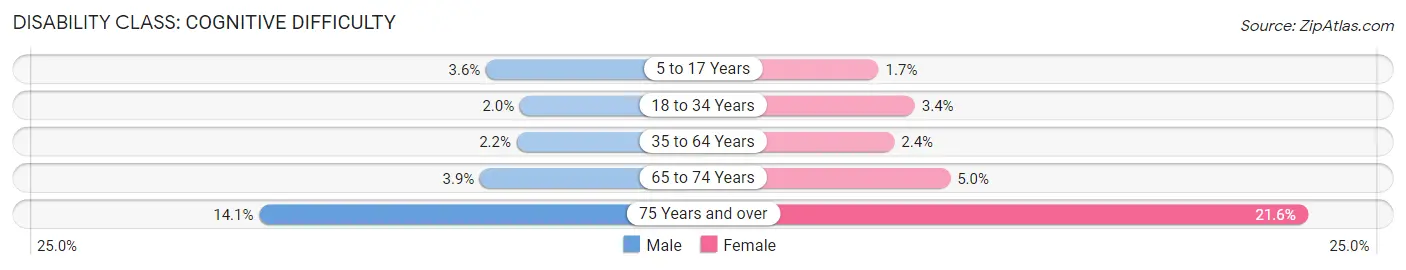
| Age Bracket | Male | Female |
| 5 to 17 Years | 271 (3.6%) | 130 (1.7%) |
| 18 to 34 Years | 341 (2.0%) | 496 (3.4%) |
| 35 to 64 Years | 503 (2.2%) | 510 (2.4%) |
| 65 to 74 Years | 165 (3.9%) | 222 (5.0%) |
| 75 Years and over | 327 (14.1%) | 708 (21.6%) |
Disability Class: Ambulatory Difficulty
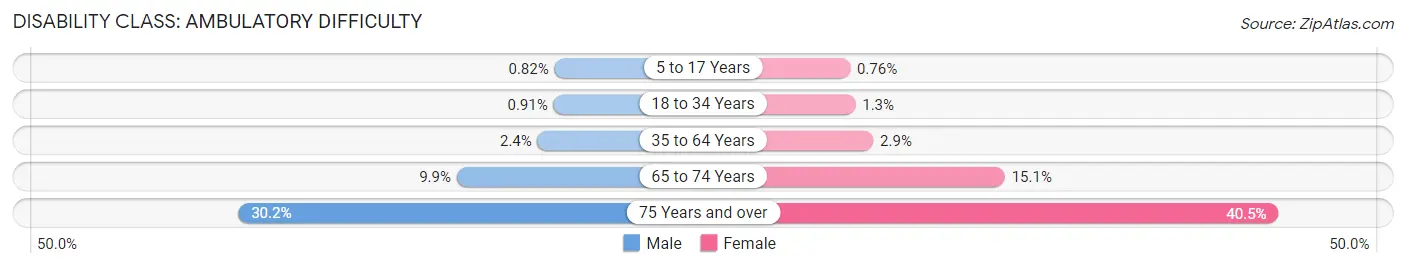
| Age Bracket | Male | Female |
| 5 to 17 Years | 62 (0.8%) | 58 (0.8%) |
| 18 to 34 Years | 155 (0.9%) | 183 (1.3%) |
| 35 to 64 Years | 555 (2.4%) | 609 (2.9%) |
| 65 to 74 Years | 423 (9.9%) | 668 (15.1%) |
| 75 Years and over | 699 (30.2%) | 1,328 (40.5%) |
Disability Class: Self-Care Difficulty
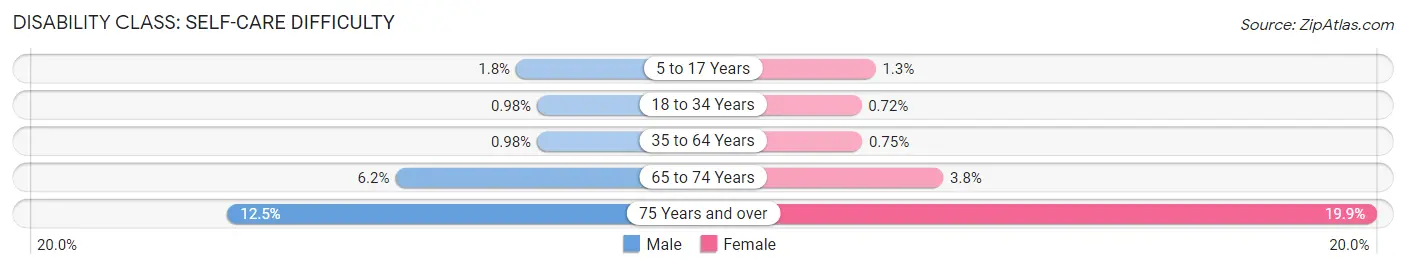
| Age Bracket | Male | Female |
| 5 to 17 Years | 133 (1.8%) | 95 (1.3%) |
| 18 to 34 Years | 167 (1.0%) | 105 (0.7%) |
| 35 to 64 Years | 229 (1.0%) | 157 (0.7%) |
| 65 to 74 Years | 267 (6.2%) | 166 (3.8%) |
| 75 Years and over | 289 (12.5%) | 651 (19.9%) |
Technology Access in Costa Mesa
Computing Device Access in Costa Mesa
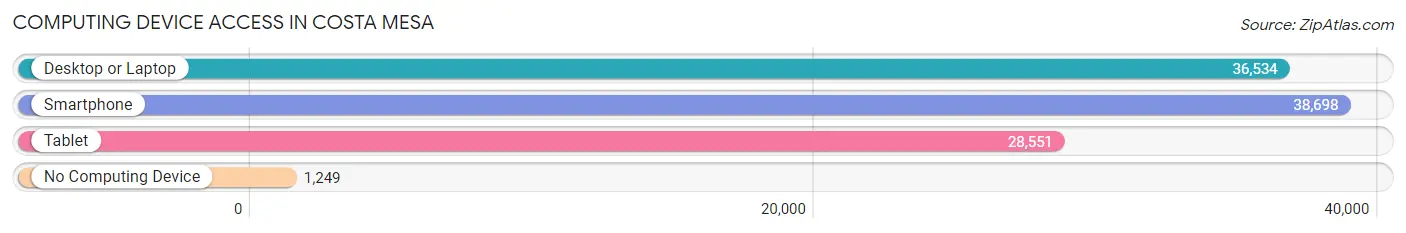
| Device Type | # Households | % Households |
| Desktop or Laptop | 36,534 | 88.2% |
| Smartphone | 38,698 | 93.5% |
| Tablet | 28,551 | 69.0% |
| No Computing Device | 1,249 | 3.0% |
| Total | 41,407 | 100.0% |
Internet Access in Costa Mesa
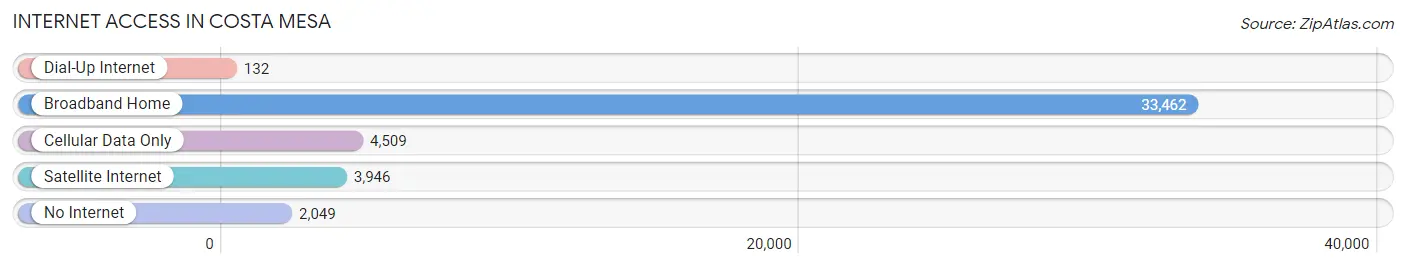
| Internet Type | # Households | % Households |
| Dial-Up Internet | 132 | 0.3% |
| Broadband Home | 33,462 | 80.8% |
| Cellular Data Only | 4,509 | 10.9% |
| Satellite Internet | 3,946 | 9.5% |
| No Internet | 2,049 | 5.0% |
| Total | 41,407 | 100.0% |
Costa Mesa Summary
Costa Mesa is a city located in Orange County, California. It is bordered by Newport Beach to the west, Irvine to the north, and Huntington Beach to the south. The city is home to a population of approximately 113,000 people, making it the 15th most populous city in Orange County.
Geography
Costa Mesa is located in the southern part of Orange County, California. It is bordered by Newport Beach to the west, Irvine to the north, and Huntington Beach to the south. The city covers an area of 15.7 square miles, with a population density of 7,200 people per square mile. The city is located at an elevation of 56 feet above sea level.
The city is located in a Mediterranean climate zone, with mild temperatures year-round. The average high temperature in the summer is around 78 degrees Fahrenheit, while the average low temperature in the winter is around 50 degrees Fahrenheit. The city receives an average of 13 inches of rain per year.
Economy
Costa Mesa is home to a diverse economy, with a variety of industries represented. The city is home to several large employers, including Experian, Hyundai Motor America, and Pacific Life Insurance. The city is also home to several smaller businesses, including restaurants, retail stores, and professional services.
The city’s economy is largely driven by the service industry, which accounts for approximately 60% of the city’s total employment. The city is also home to a number of manufacturing and technology companies, including Experian, Hyundai Motor America, and Pacific Life Insurance.
Demographics
As of the 2020 census, Costa Mesa had a population of 113,000 people. The city has a median age of 37.7 years, with a gender ratio of 49.7% male and 50.3% female. The city is racially diverse, with a population that is 44.3% White, 4.3% African American, 0.7% Native American, 28.2% Asian, 0.3% Pacific Islander, and 22.2% from other races.
The city has a median household income of $76,000, with a poverty rate of 8.3%. The city is home to a large number of college-educated residents, with 44.3% of the population having a bachelor’s degree or higher.
Conclusion
Costa Mesa is a city located in Orange County, California. It is bordered by Newport Beach to the west, Irvine to the north, and Huntington Beach to the south. The city is home to a population of approximately 113,000 people, making it the 15th most populous city in Orange County. The city is located in a Mediterranean climate zone, with mild temperatures year-round. The city’s economy is largely driven by the service industry, which accounts for approximately 60% of the city’s total employment. The city is racially diverse, with a population that is 44.3% White, 4.3% African American, 0.7% Native American, 28.2% Asian, 0.3% Pacific Islander, and 22.2% from other races. The city has a median household income of $76,000, with a poverty rate of 8.3%. Costa Mesa is a vibrant city with a diverse economy and population.
Common Questions
What is Per Capita Income in Costa Mesa?
Per Capita income in Costa Mesa is $53,888.
What is the Median Family Income in Costa Mesa?
Median Family Income in Costa Mesa is $115,798.
What is the Median Household income in Costa Mesa?
Median Household Income in Costa Mesa is $104,981.
What is Income or Wage Gap in Costa Mesa?
Income or Wage Gap in Costa Mesa is 20.4%.
Women in Costa Mesa earn 79.6 cents for every dollar earned by a man.
What is Family Income Deficit in Costa Mesa?
Family Income Deficit in Costa Mesa is $11,531.
Families that are below poverty line in Costa Mesa earn $11,531 less on average than the poverty threshold level.
What is Inequality or Gini Index in Costa Mesa?
Inequality or Gini Index in Costa Mesa is 0.45.
What is the Total Population of Costa Mesa?
Total Population of Costa Mesa is 111,490.
What is the Total Male Population of Costa Mesa?
Total Male Population of Costa Mesa is 57,488.
What is the Total Female Population of Costa Mesa?
Total Female Population of Costa Mesa is 54,002.
What is the Ratio of Males per 100 Females in Costa Mesa?
There are 106.46 Males per 100 Females in Costa Mesa.
What is the Ratio of Females per 100 Males in Costa Mesa?
There are 93.94 Females per 100 Males in Costa Mesa.
What is the Median Population Age in Costa Mesa?
Median Population Age in Costa Mesa is 36.4 Years.
What is the Average Family Size in Costa Mesa
Average Family Size in Costa Mesa is 3.2 People.
What is the Average Household Size in Costa Mesa
Average Household Size in Costa Mesa is 2.6 People.
How Large is the Labor Force in Costa Mesa?
There are 67,880 People in the Labor Forcein in Costa Mesa.
What is the Percentage of People in the Labor Force in Costa Mesa?
73.2% of People are in the Labor Force in Costa Mesa.
What is the Unemployment Rate in Costa Mesa?
Unemployment Rate in Costa Mesa is 5.0%.