Lake Forest, CA Map & Demographics
Lake Forest Map
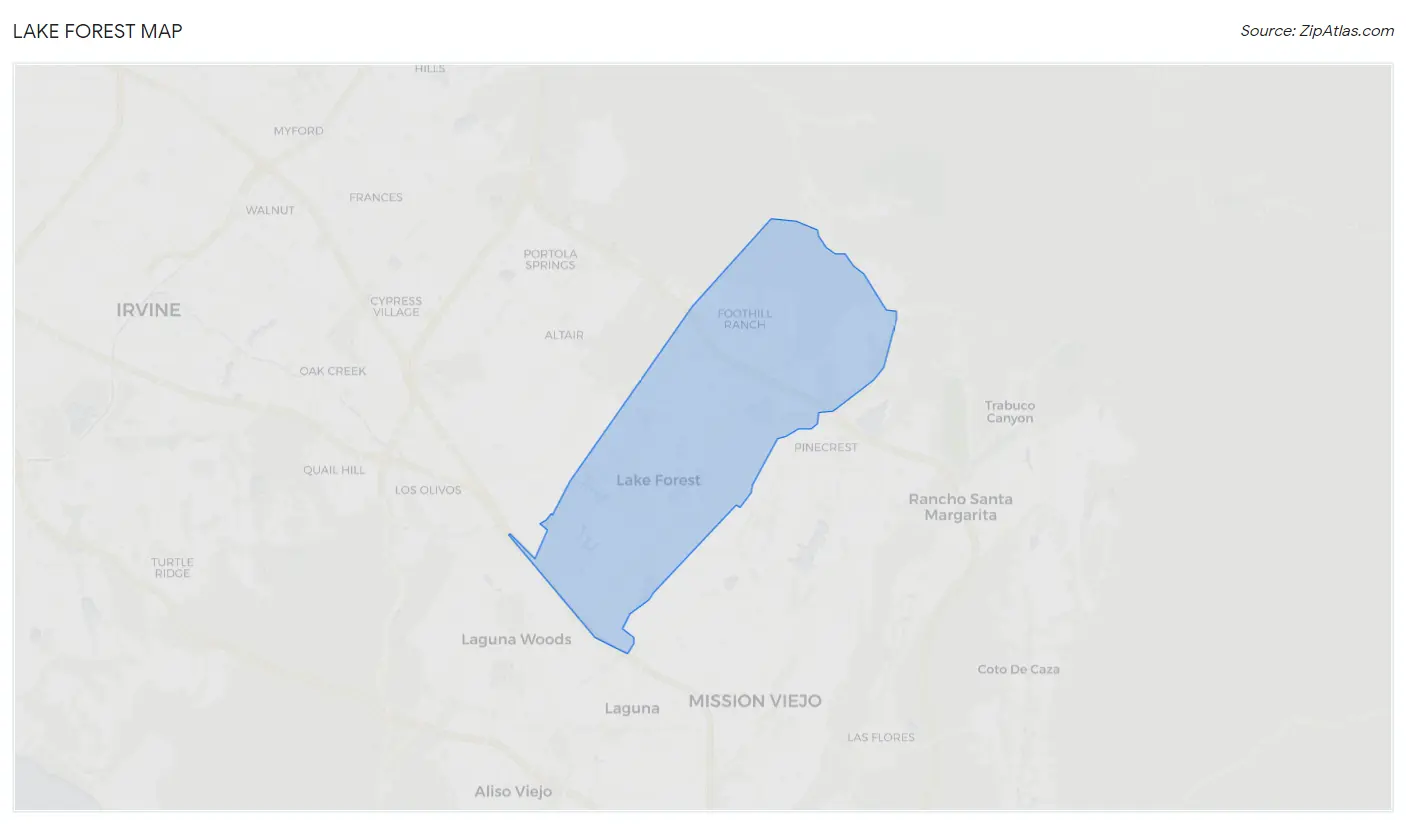
Lake Forest Overview
$56,627
PER CAPITA INCOME
$147,450
AVG FAMILY INCOME
$128,358
AVG HOUSEHOLD INCOME
35.7%
WAGE / INCOME GAP [ % ]
64.3¢/ $1
WAGE / INCOME GAP [ $ ]
$10,731
FAMILY INCOME DEFICIT
0.41
INEQUALITY / GINI INDEX
85,583
TOTAL POPULATION
42,347
MALE POPULATION
43,236
FEMALE POPULATION
97.94
MALES / 100 FEMALES
102.10
FEMALES / 100 MALES
40.0
MEDIAN AGE
3.3
AVG FAMILY SIZE
2.8
AVG HOUSEHOLD SIZE
48,547
LABOR FORCE [ PEOPLE ]
69.2%
PERCENT IN LABOR FORCE
5.0%
UNEMPLOYMENT RATE
Lake Forest Zip Codes
Income in Lake Forest
Income Overview in Lake Forest
Per Capita Income in Lake Forest is $56,627, while median incomes of families and households are $147,450 and $128,358 respectively.
| Characteristic | Number | Measure |
| Per Capita Income | 85,583 | $56,627 |
| Median Family Income | 21,983 | $147,450 |
| Mean Family Income | 21,983 | $174,522 |
| Median Household Income | 30,298 | $128,358 |
| Mean Household Income | 30,298 | $156,759 |
| Income Deficit | 21,983 | $10,731 |
| Wage / Income Gap (%) | 85,583 | 35.67% |
| Wage / Income Gap ($) | 85,583 | 64.33¢ per $1 |
| Gini / Inequality Index | 85,583 | 0.41 |
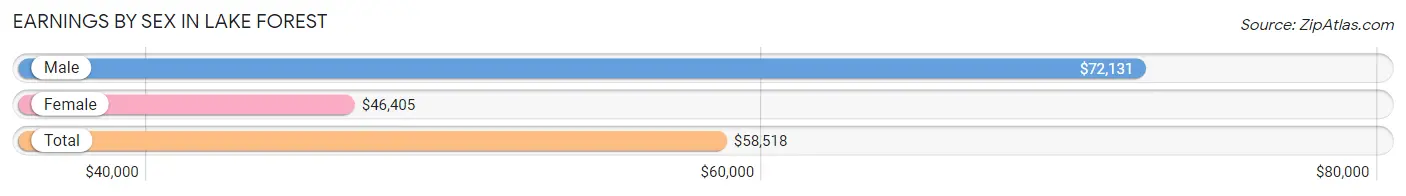
Earnings by Sex in Lake Forest
Average Earnings in Lake Forest are $58,518, $72,131 for men and $46,405 for women, a difference of 35.7%.
| Sex | Number | Average Earnings |
| Male | 26,695 (53.2%) | $72,131 |
| Female | 23,519 (46.8%) | $46,405 |
| Total | 50,214 (100.0%) | $58,518 |
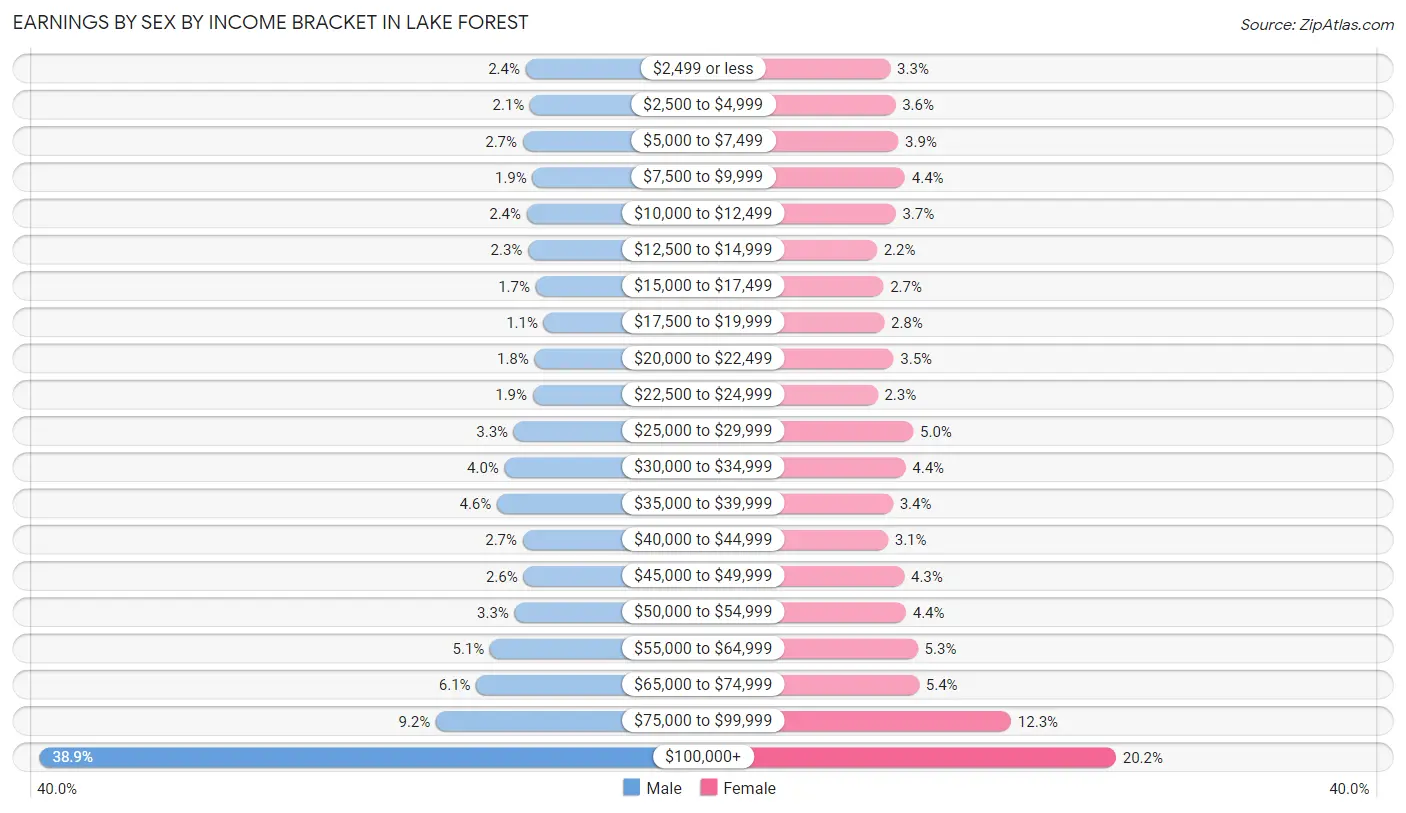
Earnings by Sex by Income Bracket in Lake Forest
The most common earnings brackets in Lake Forest are $100,000+ for men (10,380 | 38.9%) and $100,000+ for women (4,741 | 20.2%).
| Income | Male | Female |
| $2,499 or less | 651 (2.4%) | 765 (3.3%) |
| $2,500 to $4,999 | 563 (2.1%) | 853 (3.6%) |
| $5,000 to $7,499 | 711 (2.7%) | 905 (3.8%) |
| $7,500 to $9,999 | 514 (1.9%) | 1,023 (4.3%) |
| $10,000 to $12,499 | 630 (2.4%) | 858 (3.6%) |
| $12,500 to $14,999 | 604 (2.3%) | 526 (2.2%) |
| $15,000 to $17,499 | 451 (1.7%) | 641 (2.7%) |
| $17,500 to $19,999 | 292 (1.1%) | 656 (2.8%) |
| $20,000 to $22,499 | 474 (1.8%) | 821 (3.5%) |
| $22,500 to $24,999 | 509 (1.9%) | 540 (2.3%) |
| $25,000 to $29,999 | 890 (3.3%) | 1,168 (5.0%) |
| $30,000 to $34,999 | 1,074 (4.0%) | 1,033 (4.4%) |
| $35,000 to $39,999 | 1,224 (4.6%) | 808 (3.4%) |
| $40,000 to $44,999 | 710 (2.7%) | 722 (3.1%) |
| $45,000 to $49,999 | 697 (2.6%) | 1,008 (4.3%) |
| $50,000 to $54,999 | 872 (3.3%) | 1,040 (4.4%) |
| $55,000 to $64,999 | 1,364 (5.1%) | 1,248 (5.3%) |
| $65,000 to $74,999 | 1,639 (6.1%) | 1,269 (5.4%) |
| $75,000 to $99,999 | 2,446 (9.2%) | 2,894 (12.3%) |
| $100,000+ | 10,380 (38.9%) | 4,741 (20.2%) |
| Total | 26,695 (100.0%) | 23,519 (100.0%) |
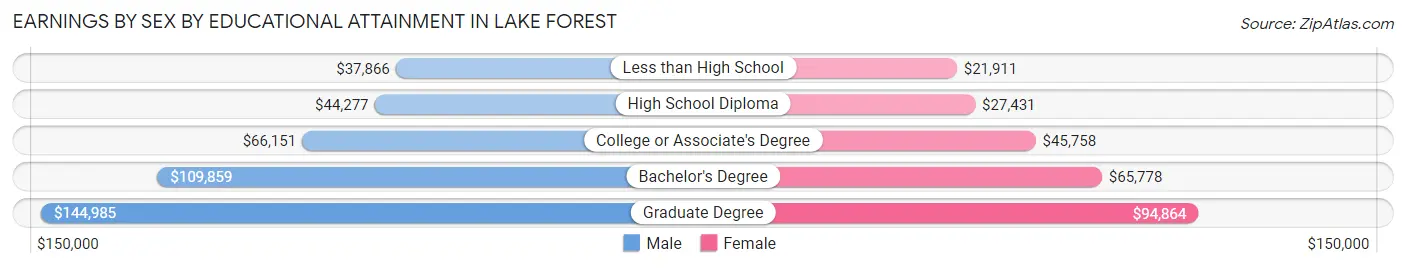
Earnings by Sex by Educational Attainment in Lake Forest
Average earnings in Lake Forest are $85,063 for men and $53,739 for women, a difference of 36.8%. Men with an educational attainment of graduate degree enjoy the highest average annual earnings of $144,985, while those with less than high school education earn the least with $37,866. Women with an educational attainment of graduate degree earn the most with the average annual earnings of $94,864, while those with less than high school education have the smallest earnings of $21,911.
| Educational Attainment | Male Income | Female Income |
| Less than High School | $37,866 | $21,911 |
| High School Diploma | $44,277 | $27,431 |
| College or Associate's Degree | $66,151 | $45,758 |
| Bachelor's Degree | $109,859 | $65,778 |
| Graduate Degree | $144,985 | $94,864 |
| Total | $85,063 | $53,739 |
Family Income in Lake Forest
Family Income Brackets in Lake Forest
According to the Lake Forest family income data, there are 7,101 families falling into the $200,000+ income range, which is the most common income bracket and makes up 32.3% of all families. Conversely, the $10,000 to $14,999 income bracket is the least frequent group with only 176 families (0.8%) belonging to this category.
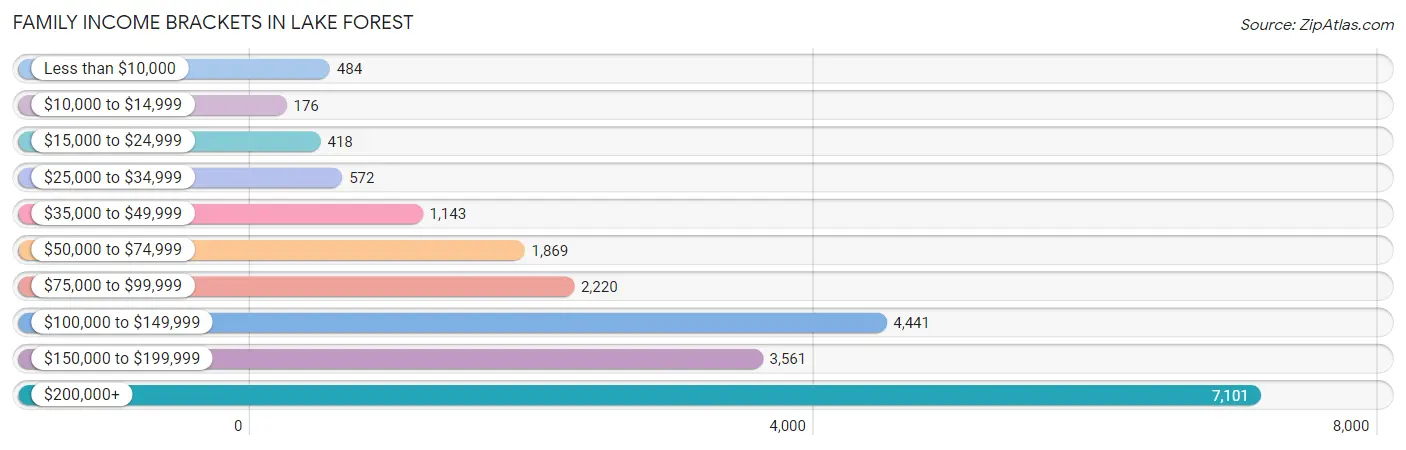
| Income Bracket | # Families | % Families |
| Less than $10,000 | 484 | 2.2% |
| $10,000 to $14,999 | 176 | 0.8% |
| $15,000 to $24,999 | 418 | 1.9% |
| $25,000 to $34,999 | 572 | 2.6% |
| $35,000 to $49,999 | 1,143 | 5.2% |
| $50,000 to $74,999 | 1,869 | 8.5% |
| $75,000 to $99,999 | 2,220 | 10.1% |
| $100,000 to $149,999 | 4,441 | 20.2% |
| $150,000 to $199,999 | 3,561 | 16.2% |
| $200,000+ | 7,101 | 32.3% |
Family Income by Famaliy Size in Lake Forest
4-person families (5,588 | 25.4%) account for the highest median family income in Lake Forest with $190,441 per family, while 2-person families (8,137 | 37.0%) have the highest median income of $64,018 per family member.
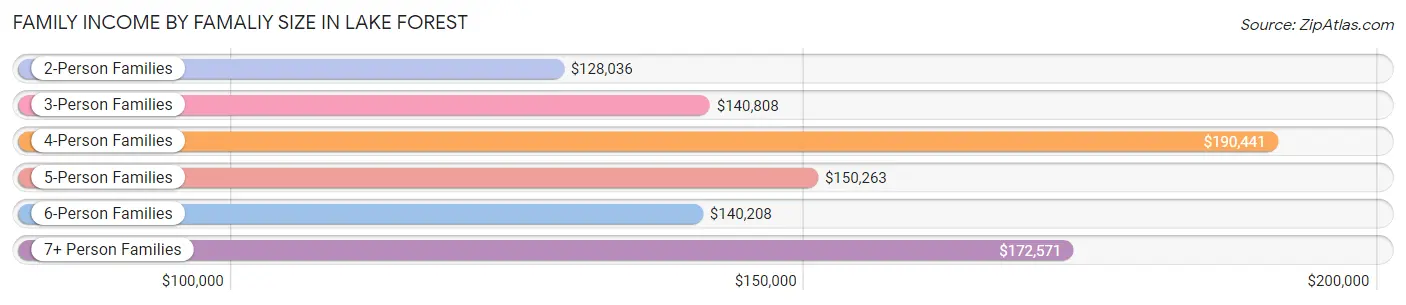
| Income Bracket | # Families | Median Income |
| 2-Person Families | 8,137 (37.0%) | $128,036 |
| 3-Person Families | 5,741 (26.1%) | $140,808 |
| 4-Person Families | 5,588 (25.4%) | $190,441 |
| 5-Person Families | 1,840 (8.4%) | $150,263 |
| 6-Person Families | 382 (1.7%) | $140,208 |
| 7+ Person Families | 295 (1.3%) | $172,571 |
| Total | 21,983 (100.0%) | $147,450 |
Family Income by Number of Earners in Lake Forest
The median family income in Lake Forest is $147,450, with families comprising 2 earners (9,967) having the highest median family income of $176,438, while families with no earners (1,980) have the lowest median family income of $71,000, accounting for 45.3% and 9.0% of families, respectively.
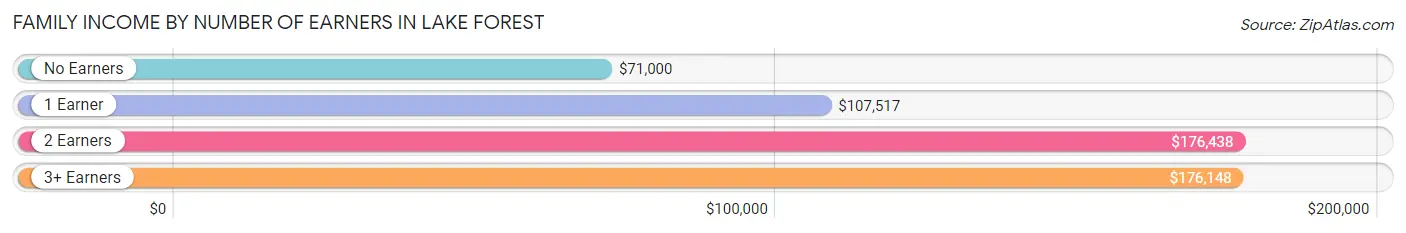
| Number of Earners | # Families | Median Income |
| No Earners | 1,980 (9.0%) | $71,000 |
| 1 Earner | 6,163 (28.0%) | $107,517 |
| 2 Earners | 9,967 (45.3%) | $176,438 |
| 3+ Earners | 3,873 (17.6%) | $176,148 |
| Total | 21,983 (100.0%) | $147,450 |
Household Income in Lake Forest
Household Income Brackets in Lake Forest
With 8,180 households falling in the category, the $200,000+ income range is the most frequent in Lake Forest, accounting for 27.0% of all households. In contrast, only 636 households (2.1%) fall into the $15,000 to $24,999 income bracket, making it the least populous group.
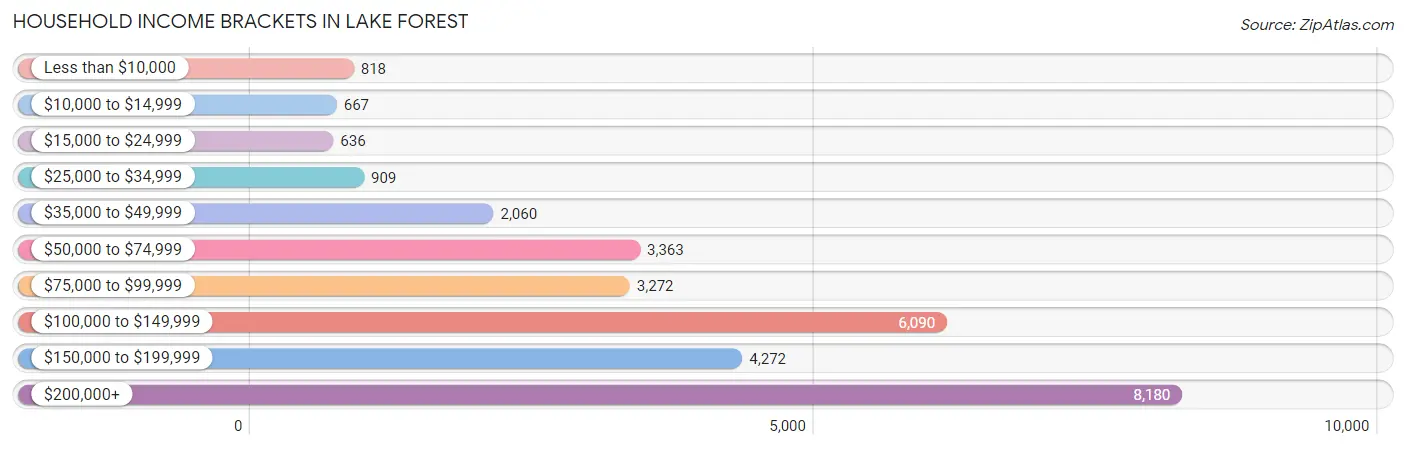
| Income Bracket | # Households | % Households |
| Less than $10,000 | 818 | 2.7% |
| $10,000 to $14,999 | 667 | 2.2% |
| $15,000 to $24,999 | 636 | 2.1% |
| $25,000 to $34,999 | 909 | 3.0% |
| $35,000 to $49,999 | 2,060 | 6.8% |
| $50,000 to $74,999 | 3,363 | 11.1% |
| $75,000 to $99,999 | 3,272 | 10.8% |
| $100,000 to $149,999 | 6,090 | 20.1% |
| $150,000 to $199,999 | 4,272 | 14.1% |
| $200,000+ | 8,180 | 27.0% |
Household Income by Householder Age in Lake Forest
The median household income in Lake Forest is $128,358, with the highest median household income of $147,500 found in the 45 to 64 years age bracket for the primary householder. A total of 13,146 households (43.4%) fall into this category. Meanwhile, the 15 to 24 years age bracket for the primary householder has the lowest median household income of $78,417, with 316 households (1.0%) in this group.
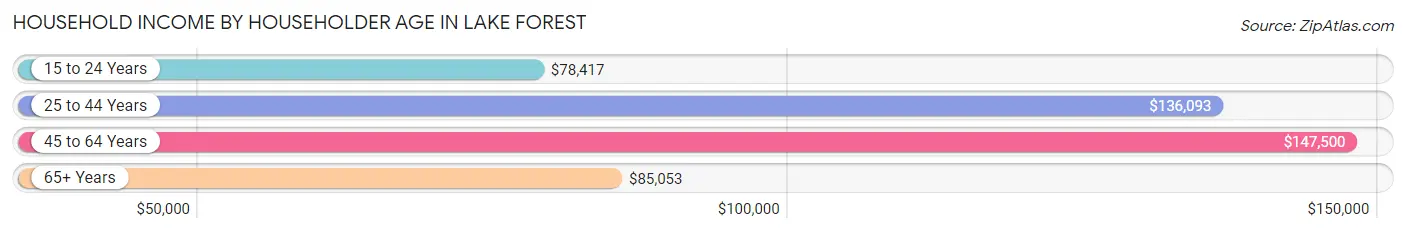
| Income Bracket | # Households | Median Income |
| 15 to 24 Years | 316 (1.0%) | $78,417 |
| 25 to 44 Years | 9,887 (32.6%) | $136,093 |
| 45 to 64 Years | 13,146 (43.4%) | $147,500 |
| 65+ Years | 6,949 (22.9%) | $85,053 |
| Total | 30,298 (100.0%) | $128,358 |
Poverty in Lake Forest
Income Below Poverty by Sex and Age in Lake Forest
With 6.4% poverty level for males and 8.2% for females among the residents of Lake Forest, 15 year old males and 15 year old females are the most vulnerable to poverty, with 77 males (16.0%) and 105 females (23.0%) in their respective age groups living below the poverty level.
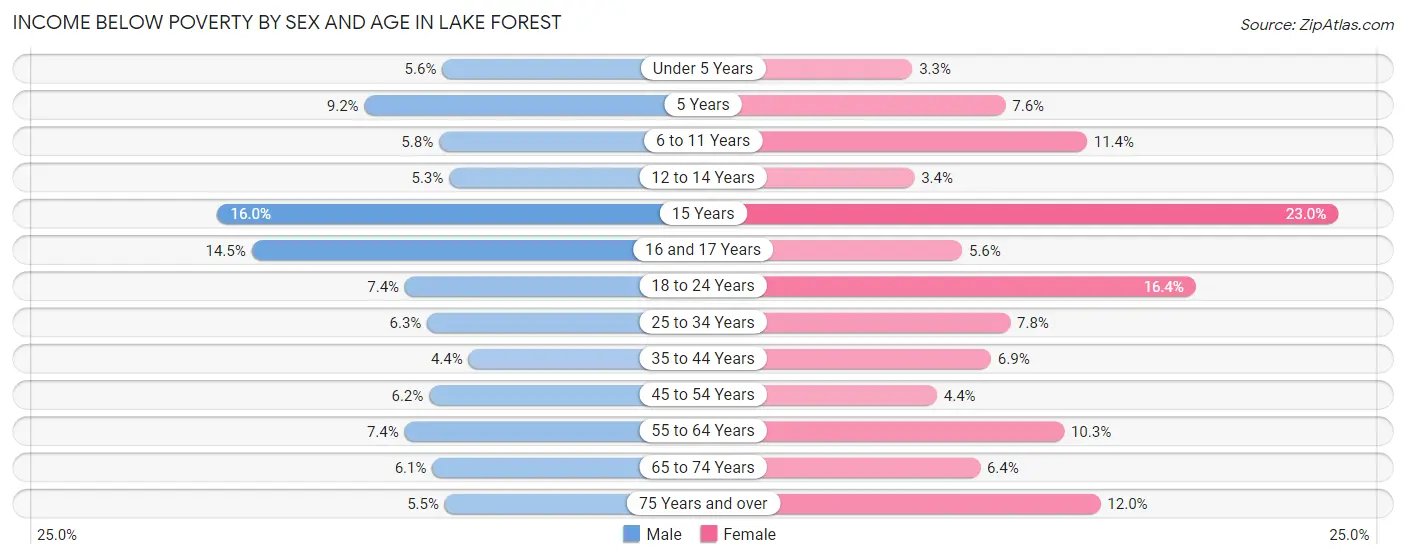
| Age Bracket | Male | Female |
| Under 5 Years | 163 (5.6%) | 81 (3.3%) |
| 5 Years | 36 (9.2%) | 42 (7.6%) |
| 6 to 11 Years | 182 (5.8%) | 272 (11.4%) |
| 12 to 14 Years | 71 (5.3%) | 39 (3.4%) |
| 15 Years | 77 (16.0%) | 105 (23.0%) |
| 16 and 17 Years | 155 (14.5%) | 55 (5.6%) |
| 18 to 24 Years | 280 (7.3%) | 526 (16.4%) |
| 25 to 34 Years | 351 (6.3%) | 471 (7.8%) |
| 35 to 44 Years | 279 (4.4%) | 454 (6.9%) |
| 45 to 54 Years | 427 (6.2%) | 286 (4.4%) |
| 55 to 64 Years | 384 (7.4%) | 616 (10.3%) |
| 65 to 74 Years | 223 (6.1%) | 266 (6.4%) |
| 75 Years and over | 81 (5.5%) | 312 (12.0%) |
| Total | 2,709 (6.4%) | 3,525 (8.2%) |
Income Above Poverty by Sex and Age in Lake Forest
According to the poverty statistics in Lake Forest, males aged 35 to 44 years and females aged under 5 years are the age groups that are most secure financially, with 95.6% of males and 96.7% of females in these age groups living above the poverty line.
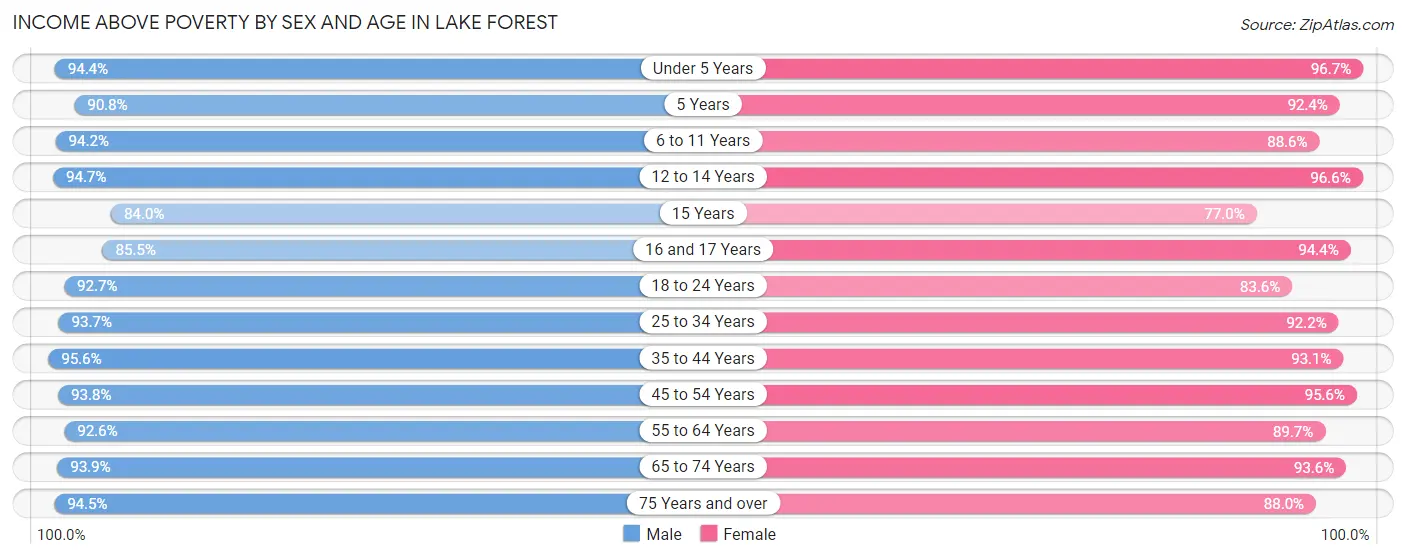
| Age Bracket | Male | Female |
| Under 5 Years | 2,738 (94.4%) | 2,398 (96.7%) |
| 5 Years | 354 (90.8%) | 511 (92.4%) |
| 6 to 11 Years | 2,970 (94.2%) | 2,121 (88.6%) |
| 12 to 14 Years | 1,269 (94.7%) | 1,121 (96.6%) |
| 15 Years | 403 (84.0%) | 351 (77.0%) |
| 16 and 17 Years | 916 (85.5%) | 930 (94.4%) |
| 18 to 24 Years | 3,529 (92.6%) | 2,678 (83.6%) |
| 25 to 34 Years | 5,205 (93.7%) | 5,556 (92.2%) |
| 35 to 44 Years | 6,061 (95.6%) | 6,109 (93.1%) |
| 45 to 54 Years | 6,429 (93.8%) | 6,200 (95.6%) |
| 55 to 64 Years | 4,824 (92.6%) | 5,360 (89.7%) |
| 65 to 74 Years | 3,445 (93.9%) | 3,886 (93.6%) |
| 75 Years and over | 1,393 (94.5%) | 2,289 (88.0%) |
| Total | 39,536 (93.6%) | 39,510 (91.8%) |
Income Below Poverty Among Married-Couple Families in Lake Forest
The poverty statistics for married-couple families in Lake Forest show that 2.9% or 532 of the total 18,090 families live below the poverty line. Families with 5 or more children have the highest poverty rate of 33.9%, comprising of 21 families. On the other hand, families with no children have the lowest poverty rate of 2.3%, which includes 224 families.
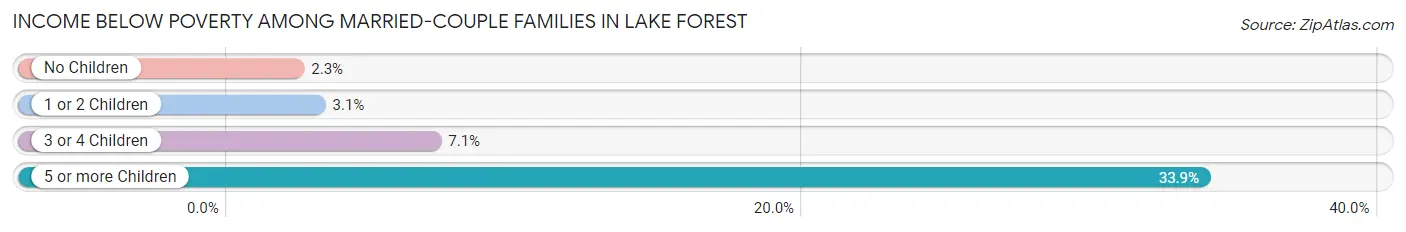
| Children | Above Poverty | Below Poverty |
| No Children | 9,492 (97.7%) | 224 (2.3%) |
| 1 or 2 Children | 7,251 (97.0%) | 228 (3.0%) |
| 3 or 4 Children | 774 (92.9%) | 59 (7.1%) |
| 5 or more Children | 41 (66.1%) | 21 (33.9%) |
| Total | 17,558 (97.1%) | 532 (2.9%) |
Income Below Poverty Among Single-Parent Households in Lake Forest
According to the poverty data in Lake Forest, 15.4% or 185 single-father households and 15.5% or 419 single-mother households are living below the poverty line. Among single-father households, those with 1 or 2 children have the highest poverty rate, with 98 households (26.1%) experiencing poverty. Likewise, among single-mother households, those with 3 or 4 children have the highest poverty rate, with 25 households (49.0%) falling below the poverty line.
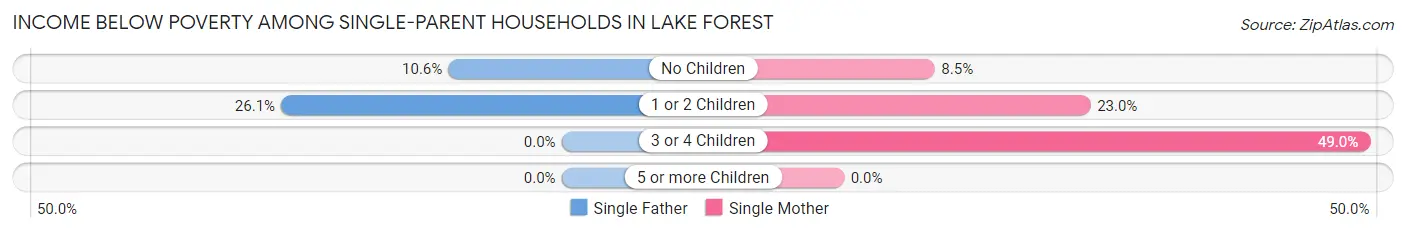
| Children | Single Father | Single Mother |
| No Children | 87 (10.6%) | 124 (8.5%) |
| 1 or 2 Children | 98 (26.1%) | 270 (23.0%) |
| 3 or 4 Children | 0 (0.0%) | 25 (49.0%) |
| 5 or more Children | 0 (0.0%) | 0 (0.0%) |
| Total | 185 (15.4%) | 419 (15.5%) |
Income Below Poverty Among Married-Couple vs Single-Parent Households in Lake Forest
The poverty data for Lake Forest shows that 532 of the married-couple family households (2.9%) and 604 of the single-parent households (15.5%) are living below the poverty level. Within the married-couple family households, those with 5 or more children have the highest poverty rate, with 21 households (33.9%) falling below the poverty line. Among the single-parent households, those with 3 or 4 children have the highest poverty rate, with 25 household (49.0%) living below poverty.
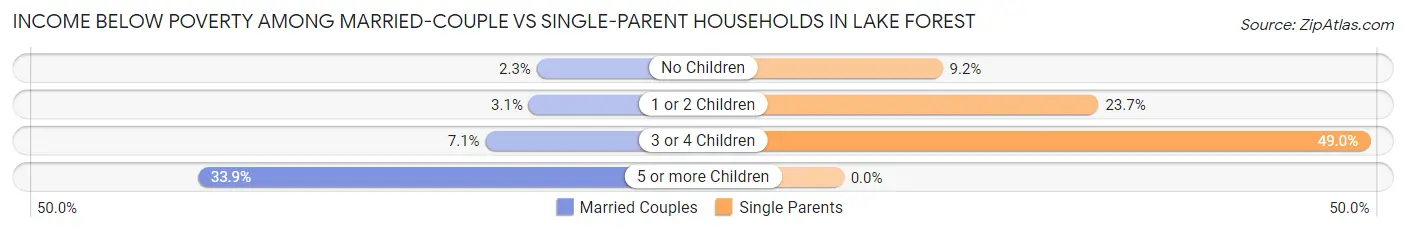
| Children | Married-Couple Families | Single-Parent Households |
| No Children | 224 (2.3%) | 211 (9.2%) |
| 1 or 2 Children | 228 (3.0%) | 368 (23.7%) |
| 3 or 4 Children | 59 (7.1%) | 25 (49.0%) |
| 5 or more Children | 21 (33.9%) | 0 (0.0%) |
| Total | 532 (2.9%) | 604 (15.5%) |
Race in Lake Forest
The most populous races in Lake Forest are White / Caucasian (47,958 | 56.0%), Hispanic or Latino (20,073 | 23.4%), and Asian (16,691 | 19.5%).
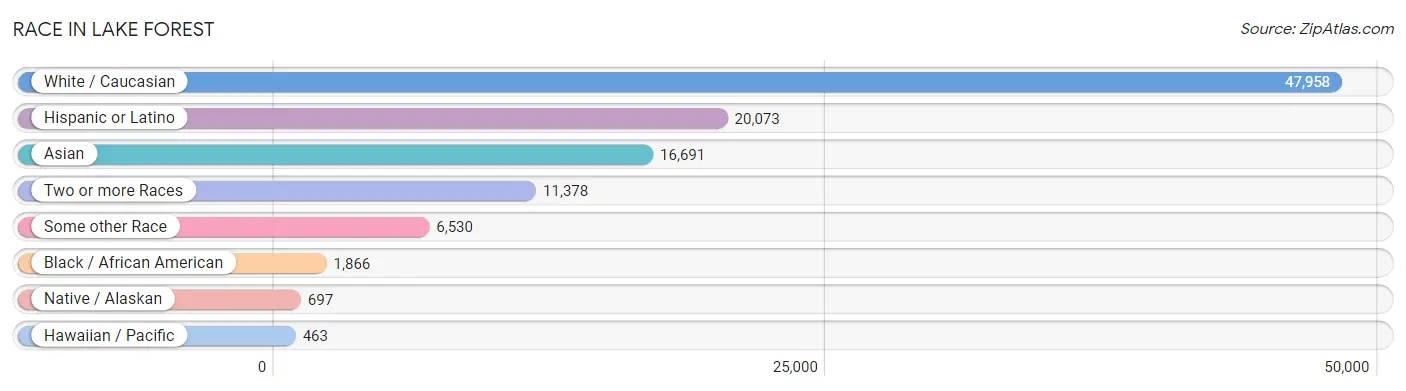
| Race | # Population | % Population |
| Asian | 16,691 | 19.5% |
| Black / African American | 1,866 | 2.2% |
| Hawaiian / Pacific | 463 | 0.5% |
| Hispanic or Latino | 20,073 | 23.4% |
| Native / Alaskan | 697 | 0.8% |
| White / Caucasian | 47,958 | 56.0% |
| Two or more Races | 11,378 | 13.3% |
| Some other Race | 6,530 | 7.6% |
| Total | 85,583 | 100.0% |
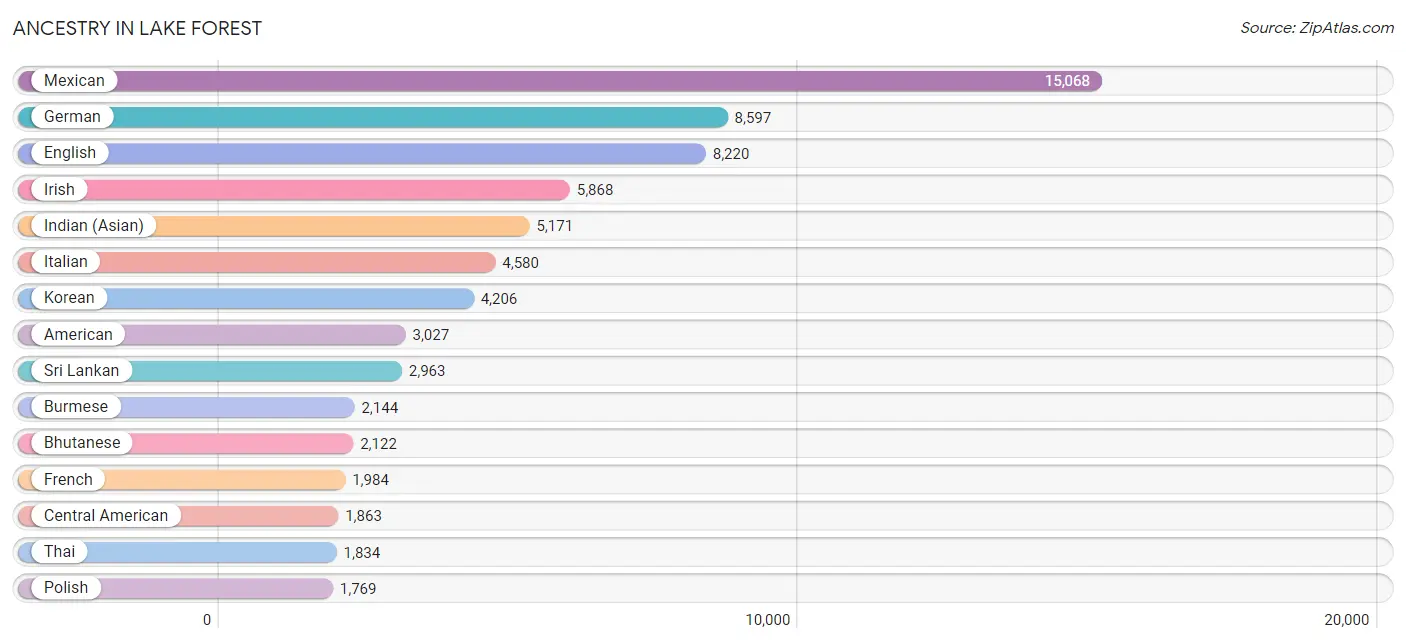
Ancestry in Lake Forest
The most populous ancestries reported in Lake Forest are Mexican (15,068 | 17.6%), German (8,597 | 10.1%), English (8,220 | 9.6%), Irish (5,868 | 6.9%), and Indian (Asian) (5,171 | 6.0%), together accounting for 50.2% of all Lake Forest residents.
| Ancestry | # Population | % Population |
| Afghan | 206 | 0.2% |
| African | 54 | 0.1% |
| American | 3,027 | 3.5% |
| Arab | 1,442 | 1.7% |
| Argentinean | 216 | 0.3% |
| Armenian | 116 | 0.1% |
| Assyrian / Chaldean / Syriac | 69 | 0.1% |
| Australian | 129 | 0.2% |
| Austrian | 261 | 0.3% |
| Bangladeshi | 9 | 0.0% |
| Barbadian | 13 | 0.0% |
| Basque | 24 | 0.0% |
| Belgian | 56 | 0.1% |
| Bhutanese | 2,122 | 2.5% |
| Bolivian | 230 | 0.3% |
| Brazilian | 33 | 0.0% |
| British | 773 | 0.9% |
| Bulgarian | 63 | 0.1% |
| Burmese | 2,144 | 2.5% |
| Cajun | 10 | 0.0% |
| Canadian | 142 | 0.2% |
| Central American | 1,863 | 2.2% |
| Central American Indian | 360 | 0.4% |
| Cherokee | 180 | 0.2% |
| Chilean | 52 | 0.1% |
| Chinese | 64 | 0.1% |
| Chippewa | 102 | 0.1% |
| Choctaw | 8 | 0.0% |
| Colombian | 212 | 0.3% |
| Costa Rican | 40 | 0.1% |
| Croatian | 354 | 0.4% |
| Cuban | 139 | 0.2% |
| Czech | 218 | 0.3% |
| Czechoslovakian | 18 | 0.0% |
| Danish | 411 | 0.5% |
| Delaware | 13 | 0.0% |
| Dominican | 47 | 0.1% |
| Dutch | 689 | 0.8% |
| Eastern European | 472 | 0.5% |
| Ecuadorian | 278 | 0.3% |
| Egyptian | 758 | 0.9% |
| English | 8,220 | 9.6% |
| European | 1,741 | 2.0% |
| Filipino | 797 | 0.9% |
| Finnish | 173 | 0.2% |
| French | 1,984 | 2.3% |
| French Canadian | 642 | 0.7% |
| German | 8,597 | 10.1% |
| Ghanaian | 75 | 0.1% |
| Greek | 526 | 0.6% |
| Guamanian / Chamorro | 24 | 0.0% |
| Guatemalan | 826 | 1.0% |
| Honduran | 111 | 0.1% |
| Hungarian | 354 | 0.4% |
| Indian (Asian) | 5,171 | 6.0% |
| Indonesian | 95 | 0.1% |
| Iranian | 1,492 | 1.7% |
| Irish | 5,868 | 6.9% |
| Iroquois | 13 | 0.0% |
| Israeli | 15 | 0.0% |
| Italian | 4,580 | 5.3% |
| Jamaican | 12 | 0.0% |
| Japanese | 211 | 0.3% |
| Jordanian | 218 | 0.3% |
| Kenyan | 30 | 0.0% |
| Korean | 4,206 | 4.9% |
| Laotian | 344 | 0.4% |
| Lebanese | 255 | 0.3% |
| Lithuanian | 163 | 0.2% |
| Luxembourger | 4 | 0.0% |
| Macedonian | 11 | 0.0% |
| Malaysian | 310 | 0.4% |
| Mexican | 15,068 | 17.6% |
| Mexican American Indian | 239 | 0.3% |
| Moroccan | 7 | 0.0% |
| Native Hawaiian | 233 | 0.3% |
| New Zealander | 11 | 0.0% |
| Nicaraguan | 36 | 0.0% |
| Northern European | 273 | 0.3% |
| Norwegian | 1,214 | 1.4% |
| Pakistani | 709 | 0.8% |
| Palestinian | 43 | 0.1% |
| Panamanian | 149 | 0.2% |
| Pennsylvania German | 9 | 0.0% |
| Peruvian | 523 | 0.6% |
| Polish | 1,769 | 2.1% |
| Portuguese | 482 | 0.6% |
| Pueblo | 22 | 0.0% |
| Puerto Rican | 692 | 0.8% |
| Romanian | 139 | 0.2% |
| Russian | 848 | 1.0% |
| Salvadoran | 701 | 0.8% |
| Samoan | 26 | 0.0% |
| Scandinavian | 293 | 0.3% |
| Scotch-Irish | 434 | 0.5% |
| Scottish | 1,533 | 1.8% |
| Serbian | 65 | 0.1% |
| Slovak | 37 | 0.0% |
| South African | 141 | 0.2% |
| South American | 1,546 | 1.8% |
| Spaniard | 281 | 0.3% |
| Spanish | 279 | 0.3% |
| Sri Lankan | 2,963 | 3.5% |
| Subsaharan African | 368 | 0.4% |
| Swedish | 1,184 | 1.4% |
| Swiss | 449 | 0.5% |
| Syrian | 97 | 0.1% |
| Thai | 1,834 | 2.1% |
| Tongan | 24 | 0.0% |
| Turkish | 137 | 0.2% |
| U.S. Virgin Islander | 5 | 0.0% |
| Ukrainian | 203 | 0.2% |
| Venezuelan | 35 | 0.0% |
| Welsh | 529 | 0.6% |
| Yaqui | 8 | 0.0% |
| Yugoslavian | 53 | 0.1% |
| Zimbabwean | 53 | 0.1% | View All 117 Rows |
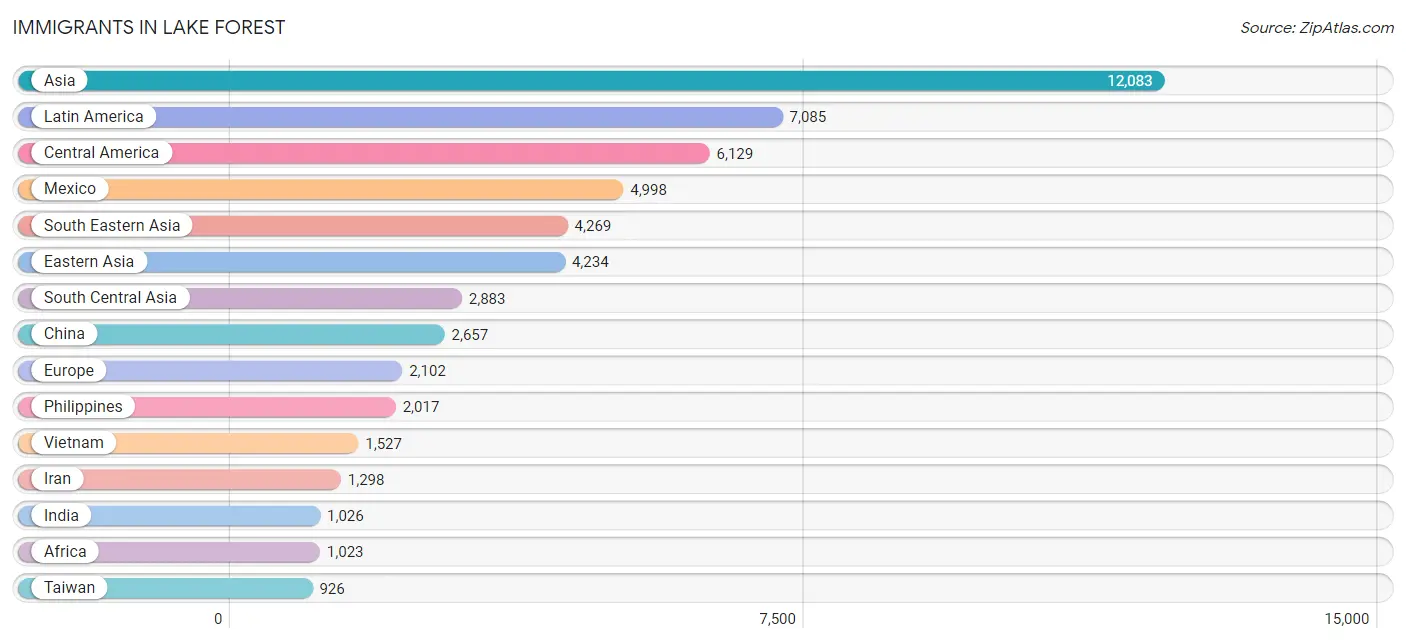
Immigrants in Lake Forest
The most numerous immigrant groups reported in Lake Forest came from Asia (12,083 | 14.1%), Latin America (7,085 | 8.3%), Central America (6,129 | 7.2%), Mexico (4,998 | 5.8%), and South Eastern Asia (4,269 | 5.0%), together accounting for 40.4% of all Lake Forest residents.
| Immigration Origin | # Population | % Population |
| Afghanistan | 229 | 0.3% |
| Africa | 1,023 | 1.2% |
| Argentina | 202 | 0.2% |
| Armenia | 50 | 0.1% |
| Asia | 12,083 | 14.1% |
| Australia | 65 | 0.1% |
| Barbados | 13 | 0.0% |
| Belgium | 18 | 0.0% |
| Bolivia | 59 | 0.1% |
| Bosnia and Herzegovina | 30 | 0.0% |
| Brazil | 88 | 0.1% |
| Bulgaria | 33 | 0.0% |
| Cambodia | 8 | 0.0% |
| Canada | 326 | 0.4% |
| Caribbean | 59 | 0.1% |
| Central America | 6,129 | 7.2% |
| Chile | 25 | 0.0% |
| China | 2,657 | 3.1% |
| Colombia | 60 | 0.1% |
| Costa Rica | 40 | 0.1% |
| Cuba | 13 | 0.0% |
| Czechoslovakia | 17 | 0.0% |
| Dominican Republic | 22 | 0.0% |
| Eastern Africa | 111 | 0.1% |
| Eastern Asia | 4,234 | 5.0% |
| Eastern Europe | 889 | 1.0% |
| Ecuador | 88 | 0.1% |
| Egypt | 630 | 0.7% |
| El Salvador | 411 | 0.5% |
| England | 237 | 0.3% |
| Ethiopia | 11 | 0.0% |
| Europe | 2,102 | 2.5% |
| Fiji | 176 | 0.2% |
| France | 113 | 0.1% |
| Germany | 366 | 0.4% |
| Ghana | 36 | 0.0% |
| Greece | 55 | 0.1% |
| Guatemala | 513 | 0.6% |
| Honduras | 65 | 0.1% |
| Hong Kong | 319 | 0.4% |
| Hungary | 14 | 0.0% |
| India | 1,026 | 1.2% |
| Indonesia | 245 | 0.3% |
| Iran | 1,298 | 1.5% |
| Iraq | 10 | 0.0% |
| Ireland | 7 | 0.0% |
| Israel | 36 | 0.0% |
| Italy | 193 | 0.2% |
| Japan | 698 | 0.8% |
| Jordan | 43 | 0.1% |
| Kenya | 30 | 0.0% |
| Korea | 879 | 1.0% |
| Kuwait | 65 | 0.1% |
| Laos | 155 | 0.2% |
| Latin America | 7,085 | 8.3% |
| Lebanon | 81 | 0.1% |
| Malaysia | 31 | 0.0% |
| Mexico | 4,998 | 5.8% |
| Morocco | 17 | 0.0% |
| Netherlands | 31 | 0.0% |
| Northern Africa | 647 | 0.8% |
| Northern Europe | 350 | 0.4% |
| Norway | 23 | 0.0% |
| Oceania | 338 | 0.4% |
| Pakistan | 275 | 0.3% |
| Panama | 102 | 0.1% |
| Peru | 375 | 0.4% |
| Philippines | 2,017 | 2.4% |
| Poland | 364 | 0.4% |
| Portugal | 16 | 0.0% |
| Romania | 47 | 0.1% |
| Russia | 277 | 0.3% |
| Saudi Arabia | 16 | 0.0% |
| Scotland | 9 | 0.0% |
| Singapore | 62 | 0.1% |
| South Africa | 229 | 0.3% |
| South America | 897 | 1.1% |
| South Central Asia | 2,883 | 3.4% |
| South Eastern Asia | 4,269 | 5.0% |
| Southern Europe | 274 | 0.3% |
| Spain | 10 | 0.0% |
| Sri Lanka | 55 | 0.1% |
| Sweden | 10 | 0.0% |
| Switzerland | 61 | 0.1% |
| Syria | 185 | 0.2% |
| Taiwan | 926 | 1.1% |
| Thailand | 159 | 0.2% |
| Trinidad and Tobago | 9 | 0.0% |
| Turkey | 154 | 0.2% |
| Uganda | 6 | 0.0% |
| Ukraine | 69 | 0.1% |
| Vietnam | 1,527 | 1.8% |
| West Indies | 2 | 0.0% |
| Western Africa | 36 | 0.0% |
| Western Asia | 692 | 0.8% |
| Western Europe | 589 | 0.7% |
| Zimbabwe | 53 | 0.1% | View All 97 Rows |
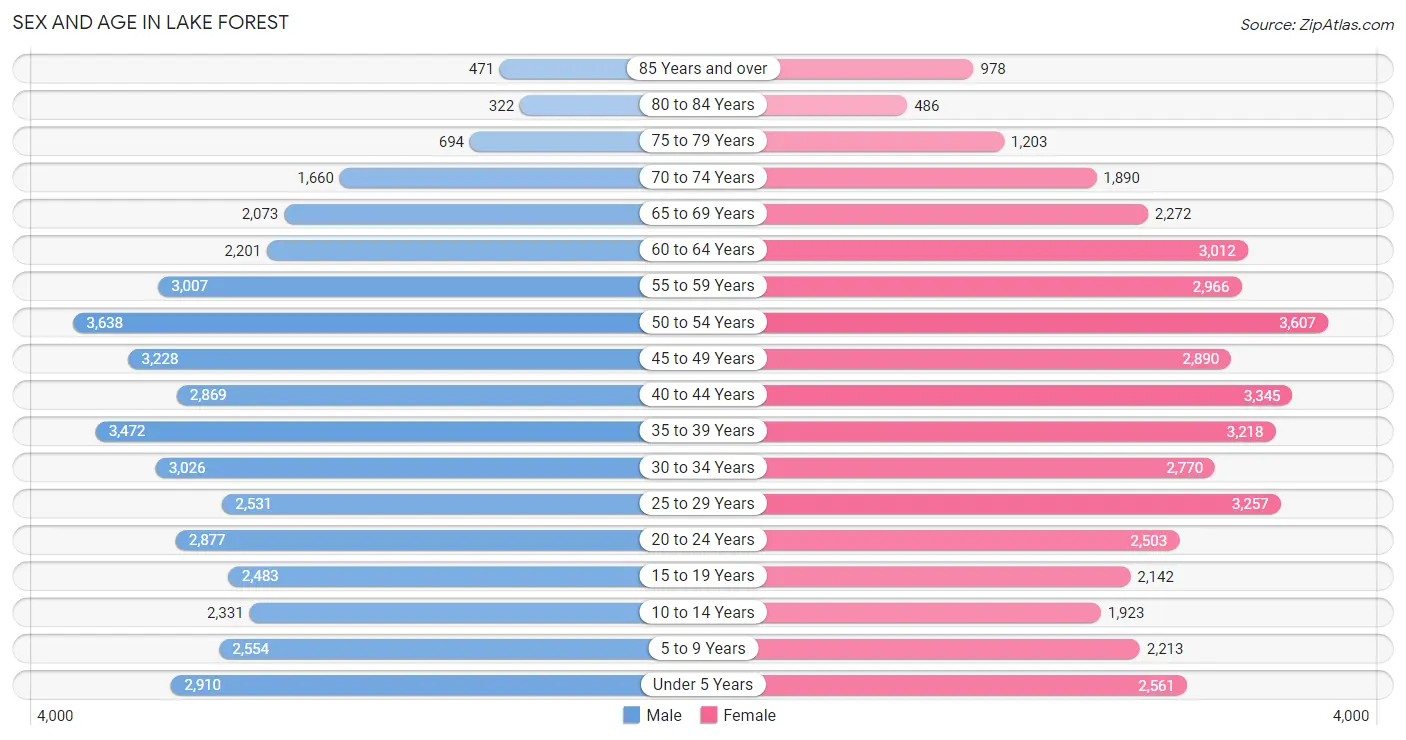
Sex and Age in Lake Forest
Sex and Age in Lake Forest
The most populous age groups in Lake Forest are 50 to 54 Years (3,638 | 8.6%) for men and 50 to 54 Years (3,607 | 8.3%) for women.
| Age Bracket | Male | Female |
| Under 5 Years | 2,910 (6.9%) | 2,561 (5.9%) |
| 5 to 9 Years | 2,554 (6.0%) | 2,213 (5.1%) |
| 10 to 14 Years | 2,331 (5.5%) | 1,923 (4.4%) |
| 15 to 19 Years | 2,483 (5.9%) | 2,142 (5.0%) |
| 20 to 24 Years | 2,877 (6.8%) | 2,503 (5.8%) |
| 25 to 29 Years | 2,531 (6.0%) | 3,257 (7.5%) |
| 30 to 34 Years | 3,026 (7.1%) | 2,770 (6.4%) |
| 35 to 39 Years | 3,472 (8.2%) | 3,218 (7.4%) |
| 40 to 44 Years | 2,869 (6.8%) | 3,345 (7.7%) |
| 45 to 49 Years | 3,228 (7.6%) | 2,890 (6.7%) |
| 50 to 54 Years | 3,638 (8.6%) | 3,607 (8.3%) |
| 55 to 59 Years | 3,007 (7.1%) | 2,966 (6.9%) |
| 60 to 64 Years | 2,201 (5.2%) | 3,012 (7.0%) |
| 65 to 69 Years | 2,073 (4.9%) | 2,272 (5.2%) |
| 70 to 74 Years | 1,660 (3.9%) | 1,890 (4.4%) |
| 75 to 79 Years | 694 (1.6%) | 1,203 (2.8%) |
| 80 to 84 Years | 322 (0.8%) | 486 (1.1%) |
| 85 Years and over | 471 (1.1%) | 978 (2.3%) |
| Total | 42,347 (100.0%) | 43,236 (100.0%) |
Families and Households in Lake Forest
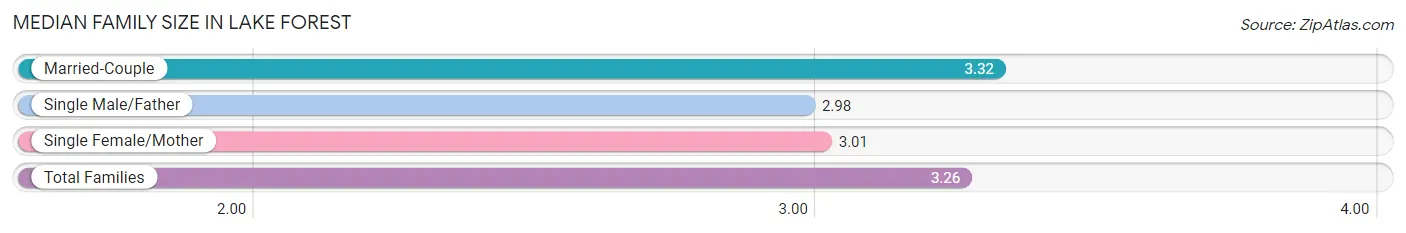
Median Family Size in Lake Forest
The median family size in Lake Forest is 3.26 persons per family, with married-couple families (18,090 | 82.3%) accounting for the largest median family size of 3.32 persons per family. On the other hand, single male/father families (1,199 | 5.4%) represent the smallest median family size with 2.98 persons per family.
| Family Type | # Families | Family Size |
| Married-Couple | 18,090 (82.3%) | 3.32 |
| Single Male/Father | 1,199 (5.4%) | 2.98 |
| Single Female/Mother | 2,694 (12.2%) | 3.01 |
| Total Families | 21,983 (100.0%) | 3.26 |
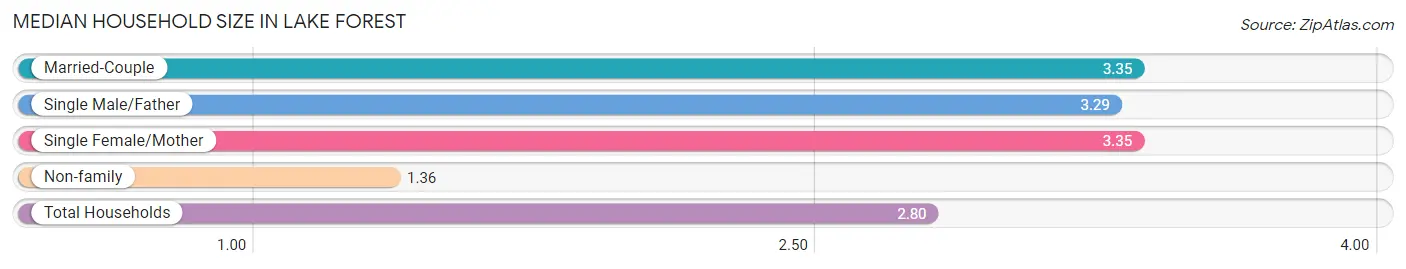
Median Household Size in Lake Forest
The median household size in Lake Forest is 2.80 persons per household, with married-couple households (18,090 | 59.7%) accounting for the largest median household size of 3.35 persons per household. non-family households (8,315 | 27.4%) represent the smallest median household size with 1.36 persons per household.
| Household Type | # Households | Household Size |
| Married-Couple | 18,090 (59.7%) | 3.35 |
| Single Male/Father | 1,199 (4.0%) | 3.29 |
| Single Female/Mother | 2,694 (8.9%) | 3.35 |
| Non-family | 8,315 (27.4%) | 1.36 |
| Total Households | 30,298 (100.0%) | 2.80 |
Household Size by Marriage Status in Lake Forest
Out of a total of 30,298 households in Lake Forest, 21,983 (72.6%) are family households, while 8,315 (27.4%) are nonfamily households. The most numerous type of family households are 2-person households, comprising 7,450, and the most common type of nonfamily households are 1-person households, comprising 6,129.
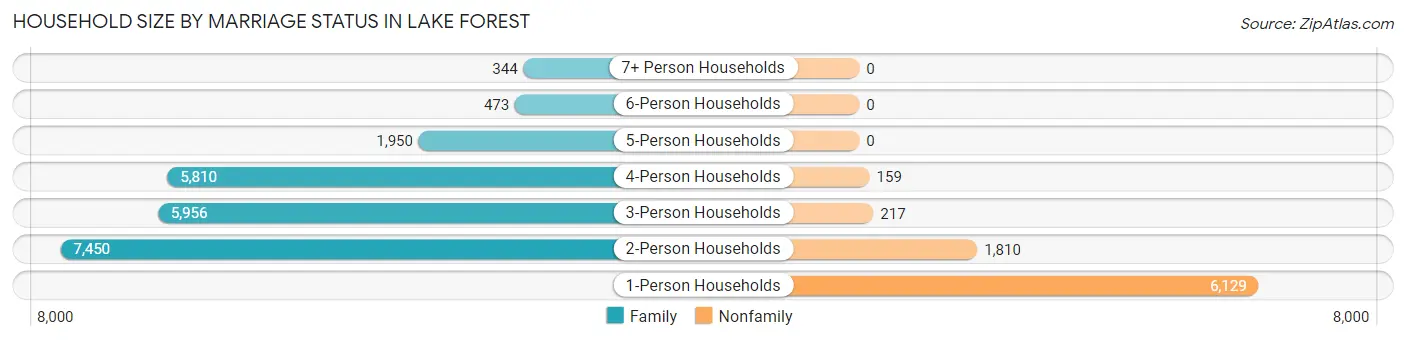
| Household Size | Family Households | Nonfamily Households |
| 1-Person Households | - | 6,129 (20.2%) |
| 2-Person Households | 7,450 (24.6%) | 1,810 (6.0%) |
| 3-Person Households | 5,956 (19.7%) | 217 (0.7%) |
| 4-Person Households | 5,810 (19.2%) | 159 (0.5%) |
| 5-Person Households | 1,950 (6.4%) | 0 (0.0%) |
| 6-Person Households | 473 (1.6%) | 0 (0.0%) |
| 7+ Person Households | 344 (1.1%) | 0 (0.0%) |
| Total | 21,983 (72.6%) | 8,315 (27.4%) |
Female Fertility in Lake Forest
Fertility by Age in Lake Forest
Average fertility rate in Lake Forest is 46.0 births per 1,000 women. Women in the age bracket of 20 to 34 years have the highest fertility rate with 66.0 births per 1,000 women. Women in the age bracket of 20 to 34 years acount for 57.1% of all women with births.
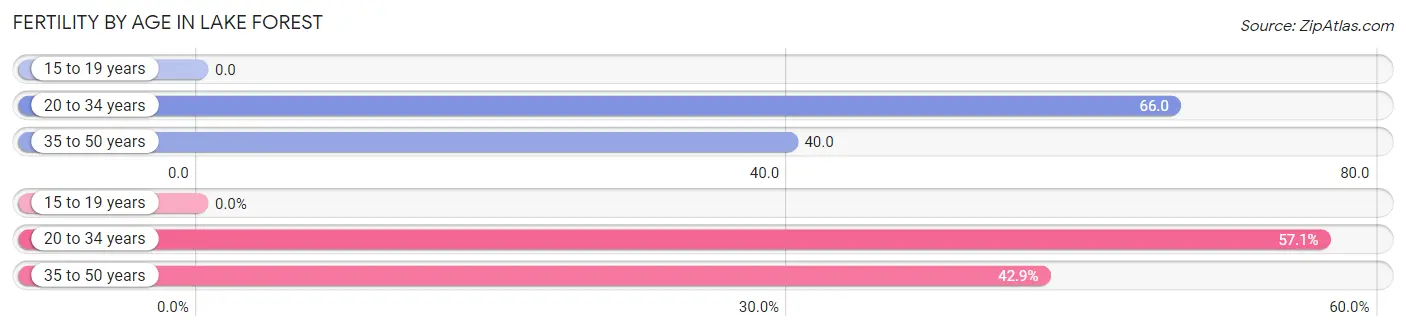
| Age Bracket | Women with Births | Births / 1,000 Women |
| 15 to 19 years | 0 (0.0%) | 0.0 |
| 20 to 34 years | 561 (57.1%) | 66.0 |
| 35 to 50 years | 421 (42.9%) | 40.0 |
| Total | 982 (100.0%) | 46.0 |
Fertility by Age by Marriage Status in Lake Forest
96.7% of women with births (982) in Lake Forest are married. The highest percentage of unmarried women with births falls into 20 to 34 years age bracket with 5.7% of them unmarried at the time of birth, while the lowest percentage of unmarried women with births belong to 35 to 50 years age bracket with 0.0% of them unmarried.
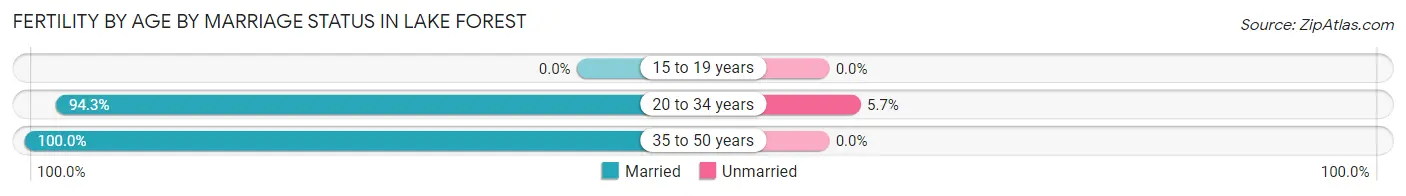
| Age Bracket | Married | Unmarried |
| 15 to 19 years | 0 (0.0%) | 0 (0.0%) |
| 20 to 34 years | 529 (94.3%) | 32 (5.7%) |
| 35 to 50 years | 421 (100.0%) | 0 (0.0%) |
| Total | 950 (96.7%) | 32 (3.3%) |
Fertility by Education in Lake Forest
Average fertility rate in Lake Forest is 46.0 births per 1,000 women. Women with the education attainment of bachelor's degree have the highest fertility rate of 75.0 births per 1,000 women, while women with the education attainment of less than high school have the lowest fertility at 7.0 births per 1,000 women. Women with the education attainment of bachelor's degree represent 51.0% of all women with births.
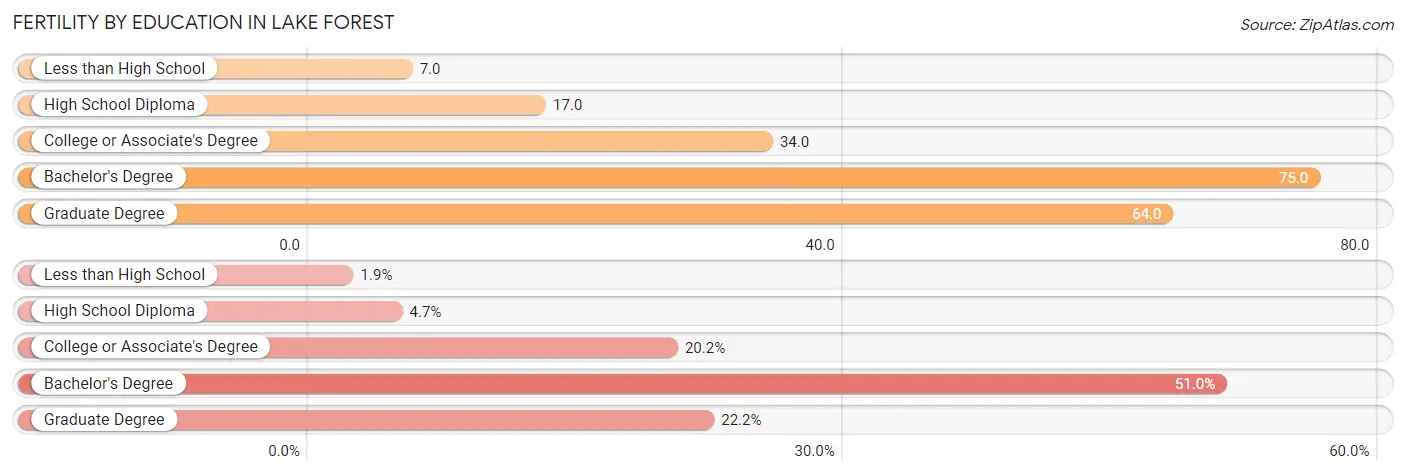
| Educational Attainment | Women with Births | Births / 1,000 Women |
| Less than High School | 19 (1.9%) | 7.0 |
| High School Diploma | 46 (4.7%) | 17.0 |
| College or Associate's Degree | 198 (20.2%) | 34.0 |
| Bachelor's Degree | 501 (51.0%) | 75.0 |
| Graduate Degree | 218 (22.2%) | 64.0 |
| Total | 982 (100.0%) | 46.0 |
Fertility by Education by Marriage Status in Lake Forest
3.3% of women with births in Lake Forest are unmarried. Women with the educational attainment of less than high school are most likely to be married with 100.0% of them married at childbirth, while women with the educational attainment of college or associate's degree are least likely to be married with 12.6% of them unmarried at childbirth.
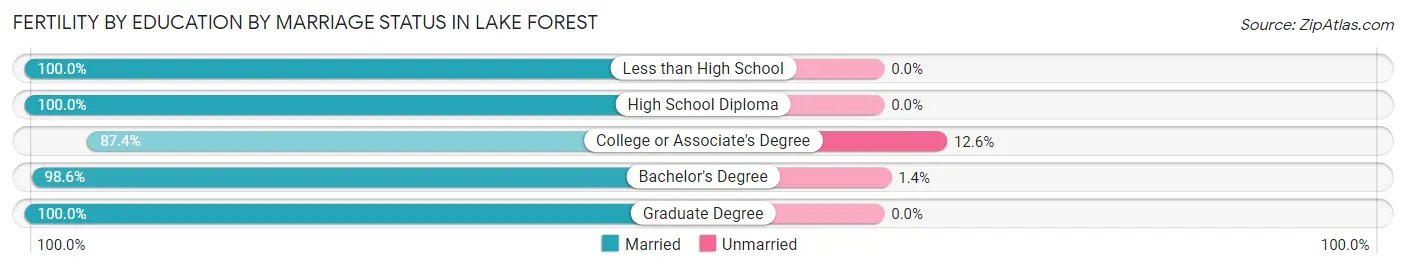
| Educational Attainment | Married | Unmarried |
| Less than High School | 19 (100.0%) | 0 (0.0%) |
| High School Diploma | 46 (100.0%) | 0 (0.0%) |
| College or Associate's Degree | 173 (87.4%) | 25 (12.6%) |
| Bachelor's Degree | 494 (98.6%) | 7 (1.4%) |
| Graduate Degree | 218 (100.0%) | 0 (0.0%) |
| Total | 950 (96.7%) | 32 (3.3%) |
Employment Characteristics in Lake Forest
Employment by Class of Employer in Lake Forest
Among the 45,280 employed individuals in Lake Forest, private company employees (32,846 | 72.5%), self-employed (not incorporated) (3,278 | 7.2%), and local government employees (2,958 | 6.5%) make up the most common classes of employment.
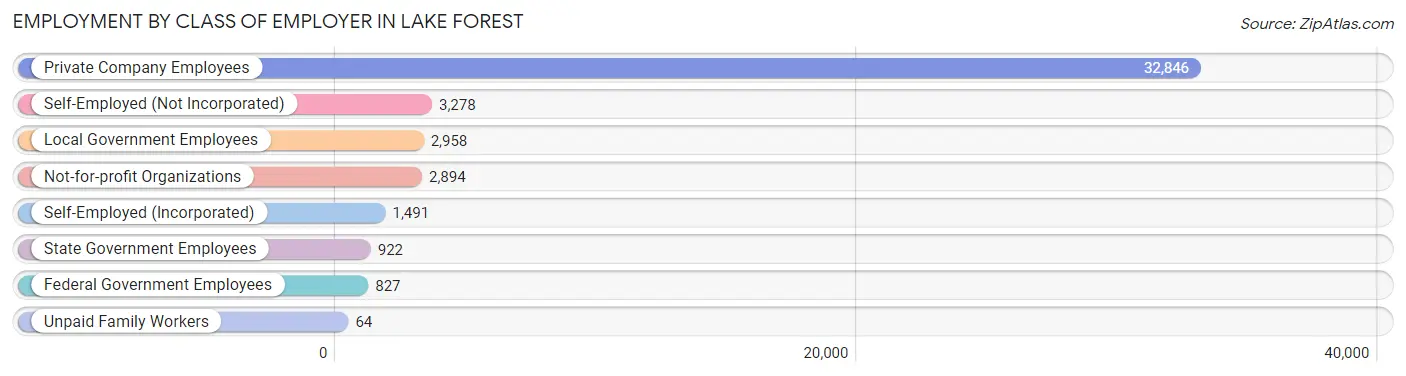
| Employer Class | # Employees | % Employees |
| Private Company Employees | 32,846 | 72.5% |
| Self-Employed (Incorporated) | 1,491 | 3.3% |
| Self-Employed (Not Incorporated) | 3,278 | 7.2% |
| Not-for-profit Organizations | 2,894 | 6.4% |
| Local Government Employees | 2,958 | 6.5% |
| State Government Employees | 922 | 2.0% |
| Federal Government Employees | 827 | 1.8% |
| Unpaid Family Workers | 64 | 0.1% |
| Total | 45,280 | 100.0% |
Employment Status by Age in Lake Forest
According to the labor force statistics for Lake Forest, out of the total population over 16 years of age (70,155), 69.2% or 48,547 individuals are in the labor force, with 5.0% or 2,427 of them unemployed. The age group with the highest labor force participation rate is 45 to 54 years, with 85.6% or 11,439 individuals in the labor force. Within the labor force, the 16 to 19 years age range has the highest percentage of unemployed individuals, with 13.1% or 185 of them being unemployed.
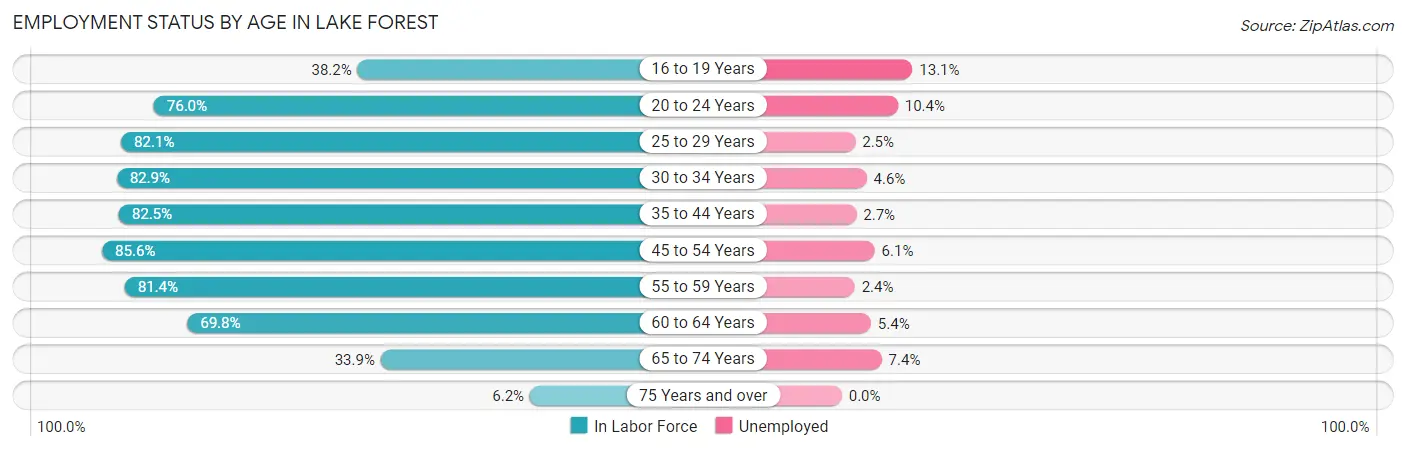
| Age Bracket | In Labor Force | Unemployed |
| 16 to 19 Years | 1,409 (38.2%) | 185 (13.1%) |
| 20 to 24 Years | 4,089 (76.0%) | 425 (10.4%) |
| 25 to 29 Years | 4,752 (82.1%) | 119 (2.5%) |
| 30 to 34 Years | 4,805 (82.9%) | 221 (4.6%) |
| 35 to 44 Years | 10,646 (82.5%) | 287 (2.7%) |
| 45 to 54 Years | 11,439 (85.6%) | 698 (6.1%) |
| 55 to 59 Years | 4,862 (81.4%) | 117 (2.4%) |
| 60 to 64 Years | 3,639 (69.8%) | 197 (5.4%) |
| 65 to 74 Years | 2,676 (33.9%) | 198 (7.4%) |
| 75 Years and over | 258 (6.2%) | 0 (0.0%) |
| Total | 48,547 (69.2%) | 2,427 (5.0%) |
Employment Status by Educational Attainment in Lake Forest
According to labor force statistics for Lake Forest, 81.9% of individuals (40,161) out of the total population between 25 and 64 years of age (49,037) are in the labor force, with 4.1% or 1,647 of them being unemployed. The group with the highest labor force participation rate are those with the educational attainment of bachelor's degree or higher, with 84.6% or 21,024 individuals in the labor force. Within the labor force, individuals with less than high school education have the highest percentage of unemployment, with 16.3% or 328 of them being unemployed.
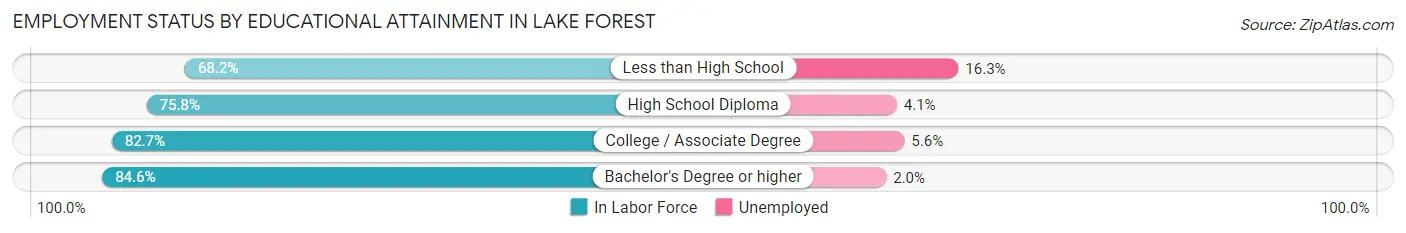
| Educational Attainment | In Labor Force | Unemployed |
| Less than High School | 2,015 (68.2%) | 482 (16.3%) |
| High School Diploma | 5,058 (75.8%) | 274 (4.1%) |
| College / Associate Degree | 12,039 (82.7%) | 815 (5.6%) |
| Bachelor's Degree or higher | 21,024 (84.6%) | 497 (2.0%) |
| Total | 40,161 (81.9%) | 2,011 (4.1%) |
Employment Occupations by Sex in Lake Forest
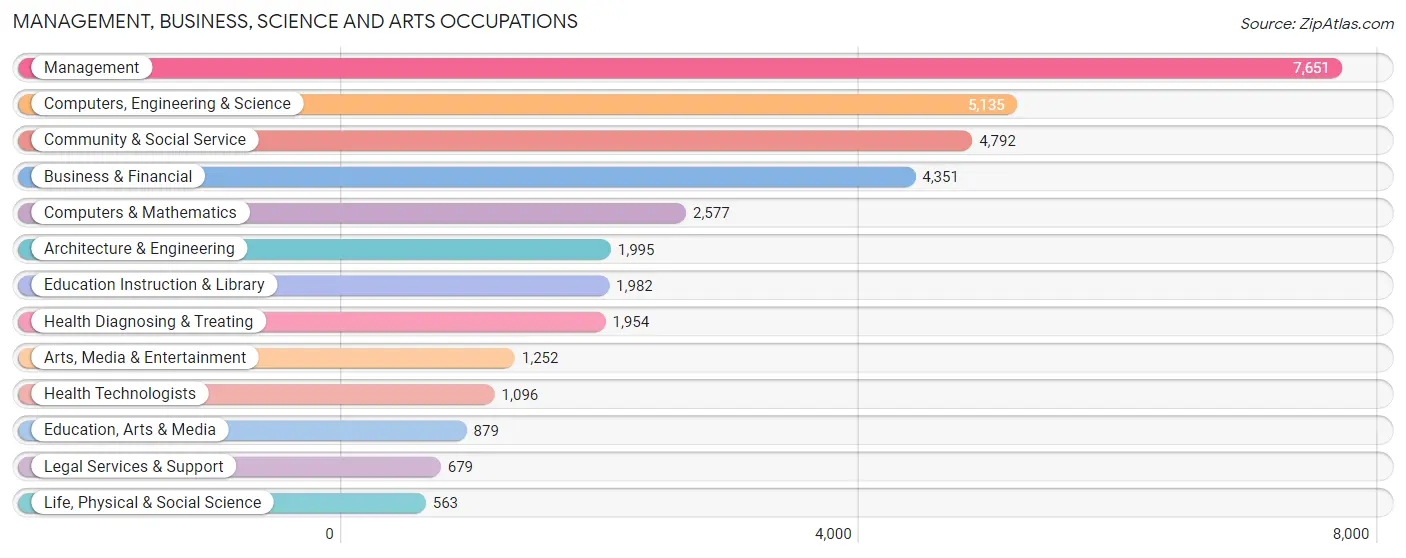
Management, Business, Science and Arts Occupations
The most common Management, Business, Science and Arts occupations in Lake Forest are Management (7,651 | 16.6%), Computers, Engineering & Science (5,135 | 11.2%), Community & Social Service (4,792 | 10.4%), Business & Financial (4,351 | 9.4%), and Computers & Mathematics (2,577 | 5.6%).
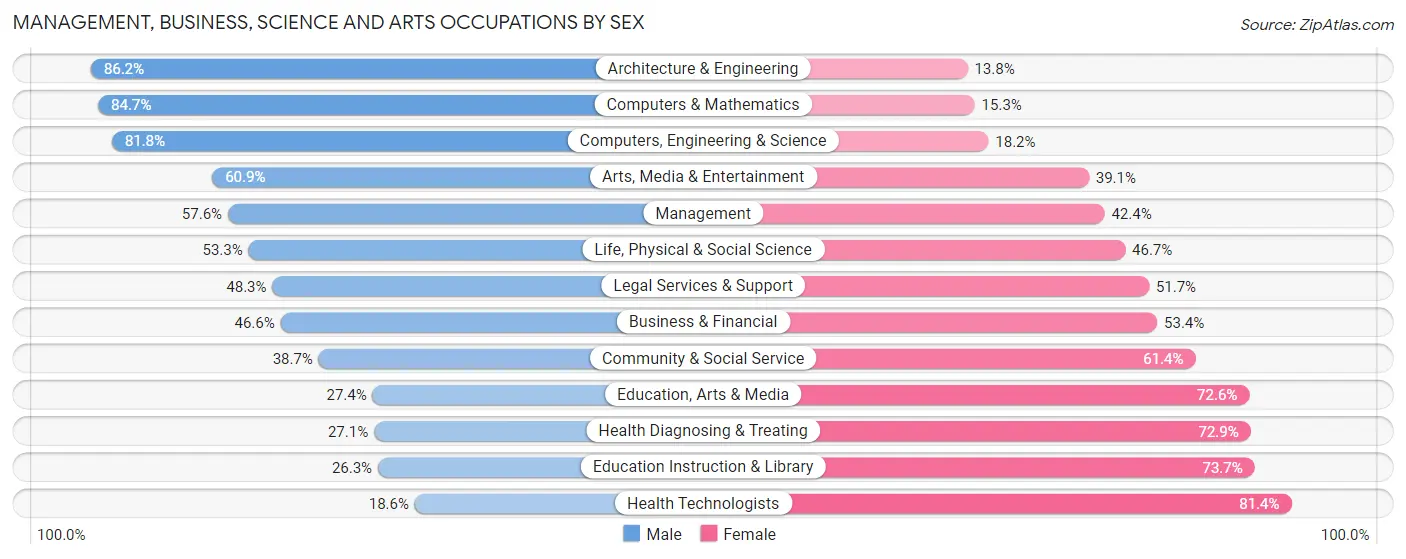
Management, Business, Science and Arts Occupations by Sex
Within the Management, Business, Science and Arts occupations in Lake Forest, the most male-oriented occupations are Architecture & Engineering (86.2%), Computers & Mathematics (84.7%), and Computers, Engineering & Science (81.8%), while the most female-oriented occupations are Health Technologists (81.4%), Education Instruction & Library (73.7%), and Health Diagnosing & Treating (72.9%).
| Occupation | Male | Female |
| Management | 4,406 (57.6%) | 3,245 (42.4%) |
| Business & Financial | 2,028 (46.6%) | 2,323 (53.4%) |
| Computers, Engineering & Science | 4,201 (81.8%) | 934 (18.2%) |
| Computers & Mathematics | 2,182 (84.7%) | 395 (15.3%) |
| Architecture & Engineering | 1,719 (86.2%) | 276 (13.8%) |
| Life, Physical & Social Science | 300 (53.3%) | 263 (46.7%) |
| Community & Social Service | 1,852 (38.7%) | 2,940 (61.4%) |
| Education, Arts & Media | 241 (27.4%) | 638 (72.6%) |
| Legal Services & Support | 328 (48.3%) | 351 (51.7%) |
| Education Instruction & Library | 521 (26.3%) | 1,461 (73.7%) |
| Arts, Media & Entertainment | 762 (60.9%) | 490 (39.1%) |
| Health Diagnosing & Treating | 530 (27.1%) | 1,424 (72.9%) |
| Health Technologists | 204 (18.6%) | 892 (81.4%) |
| Total (Category) | 13,017 (54.5%) | 10,866 (45.5%) |
| Total (Overall) | 24,896 (54.0%) | 21,176 (46.0%) |
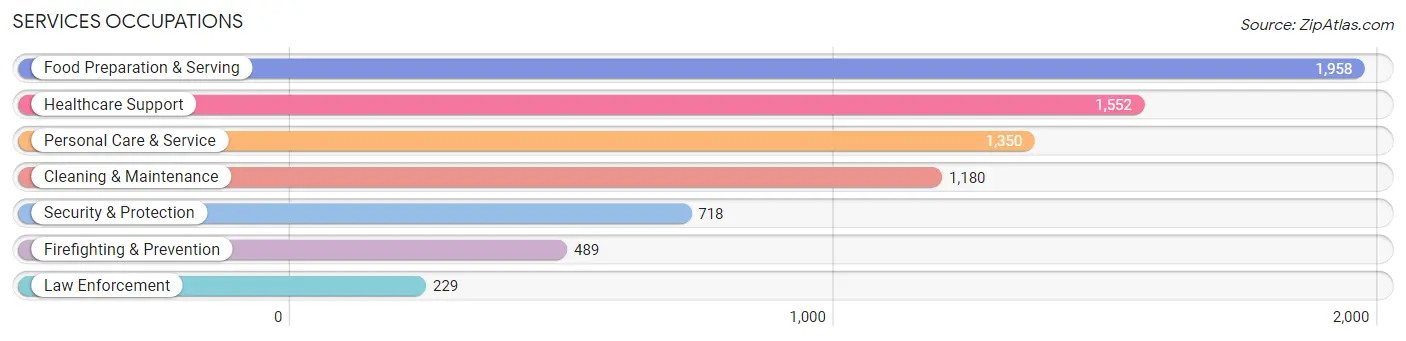
Services Occupations
The most common Services occupations in Lake Forest are Food Preparation & Serving (1,958 | 4.3%), Healthcare Support (1,552 | 3.4%), Personal Care & Service (1,350 | 2.9%), Cleaning & Maintenance (1,180 | 2.6%), and Security & Protection (718 | 1.6%).
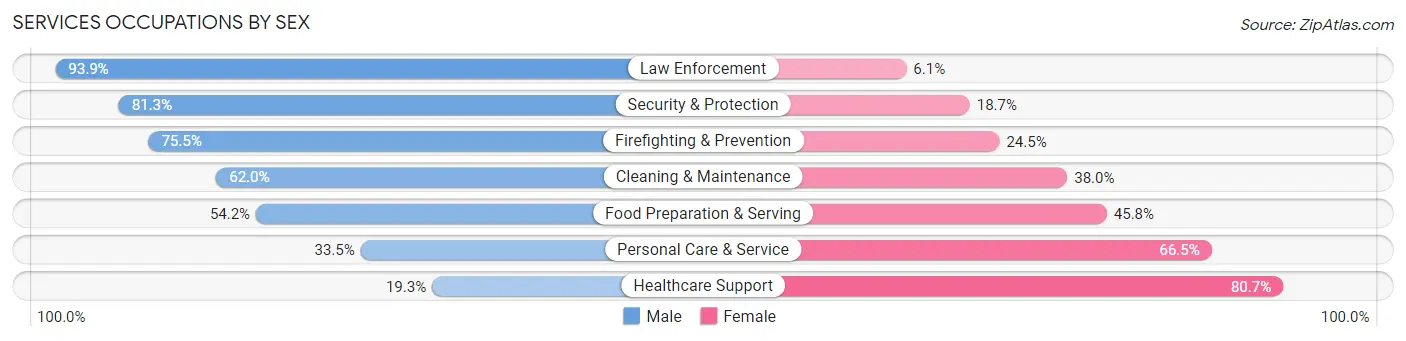
Services Occupations by Sex
Within the Services occupations in Lake Forest, the most male-oriented occupations are Law Enforcement (93.9%), Security & Protection (81.3%), and Firefighting & Prevention (75.5%), while the most female-oriented occupations are Healthcare Support (80.7%), Personal Care & Service (66.5%), and Food Preparation & Serving (45.8%).
| Occupation | Male | Female |
| Healthcare Support | 300 (19.3%) | 1,252 (80.7%) |
| Security & Protection | 584 (81.3%) | 134 (18.7%) |
| Firefighting & Prevention | 369 (75.5%) | 120 (24.5%) |
| Law Enforcement | 215 (93.9%) | 14 (6.1%) |
| Food Preparation & Serving | 1,061 (54.2%) | 897 (45.8%) |
| Cleaning & Maintenance | 732 (62.0%) | 448 (38.0%) |
| Personal Care & Service | 452 (33.5%) | 898 (66.5%) |
| Total (Category) | 3,129 (46.3%) | 3,629 (53.7%) |
| Total (Overall) | 24,896 (54.0%) | 21,176 (46.0%) |
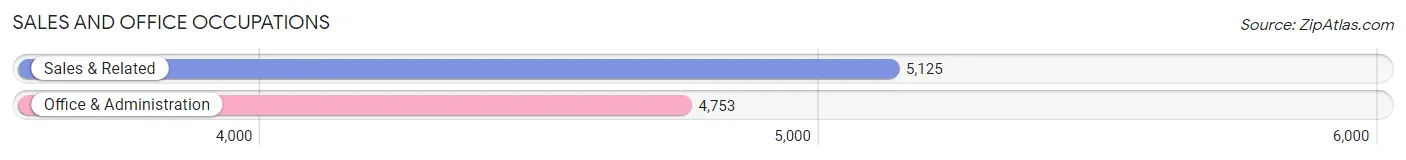
Sales and Office Occupations
The most common Sales and Office occupations in Lake Forest are Sales & Related (5,125 | 11.1%), and Office & Administration (4,753 | 10.3%).
Sales and Office Occupations by Sex
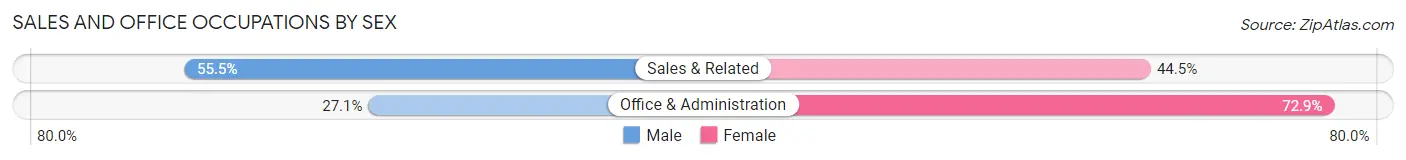
| Occupation | Male | Female |
| Sales & Related | 2,843 (55.5%) | 2,282 (44.5%) |
| Office & Administration | 1,289 (27.1%) | 3,464 (72.9%) |
| Total (Category) | 4,132 (41.8%) | 5,746 (58.2%) |
| Total (Overall) | 24,896 (54.0%) | 21,176 (46.0%) |
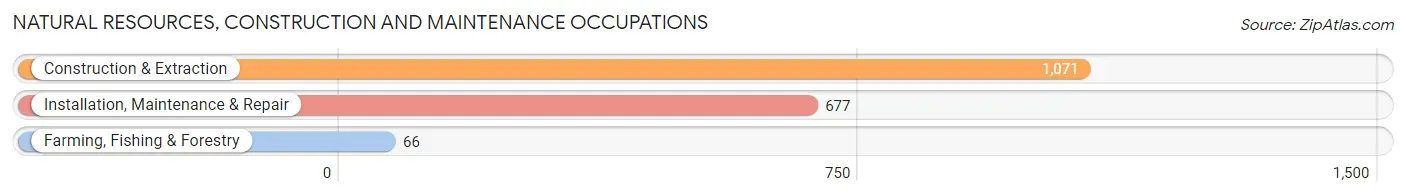
Natural Resources, Construction and Maintenance Occupations
The most common Natural Resources, Construction and Maintenance occupations in Lake Forest are Construction & Extraction (1,071 | 2.3%), Installation, Maintenance & Repair (677 | 1.5%), and Farming, Fishing & Forestry (66 | 0.1%).
Natural Resources, Construction and Maintenance Occupations by Sex
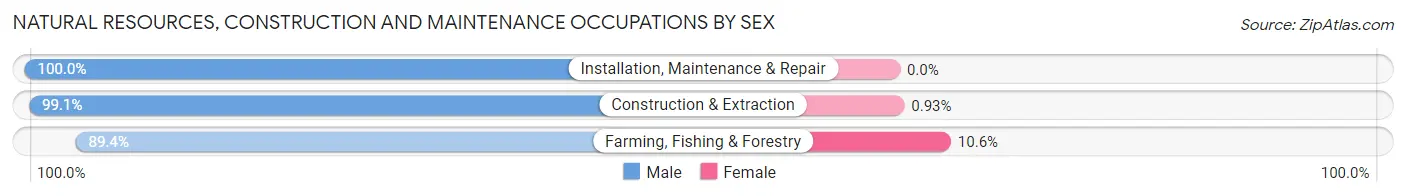
| Occupation | Male | Female |
| Farming, Fishing & Forestry | 59 (89.4%) | 7 (10.6%) |
| Construction & Extraction | 1,061 (99.1%) | 10 (0.9%) |
| Installation, Maintenance & Repair | 677 (100.0%) | 0 (0.0%) |
| Total (Category) | 1,797 (99.1%) | 17 (0.9%) |
| Total (Overall) | 24,896 (54.0%) | 21,176 (46.0%) |
Production, Transportation and Moving Occupations
The most common Production, Transportation and Moving occupations in Lake Forest are Production (1,294 | 2.8%), Transportation (1,251 | 2.7%), and Material Moving (1,194 | 2.6%).
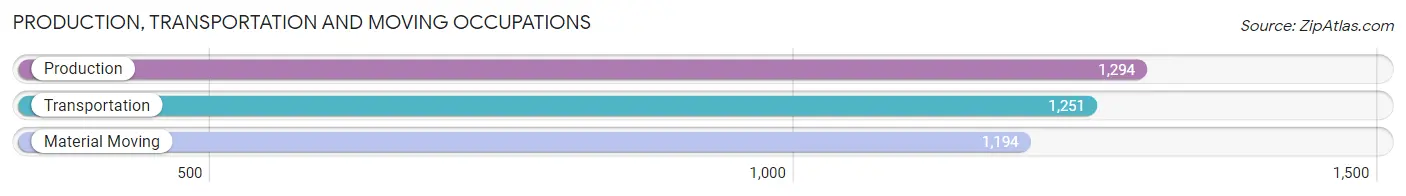
Production, Transportation and Moving Occupations by Sex
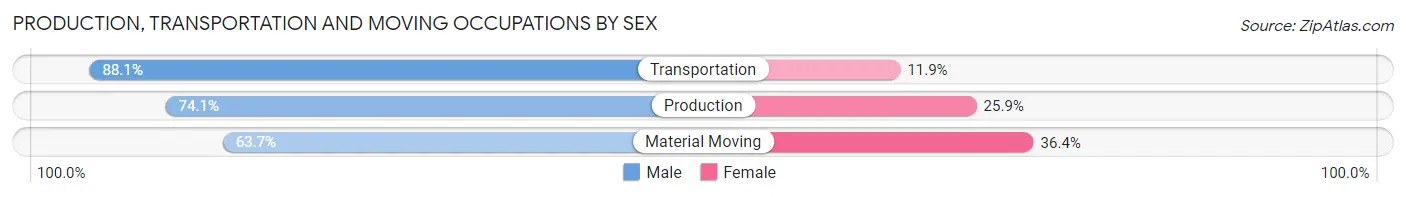
| Occupation | Male | Female |
| Production | 959 (74.1%) | 335 (25.9%) |
| Transportation | 1,102 (88.1%) | 149 (11.9%) |
| Material Moving | 760 (63.6%) | 434 (36.3%) |
| Total (Category) | 2,821 (75.4%) | 918 (24.5%) |
| Total (Overall) | 24,896 (54.0%) | 21,176 (46.0%) |
Employment Industries by Sex in Lake Forest
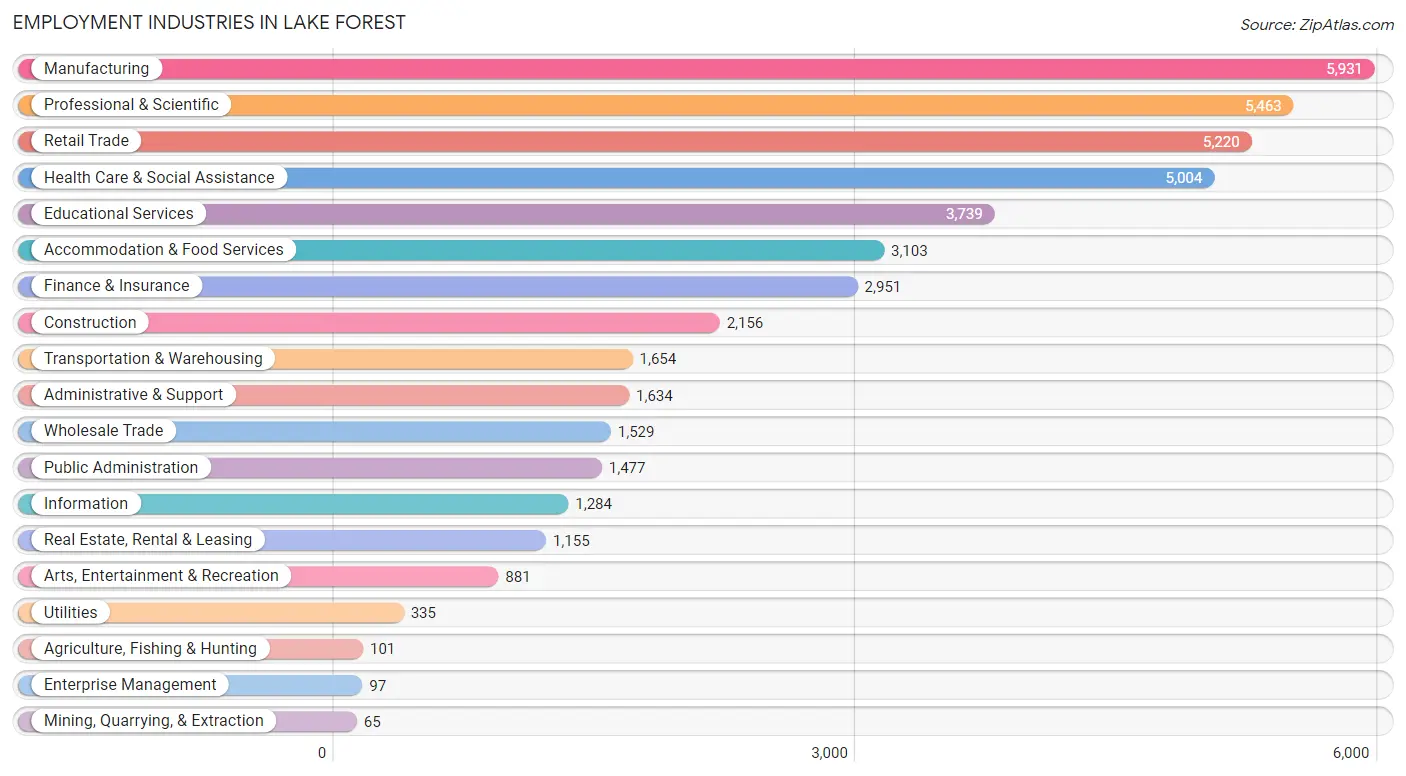
Employment Industries in Lake Forest
The major employment industries in Lake Forest include Manufacturing (5,931 | 12.9%), Professional & Scientific (5,463 | 11.9%), Retail Trade (5,220 | 11.3%), Health Care & Social Assistance (5,004 | 10.9%), and Educational Services (3,739 | 8.1%).
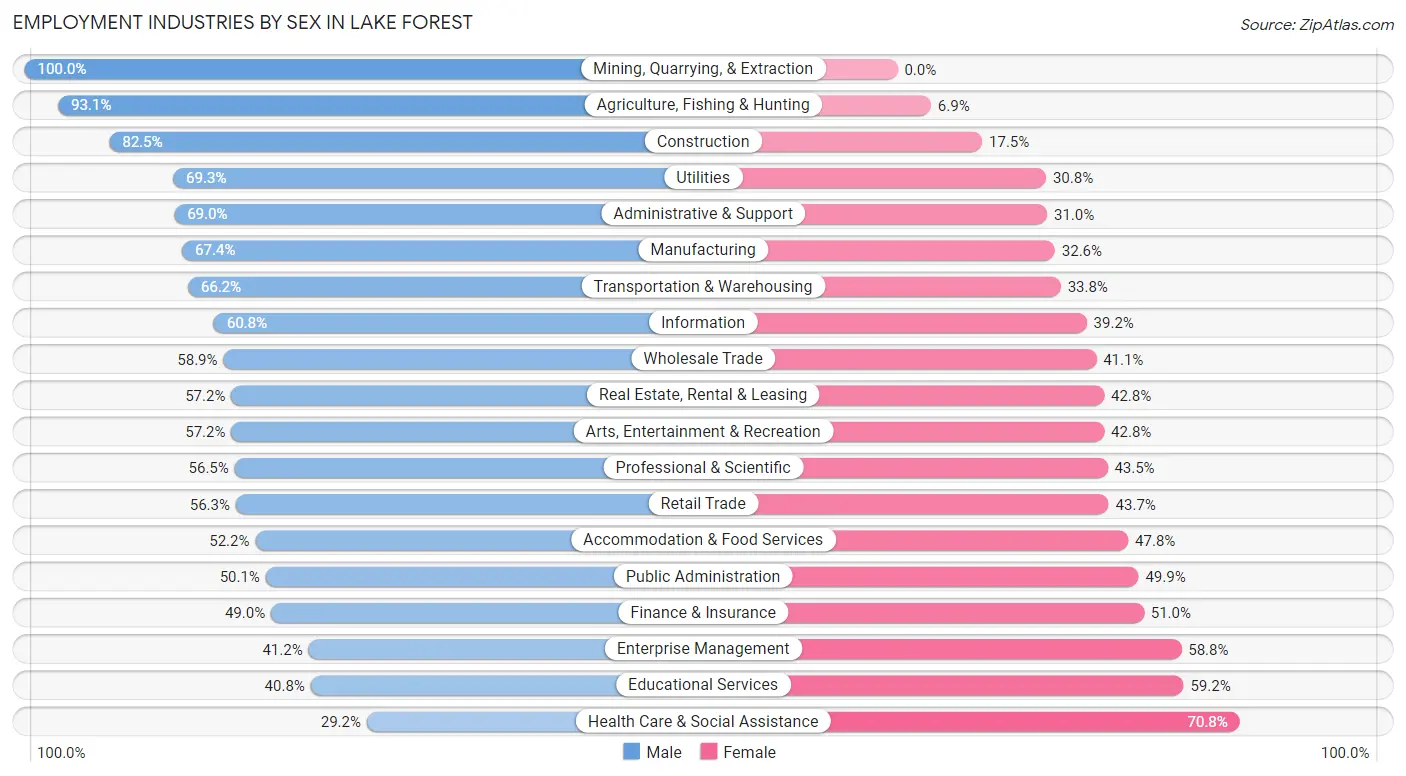
Employment Industries by Sex in Lake Forest
The Lake Forest industries that see more men than women are Mining, Quarrying, & Extraction (100.0%), Agriculture, Fishing & Hunting (93.1%), and Construction (82.5%), whereas the industries that tend to have a higher number of women are Health Care & Social Assistance (70.8%), Educational Services (59.2%), and Enterprise Management (58.8%).
| Industry | Male | Female |
| Agriculture, Fishing & Hunting | 94 (93.1%) | 7 (6.9%) |
| Mining, Quarrying, & Extraction | 65 (100.0%) | 0 (0.0%) |
| Construction | 1,778 (82.5%) | 378 (17.5%) |
| Manufacturing | 3,998 (67.4%) | 1,933 (32.6%) |
| Wholesale Trade | 900 (58.9%) | 629 (41.1%) |
| Retail Trade | 2,938 (56.3%) | 2,282 (43.7%) |
| Transportation & Warehousing | 1,095 (66.2%) | 559 (33.8%) |
| Utilities | 232 (69.3%) | 103 (30.7%) |
| Information | 781 (60.8%) | 503 (39.2%) |
| Finance & Insurance | 1,446 (49.0%) | 1,505 (51.0%) |
| Real Estate, Rental & Leasing | 661 (57.2%) | 494 (42.8%) |
| Professional & Scientific | 3,088 (56.5%) | 2,375 (43.5%) |
| Enterprise Management | 40 (41.2%) | 57 (58.8%) |
| Administrative & Support | 1,128 (69.0%) | 506 (31.0%) |
| Educational Services | 1,525 (40.8%) | 2,214 (59.2%) |
| Health Care & Social Assistance | 1,460 (29.2%) | 3,544 (70.8%) |
| Arts, Entertainment & Recreation | 504 (57.2%) | 377 (42.8%) |
| Accommodation & Food Services | 1,621 (52.2%) | 1,482 (47.8%) |
| Public Administration | 740 (50.1%) | 737 (49.9%) |
| Total | 24,896 (54.0%) | 21,176 (46.0%) |
Education in Lake Forest
School Enrollment in Lake Forest
The most common levels of schooling among the 20,238 students in Lake Forest are college / undergraduate (5,531 | 27.3%), high school (4,196 | 20.7%), and elementary school (3,899 | 19.3%).
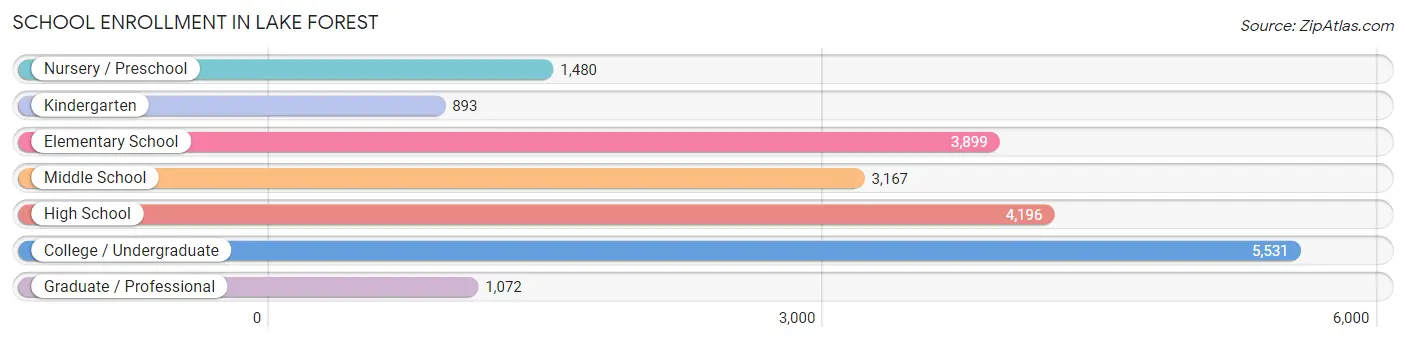
| School Level | # Students | % Students |
| Nursery / Preschool | 1,480 | 7.3% |
| Kindergarten | 893 | 4.4% |
| Elementary School | 3,899 | 19.3% |
| Middle School | 3,167 | 15.7% |
| High School | 4,196 | 20.7% |
| College / Undergraduate | 5,531 | 27.3% |
| Graduate / Professional | 1,072 | 5.3% |
| Total | 20,238 | 100.0% |
School Enrollment by Age by Funding Source in Lake Forest
Out of a total of 20,238 students who are enrolled in schools in Lake Forest, 3,865 (19.1%) attend a private institution, while the remaining 16,373 (80.9%) are enrolled in public schools. The age group of 3 to 4 year olds has the highest likelihood of being enrolled in private schools, with 772 (66.4% in the age bracket) enrolled. Conversely, the age group of 10 to 14 year olds has the lowest likelihood of being enrolled in a private school, with 3,891 (91.7% in the age bracket) attending a public institution.
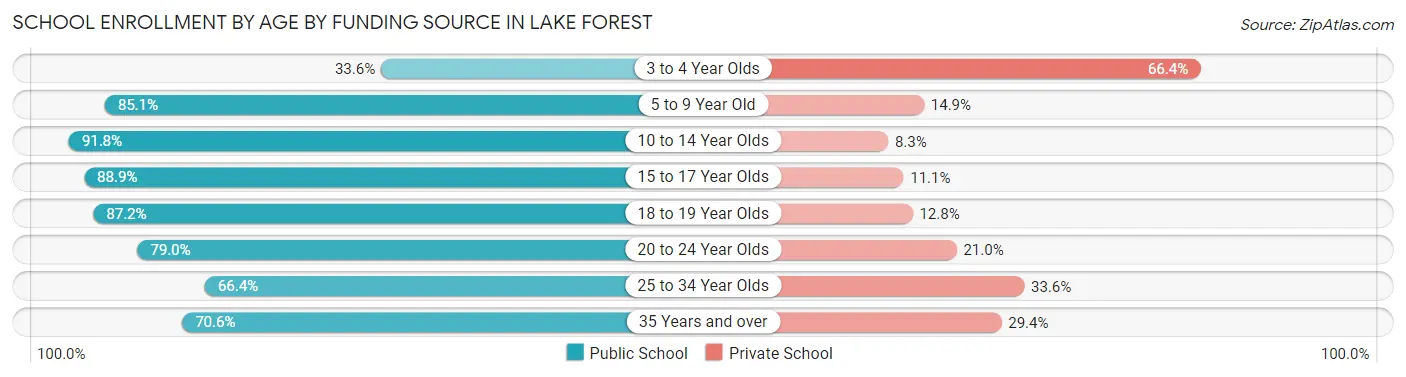
| Age Bracket | Public School | Private School |
| 3 to 4 Year Olds | 391 (33.6%) | 772 (66.4%) |
| 5 to 9 Year Old | 3,924 (85.1%) | 689 (14.9%) |
| 10 to 14 Year Olds | 3,891 (91.7%) | 350 (8.3%) |
| 15 to 17 Year Olds | 2,660 (88.9%) | 332 (11.1%) |
| 18 to 19 Year Olds | 1,224 (87.2%) | 180 (12.8%) |
| 20 to 24 Year Olds | 2,252 (79.0%) | 599 (21.0%) |
| 25 to 34 Year Olds | 955 (66.4%) | 483 (33.6%) |
| 35 Years and over | 1,085 (70.6%) | 451 (29.4%) |
| Total | 16,373 (80.9%) | 3,865 (19.1%) |
Educational Attainment by Field of Study in Lake Forest
Business (7,295 | 23.0%), engineering (3,796 | 12.0%), social sciences (2,843 | 9.0%), computers & mathematics (2,042 | 6.5%), and science & technology (1,875 | 5.9%) are the most common fields of study among 31,665 individuals in Lake Forest who have obtained a bachelor's degree or higher.
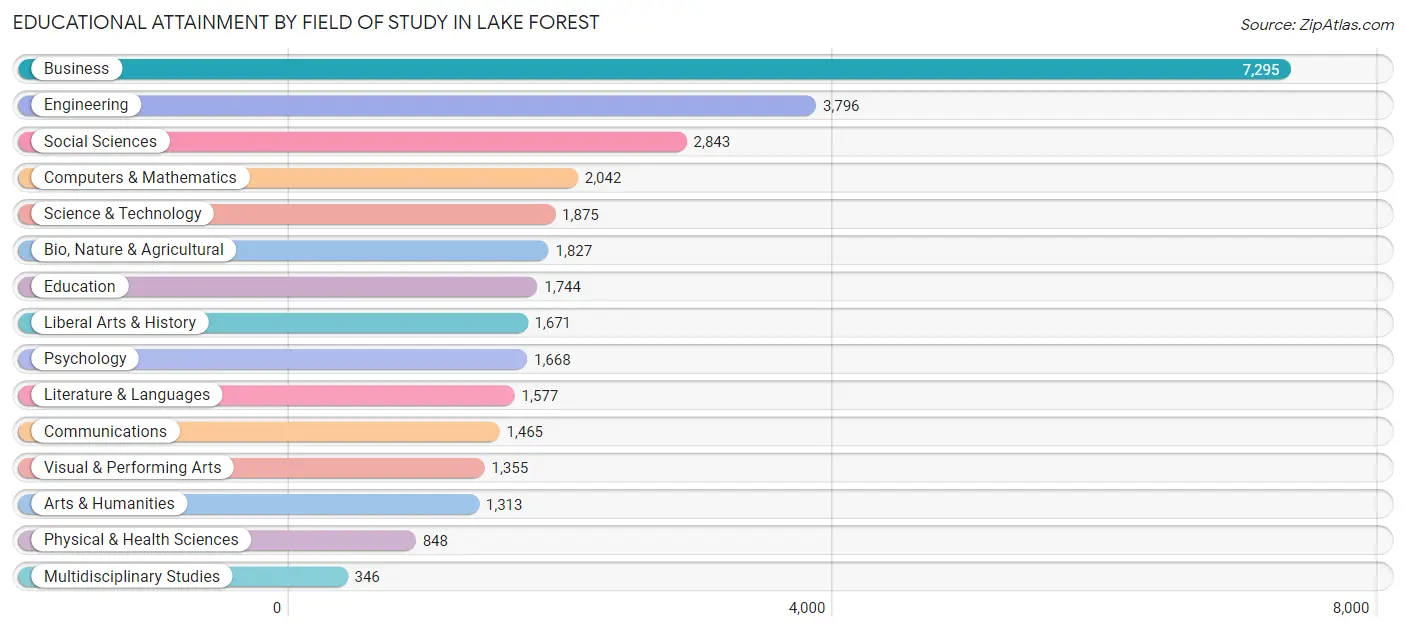
| Field of Study | # Graduates | % Graduates |
| Computers & Mathematics | 2,042 | 6.5% |
| Bio, Nature & Agricultural | 1,827 | 5.8% |
| Physical & Health Sciences | 848 | 2.7% |
| Psychology | 1,668 | 5.3% |
| Social Sciences | 2,843 | 9.0% |
| Engineering | 3,796 | 12.0% |
| Multidisciplinary Studies | 346 | 1.1% |
| Science & Technology | 1,875 | 5.9% |
| Business | 7,295 | 23.0% |
| Education | 1,744 | 5.5% |
| Literature & Languages | 1,577 | 5.0% |
| Liberal Arts & History | 1,671 | 5.3% |
| Visual & Performing Arts | 1,355 | 4.3% |
| Communications | 1,465 | 4.6% |
| Arts & Humanities | 1,313 | 4.2% |
| Total | 31,665 | 100.0% |
Transportation & Commute in Lake Forest
Vehicle Availability by Sex in Lake Forest
The most prevalent vehicle ownership categories in Lake Forest are males with 2 vehicles (10,754, accounting for 43.9%) and females with 2 vehicles (8,695, making up 52.0%).
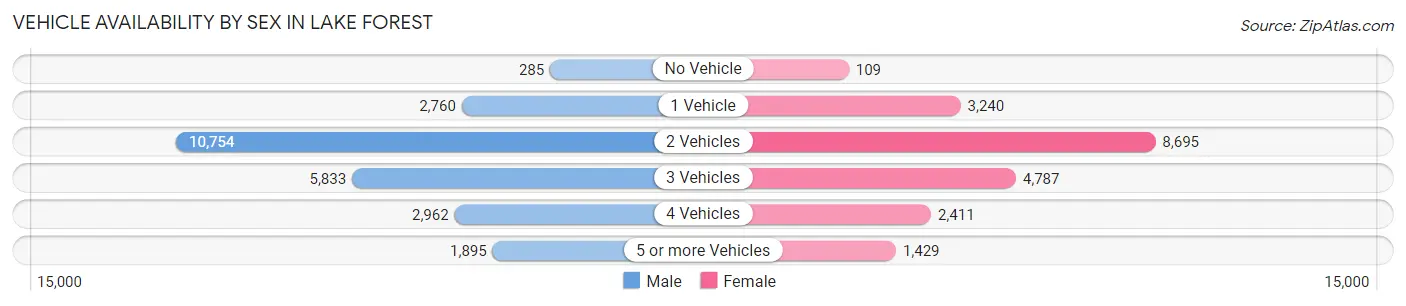
| Vehicles Available | Male | Female |
| No Vehicle | 285 (1.2%) | 109 (0.5%) |
| 1 Vehicle | 2,760 (11.3%) | 3,240 (15.7%) |
| 2 Vehicles | 10,754 (43.9%) | 8,695 (42.1%) |
| 3 Vehicles | 5,833 (23.8%) | 4,787 (23.2%) |
| 4 Vehicles | 2,962 (12.1%) | 2,411 (11.7%) |
| 5 or more Vehicles | 1,895 (7.7%) | 1,429 (6.9%) |
| Total | 24,489 (100.0%) | 20,671 (100.0%) |
Commute Time in Lake Forest
The most frequently occuring commute durations in Lake Forest are 15 to 19 minutes (5,759 commuters, 15.6%), 30 to 34 minutes (5,715 commuters, 15.5%), and 20 to 24 minutes (5,704 commuters, 15.5%).
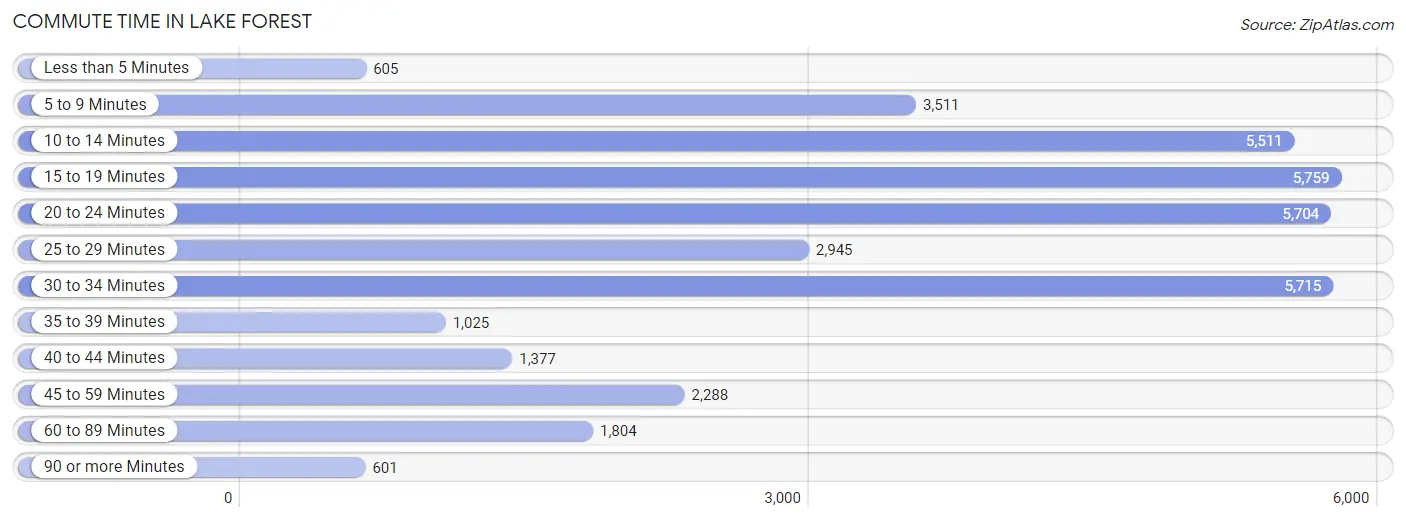
| Commute Time | # Commuters | % Commuters |
| Less than 5 Minutes | 605 | 1.6% |
| 5 to 9 Minutes | 3,511 | 9.5% |
| 10 to 14 Minutes | 5,511 | 15.0% |
| 15 to 19 Minutes | 5,759 | 15.6% |
| 20 to 24 Minutes | 5,704 | 15.5% |
| 25 to 29 Minutes | 2,945 | 8.0% |
| 30 to 34 Minutes | 5,715 | 15.5% |
| 35 to 39 Minutes | 1,025 | 2.8% |
| 40 to 44 Minutes | 1,377 | 3.7% |
| 45 to 59 Minutes | 2,288 | 6.2% |
| 60 to 89 Minutes | 1,804 | 4.9% |
| 90 or more Minutes | 601 | 1.6% |
Commute Time by Sex in Lake Forest
The most common commute times in Lake Forest are 20 to 24 minutes (3,202 commuters, 16.1%) for males and 30 to 34 minutes (3,103 commuters, 18.3%) for females.
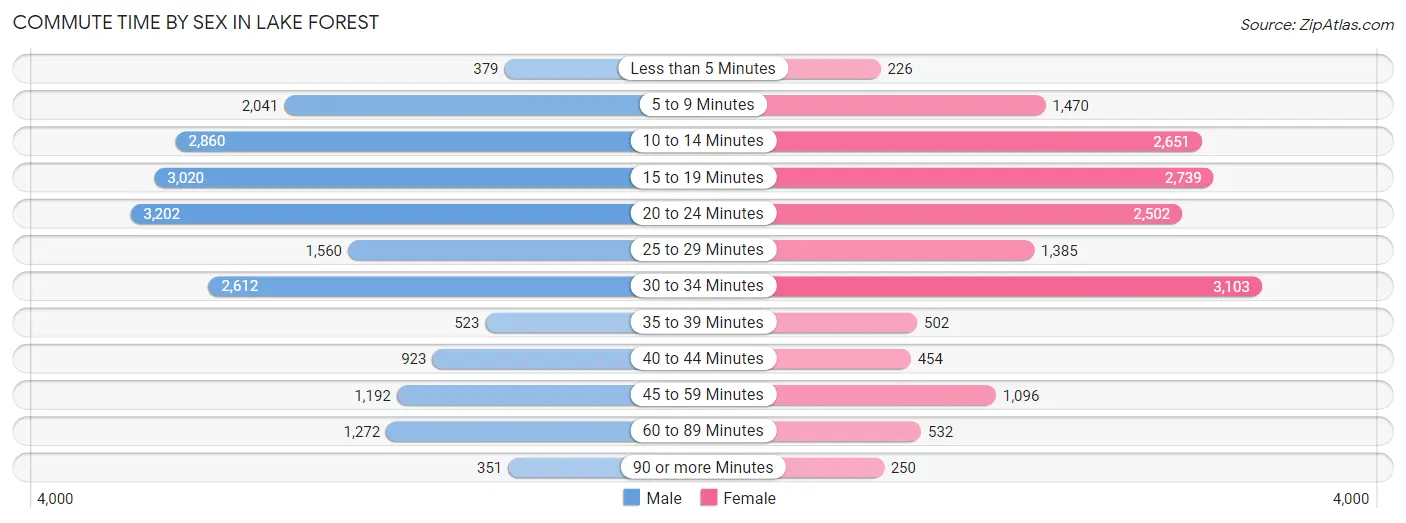
| Commute Time | Male | Female |
| Less than 5 Minutes | 379 (1.9%) | 226 (1.3%) |
| 5 to 9 Minutes | 2,041 (10.2%) | 1,470 (8.7%) |
| 10 to 14 Minutes | 2,860 (14.3%) | 2,651 (15.7%) |
| 15 to 19 Minutes | 3,020 (15.1%) | 2,739 (16.2%) |
| 20 to 24 Minutes | 3,202 (16.1%) | 2,502 (14.8%) |
| 25 to 29 Minutes | 1,560 (7.8%) | 1,385 (8.2%) |
| 30 to 34 Minutes | 2,612 (13.1%) | 3,103 (18.3%) |
| 35 to 39 Minutes | 523 (2.6%) | 502 (3.0%) |
| 40 to 44 Minutes | 923 (4.6%) | 454 (2.7%) |
| 45 to 59 Minutes | 1,192 (6.0%) | 1,096 (6.5%) |
| 60 to 89 Minutes | 1,272 (6.4%) | 532 (3.2%) |
| 90 or more Minutes | 351 (1.8%) | 250 (1.5%) |
Time of Departure to Work by Sex in Lake Forest
The most frequent times of departure to work in Lake Forest are 8:00 AM to 8:29 AM (2,924, 14.7%) for males and 7:30 AM to 7:59 AM (2,838, 16.8%) for females.
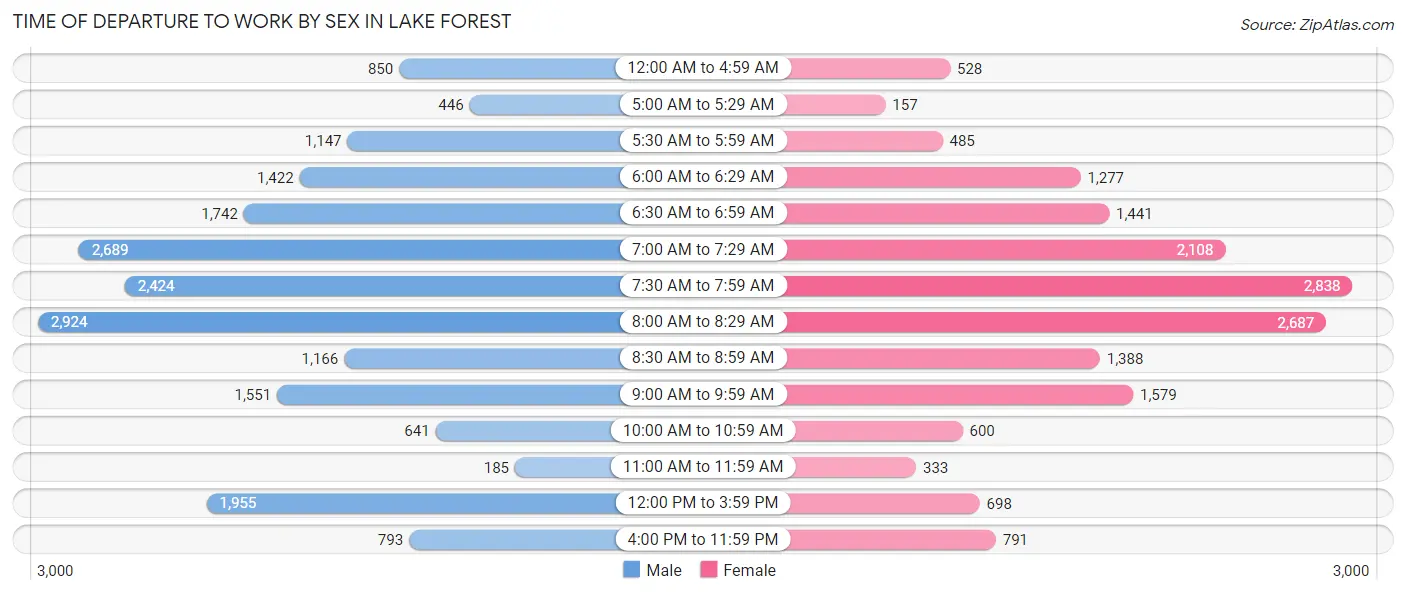
| Time of Departure | Male | Female |
| 12:00 AM to 4:59 AM | 850 (4.3%) | 528 (3.1%) |
| 5:00 AM to 5:29 AM | 446 (2.2%) | 157 (0.9%) |
| 5:30 AM to 5:59 AM | 1,147 (5.8%) | 485 (2.9%) |
| 6:00 AM to 6:29 AM | 1,422 (7.1%) | 1,277 (7.5%) |
| 6:30 AM to 6:59 AM | 1,742 (8.7%) | 1,441 (8.5%) |
| 7:00 AM to 7:29 AM | 2,689 (13.5%) | 2,108 (12.5%) |
| 7:30 AM to 7:59 AM | 2,424 (12.2%) | 2,838 (16.8%) |
| 8:00 AM to 8:29 AM | 2,924 (14.7%) | 2,687 (15.9%) |
| 8:30 AM to 8:59 AM | 1,166 (5.9%) | 1,388 (8.2%) |
| 9:00 AM to 9:59 AM | 1,551 (7.8%) | 1,579 (9.3%) |
| 10:00 AM to 10:59 AM | 641 (3.2%) | 600 (3.5%) |
| 11:00 AM to 11:59 AM | 185 (0.9%) | 333 (2.0%) |
| 12:00 PM to 3:59 PM | 1,955 (9.8%) | 698 (4.1%) |
| 4:00 PM to 11:59 PM | 793 (4.0%) | 791 (4.7%) |
| Total | 19,935 (100.0%) | 16,910 (100.0%) |
Housing Occupancy in Lake Forest
Occupancy by Ownership in Lake Forest
Of the total 30,298 dwellings in Lake Forest, owner-occupied units account for 21,300 (70.3%), while renter-occupied units make up 8,998 (29.7%).
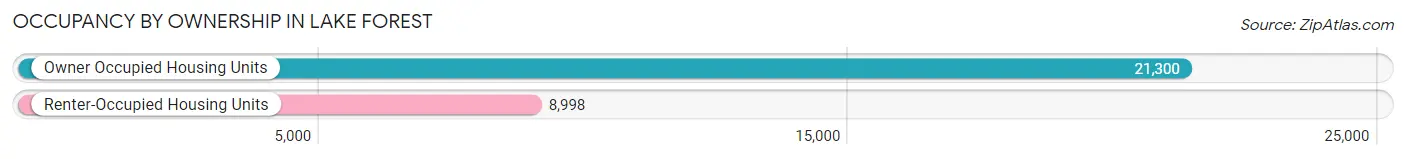
| Occupancy | # Housing Units | % Housing Units |
| Owner Occupied Housing Units | 21,300 | 70.3% |
| Renter-Occupied Housing Units | 8,998 | 29.7% |
| Total Occupied Housing Units | 30,298 | 100.0% |
Occupancy by Household Size in Lake Forest
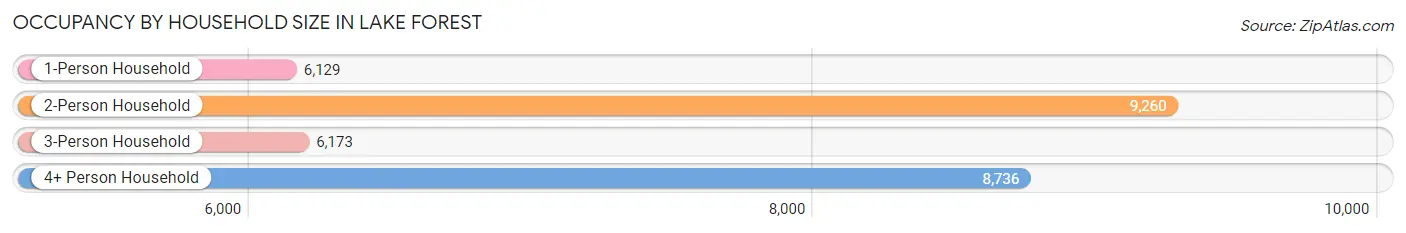
| Household Size | # Housing Units | % Housing Units |
| 1-Person Household | 6,129 | 20.2% |
| 2-Person Household | 9,260 | 30.6% |
| 3-Person Household | 6,173 | 20.4% |
| 4+ Person Household | 8,736 | 28.8% |
| Total Housing Units | 30,298 | 100.0% |
Occupancy by Ownership by Household Size in Lake Forest
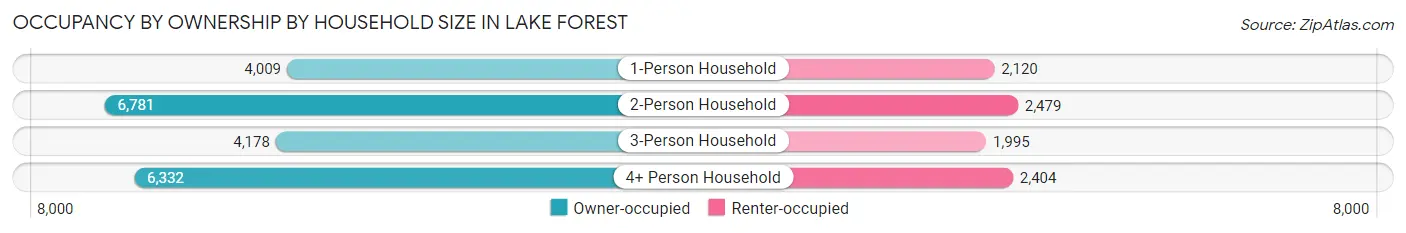
| Household Size | Owner-occupied | Renter-occupied |
| 1-Person Household | 4,009 (65.4%) | 2,120 (34.6%) |
| 2-Person Household | 6,781 (73.2%) | 2,479 (26.8%) |
| 3-Person Household | 4,178 (67.7%) | 1,995 (32.3%) |
| 4+ Person Household | 6,332 (72.5%) | 2,404 (27.5%) |
| Total Housing Units | 21,300 (70.3%) | 8,998 (29.7%) |
Occupancy by Educational Attainment in Lake Forest
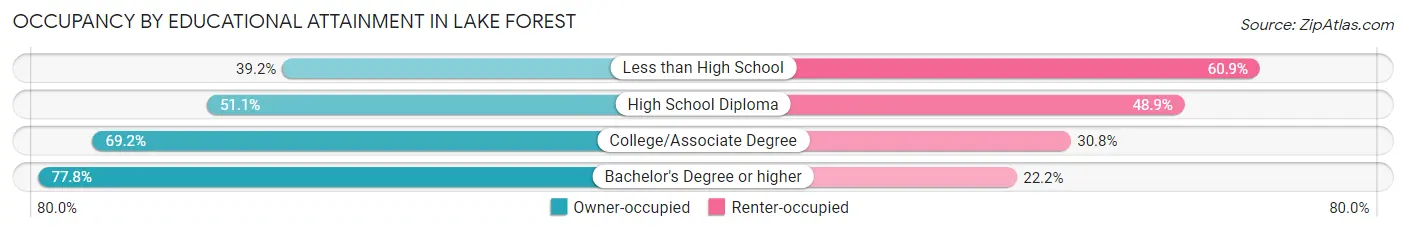
| Household Size | Owner-occupied | Renter-occupied |
| Less than High School | 532 (39.2%) | 827 (60.9%) |
| High School Diploma | 1,879 (51.1%) | 1,800 (48.9%) |
| College/Associate Degree | 6,127 (69.2%) | 2,726 (30.8%) |
| Bachelor's Degree or higher | 12,762 (77.8%) | 3,645 (22.2%) |
Occupancy by Age of Householder in Lake Forest
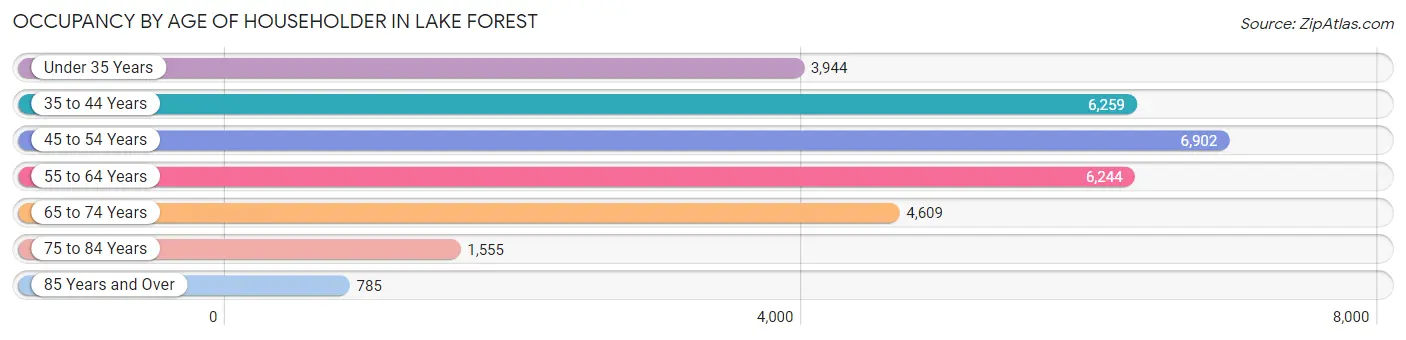
| Age Bracket | # Households | % Households |
| Under 35 Years | 3,944 | 13.0% |
| 35 to 44 Years | 6,259 | 20.7% |
| 45 to 54 Years | 6,902 | 22.8% |
| 55 to 64 Years | 6,244 | 20.6% |
| 65 to 74 Years | 4,609 | 15.2% |
| 75 to 84 Years | 1,555 | 5.1% |
| 85 Years and Over | 785 | 2.6% |
| Total | 30,298 | 100.0% |
Housing Finances in Lake Forest
Median Income by Occupancy in Lake Forest
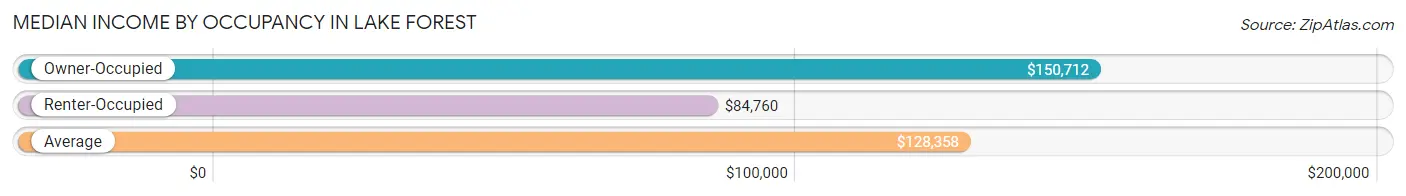
| Occupancy Type | # Households | Median Income |
| Owner-Occupied | 21,300 (70.3%) | $150,712 |
| Renter-Occupied | 8,998 (29.7%) | $84,760 |
| Average | 30,298 (100.0%) | $128,358 |
Occupancy by Householder Income Bracket in Lake Forest
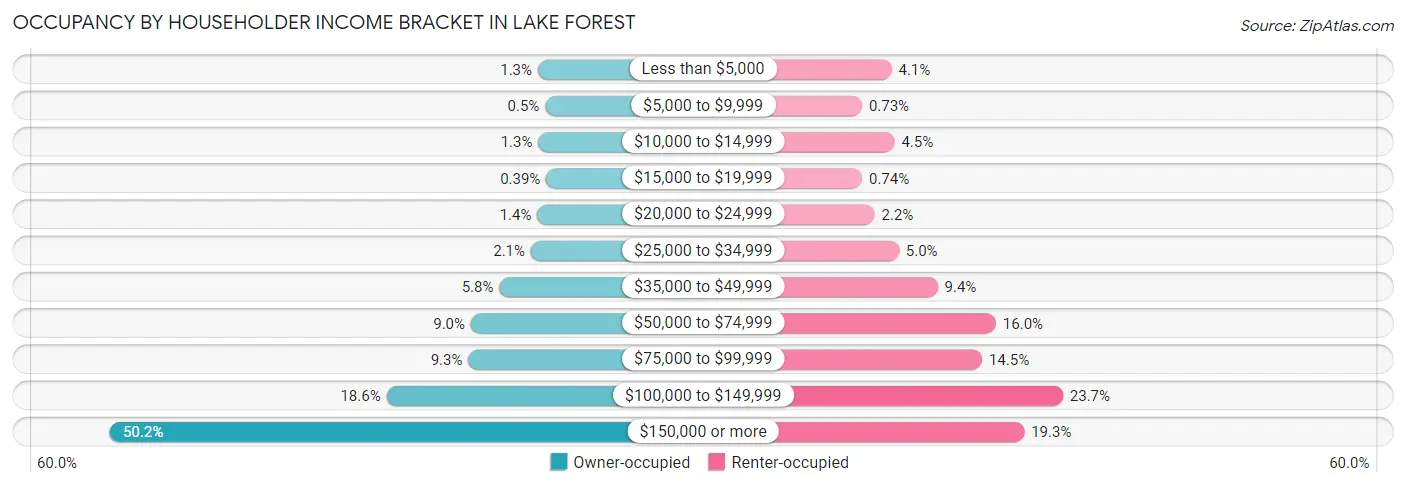
| Income Bracket | Owner-occupied | Renter-occupied |
| Less than $5,000 | 285 (1.3%) | 370 (4.1%) |
| $5,000 to $9,999 | 106 (0.5%) | 66 (0.7%) |
| $10,000 to $14,999 | 275 (1.3%) | 400 (4.4%) |
| $15,000 to $19,999 | 84 (0.4%) | 67 (0.7%) |
| $20,000 to $24,999 | 301 (1.4%) | 196 (2.2%) |
| $25,000 to $34,999 | 456 (2.1%) | 445 (5.0%) |
| $35,000 to $49,999 | 1,225 (5.8%) | 844 (9.4%) |
| $50,000 to $74,999 | 1,917 (9.0%) | 1,443 (16.0%) |
| $75,000 to $99,999 | 1,979 (9.3%) | 1,300 (14.4%) |
| $100,000 to $149,999 | 3,971 (18.6%) | 2,132 (23.7%) |
| $150,000 or more | 10,701 (50.2%) | 1,735 (19.3%) |
| Total | 21,300 (100.0%) | 8,998 (100.0%) |
Monthly Housing Cost Tiers in Lake Forest
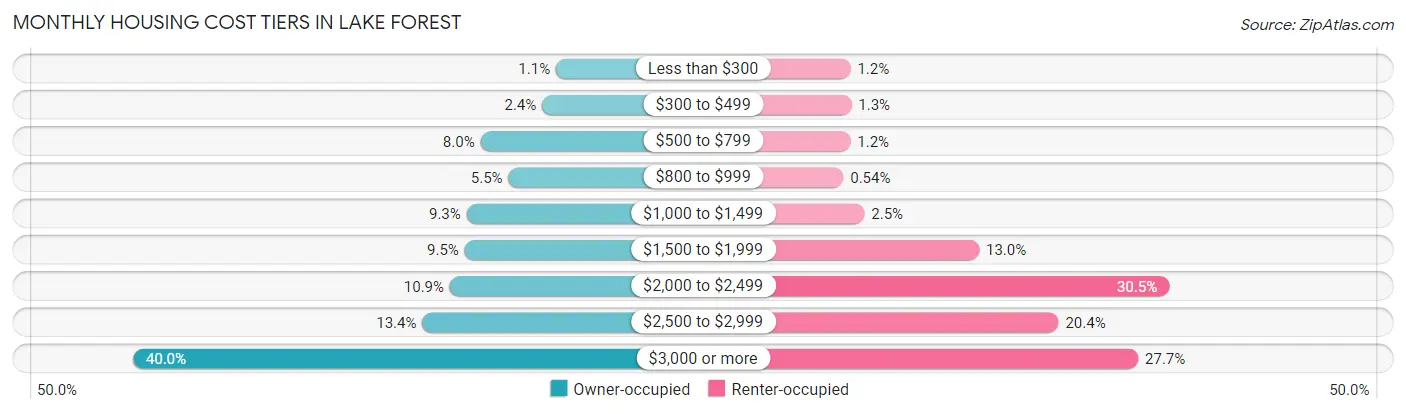
| Monthly Cost | Owner-occupied | Renter-occupied |
| Less than $300 | 230 (1.1%) | 108 (1.2%) |
| $300 to $499 | 503 (2.4%) | 115 (1.3%) |
| $500 to $799 | 1,710 (8.0%) | 107 (1.2%) |
| $800 to $999 | 1,163 (5.5%) | 49 (0.5%) |
| $1,000 to $1,499 | 1,984 (9.3%) | 223 (2.5%) |
| $1,500 to $1,999 | 2,021 (9.5%) | 1,173 (13.0%) |
| $2,000 to $2,499 | 2,310 (10.8%) | 2,747 (30.5%) |
| $2,500 to $2,999 | 2,853 (13.4%) | 1,831 (20.3%) |
| $3,000 or more | 8,526 (40.0%) | 2,491 (27.7%) |
| Total | 21,300 (100.0%) | 8,998 (100.0%) |
Physical Housing Characteristics in Lake Forest
Housing Structures in Lake Forest
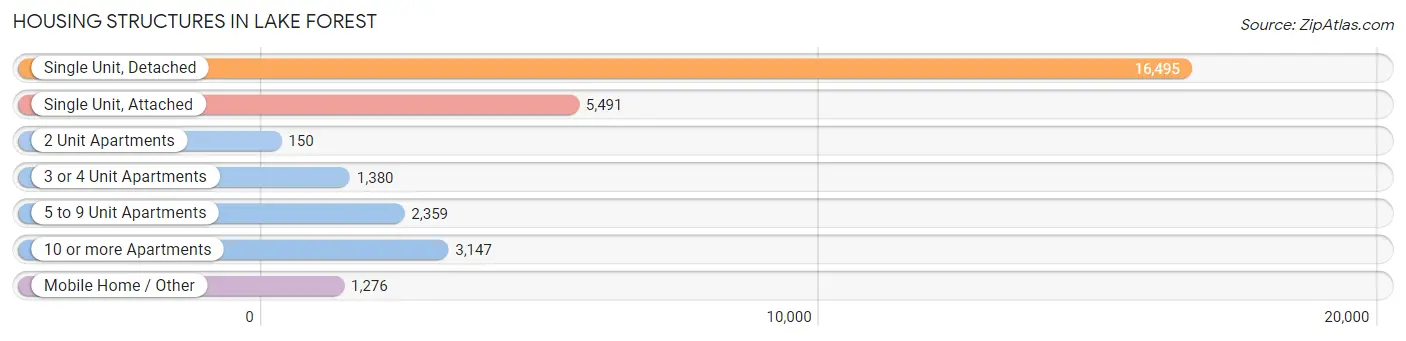
| Structure Type | # Housing Units | % Housing Units |
| Single Unit, Detached | 16,495 | 54.4% |
| Single Unit, Attached | 5,491 | 18.1% |
| 2 Unit Apartments | 150 | 0.5% |
| 3 or 4 Unit Apartments | 1,380 | 4.5% |
| 5 to 9 Unit Apartments | 2,359 | 7.8% |
| 10 or more Apartments | 3,147 | 10.4% |
| Mobile Home / Other | 1,276 | 4.2% |
| Total | 30,298 | 100.0% |
Housing Structures by Occupancy in Lake Forest
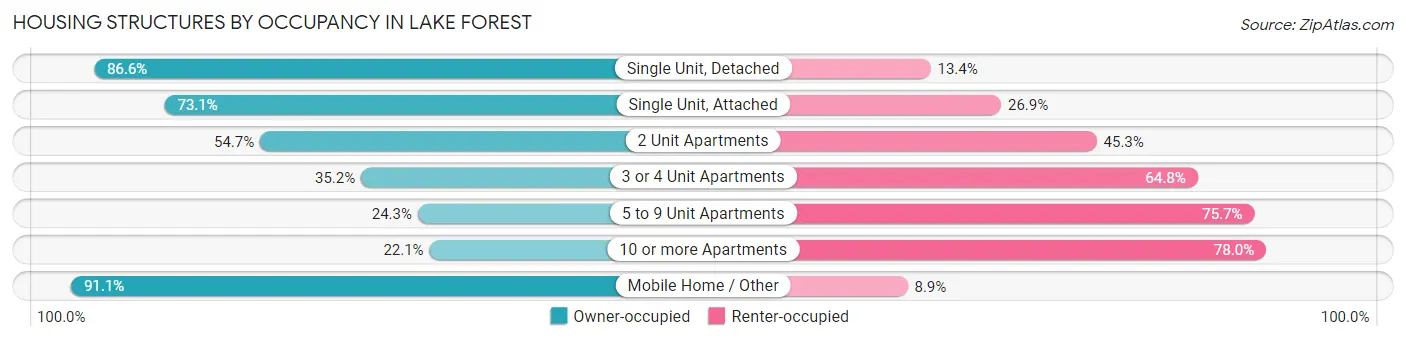
| Structure Type | Owner-occupied | Renter-occupied |
| Single Unit, Detached | 14,291 (86.6%) | 2,204 (13.4%) |
| Single Unit, Attached | 4,012 (73.1%) | 1,479 (26.9%) |
| 2 Unit Apartments | 82 (54.7%) | 68 (45.3%) |
| 3 or 4 Unit Apartments | 486 (35.2%) | 894 (64.8%) |
| 5 to 9 Unit Apartments | 573 (24.3%) | 1,786 (75.7%) |
| 10 or more Apartments | 694 (22.1%) | 2,453 (77.9%) |
| Mobile Home / Other | 1,162 (91.1%) | 114 (8.9%) |
| Total | 21,300 (70.3%) | 8,998 (29.7%) |
Housing Structures by Number of Rooms in Lake Forest
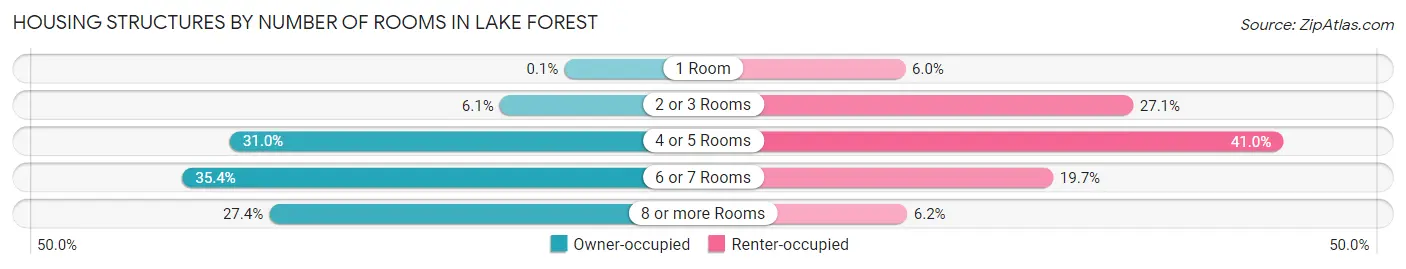
| Number of Rooms | Owner-occupied | Renter-occupied |
| 1 Room | 21 (0.1%) | 543 (6.0%) |
| 2 or 3 Rooms | 1,296 (6.1%) | 2,438 (27.1%) |
| 4 or 5 Rooms | 6,605 (31.0%) | 3,687 (41.0%) |
| 6 or 7 Rooms | 7,541 (35.4%) | 1,773 (19.7%) |
| 8 or more Rooms | 5,837 (27.4%) | 557 (6.2%) |
| Total | 21,300 (100.0%) | 8,998 (100.0%) |
Housing Structure by Heating Type in Lake Forest
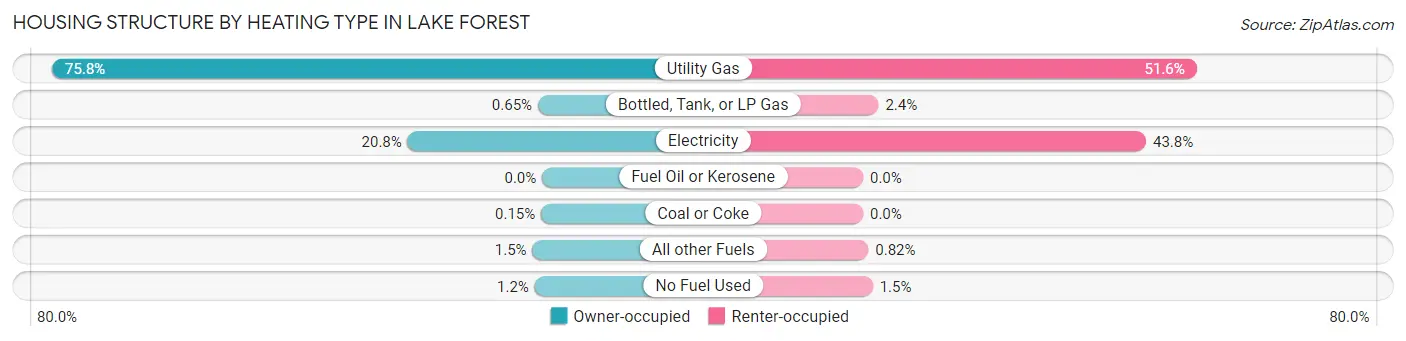
| Heating Type | Owner-occupied | Renter-occupied |
| Utility Gas | 16,138 (75.8%) | 4,639 (51.6%) |
| Bottled, Tank, or LP Gas | 139 (0.6%) | 214 (2.4%) |
| Electricity | 4,428 (20.8%) | 3,937 (43.8%) |
| Fuel Oil or Kerosene | 0 (0.0%) | 0 (0.0%) |
| Coal or Coke | 33 (0.2%) | 0 (0.0%) |
| All other Fuels | 318 (1.5%) | 74 (0.8%) |
| No Fuel Used | 244 (1.1%) | 134 (1.5%) |
| Total | 21,300 (100.0%) | 8,998 (100.0%) |
Household Vehicle Usage in Lake Forest
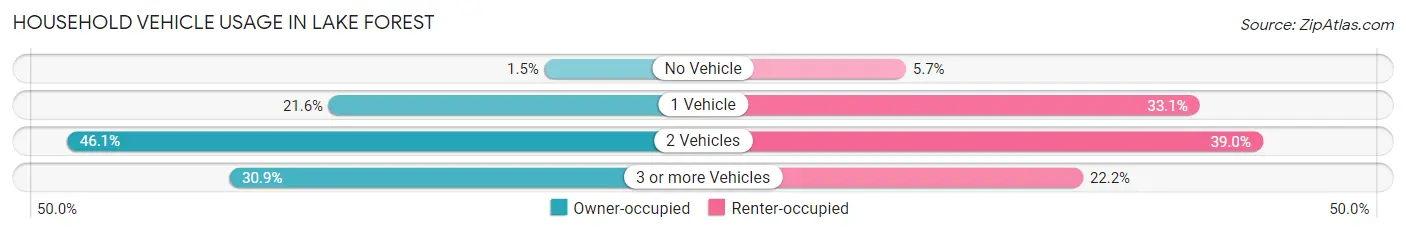
| Vehicles per Household | Owner-occupied | Renter-occupied |
| No Vehicle | 309 (1.5%) | 512 (5.7%) |
| 1 Vehicle | 4,599 (21.6%) | 2,978 (33.1%) |
| 2 Vehicles | 9,809 (46.1%) | 3,509 (39.0%) |
| 3 or more Vehicles | 6,583 (30.9%) | 1,999 (22.2%) |
| Total | 21,300 (100.0%) | 8,998 (100.0%) |
Real Estate & Mortgages in Lake Forest
Real Estate and Mortgage Overview in Lake Forest
| Characteristic | Without Mortgage | With Mortgage |
| Housing Units | 5,246 | 16,054 |
| Median Property Value | $789,400 | $849,000 |
| Median Household Income | $100,360 | $9,183 |
| Monthly Housing Costs | $863 | $8,423 |
| Real Estate Taxes | $4,210 | $309 |
Property Value by Mortgage Status in Lake Forest
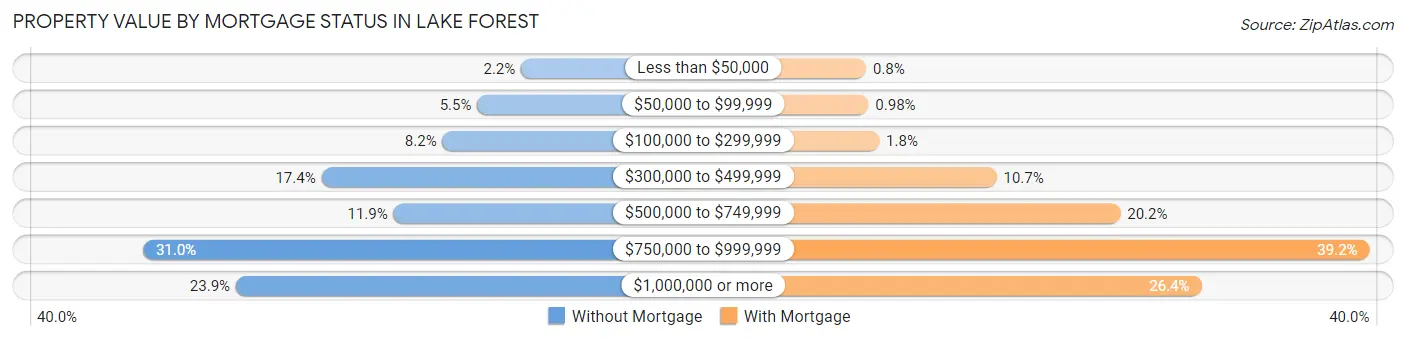
| Property Value | Without Mortgage | With Mortgage |
| Less than $50,000 | 114 (2.2%) | 129 (0.8%) |
| $50,000 to $99,999 | 289 (5.5%) | 158 (1.0%) |
| $100,000 to $299,999 | 428 (8.2%) | 289 (1.8%) |
| $300,000 to $499,999 | 912 (17.4%) | 1,724 (10.7%) |
| $500,000 to $749,999 | 624 (11.9%) | 3,238 (20.2%) |
| $750,000 to $999,999 | 1,625 (31.0%) | 6,285 (39.2%) |
| $1,000,000 or more | 1,254 (23.9%) | 4,231 (26.4%) |
| Total | 5,246 (100.0%) | 16,054 (100.0%) |
Household Income by Mortgage Status in Lake Forest
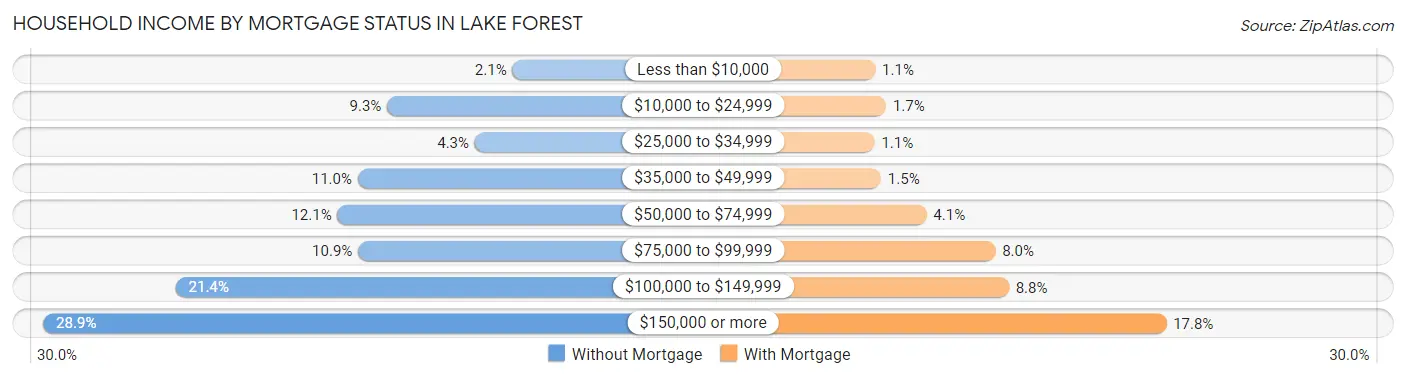
| Household Income | Without Mortgage | With Mortgage |
| Less than $10,000 | 111 (2.1%) | 180 (1.1%) |
| $10,000 to $24,999 | 487 (9.3%) | 280 (1.7%) |
| $25,000 to $34,999 | 224 (4.3%) | 173 (1.1%) |
| $35,000 to $49,999 | 575 (11.0%) | 232 (1.5%) |
| $50,000 to $74,999 | 636 (12.1%) | 650 (4.1%) |
| $75,000 to $99,999 | 574 (10.9%) | 1,281 (8.0%) |
| $100,000 to $149,999 | 1,121 (21.4%) | 1,405 (8.7%) |
| $150,000 or more | 1,518 (28.9%) | 2,850 (17.7%) |
| Total | 5,246 (100.0%) | 16,054 (100.0%) |
Property Value to Household Income Ratio in Lake Forest
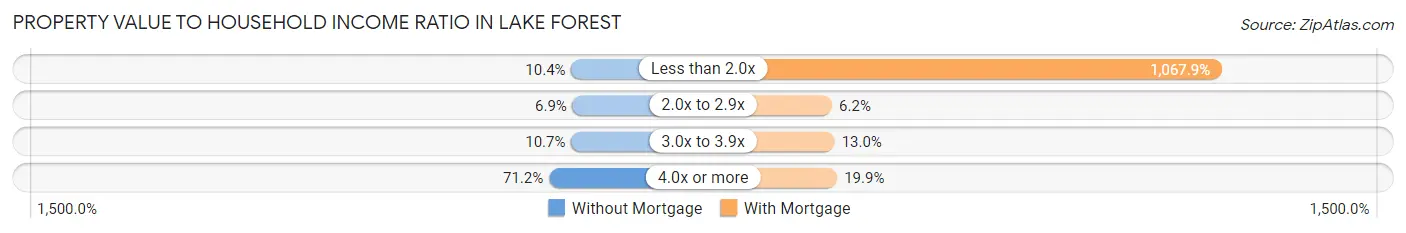
| Value-to-Income Ratio | Without Mortgage | With Mortgage |
| Less than 2.0x | 544 (10.4%) | 171,445 (1,067.9%) |
| 2.0x to 2.9x | 361 (6.9%) | 990 (6.2%) |
| 3.0x to 3.9x | 561 (10.7%) | 2,090 (13.0%) |
| 4.0x or more | 3,736 (71.2%) | 3,187 (19.9%) |
| Total | 5,246 (100.0%) | 16,054 (100.0%) |
Real Estate Taxes by Mortgage Status in Lake Forest
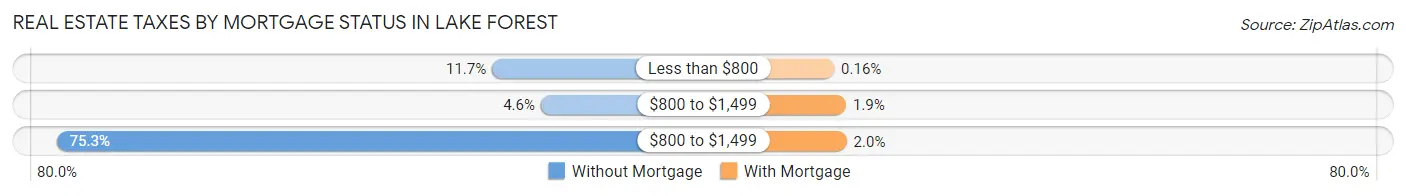
| Property Taxes | Without Mortgage | With Mortgage |
| Less than $800 | 614 (11.7%) | 26 (0.2%) |
| $800 to $1,499 | 240 (4.6%) | 304 (1.9%) |
| $800 to $1,499 | 3,951 (75.3%) | 319 (2.0%) |
| Total | 5,246 (100.0%) | 16,054 (100.0%) |
Health & Disability in Lake Forest
Health Insurance Coverage by Age in Lake Forest
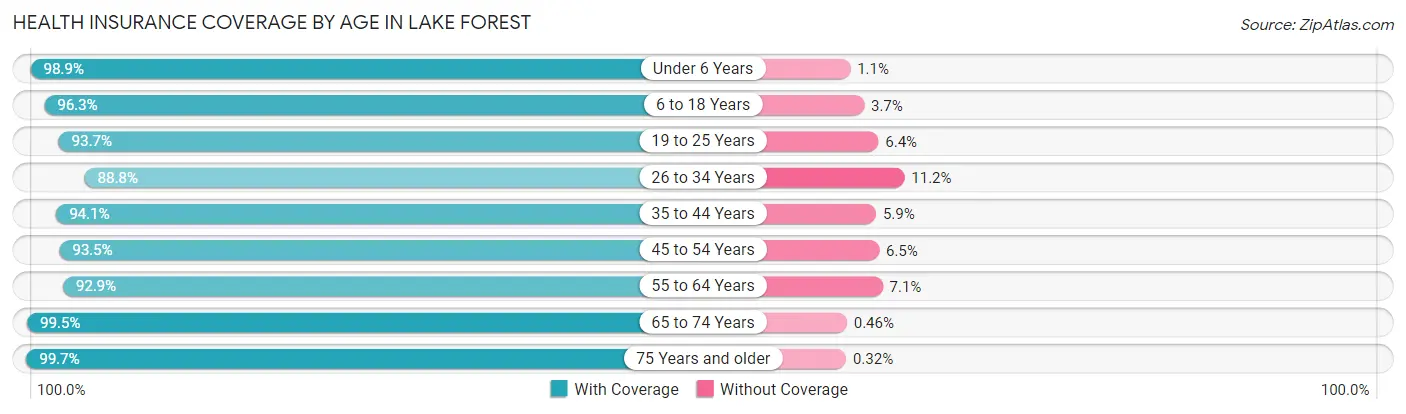
| Age Bracket | With Coverage | Without Coverage |
| Under 6 Years | 6,343 (98.9%) | 71 (1.1%) |
| 6 to 18 Years | 11,544 (96.3%) | 441 (3.7%) |
| 19 to 25 Years | 6,741 (93.6%) | 457 (6.4%) |
| 26 to 34 Years | 9,259 (88.8%) | 1,168 (11.2%) |
| 35 to 44 Years | 12,125 (94.1%) | 761 (5.9%) |
| 45 to 54 Years | 12,477 (93.5%) | 865 (6.5%) |
| 55 to 64 Years | 10,385 (92.9%) | 799 (7.1%) |
| 65 to 74 Years | 7,784 (99.5%) | 36 (0.5%) |
| 75 Years and older | 4,062 (99.7%) | 13 (0.3%) |
| Total | 80,720 (94.6%) | 4,611 (5.4%) |
Health Insurance Coverage by Citizenship Status in Lake Forest
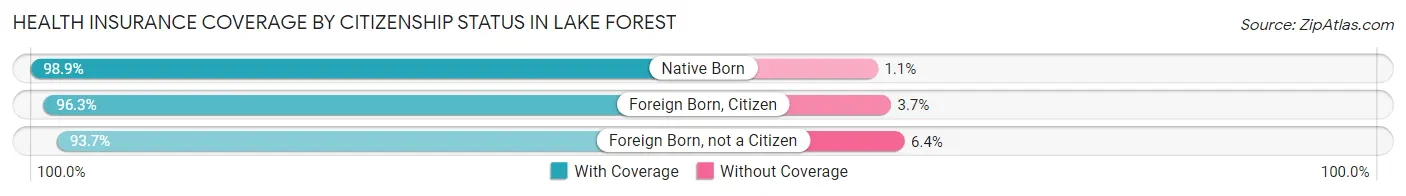
| Citizenship Status | With Coverage | Without Coverage |
| Native Born | 6,343 (98.9%) | 71 (1.1%) |
| Foreign Born, Citizen | 11,544 (96.3%) | 441 (3.7%) |
| Foreign Born, not a Citizen | 6,741 (93.6%) | 457 (6.4%) |
Health Insurance Coverage by Household Income in Lake Forest
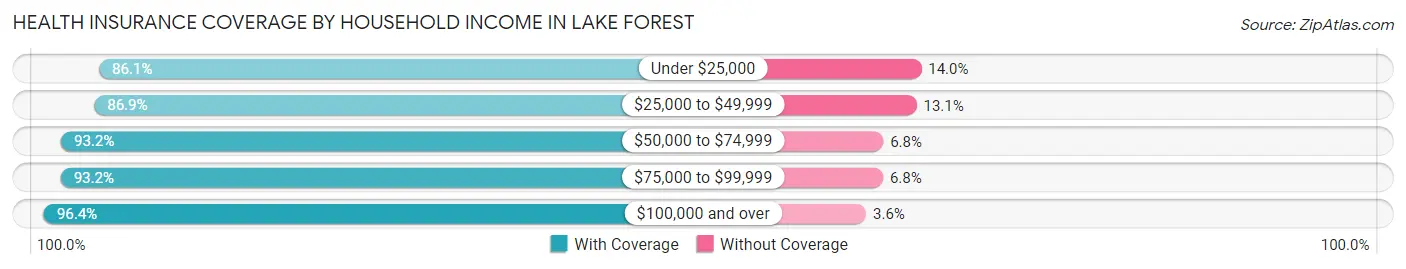
| Household Income | With Coverage | Without Coverage |
| Under $25,000 | 3,084 (86.1%) | 500 (14.0%) |
| $25,000 to $49,999 | 5,827 (86.9%) | 876 (13.1%) |
| $50,000 to $74,999 | 7,426 (93.2%) | 544 (6.8%) |
| $75,000 to $99,999 | 7,695 (93.2%) | 559 (6.8%) |
| $100,000 and over | 56,203 (96.4%) | 2,112 (3.6%) |
Public vs Private Health Insurance Coverage by Age in Lake Forest
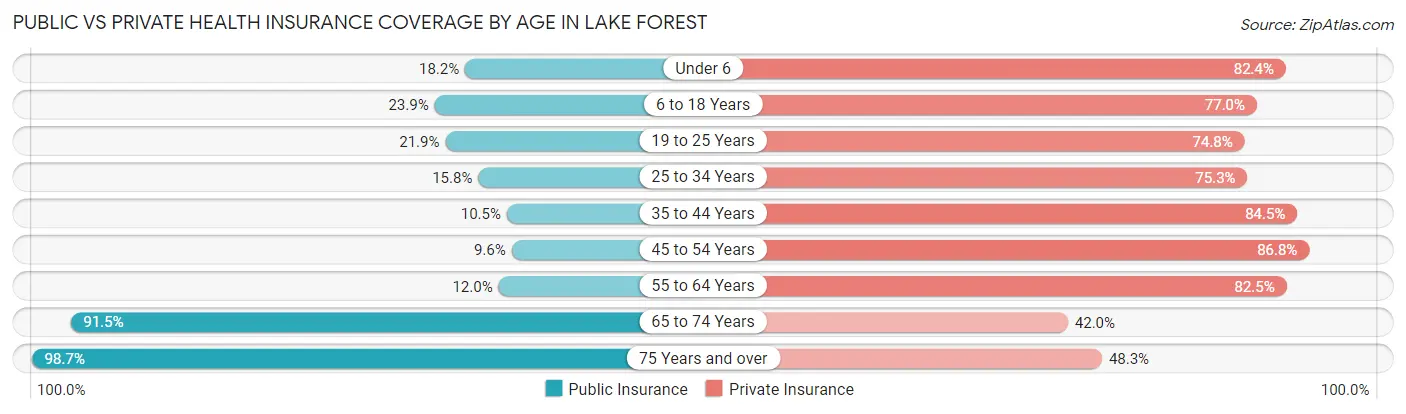
| Age Bracket | Public Insurance | Private Insurance |
| Under 6 | 1,170 (18.2%) | 5,286 (82.4%) |
| 6 to 18 Years | 2,867 (23.9%) | 9,233 (77.0%) |
| 19 to 25 Years | 1,577 (21.9%) | 5,381 (74.8%) |
| 25 to 34 Years | 1,647 (15.8%) | 7,849 (75.3%) |
| 35 to 44 Years | 1,353 (10.5%) | 10,893 (84.5%) |
| 45 to 54 Years | 1,284 (9.6%) | 11,574 (86.8%) |
| 55 to 64 Years | 1,347 (12.0%) | 9,231 (82.5%) |
| 65 to 74 Years | 7,156 (91.5%) | 3,281 (42.0%) |
| 75 Years and over | 4,023 (98.7%) | 1,968 (48.3%) |
| Total | 22,424 (26.3%) | 64,696 (75.8%) |
Disability Status by Sex by Age in Lake Forest
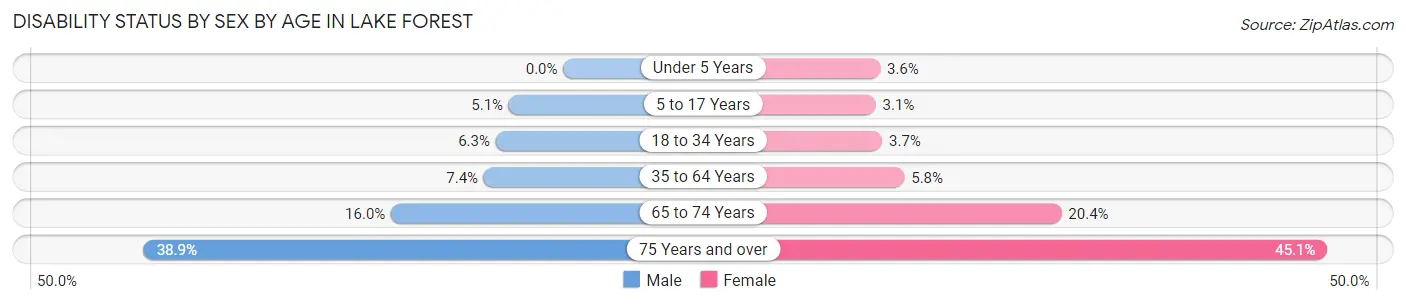
| Age Bracket | Male | Female |
| Under 5 Years | 0 (0.0%) | 91 (3.5%) |
| 5 to 17 Years | 325 (5.1%) | 175 (3.1%) |
| 18 to 34 Years | 584 (6.3%) | 345 (3.7%) |
| 35 to 64 Years | 1,356 (7.4%) | 1,103 (5.8%) |
| 65 to 74 Years | 586 (16.0%) | 846 (20.4%) |
| 75 Years and over | 574 (38.9%) | 1,172 (45.1%) |
Disability Class by Sex by Age in Lake Forest
Disability Class: Hearing Difficulty
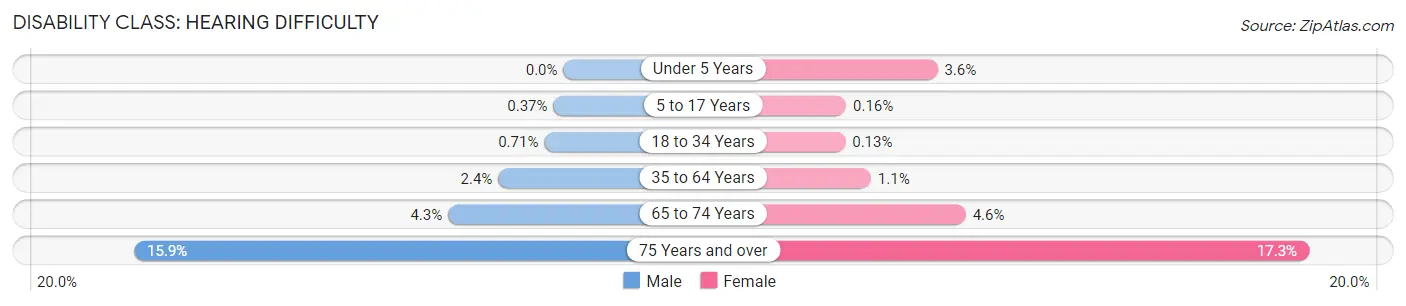
| Age Bracket | Male | Female |
| Under 5 Years | 0 (0.0%) | 91 (3.5%) |
| 5 to 17 Years | 24 (0.4%) | 9 (0.2%) |
| 18 to 34 Years | 66 (0.7%) | 12 (0.1%) |
| 35 to 64 Years | 445 (2.4%) | 205 (1.1%) |
| 65 to 74 Years | 157 (4.3%) | 191 (4.6%) |
| 75 Years and over | 235 (15.9%) | 451 (17.3%) |
Disability Class: Vision Difficulty
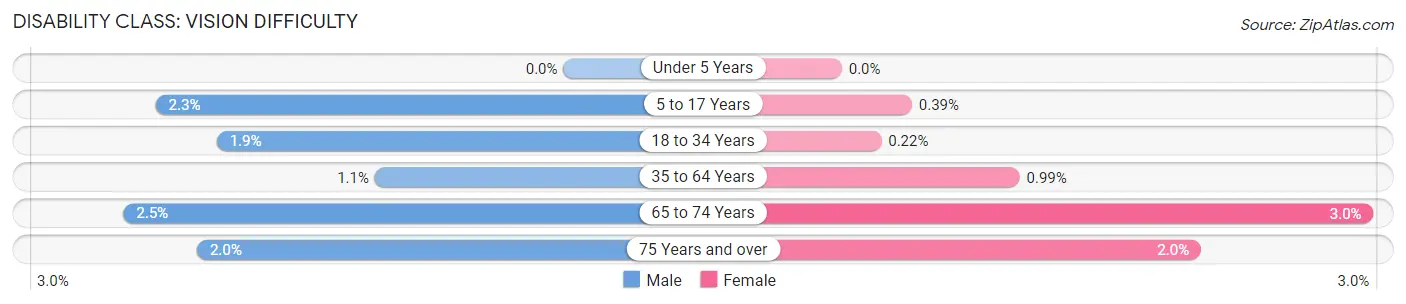
| Age Bracket | Male | Female |
| Under 5 Years | 0 (0.0%) | 0 (0.0%) |
| 5 to 17 Years | 146 (2.3%) | 22 (0.4%) |
| 18 to 34 Years | 180 (1.9%) | 20 (0.2%) |
| 35 to 64 Years | 193 (1.1%) | 189 (1.0%) |
| 65 to 74 Years | 90 (2.5%) | 123 (3.0%) |
| 75 Years and over | 30 (2.0%) | 52 (2.0%) |
Disability Class: Cognitive Difficulty
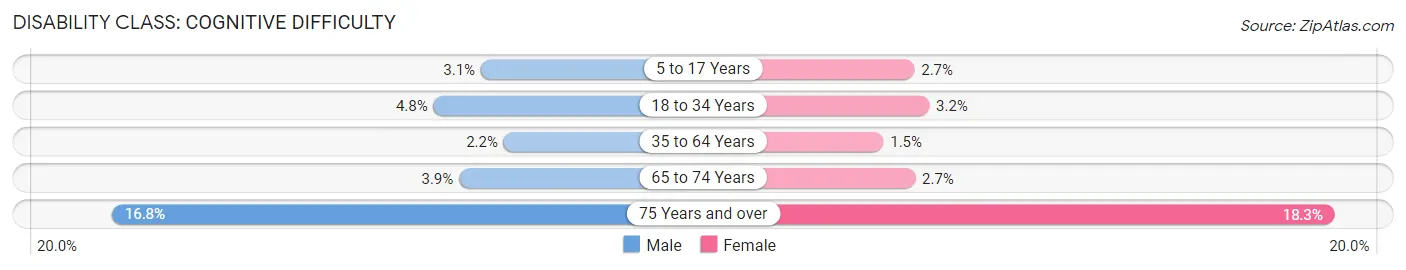
| Age Bracket | Male | Female |
| 5 to 17 Years | 197 (3.1%) | 150 (2.7%) |
| 18 to 34 Years | 449 (4.8%) | 299 (3.2%) |
| 35 to 64 Years | 406 (2.2%) | 292 (1.5%) |
| 65 to 74 Years | 142 (3.9%) | 113 (2.7%) |
| 75 Years and over | 247 (16.8%) | 476 (18.3%) |
Disability Class: Ambulatory Difficulty
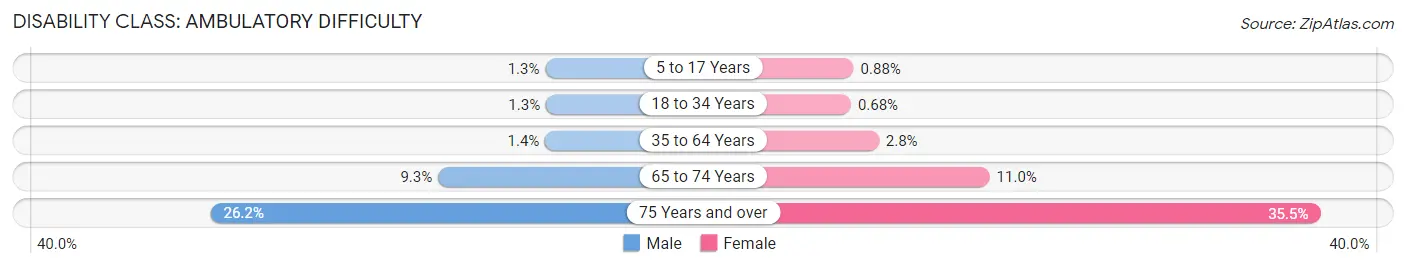
| Age Bracket | Male | Female |
| 5 to 17 Years | 86 (1.3%) | 49 (0.9%) |
| 18 to 34 Years | 120 (1.3%) | 63 (0.7%) |
| 35 to 64 Years | 248 (1.3%) | 522 (2.8%) |
| 65 to 74 Years | 341 (9.3%) | 456 (11.0%) |
| 75 Years and over | 386 (26.2%) | 924 (35.5%) |
Disability Class: Self-Care Difficulty
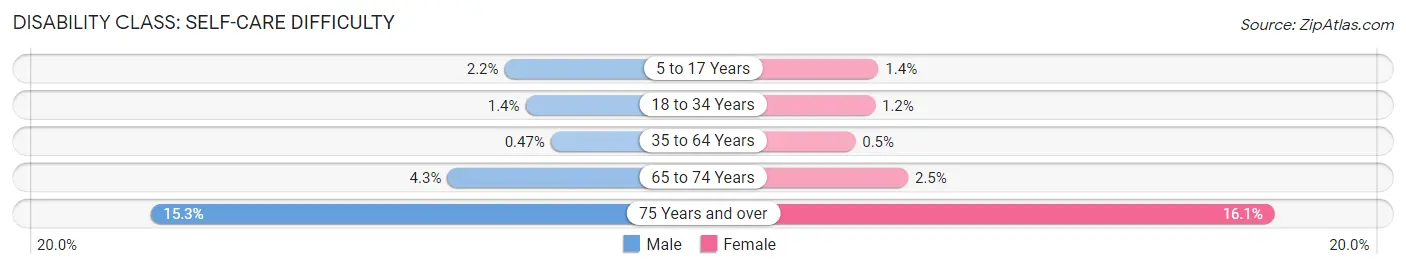
| Age Bracket | Male | Female |
| 5 to 17 Years | 141 (2.2%) | 76 (1.4%) |
| 18 to 34 Years | 131 (1.4%) | 114 (1.2%) |
| 35 to 64 Years | 86 (0.5%) | 95 (0.5%) |
| 65 to 74 Years | 158 (4.3%) | 102 (2.5%) |
| 75 Years and over | 226 (15.3%) | 418 (16.1%) |
Technology Access in Lake Forest
Computing Device Access in Lake Forest
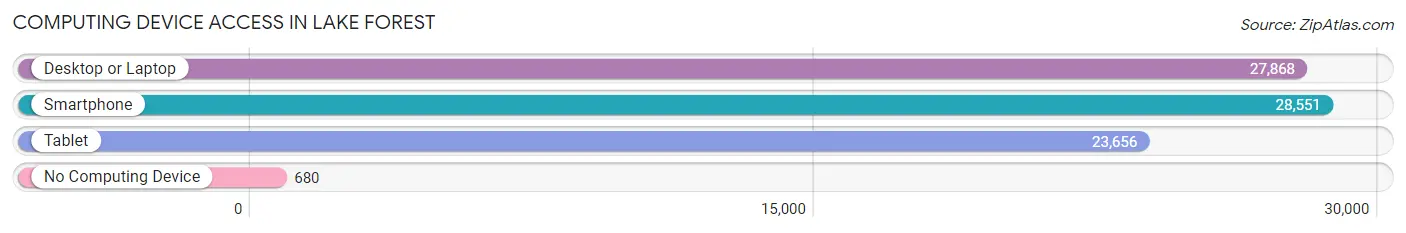
| Device Type | # Households | % Households |
| Desktop or Laptop | 27,868 | 92.0% |
| Smartphone | 28,551 | 94.2% |
| Tablet | 23,656 | 78.1% |
| No Computing Device | 680 | 2.2% |
| Total | 30,298 | 100.0% |
Internet Access in Lake Forest
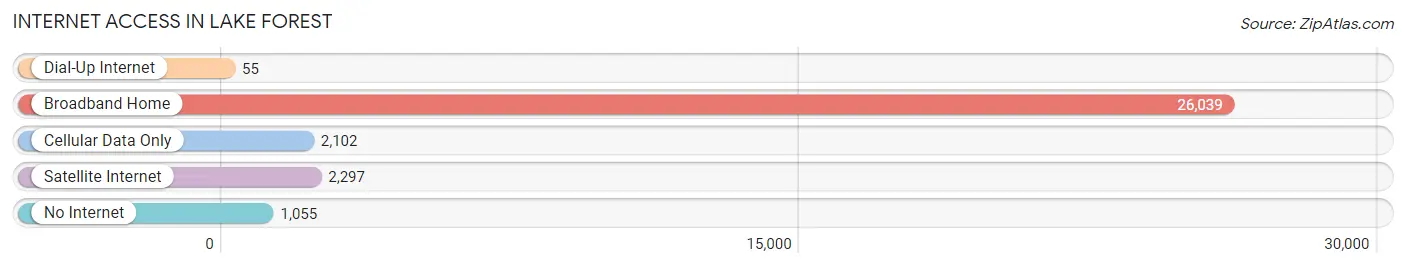
| Internet Type | # Households | % Households |
| Dial-Up Internet | 55 | 0.2% |
| Broadband Home | 26,039 | 85.9% |
| Cellular Data Only | 2,102 | 6.9% |
| Satellite Internet | 2,297 | 7.6% |
| No Internet | 1,055 | 3.5% |
| Total | 30,298 | 100.0% |
Lake Forest Summary
Introduction
Located in Orange County, California, the city of Lake Forest is a vibrant and diverse community. With a population of 77,264 as of the 2010 census, Lake Forest is the second largest city in Orange County. The city is known for its beautiful parks, trails, and open spaces, as well as its excellent schools and businesses. Lake Forest is also home to a variety of cultural and recreational activities, making it a great place to live and work.
History
The area that is now Lake Forest was originally inhabited by the Acjachemen Native American tribe. The first Europeans to settle in the area were Spanish missionaries, who established the Mission San Juan Capistrano in 1776. The area was later part of the Rancho Lomas de Santiago, which was granted to Jose Antonio Yorba in 1810. The area was then divided into several smaller ranches, and in 1856, the El Toro Rancho was established.
In the late 1800s, the area began to be developed for agriculture, and in 1891, the El Toro Land and Water Company was formed to develop the area. The company built a railroad line to connect the area to Los Angeles, and in 1894, the first post office was established. The city of Lake Forest was officially incorporated in 1991.
Geography
Lake Forest is located in Orange County, California, about 40 miles south of Los Angeles. The city covers an area of 17.1 square miles, and is bordered by the cities of Irvine, Mission Viejo, Laguna Hills, and Laguna Woods. The city is situated in the foothills of the Santa Ana Mountains, and is home to several parks and open spaces, including the Whiting Ranch Wilderness Park, the Lake Forest Sports Park, and the Serrano Creek Park.
Economy
Lake Forest is home to a variety of businesses and industries, including retail, manufacturing, and technology. The city is home to several major employers, including the headquarters of the El Toro Marine Corps Air Station, the headquarters of the Saddleback Valley Unified School District, and the headquarters of the Lake Forest Sports Park. The city is also home to several shopping centers, including the Foothill Ranch Towne Center, the Lake Forest Towne Center, and the Lake Forest Plaza.
Demographics
As of the 2010 census, the population of Lake Forest was 77,264. The racial makeup of the city was 68.2% White, 11.2% Asian, 8.3% Hispanic or Latino, and 6.2% African American. The median household income was $90,845, and the median age was 37.
Conclusion
Lake Forest is a vibrant and diverse city located in Orange County, California. The city is known for its beautiful parks and open spaces, excellent schools, and thriving businesses. With a population of 77,264, Lake Forest is the second largest city in Orange County, and is home to a variety of cultural and recreational activities. The city is also home to a variety of businesses and industries, making it a great place to live and work.
Common Questions
What is Per Capita Income in Lake Forest?
Per Capita income in Lake Forest is $56,627.
What is the Median Family Income in Lake Forest?
Median Family Income in Lake Forest is $147,450.
What is the Median Household income in Lake Forest?
Median Household Income in Lake Forest is $128,358.
What is Income or Wage Gap in Lake Forest?
Income or Wage Gap in Lake Forest is 35.7%.
Women in Lake Forest earn 64.3 cents for every dollar earned by a man.
What is Family Income Deficit in Lake Forest?
Family Income Deficit in Lake Forest is $10,731.
Families that are below poverty line in Lake Forest earn $10,731 less on average than the poverty threshold level.
What is Inequality or Gini Index in Lake Forest?
Inequality or Gini Index in Lake Forest is 0.41.
What is the Total Population of Lake Forest?
Total Population of Lake Forest is 85,583.
What is the Total Male Population of Lake Forest?
Total Male Population of Lake Forest is 42,347.
What is the Total Female Population of Lake Forest?
Total Female Population of Lake Forest is 43,236.
What is the Ratio of Males per 100 Females in Lake Forest?
There are 97.94 Males per 100 Females in Lake Forest.
What is the Ratio of Females per 100 Males in Lake Forest?
There are 102.10 Females per 100 Males in Lake Forest.
What is the Median Population Age in Lake Forest?
Median Population Age in Lake Forest is 40.0 Years.
What is the Average Family Size in Lake Forest
Average Family Size in Lake Forest is 3.3 People.
What is the Average Household Size in Lake Forest
Average Household Size in Lake Forest is 2.8 People.
How Large is the Labor Force in Lake Forest?
There are 48,547 People in the Labor Forcein in Lake Forest.
What is the Percentage of People in the Labor Force in Lake Forest?
69.2% of People are in the Labor Force in Lake Forest.
What is the Unemployment Rate in Lake Forest?
Unemployment Rate in Lake Forest is 5.0%.