Dublin, CA Map & Demographics
Dublin Map
Dublin Overview
$76,941
PER CAPITA INCOME
$214,058
AVG FAMILY INCOME
$191,039
AVG HOUSEHOLD INCOME
46.0%
WAGE / INCOME GAP [ % ]
54.0¢/ $1
WAGE / INCOME GAP [ $ ]
0.40
INEQUALITY / GINI INDEX
71,068
TOTAL POPULATION
35,603
MALE POPULATION
35,465
FEMALE POPULATION
100.39
MALES / 100 FEMALES
99.61
FEMALES / 100 MALES
37.1
MEDIAN AGE
3.3
AVG FAMILY SIZE
2.9
AVG HOUSEHOLD SIZE
37,969
LABOR FORCE [ PEOPLE ]
69.9%
PERCENT IN LABOR FORCE
3.4%
UNEMPLOYMENT RATE
Dublin Zip Codes
Dublin Area Codes
Income in Dublin
Income Overview in Dublin
Per Capita Income in Dublin is $76,941, while median incomes of families and households are $214,058 and $191,039 respectively.
| Characteristic | Number | Measure |
| Per Capita Income | 71,068 | $76,941 |
| Median Family Income | 18,507 | $214,058 |
| Mean Family Income | 18,507 | $248,166 |
| Median Household Income | 23,583 | $191,039 |
| Mean Household Income | 23,583 | $228,282 |
| Income Deficit | 18,507 | $0 |
| Wage / Income Gap (%) | 71,068 | 46.03% |
| Wage / Income Gap ($) | 71,068 | 53.97¢ per $1 |
| Gini / Inequality Index | 71,068 | 0.40 |
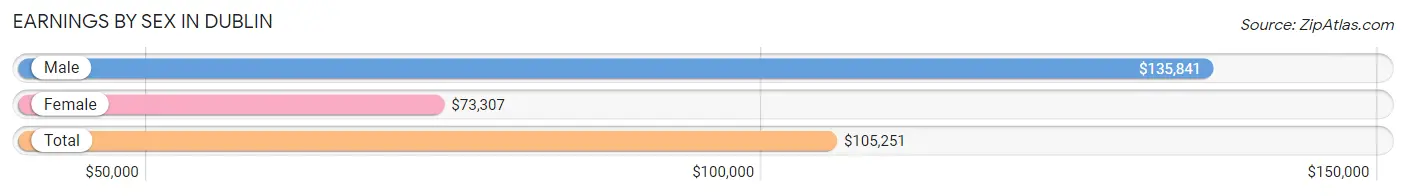
Earnings by Sex in Dublin
Average Earnings in Dublin are $105,251, $135,841 for men and $73,307 for women, a difference of 46.0%.
| Sex | Number | Average Earnings |
| Male | 21,755 (55.0%) | $135,841 |
| Female | 17,813 (45.0%) | $73,307 |
| Total | 39,568 (100.0%) | $105,251 |
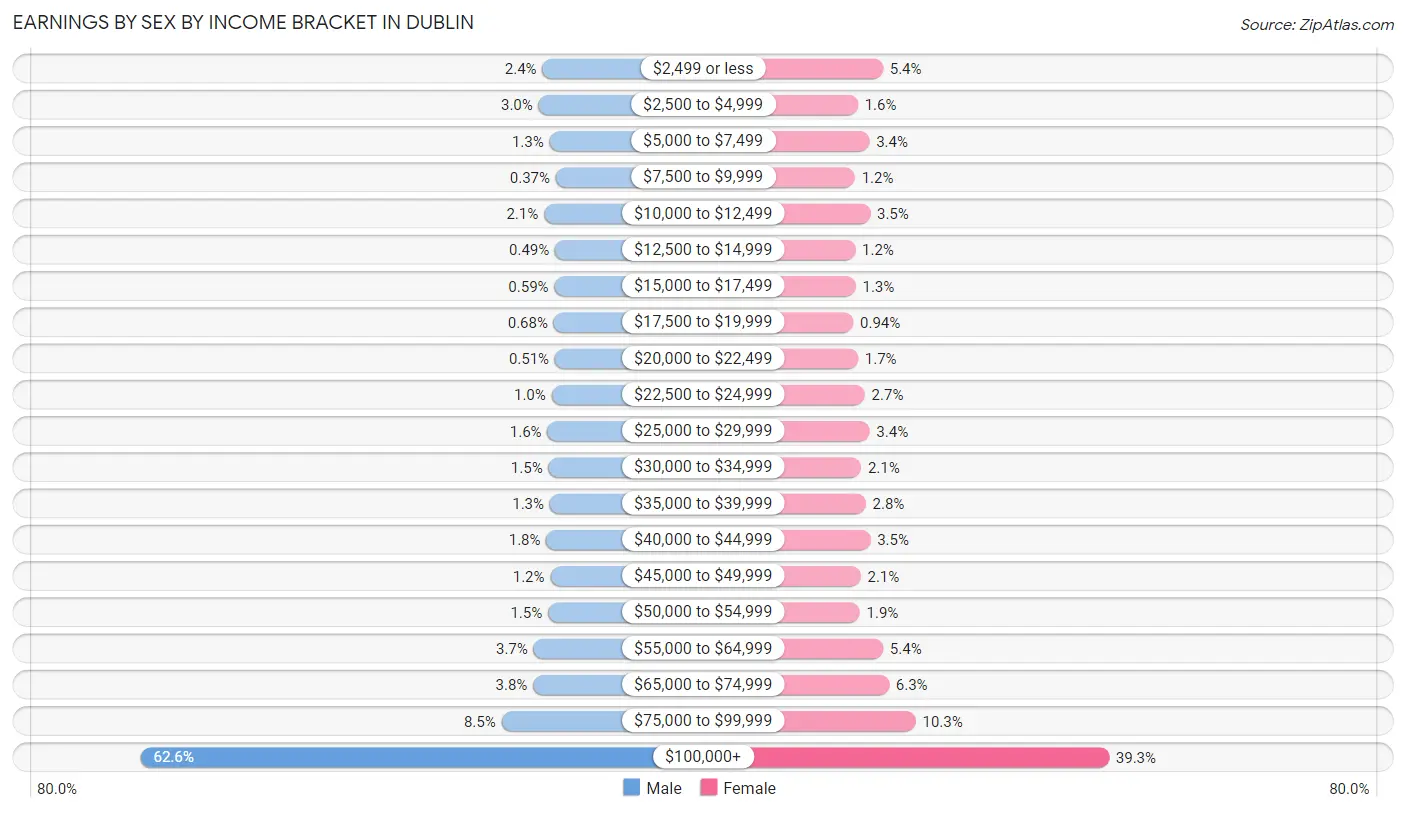
Earnings by Sex by Income Bracket in Dublin
The most common earnings brackets in Dublin are $100,000+ for men (13,622 | 62.6%) and $100,000+ for women (6,997 | 39.3%).
| Income | Male | Female |
| $2,499 or less | 520 (2.4%) | 960 (5.4%) |
| $2,500 to $4,999 | 644 (3.0%) | 292 (1.6%) |
| $5,000 to $7,499 | 287 (1.3%) | 599 (3.4%) |
| $7,500 to $9,999 | 80 (0.4%) | 212 (1.2%) |
| $10,000 to $12,499 | 466 (2.1%) | 620 (3.5%) |
| $12,500 to $14,999 | 106 (0.5%) | 220 (1.2%) |
| $15,000 to $17,499 | 129 (0.6%) | 234 (1.3%) |
| $17,500 to $19,999 | 148 (0.7%) | 167 (0.9%) |
| $20,000 to $22,499 | 110 (0.5%) | 295 (1.7%) |
| $22,500 to $24,999 | 220 (1.0%) | 477 (2.7%) |
| $25,000 to $29,999 | 357 (1.6%) | 604 (3.4%) |
| $30,000 to $34,999 | 321 (1.5%) | 379 (2.1%) |
| $35,000 to $39,999 | 276 (1.3%) | 502 (2.8%) |
| $40,000 to $44,999 | 392 (1.8%) | 625 (3.5%) |
| $45,000 to $49,999 | 262 (1.2%) | 367 (2.1%) |
| $50,000 to $54,999 | 335 (1.5%) | 342 (1.9%) |
| $55,000 to $64,999 | 808 (3.7%) | 963 (5.4%) |
| $65,000 to $74,999 | 820 (3.8%) | 1,123 (6.3%) |
| $75,000 to $99,999 | 1,852 (8.5%) | 1,835 (10.3%) |
| $100,000+ | 13,622 (62.6%) | 6,997 (39.3%) |
| Total | 21,755 (100.0%) | 17,813 (100.0%) |
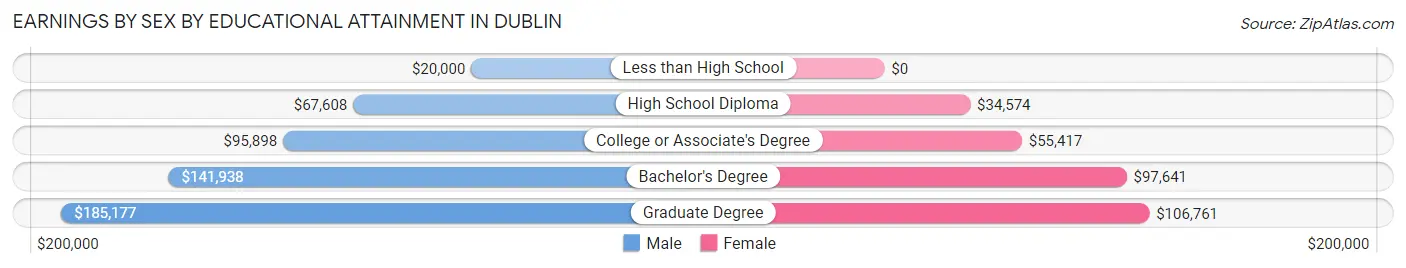
Earnings by Sex by Educational Attainment in Dublin
Average earnings in Dublin are $143,295 for men and $81,870 for women, a difference of 42.9%. Men with an educational attainment of graduate degree enjoy the highest average annual earnings of $185,177, while those with less than high school education earn the least with $20,000. Women with an educational attainment of graduate degree earn the most with the average annual earnings of $106,761, while those with high school diploma education have the smallest earnings of $34,574.
| Educational Attainment | Male Income | Female Income |
| Less than High School | $20,000 | $0 |
| High School Diploma | $67,608 | $34,574 |
| College or Associate's Degree | $95,898 | $55,417 |
| Bachelor's Degree | $141,938 | $97,641 |
| Graduate Degree | $185,177 | $106,761 |
| Total | $143,295 | $81,870 |
Family Income in Dublin
Family Income Brackets in Dublin
According to the Dublin family income data, there are 10,049 families falling into the $200,000+ income range, which is the most common income bracket and makes up 54.3% of all families. Conversely, the $10,000 to $14,999 income bracket is the least frequent group with only 185 families (1.0%) belonging to this category.
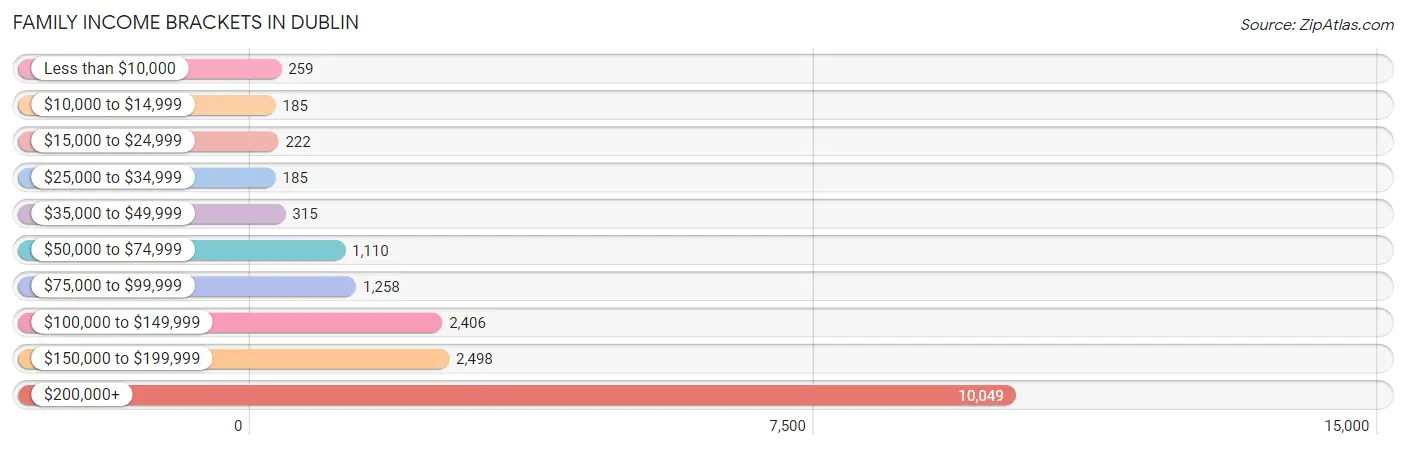
| Income Bracket | # Families | % Families |
| Less than $10,000 | 259 | 1.4% |
| $10,000 to $14,999 | 185 | 1.0% |
| $15,000 to $24,999 | 222 | 1.2% |
| $25,000 to $34,999 | 185 | 1.0% |
| $35,000 to $49,999 | 315 | 1.7% |
| $50,000 to $74,999 | 1,110 | 6.0% |
| $75,000 to $99,999 | 1,258 | 6.8% |
| $100,000 to $149,999 | 2,406 | 13.0% |
| $150,000 to $199,999 | 2,498 | 13.5% |
| $200,000+ | 10,049 | 54.3% |
Family Income by Famaliy Size in Dublin
6-person families (518 | 2.8%) account for the highest median family income in Dublin with $250,001 per family, while 3-person families (4,938 | 26.7%) have the highest median income of $79,660 per family member.
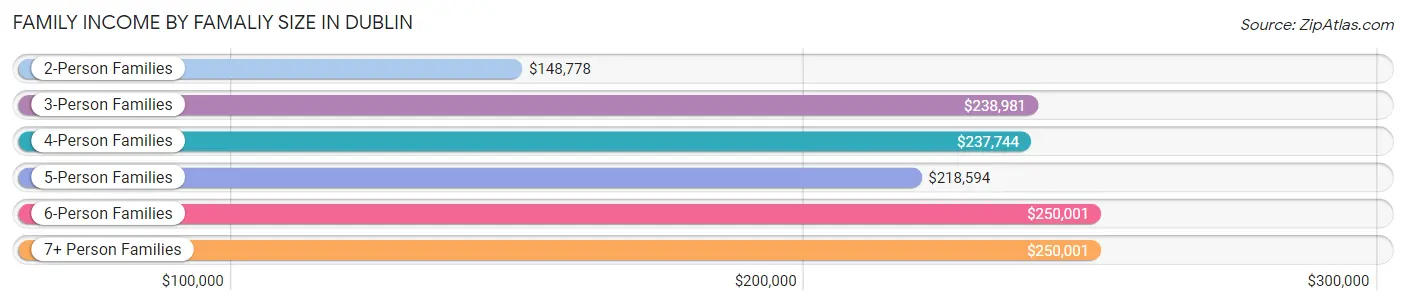
| Income Bracket | # Families | Median Income |
| 2-Person Families | 5,988 (32.4%) | $148,778 |
| 3-Person Families | 4,938 (26.7%) | $238,981 |
| 4-Person Families | 5,840 (31.6%) | $237,744 |
| 5-Person Families | 1,029 (5.6%) | $218,594 |
| 6-Person Families | 518 (2.8%) | $250,001 |
| 7+ Person Families | 194 (1.1%) | $250,001 |
| Total | 18,507 (100.0%) | $214,058 |
Family Income by Number of Earners in Dublin
The median family income in Dublin is $214,058, with families comprising 2 earners (9,642) having the highest median family income of $250,001, while families with no earners (1,213) have the lowest median family income of $70,762, accounting for 52.1% and 6.6% of families, respectively.
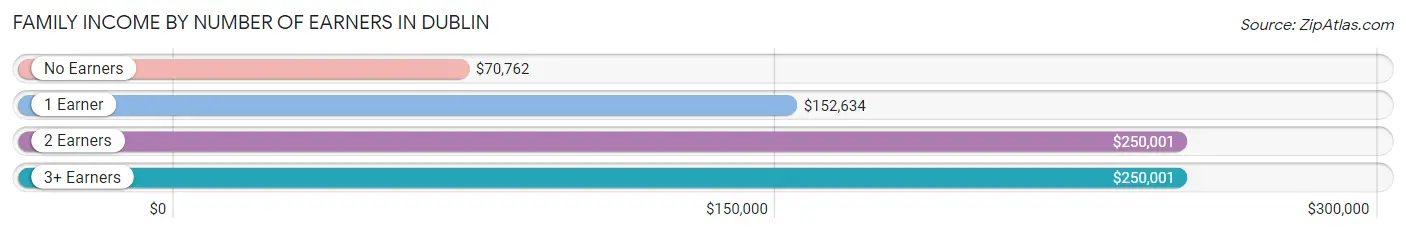
| Number of Earners | # Families | Median Income |
| No Earners | 1,213 (6.6%) | $70,762 |
| 1 Earner | 5,642 (30.5%) | $152,634 |
| 2 Earners | 9,642 (52.1%) | $250,001 |
| 3+ Earners | 2,010 (10.9%) | $250,001 |
| Total | 18,507 (100.0%) | $214,058 |
Household Income in Dublin
Household Income Brackets in Dublin
With 11,367 households falling in the category, the $200,000+ income range is the most frequent in Dublin, accounting for 48.2% of all households. In contrast, only 330 households (1.4%) fall into the $15,000 to $24,999 income bracket, making it the least populous group.
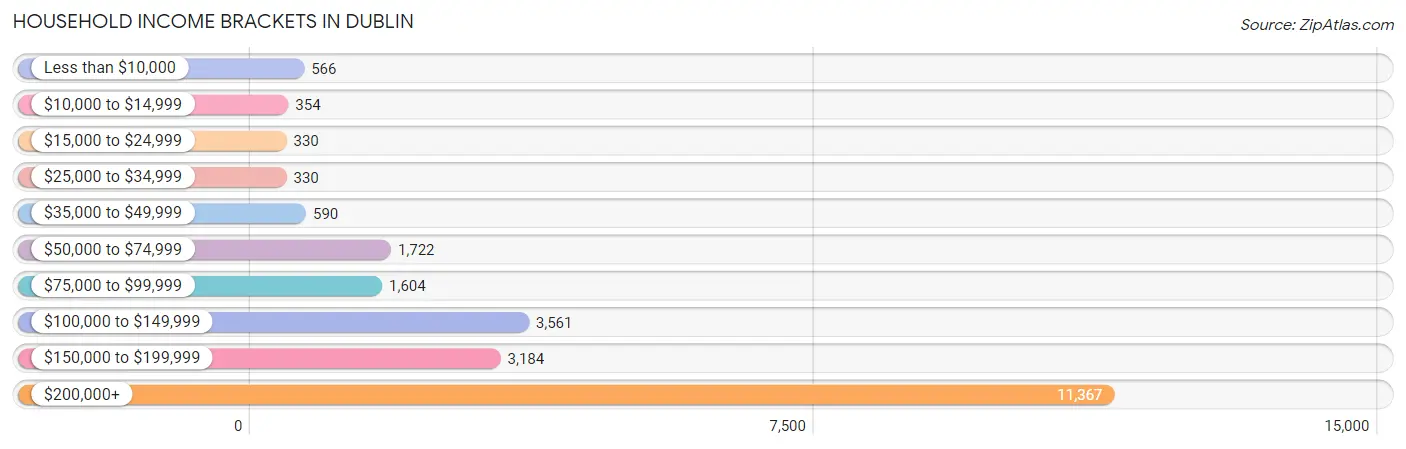
| Income Bracket | # Households | % Households |
| Less than $10,000 | 566 | 2.4% |
| $10,000 to $14,999 | 354 | 1.5% |
| $15,000 to $24,999 | 330 | 1.4% |
| $25,000 to $34,999 | 330 | 1.4% |
| $35,000 to $49,999 | 590 | 2.5% |
| $50,000 to $74,999 | 1,722 | 7.3% |
| $75,000 to $99,999 | 1,604 | 6.8% |
| $100,000 to $149,999 | 3,561 | 15.1% |
| $150,000 to $199,999 | 3,184 | 13.5% |
| $200,000+ | 11,367 | 48.2% |
Household Income by Householder Age in Dublin
The median household income in Dublin is $191,039, with the highest median household income of $212,852 found in the 25 to 44 years age bracket for the primary householder. A total of 11,013 households (46.7%) fall into this category. Meanwhile, the 15 to 24 years age bracket for the primary householder has the lowest median household income of $74,085, with 226 households (1.0%) in this group.
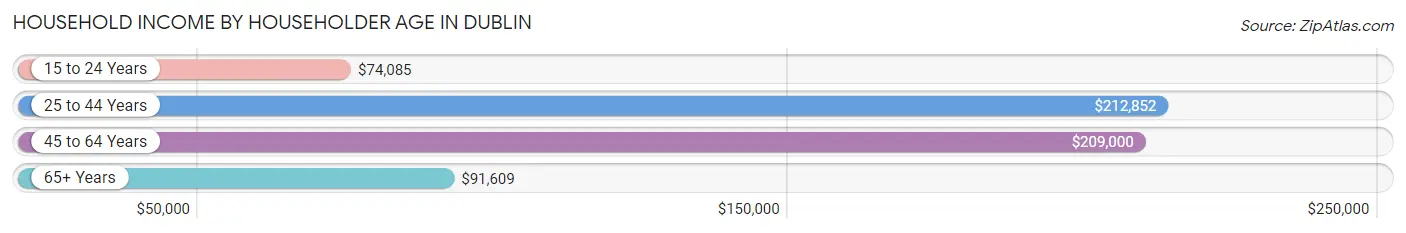
| Income Bracket | # Households | Median Income |
| 15 to 24 Years | 226 (1.0%) | $74,085 |
| 25 to 44 Years | 11,013 (46.7%) | $212,852 |
| 45 to 64 Years | 9,182 (38.9%) | $209,000 |
| 65+ Years | 3,162 (13.4%) | $91,609 |
| Total | 23,583 (100.0%) | $191,039 |
Poverty in Dublin
Income Below Poverty by Sex and Age in Dublin
With 3.9% poverty level for males and 3.9% for females among the residents of Dublin, 75 year old and over males and 55 to 64 year old females are the most vulnerable to poverty, with 124 males (12.9%) and 270 females (8.2%) in their respective age groups living below the poverty level.
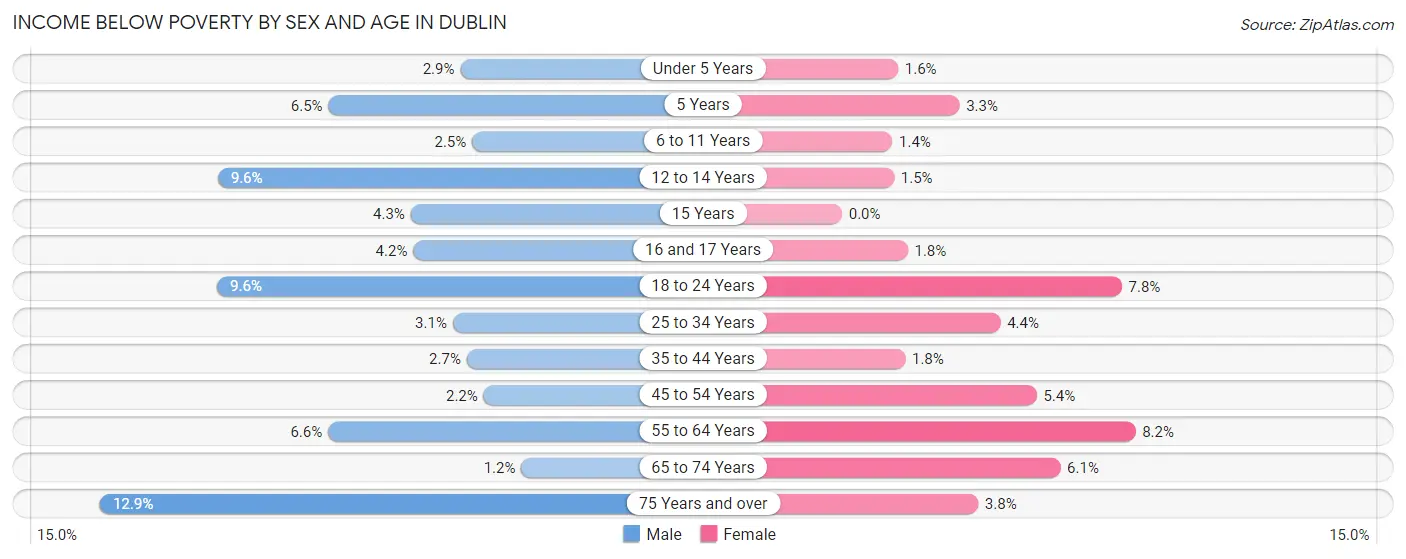
| Age Bracket | Male | Female |
| Under 5 Years | 73 (2.9%) | 38 (1.6%) |
| 5 Years | 42 (6.5%) | 17 (3.3%) |
| 6 to 11 Years | 95 (2.5%) | 45 (1.4%) |
| 12 to 14 Years | 136 (9.6%) | 20 (1.5%) |
| 15 Years | 17 (4.3%) | 0 (0.0%) |
| 16 and 17 Years | 35 (4.2%) | 17 (1.8%) |
| 18 to 24 Years | 177 (9.6%) | 138 (7.8%) |
| 25 to 34 Years | 148 (3.1%) | 212 (4.4%) |
| 35 to 44 Years | 199 (2.7%) | 129 (1.8%) |
| 45 to 54 Years | 116 (2.2%) | 267 (5.4%) |
| 55 to 64 Years | 180 (6.6%) | 270 (8.2%) |
| 65 to 74 Years | 25 (1.2%) | 144 (6.1%) |
| 75 Years and over | 124 (12.9%) | 51 (3.8%) |
| Total | 1,367 (3.9%) | 1,348 (3.9%) |
Income Above Poverty by Sex and Age in Dublin
According to the poverty statistics in Dublin, males aged 65 to 74 years and females aged 15 years are the age groups that are most secure financially, with 98.8% of males and 100.0% of females in these age groups living above the poverty line.
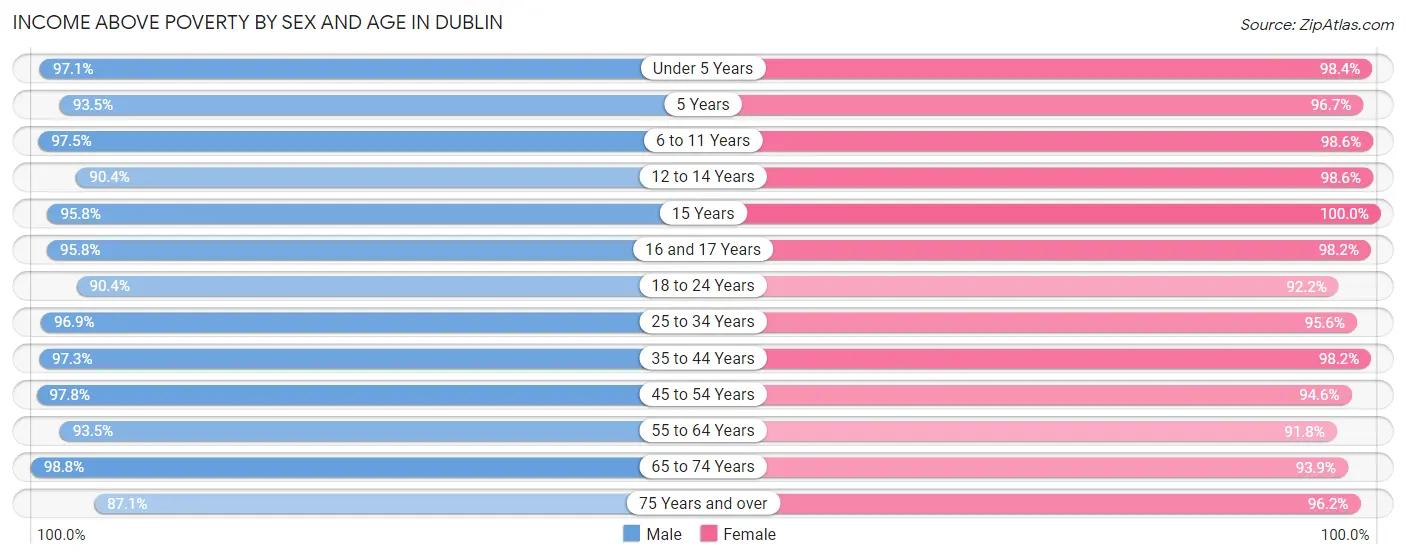
| Age Bracket | Male | Female |
| Under 5 Years | 2,470 (97.1%) | 2,402 (98.4%) |
| 5 Years | 600 (93.5%) | 503 (96.7%) |
| 6 to 11 Years | 3,639 (97.5%) | 3,166 (98.6%) |
| 12 to 14 Years | 1,278 (90.4%) | 1,358 (98.6%) |
| 15 Years | 383 (95.8%) | 399 (100.0%) |
| 16 and 17 Years | 802 (95.8%) | 914 (98.2%) |
| 18 to 24 Years | 1,659 (90.4%) | 1,634 (92.2%) |
| 25 to 34 Years | 4,651 (96.9%) | 4,596 (95.6%) |
| 35 to 44 Years | 7,212 (97.3%) | 7,215 (98.2%) |
| 45 to 54 Years | 5,110 (97.8%) | 4,662 (94.6%) |
| 55 to 64 Years | 2,567 (93.4%) | 3,036 (91.8%) |
| 65 to 74 Years | 2,103 (98.8%) | 2,226 (93.9%) |
| 75 Years and over | 837 (87.1%) | 1,296 (96.2%) |
| Total | 33,311 (96.1%) | 33,407 (96.1%) |
Income Below Poverty Among Married-Couple Families in Dublin
The poverty statistics for married-couple families in Dublin show that 1.7% or 264 of the total 15,676 families live below the poverty line. Families with 3 or 4 children have the highest poverty rate of 5.6%, comprising of 43 families. On the other hand, families with 5 or more children have the lowest poverty rate of 0.0%, which includes 0 families.
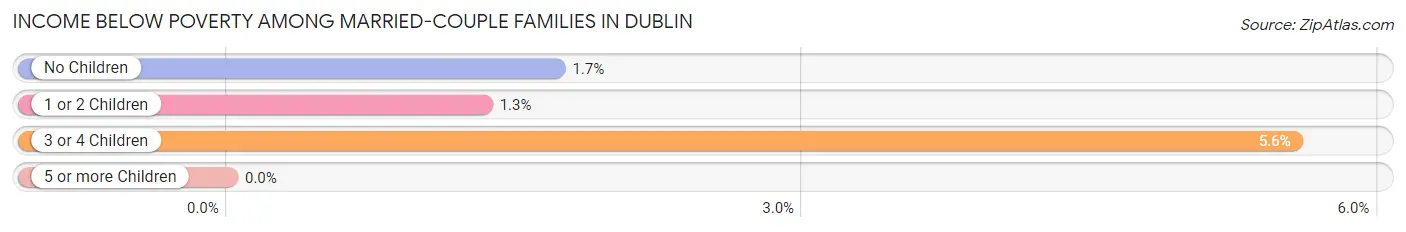
| Children | Above Poverty | Below Poverty |
| No Children | 6,144 (98.3%) | 107 (1.7%) |
| 1 or 2 Children | 8,465 (98.7%) | 114 (1.3%) |
| 3 or 4 Children | 730 (94.4%) | 43 (5.6%) |
| 5 or more Children | 73 (100.0%) | 0 (0.0%) |
| Total | 15,412 (98.3%) | 264 (1.7%) |
Income Below Poverty Among Single-Parent Households in Dublin
According to the poverty data in Dublin, 0.4% or 4 single-father households and 13.3% or 255 single-mother households are living below the poverty line. Among single-father households, those with 3 or 4 children have the highest poverty rate, with 4 households (8.2%) experiencing poverty. Likewise, among single-mother households, those with 1 or 2 children have the highest poverty rate, with 238 households (23.0%) falling below the poverty line.
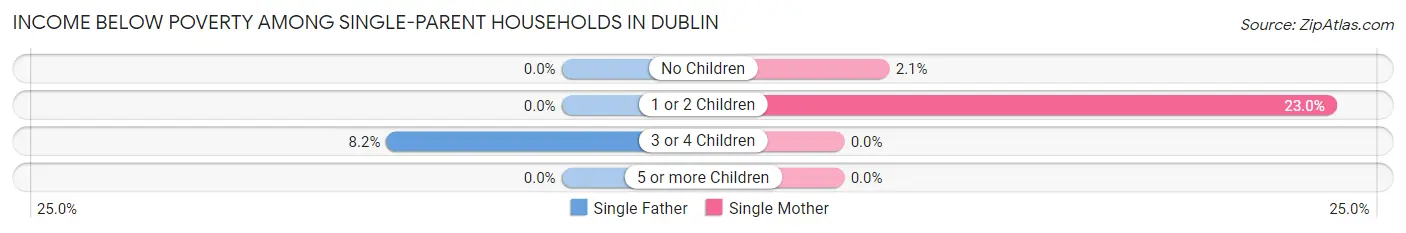
| Children | Single Father | Single Mother |
| No Children | 0 (0.0%) | 17 (2.1%) |
| 1 or 2 Children | 0 (0.0%) | 238 (23.0%) |
| 3 or 4 Children | 4 (8.2%) | 0 (0.0%) |
| 5 or more Children | 0 (0.0%) | 0 (0.0%) |
| Total | 4 (0.4%) | 255 (13.3%) |
Income Below Poverty Among Married-Couple vs Single-Parent Households in Dublin
The poverty data for Dublin shows that 264 of the married-couple family households (1.7%) and 259 of the single-parent households (9.1%) are living below the poverty level. Within the married-couple family households, those with 3 or 4 children have the highest poverty rate, with 43 households (5.6%) falling below the poverty line. Among the single-parent households, those with 1 or 2 children have the highest poverty rate, with 238 household (16.2%) living below poverty.
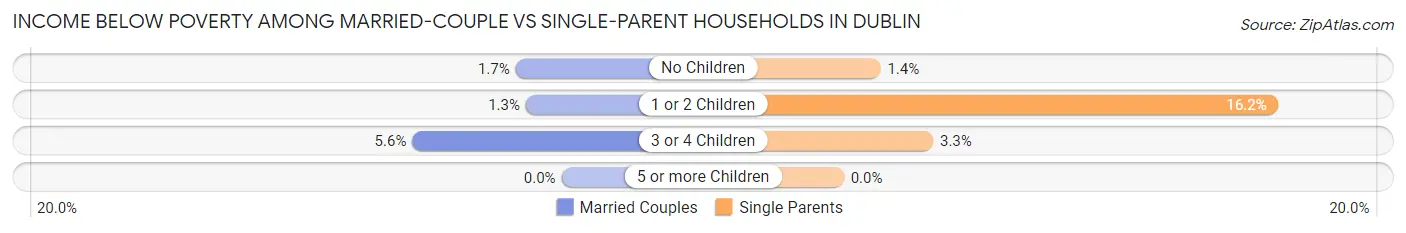
| Children | Married-Couple Families | Single-Parent Households |
| No Children | 107 (1.7%) | 17 (1.4%) |
| 1 or 2 Children | 114 (1.3%) | 238 (16.2%) |
| 3 or 4 Children | 43 (5.6%) | 4 (3.3%) |
| 5 or more Children | 0 (0.0%) | 0 (0.0%) |
| Total | 264 (1.7%) | 259 (9.1%) |
Race in Dublin
The most populous races in Dublin are Asian (37,998 | 53.5%), White / Caucasian (21,073 | 29.6%), and Hispanic or Latino (7,151 | 10.1%).
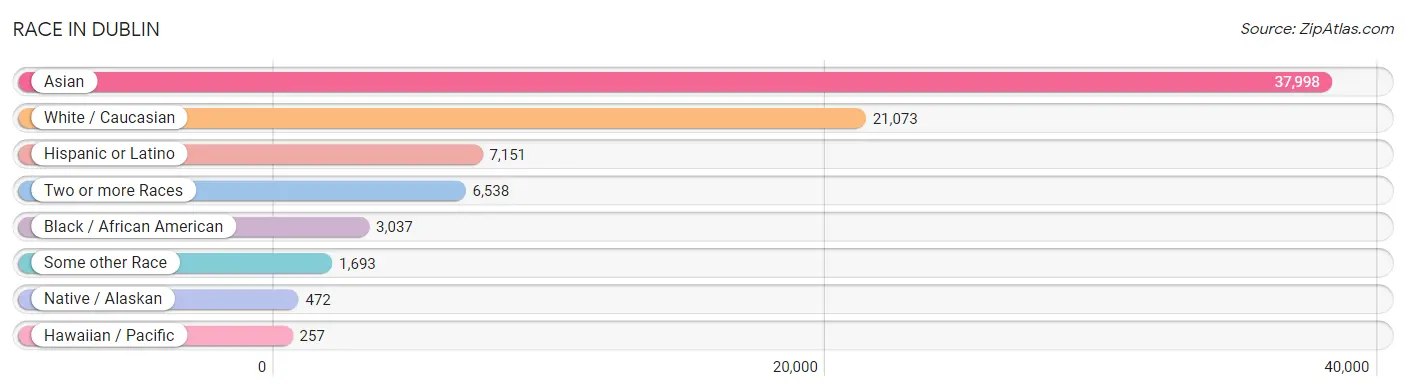
| Race | # Population | % Population |
| Asian | 37,998 | 53.5% |
| Black / African American | 3,037 | 4.3% |
| Hawaiian / Pacific | 257 | 0.4% |
| Hispanic or Latino | 7,151 | 10.1% |
| Native / Alaskan | 472 | 0.7% |
| White / Caucasian | 21,073 | 29.6% |
| Two or more Races | 6,538 | 9.2% |
| Some other Race | 1,693 | 2.4% |
| Total | 71,068 | 100.0% |
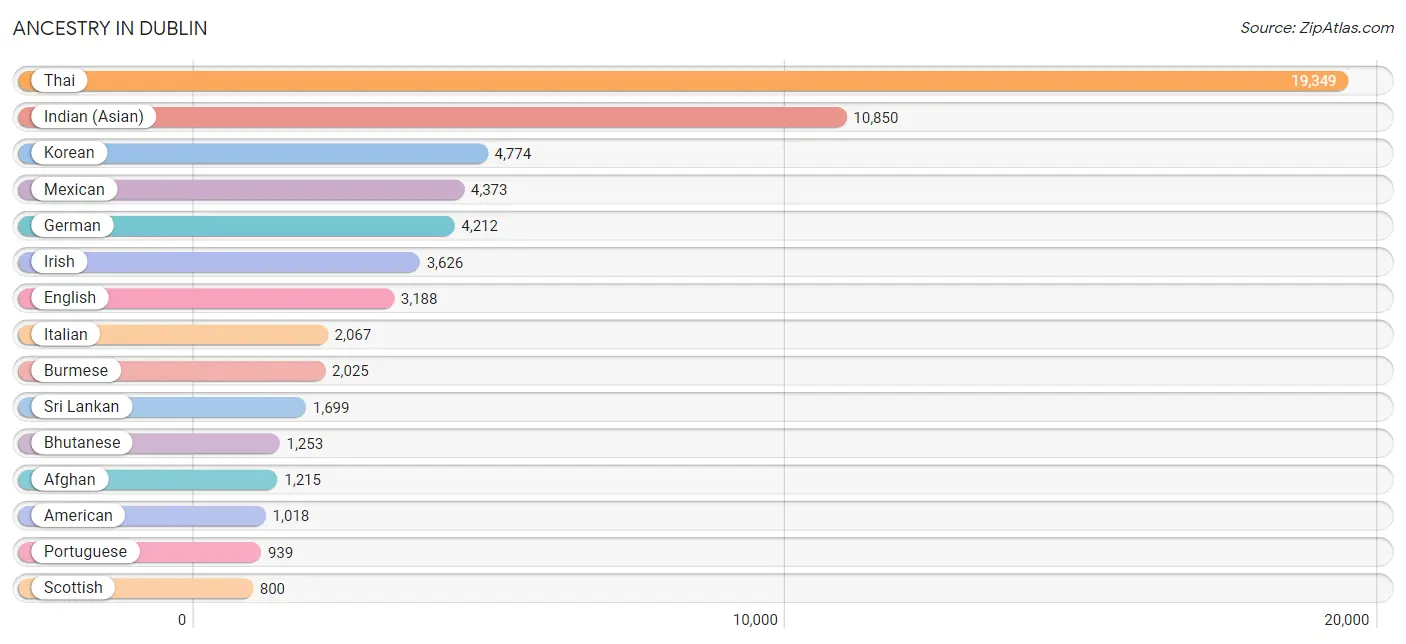
Ancestry in Dublin
The most populous ancestries reported in Dublin are Thai (19,349 | 27.2%), Indian (Asian) (10,850 | 15.3%), Korean (4,774 | 6.7%), Mexican (4,373 | 6.1%), and German (4,212 | 5.9%), together accounting for 61.3% of all Dublin residents.
| Ancestry | # Population | % Population |
| Afghan | 1,215 | 1.7% |
| African | 135 | 0.2% |
| Aleut | 6 | 0.0% |
| American | 1,018 | 1.4% |
| Apache | 5 | 0.0% |
| Arab | 542 | 0.8% |
| Arapaho | 9 | 0.0% |
| Armenian | 94 | 0.1% |
| Assyrian / Chaldean / Syriac | 31 | 0.0% |
| Australian | 7 | 0.0% |
| Austrian | 28 | 0.0% |
| Basque | 56 | 0.1% |
| Belgian | 39 | 0.1% |
| Bhutanese | 1,253 | 1.8% |
| Blackfeet | 6 | 0.0% |
| Brazilian | 77 | 0.1% |
| British | 178 | 0.3% |
| Bulgarian | 138 | 0.2% |
| Burmese | 2,025 | 2.9% |
| Cajun | 34 | 0.1% |
| Cambodian | 39 | 0.1% |
| Canadian | 123 | 0.2% |
| Central American | 624 | 0.9% |
| Central American Indian | 50 | 0.1% |
| Cherokee | 51 | 0.1% |
| Chilean | 43 | 0.1% |
| Choctaw | 13 | 0.0% |
| Colombian | 149 | 0.2% |
| Croatian | 68 | 0.1% |
| Crow | 6 | 0.0% |
| Cuban | 216 | 0.3% |
| Czech | 34 | 0.1% |
| Czechoslovakian | 11 | 0.0% |
| Danish | 113 | 0.2% |
| Dutch | 627 | 0.9% |
| Eastern European | 65 | 0.1% |
| Ecuadorian | 100 | 0.1% |
| Egyptian | 72 | 0.1% |
| English | 3,188 | 4.5% |
| Estonian | 9 | 0.0% |
| Ethiopian | 266 | 0.4% |
| European | 664 | 0.9% |
| Filipino | 447 | 0.6% |
| Finnish | 262 | 0.4% |
| French | 750 | 1.1% |
| French Canadian | 68 | 0.1% |
| German | 4,212 | 5.9% |
| Greek | 301 | 0.4% |
| Guamanian / Chamorro | 105 | 0.2% |
| Guatemalan | 197 | 0.3% |
| Honduran | 63 | 0.1% |
| Hopi | 27 | 0.0% |
| Hungarian | 45 | 0.1% |
| Indian (Asian) | 10,850 | 15.3% |
| Indonesian | 25 | 0.0% |
| Iranian | 768 | 1.1% |
| Iraqi | 37 | 0.1% |
| Irish | 3,626 | 5.1% |
| Iroquois | 3 | 0.0% |
| Israeli | 13 | 0.0% |
| Italian | 2,067 | 2.9% |
| Jamaican | 272 | 0.4% |
| Japanese | 45 | 0.1% |
| Korean | 4,774 | 6.7% |
| Laotian | 308 | 0.4% |
| Lebanese | 11 | 0.0% |
| Lithuanian | 118 | 0.2% |
| Malaysian | 44 | 0.1% |
| Maltese | 65 | 0.1% |
| Mexican | 4,373 | 6.1% |
| Mexican American Indian | 308 | 0.4% |
| Mongolian | 109 | 0.2% |
| Moroccan | 98 | 0.1% |
| Native Hawaiian | 160 | 0.2% |
| New Zealander | 42 | 0.1% |
| Nicaraguan | 257 | 0.4% |
| Northern European | 229 | 0.3% |
| Norwegian | 502 | 0.7% |
| Pakistani | 57 | 0.1% |
| Palestinian | 28 | 0.0% |
| Panamanian | 20 | 0.0% |
| Peruvian | 110 | 0.2% |
| Polish | 567 | 0.8% |
| Portuguese | 939 | 1.3% |
| Pueblo | 4 | 0.0% |
| Puerto Rican | 392 | 0.5% |
| Romanian | 157 | 0.2% |
| Russian | 630 | 0.9% |
| Salvadoran | 87 | 0.1% |
| Samoan | 101 | 0.1% |
| Scandinavian | 112 | 0.2% |
| Scotch-Irish | 597 | 0.8% |
| Scottish | 800 | 1.1% |
| Serbian | 49 | 0.1% |
| Slovak | 22 | 0.0% |
| South American | 413 | 0.6% |
| Spaniard | 632 | 0.9% |
| Spanish | 130 | 0.2% |
| Sri Lankan | 1,699 | 2.4% |
| Subsaharan African | 557 | 0.8% |
| Sudanese | 156 | 0.2% |
| Swedish | 738 | 1.0% |
| Swiss | 145 | 0.2% |
| Thai | 19,349 | 27.2% |
| Tongan | 145 | 0.2% |
| Turkish | 148 | 0.2% |
| Ukrainian | 179 | 0.3% |
| Venezuelan | 11 | 0.0% |
| Vietnamese | 54 | 0.1% |
| Welsh | 323 | 0.4% |
| Yugoslavian | 4 | 0.0% | View All 111 Rows |
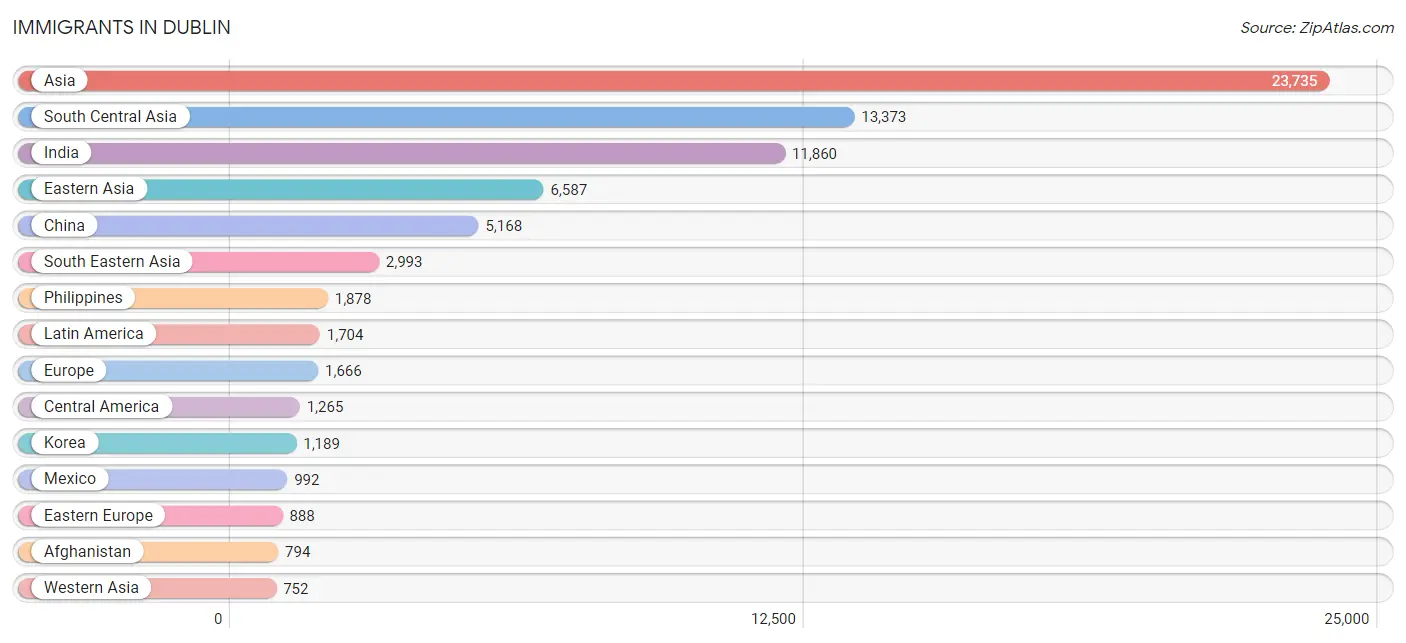
Immigrants in Dublin
The most numerous immigrant groups reported in Dublin came from Asia (23,735 | 33.4%), South Central Asia (13,373 | 18.8%), India (11,860 | 16.7%), Eastern Asia (6,587 | 9.3%), and China (5,168 | 7.3%), together accounting for 85.5% of all Dublin residents.
| Immigration Origin | # Population | % Population |
| Afghanistan | 794 | 1.1% |
| Africa | 657 | 0.9% |
| Armenia | 5 | 0.0% |
| Asia | 23,735 | 33.4% |
| Australia | 58 | 0.1% |
| Azores | 10 | 0.0% |
| Bangladesh | 72 | 0.1% |
| Belgium | 8 | 0.0% |
| Brazil | 142 | 0.2% |
| Bulgaria | 198 | 0.3% |
| Cambodia | 14 | 0.0% |
| Cameroon | 14 | 0.0% |
| Canada | 397 | 0.6% |
| Caribbean | 148 | 0.2% |
| Central America | 1,265 | 1.8% |
| China | 5,168 | 7.3% |
| Colombia | 46 | 0.1% |
| Croatia | 32 | 0.1% |
| Cuba | 39 | 0.1% |
| Denmark | 41 | 0.1% |
| Eastern Africa | 327 | 0.5% |
| Eastern Asia | 6,587 | 9.3% |
| Eastern Europe | 888 | 1.3% |
| Egypt | 97 | 0.1% |
| El Salvador | 81 | 0.1% |
| England | 13 | 0.0% |
| Eritrea | 26 | 0.0% |
| Ethiopia | 185 | 0.3% |
| Europe | 1,666 | 2.3% |
| Fiji | 135 | 0.2% |
| France | 48 | 0.1% |
| Germany | 106 | 0.2% |
| Guatemala | 24 | 0.0% |
| Honduras | 63 | 0.1% |
| Hong Kong | 578 | 0.8% |
| India | 11,860 | 16.7% |
| Indonesia | 163 | 0.2% |
| Iran | 232 | 0.3% |
| Iraq | 42 | 0.1% |
| Ireland | 38 | 0.1% |
| Israel | 22 | 0.0% |
| Italy | 81 | 0.1% |
| Jamaica | 109 | 0.2% |
| Japan | 212 | 0.3% |
| Kenya | 87 | 0.1% |
| Korea | 1,189 | 1.7% |
| Kuwait | 15 | 0.0% |
| Laos | 24 | 0.0% |
| Latin America | 1,704 | 2.4% |
| Lithuania | 56 | 0.1% |
| Malaysia | 154 | 0.2% |
| Mexico | 992 | 1.4% |
| Middle Africa | 14 | 0.0% |
| Moldova | 14 | 0.0% |
| Morocco | 61 | 0.1% |
| Netherlands | 34 | 0.1% |
| Nicaragua | 105 | 0.2% |
| Northern Africa | 263 | 0.4% |
| Northern Europe | 249 | 0.4% |
| Norway | 9 | 0.0% |
| Oceania | 277 | 0.4% |
| Pakistan | 400 | 0.6% |
| Peru | 92 | 0.1% |
| Philippines | 1,878 | 2.6% |
| Poland | 25 | 0.0% |
| Portugal | 167 | 0.2% |
| Romania | 93 | 0.1% |
| Russia | 245 | 0.3% |
| Saudi Arabia | 110 | 0.2% |
| Singapore | 37 | 0.1% |
| South Africa | 53 | 0.1% |
| South America | 291 | 0.4% |
| South Central Asia | 13,373 | 18.8% |
| South Eastern Asia | 2,993 | 4.2% |
| Southern Europe | 248 | 0.4% |
| Sri Lanka | 8 | 0.0% |
| Sudan | 51 | 0.1% |
| Sweden | 18 | 0.0% |
| Switzerland | 85 | 0.1% |
| Taiwan | 569 | 0.8% |
| Thailand | 7 | 0.0% |
| Turkey | 180 | 0.3% |
| Uganda | 14 | 0.0% |
| Ukraine | 102 | 0.1% |
| Venezuela | 11 | 0.0% |
| Vietnam | 675 | 0.9% |
| Western Asia | 752 | 1.1% |
| Western Europe | 281 | 0.4% |
| Yemen | 42 | 0.1% | View All 89 Rows |
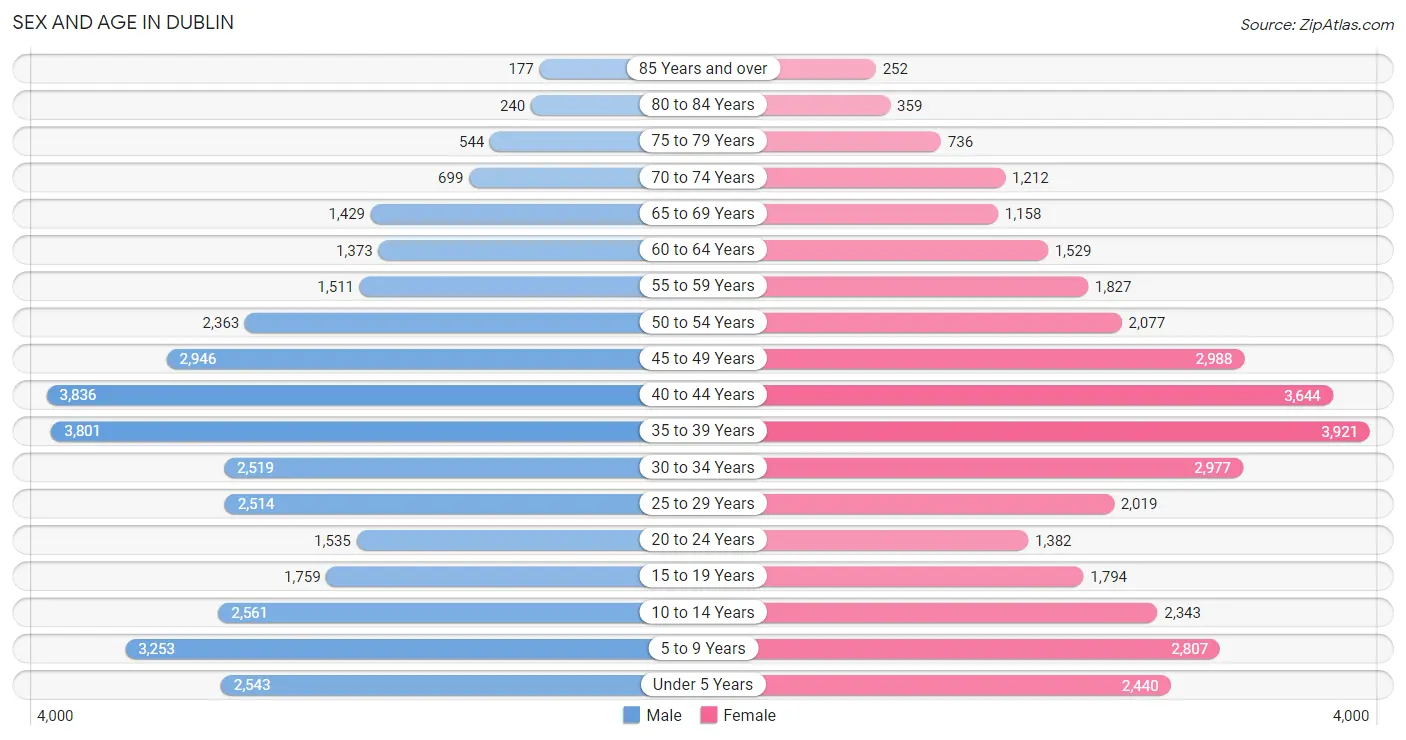
Sex and Age in Dublin
Sex and Age in Dublin
The most populous age groups in Dublin are 40 to 44 Years (3,836 | 10.8%) for men and 35 to 39 Years (3,921 | 11.1%) for women.
| Age Bracket | Male | Female |
| Under 5 Years | 2,543 (7.1%) | 2,440 (6.9%) |
| 5 to 9 Years | 3,253 (9.1%) | 2,807 (7.9%) |
| 10 to 14 Years | 2,561 (7.2%) | 2,343 (6.6%) |
| 15 to 19 Years | 1,759 (4.9%) | 1,794 (5.1%) |
| 20 to 24 Years | 1,535 (4.3%) | 1,382 (3.9%) |
| 25 to 29 Years | 2,514 (7.1%) | 2,019 (5.7%) |
| 30 to 34 Years | 2,519 (7.1%) | 2,977 (8.4%) |
| 35 to 39 Years | 3,801 (10.7%) | 3,921 (11.1%) |
| 40 to 44 Years | 3,836 (10.8%) | 3,644 (10.3%) |
| 45 to 49 Years | 2,946 (8.3%) | 2,988 (8.4%) |
| 50 to 54 Years | 2,363 (6.6%) | 2,077 (5.9%) |
| 55 to 59 Years | 1,511 (4.2%) | 1,827 (5.1%) |
| 60 to 64 Years | 1,373 (3.9%) | 1,529 (4.3%) |
| 65 to 69 Years | 1,429 (4.0%) | 1,158 (3.3%) |
| 70 to 74 Years | 699 (2.0%) | 1,212 (3.4%) |
| 75 to 79 Years | 544 (1.5%) | 736 (2.1%) |
| 80 to 84 Years | 240 (0.7%) | 359 (1.0%) |
| 85 Years and over | 177 (0.5%) | 252 (0.7%) |
| Total | 35,603 (100.0%) | 35,465 (100.0%) |
Families and Households in Dublin
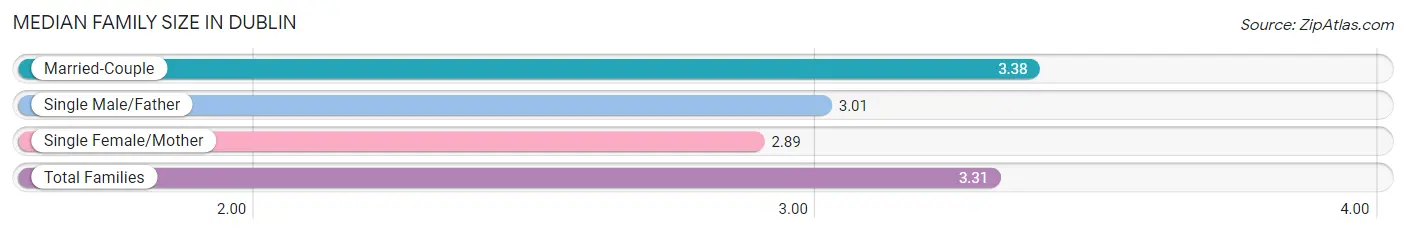
Median Family Size in Dublin
The median family size in Dublin is 3.31 persons per family, with married-couple families (15,676 | 84.7%) accounting for the largest median family size of 3.38 persons per family. On the other hand, single female/mother families (1,918 | 10.4%) represent the smallest median family size with 2.89 persons per family.
| Family Type | # Families | Family Size |
| Married-Couple | 15,676 (84.7%) | 3.38 |
| Single Male/Father | 913 (4.9%) | 3.01 |
| Single Female/Mother | 1,918 (10.4%) | 2.89 |
| Total Families | 18,507 (100.0%) | 3.31 |
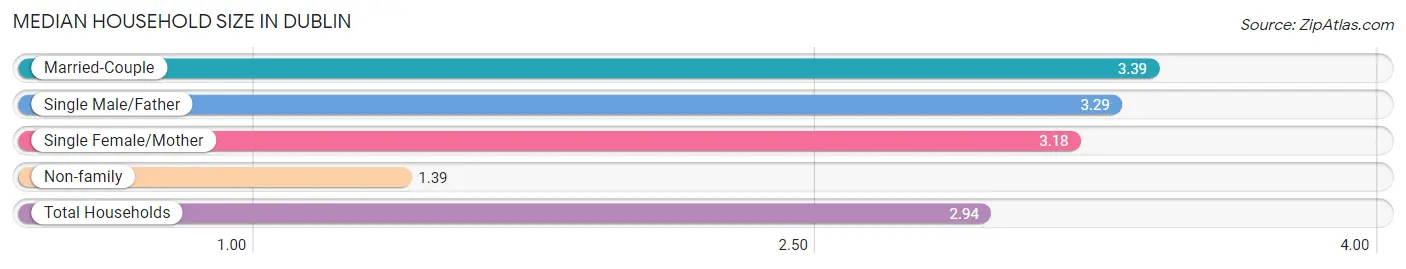
Median Household Size in Dublin
The median household size in Dublin is 2.94 persons per household, with married-couple households (15,676 | 66.5%) accounting for the largest median household size of 3.39 persons per household. non-family households (5,076 | 21.5%) represent the smallest median household size with 1.39 persons per household.
| Household Type | # Households | Household Size |
| Married-Couple | 15,676 (66.5%) | 3.39 |
| Single Male/Father | 913 (3.9%) | 3.29 |
| Single Female/Mother | 1,918 (8.1%) | 3.18 |
| Non-family | 5,076 (21.5%) | 1.39 |
| Total Households | 23,583 (100.0%) | 2.94 |
Household Size by Marriage Status in Dublin
Out of a total of 23,583 households in Dublin, 18,507 (78.5%) are family households, while 5,076 (21.5%) are nonfamily households. The most numerous type of family households are 4-person households, comprising 5,843, and the most common type of nonfamily households are 1-person households, comprising 3,688.
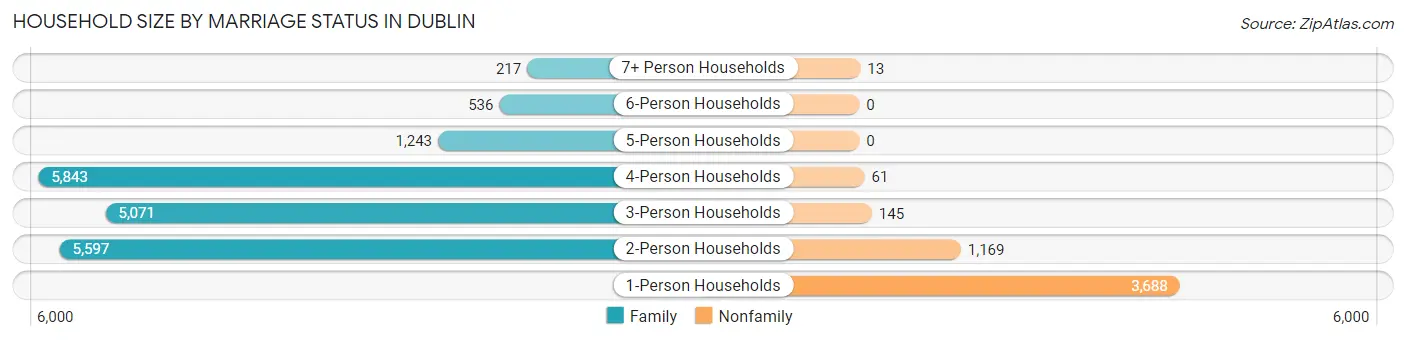
| Household Size | Family Households | Nonfamily Households |
| 1-Person Households | - | 3,688 (15.6%) |
| 2-Person Households | 5,597 (23.7%) | 1,169 (5.0%) |
| 3-Person Households | 5,071 (21.5%) | 145 (0.6%) |
| 4-Person Households | 5,843 (24.8%) | 61 (0.3%) |
| 5-Person Households | 1,243 (5.3%) | 0 (0.0%) |
| 6-Person Households | 536 (2.3%) | 0 (0.0%) |
| 7+ Person Households | 217 (0.9%) | 13 (0.1%) |
| Total | 18,507 (78.5%) | 5,076 (21.5%) |
Female Fertility in Dublin
Fertility by Age in Dublin
Average fertility rate in Dublin is 48.0 births per 1,000 women. Women in the age bracket of 20 to 34 years have the highest fertility rate with 66.0 births per 1,000 women. Women in the age bracket of 35 to 50 years acount for 52.2% of all women with births.
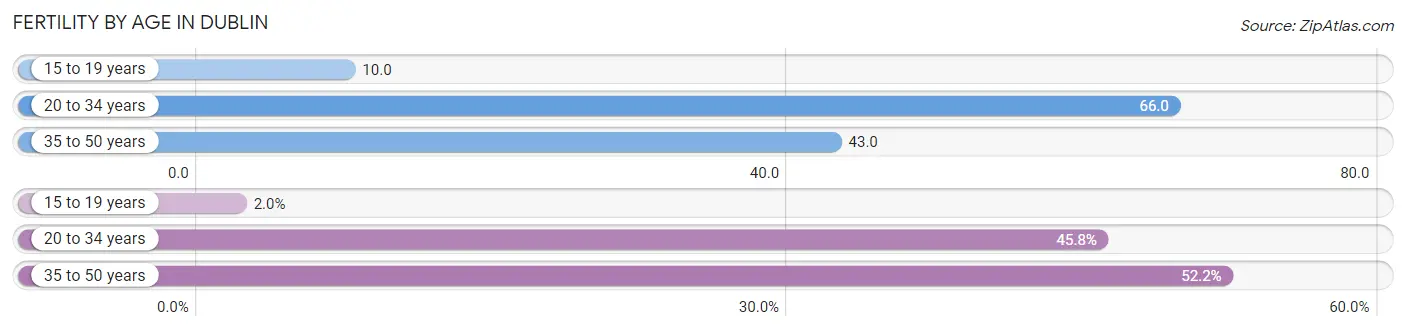
| Age Bracket | Women with Births | Births / 1,000 Women |
| 15 to 19 years | 18 (2.0%) | 10.0 |
| 20 to 34 years | 419 (45.8%) | 66.0 |
| 35 to 50 years | 477 (52.2%) | 43.0 |
| Total | 914 (100.0%) | 48.0 |
Fertility by Age by Marriage Status in Dublin
95.0% of women with births (914) in Dublin are married. The highest percentage of unmarried women with births falls into 35 to 50 years age bracket with 5.2% of them unmarried at the time of birth, while the lowest percentage of unmarried women with births belong to 15 to 19 years age bracket with 0.0% of them unmarried.
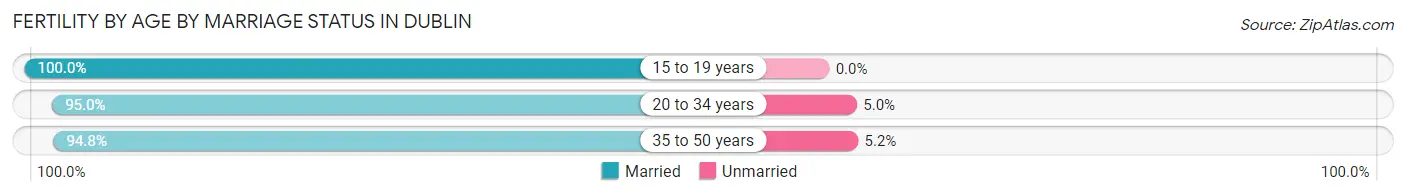
| Age Bracket | Married | Unmarried |
| 15 to 19 years | 18 (100.0%) | 0 (0.0%) |
| 20 to 34 years | 398 (95.0%) | 21 (5.0%) |
| 35 to 50 years | 452 (94.8%) | 25 (5.2%) |
| Total | 868 (95.0%) | 46 (5.0%) |
Fertility by Education in Dublin
Average fertility rate in Dublin is 48.0 births per 1,000 women. Women with the education attainment of graduate degree have the highest fertility rate of 71.0 births per 1,000 women, while women with the education attainment of high school diploma have the lowest fertility at 3.0 births per 1,000 women. Women with the education attainment of bachelor's degree represent 44.8% of all women with births.
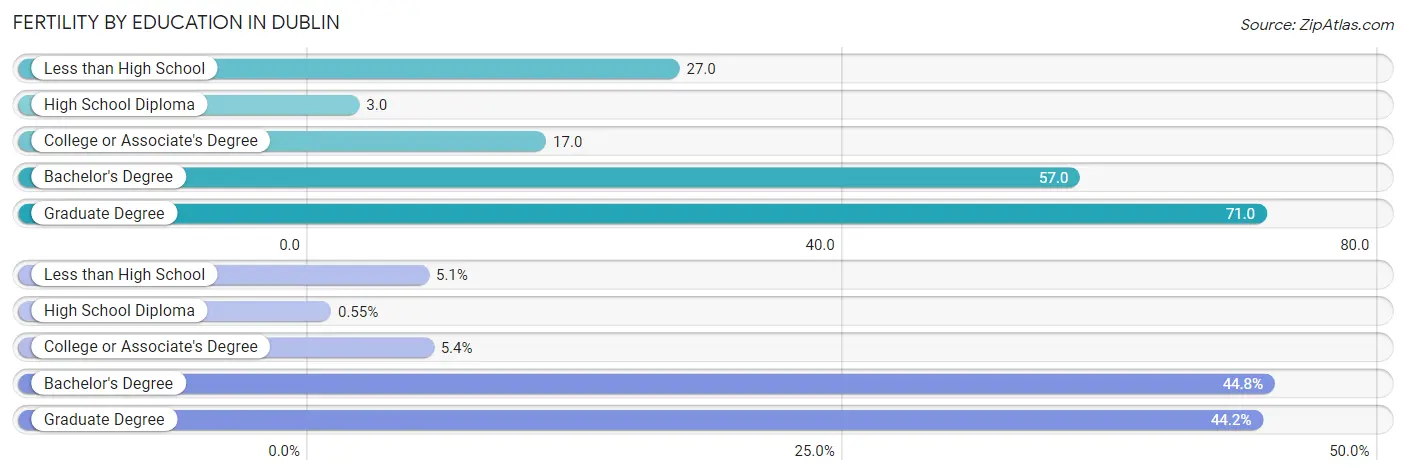
| Educational Attainment | Women with Births | Births / 1,000 Women |
| Less than High School | 47 (5.1%) | 27.0 |
| High School Diploma | 5 (0.5%) | 3.0 |
| College or Associate's Degree | 49 (5.4%) | 17.0 |
| Bachelor's Degree | 409 (44.8%) | 57.0 |
| Graduate Degree | 404 (44.2%) | 71.0 |
| Total | 914 (100.0%) | 48.0 |
Fertility by Education by Marriage Status in Dublin
5.0% of women with births in Dublin are unmarried. Women with the educational attainment of high school diploma are most likely to be married with 100.0% of them married at childbirth, while women with the educational attainment of college or associate's degree are least likely to be married with 51.0% of them unmarried at childbirth.
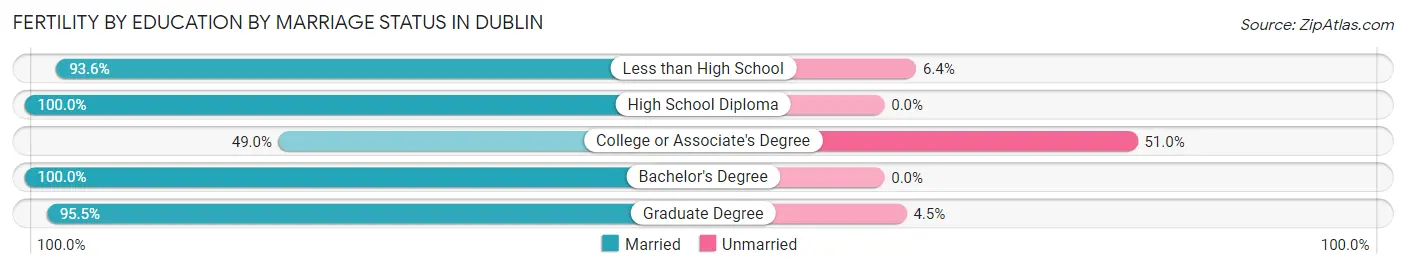
| Educational Attainment | Married | Unmarried |
| Less than High School | 44 (93.6%) | 3 (6.4%) |
| High School Diploma | 5 (100.0%) | 0 (0.0%) |
| College or Associate's Degree | 24 (49.0%) | 25 (51.0%) |
| Bachelor's Degree | 409 (100.0%) | 0 (0.0%) |
| Graduate Degree | 386 (95.5%) | 18 (4.5%) |
| Total | 868 (95.0%) | 46 (5.0%) |
Employment Characteristics in Dublin
Employment by Class of Employer in Dublin
Among the 35,608 employed individuals in Dublin, private company employees (26,038 | 73.1%), local government employees (2,191 | 6.1%), and not-for-profit organizations (2,177 | 6.1%) make up the most common classes of employment.
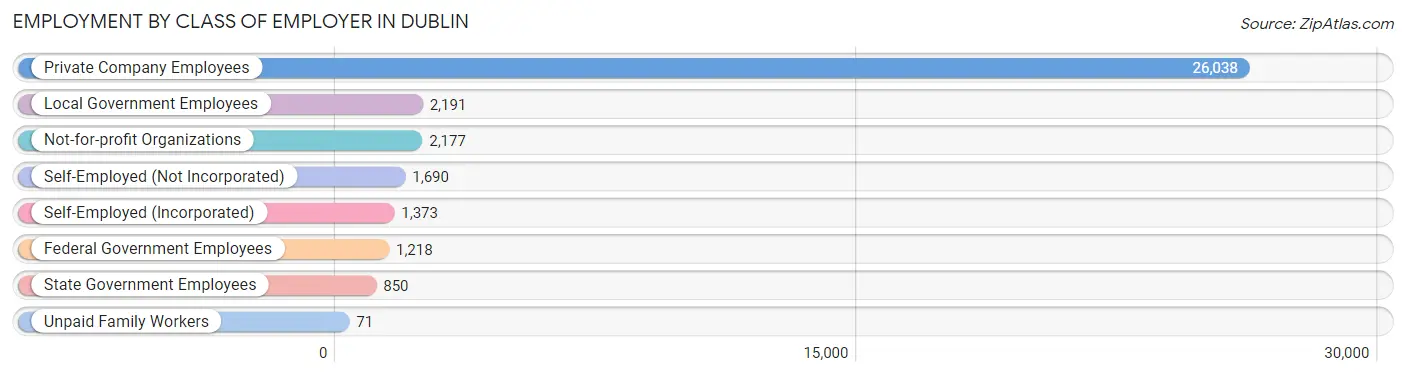
| Employer Class | # Employees | % Employees |
| Private Company Employees | 26,038 | 73.1% |
| Self-Employed (Incorporated) | 1,373 | 3.9% |
| Self-Employed (Not Incorporated) | 1,690 | 4.8% |
| Not-for-profit Organizations | 2,177 | 6.1% |
| Local Government Employees | 2,191 | 6.1% |
| State Government Employees | 850 | 2.4% |
| Federal Government Employees | 1,218 | 3.4% |
| Unpaid Family Workers | 71 | 0.2% |
| Total | 35,608 | 100.0% |
Employment Status by Age in Dublin
According to the labor force statistics for Dublin, out of the total population over 16 years of age (54,319), 69.9% or 37,969 individuals are in the labor force, with 3.4% or 1,291 of them unemployed. The age group with the highest labor force participation rate is 30 to 34 years, with 83.4% or 4,584 individuals in the labor force. Within the labor force, the 16 to 19 years age range has the highest percentage of unemployed individuals, with 7.2% or 52 of them being unemployed.
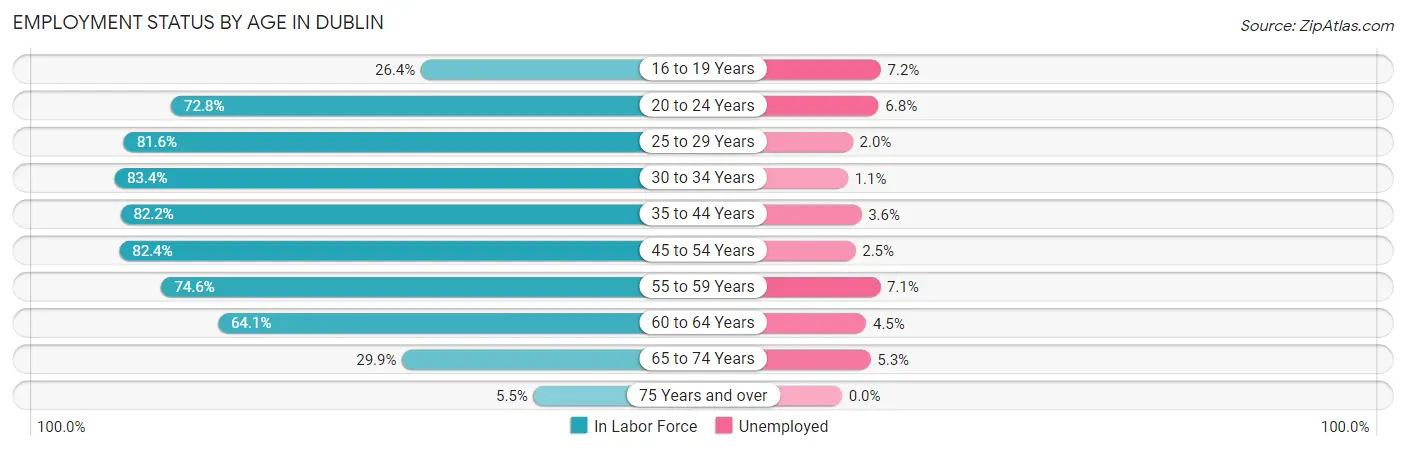
| Age Bracket | In Labor Force | Unemployed |
| 16 to 19 Years | 726 (26.4%) | 52 (7.2%) |
| 20 to 24 Years | 2,124 (72.8%) | 144 (6.8%) |
| 25 to 29 Years | 3,699 (81.6%) | 74 (2.0%) |
| 30 to 34 Years | 4,584 (83.4%) | 50 (1.1%) |
| 35 to 44 Years | 12,496 (82.2%) | 450 (3.6%) |
| 45 to 54 Years | 8,548 (82.4%) | 214 (2.5%) |
| 55 to 59 Years | 2,490 (74.6%) | 177 (7.1%) |
| 60 to 64 Years | 1,860 (64.1%) | 84 (4.5%) |
| 65 to 74 Years | 1,345 (29.9%) | 71 (5.3%) |
| 75 Years and over | 127 (5.5%) | 0 (0.0%) |
| Total | 37,969 (69.9%) | 1,291 (3.4%) |
Employment Status by Educational Attainment in Dublin
According to labor force statistics for Dublin, 80.5% of individuals (33,685) out of the total population between 25 and 64 years of age (41,845) are in the labor force, with 3.1% or 1,044 of them being unemployed. The group with the highest labor force participation rate are those with the educational attainment of bachelor's degree or higher, with 87.0% or 26,426 individuals in the labor force. Within the labor force, individuals with less than high school education have the highest percentage of unemployment, with 6.3% or 20 of them being unemployed.
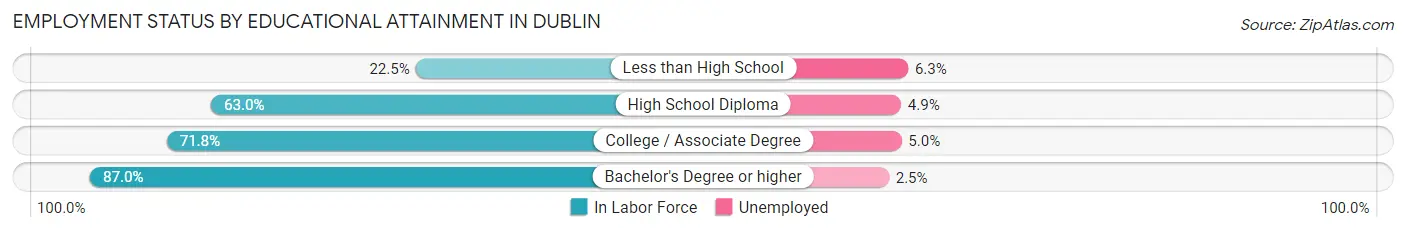
| Educational Attainment | In Labor Force | Unemployed |
| Less than High School | 315 (22.5%) | 88 (6.3%) |
| High School Diploma | 2,146 (63.0%) | 167 (4.9%) |
| College / Associate Degree | 4,786 (71.8%) | 333 (5.0%) |
| Bachelor's Degree or higher | 26,426 (87.0%) | 759 (2.5%) |
| Total | 33,685 (80.5%) | 1,297 (3.1%) |
Employment Occupations by Sex in Dublin
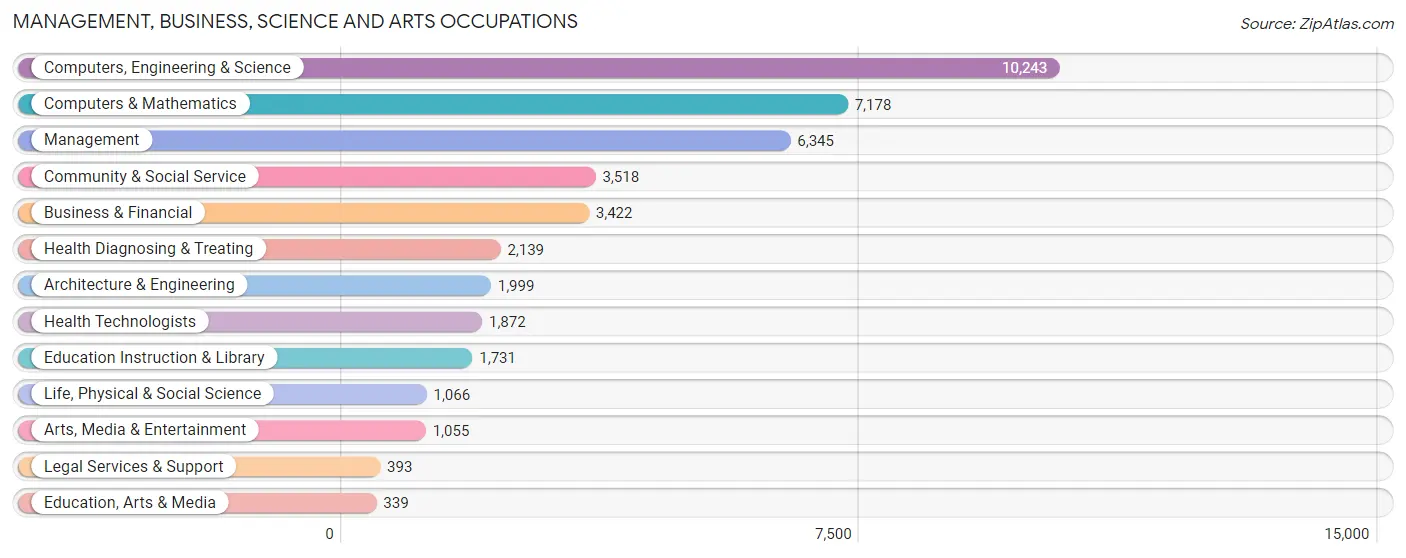
Management, Business, Science and Arts Occupations
The most common Management, Business, Science and Arts occupations in Dublin are Computers, Engineering & Science (10,243 | 28.1%), Computers & Mathematics (7,178 | 19.7%), Management (6,345 | 17.4%), Community & Social Service (3,518 | 9.7%), and Business & Financial (3,422 | 9.4%).
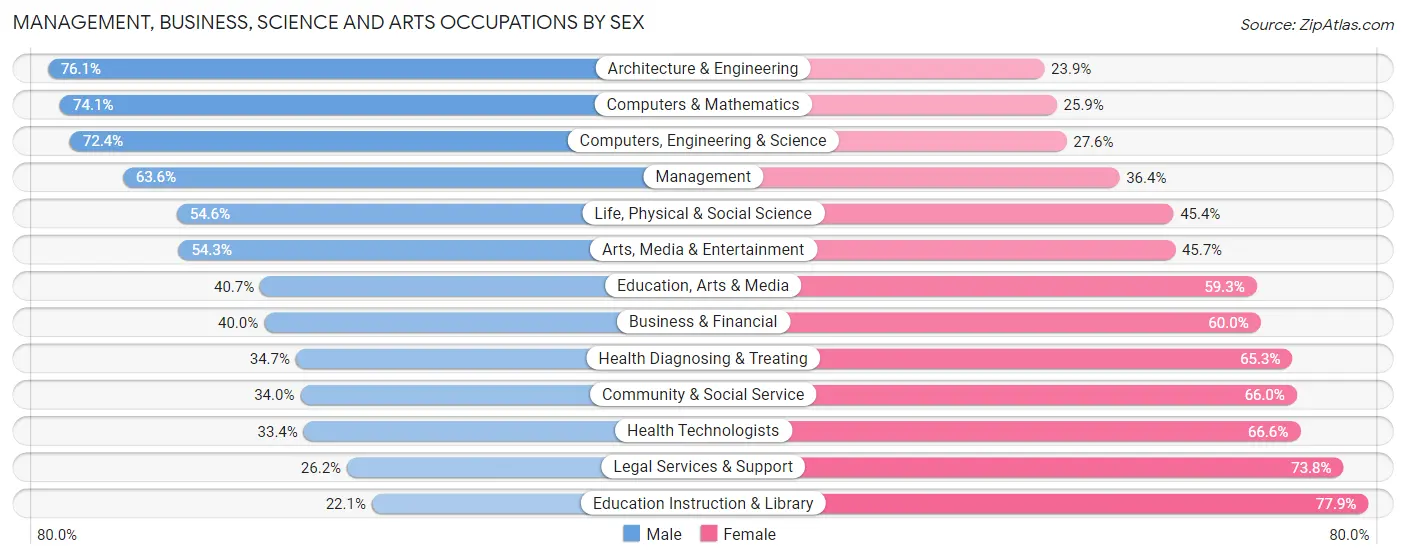
Management, Business, Science and Arts Occupations by Sex
Within the Management, Business, Science and Arts occupations in Dublin, the most male-oriented occupations are Architecture & Engineering (76.1%), Computers & Mathematics (74.1%), and Computers, Engineering & Science (72.4%), while the most female-oriented occupations are Education Instruction & Library (77.9%), Legal Services & Support (73.8%), and Health Technologists (66.6%).
| Occupation | Male | Female |
| Management | 4,036 (63.6%) | 2,309 (36.4%) |
| Business & Financial | 1,370 (40.0%) | 2,052 (60.0%) |
| Computers, Engineering & Science | 7,420 (72.4%) | 2,823 (27.6%) |
| Computers & Mathematics | 5,316 (74.1%) | 1,862 (25.9%) |
| Architecture & Engineering | 1,522 (76.1%) | 477 (23.9%) |
| Life, Physical & Social Science | 582 (54.6%) | 484 (45.4%) |
| Community & Social Service | 1,196 (34.0%) | 2,322 (66.0%) |
| Education, Arts & Media | 138 (40.7%) | 201 (59.3%) |
| Legal Services & Support | 103 (26.2%) | 290 (73.8%) |
| Education Instruction & Library | 382 (22.1%) | 1,349 (77.9%) |
| Arts, Media & Entertainment | 573 (54.3%) | 482 (45.7%) |
| Health Diagnosing & Treating | 743 (34.7%) | 1,396 (65.3%) |
| Health Technologists | 626 (33.4%) | 1,246 (66.6%) |
| Total (Category) | 14,765 (57.5%) | 10,902 (42.5%) |
| Total (Overall) | 20,188 (55.3%) | 16,285 (44.7%) |
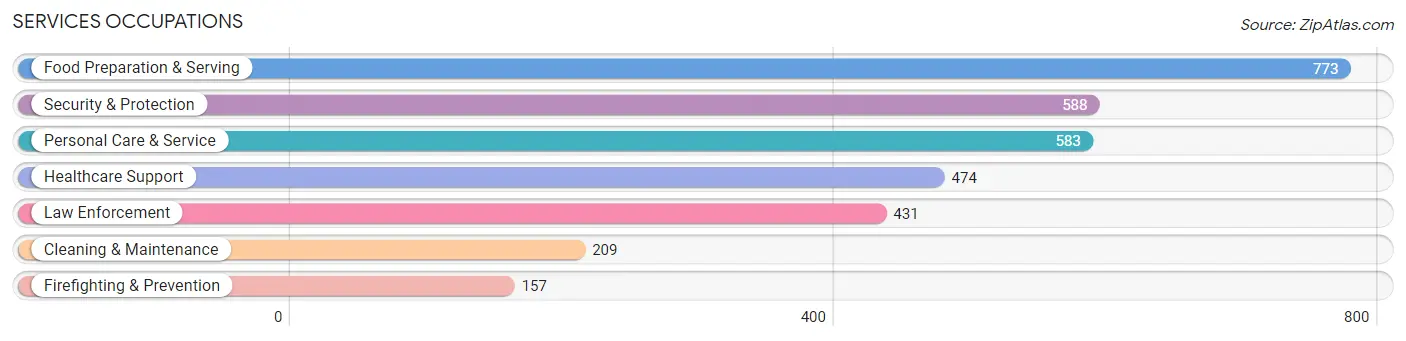
Services Occupations
The most common Services occupations in Dublin are Food Preparation & Serving (773 | 2.1%), Security & Protection (588 | 1.6%), Personal Care & Service (583 | 1.6%), Healthcare Support (474 | 1.3%), and Law Enforcement (431 | 1.2%).
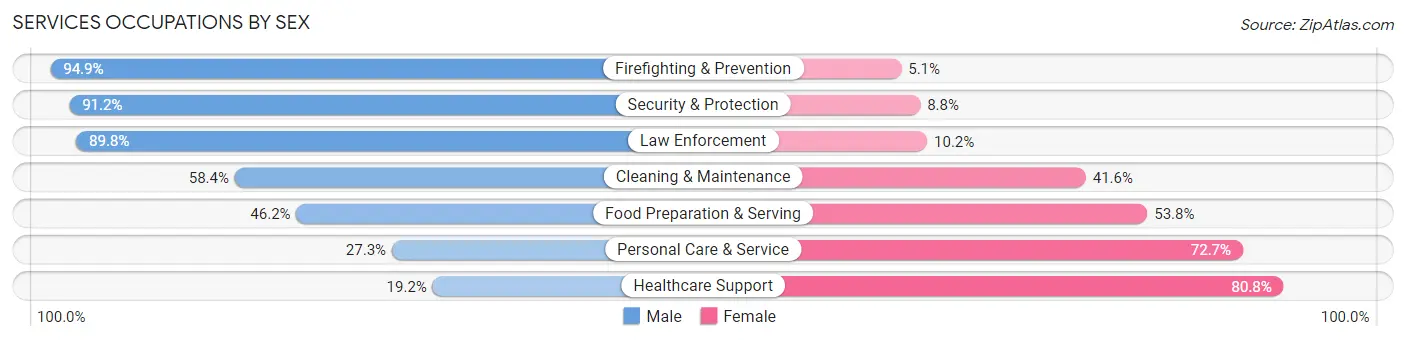
Services Occupations by Sex
Within the Services occupations in Dublin, the most male-oriented occupations are Firefighting & Prevention (94.9%), Security & Protection (91.2%), and Law Enforcement (89.8%), while the most female-oriented occupations are Healthcare Support (80.8%), Personal Care & Service (72.7%), and Food Preparation & Serving (53.8%).
| Occupation | Male | Female |
| Healthcare Support | 91 (19.2%) | 383 (80.8%) |
| Security & Protection | 536 (91.2%) | 52 (8.8%) |
| Firefighting & Prevention | 149 (94.9%) | 8 (5.1%) |
| Law Enforcement | 387 (89.8%) | 44 (10.2%) |
| Food Preparation & Serving | 357 (46.2%) | 416 (53.8%) |
| Cleaning & Maintenance | 122 (58.4%) | 87 (41.6%) |
| Personal Care & Service | 159 (27.3%) | 424 (72.7%) |
| Total (Category) | 1,265 (48.1%) | 1,362 (51.8%) |
| Total (Overall) | 20,188 (55.3%) | 16,285 (44.7%) |
Sales and Office Occupations
The most common Sales and Office occupations in Dublin are Sales & Related (2,818 | 7.7%), and Office & Administration (2,727 | 7.5%).

Sales and Office Occupations by Sex

| Occupation | Male | Female |
| Sales & Related | 1,290 (45.8%) | 1,528 (54.2%) |
| Office & Administration | 947 (34.7%) | 1,780 (65.3%) |
| Total (Category) | 2,237 (40.3%) | 3,308 (59.7%) |
| Total (Overall) | 20,188 (55.3%) | 16,285 (44.7%) |
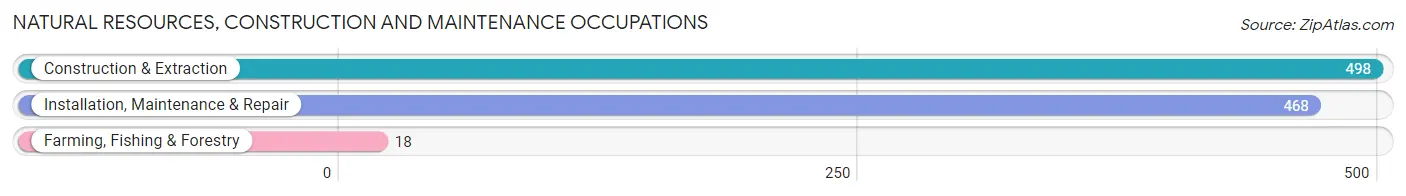
Natural Resources, Construction and Maintenance Occupations
The most common Natural Resources, Construction and Maintenance occupations in Dublin are Construction & Extraction (498 | 1.4%), Installation, Maintenance & Repair (468 | 1.3%), and Farming, Fishing & Forestry (18 | 0.1%).
Natural Resources, Construction and Maintenance Occupations by Sex
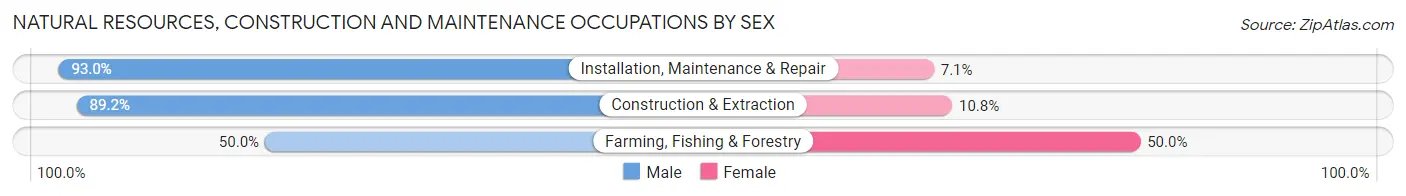
| Occupation | Male | Female |
| Farming, Fishing & Forestry | 9 (50.0%) | 9 (50.0%) |
| Construction & Extraction | 444 (89.2%) | 54 (10.8%) |
| Installation, Maintenance & Repair | 435 (92.9%) | 33 (7.0%) |
| Total (Category) | 888 (90.2%) | 96 (9.8%) |
| Total (Overall) | 20,188 (55.3%) | 16,285 (44.7%) |
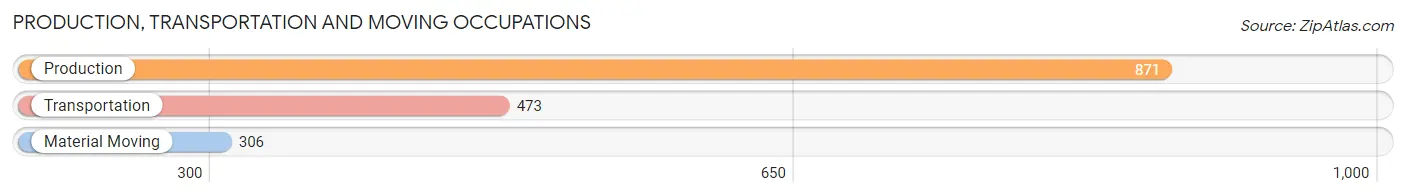
Production, Transportation and Moving Occupations
The most common Production, Transportation and Moving occupations in Dublin are Production (871 | 2.4%), Transportation (473 | 1.3%), and Material Moving (306 | 0.8%).
Production, Transportation and Moving Occupations by Sex
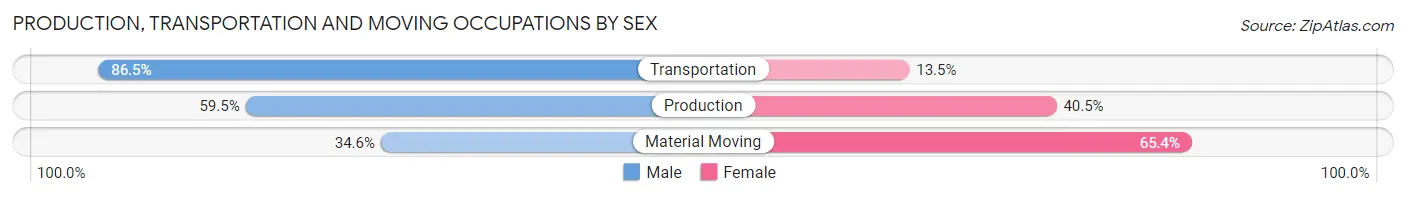
| Occupation | Male | Female |
| Production | 518 (59.5%) | 353 (40.5%) |
| Transportation | 409 (86.5%) | 64 (13.5%) |
| Material Moving | 106 (34.6%) | 200 (65.4%) |
| Total (Category) | 1,033 (62.6%) | 617 (37.4%) |
| Total (Overall) | 20,188 (55.3%) | 16,285 (44.7%) |
Employment Industries by Sex in Dublin
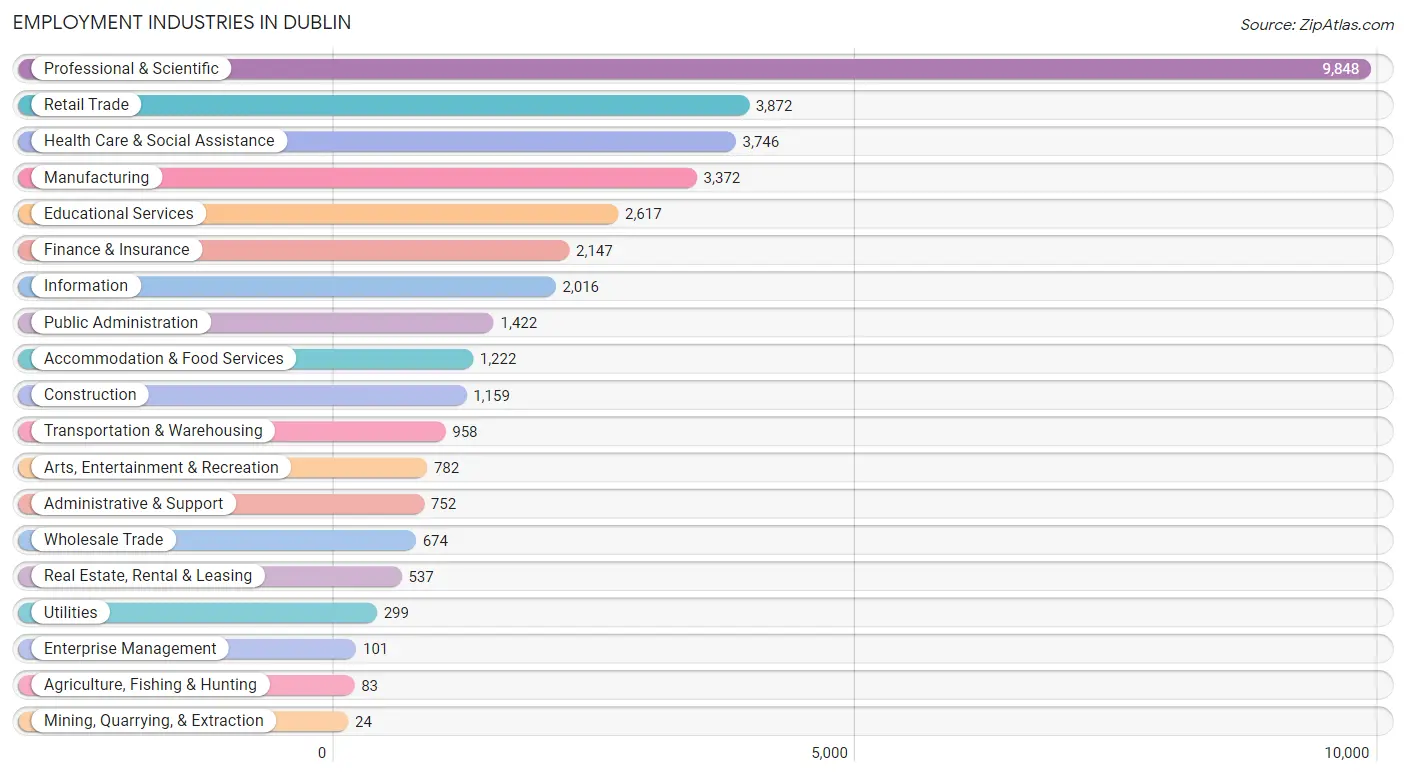
Employment Industries in Dublin
The major employment industries in Dublin include Professional & Scientific (9,848 | 27.0%), Retail Trade (3,872 | 10.6%), Health Care & Social Assistance (3,746 | 10.3%), Manufacturing (3,372 | 9.2%), and Educational Services (2,617 | 7.2%).
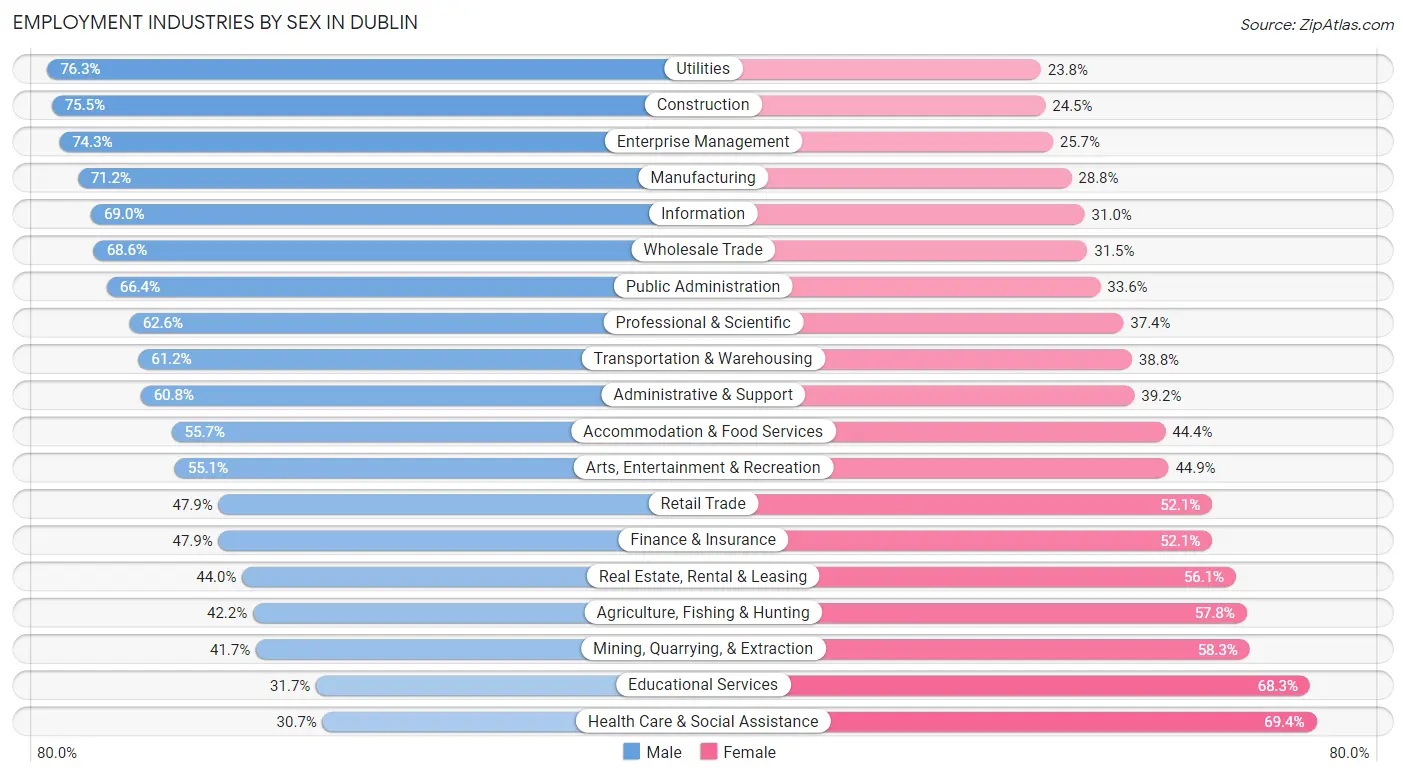
Employment Industries by Sex in Dublin
The Dublin industries that see more men than women are Utilities (76.2%), Construction (75.5%), and Enterprise Management (74.3%), whereas the industries that tend to have a higher number of women are Health Care & Social Assistance (69.4%), Educational Services (68.3%), and Mining, Quarrying, & Extraction (58.3%).
| Industry | Male | Female |
| Agriculture, Fishing & Hunting | 35 (42.2%) | 48 (57.8%) |
| Mining, Quarrying, & Extraction | 10 (41.7%) | 14 (58.3%) |
| Construction | 875 (75.5%) | 284 (24.5%) |
| Manufacturing | 2,401 (71.2%) | 971 (28.8%) |
| Wholesale Trade | 462 (68.5%) | 212 (31.5%) |
| Retail Trade | 1,854 (47.9%) | 2,018 (52.1%) |
| Transportation & Warehousing | 586 (61.2%) | 372 (38.8%) |
| Utilities | 228 (76.2%) | 71 (23.7%) |
| Information | 1,391 (69.0%) | 625 (31.0%) |
| Finance & Insurance | 1,028 (47.9%) | 1,119 (52.1%) |
| Real Estate, Rental & Leasing | 236 (44.0%) | 301 (56.0%) |
| Professional & Scientific | 6,164 (62.6%) | 3,684 (37.4%) |
| Enterprise Management | 75 (74.3%) | 26 (25.7%) |
| Administrative & Support | 457 (60.8%) | 295 (39.2%) |
| Educational Services | 830 (31.7%) | 1,787 (68.3%) |
| Health Care & Social Assistance | 1,148 (30.6%) | 2,598 (69.4%) |
| Arts, Entertainment & Recreation | 431 (55.1%) | 351 (44.9%) |
| Accommodation & Food Services | 680 (55.6%) | 542 (44.4%) |
| Public Administration | 944 (66.4%) | 478 (33.6%) |
| Total | 20,188 (55.3%) | 16,285 (44.7%) |
Education in Dublin
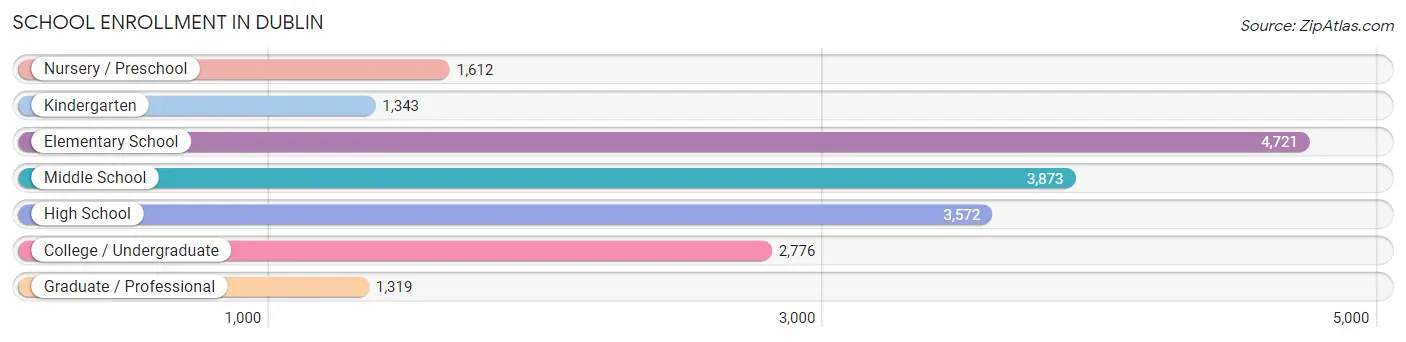
School Enrollment in Dublin
The most common levels of schooling among the 19,216 students in Dublin are elementary school (4,721 | 24.6%), middle school (3,873 | 20.2%), and high school (3,572 | 18.6%).
| School Level | # Students | % Students |
| Nursery / Preschool | 1,612 | 8.4% |
| Kindergarten | 1,343 | 7.0% |
| Elementary School | 4,721 | 24.6% |
| Middle School | 3,873 | 20.2% |
| High School | 3,572 | 18.6% |
| College / Undergraduate | 2,776 | 14.4% |
| Graduate / Professional | 1,319 | 6.9% |
| Total | 19,216 | 100.0% |
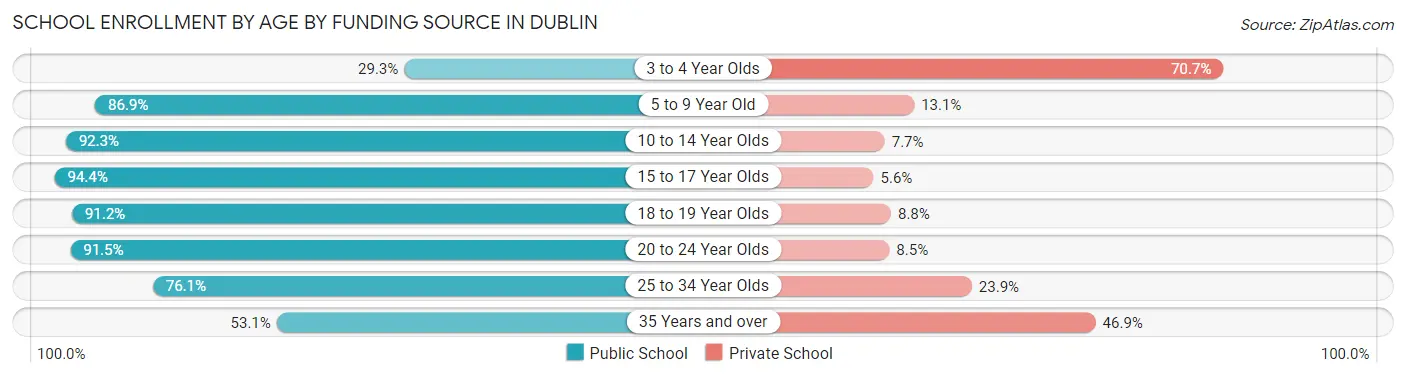
School Enrollment by Age by Funding Source in Dublin
Out of a total of 19,216 students who are enrolled in schools in Dublin, 3,344 (17.4%) attend a private institution, while the remaining 15,872 (82.6%) are enrolled in public schools. The age group of 3 to 4 year olds has the highest likelihood of being enrolled in private schools, with 914 (70.7% in the age bracket) enrolled. Conversely, the age group of 15 to 17 year olds has the lowest likelihood of being enrolled in a private school, with 2,401 (94.4% in the age bracket) attending a public institution.
| Age Bracket | Public School | Private School |
| 3 to 4 Year Olds | 379 (29.3%) | 914 (70.7%) |
| 5 to 9 Year Old | 5,101 (86.9%) | 772 (13.1%) |
| 10 to 14 Year Olds | 4,507 (92.3%) | 374 (7.7%) |
| 15 to 17 Year Olds | 2,401 (94.4%) | 142 (5.6%) |
| 18 to 19 Year Olds | 775 (91.2%) | 75 (8.8%) |
| 20 to 24 Year Olds | 1,085 (91.5%) | 101 (8.5%) |
| 25 to 34 Year Olds | 838 (76.1%) | 263 (23.9%) |
| 35 Years and over | 790 (53.1%) | 699 (46.9%) |
| Total | 15,872 (82.6%) | 3,344 (17.4%) |
Educational Attainment by Field of Study in Dublin
Engineering (7,483 | 20.7%), business (6,937 | 19.2%), computers & mathematics (5,201 | 14.4%), science & technology (2,831 | 7.9%), and bio, nature & agricultural (2,386 | 6.6%) are the most common fields of study among 36,061 individuals in Dublin who have obtained a bachelor's degree or higher.
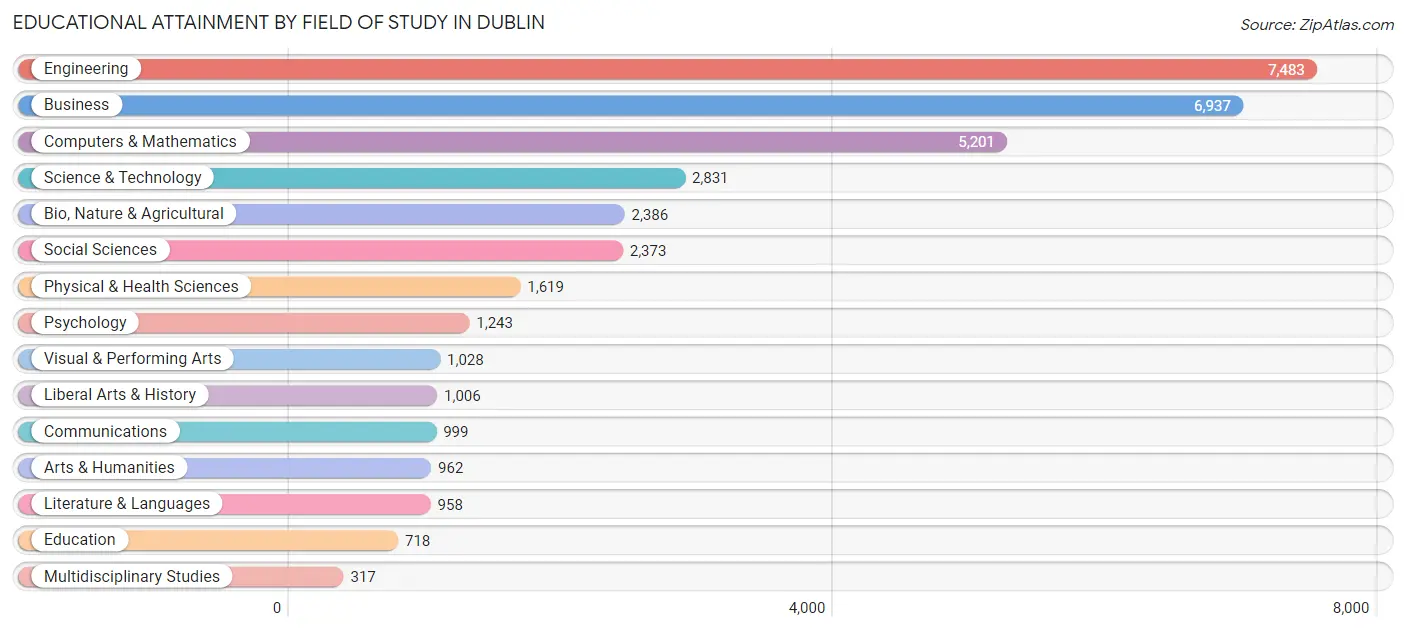
| Field of Study | # Graduates | % Graduates |
| Computers & Mathematics | 5,201 | 14.4% |
| Bio, Nature & Agricultural | 2,386 | 6.6% |
| Physical & Health Sciences | 1,619 | 4.5% |
| Psychology | 1,243 | 3.5% |
| Social Sciences | 2,373 | 6.6% |
| Engineering | 7,483 | 20.7% |
| Multidisciplinary Studies | 317 | 0.9% |
| Science & Technology | 2,831 | 7.9% |
| Business | 6,937 | 19.2% |
| Education | 718 | 2.0% |
| Literature & Languages | 958 | 2.7% |
| Liberal Arts & History | 1,006 | 2.8% |
| Visual & Performing Arts | 1,028 | 2.9% |
| Communications | 999 | 2.8% |
| Arts & Humanities | 962 | 2.7% |
| Total | 36,061 | 100.0% |
Transportation & Commute in Dublin
Vehicle Availability by Sex in Dublin
The most prevalent vehicle ownership categories in Dublin are males with 2 vehicles (10,119, accounting for 51.2%) and females with 2 vehicles (7,742, making up 64.2%).
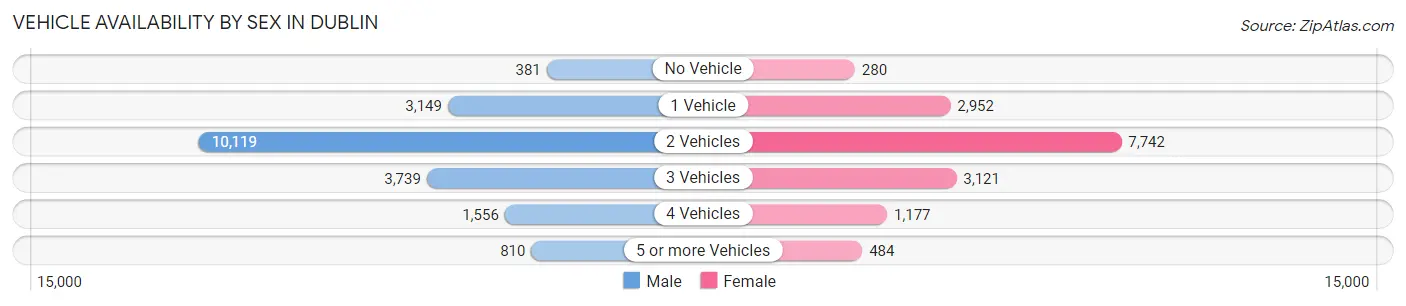
| Vehicles Available | Male | Female |
| No Vehicle | 381 (1.9%) | 280 (1.8%) |
| 1 Vehicle | 3,149 (15.9%) | 2,952 (18.7%) |
| 2 Vehicles | 10,119 (51.2%) | 7,742 (49.1%) |
| 3 Vehicles | 3,739 (18.9%) | 3,121 (19.8%) |
| 4 Vehicles | 1,556 (7.9%) | 1,177 (7.5%) |
| 5 or more Vehicles | 810 (4.1%) | 484 (3.1%) |
| Total | 19,754 (100.0%) | 15,756 (100.0%) |
Commute Time in Dublin
The most frequently occuring commute durations in Dublin are 60 to 89 minutes (5,137 commuters, 19.8%), 10 to 14 minutes (3,625 commuters, 14.0%), and 15 to 19 minutes (2,977 commuters, 11.5%).
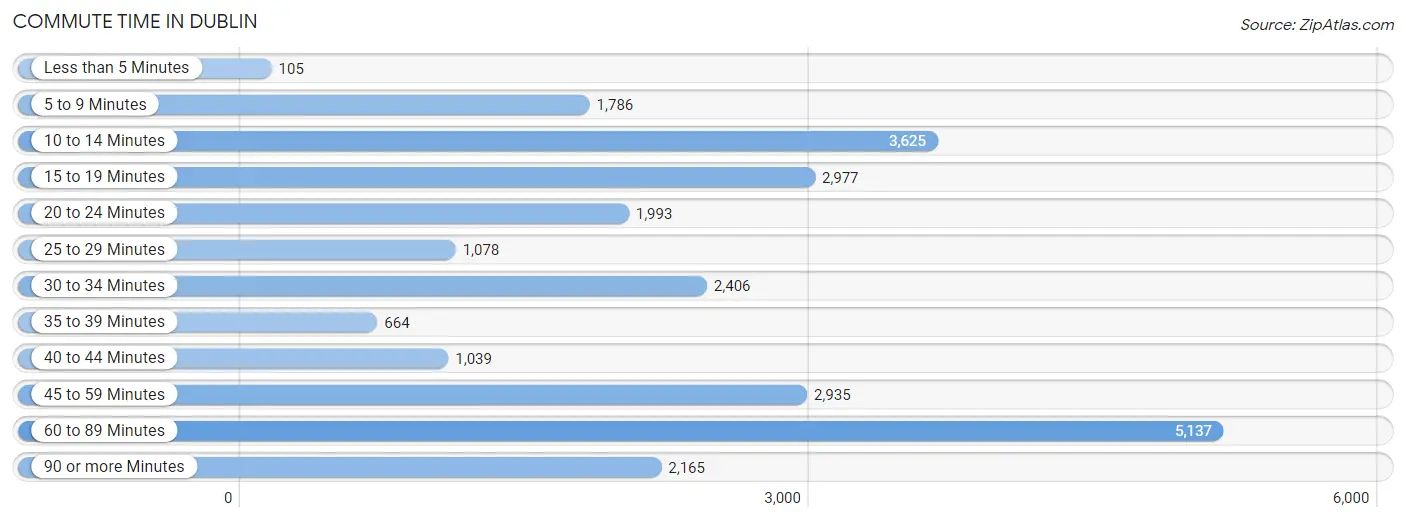
| Commute Time | # Commuters | % Commuters |
| Less than 5 Minutes | 105 | 0.4% |
| 5 to 9 Minutes | 1,786 | 6.9% |
| 10 to 14 Minutes | 3,625 | 14.0% |
| 15 to 19 Minutes | 2,977 | 11.5% |
| 20 to 24 Minutes | 1,993 | 7.7% |
| 25 to 29 Minutes | 1,078 | 4.2% |
| 30 to 34 Minutes | 2,406 | 9.3% |
| 35 to 39 Minutes | 664 | 2.6% |
| 40 to 44 Minutes | 1,039 | 4.0% |
| 45 to 59 Minutes | 2,935 | 11.3% |
| 60 to 89 Minutes | 5,137 | 19.8% |
| 90 or more Minutes | 2,165 | 8.4% |
Commute Time by Sex in Dublin
The most common commute times in Dublin are 60 to 89 minutes (3,372 commuters, 22.6%) for males and 60 to 89 minutes (1,765 commuters, 16.0%) for females.
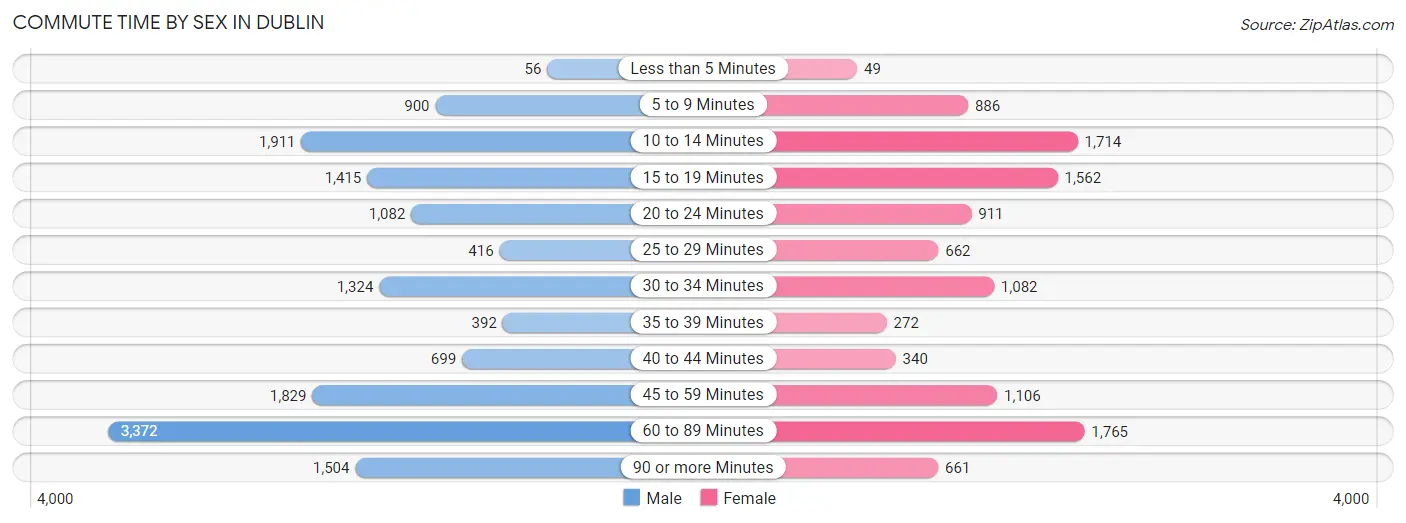
| Commute Time | Male | Female |
| Less than 5 Minutes | 56 (0.4%) | 49 (0.4%) |
| 5 to 9 Minutes | 900 (6.0%) | 886 (8.1%) |
| 10 to 14 Minutes | 1,911 (12.8%) | 1,714 (15.6%) |
| 15 to 19 Minutes | 1,415 (9.5%) | 1,562 (14.2%) |
| 20 to 24 Minutes | 1,082 (7.3%) | 911 (8.3%) |
| 25 to 29 Minutes | 416 (2.8%) | 662 (6.0%) |
| 30 to 34 Minutes | 1,324 (8.9%) | 1,082 (9.8%) |
| 35 to 39 Minutes | 392 (2.6%) | 272 (2.5%) |
| 40 to 44 Minutes | 699 (4.7%) | 340 (3.1%) |
| 45 to 59 Minutes | 1,829 (12.3%) | 1,106 (10.1%) |
| 60 to 89 Minutes | 3,372 (22.6%) | 1,765 (16.0%) |
| 90 or more Minutes | 1,504 (10.1%) | 661 (6.0%) |
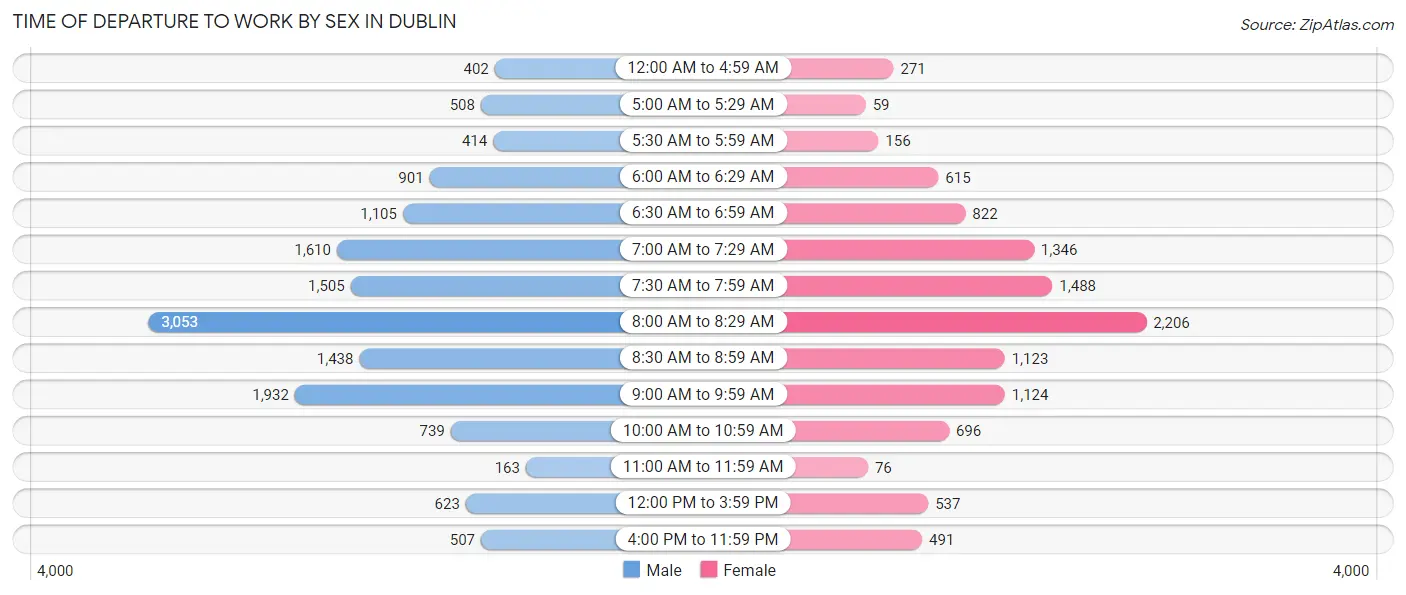
Time of Departure to Work by Sex in Dublin
The most frequent times of departure to work in Dublin are 8:00 AM to 8:29 AM (3,053, 20.5%) for males and 8:00 AM to 8:29 AM (2,206, 20.0%) for females.
| Time of Departure | Male | Female |
| 12:00 AM to 4:59 AM | 402 (2.7%) | 271 (2.5%) |
| 5:00 AM to 5:29 AM | 508 (3.4%) | 59 (0.5%) |
| 5:30 AM to 5:59 AM | 414 (2.8%) | 156 (1.4%) |
| 6:00 AM to 6:29 AM | 901 (6.0%) | 615 (5.6%) |
| 6:30 AM to 6:59 AM | 1,105 (7.4%) | 822 (7.5%) |
| 7:00 AM to 7:29 AM | 1,610 (10.8%) | 1,346 (12.2%) |
| 7:30 AM to 7:59 AM | 1,505 (10.1%) | 1,488 (13.5%) |
| 8:00 AM to 8:29 AM | 3,053 (20.5%) | 2,206 (20.0%) |
| 8:30 AM to 8:59 AM | 1,438 (9.7%) | 1,123 (10.2%) |
| 9:00 AM to 9:59 AM | 1,932 (13.0%) | 1,124 (10.2%) |
| 10:00 AM to 10:59 AM | 739 (5.0%) | 696 (6.3%) |
| 11:00 AM to 11:59 AM | 163 (1.1%) | 76 (0.7%) |
| 12:00 PM to 3:59 PM | 623 (4.2%) | 537 (4.9%) |
| 4:00 PM to 11:59 PM | 507 (3.4%) | 491 (4.5%) |
| Total | 14,900 (100.0%) | 11,010 (100.0%) |
Housing Occupancy in Dublin
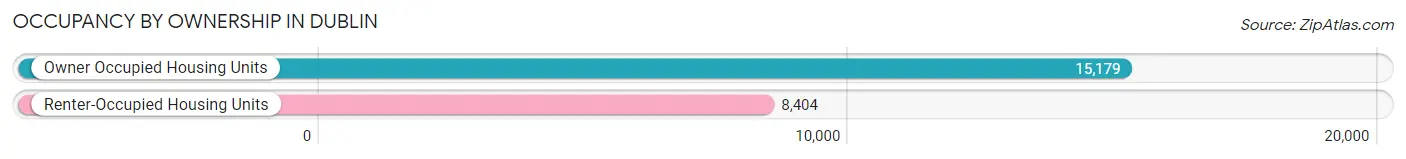
Occupancy by Ownership in Dublin
Of the total 23,583 dwellings in Dublin, owner-occupied units account for 15,179 (64.4%), while renter-occupied units make up 8,404 (35.6%).
| Occupancy | # Housing Units | % Housing Units |
| Owner Occupied Housing Units | 15,179 | 64.4% |
| Renter-Occupied Housing Units | 8,404 | 35.6% |
| Total Occupied Housing Units | 23,583 | 100.0% |
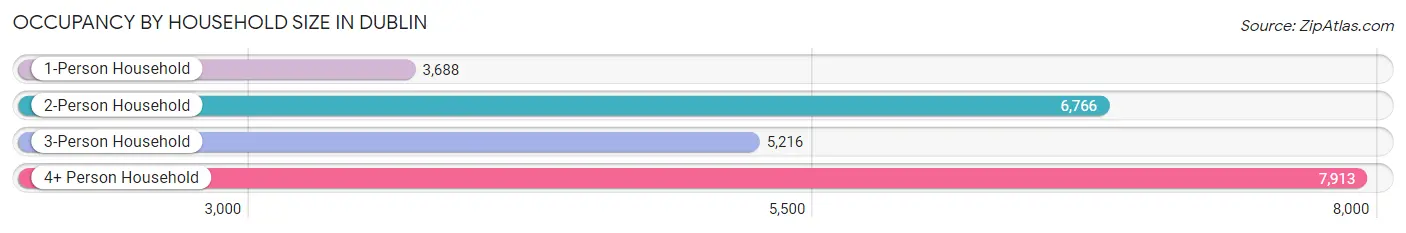
Occupancy by Household Size in Dublin
| Household Size | # Housing Units | % Housing Units |
| 1-Person Household | 3,688 | 15.6% |
| 2-Person Household | 6,766 | 28.7% |
| 3-Person Household | 5,216 | 22.1% |
| 4+ Person Household | 7,913 | 33.6% |
| Total Housing Units | 23,583 | 100.0% |
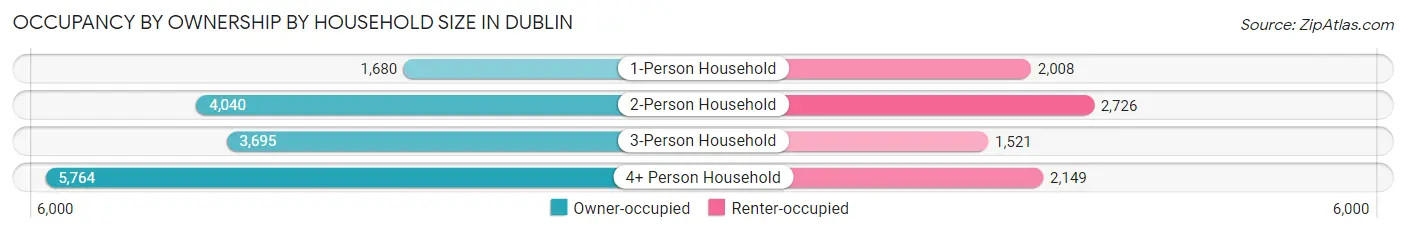
Occupancy by Ownership by Household Size in Dublin
| Household Size | Owner-occupied | Renter-occupied |
| 1-Person Household | 1,680 (45.6%) | 2,008 (54.4%) |
| 2-Person Household | 4,040 (59.7%) | 2,726 (40.3%) |
| 3-Person Household | 3,695 (70.8%) | 1,521 (29.2%) |
| 4+ Person Household | 5,764 (72.8%) | 2,149 (27.2%) |
| Total Housing Units | 15,179 (64.4%) | 8,404 (35.6%) |
Occupancy by Educational Attainment in Dublin
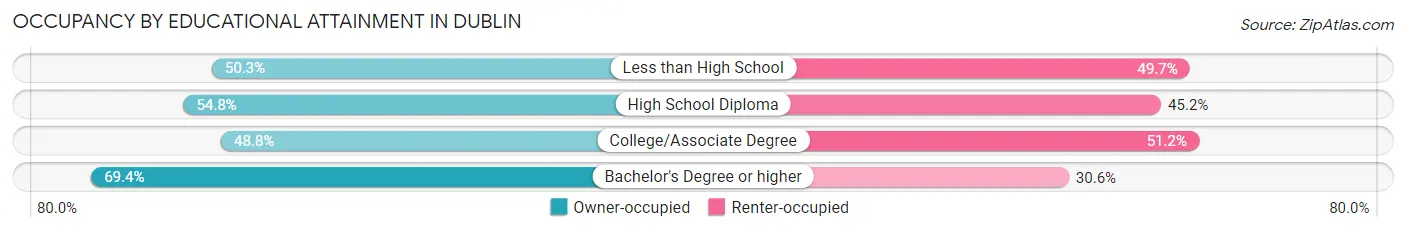
| Household Size | Owner-occupied | Renter-occupied |
| Less than High School | 256 (50.3%) | 253 (49.7%) |
| High School Diploma | 777 (54.8%) | 641 (45.2%) |
| College/Associate Degree | 2,113 (48.8%) | 2,213 (51.2%) |
| Bachelor's Degree or higher | 12,033 (69.4%) | 5,297 (30.6%) |
Occupancy by Age of Householder in Dublin
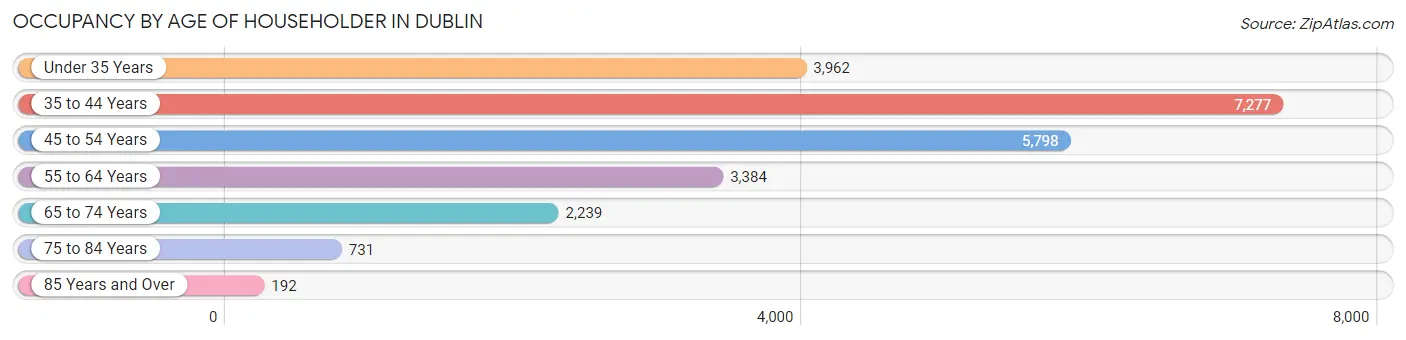
| Age Bracket | # Households | % Households |
| Under 35 Years | 3,962 | 16.8% |
| 35 to 44 Years | 7,277 | 30.9% |
| 45 to 54 Years | 5,798 | 24.6% |
| 55 to 64 Years | 3,384 | 14.3% |
| 65 to 74 Years | 2,239 | 9.5% |
| 75 to 84 Years | 731 | 3.1% |
| 85 Years and Over | 192 | 0.8% |
| Total | 23,583 | 100.0% |
Housing Finances in Dublin
Median Income by Occupancy in Dublin
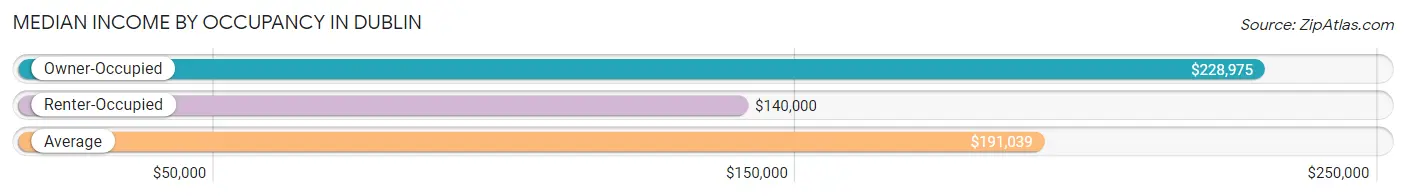
| Occupancy Type | # Households | Median Income |
| Owner-Occupied | 15,179 (64.4%) | $228,975 |
| Renter-Occupied | 8,404 (35.6%) | $140,000 |
| Average | 23,583 (100.0%) | $191,039 |
Occupancy by Householder Income Bracket in Dublin
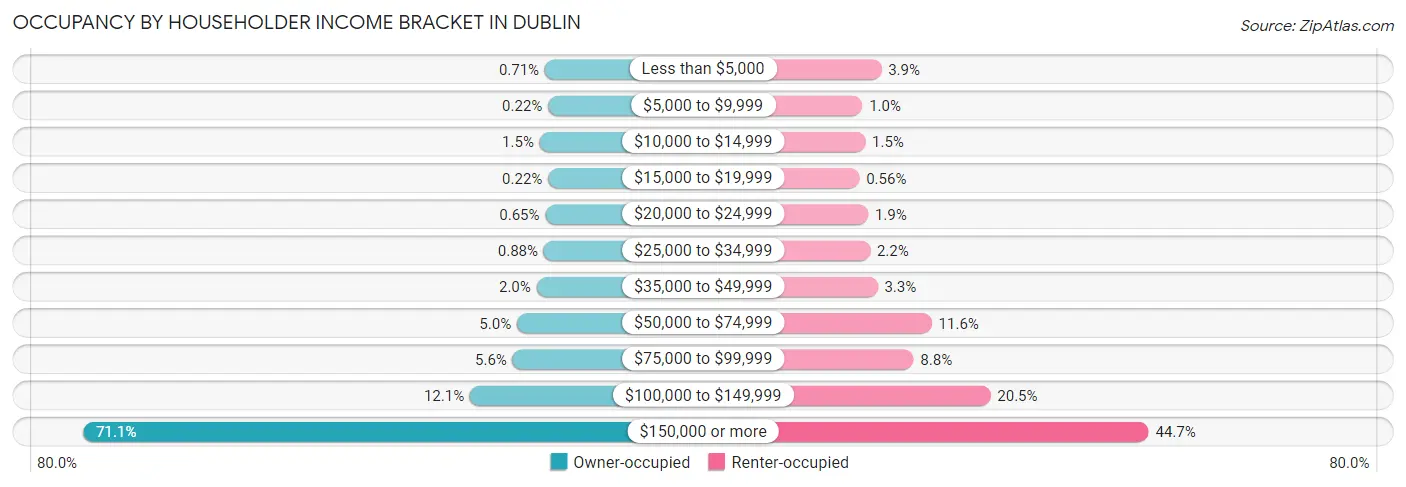
| Income Bracket | Owner-occupied | Renter-occupied |
| Less than $5,000 | 108 (0.7%) | 329 (3.9%) |
| $5,000 to $9,999 | 34 (0.2%) | 86 (1.0%) |
| $10,000 to $14,999 | 228 (1.5%) | 123 (1.5%) |
| $15,000 to $19,999 | 33 (0.2%) | 47 (0.6%) |
| $20,000 to $24,999 | 98 (0.6%) | 159 (1.9%) |
| $25,000 to $34,999 | 134 (0.9%) | 185 (2.2%) |
| $35,000 to $49,999 | 301 (2.0%) | 281 (3.3%) |
| $50,000 to $74,999 | 755 (5.0%) | 975 (11.6%) |
| $75,000 to $99,999 | 854 (5.6%) | 741 (8.8%) |
| $100,000 to $149,999 | 1,841 (12.1%) | 1,726 (20.5%) |
| $150,000 or more | 10,793 (71.1%) | 3,752 (44.7%) |
| Total | 15,179 (100.0%) | 8,404 (100.0%) |
Monthly Housing Cost Tiers in Dublin
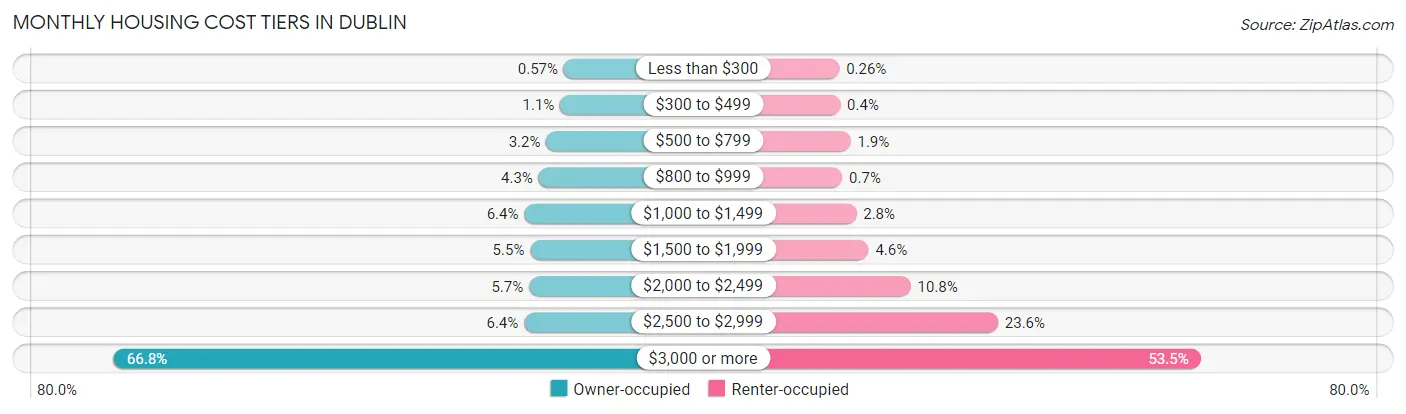
| Monthly Cost | Owner-occupied | Renter-occupied |
| Less than $300 | 86 (0.6%) | 22 (0.3%) |
| $300 to $499 | 169 (1.1%) | 34 (0.4%) |
| $500 to $799 | 480 (3.2%) | 162 (1.9%) |
| $800 to $999 | 649 (4.3%) | 59 (0.7%) |
| $1,000 to $1,499 | 971 (6.4%) | 234 (2.8%) |
| $1,500 to $1,999 | 838 (5.5%) | 384 (4.6%) |
| $2,000 to $2,499 | 865 (5.7%) | 906 (10.8%) |
| $2,500 to $2,999 | 975 (6.4%) | 1,986 (23.6%) |
| $3,000 or more | 10,146 (66.8%) | 4,494 (53.5%) |
| Total | 15,179 (100.0%) | 8,404 (100.0%) |
Physical Housing Characteristics in Dublin
Housing Structures in Dublin
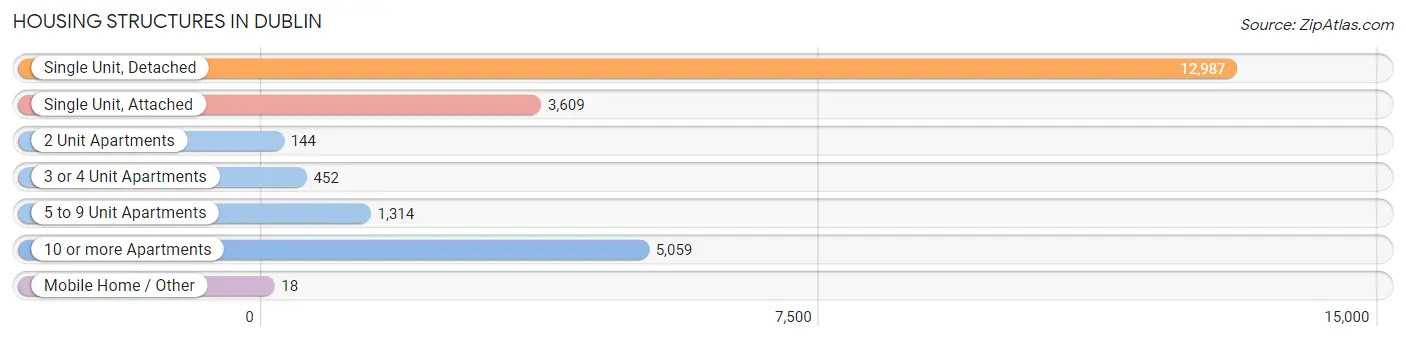
| Structure Type | # Housing Units | % Housing Units |
| Single Unit, Detached | 12,987 | 55.1% |
| Single Unit, Attached | 3,609 | 15.3% |
| 2 Unit Apartments | 144 | 0.6% |
| 3 or 4 Unit Apartments | 452 | 1.9% |
| 5 to 9 Unit Apartments | 1,314 | 5.6% |
| 10 or more Apartments | 5,059 | 21.4% |
| Mobile Home / Other | 18 | 0.1% |
| Total | 23,583 | 100.0% |
Housing Structures by Occupancy in Dublin
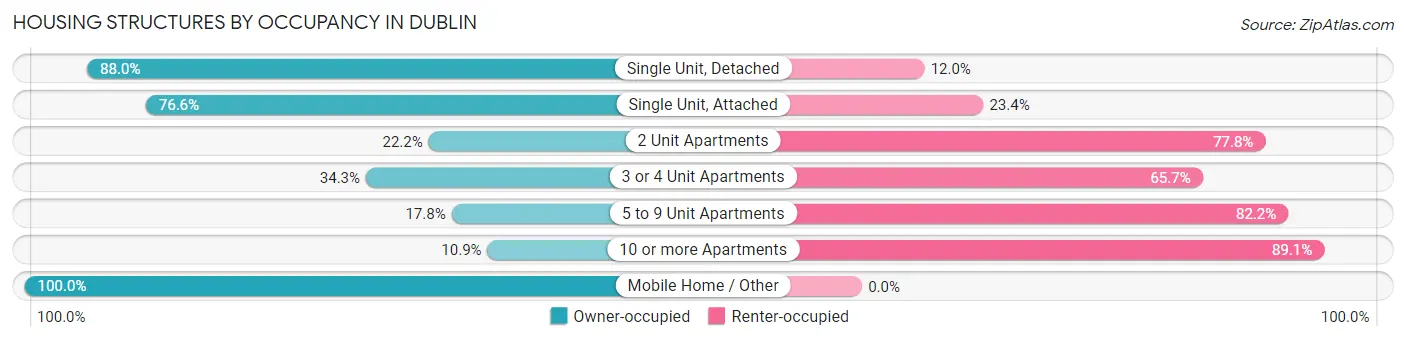
| Structure Type | Owner-occupied | Renter-occupied |
| Single Unit, Detached | 11,423 (88.0%) | 1,564 (12.0%) |
| Single Unit, Attached | 2,766 (76.6%) | 843 (23.4%) |
| 2 Unit Apartments | 32 (22.2%) | 112 (77.8%) |
| 3 or 4 Unit Apartments | 155 (34.3%) | 297 (65.7%) |
| 5 to 9 Unit Apartments | 234 (17.8%) | 1,080 (82.2%) |
| 10 or more Apartments | 551 (10.9%) | 4,508 (89.1%) |
| Mobile Home / Other | 18 (100.0%) | 0 (0.0%) |
| Total | 15,179 (64.4%) | 8,404 (35.6%) |
Housing Structures by Number of Rooms in Dublin
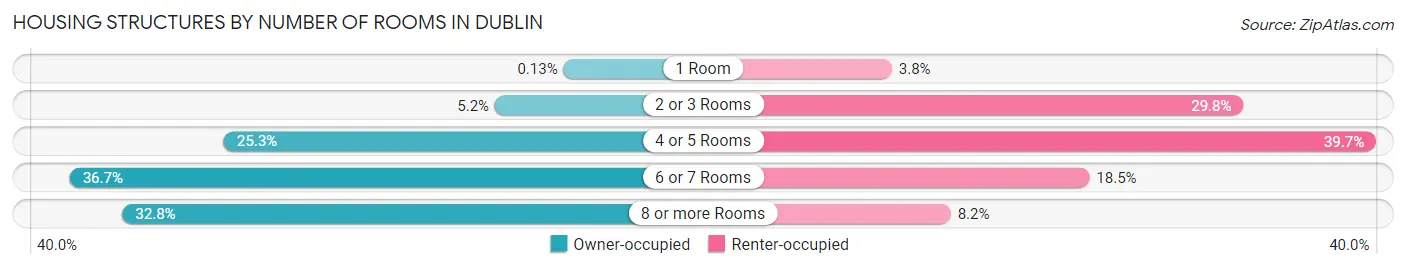
| Number of Rooms | Owner-occupied | Renter-occupied |
| 1 Room | 20 (0.1%) | 323 (3.8%) |
| 2 or 3 Rooms | 789 (5.2%) | 2,508 (29.8%) |
| 4 or 5 Rooms | 3,832 (25.3%) | 3,333 (39.7%) |
| 6 or 7 Rooms | 5,565 (36.7%) | 1,551 (18.5%) |
| 8 or more Rooms | 4,973 (32.8%) | 689 (8.2%) |
| Total | 15,179 (100.0%) | 8,404 (100.0%) |
Housing Structure by Heating Type in Dublin
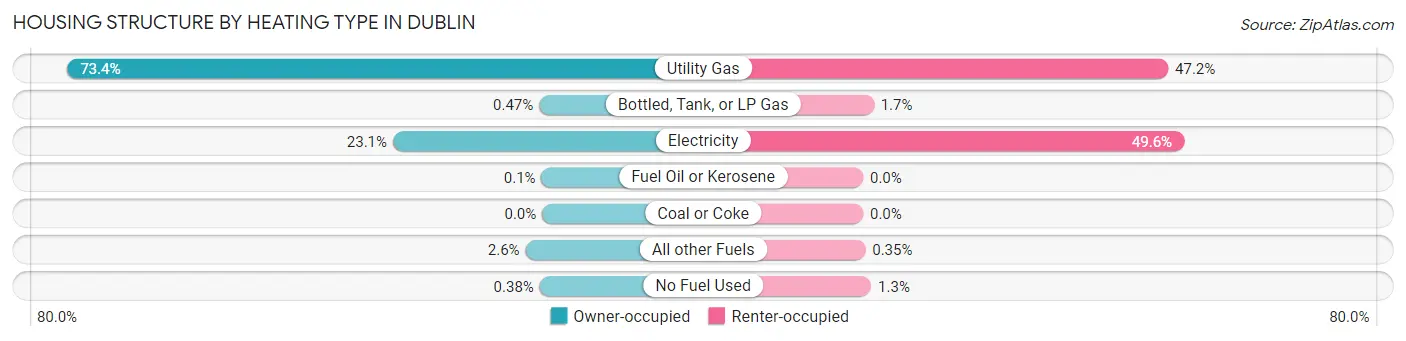
| Heating Type | Owner-occupied | Renter-occupied |
| Utility Gas | 11,141 (73.4%) | 3,963 (47.2%) |
| Bottled, Tank, or LP Gas | 72 (0.5%) | 139 (1.7%) |
| Electricity | 3,502 (23.1%) | 4,168 (49.6%) |
| Fuel Oil or Kerosene | 15 (0.1%) | 0 (0.0%) |
| Coal or Coke | 0 (0.0%) | 0 (0.0%) |
| All other Fuels | 391 (2.6%) | 29 (0.4%) |
| No Fuel Used | 58 (0.4%) | 105 (1.3%) |
| Total | 15,179 (100.0%) | 8,404 (100.0%) |
Household Vehicle Usage in Dublin
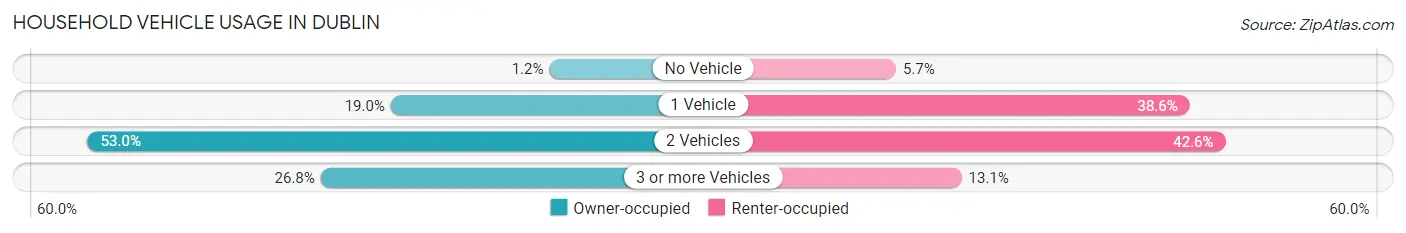
| Vehicles per Household | Owner-occupied | Renter-occupied |
| No Vehicle | 185 (1.2%) | 481 (5.7%) |
| 1 Vehicle | 2,882 (19.0%) | 3,244 (38.6%) |
| 2 Vehicles | 8,038 (52.9%) | 3,581 (42.6%) |
| 3 or more Vehicles | 4,074 (26.8%) | 1,098 (13.1%) |
| Total | 15,179 (100.0%) | 8,404 (100.0%) |
Real Estate & Mortgages in Dublin
Real Estate and Mortgage Overview in Dublin
| Characteristic | Without Mortgage | With Mortgage |
| Housing Units | 3,057 | 12,122 |
| Median Property Value | $1,105,900 | $1,180,800 |
| Median Household Income | $160,236 | $9,155 |
| Monthly Housing Costs | $1,154 | $10,091 |
| Real Estate Taxes | $9,052 | $83 |
Property Value by Mortgage Status in Dublin
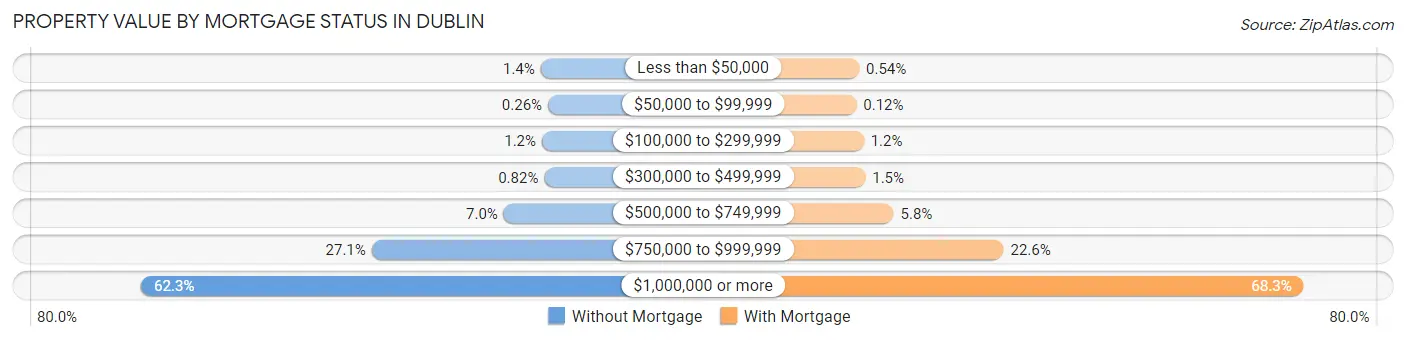
| Property Value | Without Mortgage | With Mortgage |
| Less than $50,000 | 42 (1.4%) | 66 (0.5%) |
| $50,000 to $99,999 | 8 (0.3%) | 14 (0.1%) |
| $100,000 to $299,999 | 36 (1.2%) | 150 (1.2%) |
| $300,000 to $499,999 | 25 (0.8%) | 180 (1.5%) |
| $500,000 to $749,999 | 214 (7.0%) | 703 (5.8%) |
| $750,000 to $999,999 | 829 (27.1%) | 2,733 (22.6%) |
| $1,000,000 or more | 1,903 (62.3%) | 8,276 (68.3%) |
| Total | 3,057 (100.0%) | 12,122 (100.0%) |
Household Income by Mortgage Status in Dublin
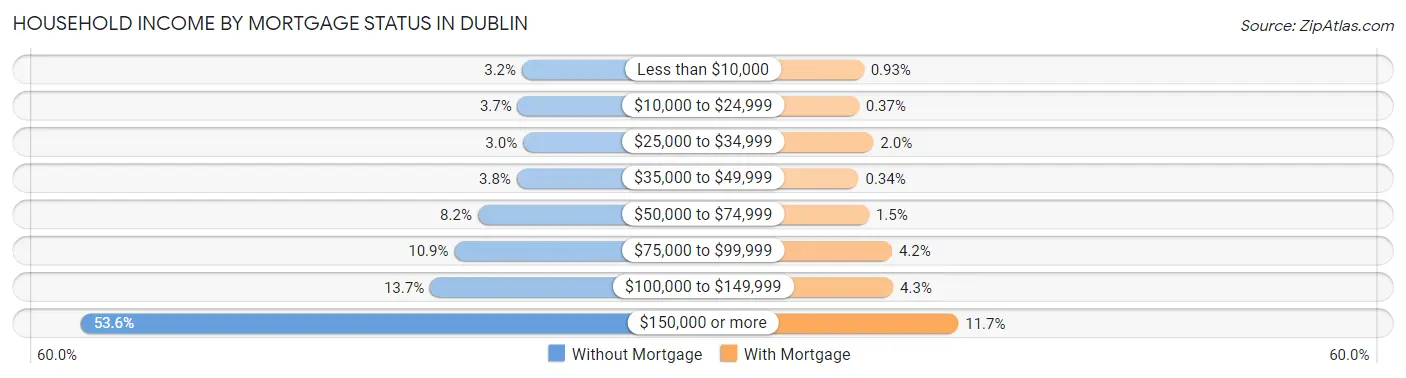
| Household Income | Without Mortgage | With Mortgage |
| Less than $10,000 | 97 (3.2%) | 113 (0.9%) |
| $10,000 to $24,999 | 112 (3.7%) | 45 (0.4%) |
| $25,000 to $34,999 | 93 (3.0%) | 247 (2.0%) |
| $35,000 to $49,999 | 115 (3.8%) | 41 (0.3%) |
| $50,000 to $74,999 | 251 (8.2%) | 186 (1.5%) |
| $75,000 to $99,999 | 333 (10.9%) | 504 (4.2%) |
| $100,000 to $149,999 | 418 (13.7%) | 521 (4.3%) |
| $150,000 or more | 1,638 (53.6%) | 1,423 (11.7%) |
| Total | 3,057 (100.0%) | 12,122 (100.0%) |
Property Value to Household Income Ratio in Dublin
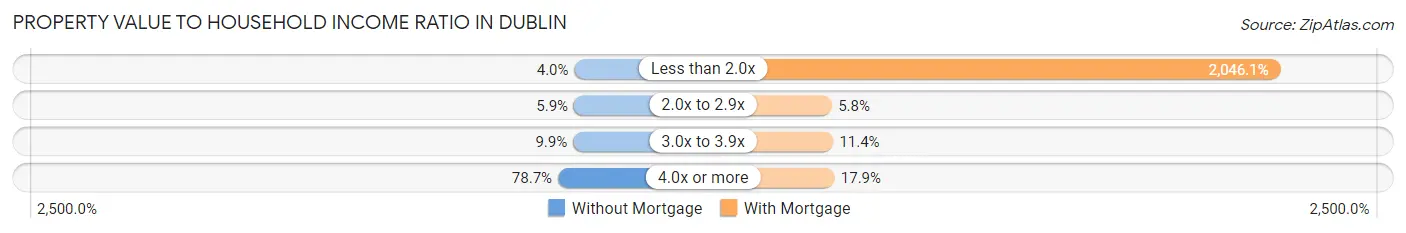
| Value-to-Income Ratio | Without Mortgage | With Mortgage |
| Less than 2.0x | 121 (4.0%) | 248,026 (2,046.1%) |
| 2.0x to 2.9x | 179 (5.9%) | 706 (5.8%) |
| 3.0x to 3.9x | 302 (9.9%) | 1,384 (11.4%) |
| 4.0x or more | 2,405 (78.7%) | 2,165 (17.9%) |
| Total | 3,057 (100.0%) | 12,122 (100.0%) |
Real Estate Taxes by Mortgage Status in Dublin

| Property Taxes | Without Mortgage | With Mortgage |
| Less than $800 | 0 (0.0%) | 9 (0.1%) |
| $800 to $1,499 | 19 (0.6%) | 73 (0.6%) |
| $800 to $1,499 | 2,890 (94.5%) | 64 (0.5%) |
| Total | 3,057 (100.0%) | 12,122 (100.0%) |
Health & Disability in Dublin
Health Insurance Coverage by Age in Dublin
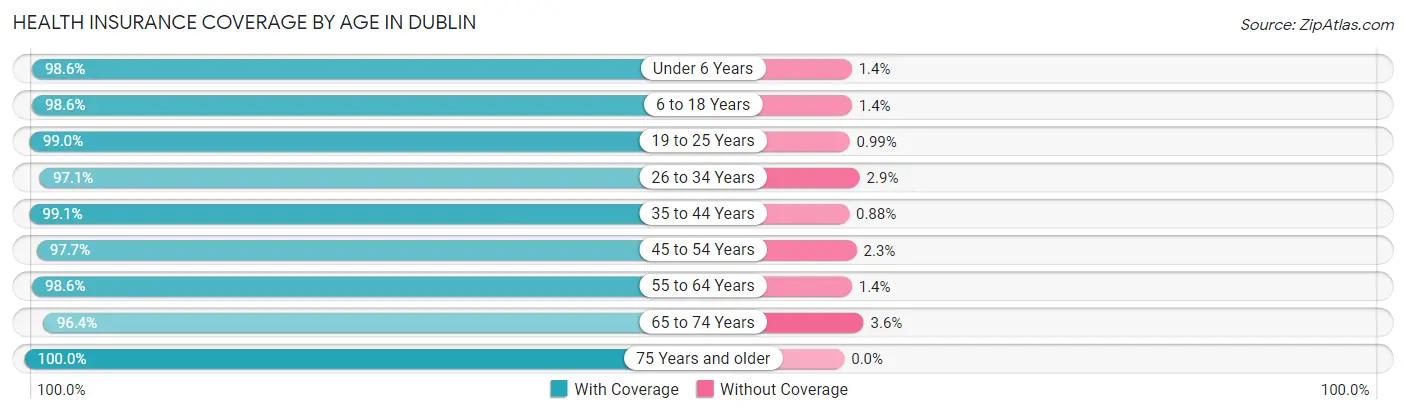
| Age Bracket | With Coverage | Without Coverage |
| Under 6 Years | 6,060 (98.6%) | 85 (1.4%) |
| 6 to 18 Years | 12,757 (98.6%) | 183 (1.4%) |
| 19 to 25 Years | 3,908 (99.0%) | 39 (1.0%) |
| 26 to 34 Years | 8,399 (97.1%) | 248 (2.9%) |
| 35 to 44 Years | 14,585 (99.1%) | 130 (0.9%) |
| 45 to 54 Years | 9,922 (97.7%) | 233 (2.3%) |
| 55 to 64 Years | 5,927 (98.6%) | 84 (1.4%) |
| 65 to 74 Years | 4,336 (96.4%) | 162 (3.6%) |
| 75 Years and older | 2,308 (100.0%) | 0 (0.0%) |
| Total | 68,202 (98.3%) | 1,164 (1.7%) |
Health Insurance Coverage by Citizenship Status in Dublin
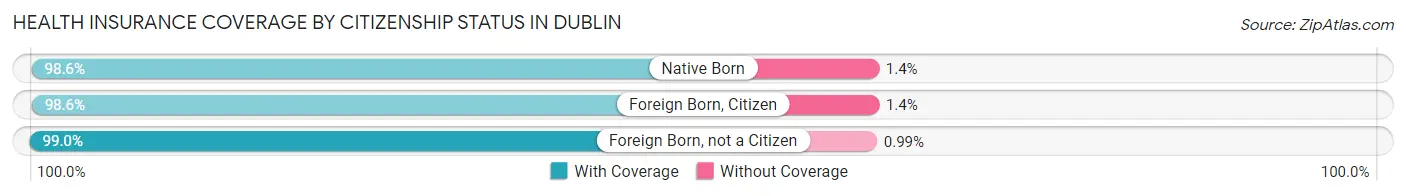
| Citizenship Status | With Coverage | Without Coverage |
| Native Born | 6,060 (98.6%) | 85 (1.4%) |
| Foreign Born, Citizen | 12,757 (98.6%) | 183 (1.4%) |
| Foreign Born, not a Citizen | 3,908 (99.0%) | 39 (1.0%) |
Health Insurance Coverage by Household Income in Dublin
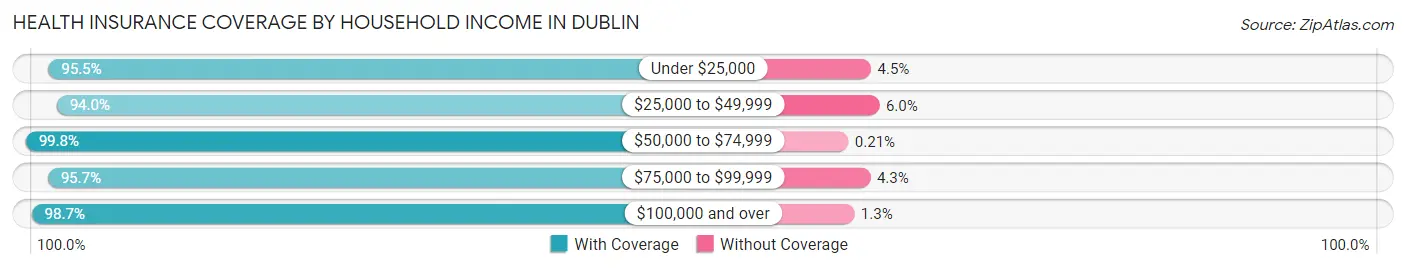
| Household Income | With Coverage | Without Coverage |
| Under $25,000 | 2,251 (95.5%) | 105 (4.5%) |
| $25,000 to $49,999 | 1,842 (94.0%) | 118 (6.0%) |
| $50,000 to $74,999 | 3,891 (99.8%) | 8 (0.2%) |
| $75,000 to $99,999 | 3,591 (95.7%) | 163 (4.3%) |
| $100,000 and over | 56,469 (98.7%) | 759 (1.3%) |
Public vs Private Health Insurance Coverage by Age in Dublin
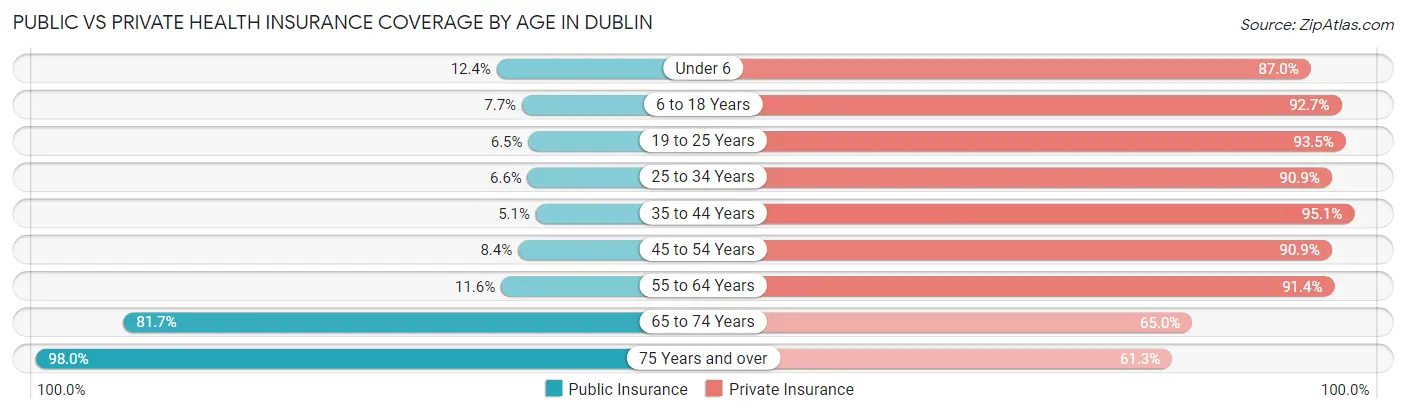
| Age Bracket | Public Insurance | Private Insurance |
| Under 6 | 760 (12.4%) | 5,347 (87.0%) |
| 6 to 18 Years | 995 (7.7%) | 11,995 (92.7%) |
| 19 to 25 Years | 256 (6.5%) | 3,690 (93.5%) |
| 25 to 34 Years | 572 (6.6%) | 7,862 (90.9%) |
| 35 to 44 Years | 754 (5.1%) | 13,990 (95.1%) |
| 45 to 54 Years | 854 (8.4%) | 9,230 (90.9%) |
| 55 to 64 Years | 695 (11.6%) | 5,494 (91.4%) |
| 65 to 74 Years | 3,673 (81.7%) | 2,925 (65.0%) |
| 75 Years and over | 2,262 (98.0%) | 1,415 (61.3%) |
| Total | 10,821 (15.6%) | 61,948 (89.3%) |
Disability Status by Sex by Age in Dublin
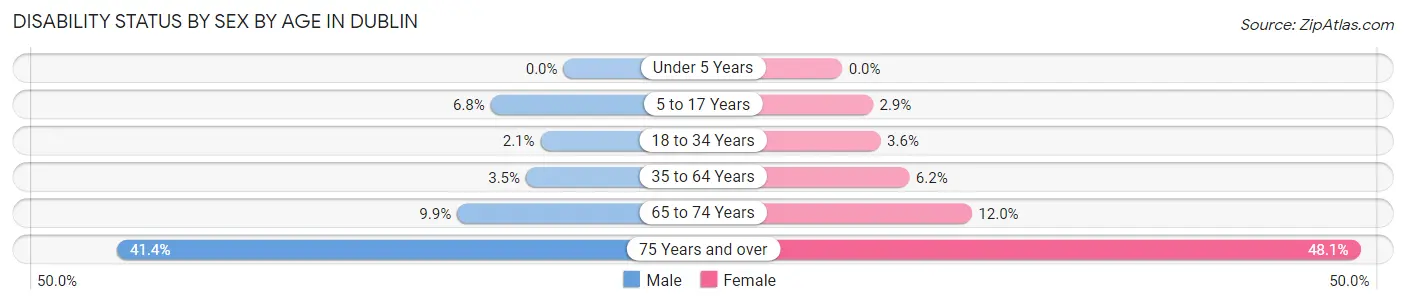
| Age Bracket | Male | Female |
| Under 5 Years | 0 (0.0%) | 0 (0.0%) |
| 5 to 17 Years | 476 (6.8%) | 185 (2.9%) |
| 18 to 34 Years | 141 (2.1%) | 233 (3.6%) |
| 35 to 64 Years | 532 (3.5%) | 970 (6.2%) |
| 65 to 74 Years | 210 (9.9%) | 285 (12.0%) |
| 75 Years and over | 398 (41.4%) | 648 (48.1%) |
Disability Class by Sex by Age in Dublin
Disability Class: Hearing Difficulty
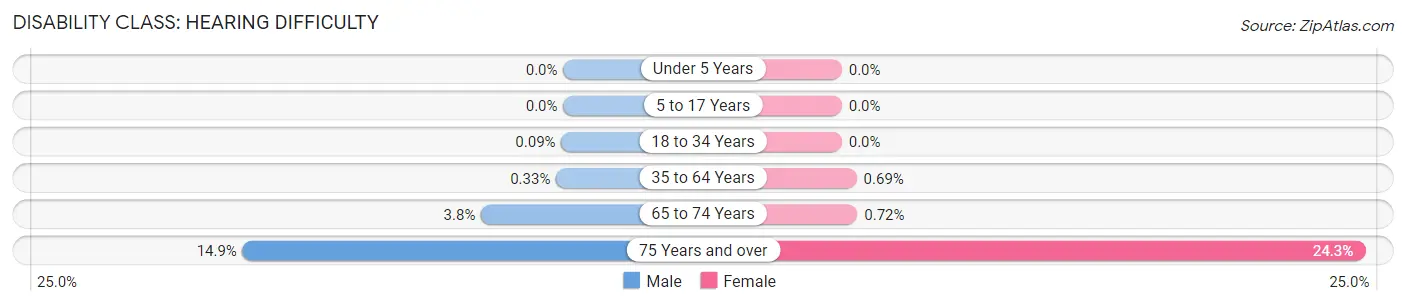
| Age Bracket | Male | Female |
| Under 5 Years | 0 (0.0%) | 0 (0.0%) |
| 5 to 17 Years | 0 (0.0%) | 0 (0.0%) |
| 18 to 34 Years | 6 (0.1%) | 0 (0.0%) |
| 35 to 64 Years | 51 (0.3%) | 107 (0.7%) |
| 65 to 74 Years | 81 (3.8%) | 17 (0.7%) |
| 75 Years and over | 143 (14.9%) | 327 (24.3%) |
Disability Class: Vision Difficulty
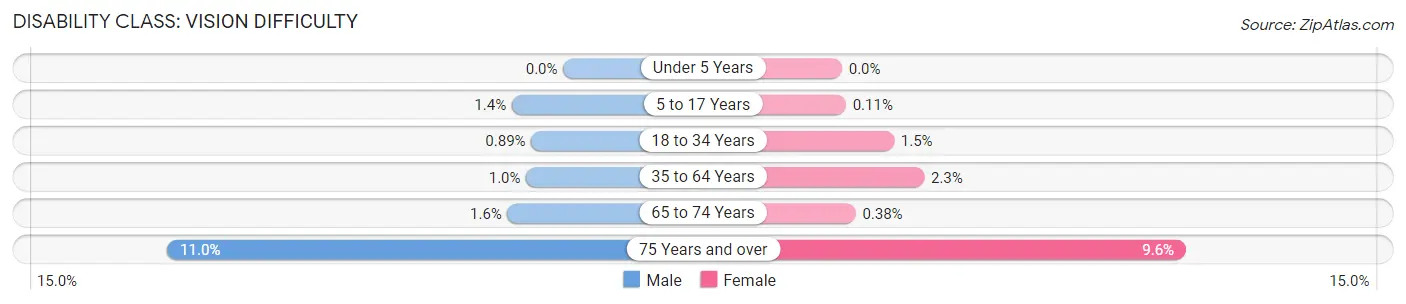
| Age Bracket | Male | Female |
| Under 5 Years | 0 (0.0%) | 0 (0.0%) |
| 5 to 17 Years | 101 (1.4%) | 7 (0.1%) |
| 18 to 34 Years | 59 (0.9%) | 95 (1.5%) |
| 35 to 64 Years | 158 (1.0%) | 357 (2.3%) |
| 65 to 74 Years | 33 (1.5%) | 9 (0.4%) |
| 75 Years and over | 106 (11.0%) | 129 (9.6%) |
Disability Class: Cognitive Difficulty
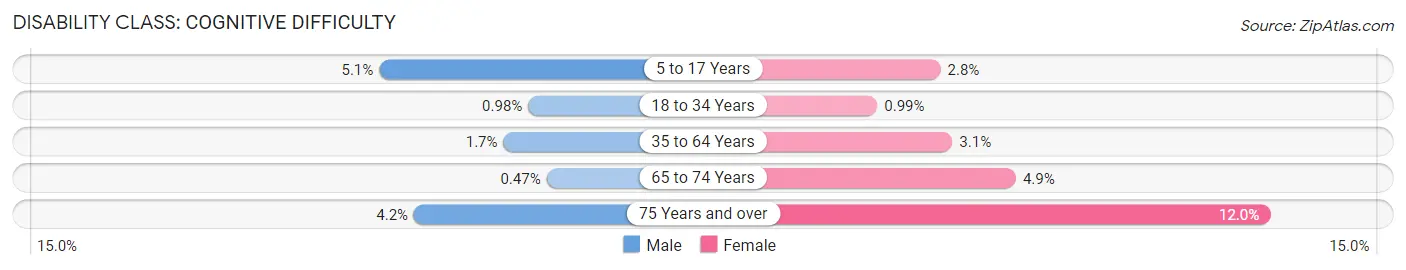
| Age Bracket | Male | Female |
| 5 to 17 Years | 362 (5.1%) | 178 (2.8%) |
| 18 to 34 Years | 65 (1.0%) | 65 (1.0%) |
| 35 to 64 Years | 255 (1.7%) | 479 (3.1%) |
| 65 to 74 Years | 10 (0.5%) | 115 (4.9%) |
| 75 Years and over | 40 (4.2%) | 161 (11.9%) |
Disability Class: Ambulatory Difficulty
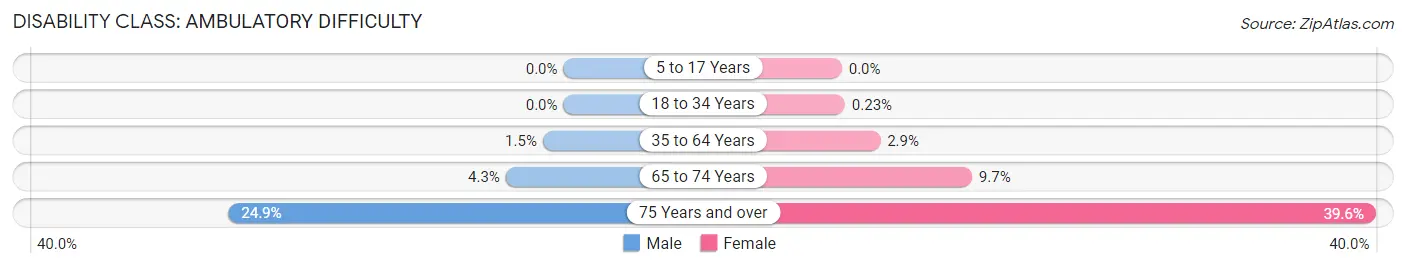
| Age Bracket | Male | Female |
| 5 to 17 Years | 0 (0.0%) | 0 (0.0%) |
| 18 to 34 Years | 0 (0.0%) | 15 (0.2%) |
| 35 to 64 Years | 234 (1.5%) | 444 (2.9%) |
| 65 to 74 Years | 91 (4.3%) | 229 (9.7%) |
| 75 Years and over | 239 (24.9%) | 534 (39.6%) |
Disability Class: Self-Care Difficulty
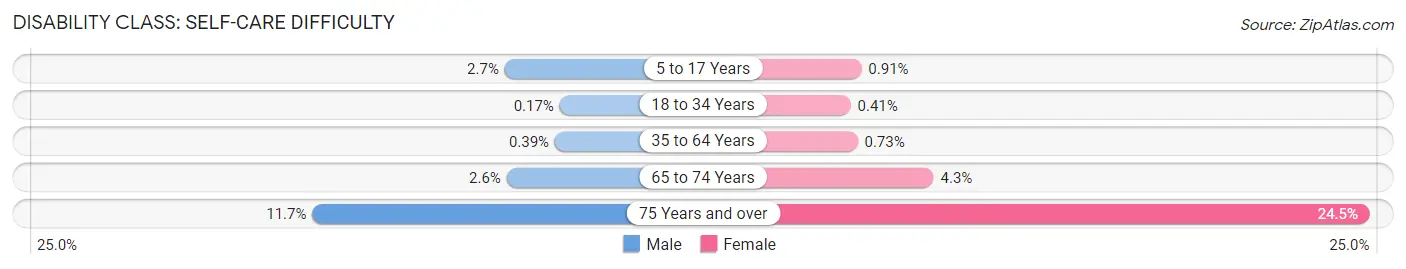
| Age Bracket | Male | Female |
| 5 to 17 Years | 192 (2.7%) | 59 (0.9%) |
| 18 to 34 Years | 11 (0.2%) | 27 (0.4%) |
| 35 to 64 Years | 59 (0.4%) | 113 (0.7%) |
| 65 to 74 Years | 56 (2.6%) | 101 (4.3%) |
| 75 Years and over | 112 (11.7%) | 330 (24.5%) |
Technology Access in Dublin
Computing Device Access in Dublin
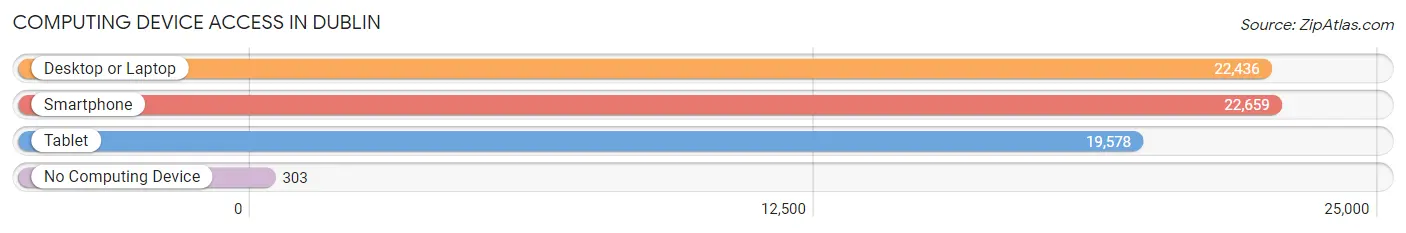
| Device Type | # Households | % Households |
| Desktop or Laptop | 22,436 | 95.1% |
| Smartphone | 22,659 | 96.1% |
| Tablet | 19,578 | 83.0% |
| No Computing Device | 303 | 1.3% |
| Total | 23,583 | 100.0% |
Internet Access in Dublin
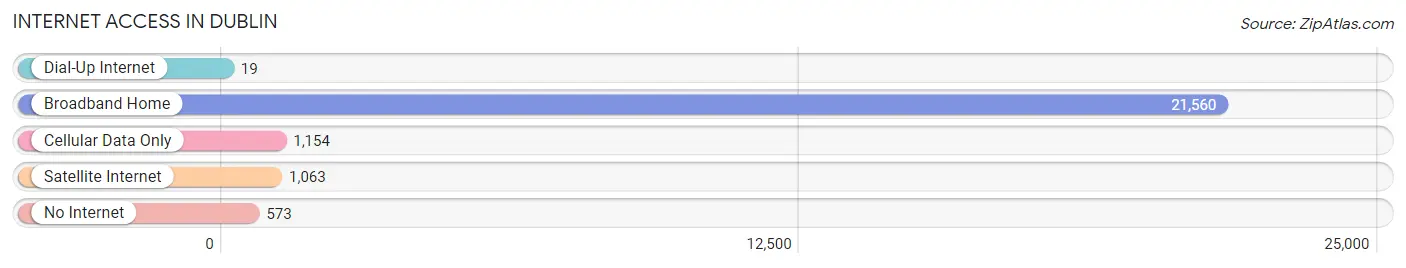
| Internet Type | # Households | % Households |
| Dial-Up Internet | 19 | 0.1% |
| Broadband Home | 21,560 | 91.4% |
| Cellular Data Only | 1,154 | 4.9% |
| Satellite Internet | 1,063 | 4.5% |
| No Internet | 573 | 2.4% |
| Total | 23,583 | 100.0% |
Dublin Summary
Dublin, California is a city located in Alameda County, in the San Francisco Bay Area. It is situated at the junction of Interstate 580 and Interstate 680, approximately 35 miles east of San Francisco. The city is known for its high quality of life, excellent schools, and diverse population.
History
The area that is now Dublin was originally inhabited by the Ohlone people, who were hunter-gatherers. In the early 1800s, the area was settled by Mexican ranchers, who named the area “Rancho San Ramon”. In 1835, the area was granted to John Horner, who established a stagecoach stop and trading post. In 1858, the town was renamed “Dublin” after the Irish city of the same name.
In the late 1800s, the area was transformed by the arrival of the railroad. The Central Pacific Railroad built a station in Dublin, which allowed for the transportation of goods and people. This led to the growth of the town, and by the early 1900s, Dublin had become a thriving agricultural community.
In the 1950s, Dublin began to experience rapid growth due to the development of the nearby cities of Pleasanton and Livermore. This growth continued into the 1970s, when Dublin was incorporated as a city in 1982.
Geography
Dublin is located in the East Bay region of the San Francisco Bay Area. It is situated at the junction of Interstate 580 and Interstate 680, approximately 35 miles east of San Francisco. The city is bordered by Pleasanton to the north, Livermore to the east, San Ramon to the south, and Castro Valley to the west.
The city has a total area of 14.6 square miles, of which 14.3 square miles is land and 0.3 square miles is water. The city is located in the foothills of the Diablo Range, and is characterized by rolling hills and valleys. The city is also home to several parks, including Dublin Hills Regional Park, Dublin Creek Park, and Dublin Community Park.
Economy
Dublin’s economy is largely driven by the technology industry. The city is home to several major employers, including Oracle, Ross Stores, and Kaiser Permanente. The city is also home to several shopping centers, including the Stoneridge Shopping Center and the Hacienda Crossings Shopping Center.
In addition to the technology industry, Dublin is also home to several other industries, including healthcare, retail, and hospitality. The city is also home to several educational institutions, including the University of California, Berkeley, and the University of San Francisco.
Demographics
As of the 2010 census, Dublin had a population of 46,063. The racial makeup of the city was 57.2% White, 24.3% Asian, 11.2% Hispanic or Latino, 8.2% African American, and 0.3% Native American.
The median household income in Dublin was $103,814, and the median family income was $117,813. The per capita income was $41,845. The city’s poverty rate was 4.2%.
Dublin is a diverse city, with a large Asian population. The city is also home to a large Irish-American population, as well as a growing Hispanic population. The city is also home to a large number of immigrants from India, China, and the Philippines.
Common Questions
What is Per Capita Income in Dublin?
Per Capita income in Dublin is $76,941.
What is the Median Family Income in Dublin?
Median Family Income in Dublin is $214,058.
What is the Median Household income in Dublin?
Median Household Income in Dublin is $191,039.
What is Income or Wage Gap in Dublin?
Income or Wage Gap in Dublin is 46.0%.
Women in Dublin earn 54.0 cents for every dollar earned by a man.
What is Inequality or Gini Index in Dublin?
Inequality or Gini Index in Dublin is 0.40.
What is the Total Population of Dublin?
Total Population of Dublin is 71,068.
What is the Total Male Population of Dublin?
Total Male Population of Dublin is 35,603.
What is the Total Female Population of Dublin?
Total Female Population of Dublin is 35,465.
What is the Ratio of Males per 100 Females in Dublin?
There are 100.39 Males per 100 Females in Dublin.
What is the Ratio of Females per 100 Males in Dublin?
There are 99.61 Females per 100 Males in Dublin.
What is the Median Population Age in Dublin?
Median Population Age in Dublin is 37.1 Years.
What is the Average Family Size in Dublin
Average Family Size in Dublin is 3.3 People.
What is the Average Household Size in Dublin
Average Household Size in Dublin is 2.9 People.
How Large is the Labor Force in Dublin?
There are 37,969 People in the Labor Forcein in Dublin.
What is the Percentage of People in the Labor Force in Dublin?
69.9% of People are in the Labor Force in Dublin.
What is the Unemployment Rate in Dublin?
Unemployment Rate in Dublin is 3.4%.