Long Beach, CA Map & Demographics
Long Beach Map
Long Beach Overview
$39,589
PER CAPITA INCOME
$89,469
AVG FAMILY INCOME
$78,995
AVG HOUSEHOLD INCOME
22.6%
WAGE / INCOME GAP [ % ]
77.4¢/ $1
WAGE / INCOME GAP [ $ ]
$11,786
FAMILY INCOME DEFICIT
0.46
INEQUALITY / GINI INDEX
462,293
TOTAL POPULATION
228,674
MALE POPULATION
233,619
FEMALE POPULATION
97.88
MALES / 100 FEMALES
102.16
FEMALES / 100 MALES
36.1
MEDIAN AGE
3.4
AVG FAMILY SIZE
2.6
AVG HOUSEHOLD SIZE
251,514
LABOR FORCE [ PEOPLE ]
66.6%
PERCENT IN LABOR FORCE
6.6%
UNEMPLOYMENT RATE
Long Beach Zip Codes
Income in Long Beach
Income Overview in Long Beach
Per Capita Income in Long Beach is $39,589, while median incomes of families and households are $89,469 and $78,995 respectively.
| Characteristic | Number | Measure |
| Per Capita Income | 462,293 | $39,589 |
| Median Family Income | 100,098 | $89,469 |
| Mean Family Income | 100,098 | $118,781 |
| Median Household Income | 170,174 | $78,995 |
| Mean Household Income | 170,174 | $104,313 |
| Income Deficit | 100,098 | $11,786 |
| Wage / Income Gap (%) | 462,293 | 22.58% |
| Wage / Income Gap ($) | 462,293 | 77.42¢ per $1 |
| Gini / Inequality Index | 462,293 | 0.46 |
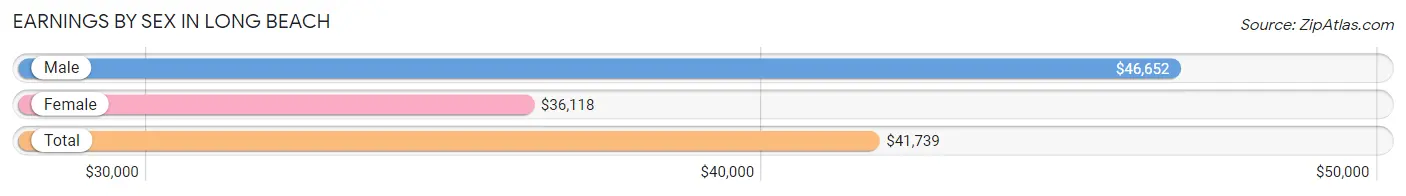
Earnings by Sex in Long Beach
Average Earnings in Long Beach are $41,739, $46,652 for men and $36,118 for women, a difference of 22.6%.
| Sex | Number | Average Earnings |
| Male | 133,134 (52.4%) | $46,652 |
| Female | 120,707 (47.5%) | $36,118 |
| Total | 253,841 (100.0%) | $41,739 |
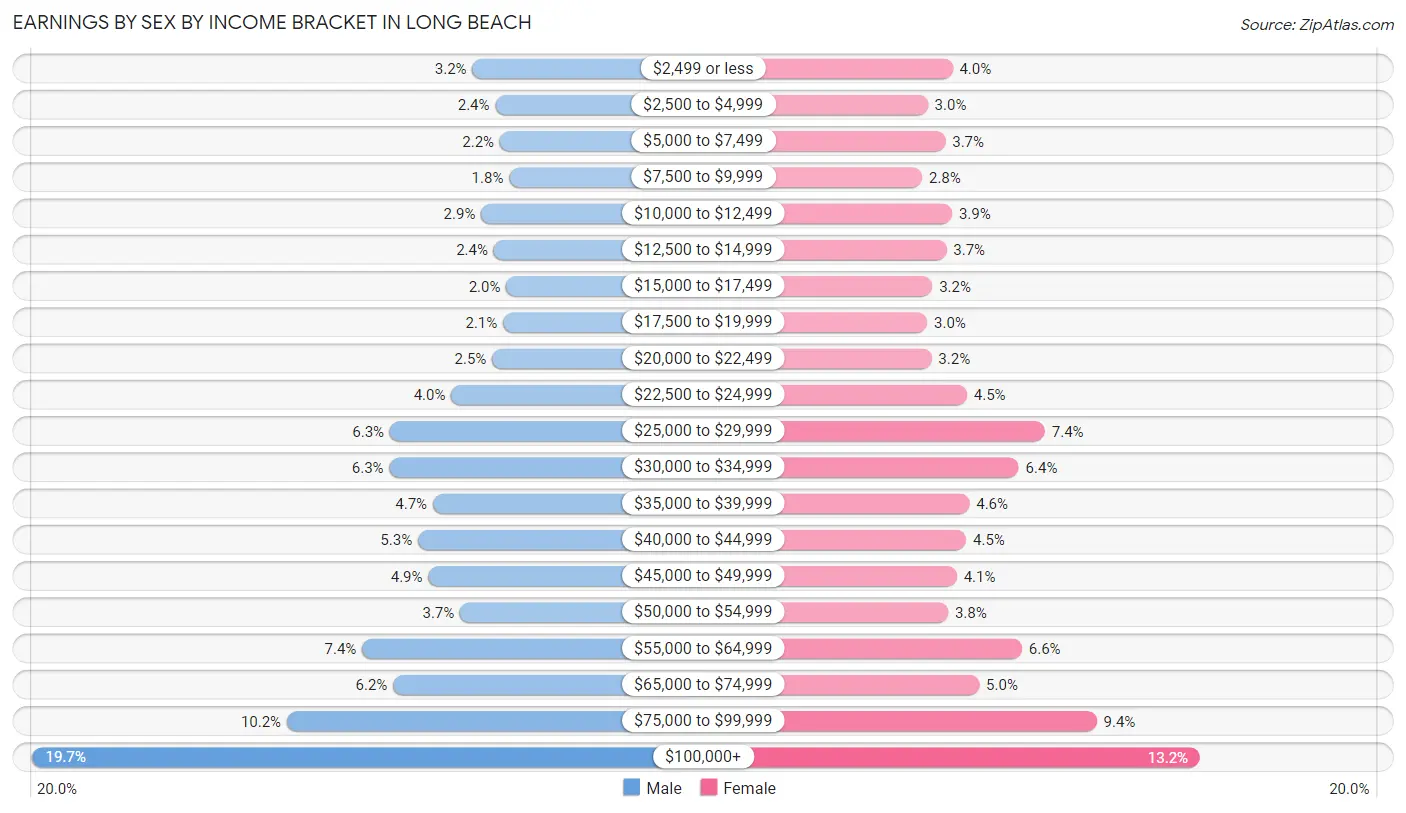
Earnings by Sex by Income Bracket in Long Beach
The most common earnings brackets in Long Beach are $100,000+ for men (26,221 | 19.7%) and $100,000+ for women (15,971 | 13.2%).
| Income | Male | Female |
| $2,499 or less | 4,286 (3.2%) | 4,776 (4.0%) |
| $2,500 to $4,999 | 3,148 (2.4%) | 3,655 (3.0%) |
| $5,000 to $7,499 | 2,922 (2.2%) | 4,460 (3.7%) |
| $7,500 to $9,999 | 2,456 (1.8%) | 3,406 (2.8%) |
| $10,000 to $12,499 | 3,842 (2.9%) | 4,756 (3.9%) |
| $12,500 to $14,999 | 3,227 (2.4%) | 4,503 (3.7%) |
| $15,000 to $17,499 | 2,596 (1.9%) | 3,868 (3.2%) |
| $17,500 to $19,999 | 2,753 (2.1%) | 3,631 (3.0%) |
| $20,000 to $22,499 | 3,304 (2.5%) | 3,832 (3.2%) |
| $22,500 to $24,999 | 5,338 (4.0%) | 5,430 (4.5%) |
| $25,000 to $29,999 | 8,396 (6.3%) | 8,952 (7.4%) |
| $30,000 to $34,999 | 8,429 (6.3%) | 7,778 (6.4%) |
| $35,000 to $39,999 | 6,263 (4.7%) | 5,544 (4.6%) |
| $40,000 to $44,999 | 7,002 (5.3%) | 5,391 (4.5%) |
| $45,000 to $49,999 | 6,481 (4.9%) | 4,970 (4.1%) |
| $50,000 to $54,999 | 4,902 (3.7%) | 4,575 (3.8%) |
| $55,000 to $64,999 | 9,787 (7.3%) | 7,918 (6.6%) |
| $65,000 to $74,999 | 8,243 (6.2%) | 5,991 (5.0%) |
| $75,000 to $99,999 | 13,538 (10.2%) | 11,300 (9.4%) |
| $100,000+ | 26,221 (19.7%) | 15,971 (13.2%) |
| Total | 133,134 (100.0%) | 120,707 (100.0%) |
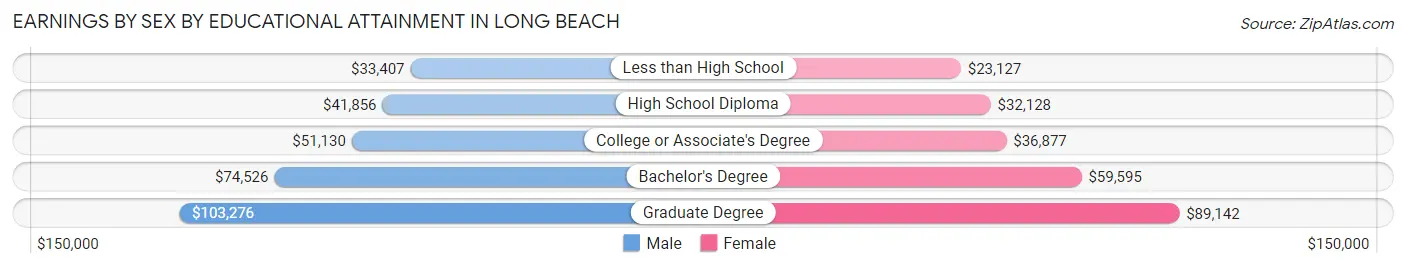
Earnings by Sex by Educational Attainment in Long Beach
Average earnings in Long Beach are $52,291 for men and $41,867 for women, a difference of 19.9%. Men with an educational attainment of graduate degree enjoy the highest average annual earnings of $103,276, while those with less than high school education earn the least with $33,407. Women with an educational attainment of graduate degree earn the most with the average annual earnings of $89,142, while those with less than high school education have the smallest earnings of $23,127.
| Educational Attainment | Male Income | Female Income |
| Less than High School | $33,407 | $23,127 |
| High School Diploma | $41,856 | $32,128 |
| College or Associate's Degree | $51,130 | $36,877 |
| Bachelor's Degree | $74,526 | $59,595 |
| Graduate Degree | $103,276 | $89,142 |
| Total | $52,291 | $41,867 |
Family Income in Long Beach
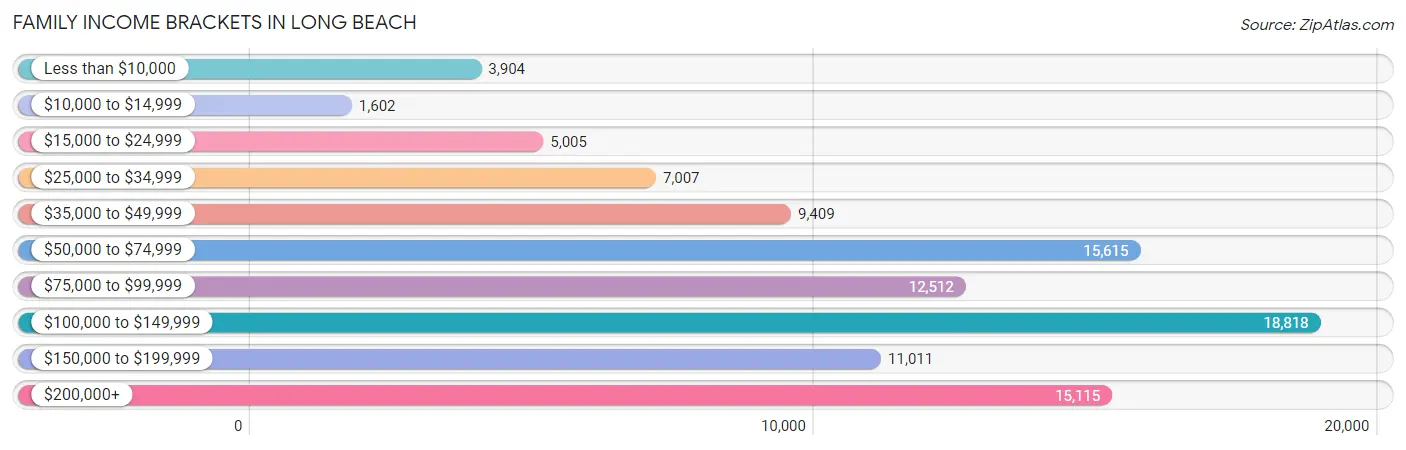
Family Income Brackets in Long Beach
According to the Long Beach family income data, there are 18,818 families falling into the $100,000 to $149,999 income range, which is the most common income bracket and makes up 18.8% of all families. Conversely, the $10,000 to $14,999 income bracket is the least frequent group with only 1,602 families (1.6%) belonging to this category.
| Income Bracket | # Families | % Families |
| Less than $10,000 | 3,904 | 3.9% |
| $10,000 to $14,999 | 1,602 | 1.6% |
| $15,000 to $24,999 | 5,005 | 5.0% |
| $25,000 to $34,999 | 7,007 | 7.0% |
| $35,000 to $49,999 | 9,409 | 9.4% |
| $50,000 to $74,999 | 15,615 | 15.6% |
| $75,000 to $99,999 | 12,512 | 12.5% |
| $100,000 to $149,999 | 18,818 | 18.8% |
| $150,000 to $199,999 | 11,011 | 11.0% |
| $200,000+ | 15,115 | 15.1% |
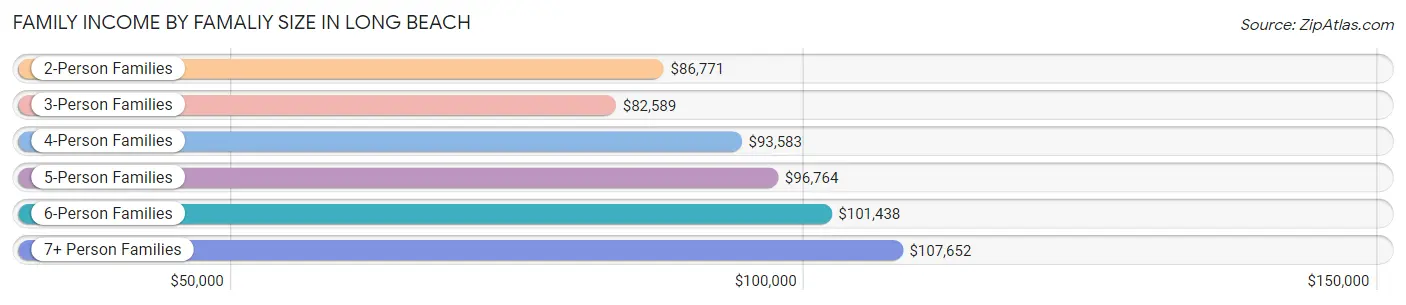
Family Income by Famaliy Size in Long Beach
7+ person families (2,742 | 2.7%) account for the highest median family income in Long Beach with $107,652 per family, while 2-person families (39,203 | 39.2%) have the highest median income of $43,386 per family member.
| Income Bracket | # Families | Median Income |
| 2-Person Families | 39,203 (39.2%) | $86,771 |
| 3-Person Families | 24,224 (24.2%) | $82,589 |
| 4-Person Families | 20,580 (20.6%) | $93,583 |
| 5-Person Families | 9,555 (9.6%) | $96,764 |
| 6-Person Families | 3,794 (3.8%) | $101,438 |
| 7+ Person Families | 2,742 (2.7%) | $107,652 |
| Total | 100,098 (100.0%) | $89,469 |
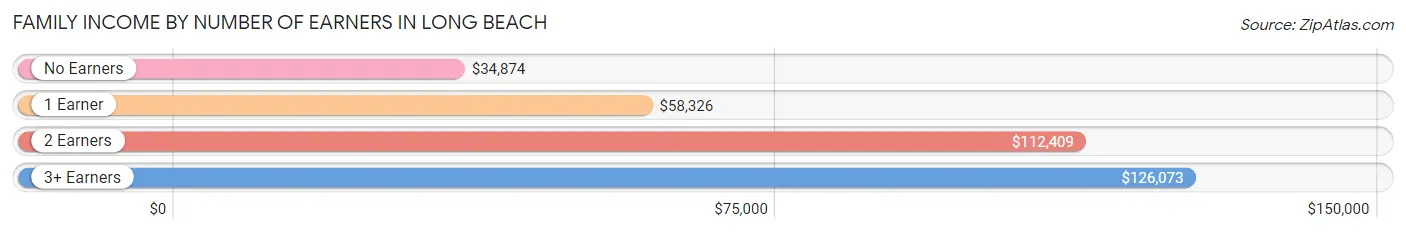
Family Income by Number of Earners in Long Beach
The median family income in Long Beach is $89,469, with families comprising 3+ earners (15,771) having the highest median family income of $126,073, while families with no earners (10,819) have the lowest median family income of $34,874, accounting for 15.8% and 10.8% of families, respectively.
| Number of Earners | # Families | Median Income |
| No Earners | 10,819 (10.8%) | $34,874 |
| 1 Earner | 33,007 (33.0%) | $58,326 |
| 2 Earners | 40,501 (40.5%) | $112,409 |
| 3+ Earners | 15,771 (15.8%) | $126,073 |
| Total | 100,098 (100.0%) | $89,469 |
Household Income in Long Beach
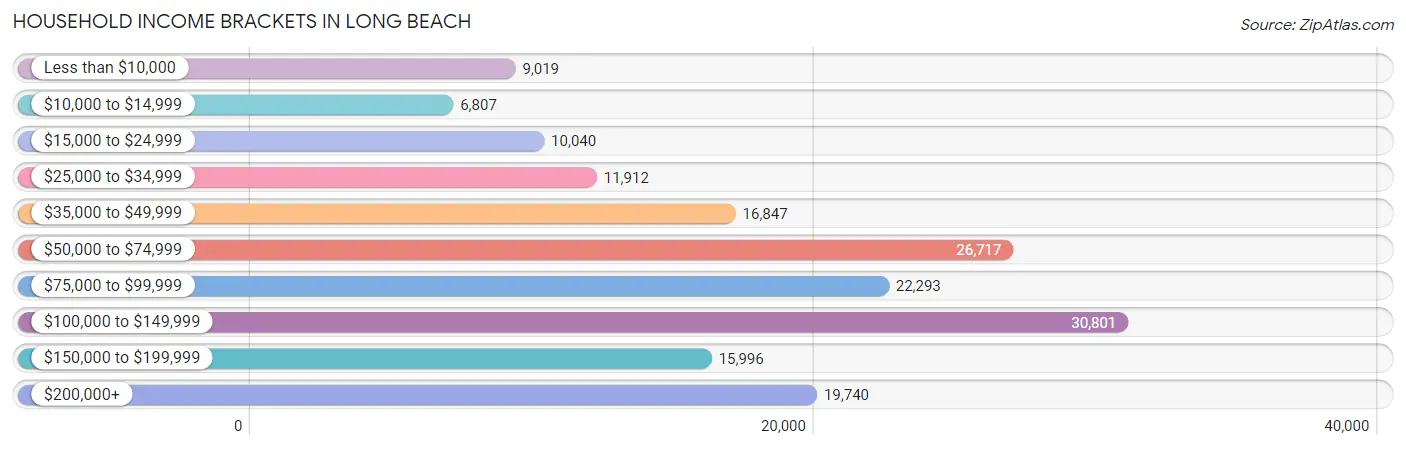
Household Income Brackets in Long Beach
With 30,801 households falling in the category, the $100,000 to $149,999 income range is the most frequent in Long Beach, accounting for 18.1% of all households. In contrast, only 6,807 households (4.0%) fall into the $10,000 to $14,999 income bracket, making it the least populous group.
| Income Bracket | # Households | % Households |
| Less than $10,000 | 9,019 | 5.3% |
| $10,000 to $14,999 | 6,807 | 4.0% |
| $15,000 to $24,999 | 10,040 | 5.9% |
| $25,000 to $34,999 | 11,912 | 7.0% |
| $35,000 to $49,999 | 16,847 | 9.9% |
| $50,000 to $74,999 | 26,717 | 15.7% |
| $75,000 to $99,999 | 22,293 | 13.1% |
| $100,000 to $149,999 | 30,801 | 18.1% |
| $150,000 to $199,999 | 15,996 | 9.4% |
| $200,000+ | 19,740 | 11.6% |
Household Income by Householder Age in Long Beach
The median household income in Long Beach is $78,995, with the highest median household income of $90,031 found in the 45 to 64 years age bracket for the primary householder. A total of 64,463 households (37.9%) fall into this category. Meanwhile, the 15 to 24 years age bracket for the primary householder has the lowest median household income of $47,762, with 6,044 households (3.5%) in this group.
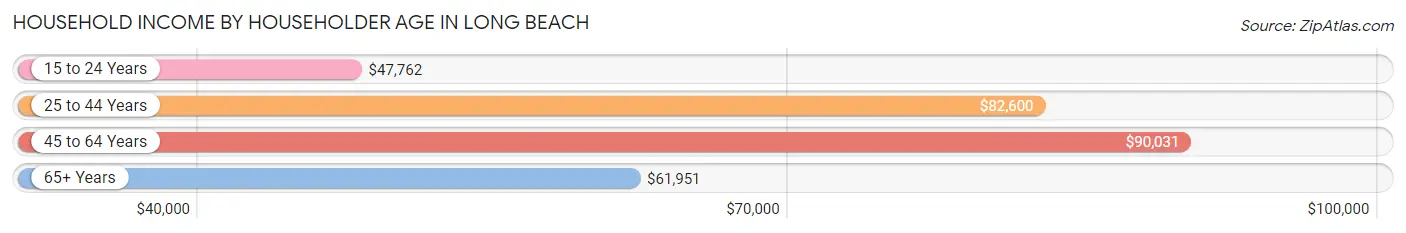
| Income Bracket | # Households | Median Income |
| 15 to 24 Years | 6,044 (3.5%) | $47,762 |
| 25 to 44 Years | 66,757 (39.2%) | $82,600 |
| 45 to 64 Years | 64,463 (37.9%) | $90,031 |
| 65+ Years | 32,910 (19.3%) | $61,951 |
| Total | 170,174 (100.0%) | $78,995 |
Poverty in Long Beach
Income Below Poverty by Sex and Age in Long Beach
With 13.6% poverty level for males and 16.5% for females among the residents of Long Beach, 5 year old males and 15 year old females are the most vulnerable to poverty, with 702 males (24.9%) and 834 females (29.2%) in their respective age groups living below the poverty level.
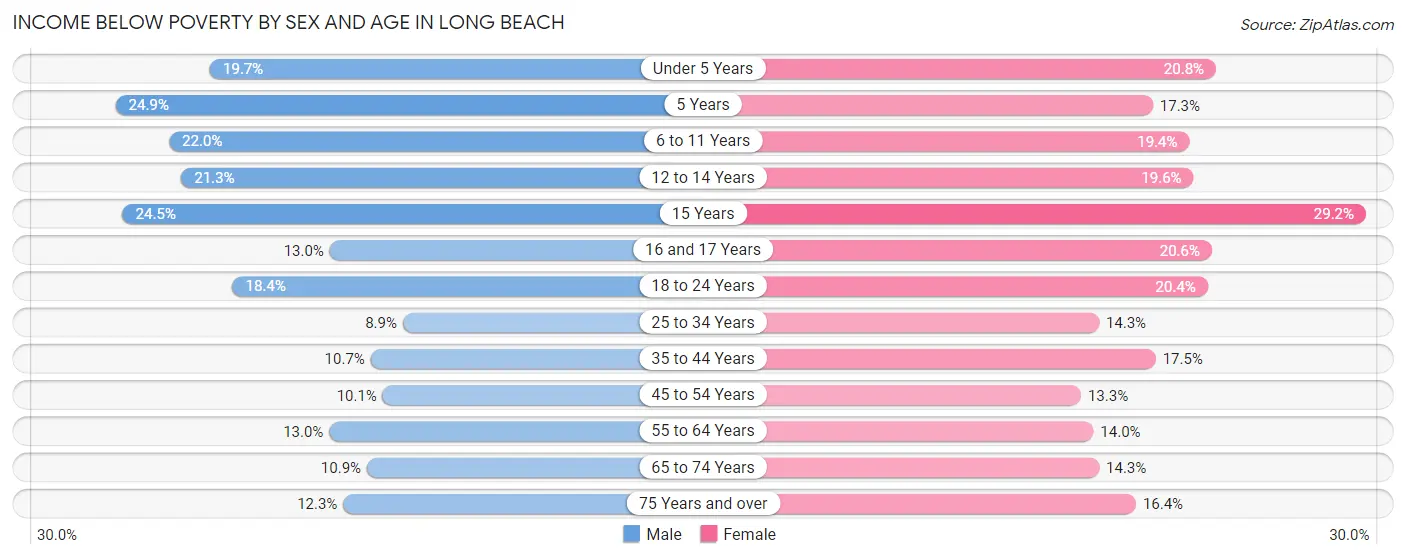
| Age Bracket | Male | Female |
| Under 5 Years | 2,407 (19.7%) | 2,553 (20.8%) |
| 5 Years | 702 (24.9%) | 418 (17.3%) |
| 6 to 11 Years | 3,466 (22.0%) | 2,814 (19.4%) |
| 12 to 14 Years | 2,129 (21.3%) | 1,457 (19.6%) |
| 15 Years | 717 (24.5%) | 834 (29.2%) |
| 16 and 17 Years | 725 (13.0%) | 1,111 (20.6%) |
| 18 to 24 Years | 3,992 (18.4%) | 4,609 (20.4%) |
| 25 to 34 Years | 3,514 (8.9%) | 5,781 (14.3%) |
| 35 to 44 Years | 3,521 (10.7%) | 5,568 (17.5%) |
| 45 to 54 Years | 3,007 (10.1%) | 4,006 (13.3%) |
| 55 to 64 Years | 3,677 (13.0%) | 3,935 (14.0%) |
| 65 to 74 Years | 1,768 (10.9%) | 2,770 (14.3%) |
| 75 Years and over | 986 (12.3%) | 2,005 (16.4%) |
| Total | 30,611 (13.6%) | 37,861 (16.5%) |
Income Above Poverty by Sex and Age in Long Beach
According to the poverty statistics in Long Beach, males aged 25 to 34 years and females aged 45 to 54 years are the age groups that are most secure financially, with 91.1% of males and 86.7% of females in these age groups living above the poverty line.
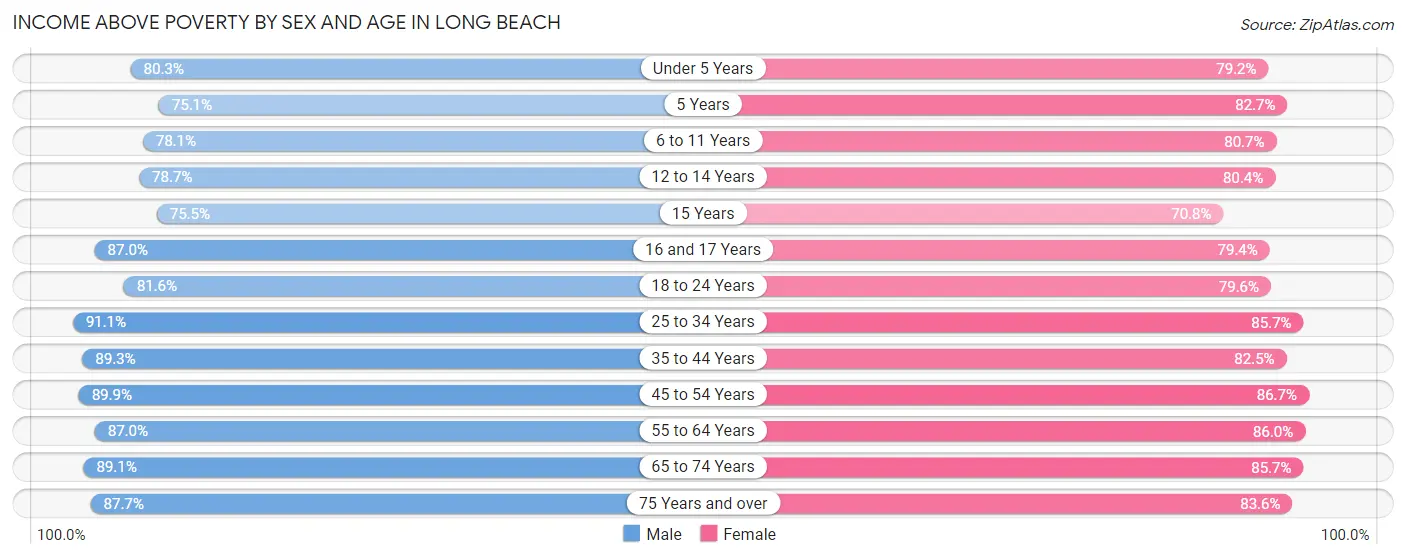
| Age Bracket | Male | Female |
| Under 5 Years | 9,826 (80.3%) | 9,706 (79.2%) |
| 5 Years | 2,114 (75.1%) | 1,996 (82.7%) |
| 6 to 11 Years | 12,328 (78.0%) | 11,725 (80.6%) |
| 12 to 14 Years | 7,879 (78.7%) | 5,983 (80.4%) |
| 15 Years | 2,205 (75.5%) | 2,024 (70.8%) |
| 16 and 17 Years | 4,847 (87.0%) | 4,282 (79.4%) |
| 18 to 24 Years | 17,684 (81.6%) | 18,017 (79.6%) |
| 25 to 34 Years | 35,773 (91.1%) | 34,588 (85.7%) |
| 35 to 44 Years | 29,281 (89.3%) | 26,284 (82.5%) |
| 45 to 54 Years | 26,892 (89.9%) | 26,063 (86.7%) |
| 55 to 64 Years | 24,519 (87.0%) | 24,146 (86.0%) |
| 65 to 74 Years | 14,388 (89.1%) | 16,557 (85.7%) |
| 75 Years and over | 7,054 (87.7%) | 10,238 (83.6%) |
| Total | 194,790 (86.4%) | 191,609 (83.5%) |
Income Below Poverty Among Married-Couple Families in Long Beach
The poverty statistics for married-couple families in Long Beach show that 5.9% or 3,722 of the total 62,732 families live below the poverty line. Families with 5 or more children have the highest poverty rate of 22.0%, comprising of 66 families. On the other hand, families with no children have the lowest poverty rate of 3.8%, which includes 1,368 families.
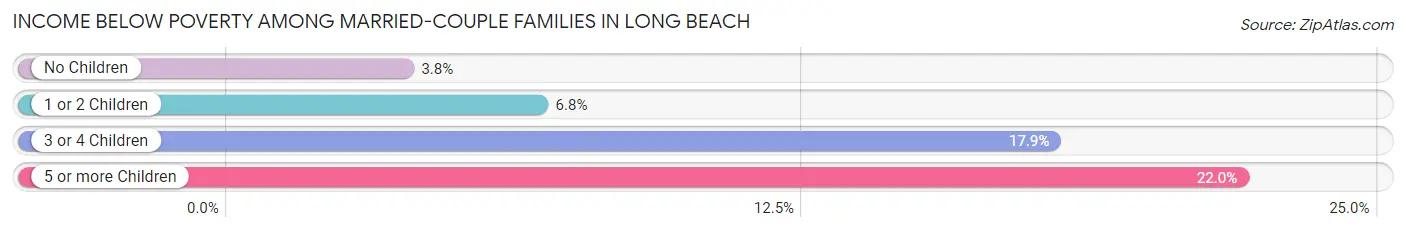
| Children | Above Poverty | Below Poverty |
| No Children | 34,290 (96.2%) | 1,368 (3.8%) |
| 1 or 2 Children | 20,970 (93.2%) | 1,521 (6.8%) |
| 3 or 4 Children | 3,516 (82.1%) | 767 (17.9%) |
| 5 or more Children | 234 (78.0%) | 66 (22.0%) |
| Total | 59,010 (94.1%) | 3,722 (5.9%) |
Income Below Poverty Among Single-Parent Households in Long Beach
According to the poverty data in Long Beach, 12.4% or 1,409 single-father households and 20.6% or 5,351 single-mother households are living below the poverty line. Among single-father households, those with 3 or 4 children have the highest poverty rate, with 228 households (30.2%) experiencing poverty. Likewise, among single-mother households, those with 5 or more children have the highest poverty rate, with 262 households (64.2%) falling below the poverty line.
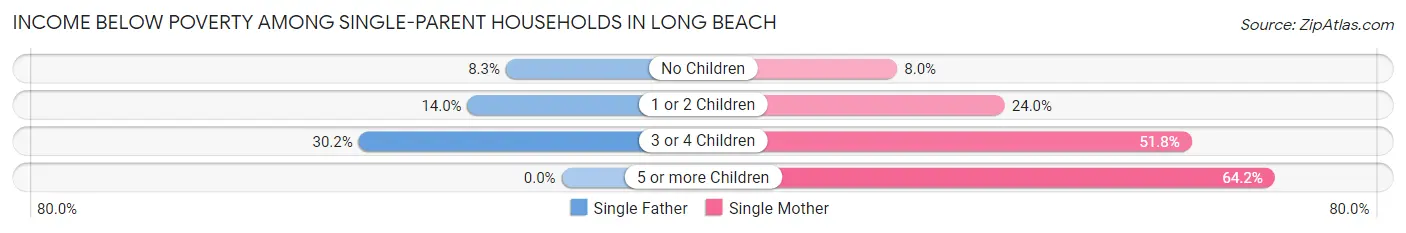
| Children | Single Father | Single Mother |
| No Children | 433 (8.3%) | 874 (8.0%) |
| 1 or 2 Children | 748 (14.0%) | 2,922 (24.0%) |
| 3 or 4 Children | 228 (30.2%) | 1,293 (51.8%) |
| 5 or more Children | 0 (0.0%) | 262 (64.2%) |
| Total | 1,409 (12.4%) | 5,351 (20.6%) |
Income Below Poverty Among Married-Couple vs Single-Parent Households in Long Beach
The poverty data for Long Beach shows that 3,722 of the married-couple family households (5.9%) and 6,760 of the single-parent households (18.1%) are living below the poverty level. Within the married-couple family households, those with 5 or more children have the highest poverty rate, with 66 households (22.0%) falling below the poverty line. Among the single-parent households, those with 5 or more children have the highest poverty rate, with 262 household (56.2%) living below poverty.
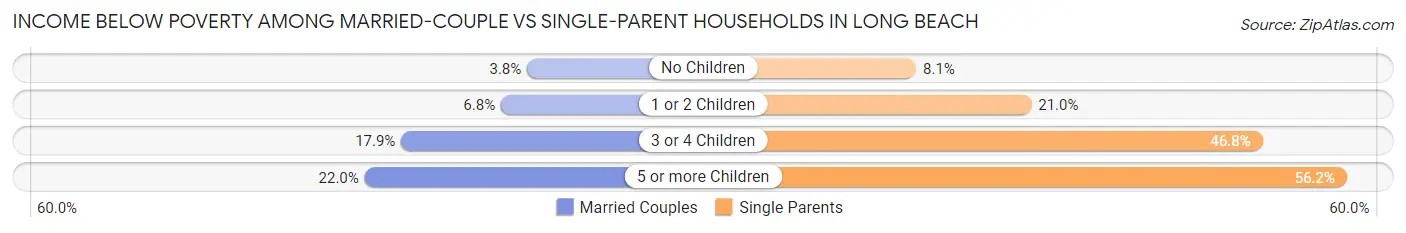
| Children | Married-Couple Families | Single-Parent Households |
| No Children | 1,368 (3.8%) | 1,307 (8.1%) |
| 1 or 2 Children | 1,521 (6.8%) | 3,670 (21.0%) |
| 3 or 4 Children | 767 (17.9%) | 1,521 (46.8%) |
| 5 or more Children | 66 (22.0%) | 262 (56.2%) |
| Total | 3,722 (5.9%) | 6,760 (18.1%) |
Race in Long Beach
The most populous races in Long Beach are Hispanic or Latino (203,754 | 44.1%), White / Caucasian (202,778 | 43.9%), and Some other Race (84,171 | 18.2%).
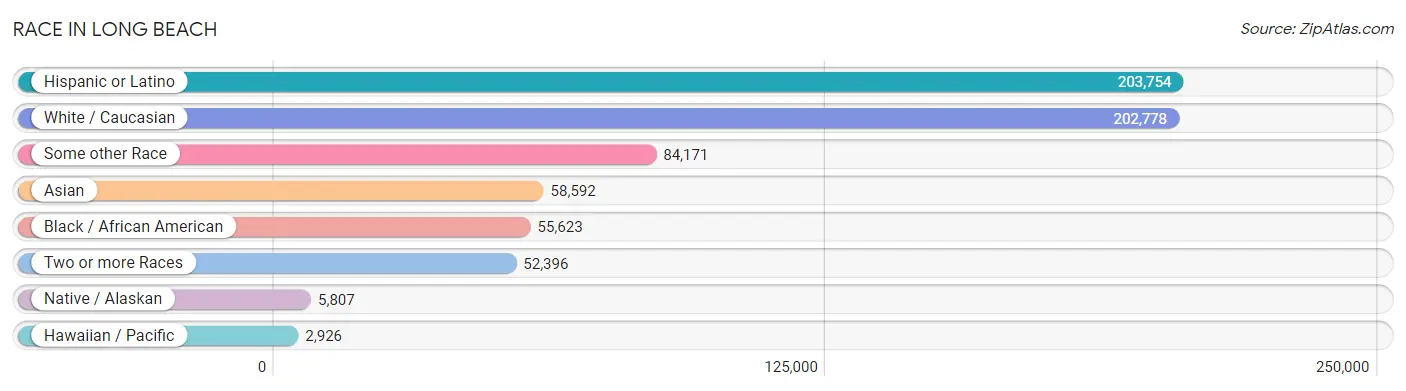
| Race | # Population | % Population |
| Asian | 58,592 | 12.7% |
| Black / African American | 55,623 | 12.0% |
| Hawaiian / Pacific | 2,926 | 0.6% |
| Hispanic or Latino | 203,754 | 44.1% |
| Native / Alaskan | 5,807 | 1.3% |
| White / Caucasian | 202,778 | 43.9% |
| Two or more Races | 52,396 | 11.3% |
| Some other Race | 84,171 | 18.2% |
| Total | 462,293 | 100.0% |
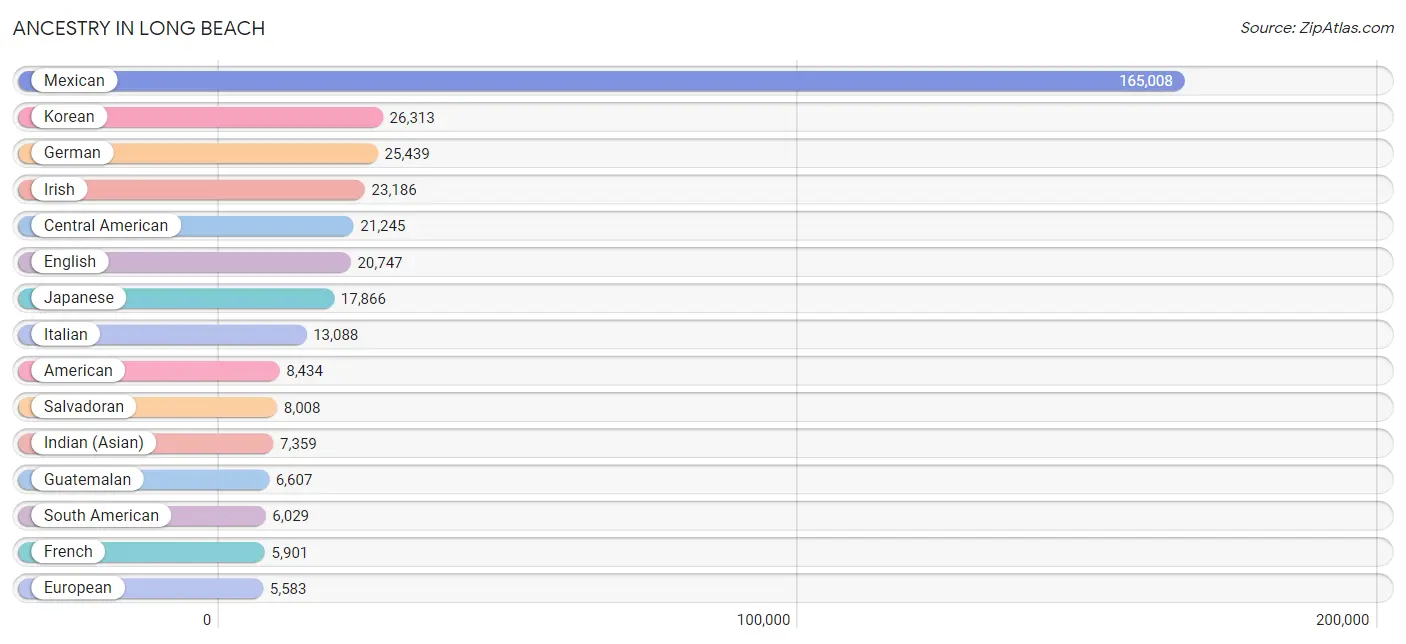
Ancestry in Long Beach
The most populous ancestries reported in Long Beach are Mexican (165,008 | 35.7%), Korean (26,313 | 5.7%), German (25,439 | 5.5%), Irish (23,186 | 5.0%), and Central American (21,245 | 4.6%), together accounting for 56.5% of all Long Beach residents.
| Ancestry | # Population | % Population |
| Afghan | 57 | 0.0% |
| African | 2,085 | 0.4% |
| Alaska Native | 21 | 0.0% |
| Albanian | 110 | 0.0% |
| Alsatian | 5 | 0.0% |
| American | 8,434 | 1.8% |
| Apache | 487 | 0.1% |
| Arab | 1,880 | 0.4% |
| Arapaho | 6 | 0.0% |
| Argentinean | 1,072 | 0.2% |
| Armenian | 1,018 | 0.2% |
| Assyrian / Chaldean / Syriac | 27 | 0.0% |
| Australian | 240 | 0.1% |
| Austrian | 799 | 0.2% |
| Bahamian | 27 | 0.0% |
| Bangladeshi | 203 | 0.0% |
| Barbadian | 15 | 0.0% |
| Basque | 190 | 0.0% |
| Belgian | 398 | 0.1% |
| Belizean | 796 | 0.2% |
| Bermudan | 11 | 0.0% |
| Bhutanese | 4,392 | 0.9% |
| Blackfeet | 370 | 0.1% |
| Bolivian | 193 | 0.0% |
| Brazilian | 1,059 | 0.2% |
| British | 2,341 | 0.5% |
| British West Indian | 74 | 0.0% |
| Bulgarian | 63 | 0.0% |
| Burmese | 3,803 | 0.8% |
| Cajun | 50 | 0.0% |
| Cambodian | 27 | 0.0% |
| Canadian | 971 | 0.2% |
| Cape Verdean | 46 | 0.0% |
| Celtic | 25 | 0.0% |
| Central American | 21,245 | 4.6% |
| Central American Indian | 1,174 | 0.3% |
| Cherokee | 790 | 0.2% |
| Cheyenne | 137 | 0.0% |
| Chickasaw | 203 | 0.0% |
| Chilean | 268 | 0.1% |
| Chippewa | 50 | 0.0% |
| Choctaw | 363 | 0.1% |
| Colombian | 1,747 | 0.4% |
| Comanche | 54 | 0.0% |
| Costa Rican | 424 | 0.1% |
| Cree | 39 | 0.0% |
| Creek | 148 | 0.0% |
| Croatian | 413 | 0.1% |
| Cuban | 1,340 | 0.3% |
| Cypriot | 30 | 0.0% |
| Czech | 1,016 | 0.2% |
| Czechoslovakian | 278 | 0.1% |
| Danish | 1,367 | 0.3% |
| Delaware | 7 | 0.0% |
| Dominican | 361 | 0.1% |
| Dutch | 2,670 | 0.6% |
| Dutch West Indian | 53 | 0.0% |
| Eastern European | 1,090 | 0.2% |
| Ecuadorian | 1,274 | 0.3% |
| Egyptian | 667 | 0.1% |
| English | 20,747 | 4.5% |
| Estonian | 44 | 0.0% |
| Ethiopian | 59 | 0.0% |
| European | 5,583 | 1.2% |
| Fijian | 17 | 0.0% |
| Filipino | 495 | 0.1% |
| Finnish | 612 | 0.1% |
| French | 5,901 | 1.3% |
| French American Indian | 33 | 0.0% |
| French Canadian | 1,111 | 0.2% |
| German | 25,439 | 5.5% |
| German Russian | 19 | 0.0% |
| Ghanaian | 28 | 0.0% |
| Greek | 1,790 | 0.4% |
| Guamanian / Chamorro | 582 | 0.1% |
| Guatemalan | 6,607 | 1.4% |
| Guyanese | 118 | 0.0% |
| Haitian | 153 | 0.0% |
| Honduran | 4,474 | 1.0% |
| Hopi | 10 | 0.0% |
| Hungarian | 944 | 0.2% |
| Icelander | 93 | 0.0% |
| Indian (Asian) | 7,359 | 1.6% |
| Indonesian | 78 | 0.0% |
| Inupiat | 9 | 0.0% |
| Iranian | 1,383 | 0.3% |
| Iraqi | 4 | 0.0% |
| Irish | 23,186 | 5.0% |
| Iroquois | 97 | 0.0% |
| Israeli | 310 | 0.1% |
| Italian | 13,088 | 2.8% |
| Jamaican | 1,250 | 0.3% |
| Japanese | 17,866 | 3.9% |
| Jordanian | 33 | 0.0% |
| Kenyan | 170 | 0.0% |
| Korean | 26,313 | 5.7% |
| Laotian | 331 | 0.1% |
| Latvian | 117 | 0.0% |
| Lebanese | 465 | 0.1% |
| Lithuanian | 447 | 0.1% |
| Luxembourger | 29 | 0.0% |
| Macedonian | 39 | 0.0% |
| Malaysian | 1,469 | 0.3% |
| Maltese | 8 | 0.0% |
| Mexican | 165,008 | 35.7% |
| Mexican American Indian | 2,947 | 0.6% |
| Mongolian | 27 | 0.0% |
| Moroccan | 6 | 0.0% |
| Native Hawaiian | 1,343 | 0.3% |
| Navajo | 166 | 0.0% |
| New Zealander | 45 | 0.0% |
| Nicaraguan | 1,312 | 0.3% |
| Nigerian | 557 | 0.1% |
| Northern European | 625 | 0.1% |
| Norwegian | 3,206 | 0.7% |
| Okinawan | 10 | 0.0% |
| Osage | 2 | 0.0% |
| Ottawa | 16 | 0.0% |
| Pakistani | 1,707 | 0.4% |
| Palestinian | 111 | 0.0% |
| Panamanian | 282 | 0.1% |
| Paraguayan | 2 | 0.0% |
| Pennsylvania German | 49 | 0.0% |
| Peruvian | 1,331 | 0.3% |
| Pima | 162 | 0.0% |
| Polish | 5,186 | 1.1% |
| Portuguese | 1,313 | 0.3% |
| Pueblo | 23 | 0.0% |
| Puerto Rican | 3,085 | 0.7% |
| Romanian | 194 | 0.0% |
| Russian | 2,984 | 0.6% |
| Salvadoran | 8,008 | 1.7% |
| Samoan | 1,658 | 0.4% |
| Scandinavian | 1,186 | 0.3% |
| Scotch-Irish | 1,834 | 0.4% |
| Scottish | 4,047 | 0.9% |
| Seminole | 7 | 0.0% |
| Serbian | 146 | 0.0% |
| Shoshone | 10 | 0.0% |
| Sioux | 181 | 0.0% |
| Slavic | 89 | 0.0% |
| Slovak | 313 | 0.1% |
| Slovene | 84 | 0.0% |
| South African | 133 | 0.0% |
| South American | 6,029 | 1.3% |
| South American Indian | 72 | 0.0% |
| Soviet Union | 13 | 0.0% |
| Spaniard | 1,662 | 0.4% |
| Spanish | 1,127 | 0.2% |
| Spanish American | 149 | 0.0% |
| Spanish American Indian | 17 | 0.0% |
| Sri Lankan | 3,880 | 0.8% |
| Subsaharan African | 3,547 | 0.8% |
| Sudanese | 286 | 0.1% |
| Swedish | 2,760 | 0.6% |
| Swiss | 633 | 0.1% |
| Syrian | 62 | 0.0% |
| Thai | 3,040 | 0.7% |
| Tlingit-Haida | 19 | 0.0% |
| Tohono O'Odham | 87 | 0.0% |
| Tongan | 374 | 0.1% |
| Trinidadian and Tobagonian | 213 | 0.1% |
| Turkish | 411 | 0.1% |
| Ukrainian | 809 | 0.2% |
| Uruguayan | 8 | 0.0% |
| Venezuelan | 102 | 0.0% |
| Vietnamese | 480 | 0.1% |
| Welsh | 1,662 | 0.4% |
| West Indian | 204 | 0.0% |
| Yakama | 18 | 0.0% |
| Yaqui | 127 | 0.0% |
| Yugoslavian | 176 | 0.0% |
| Yuman | 30 | 0.0% |
| Yup'ik | 27 | 0.0% |
| Zimbabwean | 19 | 0.0% | View All 175 Rows |
Immigrants in Long Beach
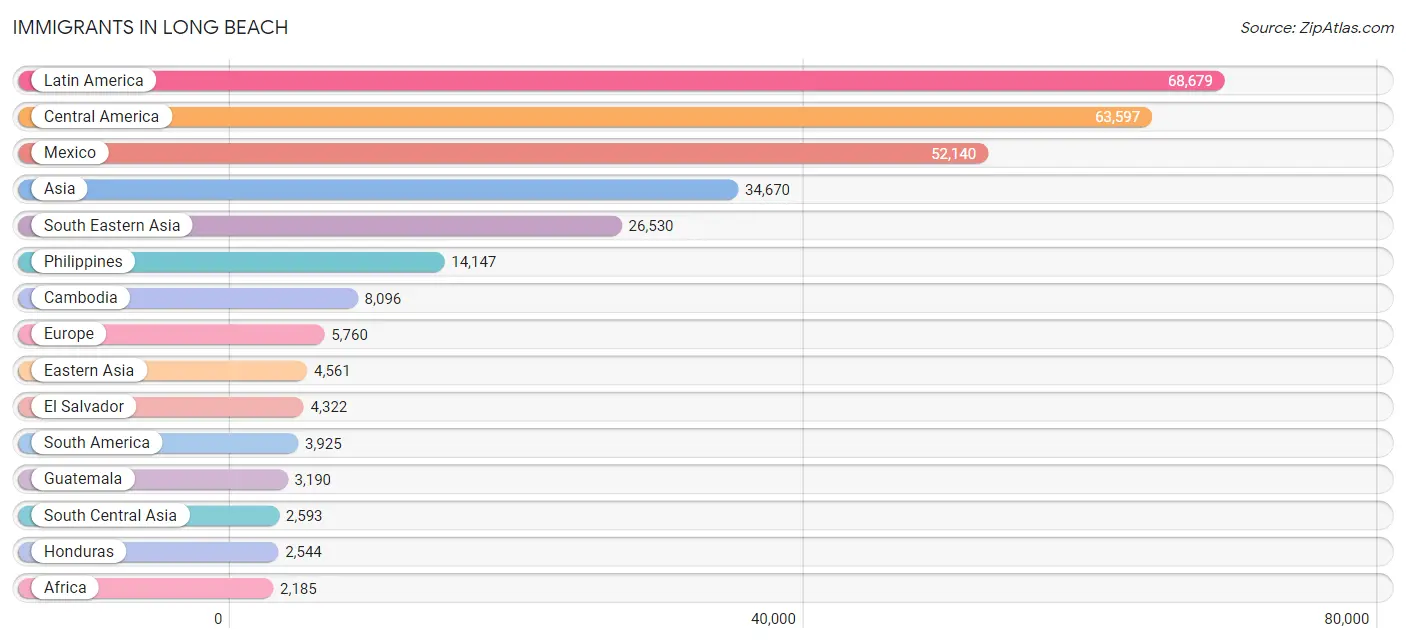
The most numerous immigrant groups reported in Long Beach came from Latin America (68,679 | 14.9%), Central America (63,597 | 13.8%), Mexico (52,140 | 11.3%), Asia (34,670 | 7.5%), and South Eastern Asia (26,530 | 5.7%), together accounting for 53.1% of all Long Beach residents.
| Immigration Origin | # Population | % Population |
| Afghanistan | 22 | 0.0% |
| Africa | 2,185 | 0.5% |
| Albania | 24 | 0.0% |
| Argentina | 642 | 0.1% |
| Armenia | 52 | 0.0% |
| Asia | 34,670 | 7.5% |
| Australia | 137 | 0.0% |
| Austria | 17 | 0.0% |
| Bahamas | 20 | 0.0% |
| Bangladesh | 322 | 0.1% |
| Barbados | 1 | 0.0% |
| Belarus | 21 | 0.0% |
| Belgium | 107 | 0.0% |
| Belize | 387 | 0.1% |
| Bolivia | 126 | 0.0% |
| Bosnia and Herzegovina | 134 | 0.0% |
| Brazil | 965 | 0.2% |
| Bulgaria | 14 | 0.0% |
| Cabo Verde | 9 | 0.0% |
| Cambodia | 8,096 | 1.8% |
| Cameroon | 27 | 0.0% |
| Canada | 1,271 | 0.3% |
| Caribbean | 1,157 | 0.3% |
| Central America | 63,597 | 13.8% |
| Chile | 215 | 0.1% |
| China | 1,941 | 0.4% |
| Colombia | 904 | 0.2% |
| Costa Rica | 197 | 0.0% |
| Croatia | 33 | 0.0% |
| Cuba | 375 | 0.1% |
| Czechoslovakia | 254 | 0.1% |
| Denmark | 71 | 0.0% |
| Dominica | 7 | 0.0% |
| Dominican Republic | 182 | 0.0% |
| Eastern Africa | 482 | 0.1% |
| Eastern Asia | 4,561 | 1.0% |
| Eastern Europe | 1,945 | 0.4% |
| Ecuador | 179 | 0.0% |
| Egypt | 461 | 0.1% |
| El Salvador | 4,322 | 0.9% |
| England | 656 | 0.1% |
| Eritrea | 15 | 0.0% |
| Ethiopia | 57 | 0.0% |
| Europe | 5,760 | 1.3% |
| Fiji | 116 | 0.0% |
| France | 338 | 0.1% |
| Germany | 733 | 0.2% |
| Ghana | 41 | 0.0% |
| Greece | 131 | 0.0% |
| Guatemala | 3,190 | 0.7% |
| Guyana | 18 | 0.0% |
| Haiti | 51 | 0.0% |
| Honduras | 2,544 | 0.5% |
| Hong Kong | 153 | 0.0% |
| Hungary | 63 | 0.0% |
| India | 1,248 | 0.3% |
| Indonesia | 354 | 0.1% |
| Iran | 691 | 0.2% |
| Iraq | 56 | 0.0% |
| Ireland | 127 | 0.0% |
| Israel | 138 | 0.0% |
| Italy | 150 | 0.0% |
| Jamaica | 211 | 0.1% |
| Japan | 907 | 0.2% |
| Jordan | 88 | 0.0% |
| Kazakhstan | 46 | 0.0% |
| Kenya | 177 | 0.0% |
| Korea | 1,686 | 0.4% |
| Kuwait | 20 | 0.0% |
| Laos | 77 | 0.0% |
| Latin America | 68,679 | 14.9% |
| Latvia | 40 | 0.0% |
| Lebanon | 136 | 0.0% |
| Liberia | 53 | 0.0% |
| Lithuania | 24 | 0.0% |
| Malaysia | 59 | 0.0% |
| Mexico | 52,140 | 11.3% |
| Micronesia | 15 | 0.0% |
| Middle Africa | 27 | 0.0% |
| Netherlands | 167 | 0.0% |
| Nicaragua | 649 | 0.1% |
| Nigeria | 524 | 0.1% |
| North Macedonia | 11 | 0.0% |
| Northern Africa | 754 | 0.2% |
| Northern Europe | 1,971 | 0.4% |
| Oceania | 1,149 | 0.3% |
| Pakistan | 210 | 0.1% |
| Panama | 109 | 0.0% |
| Peru | 778 | 0.2% |
| Philippines | 14,147 | 3.1% |
| Poland | 319 | 0.1% |
| Portugal | 17 | 0.0% |
| Romania | 68 | 0.0% |
| Russia | 491 | 0.1% |
| Saudi Arabia | 17 | 0.0% |
| Scotland | 113 | 0.0% |
| Serbia | 20 | 0.0% |
| Singapore | 50 | 0.0% |
| Somalia | 24 | 0.0% |
| South Africa | 192 | 0.0% |
| South America | 3,925 | 0.9% |
| South Central Asia | 2,593 | 0.6% |
| South Eastern Asia | 26,530 | 5.7% |
| Southern Europe | 471 | 0.1% |
| Spain | 173 | 0.0% |
| Sri Lanka | 48 | 0.0% |
| Sudan | 279 | 0.1% |
| Sweden | 71 | 0.0% |
| Syria | 73 | 0.0% |
| Taiwan | 442 | 0.1% |
| Thailand | 1,649 | 0.4% |
| Trinidad and Tobago | 238 | 0.1% |
| Turkey | 329 | 0.1% |
| Uganda | 12 | 0.0% |
| Ukraine | 341 | 0.1% |
| Uruguay | 8 | 0.0% |
| Uzbekistan | 6 | 0.0% |
| Venezuela | 88 | 0.0% |
| Vietnam | 1,991 | 0.4% |
| Western Africa | 673 | 0.2% |
| Western Asia | 940 | 0.2% |
| Western Europe | 1,373 | 0.3% |
| Zimbabwe | 34 | 0.0% | View All 123 Rows |
Sex and Age in Long Beach
Sex and Age in Long Beach
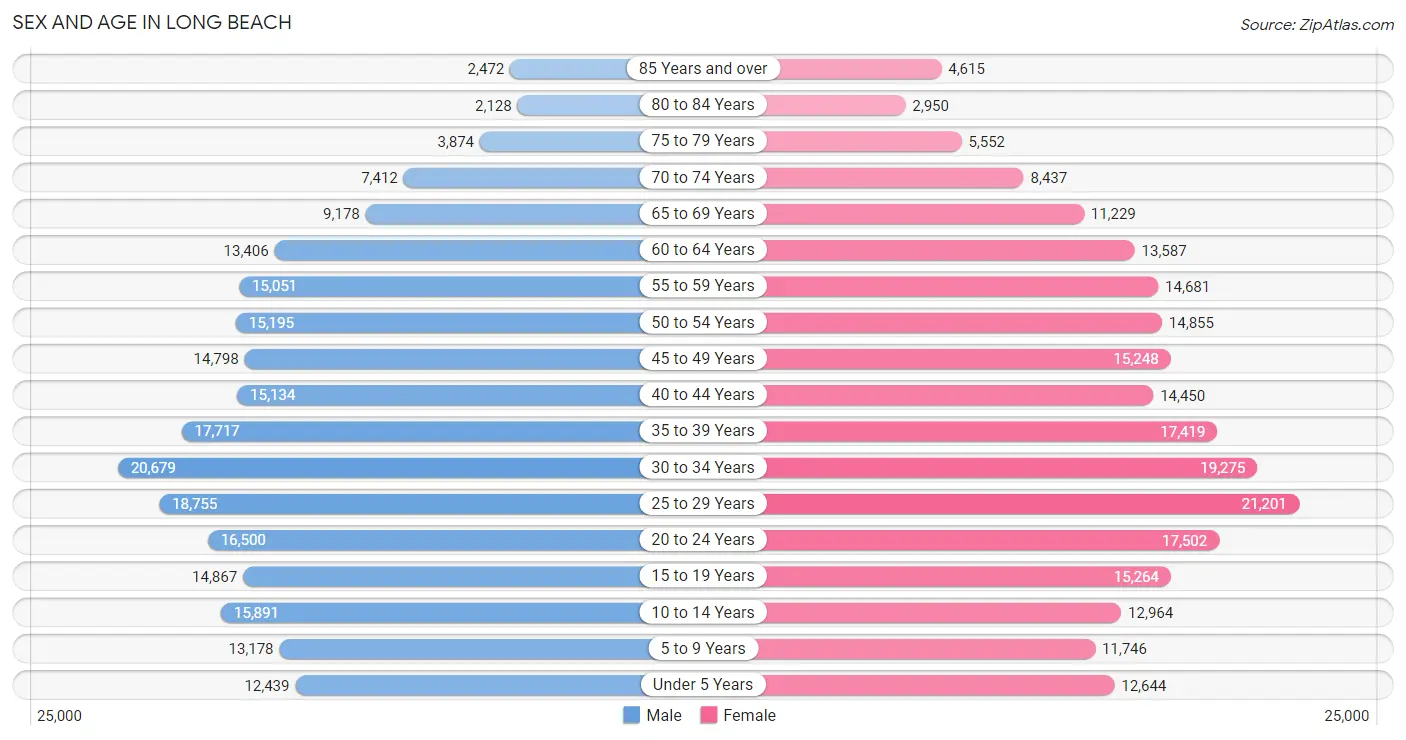
The most populous age groups in Long Beach are 30 to 34 Years (20,679 | 9.0%) for men and 25 to 29 Years (21,201 | 9.1%) for women.
| Age Bracket | Male | Female |
| Under 5 Years | 12,439 (5.4%) | 12,644 (5.4%) |
| 5 to 9 Years | 13,178 (5.8%) | 11,746 (5.0%) |
| 10 to 14 Years | 15,891 (7.0%) | 12,964 (5.6%) |
| 15 to 19 Years | 14,867 (6.5%) | 15,264 (6.5%) |
| 20 to 24 Years | 16,500 (7.2%) | 17,502 (7.5%) |
| 25 to 29 Years | 18,755 (8.2%) | 21,201 (9.1%) |
| 30 to 34 Years | 20,679 (9.0%) | 19,275 (8.3%) |
| 35 to 39 Years | 17,717 (7.7%) | 17,419 (7.5%) |
| 40 to 44 Years | 15,134 (6.6%) | 14,450 (6.2%) |
| 45 to 49 Years | 14,798 (6.5%) | 15,248 (6.5%) |
| 50 to 54 Years | 15,195 (6.6%) | 14,855 (6.4%) |
| 55 to 59 Years | 15,051 (6.6%) | 14,681 (6.3%) |
| 60 to 64 Years | 13,406 (5.9%) | 13,587 (5.8%) |
| 65 to 69 Years | 9,178 (4.0%) | 11,229 (4.8%) |
| 70 to 74 Years | 7,412 (3.2%) | 8,437 (3.6%) |
| 75 to 79 Years | 3,874 (1.7%) | 5,552 (2.4%) |
| 80 to 84 Years | 2,128 (0.9%) | 2,950 (1.3%) |
| 85 Years and over | 2,472 (1.1%) | 4,615 (2.0%) |
| Total | 228,674 (100.0%) | 233,619 (100.0%) |
Families and Households in Long Beach
Median Family Size in Long Beach
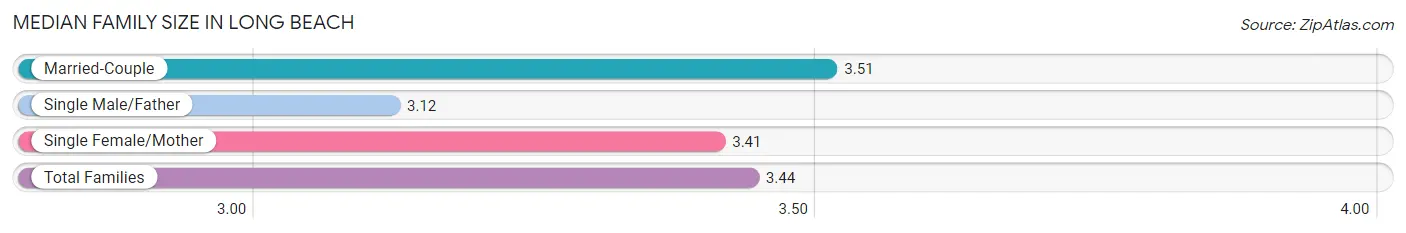
The median family size in Long Beach is 3.44 persons per family, with married-couple families (62,732 | 62.7%) accounting for the largest median family size of 3.51 persons per family. On the other hand, single male/father families (11,369 | 11.4%) represent the smallest median family size with 3.12 persons per family.
| Family Type | # Families | Family Size |
| Married-Couple | 62,732 (62.7%) | 3.51 |
| Single Male/Father | 11,369 (11.4%) | 3.12 |
| Single Female/Mother | 25,997 (26.0%) | 3.41 |
| Total Families | 100,098 (100.0%) | 3.44 |
Median Household Size in Long Beach
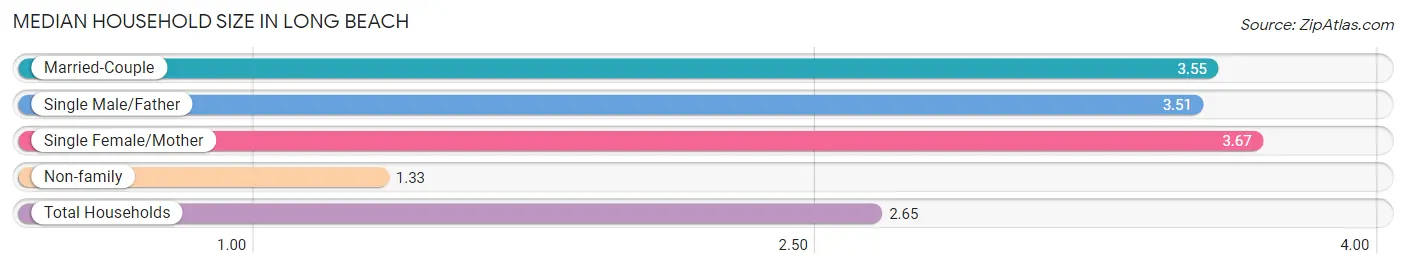
The median household size in Long Beach is 2.65 persons per household, with single female/mother households (25,997 | 15.3%) accounting for the largest median household size of 3.67 persons per household. non-family households (70,076 | 41.2%) represent the smallest median household size with 1.33 persons per household.
| Household Type | # Households | Household Size |
| Married-Couple | 62,732 (36.9%) | 3.55 |
| Single Male/Father | 11,369 (6.7%) | 3.51 |
| Single Female/Mother | 25,997 (15.3%) | 3.67 |
| Non-family | 70,076 (41.2%) | 1.33 |
| Total Households | 170,174 (100.0%) | 2.65 |
Household Size by Marriage Status in Long Beach
Out of a total of 170,174 households in Long Beach, 100,098 (58.8%) are family households, while 70,076 (41.2%) are nonfamily households. The most numerous type of family households are 2-person households, comprising 35,026, and the most common type of nonfamily households are 1-person households, comprising 53,073.
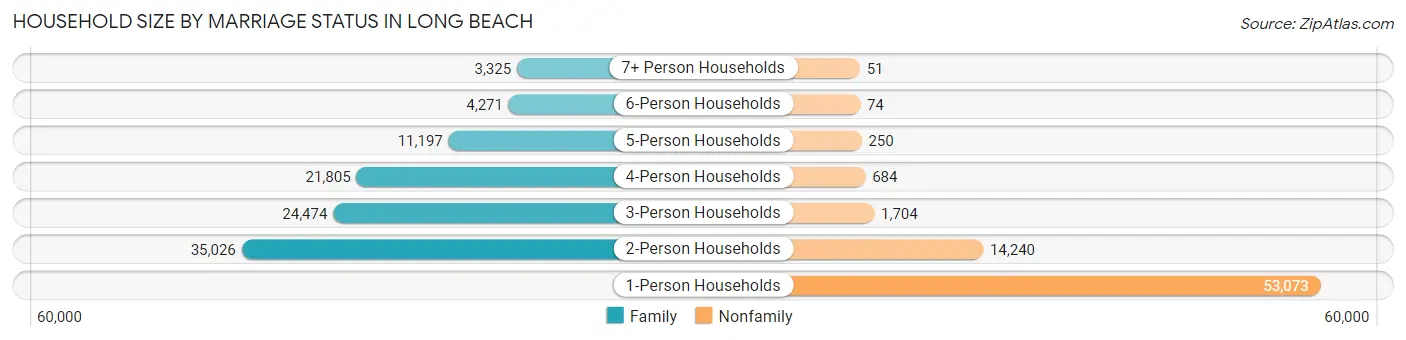
| Household Size | Family Households | Nonfamily Households |
| 1-Person Households | - | 53,073 (31.2%) |
| 2-Person Households | 35,026 (20.6%) | 14,240 (8.4%) |
| 3-Person Households | 24,474 (14.4%) | 1,704 (1.0%) |
| 4-Person Households | 21,805 (12.8%) | 684 (0.4%) |
| 5-Person Households | 11,197 (6.6%) | 250 (0.2%) |
| 6-Person Households | 4,271 (2.5%) | 74 (0.0%) |
| 7+ Person Households | 3,325 (1.9%) | 51 (0.0%) |
| Total | 100,098 (58.8%) | 70,076 (41.2%) |
Female Fertility in Long Beach
Fertility by Age in Long Beach
Average fertility rate in Long Beach is 45.0 births per 1,000 women. Women in the age bracket of 20 to 34 years have the highest fertility rate with 57.0 births per 1,000 women. Women in the age bracket of 20 to 34 years acount for 59.5% of all women with births.
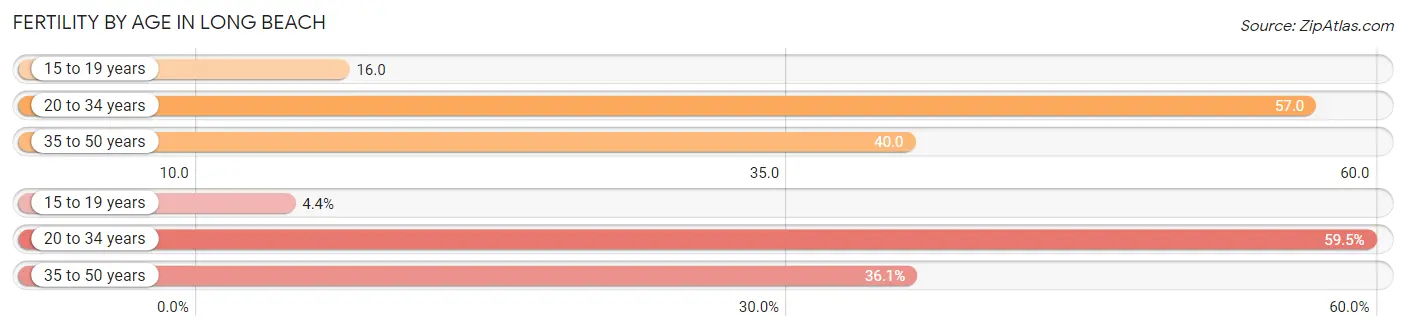
| Age Bracket | Women with Births | Births / 1,000 Women |
| 15 to 19 years | 246 (4.4%) | 16.0 |
| 20 to 34 years | 3,292 (59.5%) | 57.0 |
| 35 to 50 years | 1,998 (36.1%) | 40.0 |
| Total | 5,536 (100.0%) | 45.0 |
Fertility by Age by Marriage Status in Long Beach
51.9% of women with births (5,536) in Long Beach are married. The highest percentage of unmarried women with births falls into 15 to 19 years age bracket with 100.0% of them unmarried at the time of birth, while the lowest percentage of unmarried women with births belong to 35 to 50 years age bracket with 27.5% of them unmarried.
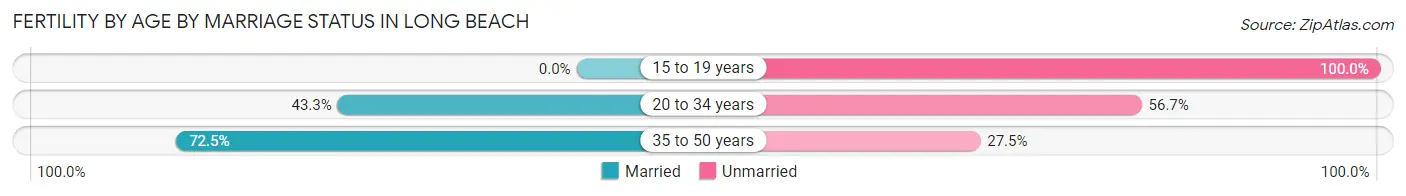
| Age Bracket | Married | Unmarried |
| 15 to 19 years | 0 (0.0%) | 246 (100.0%) |
| 20 to 34 years | 1,425 (43.3%) | 1,867 (56.7%) |
| 35 to 50 years | 1,449 (72.5%) | 549 (27.5%) |
| Total | 2,873 (51.9%) | 2,663 (48.1%) |
Fertility by Education in Long Beach
Average fertility rate in Long Beach is 45.0 births per 1,000 women. Women with the education attainment of high school diploma have the highest fertility rate of 64.0 births per 1,000 women, while women with the education attainment of less than high school have the lowest fertility at 32.0 births per 1,000 women. Women with the education attainment of college or associate's degree represent 29.3% of all women with births.
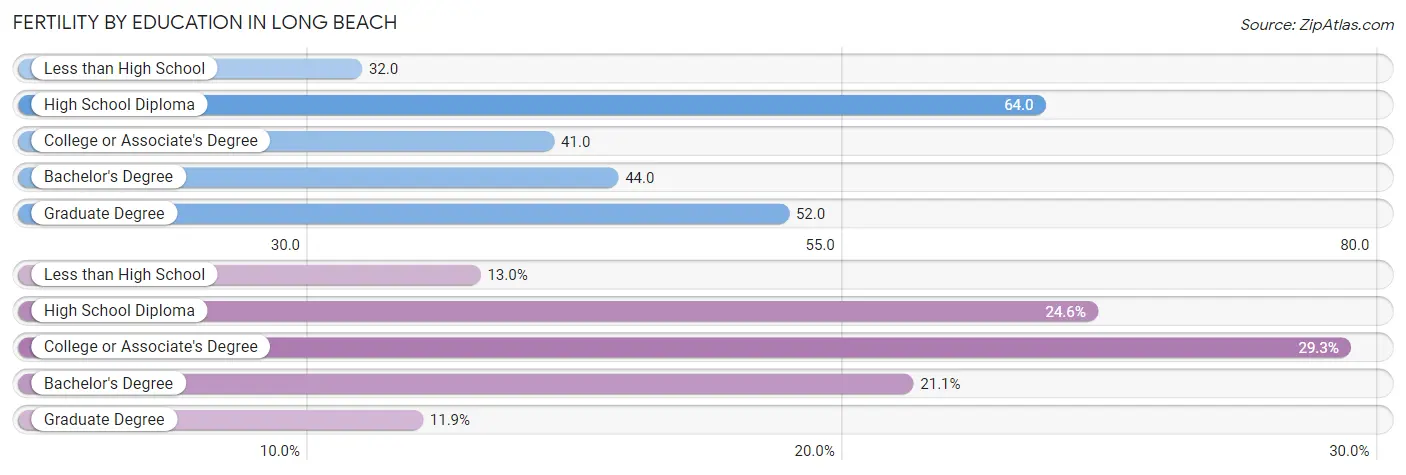
| Educational Attainment | Women with Births | Births / 1,000 Women |
| Less than High School | 721 (13.0%) | 32.0 |
| High School Diploma | 1,361 (24.6%) | 64.0 |
| College or Associate's Degree | 1,623 (29.3%) | 41.0 |
| Bachelor's Degree | 1,170 (21.1%) | 44.0 |
| Graduate Degree | 661 (11.9%) | 52.0 |
| Total | 5,536 (100.0%) | 45.0 |
Fertility by Education by Marriage Status in Long Beach
48.1% of women with births in Long Beach are unmarried. Women with the educational attainment of graduate degree are most likely to be married with 80.8% of them married at childbirth, while women with the educational attainment of high school diploma are least likely to be married with 70.7% of them unmarried at childbirth.
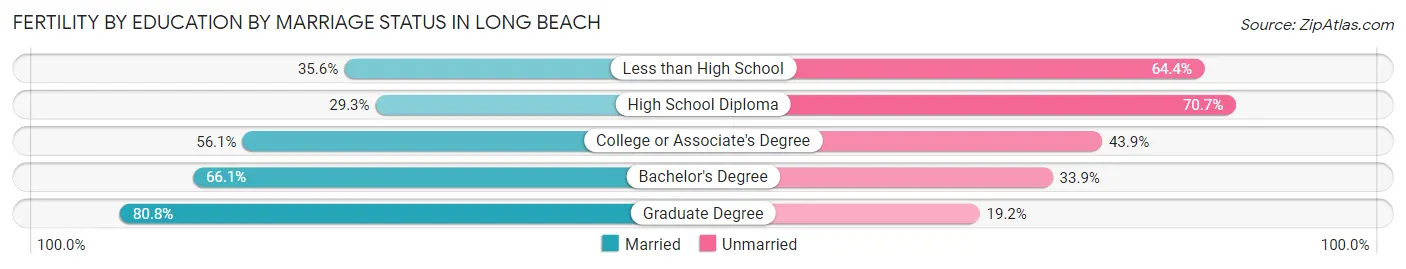
| Educational Attainment | Married | Unmarried |
| Less than High School | 257 (35.6%) | 464 (64.4%) |
| High School Diploma | 399 (29.3%) | 962 (70.7%) |
| College or Associate's Degree | 911 (56.1%) | 712 (43.9%) |
| Bachelor's Degree | 773 (66.1%) | 397 (33.9%) |
| Graduate Degree | 534 (80.8%) | 127 (19.2%) |
| Total | 2,873 (51.9%) | 2,663 (48.1%) |
Employment Characteristics in Long Beach
Employment by Class of Employer in Long Beach
Among the 228,215 employed individuals in Long Beach, private company employees (153,004 | 67.0%), local government employees (19,699 | 8.6%), and self-employed (not incorporated) (17,930 | 7.9%) make up the most common classes of employment.
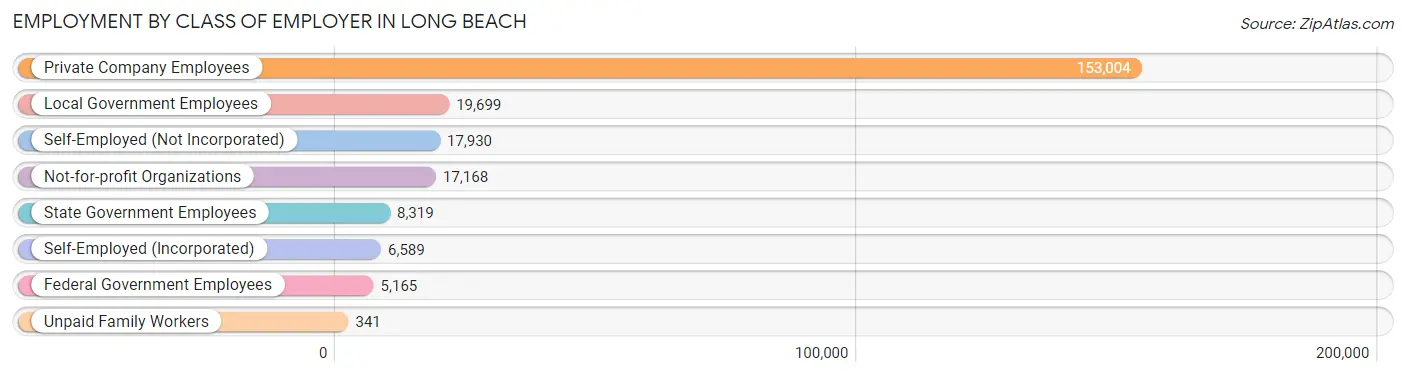
| Employer Class | # Employees | % Employees |
| Private Company Employees | 153,004 | 67.0% |
| Self-Employed (Incorporated) | 6,589 | 2.9% |
| Self-Employed (Not Incorporated) | 17,930 | 7.9% |
| Not-for-profit Organizations | 17,168 | 7.5% |
| Local Government Employees | 19,699 | 8.6% |
| State Government Employees | 8,319 | 3.6% |
| Federal Government Employees | 5,165 | 2.3% |
| Unpaid Family Workers | 341 | 0.2% |
| Total | 228,215 | 100.0% |
Employment Status by Age in Long Beach
According to the labor force statistics for Long Beach, out of the total population over 16 years of age (377,649), 66.6% or 251,514 individuals are in the labor force, with 6.6% or 16,600 of them unemployed. The age group with the highest labor force participation rate is 30 to 34 years, with 87.3% or 34,880 individuals in the labor force. Within the labor force, the 16 to 19 years age range has the highest percentage of unemployed individuals, with 20.6% or 1,324 of them being unemployed.
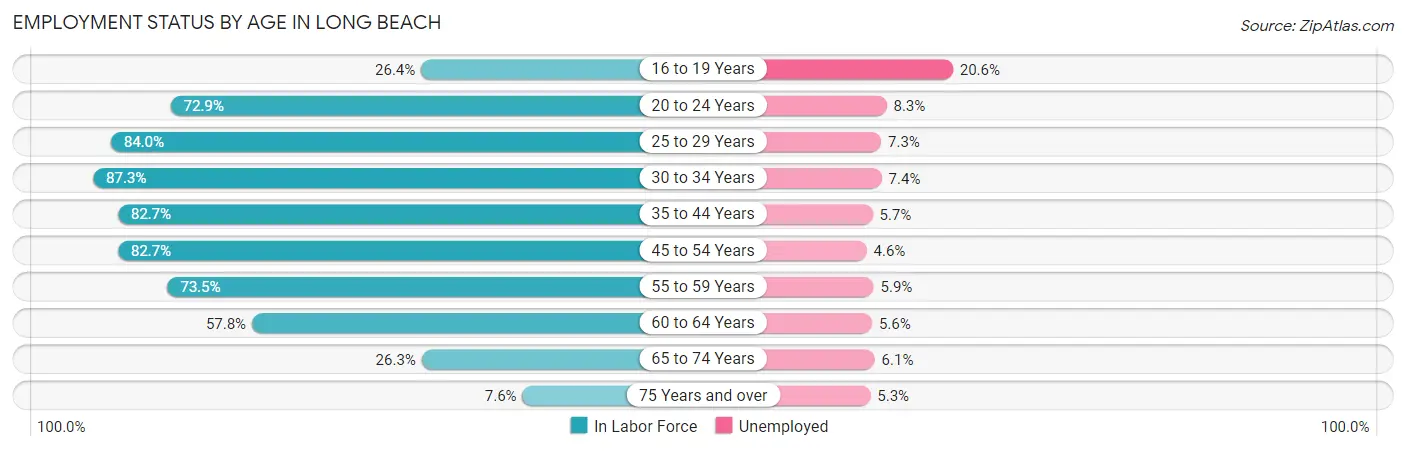
| Age Bracket | In Labor Force | Unemployed |
| 16 to 19 Years | 6,428 (26.4%) | 1,324 (20.6%) |
| 20 to 24 Years | 24,787 (72.9%) | 2,057 (8.3%) |
| 25 to 29 Years | 33,563 (84.0%) | 2,450 (7.3%) |
| 30 to 34 Years | 34,880 (87.3%) | 2,581 (7.4%) |
| 35 to 44 Years | 53,523 (82.7%) | 3,051 (5.7%) |
| 45 to 54 Years | 49,699 (82.7%) | 2,286 (4.6%) |
| 55 to 59 Years | 21,853 (73.5%) | 1,289 (5.9%) |
| 60 to 64 Years | 15,602 (57.8%) | 874 (5.6%) |
| 65 to 74 Years | 9,535 (26.3%) | 582 (6.1%) |
| 75 Years and over | 1,641 (7.6%) | 87 (5.3%) |
| Total | 251,514 (66.6%) | 16,600 (6.6%) |
Employment Status by Educational Attainment in Long Beach
According to labor force statistics for Long Beach, 80.0% of individuals (209,161) out of the total population between 25 and 64 years of age (261,451) are in the labor force, with 6.0% or 12,550 of them being unemployed. The group with the highest labor force participation rate are those with the educational attainment of bachelor's degree or higher, with 89.7% or 79,847 individuals in the labor force. Within the labor force, individuals with high school diploma education have the highest percentage of unemployment, with 7.3% or 2,548 of them being unemployed.
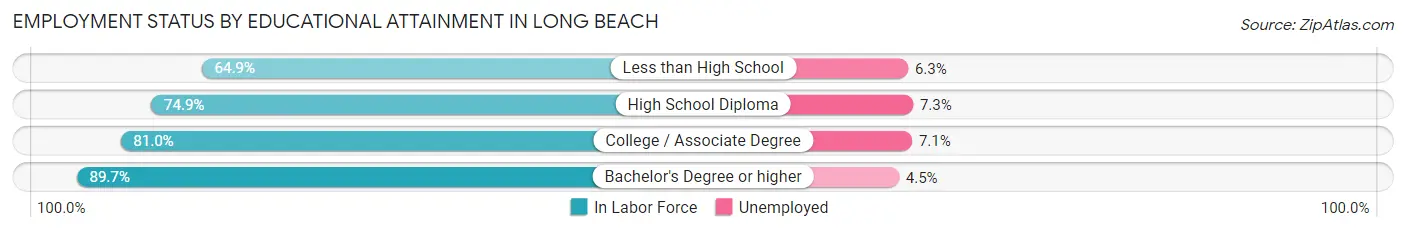
| Educational Attainment | In Labor Force | Unemployed |
| Less than High School | 30,364 (64.9%) | 2,948 (6.3%) |
| High School Diploma | 34,908 (74.9%) | 3,402 (7.3%) |
| College / Associate Degree | 64,025 (81.0%) | 5,612 (7.1%) |
| Bachelor's Degree or higher | 79,847 (89.7%) | 4,006 (4.5%) |
| Total | 209,161 (80.0%) | 15,687 (6.0%) |
Employment Occupations by Sex in Long Beach
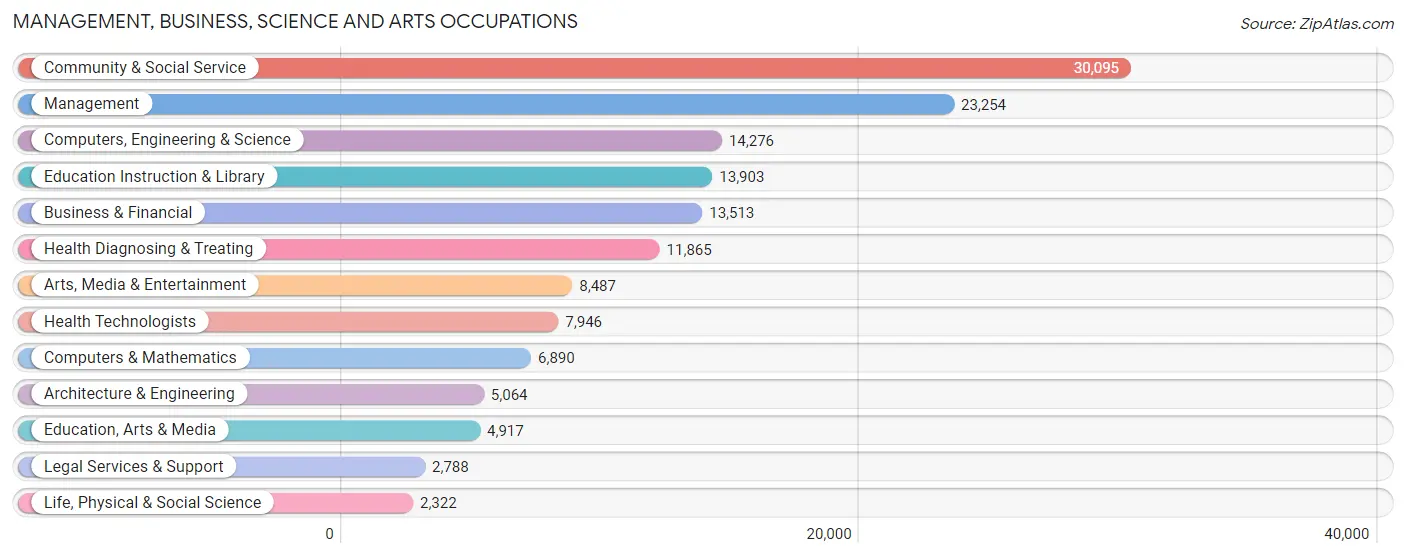
Management, Business, Science and Arts Occupations
The most common Management, Business, Science and Arts occupations in Long Beach are Community & Social Service (30,095 | 12.8%), Management (23,254 | 9.9%), Computers, Engineering & Science (14,276 | 6.1%), Education Instruction & Library (13,903 | 5.9%), and Business & Financial (13,513 | 5.8%).
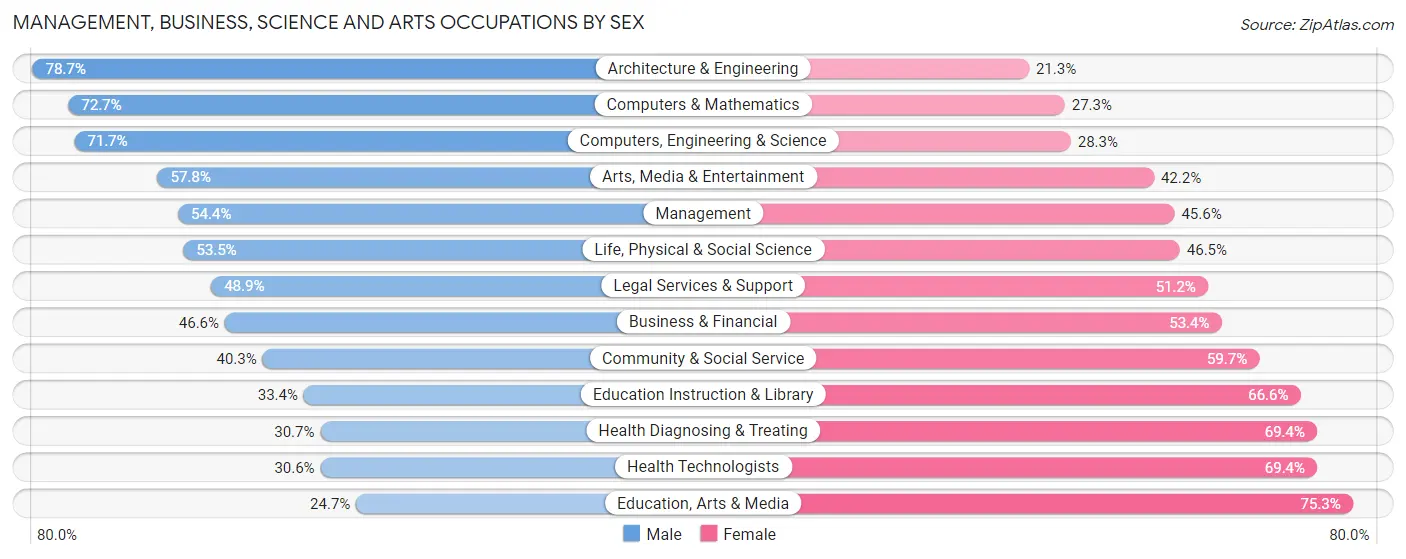
Management, Business, Science and Arts Occupations by Sex
Within the Management, Business, Science and Arts occupations in Long Beach, the most male-oriented occupations are Architecture & Engineering (78.7%), Computers & Mathematics (72.7%), and Computers, Engineering & Science (71.7%), while the most female-oriented occupations are Education, Arts & Media (75.3%), Health Technologists (69.4%), and Health Diagnosing & Treating (69.4%).
| Occupation | Male | Female |
| Management | 12,648 (54.4%) | 10,606 (45.6%) |
| Business & Financial | 6,295 (46.6%) | 7,218 (53.4%) |
| Computers, Engineering & Science | 10,234 (71.7%) | 4,042 (28.3%) |
| Computers & Mathematics | 5,008 (72.7%) | 1,882 (27.3%) |
| Architecture & Engineering | 3,984 (78.7%) | 1,080 (21.3%) |
| Life, Physical & Social Science | 1,242 (53.5%) | 1,080 (46.5%) |
| Community & Social Service | 12,125 (40.3%) | 17,970 (59.7%) |
| Education, Arts & Media | 1,213 (24.7%) | 3,704 (75.3%) |
| Legal Services & Support | 1,362 (48.8%) | 1,426 (51.1%) |
| Education Instruction & Library | 4,644 (33.4%) | 9,259 (66.6%) |
| Arts, Media & Entertainment | 4,906 (57.8%) | 3,581 (42.2%) |
| Health Diagnosing & Treating | 3,637 (30.6%) | 8,228 (69.4%) |
| Health Technologists | 2,434 (30.6%) | 5,512 (69.4%) |
| Total (Category) | 44,939 (48.3%) | 48,064 (51.7%) |
| Total (Overall) | 122,757 (52.3%) | 111,810 (47.7%) |
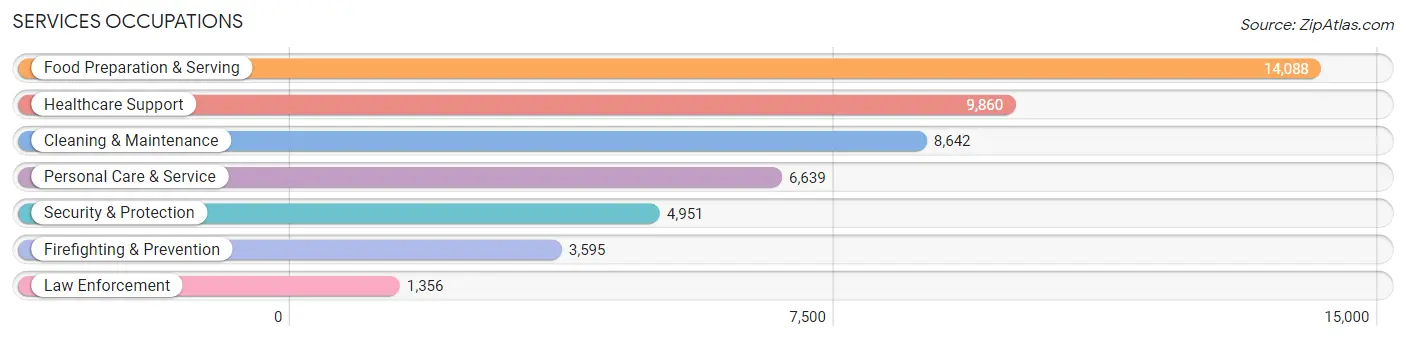
Services Occupations
The most common Services occupations in Long Beach are Food Preparation & Serving (14,088 | 6.0%), Healthcare Support (9,860 | 4.2%), Cleaning & Maintenance (8,642 | 3.7%), Personal Care & Service (6,639 | 2.8%), and Security & Protection (4,951 | 2.1%).
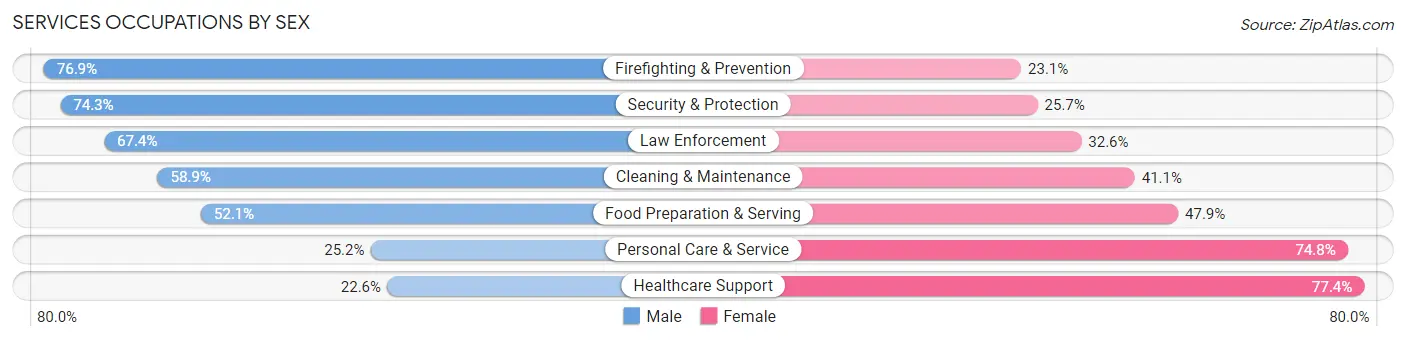
Services Occupations by Sex
Within the Services occupations in Long Beach, the most male-oriented occupations are Firefighting & Prevention (76.9%), Security & Protection (74.3%), and Law Enforcement (67.4%), while the most female-oriented occupations are Healthcare Support (77.4%), Personal Care & Service (74.8%), and Food Preparation & Serving (47.9%).
| Occupation | Male | Female |
| Healthcare Support | 2,229 (22.6%) | 7,631 (77.4%) |
| Security & Protection | 3,680 (74.3%) | 1,271 (25.7%) |
| Firefighting & Prevention | 2,766 (76.9%) | 829 (23.1%) |
| Law Enforcement | 914 (67.4%) | 442 (32.6%) |
| Food Preparation & Serving | 7,336 (52.1%) | 6,752 (47.9%) |
| Cleaning & Maintenance | 5,093 (58.9%) | 3,549 (41.1%) |
| Personal Care & Service | 1,675 (25.2%) | 4,964 (74.8%) |
| Total (Category) | 20,013 (45.3%) | 24,167 (54.7%) |
| Total (Overall) | 122,757 (52.3%) | 111,810 (47.7%) |
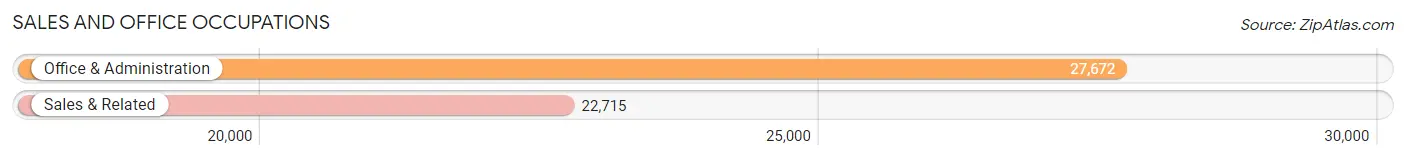
Sales and Office Occupations
The most common Sales and Office occupations in Long Beach are Office & Administration (27,672 | 11.8%), and Sales & Related (22,715 | 9.7%).
Sales and Office Occupations by Sex
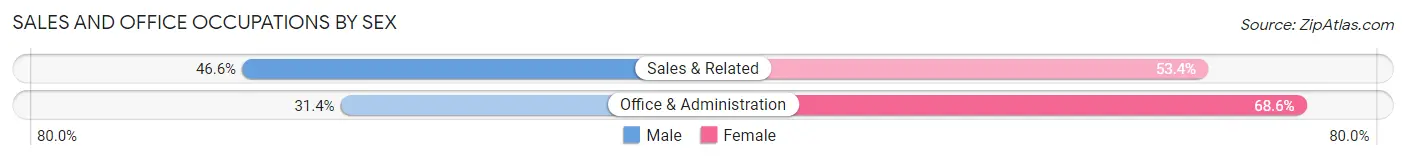
| Occupation | Male | Female |
| Sales & Related | 10,577 (46.6%) | 12,138 (53.4%) |
| Office & Administration | 8,692 (31.4%) | 18,980 (68.6%) |
| Total (Category) | 19,269 (38.2%) | 31,118 (61.8%) |
| Total (Overall) | 122,757 (52.3%) | 111,810 (47.7%) |
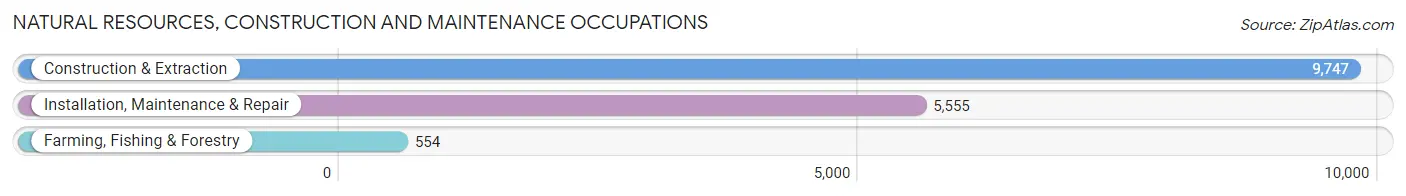
Natural Resources, Construction and Maintenance Occupations
The most common Natural Resources, Construction and Maintenance occupations in Long Beach are Construction & Extraction (9,747 | 4.2%), Installation, Maintenance & Repair (5,555 | 2.4%), and Farming, Fishing & Forestry (554 | 0.2%).
Natural Resources, Construction and Maintenance Occupations by Sex
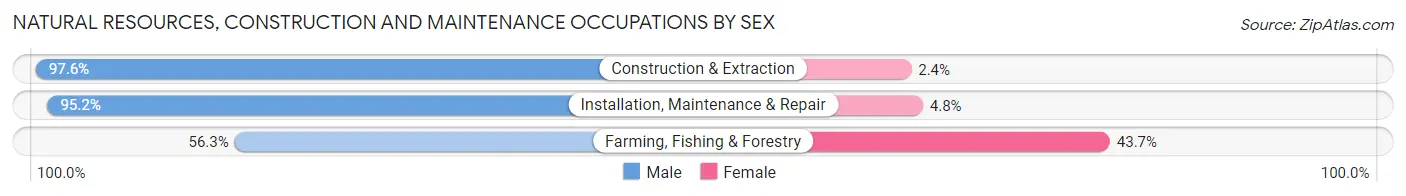
| Occupation | Male | Female |
| Farming, Fishing & Forestry | 312 (56.3%) | 242 (43.7%) |
| Construction & Extraction | 9,517 (97.6%) | 230 (2.4%) |
| Installation, Maintenance & Repair | 5,290 (95.2%) | 265 (4.8%) |
| Total (Category) | 15,119 (95.4%) | 737 (4.6%) |
| Total (Overall) | 122,757 (52.3%) | 111,810 (47.7%) |
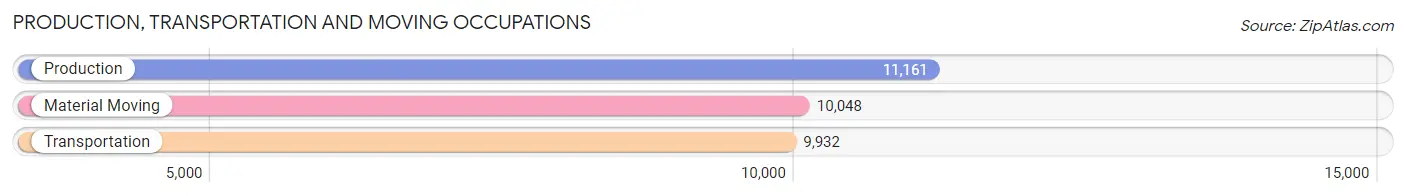
Production, Transportation and Moving Occupations
The most common Production, Transportation and Moving occupations in Long Beach are Production (11,161 | 4.8%), Material Moving (10,048 | 4.3%), and Transportation (9,932 | 4.2%).
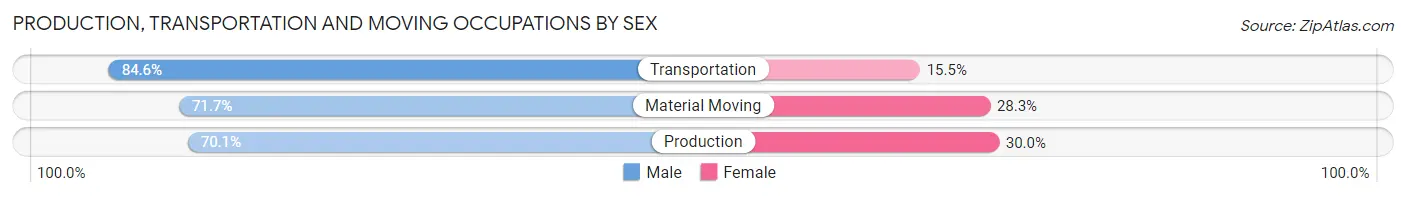
Production, Transportation and Moving Occupations by Sex
| Occupation | Male | Female |
| Production | 7,818 (70.1%) | 3,343 (29.9%) |
| Transportation | 8,398 (84.6%) | 1,534 (15.4%) |
| Material Moving | 7,201 (71.7%) | 2,847 (28.3%) |
| Total (Category) | 23,417 (75.2%) | 7,724 (24.8%) |
| Total (Overall) | 122,757 (52.3%) | 111,810 (47.7%) |
Employment Industries by Sex in Long Beach
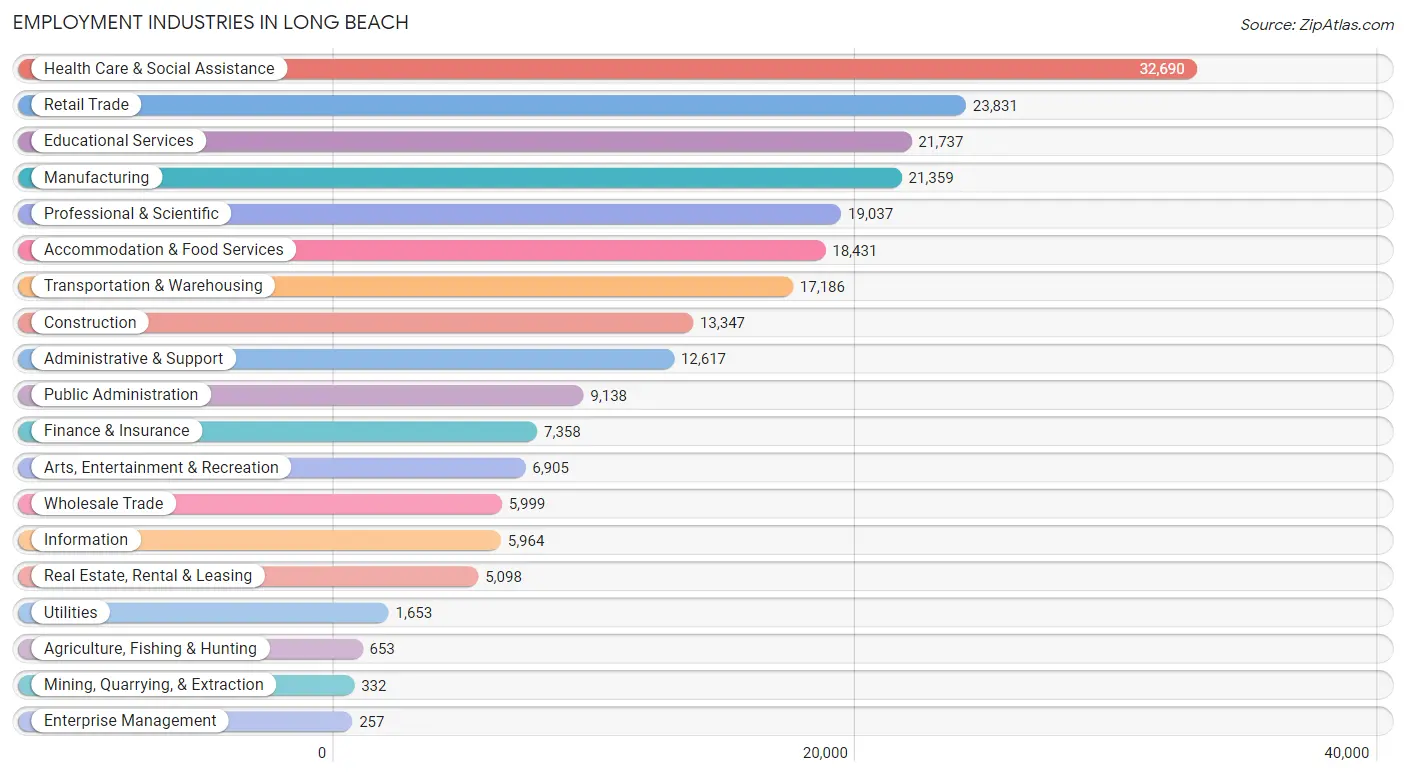
Employment Industries in Long Beach
The major employment industries in Long Beach include Health Care & Social Assistance (32,690 | 13.9%), Retail Trade (23,831 | 10.2%), Educational Services (21,737 | 9.3%), Manufacturing (21,359 | 9.1%), and Professional & Scientific (19,037 | 8.1%).
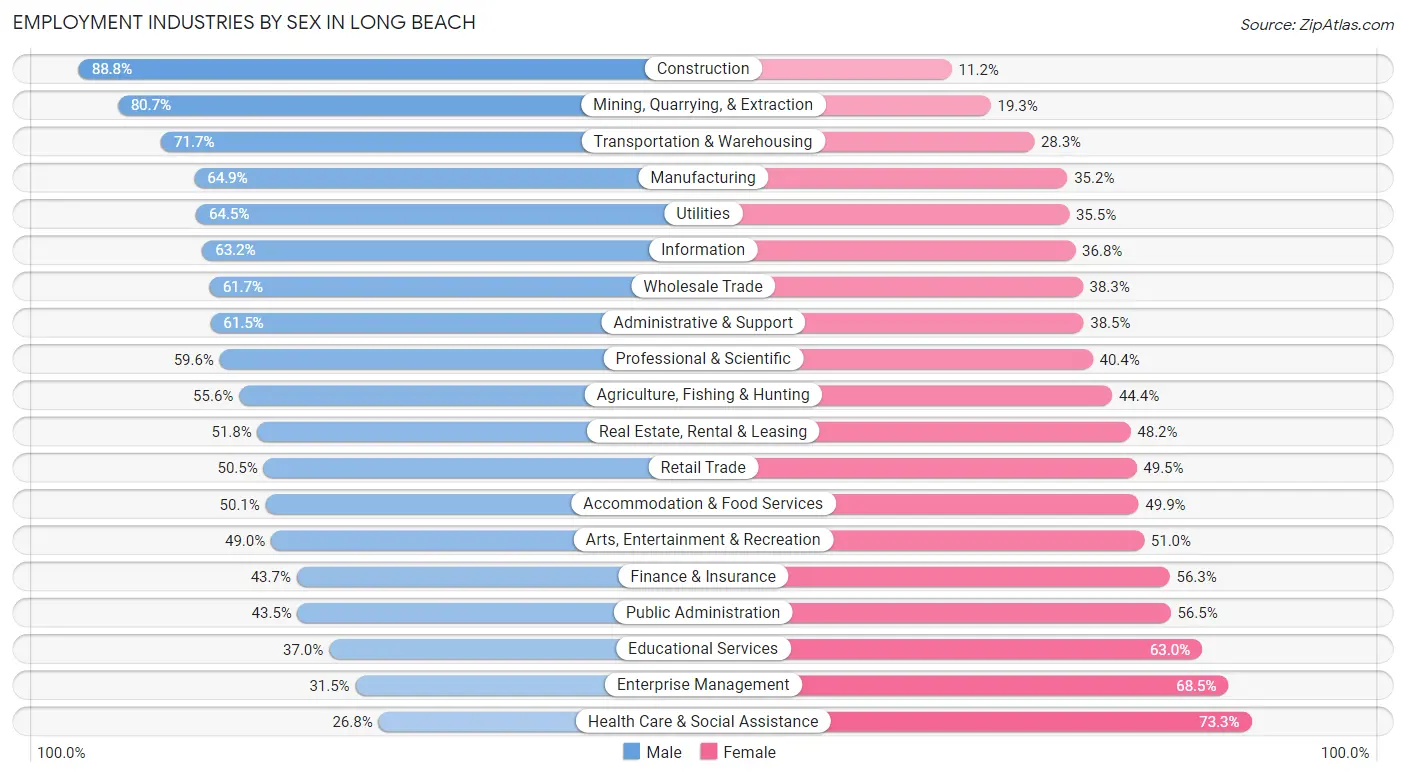
Employment Industries by Sex in Long Beach
The Long Beach industries that see more men than women are Construction (88.8%), Mining, Quarrying, & Extraction (80.7%), and Transportation & Warehousing (71.7%), whereas the industries that tend to have a higher number of women are Health Care & Social Assistance (73.3%), Enterprise Management (68.5%), and Educational Services (63.0%).
| Industry | Male | Female |
| Agriculture, Fishing & Hunting | 363 (55.6%) | 290 (44.4%) |
| Mining, Quarrying, & Extraction | 268 (80.7%) | 64 (19.3%) |
| Construction | 11,848 (88.8%) | 1,499 (11.2%) |
| Manufacturing | 13,851 (64.8%) | 7,508 (35.1%) |
| Wholesale Trade | 3,700 (61.7%) | 2,299 (38.3%) |
| Retail Trade | 12,045 (50.5%) | 11,786 (49.5%) |
| Transportation & Warehousing | 12,329 (71.7%) | 4,857 (28.3%) |
| Utilities | 1,066 (64.5%) | 587 (35.5%) |
| Information | 3,770 (63.2%) | 2,194 (36.8%) |
| Finance & Insurance | 3,213 (43.7%) | 4,145 (56.3%) |
| Real Estate, Rental & Leasing | 2,640 (51.8%) | 2,458 (48.2%) |
| Professional & Scientific | 11,350 (59.6%) | 7,687 (40.4%) |
| Enterprise Management | 81 (31.5%) | 176 (68.5%) |
| Administrative & Support | 7,763 (61.5%) | 4,854 (38.5%) |
| Educational Services | 8,036 (37.0%) | 13,701 (63.0%) |
| Health Care & Social Assistance | 8,745 (26.8%) | 23,945 (73.3%) |
| Arts, Entertainment & Recreation | 3,383 (49.0%) | 3,522 (51.0%) |
| Accommodation & Food Services | 9,237 (50.1%) | 9,194 (49.9%) |
| Public Administration | 3,973 (43.5%) | 5,165 (56.5%) |
| Total | 122,757 (52.3%) | 111,810 (47.7%) |
Education in Long Beach
School Enrollment in Long Beach
The most common levels of schooling among the 117,254 students in Long Beach are college / undergraduate (34,059 | 29.0%), high school (23,227 | 19.8%), and middle school (21,655 | 18.5%).
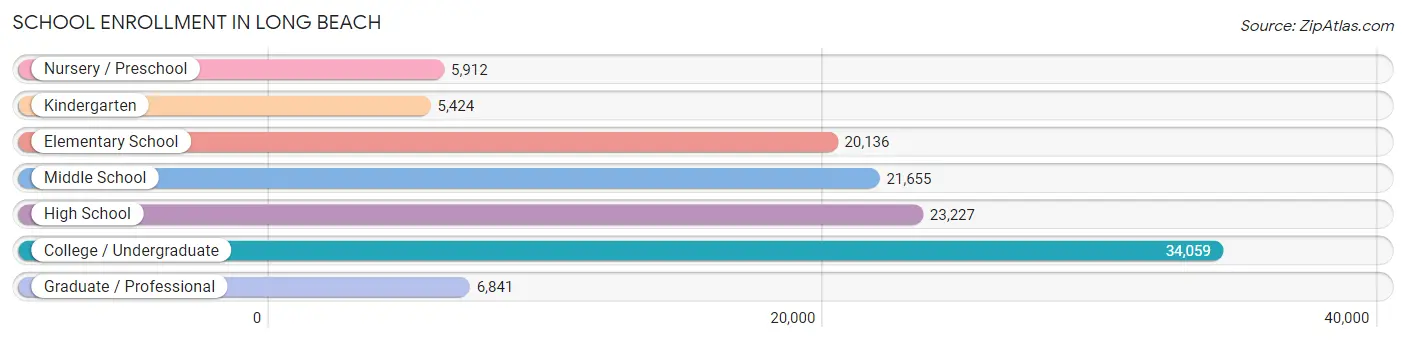
| School Level | # Students | % Students |
| Nursery / Preschool | 5,912 | 5.0% |
| Kindergarten | 5,424 | 4.6% |
| Elementary School | 20,136 | 17.2% |
| Middle School | 21,655 | 18.5% |
| High School | 23,227 | 19.8% |
| College / Undergraduate | 34,059 | 29.0% |
| Graduate / Professional | 6,841 | 5.8% |
| Total | 117,254 | 100.0% |
School Enrollment by Age by Funding Source in Long Beach
Out of a total of 117,254 students who are enrolled in schools in Long Beach, 11,843 (10.1%) attend a private institution, while the remaining 105,411 (89.9%) are enrolled in public schools. The age group of 3 to 4 year olds has the highest likelihood of being enrolled in private schools, with 1,519 (32.3% in the age bracket) enrolled. Conversely, the age group of 15 to 17 year olds has the lowest likelihood of being enrolled in a private school, with 15,592 (95.4% in the age bracket) attending a public institution.
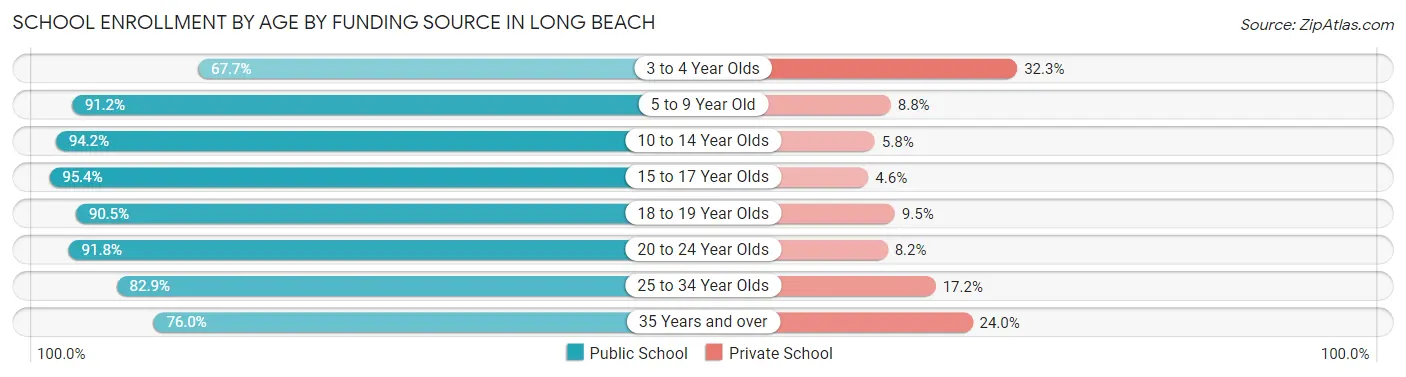
| Age Bracket | Public School | Private School |
| 3 to 4 Year Olds | 3,179 (67.7%) | 1,519 (32.3%) |
| 5 to 9 Year Old | 21,824 (91.2%) | 2,102 (8.8%) |
| 10 to 14 Year Olds | 26,597 (94.2%) | 1,644 (5.8%) |
| 15 to 17 Year Olds | 15,592 (95.4%) | 754 (4.6%) |
| 18 to 19 Year Olds | 9,092 (90.5%) | 959 (9.5%) |
| 20 to 24 Year Olds | 14,107 (91.8%) | 1,262 (8.2%) |
| 25 to 34 Year Olds | 9,877 (82.9%) | 2,045 (17.2%) |
| 35 Years and over | 5,092 (76.0%) | 1,609 (24.0%) |
| Total | 105,411 (89.9%) | 11,843 (10.1%) |
Educational Attainment by Field of Study in Long Beach
Business (18,952 | 16.6%), social sciences (12,149 | 10.6%), science & technology (10,491 | 9.2%), visual & performing arts (8,527 | 7.4%), and education (8,293 | 7.2%) are the most common fields of study among 114,532 individuals in Long Beach who have obtained a bachelor's degree or higher.
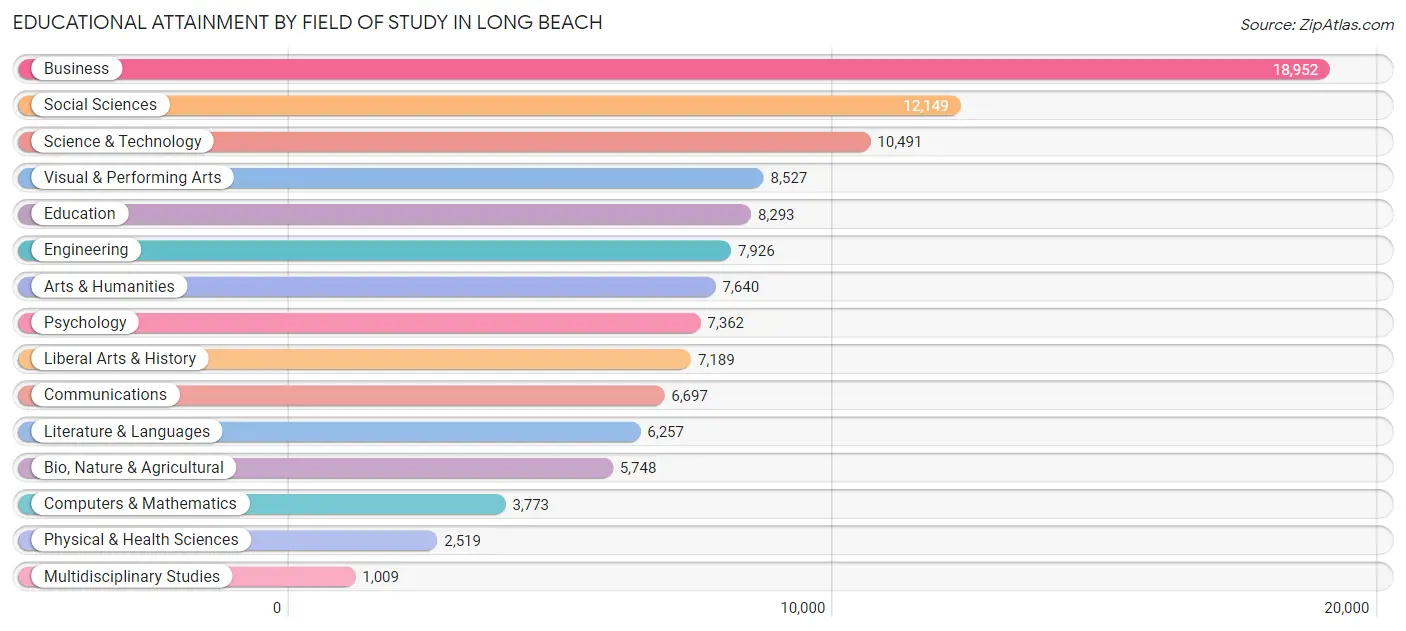
| Field of Study | # Graduates | % Graduates |
| Computers & Mathematics | 3,773 | 3.3% |
| Bio, Nature & Agricultural | 5,748 | 5.0% |
| Physical & Health Sciences | 2,519 | 2.2% |
| Psychology | 7,362 | 6.4% |
| Social Sciences | 12,149 | 10.6% |
| Engineering | 7,926 | 6.9% |
| Multidisciplinary Studies | 1,009 | 0.9% |
| Science & Technology | 10,491 | 9.2% |
| Business | 18,952 | 16.6% |
| Education | 8,293 | 7.2% |
| Literature & Languages | 6,257 | 5.5% |
| Liberal Arts & History | 7,189 | 6.3% |
| Visual & Performing Arts | 8,527 | 7.4% |
| Communications | 6,697 | 5.9% |
| Arts & Humanities | 7,640 | 6.7% |
| Total | 114,532 | 100.0% |
Transportation & Commute in Long Beach
Vehicle Availability by Sex in Long Beach
The most prevalent vehicle ownership categories in Long Beach are males with 2 vehicles (47,476, accounting for 39.6%) and females with 2 vehicles (39,095, making up 44.2%).
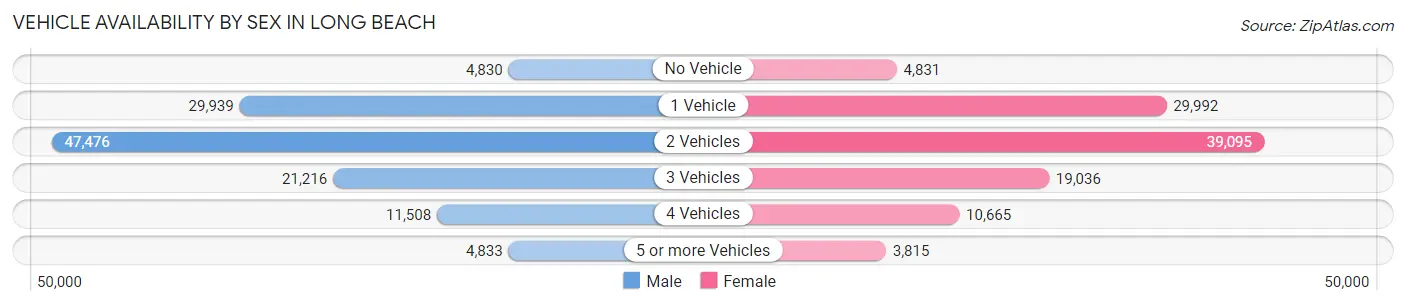
| Vehicles Available | Male | Female |
| No Vehicle | 4,830 (4.0%) | 4,831 (4.5%) |
| 1 Vehicle | 29,939 (25.0%) | 29,992 (27.9%) |
| 2 Vehicles | 47,476 (39.6%) | 39,095 (36.4%) |
| 3 Vehicles | 21,216 (17.7%) | 19,036 (17.7%) |
| 4 Vehicles | 11,508 (9.6%) | 10,665 (9.9%) |
| 5 or more Vehicles | 4,833 (4.0%) | 3,815 (3.5%) |
| Total | 119,802 (100.0%) | 107,434 (100.0%) |
Commute Time in Long Beach
The most frequently occuring commute durations in Long Beach are 30 to 34 minutes (34,852 commuters, 17.4%), 20 to 24 minutes (32,643 commuters, 16.4%), and 15 to 19 minutes (27,099 commuters, 13.6%).
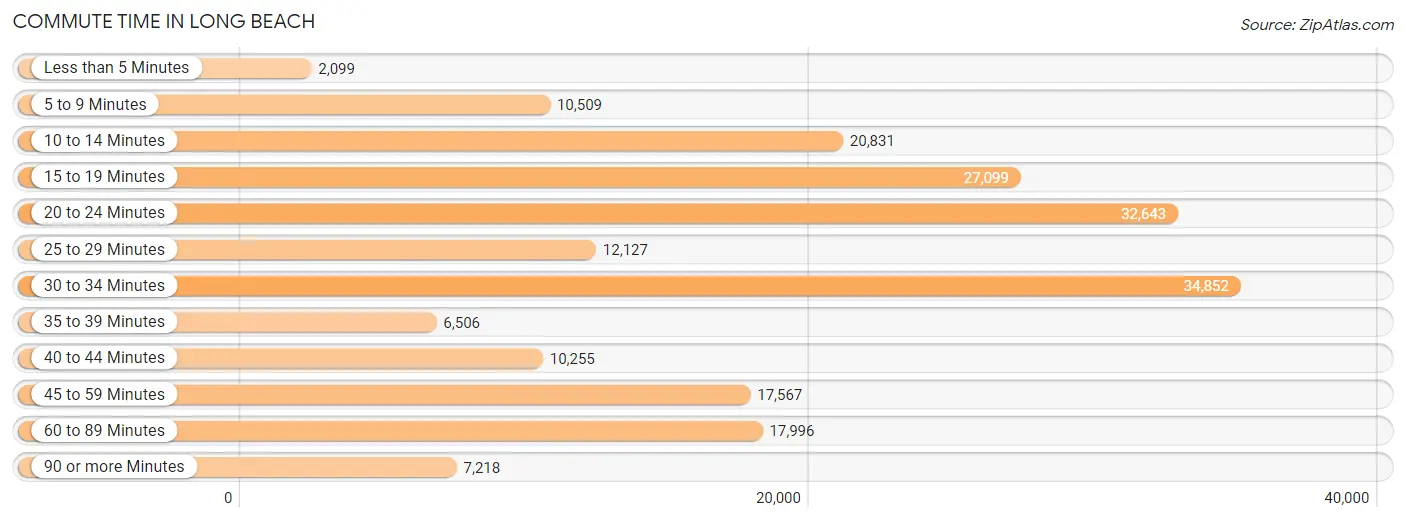
| Commute Time | # Commuters | % Commuters |
| Less than 5 Minutes | 2,099 | 1.1% |
| 5 to 9 Minutes | 10,509 | 5.3% |
| 10 to 14 Minutes | 20,831 | 10.4% |
| 15 to 19 Minutes | 27,099 | 13.6% |
| 20 to 24 Minutes | 32,643 | 16.4% |
| 25 to 29 Minutes | 12,127 | 6.1% |
| 30 to 34 Minutes | 34,852 | 17.4% |
| 35 to 39 Minutes | 6,506 | 3.3% |
| 40 to 44 Minutes | 10,255 | 5.1% |
| 45 to 59 Minutes | 17,567 | 8.8% |
| 60 to 89 Minutes | 17,996 | 9.0% |
| 90 or more Minutes | 7,218 | 3.6% |
Commute Time by Sex in Long Beach
The most common commute times in Long Beach are 30 to 34 minutes (20,674 commuters, 19.2%) for males and 20 to 24 minutes (14,637 commuters, 15.9%) for females.
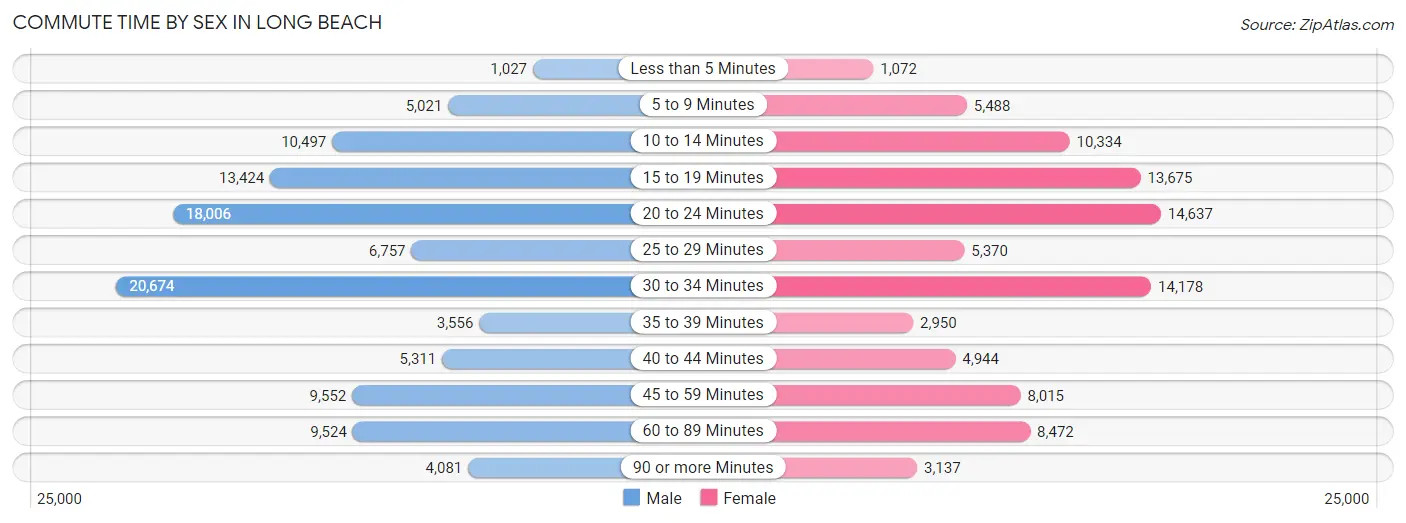
| Commute Time | Male | Female |
| Less than 5 Minutes | 1,027 (1.0%) | 1,072 (1.2%) |
| 5 to 9 Minutes | 5,021 (4.7%) | 5,488 (5.9%) |
| 10 to 14 Minutes | 10,497 (9.8%) | 10,334 (11.2%) |
| 15 to 19 Minutes | 13,424 (12.5%) | 13,675 (14.8%) |
| 20 to 24 Minutes | 18,006 (16.8%) | 14,637 (15.9%) |
| 25 to 29 Minutes | 6,757 (6.3%) | 5,370 (5.8%) |
| 30 to 34 Minutes | 20,674 (19.2%) | 14,178 (15.4%) |
| 35 to 39 Minutes | 3,556 (3.3%) | 2,950 (3.2%) |
| 40 to 44 Minutes | 5,311 (4.9%) | 4,944 (5.4%) |
| 45 to 59 Minutes | 9,552 (8.9%) | 8,015 (8.7%) |
| 60 to 89 Minutes | 9,524 (8.9%) | 8,472 (9.2%) |
| 90 or more Minutes | 4,081 (3.8%) | 3,137 (3.4%) |
Time of Departure to Work by Sex in Long Beach
The most frequent times of departure to work in Long Beach are 7:00 AM to 7:29 AM (19,243, 17.9%) for males and 8:00 AM to 8:29 AM (16,657, 18.0%) for females.
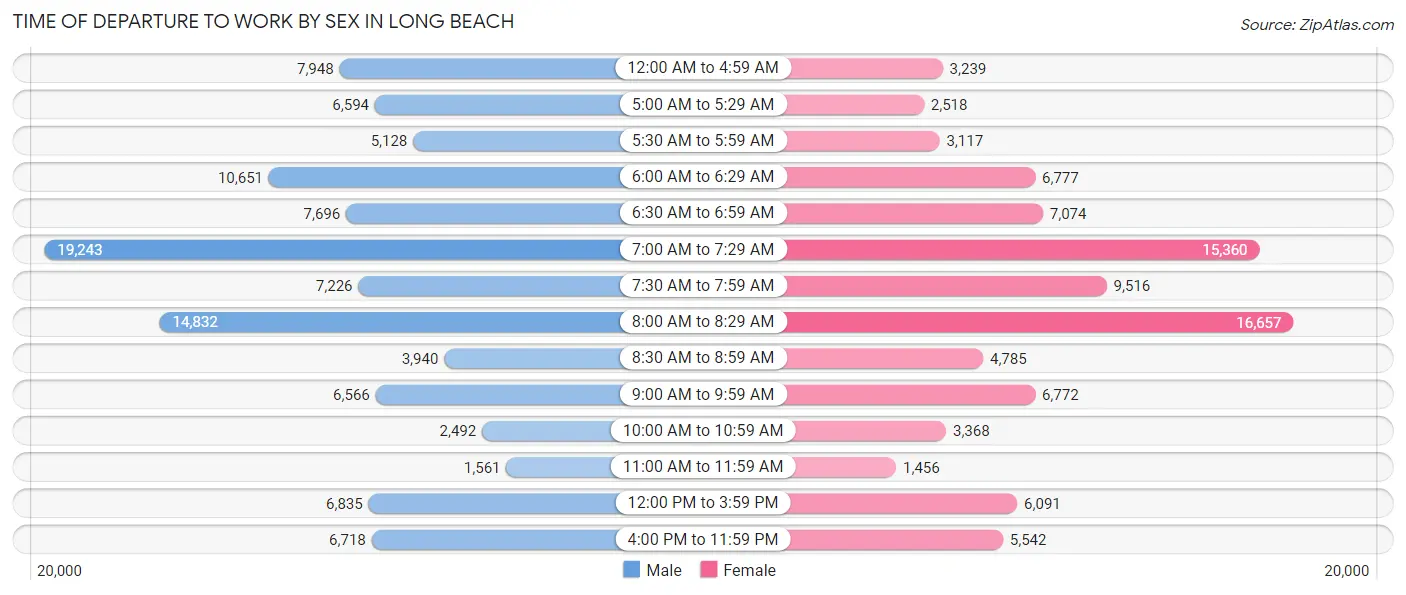
| Time of Departure | Male | Female |
| 12:00 AM to 4:59 AM | 7,948 (7.4%) | 3,239 (3.5%) |
| 5:00 AM to 5:29 AM | 6,594 (6.1%) | 2,518 (2.7%) |
| 5:30 AM to 5:59 AM | 5,128 (4.8%) | 3,117 (3.4%) |
| 6:00 AM to 6:29 AM | 10,651 (9.9%) | 6,777 (7.3%) |
| 6:30 AM to 6:59 AM | 7,696 (7.2%) | 7,074 (7.7%) |
| 7:00 AM to 7:29 AM | 19,243 (17.9%) | 15,360 (16.7%) |
| 7:30 AM to 7:59 AM | 7,226 (6.7%) | 9,516 (10.3%) |
| 8:00 AM to 8:29 AM | 14,832 (13.8%) | 16,657 (18.0%) |
| 8:30 AM to 8:59 AM | 3,940 (3.7%) | 4,785 (5.2%) |
| 9:00 AM to 9:59 AM | 6,566 (6.1%) | 6,772 (7.3%) |
| 10:00 AM to 10:59 AM | 2,492 (2.3%) | 3,368 (3.6%) |
| 11:00 AM to 11:59 AM | 1,561 (1.5%) | 1,456 (1.6%) |
| 12:00 PM to 3:59 PM | 6,835 (6.4%) | 6,091 (6.6%) |
| 4:00 PM to 11:59 PM | 6,718 (6.2%) | 5,542 (6.0%) |
| Total | 107,430 (100.0%) | 92,272 (100.0%) |
Housing Occupancy in Long Beach
Occupancy by Ownership in Long Beach
Of the total 170,174 dwellings in Long Beach, owner-occupied units account for 69,167 (40.6%), while renter-occupied units make up 101,007 (59.4%).
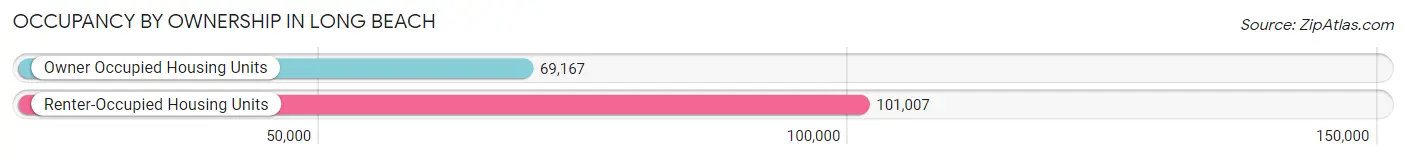
| Occupancy | # Housing Units | % Housing Units |
| Owner Occupied Housing Units | 69,167 | 40.6% |
| Renter-Occupied Housing Units | 101,007 | 59.4% |
| Total Occupied Housing Units | 170,174 | 100.0% |
Occupancy by Household Size in Long Beach
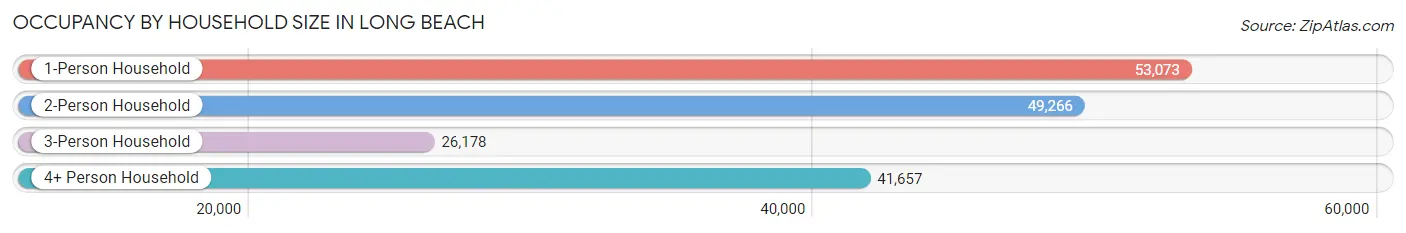
| Household Size | # Housing Units | % Housing Units |
| 1-Person Household | 53,073 | 31.2% |
| 2-Person Household | 49,266 | 28.9% |
| 3-Person Household | 26,178 | 15.4% |
| 4+ Person Household | 41,657 | 24.5% |
| Total Housing Units | 170,174 | 100.0% |
Occupancy by Ownership by Household Size in Long Beach
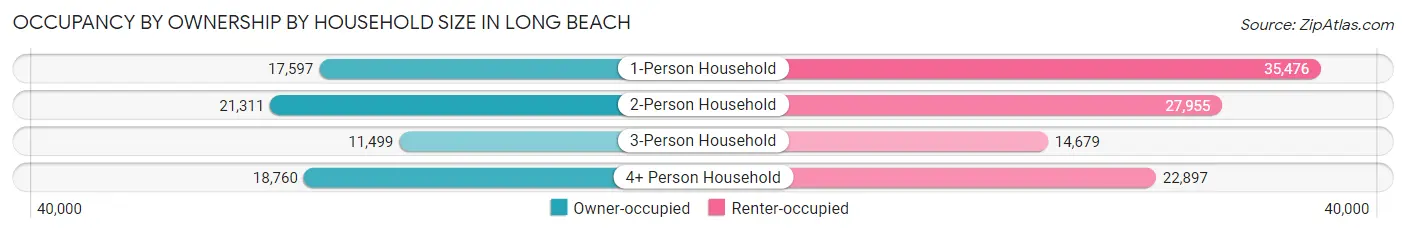
| Household Size | Owner-occupied | Renter-occupied |
| 1-Person Household | 17,597 (33.2%) | 35,476 (66.8%) |
| 2-Person Household | 21,311 (43.3%) | 27,955 (56.7%) |
| 3-Person Household | 11,499 (43.9%) | 14,679 (56.1%) |
| 4+ Person Household | 18,760 (45.0%) | 22,897 (55.0%) |
| Total Housing Units | 69,167 (40.6%) | 101,007 (59.4%) |
Occupancy by Educational Attainment in Long Beach
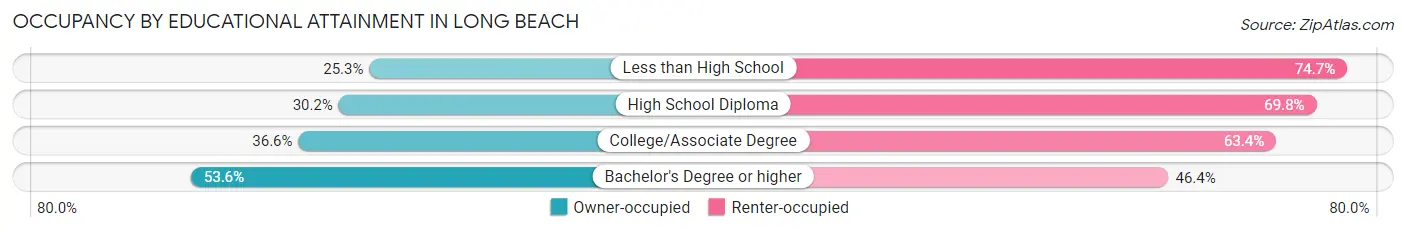
| Household Size | Owner-occupied | Renter-occupied |
| Less than High School | 5,953 (25.3%) | 17,552 (74.7%) |
| High School Diploma | 7,606 (30.2%) | 17,598 (69.8%) |
| College/Associate Degree | 20,447 (36.6%) | 35,448 (63.4%) |
| Bachelor's Degree or higher | 35,161 (53.6%) | 30,409 (46.4%) |
Occupancy by Age of Householder in Long Beach
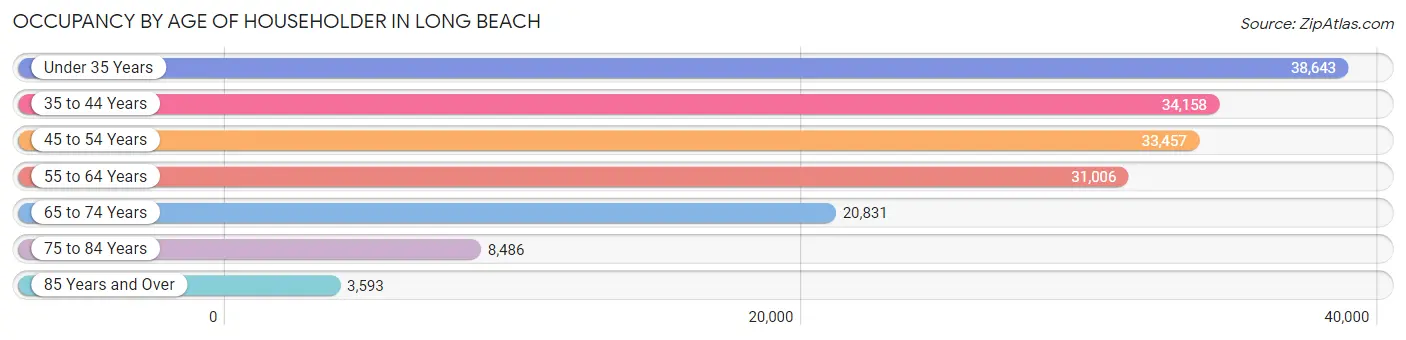
| Age Bracket | # Households | % Households |
| Under 35 Years | 38,643 | 22.7% |
| 35 to 44 Years | 34,158 | 20.1% |
| 45 to 54 Years | 33,457 | 19.7% |
| 55 to 64 Years | 31,006 | 18.2% |
| 65 to 74 Years | 20,831 | 12.2% |
| 75 to 84 Years | 8,486 | 5.0% |
| 85 Years and Over | 3,593 | 2.1% |
| Total | 170,174 | 100.0% |
Housing Finances in Long Beach
Median Income by Occupancy in Long Beach
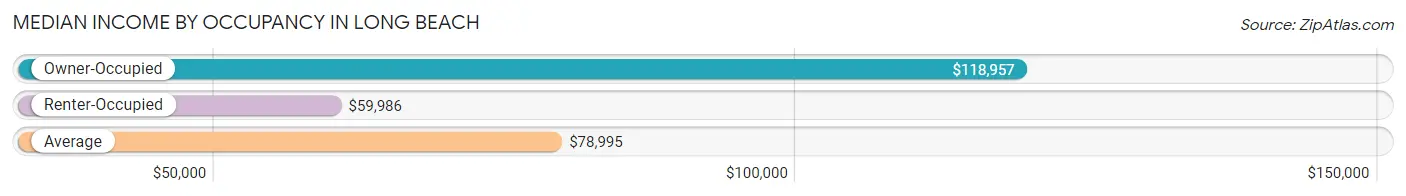
| Occupancy Type | # Households | Median Income |
| Owner-Occupied | 69,167 (40.6%) | $118,957 |
| Renter-Occupied | 101,007 (59.4%) | $59,986 |
| Average | 170,174 (100.0%) | $78,995 |
Occupancy by Householder Income Bracket in Long Beach
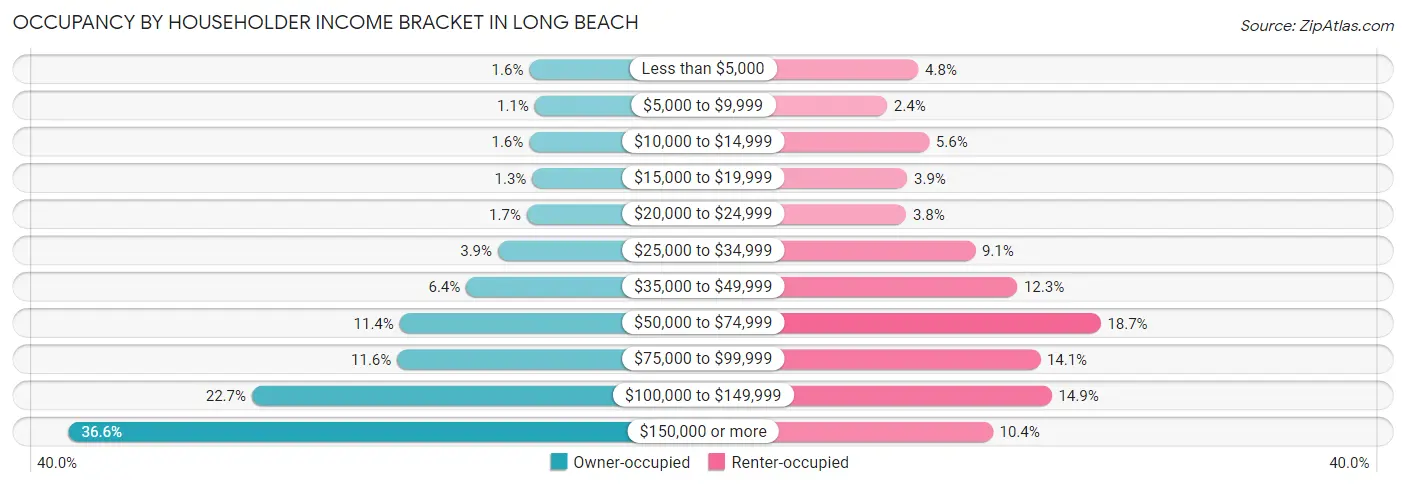
| Income Bracket | Owner-occupied | Renter-occupied |
| Less than $5,000 | 1,073 (1.5%) | 4,816 (4.8%) |
| $5,000 to $9,999 | 786 (1.1%) | 2,417 (2.4%) |
| $10,000 to $14,999 | 1,081 (1.6%) | 5,642 (5.6%) |
| $15,000 to $19,999 | 918 (1.3%) | 3,974 (3.9%) |
| $20,000 to $24,999 | 1,206 (1.7%) | 3,879 (3.8%) |
| $25,000 to $34,999 | 2,725 (3.9%) | 9,187 (9.1%) |
| $35,000 to $49,999 | 4,397 (6.4%) | 12,425 (12.3%) |
| $50,000 to $74,999 | 7,908 (11.4%) | 18,845 (18.7%) |
| $75,000 to $99,999 | 8,038 (11.6%) | 14,196 (14.1%) |
| $100,000 to $149,999 | 15,694 (22.7%) | 15,082 (14.9%) |
| $150,000 or more | 25,341 (36.6%) | 10,544 (10.4%) |
| Total | 69,167 (100.0%) | 101,007 (100.0%) |
Monthly Housing Cost Tiers in Long Beach
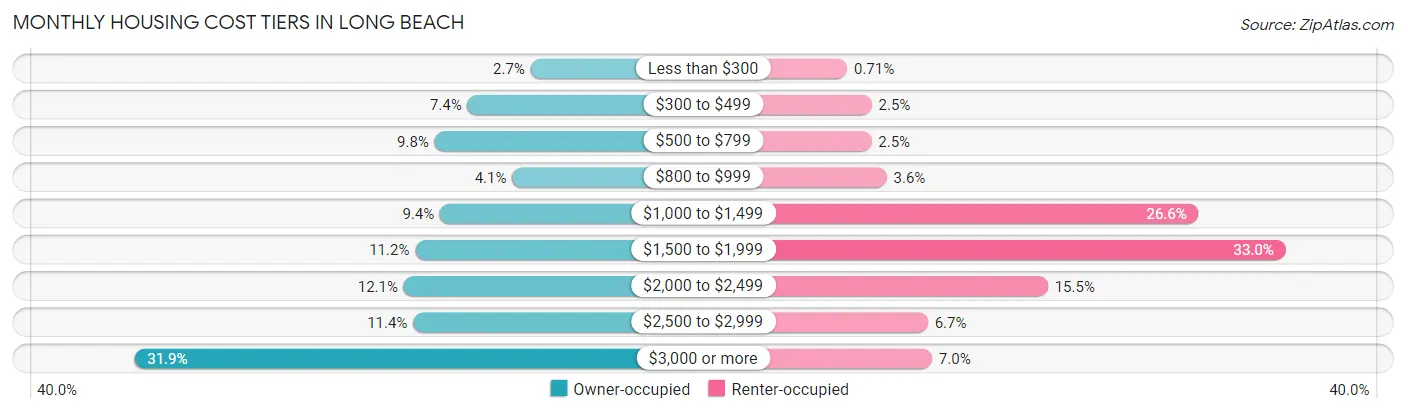
| Monthly Cost | Owner-occupied | Renter-occupied |
| Less than $300 | 1,888 (2.7%) | 719 (0.7%) |
| $300 to $499 | 5,106 (7.4%) | 2,550 (2.5%) |
| $500 to $799 | 6,781 (9.8%) | 2,522 (2.5%) |
| $800 to $999 | 2,825 (4.1%) | 3,655 (3.6%) |
| $1,000 to $1,499 | 6,503 (9.4%) | 26,863 (26.6%) |
| $1,500 to $1,999 | 7,770 (11.2%) | 33,346 (33.0%) |
| $2,000 to $2,499 | 8,346 (12.1%) | 15,641 (15.5%) |
| $2,500 to $2,999 | 7,868 (11.4%) | 6,713 (6.7%) |
| $3,000 or more | 22,080 (31.9%) | 7,029 (7.0%) |
| Total | 69,167 (100.0%) | 101,007 (100.0%) |
Physical Housing Characteristics in Long Beach
Housing Structures in Long Beach
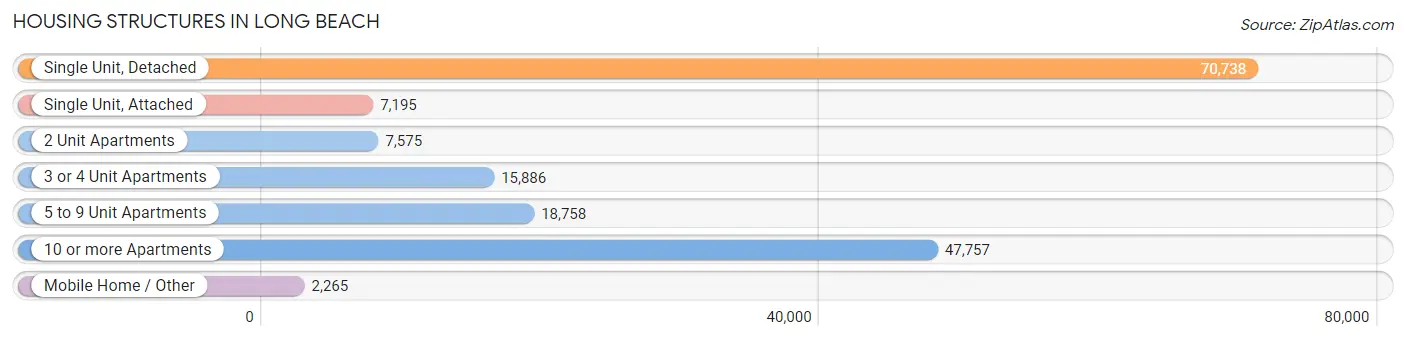
| Structure Type | # Housing Units | % Housing Units |
| Single Unit, Detached | 70,738 | 41.6% |
| Single Unit, Attached | 7,195 | 4.2% |
| 2 Unit Apartments | 7,575 | 4.4% |
| 3 or 4 Unit Apartments | 15,886 | 9.3% |
| 5 to 9 Unit Apartments | 18,758 | 11.0% |
| 10 or more Apartments | 47,757 | 28.1% |
| Mobile Home / Other | 2,265 | 1.3% |
| Total | 170,174 | 100.0% |
Housing Structures by Occupancy in Long Beach
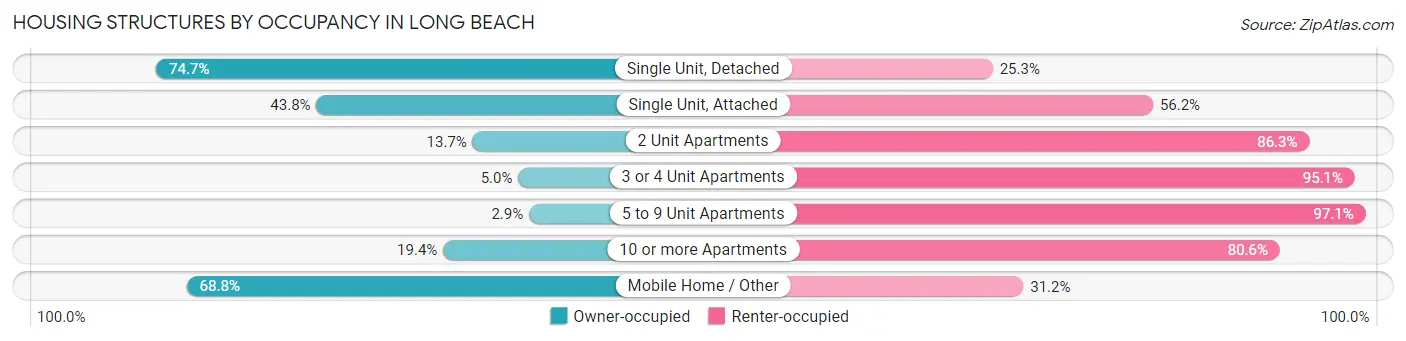
| Structure Type | Owner-occupied | Renter-occupied |
| Single Unit, Detached | 52,820 (74.7%) | 17,918 (25.3%) |
| Single Unit, Attached | 3,153 (43.8%) | 4,042 (56.2%) |
| 2 Unit Apartments | 1,040 (13.7%) | 6,535 (86.3%) |
| 3 or 4 Unit Apartments | 786 (5.0%) | 15,100 (95.1%) |
| 5 to 9 Unit Apartments | 541 (2.9%) | 18,217 (97.1%) |
| 10 or more Apartments | 9,269 (19.4%) | 38,488 (80.6%) |
| Mobile Home / Other | 1,558 (68.8%) | 707 (31.2%) |
| Total | 69,167 (40.6%) | 101,007 (59.4%) |
Housing Structures by Number of Rooms in Long Beach
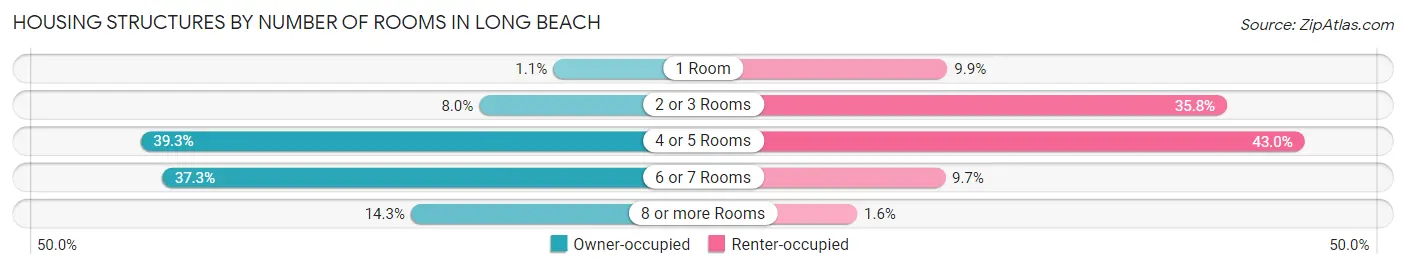
| Number of Rooms | Owner-occupied | Renter-occupied |
| 1 Room | 781 (1.1%) | 10,036 (9.9%) |
| 2 or 3 Rooms | 5,516 (8.0%) | 36,147 (35.8%) |
| 4 or 5 Rooms | 27,180 (39.3%) | 43,405 (43.0%) |
| 6 or 7 Rooms | 25,808 (37.3%) | 9,818 (9.7%) |
| 8 or more Rooms | 9,882 (14.3%) | 1,601 (1.6%) |
| Total | 69,167 (100.0%) | 101,007 (100.0%) |
Housing Structure by Heating Type in Long Beach
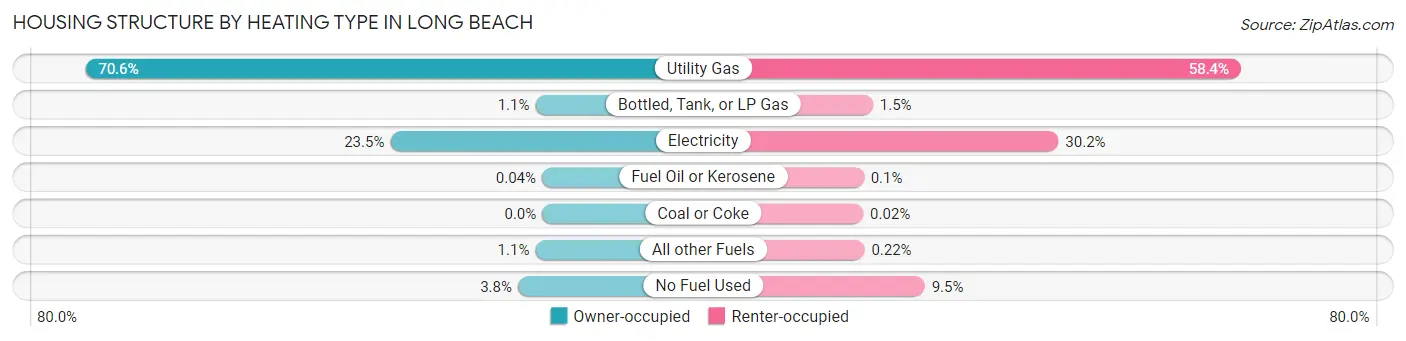
| Heating Type | Owner-occupied | Renter-occupied |
| Utility Gas | 48,837 (70.6%) | 58,988 (58.4%) |
| Bottled, Tank, or LP Gas | 728 (1.1%) | 1,537 (1.5%) |
| Electricity | 16,240 (23.5%) | 30,502 (30.2%) |
| Fuel Oil or Kerosene | 31 (0.0%) | 102 (0.1%) |
| Coal or Coke | 0 (0.0%) | 21 (0.0%) |
| All other Fuels | 735 (1.1%) | 226 (0.2%) |
| No Fuel Used | 2,596 (3.7%) | 9,631 (9.5%) |
| Total | 69,167 (100.0%) | 101,007 (100.0%) |
Household Vehicle Usage in Long Beach
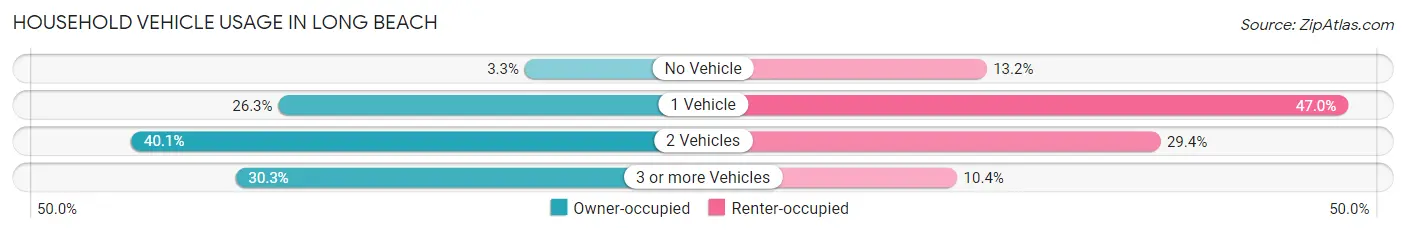
| Vehicles per Household | Owner-occupied | Renter-occupied |
| No Vehicle | 2,292 (3.3%) | 13,324 (13.2%) |
| 1 Vehicle | 18,196 (26.3%) | 47,443 (47.0%) |
| 2 Vehicles | 27,707 (40.1%) | 29,705 (29.4%) |
| 3 or more Vehicles | 20,972 (30.3%) | 10,535 (10.4%) |
| Total | 69,167 (100.0%) | 101,007 (100.0%) |
Real Estate & Mortgages in Long Beach
Real Estate and Mortgage Overview in Long Beach
| Characteristic | Without Mortgage | With Mortgage |
| Housing Units | 19,440 | 49,727 |
| Median Property Value | $709,900 | $709,600 |
| Median Household Income | $87,220 | $20,702 |
| Monthly Housing Costs | $622 | $21,884 |
| Real Estate Taxes | $3,123 | $847 |
Property Value by Mortgage Status in Long Beach
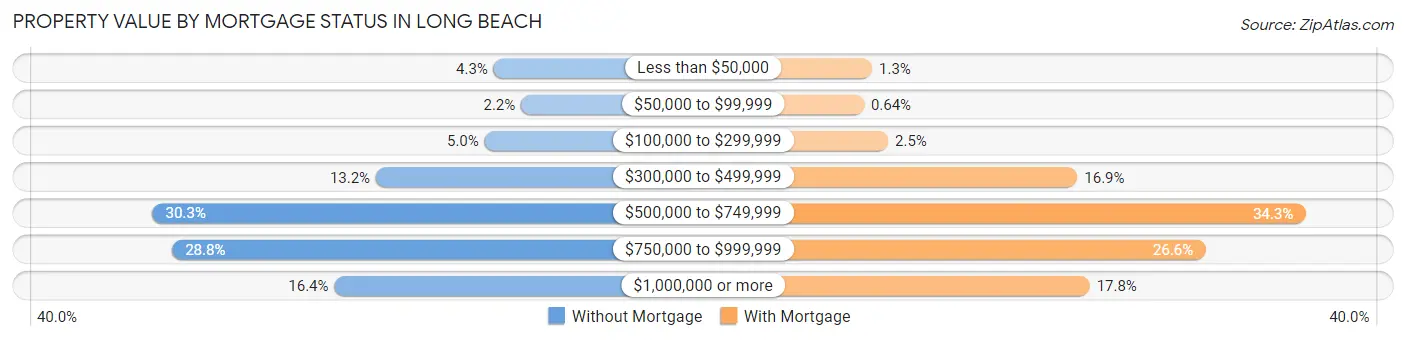
| Property Value | Without Mortgage | With Mortgage |
| Less than $50,000 | 828 (4.3%) | 629 (1.3%) |
| $50,000 to $99,999 | 421 (2.2%) | 318 (0.6%) |
| $100,000 to $299,999 | 963 (5.0%) | 1,231 (2.5%) |
| $300,000 to $499,999 | 2,571 (13.2%) | 8,403 (16.9%) |
| $500,000 to $749,999 | 5,880 (30.2%) | 17,035 (34.3%) |
| $750,000 to $999,999 | 5,589 (28.7%) | 13,240 (26.6%) |
| $1,000,000 or more | 3,188 (16.4%) | 8,871 (17.8%) |
| Total | 19,440 (100.0%) | 49,727 (100.0%) |
Household Income by Mortgage Status in Long Beach
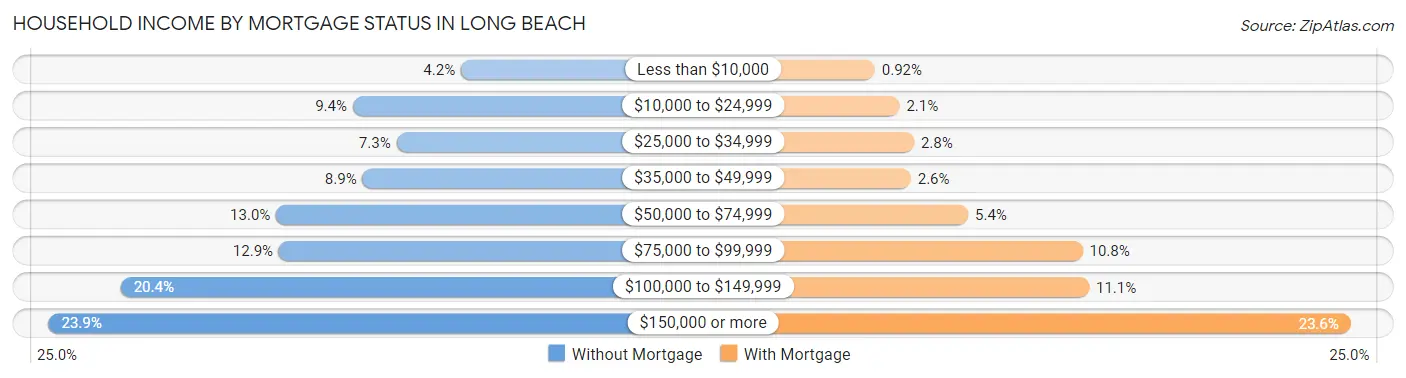
| Household Income | Without Mortgage | With Mortgage |
| Less than $10,000 | 821 (4.2%) | 458 (0.9%) |
| $10,000 to $24,999 | 1,822 (9.4%) | 1,038 (2.1%) |
| $25,000 to $34,999 | 1,417 (7.3%) | 1,383 (2.8%) |
| $35,000 to $49,999 | 1,733 (8.9%) | 1,308 (2.6%) |
| $50,000 to $74,999 | 2,532 (13.0%) | 2,664 (5.4%) |
| $75,000 to $99,999 | 2,506 (12.9%) | 5,376 (10.8%) |
| $100,000 to $149,999 | 3,970 (20.4%) | 5,532 (11.1%) |
| $150,000 or more | 4,639 (23.9%) | 11,724 (23.6%) |
| Total | 19,440 (100.0%) | 49,727 (100.0%) |
Property Value to Household Income Ratio in Long Beach
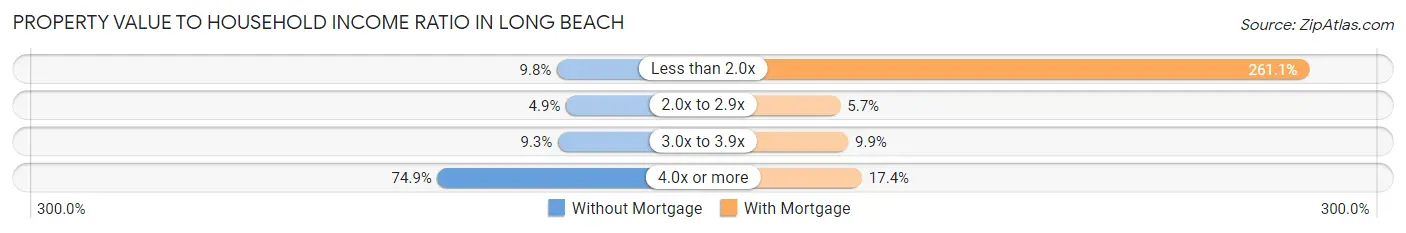
| Value-to-Income Ratio | Without Mortgage | With Mortgage |
| Less than 2.0x | 1,911 (9.8%) | 129,844 (261.1%) |
| 2.0x to 2.9x | 952 (4.9%) | 2,822 (5.7%) |
| 3.0x to 3.9x | 1,814 (9.3%) | 4,920 (9.9%) |
| 4.0x or more | 14,569 (74.9%) | 8,671 (17.4%) |
| Total | 19,440 (100.0%) | 49,727 (100.0%) |
Real Estate Taxes by Mortgage Status in Long Beach
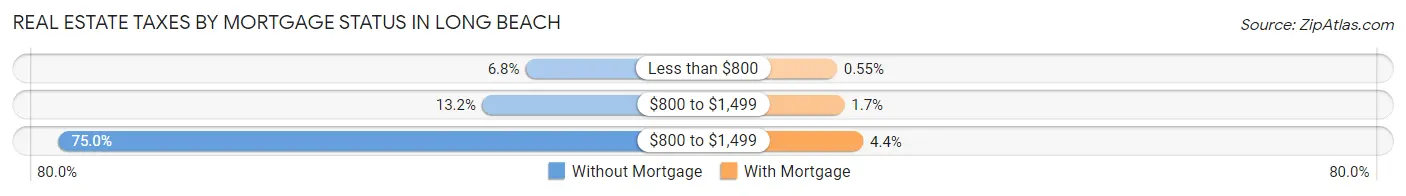
| Property Taxes | Without Mortgage | With Mortgage |
| Less than $800 | 1,330 (6.8%) | 273 (0.5%) |
| $800 to $1,499 | 2,567 (13.2%) | 819 (1.7%) |
| $800 to $1,499 | 14,585 (75.0%) | 2,183 (4.4%) |
| Total | 19,440 (100.0%) | 49,727 (100.0%) |
Health & Disability in Long Beach
Health Insurance Coverage by Age in Long Beach
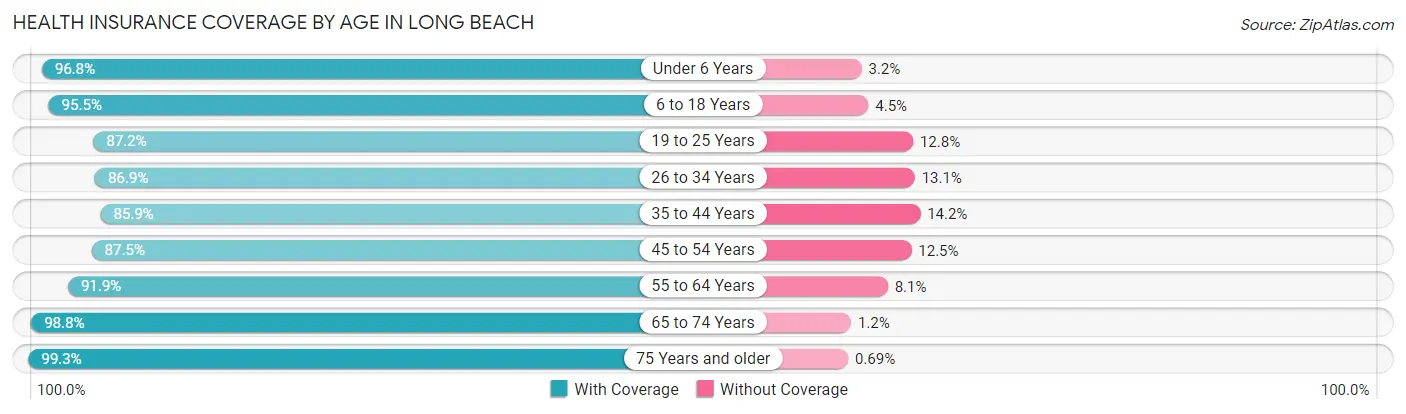
| Age Bracket | With Coverage | Without Coverage |
| Under 6 Years | 29,352 (96.8%) | 974 (3.2%) |
| 6 to 18 Years | 69,289 (95.5%) | 3,256 (4.5%) |
| 19 to 25 Years | 41,391 (87.2%) | 6,083 (12.8%) |
| 26 to 34 Years | 62,657 (86.9%) | 9,472 (13.1%) |
| 35 to 44 Years | 55,421 (85.9%) | 9,132 (14.1%) |
| 45 to 54 Years | 52,473 (87.5%) | 7,495 (12.5%) |
| 55 to 64 Years | 51,723 (91.9%) | 4,554 (8.1%) |
| 65 to 74 Years | 35,043 (98.8%) | 440 (1.2%) |
| 75 Years and older | 20,143 (99.3%) | 140 (0.7%) |
| Total | 417,492 (90.9%) | 41,546 (9.0%) |
Health Insurance Coverage by Citizenship Status in Long Beach
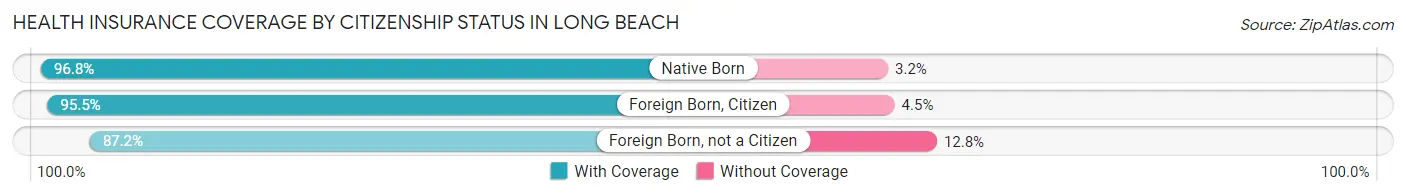
| Citizenship Status | With Coverage | Without Coverage |
| Native Born | 29,352 (96.8%) | 974 (3.2%) |
| Foreign Born, Citizen | 69,289 (95.5%) | 3,256 (4.5%) |
| Foreign Born, not a Citizen | 41,391 (87.2%) | 6,083 (12.8%) |
Health Insurance Coverage by Household Income in Long Beach
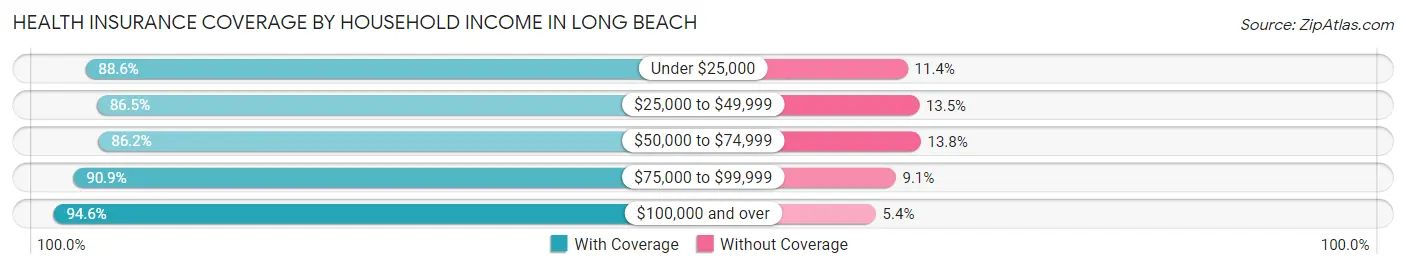
| Household Income | With Coverage | Without Coverage |
| Under $25,000 | 43,543 (88.6%) | 5,605 (11.4%) |
| $25,000 to $49,999 | 59,932 (86.5%) | 9,368 (13.5%) |
| $50,000 to $74,999 | 61,045 (86.2%) | 9,790 (13.8%) |
| $75,000 to $99,999 | 54,793 (90.9%) | 5,507 (9.1%) |
| $100,000 and over | 190,446 (94.6%) | 10,895 (5.4%) |
Public vs Private Health Insurance Coverage by Age in Long Beach
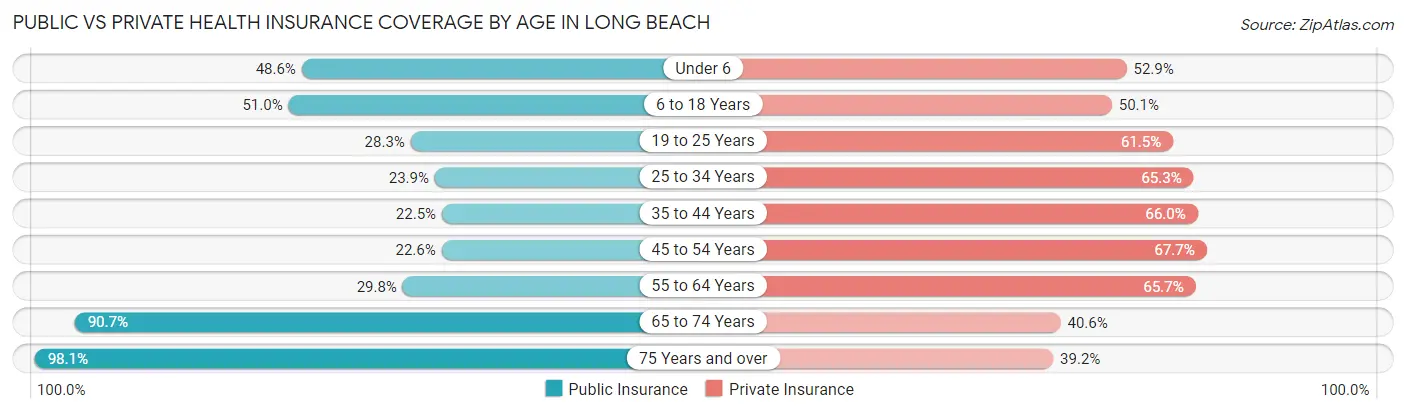
| Age Bracket | Public Insurance | Private Insurance |
| Under 6 | 14,729 (48.6%) | 16,030 (52.9%) |
| 6 to 18 Years | 37,013 (51.0%) | 36,349 (50.1%) |
| 19 to 25 Years | 13,455 (28.3%) | 29,185 (61.5%) |
| 25 to 34 Years | 17,211 (23.9%) | 47,075 (65.3%) |
| 35 to 44 Years | 14,551 (22.5%) | 42,623 (66.0%) |
| 45 to 54 Years | 13,559 (22.6%) | 40,601 (67.7%) |
| 55 to 64 Years | 16,784 (29.8%) | 36,948 (65.6%) |
| 65 to 74 Years | 32,181 (90.7%) | 14,408 (40.6%) |
| 75 Years and over | 19,900 (98.1%) | 7,958 (39.2%) |
| Total | 179,383 (39.1%) | 271,177 (59.1%) |
Disability Status by Sex by Age in Long Beach
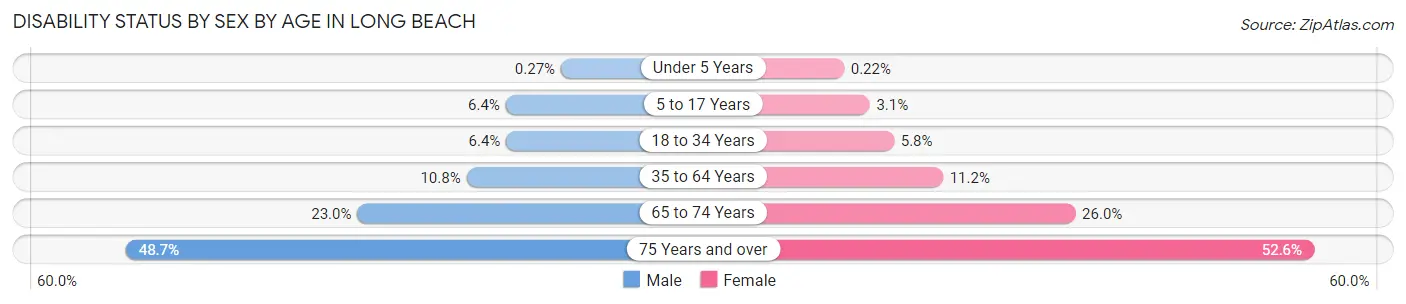
| Age Bracket | Male | Female |
| Under 5 Years | 33 (0.3%) | 28 (0.2%) |
| 5 to 17 Years | 2,414 (6.4%) | 1,018 (3.1%) |
| 18 to 34 Years | 3,943 (6.4%) | 3,754 (5.8%) |
| 35 to 64 Years | 9,801 (10.8%) | 10,119 (11.2%) |
| 65 to 74 Years | 3,707 (23.0%) | 5,024 (26.0%) |
| 75 Years and over | 3,918 (48.7%) | 6,436 (52.6%) |
Disability Class by Sex by Age in Long Beach
Disability Class: Hearing Difficulty
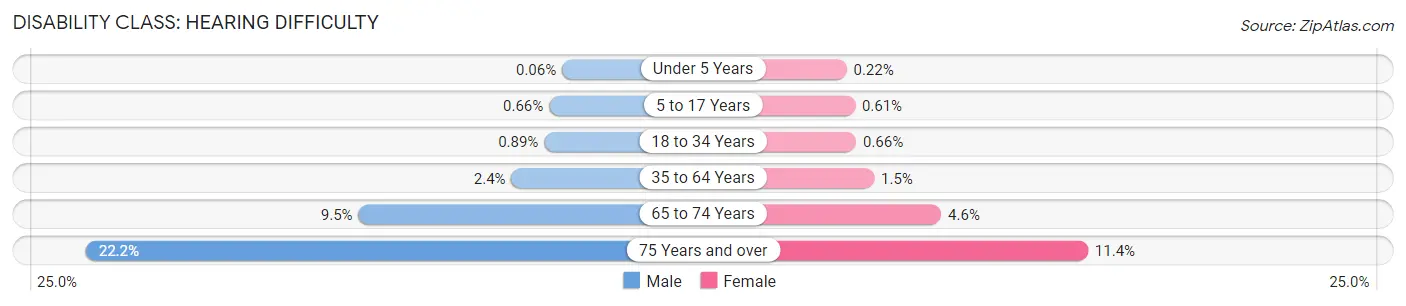
| Age Bracket | Male | Female |
| Under 5 Years | 7 (0.1%) | 28 (0.2%) |
| 5 to 17 Years | 247 (0.7%) | 203 (0.6%) |
| 18 to 34 Years | 552 (0.9%) | 427 (0.7%) |
| 35 to 64 Years | 2,188 (2.4%) | 1,350 (1.5%) |
| 65 to 74 Years | 1,537 (9.5%) | 891 (4.6%) |
| 75 Years and over | 1,782 (22.2%) | 1,398 (11.4%) |
Disability Class: Vision Difficulty
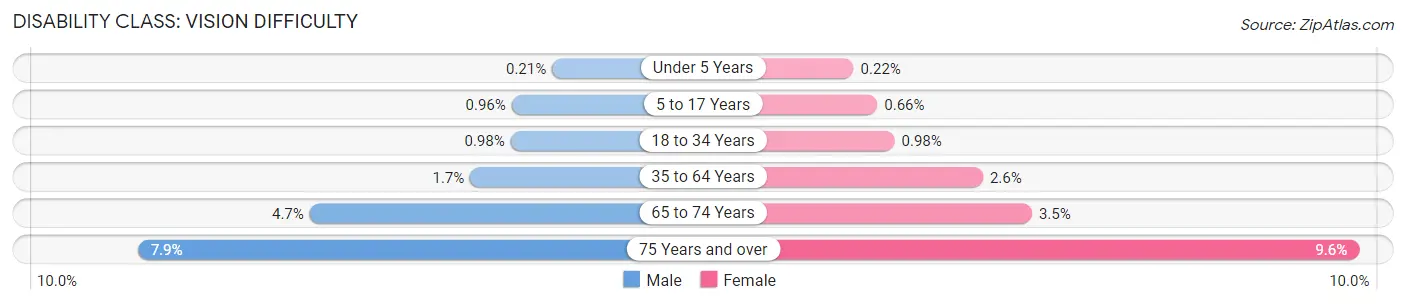
| Age Bracket | Male | Female |
| Under 5 Years | 26 (0.2%) | 28 (0.2%) |
| 5 to 17 Years | 362 (1.0%) | 218 (0.7%) |
| 18 to 34 Years | 604 (1.0%) | 638 (1.0%) |
| 35 to 64 Years | 1,570 (1.7%) | 2,359 (2.6%) |
| 65 to 74 Years | 761 (4.7%) | 682 (3.5%) |
| 75 Years and over | 635 (7.9%) | 1,175 (9.6%) |
Disability Class: Cognitive Difficulty
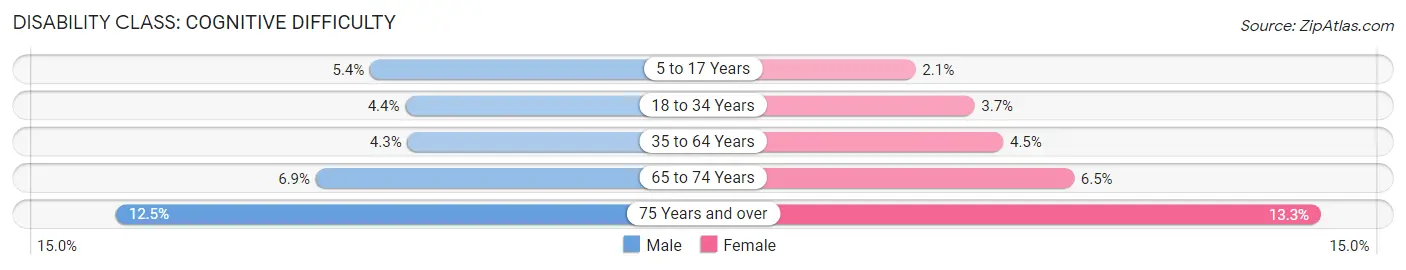
| Age Bracket | Male | Female |
| 5 to 17 Years | 2,024 (5.4%) | 676 (2.1%) |
| 18 to 34 Years | 2,728 (4.4%) | 2,392 (3.7%) |
| 35 to 64 Years | 3,940 (4.3%) | 4,037 (4.5%) |
| 65 to 74 Years | 1,113 (6.9%) | 1,249 (6.5%) |
| 75 Years and over | 1,002 (12.5%) | 1,633 (13.3%) |
Disability Class: Ambulatory Difficulty
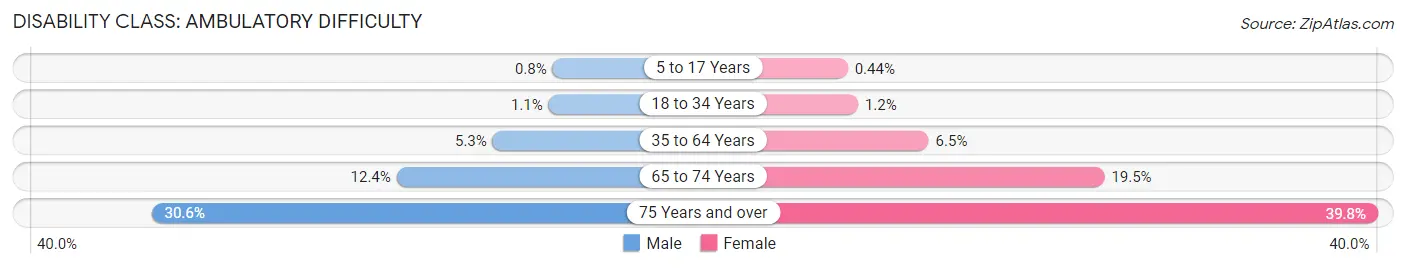
| Age Bracket | Male | Female |
| 5 to 17 Years | 301 (0.8%) | 146 (0.4%) |
| 18 to 34 Years | 684 (1.1%) | 778 (1.2%) |
| 35 to 64 Years | 4,770 (5.2%) | 5,804 (6.5%) |
| 65 to 74 Years | 2,000 (12.4%) | 3,769 (19.5%) |
| 75 Years and over | 2,458 (30.6%) | 4,872 (39.8%) |
Disability Class: Self-Care Difficulty
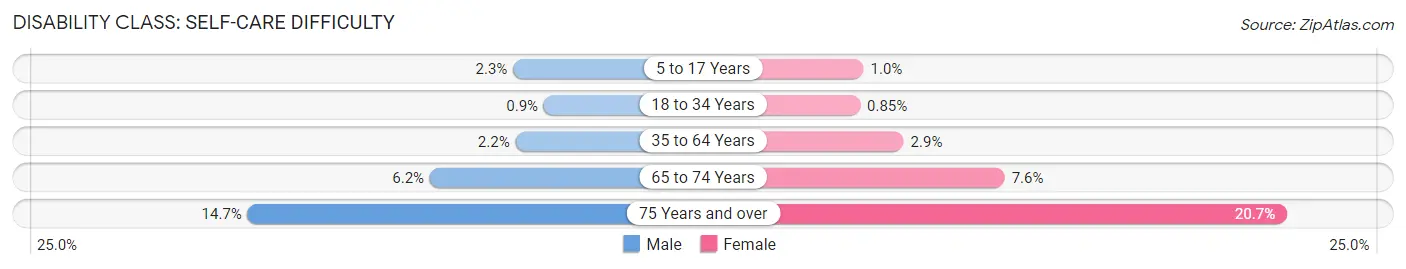
| Age Bracket | Male | Female |
| 5 to 17 Years | 877 (2.3%) | 332 (1.0%) |
| 18 to 34 Years | 556 (0.9%) | 549 (0.9%) |
| 35 to 64 Years | 2,018 (2.2%) | 2,579 (2.9%) |
| 65 to 74 Years | 1,000 (6.2%) | 1,461 (7.6%) |
| 75 Years and over | 1,178 (14.6%) | 2,530 (20.7%) |
Technology Access in Long Beach
Computing Device Access in Long Beach
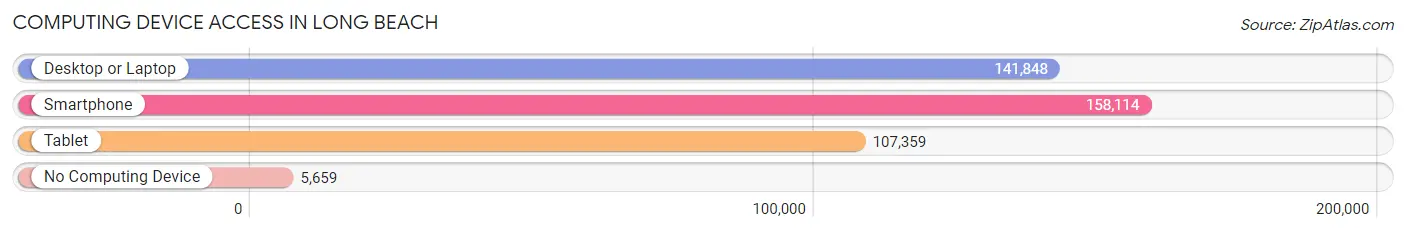
| Device Type | # Households | % Households |
| Desktop or Laptop | 141,848 | 83.4% |
| Smartphone | 158,114 | 92.9% |
| Tablet | 107,359 | 63.1% |
| No Computing Device | 5,659 | 3.3% |
| Total | 170,174 | 100.0% |
Internet Access in Long Beach
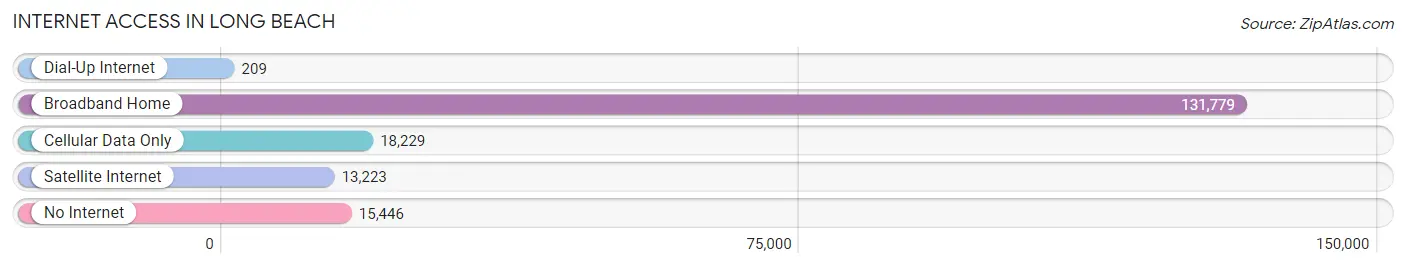
| Internet Type | # Households | % Households |
| Dial-Up Internet | 209 | 0.1% |
| Broadband Home | 131,779 | 77.4% |
| Cellular Data Only | 18,229 | 10.7% |
| Satellite Internet | 13,223 | 7.8% |
| No Internet | 15,446 | 9.1% |
| Total | 170,174 | 100.0% |
Long Beach Summary
Long Beach, California is a city located in Los Angeles County, California. It is the seventh-largest city in the state and the second-largest city in Los Angeles County. Long Beach is located on the Pacific Ocean and is home to the Port of Long Beach, one of the world’s busiest ports. The city is also home to the Long Beach Airport, one of the busiest airports in the United States.
History
Long Beach was originally inhabited by the Tongva people, who were the original inhabitants of the Los Angeles Basin. The area was first explored by Spanish explorer Juan Rodriguez Cabrillo in 1542. The area was later settled by the Spanish in 1784, when the Spanish Empire granted the land to the Rancho Los Alamitos. The area was later annexed by the United States in 1848, and the city of Long Beach was incorporated in 1888.
Geography
Long Beach is located in the Los Angeles Basin, on the Pacific Ocean. The city is bordered by the cities of Los Angeles, Signal Hill, Lakewood, and Seal Beach. The city covers an area of 51.5 square miles, and has a population of 462,257. The city is divided into several neighborhoods, including Downtown, Belmont Shore, East Long Beach, North Long Beach, and West Long Beach.
Economy
Long Beach is a major economic center in the Los Angeles area. The city is home to the Port of Long Beach, one of the busiest ports in the world. The port is a major hub for international trade, and is the second-busiest port in the United States. The city is also home to the Long Beach Airport, one of the busiest airports in the United States. The city is also home to several major corporations, including Boeing, Epson, and Molina Healthcare.
Demographics
As of the 2010 census, Long Beach had a population of 462,257. The city is racially diverse, with a population that is 44.2% White, 11.3% African American, 0.7% Native American, 33.2% Asian, 0.2% Pacific Islander, and 10.3% from other races. The city is also home to a large Hispanic population, with 33.7% of the population identifying as Hispanic or Latino. The median household income in Long Beach is $54,845, and the median home value is $521,000.
Long Beach is a vibrant and diverse city, with a rich history and a strong economy. The city is home to a large and diverse population, and is a major economic center in the Los Angeles area. Long Beach is a great place to live, work, and visit, and is sure to continue to be a major player in the Los Angeles area for years to come.
Common Questions
What is Per Capita Income in Long Beach?
Per Capita income in Long Beach is $39,589.
What is the Median Family Income in Long Beach?
Median Family Income in Long Beach is $89,469.
What is the Median Household income in Long Beach?
Median Household Income in Long Beach is $78,995.
What is Income or Wage Gap in Long Beach?
Income or Wage Gap in Long Beach is 22.6%.
Women in Long Beach earn 77.4 cents for every dollar earned by a man.
What is Family Income Deficit in Long Beach?
Family Income Deficit in Long Beach is $11,786.
Families that are below poverty line in Long Beach earn $11,786 less on average than the poverty threshold level.
What is Inequality or Gini Index in Long Beach?
Inequality or Gini Index in Long Beach is 0.46.
What is the Total Population of Long Beach?
Total Population of Long Beach is 462,293.
What is the Total Male Population of Long Beach?
Total Male Population of Long Beach is 228,674.
What is the Total Female Population of Long Beach?
Total Female Population of Long Beach is 233,619.
What is the Ratio of Males per 100 Females in Long Beach?
There are 97.88 Males per 100 Females in Long Beach.
What is the Ratio of Females per 100 Males in Long Beach?
There are 102.16 Females per 100 Males in Long Beach.
What is the Median Population Age in Long Beach?
Median Population Age in Long Beach is 36.1 Years.
What is the Average Family Size in Long Beach
Average Family Size in Long Beach is 3.4 People.
What is the Average Household Size in Long Beach
Average Household Size in Long Beach is 2.6 People.
How Large is the Labor Force in Long Beach?
There are 251,514 People in the Labor Forcein in Long Beach.
What is the Percentage of People in the Labor Force in Long Beach?
66.6% of People are in the Labor Force in Long Beach.
What is the Unemployment Rate in Long Beach?
Unemployment Rate in Long Beach is 6.6%.