Hilo, HI Map & Demographics
Hilo Map
Hilo Overview
$37,707
PER CAPITA INCOME
$98,243
AVG FAMILY INCOME
$75,589
AVG HOUSEHOLD INCOME
17.2%
WAGE / INCOME GAP [ % ]
82.8¢/ $1
WAGE / INCOME GAP [ $ ]
$11,564
FAMILY INCOME DEFICIT
0.48
INEQUALITY / GINI INDEX
47,627
TOTAL POPULATION
23,040
MALE POPULATION
24,587
FEMALE POPULATION
93.71
MALES / 100 FEMALES
106.71
FEMALES / 100 MALES
41.5
MEDIAN AGE
3.4
AVG FAMILY SIZE
2.8
AVG HOUSEHOLD SIZE
22,707
LABOR FORCE [ PEOPLE ]
58.8%
PERCENT IN LABOR FORCE
6.8%
UNEMPLOYMENT RATE
Hilo Zip Codes
Hilo Area Codes
Income in Hilo
Income Overview in Hilo
Per Capita Income in Hilo is $37,707, while median incomes of families and households are $98,243 and $75,589 respectively.
| Characteristic | Number | Measure |
| Per Capita Income | 47,627 | $37,707 |
| Median Family Income | 10,969 | $98,243 |
| Mean Family Income | 10,969 | $119,951 |
| Median Household Income | 16,752 | $75,589 |
| Mean Household Income | 16,752 | $101,320 |
| Income Deficit | 10,969 | $11,564 |
| Wage / Income Gap (%) | 47,627 | 17.23% |
| Wage / Income Gap ($) | 47,627 | 82.77¢ per $1 |
| Gini / Inequality Index | 47,627 | 0.48 |
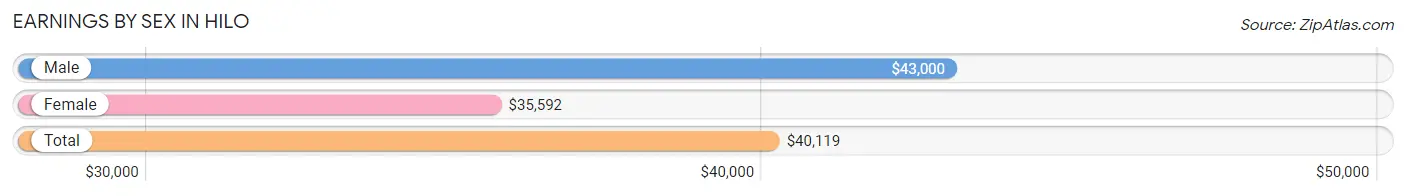
Earnings by Sex in Hilo
Average Earnings in Hilo are $40,119, $43,000 for men and $35,592 for women, a difference of 17.2%.
| Sex | Number | Average Earnings |
| Male | 11,434 (48.5%) | $43,000 |
| Female | 12,136 (51.5%) | $35,592 |
| Total | 23,570 (100.0%) | $40,119 |
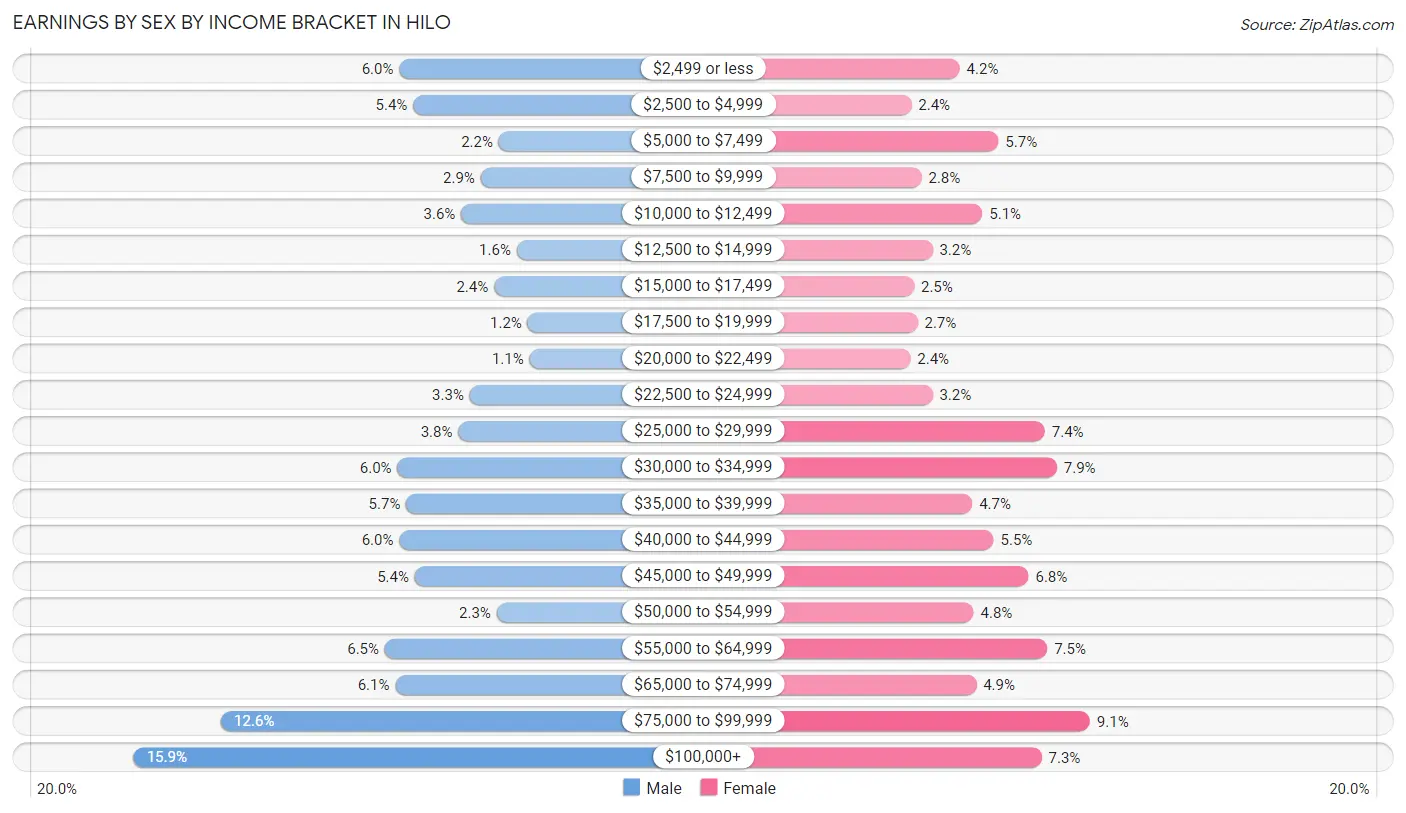
Earnings by Sex by Income Bracket in Hilo
The most common earnings brackets in Hilo are $100,000+ for men (1,819 | 15.9%) and $75,000 to $99,999 for women (1,106 | 9.1%).
| Income | Male | Female |
| $2,499 or less | 681 (6.0%) | 513 (4.2%) |
| $2,500 to $4,999 | 622 (5.4%) | 294 (2.4%) |
| $5,000 to $7,499 | 255 (2.2%) | 689 (5.7%) |
| $7,500 to $9,999 | 333 (2.9%) | 340 (2.8%) |
| $10,000 to $12,499 | 416 (3.6%) | 616 (5.1%) |
| $12,500 to $14,999 | 178 (1.6%) | 390 (3.2%) |
| $15,000 to $17,499 | 276 (2.4%) | 306 (2.5%) |
| $17,500 to $19,999 | 132 (1.1%) | 322 (2.6%) |
| $20,000 to $22,499 | 124 (1.1%) | 289 (2.4%) |
| $22,500 to $24,999 | 380 (3.3%) | 390 (3.2%) |
| $25,000 to $29,999 | 429 (3.7%) | 901 (7.4%) |
| $30,000 to $34,999 | 690 (6.0%) | 955 (7.9%) |
| $35,000 to $39,999 | 652 (5.7%) | 570 (4.7%) |
| $40,000 to $44,999 | 681 (6.0%) | 667 (5.5%) |
| $45,000 to $49,999 | 615 (5.4%) | 826 (6.8%) |
| $50,000 to $54,999 | 264 (2.3%) | 576 (4.8%) |
| $55,000 to $64,999 | 743 (6.5%) | 912 (7.5%) |
| $65,000 to $74,999 | 699 (6.1%) | 588 (4.9%) |
| $75,000 to $99,999 | 1,445 (12.6%) | 1,106 (9.1%) |
| $100,000+ | 1,819 (15.9%) | 886 (7.3%) |
| Total | 11,434 (100.0%) | 12,136 (100.0%) |
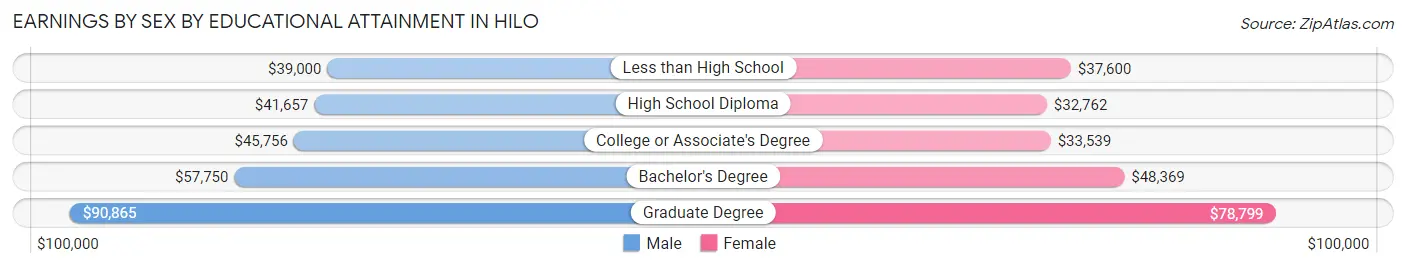
Earnings by Sex by Educational Attainment in Hilo
Average earnings in Hilo are $49,611 for men and $41,050 for women, a difference of 17.3%. Men with an educational attainment of graduate degree enjoy the highest average annual earnings of $90,865, while those with less than high school education earn the least with $39,000. Women with an educational attainment of graduate degree earn the most with the average annual earnings of $78,799, while those with high school diploma education have the smallest earnings of $32,762.
| Educational Attainment | Male Income | Female Income |
| Less than High School | $39,000 | $37,600 |
| High School Diploma | $41,657 | $32,762 |
| College or Associate's Degree | $45,756 | $33,539 |
| Bachelor's Degree | $57,750 | $48,369 |
| Graduate Degree | $90,865 | $78,799 |
| Total | $49,611 | $41,050 |
Family Income in Hilo
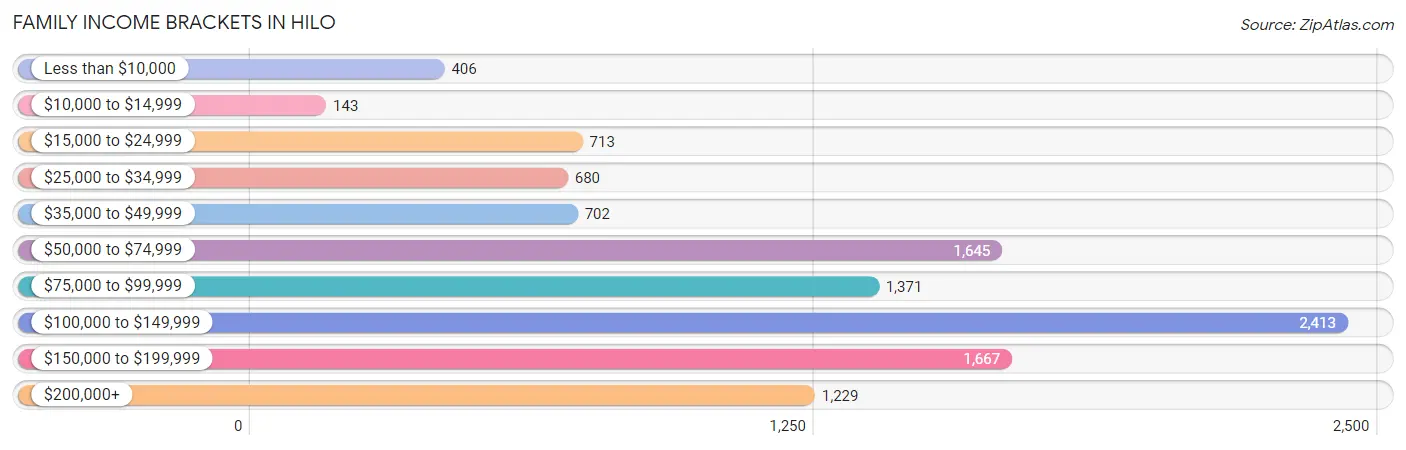
Family Income Brackets in Hilo
According to the Hilo family income data, there are 2,413 families falling into the $100,000 to $149,999 income range, which is the most common income bracket and makes up 22.0% of all families. Conversely, the $10,000 to $14,999 income bracket is the least frequent group with only 143 families (1.3%) belonging to this category.
| Income Bracket | # Families | % Families |
| Less than $10,000 | 406 | 3.7% |
| $10,000 to $14,999 | 143 | 1.3% |
| $15,000 to $24,999 | 713 | 6.5% |
| $25,000 to $34,999 | 680 | 6.2% |
| $35,000 to $49,999 | 702 | 6.4% |
| $50,000 to $74,999 | 1,645 | 15.0% |
| $75,000 to $99,999 | 1,371 | 12.5% |
| $100,000 to $149,999 | 2,413 | 22.0% |
| $150,000 to $199,999 | 1,667 | 15.2% |
| $200,000+ | 1,229 | 11.2% |
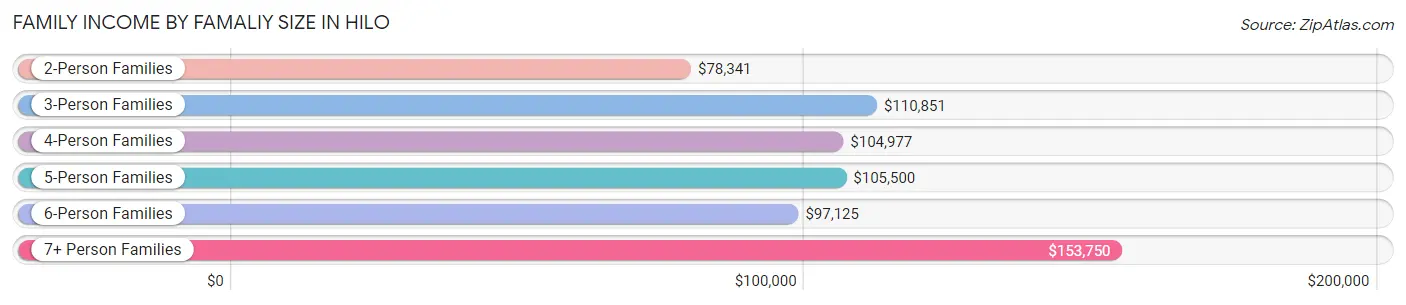
Family Income by Famaliy Size in Hilo
7+ person families (419 | 3.8%) account for the highest median family income in Hilo with $153,750 per family, while 2-person families (4,927 | 44.9%) have the highest median income of $39,170 per family member.
| Income Bracket | # Families | Median Income |
| 2-Person Families | 4,927 (44.9%) | $78,341 |
| 3-Person Families | 2,653 (24.2%) | $110,851 |
| 4-Person Families | 1,942 (17.7%) | $104,977 |
| 5-Person Families | 796 (7.3%) | $105,500 |
| 6-Person Families | 232 (2.1%) | $97,125 |
| 7+ Person Families | 419 (3.8%) | $153,750 |
| Total | 10,969 (100.0%) | $98,243 |
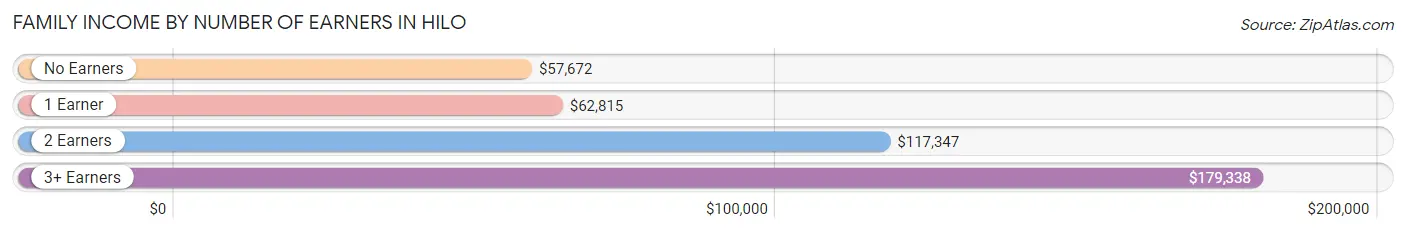
Family Income by Number of Earners in Hilo
The median family income in Hilo is $98,243, with families comprising 3+ earners (1,307) having the highest median family income of $179,338, while families with no earners (1,877) have the lowest median family income of $57,672, accounting for 11.9% and 17.1% of families, respectively.
| Number of Earners | # Families | Median Income |
| No Earners | 1,877 (17.1%) | $57,672 |
| 1 Earner | 3,535 (32.2%) | $62,815 |
| 2 Earners | 4,250 (38.8%) | $117,347 |
| 3+ Earners | 1,307 (11.9%) | $179,338 |
| Total | 10,969 (100.0%) | $98,243 |
Household Income in Hilo
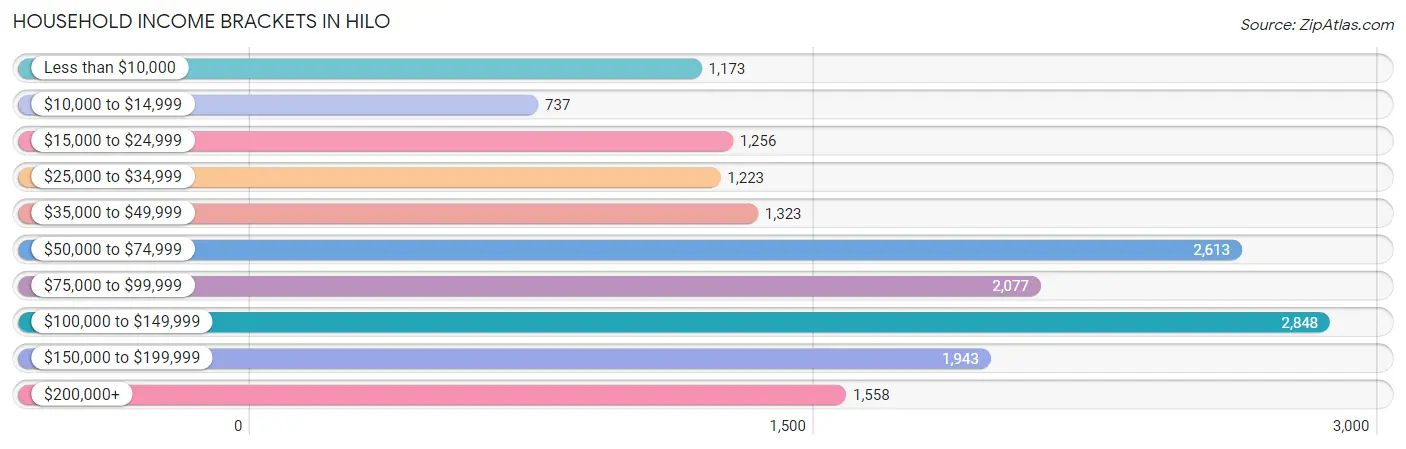
Household Income Brackets in Hilo
With 2,848 households falling in the category, the $100,000 to $149,999 income range is the most frequent in Hilo, accounting for 17.0% of all households. In contrast, only 737 households (4.4%) fall into the $10,000 to $14,999 income bracket, making it the least populous group.
| Income Bracket | # Households | % Households |
| Less than $10,000 | 1,173 | 7.0% |
| $10,000 to $14,999 | 737 | 4.4% |
| $15,000 to $24,999 | 1,256 | 7.5% |
| $25,000 to $34,999 | 1,223 | 7.3% |
| $35,000 to $49,999 | 1,323 | 7.9% |
| $50,000 to $74,999 | 2,613 | 15.6% |
| $75,000 to $99,999 | 2,077 | 12.4% |
| $100,000 to $149,999 | 2,848 | 17.0% |
| $150,000 to $199,999 | 1,943 | 11.6% |
| $200,000+ | 1,558 | 9.3% |
Household Income by Householder Age in Hilo
The median household income in Hilo is $75,589, with the highest median household income of $97,906 found in the 45 to 64 years age bracket for the primary householder. A total of 5,627 households (33.6%) fall into this category. Meanwhile, the 15 to 24 years age bracket for the primary householder has the lowest median household income of $0, with 532 households (3.2%) in this group.
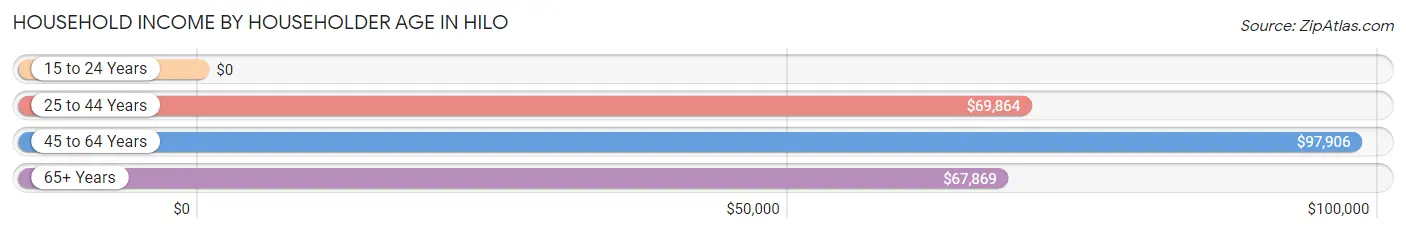
| Income Bracket | # Households | Median Income |
| 15 to 24 Years | 532 (3.2%) | $0 |
| 25 to 44 Years | 4,255 (25.4%) | $69,864 |
| 45 to 64 Years | 5,627 (33.6%) | $97,906 |
| 65+ Years | 6,338 (37.8%) | $67,869 |
| Total | 16,752 (100.0%) | $75,589 |
Poverty in Hilo
Income Below Poverty by Sex and Age in Hilo
With 14.4% poverty level for males and 15.2% for females among the residents of Hilo, 5 year old males and under 5 year old females are the most vulnerable to poverty, with 100 males (51.0%) and 349 females (42.2%) in their respective age groups living below the poverty level.
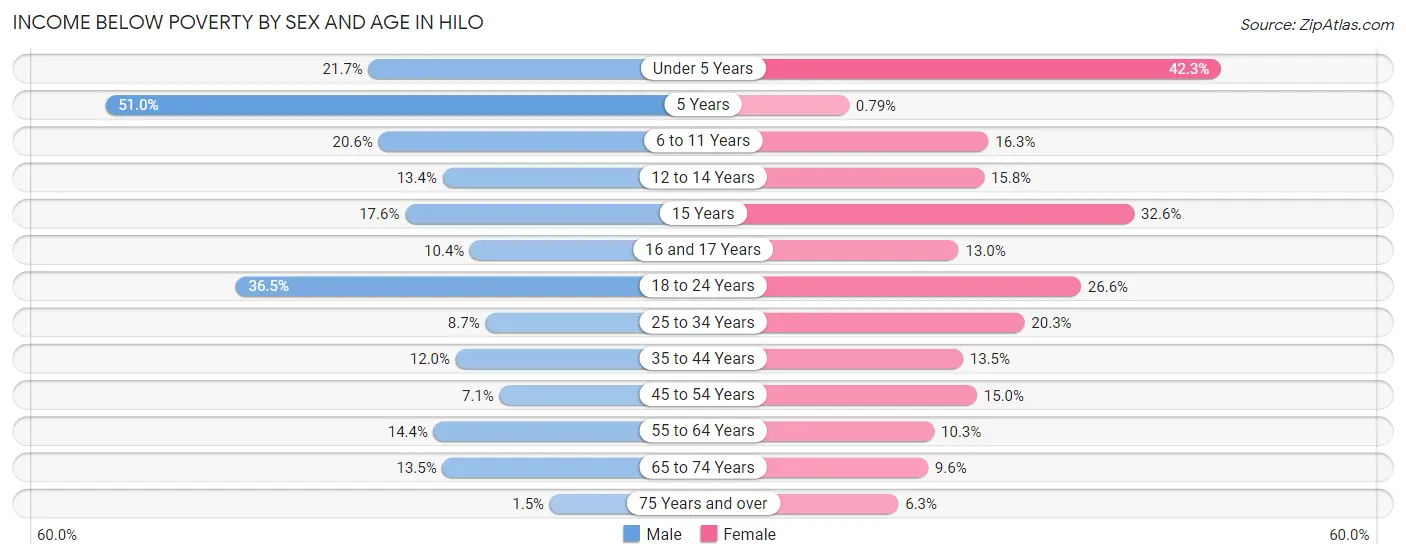
| Age Bracket | Male | Female |
| Under 5 Years | 256 (21.7%) | 349 (42.2%) |
| 5 Years | 100 (51.0%) | 1 (0.8%) |
| 6 to 11 Years | 419 (20.6%) | 286 (16.3%) |
| 12 to 14 Years | 141 (13.4%) | 152 (15.8%) |
| 15 Years | 59 (17.6%) | 112 (32.6%) |
| 16 and 17 Years | 54 (10.4%) | 70 (13.0%) |
| 18 to 24 Years | 680 (36.5%) | 501 (26.6%) |
| 25 to 34 Years | 245 (8.7%) | 590 (20.3%) |
| 35 to 44 Years | 354 (12.0%) | 408 (13.5%) |
| 45 to 54 Years | 154 (7.1%) | 383 (15.0%) |
| 55 to 64 Years | 399 (14.4%) | 350 (10.3%) |
| 65 to 74 Years | 365 (13.5%) | 290 (9.6%) |
| 75 Years and over | 29 (1.5%) | 170 (6.3%) |
| Total | 3,255 (14.4%) | 3,662 (15.2%) |
Income Above Poverty by Sex and Age in Hilo
According to the poverty statistics in Hilo, males aged 75 years and over and females aged 5 years are the age groups that are most secure financially, with 98.5% of males and 99.2% of females in these age groups living above the poverty line.
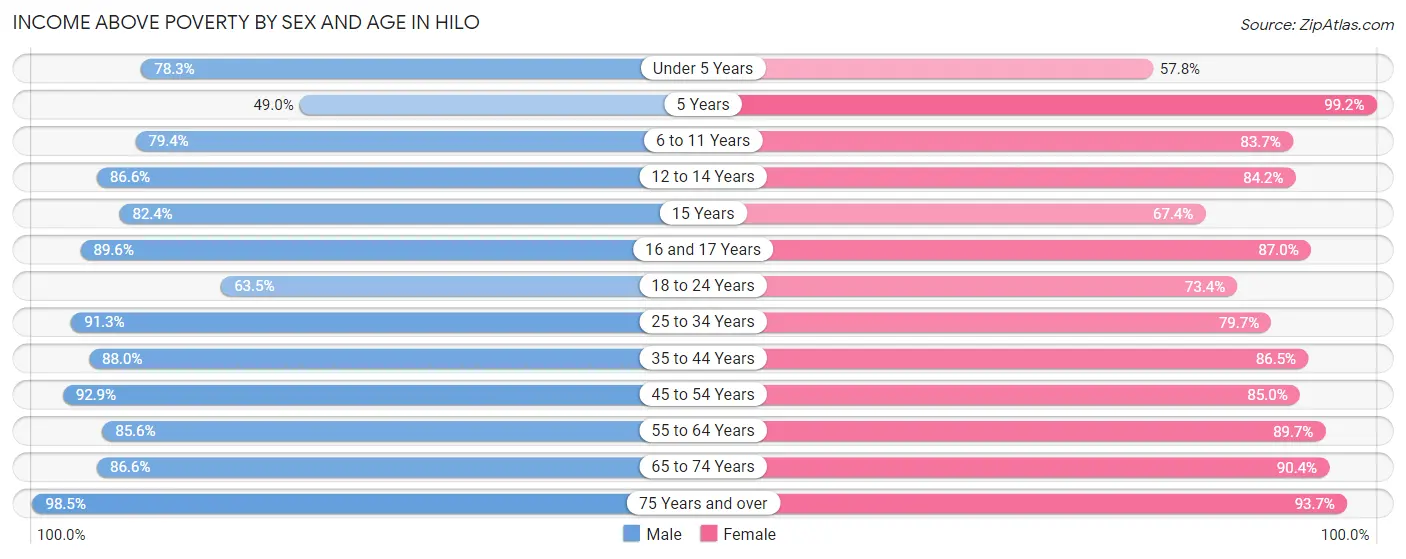
| Age Bracket | Male | Female |
| Under 5 Years | 925 (78.3%) | 477 (57.8%) |
| 5 Years | 96 (49.0%) | 125 (99.2%) |
| 6 to 11 Years | 1,618 (79.4%) | 1,466 (83.7%) |
| 12 to 14 Years | 909 (86.6%) | 808 (84.2%) |
| 15 Years | 276 (82.4%) | 232 (67.4%) |
| 16 and 17 Years | 466 (89.6%) | 468 (87.0%) |
| 18 to 24 Years | 1,183 (63.5%) | 1,380 (73.4%) |
| 25 to 34 Years | 2,582 (91.3%) | 2,310 (79.7%) |
| 35 to 44 Years | 2,604 (88.0%) | 2,618 (86.5%) |
| 45 to 54 Years | 2,019 (92.9%) | 2,164 (85.0%) |
| 55 to 64 Years | 2,367 (85.6%) | 3,055 (89.7%) |
| 65 to 74 Years | 2,348 (86.6%) | 2,733 (90.4%) |
| 75 Years and over | 1,913 (98.5%) | 2,533 (93.7%) |
| Total | 19,306 (85.6%) | 20,369 (84.8%) |
Income Below Poverty Among Married-Couple Families in Hilo
The poverty statistics for married-couple families in Hilo show that 3.7% or 274 of the total 7,441 families live below the poverty line. Families with 5 or more children have the highest poverty rate of 47.1%, comprising of 40 families. On the other hand, families with 1 or 2 children have the lowest poverty rate of 2.7%, which includes 57 families.
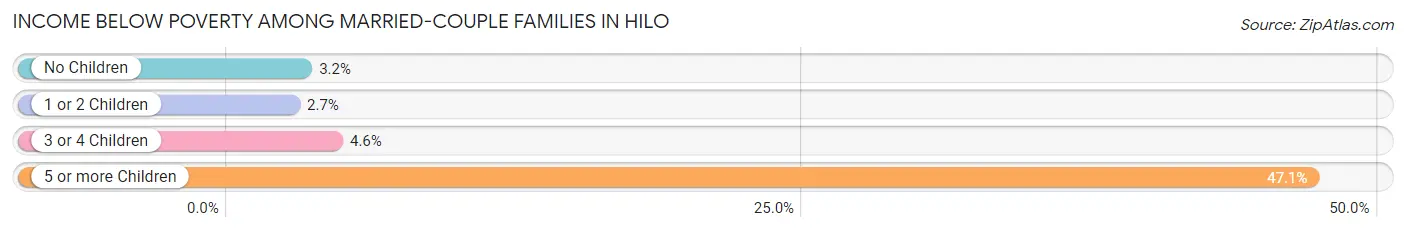
| Children | Above Poverty | Below Poverty |
| No Children | 4,522 (96.8%) | 151 (3.2%) |
| 1 or 2 Children | 2,057 (97.3%) | 57 (2.7%) |
| 3 or 4 Children | 543 (95.4%) | 26 (4.6%) |
| 5 or more Children | 45 (52.9%) | 40 (47.1%) |
| Total | 7,167 (96.3%) | 274 (3.7%) |
Income Below Poverty Among Single-Parent Households in Hilo
According to the poverty data in Hilo, 18.6% or 165 single-father households and 26.0% or 688 single-mother households are living below the poverty line. Among single-father households, those with 3 or 4 children have the highest poverty rate, with 68 households (48.9%) experiencing poverty. Likewise, among single-mother households, those with 5 or more children have the highest poverty rate, with 33 households (100.0%) falling below the poverty line.
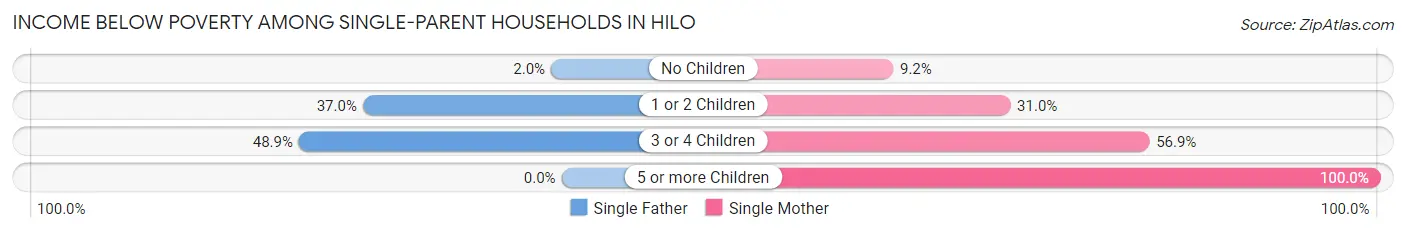
| Children | Single Father | Single Mother |
| No Children | 10 (2.0%) | 99 (9.2%) |
| 1 or 2 Children | 87 (37.0%) | 379 (31.0%) |
| 3 or 4 Children | 68 (48.9%) | 177 (56.9%) |
| 5 or more Children | 0 (0.0%) | 33 (100.0%) |
| Total | 165 (18.6%) | 688 (26.0%) |
Income Below Poverty Among Married-Couple vs Single-Parent Households in Hilo
The poverty data for Hilo shows that 274 of the married-couple family households (3.7%) and 853 of the single-parent households (24.2%) are living below the poverty level. Within the married-couple family households, those with 5 or more children have the highest poverty rate, with 40 households (47.1%) falling below the poverty line. Among the single-parent households, those with 5 or more children have the highest poverty rate, with 33 household (91.7%) living below poverty.
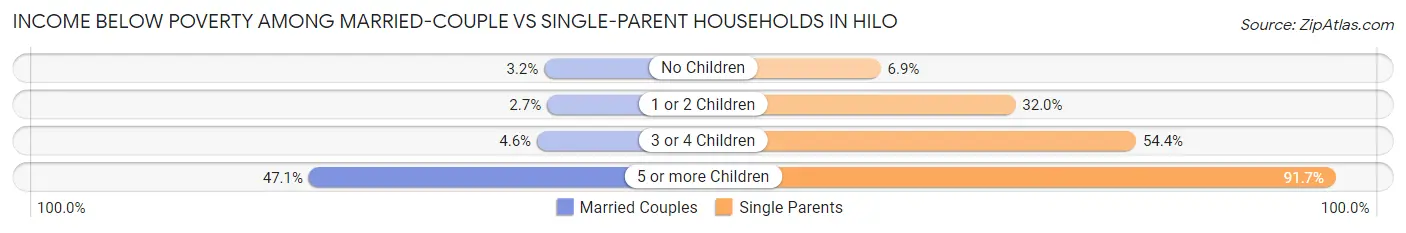
| Children | Married-Couple Families | Single-Parent Households |
| No Children | 151 (3.2%) | 109 (6.9%) |
| 1 or 2 Children | 57 (2.7%) | 466 (32.0%) |
| 3 or 4 Children | 26 (4.6%) | 245 (54.4%) |
| 5 or more Children | 40 (47.1%) | 33 (91.7%) |
| Total | 274 (3.7%) | 853 (24.2%) |
Race in Hilo
The most populous races in Hilo are Two or more Races (18,202 | 38.2%), Asian (14,840 | 31.2%), and White / Caucasian (8,150 | 17.1%).
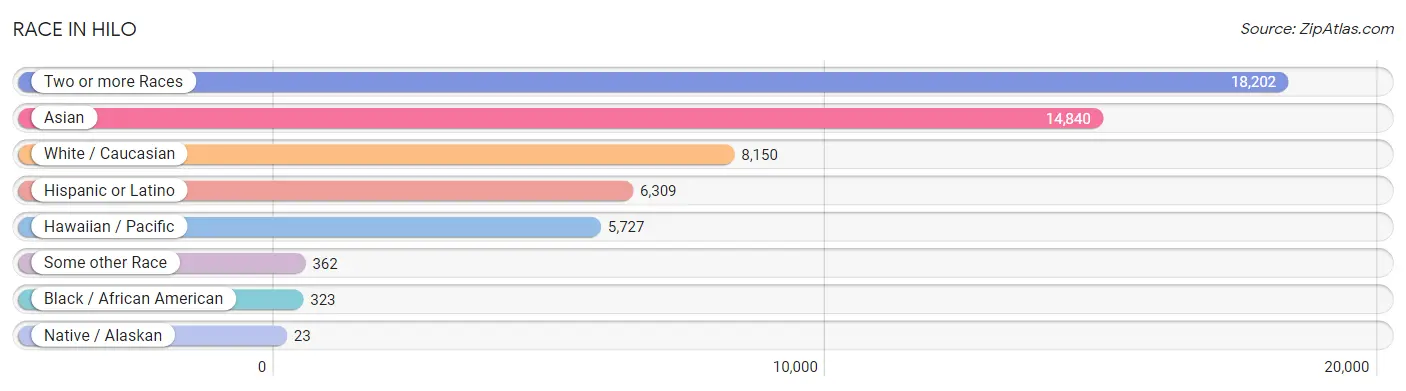
| Race | # Population | % Population |
| Asian | 14,840 | 31.2% |
| Black / African American | 323 | 0.7% |
| Hawaiian / Pacific | 5,727 | 12.0% |
| Hispanic or Latino | 6,309 | 13.3% |
| Native / Alaskan | 23 | 0.1% |
| White / Caucasian | 8,150 | 17.1% |
| Two or more Races | 18,202 | 38.2% |
| Some other Race | 362 | 0.8% |
| Total | 47,627 | 100.0% |
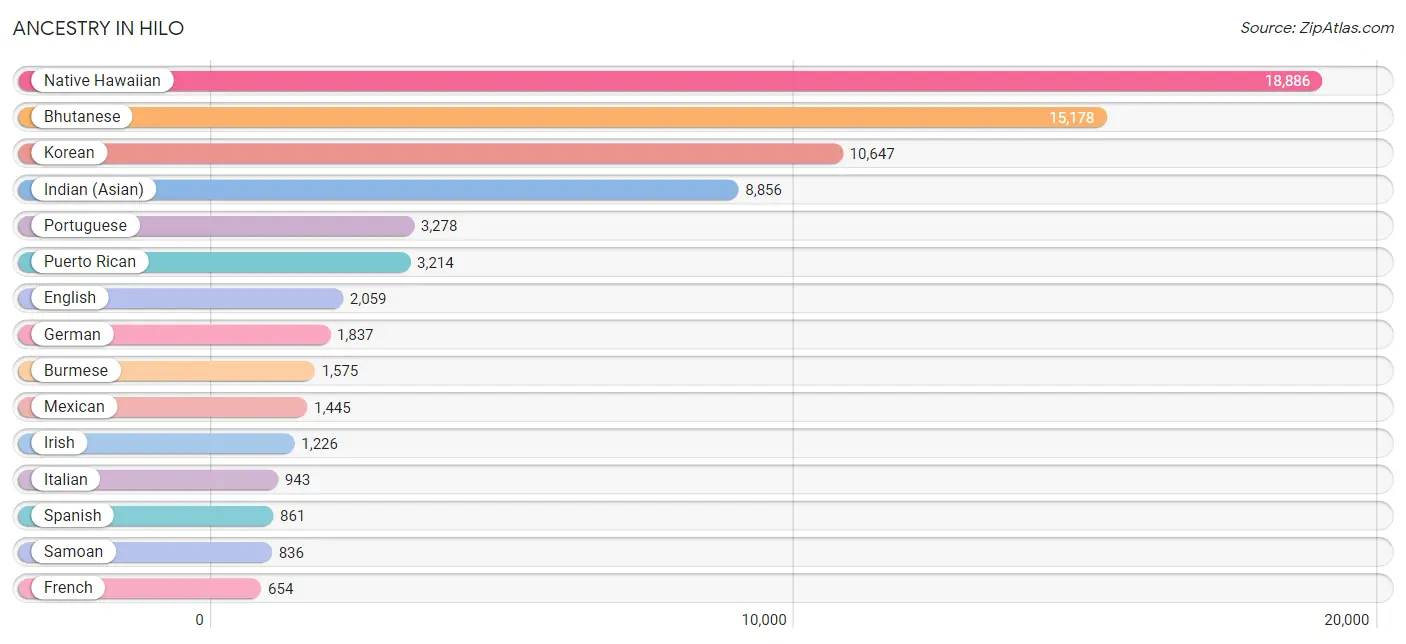
Ancestry in Hilo
The most populous ancestries reported in Hilo are Native Hawaiian (18,886 | 39.7%), Bhutanese (15,178 | 31.9%), Korean (10,647 | 22.4%), Indian (Asian) (8,856 | 18.6%), and Portuguese (3,278 | 6.9%), together accounting for 119.3% of all Hilo residents.
| Ancestry | # Population | % Population |
| African | 90 | 0.2% |
| Alaska Native | 6 | 0.0% |
| Alaskan Athabascan | 22 | 0.1% |
| Alsatian | 9 | 0.0% |
| American | 349 | 0.7% |
| Apache | 134 | 0.3% |
| Arab | 9 | 0.0% |
| Armenian | 15 | 0.0% |
| Australian | 39 | 0.1% |
| Austrian | 7 | 0.0% |
| Basque | 3 | 0.0% |
| Belgian | 3 | 0.0% |
| Bhutanese | 15,178 | 31.9% |
| Blackfeet | 41 | 0.1% |
| British | 127 | 0.3% |
| Burmese | 1,575 | 3.3% |
| Cambodian | 1 | 0.0% |
| Canadian | 34 | 0.1% |
| Central American | 57 | 0.1% |
| Central American Indian | 40 | 0.1% |
| Cherokee | 541 | 1.1% |
| Cheyenne | 38 | 0.1% |
| Chickasaw | 33 | 0.1% |
| Chinese | 269 | 0.6% |
| Chippewa | 16 | 0.0% |
| Choctaw | 38 | 0.1% |
| Colombian | 18 | 0.0% |
| Comanche | 10 | 0.0% |
| Costa Rican | 22 | 0.1% |
| Cree | 7 | 0.0% |
| Croatian | 10 | 0.0% |
| Cuban | 9 | 0.0% |
| Czech | 86 | 0.2% |
| Czechoslovakian | 3 | 0.0% |
| Danish | 44 | 0.1% |
| Dutch | 136 | 0.3% |
| Eastern European | 12 | 0.0% |
| English | 2,059 | 4.3% |
| European | 637 | 1.3% |
| Fijian | 164 | 0.3% |
| Filipino | 53 | 0.1% |
| Finnish | 65 | 0.1% |
| French | 654 | 1.4% |
| French American Indian | 7 | 0.0% |
| French Canadian | 239 | 0.5% |
| German | 1,837 | 3.9% |
| Greek | 131 | 0.3% |
| Guamanian / Chamorro | 125 | 0.3% |
| Haitian | 8 | 0.0% |
| Hungarian | 46 | 0.1% |
| Indian (Asian) | 8,856 | 18.6% |
| Indonesian | 46 | 0.1% |
| Inupiat | 12 | 0.0% |
| Iranian | 88 | 0.2% |
| Irish | 1,226 | 2.6% |
| Italian | 943 | 2.0% |
| Jamaican | 5 | 0.0% |
| Japanese | 20 | 0.0% |
| Korean | 10,647 | 22.4% |
| Laotian | 293 | 0.6% |
| Lithuanian | 34 | 0.1% |
| Marshallese | 49 | 0.1% |
| Mexican | 1,445 | 3.0% |
| Mexican American Indian | 30 | 0.1% |
| Mongolian | 5 | 0.0% |
| Native Hawaiian | 18,886 | 39.7% |
| Navajo | 37 | 0.1% |
| New Zealander | 25 | 0.1% |
| Nicaraguan | 24 | 0.1% |
| Northern European | 54 | 0.1% |
| Norwegian | 355 | 0.7% |
| Pakistani | 93 | 0.2% |
| Pennsylvania German | 45 | 0.1% |
| Polish | 153 | 0.3% |
| Portuguese | 3,278 | 6.9% |
| Potawatomi | 44 | 0.1% |
| Puerto Rican | 3,214 | 6.8% |
| Romanian | 13 | 0.0% |
| Russian | 160 | 0.3% |
| Salvadoran | 11 | 0.0% |
| Samoan | 836 | 1.8% |
| Scandinavian | 32 | 0.1% |
| Scotch-Irish | 259 | 0.5% |
| Scottish | 467 | 1.0% |
| Shoshone | 1 | 0.0% |
| Sioux | 5 | 0.0% |
| Slavic | 3 | 0.0% |
| Slovak | 24 | 0.1% |
| South American | 32 | 0.1% |
| Spaniard | 587 | 1.2% |
| Spanish | 861 | 1.8% |
| Sri Lankan | 176 | 0.4% |
| Subsaharan African | 101 | 0.2% |
| Sudanese | 11 | 0.0% |
| Swedish | 235 | 0.5% |
| Swiss | 43 | 0.1% |
| Thai | 321 | 0.7% |
| Tlingit-Haida | 6 | 0.0% |
| Tongan | 105 | 0.2% |
| Tsimshian | 22 | 0.1% |
| Turkish | 38 | 0.1% |
| Ukrainian | 67 | 0.1% |
| Welsh | 287 | 0.6% |
| Yup'ik | 6 | 0.0% | View All 104 Rows |
Immigrants in Hilo
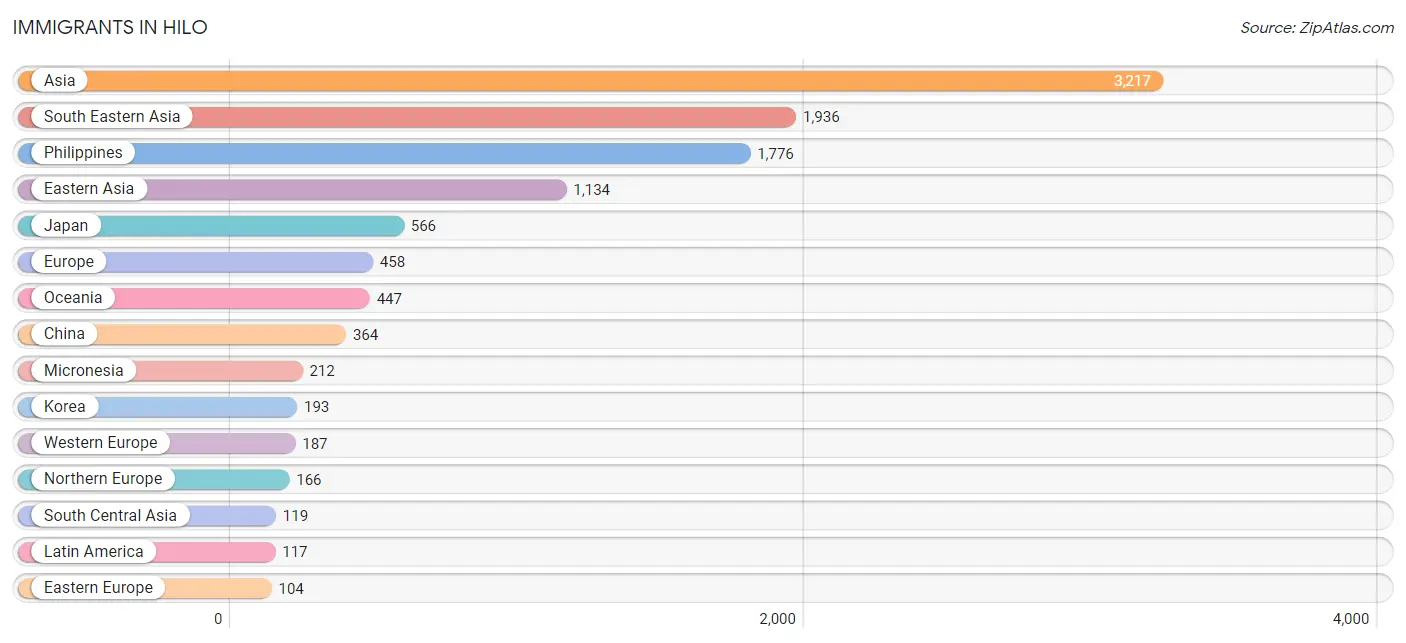
The most numerous immigrant groups reported in Hilo came from Asia (3,217 | 6.8%), South Eastern Asia (1,936 | 4.1%), Philippines (1,776 | 3.7%), Eastern Asia (1,134 | 2.4%), and Japan (566 | 1.2%), together accounting for 18.1% of all Hilo residents.
| Immigration Origin | # Population | % Population |
| Africa | 16 | 0.0% |
| Asia | 3,217 | 6.8% |
| Australia | 13 | 0.0% |
| Cambodia | 10 | 0.0% |
| Canada | 48 | 0.1% |
| Central America | 99 | 0.2% |
| China | 364 | 0.8% |
| Colombia | 18 | 0.0% |
| Croatia | 10 | 0.0% |
| Czechoslovakia | 20 | 0.0% |
| Eastern Africa | 9 | 0.0% |
| Eastern Asia | 1,134 | 2.4% |
| Eastern Europe | 104 | 0.2% |
| El Salvador | 11 | 0.0% |
| England | 15 | 0.0% |
| Europe | 458 | 1.0% |
| Fiji | 1 | 0.0% |
| France | 58 | 0.1% |
| Germany | 91 | 0.2% |
| Hong Kong | 63 | 0.1% |
| India | 61 | 0.1% |
| Indonesia | 42 | 0.1% |
| Iran | 58 | 0.1% |
| Japan | 566 | 1.2% |
| Korea | 193 | 0.4% |
| Latin America | 117 | 0.3% |
| Malaysia | 12 | 0.0% |
| Mexico | 88 | 0.2% |
| Micronesia | 212 | 0.4% |
| Netherlands | 38 | 0.1% |
| Northern Europe | 166 | 0.4% |
| Oceania | 447 | 0.9% |
| Philippines | 1,776 | 3.7% |
| Russia | 16 | 0.0% |
| Singapore | 12 | 0.0% |
| South Africa | 7 | 0.0% |
| South America | 18 | 0.0% |
| South Central Asia | 119 | 0.3% |
| South Eastern Asia | 1,936 | 4.1% |
| Southern Europe | 1 | 0.0% |
| Spain | 1 | 0.0% |
| Taiwan | 33 | 0.1% |
| Thailand | 63 | 0.1% |
| Ukraine | 58 | 0.1% |
| Vietnam | 21 | 0.0% |
| Western Asia | 28 | 0.1% |
| Western Europe | 187 | 0.4% | View All 47 Rows |
Sex and Age in Hilo
Sex and Age in Hilo
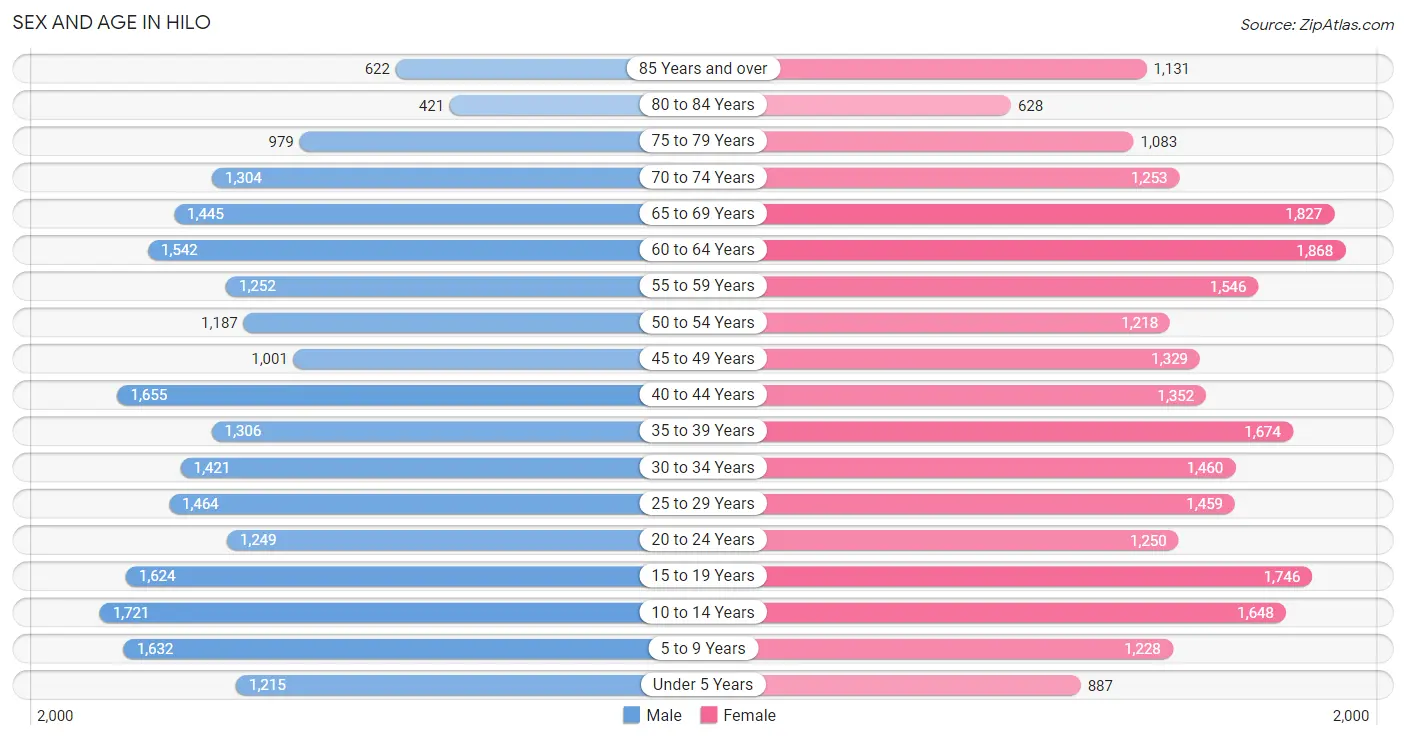
The most populous age groups in Hilo are 10 to 14 Years (1,721 | 7.5%) for men and 60 to 64 Years (1,868 | 7.6%) for women.
| Age Bracket | Male | Female |
| Under 5 Years | 1,215 (5.3%) | 887 (3.6%) |
| 5 to 9 Years | 1,632 (7.1%) | 1,228 (5.0%) |
| 10 to 14 Years | 1,721 (7.5%) | 1,648 (6.7%) |
| 15 to 19 Years | 1,624 (7.0%) | 1,746 (7.1%) |
| 20 to 24 Years | 1,249 (5.4%) | 1,250 (5.1%) |
| 25 to 29 Years | 1,464 (6.4%) | 1,459 (5.9%) |
| 30 to 34 Years | 1,421 (6.2%) | 1,460 (5.9%) |
| 35 to 39 Years | 1,306 (5.7%) | 1,674 (6.8%) |
| 40 to 44 Years | 1,655 (7.2%) | 1,352 (5.5%) |
| 45 to 49 Years | 1,001 (4.3%) | 1,329 (5.4%) |
| 50 to 54 Years | 1,187 (5.1%) | 1,218 (5.0%) |
| 55 to 59 Years | 1,252 (5.4%) | 1,546 (6.3%) |
| 60 to 64 Years | 1,542 (6.7%) | 1,868 (7.6%) |
| 65 to 69 Years | 1,445 (6.3%) | 1,827 (7.4%) |
| 70 to 74 Years | 1,304 (5.7%) | 1,253 (5.1%) |
| 75 to 79 Years | 979 (4.3%) | 1,083 (4.4%) |
| 80 to 84 Years | 421 (1.8%) | 628 (2.5%) |
| 85 Years and over | 622 (2.7%) | 1,131 (4.6%) |
| Total | 23,040 (100.0%) | 24,587 (100.0%) |
Families and Households in Hilo
Median Family Size in Hilo
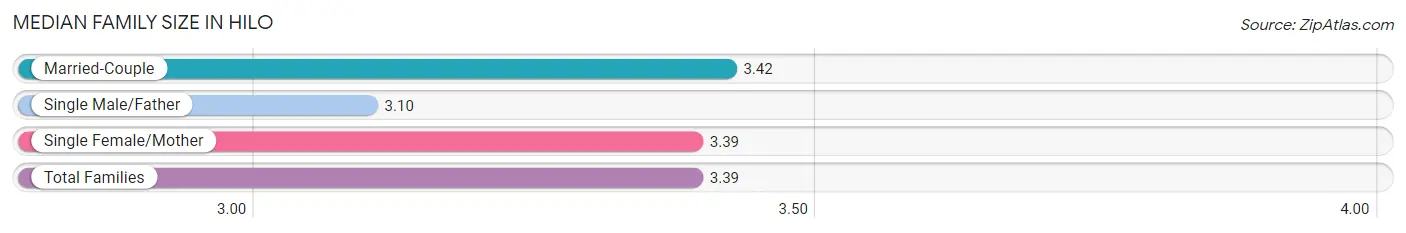
The median family size in Hilo is 3.39 persons per family, with married-couple families (7,441 | 67.8%) accounting for the largest median family size of 3.42 persons per family. On the other hand, single male/father families (886 | 8.1%) represent the smallest median family size with 3.10 persons per family.
| Family Type | # Families | Family Size |
| Married-Couple | 7,441 (67.8%) | 3.42 |
| Single Male/Father | 886 (8.1%) | 3.10 |
| Single Female/Mother | 2,642 (24.1%) | 3.39 |
| Total Families | 10,969 (100.0%) | 3.39 |
Median Household Size in Hilo
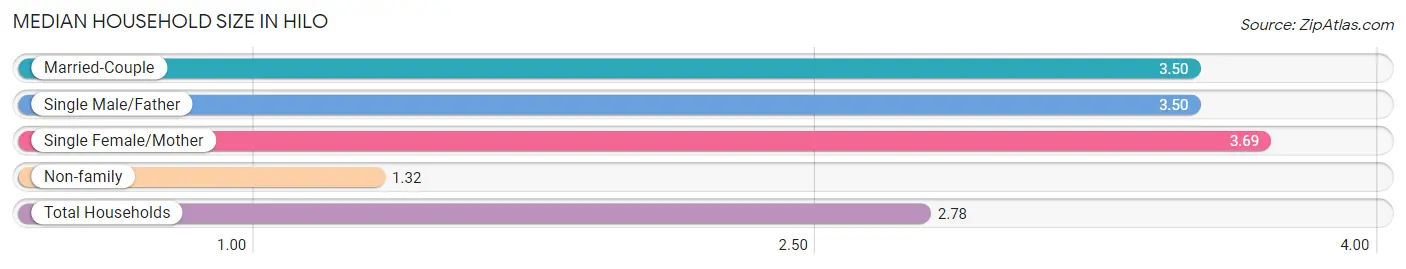
The median household size in Hilo is 2.78 persons per household, with single female/mother households (2,642 | 15.8%) accounting for the largest median household size of 3.69 persons per household. non-family households (5,783 | 34.5%) represent the smallest median household size with 1.32 persons per household.
| Household Type | # Households | Household Size |
| Married-Couple | 7,441 (44.4%) | 3.50 |
| Single Male/Father | 886 (5.3%) | 3.50 |
| Single Female/Mother | 2,642 (15.8%) | 3.69 |
| Non-family | 5,783 (34.5%) | 1.32 |
| Total Households | 16,752 (100.0%) | 2.78 |
Household Size by Marriage Status in Hilo
Out of a total of 16,752 households in Hilo, 10,969 (65.5%) are family households, while 5,783 (34.5%) are nonfamily households. The most numerous type of family households are 2-person households, comprising 4,564, and the most common type of nonfamily households are 1-person households, comprising 4,457.
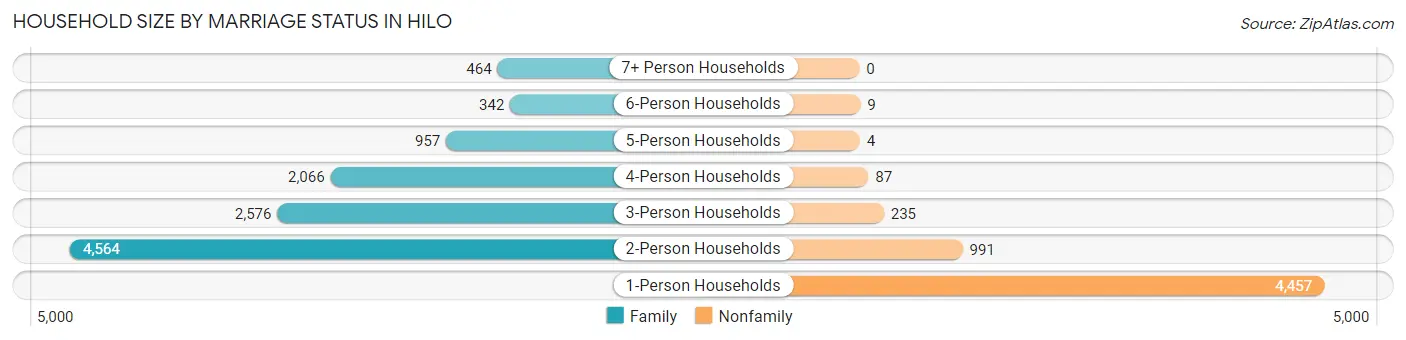
| Household Size | Family Households | Nonfamily Households |
| 1-Person Households | - | 4,457 (26.6%) |
| 2-Person Households | 4,564 (27.2%) | 991 (5.9%) |
| 3-Person Households | 2,576 (15.4%) | 235 (1.4%) |
| 4-Person Households | 2,066 (12.3%) | 87 (0.5%) |
| 5-Person Households | 957 (5.7%) | 4 (0.0%) |
| 6-Person Households | 342 (2.0%) | 9 (0.1%) |
| 7+ Person Households | 464 (2.8%) | 0 (0.0%) |
| Total | 10,969 (65.5%) | 5,783 (34.5%) |
Female Fertility in Hilo
Fertility by Age in Hilo
Average fertility rate in Hilo is 53.0 births per 1,000 women. Women in the age bracket of 20 to 34 years have the highest fertility rate with 90.0 births per 1,000 women. Women in the age bracket of 20 to 34 years acount for 67.5% of all women with births.
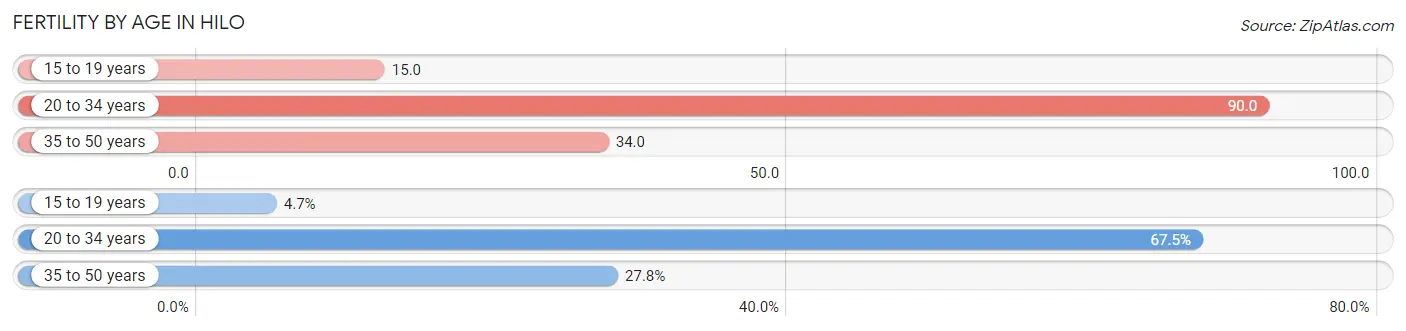
| Age Bracket | Women with Births | Births / 1,000 Women |
| 15 to 19 years | 26 (4.7%) | 15.0 |
| 20 to 34 years | 376 (67.5%) | 90.0 |
| 35 to 50 years | 155 (27.8%) | 34.0 |
| Total | 557 (100.0%) | 53.0 |
Fertility by Age by Marriage Status in Hilo
37.7% of women with births (557) in Hilo are married. The highest percentage of unmarried women with births falls into 15 to 19 years age bracket with 100.0% of them unmarried at the time of birth, while the lowest percentage of unmarried women with births belong to 35 to 50 years age bracket with 29.7% of them unmarried.
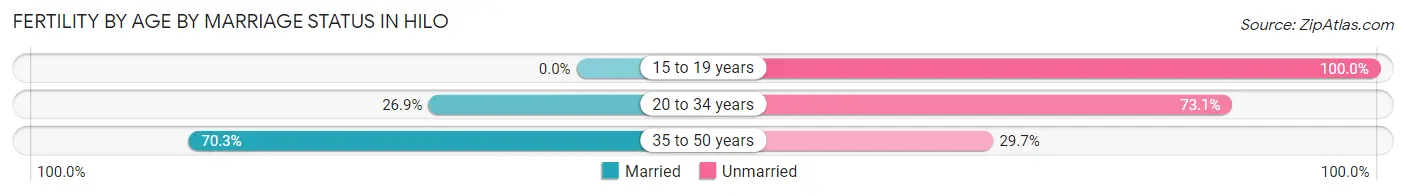
| Age Bracket | Married | Unmarried |
| 15 to 19 years | 0 (0.0%) | 26 (100.0%) |
| 20 to 34 years | 101 (26.9%) | 275 (73.1%) |
| 35 to 50 years | 109 (70.3%) | 46 (29.7%) |
| Total | 210 (37.7%) | 347 (62.3%) |
Fertility by Education in Hilo
Average fertility rate in Hilo is 53.0 births per 1,000 women. Women with the education attainment of less than high school have the highest fertility rate of 86.0 births per 1,000 women, while women with the education attainment of college or associate's degree have the lowest fertility at 29.0 births per 1,000 women. Women with the education attainment of high school diploma represent 32.7% of all women with births.
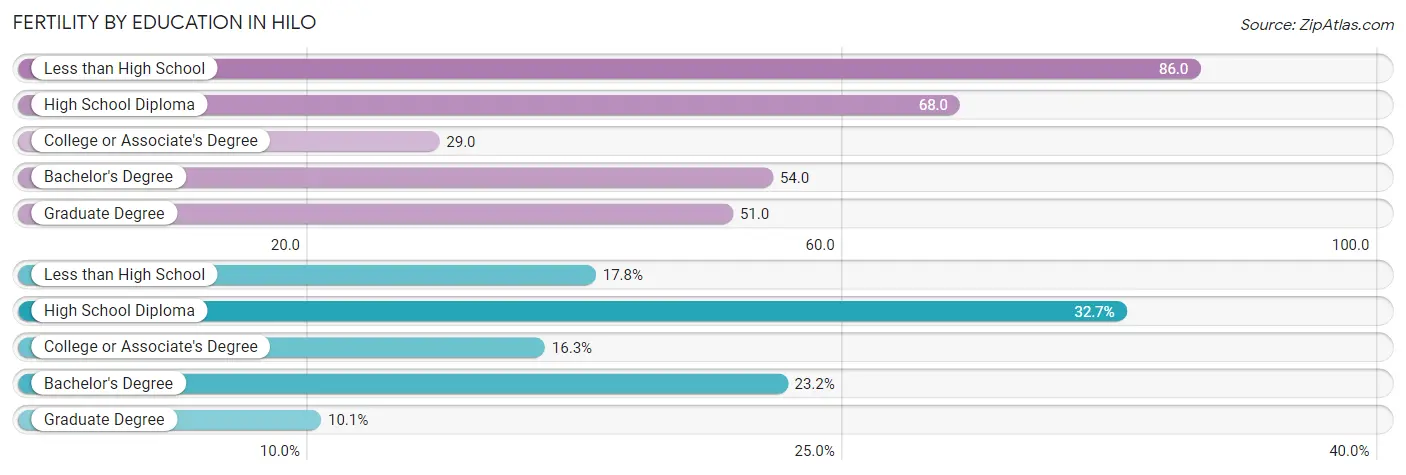
| Educational Attainment | Women with Births | Births / 1,000 Women |
| Less than High School | 99 (17.8%) | 86.0 |
| High School Diploma | 182 (32.7%) | 68.0 |
| College or Associate's Degree | 91 (16.3%) | 29.0 |
| Bachelor's Degree | 129 (23.2%) | 54.0 |
| Graduate Degree | 56 (10.1%) | 51.0 |
| Total | 557 (100.0%) | 53.0 |
Fertility by Education by Marriage Status in Hilo
62.3% of women with births in Hilo are unmarried. Women with the educational attainment of graduate degree are most likely to be married with 94.6% of them married at childbirth, while women with the educational attainment of high school diploma are least likely to be married with 88.5% of them unmarried at childbirth.
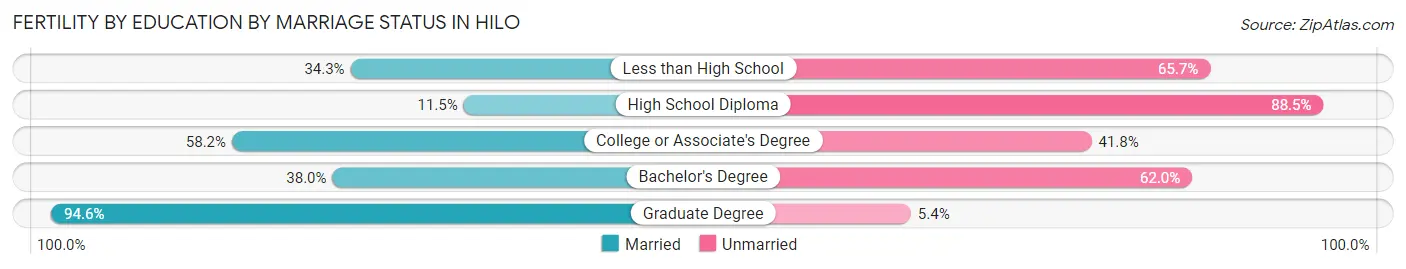
| Educational Attainment | Married | Unmarried |
| Less than High School | 34 (34.3%) | 65 (65.7%) |
| High School Diploma | 21 (11.5%) | 161 (88.5%) |
| College or Associate's Degree | 53 (58.2%) | 38 (41.8%) |
| Bachelor's Degree | 49 (38.0%) | 80 (62.0%) |
| Graduate Degree | 53 (94.6%) | 3 (5.4%) |
| Total | 210 (37.7%) | 347 (62.3%) |
Employment Characteristics in Hilo
Employment by Class of Employer in Hilo
Among the 20,565 employed individuals in Hilo, private company employees (10,844 | 52.7%), state government employees (2,832 | 13.8%), and local government employees (1,891 | 9.2%) make up the most common classes of employment.
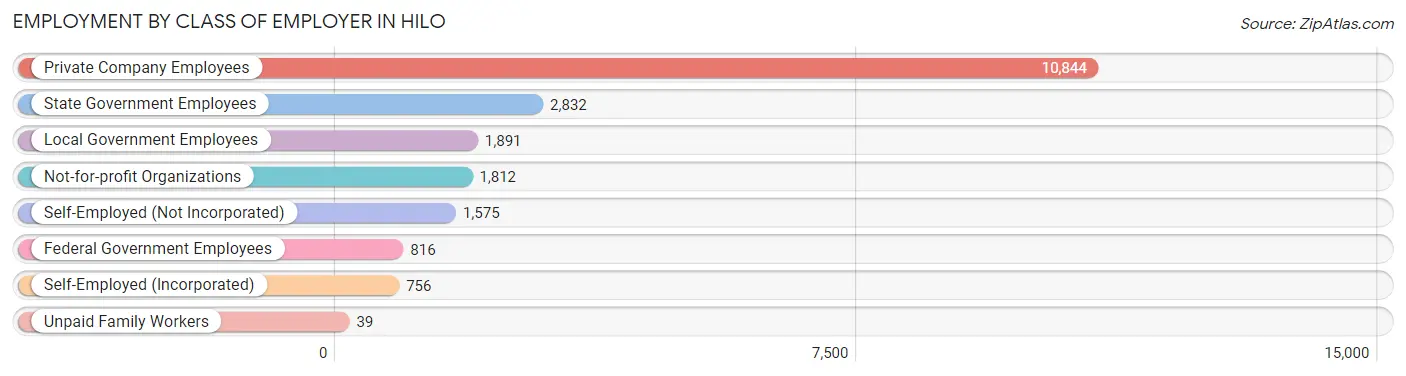
| Employer Class | # Employees | % Employees |
| Private Company Employees | 10,844 | 52.7% |
| Self-Employed (Incorporated) | 756 | 3.7% |
| Self-Employed (Not Incorporated) | 1,575 | 7.7% |
| Not-for-profit Organizations | 1,812 | 8.8% |
| Local Government Employees | 1,891 | 9.2% |
| State Government Employees | 2,832 | 13.8% |
| Federal Government Employees | 816 | 4.0% |
| Unpaid Family Workers | 39 | 0.2% |
| Total | 20,565 | 100.0% |
Employment Status by Age in Hilo
According to the labor force statistics for Hilo, out of the total population over 16 years of age (38,617), 58.8% or 22,707 individuals are in the labor force, with 6.8% or 1,544 of them unemployed. The age group with the highest labor force participation rate is 35 to 44 years, with 84.2% or 5,041 individuals in the labor force. Within the labor force, the 16 to 19 years age range has the highest percentage of unemployed individuals, with 29.7% or 226 of them being unemployed.
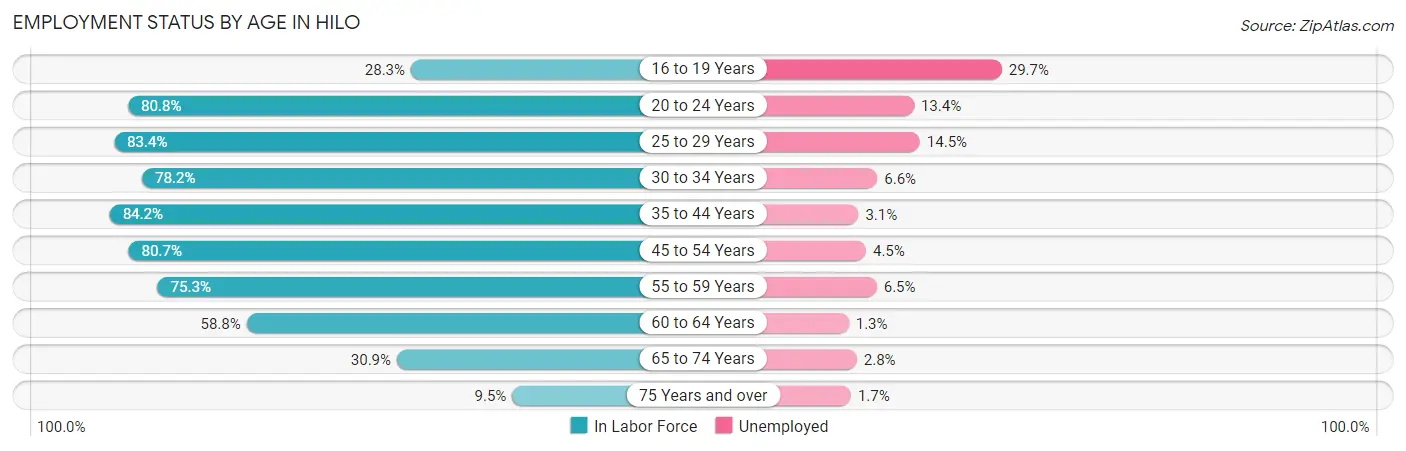
| Age Bracket | In Labor Force | Unemployed |
| 16 to 19 Years | 762 (28.3%) | 226 (29.7%) |
| 20 to 24 Years | 2,019 (80.8%) | 271 (13.4%) |
| 25 to 29 Years | 2,438 (83.4%) | 354 (14.5%) |
| 30 to 34 Years | 2,253 (78.2%) | 149 (6.6%) |
| 35 to 44 Years | 5,041 (84.2%) | 156 (3.1%) |
| 45 to 54 Years | 3,821 (80.7%) | 172 (4.5%) |
| 55 to 59 Years | 2,107 (75.3%) | 137 (6.5%) |
| 60 to 64 Years | 2,005 (58.8%) | 26 (1.3%) |
| 65 to 74 Years | 1,801 (30.9%) | 50 (2.8%) |
| 75 Years and over | 462 (9.5%) | 8 (1.7%) |
| Total | 22,707 (58.8%) | 1,544 (6.8%) |
Employment Status by Educational Attainment in Hilo
According to labor force statistics for Hilo, 77.7% of individuals (17,664) out of the total population between 25 and 64 years of age (22,734) are in the labor force, with 5.6% or 989 of them being unemployed. The group with the highest labor force participation rate are those with the educational attainment of bachelor's degree or higher, with 86.1% or 6,899 individuals in the labor force. Within the labor force, individuals with less than high school education have the highest percentage of unemployment, with 13.2% or 65 of them being unemployed.
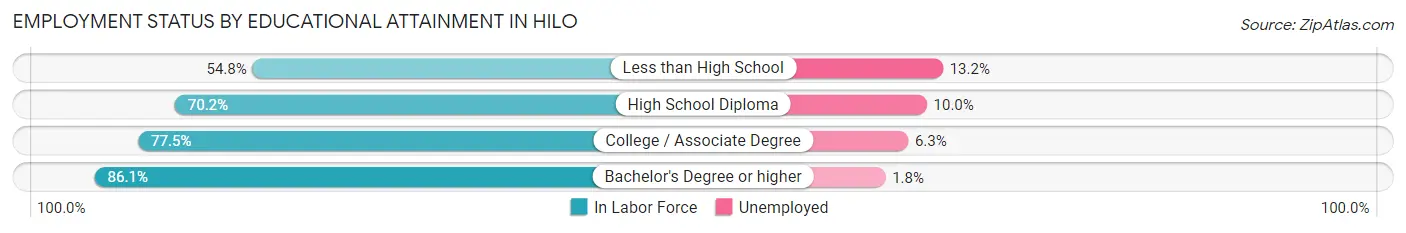
| Educational Attainment | In Labor Force | Unemployed |
| Less than High School | 491 (54.8%) | 118 (13.2%) |
| High School Diploma | 4,263 (70.2%) | 607 (10.0%) |
| College / Associate Degree | 6,009 (77.5%) | 488 (6.3%) |
| Bachelor's Degree or higher | 6,899 (86.1%) | 144 (1.8%) |
| Total | 17,664 (77.7%) | 1,273 (5.6%) |
Employment Occupations by Sex in Hilo
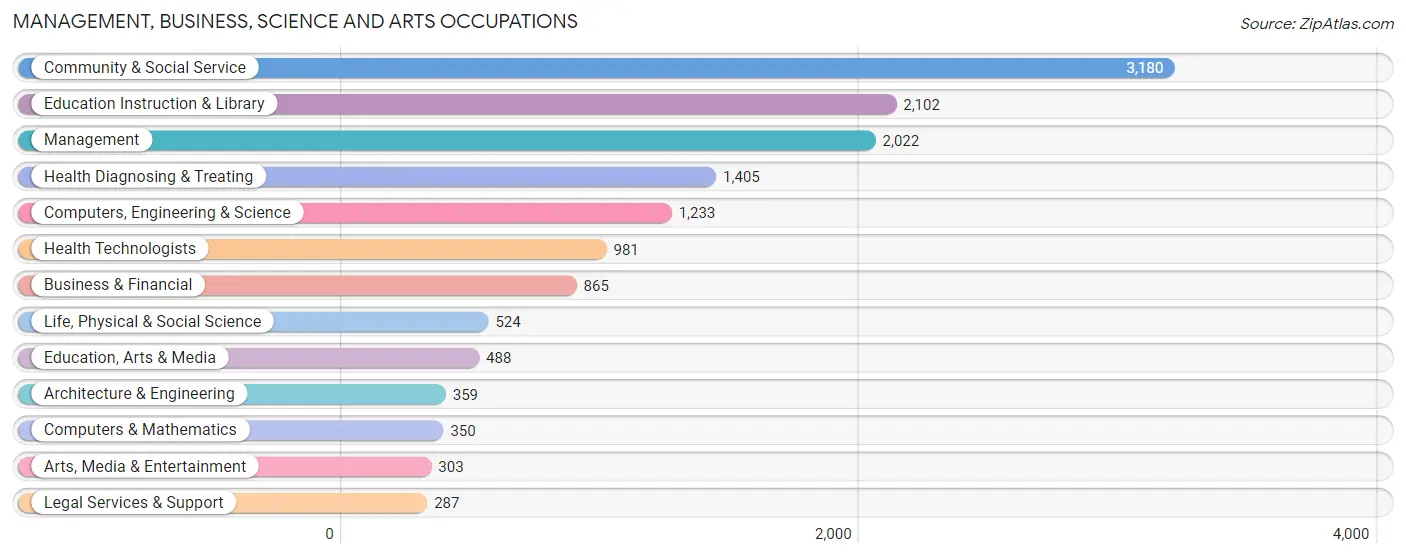
Management, Business, Science and Arts Occupations
The most common Management, Business, Science and Arts occupations in Hilo are Community & Social Service (3,180 | 15.1%), Education Instruction & Library (2,102 | 10.0%), Management (2,022 | 9.6%), Health Diagnosing & Treating (1,405 | 6.7%), and Computers, Engineering & Science (1,233 | 5.9%).
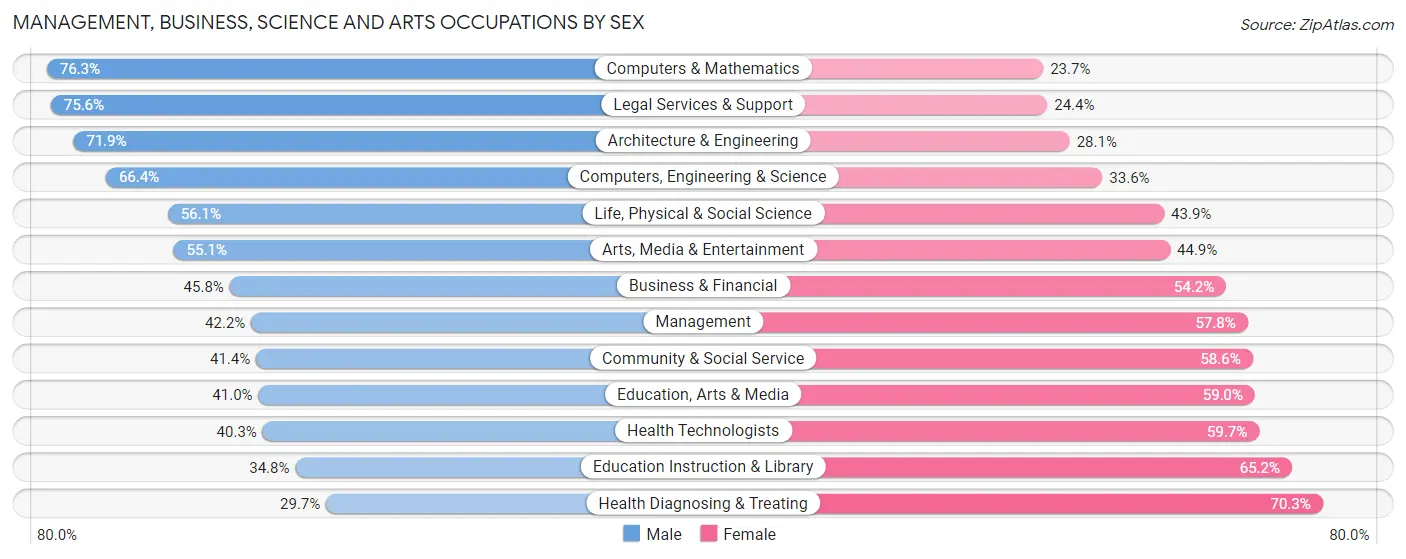
Management, Business, Science and Arts Occupations by Sex
Within the Management, Business, Science and Arts occupations in Hilo, the most male-oriented occupations are Computers & Mathematics (76.3%), Legal Services & Support (75.6%), and Architecture & Engineering (71.9%), while the most female-oriented occupations are Health Diagnosing & Treating (70.3%), Education Instruction & Library (65.2%), and Health Technologists (59.7%).
| Occupation | Male | Female |
| Management | 853 (42.2%) | 1,169 (57.8%) |
| Business & Financial | 396 (45.8%) | 469 (54.2%) |
| Computers, Engineering & Science | 819 (66.4%) | 414 (33.6%) |
| Computers & Mathematics | 267 (76.3%) | 83 (23.7%) |
| Architecture & Engineering | 258 (71.9%) | 101 (28.1%) |
| Life, Physical & Social Science | 294 (56.1%) | 230 (43.9%) |
| Community & Social Service | 1,316 (41.4%) | 1,864 (58.6%) |
| Education, Arts & Media | 200 (41.0%) | 288 (59.0%) |
| Legal Services & Support | 217 (75.6%) | 70 (24.4%) |
| Education Instruction & Library | 732 (34.8%) | 1,370 (65.2%) |
| Arts, Media & Entertainment | 167 (55.1%) | 136 (44.9%) |
| Health Diagnosing & Treating | 417 (29.7%) | 988 (70.3%) |
| Health Technologists | 395 (40.3%) | 586 (59.7%) |
| Total (Category) | 3,801 (43.7%) | 4,904 (56.3%) |
| Total (Overall) | 10,305 (48.8%) | 10,789 (51.1%) |
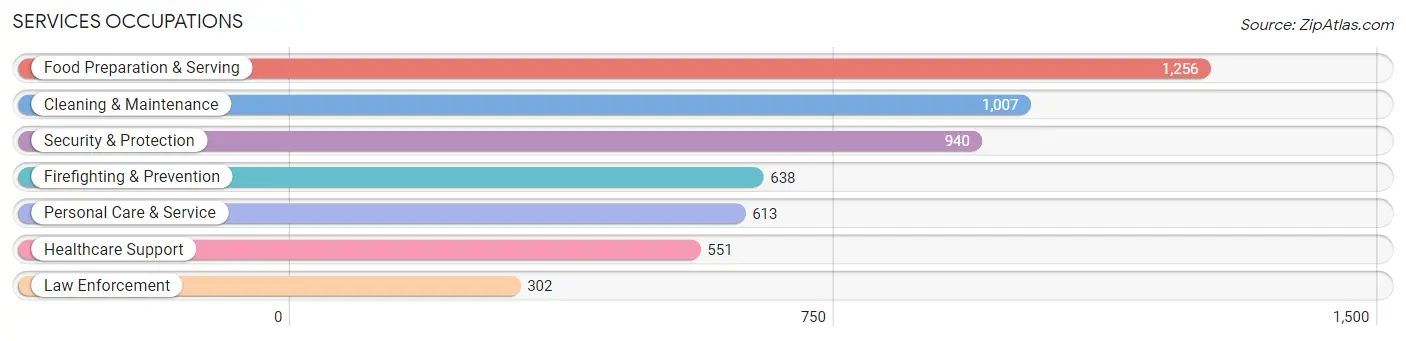
Services Occupations
The most common Services occupations in Hilo are Food Preparation & Serving (1,256 | 5.9%), Cleaning & Maintenance (1,007 | 4.8%), Security & Protection (940 | 4.5%), Firefighting & Prevention (638 | 3.0%), and Personal Care & Service (613 | 2.9%).
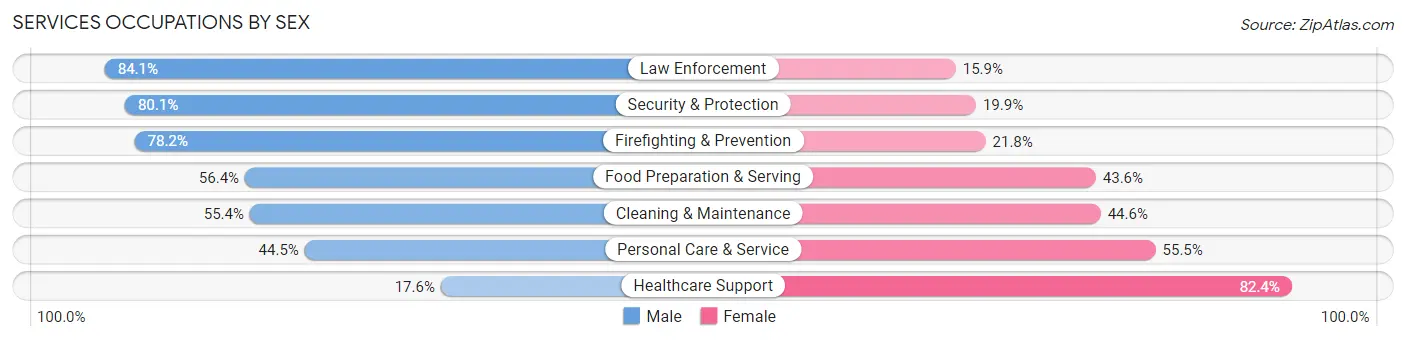
Services Occupations by Sex
Within the Services occupations in Hilo, the most male-oriented occupations are Law Enforcement (84.1%), Security & Protection (80.1%), and Firefighting & Prevention (78.2%), while the most female-oriented occupations are Healthcare Support (82.4%), Personal Care & Service (55.5%), and Cleaning & Maintenance (44.6%).
| Occupation | Male | Female |
| Healthcare Support | 97 (17.6%) | 454 (82.4%) |
| Security & Protection | 753 (80.1%) | 187 (19.9%) |
| Firefighting & Prevention | 499 (78.2%) | 139 (21.8%) |
| Law Enforcement | 254 (84.1%) | 48 (15.9%) |
| Food Preparation & Serving | 708 (56.4%) | 548 (43.6%) |
| Cleaning & Maintenance | 558 (55.4%) | 449 (44.6%) |
| Personal Care & Service | 273 (44.5%) | 340 (55.5%) |
| Total (Category) | 2,389 (54.7%) | 1,978 (45.3%) |
| Total (Overall) | 10,305 (48.8%) | 10,789 (51.1%) |
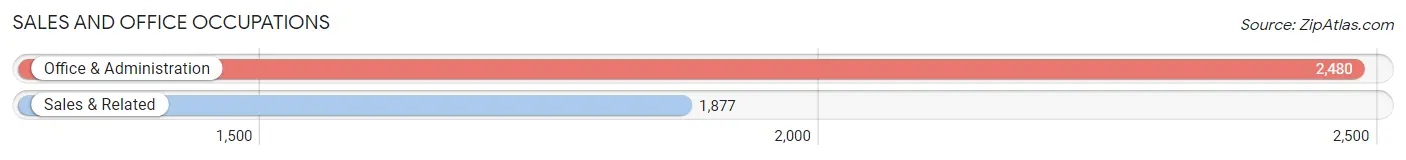
Sales and Office Occupations
The most common Sales and Office occupations in Hilo are Office & Administration (2,480 | 11.8%), and Sales & Related (1,877 | 8.9%).
Sales and Office Occupations by Sex
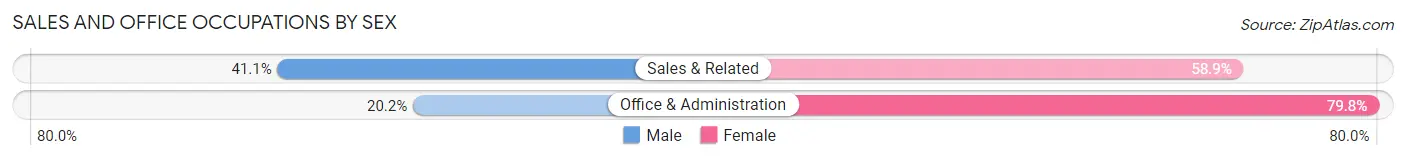
| Occupation | Male | Female |
| Sales & Related | 771 (41.1%) | 1,106 (58.9%) |
| Office & Administration | 502 (20.2%) | 1,978 (79.8%) |
| Total (Category) | 1,273 (29.2%) | 3,084 (70.8%) |
| Total (Overall) | 10,305 (48.8%) | 10,789 (51.1%) |
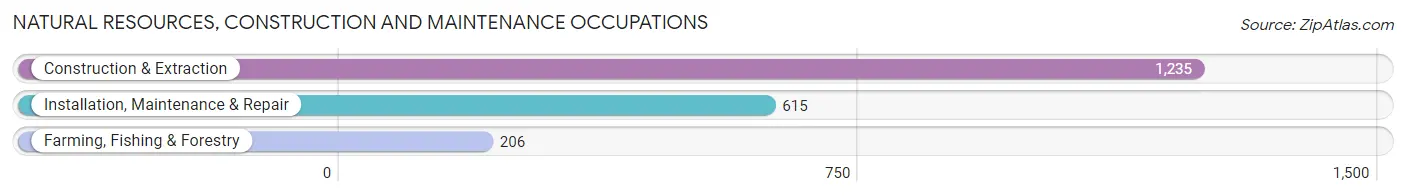
Natural Resources, Construction and Maintenance Occupations
The most common Natural Resources, Construction and Maintenance occupations in Hilo are Construction & Extraction (1,235 | 5.9%), Installation, Maintenance & Repair (615 | 2.9%), and Farming, Fishing & Forestry (206 | 1.0%).
Natural Resources, Construction and Maintenance Occupations by Sex
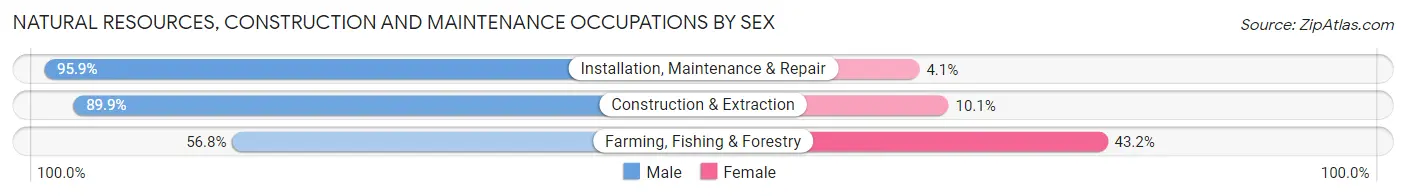
| Occupation | Male | Female |
| Farming, Fishing & Forestry | 117 (56.8%) | 89 (43.2%) |
| Construction & Extraction | 1,110 (89.9%) | 125 (10.1%) |
| Installation, Maintenance & Repair | 590 (95.9%) | 25 (4.1%) |
| Total (Category) | 1,817 (88.4%) | 239 (11.6%) |
| Total (Overall) | 10,305 (48.8%) | 10,789 (51.1%) |
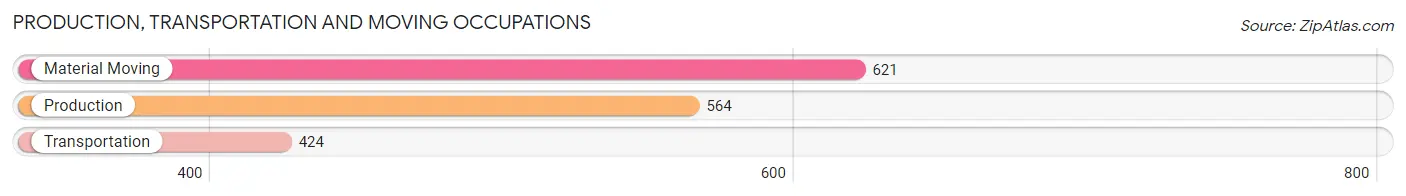
Production, Transportation and Moving Occupations
The most common Production, Transportation and Moving occupations in Hilo are Material Moving (621 | 2.9%), Production (564 | 2.7%), and Transportation (424 | 2.0%).
Production, Transportation and Moving Occupations by Sex
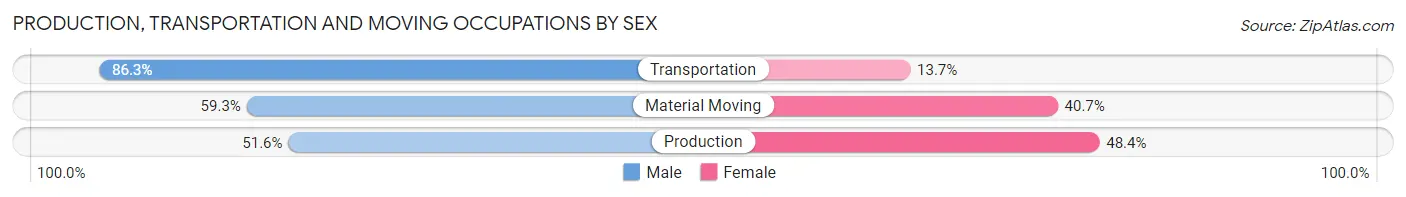
| Occupation | Male | Female |
| Production | 291 (51.6%) | 273 (48.4%) |
| Transportation | 366 (86.3%) | 58 (13.7%) |
| Material Moving | 368 (59.3%) | 253 (40.7%) |
| Total (Category) | 1,025 (63.7%) | 584 (36.3%) |
| Total (Overall) | 10,305 (48.8%) | 10,789 (51.1%) |
Employment Industries by Sex in Hilo
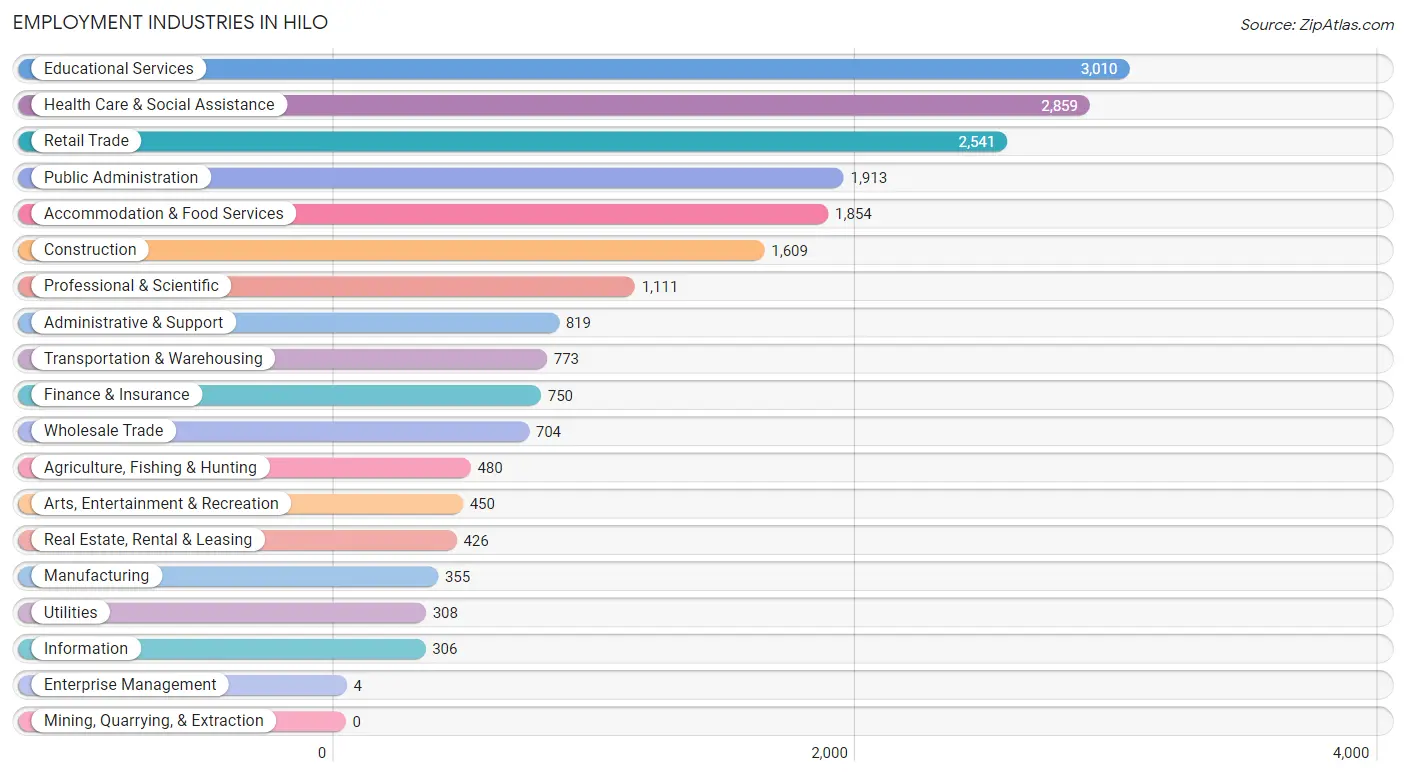
Employment Industries in Hilo
The major employment industries in Hilo include Educational Services (3,010 | 14.3%), Health Care & Social Assistance (2,859 | 13.6%), Retail Trade (2,541 | 12.0%), Public Administration (1,913 | 9.1%), and Accommodation & Food Services (1,854 | 8.8%).
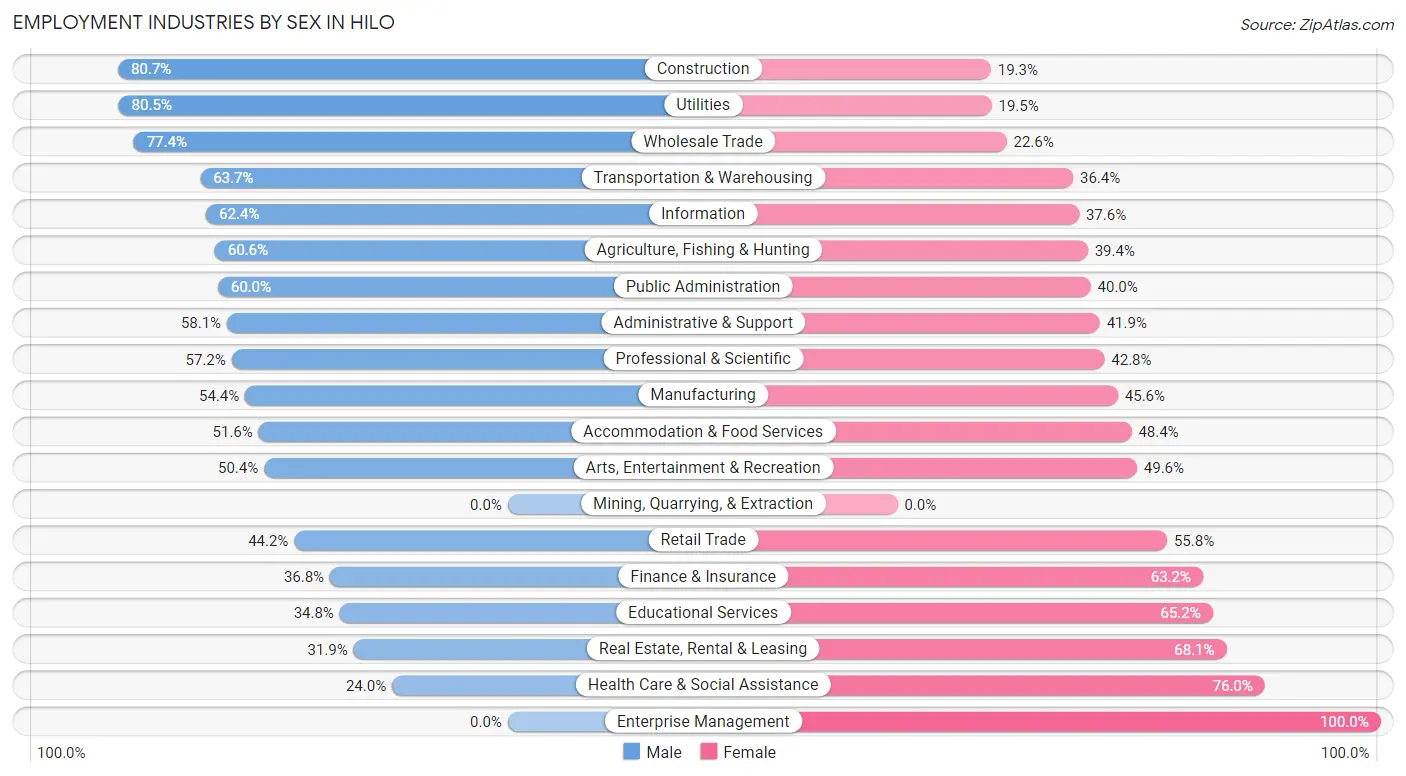
Employment Industries by Sex in Hilo
The Hilo industries that see more men than women are Construction (80.7%), Utilities (80.5%), and Wholesale Trade (77.4%), whereas the industries that tend to have a higher number of women are Enterprise Management (100.0%), Health Care & Social Assistance (76.0%), and Real Estate, Rental & Leasing (68.1%).
| Industry | Male | Female |
| Agriculture, Fishing & Hunting | 291 (60.6%) | 189 (39.4%) |
| Mining, Quarrying, & Extraction | 0 (0.0%) | 0 (0.0%) |
| Construction | 1,298 (80.7%) | 311 (19.3%) |
| Manufacturing | 193 (54.4%) | 162 (45.6%) |
| Wholesale Trade | 545 (77.4%) | 159 (22.6%) |
| Retail Trade | 1,123 (44.2%) | 1,418 (55.8%) |
| Transportation & Warehousing | 492 (63.6%) | 281 (36.3%) |
| Utilities | 248 (80.5%) | 60 (19.5%) |
| Information | 191 (62.4%) | 115 (37.6%) |
| Finance & Insurance | 276 (36.8%) | 474 (63.2%) |
| Real Estate, Rental & Leasing | 136 (31.9%) | 290 (68.1%) |
| Professional & Scientific | 635 (57.2%) | 476 (42.8%) |
| Enterprise Management | 0 (0.0%) | 4 (100.0%) |
| Administrative & Support | 476 (58.1%) | 343 (41.9%) |
| Educational Services | 1,047 (34.8%) | 1,963 (65.2%) |
| Health Care & Social Assistance | 685 (24.0%) | 2,174 (76.0%) |
| Arts, Entertainment & Recreation | 227 (50.4%) | 223 (49.6%) |
| Accommodation & Food Services | 956 (51.6%) | 898 (48.4%) |
| Public Administration | 1,148 (60.0%) | 765 (40.0%) |
| Total | 10,305 (48.8%) | 10,789 (51.1%) |
Education in Hilo
School Enrollment in Hilo
The most common levels of schooling among the 11,715 students in Hilo are college / undergraduate (2,766 | 23.6%), middle school (2,556 | 21.8%), and elementary school (2,503 | 21.4%).
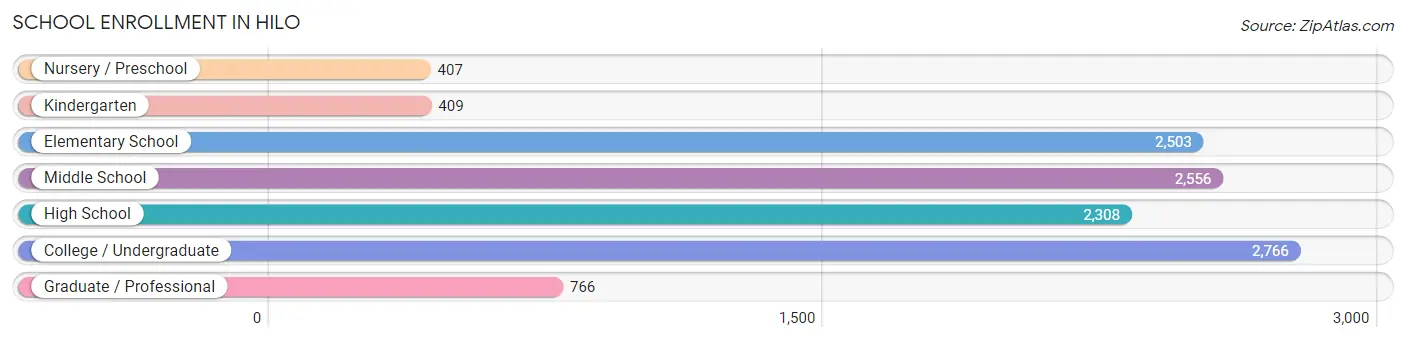
| School Level | # Students | % Students |
| Nursery / Preschool | 407 | 3.5% |
| Kindergarten | 409 | 3.5% |
| Elementary School | 2,503 | 21.4% |
| Middle School | 2,556 | 21.8% |
| High School | 2,308 | 19.7% |
| College / Undergraduate | 2,766 | 23.6% |
| Graduate / Professional | 766 | 6.5% |
| Total | 11,715 | 100.0% |
School Enrollment by Age by Funding Source in Hilo
Out of a total of 11,715 students who are enrolled in schools in Hilo, 2,085 (17.8%) attend a private institution, while the remaining 9,630 (82.2%) are enrolled in public schools. The age group of 3 to 4 year olds has the highest likelihood of being enrolled in private schools, with 202 (57.1% in the age bracket) enrolled. Conversely, the age group of 20 to 24 year olds has the lowest likelihood of being enrolled in a private school, with 1,103 (92.5% in the age bracket) attending a public institution.
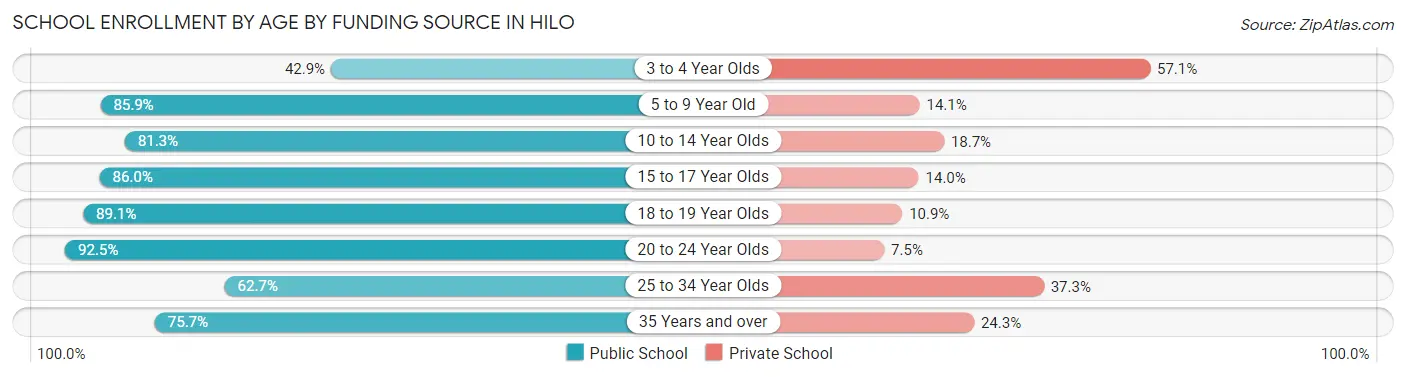
| Age Bracket | Public School | Private School |
| 3 to 4 Year Olds | 152 (42.9%) | 202 (57.1%) |
| 5 to 9 Year Old | 2,266 (85.9%) | 373 (14.1%) |
| 10 to 14 Year Olds | 2,682 (81.3%) | 616 (18.7%) |
| 15 to 17 Year Olds | 1,368 (86.0%) | 222 (14.0%) |
| 18 to 19 Year Olds | 1,014 (89.1%) | 124 (10.9%) |
| 20 to 24 Year Olds | 1,103 (92.5%) | 90 (7.5%) |
| 25 to 34 Year Olds | 426 (62.7%) | 253 (37.3%) |
| 35 Years and over | 624 (75.7%) | 200 (24.3%) |
| Total | 9,630 (82.2%) | 2,085 (17.8%) |
Educational Attainment by Field of Study in Hilo
Social sciences (1,950 | 15.6%), education (1,698 | 13.6%), business (1,681 | 13.4%), bio, nature & agricultural (1,341 | 10.7%), and science & technology (1,057 | 8.4%) are the most common fields of study among 12,526 individuals in Hilo who have obtained a bachelor's degree or higher.
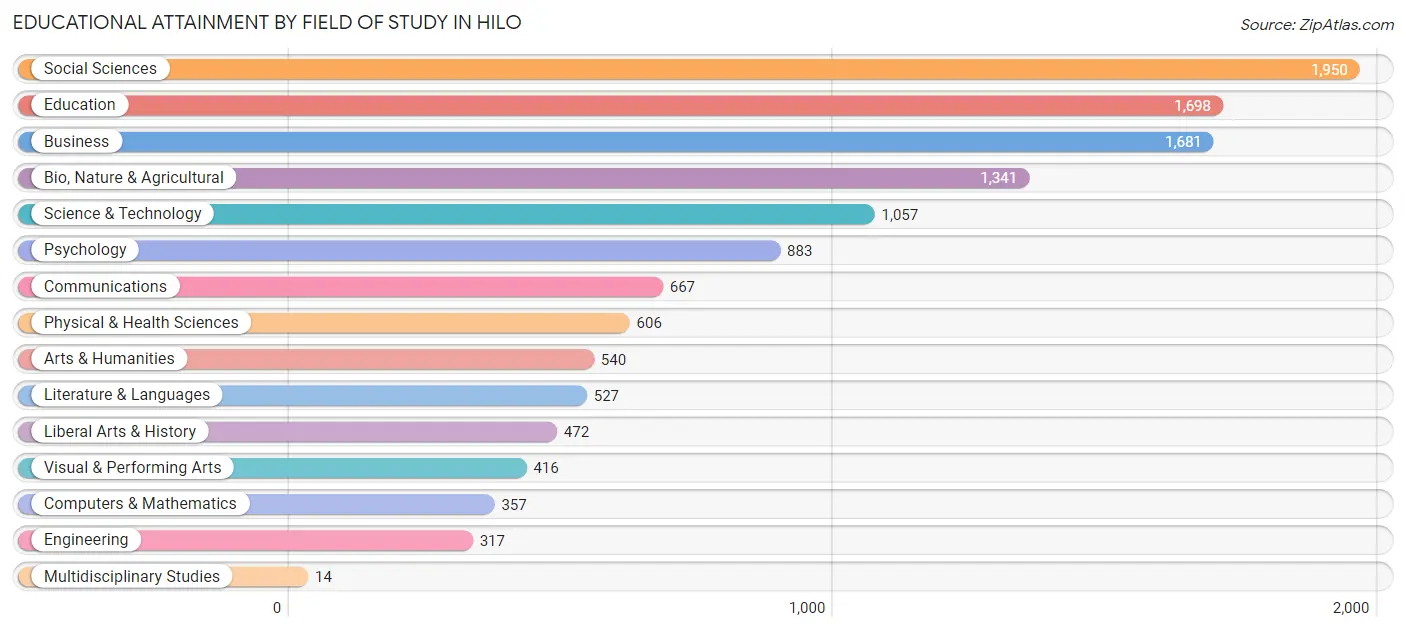
| Field of Study | # Graduates | % Graduates |
| Computers & Mathematics | 357 | 2.9% |
| Bio, Nature & Agricultural | 1,341 | 10.7% |
| Physical & Health Sciences | 606 | 4.8% |
| Psychology | 883 | 7.0% |
| Social Sciences | 1,950 | 15.6% |
| Engineering | 317 | 2.5% |
| Multidisciplinary Studies | 14 | 0.1% |
| Science & Technology | 1,057 | 8.4% |
| Business | 1,681 | 13.4% |
| Education | 1,698 | 13.6% |
| Literature & Languages | 527 | 4.2% |
| Liberal Arts & History | 472 | 3.8% |
| Visual & Performing Arts | 416 | 3.3% |
| Communications | 667 | 5.3% |
| Arts & Humanities | 540 | 4.3% |
| Total | 12,526 | 100.0% |
Transportation & Commute in Hilo
Vehicle Availability by Sex in Hilo
The most prevalent vehicle ownership categories in Hilo are males with 2 vehicles (3,162, accounting for 31.6%) and females with 2 vehicles (3,595, making up 30.5%).
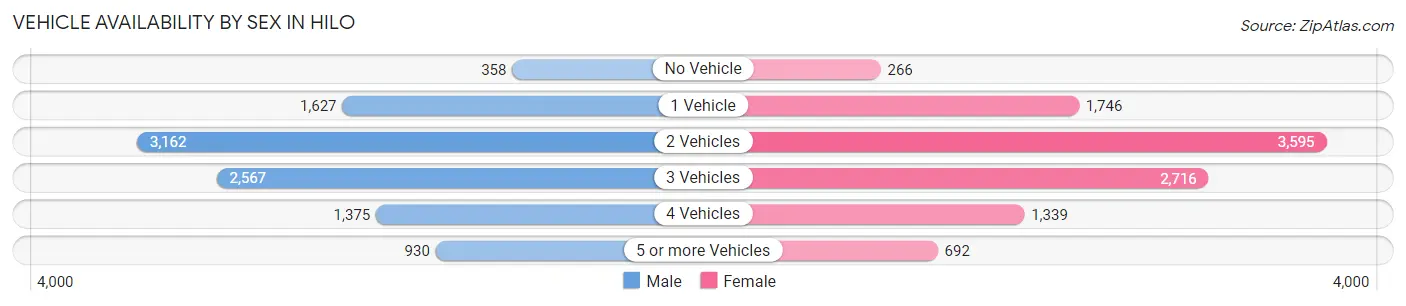
| Vehicles Available | Male | Female |
| No Vehicle | 358 (3.6%) | 266 (2.6%) |
| 1 Vehicle | 1,627 (16.2%) | 1,746 (16.9%) |
| 2 Vehicles | 3,162 (31.6%) | 3,595 (34.7%) |
| 3 Vehicles | 2,567 (25.6%) | 2,716 (26.2%) |
| 4 Vehicles | 1,375 (13.7%) | 1,339 (12.9%) |
| 5 or more Vehicles | 930 (9.3%) | 692 (6.7%) |
| Total | 10,019 (100.0%) | 10,354 (100.0%) |
Commute Time in Hilo
The most frequently occuring commute durations in Hilo are 15 to 19 minutes (5,035 commuters, 26.5%), 10 to 14 minutes (4,652 commuters, 24.5%), and 5 to 9 minutes (2,934 commuters, 15.4%).
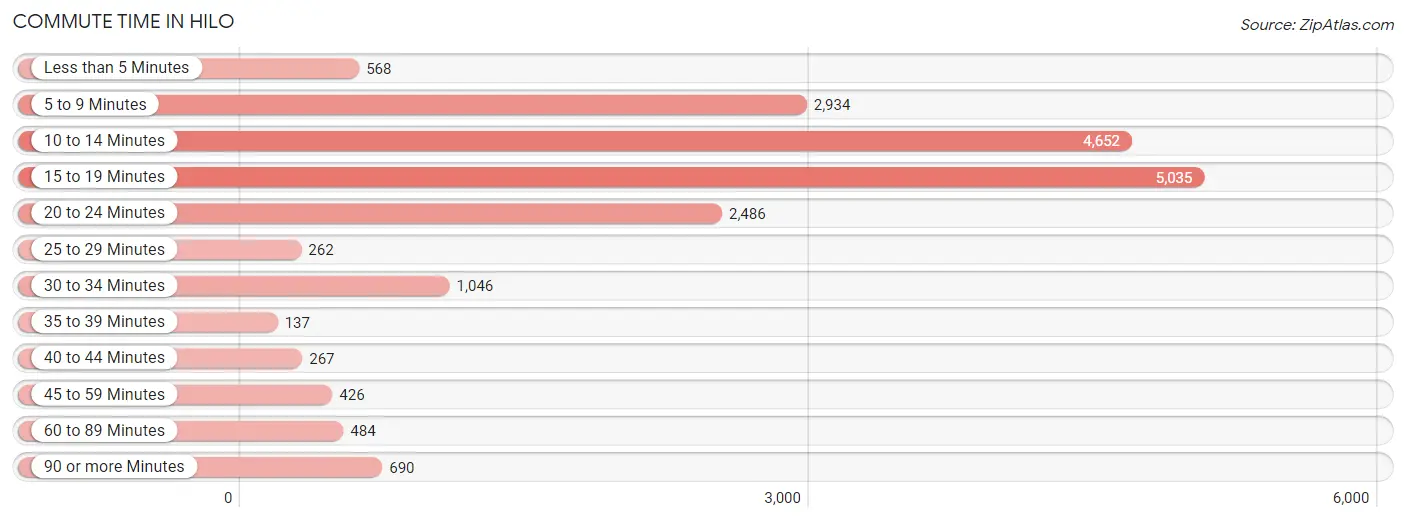
| Commute Time | # Commuters | % Commuters |
| Less than 5 Minutes | 568 | 3.0% |
| 5 to 9 Minutes | 2,934 | 15.4% |
| 10 to 14 Minutes | 4,652 | 24.5% |
| 15 to 19 Minutes | 5,035 | 26.5% |
| 20 to 24 Minutes | 2,486 | 13.1% |
| 25 to 29 Minutes | 262 | 1.4% |
| 30 to 34 Minutes | 1,046 | 5.5% |
| 35 to 39 Minutes | 137 | 0.7% |
| 40 to 44 Minutes | 267 | 1.4% |
| 45 to 59 Minutes | 426 | 2.2% |
| 60 to 89 Minutes | 484 | 2.5% |
| 90 or more Minutes | 690 | 3.6% |
Commute Time by Sex in Hilo
The most common commute times in Hilo are 15 to 19 minutes (2,731 commuters, 28.7%) for males and 15 to 19 minutes (2,304 commuters, 24.3%) for females.
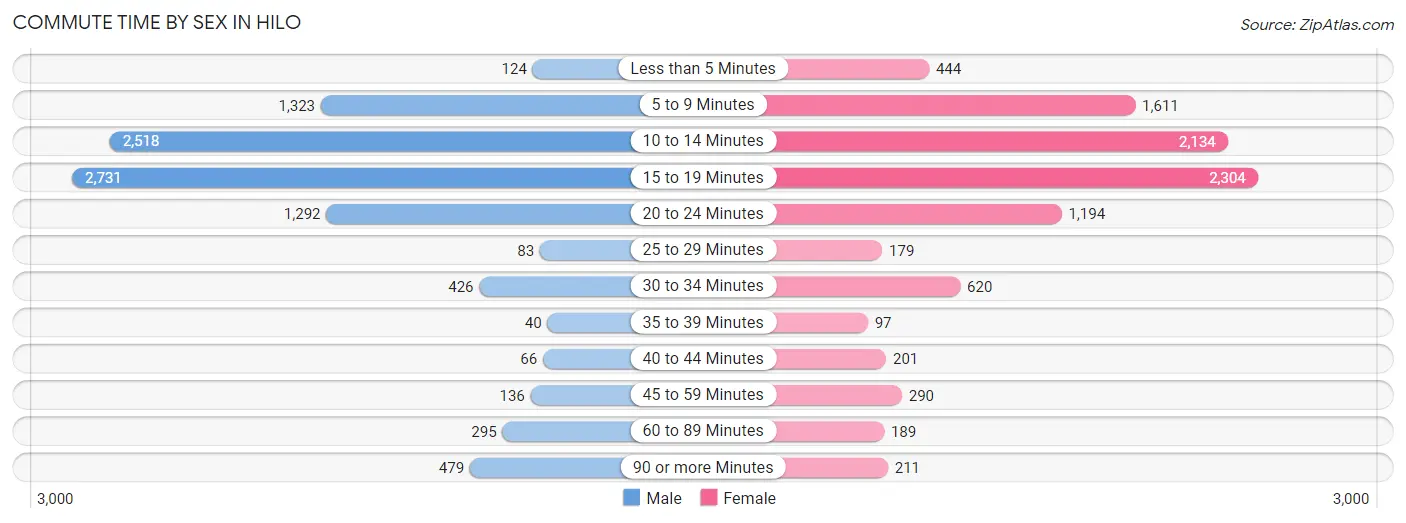
| Commute Time | Male | Female |
| Less than 5 Minutes | 124 (1.3%) | 444 (4.7%) |
| 5 to 9 Minutes | 1,323 (13.9%) | 1,611 (17.0%) |
| 10 to 14 Minutes | 2,518 (26.5%) | 2,134 (22.5%) |
| 15 to 19 Minutes | 2,731 (28.7%) | 2,304 (24.3%) |
| 20 to 24 Minutes | 1,292 (13.6%) | 1,194 (12.6%) |
| 25 to 29 Minutes | 83 (0.9%) | 179 (1.9%) |
| 30 to 34 Minutes | 426 (4.5%) | 620 (6.5%) |
| 35 to 39 Minutes | 40 (0.4%) | 97 (1.0%) |
| 40 to 44 Minutes | 66 (0.7%) | 201 (2.1%) |
| 45 to 59 Minutes | 136 (1.4%) | 290 (3.1%) |
| 60 to 89 Minutes | 295 (3.1%) | 189 (2.0%) |
| 90 or more Minutes | 479 (5.0%) | 211 (2.2%) |
Time of Departure to Work by Sex in Hilo
The most frequent times of departure to work in Hilo are 7:00 AM to 7:29 AM (1,772, 18.6%) for males and 7:00 AM to 7:29 AM (1,914, 20.2%) for females.
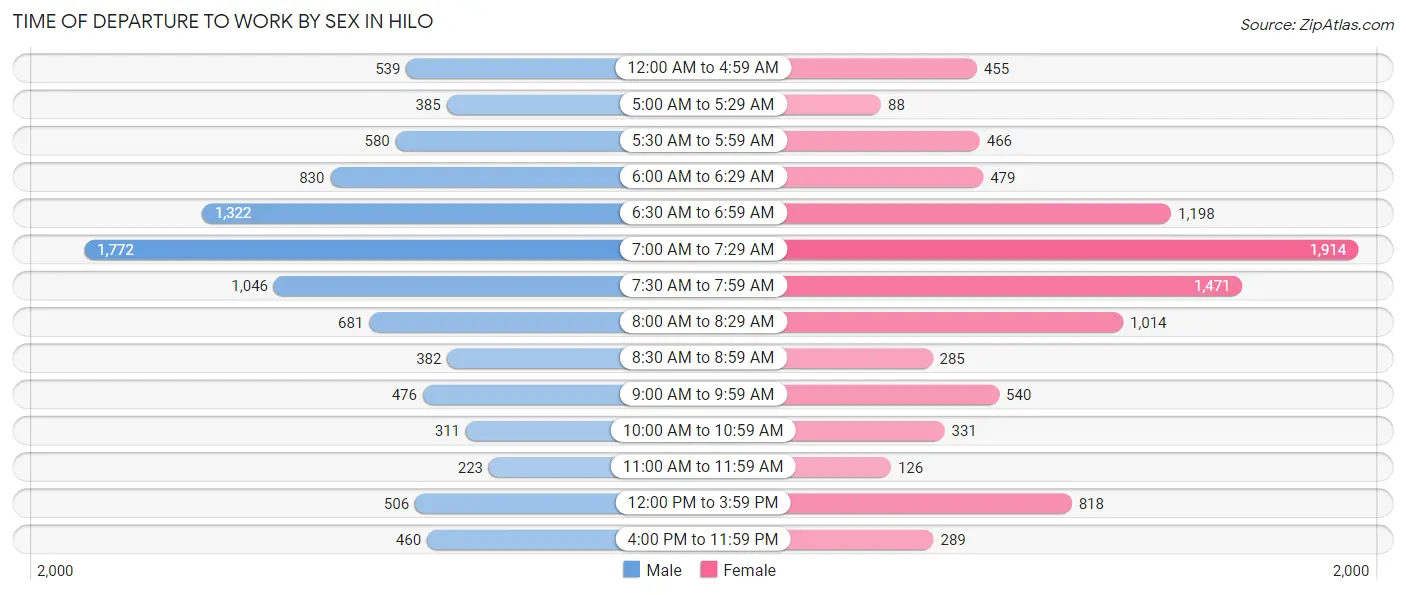
| Time of Departure | Male | Female |
| 12:00 AM to 4:59 AM | 539 (5.7%) | 455 (4.8%) |
| 5:00 AM to 5:29 AM | 385 (4.1%) | 88 (0.9%) |
| 5:30 AM to 5:59 AM | 580 (6.1%) | 466 (4.9%) |
| 6:00 AM to 6:29 AM | 830 (8.7%) | 479 (5.1%) |
| 6:30 AM to 6:59 AM | 1,322 (13.9%) | 1,198 (12.7%) |
| 7:00 AM to 7:29 AM | 1,772 (18.6%) | 1,914 (20.2%) |
| 7:30 AM to 7:59 AM | 1,046 (11.0%) | 1,471 (15.5%) |
| 8:00 AM to 8:29 AM | 681 (7.2%) | 1,014 (10.7%) |
| 8:30 AM to 8:59 AM | 382 (4.0%) | 285 (3.0%) |
| 9:00 AM to 9:59 AM | 476 (5.0%) | 540 (5.7%) |
| 10:00 AM to 10:59 AM | 311 (3.3%) | 331 (3.5%) |
| 11:00 AM to 11:59 AM | 223 (2.3%) | 126 (1.3%) |
| 12:00 PM to 3:59 PM | 506 (5.3%) | 818 (8.6%) |
| 4:00 PM to 11:59 PM | 460 (4.8%) | 289 (3.0%) |
| Total | 9,513 (100.0%) | 9,474 (100.0%) |
Housing Occupancy in Hilo
Occupancy by Ownership in Hilo
Of the total 16,752 dwellings in Hilo, owner-occupied units account for 10,847 (64.7%), while renter-occupied units make up 5,905 (35.2%).
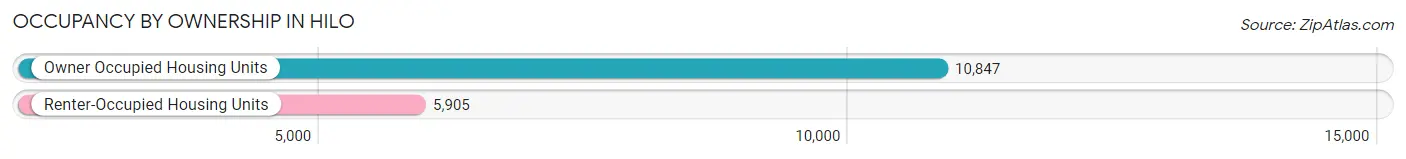
| Occupancy | # Housing Units | % Housing Units |
| Owner Occupied Housing Units | 10,847 | 64.7% |
| Renter-Occupied Housing Units | 5,905 | 35.2% |
| Total Occupied Housing Units | 16,752 | 100.0% |
Occupancy by Household Size in Hilo
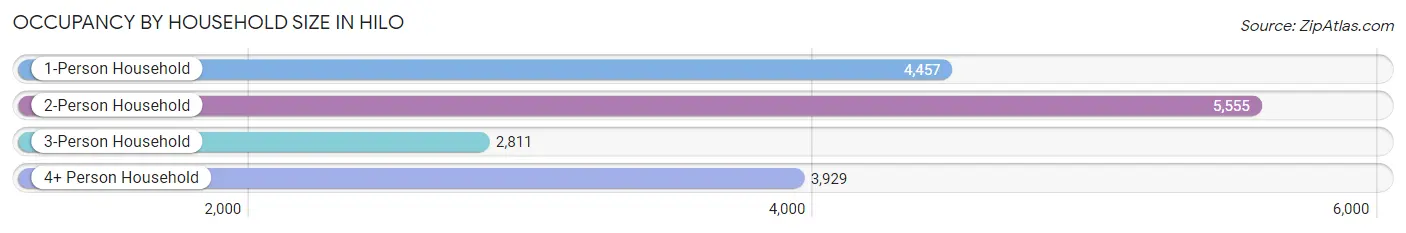
| Household Size | # Housing Units | % Housing Units |
| 1-Person Household | 4,457 | 26.6% |
| 2-Person Household | 5,555 | 33.2% |
| 3-Person Household | 2,811 | 16.8% |
| 4+ Person Household | 3,929 | 23.4% |
| Total Housing Units | 16,752 | 100.0% |
Occupancy by Ownership by Household Size in Hilo
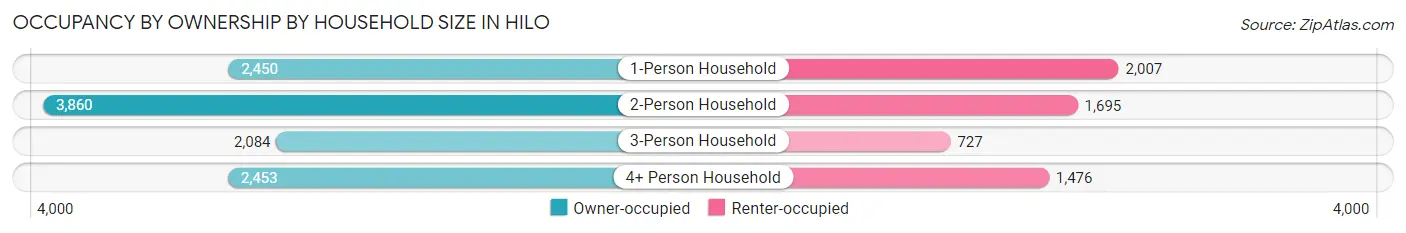
| Household Size | Owner-occupied | Renter-occupied |
| 1-Person Household | 2,450 (55.0%) | 2,007 (45.0%) |
| 2-Person Household | 3,860 (69.5%) | 1,695 (30.5%) |
| 3-Person Household | 2,084 (74.1%) | 727 (25.9%) |
| 4+ Person Household | 2,453 (62.4%) | 1,476 (37.6%) |
| Total Housing Units | 10,847 (64.7%) | 5,905 (35.2%) |
Occupancy by Educational Attainment in Hilo
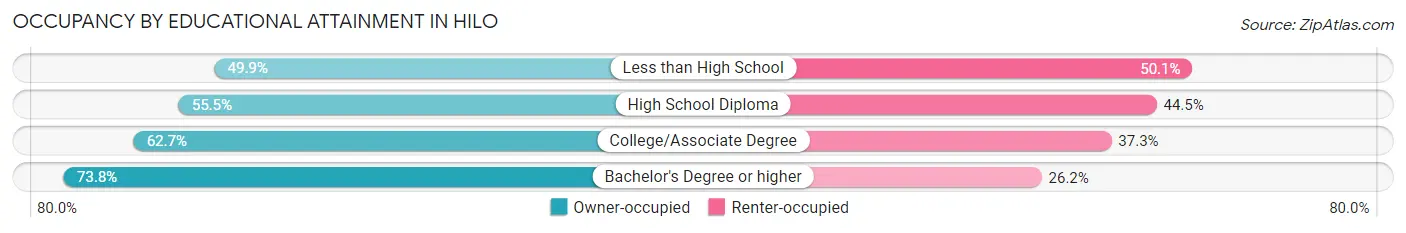
| Household Size | Owner-occupied | Renter-occupied |
| Less than High School | 350 (49.9%) | 352 (50.1%) |
| High School Diploma | 2,063 (55.5%) | 1,652 (44.5%) |
| College/Associate Degree | 3,762 (62.7%) | 2,239 (37.3%) |
| Bachelor's Degree or higher | 4,672 (73.8%) | 1,662 (26.2%) |
Occupancy by Age of Householder in Hilo
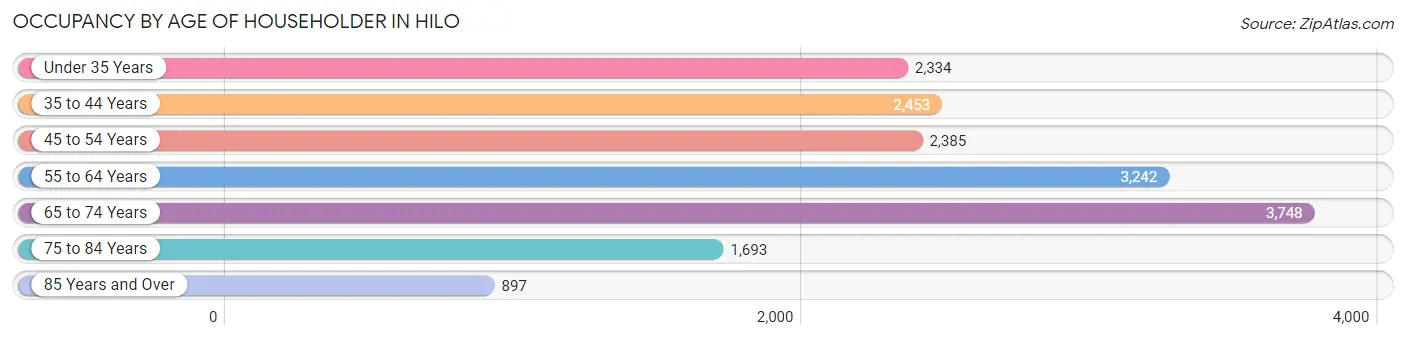
| Age Bracket | # Households | % Households |
| Under 35 Years | 2,334 | 13.9% |
| 35 to 44 Years | 2,453 | 14.6% |
| 45 to 54 Years | 2,385 | 14.2% |
| 55 to 64 Years | 3,242 | 19.4% |
| 65 to 74 Years | 3,748 | 22.4% |
| 75 to 84 Years | 1,693 | 10.1% |
| 85 Years and Over | 897 | 5.3% |
| Total | 16,752 | 100.0% |
Housing Finances in Hilo
Median Income by Occupancy in Hilo
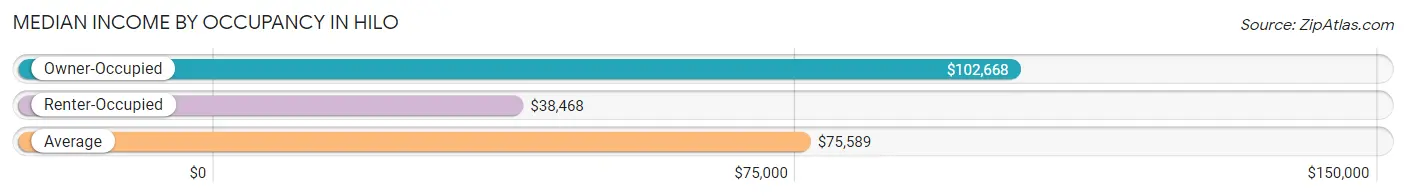
| Occupancy Type | # Households | Median Income |
| Owner-Occupied | 10,847 (64.7%) | $102,668 |
| Renter-Occupied | 5,905 (35.2%) | $38,468 |
| Average | 16,752 (100.0%) | $75,589 |
Occupancy by Householder Income Bracket in Hilo
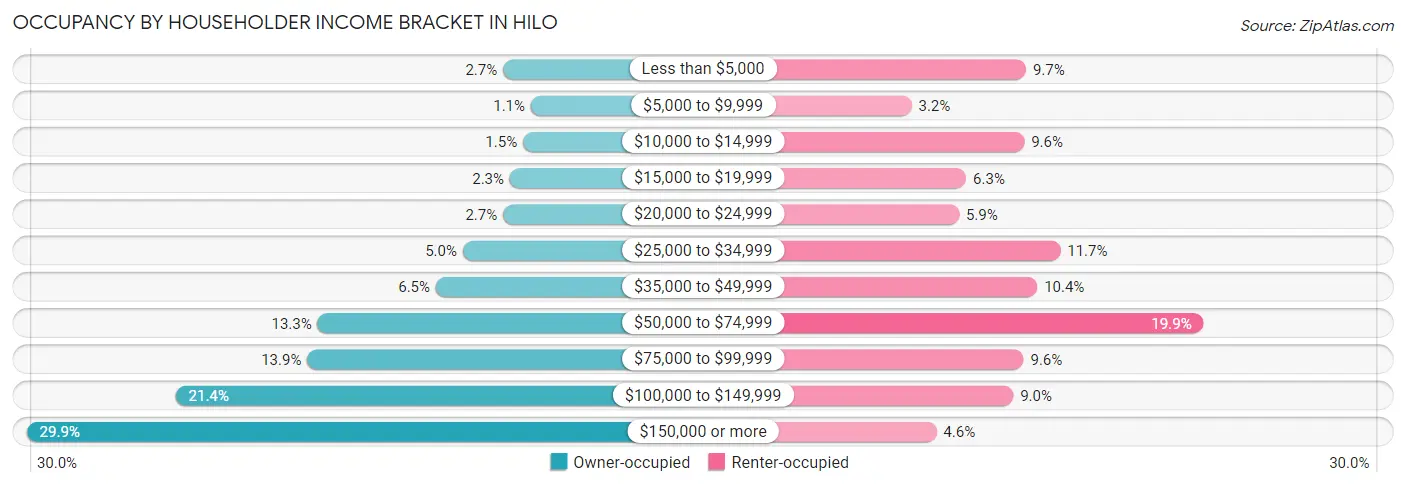
| Income Bracket | Owner-occupied | Renter-occupied |
| Less than $5,000 | 289 (2.7%) | 575 (9.7%) |
| $5,000 to $9,999 | 116 (1.1%) | 189 (3.2%) |
| $10,000 to $14,999 | 165 (1.5%) | 569 (9.6%) |
| $15,000 to $19,999 | 246 (2.3%) | 373 (6.3%) |
| $20,000 to $24,999 | 289 (2.7%) | 349 (5.9%) |
| $25,000 to $34,999 | 538 (5.0%) | 691 (11.7%) |
| $35,000 to $49,999 | 705 (6.5%) | 613 (10.4%) |
| $50,000 to $74,999 | 1,438 (13.3%) | 1,174 (19.9%) |
| $75,000 to $99,999 | 1,502 (13.9%) | 567 (9.6%) |
| $100,000 to $149,999 | 2,318 (21.4%) | 532 (9.0%) |
| $150,000 or more | 3,241 (29.9%) | 273 (4.6%) |
| Total | 10,847 (100.0%) | 5,905 (100.0%) |
Monthly Housing Cost Tiers in Hilo
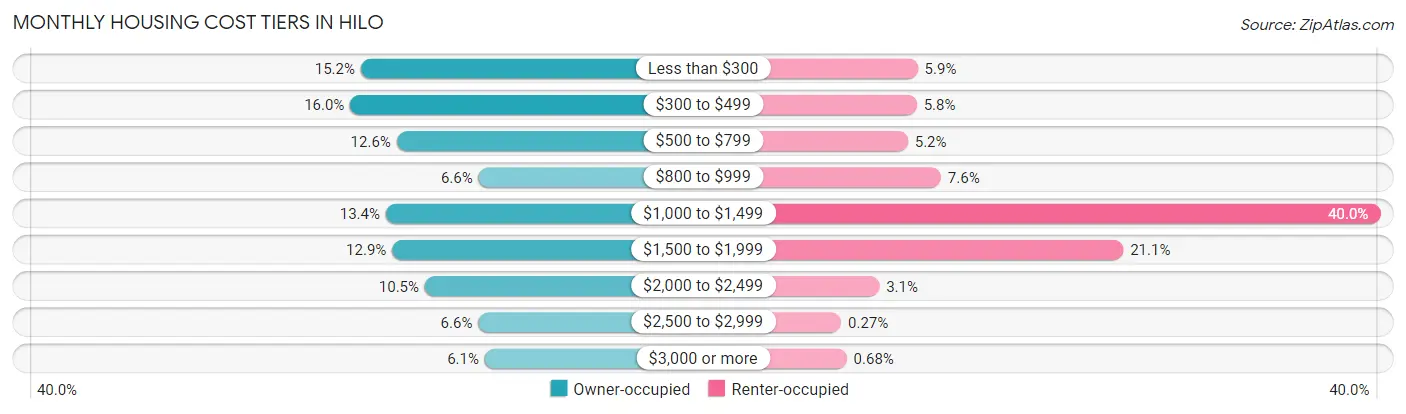
| Monthly Cost | Owner-occupied | Renter-occupied |
| Less than $300 | 1,653 (15.2%) | 349 (5.9%) |
| $300 to $499 | 1,738 (16.0%) | 345 (5.8%) |
| $500 to $799 | 1,367 (12.6%) | 306 (5.2%) |
| $800 to $999 | 713 (6.6%) | 450 (7.6%) |
| $1,000 to $1,499 | 1,454 (13.4%) | 2,360 (40.0%) |
| $1,500 to $1,999 | 1,403 (12.9%) | 1,243 (21.0%) |
| $2,000 to $2,499 | 1,141 (10.5%) | 182 (3.1%) |
| $2,500 to $2,999 | 715 (6.6%) | 16 (0.3%) |
| $3,000 or more | 663 (6.1%) | 40 (0.7%) |
| Total | 10,847 (100.0%) | 5,905 (100.0%) |
Physical Housing Characteristics in Hilo
Housing Structures in Hilo
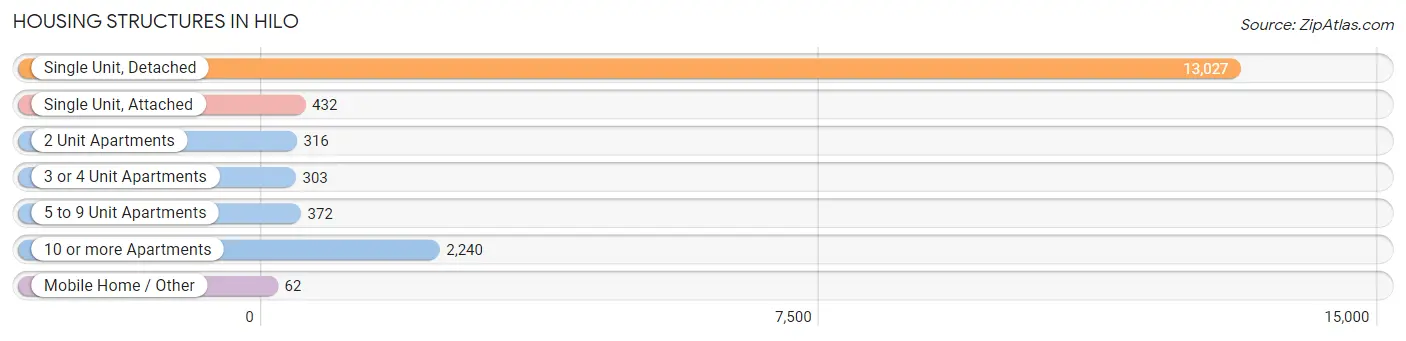
| Structure Type | # Housing Units | % Housing Units |
| Single Unit, Detached | 13,027 | 77.8% |
| Single Unit, Attached | 432 | 2.6% |
| 2 Unit Apartments | 316 | 1.9% |
| 3 or 4 Unit Apartments | 303 | 1.8% |
| 5 to 9 Unit Apartments | 372 | 2.2% |
| 10 or more Apartments | 2,240 | 13.4% |
| Mobile Home / Other | 62 | 0.4% |
| Total | 16,752 | 100.0% |
Housing Structures by Occupancy in Hilo
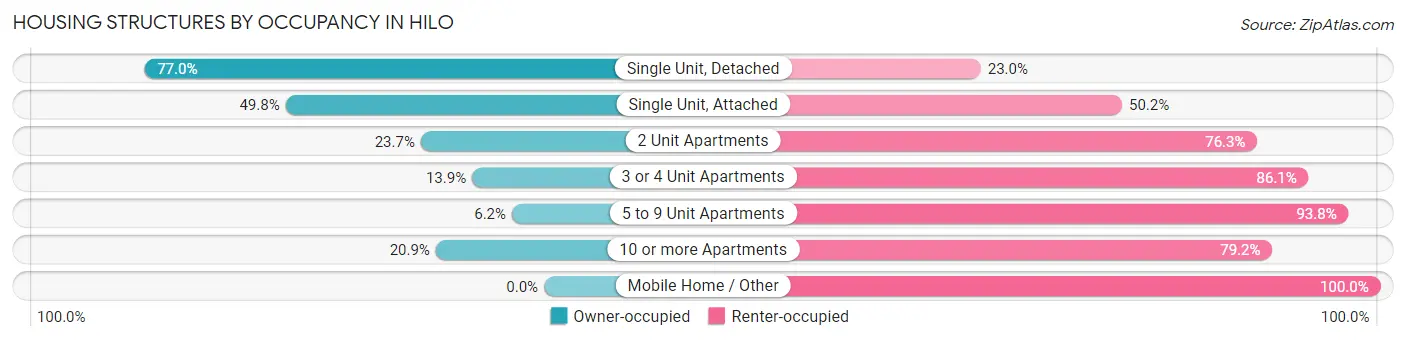
| Structure Type | Owner-occupied | Renter-occupied |
| Single Unit, Detached | 10,025 (77.0%) | 3,002 (23.0%) |
| Single Unit, Attached | 215 (49.8%) | 217 (50.2%) |
| 2 Unit Apartments | 75 (23.7%) | 241 (76.3%) |
| 3 or 4 Unit Apartments | 42 (13.9%) | 261 (86.1%) |
| 5 to 9 Unit Apartments | 23 (6.2%) | 349 (93.8%) |
| 10 or more Apartments | 467 (20.8%) | 1,773 (79.1%) |
| Mobile Home / Other | 0 (0.0%) | 62 (100.0%) |
| Total | 10,847 (64.7%) | 5,905 (35.2%) |
Housing Structures by Number of Rooms in Hilo
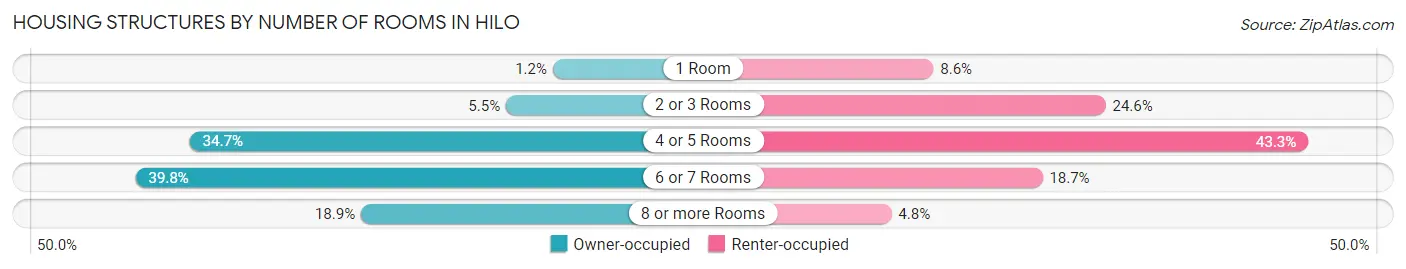
| Number of Rooms | Owner-occupied | Renter-occupied |
| 1 Room | 125 (1.1%) | 510 (8.6%) |
| 2 or 3 Rooms | 594 (5.5%) | 1,451 (24.6%) |
| 4 or 5 Rooms | 3,767 (34.7%) | 2,557 (43.3%) |
| 6 or 7 Rooms | 4,312 (39.8%) | 1,106 (18.7%) |
| 8 or more Rooms | 2,049 (18.9%) | 281 (4.8%) |
| Total | 10,847 (100.0%) | 5,905 (100.0%) |
Housing Structure by Heating Type in Hilo
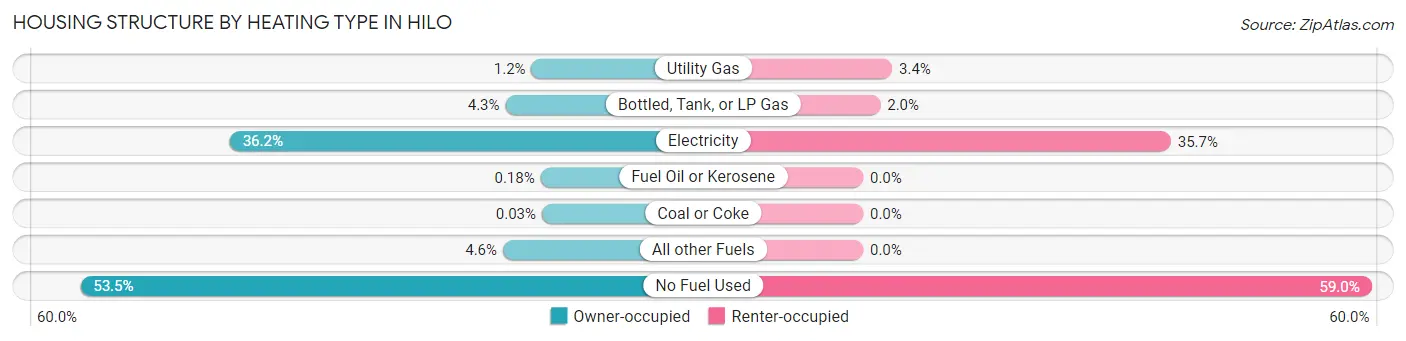
| Heating Type | Owner-occupied | Renter-occupied |
| Utility Gas | 134 (1.2%) | 199 (3.4%) |
| Bottled, Tank, or LP Gas | 462 (4.3%) | 118 (2.0%) |
| Electricity | 3,928 (36.2%) | 2,107 (35.7%) |
| Fuel Oil or Kerosene | 20 (0.2%) | 0 (0.0%) |
| Coal or Coke | 3 (0.0%) | 0 (0.0%) |
| All other Fuels | 493 (4.5%) | 0 (0.0%) |
| No Fuel Used | 5,807 (53.5%) | 3,481 (59.0%) |
| Total | 10,847 (100.0%) | 5,905 (100.0%) |
Household Vehicle Usage in Hilo
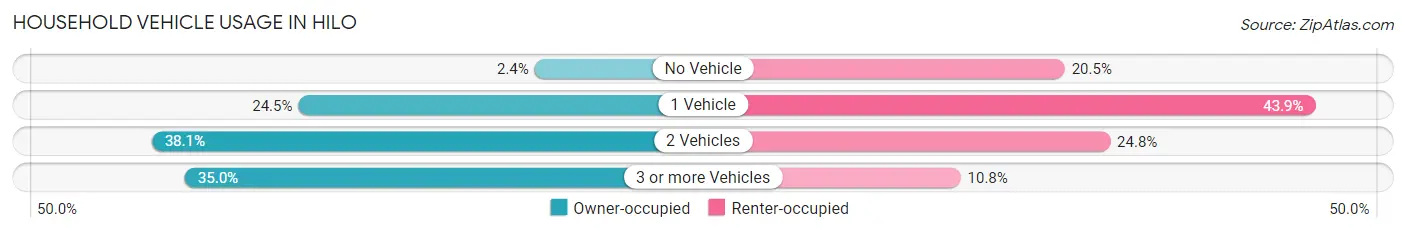
| Vehicles per Household | Owner-occupied | Renter-occupied |
| No Vehicle | 259 (2.4%) | 1,212 (20.5%) |
| 1 Vehicle | 2,652 (24.4%) | 2,593 (43.9%) |
| 2 Vehicles | 4,136 (38.1%) | 1,462 (24.8%) |
| 3 or more Vehicles | 3,800 (35.0%) | 638 (10.8%) |
| Total | 10,847 (100.0%) | 5,905 (100.0%) |
Real Estate & Mortgages in Hilo
Real Estate and Mortgage Overview in Hilo
| Characteristic | Without Mortgage | With Mortgage |
| Housing Units | 5,045 | 5,802 |
| Median Property Value | $407,800 | $425,700 |
| Median Household Income | $76,322 | $2,009 |
| Monthly Housing Costs | $411 | $656 |
| Real Estate Taxes | $849 | $269 |
Property Value by Mortgage Status in Hilo
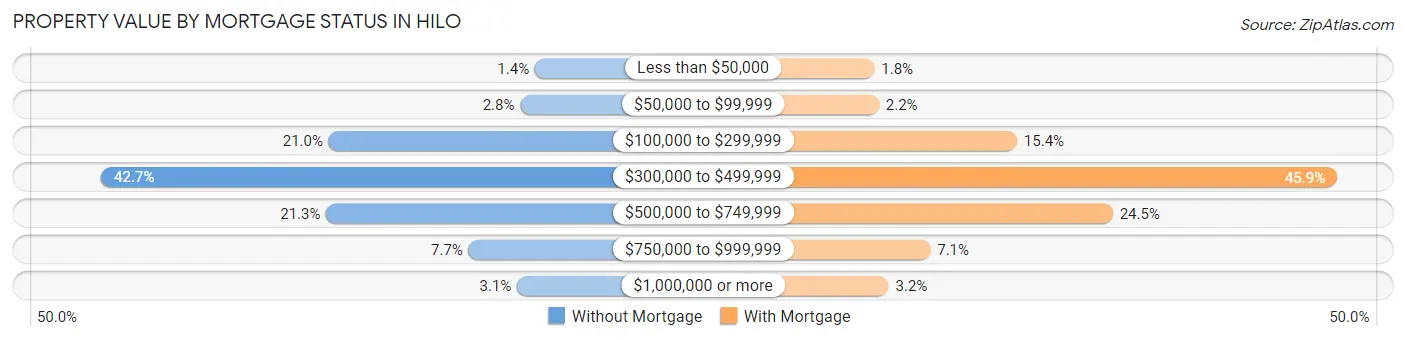
| Property Value | Without Mortgage | With Mortgage |
| Less than $50,000 | 70 (1.4%) | 104 (1.8%) |
| $50,000 to $99,999 | 141 (2.8%) | 129 (2.2%) |
| $100,000 to $299,999 | 1,061 (21.0%) | 892 (15.4%) |
| $300,000 to $499,999 | 2,155 (42.7%) | 2,660 (45.9%) |
| $500,000 to $749,999 | 1,073 (21.3%) | 1,421 (24.5%) |
| $750,000 to $999,999 | 389 (7.7%) | 413 (7.1%) |
| $1,000,000 or more | 156 (3.1%) | 183 (3.2%) |
| Total | 5,045 (100.0%) | 5,802 (100.0%) |
Household Income by Mortgage Status in Hilo
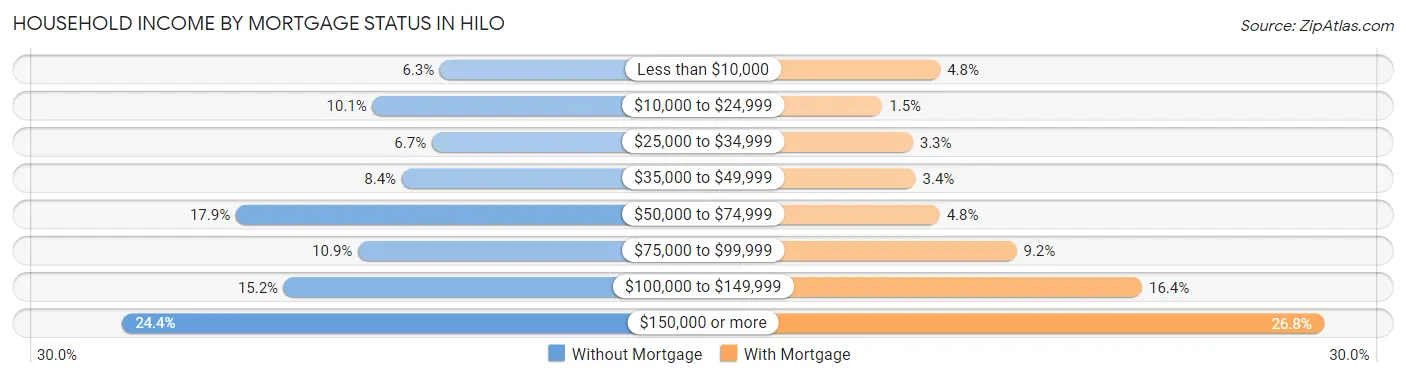
| Household Income | Without Mortgage | With Mortgage |
| Less than $10,000 | 316 (6.3%) | 281 (4.8%) |
| $10,000 to $24,999 | 510 (10.1%) | 89 (1.5%) |
| $25,000 to $34,999 | 339 (6.7%) | 190 (3.3%) |
| $35,000 to $49,999 | 426 (8.4%) | 199 (3.4%) |
| $50,000 to $74,999 | 904 (17.9%) | 279 (4.8%) |
| $75,000 to $99,999 | 552 (10.9%) | 534 (9.2%) |
| $100,000 to $149,999 | 766 (15.2%) | 950 (16.4%) |
| $150,000 or more | 1,232 (24.4%) | 1,552 (26.8%) |
| Total | 5,045 (100.0%) | 5,802 (100.0%) |
Property Value to Household Income Ratio in Hilo
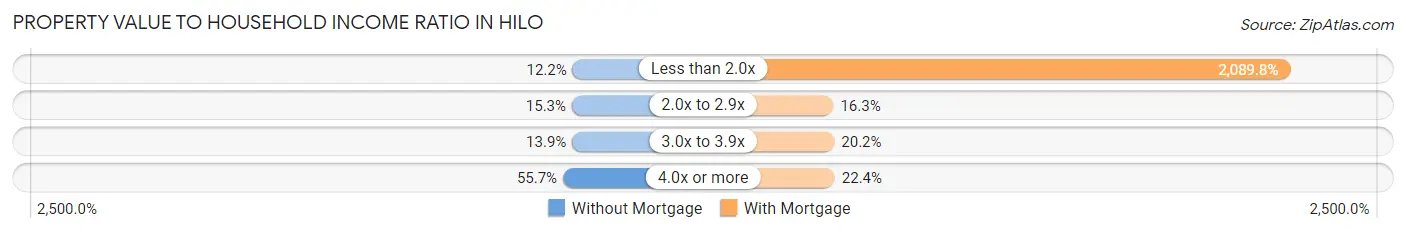
| Value-to-Income Ratio | Without Mortgage | With Mortgage |
| Less than 2.0x | 614 (12.2%) | 121,250 (2,089.8%) |
| 2.0x to 2.9x | 770 (15.3%) | 943 (16.3%) |
| 3.0x to 3.9x | 703 (13.9%) | 1,169 (20.2%) |
| 4.0x or more | 2,810 (55.7%) | 1,298 (22.4%) |
| Total | 5,045 (100.0%) | 5,802 (100.0%) |
Real Estate Taxes by Mortgage Status in Hilo
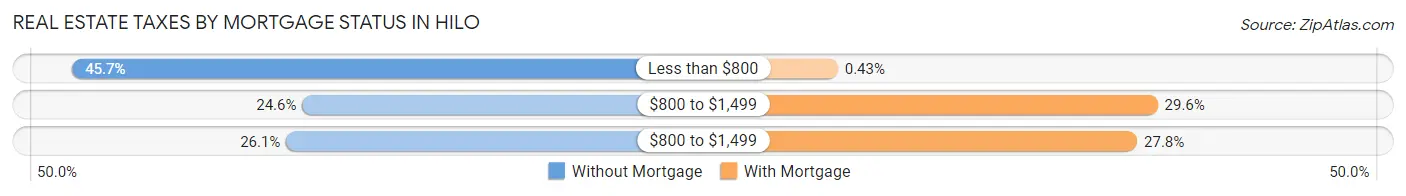
| Property Taxes | Without Mortgage | With Mortgage |
| Less than $800 | 2,303 (45.7%) | 25 (0.4%) |
| $800 to $1,499 | 1,243 (24.6%) | 1,720 (29.6%) |
| $800 to $1,499 | 1,317 (26.1%) | 1,611 (27.8%) |
| Total | 5,045 (100.0%) | 5,802 (100.0%) |
Health & Disability in Hilo
Health Insurance Coverage by Age in Hilo
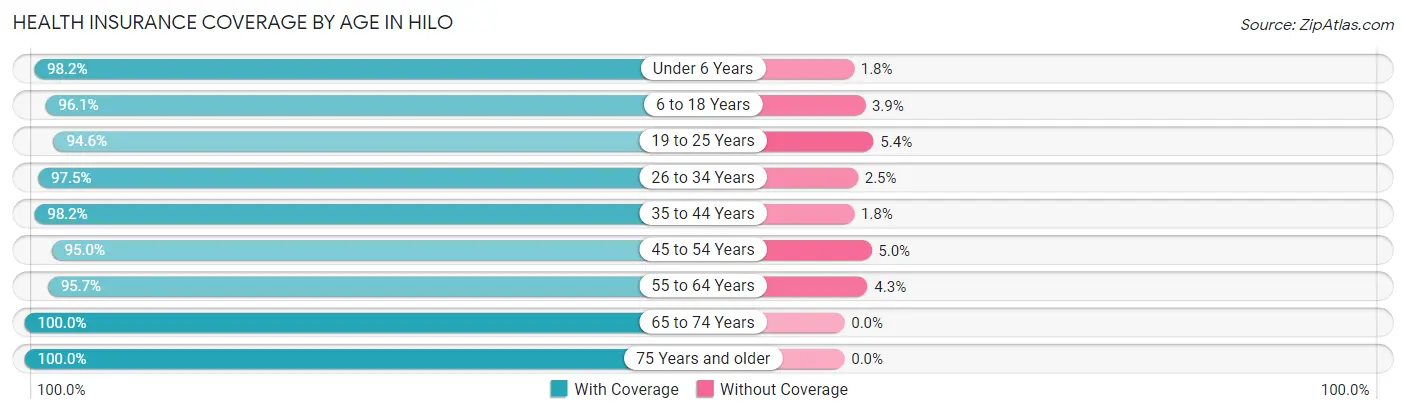
| Age Bracket | With Coverage | Without Coverage |
| Under 6 Years | 2,381 (98.2%) | 43 (1.8%) |
| 6 to 18 Years | 8,201 (96.1%) | 329 (3.9%) |
| 19 to 25 Years | 3,606 (94.6%) | 207 (5.4%) |
| 26 to 34 Years | 4,994 (97.5%) | 129 (2.5%) |
| 35 to 44 Years | 5,858 (98.2%) | 108 (1.8%) |
| 45 to 54 Years | 4,482 (95.0%) | 238 (5.0%) |
| 55 to 64 Years | 5,907 (95.7%) | 266 (4.3%) |
| 65 to 74 Years | 5,736 (100.0%) | 0 (0.0%) |
| 75 Years and older | 4,645 (100.0%) | 0 (0.0%) |
| Total | 45,810 (97.2%) | 1,320 (2.8%) |
Health Insurance Coverage by Citizenship Status in Hilo
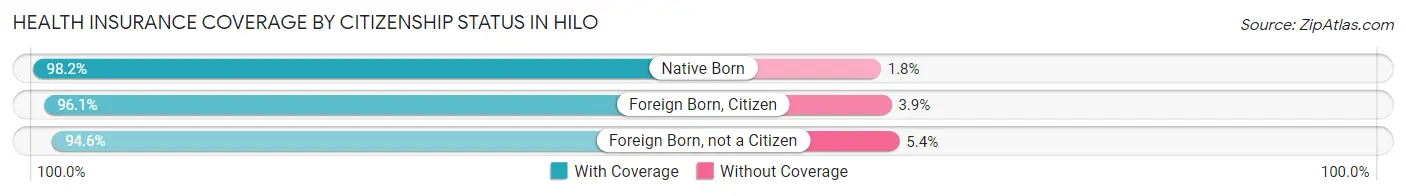
| Citizenship Status | With Coverage | Without Coverage |
| Native Born | 2,381 (98.2%) | 43 (1.8%) |
| Foreign Born, Citizen | 8,201 (96.1%) | 329 (3.9%) |
| Foreign Born, not a Citizen | 3,606 (94.6%) | 207 (5.4%) |
Health Insurance Coverage by Household Income in Hilo
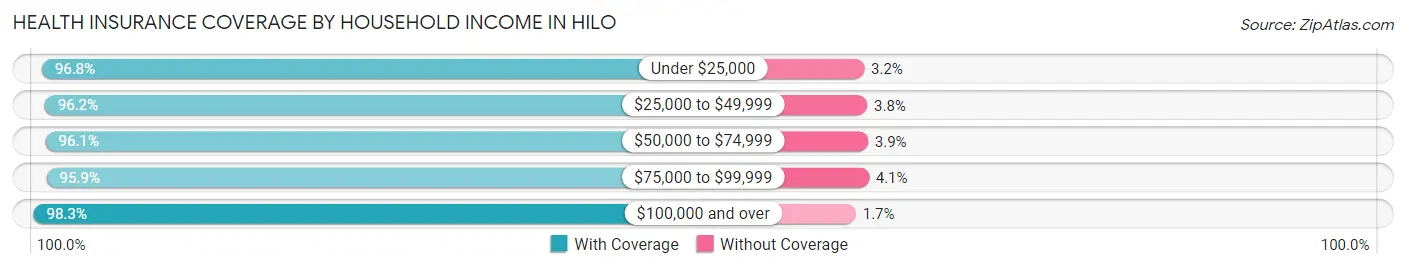
| Household Income | With Coverage | Without Coverage |
| Under $25,000 | 5,443 (96.8%) | 182 (3.2%) |
| $25,000 to $49,999 | 5,419 (96.2%) | 214 (3.8%) |
| $50,000 to $74,999 | 6,020 (96.1%) | 247 (3.9%) |
| $75,000 to $99,999 | 5,743 (95.9%) | 247 (4.1%) |
| $100,000 and over | 22,585 (98.3%) | 387 (1.7%) |
Public vs Private Health Insurance Coverage by Age in Hilo
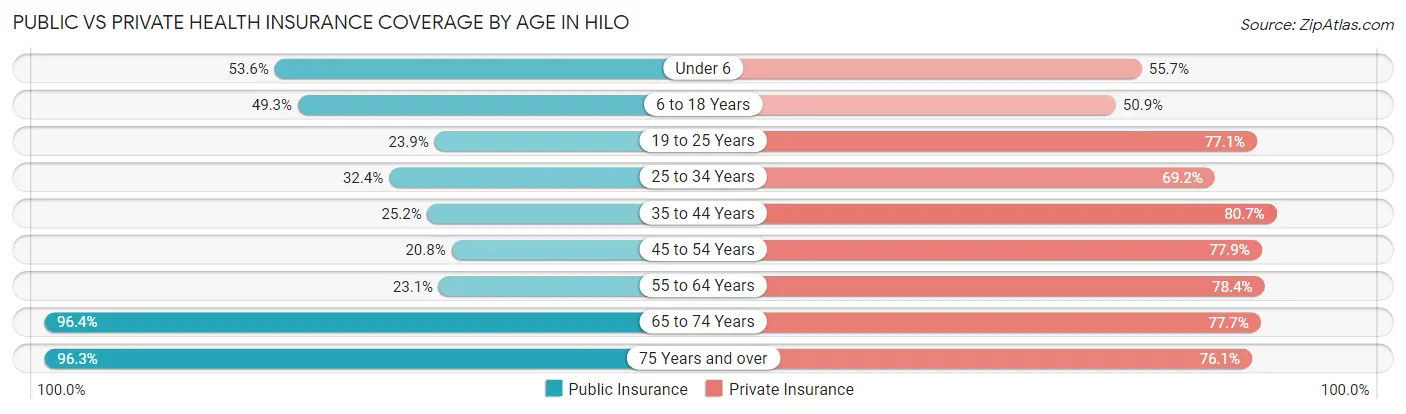
| Age Bracket | Public Insurance | Private Insurance |
| Under 6 | 1,299 (53.6%) | 1,350 (55.7%) |
| 6 to 18 Years | 4,204 (49.3%) | 4,340 (50.9%) |
| 19 to 25 Years | 912 (23.9%) | 2,938 (77.0%) |
| 25 to 34 Years | 1,658 (32.4%) | 3,545 (69.2%) |
| 35 to 44 Years | 1,504 (25.2%) | 4,813 (80.7%) |
| 45 to 54 Years | 980 (20.8%) | 3,677 (77.9%) |
| 55 to 64 Years | 1,426 (23.1%) | 4,842 (78.4%) |
| 65 to 74 Years | 5,528 (96.4%) | 4,458 (77.7%) |
| 75 Years and over | 4,474 (96.3%) | 3,535 (76.1%) |
| Total | 21,985 (46.7%) | 33,498 (71.1%) |
Disability Status by Sex by Age in Hilo
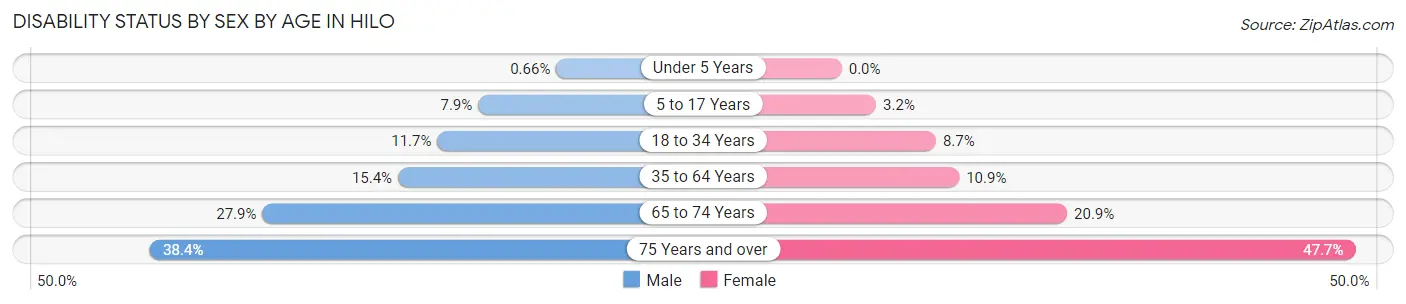
| Age Bracket | Male | Female |
| Under 5 Years | 8 (0.7%) | 0 (0.0%) |
| 5 to 17 Years | 333 (7.9%) | 120 (3.2%) |
| 18 to 34 Years | 564 (11.7%) | 437 (8.7%) |
| 35 to 64 Years | 1,210 (15.3%) | 979 (10.9%) |
| 65 to 74 Years | 758 (27.9%) | 632 (20.9%) |
| 75 Years and over | 745 (38.4%) | 1,288 (47.6%) |
Disability Class by Sex by Age in Hilo
Disability Class: Hearing Difficulty
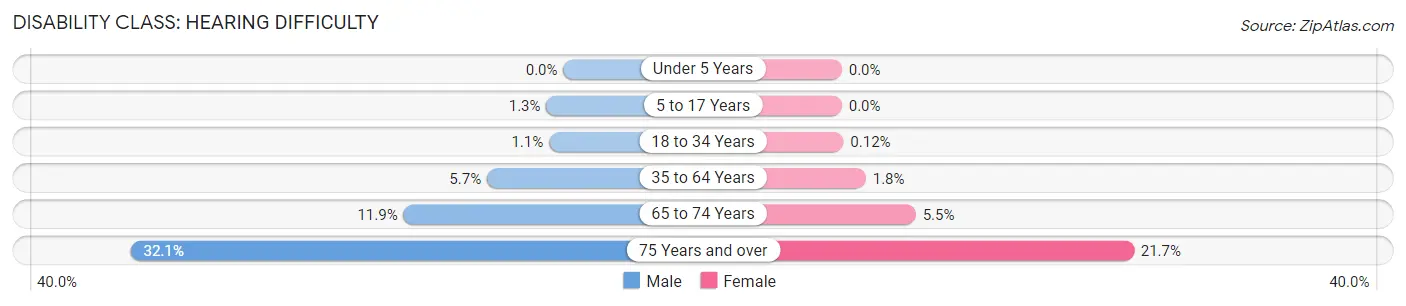
| Age Bracket | Male | Female |
| Under 5 Years | 0 (0.0%) | 0 (0.0%) |
| 5 to 17 Years | 53 (1.3%) | 0 (0.0%) |
| 18 to 34 Years | 51 (1.1%) | 6 (0.1%) |
| 35 to 64 Years | 447 (5.7%) | 160 (1.8%) |
| 65 to 74 Years | 322 (11.9%) | 166 (5.5%) |
| 75 Years and over | 624 (32.1%) | 586 (21.7%) |
Disability Class: Vision Difficulty
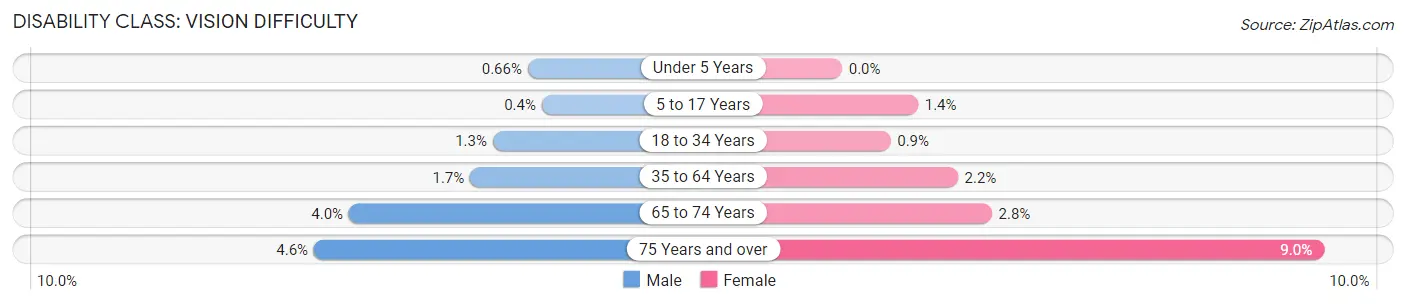
| Age Bracket | Male | Female |
| Under 5 Years | 8 (0.7%) | 0 (0.0%) |
| 5 to 17 Years | 17 (0.4%) | 53 (1.4%) |
| 18 to 34 Years | 63 (1.3%) | 45 (0.9%) |
| 35 to 64 Years | 136 (1.7%) | 193 (2.1%) |
| 65 to 74 Years | 108 (4.0%) | 84 (2.8%) |
| 75 Years and over | 90 (4.6%) | 242 (8.9%) |
Disability Class: Cognitive Difficulty
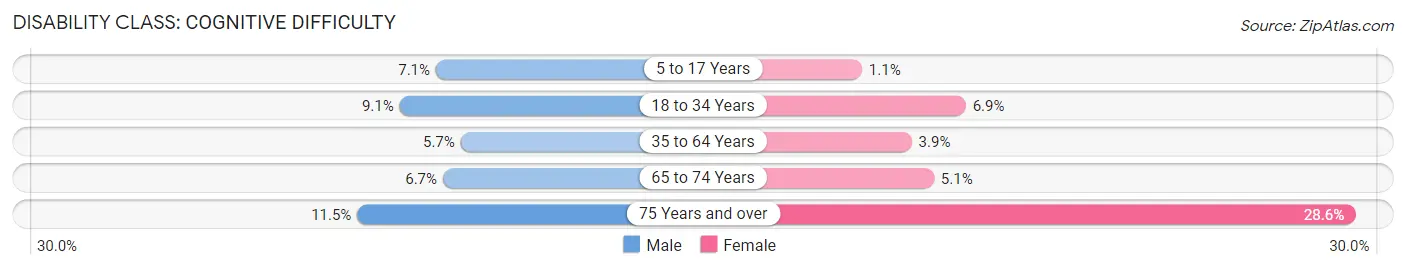
| Age Bracket | Male | Female |
| 5 to 17 Years | 299 (7.1%) | 42 (1.1%) |
| 18 to 34 Years | 440 (9.1%) | 345 (6.9%) |
| 35 to 64 Years | 451 (5.7%) | 349 (3.9%) |
| 65 to 74 Years | 182 (6.7%) | 155 (5.1%) |
| 75 Years and over | 223 (11.5%) | 774 (28.6%) |
Disability Class: Ambulatory Difficulty
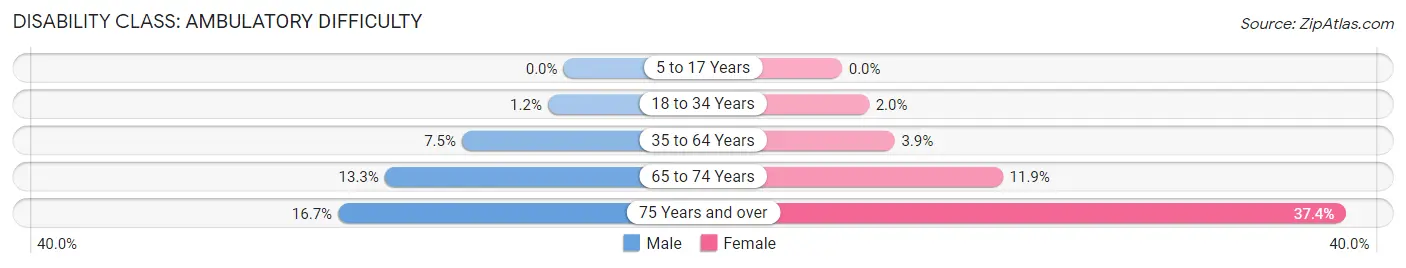
| Age Bracket | Male | Female |
| 5 to 17 Years | 0 (0.0%) | 0 (0.0%) |
| 18 to 34 Years | 56 (1.2%) | 100 (2.0%) |
| 35 to 64 Years | 594 (7.5%) | 351 (3.9%) |
| 65 to 74 Years | 360 (13.3%) | 361 (11.9%) |
| 75 Years and over | 325 (16.7%) | 1,012 (37.4%) |
Disability Class: Self-Care Difficulty
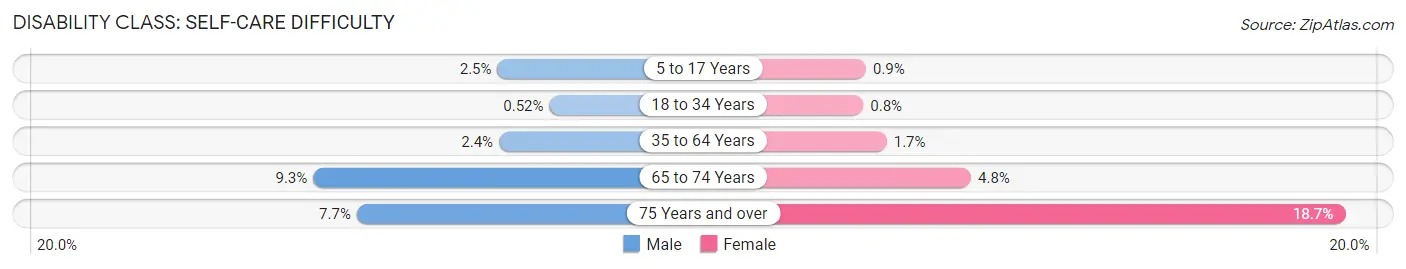
| Age Bracket | Male | Female |
| 5 to 17 Years | 103 (2.5%) | 34 (0.9%) |
| 18 to 34 Years | 25 (0.5%) | 40 (0.8%) |
| 35 to 64 Years | 188 (2.4%) | 150 (1.7%) |
| 65 to 74 Years | 252 (9.3%) | 145 (4.8%) |
| 75 Years and over | 149 (7.7%) | 505 (18.7%) |
Technology Access in Hilo
Computing Device Access in Hilo
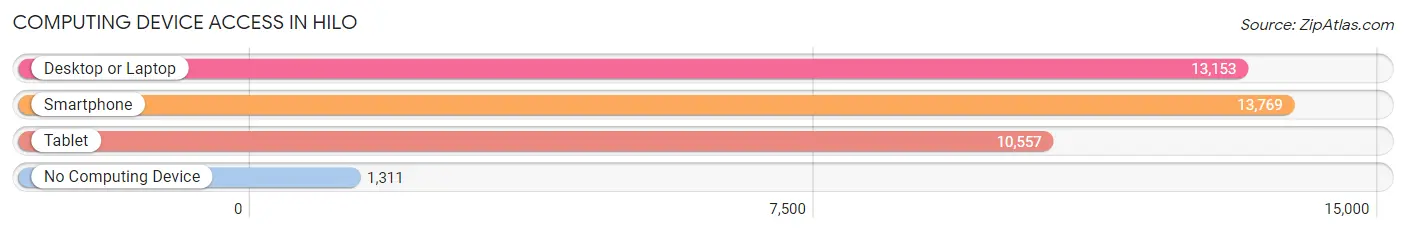
| Device Type | # Households | % Households |
| Desktop or Laptop | 13,153 | 78.5% |
| Smartphone | 13,769 | 82.2% |
| Tablet | 10,557 | 63.0% |
| No Computing Device | 1,311 | 7.8% |
| Total | 16,752 | 100.0% |
Internet Access in Hilo
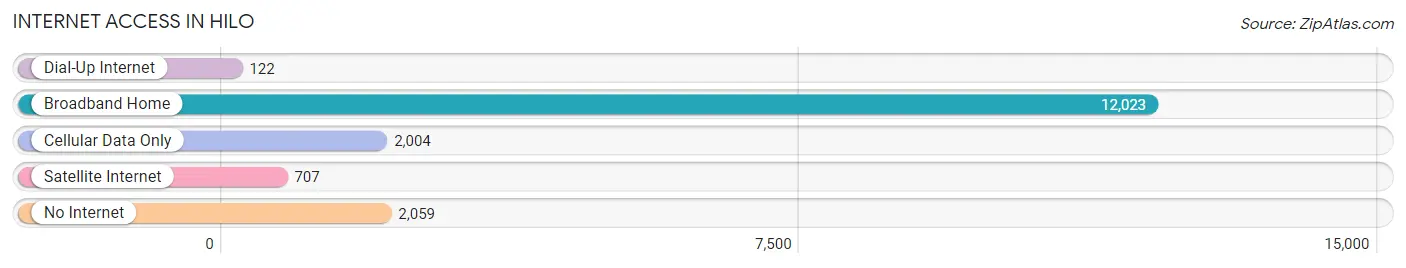
| Internet Type | # Households | % Households |
| Dial-Up Internet | 122 | 0.7% |
| Broadband Home | 12,023 | 71.8% |
| Cellular Data Only | 2,004 | 12.0% |
| Satellite Internet | 707 | 4.2% |
| No Internet | 2,059 | 12.3% |
| Total | 16,752 | 100.0% |
Hilo Summary
Hilo, Hawaii is a city located on the Big Island of Hawaii. It is the county seat of Hawaii County and the largest city in the state. The city is situated on the east coast of the island, along the Wailuku River. Hilo is known for its lush tropical rainforest, beautiful beaches, and active volcanoes.
Geography
Hilo is located on the east coast of the Big Island of Hawaii, along the Wailuku River. The city is situated at an elevation of 38 feet (11.6 m) above sea level. The city is surrounded by lush tropical rainforest and is home to two active volcanoes, Mauna Loa and Kilauea. The city is also home to several waterfalls, including Rainbow Falls and Akaka Falls.
Climate
Hilo has a tropical climate with warm temperatures year-round. The average high temperature in the summer is around 85°F (29°C) and the average low temperature in the winter is around 65°F (18°C). The city receives an average of 128 inches (3,250 mm) of rain per year, making it one of the wettest cities in the United States.
Demographics
As of the 2010 census, the population of Hilo was 43,263. The racial makeup of the city was 44.2% White, 0.4% African American, 0.7% Native American, 28.7% Asian, 10.2% Pacific Islander, 0.2% from other races, and 15.2% from two or more races. The median household income in Hilo was $50,945 in 2019.
Economy
Hilo is the economic center of the Big Island of Hawaii. The city is home to several major employers, including the University of Hawaii at Hilo, the Hawaii County government, and the Hilo Medical Center. Tourism is also a major industry in the city, with visitors coming to experience the city’s natural beauty and cultural attractions.
Hilo is also home to several major industries, including agriculture, fishing, and forestry. The city is home to several large agricultural companies, including Dole Food Company and Del Monte Foods. The city is also home to several fishing companies, including Hawaii Fish Company and Hilo Fish Company.
Conclusion
Hilo, Hawaii is a city located on the Big Island of Hawaii. It is the county seat of Hawaii County and the largest city in the state. The city is situated on the east coast of the island, along the Wailuku River. Hilo is known for its lush tropical rainforest, beautiful beaches, and active volcanoes. The city has a tropical climate with warm temperatures year-round and receives an average of 128 inches (3,250 mm) of rain per year. As of the 2010 census, the population of Hilo was 43,263. The city is the economic center of the Big Island of Hawaii and is home to several major employers, including the University of Hawaii at Hilo, the Hawaii County government, and the Hilo Medical Center. Tourism is also a major industry in the city, with visitors coming to experience the city’s natural beauty and cultural attractions. Hilo is also home to several major industries, including agriculture, fishing, and forestry.
Common Questions
What is Per Capita Income in Hilo?
Per Capita income in Hilo is $37,707.
What is the Median Family Income in Hilo?
Median Family Income in Hilo is $98,243.
What is the Median Household income in Hilo?
Median Household Income in Hilo is $75,589.
What is Income or Wage Gap in Hilo?
Income or Wage Gap in Hilo is 17.2%.
Women in Hilo earn 82.8 cents for every dollar earned by a man.
What is Family Income Deficit in Hilo?
Family Income Deficit in Hilo is $11,564.
Families that are below poverty line in Hilo earn $11,564 less on average than the poverty threshold level.
What is Inequality or Gini Index in Hilo?
Inequality or Gini Index in Hilo is 0.48.
What is the Total Population of Hilo?
Total Population of Hilo is 47,627.
What is the Total Male Population of Hilo?
Total Male Population of Hilo is 23,040.
What is the Total Female Population of Hilo?
Total Female Population of Hilo is 24,587.
What is the Ratio of Males per 100 Females in Hilo?
There are 93.71 Males per 100 Females in Hilo.
What is the Ratio of Females per 100 Males in Hilo?
There are 106.71 Females per 100 Males in Hilo.
What is the Median Population Age in Hilo?
Median Population Age in Hilo is 41.5 Years.
What is the Average Family Size in Hilo
Average Family Size in Hilo is 3.4 People.
What is the Average Household Size in Hilo
Average Household Size in Hilo is 2.8 People.
How Large is the Labor Force in Hilo?
There are 22,707 People in the Labor Forcein in Hilo.
What is the Percentage of People in the Labor Force in Hilo?
58.8% of People are in the Labor Force in Hilo.
What is the Unemployment Rate in Hilo?
Unemployment Rate in Hilo is 6.8%.