Mission Viejo, CA Map & Demographics
Mission Viejo Map
Mission Viejo Overview
$59,856
PER CAPITA INCOME
$153,683
AVG FAMILY INCOME
$136,570
AVG HOUSEHOLD INCOME
34.6%
WAGE / INCOME GAP [ % ]
65.4¢/ $1
WAGE / INCOME GAP [ $ ]
$11,669
FAMILY INCOME DEFICIT
0.41
INEQUALITY / GINI INDEX
93,233
TOTAL POPULATION
46,397
MALE POPULATION
46,836
FEMALE POPULATION
99.06
MALES / 100 FEMALES
100.95
FEMALES / 100 MALES
46.0
MEDIAN AGE
3.2
AVG FAMILY SIZE
2.8
AVG HOUSEHOLD SIZE
49,015
LABOR FORCE [ PEOPLE ]
63.6%
PERCENT IN LABOR FORCE
4.4%
UNEMPLOYMENT RATE
Income in Mission Viejo
Income Overview in Mission Viejo
Per Capita Income in Mission Viejo is $59,856, while median incomes of families and households are $153,683 and $136,570 respectively.
| Characteristic | Number | Measure |
| Per Capita Income | 93,233 | $59,856 |
| Median Family Income | 25,083 | $153,683 |
| Mean Family Income | 25,083 | $183,793 |
| Median Household Income | 32,650 | $136,570 |
| Mean Household Income | 32,650 | $166,608 |
| Income Deficit | 25,083 | $11,669 |
| Wage / Income Gap (%) | 93,233 | 34.55% |
| Wage / Income Gap ($) | 93,233 | 65.45¢ per $1 |
| Gini / Inequality Index | 93,233 | 0.41 |
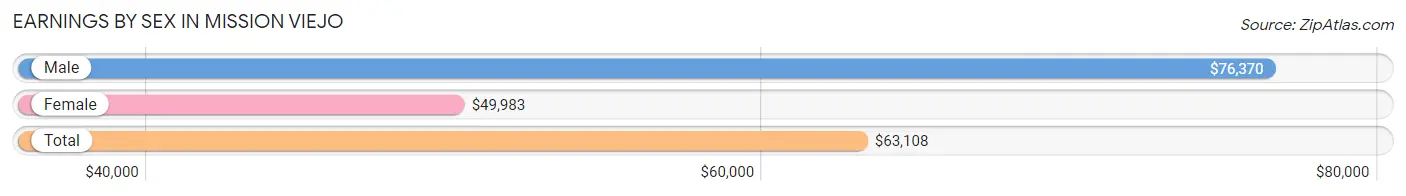
Earnings by Sex in Mission Viejo
Average Earnings in Mission Viejo are $63,108, $76,370 for men and $49,983 for women, a difference of 34.5%.
| Sex | Number | Average Earnings |
| Male | 27,750 (54.6%) | $76,370 |
| Female | 23,035 (45.4%) | $49,983 |
| Total | 50,785 (100.0%) | $63,108 |
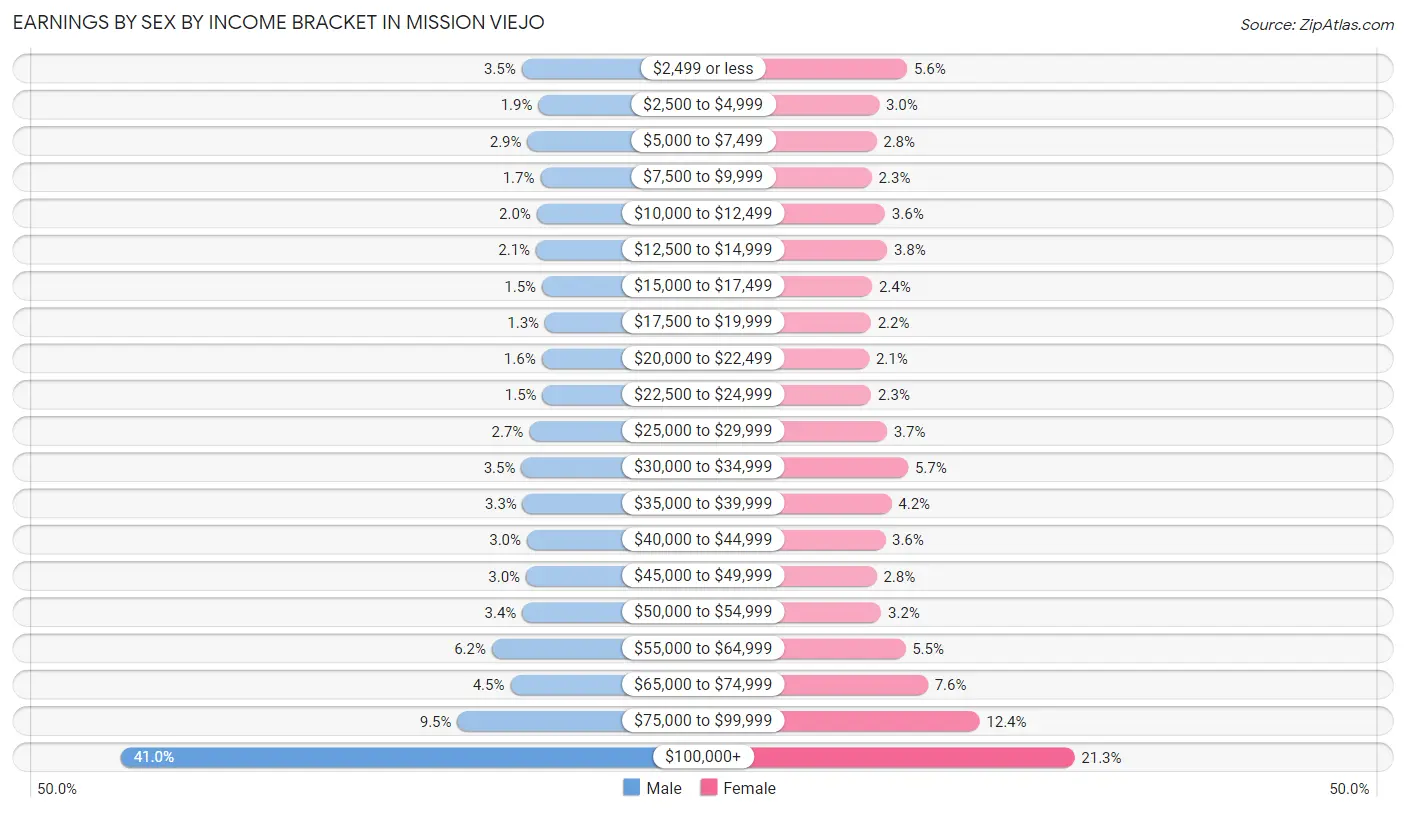
Earnings by Sex by Income Bracket in Mission Viejo
The most common earnings brackets in Mission Viejo are $100,000+ for men (11,376 | 41.0%) and $100,000+ for women (4,910 | 21.3%).
| Income | Male | Female |
| $2,499 or less | 956 (3.5%) | 1,299 (5.6%) |
| $2,500 to $4,999 | 521 (1.9%) | 693 (3.0%) |
| $5,000 to $7,499 | 805 (2.9%) | 636 (2.8%) |
| $7,500 to $9,999 | 470 (1.7%) | 536 (2.3%) |
| $10,000 to $12,499 | 562 (2.0%) | 822 (3.6%) |
| $12,500 to $14,999 | 584 (2.1%) | 867 (3.8%) |
| $15,000 to $17,499 | 426 (1.5%) | 543 (2.4%) |
| $17,500 to $19,999 | 349 (1.3%) | 515 (2.2%) |
| $20,000 to $22,499 | 438 (1.6%) | 478 (2.1%) |
| $22,500 to $24,999 | 413 (1.5%) | 525 (2.3%) |
| $25,000 to $29,999 | 757 (2.7%) | 861 (3.7%) |
| $30,000 to $34,999 | 963 (3.5%) | 1,319 (5.7%) |
| $35,000 to $39,999 | 928 (3.3%) | 960 (4.2%) |
| $40,000 to $44,999 | 818 (2.9%) | 824 (3.6%) |
| $45,000 to $49,999 | 843 (3.0%) | 641 (2.8%) |
| $50,000 to $54,999 | 940 (3.4%) | 740 (3.2%) |
| $55,000 to $64,999 | 1,728 (6.2%) | 1,260 (5.5%) |
| $65,000 to $74,999 | 1,248 (4.5%) | 1,745 (7.6%) |
| $75,000 to $99,999 | 2,625 (9.5%) | 2,861 (12.4%) |
| $100,000+ | 11,376 (41.0%) | 4,910 (21.3%) |
| Total | 27,750 (100.0%) | 23,035 (100.0%) |
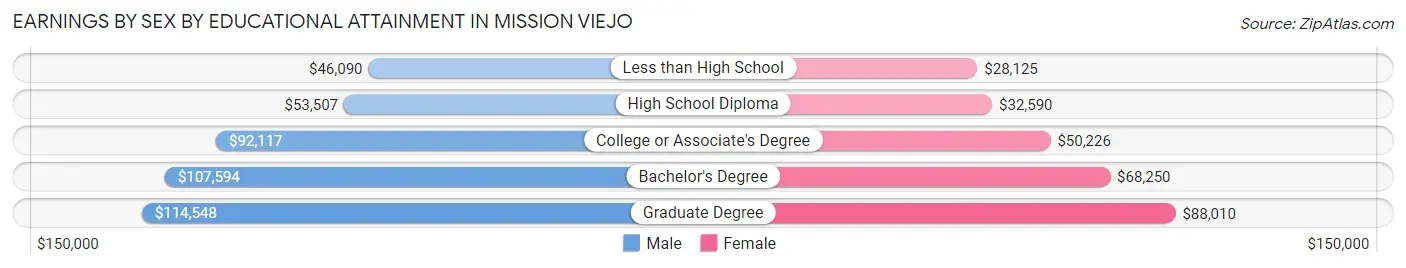
Earnings by Sex by Educational Attainment in Mission Viejo
Average earnings in Mission Viejo are $93,285 for men and $58,620 for women, a difference of 37.2%. Men with an educational attainment of graduate degree enjoy the highest average annual earnings of $114,548, while those with less than high school education earn the least with $46,090. Women with an educational attainment of graduate degree earn the most with the average annual earnings of $88,010, while those with less than high school education have the smallest earnings of $28,125.
| Educational Attainment | Male Income | Female Income |
| Less than High School | $46,090 | $28,125 |
| High School Diploma | $53,507 | $32,590 |
| College or Associate's Degree | $92,117 | $50,226 |
| Bachelor's Degree | $107,594 | $68,250 |
| Graduate Degree | $114,548 | $88,010 |
| Total | $93,285 | $58,620 |
Family Income in Mission Viejo
Family Income Brackets in Mission Viejo
According to the Mission Viejo family income data, there are 8,654 families falling into the $200,000+ income range, which is the most common income bracket and makes up 34.5% of all families. Conversely, the $10,000 to $14,999 income bracket is the least frequent group with only 150 families (0.6%) belonging to this category.
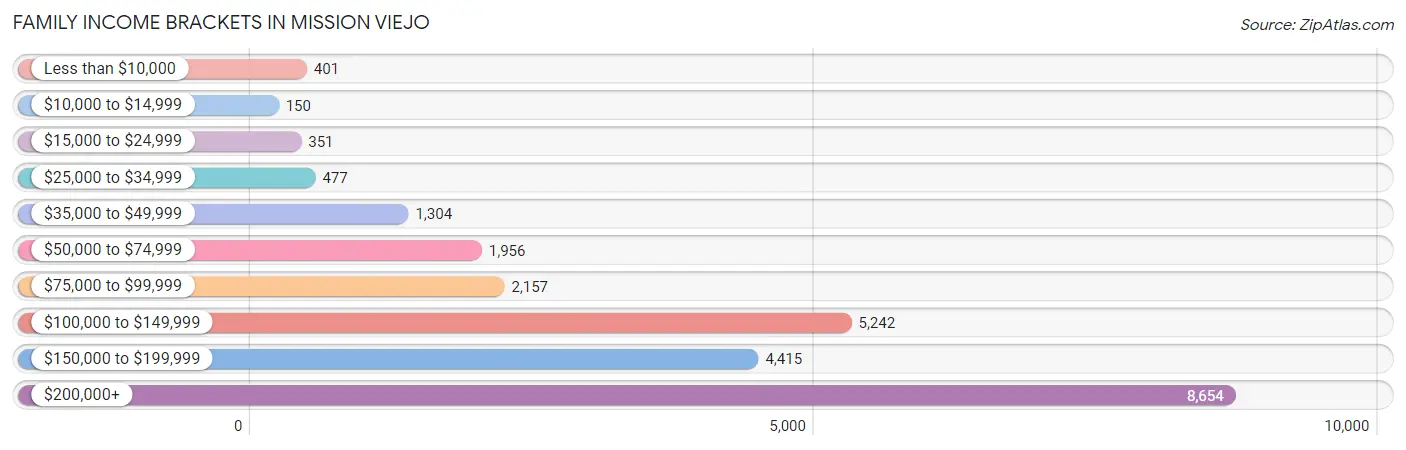
| Income Bracket | # Families | % Families |
| Less than $10,000 | 401 | 1.6% |
| $10,000 to $14,999 | 150 | 0.6% |
| $15,000 to $24,999 | 351 | 1.4% |
| $25,000 to $34,999 | 477 | 1.9% |
| $35,000 to $49,999 | 1,304 | 5.2% |
| $50,000 to $74,999 | 1,956 | 7.8% |
| $75,000 to $99,999 | 2,157 | 8.6% |
| $100,000 to $149,999 | 5,242 | 20.9% |
| $150,000 to $199,999 | 4,415 | 17.6% |
| $200,000+ | 8,654 | 34.5% |
Family Income by Famaliy Size in Mission Viejo
6-person families (1,012 | 4.0%) account for the highest median family income in Mission Viejo with $214,309 per family, while 2-person families (11,115 | 44.3%) have the highest median income of $66,272 per family member.
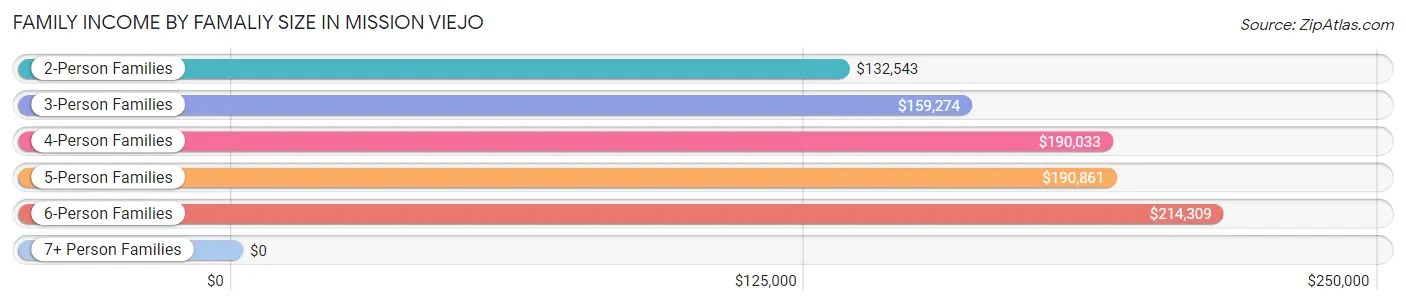
| Income Bracket | # Families | Median Income |
| 2-Person Families | 11,115 (44.3%) | $132,543 |
| 3-Person Families | 5,716 (22.8%) | $159,274 |
| 4-Person Families | 4,951 (19.7%) | $190,033 |
| 5-Person Families | 1,953 (7.8%) | $190,861 |
| 6-Person Families | 1,012 (4.0%) | $214,309 |
| 7+ Person Families | 336 (1.3%) | $0 |
| Total | 25,083 (100.0%) | $153,683 |
Family Income by Number of Earners in Mission Viejo
The median family income in Mission Viejo is $153,683, with families comprising 3+ earners (4,226) having the highest median family income of $197,406, while families with no earners (3,501) have the lowest median family income of $87,356, accounting for 16.9% and 14.0% of families, respectively.
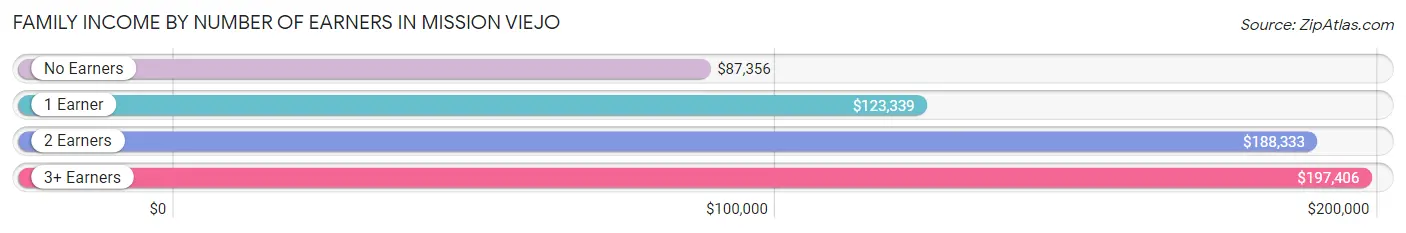
| Number of Earners | # Families | Median Income |
| No Earners | 3,501 (14.0%) | $87,356 |
| 1 Earner | 6,172 (24.6%) | $123,339 |
| 2 Earners | 11,184 (44.6%) | $188,333 |
| 3+ Earners | 4,226 (16.9%) | $197,406 |
| Total | 25,083 (100.0%) | $153,683 |
Household Income in Mission Viejo
Household Income Brackets in Mission Viejo
With 9,632 households falling in the category, the $200,000+ income range is the most frequent in Mission Viejo, accounting for 29.5% of all households. In contrast, only 392 households (1.2%) fall into the $10,000 to $14,999 income bracket, making it the least populous group.
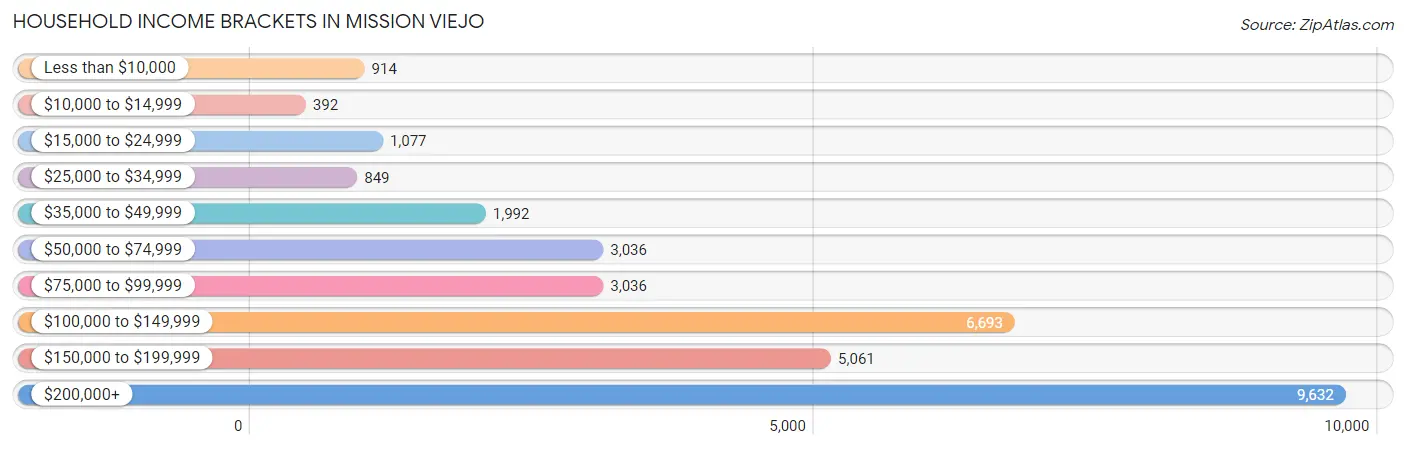
| Income Bracket | # Households | % Households |
| Less than $10,000 | 914 | 2.8% |
| $10,000 to $14,999 | 392 | 1.2% |
| $15,000 to $24,999 | 1,077 | 3.3% |
| $25,000 to $34,999 | 849 | 2.6% |
| $35,000 to $49,999 | 1,992 | 6.1% |
| $50,000 to $74,999 | 3,036 | 9.3% |
| $75,000 to $99,999 | 3,036 | 9.3% |
| $100,000 to $149,999 | 6,693 | 20.5% |
| $150,000 to $199,999 | 5,061 | 15.5% |
| $200,000+ | 9,632 | 29.5% |
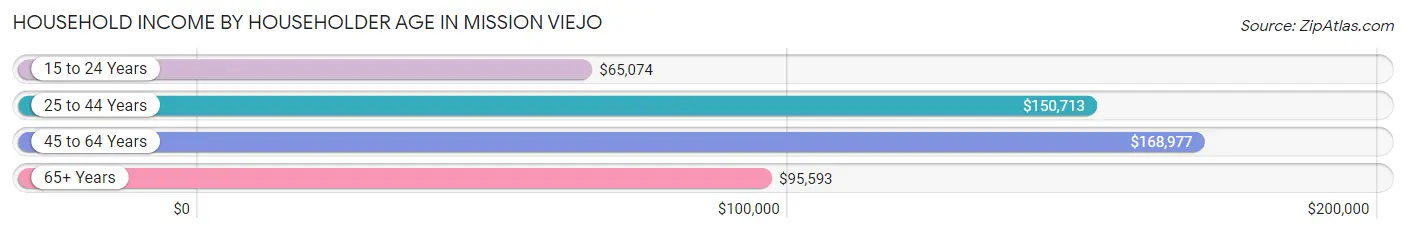
Household Income by Householder Age in Mission Viejo
The median household income in Mission Viejo is $136,570, with the highest median household income of $168,977 found in the 45 to 64 years age bracket for the primary householder. A total of 13,429 households (41.1%) fall into this category. Meanwhile, the 15 to 24 years age bracket for the primary householder has the lowest median household income of $65,074, with 383 households (1.2%) in this group.
| Income Bracket | # Households | Median Income |
| 15 to 24 Years | 383 (1.2%) | $65,074 |
| 25 to 44 Years | 7,891 (24.2%) | $150,713 |
| 45 to 64 Years | 13,429 (41.1%) | $168,977 |
| 65+ Years | 10,947 (33.5%) | $95,593 |
| Total | 32,650 (100.0%) | $136,570 |
Poverty in Mission Viejo
Income Below Poverty by Sex and Age in Mission Viejo
With 3.9% poverty level for males and 5.9% for females among the residents of Mission Viejo, 75 year old and over males and 75 year old and over females are the most vulnerable to poverty, with 312 males (8.7%) and 784 females (16.5%) in their respective age groups living below the poverty level.
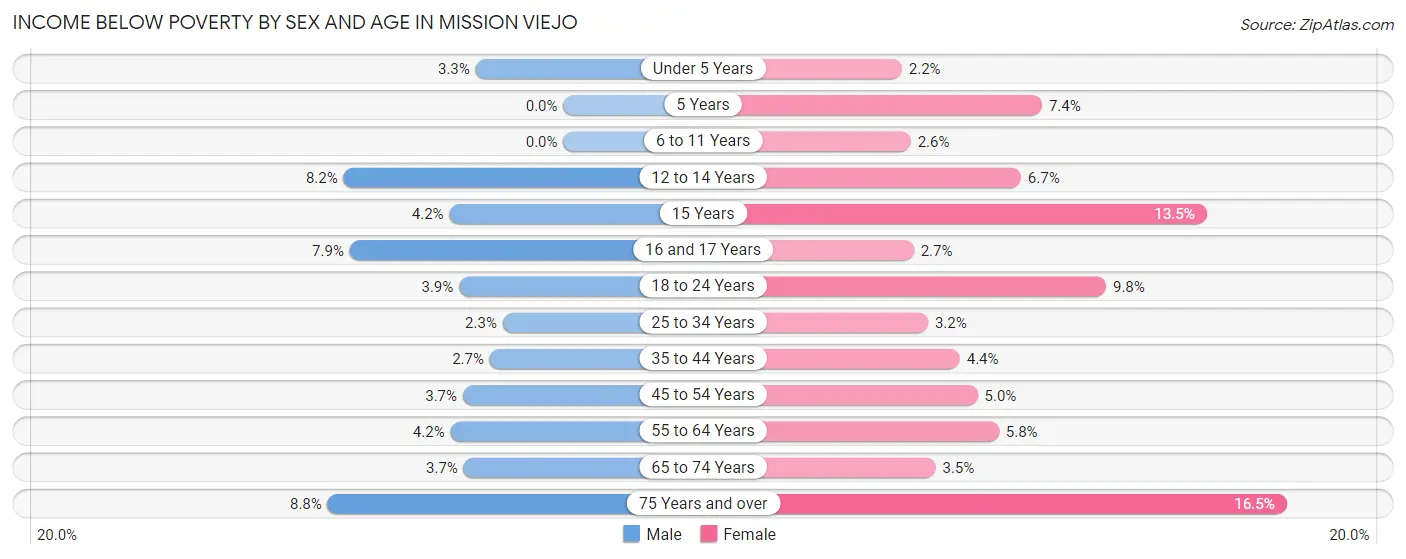
| Age Bracket | Male | Female |
| Under 5 Years | 79 (3.3%) | 61 (2.2%) |
| 5 Years | 0 (0.0%) | 33 (7.4%) |
| 6 to 11 Years | 0 (0.0%) | 76 (2.6%) |
| 12 to 14 Years | 134 (8.2%) | 104 (6.7%) |
| 15 Years | 19 (4.2%) | 65 (13.5%) |
| 16 and 17 Years | 98 (7.9%) | 26 (2.7%) |
| 18 to 24 Years | 155 (3.9%) | 240 (9.8%) |
| 25 to 34 Years | 103 (2.2%) | 146 (3.2%) |
| 35 to 44 Years | 159 (2.7%) | 258 (4.4%) |
| 45 to 54 Years | 236 (3.7%) | 327 (5.0%) |
| 55 to 64 Years | 288 (4.2%) | 416 (5.8%) |
| 65 to 74 Years | 218 (3.7%) | 213 (3.5%) |
| 75 Years and over | 312 (8.7%) | 784 (16.5%) |
| Total | 1,801 (3.9%) | 2,749 (5.9%) |
Income Above Poverty by Sex and Age in Mission Viejo
According to the poverty statistics in Mission Viejo, males aged 5 years and females aged under 5 years are the age groups that are most secure financially, with 100.0% of males and 97.8% of females in these age groups living above the poverty line.
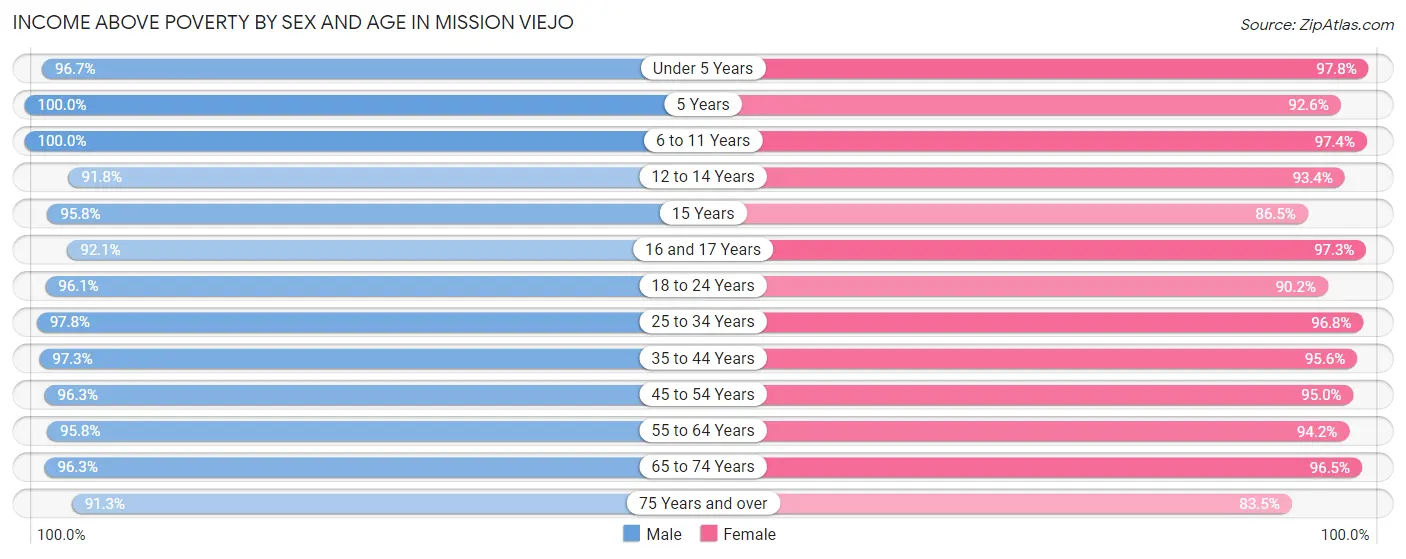
| Age Bracket | Male | Female |
| Under 5 Years | 2,346 (96.7%) | 2,679 (97.8%) |
| 5 Years | 282 (100.0%) | 411 (92.6%) |
| 6 to 11 Years | 3,098 (100.0%) | 2,896 (97.4%) |
| 12 to 14 Years | 1,508 (91.8%) | 1,461 (93.3%) |
| 15 Years | 430 (95.8%) | 415 (86.5%) |
| 16 and 17 Years | 1,138 (92.1%) | 949 (97.3%) |
| 18 to 24 Years | 3,854 (96.1%) | 2,207 (90.2%) |
| 25 to 34 Years | 4,478 (97.8%) | 4,411 (96.8%) |
| 35 to 44 Years | 5,675 (97.3%) | 5,627 (95.6%) |
| 45 to 54 Years | 6,093 (96.3%) | 6,166 (95.0%) |
| 55 to 64 Years | 6,590 (95.8%) | 6,719 (94.2%) |
| 65 to 74 Years | 5,667 (96.3%) | 5,911 (96.5%) |
| 75 Years and over | 3,254 (91.2%) | 3,964 (83.5%) |
| Total | 44,413 (96.1%) | 43,816 (94.1%) |
Income Below Poverty Among Married-Couple Families in Mission Viejo
The poverty statistics for married-couple families in Mission Viejo show that 2.2% or 479 of the total 21,444 families live below the poverty line. Families with no children have the highest poverty rate of 2.5%, comprising of 325 families. On the other hand, families with 5 or more children have the lowest poverty rate of 0.0%, which includes 0 families.
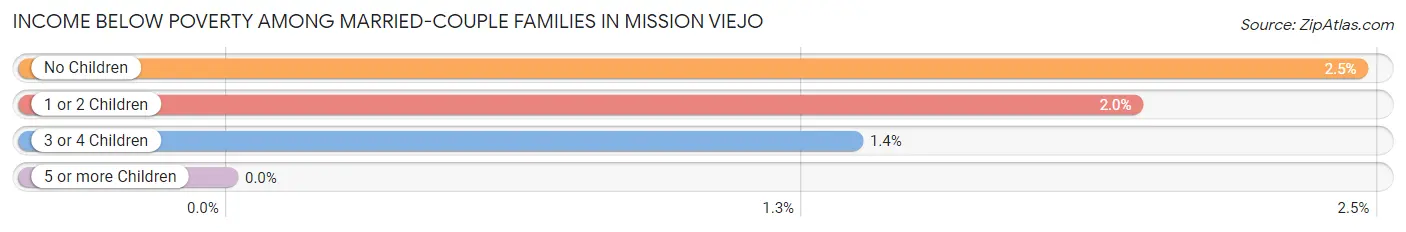
| Children | Above Poverty | Below Poverty |
| No Children | 12,891 (97.5%) | 325 (2.5%) |
| 1 or 2 Children | 7,010 (98.0%) | 141 (2.0%) |
| 3 or 4 Children | 946 (98.6%) | 13 (1.4%) |
| 5 or more Children | 118 (100.0%) | 0 (0.0%) |
| Total | 20,965 (97.8%) | 479 (2.2%) |
Income Below Poverty Among Single-Parent Households in Mission Viejo
According to the poverty data in Mission Viejo, 4.0% or 52 single-father households and 10.6% or 249 single-mother households are living below the poverty line. Among single-father households, those with 3 or 4 children have the highest poverty rate, with 12 households (75.0%) experiencing poverty. Likewise, among single-mother households, those with 1 or 2 children have the highest poverty rate, with 178 households (19.3%) falling below the poverty line.
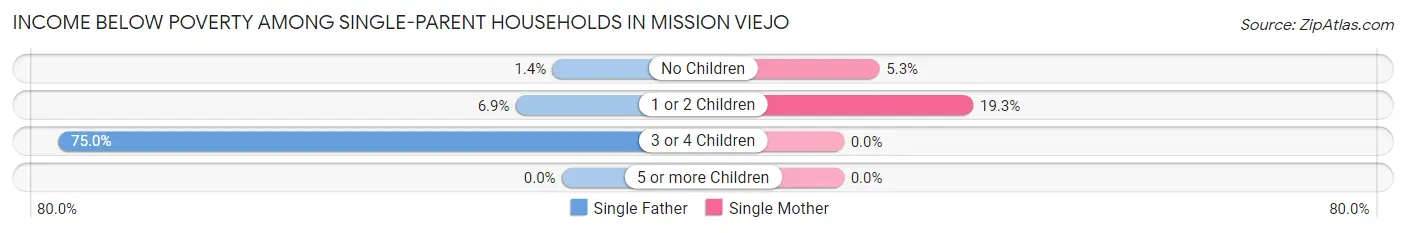
| Children | Single Father | Single Mother |
| No Children | 12 (1.4%) | 71 (5.3%) |
| 1 or 2 Children | 28 (6.9%) | 178 (19.3%) |
| 3 or 4 Children | 12 (75.0%) | 0 (0.0%) |
| 5 or more Children | 0 (0.0%) | 0 (0.0%) |
| Total | 52 (4.0%) | 249 (10.6%) |
Income Below Poverty Among Married-Couple vs Single-Parent Households in Mission Viejo
The poverty data for Mission Viejo shows that 479 of the married-couple family households (2.2%) and 301 of the single-parent households (8.3%) are living below the poverty level. Within the married-couple family households, those with no children have the highest poverty rate, with 325 households (2.5%) falling below the poverty line. Among the single-parent households, those with 1 or 2 children have the highest poverty rate, with 206 household (15.5%) living below poverty.
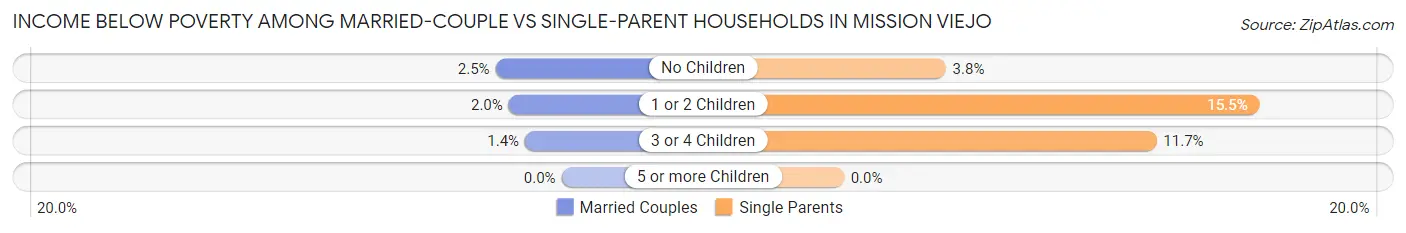
| Children | Married-Couple Families | Single-Parent Households |
| No Children | 325 (2.5%) | 83 (3.8%) |
| 1 or 2 Children | 141 (2.0%) | 206 (15.5%) |
| 3 or 4 Children | 13 (1.4%) | 12 (11.7%) |
| 5 or more Children | 0 (0.0%) | 0 (0.0%) |
| Total | 479 (2.2%) | 301 (8.3%) |
Race in Mission Viejo
The most populous races in Mission Viejo are White / Caucasian (63,187 | 67.8%), Hispanic or Latino (18,341 | 19.7%), and Asian (13,022 | 14.0%).
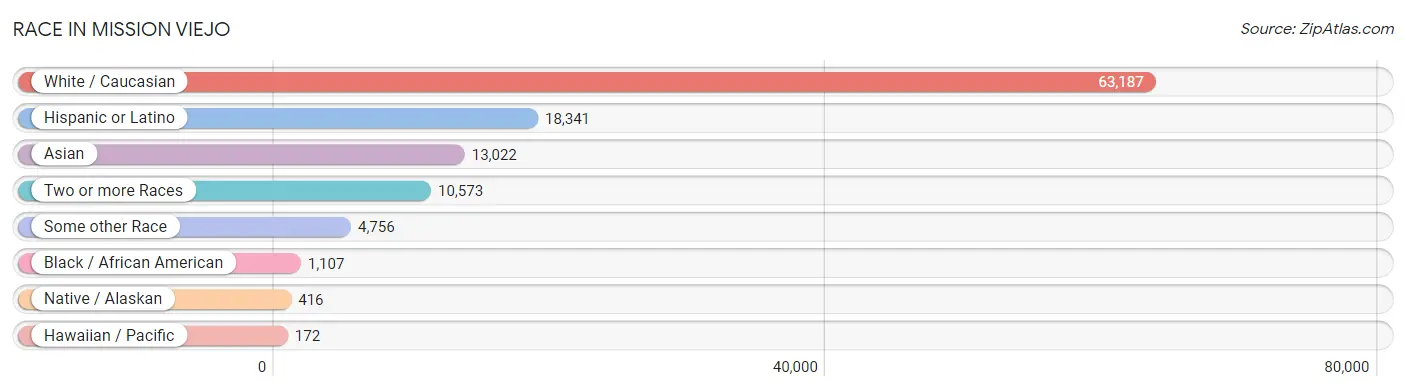
| Race | # Population | % Population |
| Asian | 13,022 | 14.0% |
| Black / African American | 1,107 | 1.2% |
| Hawaiian / Pacific | 172 | 0.2% |
| Hispanic or Latino | 18,341 | 19.7% |
| Native / Alaskan | 416 | 0.4% |
| White / Caucasian | 63,187 | 67.8% |
| Two or more Races | 10,573 | 11.3% |
| Some other Race | 4,756 | 5.1% |
| Total | 93,233 | 100.0% |
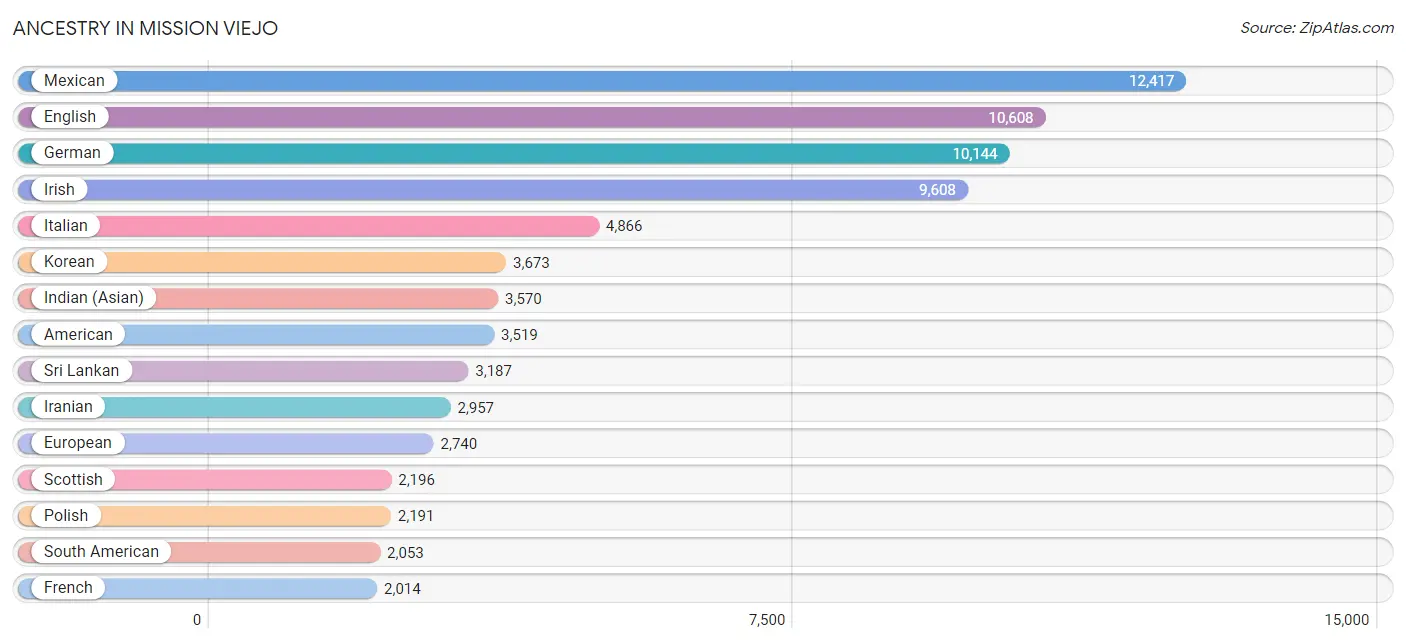
Ancestry in Mission Viejo
The most populous ancestries reported in Mission Viejo are Mexican (12,417 | 13.3%), English (10,608 | 11.4%), German (10,144 | 10.9%), Irish (9,608 | 10.3%), and Italian (4,866 | 5.2%), together accounting for 51.1% of all Mission Viejo residents.
| Ancestry | # Population | % Population |
| Afghan | 48 | 0.1% |
| African | 53 | 0.1% |
| American | 3,519 | 3.8% |
| Apache | 10 | 0.0% |
| Arab | 1,542 | 1.7% |
| Argentinean | 126 | 0.1% |
| Armenian | 223 | 0.2% |
| Assyrian / Chaldean / Syriac | 106 | 0.1% |
| Australian | 105 | 0.1% |
| Austrian | 289 | 0.3% |
| Bangladeshi | 49 | 0.1% |
| Basque | 46 | 0.1% |
| Belgian | 62 | 0.1% |
| Bhutanese | 1,940 | 2.1% |
| Blackfeet | 17 | 0.0% |
| Bolivian | 157 | 0.2% |
| Brazilian | 120 | 0.1% |
| British | 817 | 0.9% |
| British West Indian | 8 | 0.0% |
| Bulgarian | 28 | 0.0% |
| Burmese | 952 | 1.0% |
| Canadian | 503 | 0.5% |
| Cape Verdean | 5 | 0.0% |
| Central American | 1,539 | 1.7% |
| Central American Indian | 69 | 0.1% |
| Cherokee | 146 | 0.2% |
| Chilean | 61 | 0.1% |
| Chippewa | 26 | 0.0% |
| Colombian | 247 | 0.3% |
| Costa Rican | 71 | 0.1% |
| Croatian | 228 | 0.2% |
| Cuban | 367 | 0.4% |
| Czech | 422 | 0.4% |
| Czechoslovakian | 25 | 0.0% |
| Danish | 757 | 0.8% |
| Dominican | 216 | 0.2% |
| Dutch | 997 | 1.1% |
| Eastern European | 226 | 0.2% |
| Ecuadorian | 137 | 0.2% |
| Egyptian | 425 | 0.5% |
| English | 10,608 | 11.4% |
| Estonian | 67 | 0.1% |
| European | 2,740 | 2.9% |
| Filipino | 332 | 0.4% |
| Finnish | 232 | 0.3% |
| French | 2,014 | 2.2% |
| French Canadian | 541 | 0.6% |
| German | 10,144 | 10.9% |
| Greek | 466 | 0.5% |
| Guamanian / Chamorro | 82 | 0.1% |
| Guatemalan | 908 | 1.0% |
| Guyanese | 8 | 0.0% |
| Haitian | 21 | 0.0% |
| Honduran | 30 | 0.0% |
| Hungarian | 462 | 0.5% |
| Icelander | 105 | 0.1% |
| Indian (Asian) | 3,570 | 3.8% |
| Indonesian | 54 | 0.1% |
| Iranian | 2,957 | 3.2% |
| Iraqi | 26 | 0.0% |
| Irish | 9,608 | 10.3% |
| Israeli | 7 | 0.0% |
| Italian | 4,866 | 5.2% |
| Jamaican | 52 | 0.1% |
| Japanese | 468 | 0.5% |
| Jordanian | 216 | 0.2% |
| Korean | 3,673 | 3.9% |
| Laotian | 878 | 0.9% |
| Latvian | 49 | 0.1% |
| Lebanese | 419 | 0.4% |
| Lithuanian | 216 | 0.2% |
| Luxembourger | 15 | 0.0% |
| Macedonian | 26 | 0.0% |
| Maltese | 43 | 0.1% |
| Mexican | 12,417 | 13.3% |
| Mexican American Indian | 305 | 0.3% |
| Mongolian | 9 | 0.0% |
| Moroccan | 31 | 0.0% |
| Native Hawaiian | 245 | 0.3% |
| Navajo | 22 | 0.0% |
| New Zealander | 83 | 0.1% |
| Nicaraguan | 152 | 0.2% |
| Nigerian | 3 | 0.0% |
| Northern European | 187 | 0.2% |
| Norwegian | 1,356 | 1.5% |
| Okinawan | 21 | 0.0% |
| Osage | 17 | 0.0% |
| Pakistani | 376 | 0.4% |
| Palestinian | 111 | 0.1% |
| Panamanian | 9 | 0.0% |
| Pennsylvania German | 6 | 0.0% |
| Peruvian | 355 | 0.4% |
| Polish | 2,191 | 2.4% |
| Portuguese | 354 | 0.4% |
| Puerto Rican | 599 | 0.6% |
| Romanian | 341 | 0.4% |
| Russian | 938 | 1.0% |
| Salvadoran | 369 | 0.4% |
| Samoan | 126 | 0.1% |
| Scandinavian | 350 | 0.4% |
| Scotch-Irish | 685 | 0.7% |
| Scottish | 2,196 | 2.4% |
| Serbian | 385 | 0.4% |
| Shoshone | 9 | 0.0% |
| Sioux | 13 | 0.0% |
| Slavic | 47 | 0.1% |
| Slovak | 172 | 0.2% |
| Slovene | 82 | 0.1% |
| South African | 31 | 0.0% |
| South American | 2,053 | 2.2% |
| South American Indian | 11 | 0.0% |
| Spaniard | 366 | 0.4% |
| Spanish | 445 | 0.5% |
| Spanish American Indian | 12 | 0.0% |
| Sri Lankan | 3,187 | 3.4% |
| Subsaharan African | 92 | 0.1% |
| Swedish | 1,526 | 1.6% |
| Swiss | 363 | 0.4% |
| Syrian | 37 | 0.0% |
| Thai | 1,698 | 1.8% |
| Trinidadian and Tobagonian | 45 | 0.1% |
| Turkish | 140 | 0.2% |
| Ukrainian | 324 | 0.4% |
| Uruguayan | 14 | 0.0% |
| Venezuelan | 956 | 1.0% |
| Vietnamese | 16 | 0.0% |
| Welsh | 883 | 0.9% |
| West Indian | 8 | 0.0% |
| Yaqui | 82 | 0.1% |
| Yugoslavian | 56 | 0.1% |
| Yup'ik | 9 | 0.0% | View All 131 Rows |
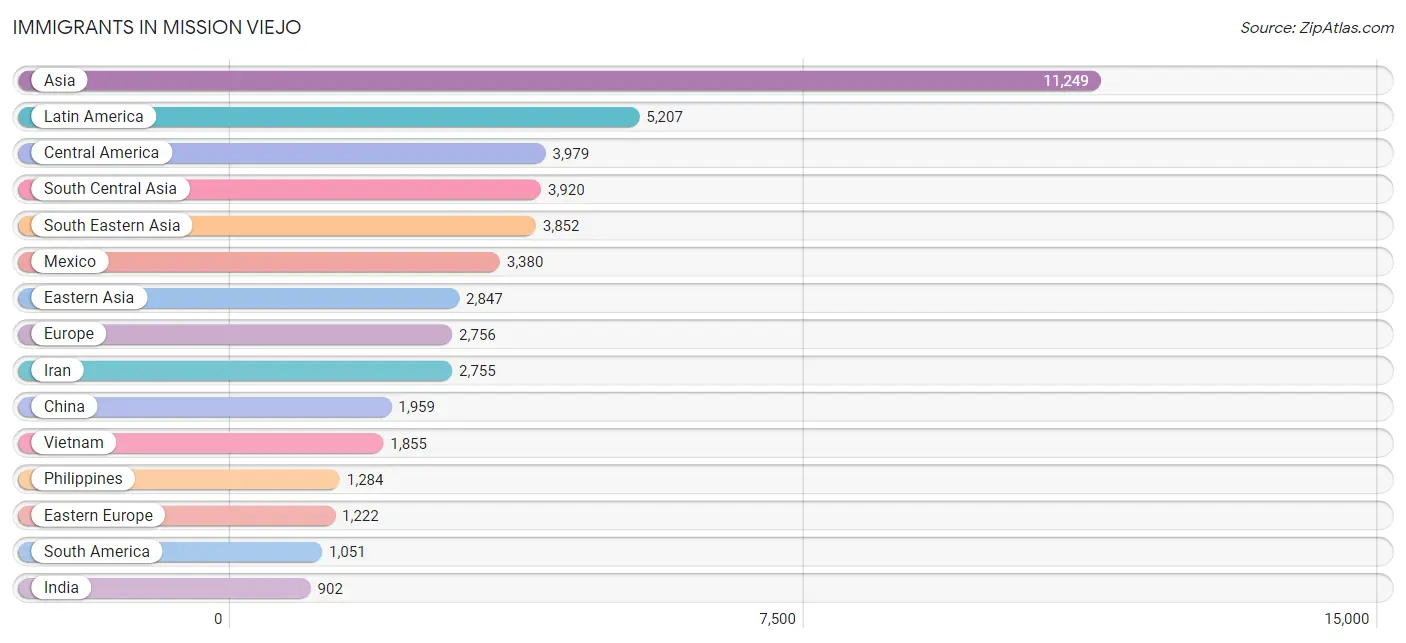
Immigrants in Mission Viejo
The most numerous immigrant groups reported in Mission Viejo came from Asia (11,249 | 12.1%), Latin America (5,207 | 5.6%), Central America (3,979 | 4.3%), South Central Asia (3,920 | 4.2%), and South Eastern Asia (3,852 | 4.1%), together accounting for 30.2% of all Mission Viejo residents.
| Immigration Origin | # Population | % Population |
| Afghanistan | 105 | 0.1% |
| Africa | 756 | 0.8% |
| Argentina | 126 | 0.1% |
| Asia | 11,249 | 12.1% |
| Australia | 63 | 0.1% |
| Austria | 8 | 0.0% |
| Bangladesh | 16 | 0.0% |
| Belgium | 28 | 0.0% |
| Bolivia | 41 | 0.0% |
| Bosnia and Herzegovina | 16 | 0.0% |
| Brazil | 75 | 0.1% |
| Bulgaria | 19 | 0.0% |
| Cambodia | 230 | 0.3% |
| Canada | 549 | 0.6% |
| Caribbean | 177 | 0.2% |
| Central America | 3,979 | 4.3% |
| Chile | 40 | 0.0% |
| China | 1,959 | 2.1% |
| Colombia | 183 | 0.2% |
| Costa Rica | 10 | 0.0% |
| Croatia | 7 | 0.0% |
| Cuba | 81 | 0.1% |
| Czechoslovakia | 25 | 0.0% |
| Denmark | 43 | 0.1% |
| Eastern Africa | 26 | 0.0% |
| Eastern Asia | 2,847 | 3.0% |
| Eastern Europe | 1,222 | 1.3% |
| Ecuador | 96 | 0.1% |
| Egypt | 377 | 0.4% |
| El Salvador | 72 | 0.1% |
| England | 185 | 0.2% |
| Europe | 2,756 | 3.0% |
| France | 169 | 0.2% |
| Germany | 279 | 0.3% |
| Guatemala | 405 | 0.4% |
| Honduras | 40 | 0.0% |
| Hong Kong | 73 | 0.1% |
| Hungary | 235 | 0.3% |
| India | 902 | 1.0% |
| Indonesia | 87 | 0.1% |
| Iran | 2,755 | 2.9% |
| Iraq | 19 | 0.0% |
| Ireland | 80 | 0.1% |
| Israel | 84 | 0.1% |
| Italy | 156 | 0.2% |
| Jamaica | 77 | 0.1% |
| Japan | 349 | 0.4% |
| Jordan | 97 | 0.1% |
| Kazakhstan | 17 | 0.0% |
| Korea | 539 | 0.6% |
| Kuwait | 32 | 0.0% |
| Laos | 46 | 0.1% |
| Latin America | 5,207 | 5.6% |
| Latvia | 18 | 0.0% |
| Lebanon | 152 | 0.2% |
| Malaysia | 53 | 0.1% |
| Mexico | 3,380 | 3.6% |
| Moldova | 21 | 0.0% |
| Morocco | 43 | 0.1% |
| Netherlands | 58 | 0.1% |
| Nicaragua | 39 | 0.0% |
| Northern Africa | 428 | 0.5% |
| Northern Europe | 774 | 0.8% |
| Norway | 10 | 0.0% |
| Oceania | 146 | 0.2% |
| Pakistan | 73 | 0.1% |
| Panama | 33 | 0.0% |
| Peru | 287 | 0.3% |
| Philippines | 1,284 | 1.4% |
| Poland | 72 | 0.1% |
| Portugal | 14 | 0.0% |
| Romania | 309 | 0.3% |
| Russia | 109 | 0.1% |
| Scotland | 72 | 0.1% |
| Serbia | 146 | 0.2% |
| South Africa | 293 | 0.3% |
| South America | 1,051 | 1.1% |
| South Central Asia | 3,920 | 4.2% |
| South Eastern Asia | 3,852 | 4.1% |
| Southern Europe | 183 | 0.2% |
| Spain | 13 | 0.0% |
| Sri Lanka | 52 | 0.1% |
| Sweden | 18 | 0.0% |
| Switzerland | 35 | 0.0% |
| Syria | 39 | 0.0% |
| Taiwan | 899 | 1.0% |
| Thailand | 243 | 0.3% |
| Trinidad and Tobago | 19 | 0.0% |
| Turkey | 207 | 0.2% |
| Ukraine | 186 | 0.2% |
| Uruguay | 10 | 0.0% |
| Venezuela | 193 | 0.2% |
| Vietnam | 1,855 | 2.0% |
| Western Africa | 9 | 0.0% |
| Western Asia | 630 | 0.7% |
| Western Europe | 577 | 0.6% |
| Zimbabwe | 10 | 0.0% | View All 97 Rows |
Sex and Age in Mission Viejo
Sex and Age in Mission Viejo
The most populous age groups in Mission Viejo are 55 to 59 Years (3,765 | 8.1%) for men and 55 to 59 Years (3,992 | 8.5%) for women.
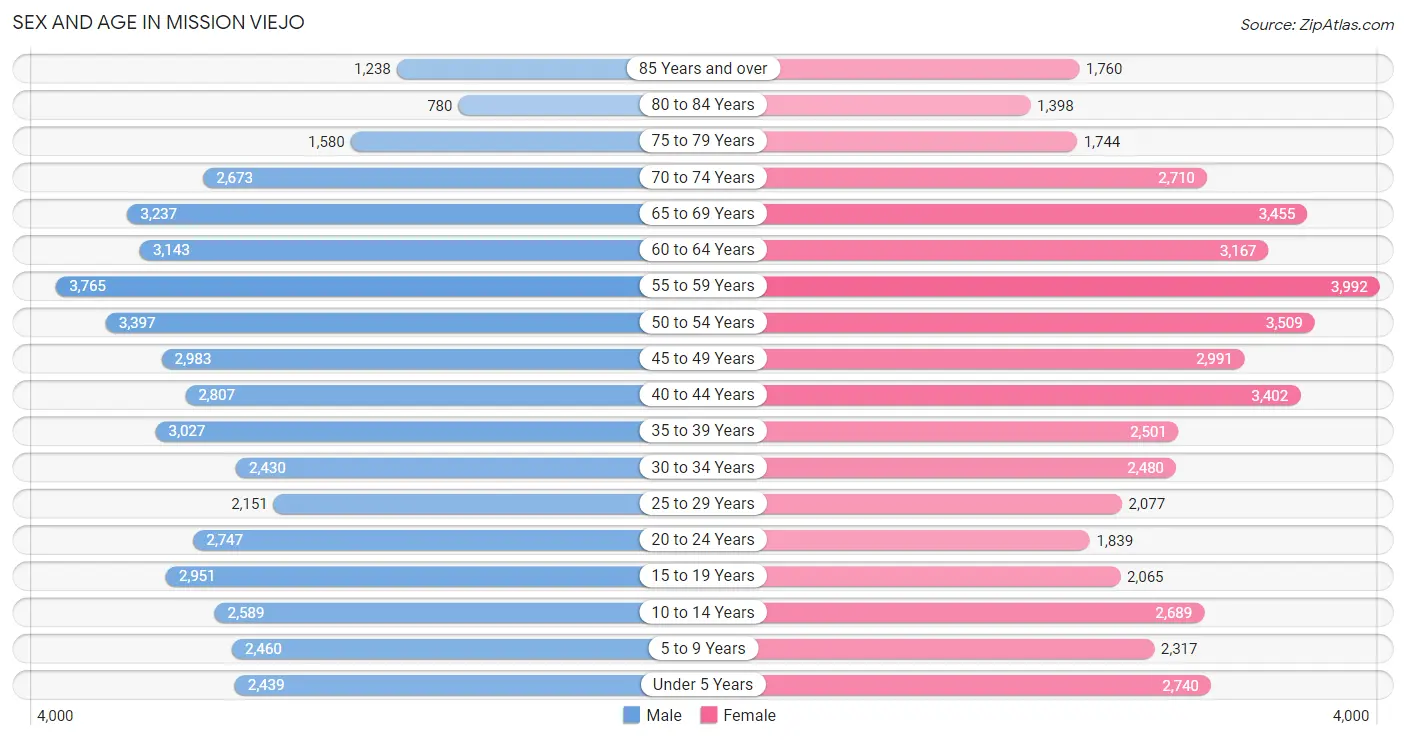
| Age Bracket | Male | Female |
| Under 5 Years | 2,439 (5.3%) | 2,740 (5.9%) |
| 5 to 9 Years | 2,460 (5.3%) | 2,317 (5.0%) |
| 10 to 14 Years | 2,589 (5.6%) | 2,689 (5.7%) |
| 15 to 19 Years | 2,951 (6.4%) | 2,065 (4.4%) |
| 20 to 24 Years | 2,747 (5.9%) | 1,839 (3.9%) |
| 25 to 29 Years | 2,151 (4.6%) | 2,077 (4.4%) |
| 30 to 34 Years | 2,430 (5.2%) | 2,480 (5.3%) |
| 35 to 39 Years | 3,027 (6.5%) | 2,501 (5.3%) |
| 40 to 44 Years | 2,807 (6.0%) | 3,402 (7.3%) |
| 45 to 49 Years | 2,983 (6.4%) | 2,991 (6.4%) |
| 50 to 54 Years | 3,397 (7.3%) | 3,509 (7.5%) |
| 55 to 59 Years | 3,765 (8.1%) | 3,992 (8.5%) |
| 60 to 64 Years | 3,143 (6.8%) | 3,167 (6.8%) |
| 65 to 69 Years | 3,237 (7.0%) | 3,455 (7.4%) |
| 70 to 74 Years | 2,673 (5.8%) | 2,710 (5.8%) |
| 75 to 79 Years | 1,580 (3.4%) | 1,744 (3.7%) |
| 80 to 84 Years | 780 (1.7%) | 1,398 (3.0%) |
| 85 Years and over | 1,238 (2.7%) | 1,760 (3.8%) |
| Total | 46,397 (100.0%) | 46,836 (100.0%) |
Families and Households in Mission Viejo
Median Family Size in Mission Viejo
The median family size in Mission Viejo is 3.20 persons per family, with married-couple families (21,444 | 85.5%) accounting for the largest median family size of 3.23 persons per family. On the other hand, single male/father families (1,295 | 5.2%) represent the smallest median family size with 2.83 persons per family.
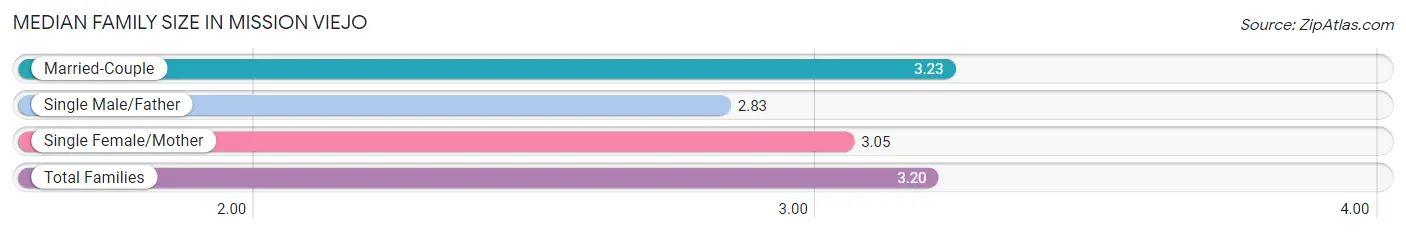
| Family Type | # Families | Family Size |
| Married-Couple | 21,444 (85.5%) | 3.23 |
| Single Male/Father | 1,295 (5.2%) | 2.83 |
| Single Female/Mother | 2,344 (9.3%) | 3.05 |
| Total Families | 25,083 (100.0%) | 3.20 |
Median Household Size in Mission Viejo
The median household size in Mission Viejo is 2.79 persons per household, with married-couple households (21,444 | 65.7%) accounting for the largest median household size of 3.26 persons per household. non-family households (7,567 | 23.2%) represent the smallest median household size with 1.29 persons per household.
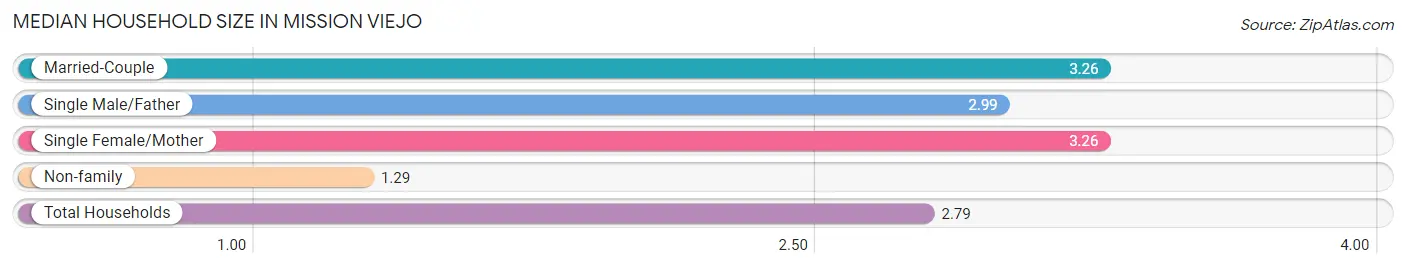
| Household Type | # Households | Household Size |
| Married-Couple | 21,444 (65.7%) | 3.26 |
| Single Male/Father | 1,295 (4.0%) | 2.99 |
| Single Female/Mother | 2,344 (7.2%) | 3.26 |
| Non-family | 7,567 (23.2%) | 1.29 |
| Total Households | 32,650 (100.0%) | 2.79 |
Household Size by Marriage Status in Mission Viejo
Out of a total of 32,650 households in Mission Viejo, 25,083 (76.8%) are family households, while 7,567 (23.2%) are nonfamily households. The most numerous type of family households are 2-person households, comprising 10,668, and the most common type of nonfamily households are 1-person households, comprising 5,986.
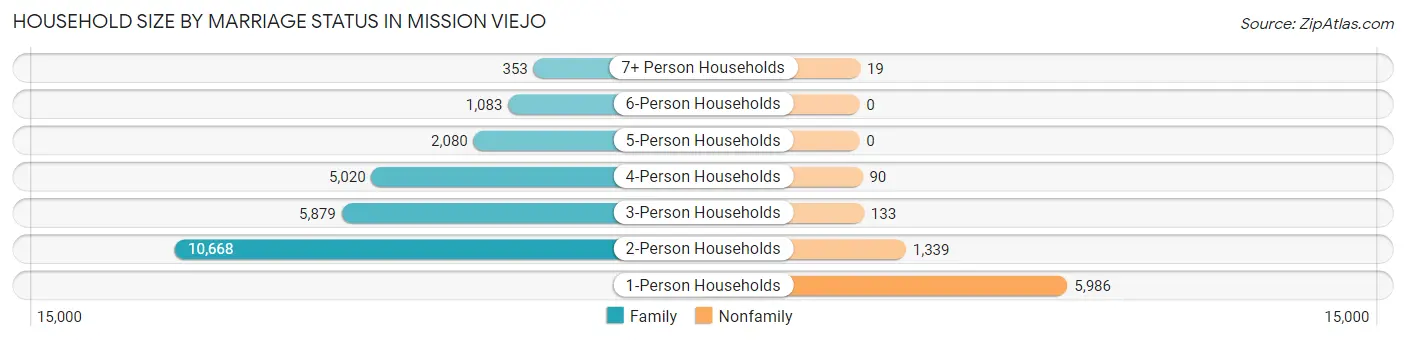
| Household Size | Family Households | Nonfamily Households |
| 1-Person Households | - | 5,986 (18.3%) |
| 2-Person Households | 10,668 (32.7%) | 1,339 (4.1%) |
| 3-Person Households | 5,879 (18.0%) | 133 (0.4%) |
| 4-Person Households | 5,020 (15.4%) | 90 (0.3%) |
| 5-Person Households | 2,080 (6.4%) | 0 (0.0%) |
| 6-Person Households | 1,083 (3.3%) | 0 (0.0%) |
| 7+ Person Households | 353 (1.1%) | 19 (0.1%) |
| Total | 25,083 (76.8%) | 7,567 (23.2%) |
Female Fertility in Mission Viejo
Fertility by Age in Mission Viejo
Average fertility rate in Mission Viejo is 51.0 births per 1,000 women. Women in the age bracket of 20 to 34 years have the highest fertility rate with 99.0 births per 1,000 women. Women in the age bracket of 20 to 34 years acount for 69.2% of all women with births.
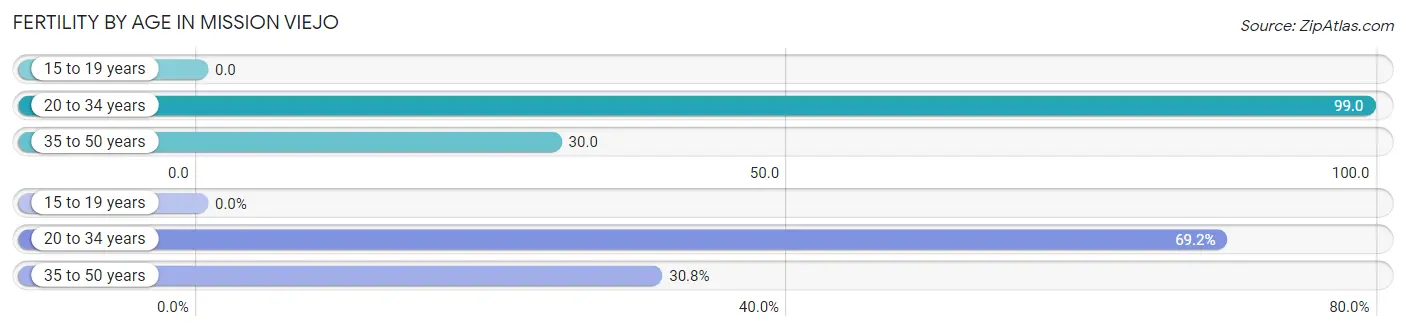
| Age Bracket | Women with Births | Births / 1,000 Women |
| 15 to 19 years | 0 (0.0%) | 0.0 |
| 20 to 34 years | 635 (69.2%) | 99.0 |
| 35 to 50 years | 283 (30.8%) | 30.0 |
| Total | 918 (100.0%) | 51.0 |
Fertility by Age by Marriage Status in Mission Viejo
93.7% of women with births (918) in Mission Viejo are married. The highest percentage of unmarried women with births falls into 35 to 50 years age bracket with 14.1% of them unmarried at the time of birth, while the lowest percentage of unmarried women with births belong to 20 to 34 years age bracket with 2.8% of them unmarried.
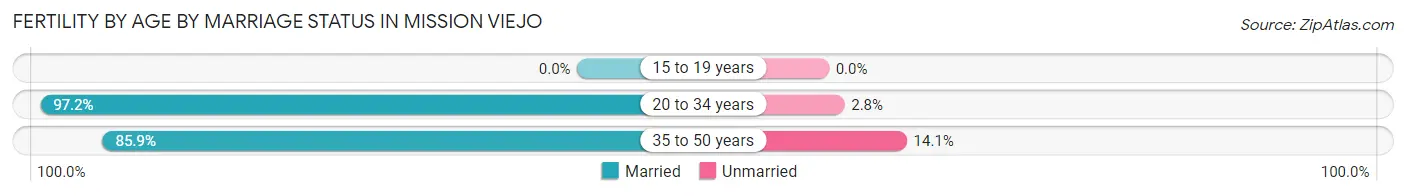
| Age Bracket | Married | Unmarried |
| 15 to 19 years | 0 (0.0%) | 0 (0.0%) |
| 20 to 34 years | 617 (97.2%) | 18 (2.8%) |
| 35 to 50 years | 243 (85.9%) | 40 (14.1%) |
| Total | 860 (93.7%) | 58 (6.3%) |
Fertility by Education in Mission Viejo
Average fertility rate in Mission Viejo is 51.0 births per 1,000 women. Women with the education attainment of graduate degree have the highest fertility rate of 83.0 births per 1,000 women, while women with the education attainment of less than high school have the lowest fertility at 18.0 births per 1,000 women. Women with the education attainment of bachelor's degree represent 49.1% of all women with births.
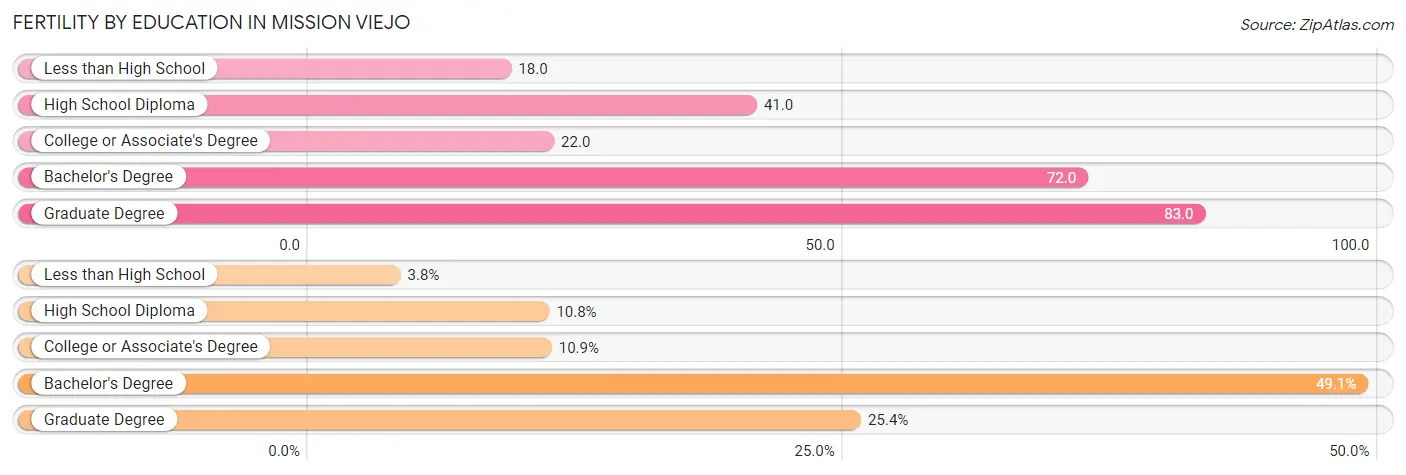
| Educational Attainment | Women with Births | Births / 1,000 Women |
| Less than High School | 35 (3.8%) | 18.0 |
| High School Diploma | 99 (10.8%) | 41.0 |
| College or Associate's Degree | 100 (10.9%) | 22.0 |
| Bachelor's Degree | 451 (49.1%) | 72.0 |
| Graduate Degree | 233 (25.4%) | 83.0 |
| Total | 918 (100.0%) | 51.0 |
Fertility by Education by Marriage Status in Mission Viejo
6.3% of women with births in Mission Viejo are unmarried. Women with the educational attainment of bachelor's degree are most likely to be married with 100.0% of them married at childbirth, while women with the educational attainment of high school diploma are least likely to be married with 23.2% of them unmarried at childbirth.
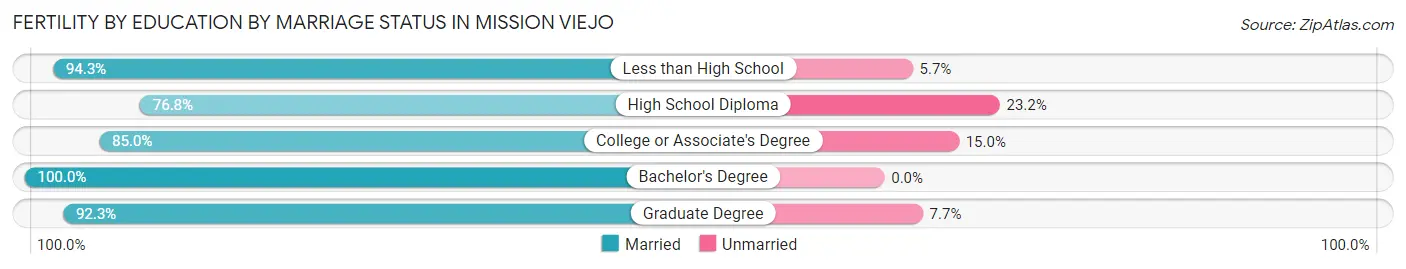
| Educational Attainment | Married | Unmarried |
| Less than High School | 33 (94.3%) | 2 (5.7%) |
| High School Diploma | 76 (76.8%) | 23 (23.2%) |
| College or Associate's Degree | 85 (85.0%) | 15 (15.0%) |
| Bachelor's Degree | 451 (100.0%) | 0 (0.0%) |
| Graduate Degree | 215 (92.3%) | 18 (7.7%) |
| Total | 860 (93.7%) | 58 (6.3%) |
Employment Characteristics in Mission Viejo
Employment by Class of Employer in Mission Viejo
Among the 45,813 employed individuals in Mission Viejo, private company employees (30,363 | 66.3%), self-employed (not incorporated) (3,718 | 8.1%), and local government employees (3,346 | 7.3%) make up the most common classes of employment.
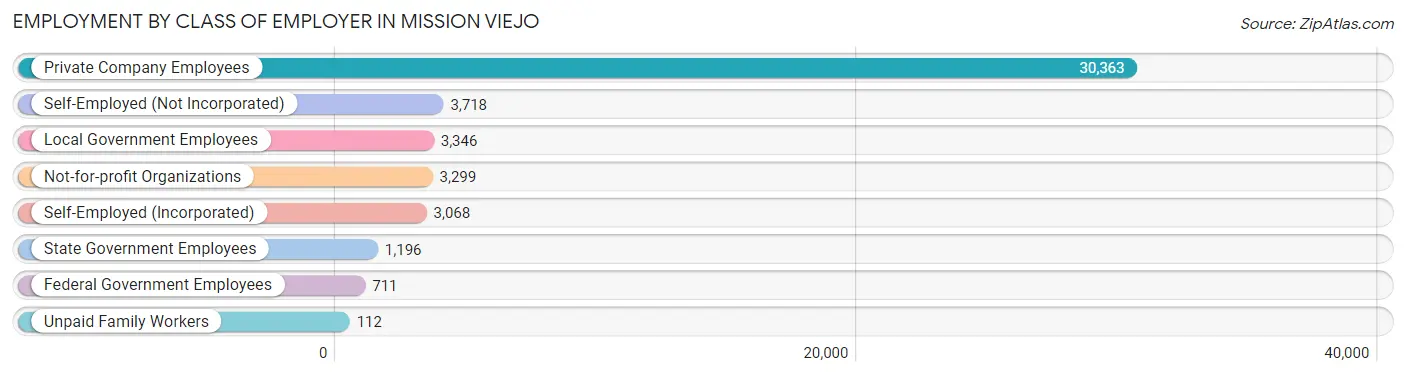
| Employer Class | # Employees | % Employees |
| Private Company Employees | 30,363 | 66.3% |
| Self-Employed (Incorporated) | 3,068 | 6.7% |
| Self-Employed (Not Incorporated) | 3,718 | 8.1% |
| Not-for-profit Organizations | 3,299 | 7.2% |
| Local Government Employees | 3,346 | 7.3% |
| State Government Employees | 1,196 | 2.6% |
| Federal Government Employees | 711 | 1.5% |
| Unpaid Family Workers | 112 | 0.2% |
| Total | 45,813 | 100.0% |
Employment Status by Age in Mission Viejo
According to the labor force statistics for Mission Viejo, out of the total population over 16 years of age (77,068), 63.6% or 49,015 individuals are in the labor force, with 4.4% or 2,157 of them unemployed. The age group with the highest labor force participation rate is 25 to 29 years, with 87.4% or 3,695 individuals in the labor force. Within the labor force, the 16 to 19 years age range has the highest percentage of unemployed individuals, with 10.2% or 177 of them being unemployed.
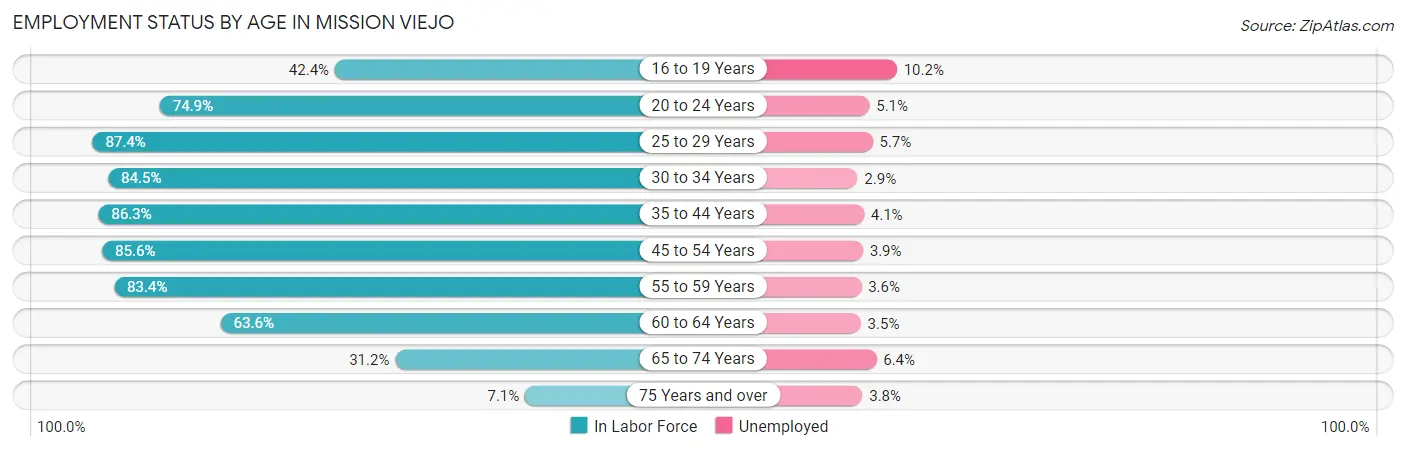
| Age Bracket | In Labor Force | Unemployed |
| 16 to 19 Years | 1,732 (42.4%) | 177 (10.2%) |
| 20 to 24 Years | 3,435 (74.9%) | 175 (5.1%) |
| 25 to 29 Years | 3,695 (87.4%) | 211 (5.7%) |
| 30 to 34 Years | 4,149 (84.5%) | 120 (2.9%) |
| 35 to 44 Years | 10,129 (86.3%) | 415 (4.1%) |
| 45 to 54 Years | 11,025 (85.6%) | 430 (3.9%) |
| 55 to 59 Years | 6,469 (83.4%) | 233 (3.6%) |
| 60 to 64 Years | 4,013 (63.6%) | 140 (3.5%) |
| 65 to 74 Years | 3,767 (31.2%) | 241 (6.4%) |
| 75 Years and over | 604 (7.1%) | 23 (3.8%) |
| Total | 49,015 (63.6%) | 2,157 (4.4%) |
Employment Status by Educational Attainment in Mission Viejo
According to labor force statistics for Mission Viejo, 82.6% of individuals (39,501) out of the total population between 25 and 64 years of age (47,822) are in the labor force, with 3.9% or 1,541 of them being unemployed. The group with the highest labor force participation rate are those with the educational attainment of bachelor's degree or higher, with 87.3% or 22,228 individuals in the labor force. Within the labor force, individuals with high school diploma education have the highest percentage of unemployment, with 6.4% or 340 of them being unemployed.
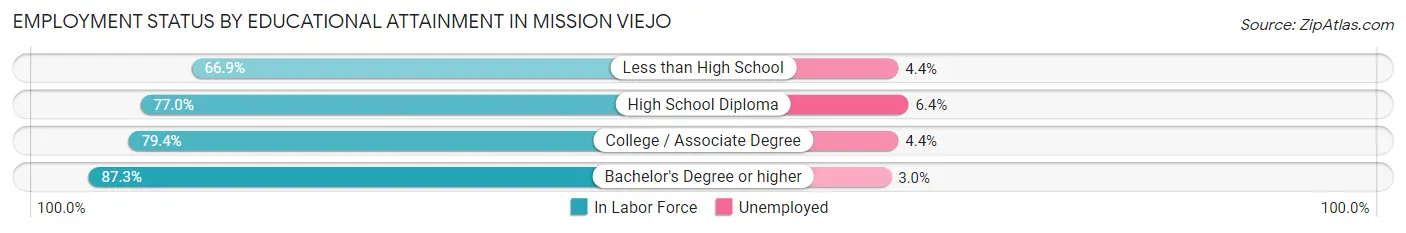
| Educational Attainment | In Labor Force | Unemployed |
| Less than High School | 1,691 (66.9%) | 111 (4.4%) |
| High School Diploma | 5,311 (77.0%) | 441 (6.4%) |
| College / Associate Degree | 10,271 (79.4%) | 569 (4.4%) |
| Bachelor's Degree or higher | 22,228 (87.3%) | 764 (3.0%) |
| Total | 39,501 (82.6%) | 1,865 (3.9%) |
Employment Occupations by Sex in Mission Viejo
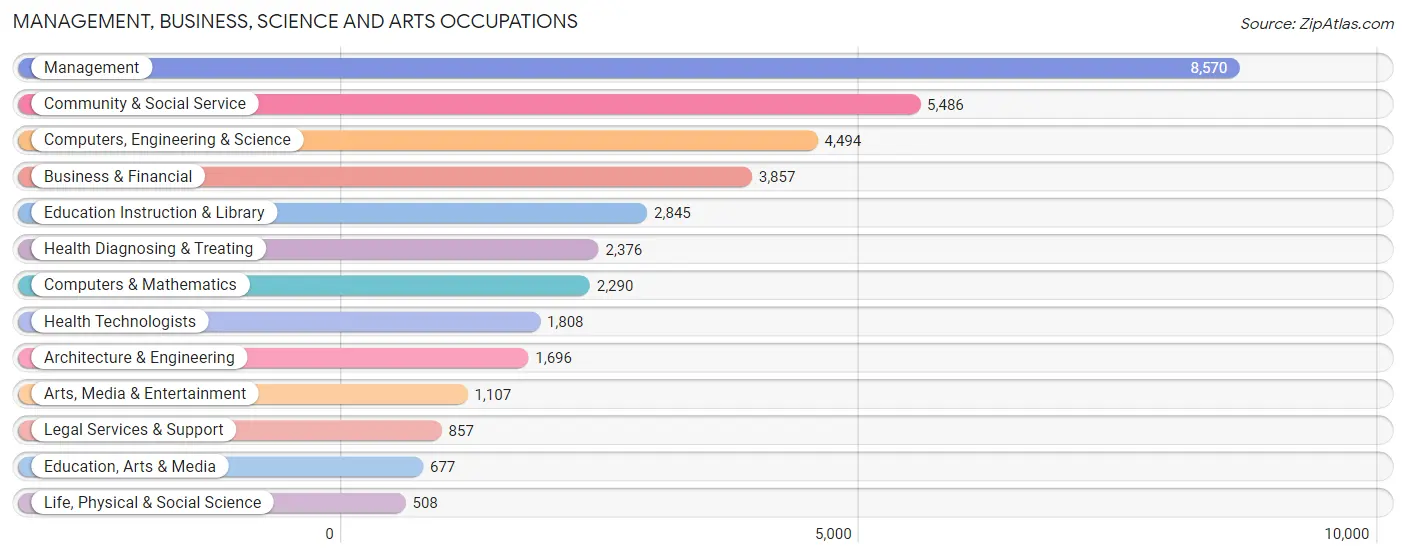
Management, Business, Science and Arts Occupations
The most common Management, Business, Science and Arts occupations in Mission Viejo are Management (8,570 | 18.3%), Community & Social Service (5,486 | 11.7%), Computers, Engineering & Science (4,494 | 9.6%), Business & Financial (3,857 | 8.3%), and Education Instruction & Library (2,845 | 6.1%).
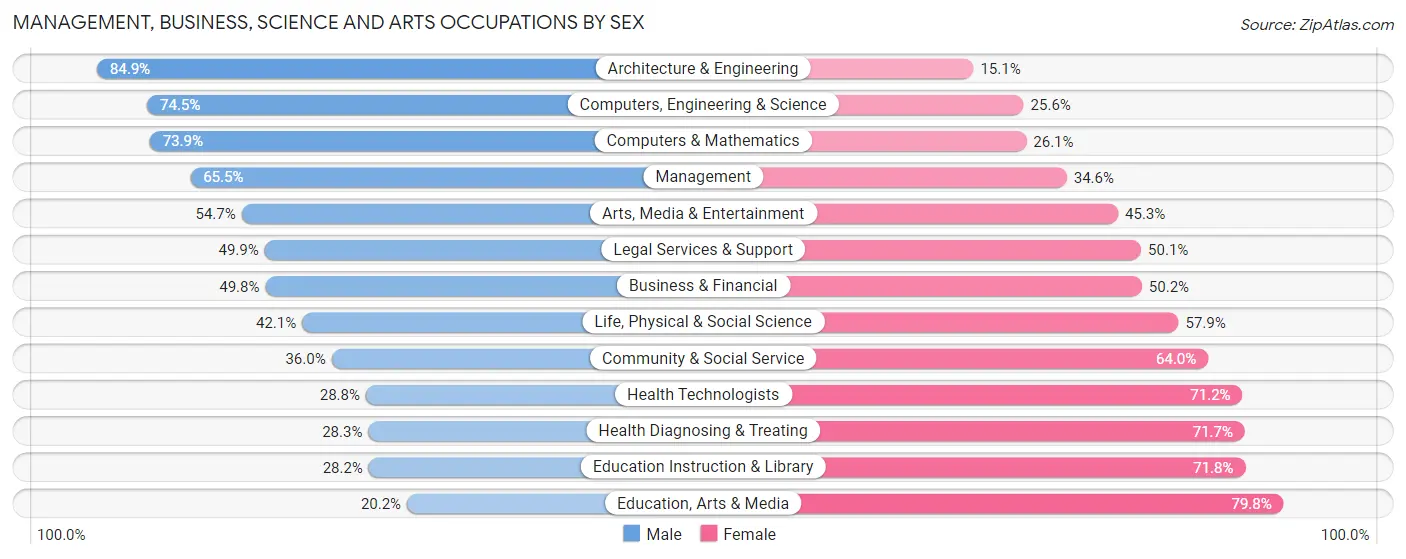
Management, Business, Science and Arts Occupations by Sex
Within the Management, Business, Science and Arts occupations in Mission Viejo, the most male-oriented occupations are Architecture & Engineering (84.9%), Computers, Engineering & Science (74.5%), and Computers & Mathematics (73.9%), while the most female-oriented occupations are Education, Arts & Media (79.8%), Education Instruction & Library (71.8%), and Health Diagnosing & Treating (71.7%).
| Occupation | Male | Female |
| Management | 5,609 (65.4%) | 2,961 (34.5%) |
| Business & Financial | 1,920 (49.8%) | 1,937 (50.2%) |
| Computers, Engineering & Science | 3,346 (74.5%) | 1,148 (25.6%) |
| Computers & Mathematics | 1,692 (73.9%) | 598 (26.1%) |
| Architecture & Engineering | 1,440 (84.9%) | 256 (15.1%) |
| Life, Physical & Social Science | 214 (42.1%) | 294 (57.9%) |
| Community & Social Service | 1,974 (36.0%) | 3,512 (64.0%) |
| Education, Arts & Media | 137 (20.2%) | 540 (79.8%) |
| Legal Services & Support | 428 (49.9%) | 429 (50.1%) |
| Education Instruction & Library | 803 (28.2%) | 2,042 (71.8%) |
| Arts, Media & Entertainment | 606 (54.7%) | 501 (45.3%) |
| Health Diagnosing & Treating | 673 (28.3%) | 1,703 (71.7%) |
| Health Technologists | 521 (28.8%) | 1,287 (71.2%) |
| Total (Category) | 13,522 (54.6%) | 11,261 (45.4%) |
| Total (Overall) | 25,771 (55.1%) | 20,990 (44.9%) |
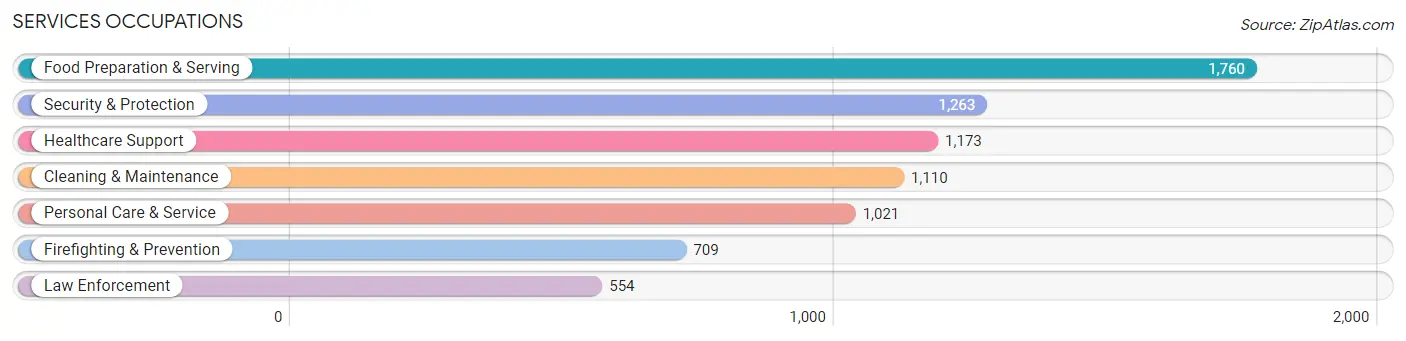
Services Occupations
The most common Services occupations in Mission Viejo are Food Preparation & Serving (1,760 | 3.8%), Security & Protection (1,263 | 2.7%), Healthcare Support (1,173 | 2.5%), Cleaning & Maintenance (1,110 | 2.4%), and Personal Care & Service (1,021 | 2.2%).
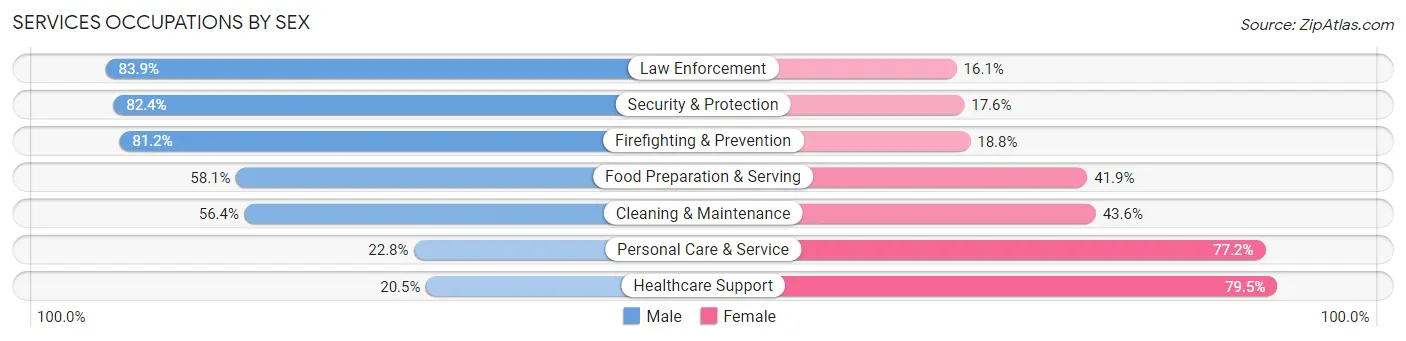
Services Occupations by Sex
Within the Services occupations in Mission Viejo, the most male-oriented occupations are Law Enforcement (83.9%), Security & Protection (82.4%), and Firefighting & Prevention (81.2%), while the most female-oriented occupations are Healthcare Support (79.5%), Personal Care & Service (77.2%), and Cleaning & Maintenance (43.6%).
| Occupation | Male | Female |
| Healthcare Support | 240 (20.5%) | 933 (79.5%) |
| Security & Protection | 1,041 (82.4%) | 222 (17.6%) |
| Firefighting & Prevention | 576 (81.2%) | 133 (18.8%) |
| Law Enforcement | 465 (83.9%) | 89 (16.1%) |
| Food Preparation & Serving | 1,022 (58.1%) | 738 (41.9%) |
| Cleaning & Maintenance | 626 (56.4%) | 484 (43.6%) |
| Personal Care & Service | 233 (22.8%) | 788 (77.2%) |
| Total (Category) | 3,162 (50.0%) | 3,165 (50.0%) |
| Total (Overall) | 25,771 (55.1%) | 20,990 (44.9%) |
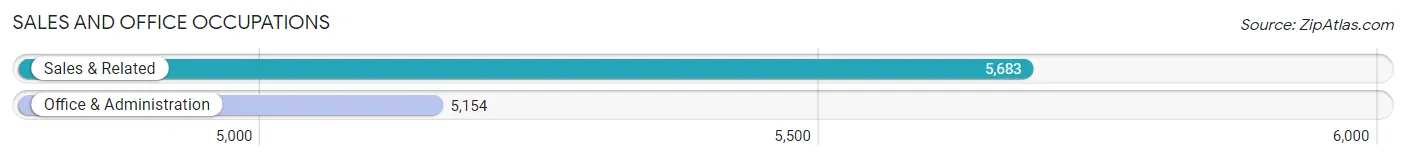
Sales and Office Occupations
The most common Sales and Office occupations in Mission Viejo are Sales & Related (5,683 | 12.1%), and Office & Administration (5,154 | 11.0%).
Sales and Office Occupations by Sex
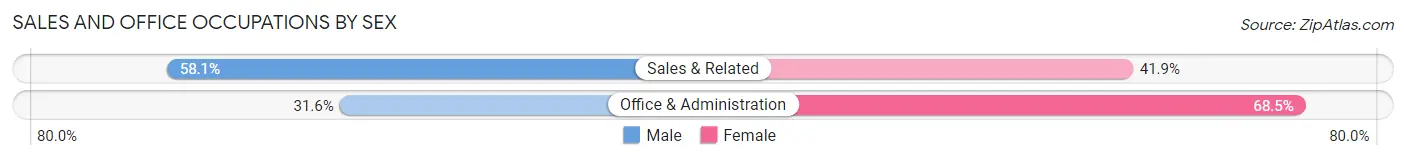
| Occupation | Male | Female |
| Sales & Related | 3,303 (58.1%) | 2,380 (41.9%) |
| Office & Administration | 1,626 (31.6%) | 3,528 (68.4%) |
| Total (Category) | 4,929 (45.5%) | 5,908 (54.5%) |
| Total (Overall) | 25,771 (55.1%) | 20,990 (44.9%) |
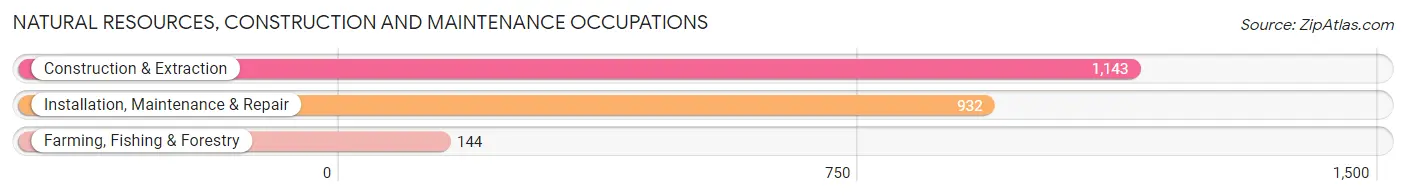
Natural Resources, Construction and Maintenance Occupations
The most common Natural Resources, Construction and Maintenance occupations in Mission Viejo are Construction & Extraction (1,143 | 2.4%), Installation, Maintenance & Repair (932 | 2.0%), and Farming, Fishing & Forestry (144 | 0.3%).
Natural Resources, Construction and Maintenance Occupations by Sex
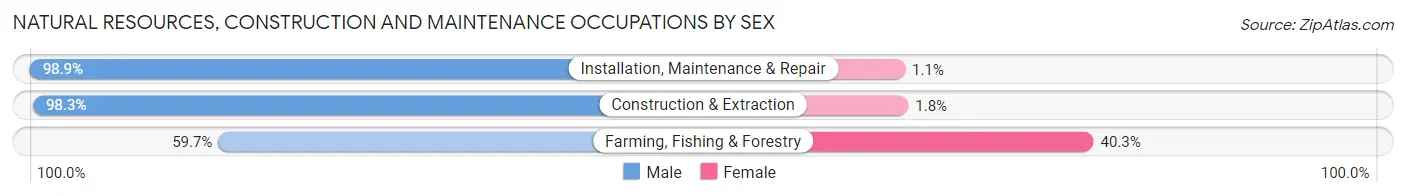
| Occupation | Male | Female |
| Farming, Fishing & Forestry | 86 (59.7%) | 58 (40.3%) |
| Construction & Extraction | 1,123 (98.3%) | 20 (1.8%) |
| Installation, Maintenance & Repair | 922 (98.9%) | 10 (1.1%) |
| Total (Category) | 2,131 (96.0%) | 88 (4.0%) |
| Total (Overall) | 25,771 (55.1%) | 20,990 (44.9%) |
Production, Transportation and Moving Occupations
The most common Production, Transportation and Moving occupations in Mission Viejo are Production (1,195 | 2.6%), Transportation (780 | 1.7%), and Material Moving (620 | 1.3%).
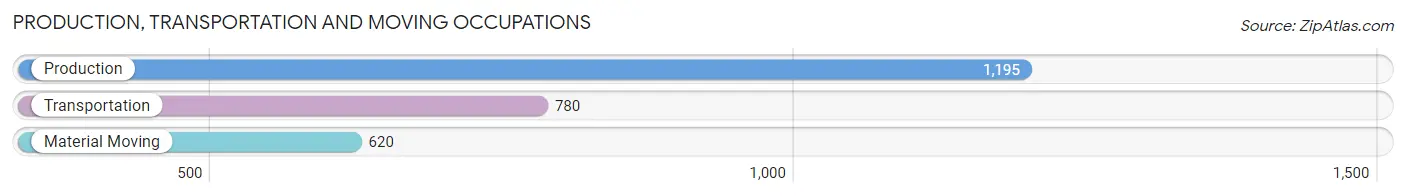
Production, Transportation and Moving Occupations by Sex
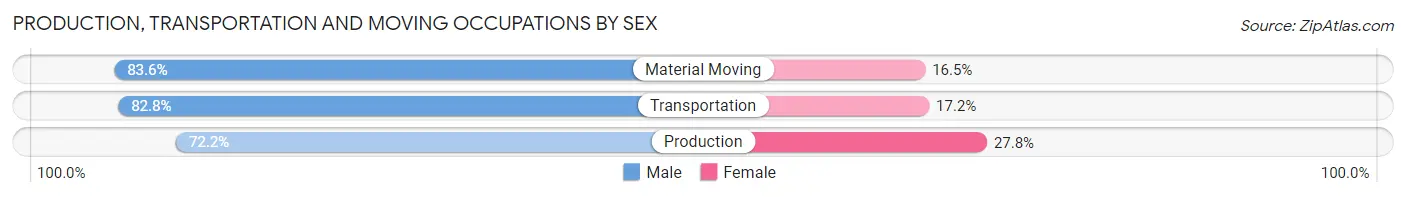
| Occupation | Male | Female |
| Production | 863 (72.2%) | 332 (27.8%) |
| Transportation | 646 (82.8%) | 134 (17.2%) |
| Material Moving | 518 (83.6%) | 102 (16.5%) |
| Total (Category) | 2,027 (78.1%) | 568 (21.9%) |
| Total (Overall) | 25,771 (55.1%) | 20,990 (44.9%) |
Employment Industries by Sex in Mission Viejo
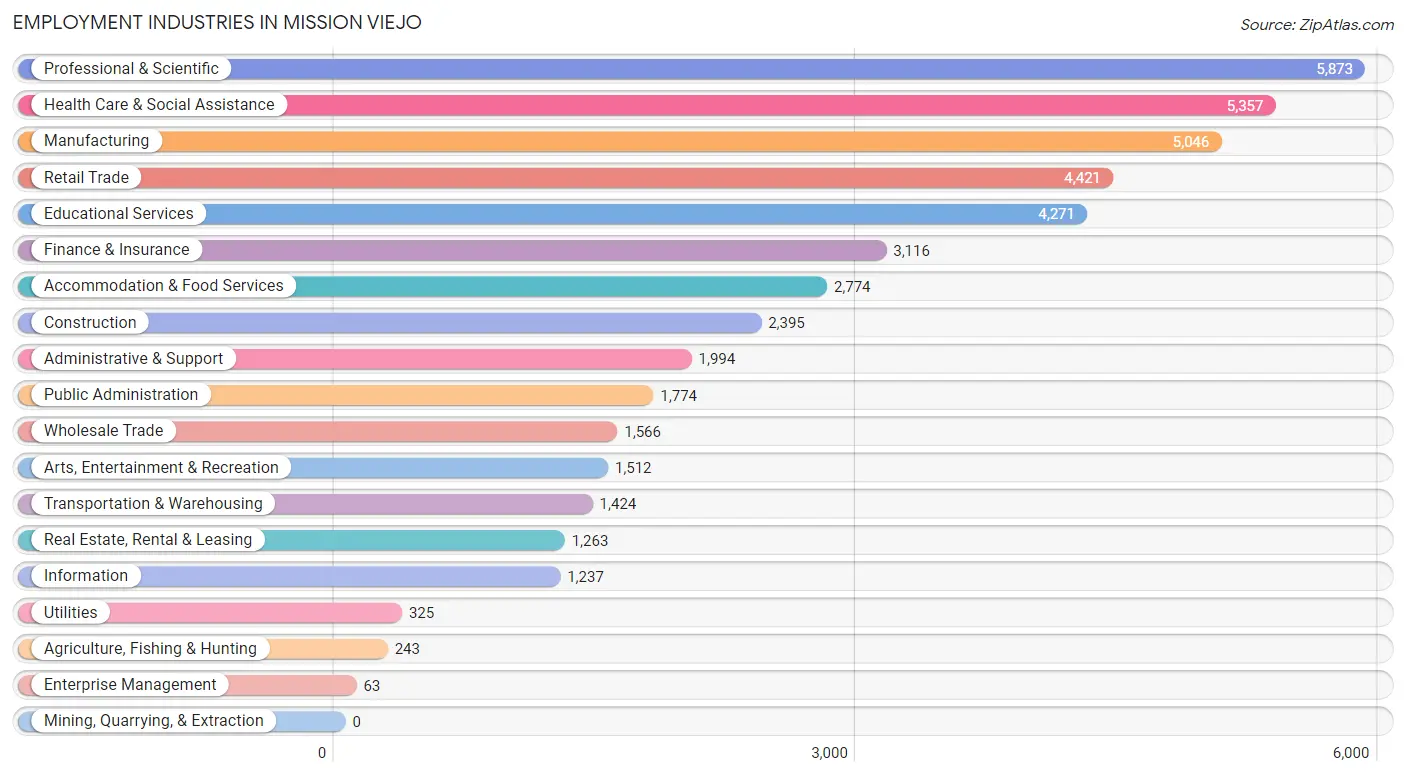
Employment Industries in Mission Viejo
The major employment industries in Mission Viejo include Professional & Scientific (5,873 | 12.6%), Health Care & Social Assistance (5,357 | 11.5%), Manufacturing (5,046 | 10.8%), Retail Trade (4,421 | 9.5%), and Educational Services (4,271 | 9.1%).
Employment Industries by Sex in Mission Viejo
The Mission Viejo industries that see more men than women are Utilities (88.0%), Construction (85.3%), and Information (77.8%), whereas the industries that tend to have a higher number of women are Health Care & Social Assistance (74.8%), Educational Services (70.1%), and Enterprise Management (66.7%).
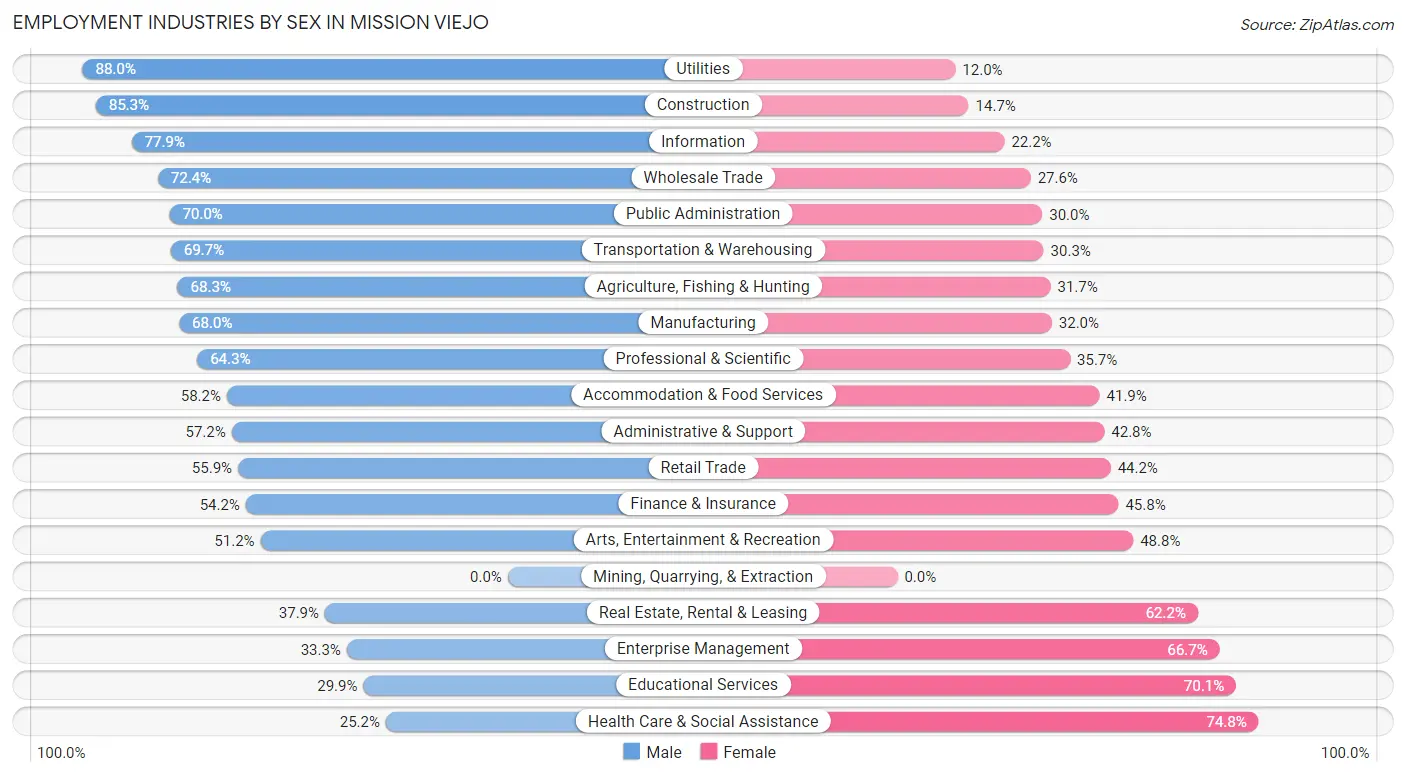
| Industry | Male | Female |
| Agriculture, Fishing & Hunting | 166 (68.3%) | 77 (31.7%) |
| Mining, Quarrying, & Extraction | 0 (0.0%) | 0 (0.0%) |
| Construction | 2,042 (85.3%) | 353 (14.7%) |
| Manufacturing | 3,433 (68.0%) | 1,613 (32.0%) |
| Wholesale Trade | 1,134 (72.4%) | 432 (27.6%) |
| Retail Trade | 2,469 (55.8%) | 1,952 (44.2%) |
| Transportation & Warehousing | 993 (69.7%) | 431 (30.3%) |
| Utilities | 286 (88.0%) | 39 (12.0%) |
| Information | 963 (77.8%) | 274 (22.2%) |
| Finance & Insurance | 1,690 (54.2%) | 1,426 (45.8%) |
| Real Estate, Rental & Leasing | 478 (37.9%) | 785 (62.2%) |
| Professional & Scientific | 3,774 (64.3%) | 2,099 (35.7%) |
| Enterprise Management | 21 (33.3%) | 42 (66.7%) |
| Administrative & Support | 1,140 (57.2%) | 854 (42.8%) |
| Educational Services | 1,277 (29.9%) | 2,994 (70.1%) |
| Health Care & Social Assistance | 1,352 (25.2%) | 4,005 (74.8%) |
| Arts, Entertainment & Recreation | 774 (51.2%) | 738 (48.8%) |
| Accommodation & Food Services | 1,613 (58.2%) | 1,161 (41.8%) |
| Public Administration | 1,242 (70.0%) | 532 (30.0%) |
| Total | 25,771 (55.1%) | 20,990 (44.9%) |
Education in Mission Viejo
School Enrollment in Mission Viejo
The most common levels of schooling among the 20,680 students in Mission Viejo are college / undergraduate (5,044 | 24.4%), high school (4,250 | 20.5%), and middle school (4,163 | 20.1%).
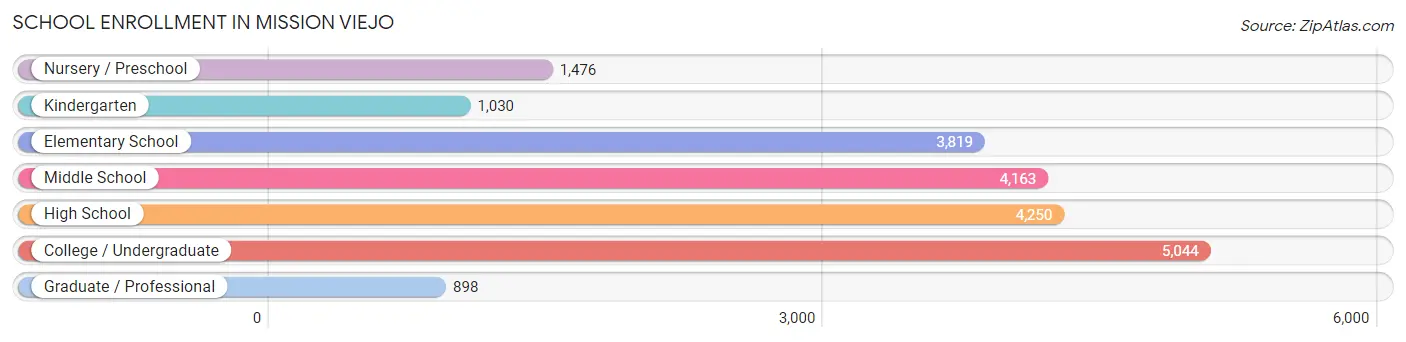
| School Level | # Students | % Students |
| Nursery / Preschool | 1,476 | 7.1% |
| Kindergarten | 1,030 | 5.0% |
| Elementary School | 3,819 | 18.5% |
| Middle School | 4,163 | 20.1% |
| High School | 4,250 | 20.5% |
| College / Undergraduate | 5,044 | 24.4% |
| Graduate / Professional | 898 | 4.3% |
| Total | 20,680 | 100.0% |
School Enrollment by Age by Funding Source in Mission Viejo
Out of a total of 20,680 students who are enrolled in schools in Mission Viejo, 4,405 (21.3%) attend a private institution, while the remaining 16,275 (78.7%) are enrolled in public schools. The age group of 3 to 4 year olds has the highest likelihood of being enrolled in private schools, with 768 (61.7% in the age bracket) enrolled. Conversely, the age group of 18 to 19 year olds has the lowest likelihood of being enrolled in a private school, with 1,562 (94.6% in the age bracket) attending a public institution.
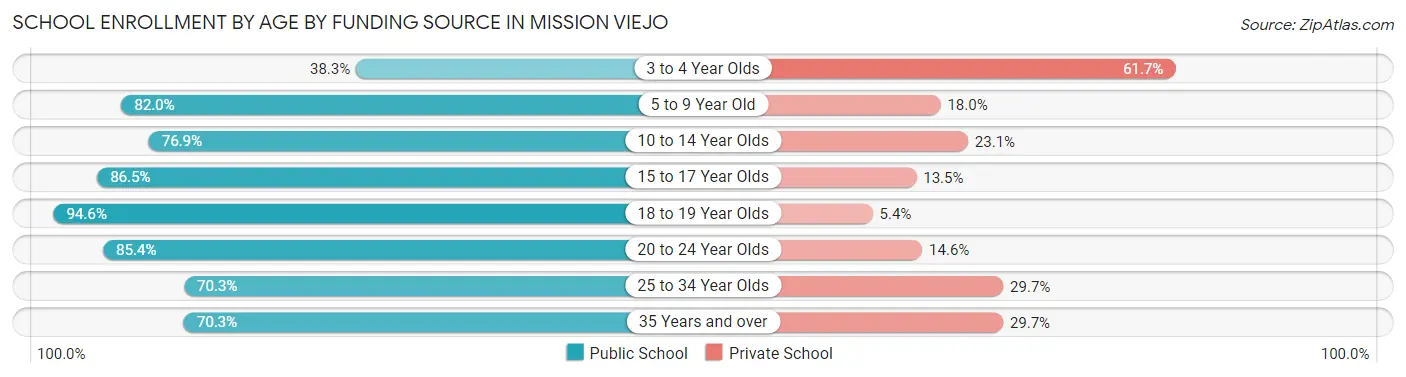
| Age Bracket | Public School | Private School |
| 3 to 4 Year Olds | 476 (38.3%) | 768 (61.7%) |
| 5 to 9 Year Old | 3,783 (82.0%) | 832 (18.0%) |
| 10 to 14 Year Olds | 4,053 (76.9%) | 1,220 (23.1%) |
| 15 to 17 Year Olds | 2,698 (86.5%) | 422 (13.5%) |
| 18 to 19 Year Olds | 1,562 (94.6%) | 89 (5.4%) |
| 20 to 24 Year Olds | 1,968 (85.4%) | 337 (14.6%) |
| 25 to 34 Year Olds | 906 (70.3%) | 383 (29.7%) |
| 35 Years and over | 832 (70.3%) | 351 (29.7%) |
| Total | 16,275 (78.7%) | 4,405 (21.3%) |
Educational Attainment by Field of Study in Mission Viejo
Business (7,854 | 21.1%), engineering (4,129 | 11.1%), science & technology (3,335 | 9.0%), social sciences (3,297 | 8.9%), and education (3,017 | 8.1%) are the most common fields of study among 37,166 individuals in Mission Viejo who have obtained a bachelor's degree or higher.
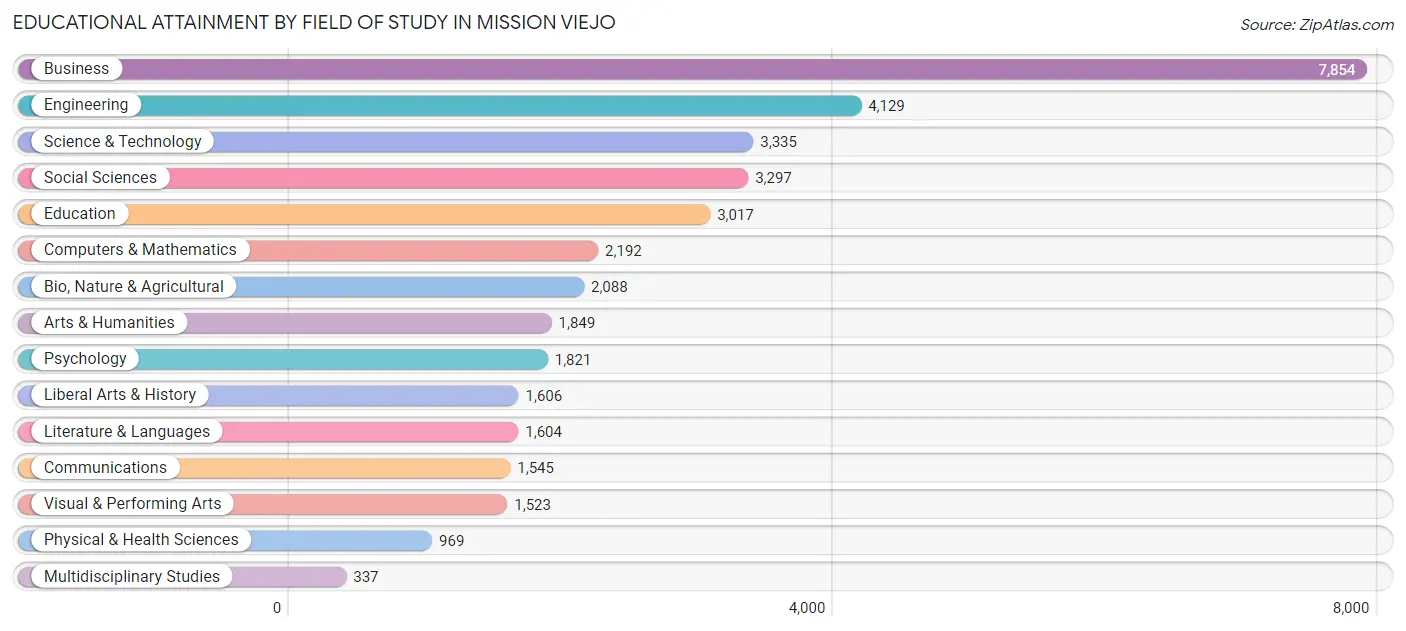
| Field of Study | # Graduates | % Graduates |
| Computers & Mathematics | 2,192 | 5.9% |
| Bio, Nature & Agricultural | 2,088 | 5.6% |
| Physical & Health Sciences | 969 | 2.6% |
| Psychology | 1,821 | 4.9% |
| Social Sciences | 3,297 | 8.9% |
| Engineering | 4,129 | 11.1% |
| Multidisciplinary Studies | 337 | 0.9% |
| Science & Technology | 3,335 | 9.0% |
| Business | 7,854 | 21.1% |
| Education | 3,017 | 8.1% |
| Literature & Languages | 1,604 | 4.3% |
| Liberal Arts & History | 1,606 | 4.3% |
| Visual & Performing Arts | 1,523 | 4.1% |
| Communications | 1,545 | 4.2% |
| Arts & Humanities | 1,849 | 5.0% |
| Total | 37,166 | 100.0% |
Transportation & Commute in Mission Viejo
Vehicle Availability by Sex in Mission Viejo
The most prevalent vehicle ownership categories in Mission Viejo are males with 2 vehicles (11,116, accounting for 43.6%) and females with 2 vehicles (8,335, making up 55.1%).
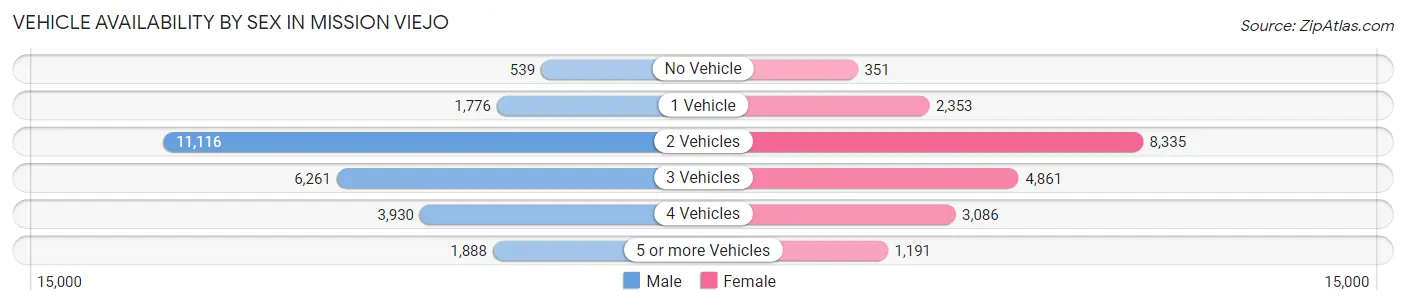
| Vehicles Available | Male | Female |
| No Vehicle | 539 (2.1%) | 351 (1.7%) |
| 1 Vehicle | 1,776 (7.0%) | 2,353 (11.7%) |
| 2 Vehicles | 11,116 (43.6%) | 8,335 (41.3%) |
| 3 Vehicles | 6,261 (24.5%) | 4,861 (24.1%) |
| 4 Vehicles | 3,930 (15.4%) | 3,086 (15.3%) |
| 5 or more Vehicles | 1,888 (7.4%) | 1,191 (5.9%) |
| Total | 25,510 (100.0%) | 20,177 (100.0%) |
Commute Time in Mission Viejo
The most frequently occuring commute durations in Mission Viejo are 15 to 19 minutes (6,532 commuters, 17.5%), 20 to 24 minutes (5,451 commuters, 14.6%), and 30 to 34 minutes (5,383 commuters, 14.4%).
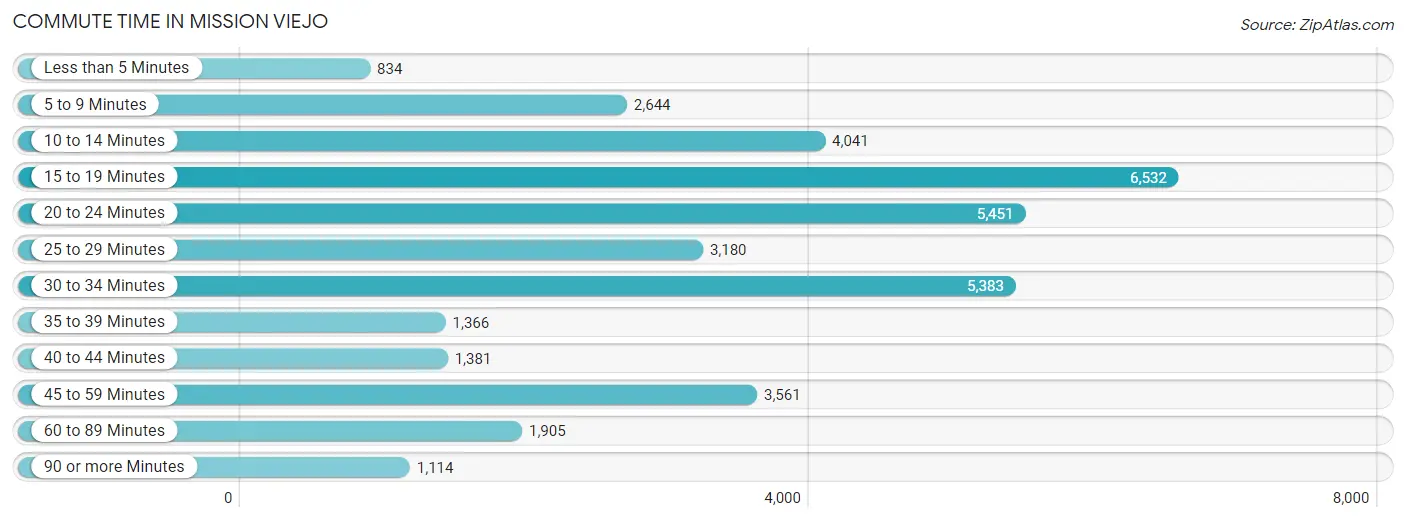
| Commute Time | # Commuters | % Commuters |
| Less than 5 Minutes | 834 | 2.2% |
| 5 to 9 Minutes | 2,644 | 7.1% |
| 10 to 14 Minutes | 4,041 | 10.8% |
| 15 to 19 Minutes | 6,532 | 17.5% |
| 20 to 24 Minutes | 5,451 | 14.6% |
| 25 to 29 Minutes | 3,180 | 8.5% |
| 30 to 34 Minutes | 5,383 | 14.4% |
| 35 to 39 Minutes | 1,366 | 3.6% |
| 40 to 44 Minutes | 1,381 | 3.7% |
| 45 to 59 Minutes | 3,561 | 9.5% |
| 60 to 89 Minutes | 1,905 | 5.1% |
| 90 or more Minutes | 1,114 | 3.0% |
Commute Time by Sex in Mission Viejo
The most common commute times in Mission Viejo are 15 to 19 minutes (3,474 commuters, 16.5%) for males and 15 to 19 minutes (3,058 commuters, 18.7%) for females.
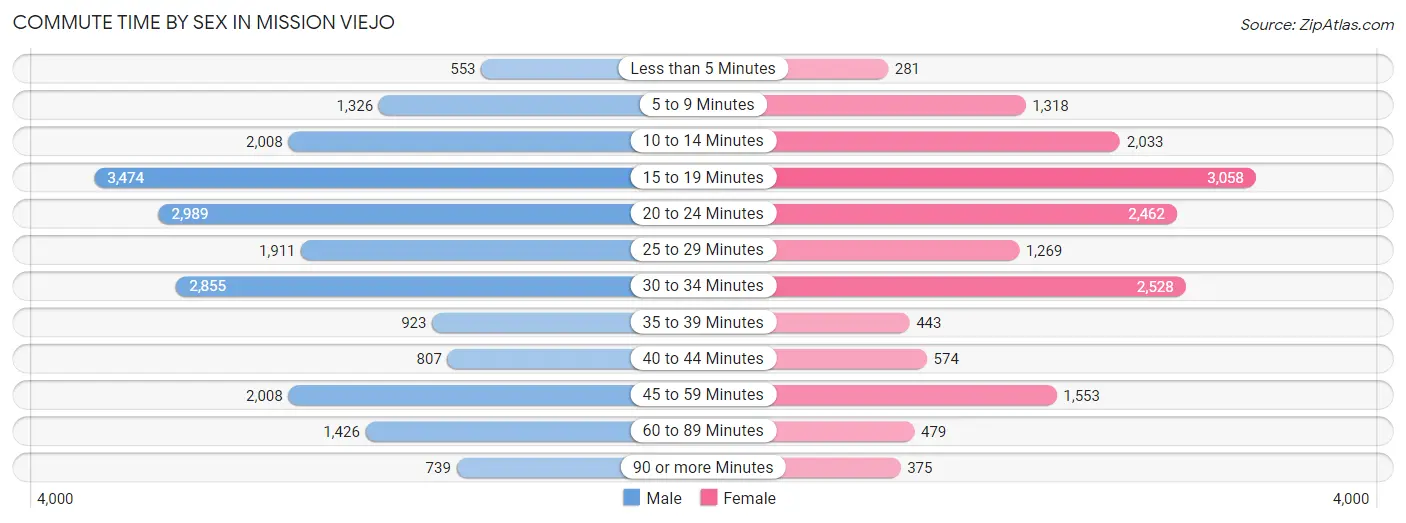
| Commute Time | Male | Female |
| Less than 5 Minutes | 553 (2.6%) | 281 (1.7%) |
| 5 to 9 Minutes | 1,326 (6.3%) | 1,318 (8.1%) |
| 10 to 14 Minutes | 2,008 (9.6%) | 2,033 (12.4%) |
| 15 to 19 Minutes | 3,474 (16.5%) | 3,058 (18.7%) |
| 20 to 24 Minutes | 2,989 (14.2%) | 2,462 (15.0%) |
| 25 to 29 Minutes | 1,911 (9.1%) | 1,269 (7.7%) |
| 30 to 34 Minutes | 2,855 (13.6%) | 2,528 (15.4%) |
| 35 to 39 Minutes | 923 (4.4%) | 443 (2.7%) |
| 40 to 44 Minutes | 807 (3.8%) | 574 (3.5%) |
| 45 to 59 Minutes | 2,008 (9.6%) | 1,553 (9.5%) |
| 60 to 89 Minutes | 1,426 (6.8%) | 479 (2.9%) |
| 90 or more Minutes | 739 (3.5%) | 375 (2.3%) |
Time of Departure to Work by Sex in Mission Viejo
The most frequent times of departure to work in Mission Viejo are 8:00 AM to 8:29 AM (3,080, 14.6%) for males and 8:00 AM to 8:29 AM (2,914, 17.8%) for females.
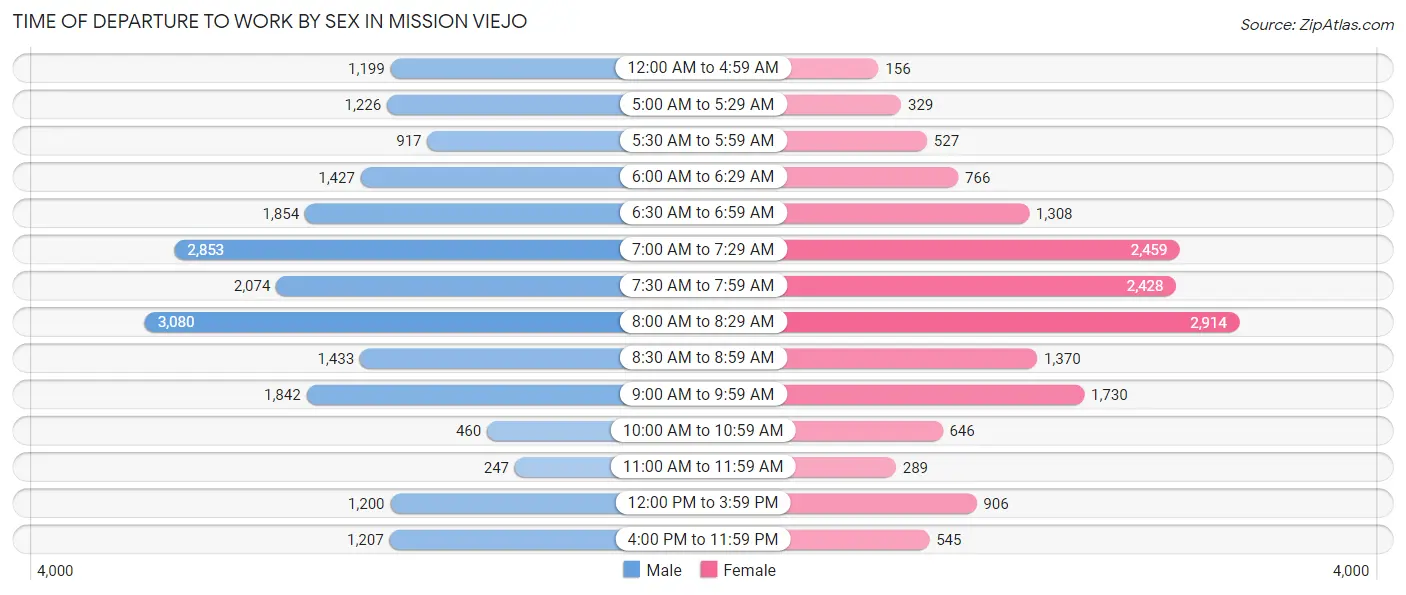
| Time of Departure | Male | Female |
| 12:00 AM to 4:59 AM | 1,199 (5.7%) | 156 (0.9%) |
| 5:00 AM to 5:29 AM | 1,226 (5.8%) | 329 (2.0%) |
| 5:30 AM to 5:59 AM | 917 (4.4%) | 527 (3.2%) |
| 6:00 AM to 6:29 AM | 1,427 (6.8%) | 766 (4.7%) |
| 6:30 AM to 6:59 AM | 1,854 (8.8%) | 1,308 (8.0%) |
| 7:00 AM to 7:29 AM | 2,853 (13.6%) | 2,459 (15.0%) |
| 7:30 AM to 7:59 AM | 2,074 (9.9%) | 2,428 (14.8%) |
| 8:00 AM to 8:29 AM | 3,080 (14.6%) | 2,914 (17.8%) |
| 8:30 AM to 8:59 AM | 1,433 (6.8%) | 1,370 (8.4%) |
| 9:00 AM to 9:59 AM | 1,842 (8.8%) | 1,730 (10.6%) |
| 10:00 AM to 10:59 AM | 460 (2.2%) | 646 (4.0%) |
| 11:00 AM to 11:59 AM | 247 (1.2%) | 289 (1.8%) |
| 12:00 PM to 3:59 PM | 1,200 (5.7%) | 906 (5.5%) |
| 4:00 PM to 11:59 PM | 1,207 (5.7%) | 545 (3.3%) |
| Total | 21,019 (100.0%) | 16,373 (100.0%) |
Housing Occupancy in Mission Viejo
Occupancy by Ownership in Mission Viejo
Of the total 32,650 dwellings in Mission Viejo, owner-occupied units account for 25,312 (77.5%), while renter-occupied units make up 7,338 (22.5%).
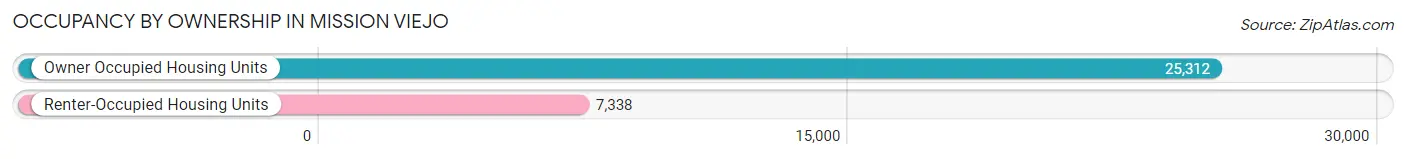
| Occupancy | # Housing Units | % Housing Units |
| Owner Occupied Housing Units | 25,312 | 77.5% |
| Renter-Occupied Housing Units | 7,338 | 22.5% |
| Total Occupied Housing Units | 32,650 | 100.0% |
Occupancy by Household Size in Mission Viejo
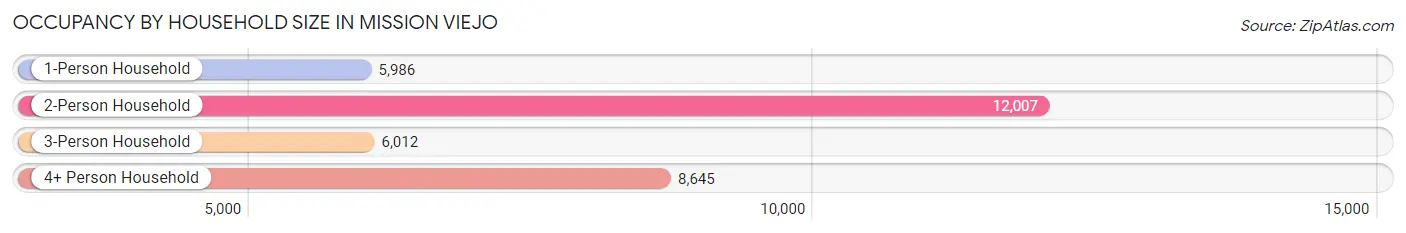
| Household Size | # Housing Units | % Housing Units |
| 1-Person Household | 5,986 | 18.3% |
| 2-Person Household | 12,007 | 36.8% |
| 3-Person Household | 6,012 | 18.4% |
| 4+ Person Household | 8,645 | 26.5% |
| Total Housing Units | 32,650 | 100.0% |
Occupancy by Ownership by Household Size in Mission Viejo
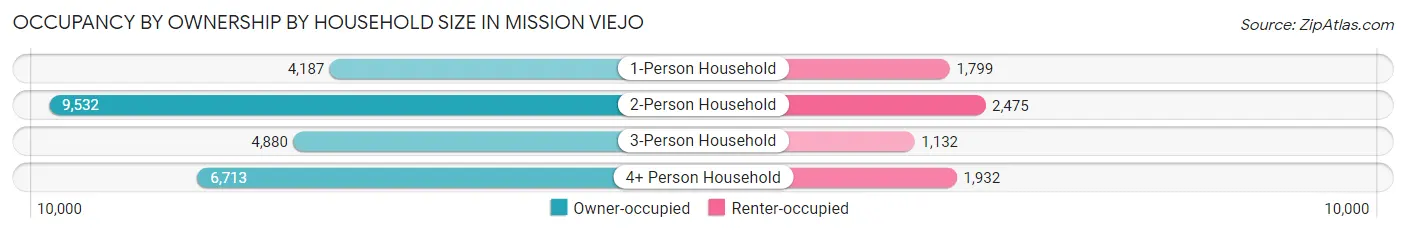
| Household Size | Owner-occupied | Renter-occupied |
| 1-Person Household | 4,187 (70.0%) | 1,799 (30.0%) |
| 2-Person Household | 9,532 (79.4%) | 2,475 (20.6%) |
| 3-Person Household | 4,880 (81.2%) | 1,132 (18.8%) |
| 4+ Person Household | 6,713 (77.6%) | 1,932 (22.4%) |
| Total Housing Units | 25,312 (77.5%) | 7,338 (22.5%) |
Occupancy by Educational Attainment in Mission Viejo
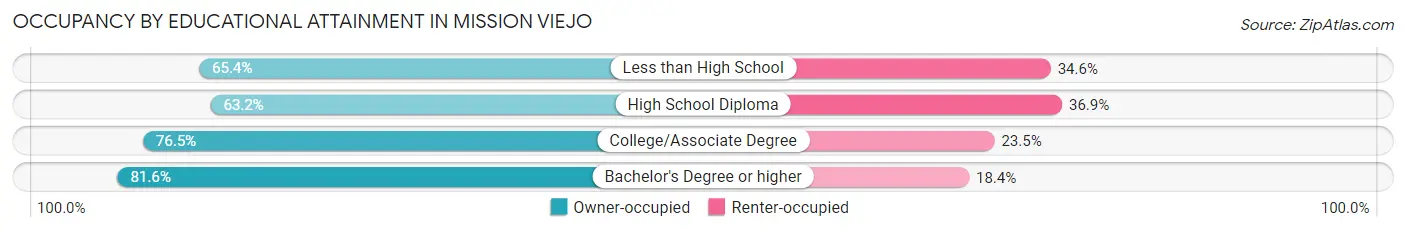
| Household Size | Owner-occupied | Renter-occupied |
| Less than High School | 820 (65.4%) | 434 (34.6%) |
| High School Diploma | 2,187 (63.1%) | 1,276 (36.8%) |
| College/Associate Degree | 7,336 (76.5%) | 2,248 (23.5%) |
| Bachelor's Degree or higher | 14,969 (81.6%) | 3,380 (18.4%) |
Occupancy by Age of Householder in Mission Viejo
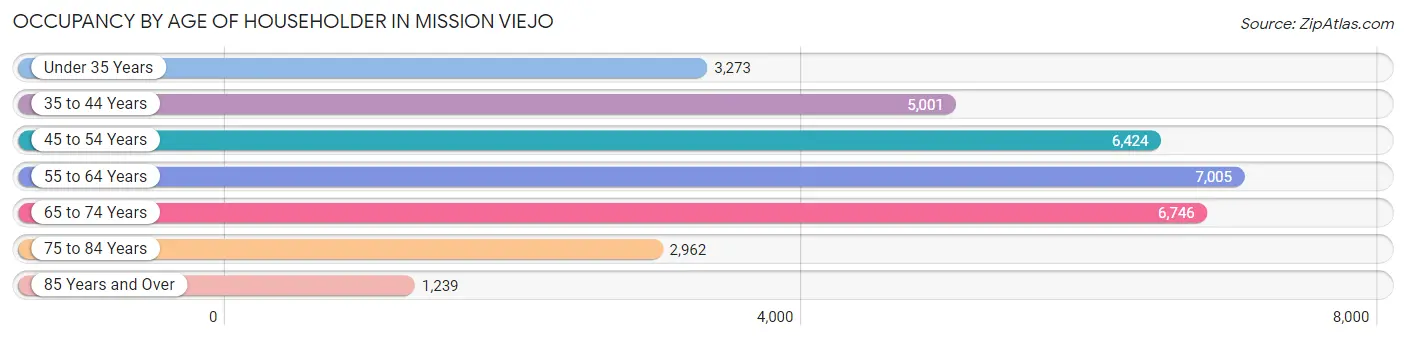
| Age Bracket | # Households | % Households |
| Under 35 Years | 3,273 | 10.0% |
| 35 to 44 Years | 5,001 | 15.3% |
| 45 to 54 Years | 6,424 | 19.7% |
| 55 to 64 Years | 7,005 | 21.4% |
| 65 to 74 Years | 6,746 | 20.7% |
| 75 to 84 Years | 2,962 | 9.1% |
| 85 Years and Over | 1,239 | 3.8% |
| Total | 32,650 | 100.0% |
Housing Finances in Mission Viejo
Median Income by Occupancy in Mission Viejo
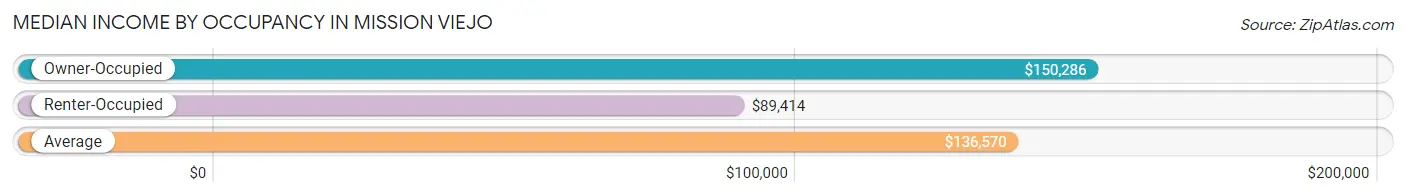
| Occupancy Type | # Households | Median Income |
| Owner-Occupied | 25,312 (77.5%) | $150,286 |
| Renter-Occupied | 7,338 (22.5%) | $89,414 |
| Average | 32,650 (100.0%) | $136,570 |
Occupancy by Householder Income Bracket in Mission Viejo
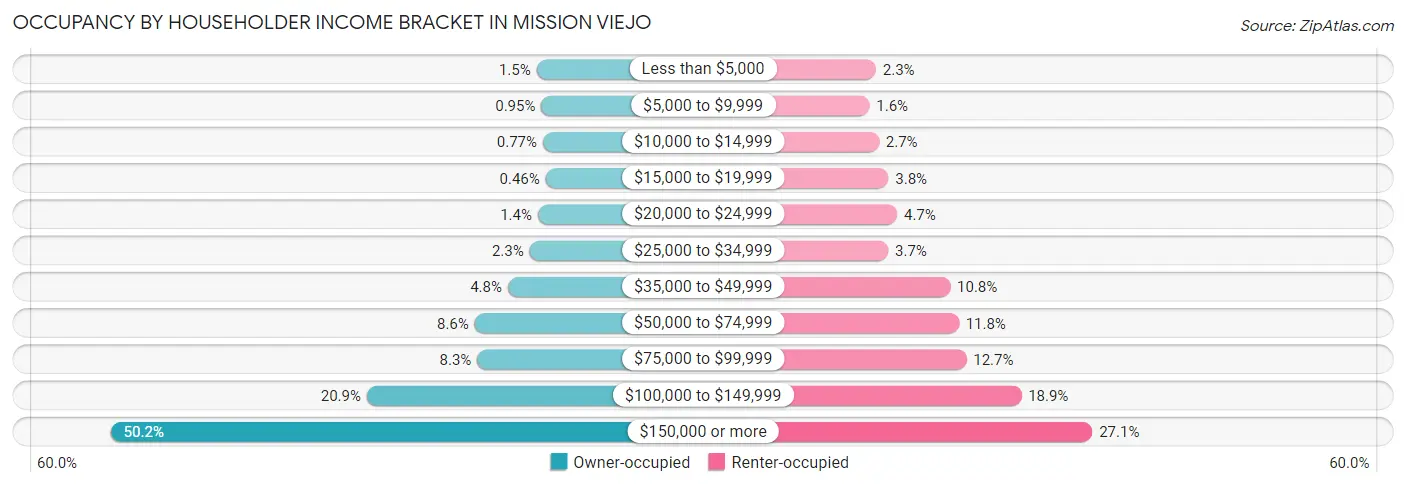
| Income Bracket | Owner-occupied | Renter-occupied |
| Less than $5,000 | 377 (1.5%) | 170 (2.3%) |
| $5,000 to $9,999 | 241 (0.9%) | 116 (1.6%) |
| $10,000 to $14,999 | 195 (0.8%) | 195 (2.7%) |
| $15,000 to $19,999 | 117 (0.5%) | 275 (3.7%) |
| $20,000 to $24,999 | 341 (1.3%) | 348 (4.7%) |
| $25,000 to $34,999 | 580 (2.3%) | 273 (3.7%) |
| $35,000 to $49,999 | 1,210 (4.8%) | 793 (10.8%) |
| $50,000 to $74,999 | 2,169 (8.6%) | 865 (11.8%) |
| $75,000 to $99,999 | 2,097 (8.3%) | 929 (12.7%) |
| $100,000 to $149,999 | 5,288 (20.9%) | 1,389 (18.9%) |
| $150,000 or more | 12,697 (50.2%) | 1,985 (27.1%) |
| Total | 25,312 (100.0%) | 7,338 (100.0%) |
Monthly Housing Cost Tiers in Mission Viejo
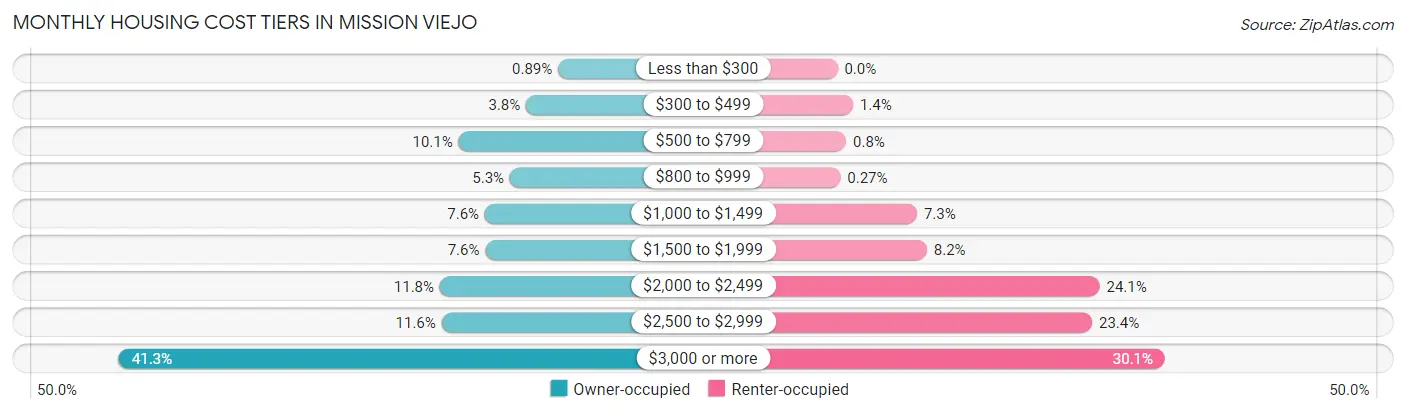
| Monthly Cost | Owner-occupied | Renter-occupied |
| Less than $300 | 226 (0.9%) | 0 (0.0%) |
| $300 to $499 | 970 (3.8%) | 105 (1.4%) |
| $500 to $799 | 2,544 (10.1%) | 59 (0.8%) |
| $800 to $999 | 1,347 (5.3%) | 20 (0.3%) |
| $1,000 to $1,499 | 1,929 (7.6%) | 537 (7.3%) |
| $1,500 to $1,999 | 1,921 (7.6%) | 604 (8.2%) |
| $2,000 to $2,499 | 2,978 (11.8%) | 1,771 (24.1%) |
| $2,500 to $2,999 | 2,939 (11.6%) | 1,720 (23.4%) |
| $3,000 or more | 10,458 (41.3%) | 2,212 (30.1%) |
| Total | 25,312 (100.0%) | 7,338 (100.0%) |
Physical Housing Characteristics in Mission Viejo
Housing Structures in Mission Viejo
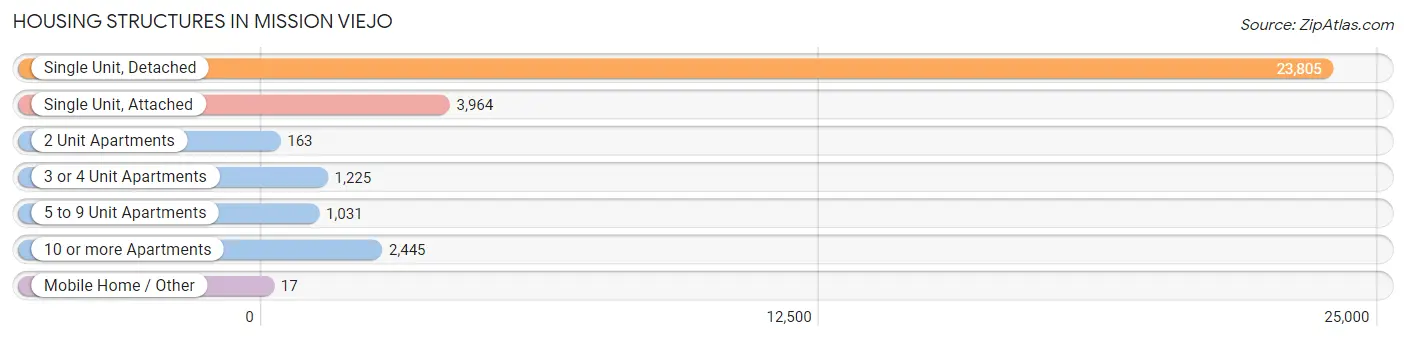
| Structure Type | # Housing Units | % Housing Units |
| Single Unit, Detached | 23,805 | 72.9% |
| Single Unit, Attached | 3,964 | 12.1% |
| 2 Unit Apartments | 163 | 0.5% |
| 3 or 4 Unit Apartments | 1,225 | 3.7% |
| 5 to 9 Unit Apartments | 1,031 | 3.2% |
| 10 or more Apartments | 2,445 | 7.5% |
| Mobile Home / Other | 17 | 0.1% |
| Total | 32,650 | 100.0% |
Housing Structures by Occupancy in Mission Viejo
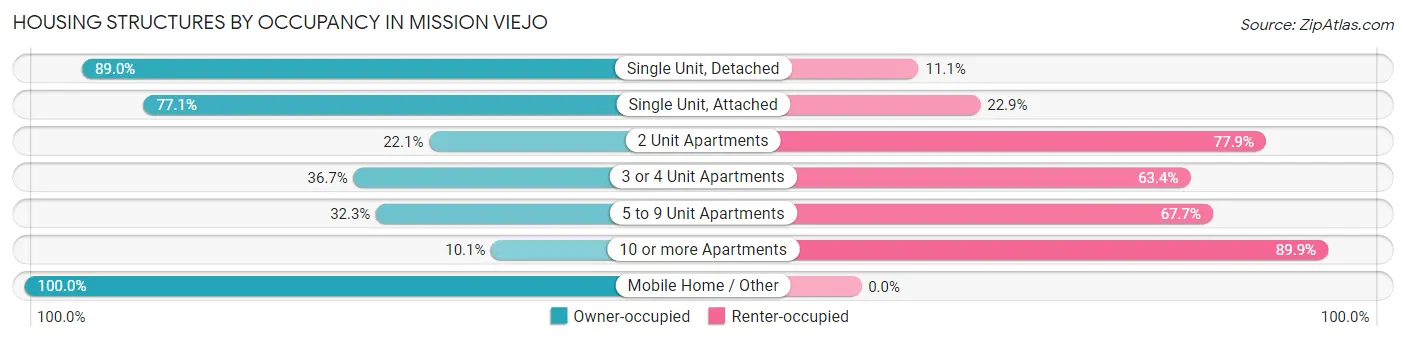
| Structure Type | Owner-occupied | Renter-occupied |
| Single Unit, Detached | 21,174 (88.9%) | 2,631 (11.1%) |
| Single Unit, Attached | 3,055 (77.1%) | 909 (22.9%) |
| 2 Unit Apartments | 36 (22.1%) | 127 (77.9%) |
| 3 or 4 Unit Apartments | 449 (36.6%) | 776 (63.3%) |
| 5 to 9 Unit Apartments | 333 (32.3%) | 698 (67.7%) |
| 10 or more Apartments | 248 (10.1%) | 2,197 (89.9%) |
| Mobile Home / Other | 17 (100.0%) | 0 (0.0%) |
| Total | 25,312 (77.5%) | 7,338 (22.5%) |
Housing Structures by Number of Rooms in Mission Viejo
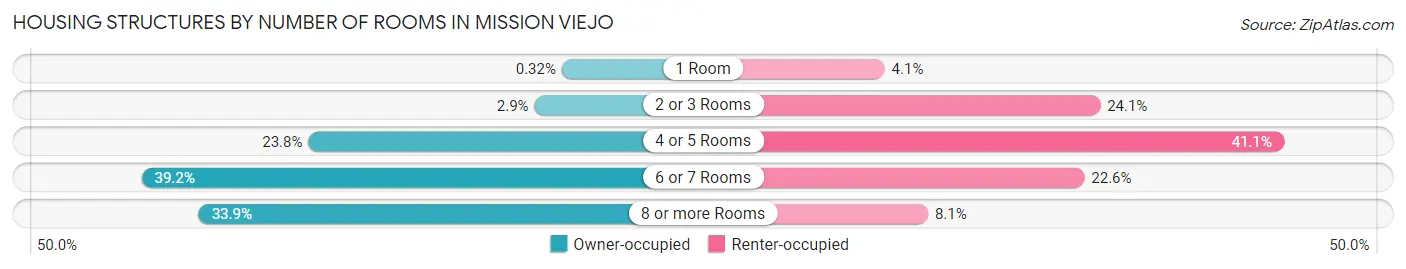
| Number of Rooms | Owner-occupied | Renter-occupied |
| 1 Room | 80 (0.3%) | 304 (4.1%) |
| 2 or 3 Rooms | 721 (2.9%) | 1,766 (24.1%) |
| 4 or 5 Rooms | 6,014 (23.8%) | 3,012 (41.0%) |
| 6 or 7 Rooms | 9,918 (39.2%) | 1,659 (22.6%) |
| 8 or more Rooms | 8,579 (33.9%) | 597 (8.1%) |
| Total | 25,312 (100.0%) | 7,338 (100.0%) |
Housing Structure by Heating Type in Mission Viejo
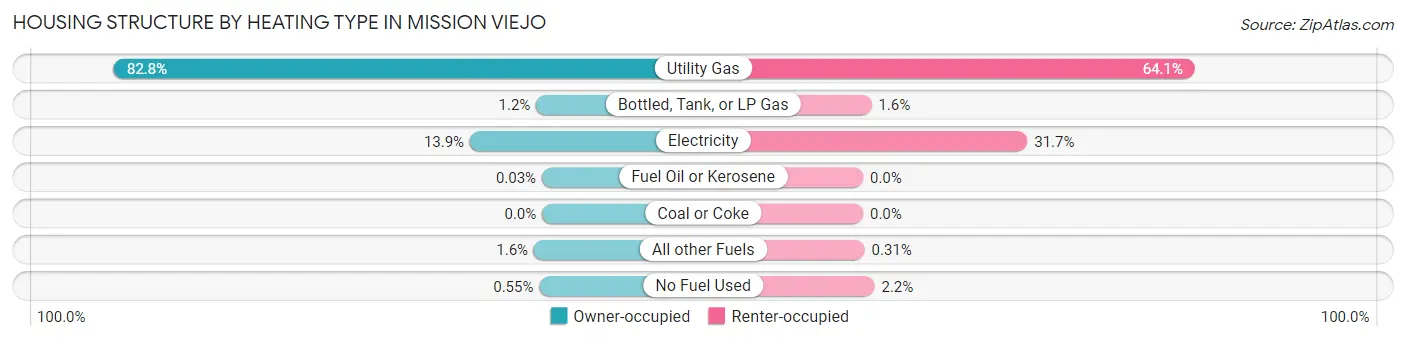
| Heating Type | Owner-occupied | Renter-occupied |
| Utility Gas | 20,947 (82.8%) | 4,704 (64.1%) |
| Bottled, Tank, or LP Gas | 290 (1.1%) | 119 (1.6%) |
| Electricity | 3,528 (13.9%) | 2,329 (31.7%) |
| Fuel Oil or Kerosene | 7 (0.0%) | 0 (0.0%) |
| Coal or Coke | 0 (0.0%) | 0 (0.0%) |
| All other Fuels | 400 (1.6%) | 23 (0.3%) |
| No Fuel Used | 140 (0.5%) | 163 (2.2%) |
| Total | 25,312 (100.0%) | 7,338 (100.0%) |
Household Vehicle Usage in Mission Viejo
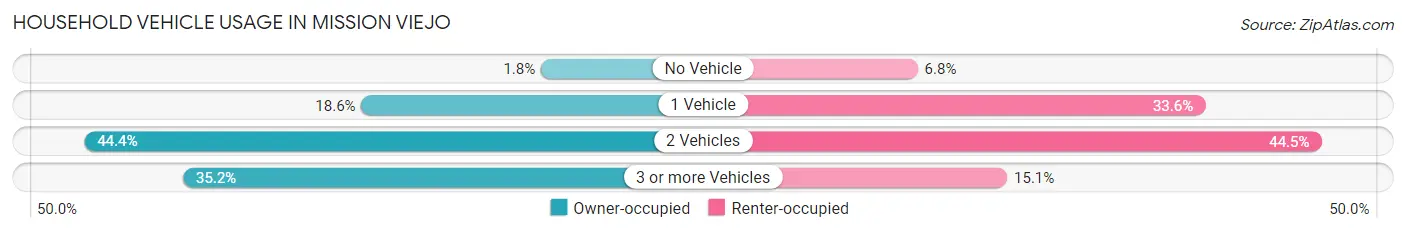
| Vehicles per Household | Owner-occupied | Renter-occupied |
| No Vehicle | 454 (1.8%) | 498 (6.8%) |
| 1 Vehicle | 4,697 (18.6%) | 2,466 (33.6%) |
| 2 Vehicles | 11,247 (44.4%) | 3,263 (44.5%) |
| 3 or more Vehicles | 8,914 (35.2%) | 1,111 (15.1%) |
| Total | 25,312 (100.0%) | 7,338 (100.0%) |
Real Estate & Mortgages in Mission Viejo
Real Estate and Mortgage Overview in Mission Viejo
| Characteristic | Without Mortgage | With Mortgage |
| Housing Units | 5,976 | 19,336 |
| Median Property Value | $857,500 | $892,700 |
| Median Household Income | $107,594 | $10,639 |
| Monthly Housing Costs | $747 | $10,429 |
| Real Estate Taxes | $4,209 | $242 |
Property Value by Mortgage Status in Mission Viejo
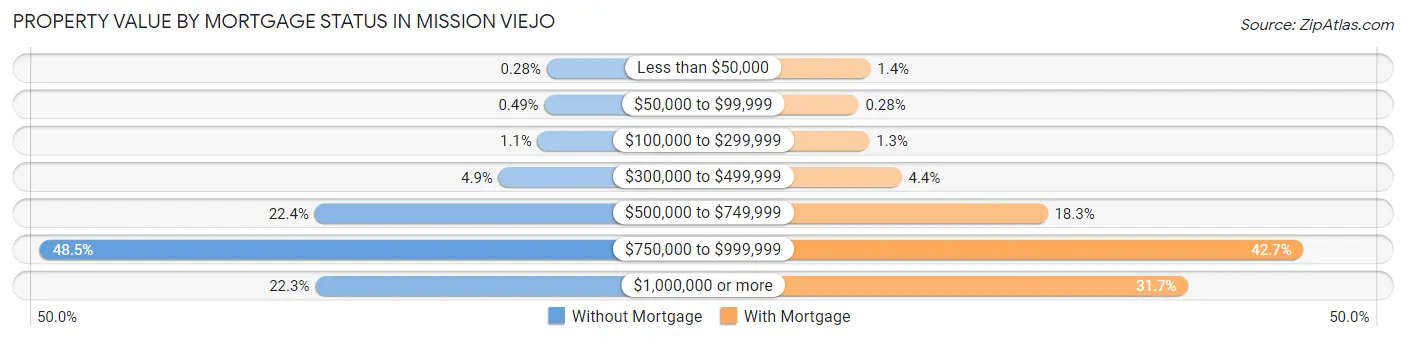
| Property Value | Without Mortgage | With Mortgage |
| Less than $50,000 | 17 (0.3%) | 272 (1.4%) |
| $50,000 to $99,999 | 29 (0.5%) | 54 (0.3%) |
| $100,000 to $299,999 | 68 (1.1%) | 251 (1.3%) |
| $300,000 to $499,999 | 290 (4.9%) | 847 (4.4%) |
| $500,000 to $749,999 | 1,337 (22.4%) | 3,535 (18.3%) |
| $750,000 to $999,999 | 2,901 (48.5%) | 8,248 (42.7%) |
| $1,000,000 or more | 1,334 (22.3%) | 6,129 (31.7%) |
| Total | 5,976 (100.0%) | 19,336 (100.0%) |
Household Income by Mortgage Status in Mission Viejo
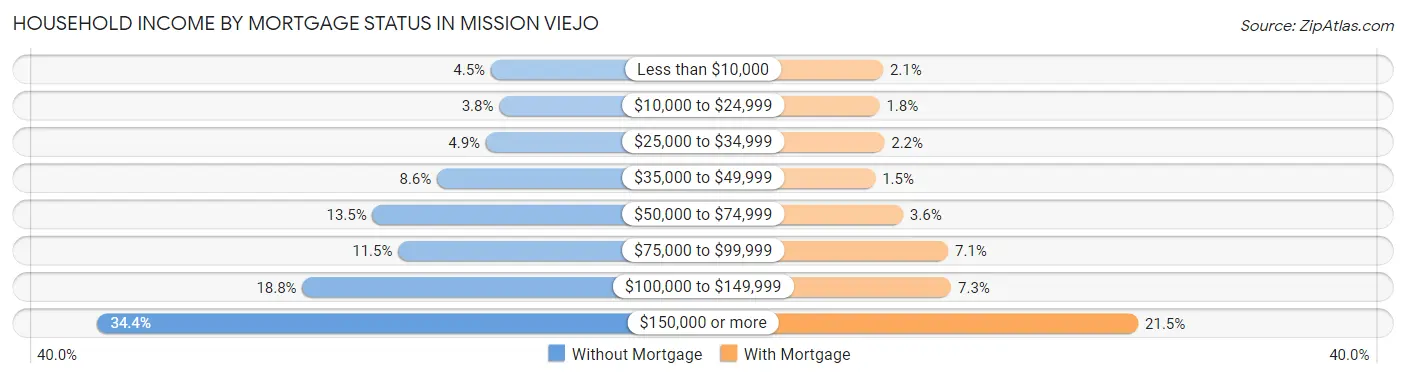
| Household Income | Without Mortgage | With Mortgage |
| Less than $10,000 | 267 (4.5%) | 404 (2.1%) |
| $10,000 to $24,999 | 229 (3.8%) | 351 (1.8%) |
| $25,000 to $34,999 | 290 (4.9%) | 424 (2.2%) |
| $35,000 to $49,999 | 512 (8.6%) | 290 (1.5%) |
| $50,000 to $74,999 | 806 (13.5%) | 698 (3.6%) |
| $75,000 to $99,999 | 689 (11.5%) | 1,363 (7.0%) |
| $100,000 to $149,999 | 1,125 (18.8%) | 1,408 (7.3%) |
| $150,000 or more | 2,058 (34.4%) | 4,163 (21.5%) |
| Total | 5,976 (100.0%) | 19,336 (100.0%) |
Property Value to Household Income Ratio in Mission Viejo
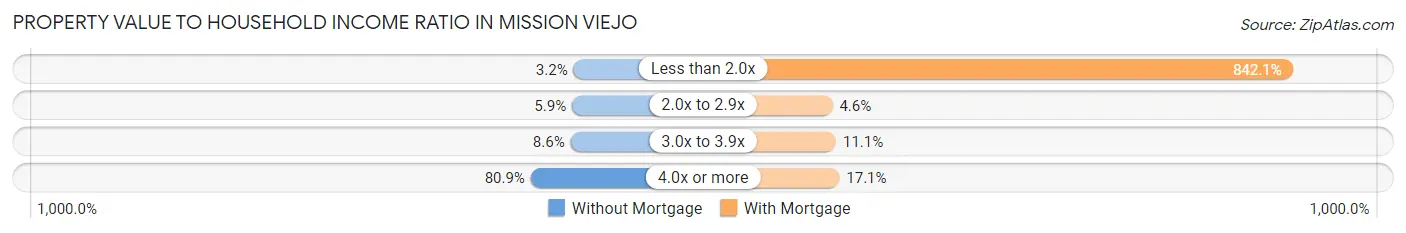
| Value-to-Income Ratio | Without Mortgage | With Mortgage |
| Less than 2.0x | 189 (3.2%) | 162,837 (842.1%) |
| 2.0x to 2.9x | 353 (5.9%) | 892 (4.6%) |
| 3.0x to 3.9x | 511 (8.6%) | 2,146 (11.1%) |
| 4.0x or more | 4,834 (80.9%) | 3,312 (17.1%) |
| Total | 5,976 (100.0%) | 19,336 (100.0%) |
Real Estate Taxes by Mortgage Status in Mission Viejo
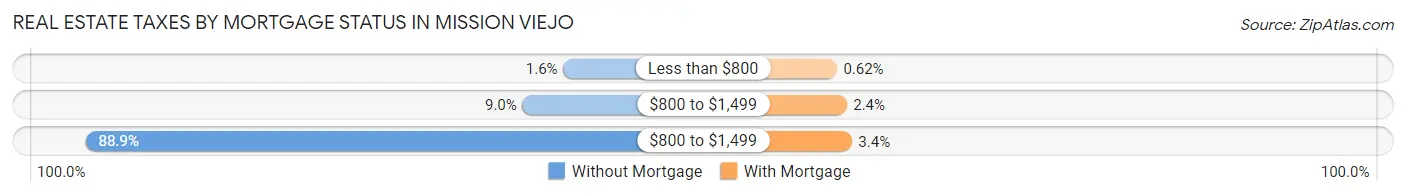
| Property Taxes | Without Mortgage | With Mortgage |
| Less than $800 | 95 (1.6%) | 120 (0.6%) |
| $800 to $1,499 | 540 (9.0%) | 468 (2.4%) |
| $800 to $1,499 | 5,310 (88.9%) | 647 (3.4%) |
| Total | 5,976 (100.0%) | 19,336 (100.0%) |
Health & Disability in Mission Viejo
Health Insurance Coverage by Age in Mission Viejo
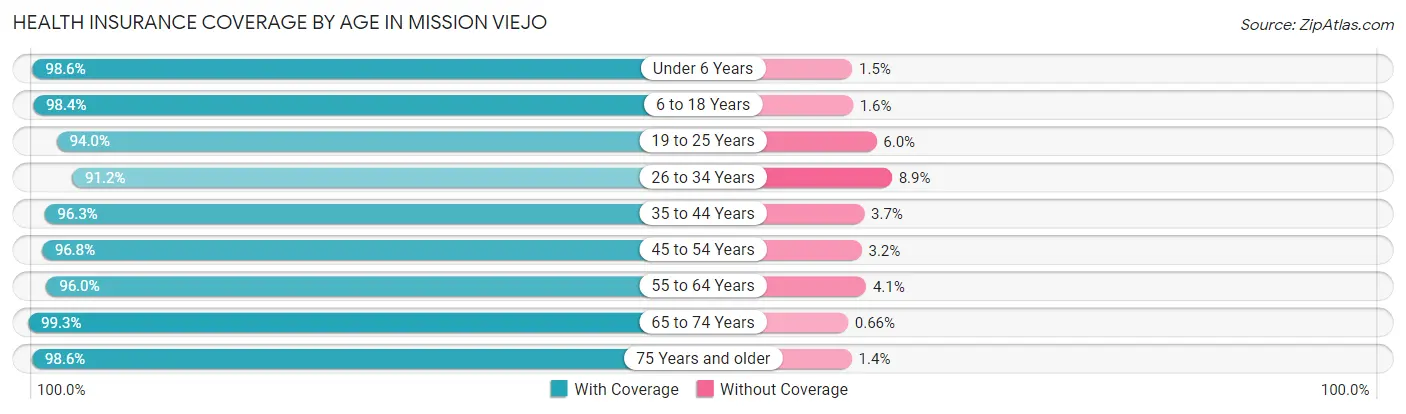
| Age Bracket | With Coverage | Without Coverage |
| Under 6 Years | 5,831 (98.6%) | 86 (1.5%) |
| 6 to 18 Years | 13,271 (98.4%) | 211 (1.6%) |
| 19 to 25 Years | 5,578 (94.0%) | 354 (6.0%) |
| 26 to 34 Years | 7,832 (91.1%) | 760 (8.8%) |
| 35 to 44 Years | 11,238 (96.3%) | 432 (3.7%) |
| 45 to 54 Years | 12,390 (96.8%) | 411 (3.2%) |
| 55 to 64 Years | 13,446 (96.0%) | 567 (4.1%) |
| 65 to 74 Years | 11,930 (99.3%) | 79 (0.7%) |
| 75 Years and older | 8,200 (98.6%) | 114 (1.4%) |
| Total | 89,716 (96.8%) | 3,014 (3.3%) |
Health Insurance Coverage by Citizenship Status in Mission Viejo
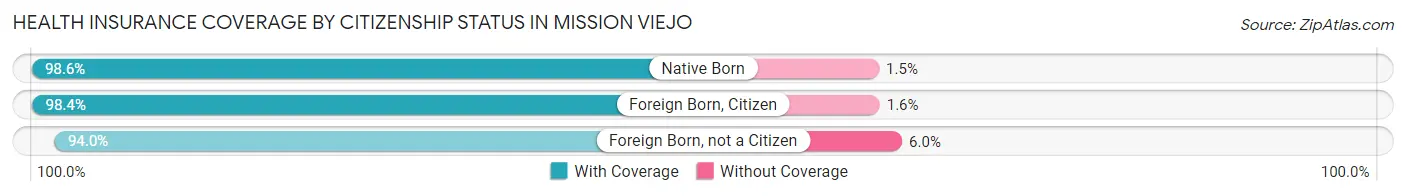
| Citizenship Status | With Coverage | Without Coverage |
| Native Born | 5,831 (98.6%) | 86 (1.5%) |
| Foreign Born, Citizen | 13,271 (98.4%) | 211 (1.6%) |
| Foreign Born, not a Citizen | 5,578 (94.0%) | 354 (6.0%) |
Health Insurance Coverage by Household Income in Mission Viejo
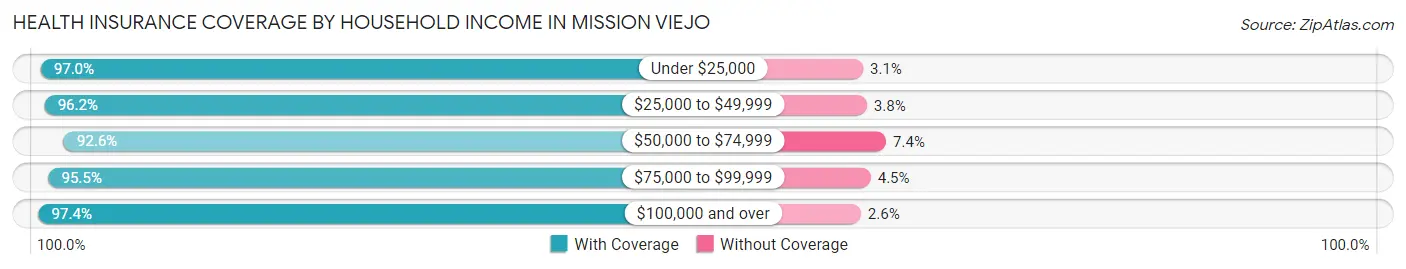
| Household Income | With Coverage | Without Coverage |
| Under $25,000 | 3,626 (97.0%) | 114 (3.0%) |
| $25,000 to $49,999 | 6,762 (96.2%) | 265 (3.8%) |
| $50,000 to $74,999 | 6,147 (92.6%) | 489 (7.4%) |
| $75,000 to $99,999 | 6,887 (95.5%) | 324 (4.5%) |
| $100,000 and over | 64,671 (97.4%) | 1,756 (2.6%) |
Public vs Private Health Insurance Coverage by Age in Mission Viejo
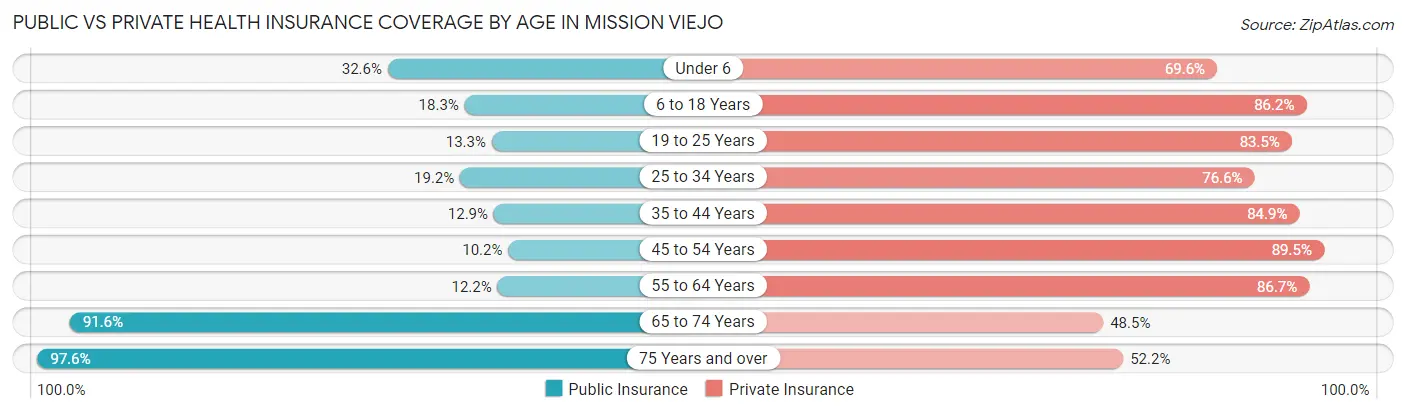
| Age Bracket | Public Insurance | Private Insurance |
| Under 6 | 1,928 (32.6%) | 4,120 (69.6%) |
| 6 to 18 Years | 2,470 (18.3%) | 11,621 (86.2%) |
| 19 to 25 Years | 788 (13.3%) | 4,953 (83.5%) |
| 25 to 34 Years | 1,646 (19.2%) | 6,580 (76.6%) |
| 35 to 44 Years | 1,505 (12.9%) | 9,908 (84.9%) |
| 45 to 54 Years | 1,308 (10.2%) | 11,450 (89.4%) |
| 55 to 64 Years | 1,711 (12.2%) | 12,153 (86.7%) |
| 65 to 74 Years | 11,002 (91.6%) | 5,828 (48.5%) |
| 75 Years and over | 8,118 (97.6%) | 4,343 (52.2%) |
| Total | 30,476 (32.9%) | 70,956 (76.5%) |
Disability Status by Sex by Age in Mission Viejo
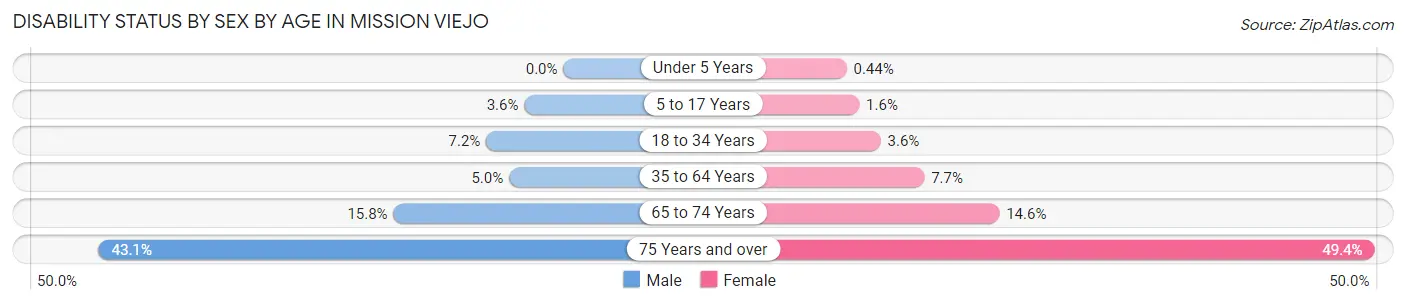
| Age Bracket | Male | Female |
| Under 5 Years | 0 (0.0%) | 12 (0.4%) |
| 5 to 17 Years | 244 (3.6%) | 104 (1.6%) |
| 18 to 34 Years | 612 (7.2%) | 252 (3.6%) |
| 35 to 64 Years | 957 (5.0%) | 1,493 (7.6%) |
| 65 to 74 Years | 928 (15.8%) | 895 (14.6%) |
| 75 Years and over | 1,538 (43.1%) | 2,347 (49.4%) |
Disability Class by Sex by Age in Mission Viejo
Disability Class: Hearing Difficulty
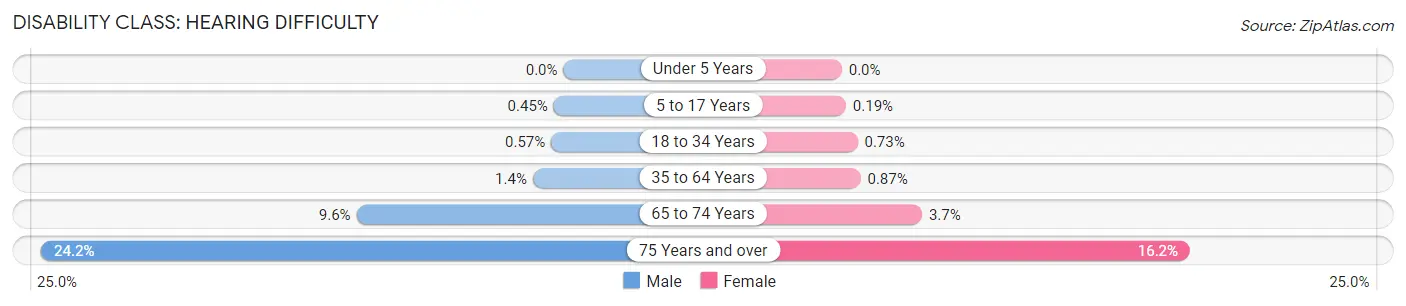
| Age Bracket | Male | Female |
| Under 5 Years | 0 (0.0%) | 0 (0.0%) |
| 5 to 17 Years | 30 (0.4%) | 12 (0.2%) |
| 18 to 34 Years | 49 (0.6%) | 51 (0.7%) |
| 35 to 64 Years | 270 (1.4%) | 169 (0.9%) |
| 65 to 74 Years | 565 (9.6%) | 228 (3.7%) |
| 75 Years and over | 864 (24.2%) | 767 (16.2%) |
Disability Class: Vision Difficulty
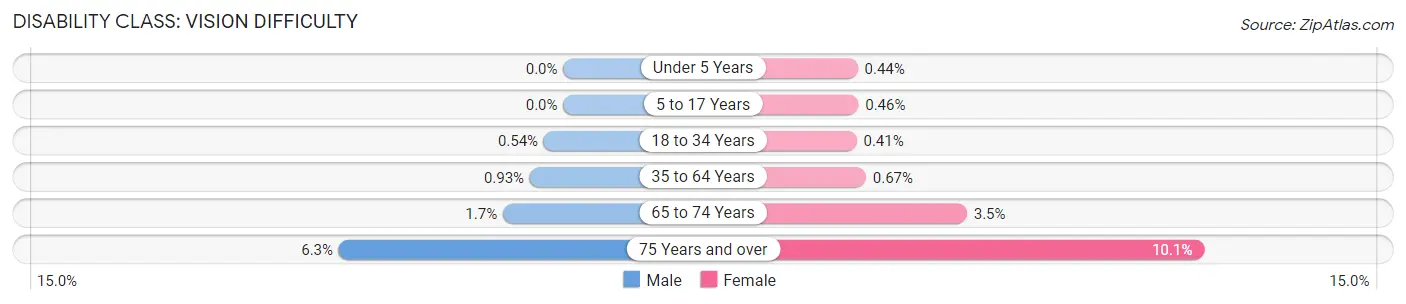
| Age Bracket | Male | Female |
| Under 5 Years | 0 (0.0%) | 12 (0.4%) |
| 5 to 17 Years | 0 (0.0%) | 30 (0.5%) |
| 18 to 34 Years | 46 (0.5%) | 29 (0.4%) |
| 35 to 64 Years | 177 (0.9%) | 130 (0.7%) |
| 65 to 74 Years | 99 (1.7%) | 213 (3.5%) |
| 75 Years and over | 223 (6.2%) | 479 (10.1%) |
Disability Class: Cognitive Difficulty
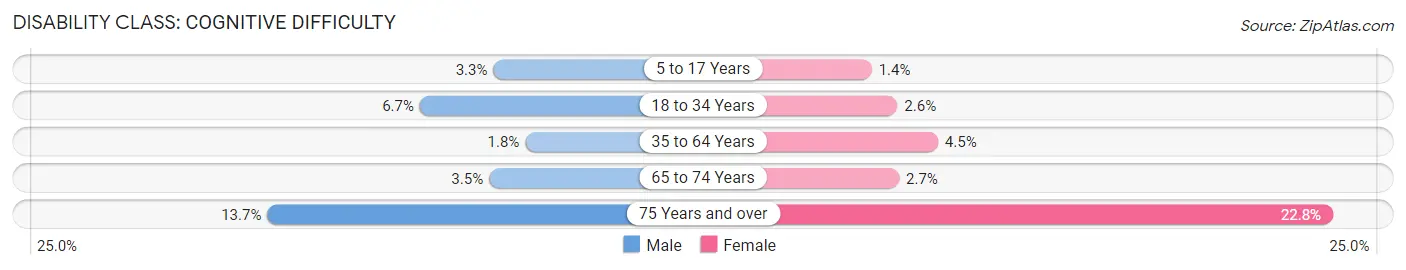
| Age Bracket | Male | Female |
| 5 to 17 Years | 219 (3.3%) | 90 (1.4%) |
| 18 to 34 Years | 569 (6.7%) | 181 (2.6%) |
| 35 to 64 Years | 336 (1.8%) | 870 (4.5%) |
| 65 to 74 Years | 203 (3.5%) | 163 (2.7%) |
| 75 Years and over | 490 (13.7%) | 1,082 (22.8%) |
Disability Class: Ambulatory Difficulty
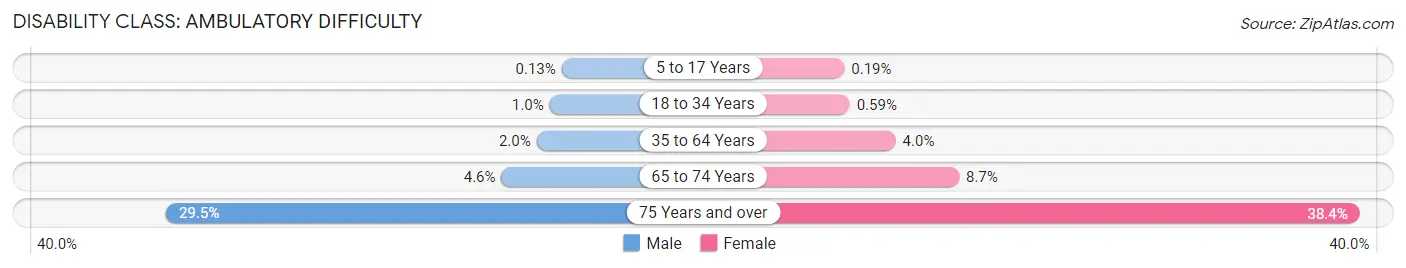
| Age Bracket | Male | Female |
| 5 to 17 Years | 9 (0.1%) | 12 (0.2%) |
| 18 to 34 Years | 88 (1.0%) | 41 (0.6%) |
| 35 to 64 Years | 377 (2.0%) | 781 (4.0%) |
| 65 to 74 Years | 271 (4.6%) | 533 (8.7%) |
| 75 Years and over | 1,052 (29.5%) | 1,825 (38.4%) |
Disability Class: Self-Care Difficulty
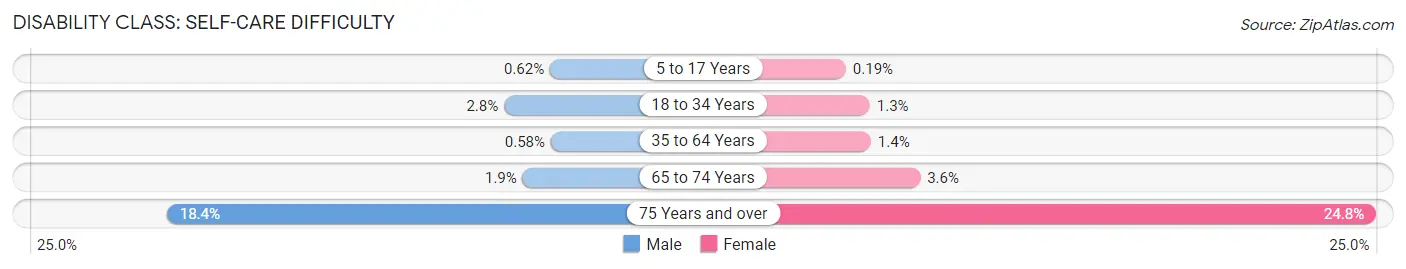
| Age Bracket | Male | Female |
| 5 to 17 Years | 42 (0.6%) | 12 (0.2%) |
| 18 to 34 Years | 235 (2.8%) | 91 (1.3%) |
| 35 to 64 Years | 110 (0.6%) | 263 (1.3%) |
| 65 to 74 Years | 111 (1.9%) | 223 (3.6%) |
| 75 Years and over | 656 (18.4%) | 1,177 (24.8%) |
Technology Access in Mission Viejo
Computing Device Access in Mission Viejo
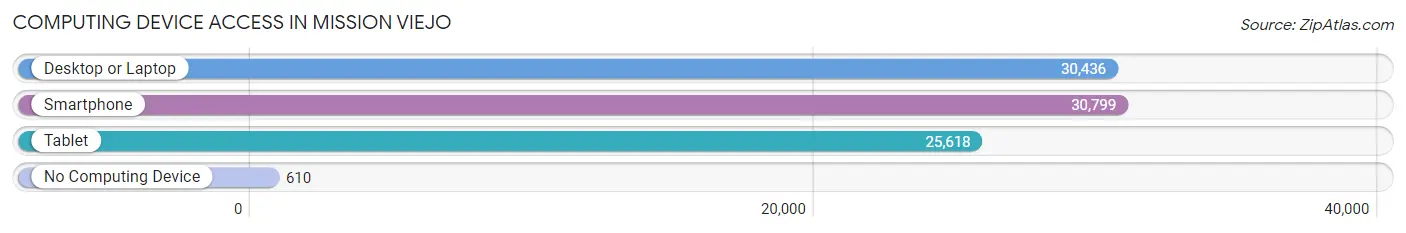
| Device Type | # Households | % Households |
| Desktop or Laptop | 30,436 | 93.2% |
| Smartphone | 30,799 | 94.3% |
| Tablet | 25,618 | 78.5% |
| No Computing Device | 610 | 1.9% |
| Total | 32,650 | 100.0% |
Internet Access in Mission Viejo
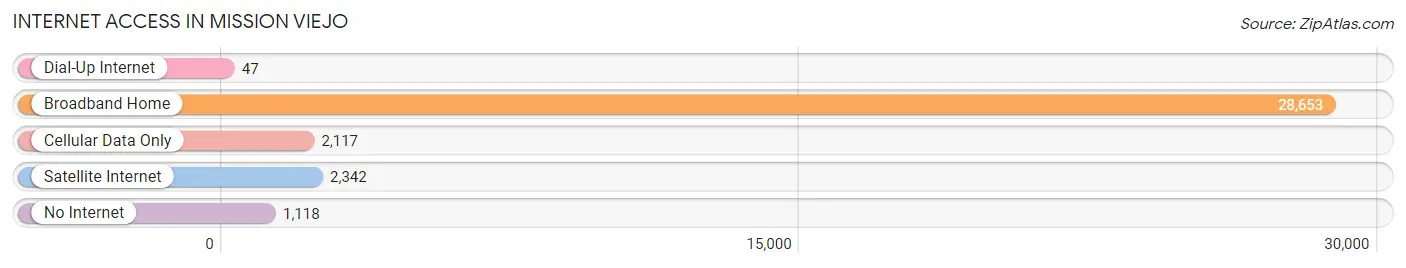
| Internet Type | # Households | % Households |
| Dial-Up Internet | 47 | 0.1% |
| Broadband Home | 28,653 | 87.8% |
| Cellular Data Only | 2,117 | 6.5% |
| Satellite Internet | 2,342 | 7.2% |
| No Internet | 1,118 | 3.4% |
| Total | 32,650 | 100.0% |
Mission Viejo Summary
History
Mission Viejo is a city located in Orange County, California. It is situated in the Saddleback Valley, and is bordered by the cities of Lake Forest, Rancho Santa Margarita, San Juan Capistrano, and Laguna Hills. The city was incorporated in 1988, and is one of the largest master-planned communities in the United States.
Mission Viejo was originally inhabited by the Acjachemen Native American tribe, who lived in the area for thousands of years. The area was later explored by Spanish missionaries, who named the area “Mission Viejo”, which translates to “Old Mission”. The area was then used for cattle grazing, and in the late 1800s, the area was divided into several large ranches.
In the 1950s, the area was purchased by the Mission Viejo Company, which was owned by the O’Neill family. The company began to develop the area into a master-planned community, and in 1961, the first homes were built. The city was officially incorporated in 1988, and has since grown to become one of the largest cities in Orange County.
Geography
Mission Viejo is located in the Saddleback Valley, and is bordered by the cities of Lake Forest, Rancho Santa Margarita, San Juan Capistrano, and Laguna Hills. The city covers an area of 18.1 square miles, and has an elevation of 545 feet.
The city is located in a Mediterranean climate zone, and has mild temperatures year-round. The average high temperature in the summer is around 80 degrees Fahrenheit, and the average low temperature in the winter is around 50 degrees Fahrenheit.
The city is home to several parks and recreational areas, including Oso Creek Trail, Mission Viejo Lake, and the Norman P. Murray Community and Senior Center.
Economy
Mission Viejo is home to several major employers, including Mission Hospital, Saddleback College, and the Mission Viejo Company. The city also has a thriving retail sector, with several shopping centers and malls, including The Shops at Mission Viejo, Kaleidoscope, and The Market Place.
The city also has a thriving tourism industry, with several attractions, including the Mission Viejo Country Club, the Mission Viejo Library, and the Mission Viejo Skate Park.
Demographics
As of the 2010 census, the population of Mission Viejo was 96,346. The racial makeup of the city was 75.3% White, 1.3% African American, 0.3% Native American, 14.2% Asian, 0.2% Pacific Islander, 4.7% from other races, and 4.2% from two or more races. Hispanic or Latino of any race were 18.2% of the population.
The median household income in Mission Viejo was $90,845, and the median family income was $103,817. The per capita income for the city was $37,845. About 4.2% of families and 5.7% of the population were below the poverty line.
Common Questions
What is Per Capita Income in Mission Viejo?
Per Capita income in Mission Viejo is $59,856.
What is the Median Family Income in Mission Viejo?
Median Family Income in Mission Viejo is $153,683.
What is the Median Household income in Mission Viejo?
Median Household Income in Mission Viejo is $136,570.
What is Income or Wage Gap in Mission Viejo?
Income or Wage Gap in Mission Viejo is 34.6%.
Women in Mission Viejo earn 65.4 cents for every dollar earned by a man.
What is Family Income Deficit in Mission Viejo?
Family Income Deficit in Mission Viejo is $11,669.
Families that are below poverty line in Mission Viejo earn $11,669 less on average than the poverty threshold level.
What is Inequality or Gini Index in Mission Viejo?
Inequality or Gini Index in Mission Viejo is 0.41.
What is the Total Population of Mission Viejo?
Total Population of Mission Viejo is 93,233.
What is the Total Male Population of Mission Viejo?
Total Male Population of Mission Viejo is 46,397.
What is the Total Female Population of Mission Viejo?
Total Female Population of Mission Viejo is 46,836.
What is the Ratio of Males per 100 Females in Mission Viejo?
There are 99.06 Males per 100 Females in Mission Viejo.
What is the Ratio of Females per 100 Males in Mission Viejo?
There are 100.95 Females per 100 Males in Mission Viejo.
What is the Median Population Age in Mission Viejo?
Median Population Age in Mission Viejo is 46.0 Years.
What is the Average Family Size in Mission Viejo
Average Family Size in Mission Viejo is 3.2 People.
What is the Average Household Size in Mission Viejo
Average Household Size in Mission Viejo is 2.8 People.
How Large is the Labor Force in Mission Viejo?
There are 49,015 People in the Labor Forcein in Mission Viejo.
What is the Percentage of People in the Labor Force in Mission Viejo?
63.6% of People are in the Labor Force in Mission Viejo.
What is the Unemployment Rate in Mission Viejo?
Unemployment Rate in Mission Viejo is 4.4%.