Fullerton, CA Map & Demographics
Fullerton Map
Fullerton Overview
$46,182
PER CAPITA INCOME
$117,295
AVG FAMILY INCOME
$99,279
AVG HOUSEHOLD INCOME
31.5%
WAGE / INCOME GAP [ % ]
68.5¢/ $1
WAGE / INCOME GAP [ $ ]
$10,613
FAMILY INCOME DEFICIT
0.48
INEQUALITY / GINI INDEX
142,280
TOTAL POPULATION
70,148
MALE POPULATION
72,132
FEMALE POPULATION
97.25
MALES / 100 FEMALES
102.83
FEMALES / 100 MALES
35.5
MEDIAN AGE
3.5
AVG FAMILY SIZE
3.0
AVG HOUSEHOLD SIZE
74,377
LABOR FORCE [ PEOPLE ]
65.4%
PERCENT IN LABOR FORCE
6.9%
UNEMPLOYMENT RATE
Income in Fullerton
Income Overview in Fullerton
Per Capita Income in Fullerton is $46,182, while median incomes of families and households are $117,295 and $99,279 respectively.
| Characteristic | Number | Measure |
| Per Capita Income | 142,280 | $46,182 |
| Median Family Income | 33,070 | $117,295 |
| Mean Family Income | 33,070 | $152,100 |
| Median Household Income | 47,014 | $99,279 |
| Mean Household Income | 47,014 | $136,287 |
| Income Deficit | 33,070 | $10,613 |
| Wage / Income Gap (%) | 142,280 | 31.52% |
| Wage / Income Gap ($) | 142,280 | 68.48¢ per $1 |
| Gini / Inequality Index | 142,280 | 0.48 |
Earnings by Sex in Fullerton
Average Earnings in Fullerton are $46,635, $55,517 for men and $38,017 for women, a difference of 31.5%.
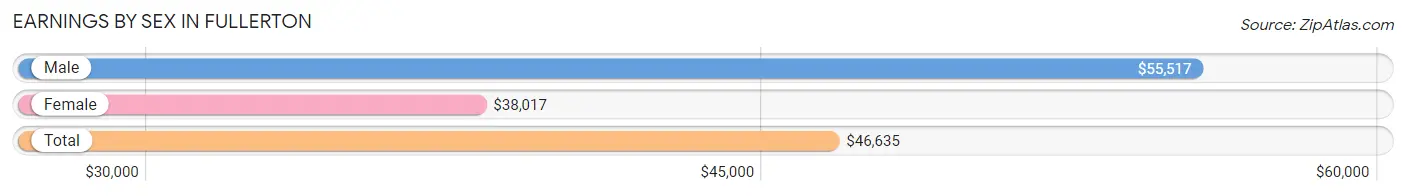
| Sex | Number | Average Earnings |
| Male | 41,338 (54.4%) | $55,517 |
| Female | 34,599 (45.6%) | $38,017 |
| Total | 75,937 (100.0%) | $46,635 |
Earnings by Sex by Income Bracket in Fullerton
The most common earnings brackets in Fullerton are $100,000+ for men (11,244 | 27.2%) and $100,000+ for women (5,202 | 15.0%).
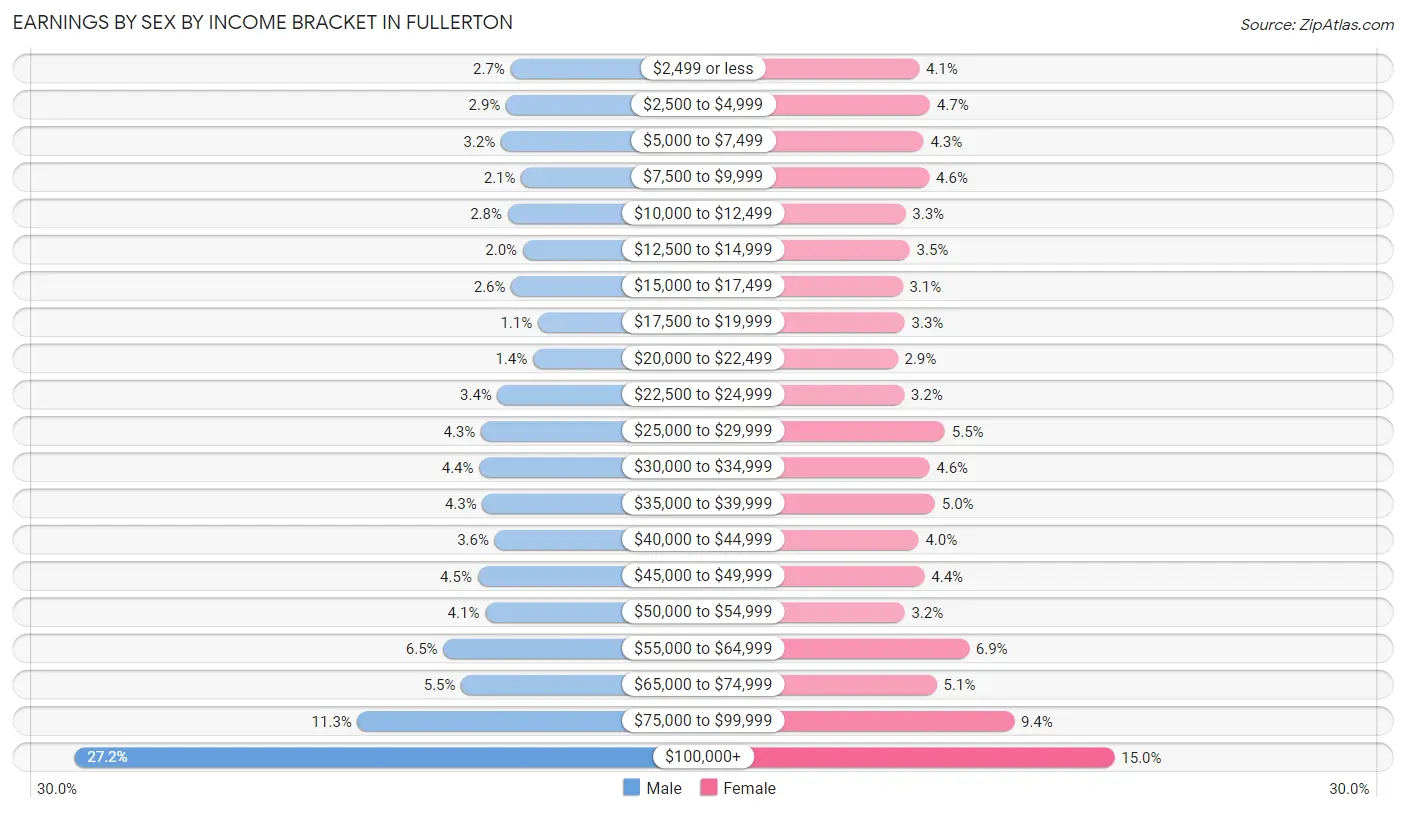
| Income | Male | Female |
| $2,499 or less | 1,106 (2.7%) | 1,404 (4.1%) |
| $2,500 to $4,999 | 1,213 (2.9%) | 1,617 (4.7%) |
| $5,000 to $7,499 | 1,331 (3.2%) | 1,492 (4.3%) |
| $7,500 to $9,999 | 860 (2.1%) | 1,601 (4.6%) |
| $10,000 to $12,499 | 1,174 (2.8%) | 1,137 (3.3%) |
| $12,500 to $14,999 | 824 (2.0%) | 1,222 (3.5%) |
| $15,000 to $17,499 | 1,093 (2.6%) | 1,082 (3.1%) |
| $17,500 to $19,999 | 473 (1.1%) | 1,125 (3.3%) |
| $20,000 to $22,499 | 586 (1.4%) | 986 (2.9%) |
| $22,500 to $24,999 | 1,411 (3.4%) | 1,111 (3.2%) |
| $25,000 to $29,999 | 1,793 (4.3%) | 1,908 (5.5%) |
| $30,000 to $34,999 | 1,836 (4.4%) | 1,605 (4.6%) |
| $35,000 to $39,999 | 1,759 (4.3%) | 1,713 (5.0%) |
| $40,000 to $44,999 | 1,476 (3.6%) | 1,393 (4.0%) |
| $45,000 to $49,999 | 1,872 (4.5%) | 1,507 (4.4%) |
| $50,000 to $54,999 | 1,700 (4.1%) | 1,120 (3.2%) |
| $55,000 to $64,999 | 2,671 (6.5%) | 2,375 (6.9%) |
| $65,000 to $74,999 | 2,252 (5.4%) | 1,748 (5.1%) |
| $75,000 to $99,999 | 4,664 (11.3%) | 3,251 (9.4%) |
| $100,000+ | 11,244 (27.2%) | 5,202 (15.0%) |
| Total | 41,338 (100.0%) | 34,599 (100.0%) |
Earnings by Sex by Educational Attainment in Fullerton
Average earnings in Fullerton are $64,702 for men and $46,566 for women, a difference of 28.0%. Men with an educational attainment of graduate degree enjoy the highest average annual earnings of $114,211, while those with less than high school education earn the least with $35,497. Women with an educational attainment of graduate degree earn the most with the average annual earnings of $74,288, while those with less than high school education have the smallest earnings of $22,088.
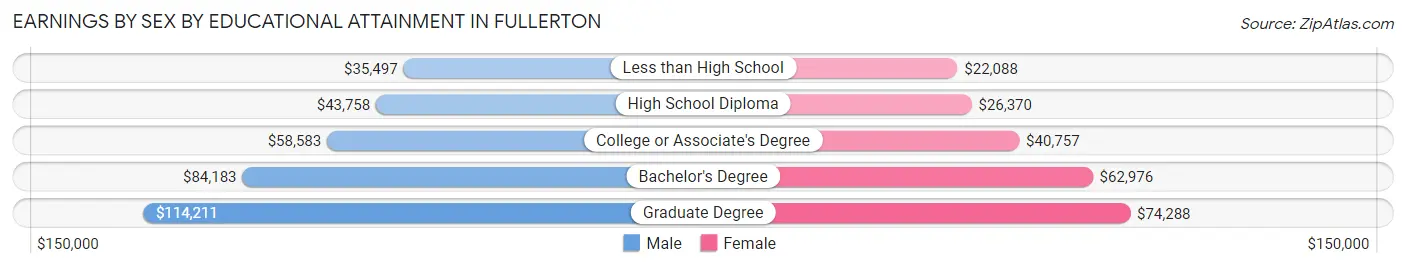
| Educational Attainment | Male Income | Female Income |
| Less than High School | $35,497 | $22,088 |
| High School Diploma | $43,758 | $26,370 |
| College or Associate's Degree | $58,583 | $40,757 |
| Bachelor's Degree | $84,183 | $62,976 |
| Graduate Degree | $114,211 | $74,288 |
| Total | $64,702 | $46,566 |
Family Income in Fullerton
Family Income Brackets in Fullerton
According to the Fullerton family income data, there are 7,805 families falling into the $200,000+ income range, which is the most common income bracket and makes up 23.6% of all families. Conversely, the $10,000 to $14,999 income bracket is the least frequent group with only 496 families (1.5%) belonging to this category.
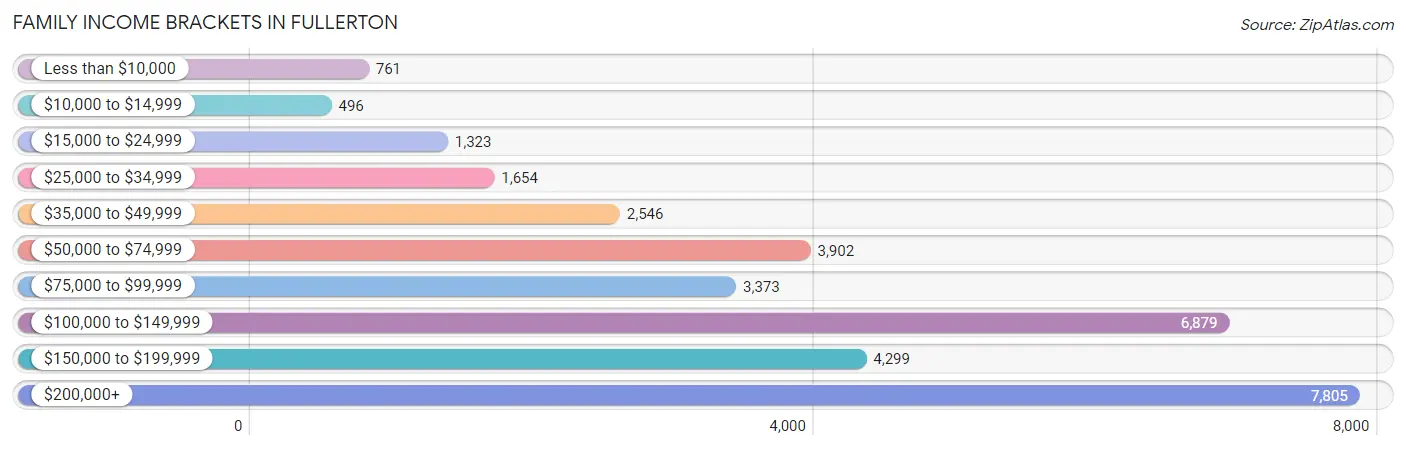
| Income Bracket | # Families | % Families |
| Less than $10,000 | 761 | 2.3% |
| $10,000 to $14,999 | 496 | 1.5% |
| $15,000 to $24,999 | 1,323 | 4.0% |
| $25,000 to $34,999 | 1,654 | 5.0% |
| $35,000 to $49,999 | 2,546 | 7.7% |
| $50,000 to $74,999 | 3,902 | 11.8% |
| $75,000 to $99,999 | 3,373 | 10.2% |
| $100,000 to $149,999 | 6,879 | 20.8% |
| $150,000 to $199,999 | 4,299 | 13.0% |
| $200,000+ | 7,805 | 23.6% |
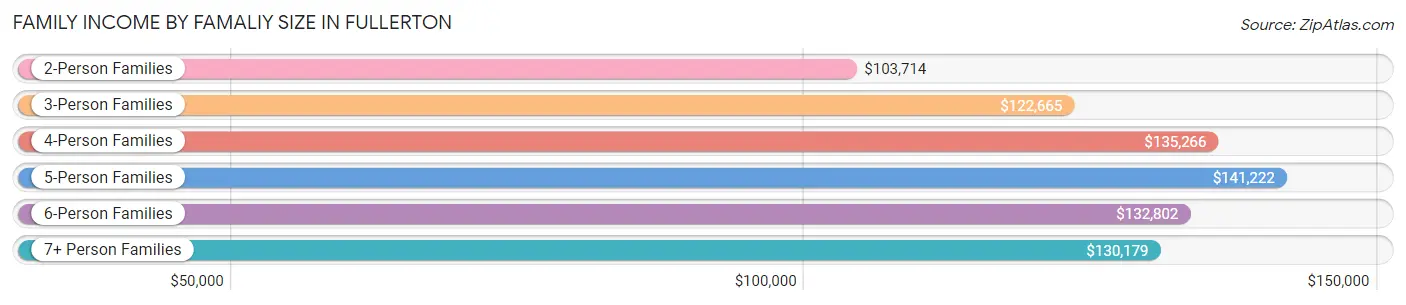
Family Income by Famaliy Size in Fullerton
5-person families (3,766 | 11.4%) account for the highest median family income in Fullerton with $141,222 per family, while 2-person families (12,280 | 37.1%) have the highest median income of $51,857 per family member.
| Income Bracket | # Families | Median Income |
| 2-Person Families | 12,280 (37.1%) | $103,714 |
| 3-Person Families | 8,077 (24.4%) | $122,665 |
| 4-Person Families | 6,749 (20.4%) | $135,266 |
| 5-Person Families | 3,766 (11.4%) | $141,222 |
| 6-Person Families | 1,237 (3.7%) | $132,802 |
| 7+ Person Families | 961 (2.9%) | $130,179 |
| Total | 33,070 (100.0%) | $117,295 |
Family Income by Number of Earners in Fullerton
The median family income in Fullerton is $117,295, with families comprising 3+ earners (5,469) having the highest median family income of $167,025, while families with no earners (3,479) have the lowest median family income of $62,835, accounting for 16.5% and 10.5% of families, respectively.
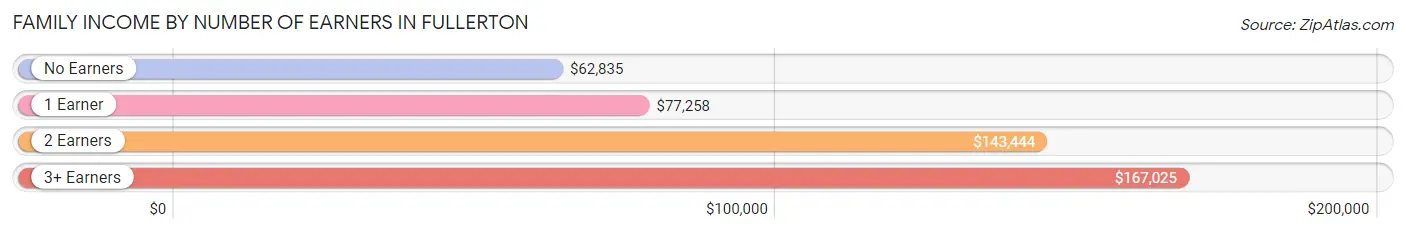
| Number of Earners | # Families | Median Income |
| No Earners | 3,479 (10.5%) | $62,835 |
| 1 Earner | 9,992 (30.2%) | $77,258 |
| 2 Earners | 14,130 (42.7%) | $143,444 |
| 3+ Earners | 5,469 (16.5%) | $167,025 |
| Total | 33,070 (100.0%) | $117,295 |
Household Income in Fullerton
Household Income Brackets in Fullerton
With 9,074 households falling in the category, the $100,000 to $149,999 income range is the most frequent in Fullerton, accounting for 19.3% of all households. In contrast, only 1,175 households (2.5%) fall into the $10,000 to $14,999 income bracket, making it the least populous group.
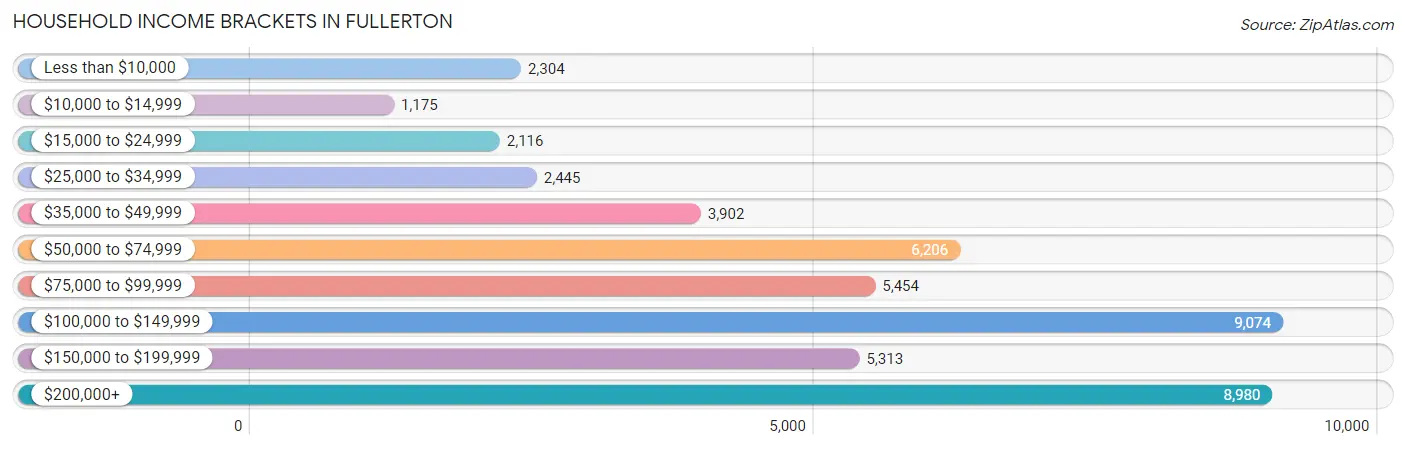
| Income Bracket | # Households | % Households |
| Less than $10,000 | 2,304 | 4.9% |
| $10,000 to $14,999 | 1,175 | 2.5% |
| $15,000 to $24,999 | 2,116 | 4.5% |
| $25,000 to $34,999 | 2,445 | 5.2% |
| $35,000 to $49,999 | 3,902 | 8.3% |
| $50,000 to $74,999 | 6,206 | 13.2% |
| $75,000 to $99,999 | 5,454 | 11.6% |
| $100,000 to $149,999 | 9,074 | 19.3% |
| $150,000 to $199,999 | 5,313 | 11.3% |
| $200,000+ | 8,980 | 19.1% |
Household Income by Householder Age in Fullerton
The median household income in Fullerton is $99,279, with the highest median household income of $122,113 found in the 45 to 64 years age bracket for the primary householder. A total of 18,269 households (38.9%) fall into this category. Meanwhile, the 15 to 24 years age bracket for the primary householder has the lowest median household income of $39,444, with 2,290 households (4.9%) in this group.
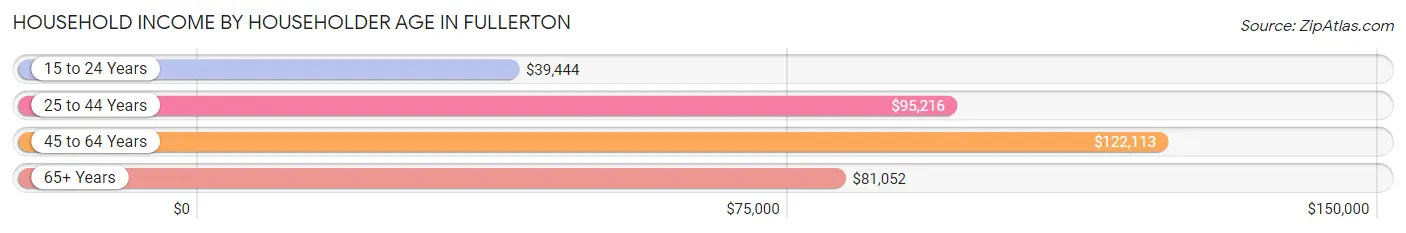
| Income Bracket | # Households | Median Income |
| 15 to 24 Years | 2,290 (4.9%) | $39,444 |
| 25 to 44 Years | 15,894 (33.8%) | $95,216 |
| 45 to 64 Years | 18,269 (38.9%) | $122,113 |
| 65+ Years | 10,561 (22.5%) | $81,052 |
| Total | 47,014 (100.0%) | $99,279 |
Poverty in Fullerton
Income Below Poverty by Sex and Age in Fullerton
With 10.4% poverty level for males and 14.1% for females among the residents of Fullerton, 18 to 24 year old males and 18 to 24 year old females are the most vulnerable to poverty, with 1,281 males (19.2%) and 2,209 females (29.4%) in their respective age groups living below the poverty level.
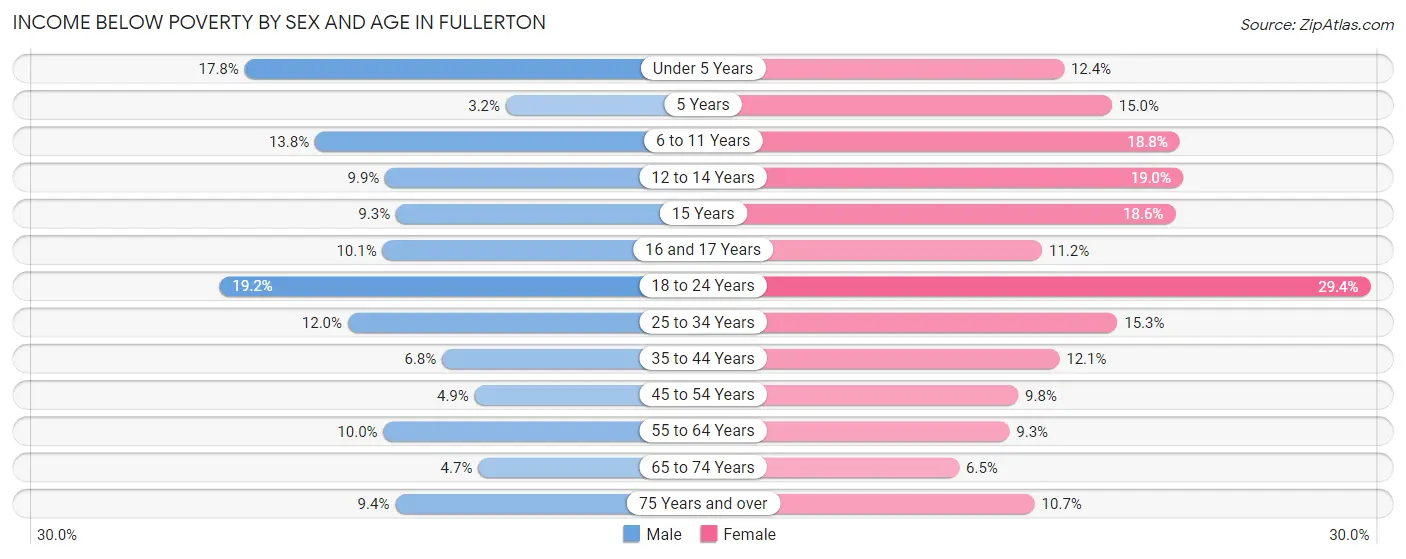
| Age Bracket | Male | Female |
| Under 5 Years | 680 (17.7%) | 582 (12.4%) |
| 5 Years | 27 (3.2%) | 119 (15.0%) |
| 6 to 11 Years | 705 (13.8%) | 886 (18.8%) |
| 12 to 14 Years | 347 (9.9%) | 557 (19.0%) |
| 15 Years | 73 (9.3%) | 137 (18.6%) |
| 16 and 17 Years | 137 (10.1%) | 207 (11.2%) |
| 18 to 24 Years | 1,281 (19.2%) | 2,209 (29.4%) |
| 25 to 34 Years | 1,415 (12.0%) | 1,690 (15.3%) |
| 35 to 44 Years | 616 (6.8%) | 946 (12.1%) |
| 45 to 54 Years | 441 (4.9%) | 900 (9.8%) |
| 55 to 64 Years | 847 (10.0%) | 825 (9.3%) |
| 65 to 74 Years | 235 (4.7%) | 352 (6.5%) |
| 75 Years and over | 339 (9.4%) | 536 (10.7%) |
| Total | 7,143 (10.4%) | 9,946 (14.1%) |
Income Above Poverty by Sex and Age in Fullerton
According to the poverty statistics in Fullerton, males aged 5 years and females aged 65 to 74 years are the age groups that are most secure financially, with 96.8% of males and 93.5% of females in these age groups living above the poverty line.
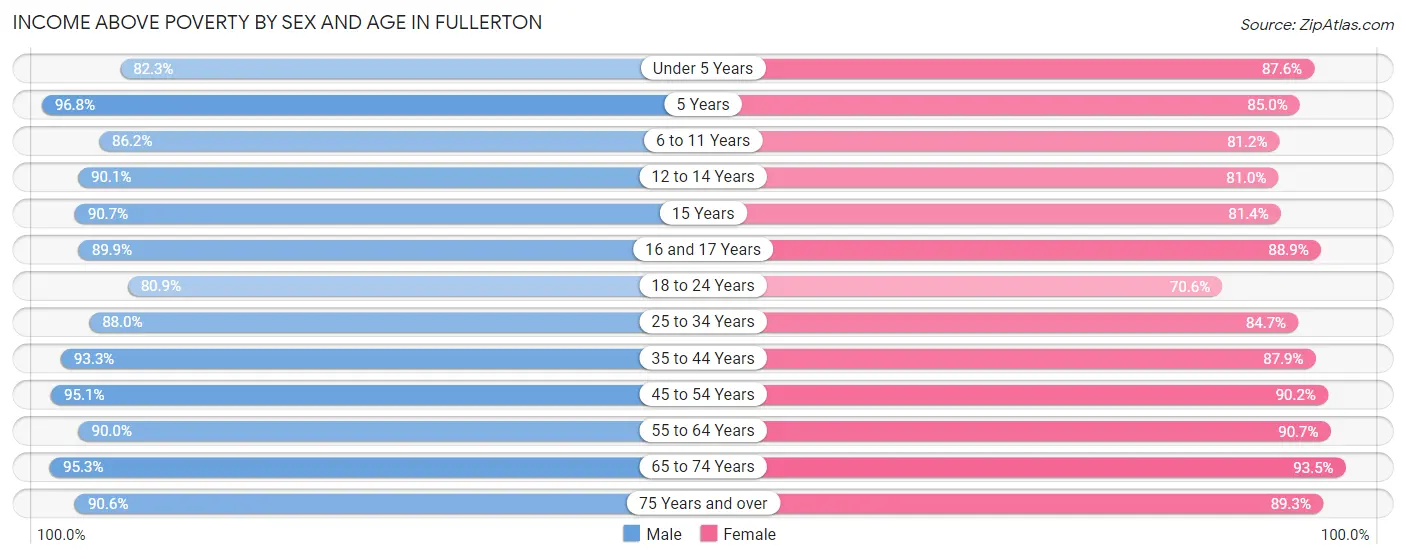
| Age Bracket | Male | Female |
| Under 5 Years | 3,152 (82.3%) | 4,123 (87.6%) |
| 5 Years | 816 (96.8%) | 672 (85.0%) |
| 6 to 11 Years | 4,391 (86.2%) | 3,825 (81.2%) |
| 12 to 14 Years | 3,151 (90.1%) | 2,376 (81.0%) |
| 15 Years | 710 (90.7%) | 601 (81.4%) |
| 16 and 17 Years | 1,224 (89.9%) | 1,649 (88.8%) |
| 18 to 24 Years | 5,407 (80.8%) | 5,298 (70.6%) |
| 25 to 34 Years | 10,374 (88.0%) | 9,330 (84.7%) |
| 35 to 44 Years | 8,508 (93.2%) | 6,863 (87.9%) |
| 45 to 54 Years | 8,479 (95.1%) | 8,267 (90.2%) |
| 55 to 64 Years | 7,607 (90.0%) | 8,014 (90.7%) |
| 65 to 74 Years | 4,721 (95.3%) | 5,036 (93.5%) |
| 75 Years and over | 3,283 (90.6%) | 4,454 (89.3%) |
| Total | 61,823 (89.6%) | 60,508 (85.9%) |
Income Below Poverty Among Married-Couple Families in Fullerton
The poverty statistics for married-couple families in Fullerton show that 3.6% or 916 of the total 25,082 families live below the poverty line. Families with 3 or 4 children have the highest poverty rate of 11.7%, comprising of 273 families. On the other hand, families with 5 or more children have the lowest poverty rate of 0.0%, which includes 0 families.
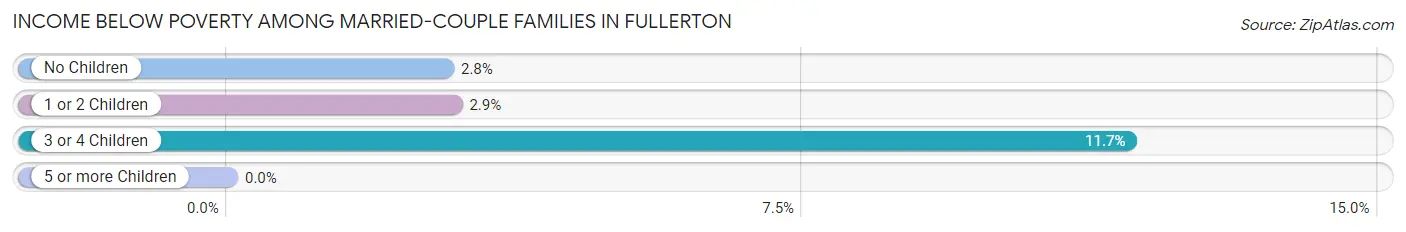
| Children | Above Poverty | Below Poverty |
| No Children | 13,510 (97.2%) | 392 (2.8%) |
| 1 or 2 Children | 8,312 (97.1%) | 251 (2.9%) |
| 3 or 4 Children | 2,052 (88.3%) | 273 (11.7%) |
| 5 or more Children | 292 (100.0%) | 0 (0.0%) |
| Total | 24,166 (96.4%) | 916 (3.6%) |
Income Below Poverty Among Single-Parent Households in Fullerton
According to the poverty data in Fullerton, 19.7% or 521 single-father households and 21.5% or 1,150 single-mother households are living below the poverty line. Among single-father households, those with 3 or 4 children have the highest poverty rate, with 199 households (81.2%) experiencing poverty. Likewise, among single-mother households, those with 3 or 4 children have the highest poverty rate, with 186 households (43.2%) falling below the poverty line.
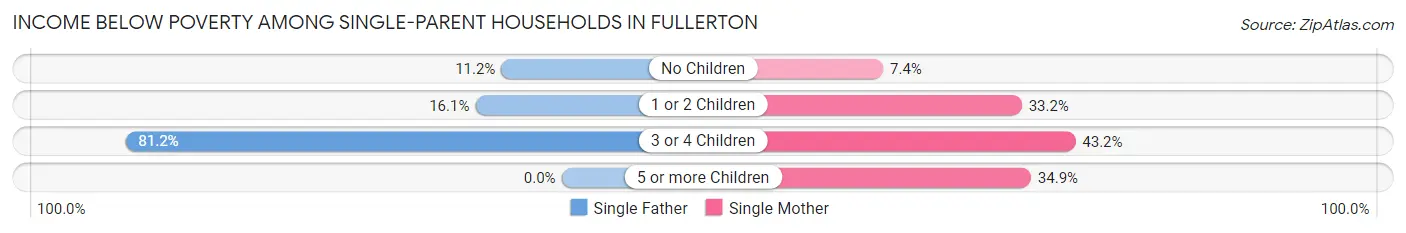
| Children | Single Father | Single Mother |
| No Children | 150 (11.2%) | 189 (7.3%) |
| 1 or 2 Children | 172 (16.1%) | 760 (33.2%) |
| 3 or 4 Children | 199 (81.2%) | 186 (43.2%) |
| 5 or more Children | 0 (0.0%) | 15 (34.9%) |
| Total | 521 (19.7%) | 1,150 (21.5%) |
Income Below Poverty Among Married-Couple vs Single-Parent Households in Fullerton
The poverty data for Fullerton shows that 916 of the married-couple family households (3.6%) and 1,671 of the single-parent households (20.9%) are living below the poverty level. Within the married-couple family households, those with 3 or 4 children have the highest poverty rate, with 273 households (11.7%) falling below the poverty line. Among the single-parent households, those with 3 or 4 children have the highest poverty rate, with 385 household (57.0%) living below poverty.
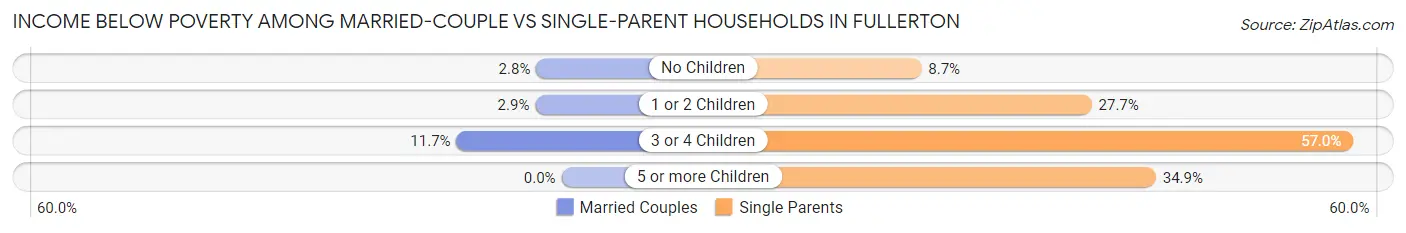
| Children | Married-Couple Families | Single-Parent Households |
| No Children | 392 (2.8%) | 339 (8.7%) |
| 1 or 2 Children | 251 (2.9%) | 932 (27.7%) |
| 3 or 4 Children | 273 (11.7%) | 385 (57.0%) |
| 5 or more Children | 0 (0.0%) | 15 (34.9%) |
| Total | 916 (3.6%) | 1,671 (20.9%) |
Race in Fullerton
The most populous races in Fullerton are White / Caucasian (67,739 | 47.6%), Hispanic or Latino (54,090 | 38.0%), and Asian (35,623 | 25.0%).
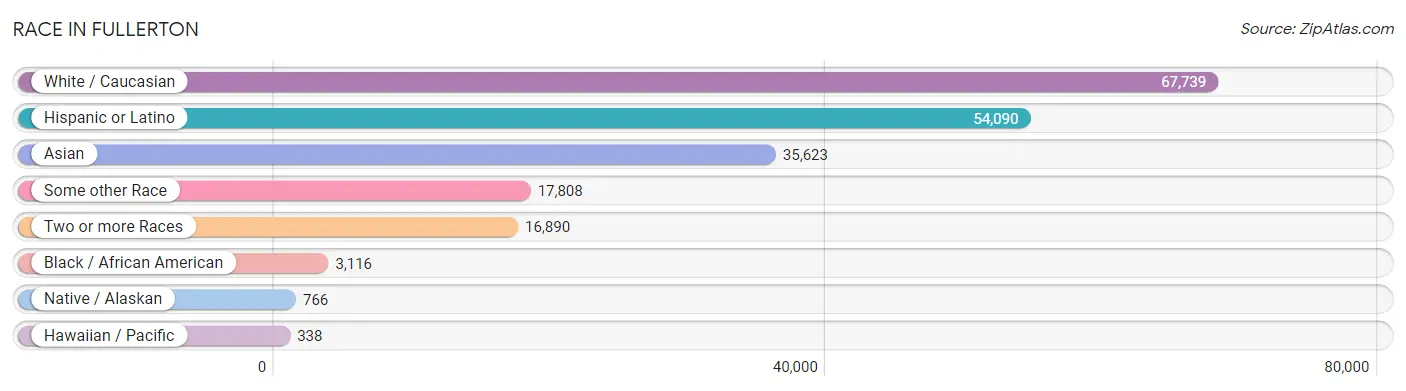
| Race | # Population | % Population |
| Asian | 35,623 | 25.0% |
| Black / African American | 3,116 | 2.2% |
| Hawaiian / Pacific | 338 | 0.2% |
| Hispanic or Latino | 54,090 | 38.0% |
| Native / Alaskan | 766 | 0.5% |
| White / Caucasian | 67,739 | 47.6% |
| Two or more Races | 16,890 | 11.9% |
| Some other Race | 17,808 | 12.5% |
| Total | 142,280 | 100.0% |
Ancestry in Fullerton
The most populous ancestries reported in Fullerton are Mexican (44,812 | 31.5%), Burmese (18,127 | 12.7%), German (9,176 | 6.5%), English (9,049 | 6.4%), and Irish (8,248 | 5.8%), together accounting for 62.9% of all Fullerton residents.
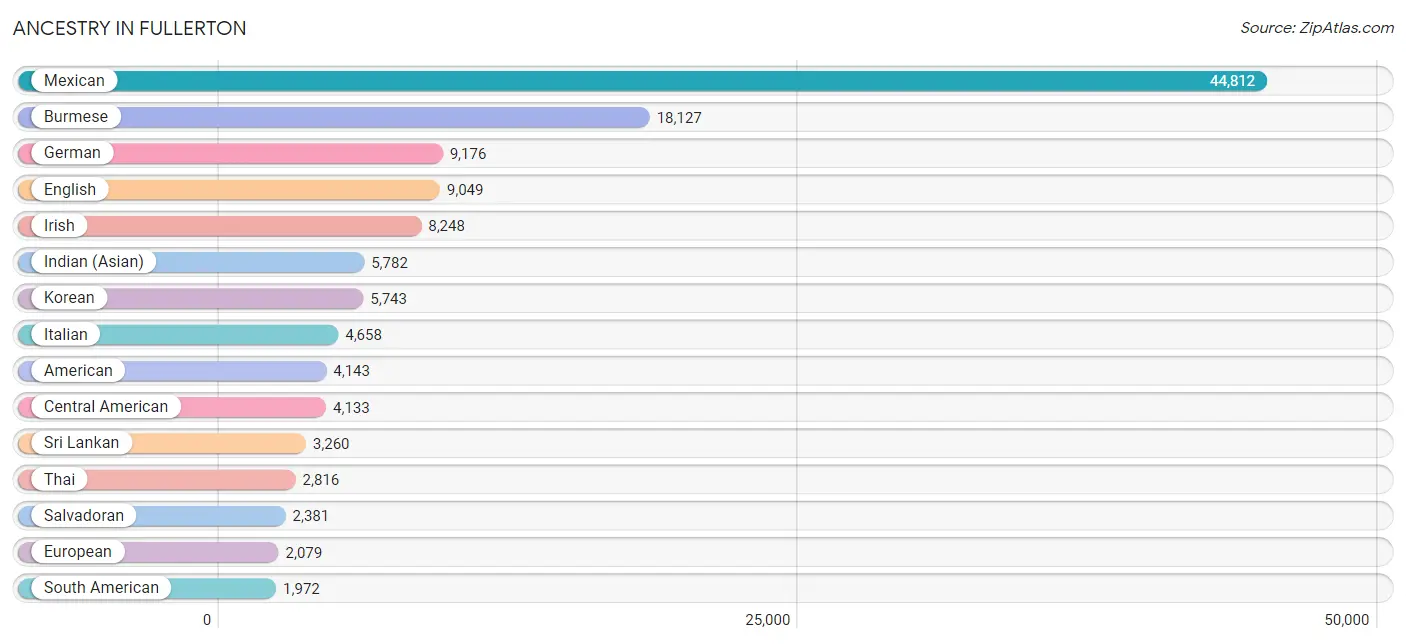
| Ancestry | # Population | % Population |
| African | 242 | 0.2% |
| Albanian | 50 | 0.0% |
| Aleut | 3 | 0.0% |
| American | 4,143 | 2.9% |
| Apache | 254 | 0.2% |
| Arab | 1,429 | 1.0% |
| Argentinean | 402 | 0.3% |
| Armenian | 218 | 0.2% |
| Assyrian / Chaldean / Syriac | 96 | 0.1% |
| Australian | 40 | 0.0% |
| Austrian | 108 | 0.1% |
| Basque | 95 | 0.1% |
| Belgian | 41 | 0.0% |
| Belizean | 30 | 0.0% |
| Bhutanese | 1,718 | 1.2% |
| Bolivian | 54 | 0.0% |
| Brazilian | 234 | 0.2% |
| British | 1,219 | 0.9% |
| Bulgarian | 50 | 0.0% |
| Burmese | 18,127 | 12.7% |
| Cajun | 3 | 0.0% |
| Canadian | 377 | 0.3% |
| Cape Verdean | 3 | 0.0% |
| Celtic | 19 | 0.0% |
| Central American | 4,133 | 2.9% |
| Central American Indian | 133 | 0.1% |
| Cherokee | 427 | 0.3% |
| Chilean | 115 | 0.1% |
| Chinese | 20 | 0.0% |
| Chippewa | 97 | 0.1% |
| Choctaw | 84 | 0.1% |
| Colombian | 362 | 0.3% |
| Comanche | 151 | 0.1% |
| Costa Rican | 5 | 0.0% |
| Creek | 43 | 0.0% |
| Croatian | 104 | 0.1% |
| Cuban | 429 | 0.3% |
| Czech | 287 | 0.2% |
| Czechoslovakian | 126 | 0.1% |
| Danish | 617 | 0.4% |
| Dominican | 13 | 0.0% |
| Dutch | 1,119 | 0.8% |
| Eastern European | 164 | 0.1% |
| Ecuadorian | 434 | 0.3% |
| Egyptian | 58 | 0.0% |
| English | 9,049 | 6.4% |
| Ethiopian | 116 | 0.1% |
| European | 2,079 | 1.5% |
| Filipino | 888 | 0.6% |
| Finnish | 102 | 0.1% |
| French | 1,764 | 1.2% |
| French Canadian | 352 | 0.3% |
| German | 9,176 | 6.5% |
| Ghanaian | 19 | 0.0% |
| Greek | 385 | 0.3% |
| Guamanian / Chamorro | 156 | 0.1% |
| Guatemalan | 924 | 0.6% |
| Haitian | 96 | 0.1% |
| Honduran | 131 | 0.1% |
| Hungarian | 318 | 0.2% |
| Icelander | 5 | 0.0% |
| Indian (Asian) | 5,782 | 4.1% |
| Indonesian | 8 | 0.0% |
| Iranian | 462 | 0.3% |
| Irish | 8,248 | 5.8% |
| Israeli | 8 | 0.0% |
| Italian | 4,658 | 3.3% |
| Jamaican | 226 | 0.2% |
| Japanese | 467 | 0.3% |
| Jordanian | 18 | 0.0% |
| Kenyan | 82 | 0.1% |
| Korean | 5,743 | 4.0% |
| Laotian | 326 | 0.2% |
| Latvian | 25 | 0.0% |
| Lebanese | 667 | 0.5% |
| Lithuanian | 196 | 0.1% |
| Malaysian | 32 | 0.0% |
| Maltese | 8 | 0.0% |
| Mexican | 44,812 | 31.5% |
| Mexican American Indian | 284 | 0.2% |
| Moroccan | 18 | 0.0% |
| Native Hawaiian | 336 | 0.2% |
| Navajo | 94 | 0.1% |
| New Zealander | 26 | 0.0% |
| Nicaraguan | 345 | 0.2% |
| Nigerian | 176 | 0.1% |
| Northern European | 249 | 0.2% |
| Norwegian | 1,480 | 1.0% |
| Okinawan | 7 | 0.0% |
| Osage | 9 | 0.0% |
| Ottawa | 11 | 0.0% |
| Pakistani | 268 | 0.2% |
| Palestinian | 87 | 0.1% |
| Panamanian | 66 | 0.1% |
| Pennsylvania German | 8 | 0.0% |
| Peruvian | 545 | 0.4% |
| Polish | 1,655 | 1.2% |
| Portuguese | 380 | 0.3% |
| Potawatomi | 86 | 0.1% |
| Pueblo | 142 | 0.1% |
| Puerto Rican | 899 | 0.6% |
| Romanian | 796 | 0.6% |
| Russian | 565 | 0.4% |
| Salvadoran | 2,381 | 1.7% |
| Samoan | 182 | 0.1% |
| Scandinavian | 326 | 0.2% |
| Scotch-Irish | 449 | 0.3% |
| Scottish | 1,778 | 1.3% |
| Seminole | 10 | 0.0% |
| Senegalese | 4 | 0.0% |
| Serbian | 16 | 0.0% |
| Shoshone | 20 | 0.0% |
| Sioux | 53 | 0.0% |
| Slovak | 241 | 0.2% |
| South American | 1,972 | 1.4% |
| Spaniard | 713 | 0.5% |
| Spanish | 479 | 0.3% |
| Sri Lankan | 3,260 | 2.3% |
| Subsaharan African | 682 | 0.5% |
| Sudanese | 17 | 0.0% |
| Swedish | 1,260 | 0.9% |
| Swiss | 181 | 0.1% |
| Syrian | 213 | 0.2% |
| Thai | 2,816 | 2.0% |
| Turkish | 171 | 0.1% |
| Ukrainian | 291 | 0.2% |
| Uruguayan | 13 | 0.0% |
| Vietnamese | 71 | 0.1% |
| Welsh | 378 | 0.3% |
| West Indian | 25 | 0.0% |
| Yaqui | 64 | 0.0% |
| Yugoslavian | 35 | 0.0% | View All 132 Rows |
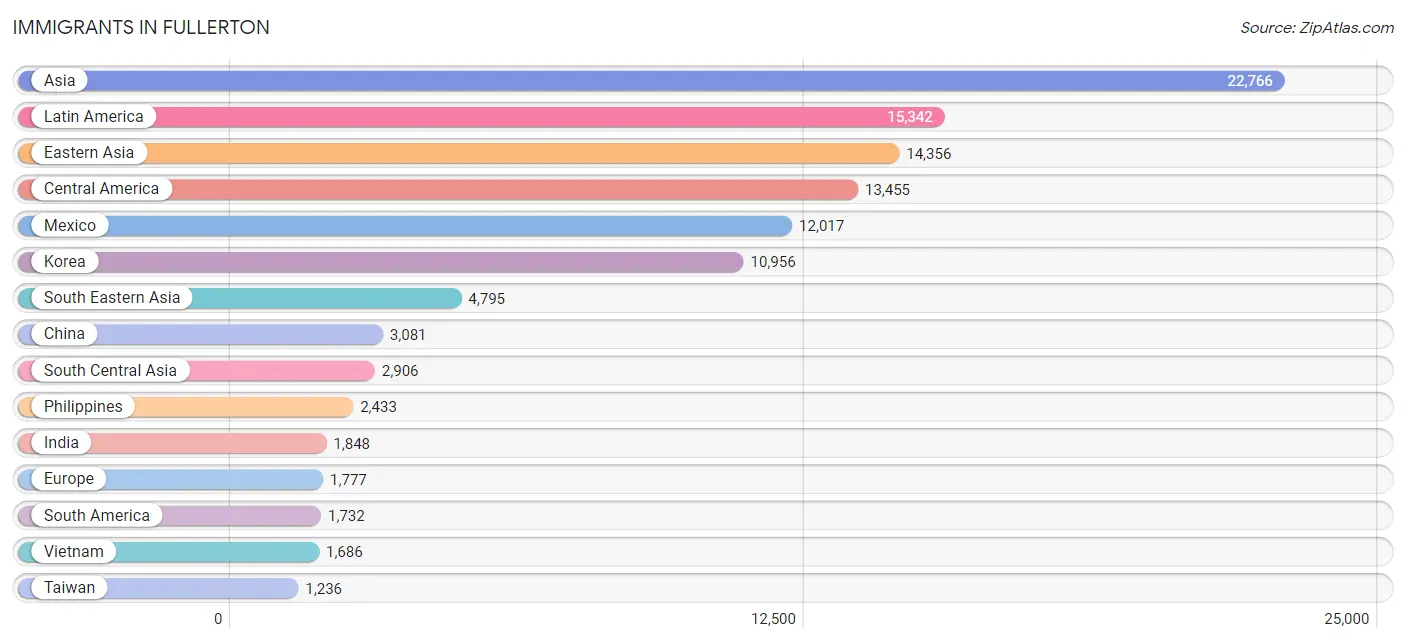
Immigrants in Fullerton
The most numerous immigrant groups reported in Fullerton came from Asia (22,766 | 16.0%), Latin America (15,342 | 10.8%), Eastern Asia (14,356 | 10.1%), Central America (13,455 | 9.5%), and Mexico (12,017 | 8.5%), together accounting for 54.8% of all Fullerton residents.
| Immigration Origin | # Population | % Population |
| Africa | 581 | 0.4% |
| Argentina | 352 | 0.3% |
| Asia | 22,766 | 16.0% |
| Australia | 37 | 0.0% |
| Bangladesh | 75 | 0.1% |
| Belgium | 12 | 0.0% |
| Belize | 30 | 0.0% |
| Bolivia | 22 | 0.0% |
| Brazil | 282 | 0.2% |
| Bulgaria | 38 | 0.0% |
| Cabo Verde | 11 | 0.0% |
| Cambodia | 227 | 0.2% |
| Canada | 547 | 0.4% |
| Caribbean | 155 | 0.1% |
| Central America | 13,455 | 9.5% |
| Chile | 13 | 0.0% |
| China | 3,081 | 2.2% |
| Colombia | 160 | 0.1% |
| Croatia | 14 | 0.0% |
| Cuba | 140 | 0.1% |
| Czechoslovakia | 51 | 0.0% |
| Denmark | 15 | 0.0% |
| Eastern Africa | 222 | 0.2% |
| Eastern Asia | 14,356 | 10.1% |
| Eastern Europe | 1,052 | 0.7% |
| Ecuador | 233 | 0.2% |
| Egypt | 125 | 0.1% |
| El Salvador | 811 | 0.6% |
| England | 79 | 0.1% |
| Ethiopia | 116 | 0.1% |
| Europe | 1,777 | 1.3% |
| France | 61 | 0.0% |
| Germany | 174 | 0.1% |
| Ghana | 20 | 0.0% |
| Greece | 11 | 0.0% |
| Guatemala | 308 | 0.2% |
| Guyana | 31 | 0.0% |
| Honduras | 50 | 0.0% |
| Hong Kong | 147 | 0.1% |
| Hungary | 38 | 0.0% |
| India | 1,848 | 1.3% |
| Indonesia | 249 | 0.2% |
| Iran | 656 | 0.5% |
| Iraq | 39 | 0.0% |
| Ireland | 36 | 0.0% |
| Israel | 5 | 0.0% |
| Italy | 44 | 0.0% |
| Japan | 319 | 0.2% |
| Jordan | 11 | 0.0% |
| Kenya | 92 | 0.1% |
| Korea | 10,956 | 7.7% |
| Kuwait | 114 | 0.1% |
| Laos | 11 | 0.0% |
| Latin America | 15,342 | 10.8% |
| Lebanon | 294 | 0.2% |
| Lithuania | 35 | 0.0% |
| Mexico | 12,017 | 8.5% |
| Nepal | 233 | 0.2% |
| Netherlands | 10 | 0.0% |
| Nicaragua | 191 | 0.1% |
| Nigeria | 85 | 0.1% |
| Northern Africa | 226 | 0.2% |
| Northern Europe | 382 | 0.3% |
| Oceania | 109 | 0.1% |
| Pakistan | 18 | 0.0% |
| Panama | 48 | 0.0% |
| Peru | 617 | 0.4% |
| Philippines | 2,433 | 1.7% |
| Poland | 53 | 0.0% |
| Portugal | 12 | 0.0% |
| Romania | 571 | 0.4% |
| Russia | 34 | 0.0% |
| Scotland | 19 | 0.0% |
| Serbia | 5 | 0.0% |
| Singapore | 44 | 0.0% |
| South Africa | 17 | 0.0% |
| South America | 1,732 | 1.2% |
| South Central Asia | 2,906 | 2.0% |
| South Eastern Asia | 4,795 | 3.4% |
| Southern Europe | 86 | 0.1% |
| Spain | 19 | 0.0% |
| Sri Lanka | 76 | 0.1% |
| Sudan | 101 | 0.1% |
| Sweden | 14 | 0.0% |
| Syria | 158 | 0.1% |
| Taiwan | 1,236 | 0.9% |
| Thailand | 117 | 0.1% |
| Turkey | 16 | 0.0% |
| Ukraine | 119 | 0.1% |
| Uruguay | 13 | 0.0% |
| Venezuela | 9 | 0.0% |
| Vietnam | 1,686 | 1.2% |
| Western Africa | 116 | 0.1% |
| Western Asia | 700 | 0.5% |
| Western Europe | 257 | 0.2% | View All 95 Rows |
Sex and Age in Fullerton
Sex and Age in Fullerton
The most populous age groups in Fullerton are 25 to 29 Years (6,370 | 9.1%) for men and 20 to 24 Years (6,237 | 8.6%) for women.
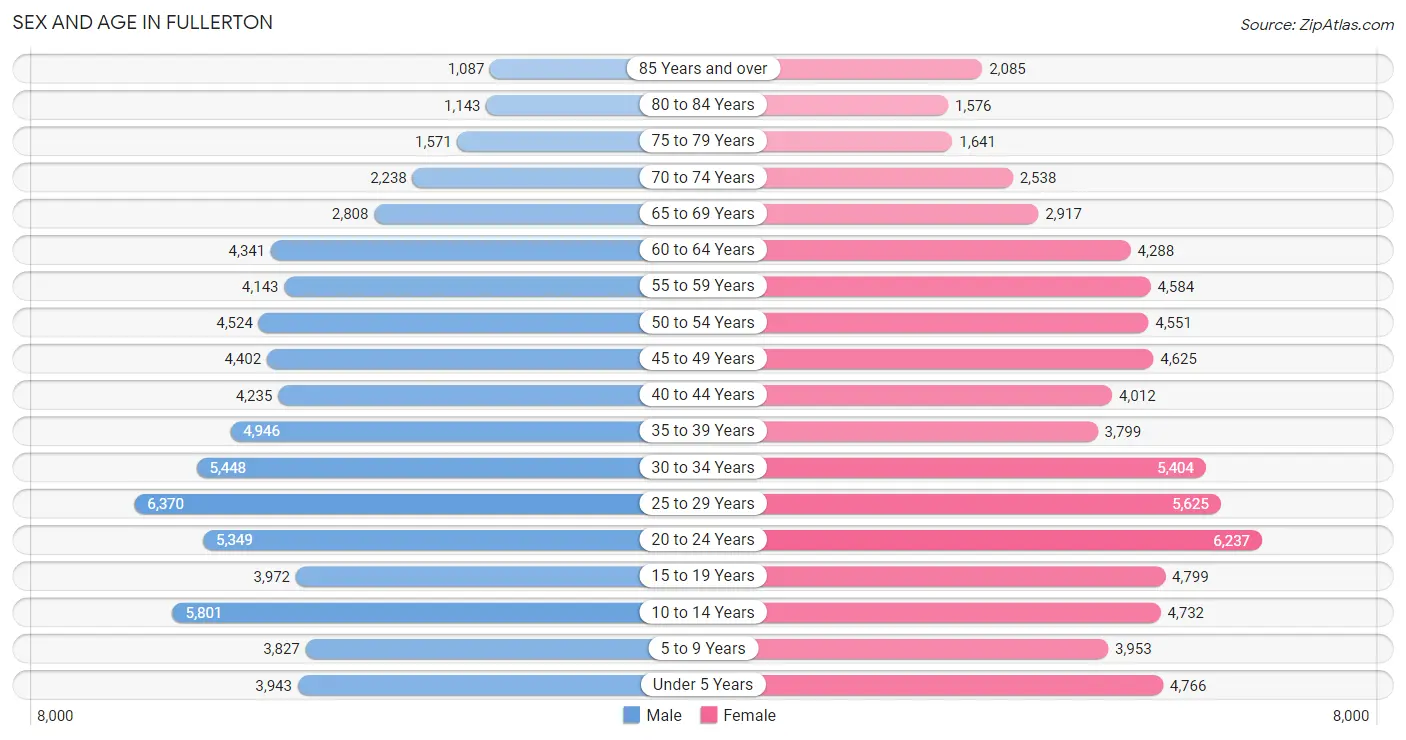
| Age Bracket | Male | Female |
| Under 5 Years | 3,943 (5.6%) | 4,766 (6.6%) |
| 5 to 9 Years | 3,827 (5.5%) | 3,953 (5.5%) |
| 10 to 14 Years | 5,801 (8.3%) | 4,732 (6.6%) |
| 15 to 19 Years | 3,972 (5.7%) | 4,799 (6.7%) |
| 20 to 24 Years | 5,349 (7.6%) | 6,237 (8.6%) |
| 25 to 29 Years | 6,370 (9.1%) | 5,625 (7.8%) |
| 30 to 34 Years | 5,448 (7.8%) | 5,404 (7.5%) |
| 35 to 39 Years | 4,946 (7.0%) | 3,799 (5.3%) |
| 40 to 44 Years | 4,235 (6.0%) | 4,012 (5.6%) |
| 45 to 49 Years | 4,402 (6.3%) | 4,625 (6.4%) |
| 50 to 54 Years | 4,524 (6.5%) | 4,551 (6.3%) |
| 55 to 59 Years | 4,143 (5.9%) | 4,584 (6.4%) |
| 60 to 64 Years | 4,341 (6.2%) | 4,288 (5.9%) |
| 65 to 69 Years | 2,808 (4.0%) | 2,917 (4.0%) |
| 70 to 74 Years | 2,238 (3.2%) | 2,538 (3.5%) |
| 75 to 79 Years | 1,571 (2.2%) | 1,641 (2.3%) |
| 80 to 84 Years | 1,143 (1.6%) | 1,576 (2.2%) |
| 85 Years and over | 1,087 (1.5%) | 2,085 (2.9%) |
| Total | 70,148 (100.0%) | 72,132 (100.0%) |
Families and Households in Fullerton
Median Family Size in Fullerton
The median family size in Fullerton is 3.46 persons per family, with married-couple families (25,082 | 75.8%) accounting for the largest median family size of 3.53 persons per family. On the other hand, single male/father families (2,652 | 8.0%) represent the smallest median family size with 3.12 persons per family.
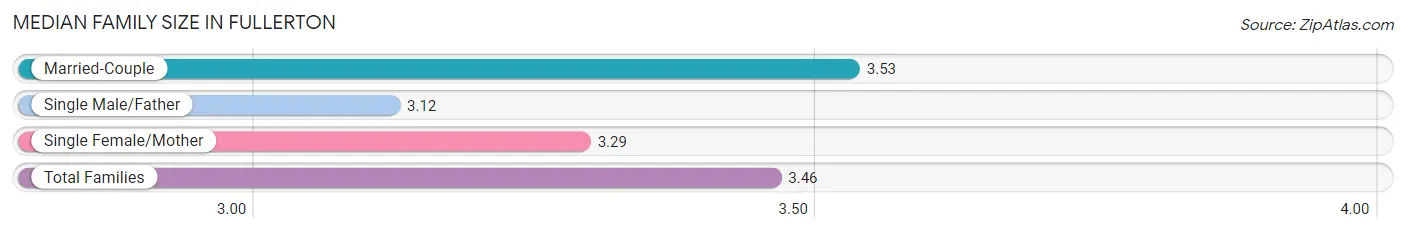
| Family Type | # Families | Family Size |
| Married-Couple | 25,082 (75.8%) | 3.53 |
| Single Male/Father | 2,652 (8.0%) | 3.12 |
| Single Female/Mother | 5,336 (16.1%) | 3.29 |
| Total Families | 33,070 (100.0%) | 3.46 |
Median Household Size in Fullerton
The median household size in Fullerton is 2.95 persons per household, with married-couple households (25,082 | 53.3%) accounting for the largest median household size of 3.57 persons per household. non-family households (13,944 | 29.7%) represent the smallest median household size with 1.50 persons per household.
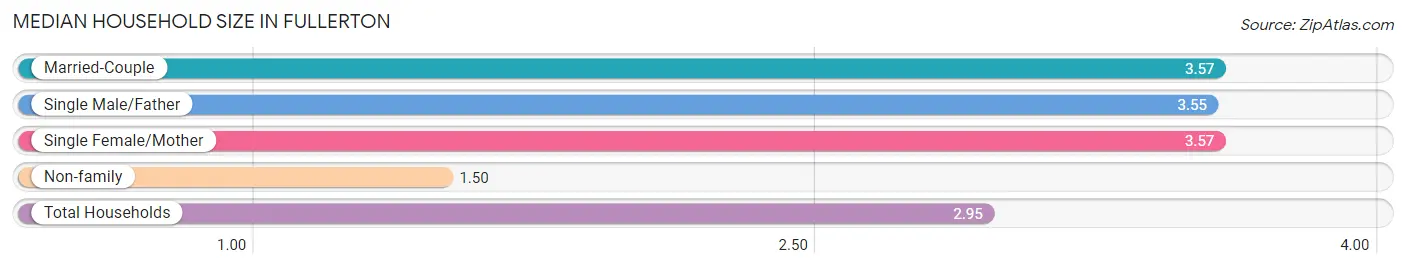
| Household Type | # Households | Household Size |
| Married-Couple | 25,082 (53.3%) | 3.57 |
| Single Male/Father | 2,652 (5.6%) | 3.55 |
| Single Female/Mother | 5,336 (11.4%) | 3.57 |
| Non-family | 13,944 (29.7%) | 1.50 |
| Total Households | 47,014 (100.0%) | 2.95 |
Household Size by Marriage Status in Fullerton
Out of a total of 47,014 households in Fullerton, 33,070 (70.3%) are family households, while 13,944 (29.7%) are nonfamily households. The most numerous type of family households are 2-person households, comprising 11,273, and the most common type of nonfamily households are 1-person households, comprising 9,633.
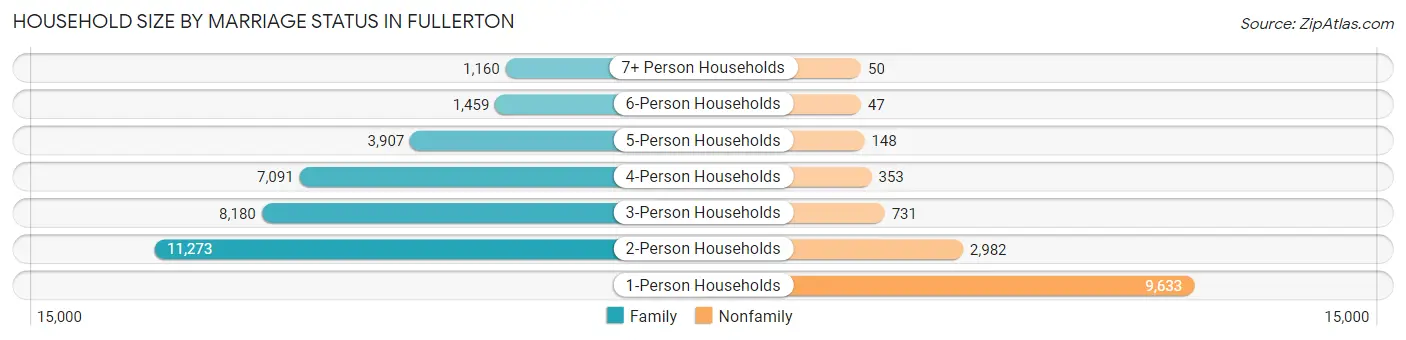
| Household Size | Family Households | Nonfamily Households |
| 1-Person Households | - | 9,633 (20.5%) |
| 2-Person Households | 11,273 (24.0%) | 2,982 (6.3%) |
| 3-Person Households | 8,180 (17.4%) | 731 (1.5%) |
| 4-Person Households | 7,091 (15.1%) | 353 (0.7%) |
| 5-Person Households | 3,907 (8.3%) | 148 (0.3%) |
| 6-Person Households | 1,459 (3.1%) | 47 (0.1%) |
| 7+ Person Households | 1,160 (2.5%) | 50 (0.1%) |
| Total | 33,070 (70.3%) | 13,944 (29.7%) |
Female Fertility in Fullerton
Fertility by Age in Fullerton
Average fertility rate in Fullerton is 59.0 births per 1,000 women. Women in the age bracket of 20 to 34 years have the highest fertility rate with 94.0 births per 1,000 women. Women in the age bracket of 20 to 34 years acount for 78.5% of all women with births.
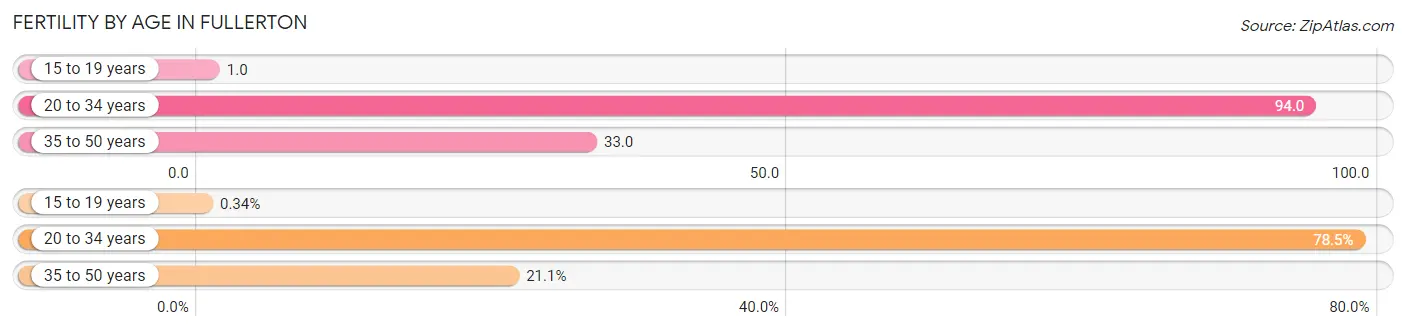
| Age Bracket | Women with Births | Births / 1,000 Women |
| 15 to 19 years | 7 (0.3%) | 1.0 |
| 20 to 34 years | 1,629 (78.5%) | 94.0 |
| 35 to 50 years | 438 (21.1%) | 33.0 |
| Total | 2,074 (100.0%) | 59.0 |
Fertility by Age by Marriage Status in Fullerton
71.9% of women with births (2,074) in Fullerton are married. The highest percentage of unmarried women with births falls into 15 to 19 years age bracket with 100.0% of them unmarried at the time of birth, while the lowest percentage of unmarried women with births belong to 35 to 50 years age bracket with 9.1% of them unmarried.
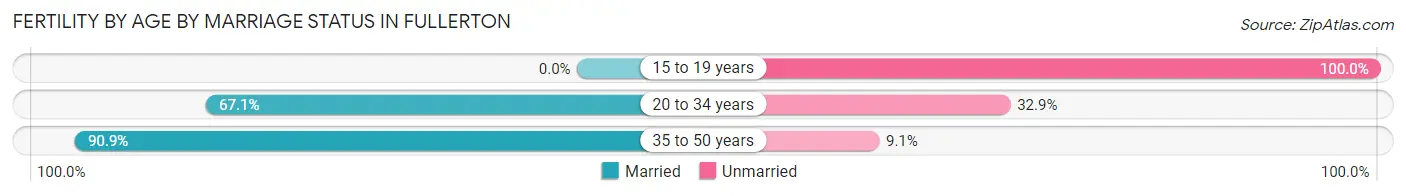
| Age Bracket | Married | Unmarried |
| 15 to 19 years | 0 (0.0%) | 7 (100.0%) |
| 20 to 34 years | 1,093 (67.1%) | 536 (32.9%) |
| 35 to 50 years | 398 (90.9%) | 40 (9.1%) |
| Total | 1,491 (71.9%) | 583 (28.1%) |
Fertility by Education in Fullerton
Average fertility rate in Fullerton is 59.0 births per 1,000 women. Women with the education attainment of college or associate's degree have the highest fertility rate of 79.0 births per 1,000 women, while women with the education attainment of less than high school have the lowest fertility at 27.0 births per 1,000 women. Women with the education attainment of college or associate's degree represent 42.0% of all women with births.
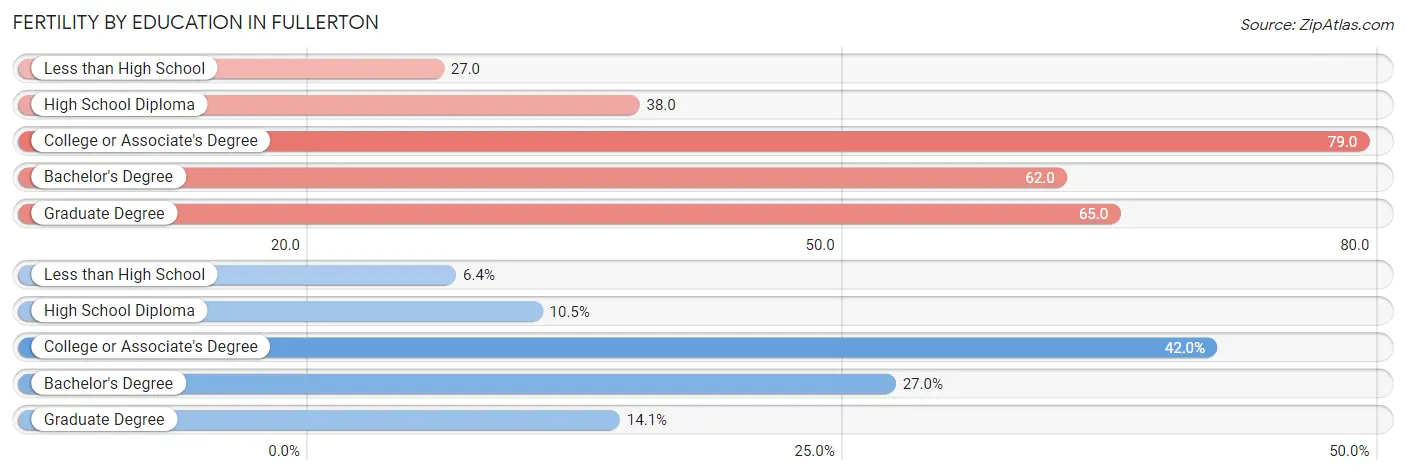
| Educational Attainment | Women with Births | Births / 1,000 Women |
| Less than High School | 133 (6.4%) | 27.0 |
| High School Diploma | 217 (10.5%) | 38.0 |
| College or Associate's Degree | 872 (42.0%) | 79.0 |
| Bachelor's Degree | 560 (27.0%) | 62.0 |
| Graduate Degree | 292 (14.1%) | 65.0 |
| Total | 2,074 (100.0%) | 59.0 |
Fertility by Education by Marriage Status in Fullerton
28.1% of women with births in Fullerton are unmarried. Women with the educational attainment of bachelor's degree are most likely to be married with 94.8% of them married at childbirth, while women with the educational attainment of high school diploma are least likely to be married with 69.6% of them unmarried at childbirth.
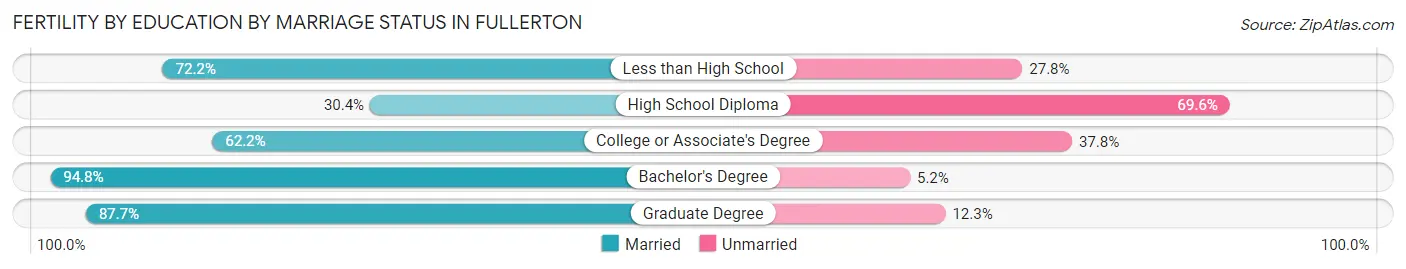
| Educational Attainment | Married | Unmarried |
| Less than High School | 96 (72.2%) | 37 (27.8%) |
| High School Diploma | 66 (30.4%) | 151 (69.6%) |
| College or Associate's Degree | 542 (62.2%) | 330 (37.8%) |
| Bachelor's Degree | 531 (94.8%) | 29 (5.2%) |
| Graduate Degree | 256 (87.7%) | 36 (12.3%) |
| Total | 1,491 (71.9%) | 583 (28.1%) |
Employment Characteristics in Fullerton
Employment by Class of Employer in Fullerton
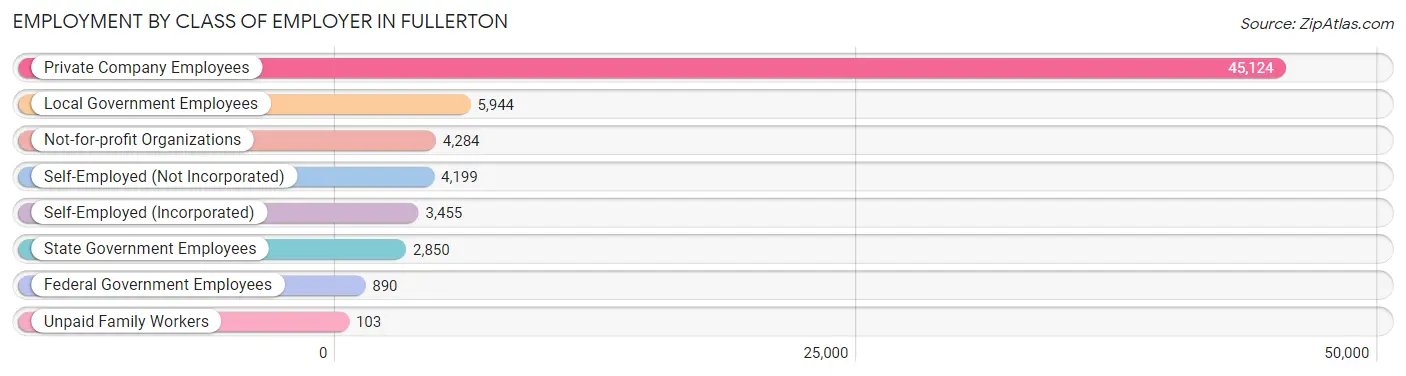
Among the 66,849 employed individuals in Fullerton, private company employees (45,124 | 67.5%), local government employees (5,944 | 8.9%), and not-for-profit organizations (4,284 | 6.4%) make up the most common classes of employment.
| Employer Class | # Employees | % Employees |
| Private Company Employees | 45,124 | 67.5% |
| Self-Employed (Incorporated) | 3,455 | 5.2% |
| Self-Employed (Not Incorporated) | 4,199 | 6.3% |
| Not-for-profit Organizations | 4,284 | 6.4% |
| Local Government Employees | 5,944 | 8.9% |
| State Government Employees | 2,850 | 4.3% |
| Federal Government Employees | 890 | 1.3% |
| Unpaid Family Workers | 103 | 0.2% |
| Total | 66,849 | 100.0% |
Employment Status by Age in Fullerton
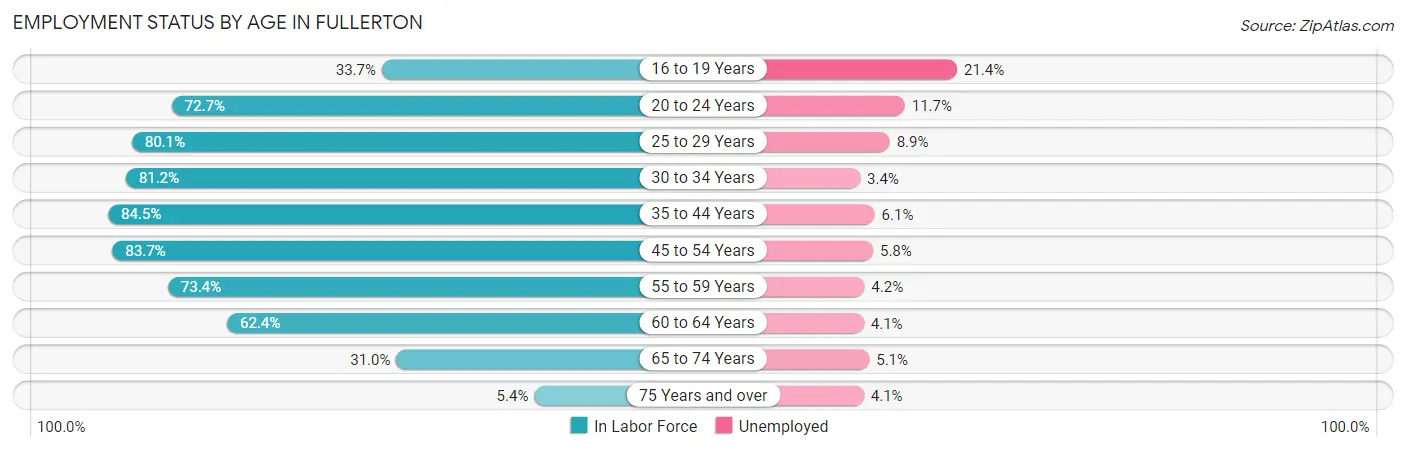
According to the labor force statistics for Fullerton, out of the total population over 16 years of age (113,726), 65.4% or 74,377 individuals are in the labor force, with 6.9% or 5,132 of them unemployed. The age group with the highest labor force participation rate is 35 to 44 years, with 84.5% or 14,358 individuals in the labor force. Within the labor force, the 16 to 19 years age range has the highest percentage of unemployed individuals, with 21.4% or 522 of them being unemployed.
| Age Bracket | In Labor Force | Unemployed |
| 16 to 19 Years | 2,440 (33.7%) | 522 (21.4%) |
| 20 to 24 Years | 8,423 (72.7%) | 985 (11.7%) |
| 25 to 29 Years | 9,608 (80.1%) | 855 (8.9%) |
| 30 to 34 Years | 8,812 (81.2%) | 300 (3.4%) |
| 35 to 44 Years | 14,358 (84.5%) | 876 (6.1%) |
| 45 to 54 Years | 15,151 (83.7%) | 879 (5.8%) |
| 55 to 59 Years | 6,406 (73.4%) | 269 (4.2%) |
| 60 to 64 Years | 5,384 (62.4%) | 221 (4.1%) |
| 65 to 74 Years | 3,255 (31.0%) | 166 (5.1%) |
| 75 Years and over | 492 (5.4%) | 20 (4.1%) |
| Total | 74,377 (65.4%) | 5,132 (6.9%) |
Employment Status by Educational Attainment in Fullerton
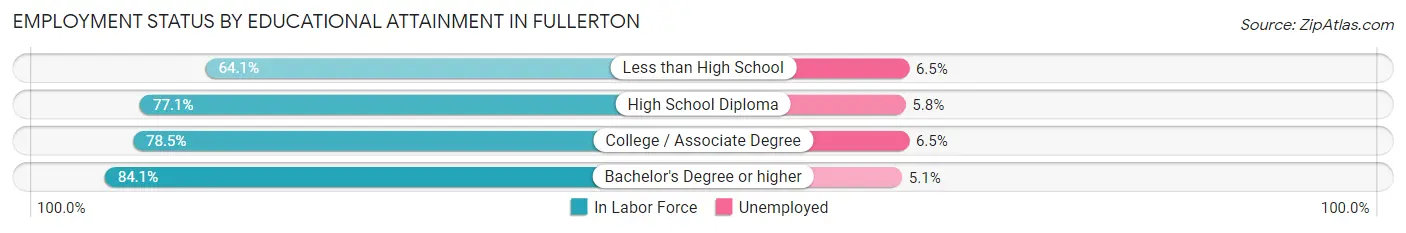
According to labor force statistics for Fullerton, 79.3% of individuals (59,711) out of the total population between 25 and 64 years of age (75,297) are in the labor force, with 5.7% or 3,404 of them being unemployed. The group with the highest labor force participation rate are those with the educational attainment of bachelor's degree or higher, with 84.1% or 28,037 individuals in the labor force. Within the labor force, individuals with less than high school education have the highest percentage of unemployment, with 6.5% or 319 of them being unemployed.
| Educational Attainment | In Labor Force | Unemployed |
| Less than High School | 4,902 (64.1%) | 497 (6.5%) |
| High School Diploma | 9,190 (77.1%) | 691 (5.8%) |
| College / Associate Degree | 17,578 (78.5%) | 1,455 (6.5%) |
| Bachelor's Degree or higher | 28,037 (84.1%) | 1,700 (5.1%) |
| Total | 59,711 (79.3%) | 4,292 (5.7%) |
Employment Occupations by Sex in Fullerton
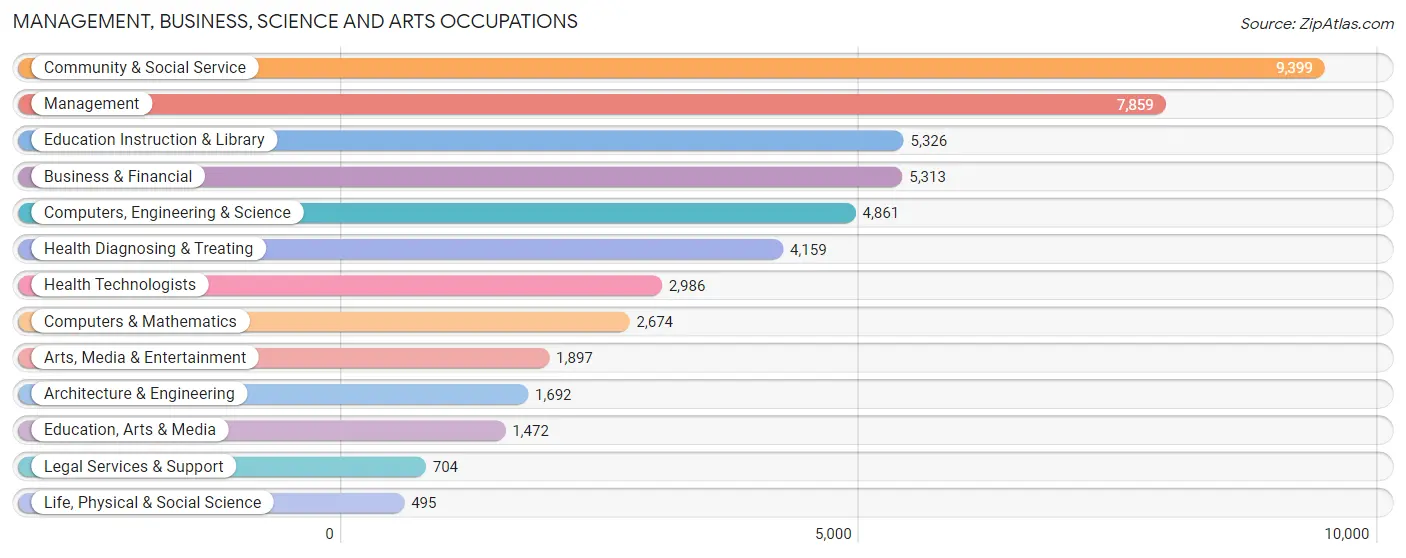
Management, Business, Science and Arts Occupations
The most common Management, Business, Science and Arts occupations in Fullerton are Community & Social Service (9,399 | 13.6%), Management (7,859 | 11.4%), Education Instruction & Library (5,326 | 7.7%), Business & Financial (5,313 | 7.7%), and Computers, Engineering & Science (4,861 | 7.0%).
Management, Business, Science and Arts Occupations by Sex
Within the Management, Business, Science and Arts occupations in Fullerton, the most male-oriented occupations are Architecture & Engineering (85.0%), Computers & Mathematics (81.2%), and Computers, Engineering & Science (79.1%), while the most female-oriented occupations are Health Diagnosing & Treating (66.7%), Education Instruction & Library (66.3%), and Health Technologists (63.6%).
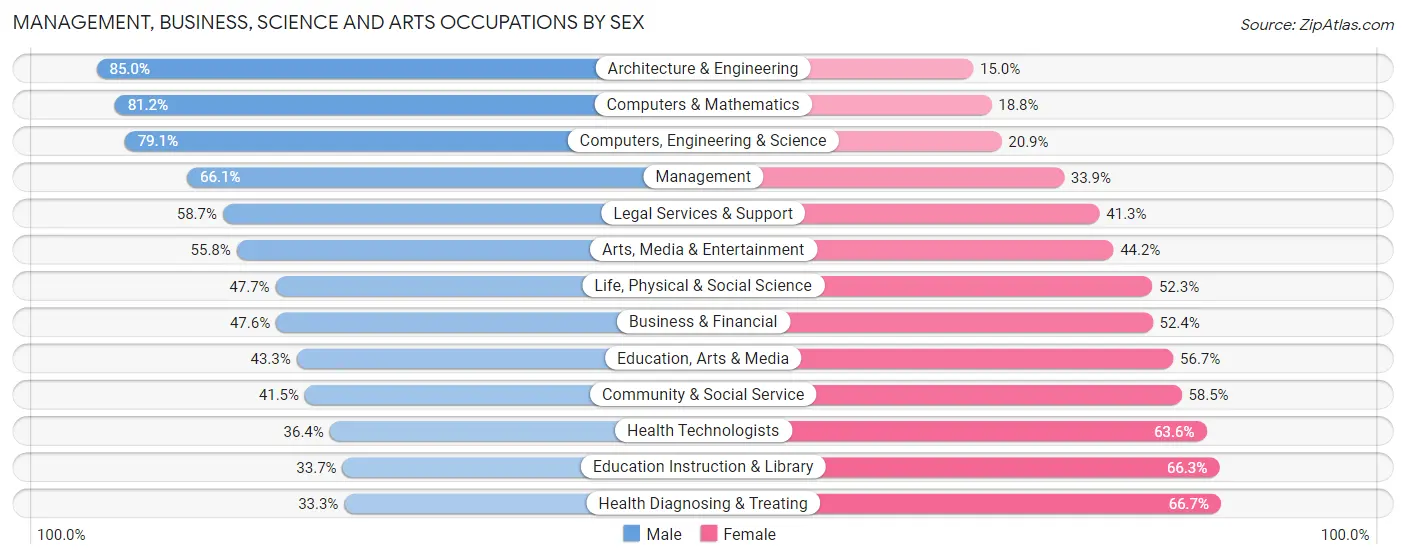
| Occupation | Male | Female |
| Management | 5,193 (66.1%) | 2,666 (33.9%) |
| Business & Financial | 2,527 (47.6%) | 2,786 (52.4%) |
| Computers, Engineering & Science | 3,845 (79.1%) | 1,016 (20.9%) |
| Computers & Mathematics | 2,171 (81.2%) | 503 (18.8%) |
| Architecture & Engineering | 1,438 (85.0%) | 254 (15.0%) |
| Life, Physical & Social Science | 236 (47.7%) | 259 (52.3%) |
| Community & Social Service | 3,903 (41.5%) | 5,496 (58.5%) |
| Education, Arts & Media | 637 (43.3%) | 835 (56.7%) |
| Legal Services & Support | 413 (58.7%) | 291 (41.3%) |
| Education Instruction & Library | 1,795 (33.7%) | 3,531 (66.3%) |
| Arts, Media & Entertainment | 1,058 (55.8%) | 839 (44.2%) |
| Health Diagnosing & Treating | 1,386 (33.3%) | 2,773 (66.7%) |
| Health Technologists | 1,086 (36.4%) | 1,900 (63.6%) |
| Total (Category) | 16,854 (53.3%) | 14,737 (46.7%) |
| Total (Overall) | 37,834 (54.7%) | 31,307 (45.3%) |
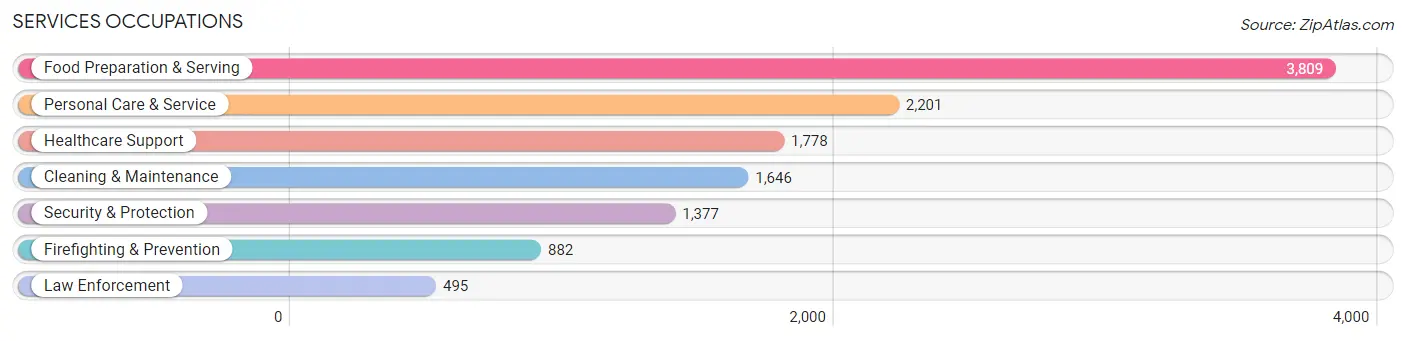
Services Occupations
The most common Services occupations in Fullerton are Food Preparation & Serving (3,809 | 5.5%), Personal Care & Service (2,201 | 3.2%), Healthcare Support (1,778 | 2.6%), Cleaning & Maintenance (1,646 | 2.4%), and Security & Protection (1,377 | 2.0%).
Services Occupations by Sex
Within the Services occupations in Fullerton, the most male-oriented occupations are Firefighting & Prevention (93.9%), Security & Protection (89.9%), and Law Enforcement (82.8%), while the most female-oriented occupations are Healthcare Support (79.3%), Personal Care & Service (71.4%), and Food Preparation & Serving (49.5%).
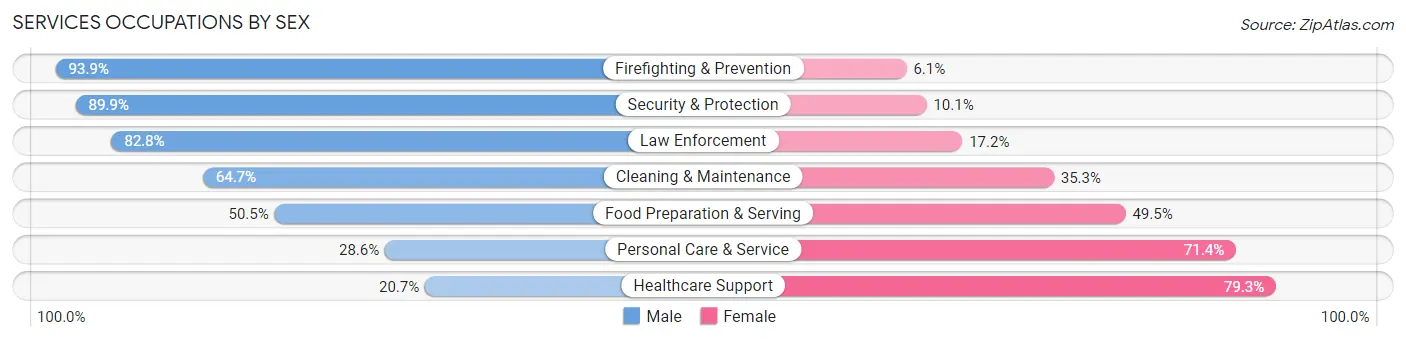
| Occupation | Male | Female |
| Healthcare Support | 368 (20.7%) | 1,410 (79.3%) |
| Security & Protection | 1,238 (89.9%) | 139 (10.1%) |
| Firefighting & Prevention | 828 (93.9%) | 54 (6.1%) |
| Law Enforcement | 410 (82.8%) | 85 (17.2%) |
| Food Preparation & Serving | 1,924 (50.5%) | 1,885 (49.5%) |
| Cleaning & Maintenance | 1,065 (64.7%) | 581 (35.3%) |
| Personal Care & Service | 630 (28.6%) | 1,571 (71.4%) |
| Total (Category) | 5,225 (48.3%) | 5,586 (51.7%) |
| Total (Overall) | 37,834 (54.7%) | 31,307 (45.3%) |
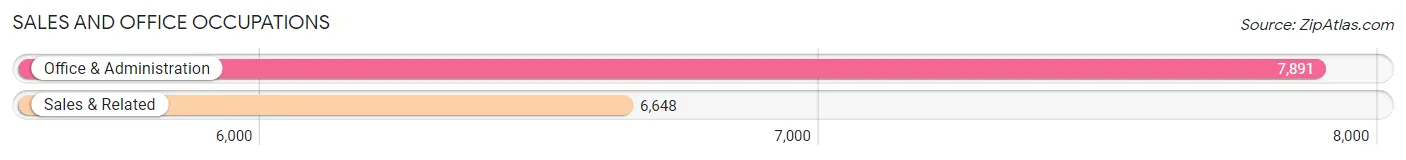
Sales and Office Occupations
The most common Sales and Office occupations in Fullerton are Office & Administration (7,891 | 11.4%), and Sales & Related (6,648 | 9.6%).
Sales and Office Occupations by Sex
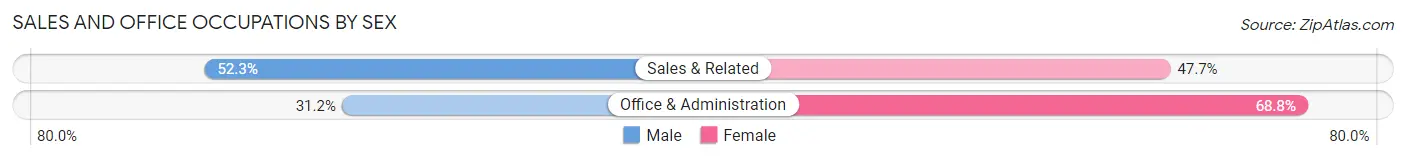
| Occupation | Male | Female |
| Sales & Related | 3,478 (52.3%) | 3,170 (47.7%) |
| Office & Administration | 2,463 (31.2%) | 5,428 (68.8%) |
| Total (Category) | 5,941 (40.9%) | 8,598 (59.1%) |
| Total (Overall) | 37,834 (54.7%) | 31,307 (45.3%) |
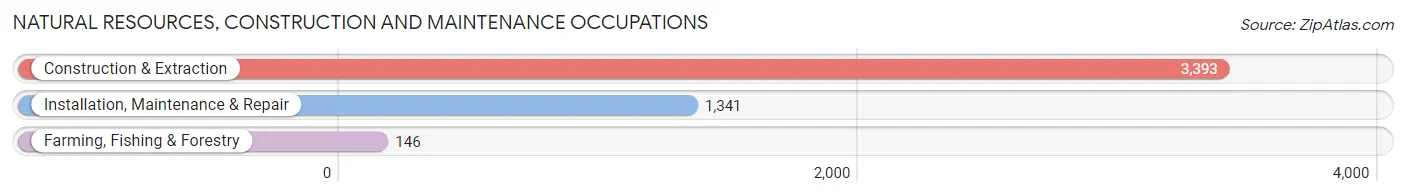
Natural Resources, Construction and Maintenance Occupations
The most common Natural Resources, Construction and Maintenance occupations in Fullerton are Construction & Extraction (3,393 | 4.9%), Installation, Maintenance & Repair (1,341 | 1.9%), and Farming, Fishing & Forestry (146 | 0.2%).
Natural Resources, Construction and Maintenance Occupations by Sex
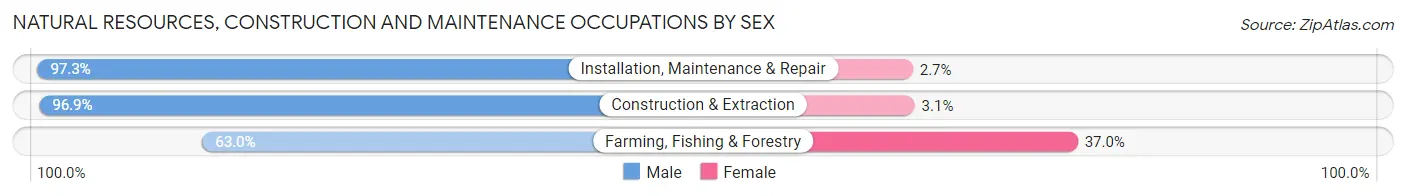
| Occupation | Male | Female |
| Farming, Fishing & Forestry | 92 (63.0%) | 54 (37.0%) |
| Construction & Extraction | 3,289 (96.9%) | 104 (3.1%) |
| Installation, Maintenance & Repair | 1,305 (97.3%) | 36 (2.7%) |
| Total (Category) | 4,686 (96.0%) | 194 (4.0%) |
| Total (Overall) | 37,834 (54.7%) | 31,307 (45.3%) |
Production, Transportation and Moving Occupations
The most common Production, Transportation and Moving occupations in Fullerton are Production (4,254 | 6.1%), Material Moving (1,564 | 2.3%), and Transportation (1,502 | 2.2%).
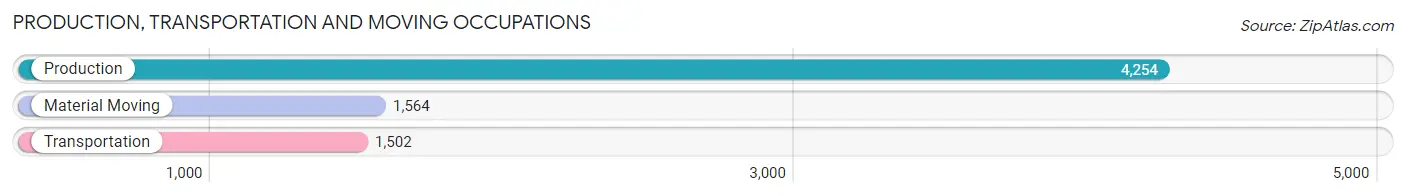
Production, Transportation and Moving Occupations by Sex
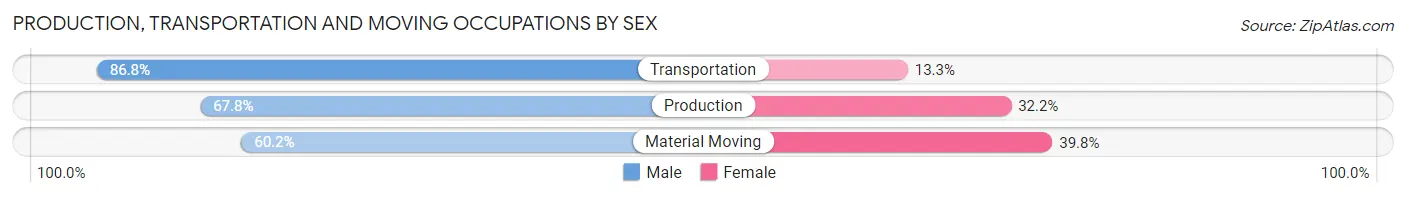
| Occupation | Male | Female |
| Production | 2,883 (67.8%) | 1,371 (32.2%) |
| Transportation | 1,303 (86.8%) | 199 (13.3%) |
| Material Moving | 942 (60.2%) | 622 (39.8%) |
| Total (Category) | 5,128 (70.1%) | 2,192 (29.9%) |
| Total (Overall) | 37,834 (54.7%) | 31,307 (45.3%) |
Employment Industries by Sex in Fullerton
Employment Industries in Fullerton
The major employment industries in Fullerton include Manufacturing (8,924 | 12.9%), Health Care & Social Assistance (8,395 | 12.1%), Educational Services (7,772 | 11.2%), Retail Trade (7,065 | 10.2%), and Professional & Scientific (6,205 | 9.0%).
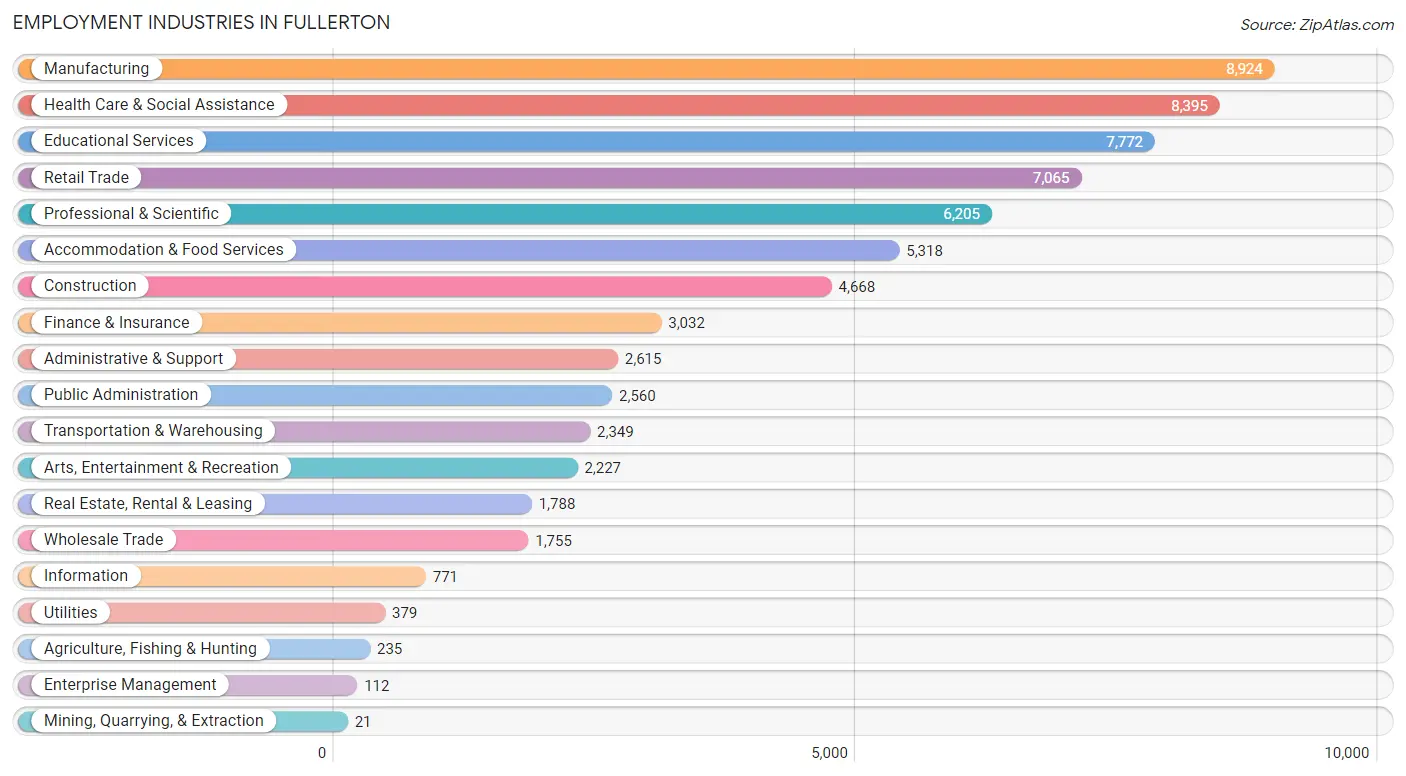
Employment Industries by Sex in Fullerton
The Fullerton industries that see more men than women are Mining, Quarrying, & Extraction (100.0%), Construction (89.0%), and Information (78.9%), whereas the industries that tend to have a higher number of women are Health Care & Social Assistance (71.3%), Enterprise Management (70.5%), and Educational Services (64.2%).
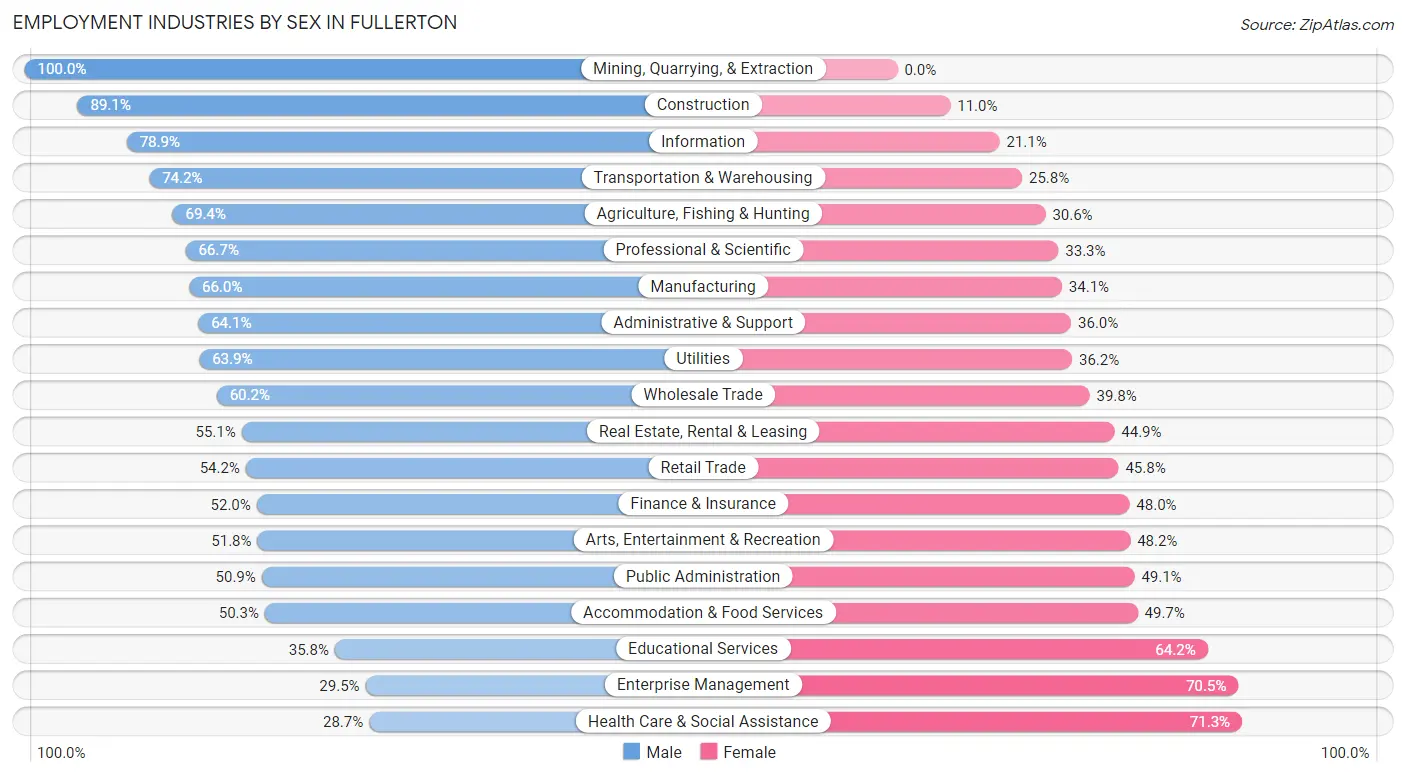
| Industry | Male | Female |
| Agriculture, Fishing & Hunting | 163 (69.4%) | 72 (30.6%) |
| Mining, Quarrying, & Extraction | 21 (100.0%) | 0 (0.0%) |
| Construction | 4,157 (89.0%) | 511 (11.0%) |
| Manufacturing | 5,885 (65.9%) | 3,039 (34.1%) |
| Wholesale Trade | 1,057 (60.2%) | 698 (39.8%) |
| Retail Trade | 3,832 (54.2%) | 3,233 (45.8%) |
| Transportation & Warehousing | 1,743 (74.2%) | 606 (25.8%) |
| Utilities | 242 (63.8%) | 137 (36.1%) |
| Information | 608 (78.9%) | 163 (21.1%) |
| Finance & Insurance | 1,576 (52.0%) | 1,456 (48.0%) |
| Real Estate, Rental & Leasing | 985 (55.1%) | 803 (44.9%) |
| Professional & Scientific | 4,138 (66.7%) | 2,067 (33.3%) |
| Enterprise Management | 33 (29.5%) | 79 (70.5%) |
| Administrative & Support | 1,675 (64.0%) | 940 (35.9%) |
| Educational Services | 2,782 (35.8%) | 4,990 (64.2%) |
| Health Care & Social Assistance | 2,409 (28.7%) | 5,986 (71.3%) |
| Arts, Entertainment & Recreation | 1,154 (51.8%) | 1,073 (48.2%) |
| Accommodation & Food Services | 2,674 (50.3%) | 2,644 (49.7%) |
| Public Administration | 1,304 (50.9%) | 1,256 (49.1%) |
| Total | 37,834 (54.7%) | 31,307 (45.3%) |
Education in Fullerton
School Enrollment in Fullerton
The most common levels of schooling among the 40,623 students in Fullerton are college / undergraduate (12,077 | 29.7%), middle school (8,310 | 20.5%), and high school (6,883 | 16.9%).
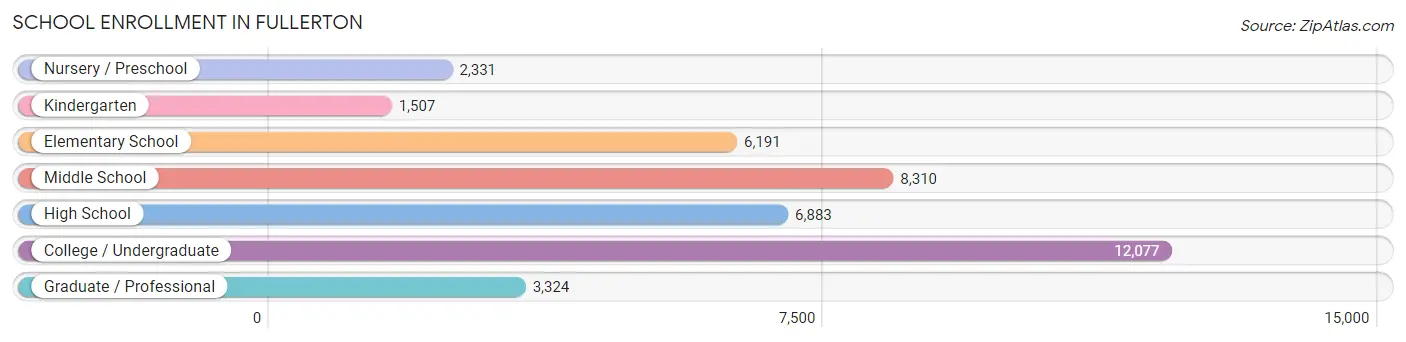
| School Level | # Students | % Students |
| Nursery / Preschool | 2,331 | 5.7% |
| Kindergarten | 1,507 | 3.7% |
| Elementary School | 6,191 | 15.2% |
| Middle School | 8,310 | 20.5% |
| High School | 6,883 | 16.9% |
| College / Undergraduate | 12,077 | 29.7% |
| Graduate / Professional | 3,324 | 8.2% |
| Total | 40,623 | 100.0% |
School Enrollment by Age by Funding Source in Fullerton
Out of a total of 40,623 students who are enrolled in schools in Fullerton, 6,540 (16.1%) attend a private institution, while the remaining 34,083 (83.9%) are enrolled in public schools. The age group of 3 to 4 year olds has the highest likelihood of being enrolled in private schools, with 1,186 (62.7% in the age bracket) enrolled. Conversely, the age group of 15 to 17 year olds has the lowest likelihood of being enrolled in a private school, with 4,311 (91.9% in the age bracket) attending a public institution.
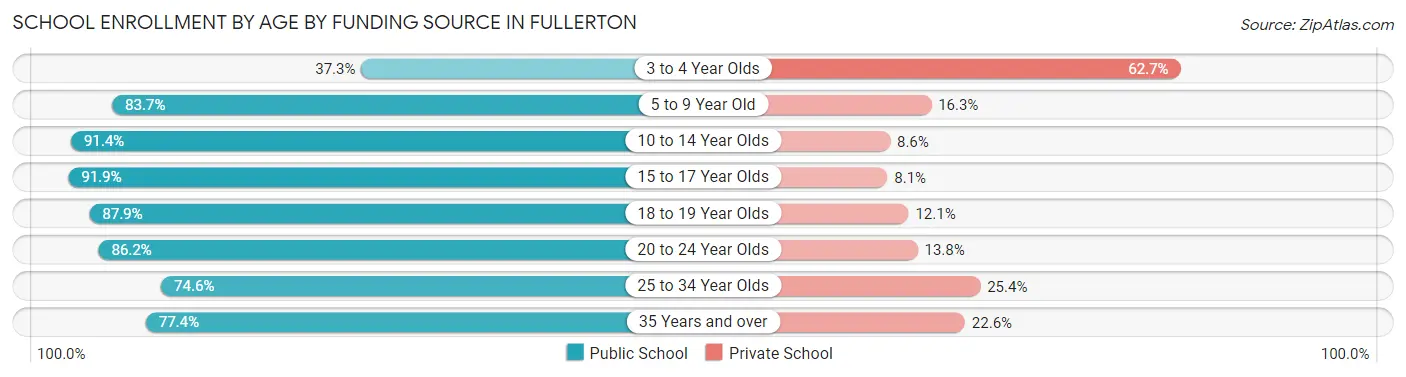
| Age Bracket | Public School | Private School |
| 3 to 4 Year Olds | 705 (37.3%) | 1,186 (62.7%) |
| 5 to 9 Year Old | 6,111 (83.7%) | 1,190 (16.3%) |
| 10 to 14 Year Olds | 9,439 (91.4%) | 891 (8.6%) |
| 15 to 17 Year Olds | 4,311 (91.9%) | 382 (8.1%) |
| 18 to 19 Year Olds | 2,928 (87.9%) | 402 (12.1%) |
| 20 to 24 Year Olds | 5,617 (86.2%) | 896 (13.8%) |
| 25 to 34 Year Olds | 3,244 (74.6%) | 1,107 (25.4%) |
| 35 Years and over | 1,714 (77.4%) | 500 (22.6%) |
| Total | 34,083 (83.9%) | 6,540 (16.1%) |
Educational Attainment by Field of Study in Fullerton
Business (7,757 | 17.6%), engineering (4,218 | 9.6%), social sciences (4,184 | 9.5%), science & technology (3,545 | 8.0%), and liberal arts & history (2,892 | 6.6%) are the most common fields of study among 44,106 individuals in Fullerton who have obtained a bachelor's degree or higher.
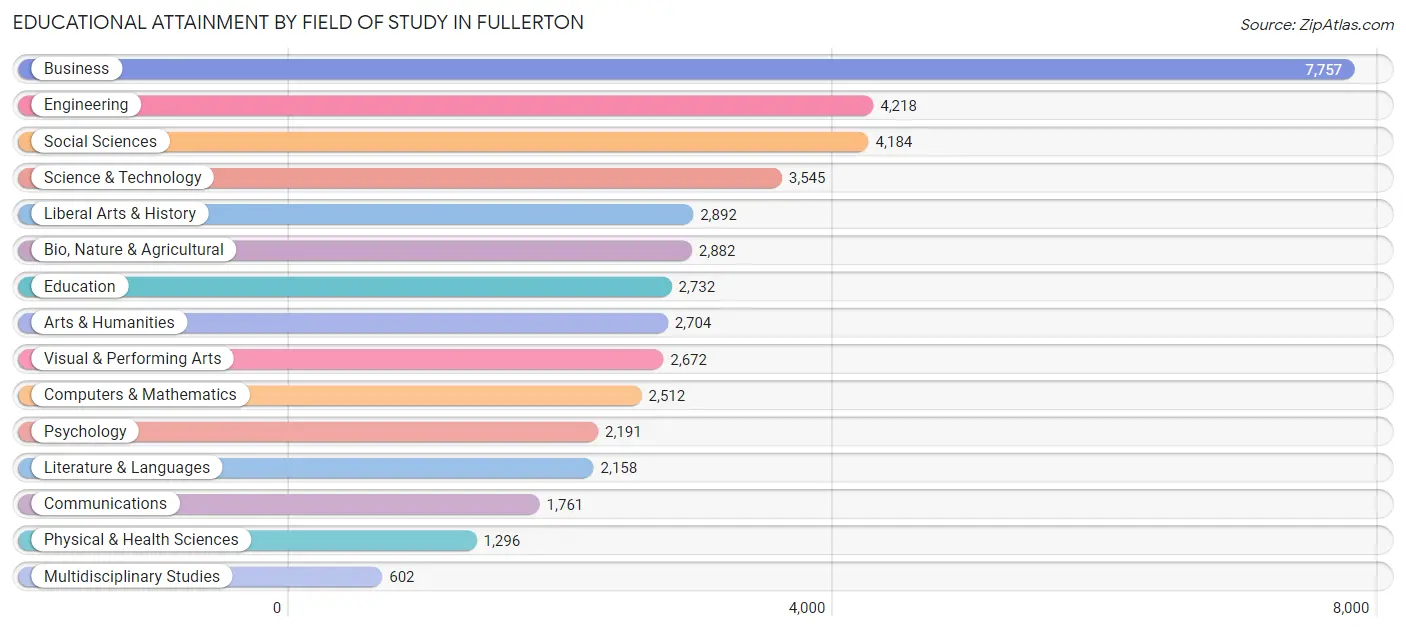
| Field of Study | # Graduates | % Graduates |
| Computers & Mathematics | 2,512 | 5.7% |
| Bio, Nature & Agricultural | 2,882 | 6.5% |
| Physical & Health Sciences | 1,296 | 2.9% |
| Psychology | 2,191 | 5.0% |
| Social Sciences | 4,184 | 9.5% |
| Engineering | 4,218 | 9.6% |
| Multidisciplinary Studies | 602 | 1.4% |
| Science & Technology | 3,545 | 8.0% |
| Business | 7,757 | 17.6% |
| Education | 2,732 | 6.2% |
| Literature & Languages | 2,158 | 4.9% |
| Liberal Arts & History | 2,892 | 6.6% |
| Visual & Performing Arts | 2,672 | 6.1% |
| Communications | 1,761 | 4.0% |
| Arts & Humanities | 2,704 | 6.1% |
| Total | 44,106 | 100.0% |
Transportation & Commute in Fullerton
Vehicle Availability by Sex in Fullerton
The most prevalent vehicle ownership categories in Fullerton are males with 2 vehicles (15,378, accounting for 42.2%) and females with 2 vehicles (11,791, making up 51.7%).
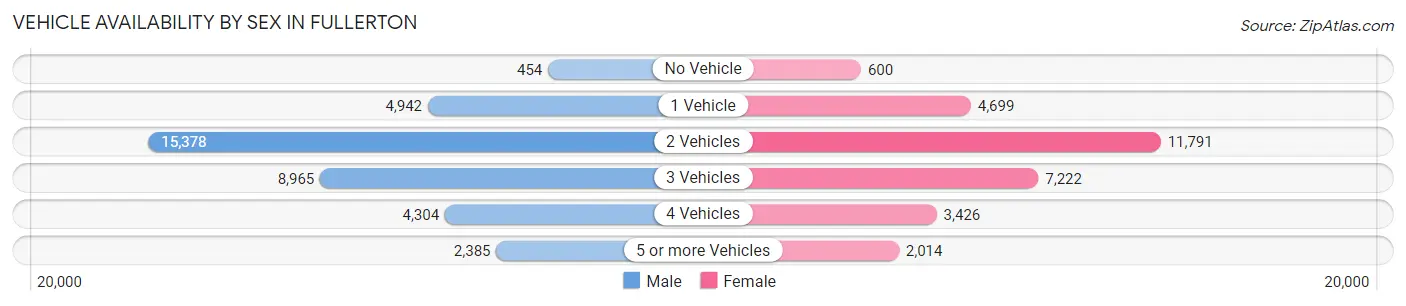
| Vehicles Available | Male | Female |
| No Vehicle | 454 (1.3%) | 600 (2.0%) |
| 1 Vehicle | 4,942 (13.6%) | 4,699 (15.8%) |
| 2 Vehicles | 15,378 (42.2%) | 11,791 (39.6%) |
| 3 Vehicles | 8,965 (24.6%) | 7,222 (24.3%) |
| 4 Vehicles | 4,304 (11.8%) | 3,426 (11.5%) |
| 5 or more Vehicles | 2,385 (6.6%) | 2,014 (6.8%) |
| Total | 36,428 (100.0%) | 29,752 (100.0%) |
Commute Time in Fullerton
The most frequently occuring commute durations in Fullerton are 30 to 34 minutes (9,141 commuters, 15.4%), 15 to 19 minutes (8,781 commuters, 14.8%), and 20 to 24 minutes (7,162 commuters, 12.1%).
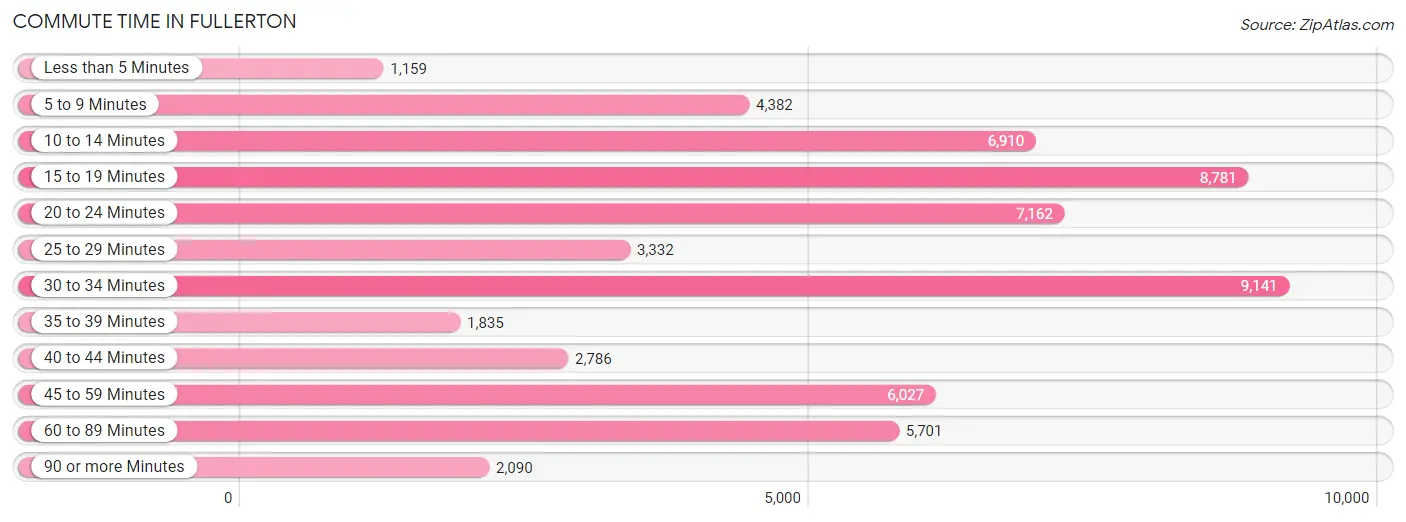
| Commute Time | # Commuters | % Commuters |
| Less than 5 Minutes | 1,159 | 1.9% |
| 5 to 9 Minutes | 4,382 | 7.4% |
| 10 to 14 Minutes | 6,910 | 11.7% |
| 15 to 19 Minutes | 8,781 | 14.8% |
| 20 to 24 Minutes | 7,162 | 12.1% |
| 25 to 29 Minutes | 3,332 | 5.6% |
| 30 to 34 Minutes | 9,141 | 15.4% |
| 35 to 39 Minutes | 1,835 | 3.1% |
| 40 to 44 Minutes | 2,786 | 4.7% |
| 45 to 59 Minutes | 6,027 | 10.2% |
| 60 to 89 Minutes | 5,701 | 9.6% |
| 90 or more Minutes | 2,090 | 3.5% |
Commute Time by Sex in Fullerton
The most common commute times in Fullerton are 30 to 34 minutes (5,595 commuters, 16.8%) for males and 15 to 19 minutes (4,141 commuters, 15.9%) for females.
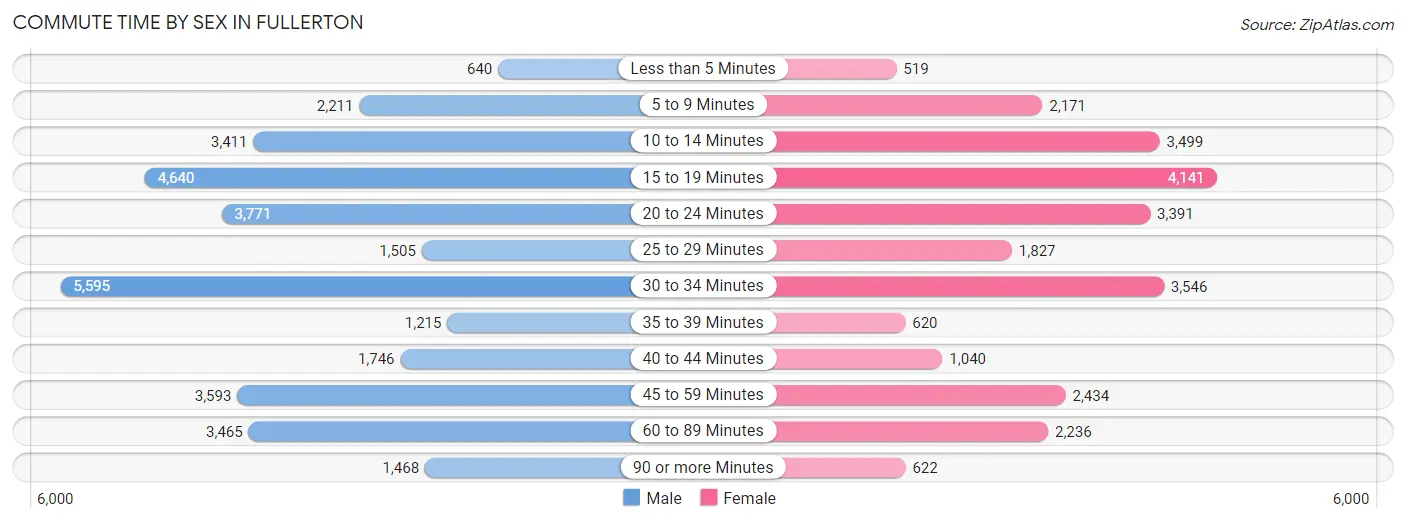
| Commute Time | Male | Female |
| Less than 5 Minutes | 640 (1.9%) | 519 (2.0%) |
| 5 to 9 Minutes | 2,211 (6.7%) | 2,171 (8.3%) |
| 10 to 14 Minutes | 3,411 (10.3%) | 3,499 (13.4%) |
| 15 to 19 Minutes | 4,640 (14.0%) | 4,141 (15.9%) |
| 20 to 24 Minutes | 3,771 (11.3%) | 3,391 (13.0%) |
| 25 to 29 Minutes | 1,505 (4.5%) | 1,827 (7.0%) |
| 30 to 34 Minutes | 5,595 (16.8%) | 3,546 (13.6%) |
| 35 to 39 Minutes | 1,215 (3.6%) | 620 (2.4%) |
| 40 to 44 Minutes | 1,746 (5.2%) | 1,040 (4.0%) |
| 45 to 59 Minutes | 3,593 (10.8%) | 2,434 (9.3%) |
| 60 to 89 Minutes | 3,465 (10.4%) | 2,236 (8.6%) |
| 90 or more Minutes | 1,468 (4.4%) | 622 (2.4%) |
Time of Departure to Work by Sex in Fullerton
The most frequent times of departure to work in Fullerton are 8:00 AM to 8:29 AM (4,604, 13.8%) for males and 7:00 AM to 7:29 AM (3,820, 14.7%) for females.
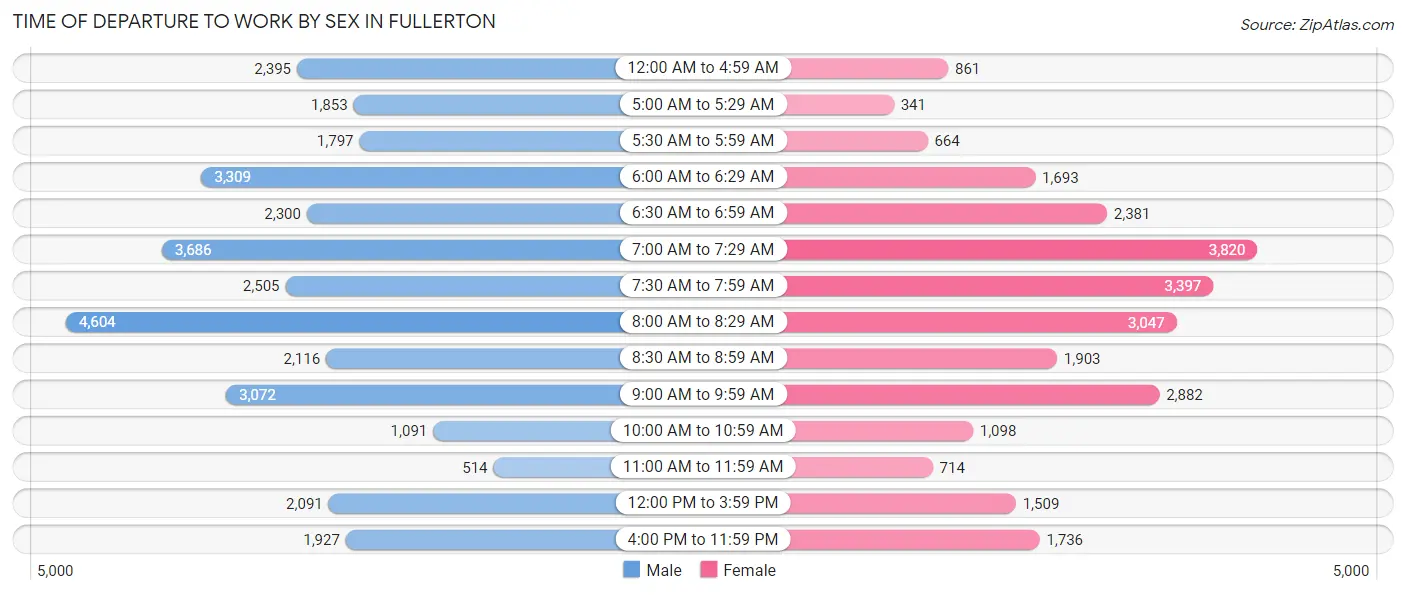
| Time of Departure | Male | Female |
| 12:00 AM to 4:59 AM | 2,395 (7.2%) | 861 (3.3%) |
| 5:00 AM to 5:29 AM | 1,853 (5.6%) | 341 (1.3%) |
| 5:30 AM to 5:59 AM | 1,797 (5.4%) | 664 (2.5%) |
| 6:00 AM to 6:29 AM | 3,309 (10.0%) | 1,693 (6.5%) |
| 6:30 AM to 6:59 AM | 2,300 (6.9%) | 2,381 (9.1%) |
| 7:00 AM to 7:29 AM | 3,686 (11.1%) | 3,820 (14.7%) |
| 7:30 AM to 7:59 AM | 2,505 (7.5%) | 3,397 (13.0%) |
| 8:00 AM to 8:29 AM | 4,604 (13.8%) | 3,047 (11.7%) |
| 8:30 AM to 8:59 AM | 2,116 (6.4%) | 1,903 (7.3%) |
| 9:00 AM to 9:59 AM | 3,072 (9.2%) | 2,882 (11.1%) |
| 10:00 AM to 10:59 AM | 1,091 (3.3%) | 1,098 (4.2%) |
| 11:00 AM to 11:59 AM | 514 (1.5%) | 714 (2.7%) |
| 12:00 PM to 3:59 PM | 2,091 (6.3%) | 1,509 (5.8%) |
| 4:00 PM to 11:59 PM | 1,927 (5.8%) | 1,736 (6.7%) |
| Total | 33,260 (100.0%) | 26,046 (100.0%) |
Housing Occupancy in Fullerton
Occupancy by Ownership in Fullerton
Of the total 47,014 dwellings in Fullerton, owner-occupied units account for 24,259 (51.6%), while renter-occupied units make up 22,755 (48.4%).
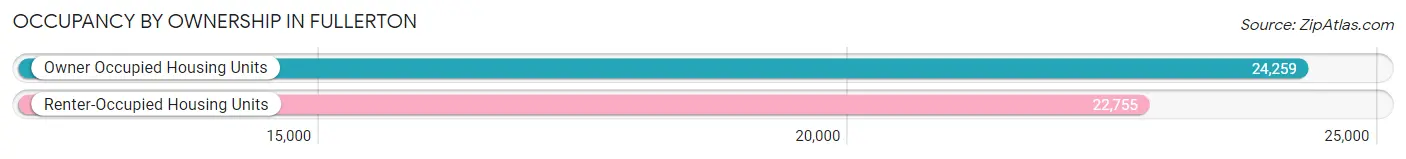
| Occupancy | # Housing Units | % Housing Units |
| Owner Occupied Housing Units | 24,259 | 51.6% |
| Renter-Occupied Housing Units | 22,755 | 48.4% |
| Total Occupied Housing Units | 47,014 | 100.0% |
Occupancy by Household Size in Fullerton
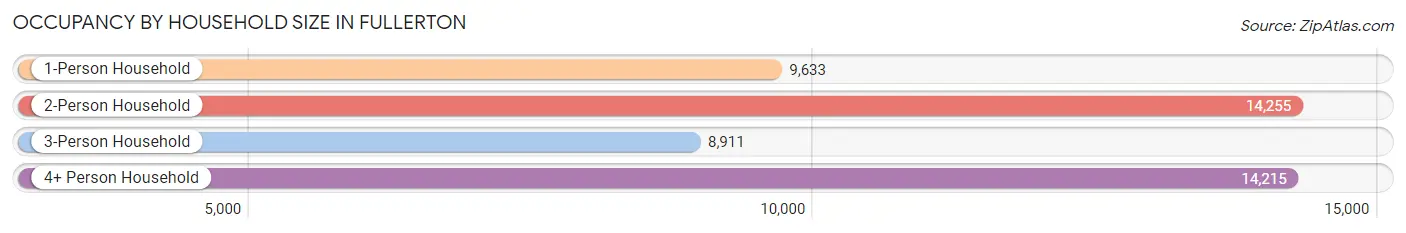
| Household Size | # Housing Units | % Housing Units |
| 1-Person Household | 9,633 | 20.5% |
| 2-Person Household | 14,255 | 30.3% |
| 3-Person Household | 8,911 | 19.0% |
| 4+ Person Household | 14,215 | 30.2% |
| Total Housing Units | 47,014 | 100.0% |
Occupancy by Ownership by Household Size in Fullerton
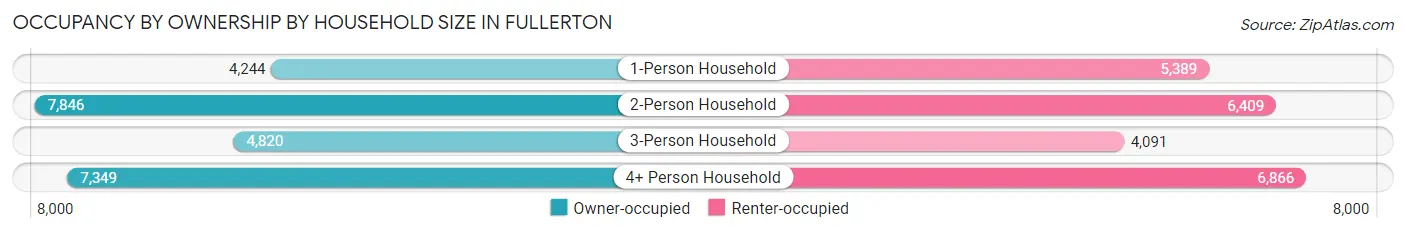
| Household Size | Owner-occupied | Renter-occupied |
| 1-Person Household | 4,244 (44.1%) | 5,389 (55.9%) |
| 2-Person Household | 7,846 (55.0%) | 6,409 (45.0%) |
| 3-Person Household | 4,820 (54.1%) | 4,091 (45.9%) |
| 4+ Person Household | 7,349 (51.7%) | 6,866 (48.3%) |
| Total Housing Units | 24,259 (51.6%) | 22,755 (48.4%) |
Occupancy by Educational Attainment in Fullerton
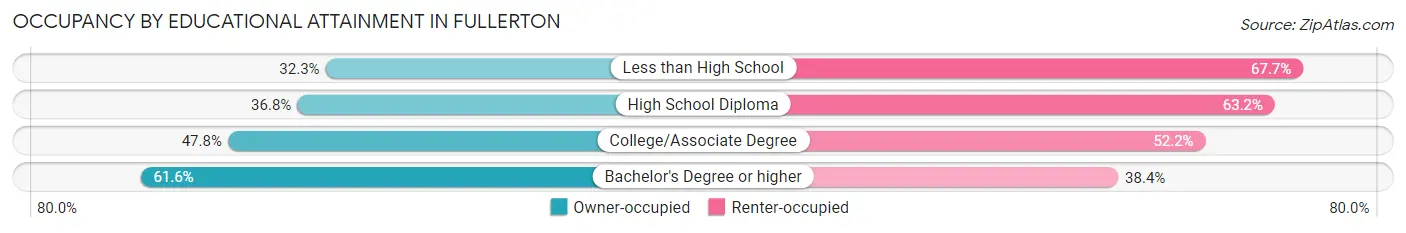
| Household Size | Owner-occupied | Renter-occupied |
| Less than High School | 1,138 (32.3%) | 2,386 (67.7%) |
| High School Diploma | 2,516 (36.8%) | 4,326 (63.2%) |
| College/Associate Degree | 6,827 (47.8%) | 7,460 (52.2%) |
| Bachelor's Degree or higher | 13,778 (61.6%) | 8,583 (38.4%) |
Occupancy by Age of Householder in Fullerton
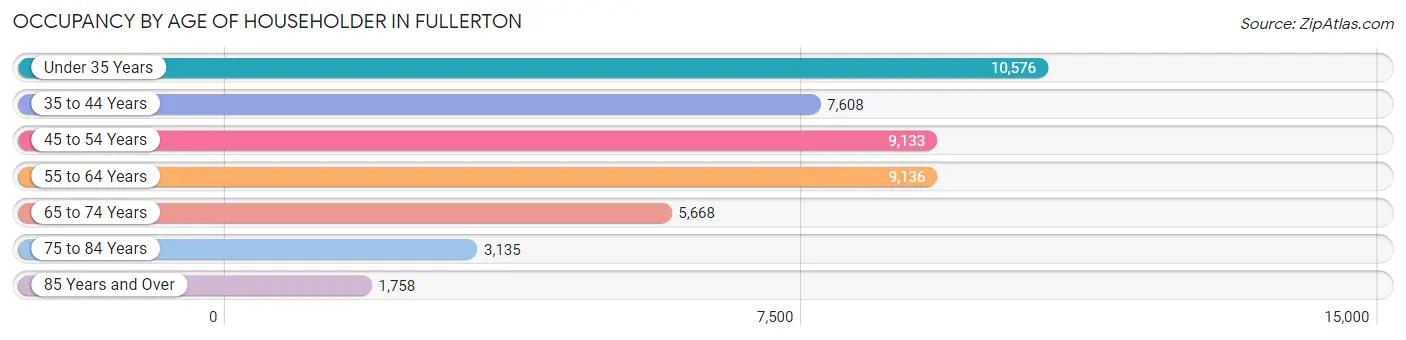
| Age Bracket | # Households | % Households |
| Under 35 Years | 10,576 | 22.5% |
| 35 to 44 Years | 7,608 | 16.2% |
| 45 to 54 Years | 9,133 | 19.4% |
| 55 to 64 Years | 9,136 | 19.4% |
| 65 to 74 Years | 5,668 | 12.1% |
| 75 to 84 Years | 3,135 | 6.7% |
| 85 Years and Over | 1,758 | 3.7% |
| Total | 47,014 | 100.0% |
Housing Finances in Fullerton
Median Income by Occupancy in Fullerton
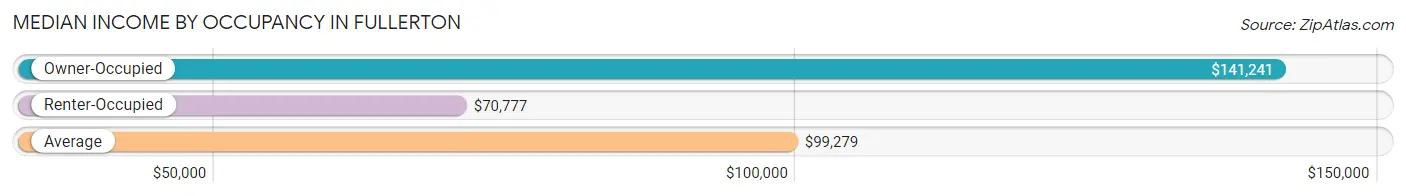
| Occupancy Type | # Households | Median Income |
| Owner-Occupied | 24,259 (51.6%) | $141,241 |
| Renter-Occupied | 22,755 (48.4%) | $70,777 |
| Average | 47,014 (100.0%) | $99,279 |
Occupancy by Householder Income Bracket in Fullerton
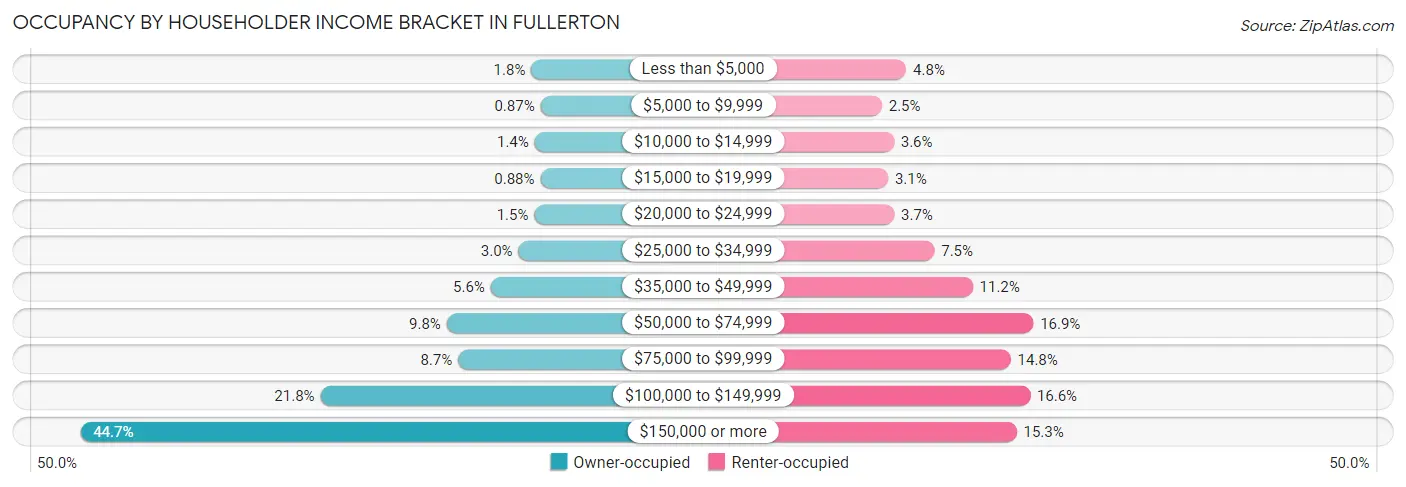
| Income Bracket | Owner-occupied | Renter-occupied |
| Less than $5,000 | 424 (1.8%) | 1,097 (4.8%) |
| $5,000 to $9,999 | 210 (0.9%) | 569 (2.5%) |
| $10,000 to $14,999 | 346 (1.4%) | 829 (3.6%) |
| $15,000 to $19,999 | 213 (0.9%) | 702 (3.1%) |
| $20,000 to $24,999 | 353 (1.5%) | 836 (3.7%) |
| $25,000 to $34,999 | 720 (3.0%) | 1,706 (7.5%) |
| $35,000 to $49,999 | 1,361 (5.6%) | 2,537 (11.2%) |
| $50,000 to $74,999 | 2,378 (9.8%) | 3,851 (16.9%) |
| $75,000 to $99,999 | 2,115 (8.7%) | 3,361 (14.8%) |
| $100,000 to $149,999 | 5,296 (21.8%) | 3,779 (16.6%) |
| $150,000 or more | 10,843 (44.7%) | 3,488 (15.3%) |
| Total | 24,259 (100.0%) | 22,755 (100.0%) |
Monthly Housing Cost Tiers in Fullerton
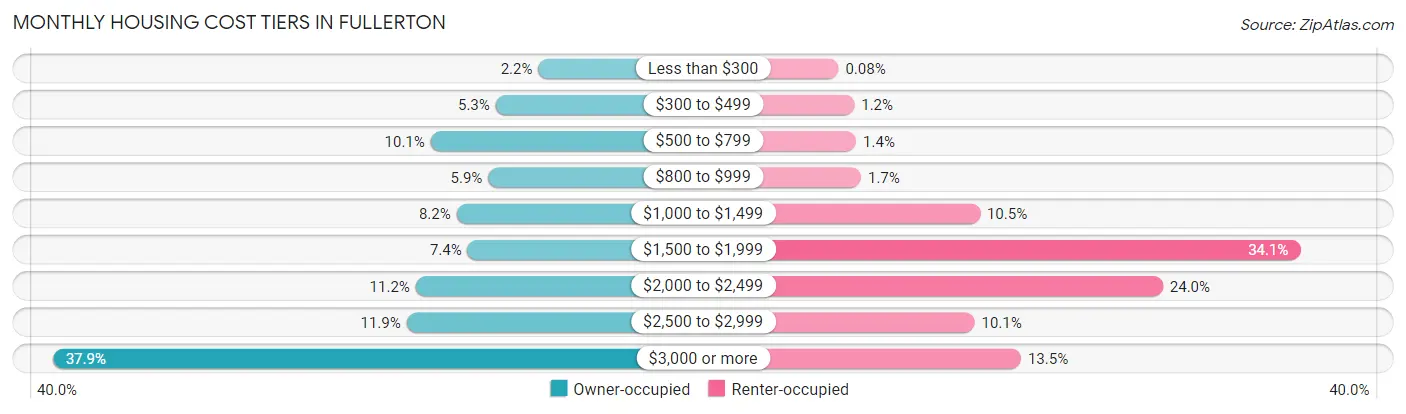
| Monthly Cost | Owner-occupied | Renter-occupied |
| Less than $300 | 526 (2.2%) | 18 (0.1%) |
| $300 to $499 | 1,288 (5.3%) | 283 (1.2%) |
| $500 to $799 | 2,449 (10.1%) | 314 (1.4%) |
| $800 to $999 | 1,421 (5.9%) | 397 (1.7%) |
| $1,000 to $1,499 | 1,986 (8.2%) | 2,390 (10.5%) |
| $1,500 to $1,999 | 1,790 (7.4%) | 7,756 (34.1%) |
| $2,000 to $2,499 | 2,717 (11.2%) | 5,454 (24.0%) |
| $2,500 to $2,999 | 2,880 (11.9%) | 2,299 (10.1%) |
| $3,000 or more | 9,202 (37.9%) | 3,077 (13.5%) |
| Total | 24,259 (100.0%) | 22,755 (100.0%) |
Physical Housing Characteristics in Fullerton
Housing Structures in Fullerton
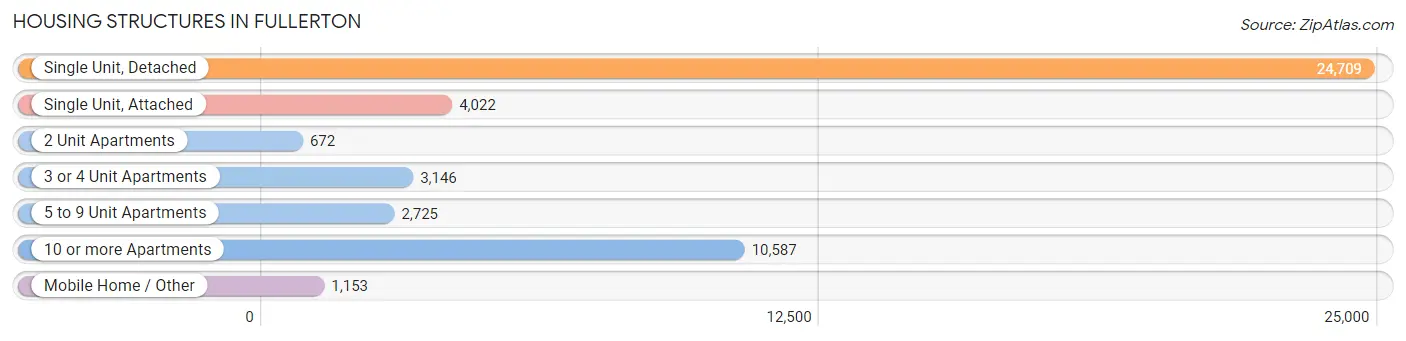
| Structure Type | # Housing Units | % Housing Units |
| Single Unit, Detached | 24,709 | 52.6% |
| Single Unit, Attached | 4,022 | 8.6% |
| 2 Unit Apartments | 672 | 1.4% |
| 3 or 4 Unit Apartments | 3,146 | 6.7% |
| 5 to 9 Unit Apartments | 2,725 | 5.8% |
| 10 or more Apartments | 10,587 | 22.5% |
| Mobile Home / Other | 1,153 | 2.5% |
| Total | 47,014 | 100.0% |
Housing Structures by Occupancy in Fullerton
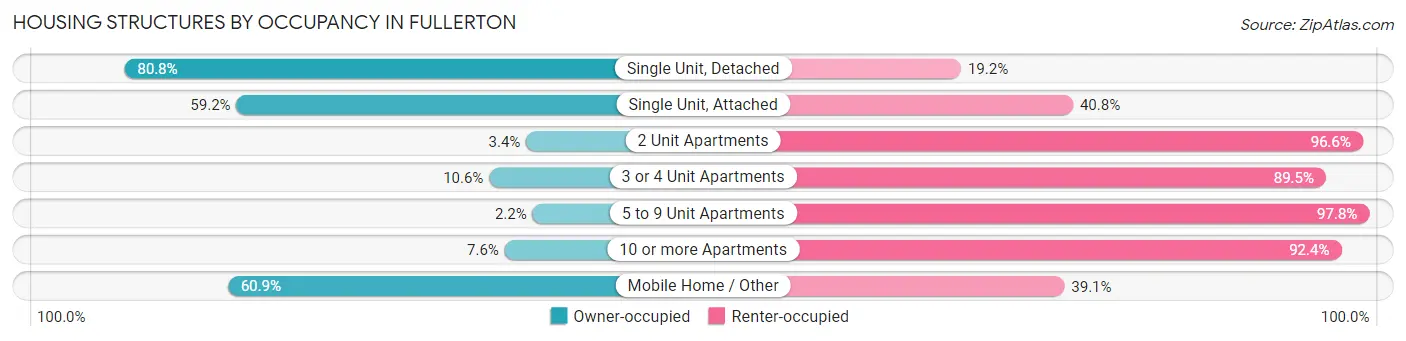
| Structure Type | Owner-occupied | Renter-occupied |
| Single Unit, Detached | 19,959 (80.8%) | 4,750 (19.2%) |
| Single Unit, Attached | 2,382 (59.2%) | 1,640 (40.8%) |
| 2 Unit Apartments | 23 (3.4%) | 649 (96.6%) |
| 3 or 4 Unit Apartments | 332 (10.5%) | 2,814 (89.4%) |
| 5 to 9 Unit Apartments | 60 (2.2%) | 2,665 (97.8%) |
| 10 or more Apartments | 801 (7.6%) | 9,786 (92.4%) |
| Mobile Home / Other | 702 (60.9%) | 451 (39.1%) |
| Total | 24,259 (51.6%) | 22,755 (48.4%) |
Housing Structures by Number of Rooms in Fullerton
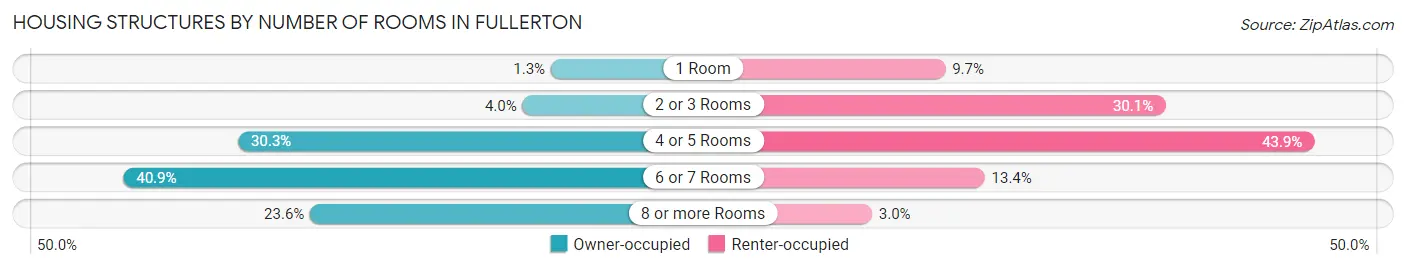
| Number of Rooms | Owner-occupied | Renter-occupied |
| 1 Room | 320 (1.3%) | 2,216 (9.7%) |
| 2 or 3 Rooms | 959 (4.0%) | 6,842 (30.1%) |
| 4 or 5 Rooms | 7,343 (30.3%) | 9,981 (43.9%) |
| 6 or 7 Rooms | 9,914 (40.9%) | 3,044 (13.4%) |
| 8 or more Rooms | 5,723 (23.6%) | 672 (2.9%) |
| Total | 24,259 (100.0%) | 22,755 (100.0%) |
Housing Structure by Heating Type in Fullerton
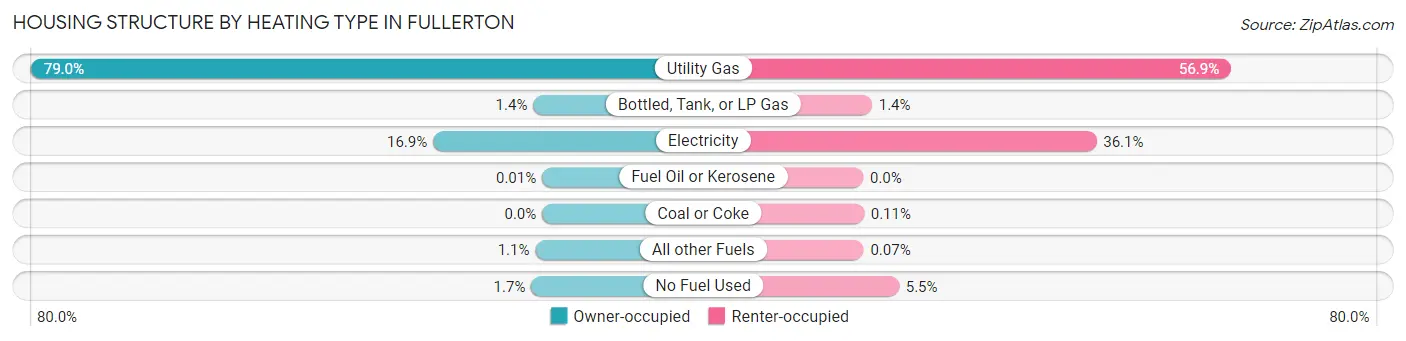
| Heating Type | Owner-occupied | Renter-occupied |
| Utility Gas | 19,174 (79.0%) | 12,945 (56.9%) |
| Bottled, Tank, or LP Gas | 332 (1.4%) | 308 (1.3%) |
| Electricity | 4,089 (16.9%) | 8,205 (36.1%) |
| Fuel Oil or Kerosene | 3 (0.0%) | 0 (0.0%) |
| Coal or Coke | 0 (0.0%) | 25 (0.1%) |
| All other Fuels | 254 (1.1%) | 16 (0.1%) |
| No Fuel Used | 407 (1.7%) | 1,256 (5.5%) |
| Total | 24,259 (100.0%) | 22,755 (100.0%) |
Household Vehicle Usage in Fullerton
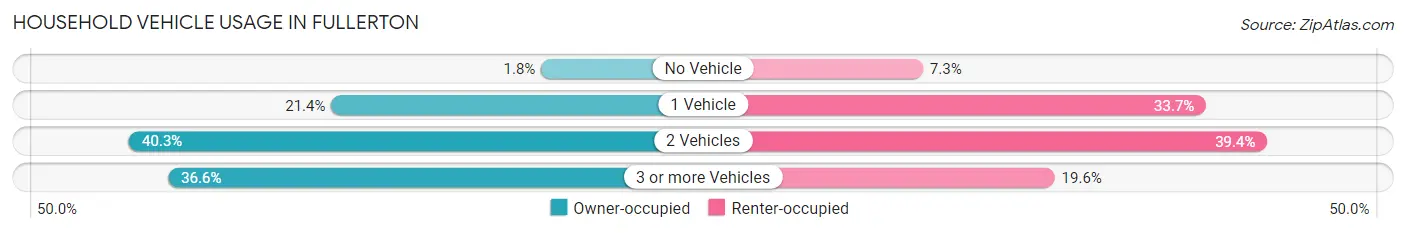
| Vehicles per Household | Owner-occupied | Renter-occupied |
| No Vehicle | 431 (1.8%) | 1,656 (7.3%) |
| 1 Vehicle | 5,184 (21.4%) | 7,674 (33.7%) |
| 2 Vehicles | 9,766 (40.3%) | 8,969 (39.4%) |
| 3 or more Vehicles | 8,878 (36.6%) | 4,456 (19.6%) |
| Total | 24,259 (100.0%) | 22,755 (100.0%) |
Real Estate & Mortgages in Fullerton
Real Estate and Mortgage Overview in Fullerton
| Characteristic | Without Mortgage | With Mortgage |
| Housing Units | 7,204 | 17,055 |
| Median Property Value | $766,700 | $801,500 |
| Median Household Income | $85,697 | $8,850 |
| Monthly Housing Costs | $728 | $9,125 |
| Real Estate Taxes | $3,319 | $195 |
Property Value by Mortgage Status in Fullerton
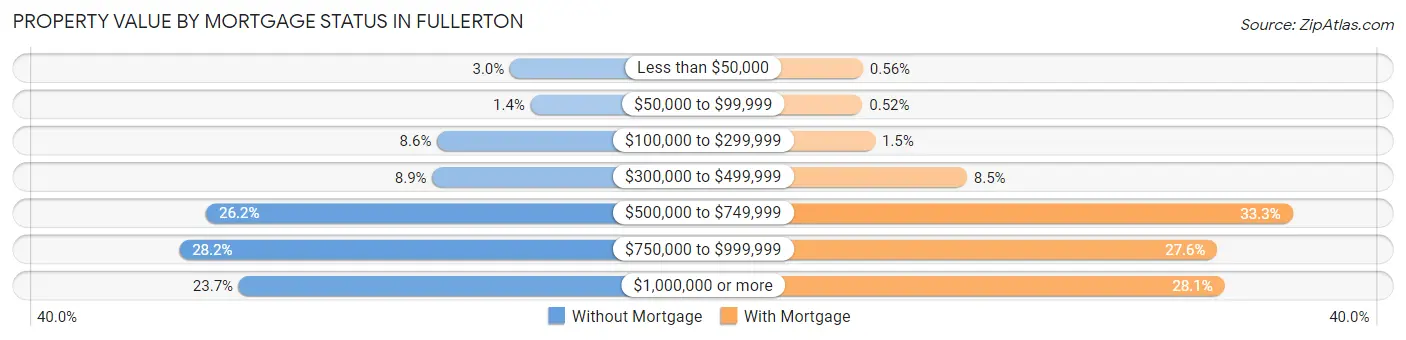
| Property Value | Without Mortgage | With Mortgage |
| Less than $50,000 | 217 (3.0%) | 96 (0.6%) |
| $50,000 to $99,999 | 104 (1.4%) | 88 (0.5%) |
| $100,000 to $299,999 | 617 (8.6%) | 252 (1.5%) |
| $300,000 to $499,999 | 643 (8.9%) | 1,447 (8.5%) |
| $500,000 to $749,999 | 1,885 (26.2%) | 5,677 (33.3%) |
| $750,000 to $999,999 | 2,033 (28.2%) | 4,701 (27.6%) |
| $1,000,000 or more | 1,705 (23.7%) | 4,794 (28.1%) |
| Total | 7,204 (100.0%) | 17,055 (100.0%) |
Household Income by Mortgage Status in Fullerton
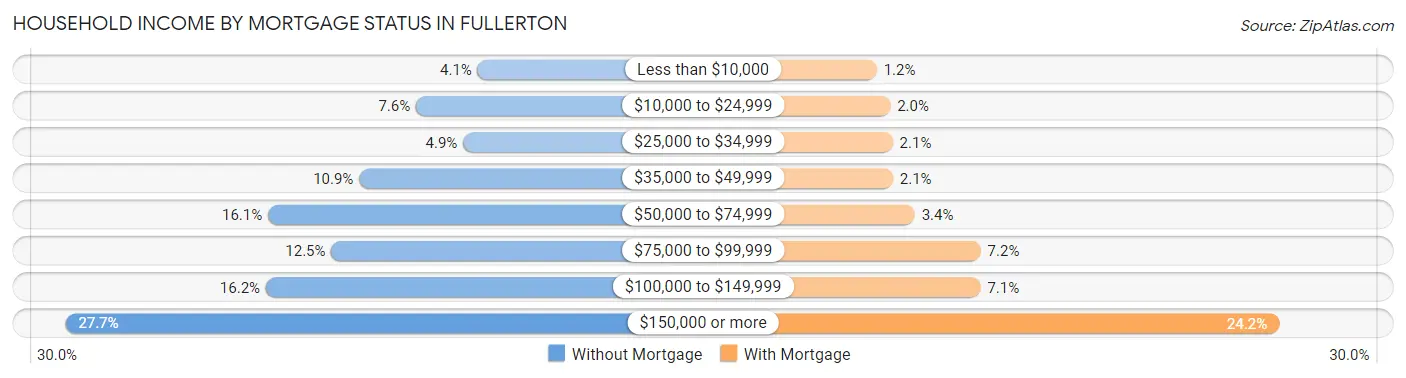
| Household Income | Without Mortgage | With Mortgage |
| Less than $10,000 | 296 (4.1%) | 206 (1.2%) |
| $10,000 to $24,999 | 550 (7.6%) | 338 (2.0%) |
| $25,000 to $34,999 | 356 (4.9%) | 362 (2.1%) |
| $35,000 to $49,999 | 784 (10.9%) | 364 (2.1%) |
| $50,000 to $74,999 | 1,159 (16.1%) | 577 (3.4%) |
| $75,000 to $99,999 | 898 (12.5%) | 1,219 (7.1%) |
| $100,000 to $149,999 | 1,168 (16.2%) | 1,217 (7.1%) |
| $150,000 or more | 1,993 (27.7%) | 4,128 (24.2%) |
| Total | 7,204 (100.0%) | 17,055 (100.0%) |
Property Value to Household Income Ratio in Fullerton
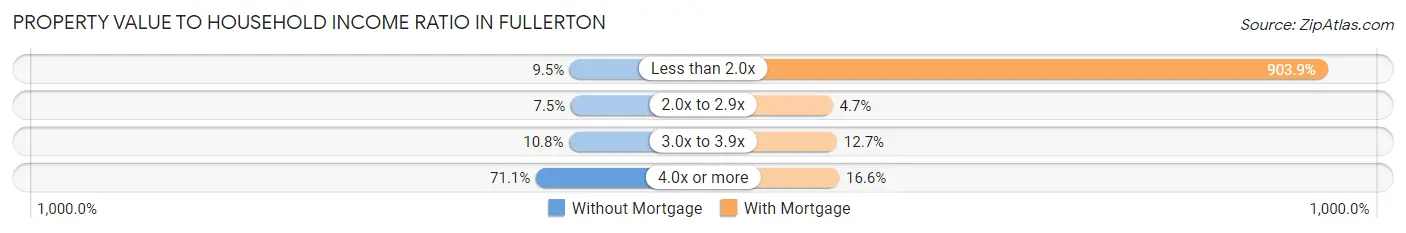
| Value-to-Income Ratio | Without Mortgage | With Mortgage |
| Less than 2.0x | 682 (9.5%) | 154,163 (903.9%) |
| 2.0x to 2.9x | 537 (7.4%) | 808 (4.7%) |
| 3.0x to 3.9x | 776 (10.8%) | 2,170 (12.7%) |
| 4.0x or more | 5,122 (71.1%) | 2,836 (16.6%) |
| Total | 7,204 (100.0%) | 17,055 (100.0%) |
Real Estate Taxes by Mortgage Status in Fullerton
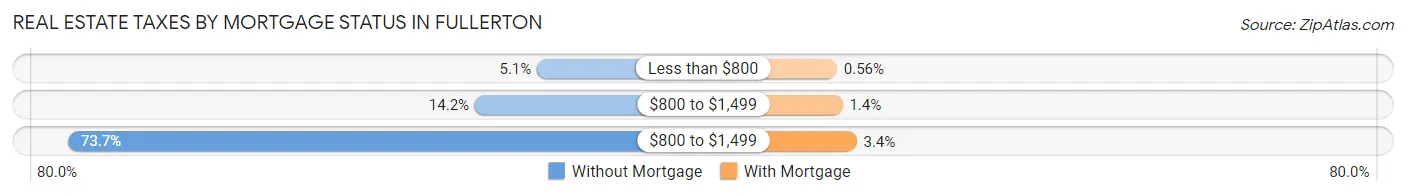
| Property Taxes | Without Mortgage | With Mortgage |
| Less than $800 | 368 (5.1%) | 95 (0.6%) |
| $800 to $1,499 | 1,023 (14.2%) | 234 (1.4%) |
| $800 to $1,499 | 5,307 (73.7%) | 585 (3.4%) |
| Total | 7,204 (100.0%) | 17,055 (100.0%) |
Health & Disability in Fullerton
Health Insurance Coverage by Age in Fullerton
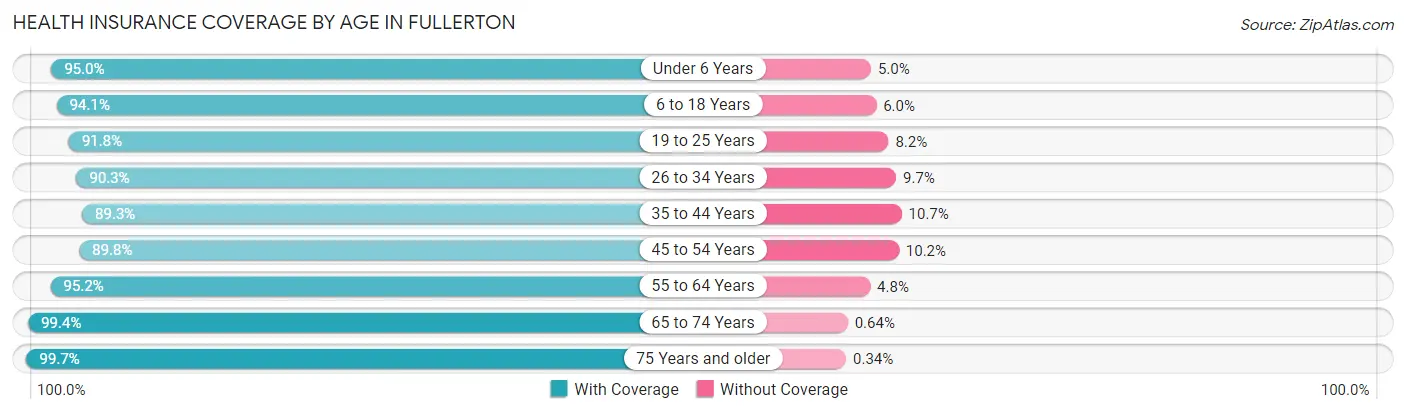
| Age Bracket | With Coverage | Without Coverage |
| Under 6 Years | 9,866 (95.0%) | 516 (5.0%) |
| 6 to 18 Years | 22,308 (94.1%) | 1,411 (5.9%) |
| 19 to 25 Years | 14,118 (91.8%) | 1,267 (8.2%) |
| 26 to 34 Years | 18,577 (90.3%) | 1,987 (9.7%) |
| 35 to 44 Years | 15,164 (89.3%) | 1,816 (10.7%) |
| 45 to 54 Years | 16,247 (89.8%) | 1,840 (10.2%) |
| 55 to 64 Years | 16,459 (95.2%) | 834 (4.8%) |
| 65 to 74 Years | 10,278 (99.4%) | 66 (0.6%) |
| 75 Years and older | 8,583 (99.7%) | 29 (0.3%) |
| Total | 131,600 (93.1%) | 9,766 (6.9%) |
Health Insurance Coverage by Citizenship Status in Fullerton
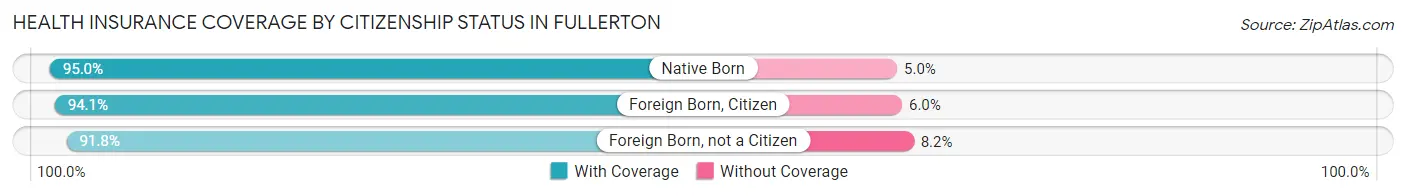
| Citizenship Status | With Coverage | Without Coverage |
| Native Born | 9,866 (95.0%) | 516 (5.0%) |
| Foreign Born, Citizen | 22,308 (94.1%) | 1,411 (5.9%) |
| Foreign Born, not a Citizen | 14,118 (91.8%) | 1,267 (8.2%) |
Health Insurance Coverage by Household Income in Fullerton
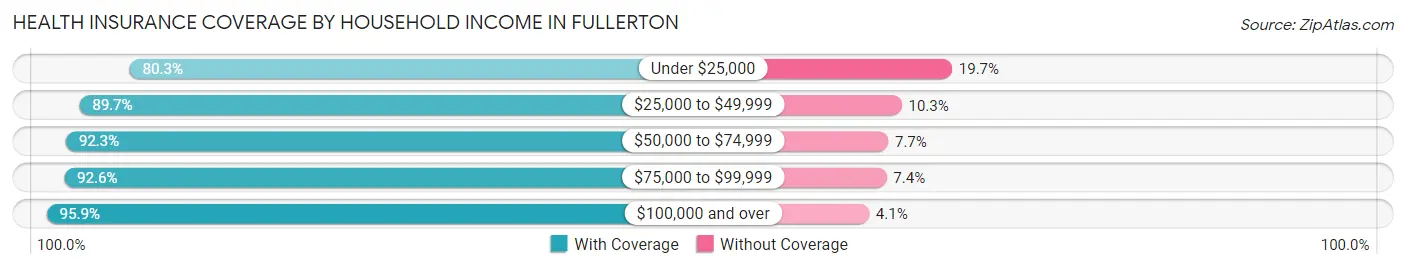
| Household Income | With Coverage | Without Coverage |
| Under $25,000 | 9,053 (80.3%) | 2,220 (19.7%) |
| $25,000 to $49,999 | 14,881 (89.7%) | 1,701 (10.3%) |
| $50,000 to $74,999 | 16,275 (92.3%) | 1,364 (7.7%) |
| $75,000 to $99,999 | 13,444 (92.6%) | 1,077 (7.4%) |
| $100,000 and over | 75,482 (95.9%) | 3,262 (4.1%) |
Public vs Private Health Insurance Coverage by Age in Fullerton
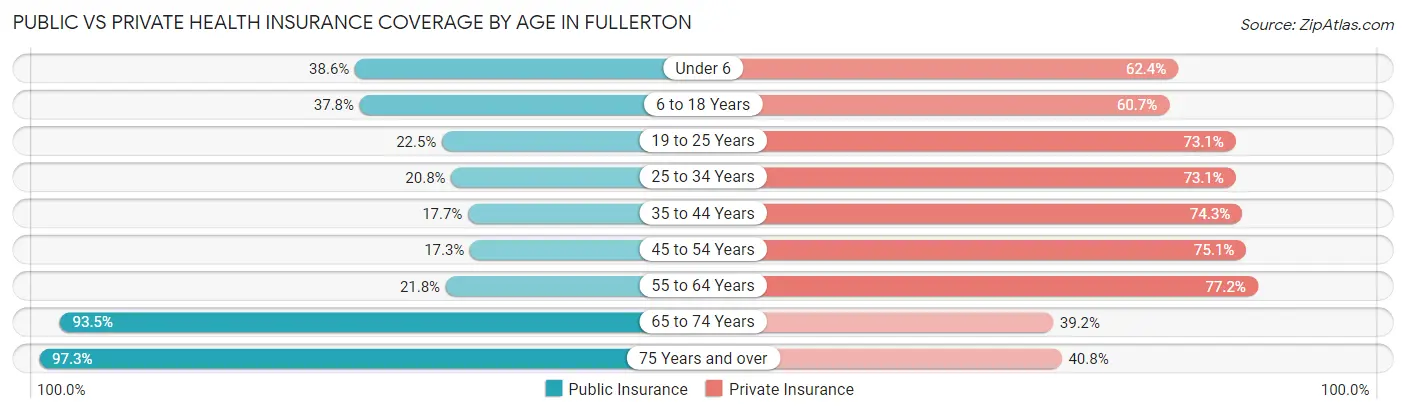
| Age Bracket | Public Insurance | Private Insurance |
| Under 6 | 4,012 (38.6%) | 6,479 (62.4%) |
| 6 to 18 Years | 8,959 (37.8%) | 14,404 (60.7%) |
| 19 to 25 Years | 3,460 (22.5%) | 11,245 (73.1%) |
| 25 to 34 Years | 4,273 (20.8%) | 15,035 (73.1%) |
| 35 to 44 Years | 2,998 (17.7%) | 12,617 (74.3%) |
| 45 to 54 Years | 3,128 (17.3%) | 13,575 (75.0%) |
| 55 to 64 Years | 3,768 (21.8%) | 13,346 (77.2%) |
| 65 to 74 Years | 9,671 (93.5%) | 4,053 (39.2%) |
| 75 Years and over | 8,379 (97.3%) | 3,512 (40.8%) |
| Total | 48,648 (34.4%) | 94,266 (66.7%) |
Disability Status by Sex by Age in Fullerton
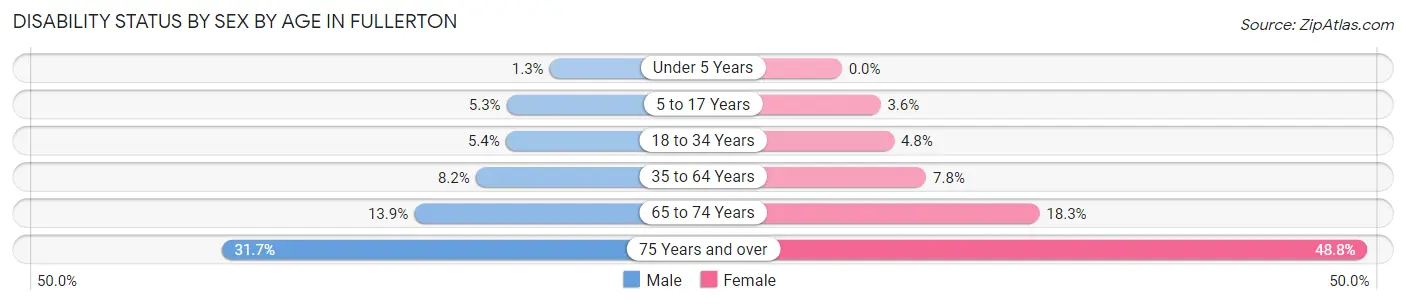
| Age Bracket | Male | Female |
| Under 5 Years | 51 (1.3%) | 0 (0.0%) |
| 5 to 17 Years | 622 (5.3%) | 405 (3.6%) |
| 18 to 34 Years | 1,010 (5.4%) | 940 (4.8%) |
| 35 to 64 Years | 2,164 (8.2%) | 2,021 (7.8%) |
| 65 to 74 Years | 687 (13.9%) | 988 (18.3%) |
| 75 Years and over | 1,149 (31.7%) | 2,434 (48.8%) |
Disability Class by Sex by Age in Fullerton
Disability Class: Hearing Difficulty
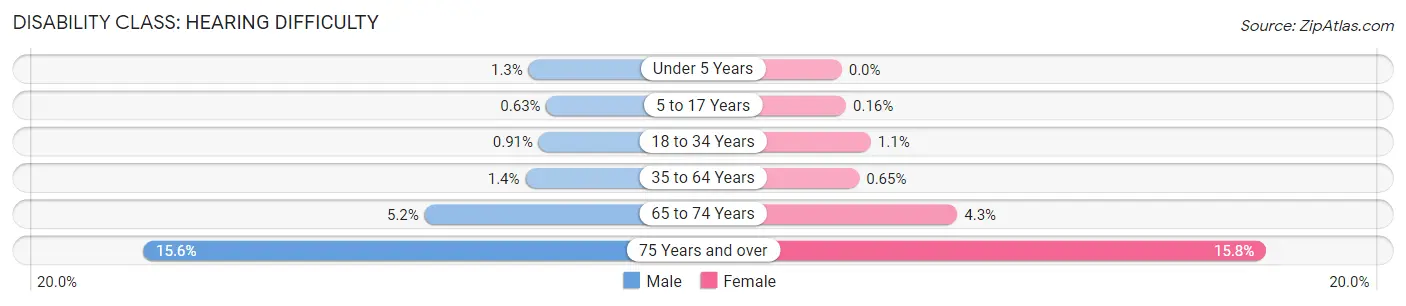
| Age Bracket | Male | Female |
| Under 5 Years | 51 (1.3%) | 0 (0.0%) |
| 5 to 17 Years | 74 (0.6%) | 18 (0.2%) |
| 18 to 34 Years | 172 (0.9%) | 210 (1.1%) |
| 35 to 64 Years | 373 (1.4%) | 167 (0.6%) |
| 65 to 74 Years | 255 (5.1%) | 231 (4.3%) |
| 75 Years and over | 565 (15.6%) | 786 (15.8%) |
Disability Class: Vision Difficulty
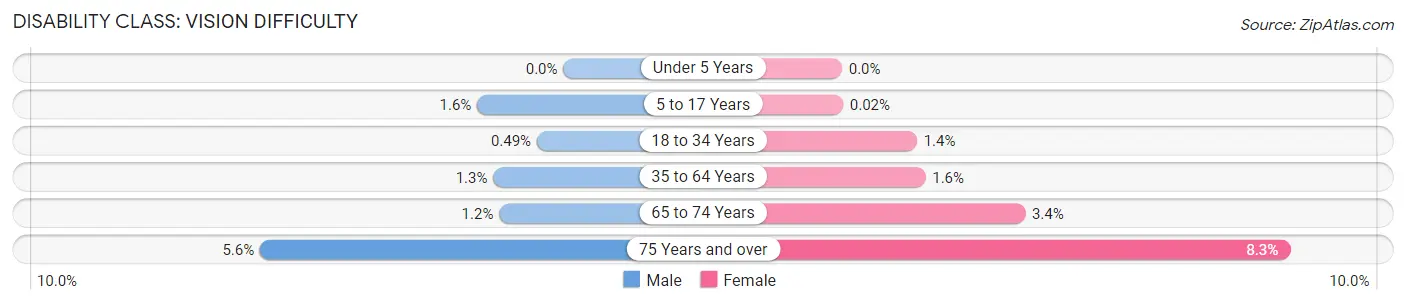
| Age Bracket | Male | Female |
| Under 5 Years | 0 (0.0%) | 0 (0.0%) |
| 5 to 17 Years | 188 (1.6%) | 2 (0.0%) |
| 18 to 34 Years | 92 (0.5%) | 269 (1.4%) |
| 35 to 64 Years | 344 (1.3%) | 399 (1.5%) |
| 65 to 74 Years | 59 (1.2%) | 183 (3.4%) |
| 75 Years and over | 204 (5.6%) | 415 (8.3%) |
Disability Class: Cognitive Difficulty
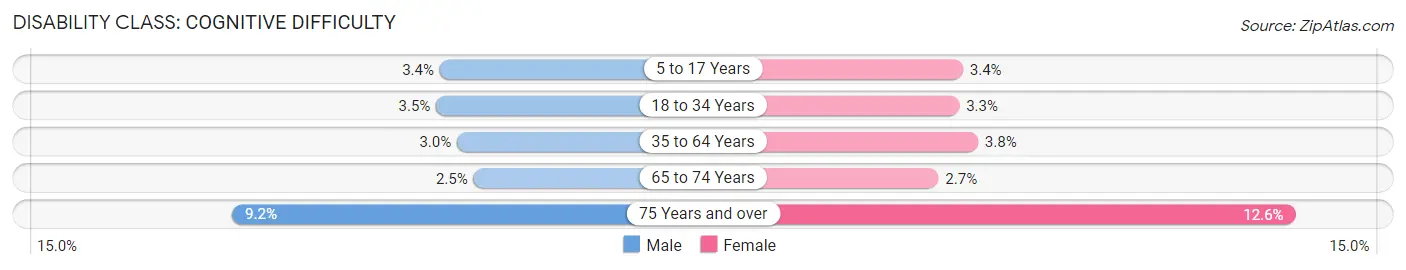
| Age Bracket | Male | Female |
| 5 to 17 Years | 405 (3.4%) | 380 (3.4%) |
| 18 to 34 Years | 667 (3.5%) | 636 (3.3%) |
| 35 to 64 Years | 785 (3.0%) | 978 (3.8%) |
| 65 to 74 Years | 124 (2.5%) | 145 (2.7%) |
| 75 Years and over | 334 (9.2%) | 630 (12.6%) |
Disability Class: Ambulatory Difficulty
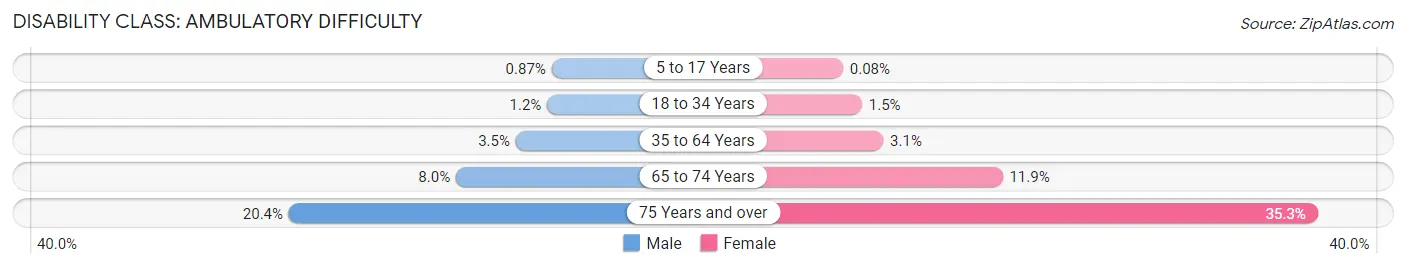
| Age Bracket | Male | Female |
| 5 to 17 Years | 102 (0.9%) | 9 (0.1%) |
| 18 to 34 Years | 226 (1.2%) | 290 (1.5%) |
| 35 to 64 Years | 936 (3.5%) | 792 (3.1%) |
| 65 to 74 Years | 395 (8.0%) | 643 (11.9%) |
| 75 Years and over | 738 (20.4%) | 1,763 (35.3%) |
Disability Class: Self-Care Difficulty
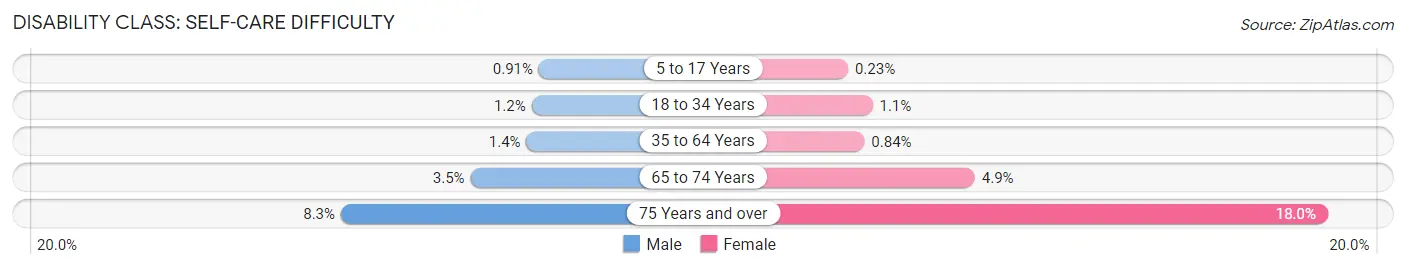
| Age Bracket | Male | Female |
| 5 to 17 Years | 107 (0.9%) | 26 (0.2%) |
| 18 to 34 Years | 222 (1.2%) | 221 (1.1%) |
| 35 to 64 Years | 364 (1.4%) | 218 (0.8%) |
| 65 to 74 Years | 171 (3.5%) | 266 (4.9%) |
| 75 Years and over | 299 (8.3%) | 900 (18.0%) |
Technology Access in Fullerton
Computing Device Access in Fullerton
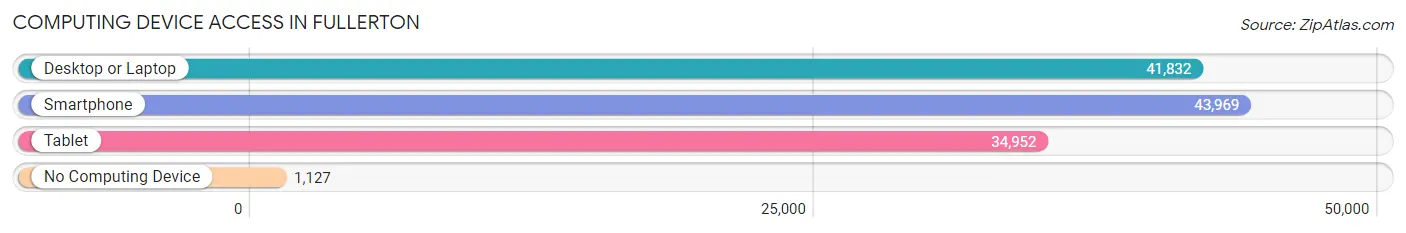
| Device Type | # Households | % Households |
| Desktop or Laptop | 41,832 | 89.0% |
| Smartphone | 43,969 | 93.5% |
| Tablet | 34,952 | 74.3% |
| No Computing Device | 1,127 | 2.4% |
| Total | 47,014 | 100.0% |
Internet Access in Fullerton
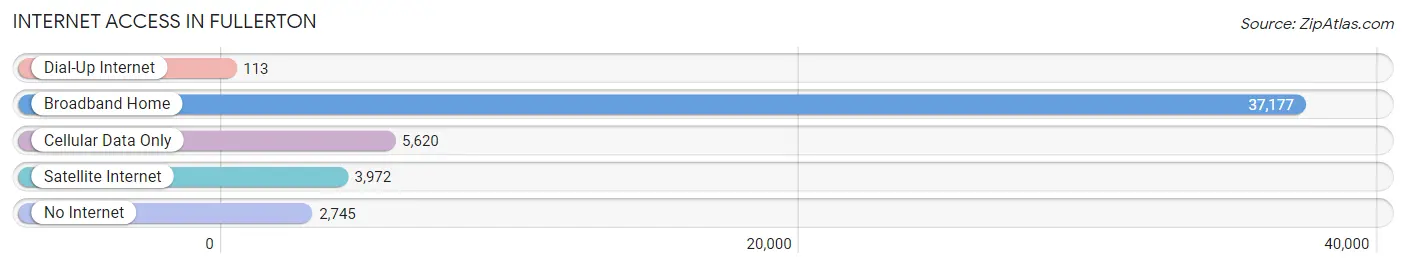
| Internet Type | # Households | % Households |
| Dial-Up Internet | 113 | 0.2% |
| Broadband Home | 37,177 | 79.1% |
| Cellular Data Only | 5,620 | 11.9% |
| Satellite Internet | 3,972 | 8.5% |
| No Internet | 2,745 | 5.8% |
| Total | 47,014 | 100.0% |
Fullerton Summary
Fullerton, California is a city located in Orange County, California. It is situated in the northern part of the county, about 25 miles southeast of Los Angeles. The city has a population of 135,161 as of the 2019 census, making it the most populous city in Orange County.
History
Fullerton was founded in 1887 by George and Edward Amerige, two brothers from Placentia, California. The brothers purchased a large tract of land from the Rancho San Juan Cajon de Santa Ana, a Mexican land grant. The brothers named the area Fullerton after George Fullerton, a former railroad official.
The city was incorporated in 1904 and quickly grew due to its proximity to Los Angeles and the Santa Fe Railroad. The city was home to a number of citrus groves and was known as the “Valley of the Orange Trees.”
In the 1920s, Fullerton was home to a number of oil fields, which helped to fuel the city’s growth. The city was also home to a number of manufacturing plants, including the Fullerton Aircraft Corporation, which produced the first all-metal aircraft in the United States.
Geography
Fullerton is located in northern Orange County, about 25 miles southeast of Los Angeles. The city is situated in the foothills of the Santa Ana Mountains and is bordered by the cities of Anaheim, Brea, Buena Park, La Habra, Placentia, and Yorba Linda.
The city has a total area of 25.2 square miles, of which 24.9 square miles is land and 0.3 square miles is water. The city is located at an elevation of about 300 feet above sea level.
Economy
Fullerton’s economy is largely driven by education, healthcare, and manufacturing. The city is home to California State University, Fullerton, which is the largest university in the area. The university has an enrollment of over 40,000 students and employs over 4,000 faculty and staff.
The city is also home to a number of healthcare facilities, including St. Jude Medical Center and the University of California, Irvine Medical Center.
Fullerton is also home to a number of manufacturing plants, including the Fullerton Aircraft Corporation, which produces aircraft components, and the Fullerton Tool Company, which produces industrial tools.
Demographics
As of the 2019 census, Fullerton had a population of 135,161. The racial makeup of the city was 57.2% White, 4.2% African American, 0.7% Native American, 24.3% Asian, 0.2% Pacific Islander, 10.2% from other races, and 3.2% from two or more races. Hispanic or Latino of any race were 25.2% of the population.
The median household income in Fullerton was $71,837, and the median family income was $83,837. The per capita income in the city was $30,945. About 11.2% of the population was below the poverty line.
Common Questions
What is Per Capita Income in Fullerton?
Per Capita income in Fullerton is $46,182.
What is the Median Family Income in Fullerton?
Median Family Income in Fullerton is $117,295.
What is the Median Household income in Fullerton?
Median Household Income in Fullerton is $99,279.
What is Income or Wage Gap in Fullerton?
Income or Wage Gap in Fullerton is 31.5%.
Women in Fullerton earn 68.5 cents for every dollar earned by a man.
What is Family Income Deficit in Fullerton?
Family Income Deficit in Fullerton is $10,613.
Families that are below poverty line in Fullerton earn $10,613 less on average than the poverty threshold level.
What is Inequality or Gini Index in Fullerton?
Inequality or Gini Index in Fullerton is 0.48.
What is the Total Population of Fullerton?
Total Population of Fullerton is 142,280.
What is the Total Male Population of Fullerton?
Total Male Population of Fullerton is 70,148.
What is the Total Female Population of Fullerton?
Total Female Population of Fullerton is 72,132.
What is the Ratio of Males per 100 Females in Fullerton?
There are 97.25 Males per 100 Females in Fullerton.
What is the Ratio of Females per 100 Males in Fullerton?
There are 102.83 Females per 100 Males in Fullerton.
What is the Median Population Age in Fullerton?
Median Population Age in Fullerton is 35.5 Years.
What is the Average Family Size in Fullerton
Average Family Size in Fullerton is 3.5 People.
What is the Average Household Size in Fullerton
Average Household Size in Fullerton is 3.0 People.
How Large is the Labor Force in Fullerton?
There are 74,377 People in the Labor Forcein in Fullerton.
What is the Percentage of People in the Labor Force in Fullerton?
65.4% of People are in the Labor Force in Fullerton.
What is the Unemployment Rate in Fullerton?
Unemployment Rate in Fullerton is 6.9%.