Columbus, GA Map & Demographics
Columbus Map
Columbus Overview
$30,980
PER CAPITA INCOME
$69,623
AVG FAMILY INCOME
$54,561
AVG HOUSEHOLD INCOME
27.9%
WAGE / INCOME GAP [ % ]
72.1¢/ $1
WAGE / INCOME GAP [ $ ]
$11,626
FAMILY INCOME DEFICIT
0.48
INEQUALITY / GINI INDEX
204,572
TOTAL POPULATION
98,973
MALE POPULATION
105,599
FEMALE POPULATION
93.73
MALES / 100 FEMALES
106.69
FEMALES / 100 MALES
34.9
MEDIAN AGE
3.2
AVG FAMILY SIZE
2.5
AVG HOUSEHOLD SIZE
96,514
LABOR FORCE [ PEOPLE ]
60.7%
PERCENT IN LABOR FORCE
7.3%
UNEMPLOYMENT RATE
Income in Columbus
Income Overview in Columbus
Per Capita Income in Columbus is $30,980, while median incomes of families and households are $69,623 and $54,561 respectively.
| Characteristic | Number | Measure |
| Per Capita Income | 204,572 | $30,980 |
| Median Family Income | 48,417 | $69,623 |
| Mean Family Income | 48,417 | $90,972 |
| Median Household Income | 79,856 | $54,561 |
| Mean Household Income | 79,856 | $75,620 |
| Income Deficit | 48,417 | $11,626 |
| Wage / Income Gap (%) | 204,572 | 27.85% |
| Wage / Income Gap ($) | 204,572 | 72.15¢ per $1 |
| Gini / Inequality Index | 204,572 | 0.48 |
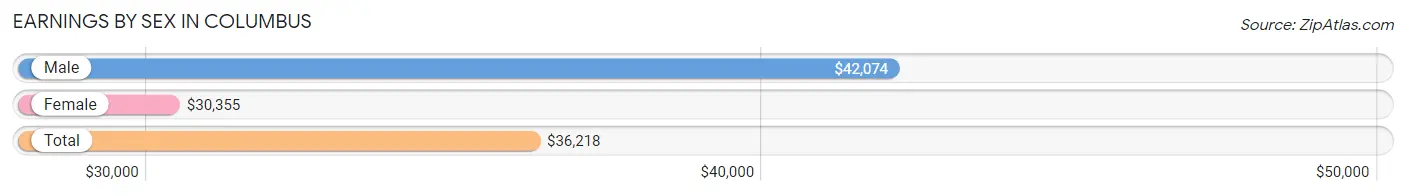
Earnings by Sex in Columbus
Average Earnings in Columbus are $36,218, $42,074 for men and $30,355 for women, a difference of 27.9%.
| Sex | Number | Average Earnings |
| Male | 49,728 (50.4%) | $42,074 |
| Female | 48,926 (49.6%) | $30,355 |
| Total | 98,654 (100.0%) | $36,218 |
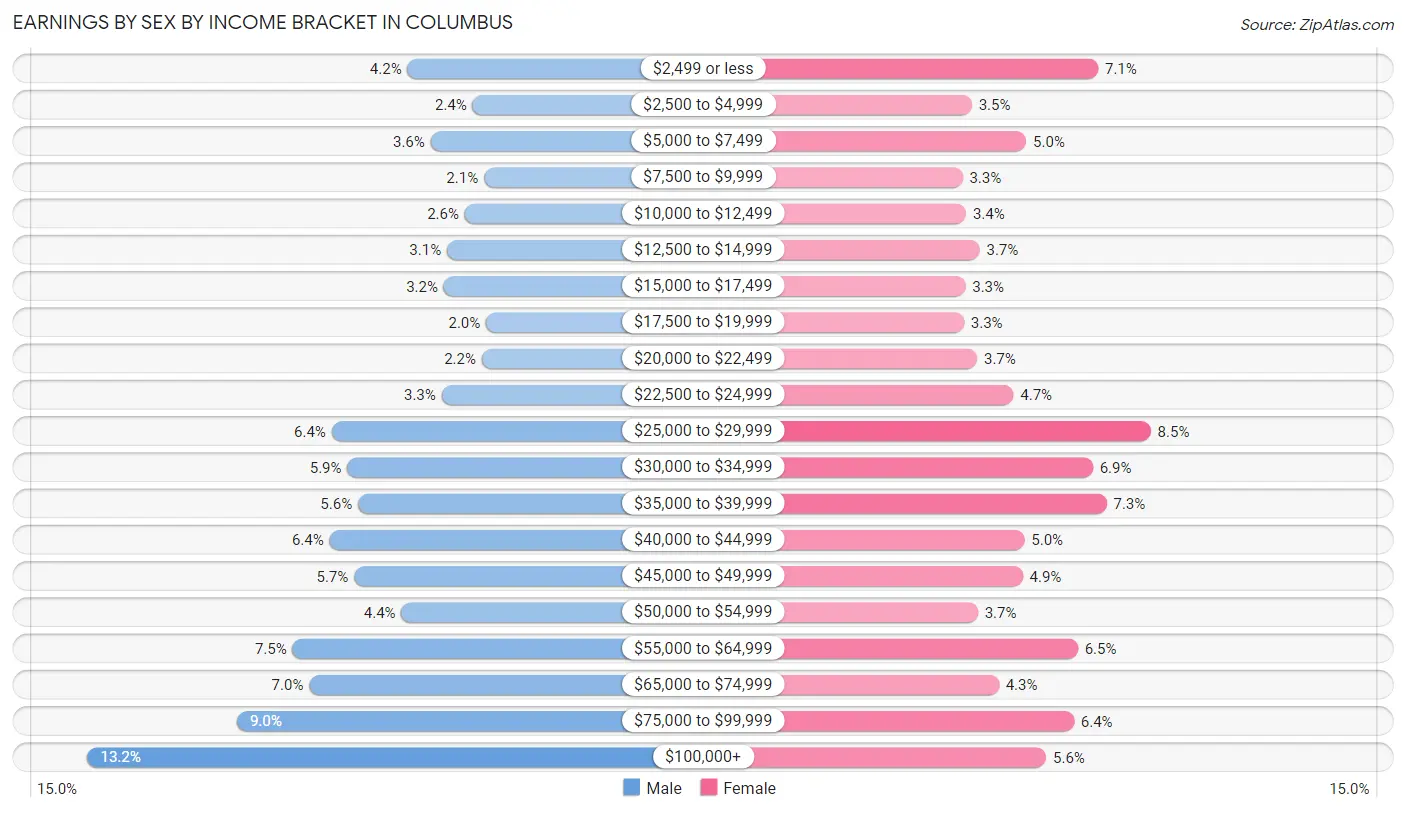
Earnings by Sex by Income Bracket in Columbus
The most common earnings brackets in Columbus are $100,000+ for men (6,581 | 13.2%) and $25,000 to $29,999 for women (4,177 | 8.5%).
| Income | Male | Female |
| $2,499 or less | 2,107 (4.2%) | 3,455 (7.1%) |
| $2,500 to $4,999 | 1,199 (2.4%) | 1,715 (3.5%) |
| $5,000 to $7,499 | 1,783 (3.6%) | 2,464 (5.0%) |
| $7,500 to $9,999 | 1,040 (2.1%) | 1,589 (3.3%) |
| $10,000 to $12,499 | 1,307 (2.6%) | 1,641 (3.4%) |
| $12,500 to $14,999 | 1,555 (3.1%) | 1,827 (3.7%) |
| $15,000 to $17,499 | 1,601 (3.2%) | 1,627 (3.3%) |
| $17,500 to $19,999 | 1,009 (2.0%) | 1,609 (3.3%) |
| $20,000 to $22,499 | 1,068 (2.1%) | 1,789 (3.7%) |
| $22,500 to $24,999 | 1,629 (3.3%) | 2,291 (4.7%) |
| $25,000 to $29,999 | 3,170 (6.4%) | 4,177 (8.5%) |
| $30,000 to $34,999 | 2,951 (5.9%) | 3,382 (6.9%) |
| $35,000 to $39,999 | 2,799 (5.6%) | 3,574 (7.3%) |
| $40,000 to $44,999 | 3,198 (6.4%) | 2,439 (5.0%) |
| $45,000 to $49,999 | 2,853 (5.7%) | 2,416 (4.9%) |
| $50,000 to $54,999 | 2,193 (4.4%) | 1,802 (3.7%) |
| $55,000 to $64,999 | 3,714 (7.5%) | 3,176 (6.5%) |
| $65,000 to $74,999 | 3,481 (7.0%) | 2,089 (4.3%) |
| $75,000 to $99,999 | 4,490 (9.0%) | 3,123 (6.4%) |
| $100,000+ | 6,581 (13.2%) | 2,741 (5.6%) |
| Total | 49,728 (100.0%) | 48,926 (100.0%) |
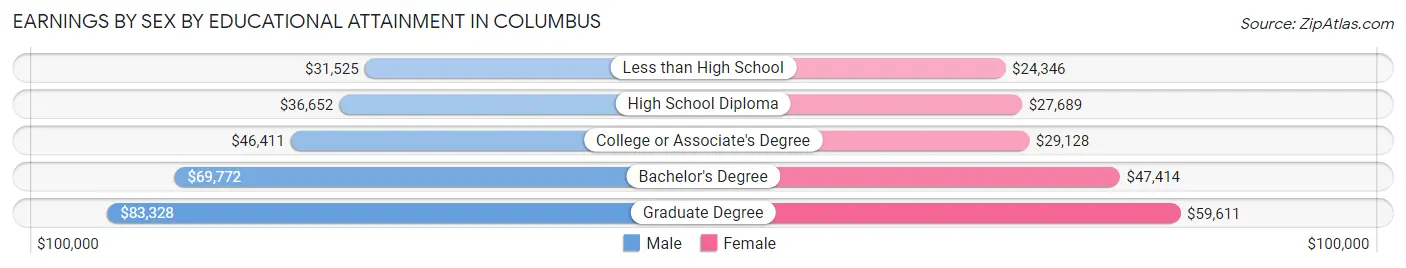
Earnings by Sex by Educational Attainment in Columbus
Average earnings in Columbus are $46,844 for men and $34,949 for women, a difference of 25.4%. Men with an educational attainment of graduate degree enjoy the highest average annual earnings of $83,328, while those with less than high school education earn the least with $31,525. Women with an educational attainment of graduate degree earn the most with the average annual earnings of $59,611, while those with less than high school education have the smallest earnings of $24,346.
| Educational Attainment | Male Income | Female Income |
| Less than High School | $31,525 | $24,346 |
| High School Diploma | $36,652 | $27,689 |
| College or Associate's Degree | $46,411 | $29,128 |
| Bachelor's Degree | $69,772 | $47,414 |
| Graduate Degree | $83,328 | $59,611 |
| Total | $46,844 | $34,949 |
Family Income in Columbus
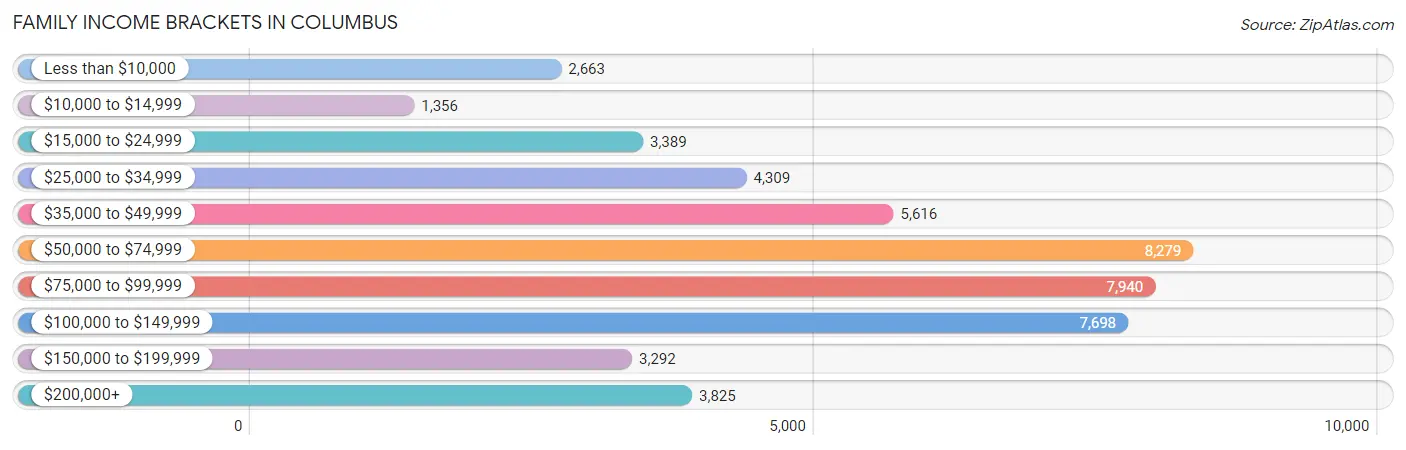
Family Income Brackets in Columbus
According to the Columbus family income data, there are 8,279 families falling into the $50,000 to $74,999 income range, which is the most common income bracket and makes up 17.1% of all families. Conversely, the $10,000 to $14,999 income bracket is the least frequent group with only 1,356 families (2.8%) belonging to this category.
| Income Bracket | # Families | % Families |
| Less than $10,000 | 2,663 | 5.5% |
| $10,000 to $14,999 | 1,356 | 2.8% |
| $15,000 to $24,999 | 3,389 | 7.0% |
| $25,000 to $34,999 | 4,309 | 8.9% |
| $35,000 to $49,999 | 5,616 | 11.6% |
| $50,000 to $74,999 | 8,279 | 17.1% |
| $75,000 to $99,999 | 7,940 | 16.4% |
| $100,000 to $149,999 | 7,698 | 15.9% |
| $150,000 to $199,999 | 3,292 | 6.8% |
| $200,000+ | 3,825 | 7.9% |
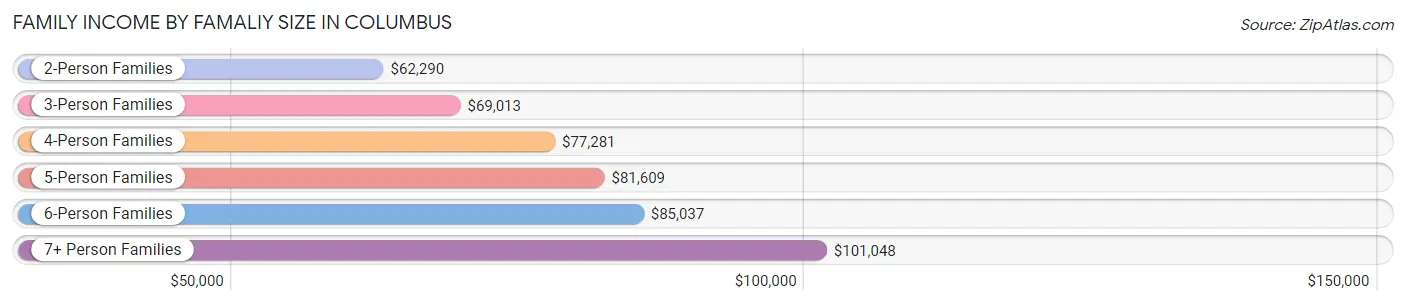
Family Income by Famaliy Size in Columbus
7+ person families (746 | 1.5%) account for the highest median family income in Columbus with $101,048 per family, while 2-person families (22,503 | 46.5%) have the highest median income of $31,145 per family member.
| Income Bracket | # Families | Median Income |
| 2-Person Families | 22,503 (46.5%) | $62,290 |
| 3-Person Families | 12,147 (25.1%) | $69,013 |
| 4-Person Families | 7,902 (16.3%) | $77,281 |
| 5-Person Families | 3,642 (7.5%) | $81,609 |
| 6-Person Families | 1,477 (3.0%) | $85,037 |
| 7+ Person Families | 746 (1.5%) | $101,048 |
| Total | 48,417 (100.0%) | $69,623 |
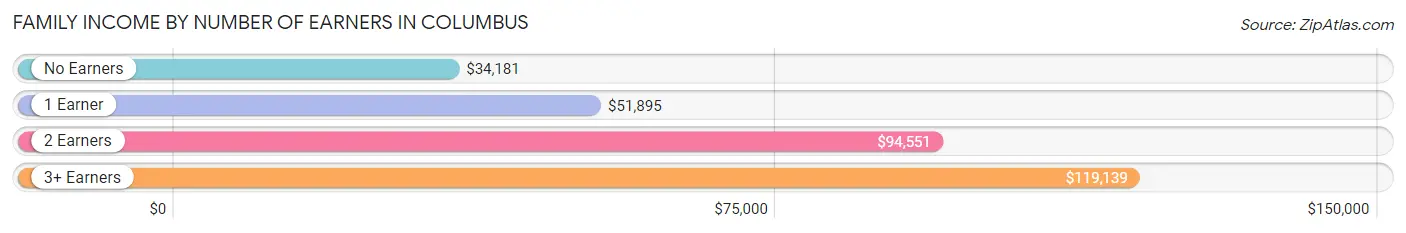
Family Income by Number of Earners in Columbus
The median family income in Columbus is $69,623, with families comprising 3+ earners (3,667) having the highest median family income of $119,139, while families with no earners (7,665) have the lowest median family income of $34,181, accounting for 7.6% and 15.8% of families, respectively.
| Number of Earners | # Families | Median Income |
| No Earners | 7,665 (15.8%) | $34,181 |
| 1 Earner | 19,733 (40.8%) | $51,895 |
| 2 Earners | 17,352 (35.8%) | $94,551 |
| 3+ Earners | 3,667 (7.6%) | $119,139 |
| Total | 48,417 (100.0%) | $69,623 |
Household Income in Columbus
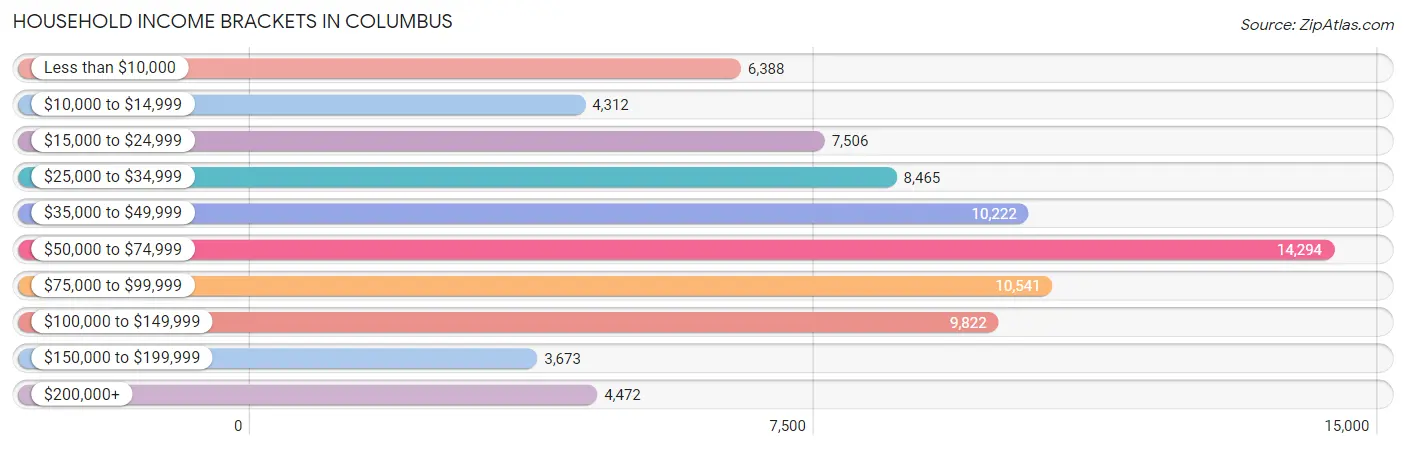
Household Income Brackets in Columbus
With 14,294 households falling in the category, the $50,000 to $74,999 income range is the most frequent in Columbus, accounting for 17.9% of all households. In contrast, only 3,673 households (4.6%) fall into the $150,000 to $199,999 income bracket, making it the least populous group.
| Income Bracket | # Households | % Households |
| Less than $10,000 | 6,388 | 8.0% |
| $10,000 to $14,999 | 4,312 | 5.4% |
| $15,000 to $24,999 | 7,506 | 9.4% |
| $25,000 to $34,999 | 8,465 | 10.6% |
| $35,000 to $49,999 | 10,222 | 12.8% |
| $50,000 to $74,999 | 14,294 | 17.9% |
| $75,000 to $99,999 | 10,541 | 13.2% |
| $100,000 to $149,999 | 9,822 | 12.3% |
| $150,000 to $199,999 | 3,673 | 4.6% |
| $200,000+ | 4,472 | 5.6% |
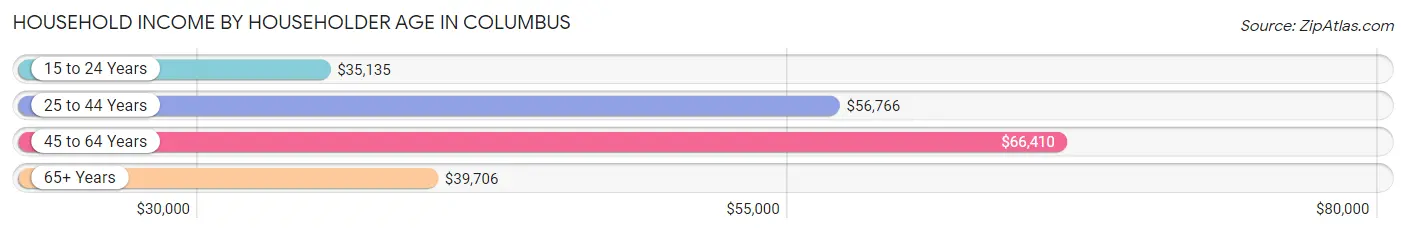
Household Income by Householder Age in Columbus
The median household income in Columbus is $54,561, with the highest median household income of $66,410 found in the 45 to 64 years age bracket for the primary householder. A total of 27,004 households (33.8%) fall into this category. Meanwhile, the 15 to 24 years age bracket for the primary householder has the lowest median household income of $35,135, with 3,328 households (4.2%) in this group.
| Income Bracket | # Households | Median Income |
| 15 to 24 Years | 3,328 (4.2%) | $35,135 |
| 25 to 44 Years | 30,424 (38.1%) | $56,766 |
| 45 to 64 Years | 27,004 (33.8%) | $66,410 |
| 65+ Years | 19,100 (23.9%) | $39,706 |
| Total | 79,856 (100.0%) | $54,561 |
Poverty in Columbus
Income Below Poverty by Sex and Age in Columbus
With 17.7% poverty level for males and 19.6% for females among the residents of Columbus, under 5 year old males and under 5 year old females are the most vulnerable to poverty, with 2,149 males (30.6%) and 2,252 females (32.7%) in their respective age groups living below the poverty level.
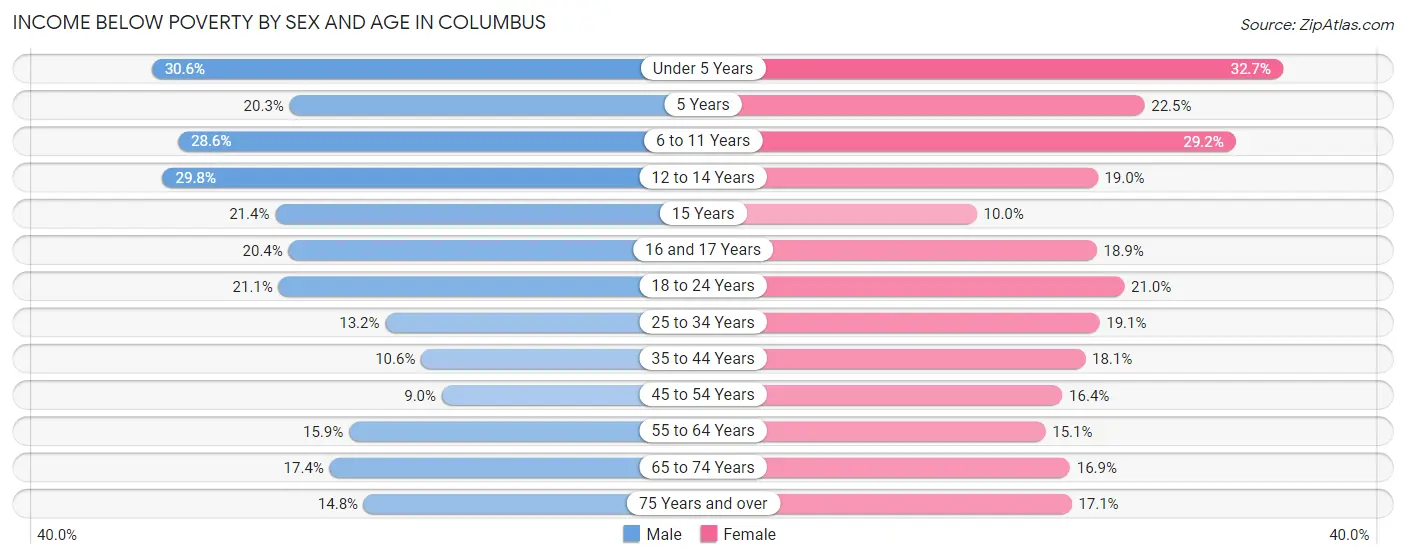
| Age Bracket | Male | Female |
| Under 5 Years | 2,149 (30.6%) | 2,252 (32.7%) |
| 5 Years | 360 (20.3%) | 294 (22.5%) |
| 6 to 11 Years | 2,483 (28.6%) | 2,437 (29.2%) |
| 12 to 14 Years | 1,230 (29.7%) | 768 (19.0%) |
| 15 Years | 357 (21.4%) | 114 (10.0%) |
| 16 and 17 Years | 497 (20.4%) | 515 (18.9%) |
| 18 to 24 Years | 1,767 (21.1%) | 1,849 (21.0%) |
| 25 to 34 Years | 2,033 (13.2%) | 3,077 (19.1%) |
| 35 to 44 Years | 1,313 (10.5%) | 2,474 (18.1%) |
| 45 to 54 Years | 967 (9.0%) | 1,953 (16.4%) |
| 55 to 64 Years | 1,725 (15.9%) | 1,871 (15.1%) |
| 65 to 74 Years | 1,284 (17.3%) | 1,584 (16.9%) |
| 75 Years and over | 612 (14.8%) | 1,239 (17.1%) |
| Total | 16,777 (17.7%) | 20,427 (19.6%) |
Income Above Poverty by Sex and Age in Columbus
According to the poverty statistics in Columbus, males aged 45 to 54 years and females aged 15 years are the age groups that are most secure financially, with 91.0% of males and 90.0% of females in these age groups living above the poverty line.
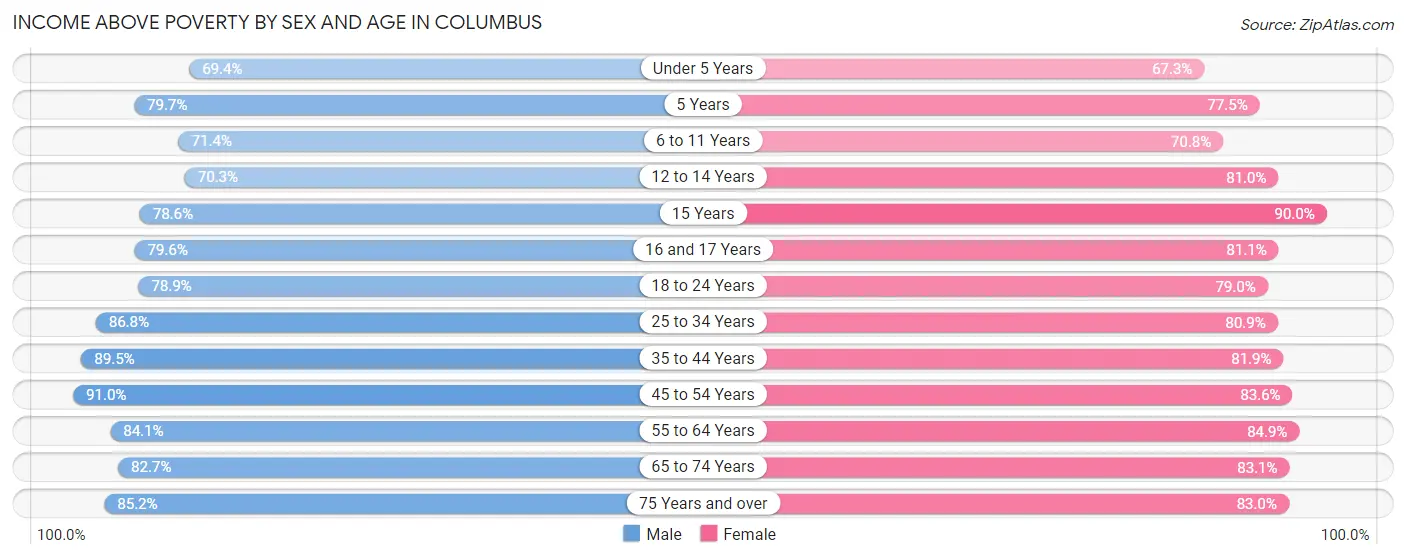
| Age Bracket | Male | Female |
| Under 5 Years | 4,882 (69.4%) | 4,627 (67.3%) |
| 5 Years | 1,412 (79.7%) | 1,015 (77.5%) |
| 6 to 11 Years | 6,198 (71.4%) | 5,900 (70.8%) |
| 12 to 14 Years | 2,904 (70.3%) | 3,278 (81.0%) |
| 15 Years | 1,312 (78.6%) | 1,025 (90.0%) |
| 16 and 17 Years | 1,939 (79.6%) | 2,207 (81.1%) |
| 18 to 24 Years | 6,590 (78.9%) | 6,972 (79.0%) |
| 25 to 34 Years | 13,351 (86.8%) | 13,020 (80.9%) |
| 35 to 44 Years | 11,134 (89.4%) | 11,227 (81.9%) |
| 45 to 54 Years | 9,757 (91.0%) | 9,986 (83.6%) |
| 55 to 64 Years | 9,118 (84.1%) | 10,514 (84.9%) |
| 65 to 74 Years | 6,115 (82.7%) | 7,774 (83.1%) |
| 75 Years and over | 3,521 (85.2%) | 6,027 (83.0%) |
| Total | 78,233 (82.3%) | 83,572 (80.4%) |
Income Below Poverty Among Married-Couple Families in Columbus
The poverty statistics for married-couple families in Columbus show that 6.6% or 1,885 of the total 28,647 families live below the poverty line. Families with 3 or 4 children have the highest poverty rate of 12.1%, comprising of 264 families. On the other hand, families with no children have the lowest poverty rate of 5.8%, which includes 954 families.
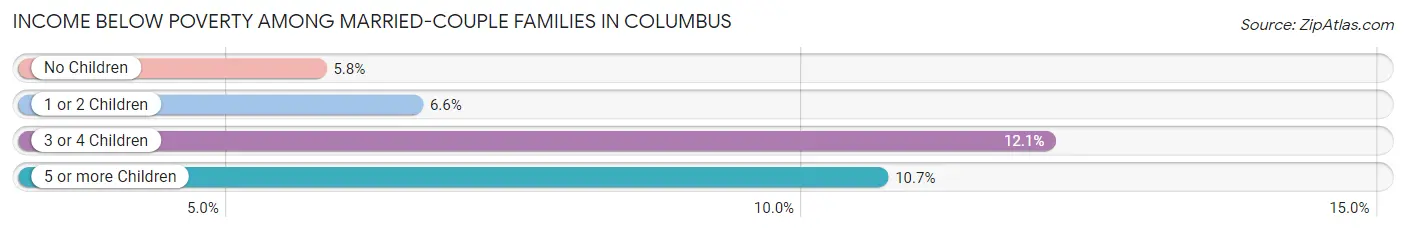
| Children | Above Poverty | Below Poverty |
| No Children | 15,590 (94.2%) | 954 (5.8%) |
| 1 or 2 Children | 9,014 (93.4%) | 638 (6.6%) |
| 3 or 4 Children | 1,915 (87.9%) | 264 (12.1%) |
| 5 or more Children | 243 (89.3%) | 29 (10.7%) |
| Total | 26,762 (93.4%) | 1,885 (6.6%) |
Income Below Poverty Among Single-Parent Households in Columbus
According to the poverty data in Columbus, 17.9% or 670 single-father households and 28.3% or 4,541 single-mother households are living below the poverty line. Among single-father households, those with 5 or more children have the highest poverty rate, with 9 households (100.0%) experiencing poverty. Likewise, among single-mother households, those with 5 or more children have the highest poverty rate, with 124 households (75.1%) falling below the poverty line.
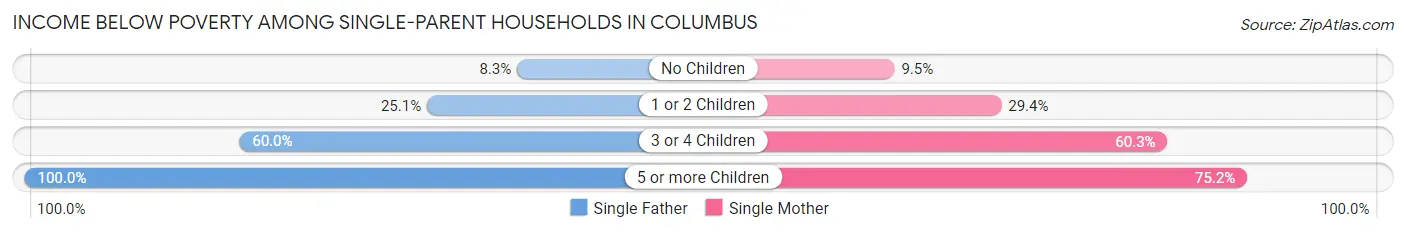
| Children | Single Father | Single Mother |
| No Children | 148 (8.3%) | 479 (9.5%) |
| 1 or 2 Children | 465 (25.1%) | 2,448 (29.4%) |
| 3 or 4 Children | 48 (60.0%) | 1,490 (60.3%) |
| 5 or more Children | 9 (100.0%) | 124 (75.1%) |
| Total | 670 (17.9%) | 4,541 (28.3%) |
Income Below Poverty Among Married-Couple vs Single-Parent Households in Columbus
The poverty data for Columbus shows that 1,885 of the married-couple family households (6.6%) and 5,211 of the single-parent households (26.4%) are living below the poverty level. Within the married-couple family households, those with 3 or 4 children have the highest poverty rate, with 264 households (12.1%) falling below the poverty line. Among the single-parent households, those with 5 or more children have the highest poverty rate, with 133 household (76.4%) living below poverty.
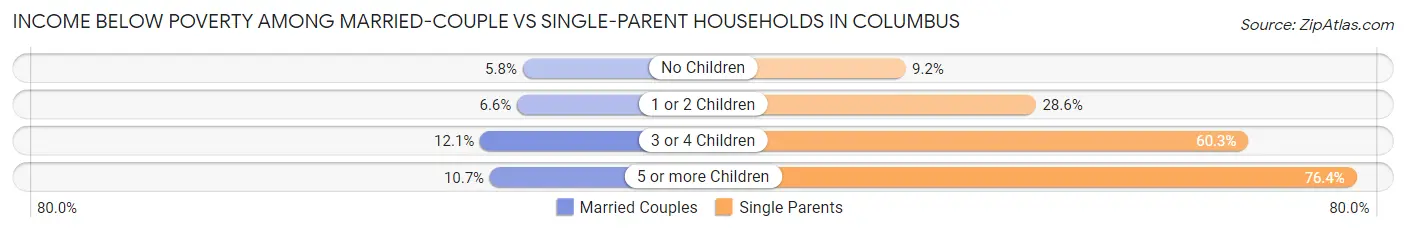
| Children | Married-Couple Families | Single-Parent Households |
| No Children | 954 (5.8%) | 627 (9.1%) |
| 1 or 2 Children | 638 (6.6%) | 2,913 (28.6%) |
| 3 or 4 Children | 264 (12.1%) | 1,538 (60.3%) |
| 5 or more Children | 29 (10.7%) | 133 (76.4%) |
| Total | 1,885 (6.6%) | 5,211 (26.4%) |
Race in Columbus
The most populous races in Columbus are Black / African American (95,323 | 46.6%), White / Caucasian (83,003 | 40.6%), and Hispanic or Latino (16,356 | 8.0%).
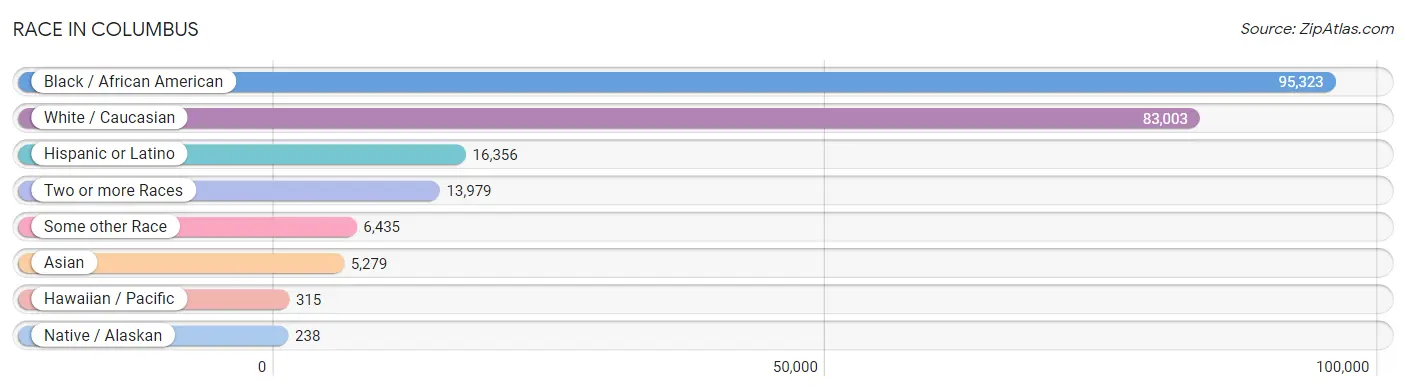
| Race | # Population | % Population |
| Asian | 5,279 | 2.6% |
| Black / African American | 95,323 | 46.6% |
| Hawaiian / Pacific | 315 | 0.2% |
| Hispanic or Latino | 16,356 | 8.0% |
| Native / Alaskan | 238 | 0.1% |
| White / Caucasian | 83,003 | 40.6% |
| Two or more Races | 13,979 | 6.8% |
| Some other Race | 6,435 | 3.2% |
| Total | 204,572 | 100.0% |
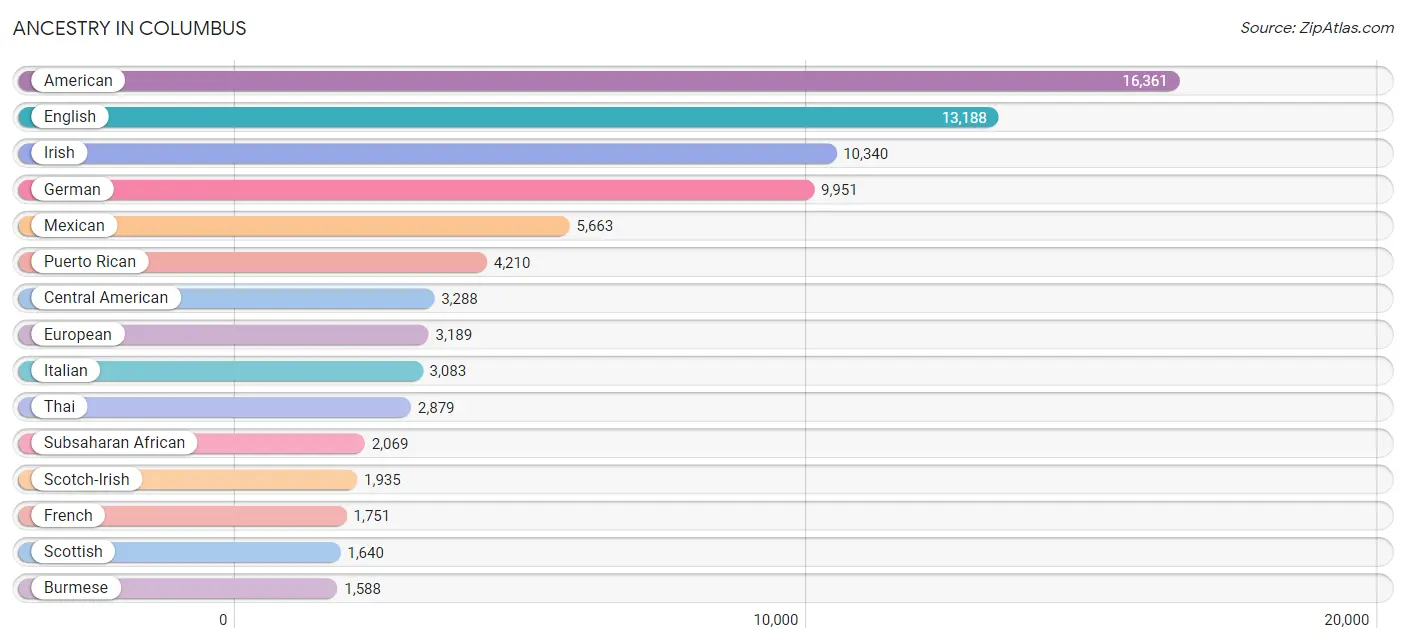
Ancestry in Columbus
The most populous ancestries reported in Columbus are American (16,361 | 8.0%), English (13,188 | 6.5%), Irish (10,340 | 5.1%), German (9,951 | 4.9%), and Mexican (5,663 | 2.8%), together accounting for 27.1% of all Columbus residents.
| Ancestry | # Population | % Population |
| African | 1,448 | 0.7% |
| Alaska Native | 6 | 0.0% |
| Albanian | 21 | 0.0% |
| American | 16,361 | 8.0% |
| Apache | 7 | 0.0% |
| Arab | 251 | 0.1% |
| Armenian | 18 | 0.0% |
| Assyrian / Chaldean / Syriac | 2 | 0.0% |
| Austrian | 179 | 0.1% |
| Barbadian | 26 | 0.0% |
| Belgian | 48 | 0.0% |
| Belizean | 18 | 0.0% |
| Bermudan | 12 | 0.0% |
| Bhutanese | 526 | 0.3% |
| Blackfeet | 311 | 0.2% |
| Bolivian | 1 | 0.0% |
| Brazilian | 418 | 0.2% |
| British | 950 | 0.5% |
| British West Indian | 29 | 0.0% |
| Burmese | 1,588 | 0.8% |
| Cajun | 146 | 0.1% |
| Cambodian | 10 | 0.0% |
| Canadian | 49 | 0.0% |
| Cape Verdean | 36 | 0.0% |
| Celtic | 8 | 0.0% |
| Central American | 3,288 | 1.6% |
| Central American Indian | 70 | 0.0% |
| Cherokee | 770 | 0.4% |
| Chilean | 15 | 0.0% |
| Chippewa | 30 | 0.0% |
| Choctaw | 2 | 0.0% |
| Colombian | 807 | 0.4% |
| Comanche | 16 | 0.0% |
| Costa Rican | 69 | 0.0% |
| Creek | 130 | 0.1% |
| Croatian | 7 | 0.0% |
| Crow | 10 | 0.0% |
| Cuban | 644 | 0.3% |
| Czech | 179 | 0.1% |
| Czechoslovakian | 48 | 0.0% |
| Danish | 71 | 0.0% |
| Dominican | 684 | 0.3% |
| Dutch | 1,045 | 0.5% |
| Eastern European | 212 | 0.1% |
| Ecuadorian | 108 | 0.1% |
| English | 13,188 | 6.5% |
| Ethiopian | 15 | 0.0% |
| European | 3,189 | 1.6% |
| Filipino | 61 | 0.0% |
| Finnish | 104 | 0.1% |
| French | 1,751 | 0.9% |
| French Canadian | 507 | 0.3% |
| German | 9,951 | 4.9% |
| German Russian | 15 | 0.0% |
| Ghanaian | 31 | 0.0% |
| Greek | 206 | 0.1% |
| Guamanian / Chamorro | 232 | 0.1% |
| Guatemalan | 983 | 0.5% |
| Guyanese | 529 | 0.3% |
| Haitian | 435 | 0.2% |
| Honduran | 554 | 0.3% |
| Hungarian | 317 | 0.2% |
| Indian (Asian) | 348 | 0.2% |
| Indonesian | 38 | 0.0% |
| Inupiat | 184 | 0.1% |
| Iranian | 35 | 0.0% |
| Irish | 10,340 | 5.1% |
| Iroquois | 13 | 0.0% |
| Italian | 3,083 | 1.5% |
| Jamaican | 556 | 0.3% |
| Korean | 1,521 | 0.7% |
| Latvian | 17 | 0.0% |
| Lebanese | 55 | 0.0% |
| Lithuanian | 46 | 0.0% |
| Luxembourger | 11 | 0.0% |
| Macedonian | 21 | 0.0% |
| Malaysian | 55 | 0.0% |
| Mexican | 5,663 | 2.8% |
| Mexican American Indian | 69 | 0.0% |
| Mongolian | 15 | 0.0% |
| Moroccan | 1 | 0.0% |
| Native Hawaiian | 302 | 0.2% |
| Navajo | 26 | 0.0% |
| Nicaraguan | 481 | 0.2% |
| Nigerian | 197 | 0.1% |
| Northern European | 143 | 0.1% |
| Norwegian | 627 | 0.3% |
| Pakistani | 280 | 0.1% |
| Panamanian | 849 | 0.4% |
| Pennsylvania German | 6 | 0.0% |
| Peruvian | 6 | 0.0% |
| Polish | 1,454 | 0.7% |
| Portuguese | 210 | 0.1% |
| Pueblo | 34 | 0.0% |
| Puerto Rican | 4,210 | 2.1% |
| Romanian | 100 | 0.1% |
| Russian | 313 | 0.2% |
| Salvadoran | 352 | 0.2% |
| Samoan | 211 | 0.1% |
| Scandinavian | 331 | 0.2% |
| Scotch-Irish | 1,935 | 0.9% |
| Scottish | 1,640 | 0.8% |
| Seminole | 56 | 0.0% |
| Serbian | 27 | 0.0% |
| Sioux | 45 | 0.0% |
| Slavic | 50 | 0.0% |
| Slovak | 59 | 0.0% |
| South African | 81 | 0.0% |
| South American | 946 | 0.5% |
| Spaniard | 56 | 0.0% |
| Spanish | 137 | 0.1% |
| Spanish American | 71 | 0.0% |
| Sri Lankan | 494 | 0.2% |
| Subsaharan African | 2,069 | 1.0% |
| Swedish | 322 | 0.2% |
| Swiss | 110 | 0.1% |
| Syrian | 184 | 0.1% |
| Thai | 2,879 | 1.4% |
| Trinidadian and Tobagonian | 84 | 0.0% |
| Turkish | 3 | 0.0% |
| U.S. Virgin Islander | 9 | 0.0% |
| Ukrainian | 17 | 0.0% |
| Venezuelan | 9 | 0.0% |
| Welsh | 468 | 0.2% |
| West Indian | 262 | 0.1% | View All 125 Rows |
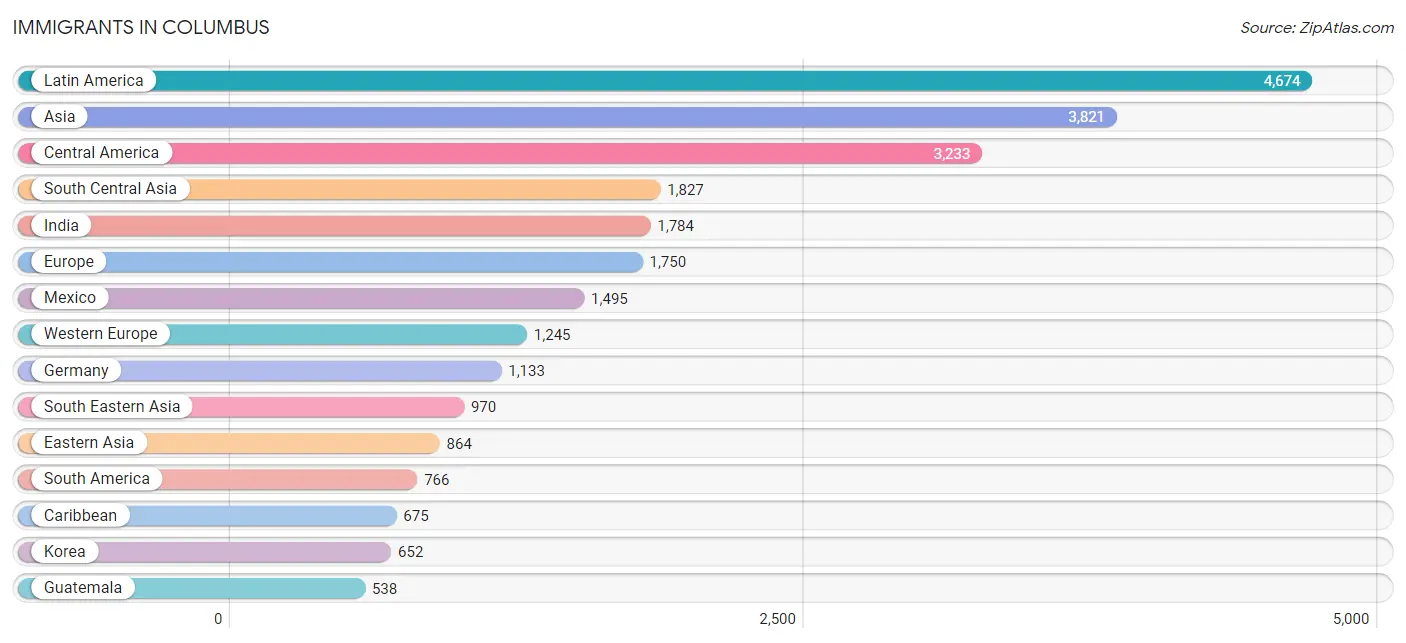
Immigrants in Columbus
The most numerous immigrant groups reported in Columbus came from Latin America (4,674 | 2.3%), Asia (3,821 | 1.9%), Central America (3,233 | 1.6%), South Central Asia (1,827 | 0.9%), and India (1,784 | 0.9%), together accounting for 7.5% of all Columbus residents.
| Immigration Origin | # Population | % Population |
| Africa | 349 | 0.2% |
| Asia | 3,821 | 1.9% |
| Austria | 23 | 0.0% |
| Azores | 8 | 0.0% |
| Barbados | 35 | 0.0% |
| Belarus | 38 | 0.0% |
| Belgium | 3 | 0.0% |
| Belize | 18 | 0.0% |
| Brazil | 75 | 0.0% |
| Cabo Verde | 24 | 0.0% |
| Cameroon | 14 | 0.0% |
| Canada | 81 | 0.0% |
| Caribbean | 675 | 0.3% |
| Central America | 3,233 | 1.6% |
| Chile | 15 | 0.0% |
| China | 64 | 0.0% |
| Colombia | 453 | 0.2% |
| Costa Rica | 45 | 0.0% |
| Cuba | 107 | 0.1% |
| Czechoslovakia | 28 | 0.0% |
| Dominica | 37 | 0.0% |
| Dominican Republic | 145 | 0.1% |
| Eastern Africa | 16 | 0.0% |
| Eastern Asia | 864 | 0.4% |
| Eastern Europe | 324 | 0.2% |
| Ecuador | 65 | 0.0% |
| El Salvador | 160 | 0.1% |
| England | 44 | 0.0% |
| Europe | 1,750 | 0.9% |
| France | 51 | 0.0% |
| Germany | 1,133 | 0.5% |
| Ghana | 125 | 0.1% |
| Guatemala | 538 | 0.3% |
| Guyana | 136 | 0.1% |
| Haiti | 86 | 0.0% |
| Honduras | 367 | 0.2% |
| India | 1,784 | 0.9% |
| Iran | 3 | 0.0% |
| Italy | 38 | 0.0% |
| Jamaica | 176 | 0.1% |
| Japan | 148 | 0.1% |
| Korea | 652 | 0.3% |
| Kuwait | 9 | 0.0% |
| Latin America | 4,674 | 2.3% |
| Malaysia | 15 | 0.0% |
| Mexico | 1,495 | 0.7% |
| Middle Africa | 18 | 0.0% |
| Nepal | 27 | 0.0% |
| Netherlands | 35 | 0.0% |
| Nicaragua | 151 | 0.1% |
| Nigeria | 128 | 0.1% |
| Northern Europe | 104 | 0.1% |
| Norway | 5 | 0.0% |
| Oceania | 35 | 0.0% |
| Pakistan | 13 | 0.0% |
| Panama | 459 | 0.2% |
| Peru | 6 | 0.0% |
| Philippines | 436 | 0.2% |
| Poland | 76 | 0.0% |
| Portugal | 8 | 0.0% |
| Romania | 25 | 0.0% |
| Russia | 143 | 0.1% |
| Saudi Arabia | 29 | 0.0% |
| Scotland | 21 | 0.0% |
| South Africa | 16 | 0.0% |
| South America | 766 | 0.4% |
| South Central Asia | 1,827 | 0.9% |
| South Eastern Asia | 970 | 0.5% |
| Southern Europe | 77 | 0.0% |
| Spain | 31 | 0.0% |
| St. Vincent and the Grenadines | 24 | 0.0% |
| Syria | 90 | 0.0% |
| Thailand | 58 | 0.0% |
| Trinidad and Tobago | 65 | 0.0% |
| Ukraine | 14 | 0.0% |
| Venezuela | 16 | 0.0% |
| Vietnam | 461 | 0.2% |
| Western Africa | 292 | 0.1% |
| Western Asia | 160 | 0.1% |
| Western Europe | 1,245 | 0.6% |
| Zaire | 4 | 0.0% | View All 81 Rows |
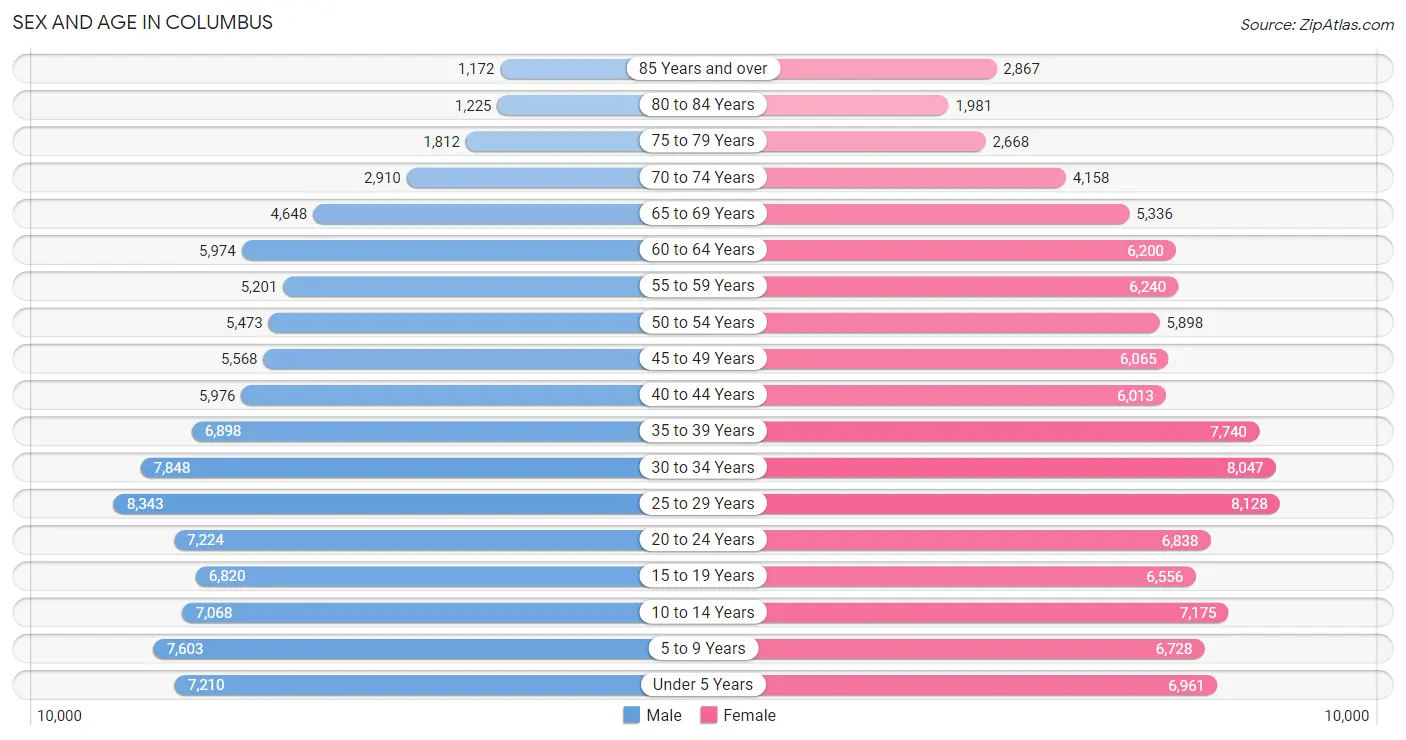
Sex and Age in Columbus
Sex and Age in Columbus
The most populous age groups in Columbus are 25 to 29 Years (8,343 | 8.4%) for men and 25 to 29 Years (8,128 | 7.7%) for women.
| Age Bracket | Male | Female |
| Under 5 Years | 7,210 (7.3%) | 6,961 (6.6%) |
| 5 to 9 Years | 7,603 (7.7%) | 6,728 (6.4%) |
| 10 to 14 Years | 7,068 (7.1%) | 7,175 (6.8%) |
| 15 to 19 Years | 6,820 (6.9%) | 6,556 (6.2%) |
| 20 to 24 Years | 7,224 (7.3%) | 6,838 (6.5%) |
| 25 to 29 Years | 8,343 (8.4%) | 8,128 (7.7%) |
| 30 to 34 Years | 7,848 (7.9%) | 8,047 (7.6%) |
| 35 to 39 Years | 6,898 (7.0%) | 7,740 (7.3%) |
| 40 to 44 Years | 5,976 (6.0%) | 6,013 (5.7%) |
| 45 to 49 Years | 5,568 (5.6%) | 6,065 (5.7%) |
| 50 to 54 Years | 5,473 (5.5%) | 5,898 (5.6%) |
| 55 to 59 Years | 5,201 (5.2%) | 6,240 (5.9%) |
| 60 to 64 Years | 5,974 (6.0%) | 6,200 (5.9%) |
| 65 to 69 Years | 4,648 (4.7%) | 5,336 (5.1%) |
| 70 to 74 Years | 2,910 (2.9%) | 4,158 (3.9%) |
| 75 to 79 Years | 1,812 (1.8%) | 2,668 (2.5%) |
| 80 to 84 Years | 1,225 (1.2%) | 1,981 (1.9%) |
| 85 Years and over | 1,172 (1.2%) | 2,867 (2.7%) |
| Total | 98,973 (100.0%) | 105,599 (100.0%) |
Families and Households in Columbus
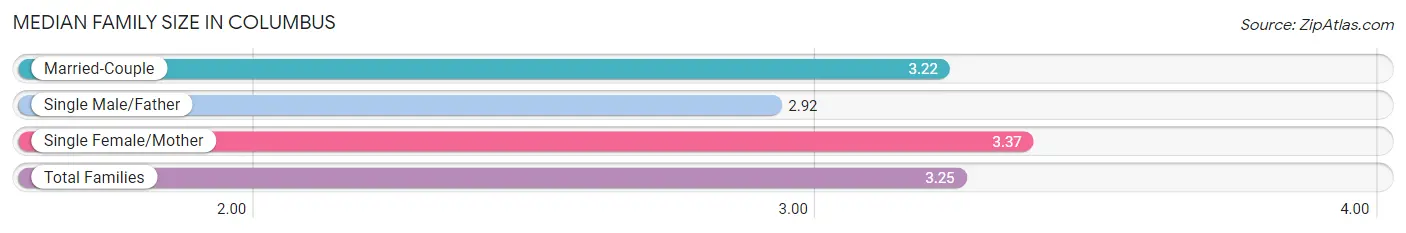
Median Family Size in Columbus
The median family size in Columbus is 3.25 persons per family, with single female/mother families (16,037 | 33.1%) accounting for the largest median family size of 3.37 persons per family. On the other hand, single male/father families (3,733 | 7.7%) represent the smallest median family size with 2.92 persons per family.
| Family Type | # Families | Family Size |
| Married-Couple | 28,647 (59.2%) | 3.22 |
| Single Male/Father | 3,733 (7.7%) | 2.92 |
| Single Female/Mother | 16,037 (33.1%) | 3.37 |
| Total Families | 48,417 (100.0%) | 3.25 |
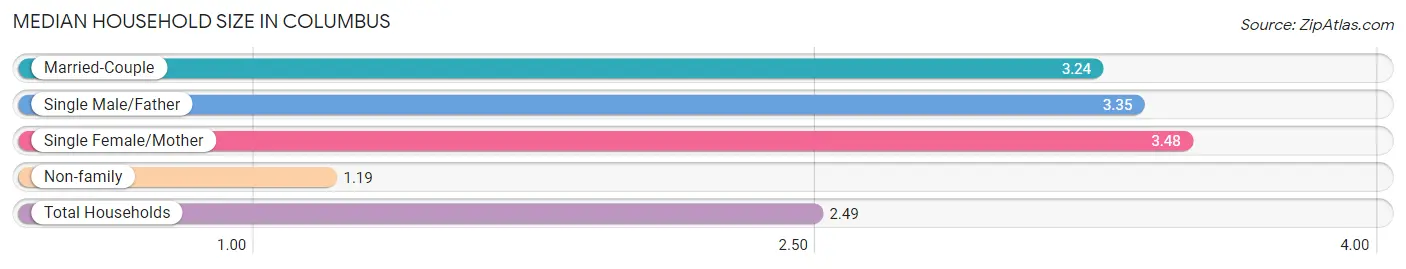
Median Household Size in Columbus
The median household size in Columbus is 2.49 persons per household, with single female/mother households (16,037 | 20.1%) accounting for the largest median household size of 3.48 persons per household. non-family households (31,439 | 39.4%) represent the smallest median household size with 1.19 persons per household.
| Household Type | # Households | Household Size |
| Married-Couple | 28,647 (35.9%) | 3.24 |
| Single Male/Father | 3,733 (4.7%) | 3.35 |
| Single Female/Mother | 16,037 (20.1%) | 3.48 |
| Non-family | 31,439 (39.4%) | 1.19 |
| Total Households | 79,856 (100.0%) | 2.49 |
Household Size by Marriage Status in Columbus
Out of a total of 79,856 households in Columbus, 48,417 (60.6%) are family households, while 31,439 (39.4%) are nonfamily households. The most numerous type of family households are 2-person households, comprising 21,273, and the most common type of nonfamily households are 1-person households, comprising 27,615.
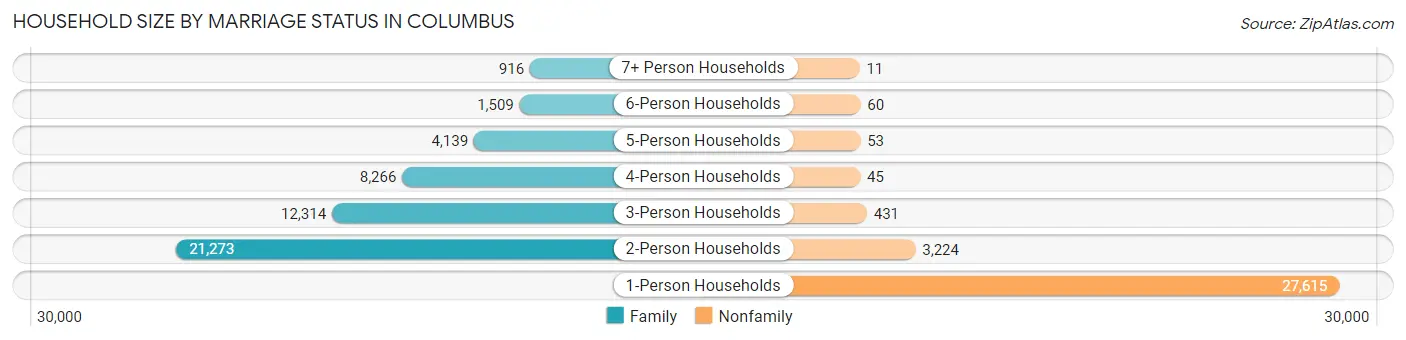
| Household Size | Family Households | Nonfamily Households |
| 1-Person Households | - | 27,615 (34.6%) |
| 2-Person Households | 21,273 (26.6%) | 3,224 (4.0%) |
| 3-Person Households | 12,314 (15.4%) | 431 (0.5%) |
| 4-Person Households | 8,266 (10.3%) | 45 (0.1%) |
| 5-Person Households | 4,139 (5.2%) | 53 (0.1%) |
| 6-Person Households | 1,509 (1.9%) | 60 (0.1%) |
| 7+ Person Households | 916 (1.1%) | 11 (0.0%) |
| Total | 48,417 (60.6%) | 31,439 (39.4%) |
Female Fertility in Columbus
Fertility by Age in Columbus
Average fertility rate in Columbus is 55.0 births per 1,000 women. Women in the age bracket of 20 to 34 years have the highest fertility rate with 90.0 births per 1,000 women. Women in the age bracket of 20 to 34 years acount for 74.2% of all women with births.
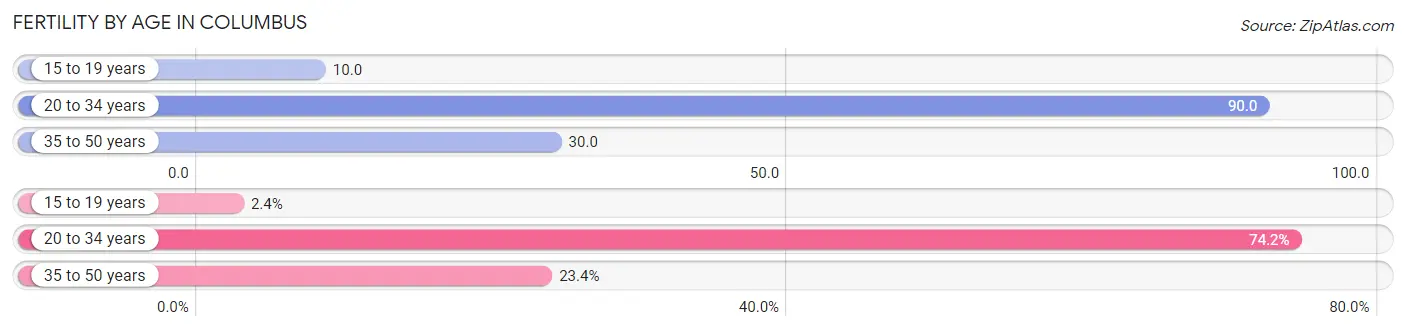
| Age Bracket | Women with Births | Births / 1,000 Women |
| 15 to 19 years | 68 (2.4%) | 10.0 |
| 20 to 34 years | 2,065 (74.2%) | 90.0 |
| 35 to 50 years | 650 (23.4%) | 30.0 |
| Total | 2,783 (100.0%) | 55.0 |
Fertility by Age by Marriage Status in Columbus
57.8% of women with births (2,783) in Columbus are married. The highest percentage of unmarried women with births falls into 15 to 19 years age bracket with 66.2% of them unmarried at the time of birth, while the lowest percentage of unmarried women with births belong to 35 to 50 years age bracket with 28.6% of them unmarried.
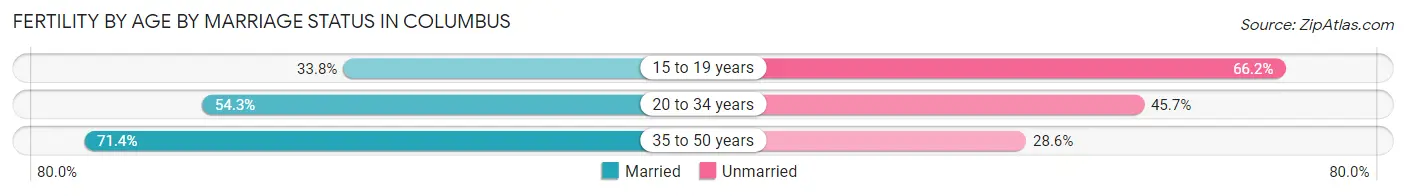
| Age Bracket | Married | Unmarried |
| 15 to 19 years | 23 (33.8%) | 45 (66.2%) |
| 20 to 34 years | 1,121 (54.3%) | 944 (45.7%) |
| 35 to 50 years | 464 (71.4%) | 186 (28.6%) |
| Total | 1,609 (57.8%) | 1,174 (42.2%) |
Fertility by Education in Columbus
Average fertility rate in Columbus is 55.0 births per 1,000 women. Women with the education attainment of bachelor's degree have the highest fertility rate of 84.0 births per 1,000 women, while women with the education attainment of less than high school have the lowest fertility at 17.0 births per 1,000 women. Women with the education attainment of college or associate's degree represent 41.9% of all women with births.
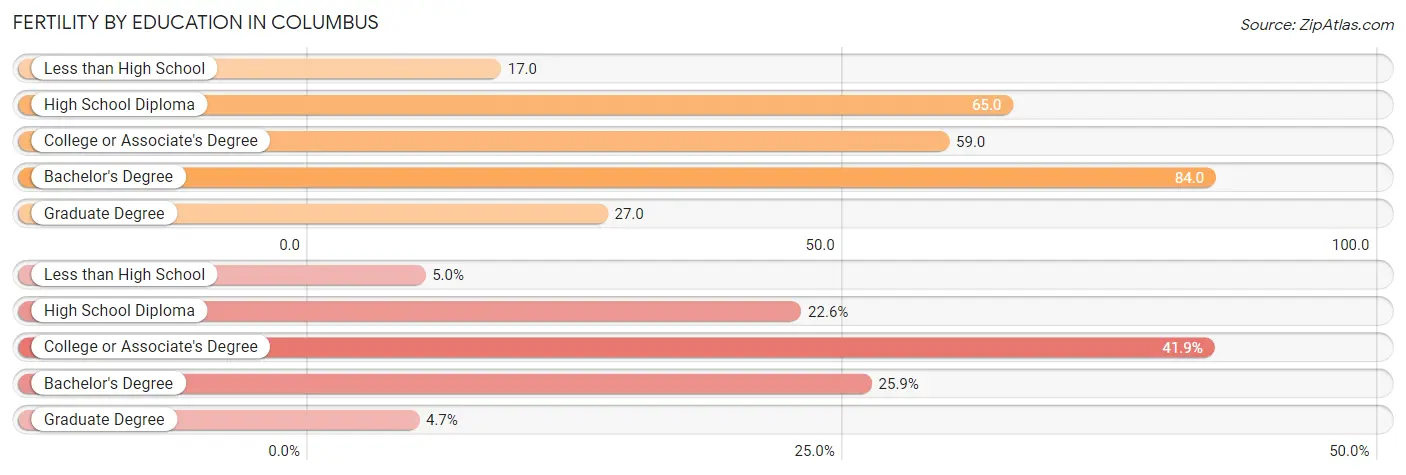
| Educational Attainment | Women with Births | Births / 1,000 Women |
| Less than High School | 138 (5.0%) | 17.0 |
| High School Diploma | 628 (22.6%) | 65.0 |
| College or Associate's Degree | 1,167 (41.9%) | 59.0 |
| Bachelor's Degree | 720 (25.9%) | 84.0 |
| Graduate Degree | 130 (4.7%) | 27.0 |
| Total | 2,783 (100.0%) | 55.0 |
Fertility by Education by Marriage Status in Columbus
42.2% of women with births in Columbus are unmarried. Women with the educational attainment of graduate degree are most likely to be married with 100.0% of them married at childbirth, while women with the educational attainment of less than high school are least likely to be married with 83.3% of them unmarried at childbirth.
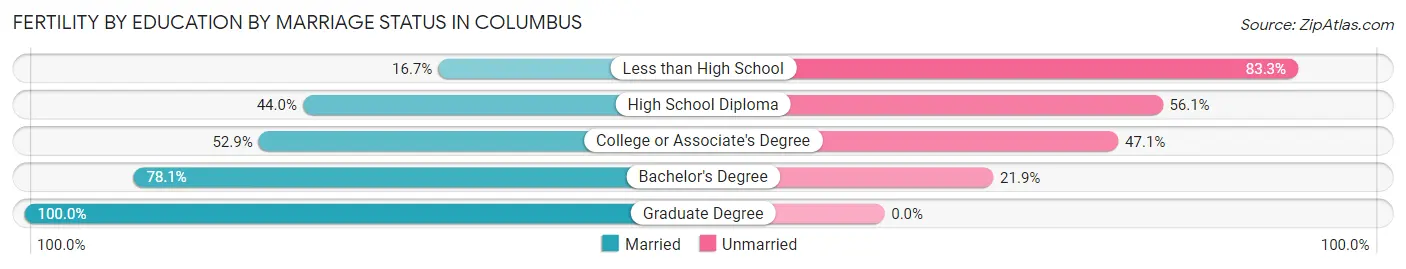
| Educational Attainment | Married | Unmarried |
| Less than High School | 23 (16.7%) | 115 (83.3%) |
| High School Diploma | 276 (44.0%) | 352 (56.0%) |
| College or Associate's Degree | 617 (52.9%) | 550 (47.1%) |
| Bachelor's Degree | 562 (78.1%) | 158 (21.9%) |
| Graduate Degree | 130 (100.0%) | 0 (0.0%) |
| Total | 1,609 (57.8%) | 1,174 (42.2%) |
Employment Characteristics in Columbus
Employment by Class of Employer in Columbus
Among the 88,082 employed individuals in Columbus, private company employees (53,870 | 61.2%), federal government employees (12,172 | 13.8%), and not-for-profit organizations (5,815 | 6.6%) make up the most common classes of employment.
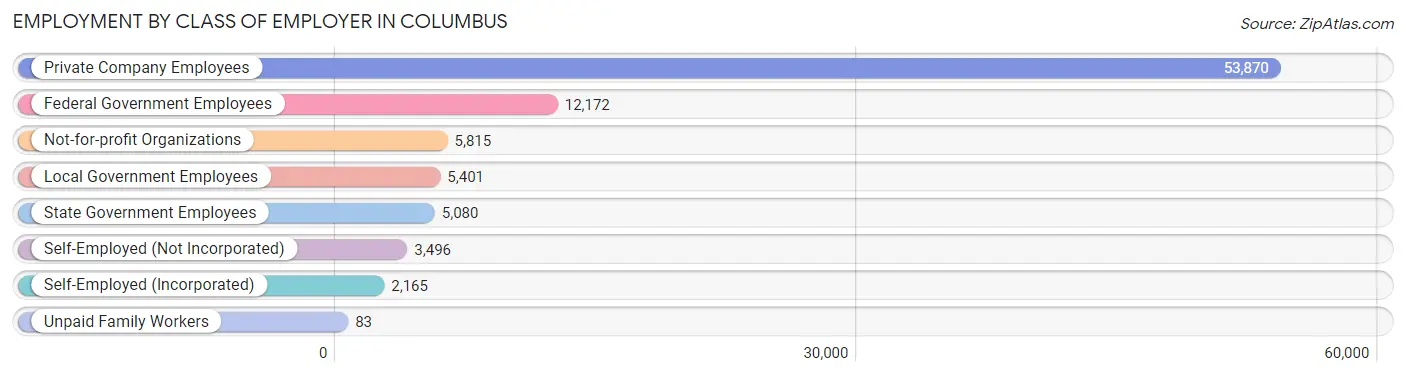
| Employer Class | # Employees | % Employees |
| Private Company Employees | 53,870 | 61.2% |
| Self-Employed (Incorporated) | 2,165 | 2.5% |
| Self-Employed (Not Incorporated) | 3,496 | 4.0% |
| Not-for-profit Organizations | 5,815 | 6.6% |
| Local Government Employees | 5,401 | 6.1% |
| State Government Employees | 5,080 | 5.8% |
| Federal Government Employees | 12,172 | 13.8% |
| Unpaid Family Workers | 83 | 0.1% |
| Total | 88,082 | 100.0% |
Employment Status by Age in Columbus
According to the labor force statistics for Columbus, out of the total population over 16 years of age (159,002), 60.7% or 96,514 individuals are in the labor force, with 7.3% or 7,046 of them unemployed. The age group with the highest labor force participation rate is 30 to 34 years, with 81.3% or 12,923 individuals in the labor force. Within the labor force, the 16 to 19 years age range has the highest percentage of unemployed individuals, with 28.4% or 1,040 of them being unemployed.
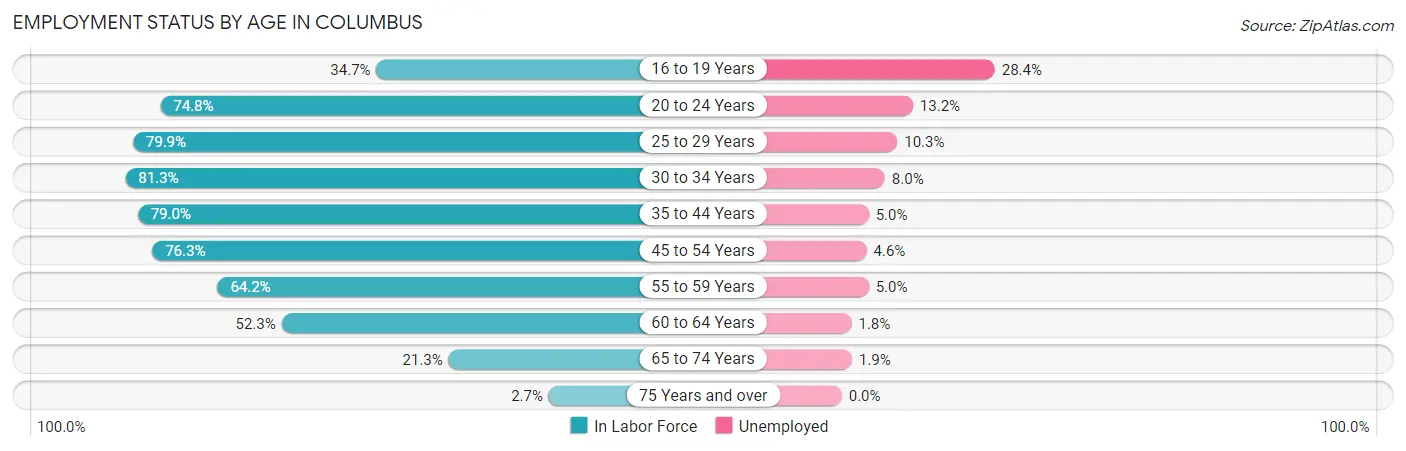
| Age Bracket | In Labor Force | Unemployed |
| 16 to 19 Years | 3,661 (34.7%) | 1,040 (28.4%) |
| 20 to 24 Years | 10,518 (74.8%) | 1,388 (13.2%) |
| 25 to 29 Years | 13,160 (79.9%) | 1,355 (10.3%) |
| 30 to 34 Years | 12,923 (81.3%) | 1,034 (8.0%) |
| 35 to 44 Years | 21,035 (79.0%) | 1,052 (5.0%) |
| 45 to 54 Years | 17,552 (76.3%) | 807 (4.6%) |
| 55 to 59 Years | 7,345 (64.2%) | 367 (5.0%) |
| 60 to 64 Years | 6,367 (52.3%) | 115 (1.8%) |
| 65 to 74 Years | 3,632 (21.3%) | 69 (1.9%) |
| 75 Years and over | 317 (2.7%) | 0 (0.0%) |
| Total | 96,514 (60.7%) | 7,046 (7.3%) |
Employment Status by Educational Attainment in Columbus
According to labor force statistics for Columbus, 74.2% of individuals (78,364) out of the total population between 25 and 64 years of age (105,612) are in the labor force, with 5.9% or 4,623 of them being unemployed. The group with the highest labor force participation rate are those with the educational attainment of bachelor's degree or higher, with 85.5% or 26,374 individuals in the labor force. Within the labor force, individuals with less than high school education have the highest percentage of unemployment, with 11.8% or 648 of them being unemployed.
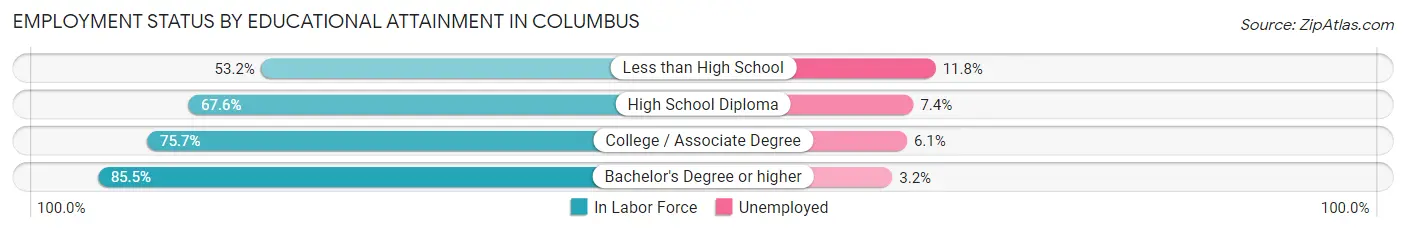
| Educational Attainment | In Labor Force | Unemployed |
| Less than High School | 5,492 (53.2%) | 1,218 (11.8%) |
| High School Diploma | 18,891 (67.6%) | 2,068 (7.4%) |
| College / Associate Degree | 27,628 (75.7%) | 2,226 (6.1%) |
| Bachelor's Degree or higher | 26,374 (85.5%) | 987 (3.2%) |
| Total | 78,364 (74.2%) | 6,231 (5.9%) |
Employment Occupations by Sex in Columbus
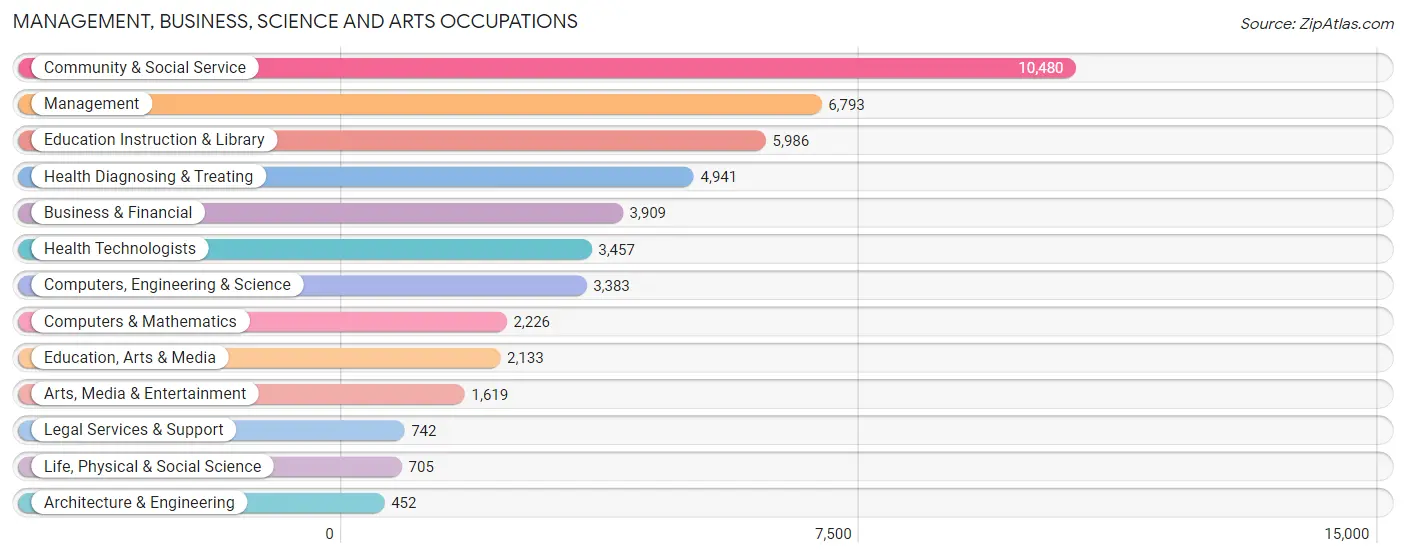
Management, Business, Science and Arts Occupations
The most common Management, Business, Science and Arts occupations in Columbus are Community & Social Service (10,480 | 12.7%), Management (6,793 | 8.2%), Education Instruction & Library (5,986 | 7.2%), Health Diagnosing & Treating (4,941 | 6.0%), and Business & Financial (3,909 | 4.7%).
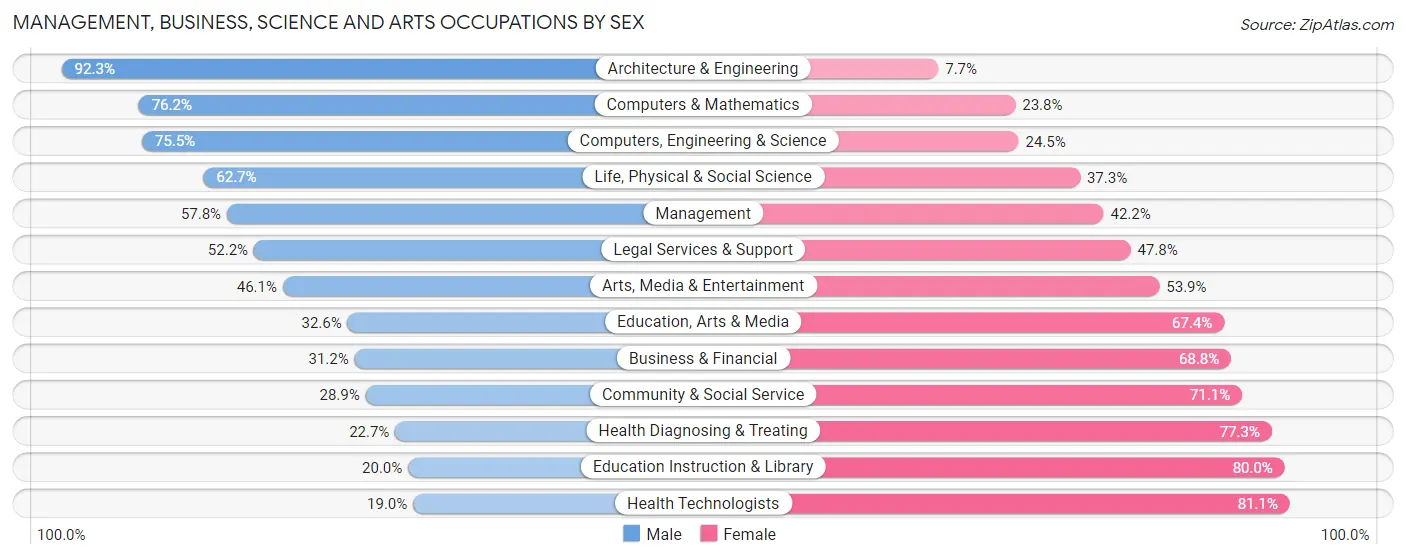
Management, Business, Science and Arts Occupations by Sex
Within the Management, Business, Science and Arts occupations in Columbus, the most male-oriented occupations are Architecture & Engineering (92.3%), Computers & Mathematics (76.2%), and Computers, Engineering & Science (75.5%), while the most female-oriented occupations are Health Technologists (81.0%), Education Instruction & Library (80.0%), and Health Diagnosing & Treating (77.3%).
| Occupation | Male | Female |
| Management | 3,926 (57.8%) | 2,867 (42.2%) |
| Business & Financial | 1,219 (31.2%) | 2,690 (68.8%) |
| Computers, Engineering & Science | 2,555 (75.5%) | 828 (24.5%) |
| Computers & Mathematics | 1,696 (76.2%) | 530 (23.8%) |
| Architecture & Engineering | 417 (92.3%) | 35 (7.7%) |
| Life, Physical & Social Science | 442 (62.7%) | 263 (37.3%) |
| Community & Social Service | 3,027 (28.9%) | 7,453 (71.1%) |
| Education, Arts & Media | 696 (32.6%) | 1,437 (67.4%) |
| Legal Services & Support | 387 (52.2%) | 355 (47.8%) |
| Education Instruction & Library | 1,197 (20.0%) | 4,789 (80.0%) |
| Arts, Media & Entertainment | 747 (46.1%) | 872 (53.9%) |
| Health Diagnosing & Treating | 1,121 (22.7%) | 3,820 (77.3%) |
| Health Technologists | 655 (19.0%) | 2,802 (81.0%) |
| Total (Category) | 11,848 (40.2%) | 17,658 (59.9%) |
| Total (Overall) | 39,301 (47.4%) | 43,573 (52.6%) |
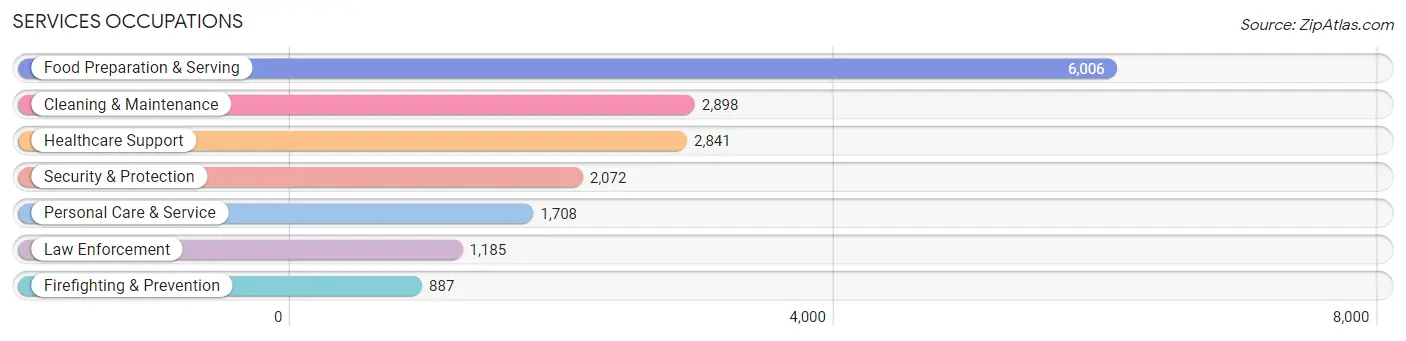
Services Occupations
The most common Services occupations in Columbus are Food Preparation & Serving (6,006 | 7.2%), Cleaning & Maintenance (2,898 | 3.5%), Healthcare Support (2,841 | 3.4%), Security & Protection (2,072 | 2.5%), and Personal Care & Service (1,708 | 2.1%).
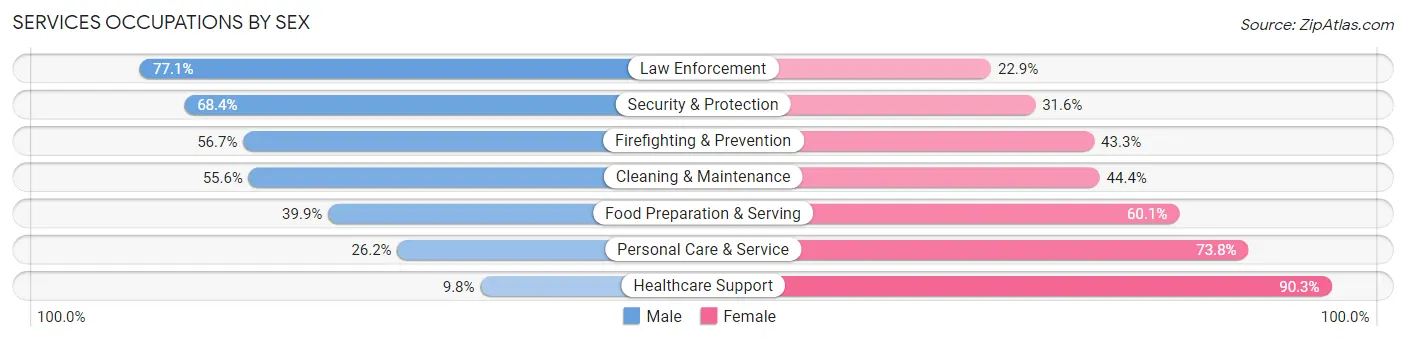
Services Occupations by Sex
Within the Services occupations in Columbus, the most male-oriented occupations are Law Enforcement (77.1%), Security & Protection (68.4%), and Firefighting & Prevention (56.7%), while the most female-oriented occupations are Healthcare Support (90.2%), Personal Care & Service (73.8%), and Food Preparation & Serving (60.1%).
| Occupation | Male | Female |
| Healthcare Support | 277 (9.8%) | 2,564 (90.2%) |
| Security & Protection | 1,417 (68.4%) | 655 (31.6%) |
| Firefighting & Prevention | 503 (56.7%) | 384 (43.3%) |
| Law Enforcement | 914 (77.1%) | 271 (22.9%) |
| Food Preparation & Serving | 2,396 (39.9%) | 3,610 (60.1%) |
| Cleaning & Maintenance | 1,612 (55.6%) | 1,286 (44.4%) |
| Personal Care & Service | 447 (26.2%) | 1,261 (73.8%) |
| Total (Category) | 6,149 (39.6%) | 9,376 (60.4%) |
| Total (Overall) | 39,301 (47.4%) | 43,573 (52.6%) |
Sales and Office Occupations
The most common Sales and Office occupations in Columbus are Office & Administration (10,884 | 13.1%), and Sales & Related (8,895 | 10.7%).

Sales and Office Occupations by Sex
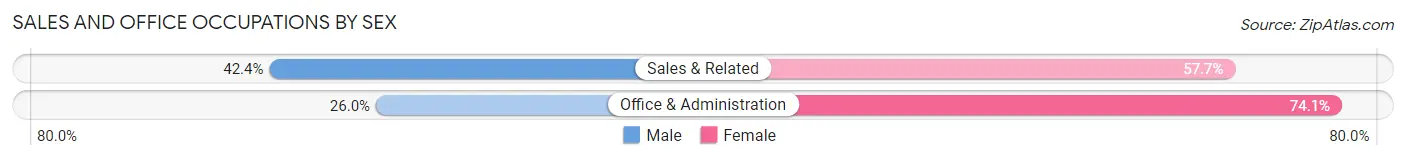
| Occupation | Male | Female |
| Sales & Related | 3,767 (42.3%) | 5,128 (57.7%) |
| Office & Administration | 2,824 (26.0%) | 8,060 (74.1%) |
| Total (Category) | 6,591 (33.3%) | 13,188 (66.7%) |
| Total (Overall) | 39,301 (47.4%) | 43,573 (52.6%) |
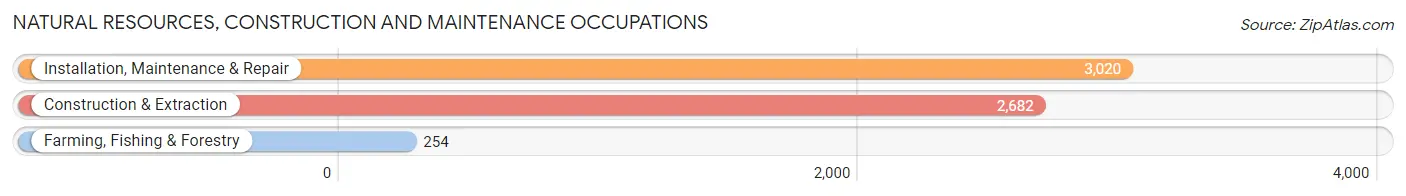
Natural Resources, Construction and Maintenance Occupations
The most common Natural Resources, Construction and Maintenance occupations in Columbus are Installation, Maintenance & Repair (3,020 | 3.6%), Construction & Extraction (2,682 | 3.2%), and Farming, Fishing & Forestry (254 | 0.3%).
Natural Resources, Construction and Maintenance Occupations by Sex
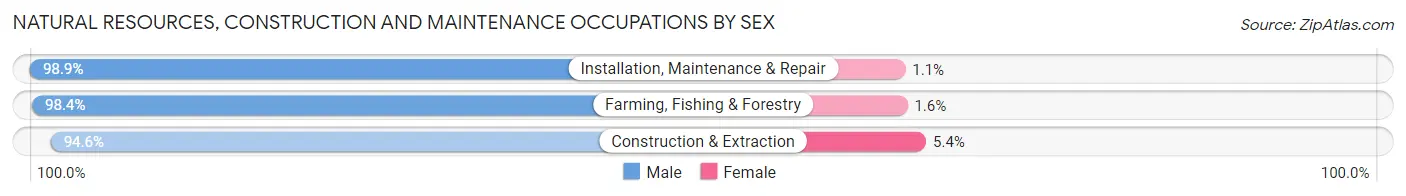
| Occupation | Male | Female |
| Farming, Fishing & Forestry | 250 (98.4%) | 4 (1.6%) |
| Construction & Extraction | 2,536 (94.6%) | 146 (5.4%) |
| Installation, Maintenance & Repair | 2,986 (98.9%) | 34 (1.1%) |
| Total (Category) | 5,772 (96.9%) | 184 (3.1%) |
| Total (Overall) | 39,301 (47.4%) | 43,573 (52.6%) |
Production, Transportation and Moving Occupations
The most common Production, Transportation and Moving occupations in Columbus are Production (5,680 | 6.9%), Transportation (3,520 | 4.3%), and Material Moving (2,908 | 3.5%).
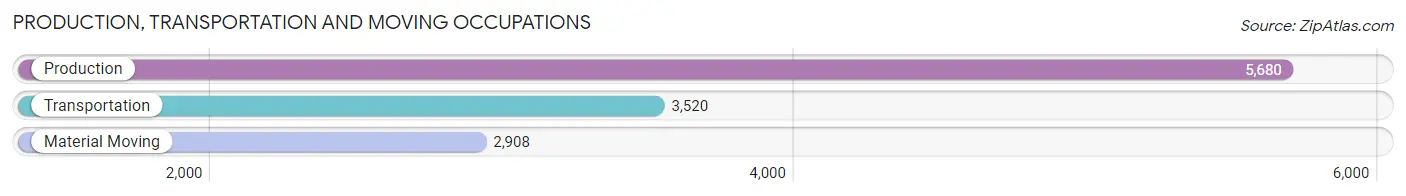
Production, Transportation and Moving Occupations by Sex
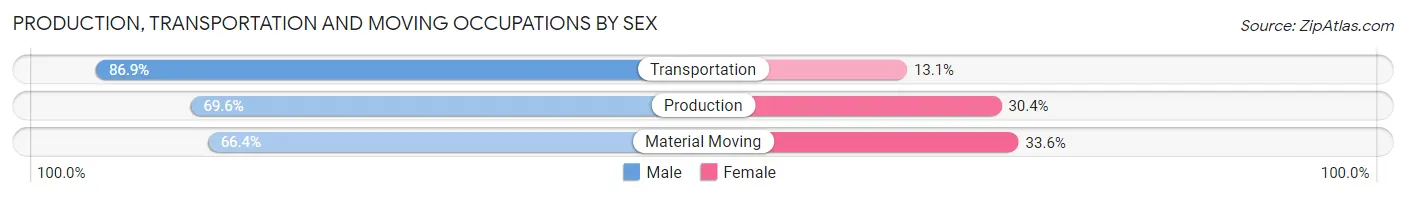
| Occupation | Male | Female |
| Production | 3,951 (69.6%) | 1,729 (30.4%) |
| Transportation | 3,059 (86.9%) | 461 (13.1%) |
| Material Moving | 1,931 (66.4%) | 977 (33.6%) |
| Total (Category) | 8,941 (73.8%) | 3,167 (26.2%) |
| Total (Overall) | 39,301 (47.4%) | 43,573 (52.6%) |
Employment Industries by Sex in Columbus
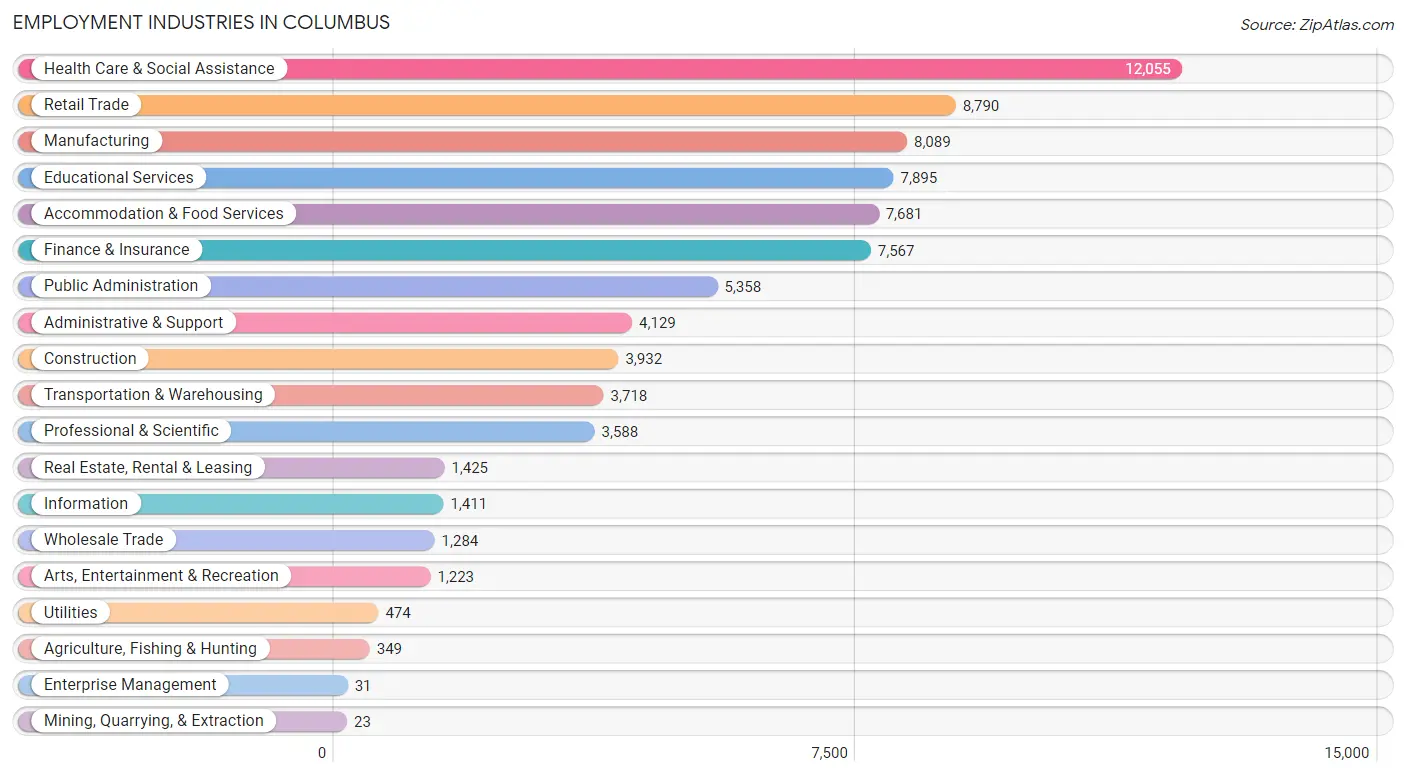
Employment Industries in Columbus
The major employment industries in Columbus include Health Care & Social Assistance (12,055 | 14.5%), Retail Trade (8,790 | 10.6%), Manufacturing (8,089 | 9.8%), Educational Services (7,895 | 9.5%), and Accommodation & Food Services (7,681 | 9.3%).
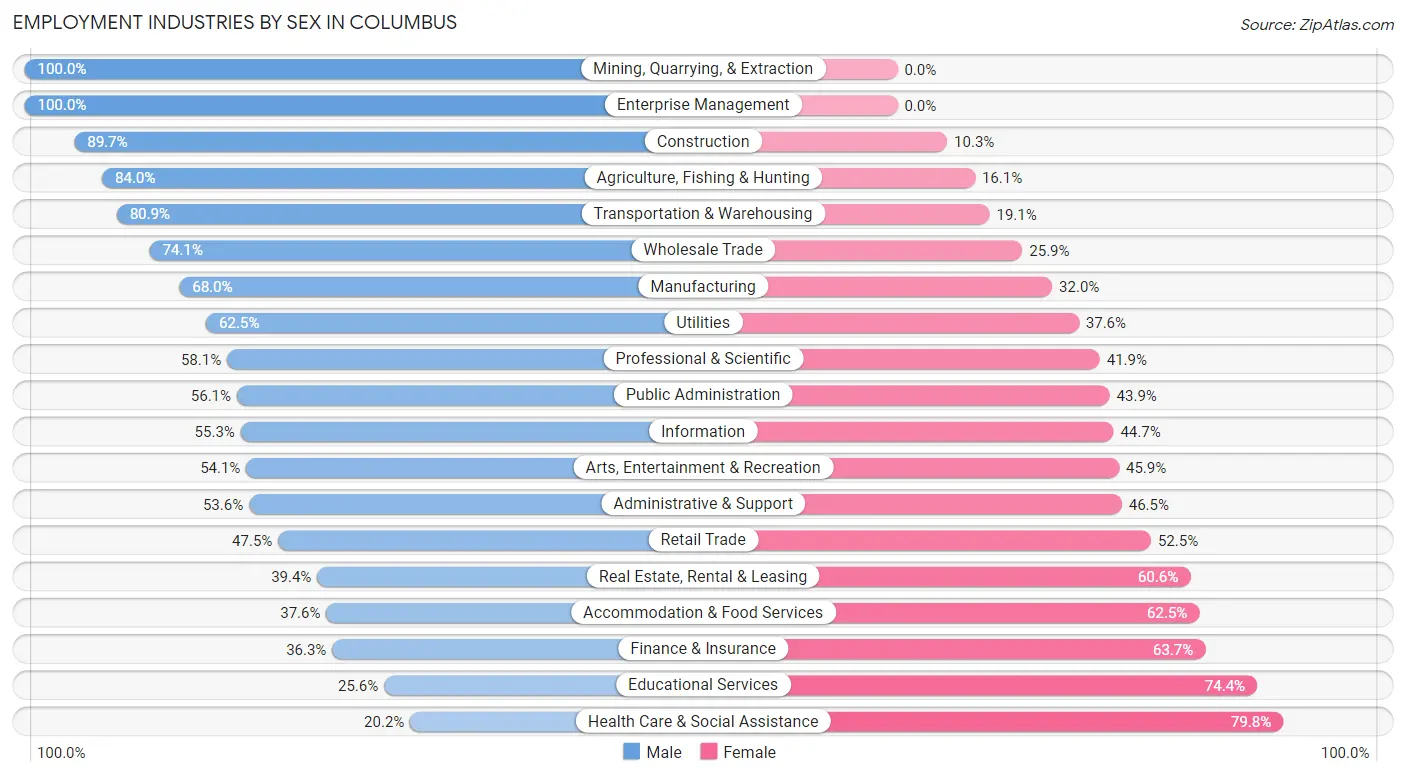
Employment Industries by Sex in Columbus
The Columbus industries that see more men than women are Mining, Quarrying, & Extraction (100.0%), Enterprise Management (100.0%), and Construction (89.7%), whereas the industries that tend to have a higher number of women are Health Care & Social Assistance (79.8%), Educational Services (74.4%), and Finance & Insurance (63.7%).
| Industry | Male | Female |
| Agriculture, Fishing & Hunting | 293 (84.0%) | 56 (16.1%) |
| Mining, Quarrying, & Extraction | 23 (100.0%) | 0 (0.0%) |
| Construction | 3,527 (89.7%) | 405 (10.3%) |
| Manufacturing | 5,498 (68.0%) | 2,591 (32.0%) |
| Wholesale Trade | 952 (74.1%) | 332 (25.9%) |
| Retail Trade | 4,177 (47.5%) | 4,613 (52.5%) |
| Transportation & Warehousing | 3,009 (80.9%) | 709 (19.1%) |
| Utilities | 296 (62.5%) | 178 (37.6%) |
| Information | 780 (55.3%) | 631 (44.7%) |
| Finance & Insurance | 2,749 (36.3%) | 4,818 (63.7%) |
| Real Estate, Rental & Leasing | 562 (39.4%) | 863 (60.6%) |
| Professional & Scientific | 2,085 (58.1%) | 1,503 (41.9%) |
| Enterprise Management | 31 (100.0%) | 0 (0.0%) |
| Administrative & Support | 2,211 (53.5%) | 1,918 (46.5%) |
| Educational Services | 2,021 (25.6%) | 5,874 (74.4%) |
| Health Care & Social Assistance | 2,434 (20.2%) | 9,621 (79.8%) |
| Arts, Entertainment & Recreation | 662 (54.1%) | 561 (45.9%) |
| Accommodation & Food Services | 2,884 (37.6%) | 4,797 (62.5%) |
| Public Administration | 3,004 (56.1%) | 2,354 (43.9%) |
| Total | 39,301 (47.4%) | 43,573 (52.6%) |
Education in Columbus
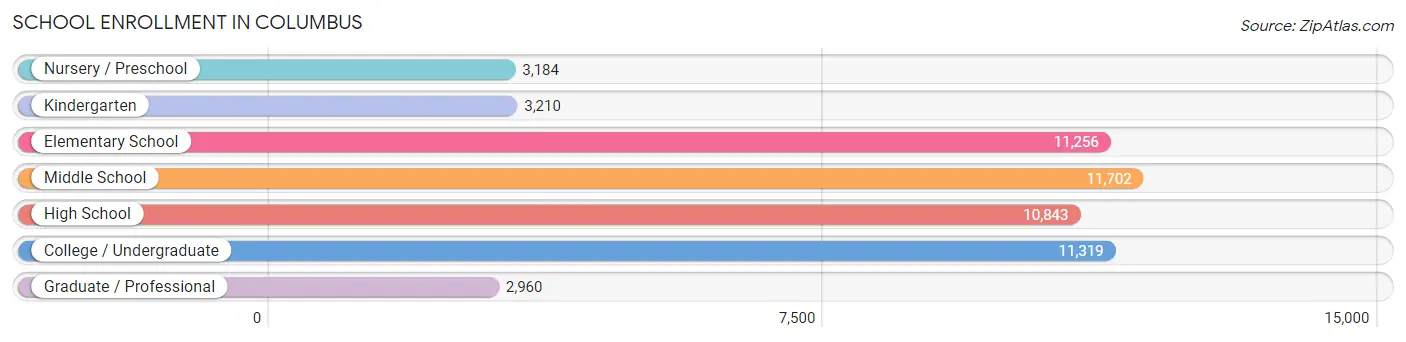
School Enrollment in Columbus
The most common levels of schooling among the 54,474 students in Columbus are middle school (11,702 | 21.5%), college / undergraduate (11,319 | 20.8%), and elementary school (11,256 | 20.7%).
| School Level | # Students | % Students |
| Nursery / Preschool | 3,184 | 5.8% |
| Kindergarten | 3,210 | 5.9% |
| Elementary School | 11,256 | 20.7% |
| Middle School | 11,702 | 21.5% |
| High School | 10,843 | 19.9% |
| College / Undergraduate | 11,319 | 20.8% |
| Graduate / Professional | 2,960 | 5.4% |
| Total | 54,474 | 100.0% |
School Enrollment by Age by Funding Source in Columbus
Out of a total of 54,474 students who are enrolled in schools in Columbus, 7,300 (13.4%) attend a private institution, while the remaining 47,174 (86.6%) are enrolled in public schools. The age group of 3 to 4 year olds has the highest likelihood of being enrolled in private schools, with 784 (29.1% in the age bracket) enrolled. Conversely, the age group of 15 to 17 year olds has the lowest likelihood of being enrolled in a private school, with 7,120 (91.7% in the age bracket) attending a public institution.
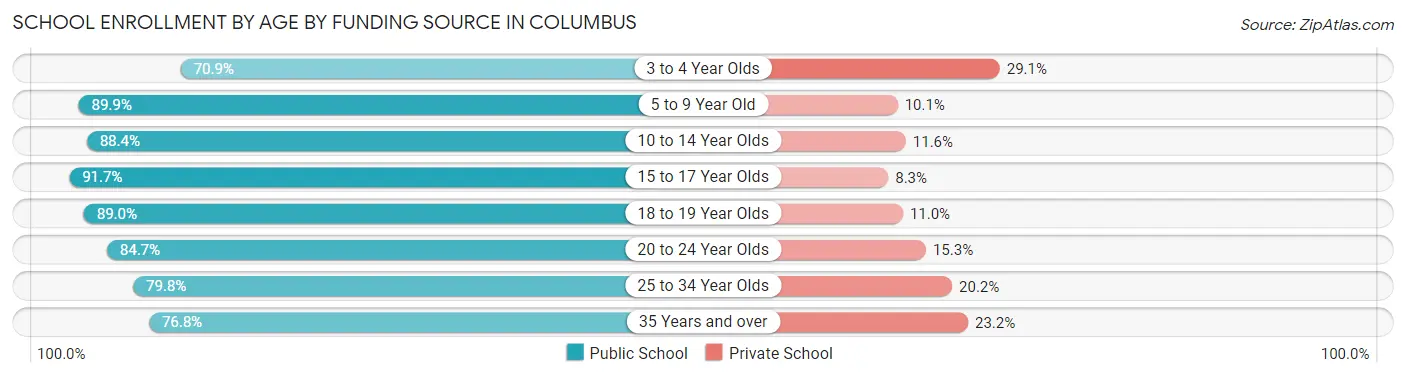
| Age Bracket | Public School | Private School |
| 3 to 4 Year Olds | 1,912 (70.9%) | 784 (29.1%) |
| 5 to 9 Year Old | 12,324 (89.9%) | 1,379 (10.1%) |
| 10 to 14 Year Olds | 12,314 (88.4%) | 1,613 (11.6%) |
| 15 to 17 Year Olds | 7,120 (91.7%) | 645 (8.3%) |
| 18 to 19 Year Olds | 2,885 (89.0%) | 358 (11.0%) |
| 20 to 24 Year Olds | 4,331 (84.7%) | 784 (15.3%) |
| 25 to 34 Year Olds | 3,511 (79.8%) | 889 (20.2%) |
| 35 Years and over | 2,785 (76.8%) | 840 (23.2%) |
| Total | 47,174 (86.6%) | 7,300 (13.4%) |
Educational Attainment by Field of Study in Columbus
Business (9,496 | 23.3%), education (5,457 | 13.4%), science & technology (4,133 | 10.2%), arts & humanities (3,474 | 8.5%), and social sciences (2,605 | 6.4%) are the most common fields of study among 40,726 individuals in Columbus who have obtained a bachelor's degree or higher.
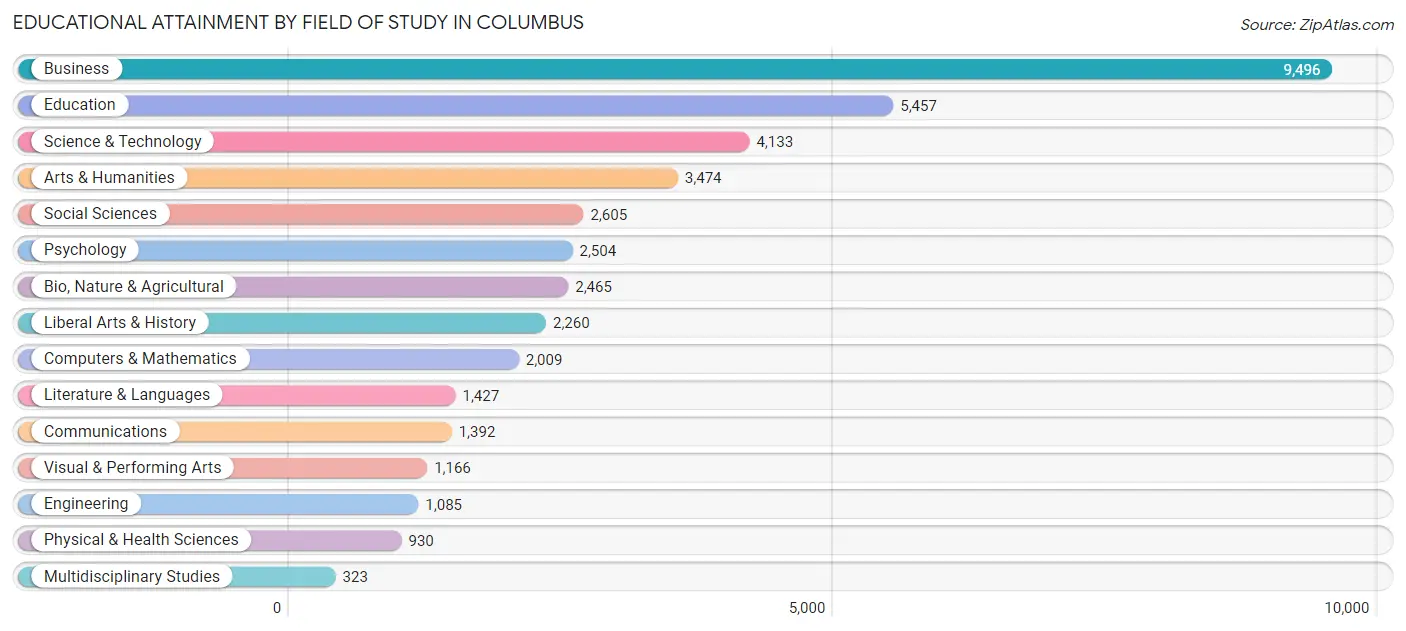
| Field of Study | # Graduates | % Graduates |
| Computers & Mathematics | 2,009 | 4.9% |
| Bio, Nature & Agricultural | 2,465 | 6.0% |
| Physical & Health Sciences | 930 | 2.3% |
| Psychology | 2,504 | 6.1% |
| Social Sciences | 2,605 | 6.4% |
| Engineering | 1,085 | 2.7% |
| Multidisciplinary Studies | 323 | 0.8% |
| Science & Technology | 4,133 | 10.2% |
| Business | 9,496 | 23.3% |
| Education | 5,457 | 13.4% |
| Literature & Languages | 1,427 | 3.5% |
| Liberal Arts & History | 2,260 | 5.6% |
| Visual & Performing Arts | 1,166 | 2.9% |
| Communications | 1,392 | 3.4% |
| Arts & Humanities | 3,474 | 8.5% |
| Total | 40,726 | 100.0% |
Transportation & Commute in Columbus
Vehicle Availability by Sex in Columbus
The most prevalent vehicle ownership categories in Columbus are males with 2 vehicles (18,925, accounting for 43.3%) and females with 2 vehicles (16,855, making up 44.5%).
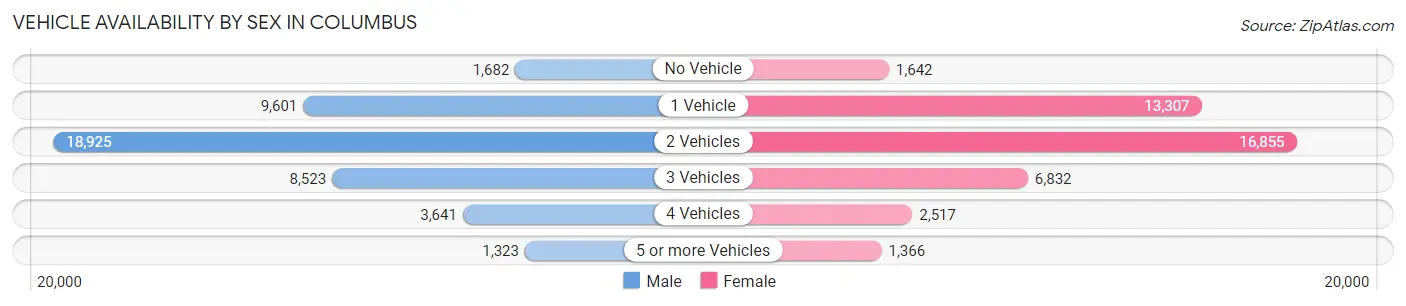
| Vehicles Available | Male | Female |
| No Vehicle | 1,682 (3.8%) | 1,642 (3.9%) |
| 1 Vehicle | 9,601 (22.0%) | 13,307 (31.3%) |
| 2 Vehicles | 18,925 (43.3%) | 16,855 (39.6%) |
| 3 Vehicles | 8,523 (19.5%) | 6,832 (16.1%) |
| 4 Vehicles | 3,641 (8.3%) | 2,517 (5.9%) |
| 5 or more Vehicles | 1,323 (3.0%) | 1,366 (3.2%) |
| Total | 43,695 (100.0%) | 42,519 (100.0%) |
Commute Time in Columbus
The most frequently occuring commute durations in Columbus are 15 to 19 minutes (20,376 commuters, 24.9%), 20 to 24 minutes (14,950 commuters, 18.3%), and 10 to 14 minutes (14,084 commuters, 17.2%).
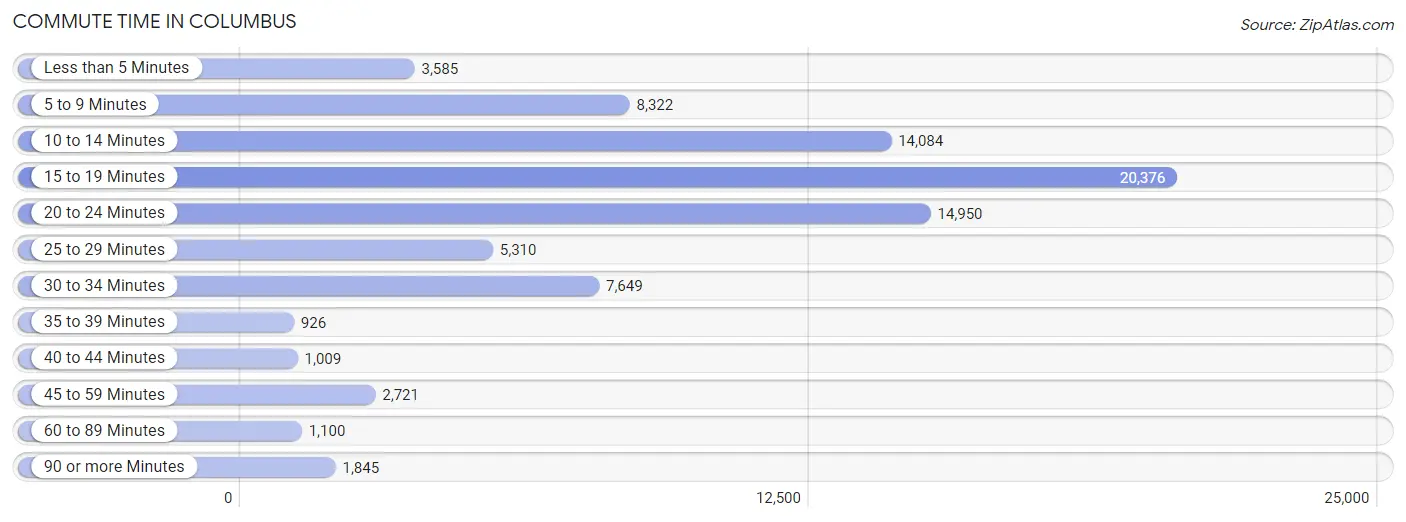
| Commute Time | # Commuters | % Commuters |
| Less than 5 Minutes | 3,585 | 4.4% |
| 5 to 9 Minutes | 8,322 | 10.2% |
| 10 to 14 Minutes | 14,084 | 17.2% |
| 15 to 19 Minutes | 20,376 | 24.9% |
| 20 to 24 Minutes | 14,950 | 18.3% |
| 25 to 29 Minutes | 5,310 | 6.5% |
| 30 to 34 Minutes | 7,649 | 9.3% |
| 35 to 39 Minutes | 926 | 1.1% |
| 40 to 44 Minutes | 1,009 | 1.2% |
| 45 to 59 Minutes | 2,721 | 3.3% |
| 60 to 89 Minutes | 1,100 | 1.3% |
| 90 or more Minutes | 1,845 | 2.2% |
Commute Time by Sex in Columbus
The most common commute times in Columbus are 15 to 19 minutes (9,975 commuters, 23.4%) for males and 15 to 19 minutes (10,401 commuters, 26.5%) for females.
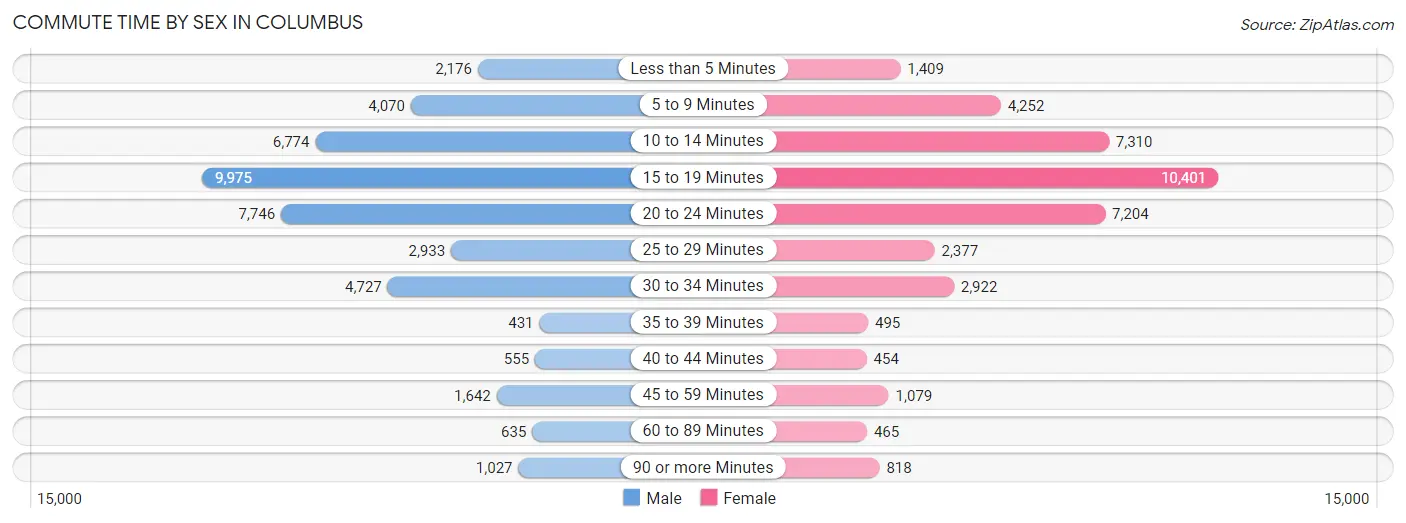
| Commute Time | Male | Female |
| Less than 5 Minutes | 2,176 (5.1%) | 1,409 (3.6%) |
| 5 to 9 Minutes | 4,070 (9.5%) | 4,252 (10.8%) |
| 10 to 14 Minutes | 6,774 (15.9%) | 7,310 (18.6%) |
| 15 to 19 Minutes | 9,975 (23.4%) | 10,401 (26.5%) |
| 20 to 24 Minutes | 7,746 (18.1%) | 7,204 (18.4%) |
| 25 to 29 Minutes | 2,933 (6.9%) | 2,377 (6.1%) |
| 30 to 34 Minutes | 4,727 (11.1%) | 2,922 (7.5%) |
| 35 to 39 Minutes | 431 (1.0%) | 495 (1.3%) |
| 40 to 44 Minutes | 555 (1.3%) | 454 (1.2%) |
| 45 to 59 Minutes | 1,642 (3.8%) | 1,079 (2.8%) |
| 60 to 89 Minutes | 635 (1.5%) | 465 (1.2%) |
| 90 or more Minutes | 1,027 (2.4%) | 818 (2.1%) |
Time of Departure to Work by Sex in Columbus
The most frequent times of departure to work in Columbus are 7:00 AM to 7:29 AM (6,341, 14.8%) for males and 7:30 AM to 7:59 AM (5,463, 13.9%) for females.
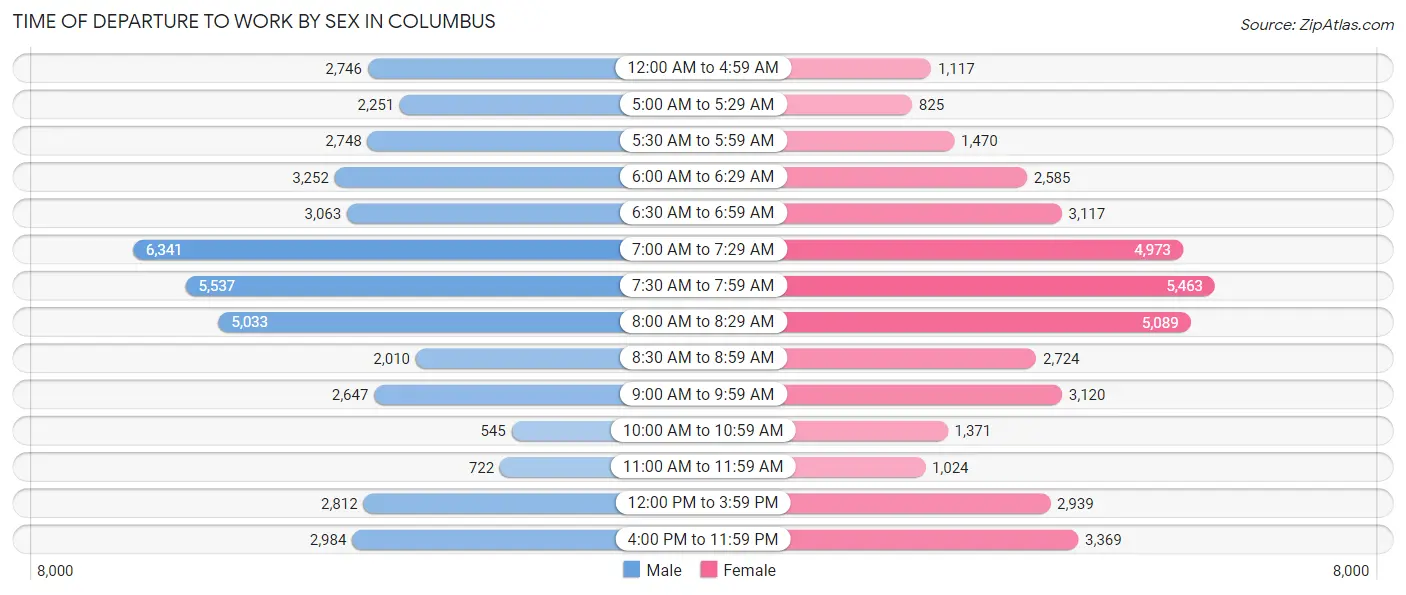
| Time of Departure | Male | Female |
| 12:00 AM to 4:59 AM | 2,746 (6.4%) | 1,117 (2.9%) |
| 5:00 AM to 5:29 AM | 2,251 (5.3%) | 825 (2.1%) |
| 5:30 AM to 5:59 AM | 2,748 (6.4%) | 1,470 (3.7%) |
| 6:00 AM to 6:29 AM | 3,252 (7.6%) | 2,585 (6.6%) |
| 6:30 AM to 6:59 AM | 3,063 (7.2%) | 3,117 (8.0%) |
| 7:00 AM to 7:29 AM | 6,341 (14.8%) | 4,973 (12.7%) |
| 7:30 AM to 7:59 AM | 5,537 (13.0%) | 5,463 (13.9%) |
| 8:00 AM to 8:29 AM | 5,033 (11.8%) | 5,089 (13.0%) |
| 8:30 AM to 8:59 AM | 2,010 (4.7%) | 2,724 (7.0%) |
| 9:00 AM to 9:59 AM | 2,647 (6.2%) | 3,120 (8.0%) |
| 10:00 AM to 10:59 AM | 545 (1.3%) | 1,371 (3.5%) |
| 11:00 AM to 11:59 AM | 722 (1.7%) | 1,024 (2.6%) |
| 12:00 PM to 3:59 PM | 2,812 (6.6%) | 2,939 (7.5%) |
| 4:00 PM to 11:59 PM | 2,984 (7.0%) | 3,369 (8.6%) |
| Total | 42,691 (100.0%) | 39,186 (100.0%) |
Housing Occupancy in Columbus
Occupancy by Ownership in Columbus
Of the total 79,856 dwellings in Columbus, owner-occupied units account for 39,535 (49.5%), while renter-occupied units make up 40,321 (50.5%).
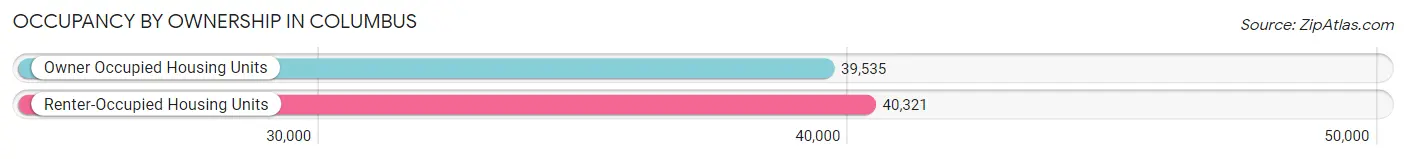
| Occupancy | # Housing Units | % Housing Units |
| Owner Occupied Housing Units | 39,535 | 49.5% |
| Renter-Occupied Housing Units | 40,321 | 50.5% |
| Total Occupied Housing Units | 79,856 | 100.0% |
Occupancy by Household Size in Columbus
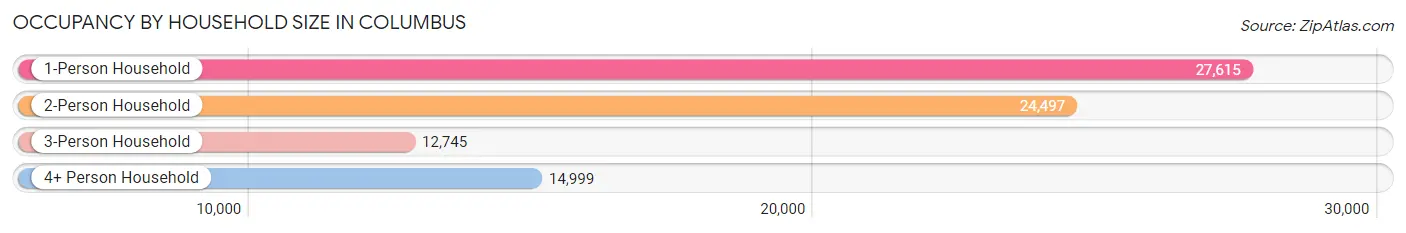
| Household Size | # Housing Units | % Housing Units |
| 1-Person Household | 27,615 | 34.6% |
| 2-Person Household | 24,497 | 30.7% |
| 3-Person Household | 12,745 | 16.0% |
| 4+ Person Household | 14,999 | 18.8% |
| Total Housing Units | 79,856 | 100.0% |
Occupancy by Ownership by Household Size in Columbus
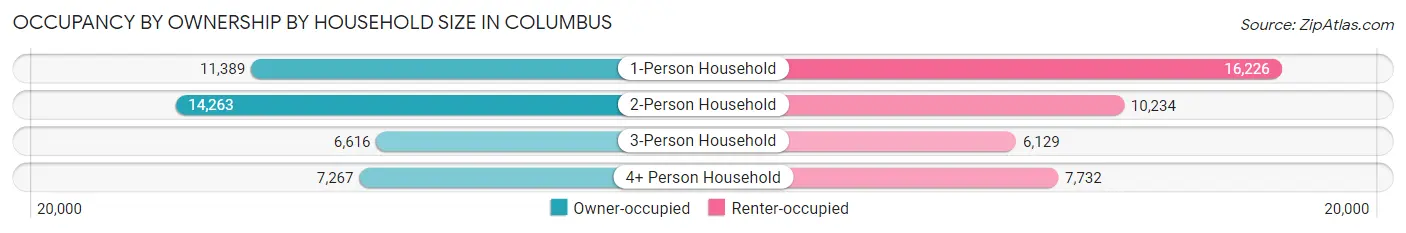
| Household Size | Owner-occupied | Renter-occupied |
| 1-Person Household | 11,389 (41.2%) | 16,226 (58.8%) |
| 2-Person Household | 14,263 (58.2%) | 10,234 (41.8%) |
| 3-Person Household | 6,616 (51.9%) | 6,129 (48.1%) |
| 4+ Person Household | 7,267 (48.4%) | 7,732 (51.5%) |
| Total Housing Units | 39,535 (49.5%) | 40,321 (50.5%) |
Occupancy by Educational Attainment in Columbus
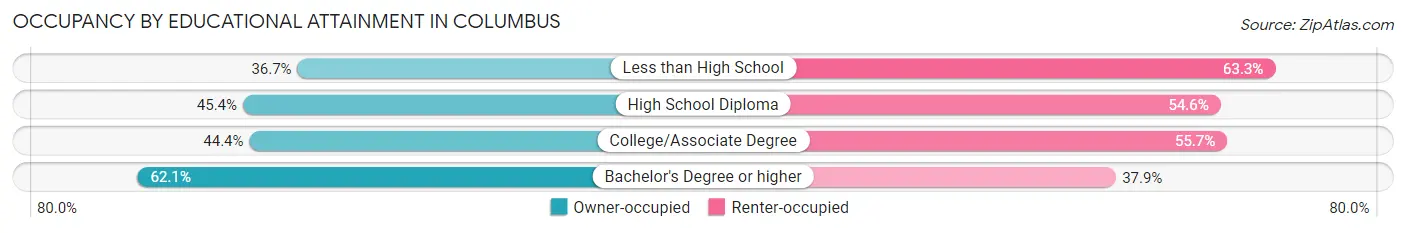
| Household Size | Owner-occupied | Renter-occupied |
| Less than High School | 2,826 (36.7%) | 4,870 (63.3%) |
| High School Diploma | 8,229 (45.4%) | 9,906 (54.6%) |
| College/Associate Degree | 12,666 (44.4%) | 15,891 (55.6%) |
| Bachelor's Degree or higher | 15,814 (62.1%) | 9,654 (37.9%) |
Occupancy by Age of Householder in Columbus
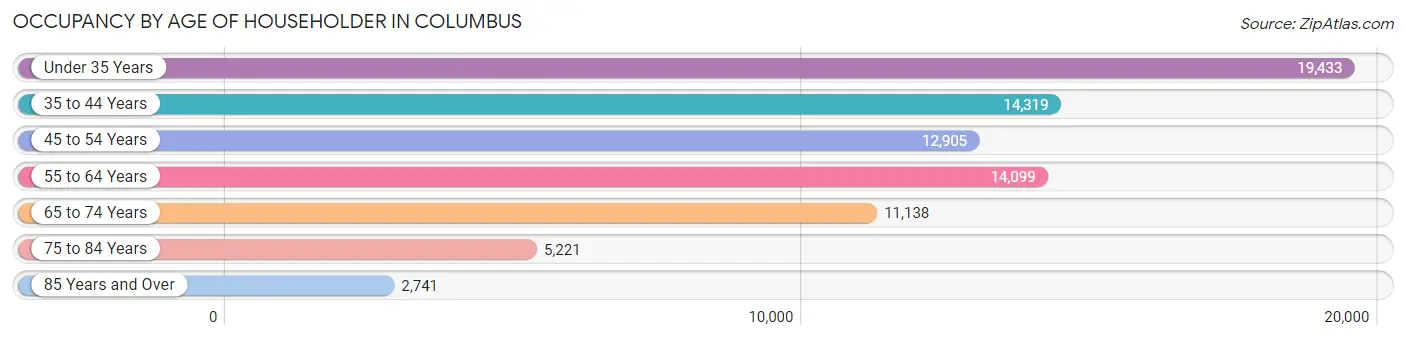
| Age Bracket | # Households | % Households |
| Under 35 Years | 19,433 | 24.3% |
| 35 to 44 Years | 14,319 | 17.9% |
| 45 to 54 Years | 12,905 | 16.2% |
| 55 to 64 Years | 14,099 | 17.7% |
| 65 to 74 Years | 11,138 | 14.0% |
| 75 to 84 Years | 5,221 | 6.5% |
| 85 Years and Over | 2,741 | 3.4% |
| Total | 79,856 | 100.0% |
Housing Finances in Columbus
Median Income by Occupancy in Columbus
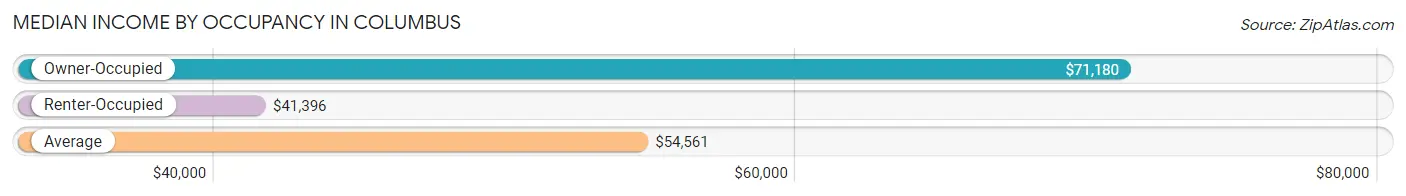
| Occupancy Type | # Households | Median Income |
| Owner-Occupied | 39,535 (49.5%) | $71,180 |
| Renter-Occupied | 40,321 (50.5%) | $41,396 |
| Average | 79,856 (100.0%) | $54,561 |
Occupancy by Householder Income Bracket in Columbus
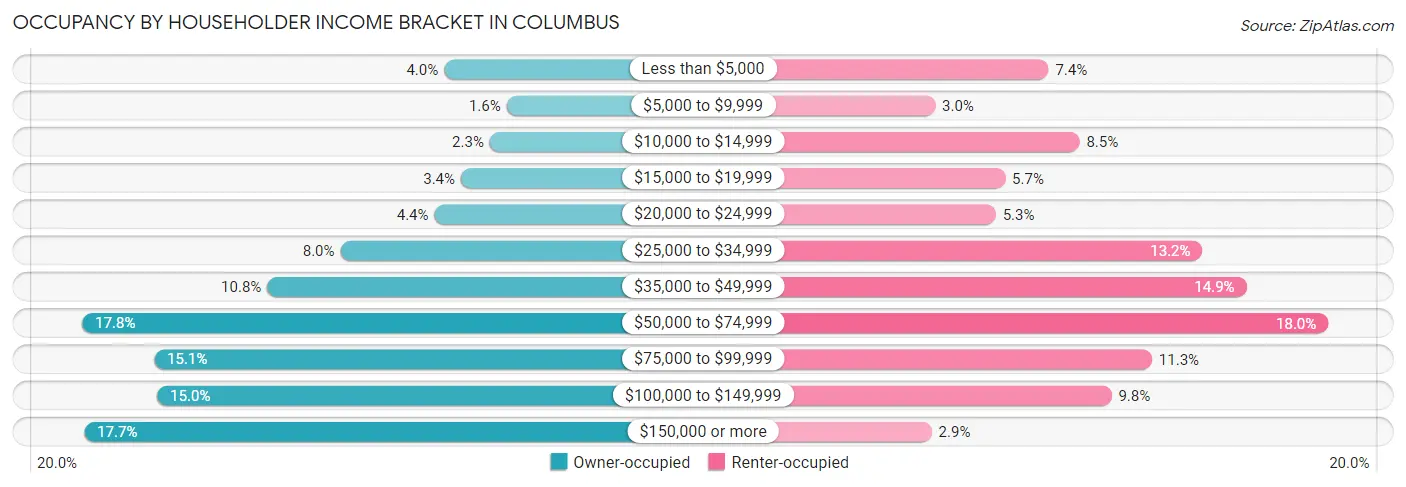
| Income Bracket | Owner-occupied | Renter-occupied |
| Less than $5,000 | 1,590 (4.0%) | 2,965 (7.3%) |
| $5,000 to $9,999 | 650 (1.6%) | 1,221 (3.0%) |
| $10,000 to $14,999 | 903 (2.3%) | 3,438 (8.5%) |
| $15,000 to $19,999 | 1,338 (3.4%) | 2,300 (5.7%) |
| $20,000 to $24,999 | 1,735 (4.4%) | 2,153 (5.3%) |
| $25,000 to $34,999 | 3,150 (8.0%) | 5,328 (13.2%) |
| $35,000 to $49,999 | 4,252 (10.8%) | 6,005 (14.9%) |
| $50,000 to $74,999 | 7,041 (17.8%) | 7,256 (18.0%) |
| $75,000 to $99,999 | 5,958 (15.1%) | 4,554 (11.3%) |
| $100,000 to $149,999 | 5,909 (14.9%) | 3,931 (9.8%) |
| $150,000 or more | 7,009 (17.7%) | 1,170 (2.9%) |
| Total | 39,535 (100.0%) | 40,321 (100.0%) |
Monthly Housing Cost Tiers in Columbus
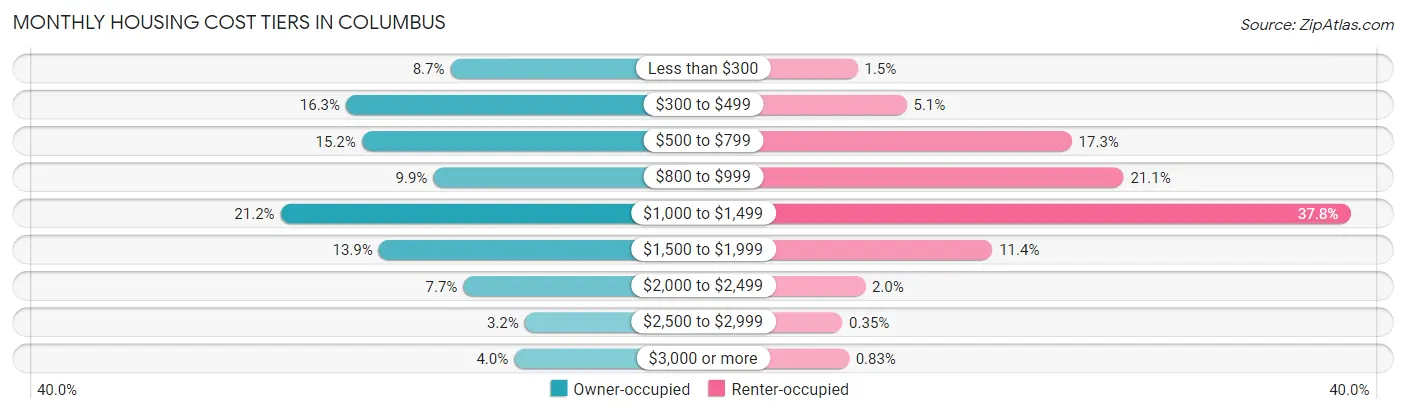
| Monthly Cost | Owner-occupied | Renter-occupied |
| Less than $300 | 3,420 (8.6%) | 597 (1.5%) |
| $300 to $499 | 6,459 (16.3%) | 2,053 (5.1%) |
| $500 to $799 | 6,002 (15.2%) | 6,957 (17.2%) |
| $800 to $999 | 3,918 (9.9%) | 8,494 (21.1%) |
| $1,000 to $1,499 | 8,365 (21.2%) | 15,224 (37.8%) |
| $1,500 to $1,999 | 5,506 (13.9%) | 4,596 (11.4%) |
| $2,000 to $2,499 | 3,046 (7.7%) | 817 (2.0%) |
| $2,500 to $2,999 | 1,258 (3.2%) | 143 (0.4%) |
| $3,000 or more | 1,561 (4.0%) | 334 (0.8%) |
| Total | 39,535 (100.0%) | 40,321 (100.0%) |
Physical Housing Characteristics in Columbus
Housing Structures in Columbus
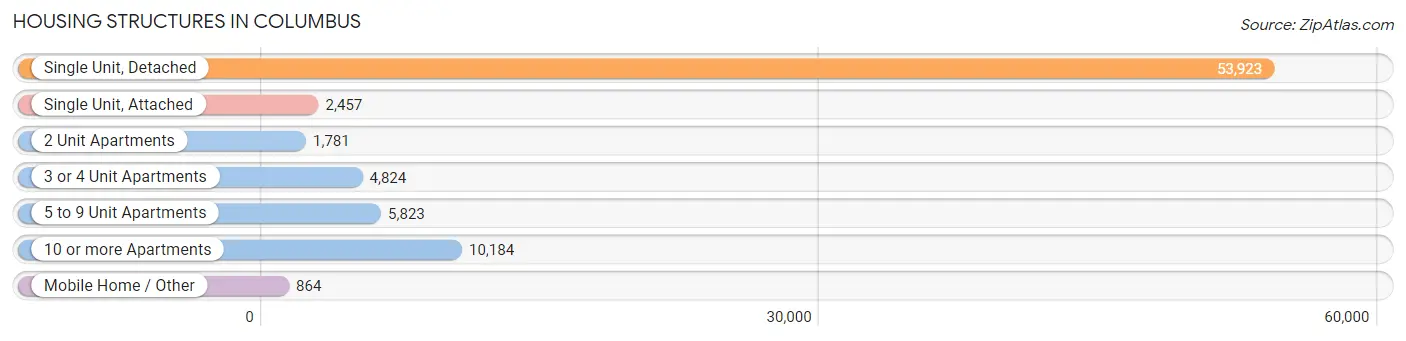
| Structure Type | # Housing Units | % Housing Units |
| Single Unit, Detached | 53,923 | 67.5% |
| Single Unit, Attached | 2,457 | 3.1% |
| 2 Unit Apartments | 1,781 | 2.2% |
| 3 or 4 Unit Apartments | 4,824 | 6.0% |
| 5 to 9 Unit Apartments | 5,823 | 7.3% |
| 10 or more Apartments | 10,184 | 12.8% |
| Mobile Home / Other | 864 | 1.1% |
| Total | 79,856 | 100.0% |
Housing Structures by Occupancy in Columbus
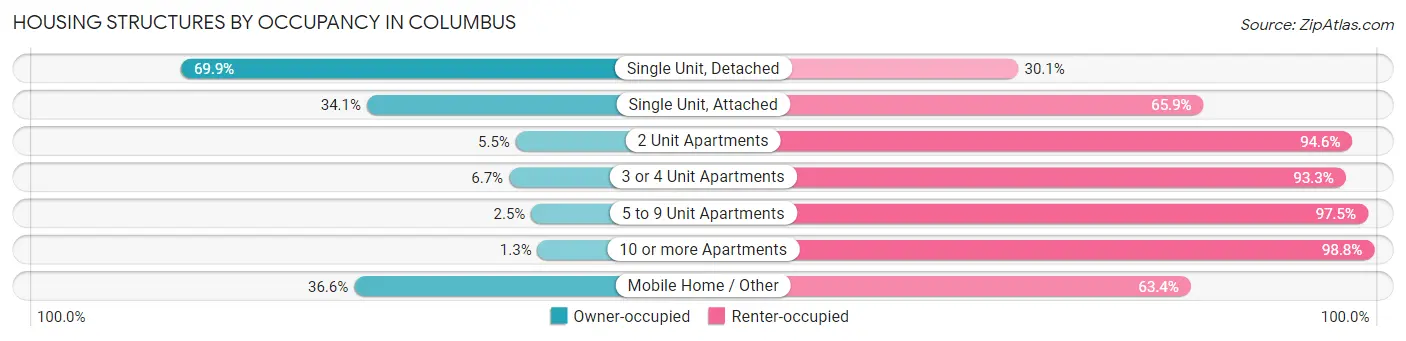
| Structure Type | Owner-occupied | Renter-occupied |
| Single Unit, Detached | 37,689 (69.9%) | 16,234 (30.1%) |
| Single Unit, Attached | 838 (34.1%) | 1,619 (65.9%) |
| 2 Unit Apartments | 97 (5.4%) | 1,684 (94.6%) |
| 3 or 4 Unit Apartments | 325 (6.7%) | 4,499 (93.3%) |
| 5 to 9 Unit Apartments | 143 (2.5%) | 5,680 (97.5%) |
| 10 or more Apartments | 127 (1.3%) | 10,057 (98.8%) |
| Mobile Home / Other | 316 (36.6%) | 548 (63.4%) |
| Total | 39,535 (49.5%) | 40,321 (50.5%) |
Housing Structures by Number of Rooms in Columbus
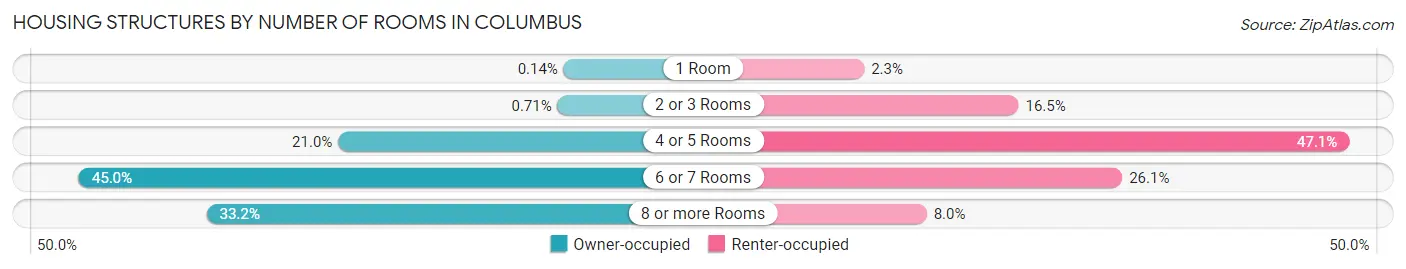
| Number of Rooms | Owner-occupied | Renter-occupied |
| 1 Room | 55 (0.1%) | 906 (2.2%) |
| 2 or 3 Rooms | 282 (0.7%) | 6,662 (16.5%) |
| 4 or 5 Rooms | 8,302 (21.0%) | 18,989 (47.1%) |
| 6 or 7 Rooms | 17,781 (45.0%) | 10,527 (26.1%) |
| 8 or more Rooms | 13,115 (33.2%) | 3,237 (8.0%) |
| Total | 39,535 (100.0%) | 40,321 (100.0%) |
Housing Structure by Heating Type in Columbus
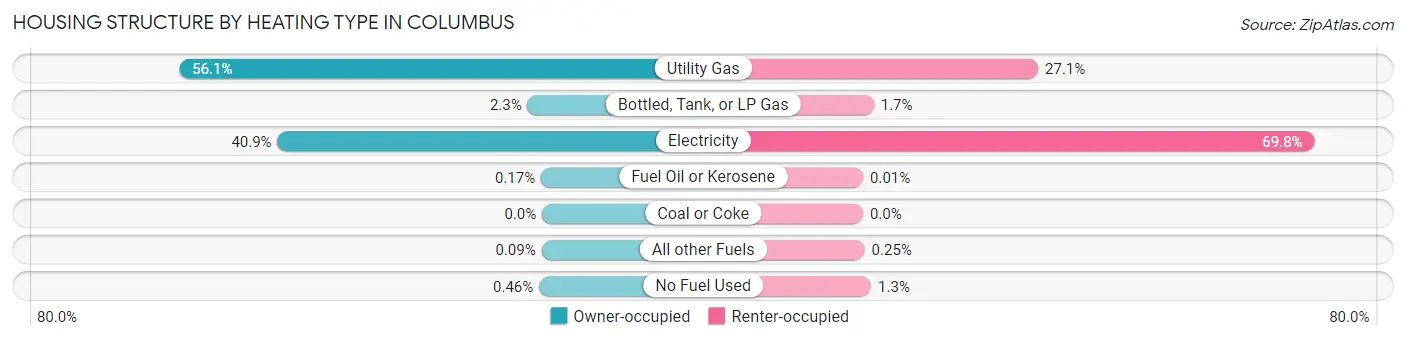
| Heating Type | Owner-occupied | Renter-occupied |
| Utility Gas | 22,186 (56.1%) | 10,910 (27.1%) |
| Bottled, Tank, or LP Gas | 890 (2.2%) | 670 (1.7%) |
| Electricity | 16,173 (40.9%) | 28,132 (69.8%) |
| Fuel Oil or Kerosene | 68 (0.2%) | 3 (0.0%) |
| Coal or Coke | 0 (0.0%) | 0 (0.0%) |
| All other Fuels | 36 (0.1%) | 100 (0.3%) |
| No Fuel Used | 182 (0.5%) | 506 (1.3%) |
| Total | 39,535 (100.0%) | 40,321 (100.0%) |
Household Vehicle Usage in Columbus
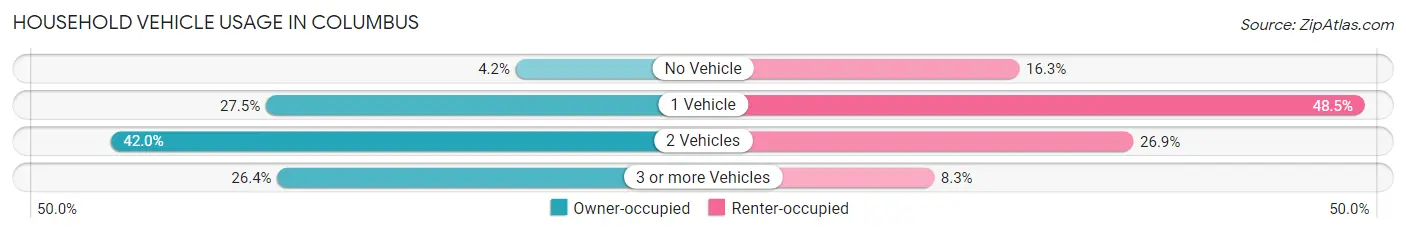
| Vehicles per Household | Owner-occupied | Renter-occupied |
| No Vehicle | 1,640 (4.2%) | 6,558 (16.3%) |
| 1 Vehicle | 10,857 (27.5%) | 19,568 (48.5%) |
| 2 Vehicles | 16,600 (42.0%) | 10,847 (26.9%) |
| 3 or more Vehicles | 10,438 (26.4%) | 3,348 (8.3%) |
| Total | 39,535 (100.0%) | 40,321 (100.0%) |
Real Estate & Mortgages in Columbus
Real Estate and Mortgage Overview in Columbus
| Characteristic | Without Mortgage | With Mortgage |
| Housing Units | 15,064 | 24,471 |
| Median Property Value | $133,500 | $189,200 |
| Median Household Income | $50,969 | $5,437 |
| Monthly Housing Costs | $431 | $1,495 |
| Real Estate Taxes | $910 | $2,694 |
Property Value by Mortgage Status in Columbus
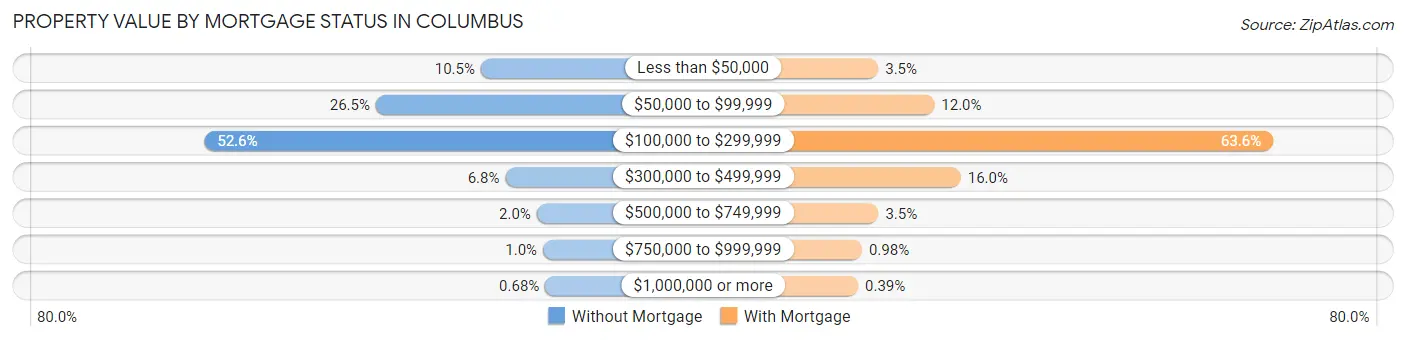
| Property Value | Without Mortgage | With Mortgage |
| Less than $50,000 | 1,580 (10.5%) | 849 (3.5%) |
| $50,000 to $99,999 | 3,990 (26.5%) | 2,938 (12.0%) |
| $100,000 to $299,999 | 7,925 (52.6%) | 15,568 (63.6%) |
| $300,000 to $499,999 | 1,017 (6.8%) | 3,926 (16.0%) |
| $500,000 to $749,999 | 297 (2.0%) | 853 (3.5%) |
| $750,000 to $999,999 | 153 (1.0%) | 241 (1.0%) |
| $1,000,000 or more | 102 (0.7%) | 96 (0.4%) |
| Total | 15,064 (100.0%) | 24,471 (100.0%) |
Household Income by Mortgage Status in Columbus
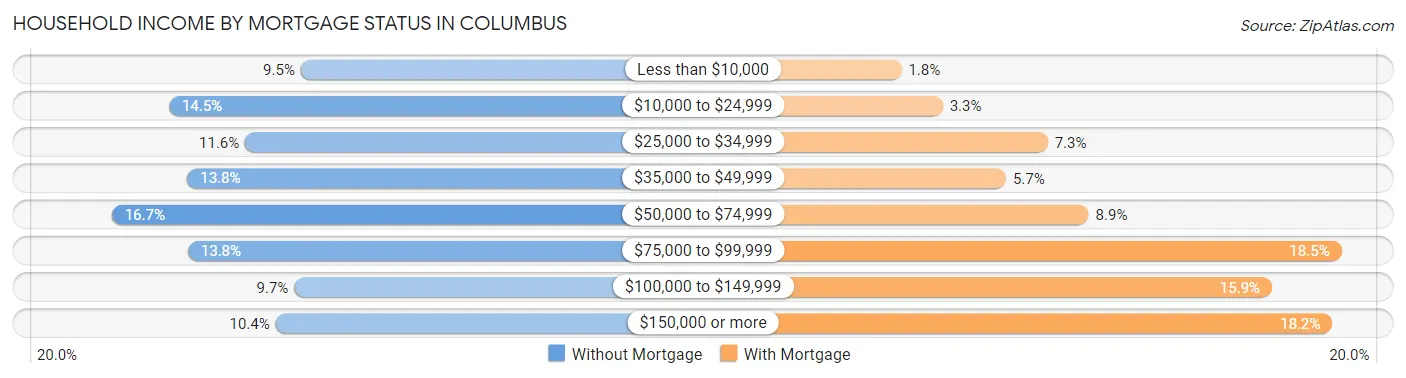
| Household Income | Without Mortgage | With Mortgage |
| Less than $10,000 | 1,428 (9.5%) | 428 (1.8%) |
| $10,000 to $24,999 | 2,184 (14.5%) | 812 (3.3%) |
| $25,000 to $34,999 | 1,748 (11.6%) | 1,792 (7.3%) |
| $35,000 to $49,999 | 2,079 (13.8%) | 1,402 (5.7%) |
| $50,000 to $74,999 | 2,512 (16.7%) | 2,173 (8.9%) |
| $75,000 to $99,999 | 2,076 (13.8%) | 4,529 (18.5%) |
| $100,000 to $149,999 | 1,465 (9.7%) | 3,882 (15.9%) |
| $150,000 or more | 1,572 (10.4%) | 4,444 (18.2%) |
| Total | 15,064 (100.0%) | 24,471 (100.0%) |
Property Value to Household Income Ratio in Columbus
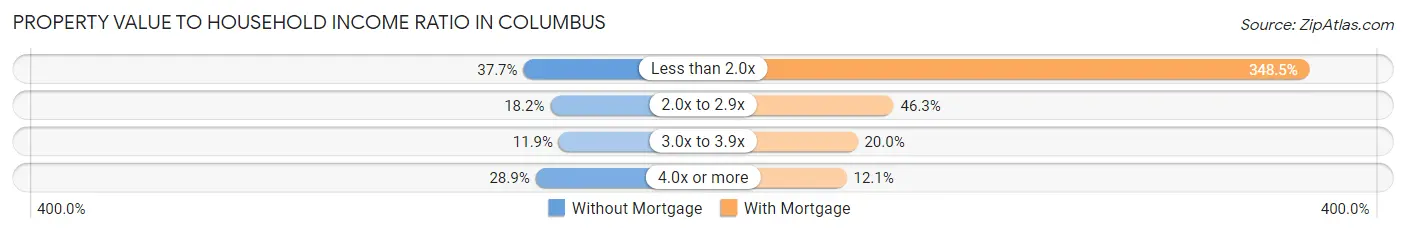
| Value-to-Income Ratio | Without Mortgage | With Mortgage |
| Less than 2.0x | 5,677 (37.7%) | 85,270 (348.5%) |
| 2.0x to 2.9x | 2,735 (18.2%) | 11,322 (46.3%) |
| 3.0x to 3.9x | 1,791 (11.9%) | 4,901 (20.0%) |
| 4.0x or more | 4,349 (28.9%) | 2,958 (12.1%) |
| Total | 15,064 (100.0%) | 24,471 (100.0%) |
Real Estate Taxes by Mortgage Status in Columbus
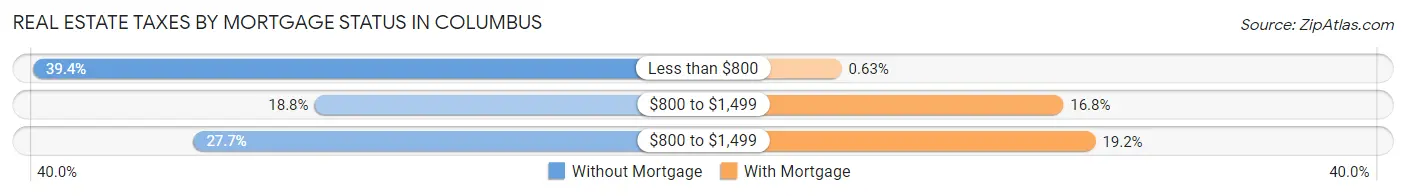
| Property Taxes | Without Mortgage | With Mortgage |
| Less than $800 | 5,933 (39.4%) | 153 (0.6%) |
| $800 to $1,499 | 2,837 (18.8%) | 4,116 (16.8%) |
| $800 to $1,499 | 4,166 (27.7%) | 4,692 (19.2%) |
| Total | 15,064 (100.0%) | 24,471 (100.0%) |
Health & Disability in Columbus
Health Insurance Coverage by Age in Columbus
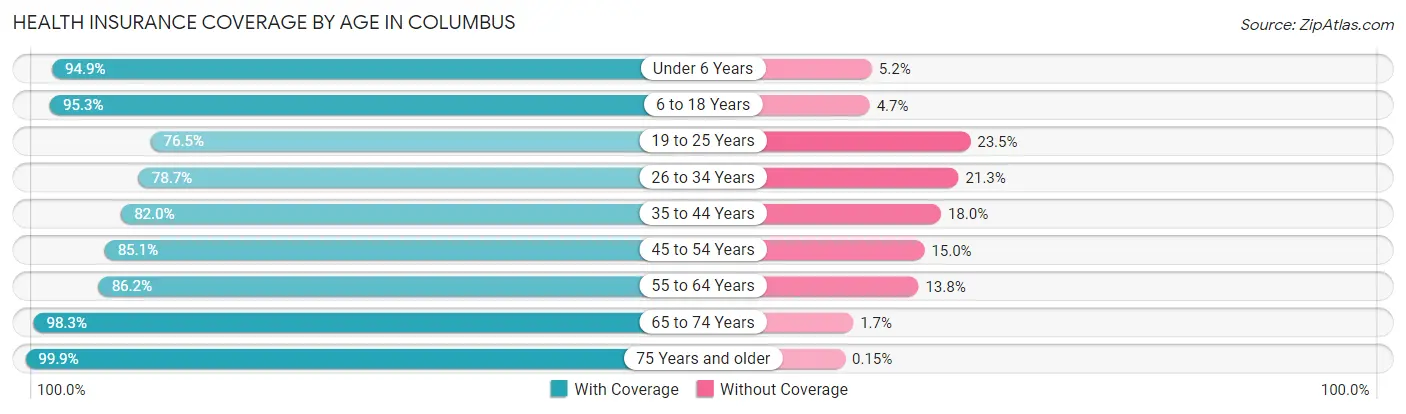
| Age Bracket | With Coverage | Without Coverage |
| Under 6 Years | 16,383 (94.9%) | 889 (5.1%) |
| 6 to 18 Years | 34,512 (95.3%) | 1,719 (4.7%) |
| 19 to 25 Years | 13,197 (76.5%) | 4,055 (23.5%) |
| 26 to 34 Years | 20,099 (78.7%) | 5,447 (21.3%) |
| 35 to 44 Years | 20,387 (82.0%) | 4,484 (18.0%) |
| 45 to 54 Years | 18,787 (85.1%) | 3,302 (14.9%) |
| 55 to 64 Years | 20,007 (86.2%) | 3,210 (13.8%) |
| 65 to 74 Years | 16,477 (98.3%) | 280 (1.7%) |
| 75 Years and older | 11,382 (99.9%) | 17 (0.2%) |
| Total | 171,231 (88.0%) | 23,403 (12.0%) |
Health Insurance Coverage by Citizenship Status in Columbus
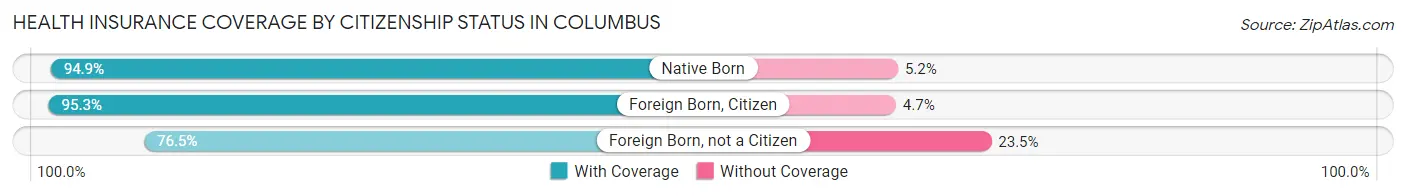
| Citizenship Status | With Coverage | Without Coverage |
| Native Born | 16,383 (94.9%) | 889 (5.1%) |
| Foreign Born, Citizen | 34,512 (95.3%) | 1,719 (4.7%) |
| Foreign Born, not a Citizen | 13,197 (76.5%) | 4,055 (23.5%) |
Health Insurance Coverage by Household Income in Columbus
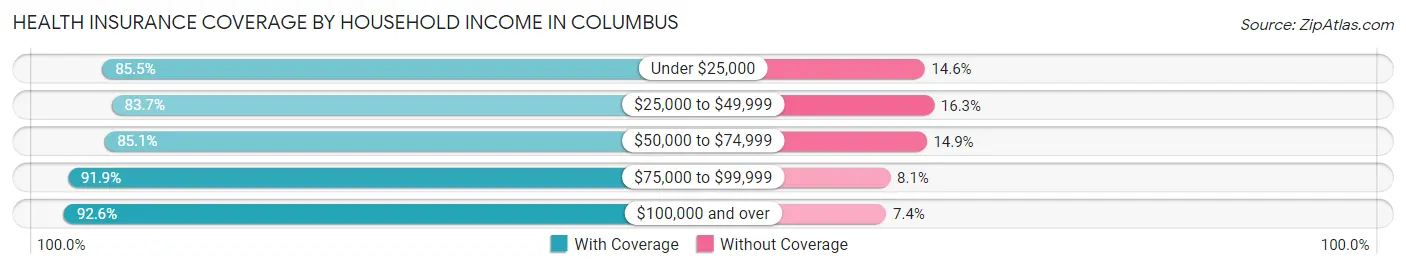
| Household Income | With Coverage | Without Coverage |
| Under $25,000 | 29,954 (85.5%) | 5,099 (14.5%) |
| $25,000 to $49,999 | 33,713 (83.7%) | 6,569 (16.3%) |
| $50,000 to $74,999 | 27,986 (85.1%) | 4,909 (14.9%) |
| $75,000 to $99,999 | 26,418 (91.9%) | 2,333 (8.1%) |
| $100,000 and over | 51,653 (92.6%) | 4,102 (7.4%) |
Public vs Private Health Insurance Coverage by Age in Columbus
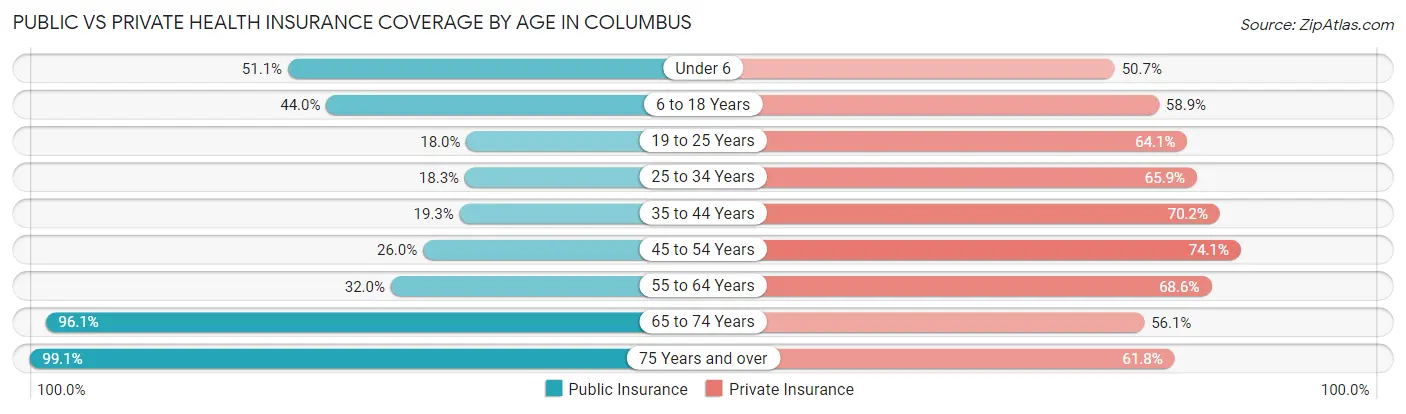
| Age Bracket | Public Insurance | Private Insurance |
| Under 6 | 8,832 (51.1%) | 8,750 (50.7%) |
| 6 to 18 Years | 15,941 (44.0%) | 21,327 (58.9%) |
| 19 to 25 Years | 3,109 (18.0%) | 11,062 (64.1%) |
| 25 to 34 Years | 4,667 (18.3%) | 16,837 (65.9%) |
| 35 to 44 Years | 4,793 (19.3%) | 17,446 (70.2%) |
| 45 to 54 Years | 5,751 (26.0%) | 16,356 (74.1%) |
| 55 to 64 Years | 7,436 (32.0%) | 15,920 (68.6%) |
| 65 to 74 Years | 16,108 (96.1%) | 9,405 (56.1%) |
| 75 Years and over | 11,299 (99.1%) | 7,040 (61.8%) |
| Total | 77,936 (40.0%) | 124,143 (63.8%) |
Disability Status by Sex by Age in Columbus
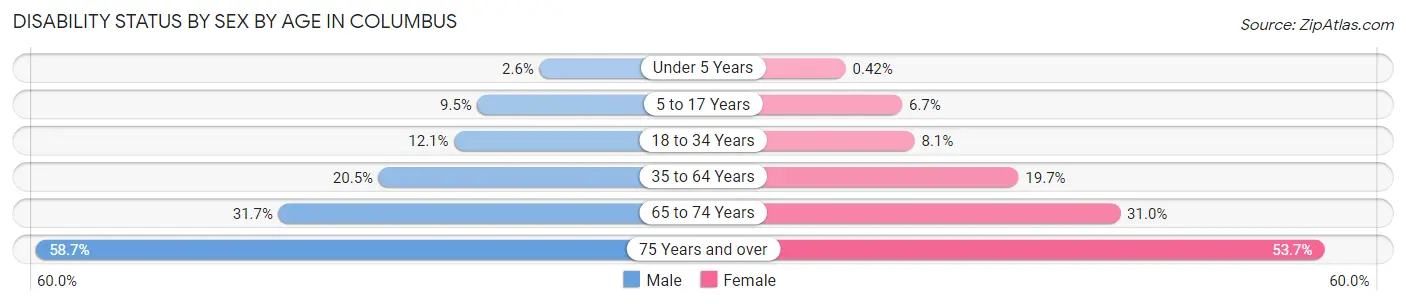
| Age Bracket | Male | Female |
| Under 5 Years | 190 (2.6%) | 29 (0.4%) |
| 5 to 17 Years | 1,790 (9.5%) | 1,191 (6.7%) |
| 18 to 34 Years | 2,481 (12.1%) | 2,039 (8.1%) |
| 35 to 64 Years | 6,635 (20.5%) | 7,452 (19.7%) |
| 65 to 74 Years | 2,345 (31.7%) | 2,901 (31.0%) |
| 75 Years and over | 2,426 (58.7%) | 3,904 (53.7%) |
Disability Class by Sex by Age in Columbus
Disability Class: Hearing Difficulty
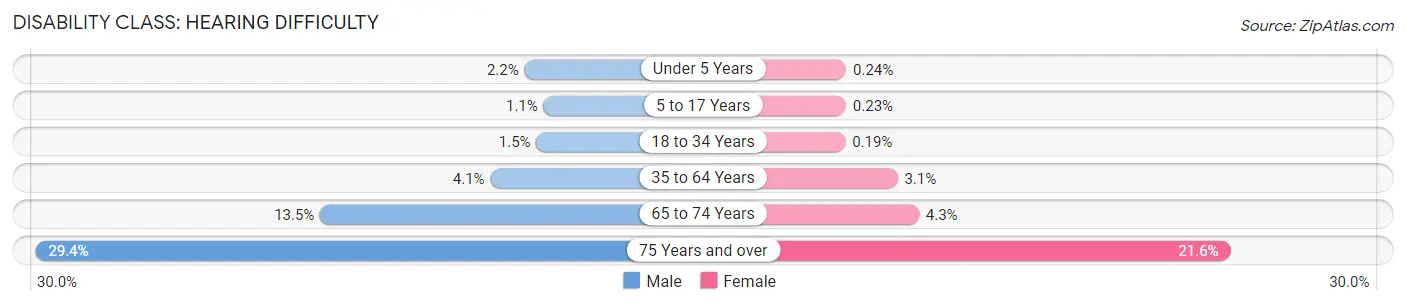
| Age Bracket | Male | Female |
| Under 5 Years | 156 (2.2%) | 17 (0.2%) |
| 5 to 17 Years | 207 (1.1%) | 41 (0.2%) |
| 18 to 34 Years | 306 (1.5%) | 48 (0.2%) |
| 35 to 64 Years | 1,310 (4.1%) | 1,176 (3.1%) |
| 65 to 74 Years | 1,002 (13.5%) | 401 (4.3%) |
| 75 Years and over | 1,215 (29.4%) | 1,572 (21.6%) |
Disability Class: Vision Difficulty
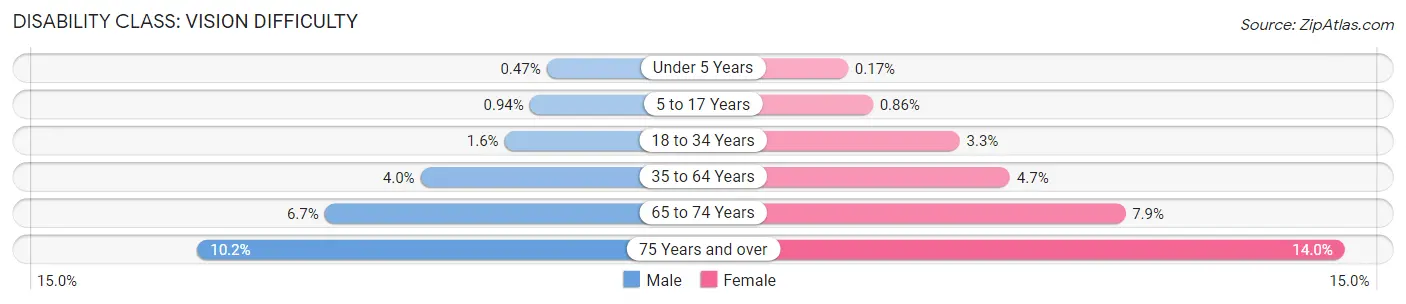
| Age Bracket | Male | Female |
| Under 5 Years | 34 (0.5%) | 12 (0.2%) |
| 5 to 17 Years | 177 (0.9%) | 152 (0.9%) |
| 18 to 34 Years | 336 (1.6%) | 826 (3.3%) |
| 35 to 64 Years | 1,287 (4.0%) | 1,771 (4.7%) |
| 65 to 74 Years | 492 (6.7%) | 738 (7.9%) |
| 75 Years and over | 421 (10.2%) | 1,017 (14.0%) |
Disability Class: Cognitive Difficulty
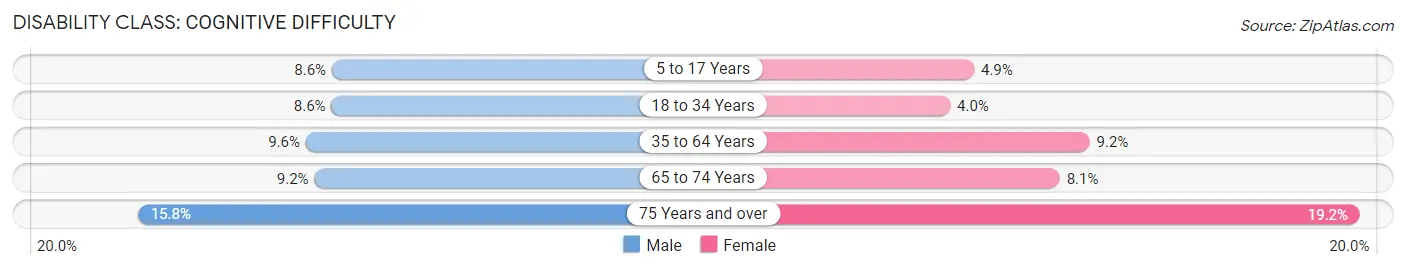
| Age Bracket | Male | Female |
| 5 to 17 Years | 1,611 (8.6%) | 872 (4.9%) |
| 18 to 34 Years | 1,760 (8.6%) | 1,011 (4.0%) |
| 35 to 64 Years | 3,089 (9.6%) | 3,483 (9.2%) |
| 65 to 74 Years | 684 (9.2%) | 757 (8.1%) |
| 75 Years and over | 653 (15.8%) | 1,397 (19.2%) |
Disability Class: Ambulatory Difficulty
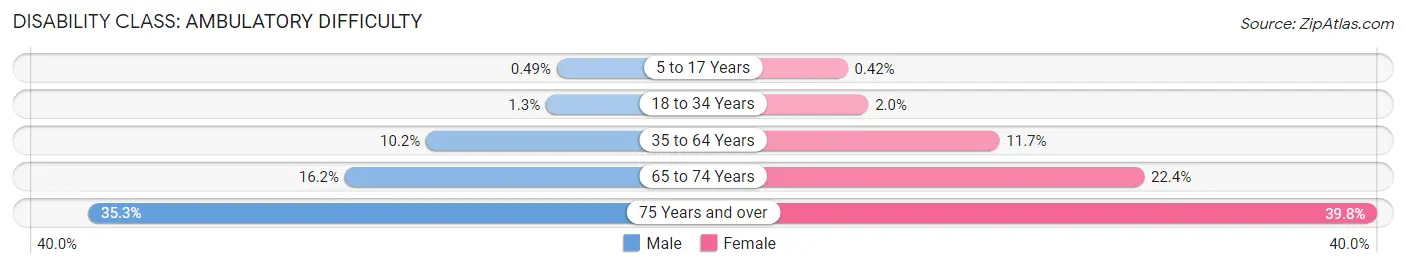
| Age Bracket | Male | Female |
| 5 to 17 Years | 91 (0.5%) | 74 (0.4%) |
| 18 to 34 Years | 263 (1.3%) | 494 (2.0%) |
| 35 to 64 Years | 3,290 (10.2%) | 4,433 (11.7%) |
| 65 to 74 Years | 1,200 (16.2%) | 2,100 (22.4%) |
| 75 Years and over | 1,458 (35.3%) | 2,888 (39.8%) |
Disability Class: Self-Care Difficulty
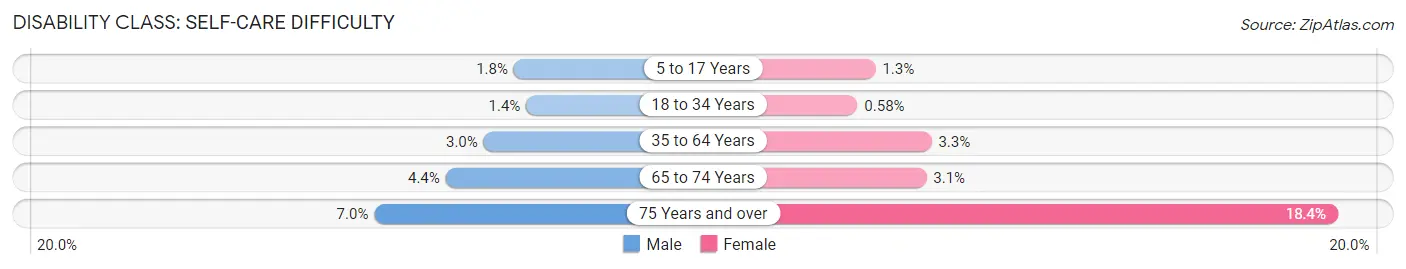
| Age Bracket | Male | Female |
| 5 to 17 Years | 346 (1.8%) | 222 (1.3%) |
| 18 to 34 Years | 282 (1.4%) | 146 (0.6%) |
| 35 to 64 Years | 955 (3.0%) | 1,261 (3.3%) |
| 65 to 74 Years | 323 (4.4%) | 294 (3.1%) |
| 75 Years and over | 290 (7.0%) | 1,338 (18.4%) |
Technology Access in Columbus
Computing Device Access in Columbus
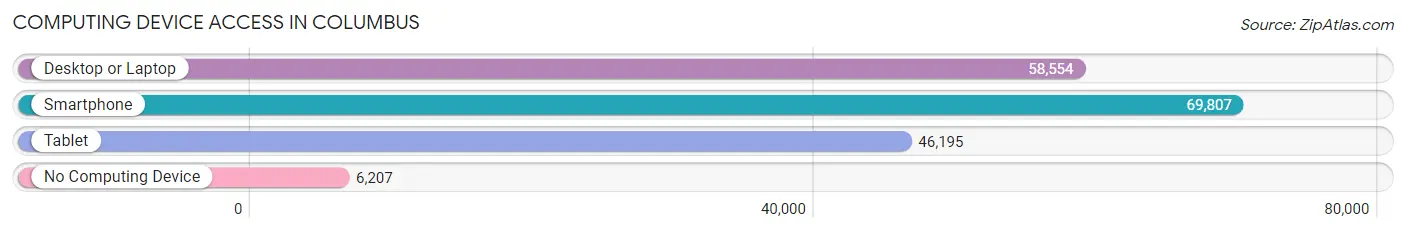
| Device Type | # Households | % Households |
| Desktop or Laptop | 58,554 | 73.3% |
| Smartphone | 69,807 | 87.4% |
| Tablet | 46,195 | 57.9% |
| No Computing Device | 6,207 | 7.8% |
| Total | 79,856 | 100.0% |
Internet Access in Columbus
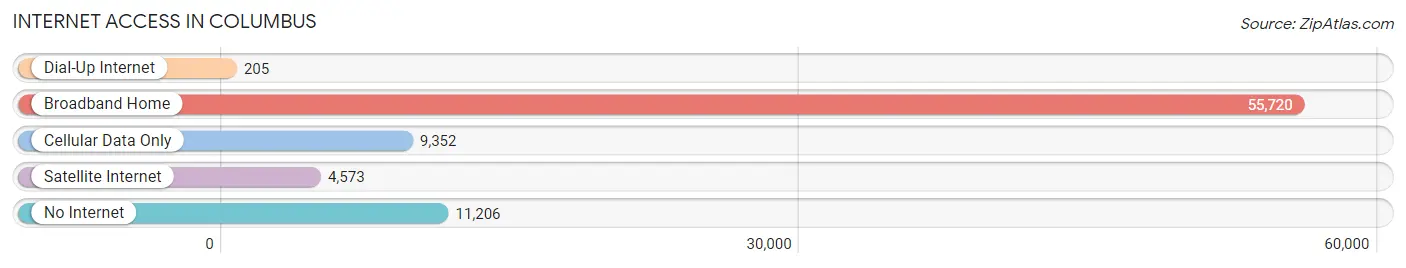
| Internet Type | # Households | % Households |
| Dial-Up Internet | 205 | 0.3% |
| Broadband Home | 55,720 | 69.8% |
| Cellular Data Only | 9,352 | 11.7% |
| Satellite Internet | 4,573 | 5.7% |
| No Internet | 11,206 | 14.0% |
| Total | 79,856 | 100.0% |
Columbus Summary
Columbus, Georgia is a city located in the western part of the state, in Muscogee County. It is the second-largest city in Georgia, with a population of 189,885 as of the 2010 census. The city is situated along the Chattahoochee River, and is the county seat of Muscogee County.
History
The area that is now Columbus was first inhabited by Native Americans, including the Creek and Cherokee tribes. The Creek were the first to settle in the area, and the city was named after Christopher Columbus. The city was founded in 1828, and was incorporated in 1854.
During the Civil War, Columbus was a major supply center for the Confederate Army. The city was also the site of several battles, including the Battle of Columbus in April 1865. After the war, the city was rebuilt and experienced a period of growth and prosperity.
Geography
Columbus is located in western Georgia, in Muscogee County. It is situated along the Chattahoochee River, and is the county seat of Muscogee County. The city has a total area of 221.5 square miles, of which 217.2 square miles is land and 4.3 square miles is water.
The city is located in the Piedmont region of Georgia, and is characterized by rolling hills and a humid subtropical climate. The average temperature in the city is around 70 degrees Fahrenheit, and the average annual precipitation is around 50 inches.
Economy
The economy of Columbus is largely based on the service industry, with the city being home to several large companies, including Aflac, TSYS, and Synovus. The city is also home to several military installations, including Fort Benning, the largest Army installation in the United States.
The city is also home to several educational institutions, including Columbus State University, Columbus Technical College, and Troy University. The city is also home to several museums, including the National Infantry Museum and the Columbus Museum.
Demographics
As of the 2010 census, the population of Columbus was 189,885. The racial makeup of the city was 57.2% White, 35.2% African American, 0.5% Native American, 2.3% Asian, 0.1% Pacific Islander, 2.7% from other races, and 2.0% from two or more races. Hispanic or Latino of any race were 5.7% of the population.
The median income for a household in the city was $37,837, and the median income for a family was $45,845. The per capita income for the city was $20,945. About 17.2% of the population was below the poverty line.
Conclusion
Columbus, Georgia is a city located in the western part of the state, in Muscogee County. It is the second-largest city in Georgia, with a population of 189,885 as of the 2010 census. The city is situated along the Chattahoochee River, and is the county seat of Muscogee County. The area was first inhabited by Native Americans, and was later founded in 1828. During the Civil War, Columbus was a major supply center for the Confederate Army. The city has a humid subtropical climate, and the economy is largely based on the service industry. The population of Columbus is largely White and African American, and the median income for a household in the city was $37,837.
Common Questions
What is Per Capita Income in Columbus?
Per Capita income in Columbus is $30,980.
What is the Median Family Income in Columbus?
Median Family Income in Columbus is $69,623.
What is the Median Household income in Columbus?
Median Household Income in Columbus is $54,561.
What is Income or Wage Gap in Columbus?
Income or Wage Gap in Columbus is 27.9%.
Women in Columbus earn 72.1 cents for every dollar earned by a man.
What is Family Income Deficit in Columbus?
Family Income Deficit in Columbus is $11,626.
Families that are below poverty line in Columbus earn $11,626 less on average than the poverty threshold level.
What is Inequality or Gini Index in Columbus?
Inequality or Gini Index in Columbus is 0.48.
What is the Total Population of Columbus?
Total Population of Columbus is 204,572.
What is the Total Male Population of Columbus?
Total Male Population of Columbus is 98,973.
What is the Total Female Population of Columbus?
Total Female Population of Columbus is 105,599.
What is the Ratio of Males per 100 Females in Columbus?
There are 93.73 Males per 100 Females in Columbus.
What is the Ratio of Females per 100 Males in Columbus?
There are 106.69 Females per 100 Males in Columbus.
What is the Median Population Age in Columbus?
Median Population Age in Columbus is 34.9 Years.
What is the Average Family Size in Columbus
Average Family Size in Columbus is 3.2 People.
What is the Average Household Size in Columbus
Average Household Size in Columbus is 2.5 People.
How Large is the Labor Force in Columbus?
There are 96,514 People in the Labor Forcein in Columbus.
What is the Percentage of People in the Labor Force in Columbus?
60.7% of People are in the Labor Force in Columbus.
What is the Unemployment Rate in Columbus?
Unemployment Rate in Columbus is 7.3%.