Winston Salem, NC Map & Demographics
Winston Salem Map
Winston Salem Overview
$33,279
PER CAPITA INCOME
$71,260
AVG FAMILY INCOME
$54,416
AVG HOUSEHOLD INCOME
21.3%
WAGE / INCOME GAP [ % ]
78.7¢/ $1
WAGE / INCOME GAP [ $ ]
$11,963
FAMILY INCOME DEFICIT
0.50
INEQUALITY / GINI INDEX
249,571
TOTAL POPULATION
117,916
MALE POPULATION
131,655
FEMALE POPULATION
89.56
MALES / 100 FEMALES
111.65
FEMALES / 100 MALES
35.7
MEDIAN AGE
3.2
AVG FAMILY SIZE
2.4
AVG HOUSEHOLD SIZE
122,161
LABOR FORCE [ PEOPLE ]
61.6%
PERCENT IN LABOR FORCE
6.2%
UNEMPLOYMENT RATE
Winston Salem Area Codes
Income in Winston Salem
Income Overview in Winston Salem
Per Capita Income in Winston Salem is $33,279, while median incomes of families and households are $71,260 and $54,416 respectively.
| Characteristic | Number | Measure |
| Per Capita Income | 249,571 | $33,279 |
| Median Family Income | 57,451 | $71,260 |
| Mean Family Income | 57,451 | $101,165 |
| Median Household Income | 98,749 | $54,416 |
| Mean Household Income | 98,749 | $81,391 |
| Income Deficit | 57,451 | $11,963 |
| Wage / Income Gap (%) | 249,571 | 21.30% |
| Wage / Income Gap ($) | 249,571 | 78.70¢ per $1 |
| Gini / Inequality Index | 249,571 | 0.50 |
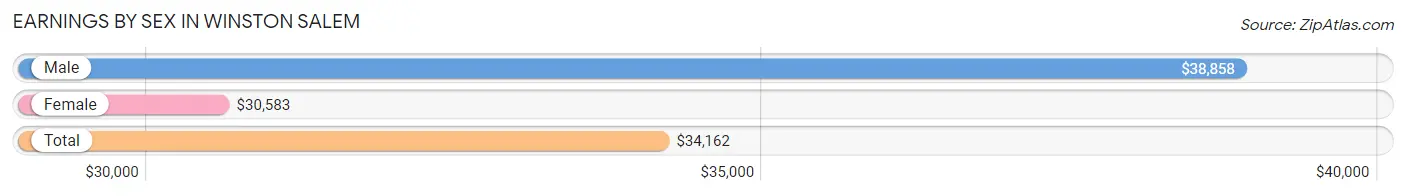
Earnings by Sex in Winston Salem
Average Earnings in Winston Salem are $34,162, $38,858 for men and $30,583 for women, a difference of 21.3%.
| Sex | Number | Average Earnings |
| Male | 62,494 (49.5%) | $38,858 |
| Female | 63,665 (50.5%) | $30,583 |
| Total | 126,159 (100.0%) | $34,162 |
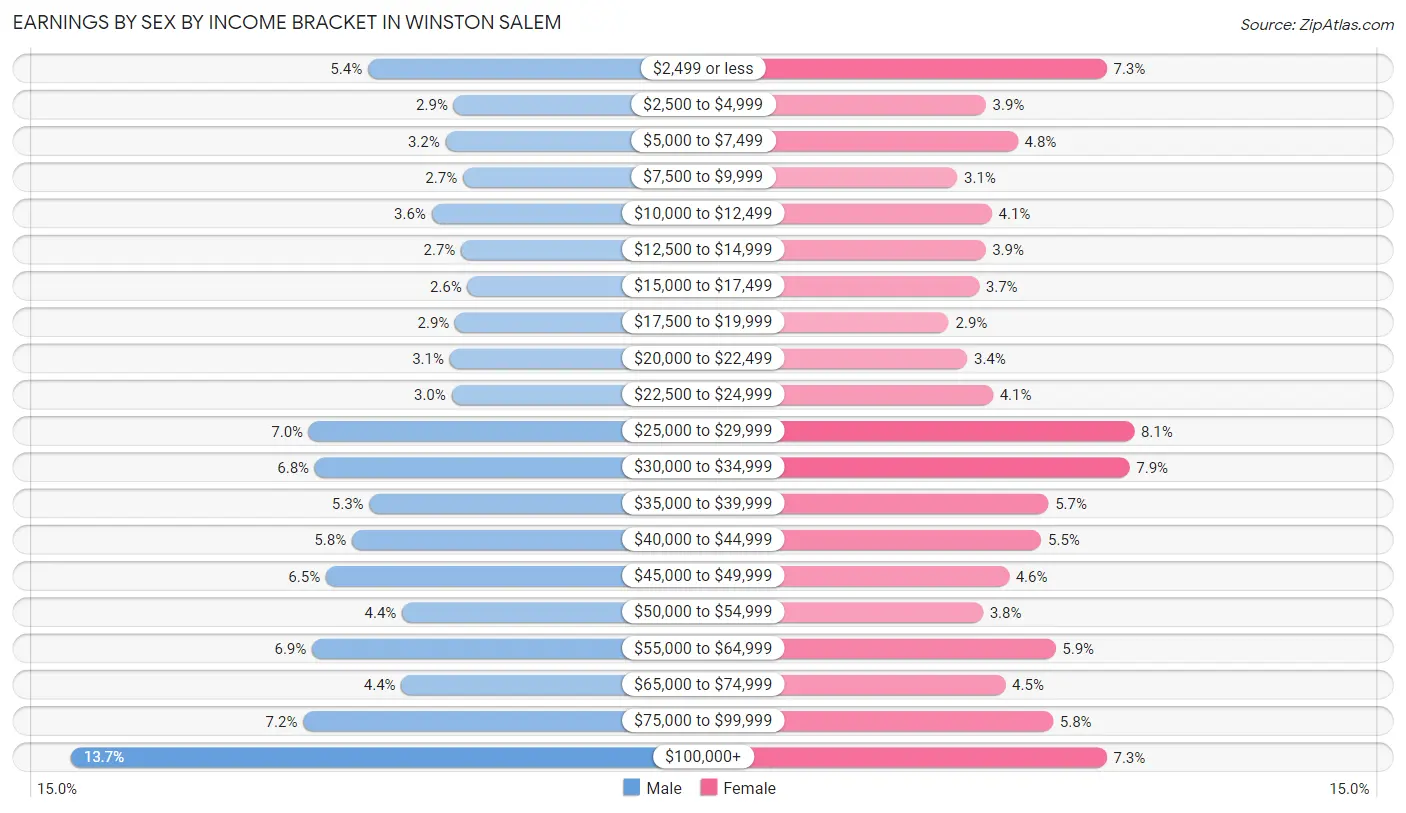
Earnings by Sex by Income Bracket in Winston Salem
The most common earnings brackets in Winston Salem are $100,000+ for men (8,561 | 13.7%) and $25,000 to $29,999 for women (5,135 | 8.1%).
| Income | Male | Female |
| $2,499 or less | 3,342 (5.3%) | 4,647 (7.3%) |
| $2,500 to $4,999 | 1,835 (2.9%) | 2,485 (3.9%) |
| $5,000 to $7,499 | 1,982 (3.2%) | 3,057 (4.8%) |
| $7,500 to $9,999 | 1,676 (2.7%) | 1,974 (3.1%) |
| $10,000 to $12,499 | 2,222 (3.6%) | 2,591 (4.1%) |
| $12,500 to $14,999 | 1,708 (2.7%) | 2,477 (3.9%) |
| $15,000 to $17,499 | 1,592 (2.5%) | 2,364 (3.7%) |
| $17,500 to $19,999 | 1,813 (2.9%) | 1,824 (2.9%) |
| $20,000 to $22,499 | 1,909 (3.0%) | 2,153 (3.4%) |
| $22,500 to $24,999 | 1,872 (3.0%) | 2,608 (4.1%) |
| $25,000 to $29,999 | 4,382 (7.0%) | 5,135 (8.1%) |
| $30,000 to $34,999 | 4,276 (6.8%) | 5,054 (7.9%) |
| $35,000 to $39,999 | 3,317 (5.3%) | 3,604 (5.7%) |
| $40,000 to $44,999 | 3,626 (5.8%) | 3,476 (5.5%) |
| $45,000 to $49,999 | 4,078 (6.5%) | 2,895 (4.5%) |
| $50,000 to $54,999 | 2,742 (4.4%) | 2,429 (3.8%) |
| $55,000 to $64,999 | 4,327 (6.9%) | 3,730 (5.9%) |
| $65,000 to $74,999 | 2,754 (4.4%) | 2,830 (4.4%) |
| $75,000 to $99,999 | 4,480 (7.2%) | 3,684 (5.8%) |
| $100,000+ | 8,561 (13.7%) | 4,648 (7.3%) |
| Total | 62,494 (100.0%) | 63,665 (100.0%) |
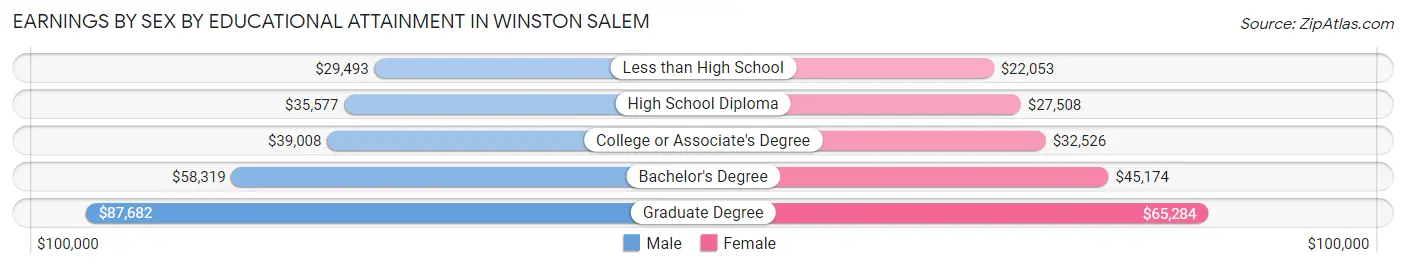
Earnings by Sex by Educational Attainment in Winston Salem
Average earnings in Winston Salem are $44,090 for men and $35,156 for women, a difference of 20.3%. Men with an educational attainment of graduate degree enjoy the highest average annual earnings of $87,682, while those with less than high school education earn the least with $29,493. Women with an educational attainment of graduate degree earn the most with the average annual earnings of $65,284, while those with less than high school education have the smallest earnings of $22,053.
| Educational Attainment | Male Income | Female Income |
| Less than High School | $29,493 | $22,053 |
| High School Diploma | $35,577 | $27,508 |
| College or Associate's Degree | $39,008 | $32,526 |
| Bachelor's Degree | $58,319 | $45,174 |
| Graduate Degree | $87,682 | $65,284 |
| Total | $44,090 | $35,156 |
Family Income in Winston Salem
Family Income Brackets in Winston Salem
According to the Winston Salem family income data, there are 10,111 families falling into the $100,000 to $149,999 income range, which is the most common income bracket and makes up 17.6% of all families. Conversely, the $10,000 to $14,999 income bracket is the least frequent group with only 1,379 families (2.4%) belonging to this category.
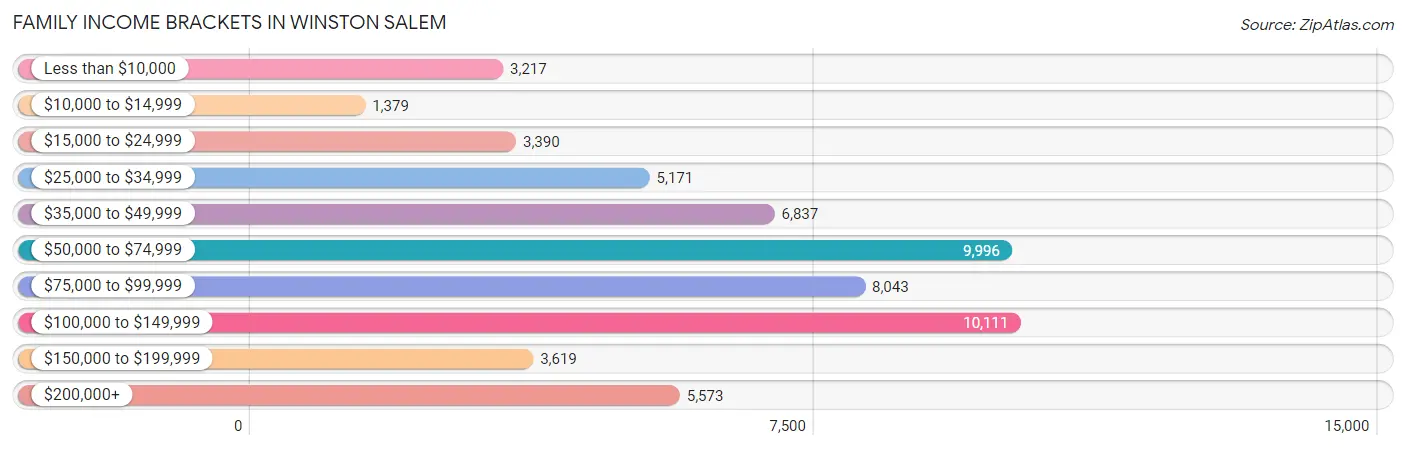
| Income Bracket | # Families | % Families |
| Less than $10,000 | 3,217 | 5.6% |
| $10,000 to $14,999 | 1,379 | 2.4% |
| $15,000 to $24,999 | 3,390 | 5.9% |
| $25,000 to $34,999 | 5,171 | 9.0% |
| $35,000 to $49,999 | 6,837 | 11.9% |
| $50,000 to $74,999 | 9,996 | 17.4% |
| $75,000 to $99,999 | 8,043 | 14.0% |
| $100,000 to $149,999 | 10,111 | 17.6% |
| $150,000 to $199,999 | 3,619 | 6.3% |
| $200,000+ | 5,573 | 9.7% |
Family Income by Famaliy Size in Winston Salem
6-person families (2,223 | 3.9%) account for the highest median family income in Winston Salem with $85,552 per family, while 2-person families (28,435 | 49.5%) have the highest median income of $33,342 per family member.
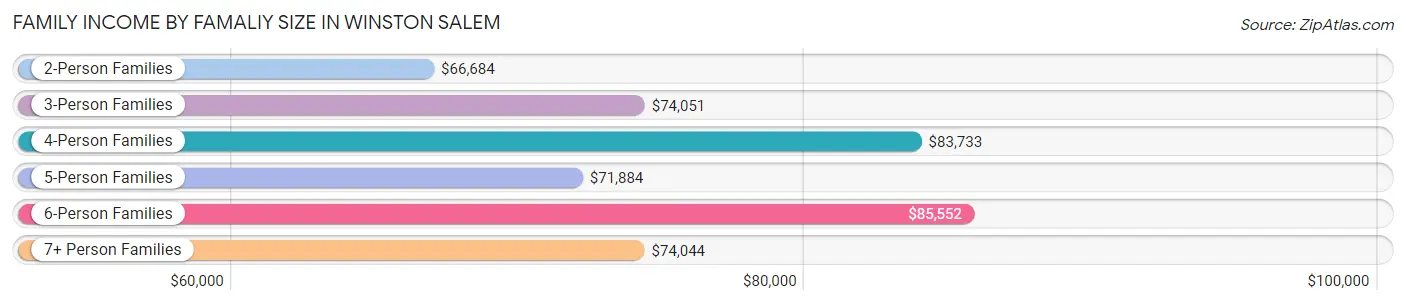
| Income Bracket | # Families | Median Income |
| 2-Person Families | 28,435 (49.5%) | $66,684 |
| 3-Person Families | 13,753 (23.9%) | $74,051 |
| 4-Person Families | 8,256 (14.4%) | $83,733 |
| 5-Person Families | 4,081 (7.1%) | $71,884 |
| 6-Person Families | 2,223 (3.9%) | $85,552 |
| 7+ Person Families | 703 (1.2%) | $74,044 |
| Total | 57,451 (100.0%) | $71,260 |
Family Income by Number of Earners in Winston Salem
The median family income in Winston Salem is $71,260, with families comprising 3+ earners (4,747) having the highest median family income of $116,309, while families with no earners (8,549) have the lowest median family income of $40,443, accounting for 8.3% and 14.9% of families, respectively.
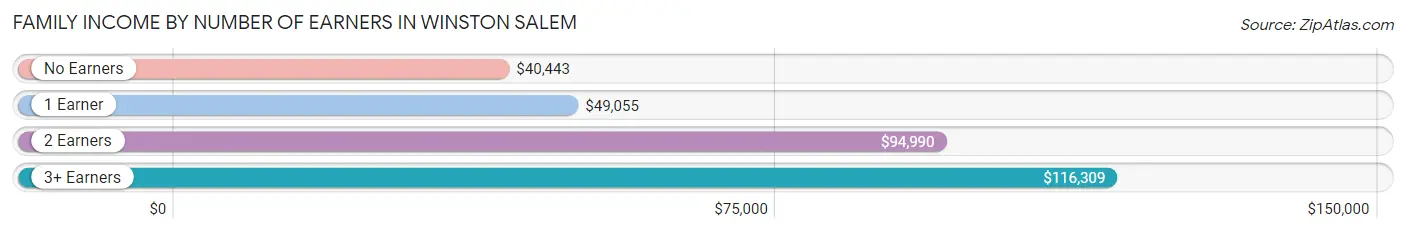
| Number of Earners | # Families | Median Income |
| No Earners | 8,549 (14.9%) | $40,443 |
| 1 Earner | 21,745 (37.9%) | $49,055 |
| 2 Earners | 22,410 (39.0%) | $94,990 |
| 3+ Earners | 4,747 (8.3%) | $116,309 |
| Total | 57,451 (100.0%) | $71,260 |
Household Income in Winston Salem
Household Income Brackets in Winston Salem
With 16,590 households falling in the category, the $50,000 to $74,999 income range is the most frequent in Winston Salem, accounting for 16.8% of all households. In contrast, only 4,740 households (4.8%) fall into the $150,000 to $199,999 income bracket, making it the least populous group.
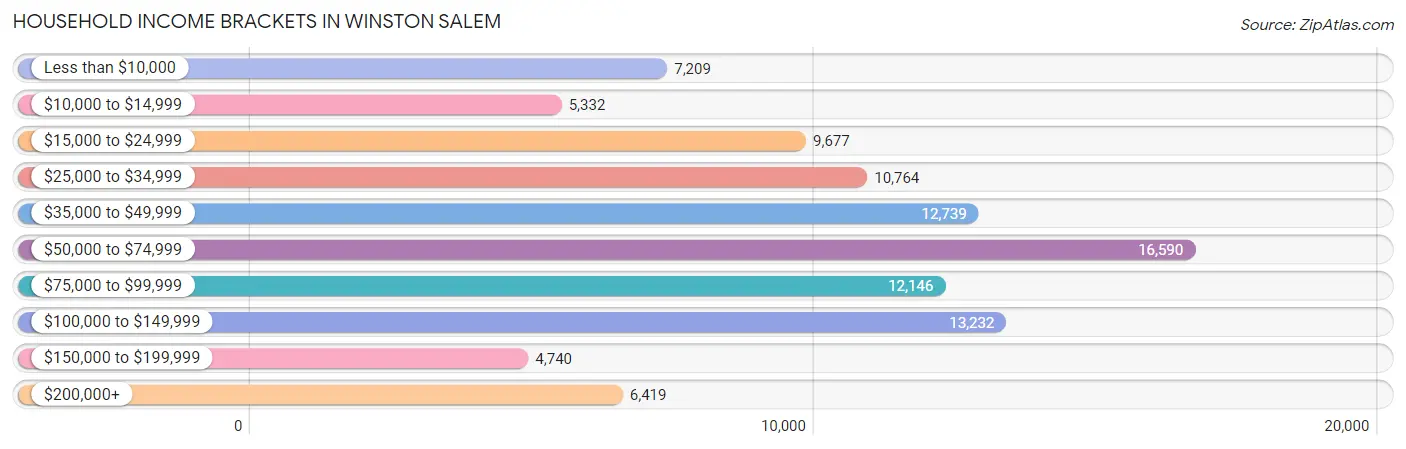
| Income Bracket | # Households | % Households |
| Less than $10,000 | 7,209 | 7.3% |
| $10,000 to $14,999 | 5,332 | 5.4% |
| $15,000 to $24,999 | 9,677 | 9.8% |
| $25,000 to $34,999 | 10,764 | 10.9% |
| $35,000 to $49,999 | 12,739 | 12.9% |
| $50,000 to $74,999 | 16,590 | 16.8% |
| $75,000 to $99,999 | 12,146 | 12.3% |
| $100,000 to $149,999 | 13,232 | 13.4% |
| $150,000 to $199,999 | 4,740 | 4.8% |
| $200,000+ | 6,419 | 6.5% |
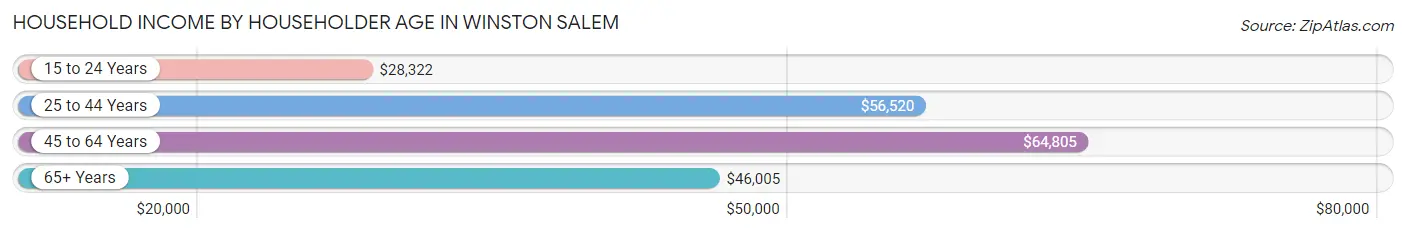
Household Income by Householder Age in Winston Salem
The median household income in Winston Salem is $54,416, with the highest median household income of $64,805 found in the 45 to 64 years age bracket for the primary householder. A total of 35,218 households (35.7%) fall into this category. Meanwhile, the 15 to 24 years age bracket for the primary householder has the lowest median household income of $28,322, with 4,519 households (4.6%) in this group.
| Income Bracket | # Households | Median Income |
| 15 to 24 Years | 4,519 (4.6%) | $28,322 |
| 25 to 44 Years | 34,585 (35.0%) | $56,520 |
| 45 to 64 Years | 35,218 (35.7%) | $64,805 |
| 65+ Years | 24,427 (24.7%) | $46,005 |
| Total | 98,749 (100.0%) | $54,416 |
Poverty in Winston Salem
Income Below Poverty by Sex and Age in Winston Salem
With 17.2% poverty level for males and 19.5% for females among the residents of Winston Salem, 5 year old males and 6 to 11 year old females are the most vulnerable to poverty, with 473 males (38.3%) and 2,867 females (31.5%) in their respective age groups living below the poverty level.
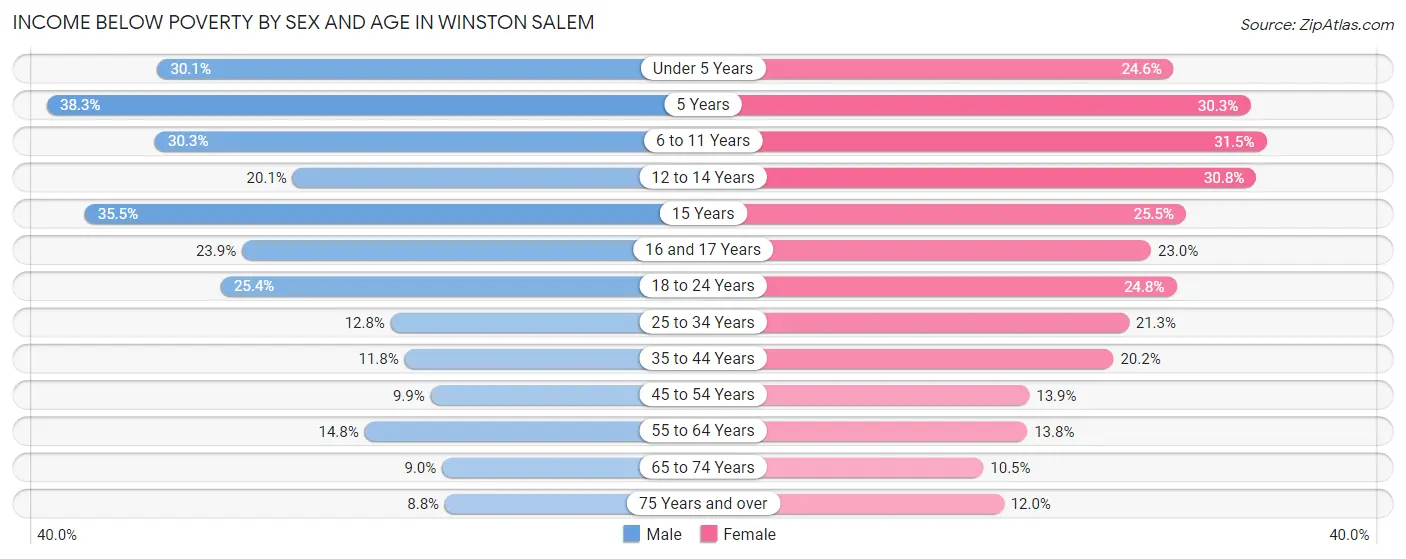
| Age Bracket | Male | Female |
| Under 5 Years | 2,208 (30.1%) | 1,783 (24.6%) |
| 5 Years | 473 (38.3%) | 451 (30.3%) |
| 6 to 11 Years | 3,155 (30.3%) | 2,867 (31.5%) |
| 12 to 14 Years | 964 (20.1%) | 1,719 (30.8%) |
| 15 Years | 744 (35.5%) | 441 (25.5%) |
| 16 and 17 Years | 806 (23.9%) | 845 (23.0%) |
| 18 to 24 Years | 2,535 (25.4%) | 2,761 (24.8%) |
| 25 to 34 Years | 2,163 (12.8%) | 3,930 (21.3%) |
| 35 to 44 Years | 1,679 (11.8%) | 3,137 (20.2%) |
| 45 to 54 Years | 1,396 (9.9%) | 2,212 (13.9%) |
| 55 to 64 Years | 2,104 (14.8%) | 2,157 (13.8%) |
| 65 to 74 Years | 835 (9.0%) | 1,242 (10.5%) |
| 75 Years and over | 508 (8.8%) | 1,065 (12.0%) |
| Total | 19,570 (17.2%) | 24,610 (19.5%) |
Income Above Poverty by Sex and Age in Winston Salem
According to the poverty statistics in Winston Salem, males aged 75 years and over and females aged 65 to 74 years are the age groups that are most secure financially, with 91.2% of males and 89.5% of females in these age groups living above the poverty line.
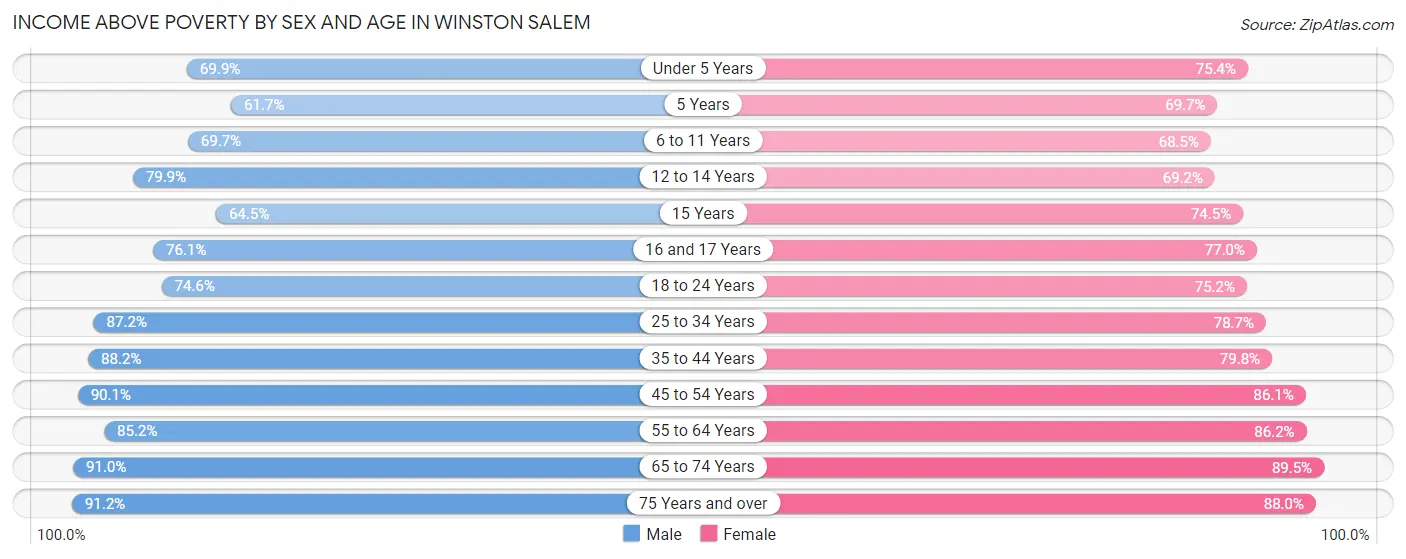
| Age Bracket | Male | Female |
| Under 5 Years | 5,121 (69.9%) | 5,453 (75.4%) |
| 5 Years | 761 (61.7%) | 1,037 (69.7%) |
| 6 to 11 Years | 7,253 (69.7%) | 6,228 (68.5%) |
| 12 to 14 Years | 3,833 (79.9%) | 3,869 (69.2%) |
| 15 Years | 1,350 (64.5%) | 1,286 (74.5%) |
| 16 and 17 Years | 2,572 (76.1%) | 2,836 (77.0%) |
| 18 to 24 Years | 7,438 (74.6%) | 8,358 (75.2%) |
| 25 to 34 Years | 14,715 (87.2%) | 14,508 (78.7%) |
| 35 to 44 Years | 12,566 (88.2%) | 12,417 (79.8%) |
| 45 to 54 Years | 12,763 (90.1%) | 13,683 (86.1%) |
| 55 to 64 Years | 12,153 (85.2%) | 13,505 (86.2%) |
| 65 to 74 Years | 8,447 (91.0%) | 10,571 (89.5%) |
| 75 Years and over | 5,271 (91.2%) | 7,794 (88.0%) |
| Total | 94,243 (82.8%) | 101,545 (80.5%) |
Income Below Poverty Among Married-Couple Families in Winston Salem
The poverty statistics for married-couple families in Winston Salem show that 5.3% or 1,932 of the total 36,579 families live below the poverty line. Families with 5 or more children have the highest poverty rate of 23.8%, comprising of 64 families. On the other hand, families with no children have the lowest poverty rate of 2.8%, which includes 625 families.
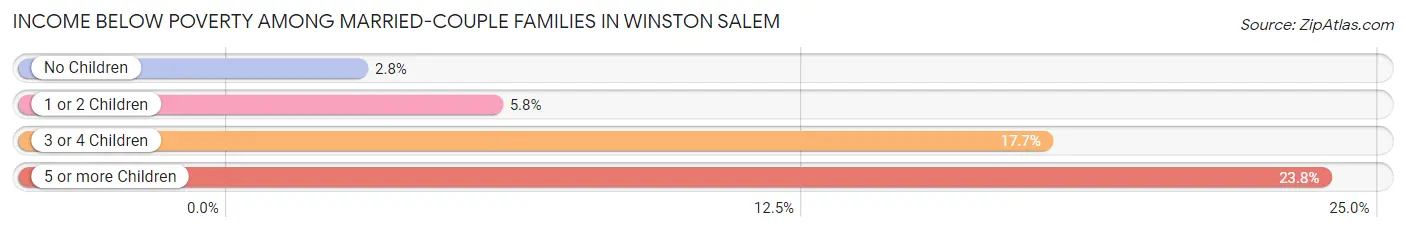
| Children | Above Poverty | Below Poverty |
| No Children | 21,434 (97.2%) | 625 (2.8%) |
| 1 or 2 Children | 10,103 (94.2%) | 617 (5.8%) |
| 3 or 4 Children | 2,905 (82.3%) | 626 (17.7%) |
| 5 or more Children | 205 (76.2%) | 64 (23.8%) |
| Total | 34,647 (94.7%) | 1,932 (5.3%) |
Income Below Poverty Among Single-Parent Households in Winston Salem
According to the poverty data in Winston Salem, 18.4% or 799 single-father households and 29.6% or 4,893 single-mother households are living below the poverty line. Among single-father households, those with 5 or more children have the highest poverty rate, with 33 households (100.0%) experiencing poverty. Likewise, among single-mother households, those with 5 or more children have the highest poverty rate, with 149 households (74.9%) falling below the poverty line.
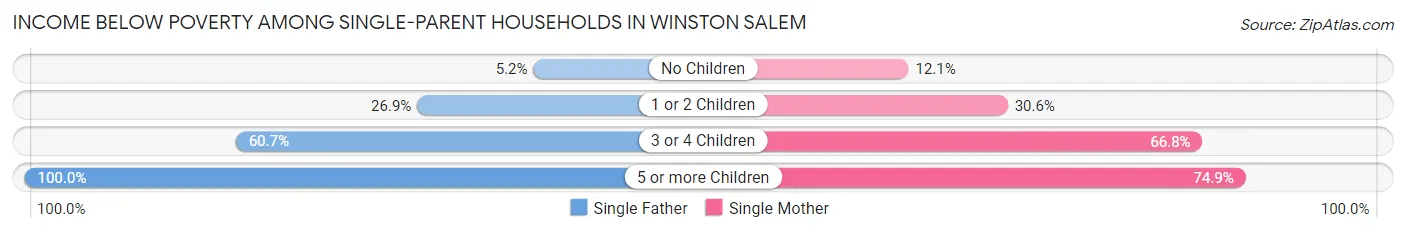
| Children | Single Father | Single Mother |
| No Children | 108 (5.2%) | 624 (12.1%) |
| 1 or 2 Children | 567 (26.9%) | 2,809 (30.5%) |
| 3 or 4 Children | 91 (60.7%) | 1,311 (66.8%) |
| 5 or more Children | 33 (100.0%) | 149 (74.9%) |
| Total | 799 (18.4%) | 4,893 (29.6%) |
Income Below Poverty Among Married-Couple vs Single-Parent Households in Winston Salem
The poverty data for Winston Salem shows that 1,932 of the married-couple family households (5.3%) and 5,692 of the single-parent households (27.3%) are living below the poverty level. Within the married-couple family households, those with 5 or more children have the highest poverty rate, with 64 households (23.8%) falling below the poverty line. Among the single-parent households, those with 5 or more children have the highest poverty rate, with 182 household (78.4%) living below poverty.
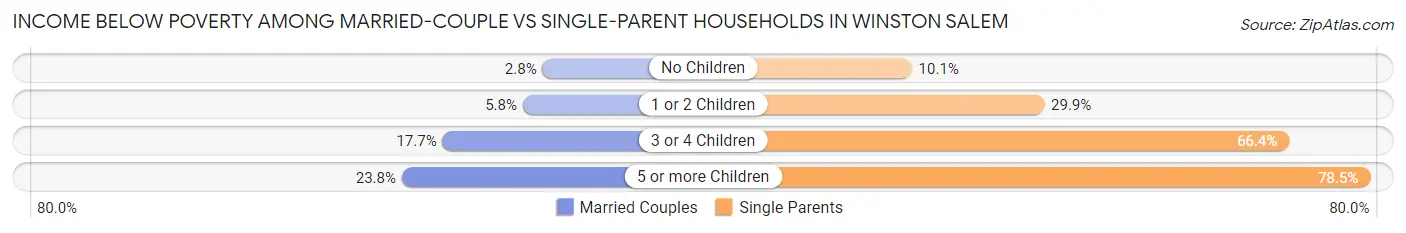
| Children | Married-Couple Families | Single-Parent Households |
| No Children | 625 (2.8%) | 732 (10.1%) |
| 1 or 2 Children | 617 (5.8%) | 3,376 (29.9%) |
| 3 or 4 Children | 626 (17.7%) | 1,402 (66.4%) |
| 5 or more Children | 64 (23.8%) | 182 (78.4%) |
| Total | 1,932 (5.3%) | 5,692 (27.3%) |
Race in Winston Salem
The most populous races in Winston Salem are White / Caucasian (127,353 | 51.0%), Black / African American (82,945 | 33.2%), and Hispanic or Latino (41,335 | 16.6%).
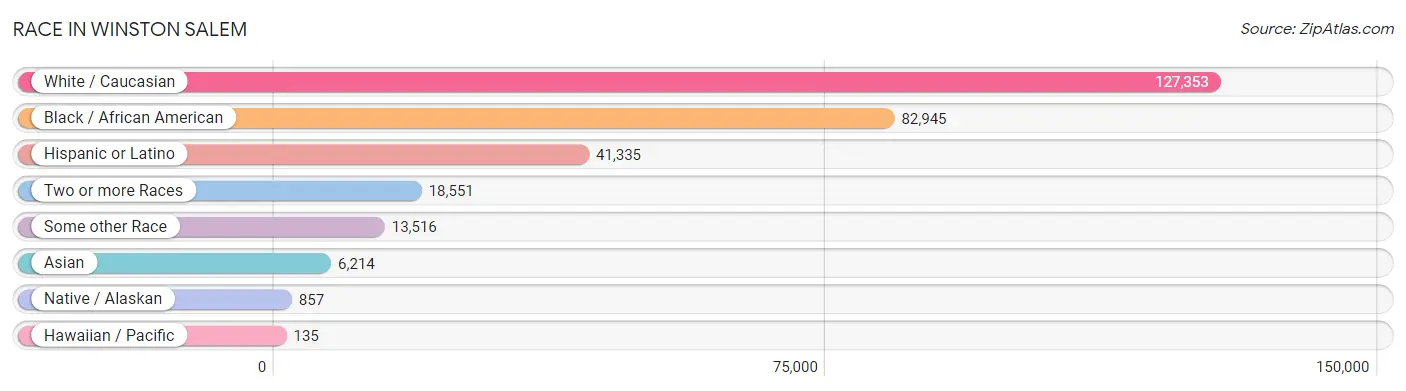
| Race | # Population | % Population |
| Asian | 6,214 | 2.5% |
| Black / African American | 82,945 | 33.2% |
| Hawaiian / Pacific | 135 | 0.1% |
| Hispanic or Latino | 41,335 | 16.6% |
| Native / Alaskan | 857 | 0.3% |
| White / Caucasian | 127,353 | 51.0% |
| Two or more Races | 18,551 | 7.4% |
| Some other Race | 13,516 | 5.4% |
| Total | 249,571 | 100.0% |
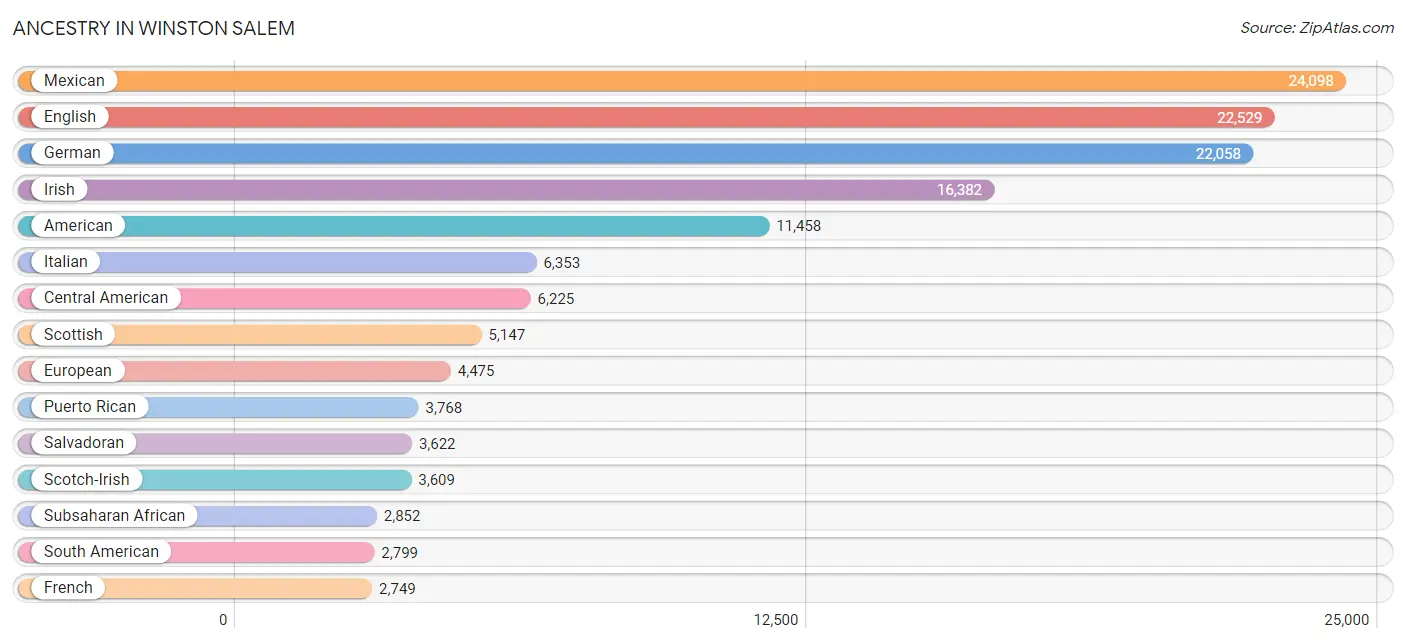
Ancestry in Winston Salem
The most populous ancestries reported in Winston Salem are Mexican (24,098 | 9.7%), English (22,529 | 9.0%), German (22,058 | 8.8%), Irish (16,382 | 6.6%), and American (11,458 | 4.6%), together accounting for 38.7% of all Winston Salem residents.
| Ancestry | # Population | % Population |
| African | 1,443 | 0.6% |
| American | 11,458 | 4.6% |
| Apache | 19 | 0.0% |
| Arab | 1,139 | 0.5% |
| Argentinean | 199 | 0.1% |
| Armenian | 71 | 0.0% |
| Assyrian / Chaldean / Syriac | 7 | 0.0% |
| Australian | 19 | 0.0% |
| Austrian | 256 | 0.1% |
| Bahamian | 25 | 0.0% |
| Barbadian | 72 | 0.0% |
| Basque | 13 | 0.0% |
| Belgian | 131 | 0.1% |
| Belizean | 69 | 0.0% |
| Bhutanese | 375 | 0.2% |
| Blackfeet | 307 | 0.1% |
| Brazilian | 121 | 0.1% |
| British | 1,235 | 0.5% |
| British West Indian | 81 | 0.0% |
| Bulgarian | 28 | 0.0% |
| Burmese | 468 | 0.2% |
| Canadian | 209 | 0.1% |
| Cape Verdean | 31 | 0.0% |
| Celtic | 32 | 0.0% |
| Central American | 6,225 | 2.5% |
| Central American Indian | 269 | 0.1% |
| Cherokee | 598 | 0.2% |
| Chickasaw | 14 | 0.0% |
| Chilean | 200 | 0.1% |
| Choctaw | 88 | 0.0% |
| Colombian | 1,153 | 0.5% |
| Comanche | 11 | 0.0% |
| Costa Rican | 77 | 0.0% |
| Creek | 21 | 0.0% |
| Croatian | 515 | 0.2% |
| Cuban | 701 | 0.3% |
| Czech | 436 | 0.2% |
| Czechoslovakian | 53 | 0.0% |
| Danish | 408 | 0.2% |
| Dominican | 1,369 | 0.5% |
| Dutch | 1,523 | 0.6% |
| Eastern European | 275 | 0.1% |
| Ecuadorian | 97 | 0.0% |
| Egyptian | 714 | 0.3% |
| English | 22,529 | 9.0% |
| Estonian | 34 | 0.0% |
| Ethiopian | 14 | 0.0% |
| European | 4,475 | 1.8% |
| Filipino | 135 | 0.1% |
| Finnish | 212 | 0.1% |
| French | 2,749 | 1.1% |
| French American Indian | 18 | 0.0% |
| French Canadian | 580 | 0.2% |
| German | 22,058 | 8.8% |
| Ghanaian | 212 | 0.1% |
| Greek | 1,152 | 0.5% |
| Guamanian / Chamorro | 40 | 0.0% |
| Guatemalan | 1,062 | 0.4% |
| Guyanese | 76 | 0.0% |
| Haitian | 197 | 0.1% |
| Honduran | 1,198 | 0.5% |
| Hungarian | 357 | 0.1% |
| Indian (Asian) | 2,038 | 0.8% |
| Indonesian | 110 | 0.0% |
| Inupiat | 7 | 0.0% |
| Iranian | 227 | 0.1% |
| Iraqi | 5 | 0.0% |
| Irish | 16,382 | 6.6% |
| Israeli | 88 | 0.0% |
| Italian | 6,353 | 2.5% |
| Jamaican | 893 | 0.4% |
| Japanese | 104 | 0.0% |
| Kenyan | 39 | 0.0% |
| Korean | 797 | 0.3% |
| Laotian | 119 | 0.1% |
| Lebanese | 155 | 0.1% |
| Lithuanian | 204 | 0.1% |
| Lumbee | 421 | 0.2% |
| Luxembourger | 6 | 0.0% |
| Macedonian | 17 | 0.0% |
| Malaysian | 5 | 0.0% |
| Mexican | 24,098 | 9.7% |
| Mexican American Indian | 355 | 0.1% |
| Mongolian | 74 | 0.0% |
| Moroccan | 66 | 0.0% |
| Native Hawaiian | 50 | 0.0% |
| Navajo | 24 | 0.0% |
| New Zealander | 50 | 0.0% |
| Nicaraguan | 203 | 0.1% |
| Nigerian | 396 | 0.2% |
| Northern European | 199 | 0.1% |
| Norwegian | 997 | 0.4% |
| Pakistani | 132 | 0.1% |
| Palestinian | 26 | 0.0% |
| Panamanian | 63 | 0.0% |
| Pennsylvania German | 30 | 0.0% |
| Peruvian | 526 | 0.2% |
| Polish | 2,531 | 1.0% |
| Portuguese | 259 | 0.1% |
| Potawatomi | 15 | 0.0% |
| Puerto Rican | 3,768 | 1.5% |
| Romanian | 81 | 0.0% |
| Russian | 596 | 0.2% |
| Salvadoran | 3,622 | 1.5% |
| Scandinavian | 413 | 0.2% |
| Scotch-Irish | 3,609 | 1.5% |
| Scottish | 5,147 | 2.1% |
| Senegalese | 311 | 0.1% |
| Serbian | 127 | 0.1% |
| Sioux | 13 | 0.0% |
| Slavic | 488 | 0.2% |
| Slovak | 260 | 0.1% |
| Slovene | 29 | 0.0% |
| South African | 13 | 0.0% |
| South American | 2,799 | 1.1% |
| South American Indian | 83 | 0.0% |
| Spaniard | 184 | 0.1% |
| Spanish | 318 | 0.1% |
| Spanish American | 9 | 0.0% |
| Sri Lankan | 623 | 0.3% |
| Subsaharan African | 2,852 | 1.1% |
| Sudanese | 161 | 0.1% |
| Swedish | 1,039 | 0.4% |
| Swiss | 654 | 0.3% |
| Syrian | 22 | 0.0% |
| Thai | 1,747 | 0.7% |
| Trinidadian and Tobagonian | 86 | 0.0% |
| Turkish | 137 | 0.1% |
| U.S. Virgin Islander | 10 | 0.0% |
| Ugandan | 136 | 0.1% |
| Ukrainian | 323 | 0.1% |
| Uruguayan | 133 | 0.1% |
| Venezuelan | 491 | 0.2% |
| Vietnamese | 25 | 0.0% |
| Welsh | 1,569 | 0.6% |
| West Indian | 119 | 0.1% |
| Yakama | 19 | 0.0% |
| Yugoslavian | 48 | 0.0% |
| Zimbabwean | 56 | 0.0% | View All 139 Rows |
Immigrants in Winston Salem
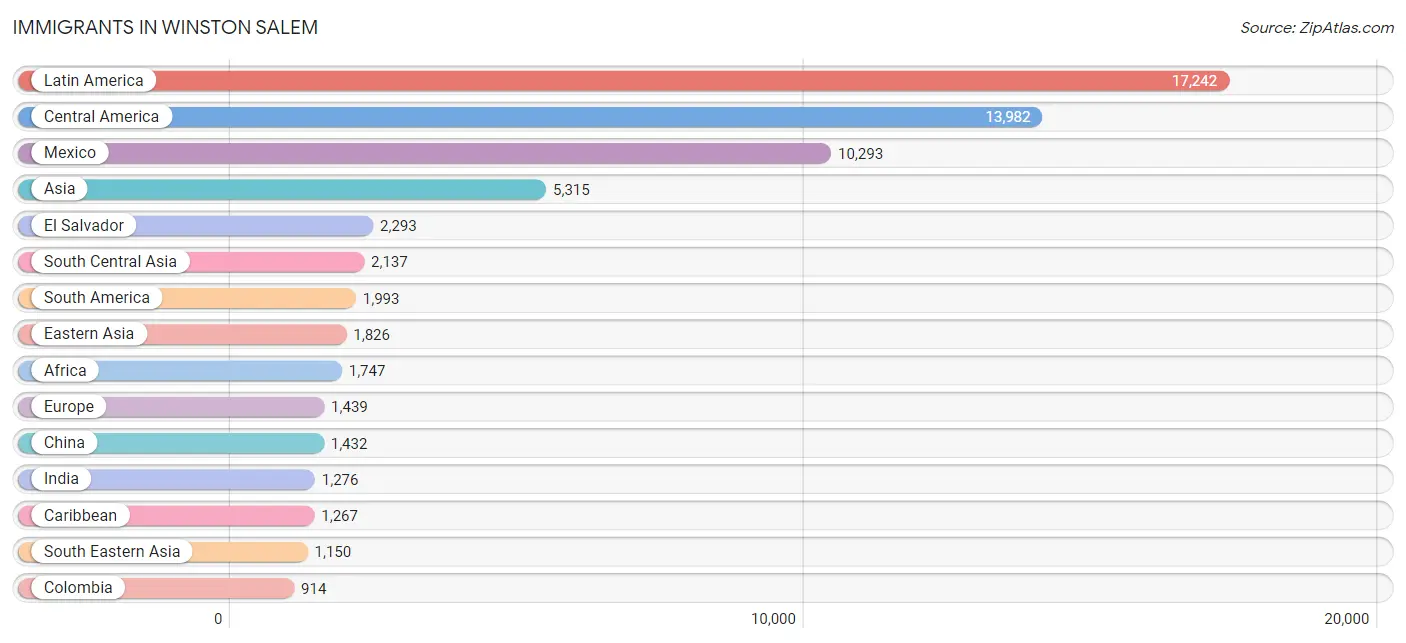
The most numerous immigrant groups reported in Winston Salem came from Latin America (17,242 | 6.9%), Central America (13,982 | 5.6%), Mexico (10,293 | 4.1%), Asia (5,315 | 2.1%), and El Salvador (2,293 | 0.9%), together accounting for 19.7% of all Winston Salem residents.
| Immigration Origin | # Population | % Population |
| Africa | 1,747 | 0.7% |
| Argentina | 64 | 0.0% |
| Asia | 5,315 | 2.1% |
| Australia | 64 | 0.0% |
| Austria | 32 | 0.0% |
| Bangladesh | 27 | 0.0% |
| Belgium | 9 | 0.0% |
| Bosnia and Herzegovina | 55 | 0.0% |
| Brazil | 228 | 0.1% |
| Cambodia | 27 | 0.0% |
| Canada | 242 | 0.1% |
| Caribbean | 1,267 | 0.5% |
| Central America | 13,982 | 5.6% |
| Chile | 96 | 0.0% |
| China | 1,432 | 0.6% |
| Colombia | 914 | 0.4% |
| Costa Rica | 61 | 0.0% |
| Croatia | 1 | 0.0% |
| Cuba | 169 | 0.1% |
| Czechoslovakia | 28 | 0.0% |
| Denmark | 9 | 0.0% |
| Dominican Republic | 807 | 0.3% |
| Eastern Africa | 344 | 0.1% |
| Eastern Asia | 1,826 | 0.7% |
| Eastern Europe | 450 | 0.2% |
| Ecuador | 37 | 0.0% |
| Egypt | 585 | 0.2% |
| El Salvador | 2,293 | 0.9% |
| England | 81 | 0.0% |
| Eritrea | 7 | 0.0% |
| Europe | 1,439 | 0.6% |
| France | 43 | 0.0% |
| Germany | 284 | 0.1% |
| Ghana | 215 | 0.1% |
| Greece | 138 | 0.1% |
| Guatemala | 724 | 0.3% |
| Guyana | 85 | 0.0% |
| Haiti | 47 | 0.0% |
| Honduras | 512 | 0.2% |
| Hong Kong | 75 | 0.0% |
| Hungary | 47 | 0.0% |
| India | 1,276 | 0.5% |
| Indonesia | 52 | 0.0% |
| Iran | 209 | 0.1% |
| Ireland | 41 | 0.0% |
| Israel | 27 | 0.0% |
| Italy | 127 | 0.1% |
| Jamaica | 107 | 0.0% |
| Japan | 211 | 0.1% |
| Jordan | 30 | 0.0% |
| Kenya | 131 | 0.1% |
| Korea | 183 | 0.1% |
| Kuwait | 13 | 0.0% |
| Laos | 4 | 0.0% |
| Latin America | 17,242 | 6.9% |
| Lebanon | 62 | 0.0% |
| Liberia | 31 | 0.0% |
| Malaysia | 7 | 0.0% |
| Mexico | 10,293 | 4.1% |
| Middle Africa | 21 | 0.0% |
| Moldova | 64 | 0.0% |
| Morocco | 7 | 0.0% |
| Nepal | 362 | 0.2% |
| Nicaragua | 69 | 0.0% |
| Nigeria | 145 | 0.1% |
| Northern Africa | 620 | 0.3% |
| Northern Europe | 322 | 0.1% |
| Norway | 41 | 0.0% |
| Oceania | 81 | 0.0% |
| Pakistan | 142 | 0.1% |
| Panama | 30 | 0.0% |
| Peru | 249 | 0.1% |
| Philippines | 512 | 0.2% |
| Poland | 32 | 0.0% |
| Portugal | 10 | 0.0% |
| Romania | 11 | 0.0% |
| Russia | 115 | 0.1% |
| Saudi Arabia | 6 | 0.0% |
| Scotland | 27 | 0.0% |
| Senegal | 176 | 0.1% |
| Singapore | 31 | 0.0% |
| South America | 1,993 | 0.8% |
| South Central Asia | 2,137 | 0.9% |
| South Eastern Asia | 1,150 | 0.5% |
| Southern Europe | 293 | 0.1% |
| Spain | 18 | 0.0% |
| Sudan | 28 | 0.0% |
| Sweden | 85 | 0.0% |
| Syria | 5 | 0.0% |
| Taiwan | 155 | 0.1% |
| Thailand | 89 | 0.0% |
| Trinidad and Tobago | 9 | 0.0% |
| Turkey | 34 | 0.0% |
| Uganda | 95 | 0.0% |
| Ukraine | 58 | 0.0% |
| Uruguay | 86 | 0.0% |
| Venezuela | 234 | 0.1% |
| Vietnam | 318 | 0.1% |
| West Indies | 34 | 0.0% |
| Western Africa | 647 | 0.3% |
| Western Asia | 202 | 0.1% |
| Western Europe | 374 | 0.2% |
| Yemen | 9 | 0.0% |
| Zaire | 21 | 0.0% |
| Zimbabwe | 56 | 0.0% | View All 105 Rows |
Sex and Age in Winston Salem
Sex and Age in Winston Salem
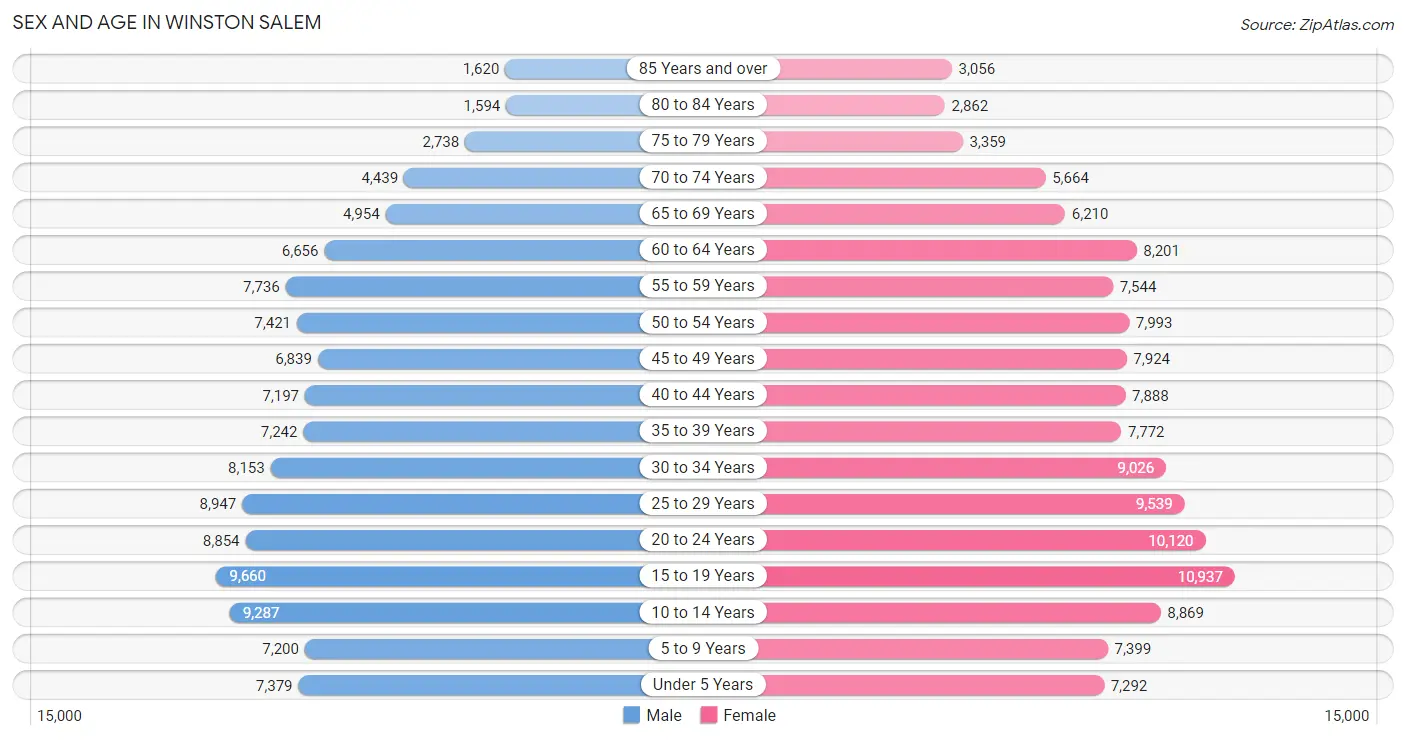
The most populous age groups in Winston Salem are 15 to 19 Years (9,660 | 8.2%) for men and 15 to 19 Years (10,937 | 8.3%) for women.
| Age Bracket | Male | Female |
| Under 5 Years | 7,379 (6.3%) | 7,292 (5.5%) |
| 5 to 9 Years | 7,200 (6.1%) | 7,399 (5.6%) |
| 10 to 14 Years | 9,287 (7.9%) | 8,869 (6.7%) |
| 15 to 19 Years | 9,660 (8.2%) | 10,937 (8.3%) |
| 20 to 24 Years | 8,854 (7.5%) | 10,120 (7.7%) |
| 25 to 29 Years | 8,947 (7.6%) | 9,539 (7.2%) |
| 30 to 34 Years | 8,153 (6.9%) | 9,026 (6.9%) |
| 35 to 39 Years | 7,242 (6.1%) | 7,772 (5.9%) |
| 40 to 44 Years | 7,197 (6.1%) | 7,888 (6.0%) |
| 45 to 49 Years | 6,839 (5.8%) | 7,924 (6.0%) |
| 50 to 54 Years | 7,421 (6.3%) | 7,993 (6.1%) |
| 55 to 59 Years | 7,736 (6.6%) | 7,544 (5.7%) |
| 60 to 64 Years | 6,656 (5.6%) | 8,201 (6.2%) |
| 65 to 69 Years | 4,954 (4.2%) | 6,210 (4.7%) |
| 70 to 74 Years | 4,439 (3.8%) | 5,664 (4.3%) |
| 75 to 79 Years | 2,738 (2.3%) | 3,359 (2.5%) |
| 80 to 84 Years | 1,594 (1.3%) | 2,862 (2.2%) |
| 85 Years and over | 1,620 (1.4%) | 3,056 (2.3%) |
| Total | 117,916 (100.0%) | 131,655 (100.0%) |
Families and Households in Winston Salem
Median Family Size in Winston Salem
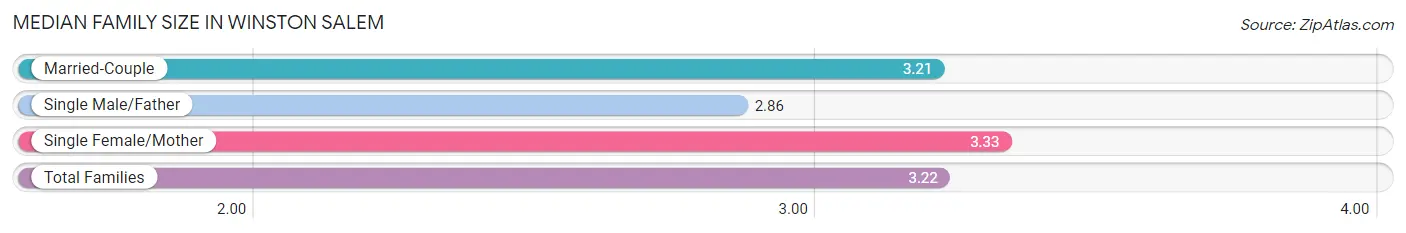
The median family size in Winston Salem is 3.22 persons per family, with single female/mother families (16,519 | 28.7%) accounting for the largest median family size of 3.33 persons per family. On the other hand, single male/father families (4,353 | 7.6%) represent the smallest median family size with 2.86 persons per family.
| Family Type | # Families | Family Size |
| Married-Couple | 36,579 (63.7%) | 3.21 |
| Single Male/Father | 4,353 (7.6%) | 2.86 |
| Single Female/Mother | 16,519 (28.7%) | 3.33 |
| Total Families | 57,451 (100.0%) | 3.22 |
Median Household Size in Winston Salem
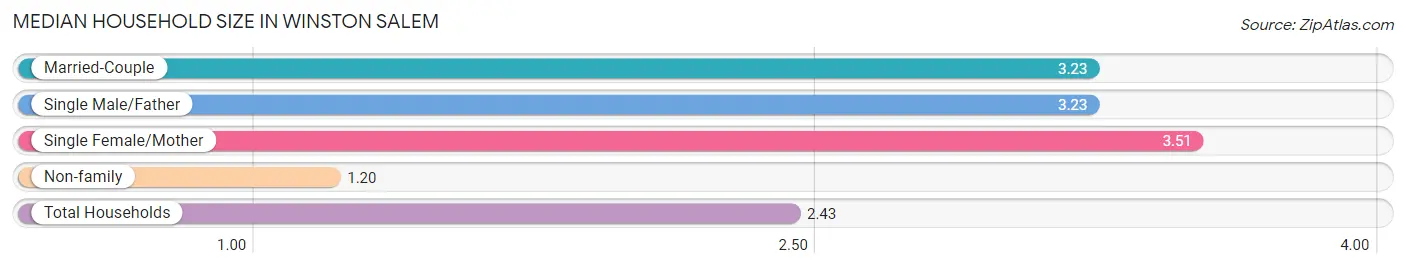
The median household size in Winston Salem is 2.43 persons per household, with single female/mother households (16,519 | 16.7%) accounting for the largest median household size of 3.51 persons per household. non-family households (41,298 | 41.8%) represent the smallest median household size with 1.20 persons per household.
| Household Type | # Households | Household Size |
| Married-Couple | 36,579 (37.0%) | 3.23 |
| Single Male/Father | 4,353 (4.4%) | 3.23 |
| Single Female/Mother | 16,519 (16.7%) | 3.51 |
| Non-family | 41,298 (41.8%) | 1.20 |
| Total Households | 98,749 (100.0%) | 2.43 |
Household Size by Marriage Status in Winston Salem
Out of a total of 98,749 households in Winston Salem, 57,451 (58.2%) are family households, while 41,298 (41.8%) are nonfamily households. The most numerous type of family households are 2-person households, comprising 26,735, and the most common type of nonfamily households are 1-person households, comprising 34,846.
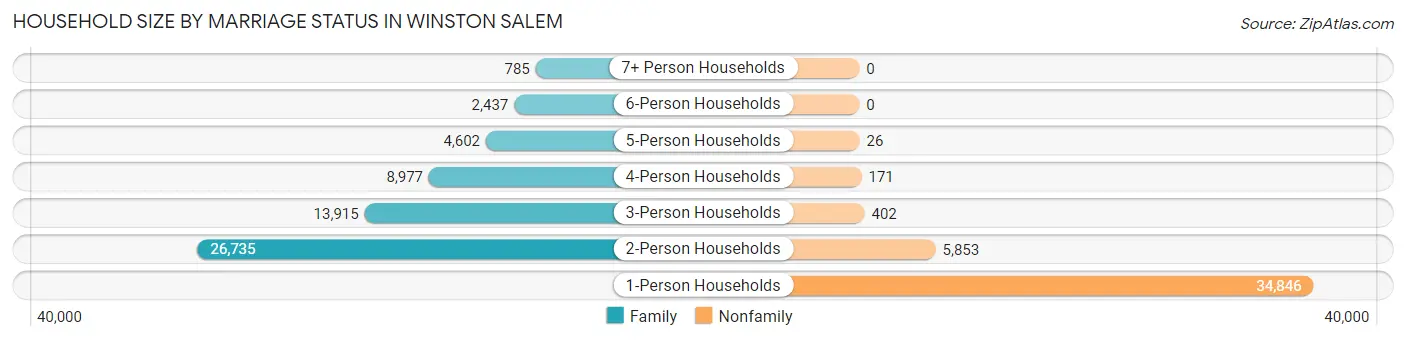
| Household Size | Family Households | Nonfamily Households |
| 1-Person Households | - | 34,846 (35.3%) |
| 2-Person Households | 26,735 (27.1%) | 5,853 (5.9%) |
| 3-Person Households | 13,915 (14.1%) | 402 (0.4%) |
| 4-Person Households | 8,977 (9.1%) | 171 (0.2%) |
| 5-Person Households | 4,602 (4.7%) | 26 (0.0%) |
| 6-Person Households | 2,437 (2.5%) | 0 (0.0%) |
| 7+ Person Households | 785 (0.8%) | 0 (0.0%) |
| Total | 57,451 (58.2%) | 41,298 (41.8%) |
Female Fertility in Winston Salem
Fertility by Age in Winston Salem
Average fertility rate in Winston Salem is 44.0 births per 1,000 women. Women in the age bracket of 20 to 34 years have the highest fertility rate with 68.0 births per 1,000 women. Women in the age bracket of 20 to 34 years acount for 68.5% of all women with births.
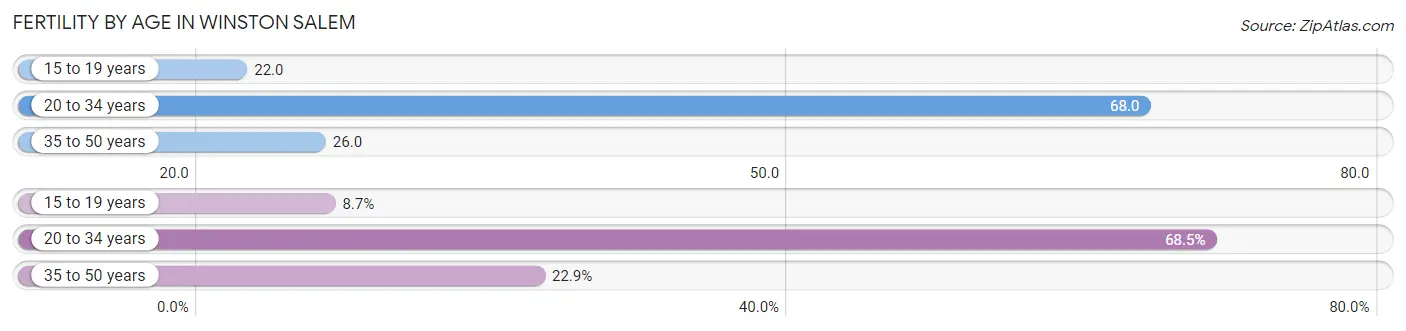
| Age Bracket | Women with Births | Births / 1,000 Women |
| 15 to 19 years | 245 (8.6%) | 22.0 |
| 20 to 34 years | 1,941 (68.5%) | 68.0 |
| 35 to 50 years | 648 (22.9%) | 26.0 |
| Total | 2,834 (100.0%) | 44.0 |
Fertility by Age by Marriage Status in Winston Salem
51.2% of women with births (2,834) in Winston Salem are married. The highest percentage of unmarried women with births falls into 15 to 19 years age bracket with 100.0% of them unmarried at the time of birth, while the lowest percentage of unmarried women with births belong to 35 to 50 years age bracket with 13.0% of them unmarried.
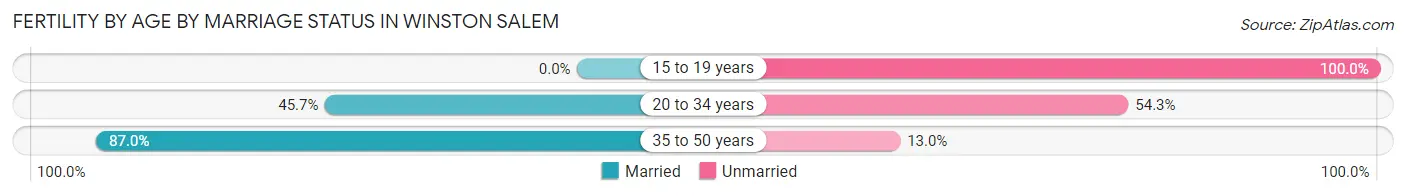
| Age Bracket | Married | Unmarried |
| 15 to 19 years | 0 (0.0%) | 245 (100.0%) |
| 20 to 34 years | 887 (45.7%) | 1,054 (54.3%) |
| 35 to 50 years | 564 (87.0%) | 84 (13.0%) |
| Total | 1,451 (51.2%) | 1,383 (48.8%) |
Fertility by Education in Winston Salem
Average fertility rate in Winston Salem is 44.0 births per 1,000 women. Women with the education attainment of bachelor's degree have the highest fertility rate of 58.0 births per 1,000 women, while women with the education attainment of less than high school have the lowest fertility at 15.0 births per 1,000 women. Women with the education attainment of high school diploma represent 29.6% of all women with births.
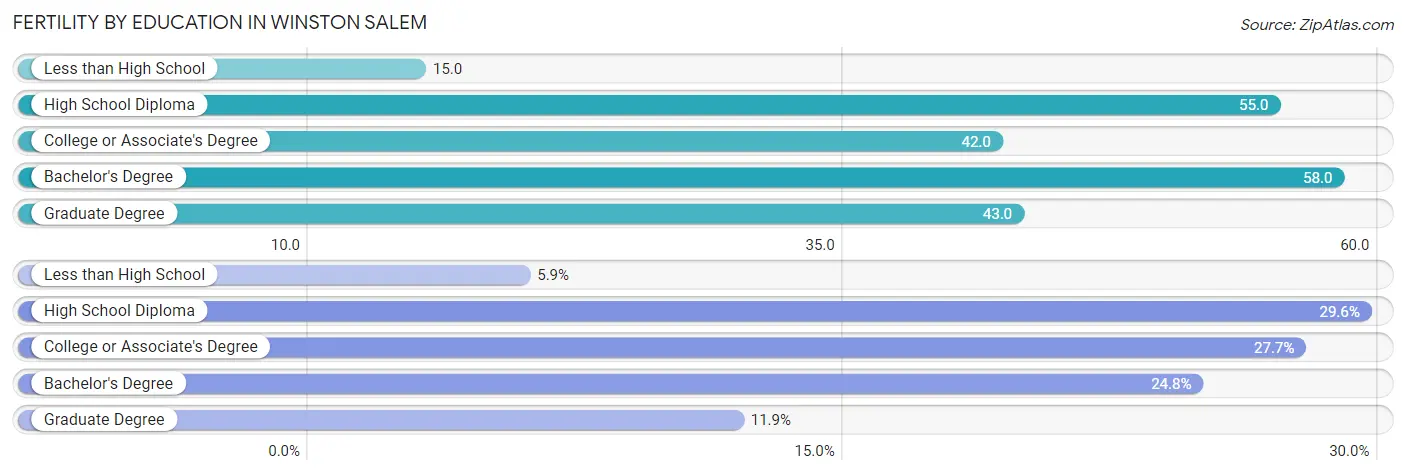
| Educational Attainment | Women with Births | Births / 1,000 Women |
| Less than High School | 168 (5.9%) | 15.0 |
| High School Diploma | 838 (29.6%) | 55.0 |
| College or Associate's Degree | 786 (27.7%) | 42.0 |
| Bachelor's Degree | 704 (24.8%) | 58.0 |
| Graduate Degree | 338 (11.9%) | 43.0 |
| Total | 2,834 (100.0%) | 44.0 |
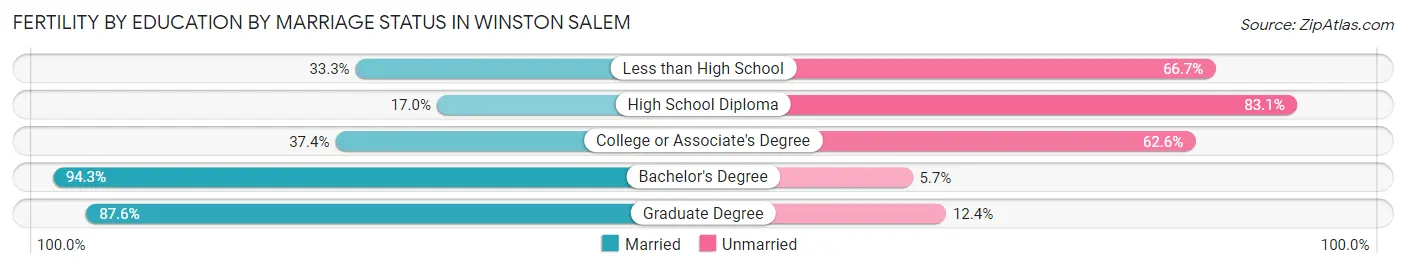
Fertility by Education by Marriage Status in Winston Salem
48.8% of women with births in Winston Salem are unmarried. Women with the educational attainment of bachelor's degree are most likely to be married with 94.3% of them married at childbirth, while women with the educational attainment of high school diploma are least likely to be married with 83.1% of them unmarried at childbirth.
| Educational Attainment | Married | Unmarried |
| Less than High School | 56 (33.3%) | 112 (66.7%) |
| High School Diploma | 142 (17.0%) | 696 (83.1%) |
| College or Associate's Degree | 294 (37.4%) | 492 (62.6%) |
| Bachelor's Degree | 664 (94.3%) | 40 (5.7%) |
| Graduate Degree | 296 (87.6%) | 42 (12.4%) |
| Total | 1,451 (51.2%) | 1,383 (48.8%) |
Employment Characteristics in Winston Salem
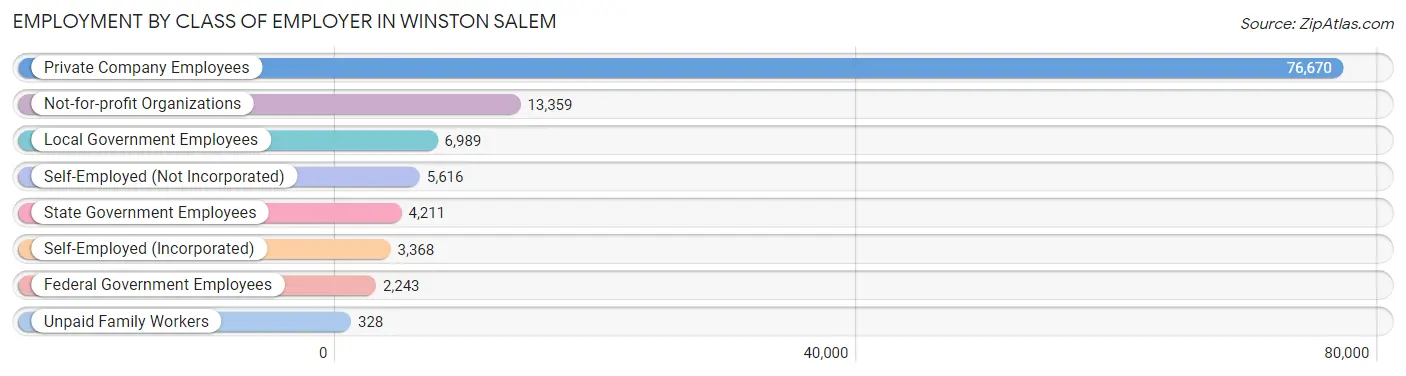
Employment by Class of Employer in Winston Salem
Among the 112,784 employed individuals in Winston Salem, private company employees (76,670 | 68.0%), not-for-profit organizations (13,359 | 11.8%), and local government employees (6,989 | 6.2%) make up the most common classes of employment.
| Employer Class | # Employees | % Employees |
| Private Company Employees | 76,670 | 68.0% |
| Self-Employed (Incorporated) | 3,368 | 3.0% |
| Self-Employed (Not Incorporated) | 5,616 | 5.0% |
| Not-for-profit Organizations | 13,359 | 11.8% |
| Local Government Employees | 6,989 | 6.2% |
| State Government Employees | 4,211 | 3.7% |
| Federal Government Employees | 2,243 | 2.0% |
| Unpaid Family Workers | 328 | 0.3% |
| Total | 112,784 | 100.0% |
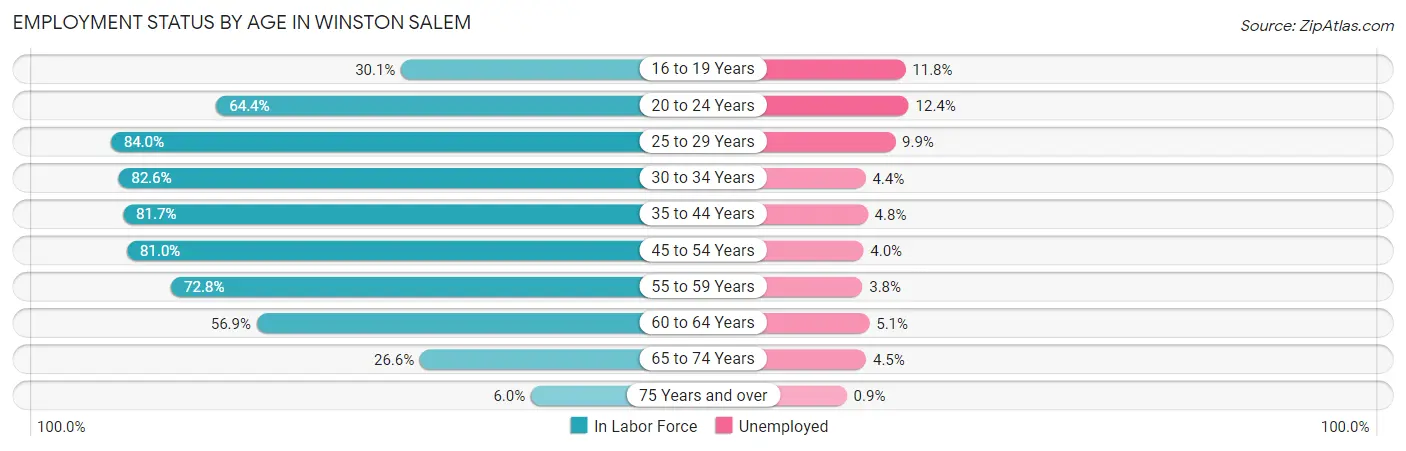
Employment Status by Age in Winston Salem
According to the labor force statistics for Winston Salem, out of the total population over 16 years of age (198,313), 61.6% or 122,161 individuals are in the labor force, with 6.2% or 7,574 of them unemployed. The age group with the highest labor force participation rate is 25 to 29 years, with 84.0% or 15,528 individuals in the labor force. Within the labor force, the 20 to 24 years age range has the highest percentage of unemployed individuals, with 12.4% or 1,515 of them being unemployed.
| Age Bracket | In Labor Force | Unemployed |
| 16 to 19 Years | 5,046 (30.1%) | 595 (11.8%) |
| 20 to 24 Years | 12,219 (64.4%) | 1,515 (12.4%) |
| 25 to 29 Years | 15,528 (84.0%) | 1,537 (9.9%) |
| 30 to 34 Years | 14,190 (82.6%) | 624 (4.4%) |
| 35 to 44 Years | 24,591 (81.7%) | 1,180 (4.8%) |
| 45 to 54 Years | 24,443 (81.0%) | 978 (4.0%) |
| 55 to 59 Years | 11,124 (72.8%) | 423 (3.8%) |
| 60 to 64 Years | 8,454 (56.9%) | 431 (5.1%) |
| 65 to 74 Years | 5,657 (26.6%) | 255 (4.5%) |
| 75 Years and over | 914 (6.0%) | 8 (0.9%) |
| Total | 122,161 (61.6%) | 7,574 (6.2%) |
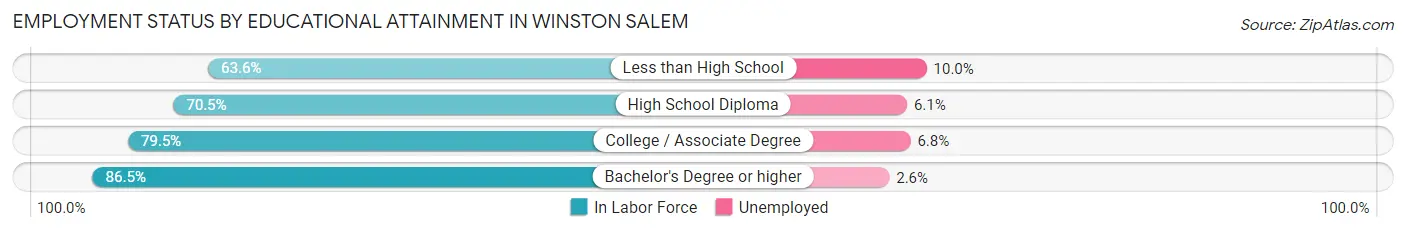
Employment Status by Educational Attainment in Winston Salem
According to labor force statistics for Winston Salem, 78.0% of individuals (98,341) out of the total population between 25 and 64 years of age (126,078) are in the labor force, with 5.3% or 5,212 of them being unemployed. The group with the highest labor force participation rate are those with the educational attainment of bachelor's degree or higher, with 86.5% or 39,370 individuals in the labor force. Within the labor force, individuals with less than high school education have the highest percentage of unemployment, with 10.0% or 981 of them being unemployed.
| Educational Attainment | In Labor Force | Unemployed |
| Less than High School | 9,813 (63.6%) | 1,543 (10.0%) |
| High School Diploma | 20,641 (70.5%) | 1,786 (6.1%) |
| College / Associate Degree | 28,506 (79.5%) | 2,438 (6.8%) |
| Bachelor's Degree or higher | 39,370 (86.5%) | 1,183 (2.6%) |
| Total | 98,341 (78.0%) | 6,682 (5.3%) |
Employment Occupations by Sex in Winston Salem
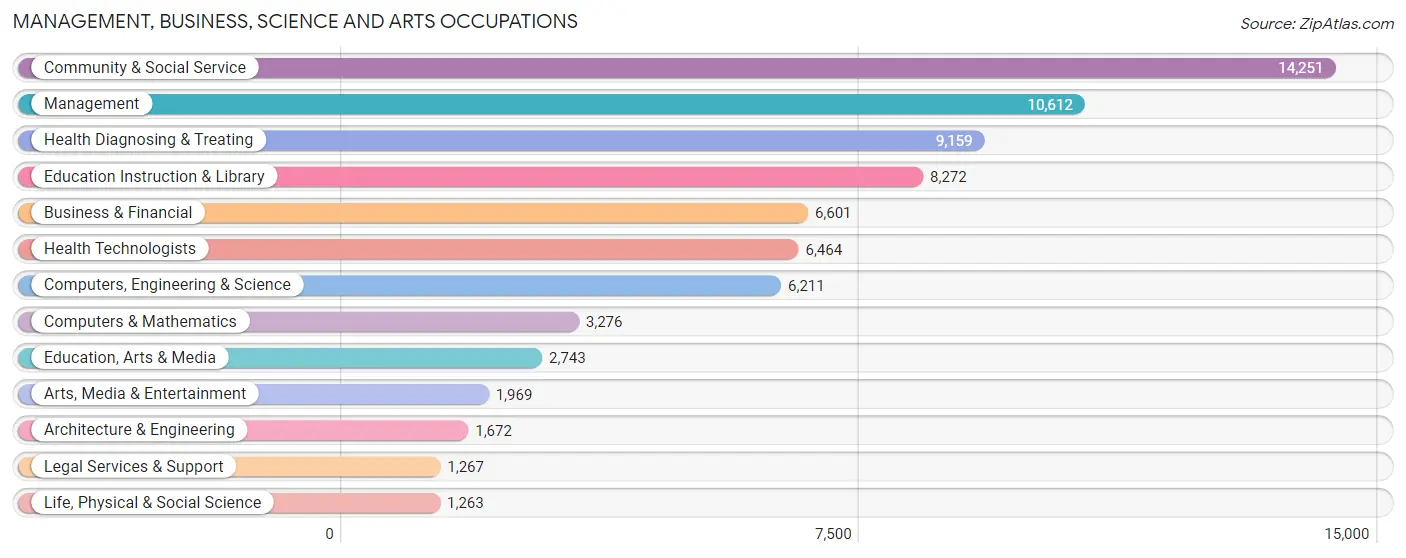
Management, Business, Science and Arts Occupations
The most common Management, Business, Science and Arts occupations in Winston Salem are Community & Social Service (14,251 | 12.5%), Management (10,612 | 9.3%), Health Diagnosing & Treating (9,159 | 8.0%), Education Instruction & Library (8,272 | 7.2%), and Business & Financial (6,601 | 5.8%).
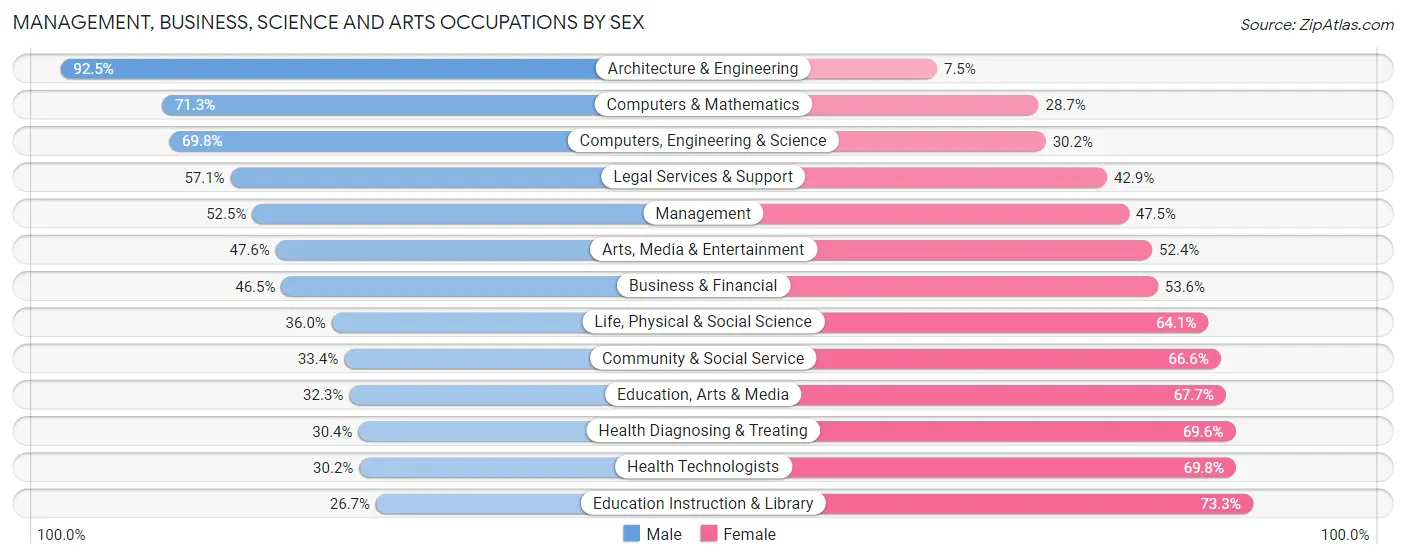
Management, Business, Science and Arts Occupations by Sex
Within the Management, Business, Science and Arts occupations in Winston Salem, the most male-oriented occupations are Architecture & Engineering (92.5%), Computers & Mathematics (71.3%), and Computers, Engineering & Science (69.8%), while the most female-oriented occupations are Education Instruction & Library (73.3%), Health Technologists (69.8%), and Health Diagnosing & Treating (69.6%).
| Occupation | Male | Female |
| Management | 5,572 (52.5%) | 5,040 (47.5%) |
| Business & Financial | 3,066 (46.5%) | 3,535 (53.5%) |
| Computers, Engineering & Science | 4,338 (69.8%) | 1,873 (30.2%) |
| Computers & Mathematics | 2,337 (71.3%) | 939 (28.7%) |
| Architecture & Engineering | 1,547 (92.5%) | 125 (7.5%) |
| Life, Physical & Social Science | 454 (35.9%) | 809 (64.0%) |
| Community & Social Service | 4,757 (33.4%) | 9,494 (66.6%) |
| Education, Arts & Media | 886 (32.3%) | 1,857 (67.7%) |
| Legal Services & Support | 723 (57.1%) | 544 (42.9%) |
| Education Instruction & Library | 2,210 (26.7%) | 6,062 (73.3%) |
| Arts, Media & Entertainment | 938 (47.6%) | 1,031 (52.4%) |
| Health Diagnosing & Treating | 2,782 (30.4%) | 6,377 (69.6%) |
| Health Technologists | 1,953 (30.2%) | 4,511 (69.8%) |
| Total (Category) | 20,515 (43.8%) | 26,319 (56.2%) |
| Total (Overall) | 56,733 (49.7%) | 57,315 (50.3%) |
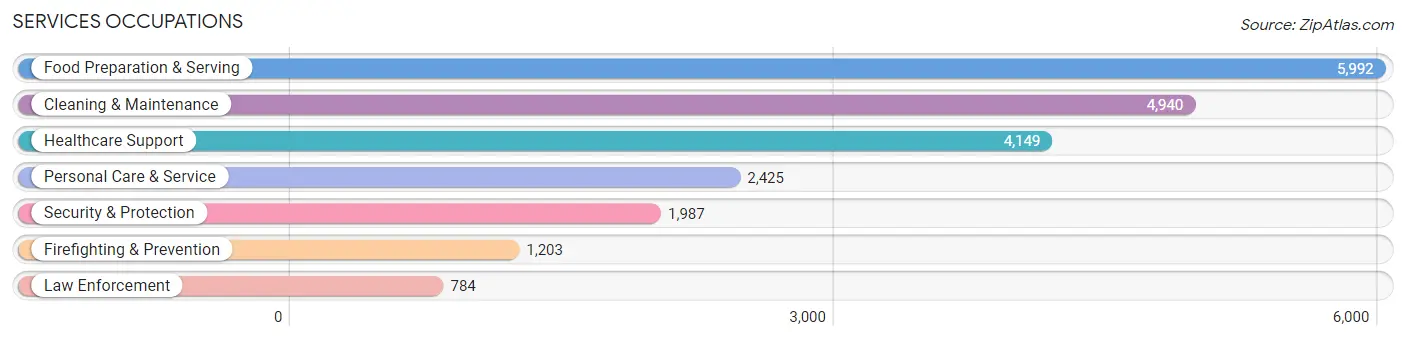
Services Occupations
The most common Services occupations in Winston Salem are Food Preparation & Serving (5,992 | 5.2%), Cleaning & Maintenance (4,940 | 4.3%), Healthcare Support (4,149 | 3.6%), Personal Care & Service (2,425 | 2.1%), and Security & Protection (1,987 | 1.7%).
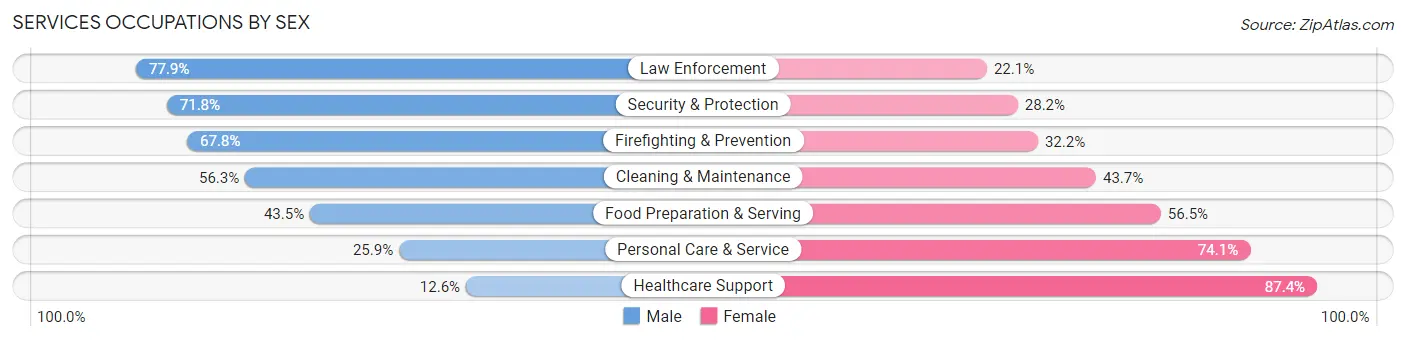
Services Occupations by Sex
Within the Services occupations in Winston Salem, the most male-oriented occupations are Law Enforcement (77.9%), Security & Protection (71.8%), and Firefighting & Prevention (67.8%), while the most female-oriented occupations are Healthcare Support (87.4%), Personal Care & Service (74.1%), and Food Preparation & Serving (56.5%).
| Occupation | Male | Female |
| Healthcare Support | 523 (12.6%) | 3,626 (87.4%) |
| Security & Protection | 1,427 (71.8%) | 560 (28.2%) |
| Firefighting & Prevention | 816 (67.8%) | 387 (32.2%) |
| Law Enforcement | 611 (77.9%) | 173 (22.1%) |
| Food Preparation & Serving | 2,606 (43.5%) | 3,386 (56.5%) |
| Cleaning & Maintenance | 2,783 (56.3%) | 2,157 (43.7%) |
| Personal Care & Service | 627 (25.9%) | 1,798 (74.1%) |
| Total (Category) | 7,966 (40.9%) | 11,527 (59.1%) |
| Total (Overall) | 56,733 (49.7%) | 57,315 (50.3%) |
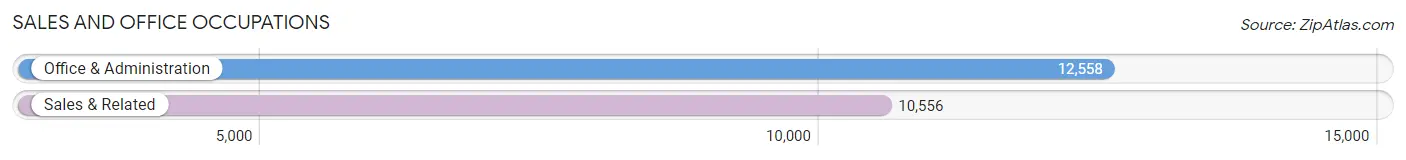
Sales and Office Occupations
The most common Sales and Office occupations in Winston Salem are Office & Administration (12,558 | 11.0%), and Sales & Related (10,556 | 9.3%).
Sales and Office Occupations by Sex
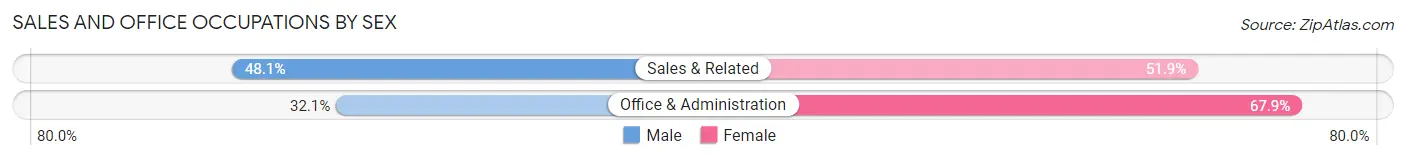
| Occupation | Male | Female |
| Sales & Related | 5,076 (48.1%) | 5,480 (51.9%) |
| Office & Administration | 4,028 (32.1%) | 8,530 (67.9%) |
| Total (Category) | 9,104 (39.4%) | 14,010 (60.6%) |
| Total (Overall) | 56,733 (49.7%) | 57,315 (50.3%) |
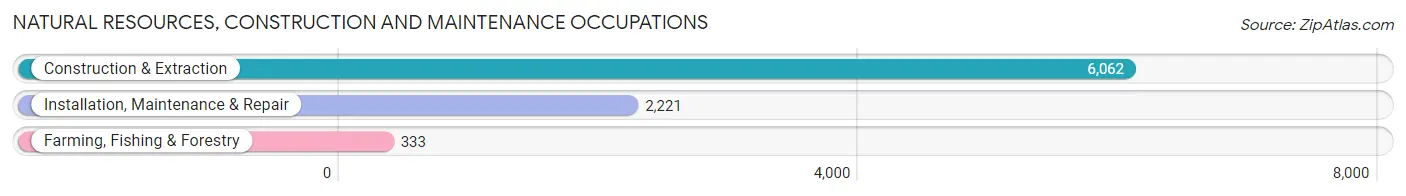
Natural Resources, Construction and Maintenance Occupations
The most common Natural Resources, Construction and Maintenance occupations in Winston Salem are Construction & Extraction (6,062 | 5.3%), Installation, Maintenance & Repair (2,221 | 1.9%), and Farming, Fishing & Forestry (333 | 0.3%).
Natural Resources, Construction and Maintenance Occupations by Sex
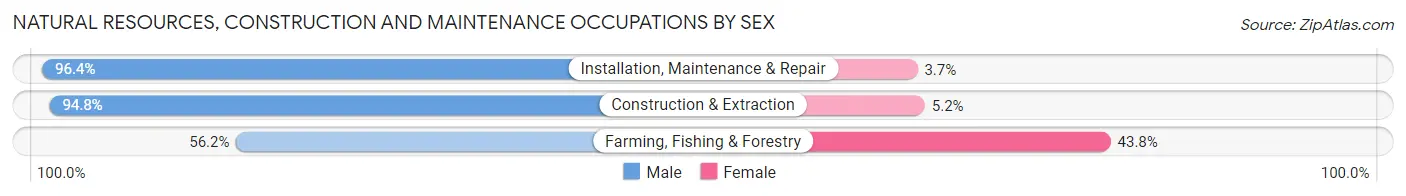
| Occupation | Male | Female |
| Farming, Fishing & Forestry | 187 (56.2%) | 146 (43.8%) |
| Construction & Extraction | 5,748 (94.8%) | 314 (5.2%) |
| Installation, Maintenance & Repair | 2,140 (96.4%) | 81 (3.6%) |
| Total (Category) | 8,075 (93.7%) | 541 (6.3%) |
| Total (Overall) | 56,733 (49.7%) | 57,315 (50.3%) |
Production, Transportation and Moving Occupations
The most common Production, Transportation and Moving occupations in Winston Salem are Production (7,041 | 6.2%), Material Moving (5,351 | 4.7%), and Transportation (3,599 | 3.2%).
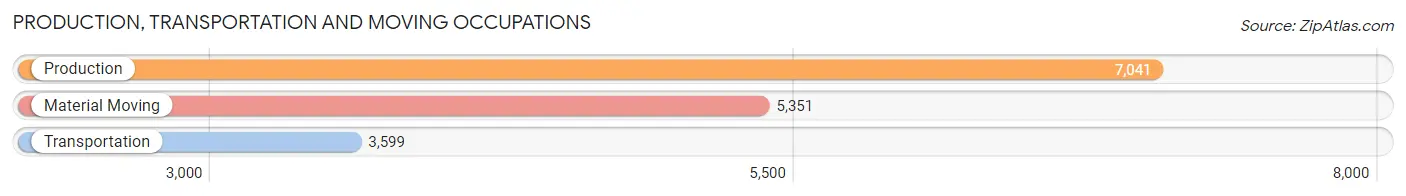
Production, Transportation and Moving Occupations by Sex
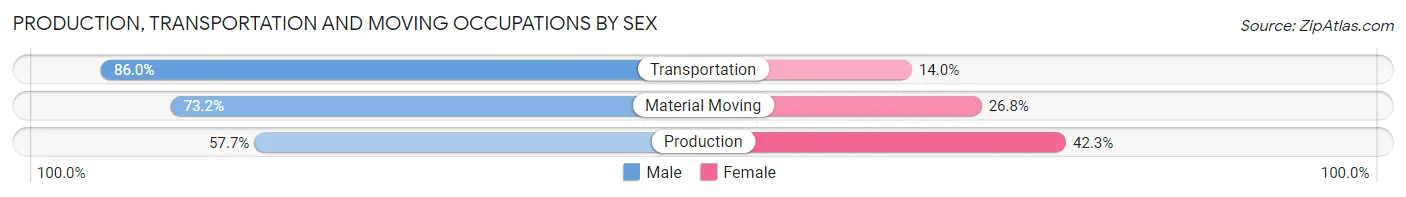
| Occupation | Male | Female |
| Production | 4,063 (57.7%) | 2,978 (42.3%) |
| Transportation | 3,094 (86.0%) | 505 (14.0%) |
| Material Moving | 3,916 (73.2%) | 1,435 (26.8%) |
| Total (Category) | 11,073 (69.3%) | 4,918 (30.7%) |
| Total (Overall) | 56,733 (49.7%) | 57,315 (50.3%) |
Employment Industries by Sex in Winston Salem
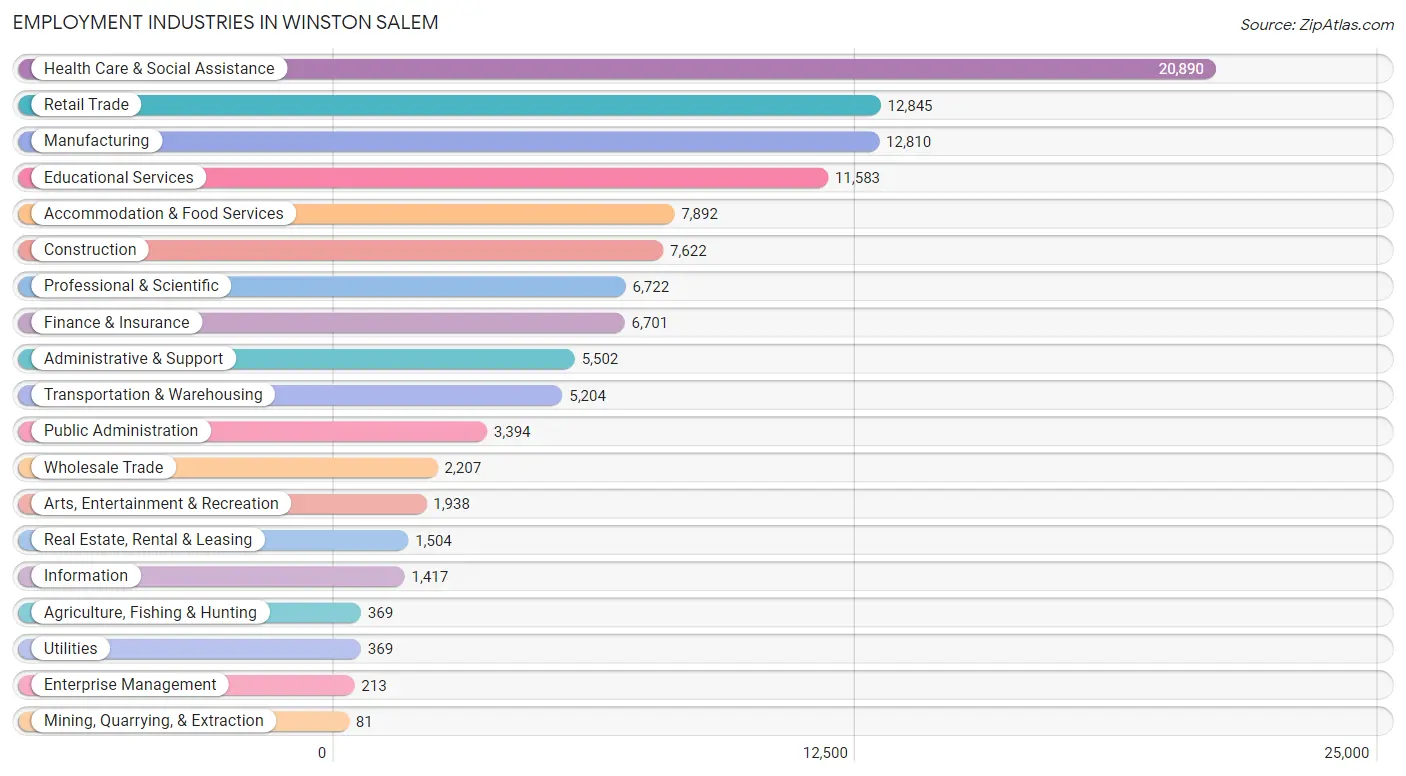
Employment Industries in Winston Salem
The major employment industries in Winston Salem include Health Care & Social Assistance (20,890 | 18.3%), Retail Trade (12,845 | 11.3%), Manufacturing (12,810 | 11.2%), Educational Services (11,583 | 10.2%), and Accommodation & Food Services (7,892 | 6.9%).
Employment Industries by Sex in Winston Salem
The Winston Salem industries that see more men than women are Construction (91.7%), Mining, Quarrying, & Extraction (81.5%), and Transportation & Warehousing (76.1%), whereas the industries that tend to have a higher number of women are Health Care & Social Assistance (75.3%), Educational Services (68.7%), and Real Estate, Rental & Leasing (56.2%).
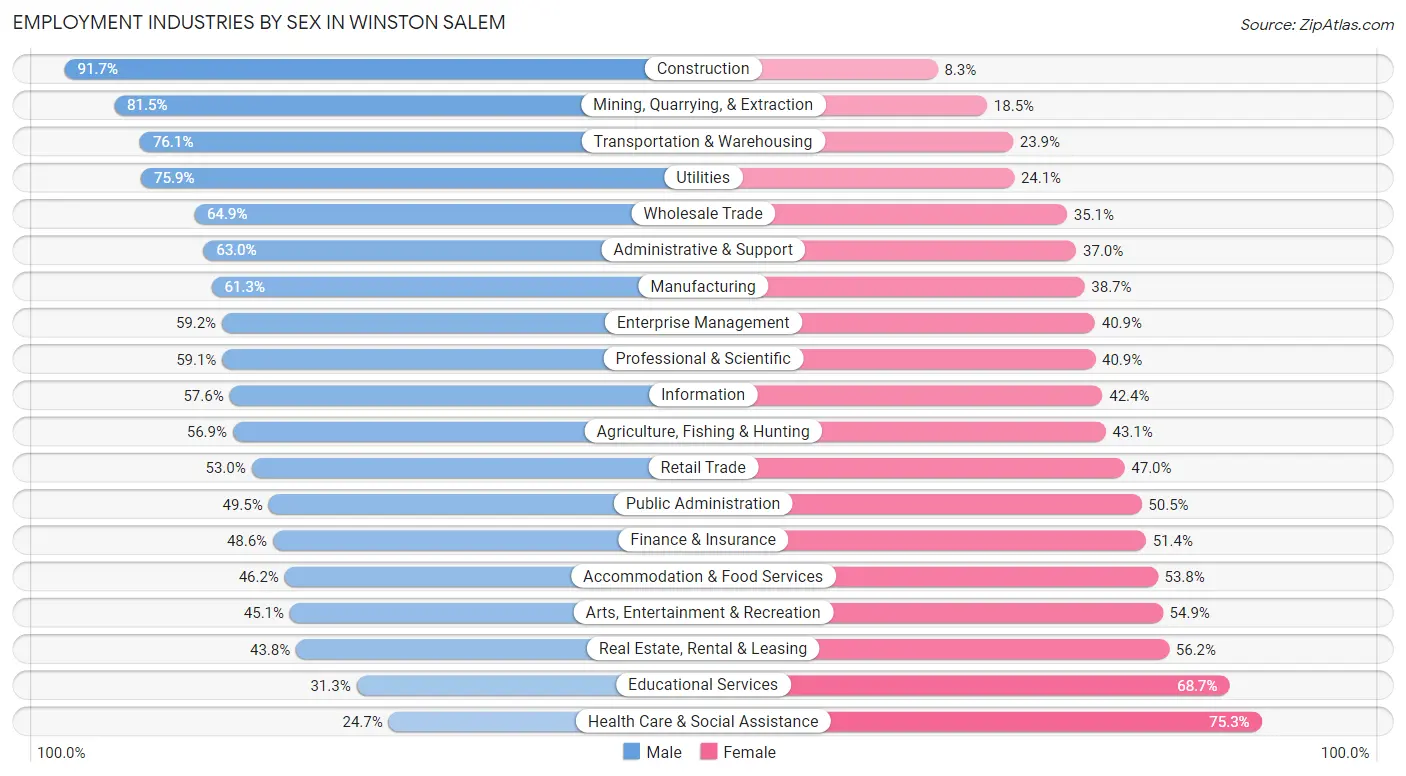
| Industry | Male | Female |
| Agriculture, Fishing & Hunting | 210 (56.9%) | 159 (43.1%) |
| Mining, Quarrying, & Extraction | 66 (81.5%) | 15 (18.5%) |
| Construction | 6,991 (91.7%) | 631 (8.3%) |
| Manufacturing | 7,854 (61.3%) | 4,956 (38.7%) |
| Wholesale Trade | 1,433 (64.9%) | 774 (35.1%) |
| Retail Trade | 6,812 (53.0%) | 6,033 (47.0%) |
| Transportation & Warehousing | 3,961 (76.1%) | 1,243 (23.9%) |
| Utilities | 280 (75.9%) | 89 (24.1%) |
| Information | 816 (57.6%) | 601 (42.4%) |
| Finance & Insurance | 3,257 (48.6%) | 3,444 (51.4%) |
| Real Estate, Rental & Leasing | 659 (43.8%) | 845 (56.2%) |
| Professional & Scientific | 3,973 (59.1%) | 2,749 (40.9%) |
| Enterprise Management | 126 (59.2%) | 87 (40.8%) |
| Administrative & Support | 3,467 (63.0%) | 2,035 (37.0%) |
| Educational Services | 3,625 (31.3%) | 7,958 (68.7%) |
| Health Care & Social Assistance | 5,153 (24.7%) | 15,737 (75.3%) |
| Arts, Entertainment & Recreation | 874 (45.1%) | 1,064 (54.9%) |
| Accommodation & Food Services | 3,643 (46.2%) | 4,249 (53.8%) |
| Public Administration | 1,680 (49.5%) | 1,714 (50.5%) |
| Total | 56,733 (49.7%) | 57,315 (50.3%) |
Education in Winston Salem
School Enrollment in Winston Salem
The most common levels of schooling among the 67,789 students in Winston Salem are college / undergraduate (16,424 | 24.2%), high school (14,683 | 21.7%), and middle school (13,388 | 19.8%).
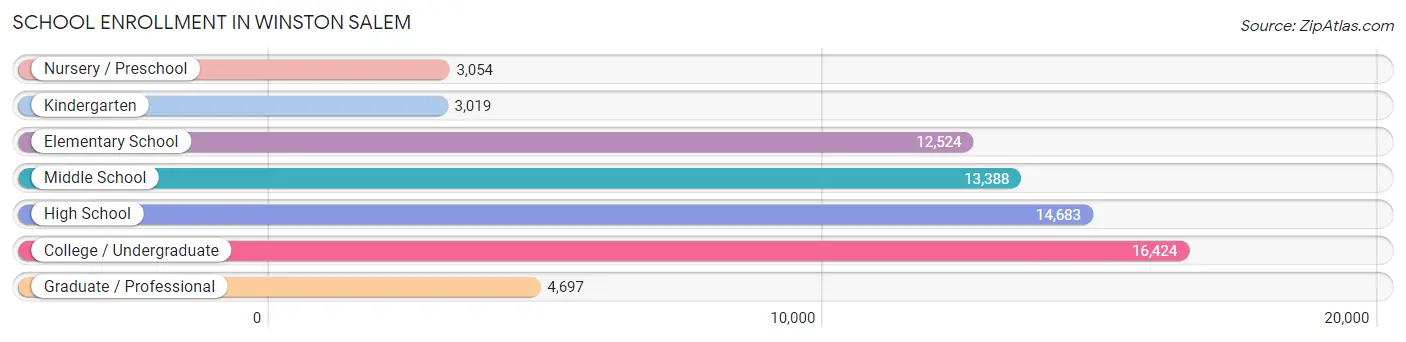
| School Level | # Students | % Students |
| Nursery / Preschool | 3,054 | 4.5% |
| Kindergarten | 3,019 | 4.4% |
| Elementary School | 12,524 | 18.5% |
| Middle School | 13,388 | 19.8% |
| High School | 14,683 | 21.7% |
| College / Undergraduate | 16,424 | 24.2% |
| Graduate / Professional | 4,697 | 6.9% |
| Total | 67,789 | 100.0% |
School Enrollment by Age by Funding Source in Winston Salem
Out of a total of 67,789 students who are enrolled in schools in Winston Salem, 13,287 (19.6%) attend a private institution, while the remaining 54,502 (80.4%) are enrolled in public schools. The age group of 3 to 4 year olds has the highest likelihood of being enrolled in private schools, with 955 (46.2% in the age bracket) enrolled. Conversely, the age group of 15 to 17 year olds has the lowest likelihood of being enrolled in a private school, with 9,885 (92.9% in the age bracket) attending a public institution.
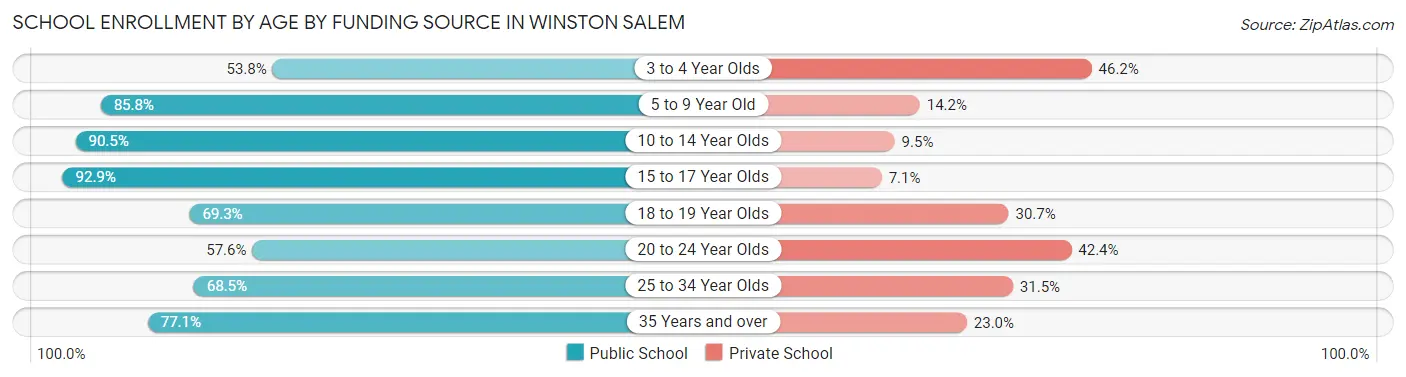
| Age Bracket | Public School | Private School |
| 3 to 4 Year Olds | 1,113 (53.8%) | 955 (46.2%) |
| 5 to 9 Year Old | 11,993 (85.8%) | 1,981 (14.2%) |
| 10 to 14 Year Olds | 16,151 (90.5%) | 1,695 (9.5%) |
| 15 to 17 Year Olds | 9,885 (92.9%) | 754 (7.1%) |
| 18 to 19 Year Olds | 5,101 (69.3%) | 2,261 (30.7%) |
| 20 to 24 Year Olds | 4,875 (57.6%) | 3,590 (42.4%) |
| 25 to 34 Year Olds | 2,698 (68.5%) | 1,242 (31.5%) |
| 35 Years and over | 2,693 (77.0%) | 802 (23.0%) |
| Total | 54,502 (80.4%) | 13,287 (19.6%) |
Educational Attainment by Field of Study in Winston Salem
Business (10,371 | 16.5%), education (6,629 | 10.5%), science & technology (6,134 | 9.7%), social sciences (5,241 | 8.3%), and arts & humanities (4,664 | 7.4%) are the most common fields of study among 63,008 individuals in Winston Salem who have obtained a bachelor's degree or higher.
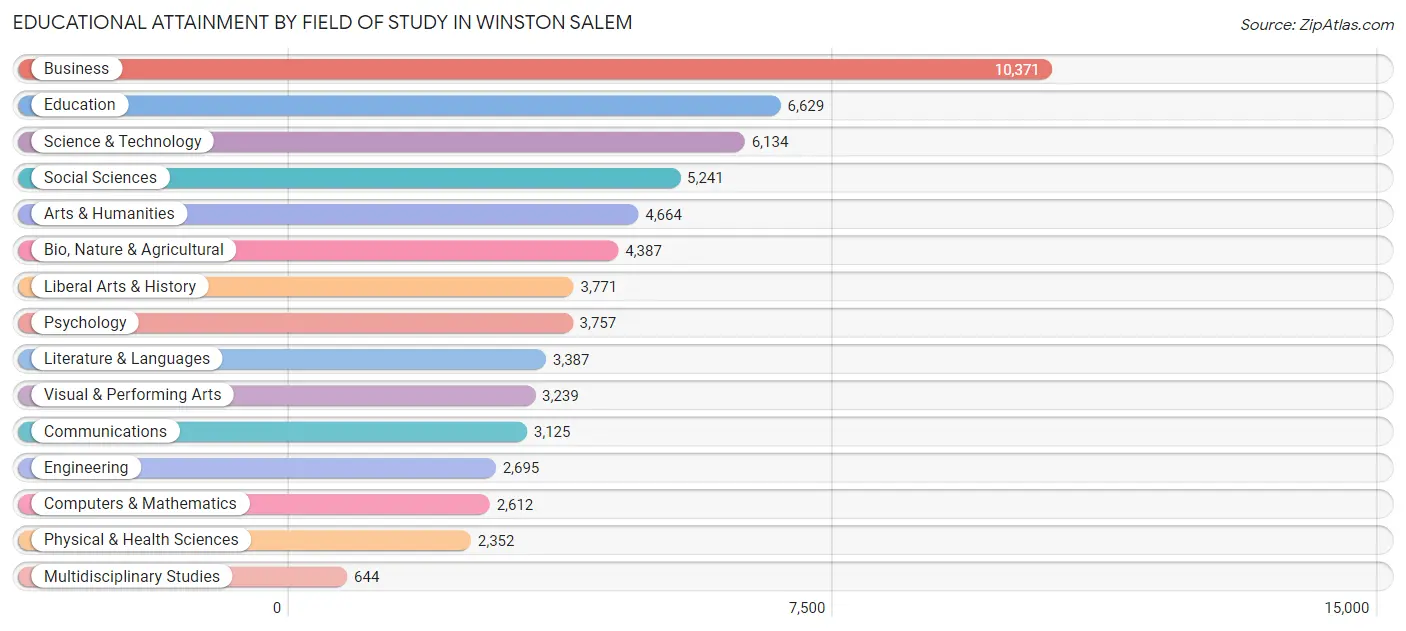
| Field of Study | # Graduates | % Graduates |
| Computers & Mathematics | 2,612 | 4.2% |
| Bio, Nature & Agricultural | 4,387 | 7.0% |
| Physical & Health Sciences | 2,352 | 3.7% |
| Psychology | 3,757 | 6.0% |
| Social Sciences | 5,241 | 8.3% |
| Engineering | 2,695 | 4.3% |
| Multidisciplinary Studies | 644 | 1.0% |
| Science & Technology | 6,134 | 9.7% |
| Business | 10,371 | 16.5% |
| Education | 6,629 | 10.5% |
| Literature & Languages | 3,387 | 5.4% |
| Liberal Arts & History | 3,771 | 6.0% |
| Visual & Performing Arts | 3,239 | 5.1% |
| Communications | 3,125 | 5.0% |
| Arts & Humanities | 4,664 | 7.4% |
| Total | 63,008 | 100.0% |
Transportation & Commute in Winston Salem
Vehicle Availability by Sex in Winston Salem
The most prevalent vehicle ownership categories in Winston Salem are males with 2 vehicles (23,690, accounting for 42.3%) and females with 2 vehicles (22,403, making up 42.5%).
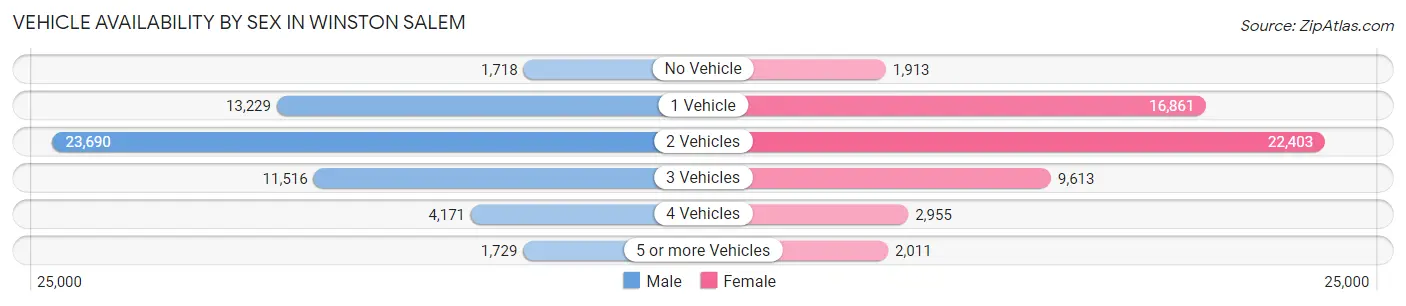
| Vehicles Available | Male | Female |
| No Vehicle | 1,718 (3.1%) | 1,913 (3.4%) |
| 1 Vehicle | 13,229 (23.6%) | 16,861 (30.2%) |
| 2 Vehicles | 23,690 (42.3%) | 22,403 (40.2%) |
| 3 Vehicles | 11,516 (20.5%) | 9,613 (17.2%) |
| 4 Vehicles | 4,171 (7.4%) | 2,955 (5.3%) |
| 5 or more Vehicles | 1,729 (3.1%) | 2,011 (3.6%) |
| Total | 56,053 (100.0%) | 55,756 (100.0%) |
Commute Time in Winston Salem
The most frequently occuring commute durations in Winston Salem are 15 to 19 minutes (22,846 commuters, 22.6%), 10 to 14 minutes (17,681 commuters, 17.5%), and 20 to 24 minutes (17,424 commuters, 17.2%).
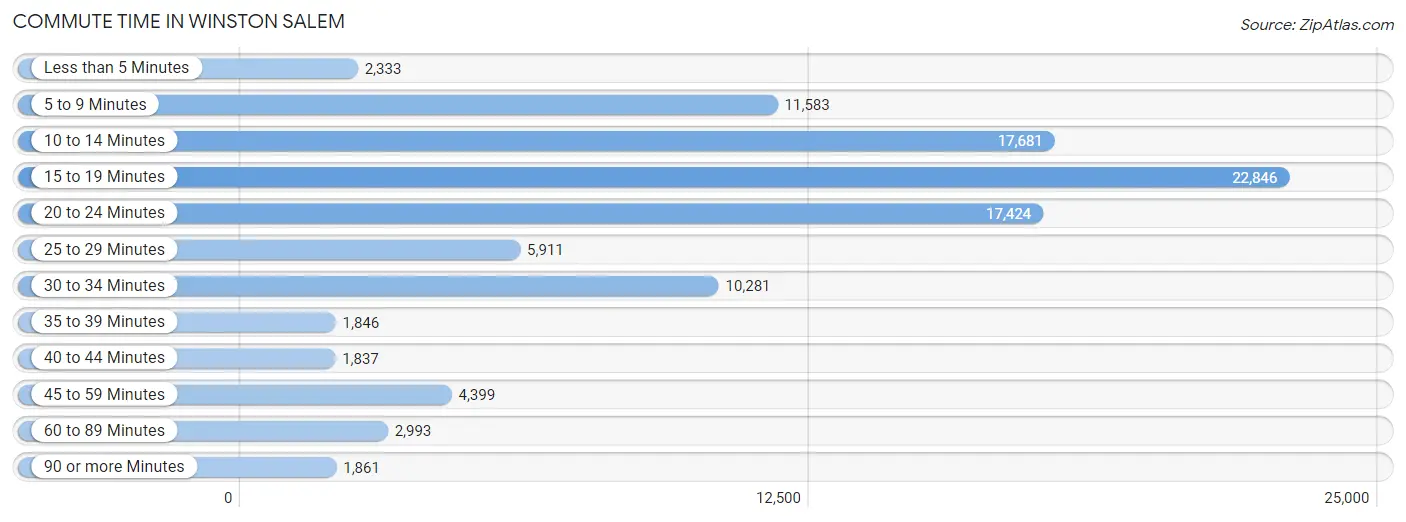
| Commute Time | # Commuters | % Commuters |
| Less than 5 Minutes | 2,333 | 2.3% |
| 5 to 9 Minutes | 11,583 | 11.5% |
| 10 to 14 Minutes | 17,681 | 17.5% |
| 15 to 19 Minutes | 22,846 | 22.6% |
| 20 to 24 Minutes | 17,424 | 17.2% |
| 25 to 29 Minutes | 5,911 | 5.9% |
| 30 to 34 Minutes | 10,281 | 10.2% |
| 35 to 39 Minutes | 1,846 | 1.8% |
| 40 to 44 Minutes | 1,837 | 1.8% |
| 45 to 59 Minutes | 4,399 | 4.4% |
| 60 to 89 Minutes | 2,993 | 3.0% |
| 90 or more Minutes | 1,861 | 1.8% |
Commute Time by Sex in Winston Salem
The most common commute times in Winston Salem are 15 to 19 minutes (11,218 commuters, 22.3%) for males and 15 to 19 minutes (11,628 commuters, 23.0%) for females.
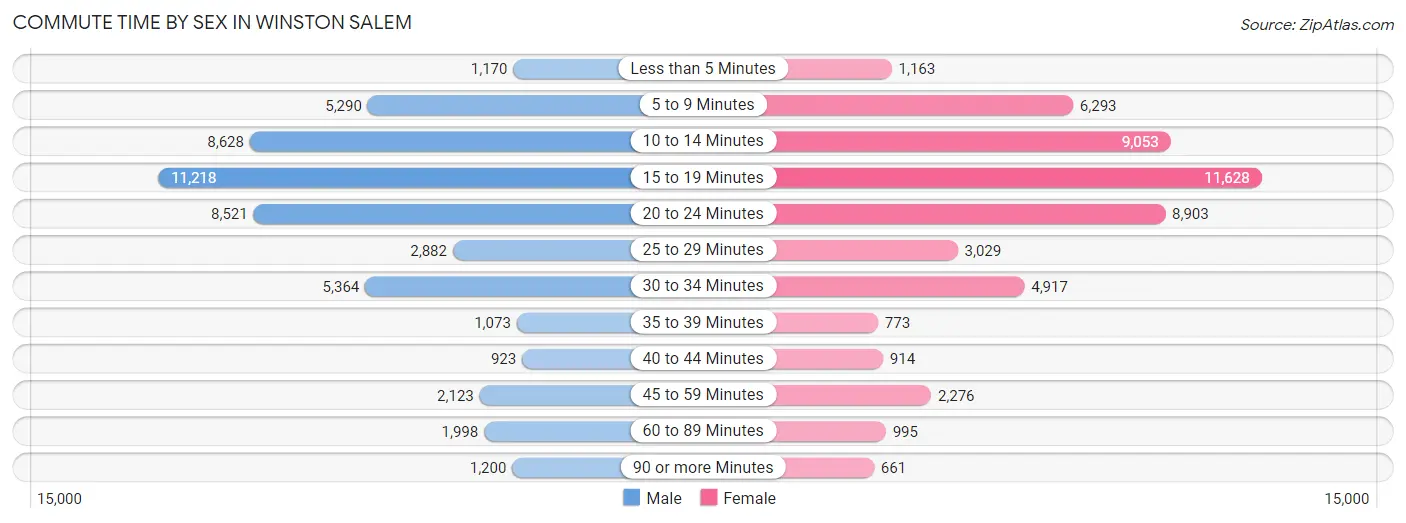
| Commute Time | Male | Female |
| Less than 5 Minutes | 1,170 (2.3%) | 1,163 (2.3%) |
| 5 to 9 Minutes | 5,290 (10.5%) | 6,293 (12.4%) |
| 10 to 14 Minutes | 8,628 (17.1%) | 9,053 (17.9%) |
| 15 to 19 Minutes | 11,218 (22.3%) | 11,628 (23.0%) |
| 20 to 24 Minutes | 8,521 (16.9%) | 8,903 (17.6%) |
| 25 to 29 Minutes | 2,882 (5.7%) | 3,029 (6.0%) |
| 30 to 34 Minutes | 5,364 (10.6%) | 4,917 (9.7%) |
| 35 to 39 Minutes | 1,073 (2.1%) | 773 (1.5%) |
| 40 to 44 Minutes | 923 (1.8%) | 914 (1.8%) |
| 45 to 59 Minutes | 2,123 (4.2%) | 2,276 (4.5%) |
| 60 to 89 Minutes | 1,998 (4.0%) | 995 (2.0%) |
| 90 or more Minutes | 1,200 (2.4%) | 661 (1.3%) |
Time of Departure to Work by Sex in Winston Salem
The most frequent times of departure to work in Winston Salem are 7:30 AM to 7:59 AM (7,049, 14.0%) for males and 7:30 AM to 7:59 AM (9,191, 18.2%) for females.
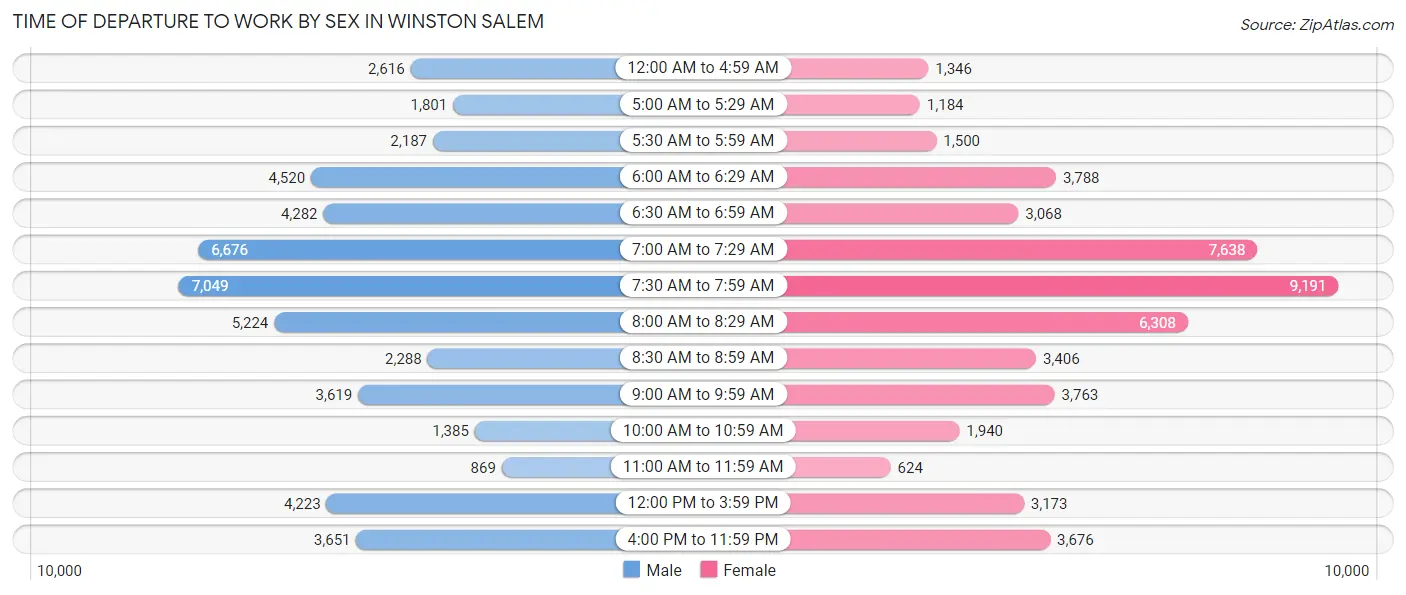
| Time of Departure | Male | Female |
| 12:00 AM to 4:59 AM | 2,616 (5.2%) | 1,346 (2.7%) |
| 5:00 AM to 5:29 AM | 1,801 (3.6%) | 1,184 (2.3%) |
| 5:30 AM to 5:59 AM | 2,187 (4.3%) | 1,500 (3.0%) |
| 6:00 AM to 6:29 AM | 4,520 (9.0%) | 3,788 (7.5%) |
| 6:30 AM to 6:59 AM | 4,282 (8.5%) | 3,068 (6.1%) |
| 7:00 AM to 7:29 AM | 6,676 (13.3%) | 7,638 (15.1%) |
| 7:30 AM to 7:59 AM | 7,049 (14.0%) | 9,191 (18.2%) |
| 8:00 AM to 8:29 AM | 5,224 (10.4%) | 6,308 (12.5%) |
| 8:30 AM to 8:59 AM | 2,288 (4.5%) | 3,406 (6.7%) |
| 9:00 AM to 9:59 AM | 3,619 (7.2%) | 3,763 (7.4%) |
| 10:00 AM to 10:59 AM | 1,385 (2.8%) | 1,940 (3.8%) |
| 11:00 AM to 11:59 AM | 869 (1.7%) | 624 (1.2%) |
| 12:00 PM to 3:59 PM | 4,223 (8.4%) | 3,173 (6.3%) |
| 4:00 PM to 11:59 PM | 3,651 (7.2%) | 3,676 (7.3%) |
| Total | 50,390 (100.0%) | 50,605 (100.0%) |
Housing Occupancy in Winston Salem
Occupancy by Ownership in Winston Salem
Of the total 98,749 dwellings in Winston Salem, owner-occupied units account for 53,236 (53.9%), while renter-occupied units make up 45,513 (46.1%).
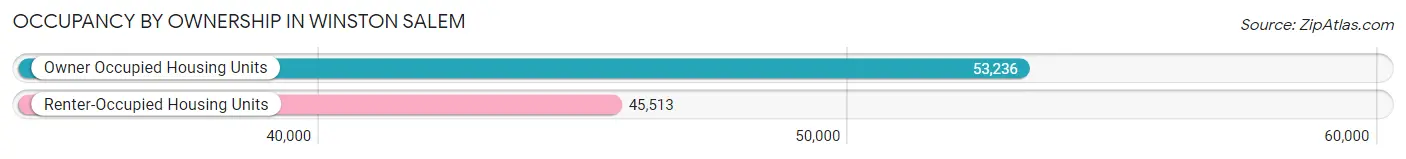
| Occupancy | # Housing Units | % Housing Units |
| Owner Occupied Housing Units | 53,236 | 53.9% |
| Renter-Occupied Housing Units | 45,513 | 46.1% |
| Total Occupied Housing Units | 98,749 | 100.0% |
Occupancy by Household Size in Winston Salem
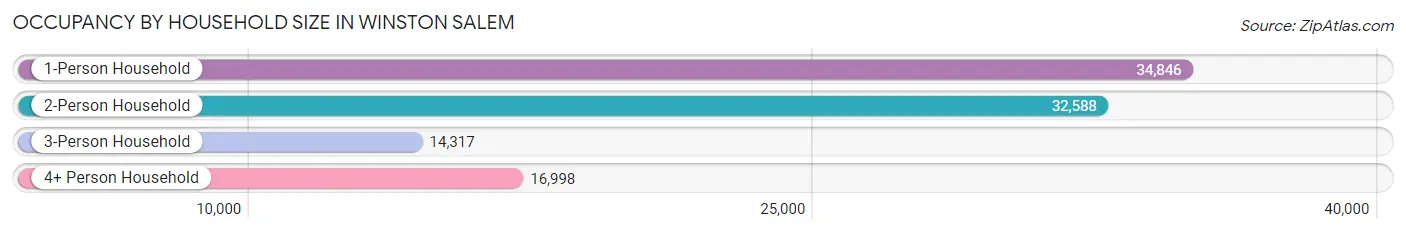
| Household Size | # Housing Units | % Housing Units |
| 1-Person Household | 34,846 | 35.3% |
| 2-Person Household | 32,588 | 33.0% |
| 3-Person Household | 14,317 | 14.5% |
| 4+ Person Household | 16,998 | 17.2% |
| Total Housing Units | 98,749 | 100.0% |
Occupancy by Ownership by Household Size in Winston Salem
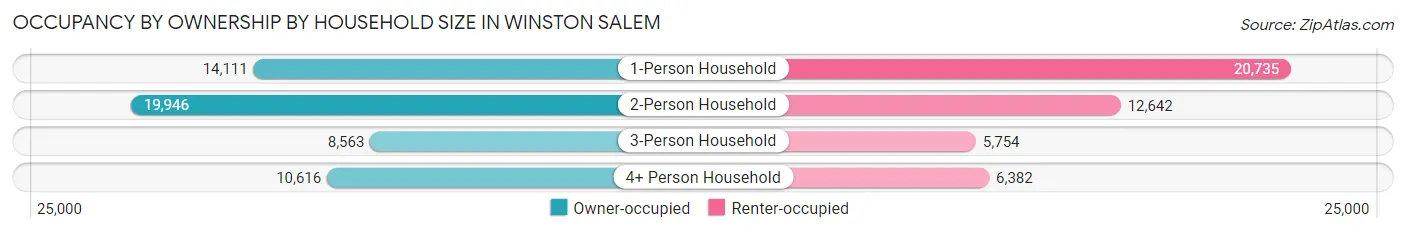
| Household Size | Owner-occupied | Renter-occupied |
| 1-Person Household | 14,111 (40.5%) | 20,735 (59.5%) |
| 2-Person Household | 19,946 (61.2%) | 12,642 (38.8%) |
| 3-Person Household | 8,563 (59.8%) | 5,754 (40.2%) |
| 4+ Person Household | 10,616 (62.5%) | 6,382 (37.6%) |
| Total Housing Units | 53,236 (53.9%) | 45,513 (46.1%) |
Occupancy by Educational Attainment in Winston Salem
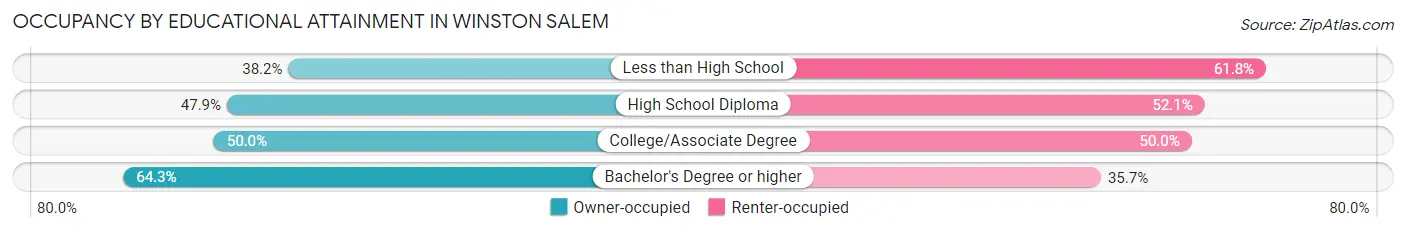
| Household Size | Owner-occupied | Renter-occupied |
| Less than High School | 3,677 (38.2%) | 5,954 (61.8%) |
| High School Diploma | 10,517 (47.9%) | 11,428 (52.1%) |
| College/Associate Degree | 14,543 (50.0%) | 14,552 (50.0%) |
| Bachelor's Degree or higher | 24,499 (64.3%) | 13,579 (35.7%) |
Occupancy by Age of Householder in Winston Salem
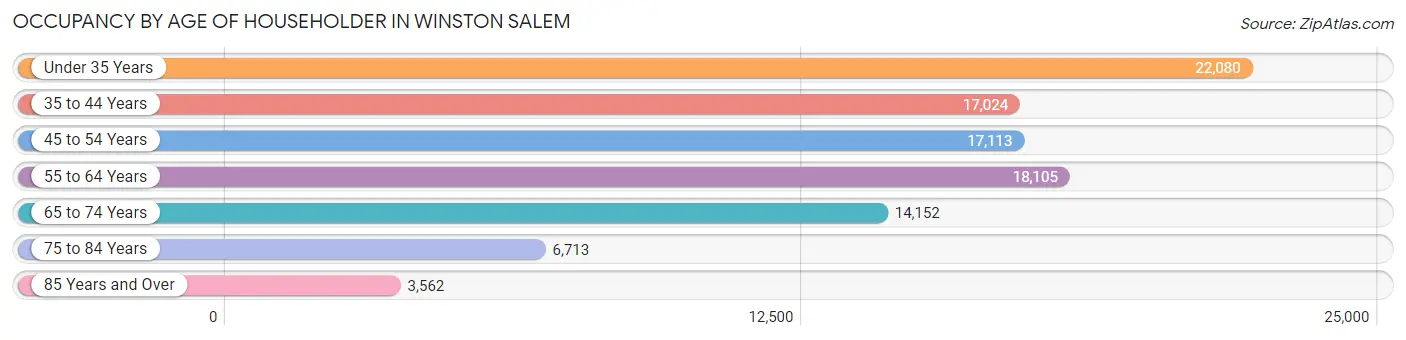
| Age Bracket | # Households | % Households |
| Under 35 Years | 22,080 | 22.4% |
| 35 to 44 Years | 17,024 | 17.2% |
| 45 to 54 Years | 17,113 | 17.3% |
| 55 to 64 Years | 18,105 | 18.3% |
| 65 to 74 Years | 14,152 | 14.3% |
| 75 to 84 Years | 6,713 | 6.8% |
| 85 Years and Over | 3,562 | 3.6% |
| Total | 98,749 | 100.0% |
Housing Finances in Winston Salem
Median Income by Occupancy in Winston Salem
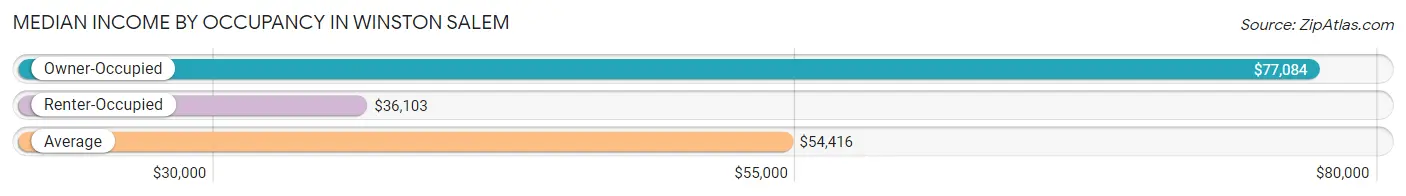
| Occupancy Type | # Households | Median Income |
| Owner-Occupied | 53,236 (53.9%) | $77,084 |
| Renter-Occupied | 45,513 (46.1%) | $36,103 |
| Average | 98,749 (100.0%) | $54,416 |
Occupancy by Householder Income Bracket in Winston Salem
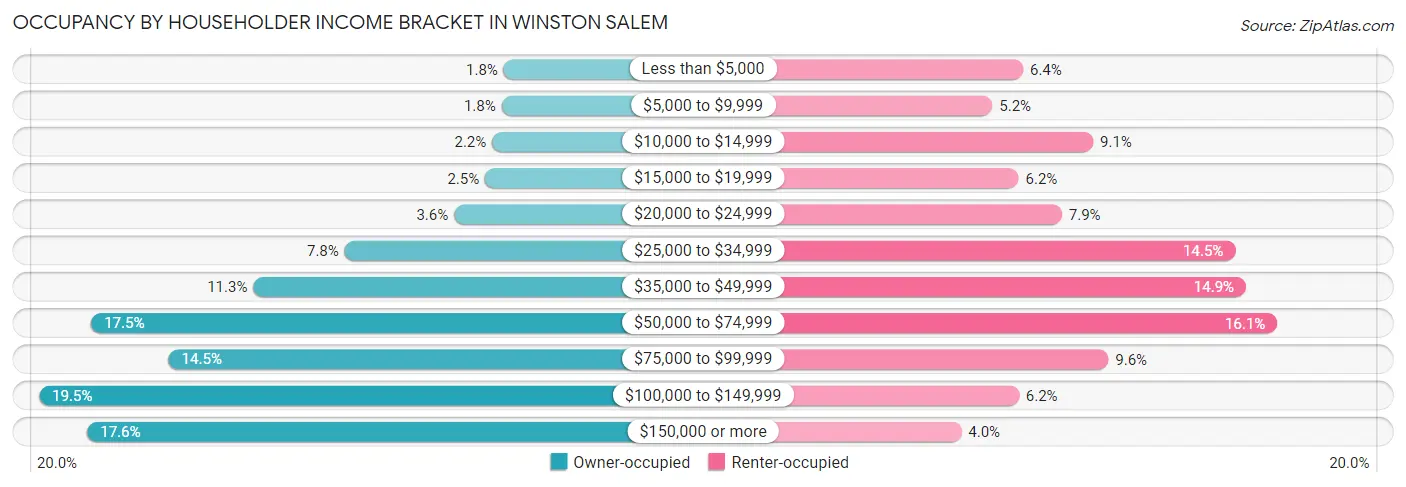
| Income Bracket | Owner-occupied | Renter-occupied |
| Less than $5,000 | 930 (1.8%) | 2,904 (6.4%) |
| $5,000 to $9,999 | 972 (1.8%) | 2,371 (5.2%) |
| $10,000 to $14,999 | 1,168 (2.2%) | 4,121 (9.0%) |
| $15,000 to $19,999 | 1,308 (2.5%) | 2,828 (6.2%) |
| $20,000 to $24,999 | 1,940 (3.6%) | 3,578 (7.9%) |
| $25,000 to $34,999 | 4,159 (7.8%) | 6,582 (14.5%) |
| $35,000 to $49,999 | 6,010 (11.3%) | 6,769 (14.9%) |
| $50,000 to $74,999 | 9,294 (17.5%) | 7,310 (16.1%) |
| $75,000 to $99,999 | 7,725 (14.5%) | 4,384 (9.6%) |
| $100,000 to $149,999 | 10,356 (19.5%) | 2,831 (6.2%) |
| $150,000 or more | 9,374 (17.6%) | 1,835 (4.0%) |
| Total | 53,236 (100.0%) | 45,513 (100.0%) |
Monthly Housing Cost Tiers in Winston Salem
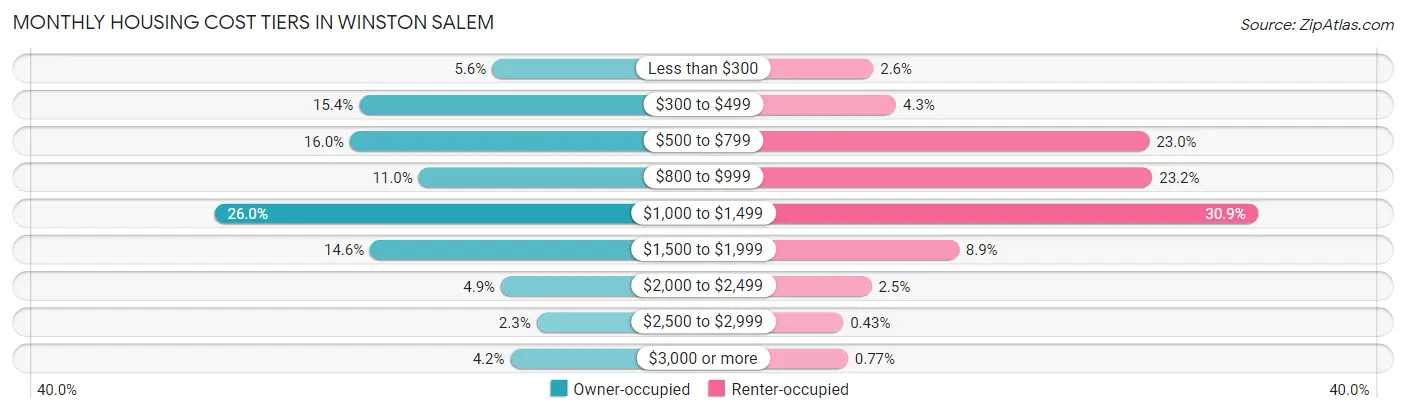
| Monthly Cost | Owner-occupied | Renter-occupied |
| Less than $300 | 2,964 (5.6%) | 1,202 (2.6%) |
| $300 to $499 | 8,185 (15.4%) | 1,964 (4.3%) |
| $500 to $799 | 8,541 (16.0%) | 10,460 (23.0%) |
| $800 to $999 | 5,852 (11.0%) | 10,554 (23.2%) |
| $1,000 to $1,499 | 13,846 (26.0%) | 14,080 (30.9%) |
| $1,500 to $1,999 | 7,750 (14.6%) | 4,070 (8.9%) |
| $2,000 to $2,499 | 2,617 (4.9%) | 1,143 (2.5%) |
| $2,500 to $2,999 | 1,227 (2.3%) | 197 (0.4%) |
| $3,000 or more | 2,254 (4.2%) | 352 (0.8%) |
| Total | 53,236 (100.0%) | 45,513 (100.0%) |
Physical Housing Characteristics in Winston Salem
Housing Structures in Winston Salem
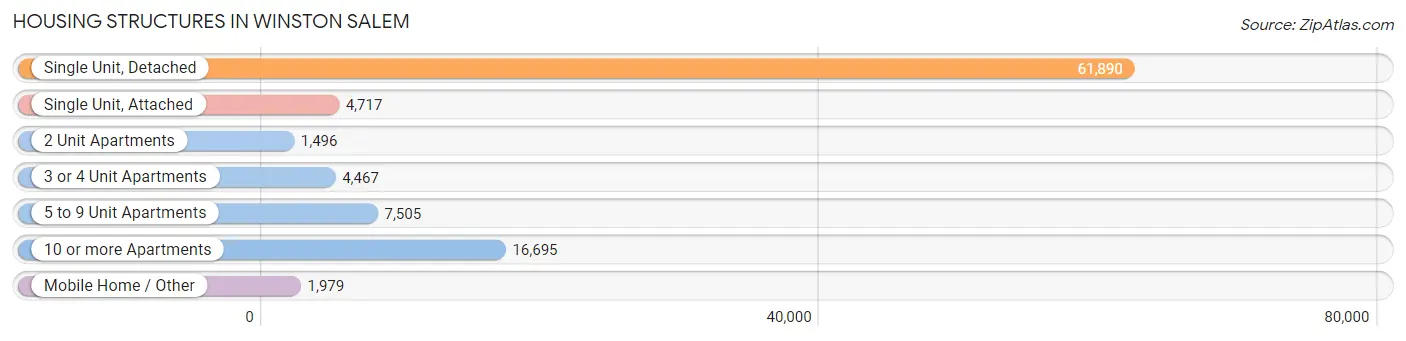
| Structure Type | # Housing Units | % Housing Units |
| Single Unit, Detached | 61,890 | 62.7% |
| Single Unit, Attached | 4,717 | 4.8% |
| 2 Unit Apartments | 1,496 | 1.5% |
| 3 or 4 Unit Apartments | 4,467 | 4.5% |
| 5 to 9 Unit Apartments | 7,505 | 7.6% |
| 10 or more Apartments | 16,695 | 16.9% |
| Mobile Home / Other | 1,979 | 2.0% |
| Total | 98,749 | 100.0% |
Housing Structures by Occupancy in Winston Salem
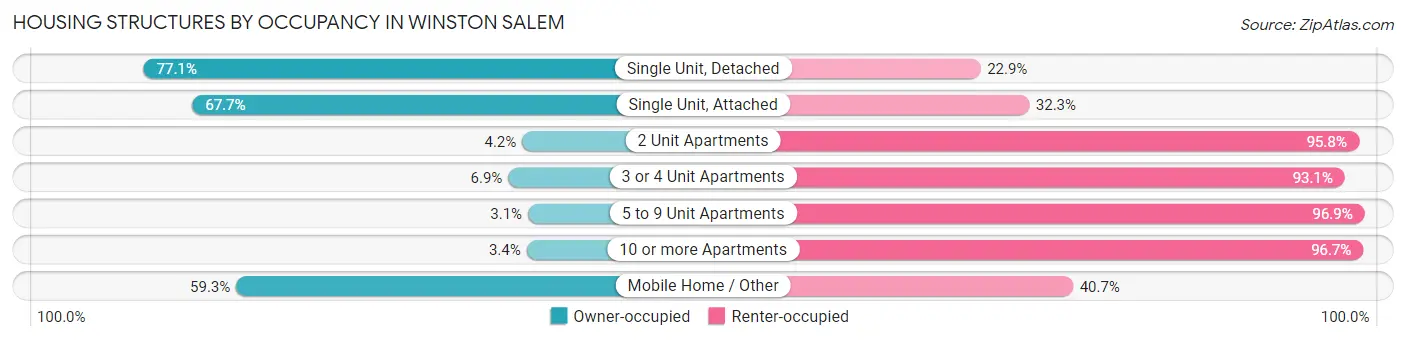
| Structure Type | Owner-occupied | Renter-occupied |
| Single Unit, Detached | 47,707 (77.1%) | 14,183 (22.9%) |
| Single Unit, Attached | 3,194 (67.7%) | 1,523 (32.3%) |
| 2 Unit Apartments | 63 (4.2%) | 1,433 (95.8%) |
| 3 or 4 Unit Apartments | 308 (6.9%) | 4,159 (93.1%) |
| 5 to 9 Unit Apartments | 232 (3.1%) | 7,273 (96.9%) |
| 10 or more Apartments | 559 (3.4%) | 16,136 (96.7%) |
| Mobile Home / Other | 1,173 (59.3%) | 806 (40.7%) |
| Total | 53,236 (53.9%) | 45,513 (46.1%) |
Housing Structures by Number of Rooms in Winston Salem
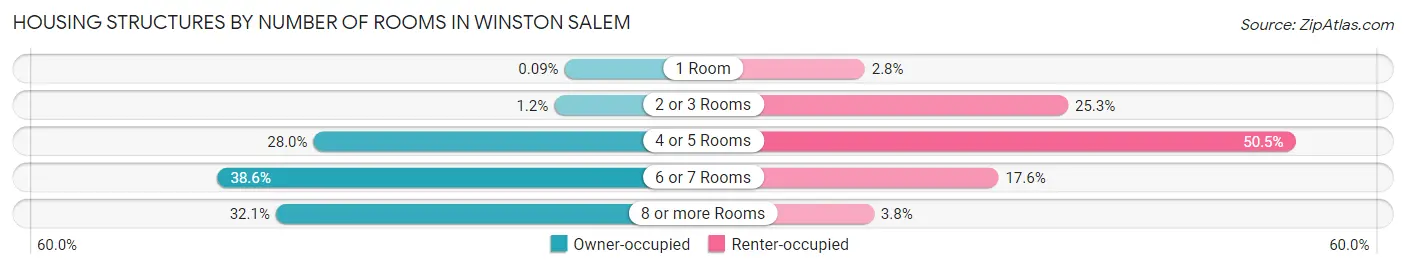
| Number of Rooms | Owner-occupied | Renter-occupied |
| 1 Room | 50 (0.1%) | 1,257 (2.8%) |
| 2 or 3 Rooms | 662 (1.2%) | 11,524 (25.3%) |
| 4 or 5 Rooms | 14,877 (28.0%) | 23,004 (50.5%) |
| 6 or 7 Rooms | 20,543 (38.6%) | 8,012 (17.6%) |
| 8 or more Rooms | 17,104 (32.1%) | 1,716 (3.8%) |
| Total | 53,236 (100.0%) | 45,513 (100.0%) |
Housing Structure by Heating Type in Winston Salem
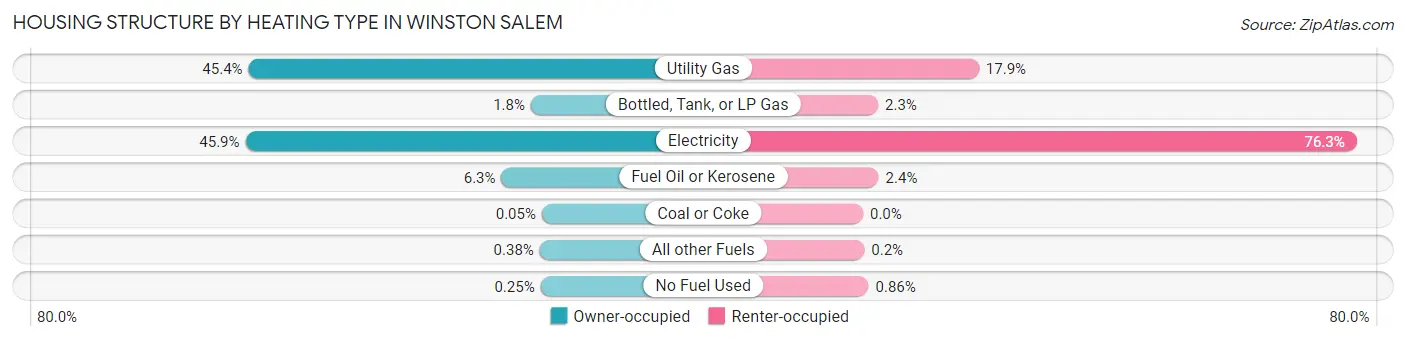
| Heating Type | Owner-occupied | Renter-occupied |
| Utility Gas | 24,167 (45.4%) | 8,152 (17.9%) |
| Bottled, Tank, or LP Gas | 932 (1.8%) | 1,060 (2.3%) |
| Electricity | 24,419 (45.9%) | 34,720 (76.3%) |
| Fuel Oil or Kerosene | 3,356 (6.3%) | 1,096 (2.4%) |
| Coal or Coke | 26 (0.1%) | 0 (0.0%) |
| All other Fuels | 202 (0.4%) | 92 (0.2%) |
| No Fuel Used | 134 (0.3%) | 393 (0.9%) |
| Total | 53,236 (100.0%) | 45,513 (100.0%) |
Household Vehicle Usage in Winston Salem
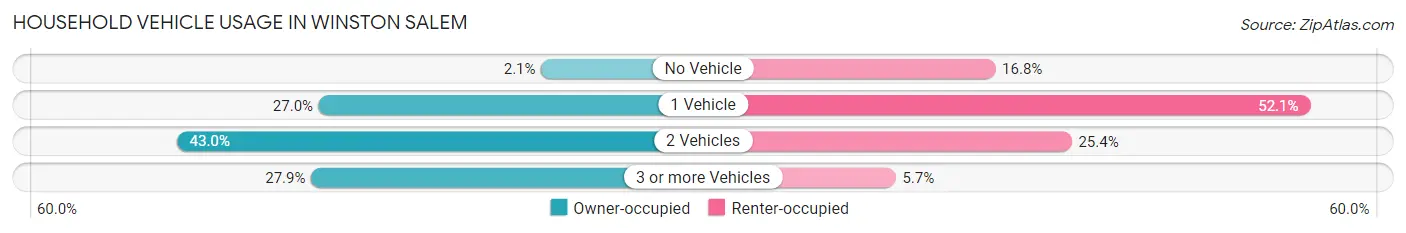
| Vehicles per Household | Owner-occupied | Renter-occupied |
| No Vehicle | 1,124 (2.1%) | 7,658 (16.8%) |
| 1 Vehicle | 14,391 (27.0%) | 23,725 (52.1%) |
| 2 Vehicles | 22,878 (43.0%) | 11,552 (25.4%) |
| 3 or more Vehicles | 14,843 (27.9%) | 2,578 (5.7%) |
| Total | 53,236 (100.0%) | 45,513 (100.0%) |
Real Estate & Mortgages in Winston Salem
Real Estate and Mortgage Overview in Winston Salem
| Characteristic | Without Mortgage | With Mortgage |
| Housing Units | 18,520 | 34,716 |
| Median Property Value | $173,400 | $193,300 |
| Median Household Income | $61,100 | $6,902 |
| Monthly Housing Costs | $466 | $2,254 |
| Real Estate Taxes | $1,760 | $523 |
Property Value by Mortgage Status in Winston Salem
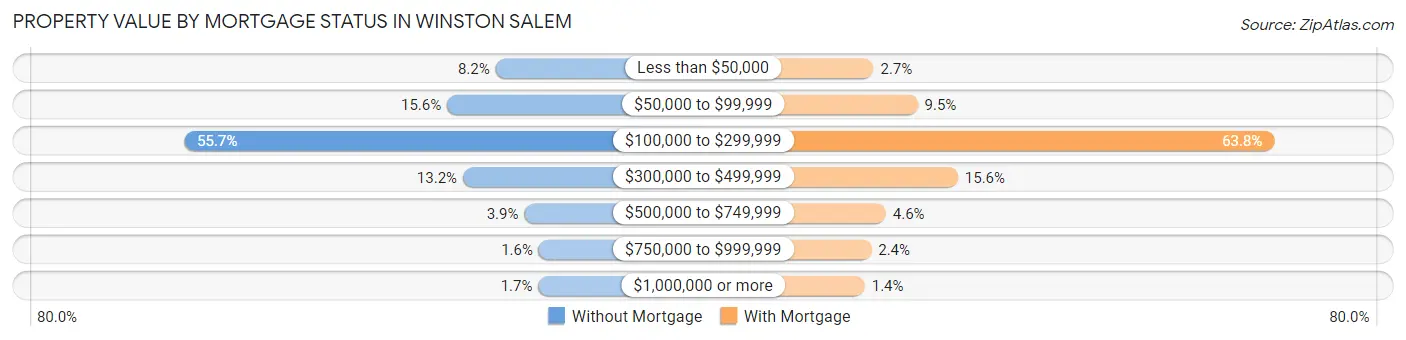
| Property Value | Without Mortgage | With Mortgage |
| Less than $50,000 | 1,524 (8.2%) | 950 (2.7%) |
| $50,000 to $99,999 | 2,895 (15.6%) | 3,283 (9.5%) |
| $100,000 to $299,999 | 10,318 (55.7%) | 22,145 (63.8%) |
| $300,000 to $499,999 | 2,446 (13.2%) | 5,411 (15.6%) |
| $500,000 to $749,999 | 715 (3.9%) | 1,603 (4.6%) |
| $750,000 to $999,999 | 303 (1.6%) | 834 (2.4%) |
| $1,000,000 or more | 319 (1.7%) | 490 (1.4%) |
| Total | 18,520 (100.0%) | 34,716 (100.0%) |
Household Income by Mortgage Status in Winston Salem
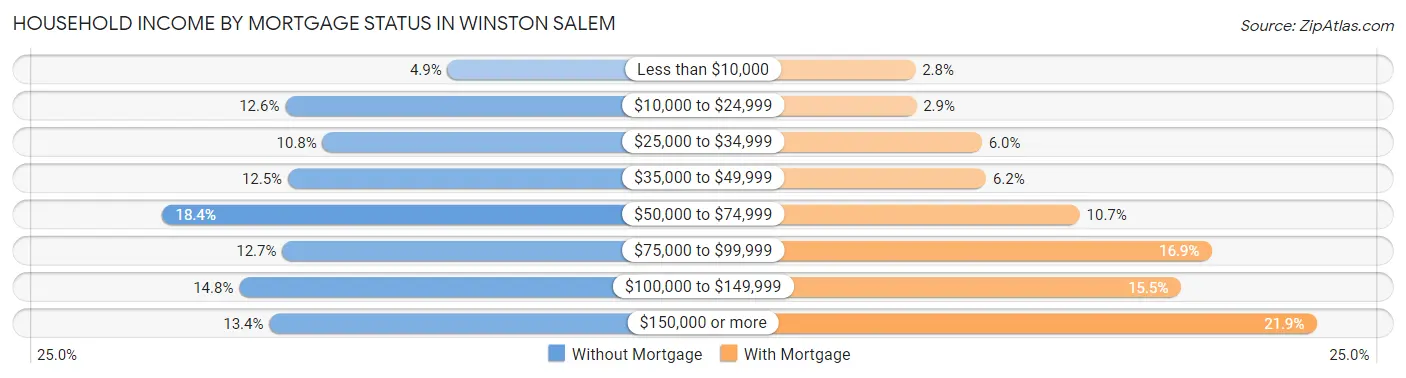
| Household Income | Without Mortgage | With Mortgage |
| Less than $10,000 | 900 (4.9%) | 986 (2.8%) |
| $10,000 to $24,999 | 2,331 (12.6%) | 1,002 (2.9%) |
| $25,000 to $34,999 | 2,002 (10.8%) | 2,085 (6.0%) |
| $35,000 to $49,999 | 2,307 (12.5%) | 2,157 (6.2%) |
| $50,000 to $74,999 | 3,413 (18.4%) | 3,703 (10.7%) |
| $75,000 to $99,999 | 2,357 (12.7%) | 5,881 (16.9%) |
| $100,000 to $149,999 | 2,738 (14.8%) | 5,368 (15.5%) |
| $150,000 or more | 2,472 (13.4%) | 7,618 (21.9%) |
| Total | 18,520 (100.0%) | 34,716 (100.0%) |
Property Value to Household Income Ratio in Winston Salem
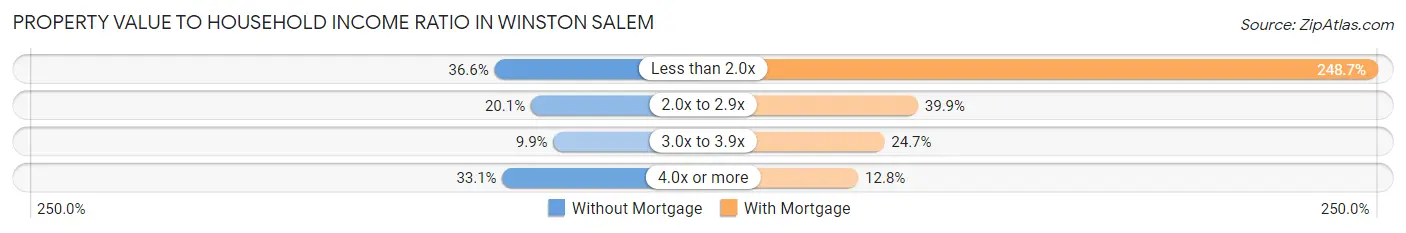
| Value-to-Income Ratio | Without Mortgage | With Mortgage |
| Less than 2.0x | 6,786 (36.6%) | 86,353 (248.7%) |
| 2.0x to 2.9x | 3,720 (20.1%) | 13,859 (39.9%) |
| 3.0x to 3.9x | 1,830 (9.9%) | 8,585 (24.7%) |
| 4.0x or more | 6,120 (33.1%) | 4,451 (12.8%) |
| Total | 18,520 (100.0%) | 34,716 (100.0%) |
Real Estate Taxes by Mortgage Status in Winston Salem
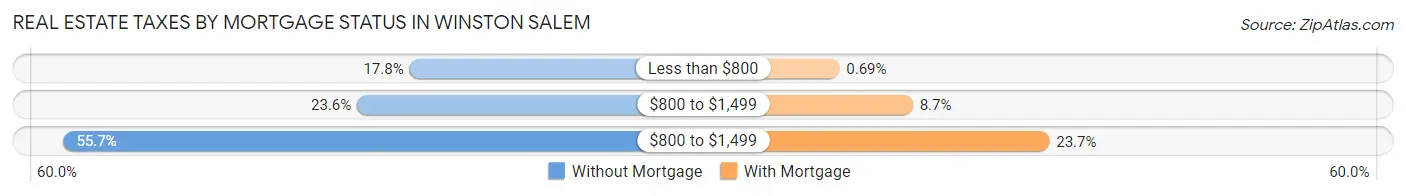
| Property Taxes | Without Mortgage | With Mortgage |
| Less than $800 | 3,300 (17.8%) | 239 (0.7%) |
| $800 to $1,499 | 4,364 (23.6%) | 3,032 (8.7%) |
| $800 to $1,499 | 10,323 (55.7%) | 8,229 (23.7%) |
| Total | 18,520 (100.0%) | 34,716 (100.0%) |
Health & Disability in Winston Salem
Health Insurance Coverage by Age in Winston Salem
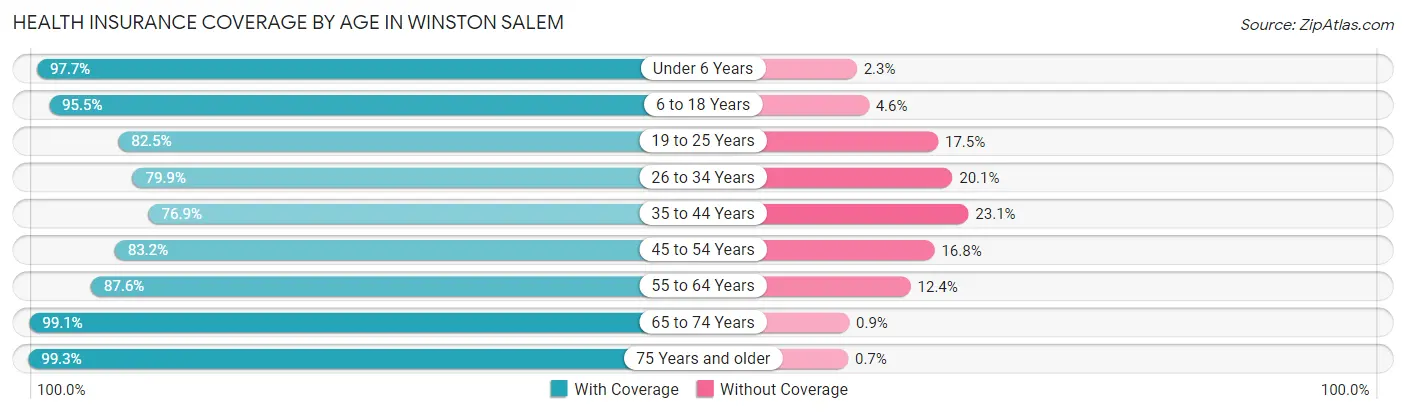
| Age Bracket | With Coverage | Without Coverage |
| Under 6 Years | 17,009 (97.7%) | 403 (2.3%) |
| 6 to 18 Years | 43,375 (95.5%) | 2,066 (4.5%) |
| 19 to 25 Years | 22,412 (82.5%) | 4,749 (17.5%) |
| 26 to 34 Years | 25,246 (79.9%) | 6,365 (20.1%) |
| 35 to 44 Years | 22,886 (76.9%) | 6,890 (23.1%) |
| 45 to 54 Years | 24,834 (83.2%) | 5,020 (16.8%) |
| 55 to 64 Years | 26,214 (87.6%) | 3,702 (12.4%) |
| 65 to 74 Years | 20,905 (99.1%) | 190 (0.9%) |
| 75 Years and older | 14,535 (99.3%) | 103 (0.7%) |
| Total | 217,416 (88.1%) | 29,488 (11.9%) |
Health Insurance Coverage by Citizenship Status in Winston Salem
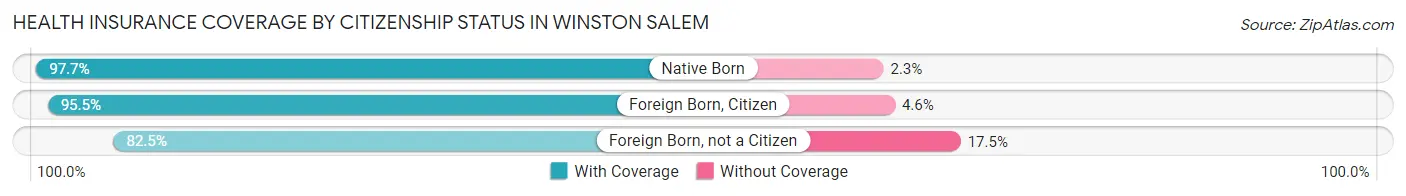
| Citizenship Status | With Coverage | Without Coverage |
| Native Born | 17,009 (97.7%) | 403 (2.3%) |
| Foreign Born, Citizen | 43,375 (95.5%) | 2,066 (4.5%) |
| Foreign Born, not a Citizen | 22,412 (82.5%) | 4,749 (17.5%) |
Health Insurance Coverage by Household Income in Winston Salem
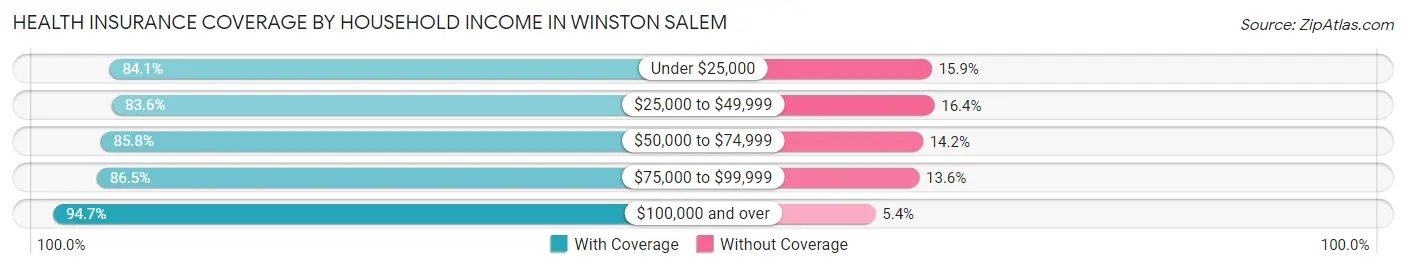
| Household Income | With Coverage | Without Coverage |
| Under $25,000 | 33,203 (84.1%) | 6,280 (15.9%) |
| $25,000 to $49,999 | 43,166 (83.6%) | 8,462 (16.4%) |
| $50,000 to $74,999 | 36,009 (85.8%) | 5,976 (14.2%) |
| $75,000 to $99,999 | 28,708 (86.5%) | 4,501 (13.6%) |
| $100,000 and over | 68,872 (94.7%) | 3,894 (5.3%) |
Public vs Private Health Insurance Coverage by Age in Winston Salem
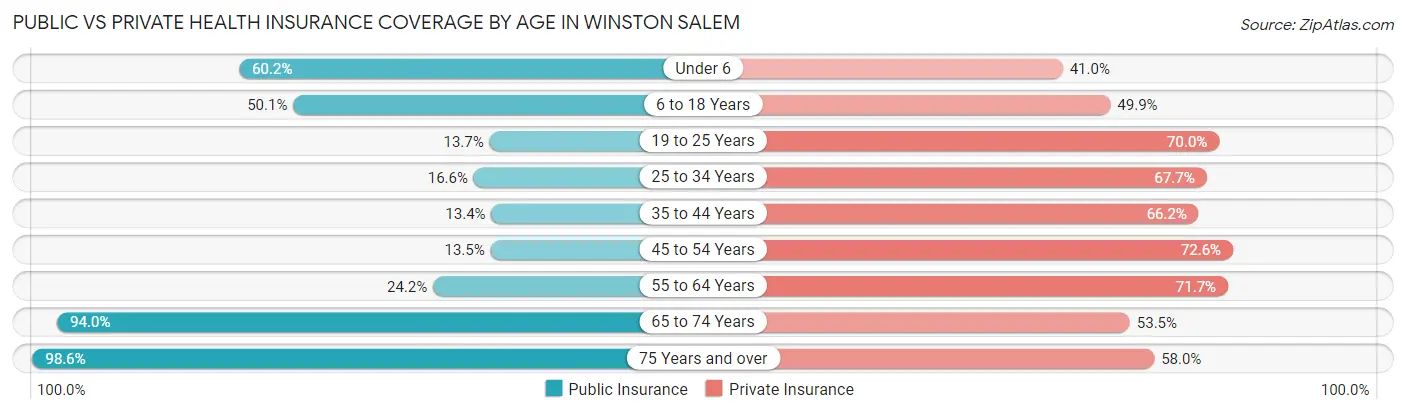
| Age Bracket | Public Insurance | Private Insurance |
| Under 6 | 10,482 (60.2%) | 7,141 (41.0%) |
| 6 to 18 Years | 22,785 (50.1%) | 22,656 (49.9%) |
| 19 to 25 Years | 3,721 (13.7%) | 19,023 (70.0%) |
| 25 to 34 Years | 5,253 (16.6%) | 21,402 (67.7%) |
| 35 to 44 Years | 3,975 (13.4%) | 19,725 (66.2%) |
| 45 to 54 Years | 4,034 (13.5%) | 21,673 (72.6%) |
| 55 to 64 Years | 7,237 (24.2%) | 21,437 (71.7%) |
| 65 to 74 Years | 19,824 (94.0%) | 11,280 (53.5%) |
| 75 Years and over | 14,426 (98.6%) | 8,489 (58.0%) |
| Total | 91,737 (37.1%) | 152,826 (61.9%) |
Disability Status by Sex by Age in Winston Salem
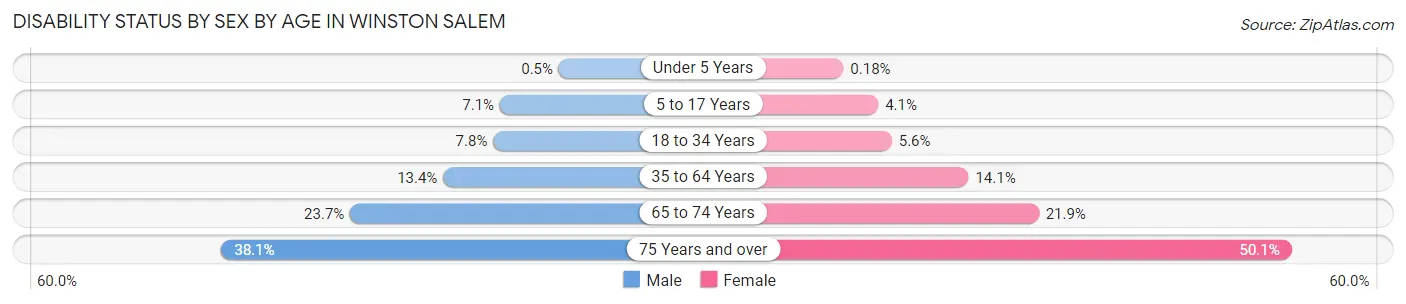
| Age Bracket | Male | Female |
| Under 5 Years | 37 (0.5%) | 13 (0.2%) |
| 5 to 17 Years | 1,549 (7.1%) | 879 (4.1%) |
| 18 to 34 Years | 2,289 (7.8%) | 1,897 (5.6%) |
| 35 to 64 Years | 5,681 (13.4%) | 6,643 (14.1%) |
| 65 to 74 Years | 2,204 (23.7%) | 2,591 (21.9%) |
| 75 Years and over | 2,201 (38.1%) | 4,437 (50.1%) |
Disability Class by Sex by Age in Winston Salem
Disability Class: Hearing Difficulty
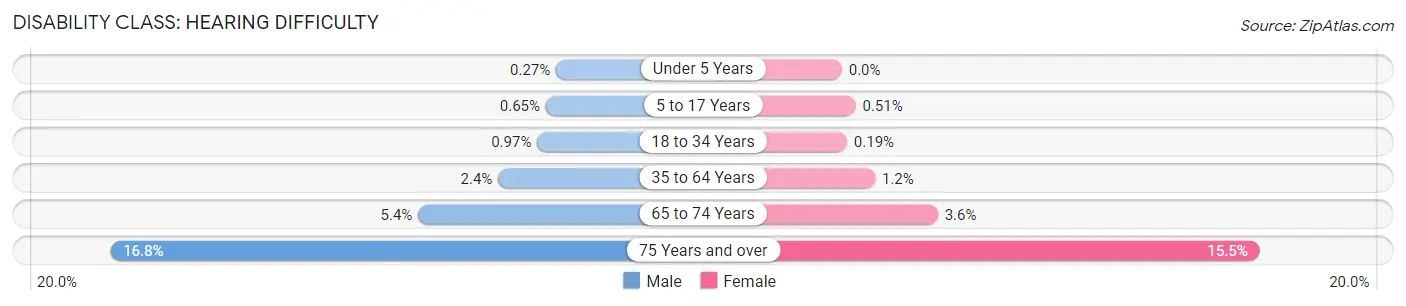
| Age Bracket | Male | Female |
| Under 5 Years | 20 (0.3%) | 0 (0.0%) |
| 5 to 17 Years | 143 (0.6%) | 111 (0.5%) |
| 18 to 34 Years | 283 (1.0%) | 65 (0.2%) |
| 35 to 64 Years | 1,029 (2.4%) | 578 (1.2%) |
| 65 to 74 Years | 500 (5.4%) | 421 (3.6%) |
| 75 Years and over | 972 (16.8%) | 1,374 (15.5%) |
Disability Class: Vision Difficulty
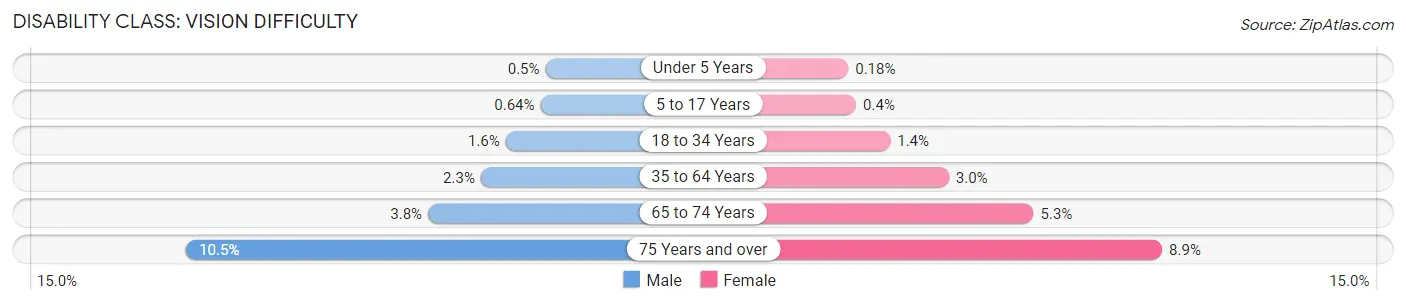
| Age Bracket | Male | Female |
| Under 5 Years | 37 (0.5%) | 13 (0.2%) |
| 5 to 17 Years | 140 (0.6%) | 87 (0.4%) |
| 18 to 34 Years | 471 (1.6%) | 458 (1.3%) |
| 35 to 64 Years | 976 (2.3%) | 1,405 (3.0%) |
| 65 to 74 Years | 350 (3.8%) | 631 (5.3%) |
| 75 Years and over | 607 (10.5%) | 790 (8.9%) |
Disability Class: Cognitive Difficulty
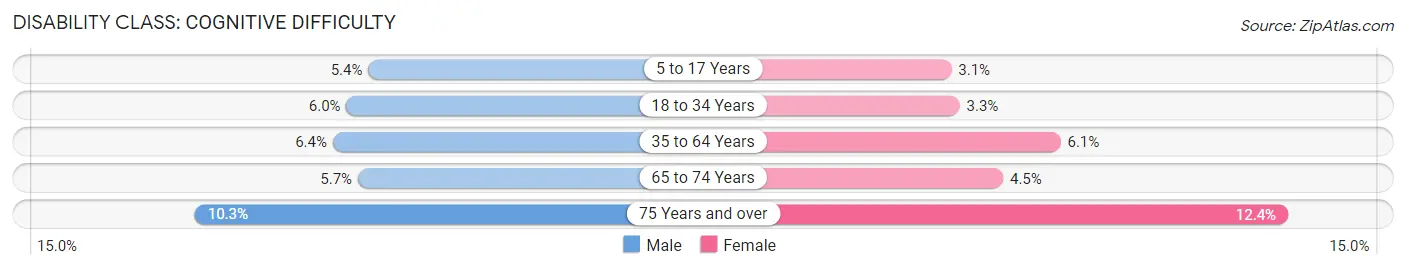
| Age Bracket | Male | Female |
| 5 to 17 Years | 1,191 (5.4%) | 661 (3.0%) |
| 18 to 34 Years | 1,770 (6.0%) | 1,118 (3.3%) |
| 35 to 64 Years | 2,725 (6.4%) | 2,867 (6.1%) |
| 65 to 74 Years | 531 (5.7%) | 530 (4.5%) |
| 75 Years and over | 593 (10.3%) | 1,100 (12.4%) |
Disability Class: Ambulatory Difficulty
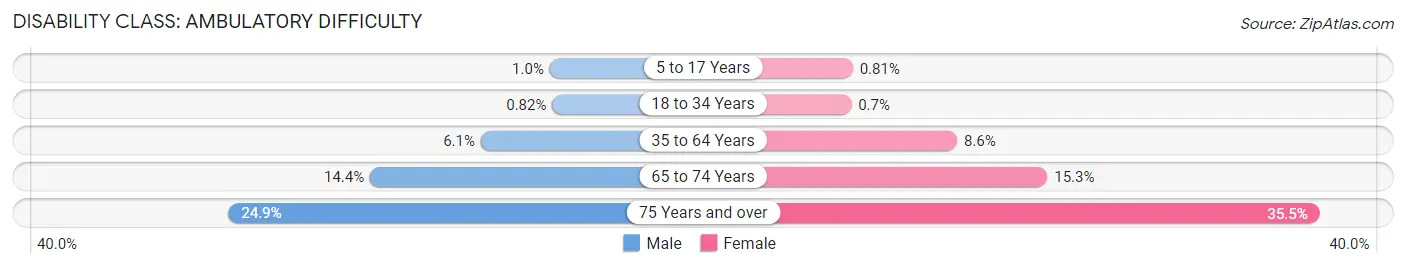
| Age Bracket | Male | Female |
| 5 to 17 Years | 221 (1.0%) | 175 (0.8%) |
| 18 to 34 Years | 239 (0.8%) | 237 (0.7%) |
| 35 to 64 Years | 2,604 (6.1%) | 4,027 (8.6%) |
| 65 to 74 Years | 1,332 (14.3%) | 1,803 (15.3%) |
| 75 Years and over | 1,437 (24.9%) | 3,142 (35.5%) |
Disability Class: Self-Care Difficulty
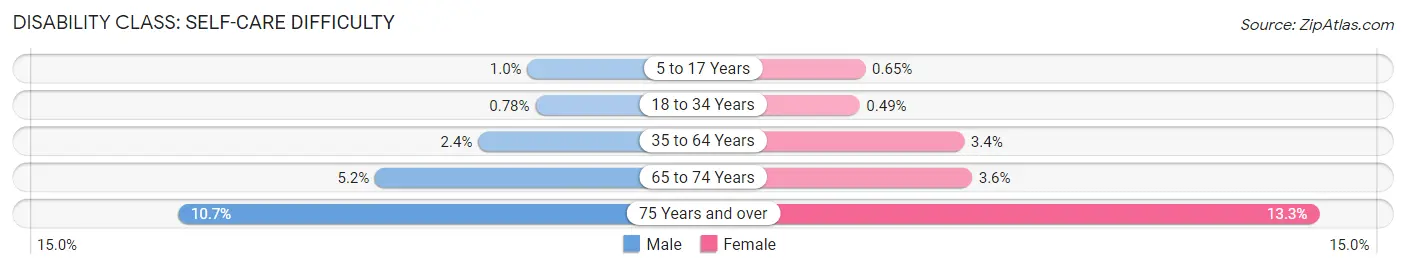
| Age Bracket | Male | Female |
| 5 to 17 Years | 220 (1.0%) | 141 (0.6%) |
| 18 to 34 Years | 229 (0.8%) | 167 (0.5%) |
| 35 to 64 Years | 1,007 (2.4%) | 1,601 (3.4%) |
| 65 to 74 Years | 486 (5.2%) | 428 (3.6%) |
| 75 Years and over | 620 (10.7%) | 1,177 (13.3%) |
Technology Access in Winston Salem
Computing Device Access in Winston Salem
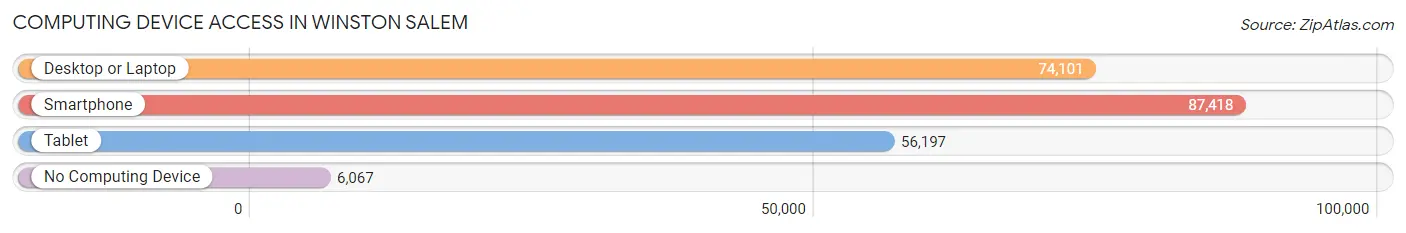
| Device Type | # Households | % Households |
| Desktop or Laptop | 74,101 | 75.0% |
| Smartphone | 87,418 | 88.5% |
| Tablet | 56,197 | 56.9% |
| No Computing Device | 6,067 | 6.1% |
| Total | 98,749 | 100.0% |
Internet Access in Winston Salem
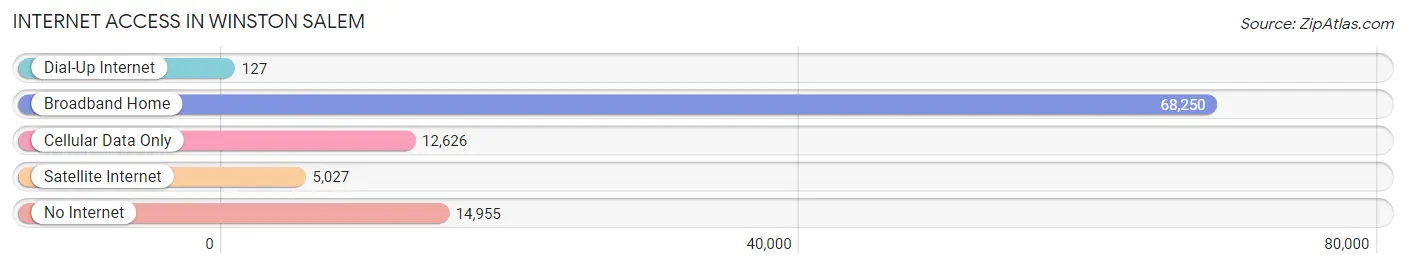
| Internet Type | # Households | % Households |
| Dial-Up Internet | 127 | 0.1% |
| Broadband Home | 68,250 | 69.1% |
| Cellular Data Only | 12,626 | 12.8% |
| Satellite Internet | 5,027 | 5.1% |
| No Internet | 14,955 | 15.1% |
| Total | 98,749 | 100.0% |
Winston Salem Summary
Winston-Salem is a city located in the state of North Carolina, United States. It is the county seat of Forsyth County and the fifth-largest city in the state. The city is located in the Piedmont Triad region of the state, and is home to a population of approximately 245,000 people.
History
The area that is now Winston-Salem was first settled by Europeans in 1753, when a group of Moravians from Pennsylvania established the town of Salem. The town was named after the biblical city of Salem, and was intended to be a religious community. The town grew quickly, and by 1766 it had become the largest town in the region.
In 1849, the town of Salem merged with the nearby town of Winston to form the city of Winston-Salem. The new city was named after the prominent local businessman, Joseph Winston. Winston was a major supporter of the Union during the Civil War, and the city was a major center of industry during the Reconstruction era.
In the early 20th century, Winston-Salem became a major center of the tobacco industry. The city was home to several major tobacco companies, including R.J. Reynolds Tobacco Company and Hanes Corporation. The city also became a major center of the textile industry, and was home to several major textile mills.
Geography
Winston-Salem is located in the Piedmont Triad region of North Carolina, in the foothills of the Blue Ridge Mountains. The city is situated at the intersection of Interstate 40 and US Highway 52, and is approximately 90 miles northwest of Charlotte.
The city covers an area of approximately 131 square miles, and is divided into several distinct neighborhoods. The downtown area is home to many of the city’s major attractions, including the Old Salem Historic District, the Reynolda House Museum of American Art, and the Southeastern Center for Contemporary Art.
The city is also home to several parks and recreational areas, including the Tanglewood Park, the Salem Lake Park, and the Hanes Park.
Economy
Winston-Salem is a major center of industry and commerce in North Carolina. The city is home to several major corporations, including Hanes Corporation, BB&T, and Reynolds American. The city is also home to several major universities, including Wake Forest University, Winston-Salem State University, and Salem College.
The city’s economy is also supported by a strong tourism industry. The city is home to several major attractions, including the Old Salem Historic District, the Reynolda House Museum of American Art, and the Southeastern Center for Contemporary Art.
Demographics
As of the 2010 census, the population of Winston-Salem was approximately 245,000 people. The city is home to a diverse population, with a majority of the population being African American (44.3%), followed by White (41.2%), Hispanic (7.2%), and Asian (3.2%).
The median household income in the city is approximately $41,000, and the median home value is approximately $150,000. The city has a poverty rate of approximately 20%, and the unemployment rate is approximately 5%.
Common Questions
What is Per Capita Income in Winston Salem?
Per Capita income in Winston Salem is $33,279.
What is the Median Family Income in Winston Salem?
Median Family Income in Winston Salem is $71,260.
What is the Median Household income in Winston Salem?
Median Household Income in Winston Salem is $54,416.
What is Income or Wage Gap in Winston Salem?
Income or Wage Gap in Winston Salem is 21.3%.
Women in Winston Salem earn 78.7 cents for every dollar earned by a man.
What is Family Income Deficit in Winston Salem?
Family Income Deficit in Winston Salem is $11,963.
Families that are below poverty line in Winston Salem earn $11,963 less on average than the poverty threshold level.
What is Inequality or Gini Index in Winston Salem?
Inequality or Gini Index in Winston Salem is 0.50.
What is the Total Population of Winston Salem?
Total Population of Winston Salem is 249,571.
What is the Total Male Population of Winston Salem?
Total Male Population of Winston Salem is 117,916.
What is the Total Female Population of Winston Salem?
Total Female Population of Winston Salem is 131,655.
What is the Ratio of Males per 100 Females in Winston Salem?
There are 89.56 Males per 100 Females in Winston Salem.
What is the Ratio of Females per 100 Males in Winston Salem?
There are 111.65 Females per 100 Males in Winston Salem.
What is the Median Population Age in Winston Salem?
Median Population Age in Winston Salem is 35.7 Years.
What is the Average Family Size in Winston Salem
Average Family Size in Winston Salem is 3.2 People.
What is the Average Household Size in Winston Salem
Average Household Size in Winston Salem is 2.4 People.
How Large is the Labor Force in Winston Salem?
There are 122,161 People in the Labor Forcein in Winston Salem.
What is the Percentage of People in the Labor Force in Winston Salem?
61.6% of People are in the Labor Force in Winston Salem.
What is the Unemployment Rate in Winston Salem?
Unemployment Rate in Winston Salem is 6.2%.