Chesapeake, VA Map & Demographics
Chesapeake Map
Chesapeake Overview
$42,753
PER CAPITA INCOME
$109,923
AVG FAMILY INCOME
$92,703
AVG HOUSEHOLD INCOME
35.2%
WAGE / INCOME GAP [ % ]
64.8¢/ $1
WAGE / INCOME GAP [ $ ]
$11,162
FAMILY INCOME DEFICIT
0.42
INEQUALITY / GINI INDEX
249,377
TOTAL POPULATION
122,672
MALE POPULATION
126,705
FEMALE POPULATION
96.82
MALES / 100 FEMALES
103.29
FEMALES / 100 MALES
37.4
MEDIAN AGE
3.1
AVG FAMILY SIZE
2.7
AVG HOUSEHOLD SIZE
132,139
LABOR FORCE [ PEOPLE ]
67.2%
PERCENT IN LABOR FORCE
5.0%
UNEMPLOYMENT RATE
Chesapeake Area Codes
Income in Chesapeake
Income Overview in Chesapeake
Per Capita Income in Chesapeake is $42,753, while median incomes of families and households are $109,923 and $92,703 respectively.
| Characteristic | Number | Measure |
| Per Capita Income | 249,377 | $42,753 |
| Median Family Income | 66,760 | $109,923 |
| Mean Family Income | 66,760 | $131,047 |
| Median Household Income | 91,368 | $92,703 |
| Mean Household Income | 91,368 | $114,454 |
| Income Deficit | 66,760 | $11,162 |
| Wage / Income Gap (%) | 249,377 | 35.21% |
| Wage / Income Gap ($) | 249,377 | 64.79¢ per $1 |
| Gini / Inequality Index | 249,377 | 0.42 |
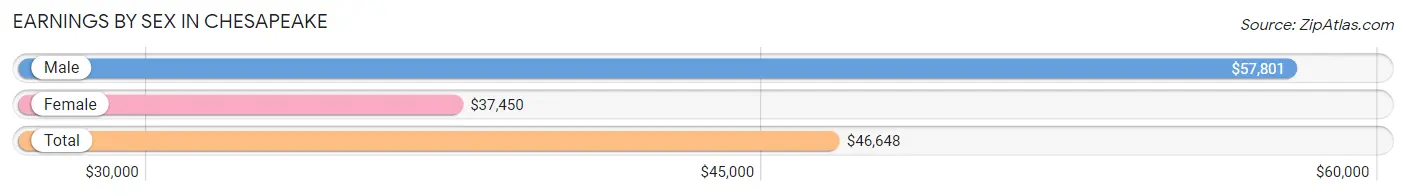
Earnings by Sex in Chesapeake
Average Earnings in Chesapeake are $46,648, $57,801 for men and $37,450 for women, a difference of 35.2%.
| Sex | Number | Average Earnings |
| Male | 72,809 (52.5%) | $57,801 |
| Female | 65,922 (47.5%) | $37,450 |
| Total | 138,731 (100.0%) | $46,648 |
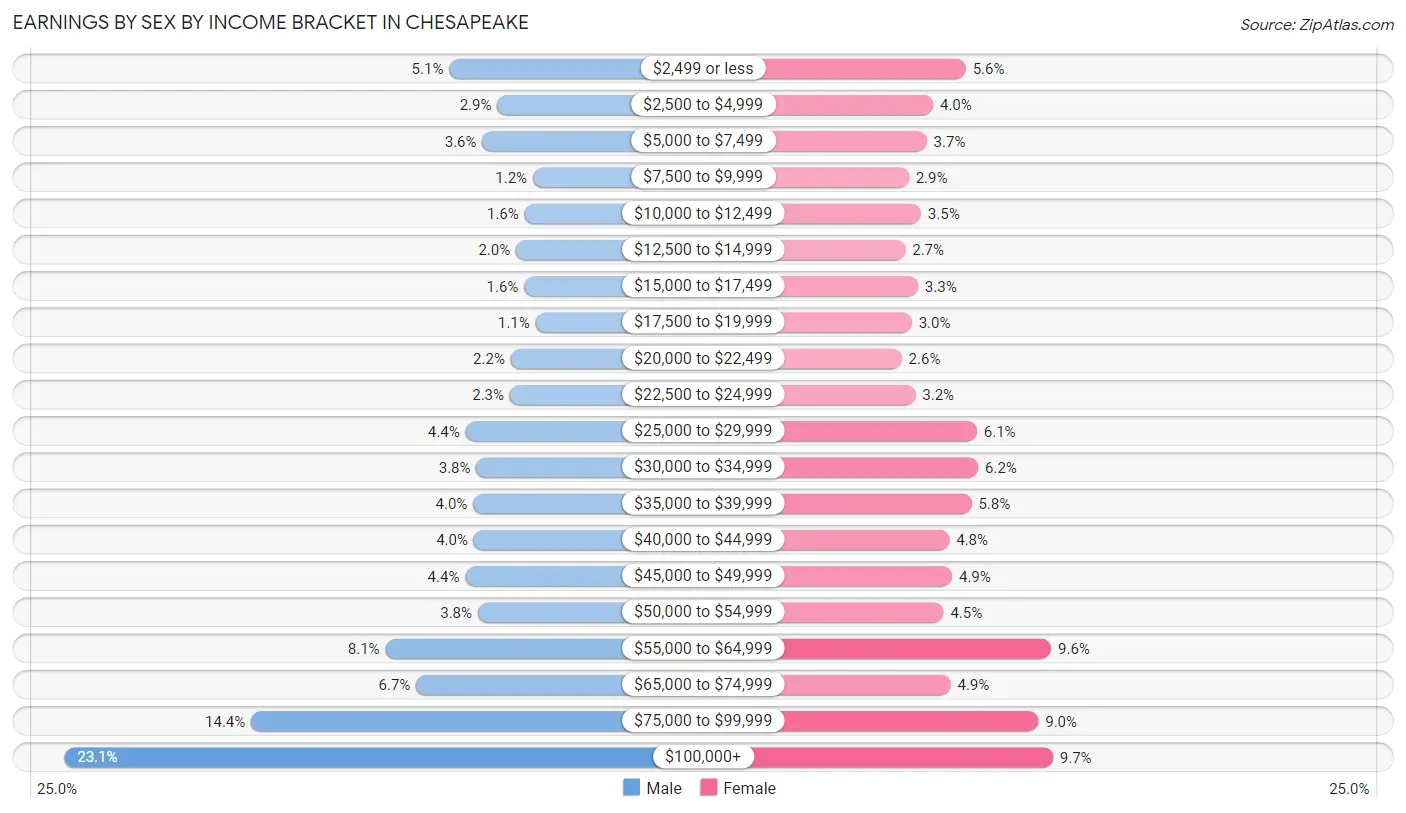
Earnings by Sex by Income Bracket in Chesapeake
The most common earnings brackets in Chesapeake are $100,000+ for men (16,851 | 23.1%) and $100,000+ for women (6,359 | 9.7%).
| Income | Male | Female |
| $2,499 or less | 3,723 (5.1%) | 3,672 (5.6%) |
| $2,500 to $4,999 | 2,084 (2.9%) | 2,664 (4.0%) |
| $5,000 to $7,499 | 2,590 (3.6%) | 2,468 (3.7%) |
| $7,500 to $9,999 | 868 (1.2%) | 1,910 (2.9%) |
| $10,000 to $12,499 | 1,152 (1.6%) | 2,286 (3.5%) |
| $12,500 to $14,999 | 1,442 (2.0%) | 1,806 (2.7%) |
| $15,000 to $17,499 | 1,165 (1.6%) | 2,193 (3.3%) |
| $17,500 to $19,999 | 782 (1.1%) | 2,002 (3.0%) |
| $20,000 to $22,499 | 1,623 (2.2%) | 1,693 (2.6%) |
| $22,500 to $24,999 | 1,653 (2.3%) | 2,119 (3.2%) |
| $25,000 to $29,999 | 3,164 (4.3%) | 4,017 (6.1%) |
| $30,000 to $34,999 | 2,793 (3.8%) | 4,055 (6.1%) |
| $35,000 to $39,999 | 2,907 (4.0%) | 3,852 (5.8%) |
| $40,000 to $44,999 | 2,880 (4.0%) | 3,161 (4.8%) |
| $45,000 to $49,999 | 3,172 (4.4%) | 3,253 (4.9%) |
| $50,000 to $54,999 | 2,742 (3.8%) | 2,986 (4.5%) |
| $55,000 to $64,999 | 5,897 (8.1%) | 6,312 (9.6%) |
| $65,000 to $74,999 | 4,847 (6.7%) | 3,204 (4.9%) |
| $75,000 to $99,999 | 10,474 (14.4%) | 5,910 (9.0%) |
| $100,000+ | 16,851 (23.1%) | 6,359 (9.7%) |
| Total | 72,809 (100.0%) | 65,922 (100.0%) |
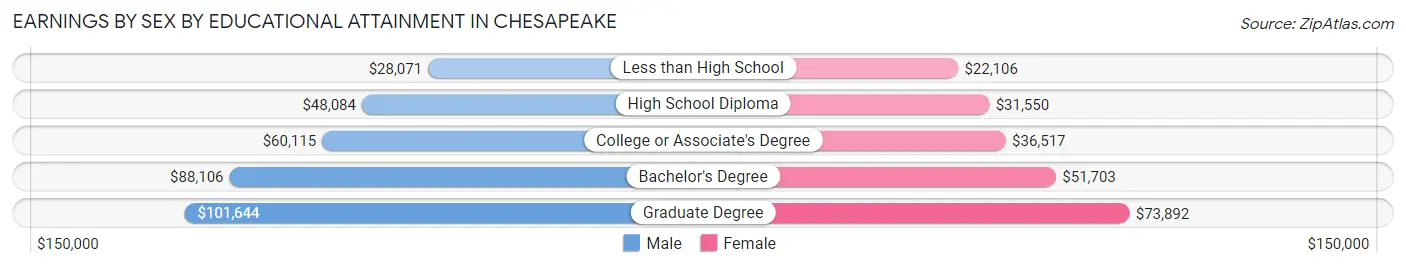
Earnings by Sex by Educational Attainment in Chesapeake
Average earnings in Chesapeake are $65,243 for men and $43,743 for women, a difference of 33.0%. Men with an educational attainment of graduate degree enjoy the highest average annual earnings of $101,644, while those with less than high school education earn the least with $28,071. Women with an educational attainment of graduate degree earn the most with the average annual earnings of $73,892, while those with less than high school education have the smallest earnings of $22,106.
| Educational Attainment | Male Income | Female Income |
| Less than High School | $28,071 | $22,106 |
| High School Diploma | $48,084 | $31,550 |
| College or Associate's Degree | $60,115 | $36,517 |
| Bachelor's Degree | $88,106 | $51,703 |
| Graduate Degree | $101,644 | $73,892 |
| Total | $65,243 | $43,743 |
Family Income in Chesapeake
Family Income Brackets in Chesapeake
According to the Chesapeake family income data, there are 15,555 families falling into the $100,000 to $149,999 income range, which is the most common income bracket and makes up 23.3% of all families. Conversely, the $10,000 to $14,999 income bracket is the least frequent group with only 668 families (1.0%) belonging to this category.
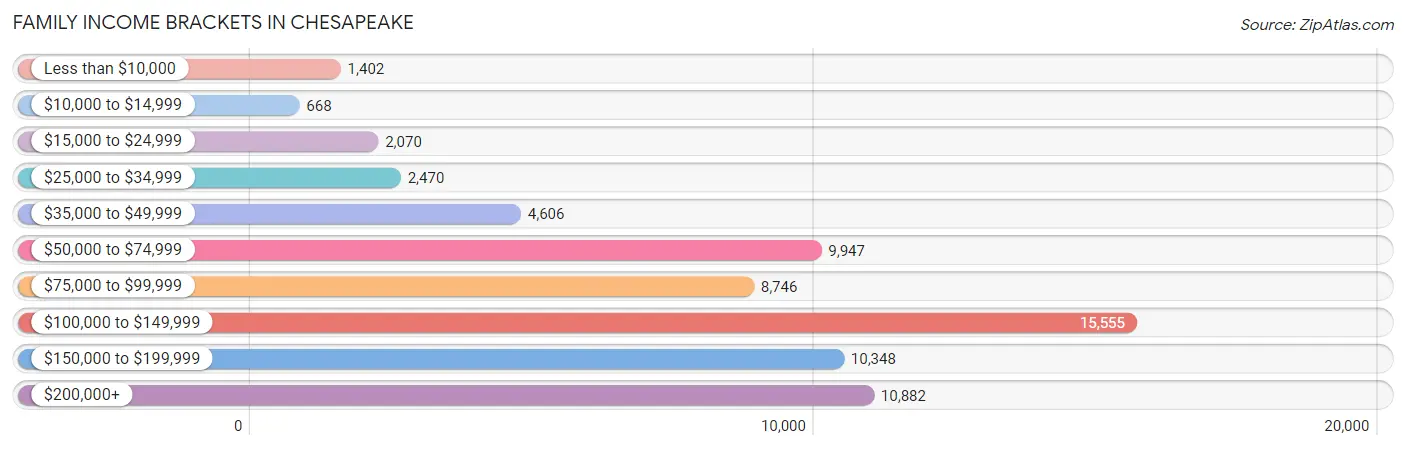
| Income Bracket | # Families | % Families |
| Less than $10,000 | 1,402 | 2.1% |
| $10,000 to $14,999 | 668 | 1.0% |
| $15,000 to $24,999 | 2,070 | 3.1% |
| $25,000 to $34,999 | 2,470 | 3.7% |
| $35,000 to $49,999 | 4,606 | 6.9% |
| $50,000 to $74,999 | 9,947 | 14.9% |
| $75,000 to $99,999 | 8,746 | 13.1% |
| $100,000 to $149,999 | 15,555 | 23.3% |
| $150,000 to $199,999 | 10,348 | 15.5% |
| $200,000+ | 10,882 | 16.3% |
Family Income by Famaliy Size in Chesapeake
4-person families (13,259 | 19.9%) account for the highest median family income in Chesapeake with $146,998 per family, while 2-person families (29,169 | 43.7%) have the highest median income of $45,098 per family member.
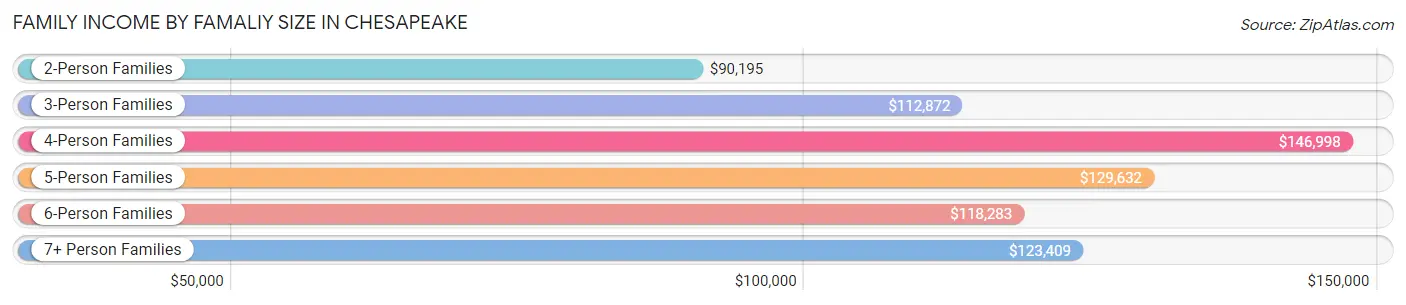
| Income Bracket | # Families | Median Income |
| 2-Person Families | 29,169 (43.7%) | $90,195 |
| 3-Person Families | 15,469 (23.2%) | $112,872 |
| 4-Person Families | 13,259 (19.9%) | $146,998 |
| 5-Person Families | 5,694 (8.5%) | $129,632 |
| 6-Person Families | 2,273 (3.4%) | $118,283 |
| 7+ Person Families | 896 (1.3%) | $123,409 |
| Total | 66,760 (100.0%) | $109,923 |
Family Income by Number of Earners in Chesapeake
The median family income in Chesapeake is $109,923, with families comprising 3+ earners (8,699) having the highest median family income of $168,810, while families with no earners (7,072) have the lowest median family income of $63,760, accounting for 13.0% and 10.6% of families, respectively.
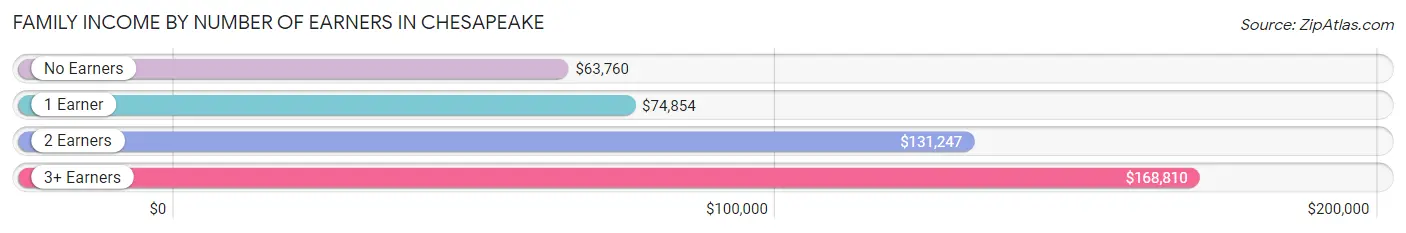
| Number of Earners | # Families | Median Income |
| No Earners | 7,072 (10.6%) | $63,760 |
| 1 Earner | 20,878 (31.3%) | $74,854 |
| 2 Earners | 30,111 (45.1%) | $131,247 |
| 3+ Earners | 8,699 (13.0%) | $168,810 |
| Total | 66,760 (100.0%) | $109,923 |
Household Income in Chesapeake
Household Income Brackets in Chesapeake
With 18,913 households falling in the category, the $100,000 to $149,999 income range is the most frequent in Chesapeake, accounting for 20.7% of all households. In contrast, only 1,827 households (2.0%) fall into the $10,000 to $14,999 income bracket, making it the least populous group.
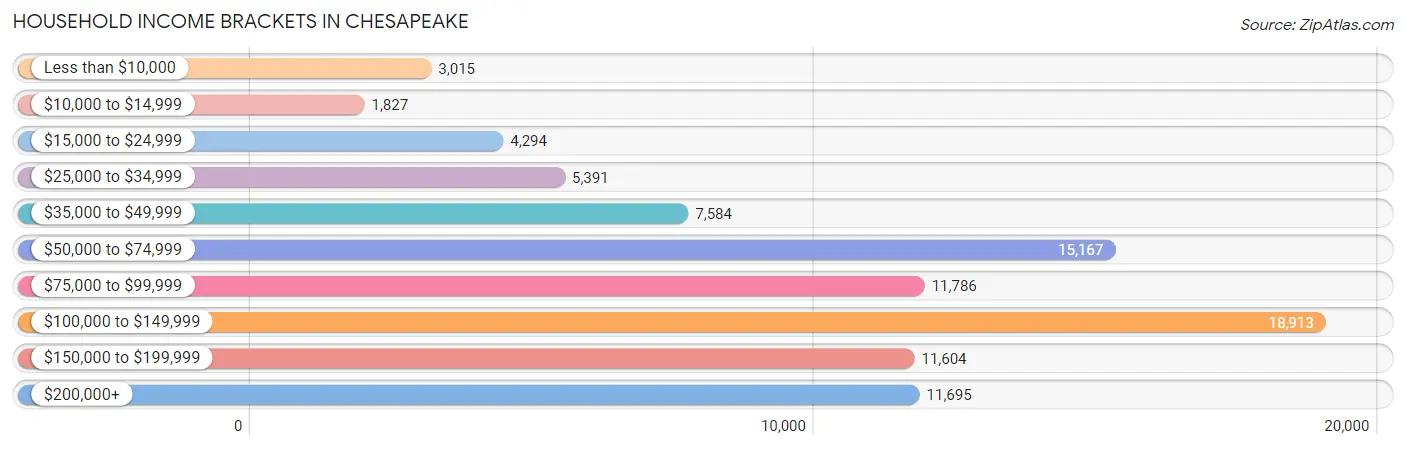
| Income Bracket | # Households | % Households |
| Less than $10,000 | 3,015 | 3.3% |
| $10,000 to $14,999 | 1,827 | 2.0% |
| $15,000 to $24,999 | 4,294 | 4.7% |
| $25,000 to $34,999 | 5,391 | 5.9% |
| $35,000 to $49,999 | 7,584 | 8.3% |
| $50,000 to $74,999 | 15,167 | 16.6% |
| $75,000 to $99,999 | 11,786 | 12.9% |
| $100,000 to $149,999 | 18,913 | 20.7% |
| $150,000 to $199,999 | 11,604 | 12.7% |
| $200,000+ | 11,695 | 12.8% |
Household Income by Householder Age in Chesapeake
The median household income in Chesapeake is $92,703, with the highest median household income of $115,047 found in the 45 to 64 years age bracket for the primary householder. A total of 35,337 households (38.7%) fall into this category. Meanwhile, the 15 to 24 years age bracket for the primary householder has the lowest median household income of $50,652, with 2,627 households (2.9%) in this group.
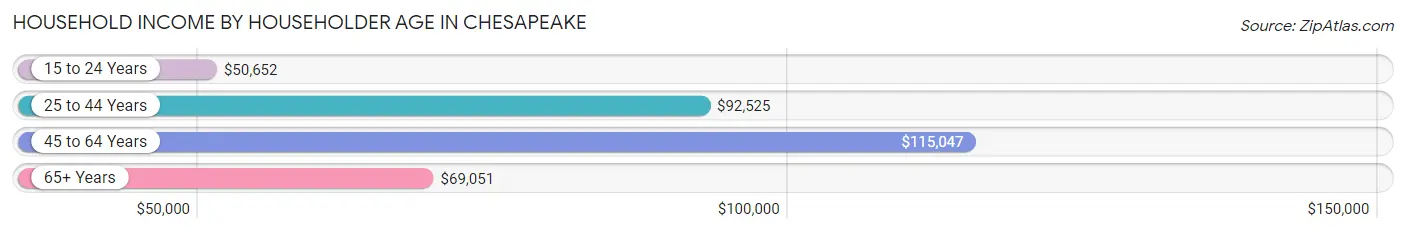
| Income Bracket | # Households | Median Income |
| 15 to 24 Years | 2,627 (2.9%) | $50,652 |
| 25 to 44 Years | 32,902 (36.0%) | $92,525 |
| 45 to 64 Years | 35,337 (38.7%) | $115,047 |
| 65+ Years | 20,502 (22.4%) | $69,051 |
| Total | 91,368 (100.0%) | $92,703 |
Poverty in Chesapeake
Income Below Poverty by Sex and Age in Chesapeake
With 6.9% poverty level for males and 8.4% for females among the residents of Chesapeake, 15 year old males and 18 to 24 year old females are the most vulnerable to poverty, with 344 males (18.8%) and 1,378 females (13.7%) in their respective age groups living below the poverty level.
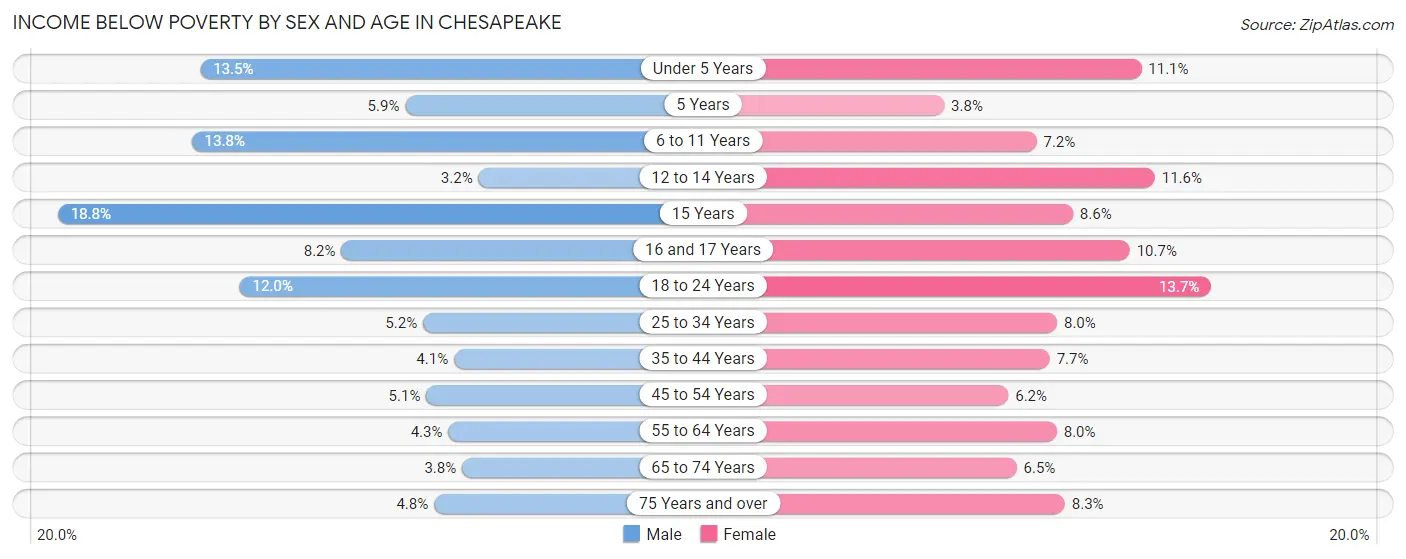
| Age Bracket | Male | Female |
| Under 5 Years | 1,026 (13.5%) | 825 (11.1%) |
| 5 Years | 109 (5.9%) | 52 (3.8%) |
| 6 to 11 Years | 1,406 (13.8%) | 730 (7.2%) |
| 12 to 14 Years | 163 (3.2%) | 582 (11.6%) |
| 15 Years | 344 (18.8%) | 135 (8.6%) |
| 16 and 17 Years | 301 (8.2%) | 396 (10.7%) |
| 18 to 24 Years | 1,242 (12.0%) | 1,378 (13.7%) |
| 25 to 34 Years | 867 (5.2%) | 1,358 (8.0%) |
| 35 to 44 Years | 679 (4.1%) | 1,393 (7.7%) |
| 45 to 54 Years | 757 (5.1%) | 972 (6.2%) |
| 55 to 64 Years | 651 (4.3%) | 1,333 (8.0%) |
| 65 to 74 Years | 360 (3.8%) | 756 (6.5%) |
| 75 Years and over | 237 (4.8%) | 617 (8.3%) |
| Total | 8,142 (6.9%) | 10,527 (8.4%) |
Income Above Poverty by Sex and Age in Chesapeake
According to the poverty statistics in Chesapeake, males aged 12 to 14 years and females aged 5 years are the age groups that are most secure financially, with 96.9% of males and 96.2% of females in these age groups living above the poverty line.
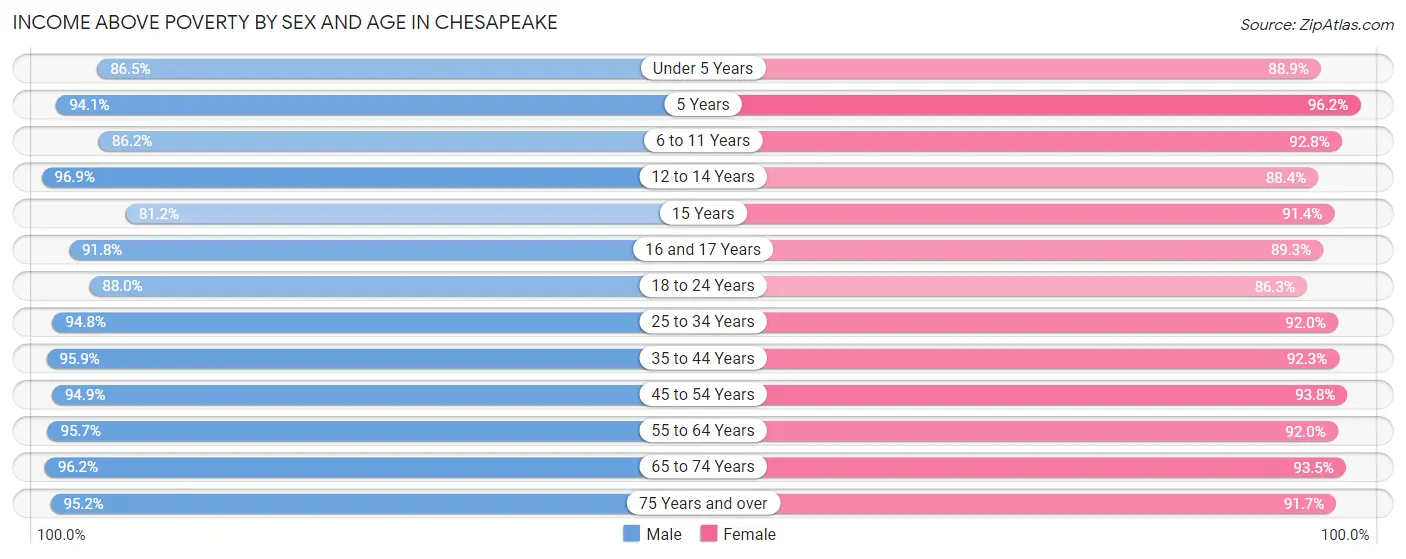
| Age Bracket | Male | Female |
| Under 5 Years | 6,583 (86.5%) | 6,593 (88.9%) |
| 5 Years | 1,749 (94.1%) | 1,315 (96.2%) |
| 6 to 11 Years | 8,785 (86.2%) | 9,369 (92.8%) |
| 12 to 14 Years | 5,013 (96.9%) | 4,426 (88.4%) |
| 15 Years | 1,489 (81.2%) | 1,438 (91.4%) |
| 16 and 17 Years | 3,353 (91.8%) | 3,308 (89.3%) |
| 18 to 24 Years | 9,094 (88.0%) | 8,671 (86.3%) |
| 25 to 34 Years | 15,771 (94.8%) | 15,634 (92.0%) |
| 35 to 44 Years | 16,055 (95.9%) | 16,656 (92.3%) |
| 45 to 54 Years | 14,120 (94.9%) | 14,760 (93.8%) |
| 55 to 64 Years | 14,579 (95.7%) | 15,373 (92.0%) |
| 65 to 74 Years | 9,212 (96.2%) | 10,896 (93.5%) |
| 75 Years and over | 4,703 (95.2%) | 6,837 (91.7%) |
| Total | 110,506 (93.1%) | 115,276 (91.6%) |
Income Below Poverty Among Married-Couple Families in Chesapeake
The poverty statistics for married-couple families in Chesapeake show that 2.1% or 1,063 of the total 50,283 families live below the poverty line. Families with 3 or 4 children have the highest poverty rate of 2.7%, comprising of 124 families. On the other hand, families with 5 or more children have the lowest poverty rate of 0.0%, which includes 0 families.
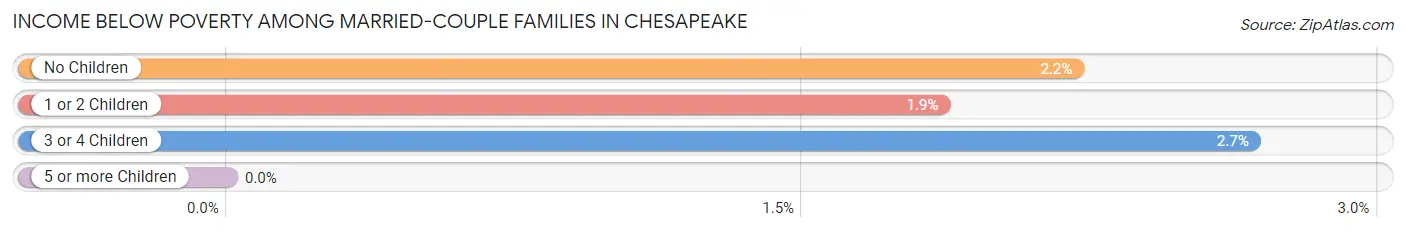
| Children | Above Poverty | Below Poverty |
| No Children | 26,377 (97.8%) | 597 (2.2%) |
| 1 or 2 Children | 18,074 (98.1%) | 342 (1.9%) |
| 3 or 4 Children | 4,515 (97.3%) | 124 (2.7%) |
| 5 or more Children | 254 (100.0%) | 0 (0.0%) |
| Total | 49,220 (97.9%) | 1,063 (2.1%) |
Income Below Poverty Among Single-Parent Households in Chesapeake
According to the poverty data in Chesapeake, 12.6% or 458 single-father households and 16.6% or 2,128 single-mother households are living below the poverty line. Among single-father households, those with 5 or more children have the highest poverty rate, with 45 households (100.0%) experiencing poverty. Likewise, among single-mother households, those with 5 or more children have the highest poverty rate, with 62 households (52.5%) falling below the poverty line.
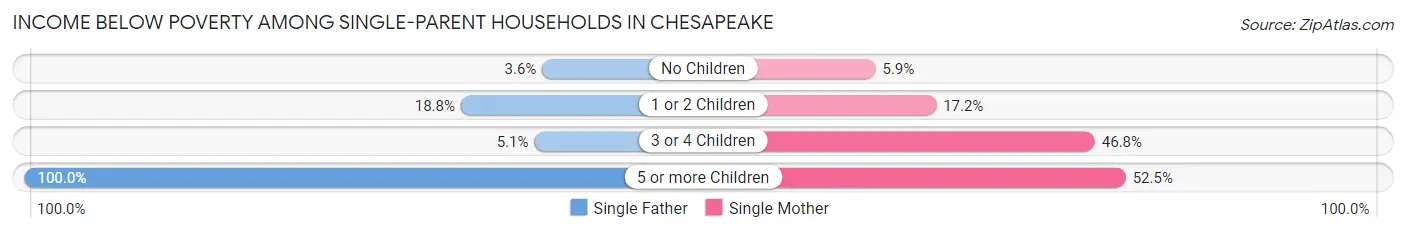
| Children | Single Father | Single Mother |
| No Children | 56 (3.6%) | 257 (5.9%) |
| 1 or 2 Children | 348 (18.8%) | 1,234 (17.2%) |
| 3 or 4 Children | 9 (5.1%) | 575 (46.8%) |
| 5 or more Children | 45 (100.0%) | 62 (52.5%) |
| Total | 458 (12.6%) | 2,128 (16.6%) |
Income Below Poverty Among Married-Couple vs Single-Parent Households in Chesapeake
The poverty data for Chesapeake shows that 1,063 of the married-couple family households (2.1%) and 2,586 of the single-parent households (15.7%) are living below the poverty level. Within the married-couple family households, those with 3 or 4 children have the highest poverty rate, with 124 households (2.7%) falling below the poverty line. Among the single-parent households, those with 5 or more children have the highest poverty rate, with 107 household (65.6%) living below poverty.
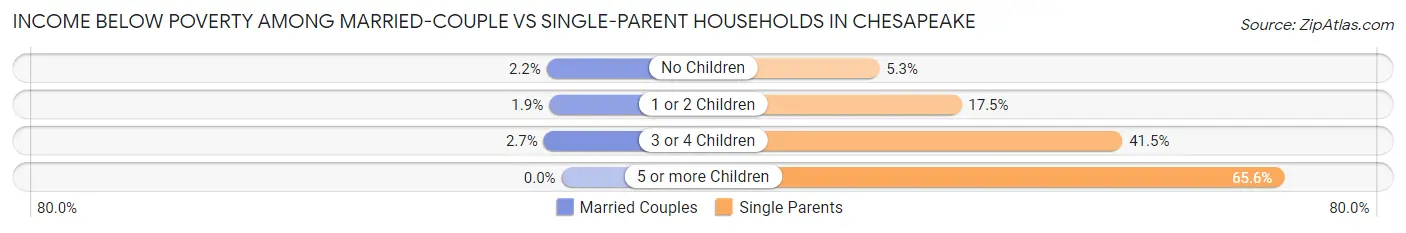
| Children | Married-Couple Families | Single-Parent Households |
| No Children | 597 (2.2%) | 313 (5.3%) |
| 1 or 2 Children | 342 (1.9%) | 1,582 (17.5%) |
| 3 or 4 Children | 124 (2.7%) | 584 (41.5%) |
| 5 or more Children | 0 (0.0%) | 107 (65.6%) |
| Total | 1,063 (2.1%) | 2,586 (15.7%) |
Race in Chesapeake
The most populous races in Chesapeake are White / Caucasian (142,840 | 57.3%), Black / African American (73,034 | 29.3%), and Two or more Races (17,786 | 7.1%).
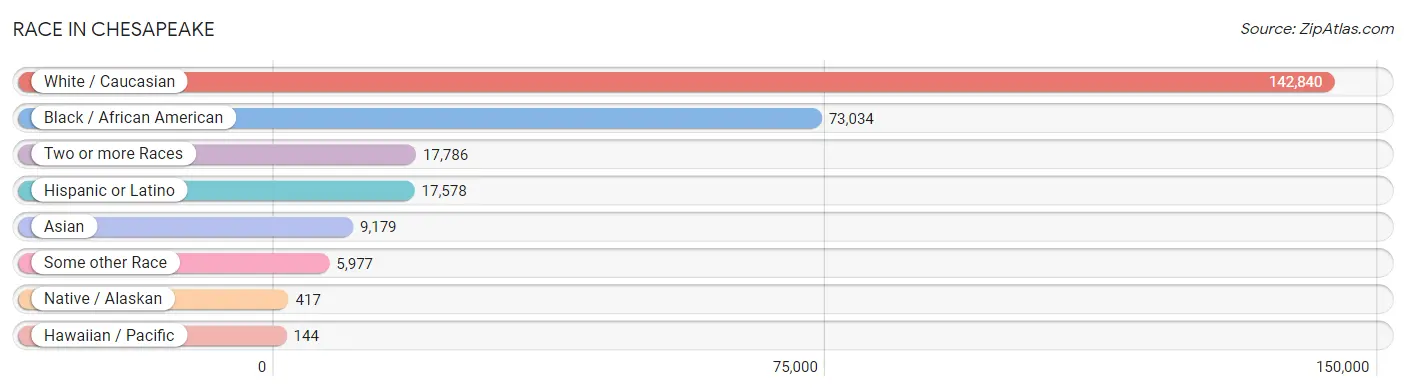
| Race | # Population | % Population |
| Asian | 9,179 | 3.7% |
| Black / African American | 73,034 | 29.3% |
| Hawaiian / Pacific | 144 | 0.1% |
| Hispanic or Latino | 17,578 | 7.0% |
| Native / Alaskan | 417 | 0.2% |
| White / Caucasian | 142,840 | 57.3% |
| Two or more Races | 17,786 | 7.1% |
| Some other Race | 5,977 | 2.4% |
| Total | 249,377 | 100.0% |
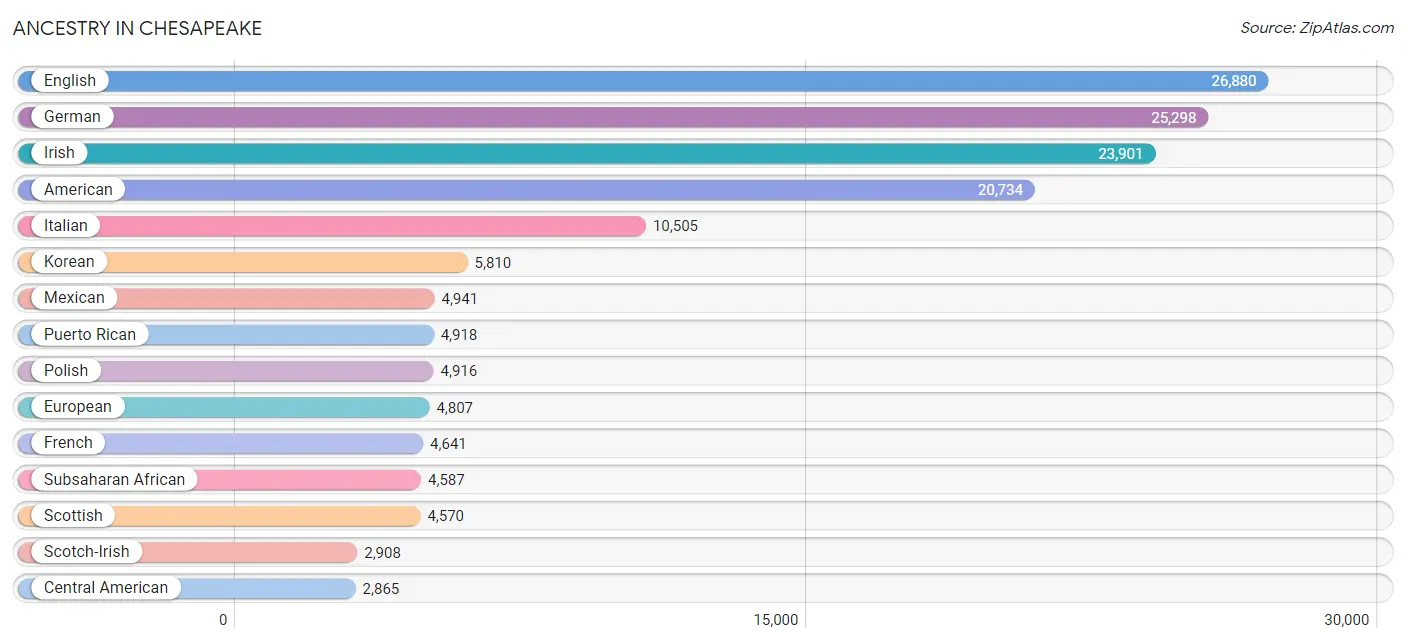
Ancestry in Chesapeake
The most populous ancestries reported in Chesapeake are English (26,880 | 10.8%), German (25,298 | 10.1%), Irish (23,901 | 9.6%), American (20,734 | 8.3%), and Italian (10,505 | 4.2%), together accounting for 43.0% of all Chesapeake residents.
| Ancestry | # Population | % Population |
| Afghan | 95 | 0.0% |
| African | 2,647 | 1.1% |
| Albanian | 26 | 0.0% |
| American | 20,734 | 8.3% |
| Apache | 14 | 0.0% |
| Arab | 489 | 0.2% |
| Armenian | 40 | 0.0% |
| Australian | 47 | 0.0% |
| Austrian | 276 | 0.1% |
| Bangladeshi | 73 | 0.0% |
| Barbadian | 207 | 0.1% |
| Basque | 18 | 0.0% |
| Belgian | 106 | 0.0% |
| Bermudan | 36 | 0.0% |
| Bhutanese | 868 | 0.4% |
| Blackfeet | 145 | 0.1% |
| Bolivian | 220 | 0.1% |
| Brazilian | 255 | 0.1% |
| British | 1,346 | 0.5% |
| British West Indian | 24 | 0.0% |
| Bulgarian | 11 | 0.0% |
| Burmese | 1,618 | 0.6% |
| Cajun | 56 | 0.0% |
| Canadian | 374 | 0.2% |
| Cape Verdean | 45 | 0.0% |
| Central American | 2,865 | 1.1% |
| Central American Indian | 303 | 0.1% |
| Cherokee | 679 | 0.3% |
| Chickasaw | 46 | 0.0% |
| Chilean | 88 | 0.0% |
| Chippewa | 28 | 0.0% |
| Choctaw | 29 | 0.0% |
| Colombian | 444 | 0.2% |
| Creek | 42 | 0.0% |
| Croatian | 106 | 0.0% |
| Crow | 35 | 0.0% |
| Cuban | 1,009 | 0.4% |
| Czech | 507 | 0.2% |
| Czechoslovakian | 103 | 0.0% |
| Danish | 354 | 0.1% |
| Dominican | 539 | 0.2% |
| Dutch | 1,240 | 0.5% |
| Eastern European | 470 | 0.2% |
| Ecuadorian | 184 | 0.1% |
| Egyptian | 154 | 0.1% |
| English | 26,880 | 10.8% |
| Estonian | 29 | 0.0% |
| Ethiopian | 197 | 0.1% |
| European | 4,807 | 1.9% |
| Filipino | 78 | 0.0% |
| Finnish | 296 | 0.1% |
| French | 4,641 | 1.9% |
| French Canadian | 1,103 | 0.4% |
| German | 25,298 | 10.1% |
| Ghanaian | 234 | 0.1% |
| Greek | 979 | 0.4% |
| Guamanian / Chamorro | 130 | 0.1% |
| Guatemalan | 1,042 | 0.4% |
| Guyanese | 187 | 0.1% |
| Haitian | 1,004 | 0.4% |
| Honduran | 436 | 0.2% |
| Hopi | 31 | 0.0% |
| Hungarian | 733 | 0.3% |
| Indian (Asian) | 1,482 | 0.6% |
| Inupiat | 23 | 0.0% |
| Iranian | 72 | 0.0% |
| Iraqi | 39 | 0.0% |
| Irish | 23,901 | 9.6% |
| Iroquois | 16 | 0.0% |
| Italian | 10,505 | 4.2% |
| Jamaican | 1,075 | 0.4% |
| Japanese | 33 | 0.0% |
| Kenyan | 237 | 0.1% |
| Korean | 5,810 | 2.3% |
| Laotian | 52 | 0.0% |
| Latvian | 26 | 0.0% |
| Lebanese | 158 | 0.1% |
| Lithuanian | 391 | 0.2% |
| Lumbee | 14 | 0.0% |
| Luxembourger | 17 | 0.0% |
| Malaysian | 19 | 0.0% |
| Mexican | 4,941 | 2.0% |
| Mexican American Indian | 14 | 0.0% |
| Moroccan | 43 | 0.0% |
| Native Hawaiian | 201 | 0.1% |
| Navajo | 20 | 0.0% |
| Nicaraguan | 226 | 0.1% |
| Nigerian | 514 | 0.2% |
| Northern European | 224 | 0.1% |
| Norwegian | 1,670 | 0.7% |
| Pakistani | 351 | 0.1% |
| Panamanian | 345 | 0.1% |
| Paraguayan | 107 | 0.0% |
| Pennsylvania German | 7 | 0.0% |
| Peruvian | 340 | 0.1% |
| Polish | 4,916 | 2.0% |
| Portuguese | 503 | 0.2% |
| Pueblo | 73 | 0.0% |
| Puerto Rican | 4,918 | 2.0% |
| Romanian | 287 | 0.1% |
| Russian | 664 | 0.3% |
| Salvadoran | 816 | 0.3% |
| Samoan | 54 | 0.0% |
| Scandinavian | 743 | 0.3% |
| Scotch-Irish | 2,908 | 1.2% |
| Scottish | 4,570 | 1.8% |
| Seminole | 24 | 0.0% |
| Sierra Leonean | 60 | 0.0% |
| Sioux | 50 | 0.0% |
| Slavic | 63 | 0.0% |
| Slovak | 315 | 0.1% |
| Slovene | 46 | 0.0% |
| South African | 110 | 0.0% |
| South American | 1,454 | 0.6% |
| South American Indian | 62 | 0.0% |
| Spaniard | 608 | 0.2% |
| Spanish | 523 | 0.2% |
| Sri Lankan | 1,256 | 0.5% |
| Subsaharan African | 4,587 | 1.8% |
| Swedish | 1,380 | 0.5% |
| Swiss | 444 | 0.2% |
| Syrian | 31 | 0.0% |
| Thai | 921 | 0.4% |
| Trinidadian and Tobagonian | 201 | 0.1% |
| Turkish | 186 | 0.1% |
| U.S. Virgin Islander | 52 | 0.0% |
| Ukrainian | 312 | 0.1% |
| Uruguayan | 45 | 0.0% |
| Venezuelan | 26 | 0.0% |
| Welsh | 1,778 | 0.7% |
| West Indian | 375 | 0.2% |
| Yugoslavian | 45 | 0.0% |
| Zimbabwean | 31 | 0.0% | View All 133 Rows |
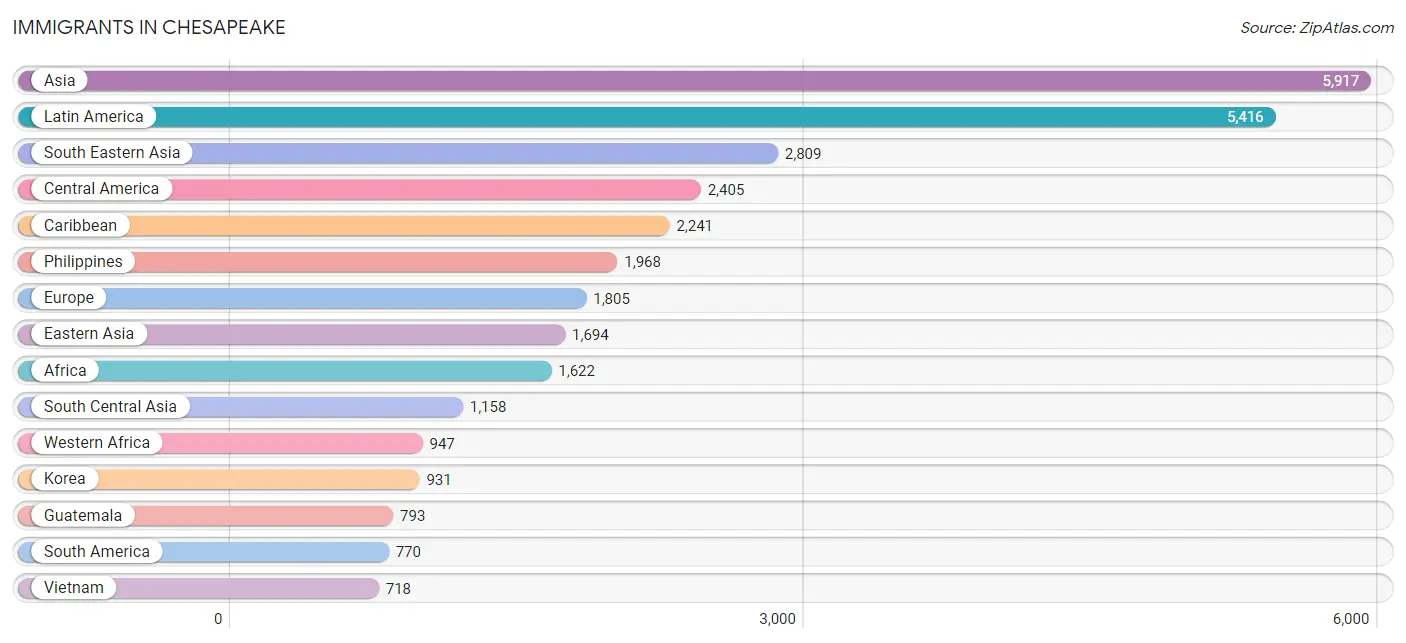
Immigrants in Chesapeake
The most numerous immigrant groups reported in Chesapeake came from Asia (5,917 | 2.4%), Latin America (5,416 | 2.2%), South Eastern Asia (2,809 | 1.1%), Central America (2,405 | 1.0%), and Caribbean (2,241 | 0.9%), together accounting for 7.5% of all Chesapeake residents.
| Immigration Origin | # Population | % Population |
| Afghanistan | 34 | 0.0% |
| Africa | 1,622 | 0.6% |
| Albania | 26 | 0.0% |
| Asia | 5,917 | 2.4% |
| Australia | 10 | 0.0% |
| Austria | 47 | 0.0% |
| Bahamas | 14 | 0.0% |
| Bangladesh | 41 | 0.0% |
| Barbados | 208 | 0.1% |
| Bolivia | 110 | 0.0% |
| Bosnia and Herzegovina | 14 | 0.0% |
| Brazil | 135 | 0.1% |
| Cabo Verde | 22 | 0.0% |
| Canada | 184 | 0.1% |
| Caribbean | 2,241 | 0.9% |
| Central America | 2,405 | 1.0% |
| Chile | 33 | 0.0% |
| China | 574 | 0.2% |
| Colombia | 237 | 0.1% |
| Costa Rica | 29 | 0.0% |
| Cuba | 276 | 0.1% |
| Czechoslovakia | 17 | 0.0% |
| Denmark | 18 | 0.0% |
| Dominican Republic | 197 | 0.1% |
| Eastern Africa | 300 | 0.1% |
| Eastern Asia | 1,694 | 0.7% |
| Eastern Europe | 443 | 0.2% |
| Ecuador | 18 | 0.0% |
| Egypt | 34 | 0.0% |
| El Salvador | 479 | 0.2% |
| England | 188 | 0.1% |
| Ethiopia | 142 | 0.1% |
| Europe | 1,805 | 0.7% |
| France | 26 | 0.0% |
| Germany | 444 | 0.2% |
| Ghana | 309 | 0.1% |
| Guatemala | 793 | 0.3% |
| Guyana | 133 | 0.1% |
| Haiti | 644 | 0.3% |
| Honduras | 192 | 0.1% |
| Hong Kong | 61 | 0.0% |
| Hungary | 18 | 0.0% |
| India | 705 | 0.3% |
| Indonesia | 19 | 0.0% |
| Iran | 17 | 0.0% |
| Iraq | 39 | 0.0% |
| Ireland | 80 | 0.0% |
| Italy | 211 | 0.1% |
| Jamaica | 576 | 0.2% |
| Japan | 189 | 0.1% |
| Kazakhstan | 3 | 0.0% |
| Kenya | 97 | 0.0% |
| Korea | 931 | 0.4% |
| Kuwait | 8 | 0.0% |
| Latin America | 5,416 | 2.2% |
| Lebanon | 71 | 0.0% |
| Lithuania | 43 | 0.0% |
| Malaysia | 19 | 0.0% |
| Mexico | 622 | 0.3% |
| Middle Africa | 101 | 0.0% |
| Moldova | 84 | 0.0% |
| Morocco | 25 | 0.0% |
| Nepal | 81 | 0.0% |
| Netherlands | 73 | 0.0% |
| Nicaragua | 124 | 0.1% |
| Nigeria | 424 | 0.2% |
| Northern Africa | 147 | 0.1% |
| Northern Europe | 421 | 0.2% |
| Oceania | 10 | 0.0% |
| Pakistan | 277 | 0.1% |
| Panama | 166 | 0.1% |
| Peru | 82 | 0.0% |
| Philippines | 1,968 | 0.8% |
| Poland | 21 | 0.0% |
| Romania | 66 | 0.0% |
| Russia | 147 | 0.1% |
| Scotland | 26 | 0.0% |
| South Africa | 98 | 0.0% |
| South America | 770 | 0.3% |
| South Central Asia | 1,158 | 0.5% |
| South Eastern Asia | 2,809 | 1.1% |
| Southern Europe | 343 | 0.1% |
| Spain | 132 | 0.1% |
| Switzerland | 8 | 0.0% |
| Syria | 19 | 0.0% |
| Taiwan | 54 | 0.0% |
| Thailand | 85 | 0.0% |
| Trinidad and Tobago | 219 | 0.1% |
| Turkey | 119 | 0.1% |
| Uganda | 30 | 0.0% |
| Ukraine | 7 | 0.0% |
| Uruguay | 19 | 0.0% |
| Venezuela | 3 | 0.0% |
| Vietnam | 718 | 0.3% |
| West Indies | 18 | 0.0% |
| Western Africa | 947 | 0.4% |
| Western Asia | 256 | 0.1% |
| Western Europe | 598 | 0.2% |
| Zaire | 101 | 0.0% |
| Zimbabwe | 23 | 0.0% | View All 100 Rows |
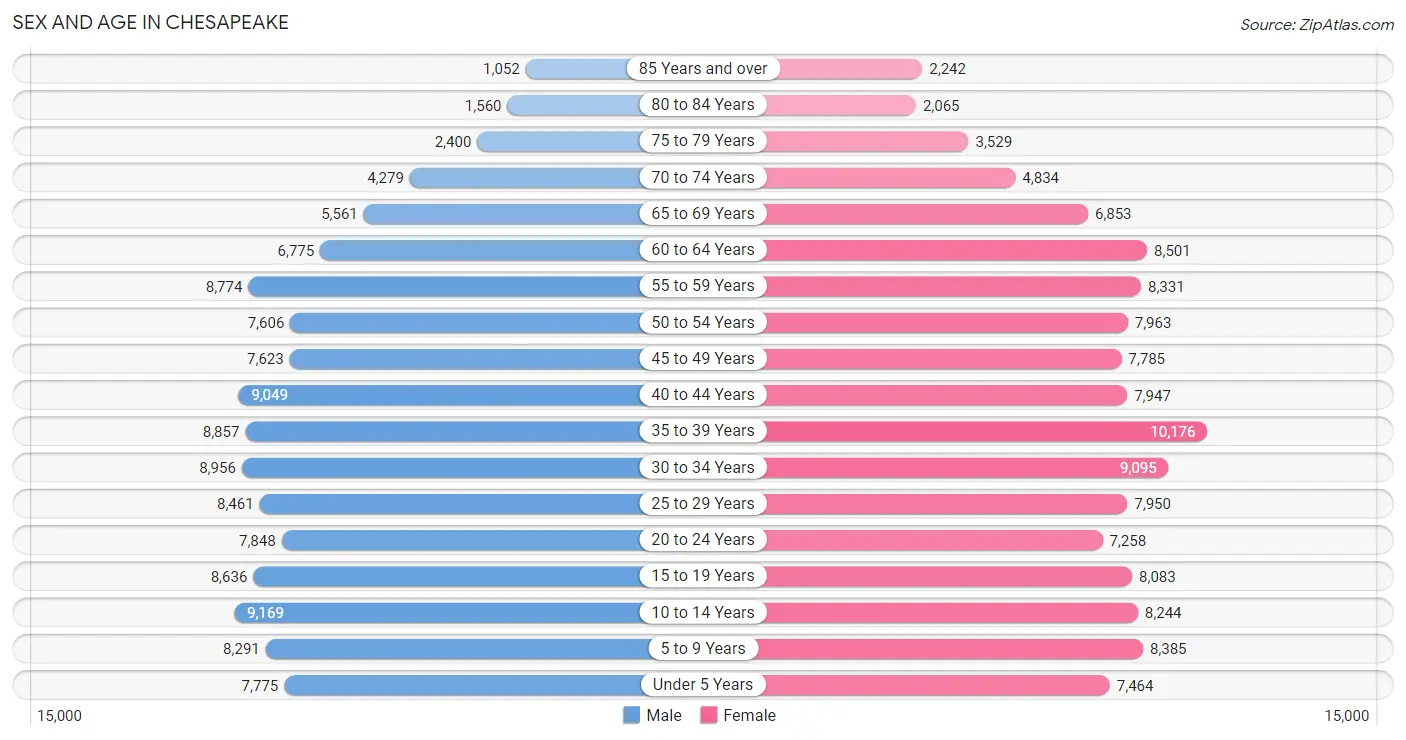
Sex and Age in Chesapeake
Sex and Age in Chesapeake
The most populous age groups in Chesapeake are 10 to 14 Years (9,169 | 7.5%) for men and 35 to 39 Years (10,176 | 8.0%) for women.
| Age Bracket | Male | Female |
| Under 5 Years | 7,775 (6.3%) | 7,464 (5.9%) |
| 5 to 9 Years | 8,291 (6.8%) | 8,385 (6.6%) |
| 10 to 14 Years | 9,169 (7.5%) | 8,244 (6.5%) |
| 15 to 19 Years | 8,636 (7.0%) | 8,083 (6.4%) |
| 20 to 24 Years | 7,848 (6.4%) | 7,258 (5.7%) |
| 25 to 29 Years | 8,461 (6.9%) | 7,950 (6.3%) |
| 30 to 34 Years | 8,956 (7.3%) | 9,095 (7.2%) |
| 35 to 39 Years | 8,857 (7.2%) | 10,176 (8.0%) |
| 40 to 44 Years | 9,049 (7.4%) | 7,947 (6.3%) |
| 45 to 49 Years | 7,623 (6.2%) | 7,785 (6.1%) |
| 50 to 54 Years | 7,606 (6.2%) | 7,963 (6.3%) |
| 55 to 59 Years | 8,774 (7.1%) | 8,331 (6.6%) |
| 60 to 64 Years | 6,775 (5.5%) | 8,501 (6.7%) |
| 65 to 69 Years | 5,561 (4.5%) | 6,853 (5.4%) |
| 70 to 74 Years | 4,279 (3.5%) | 4,834 (3.8%) |
| 75 to 79 Years | 2,400 (2.0%) | 3,529 (2.8%) |
| 80 to 84 Years | 1,560 (1.3%) | 2,065 (1.6%) |
| 85 Years and over | 1,052 (0.9%) | 2,242 (1.8%) |
| Total | 122,672 (100.0%) | 126,705 (100.0%) |
Families and Households in Chesapeake
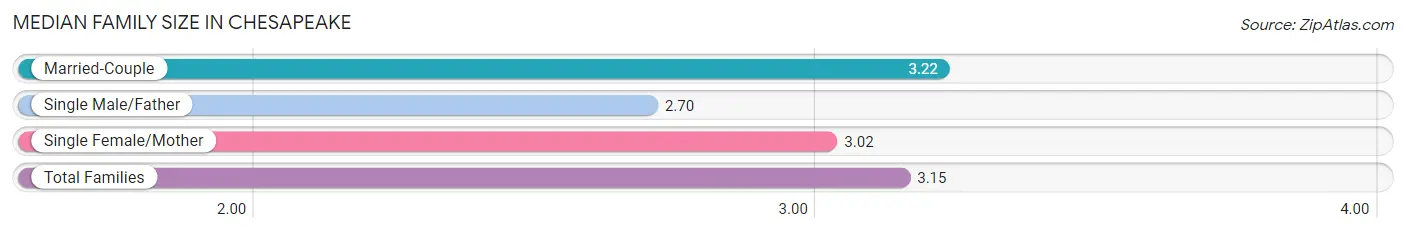
Median Family Size in Chesapeake
The median family size in Chesapeake is 3.15 persons per family, with married-couple families (50,283 | 75.3%) accounting for the largest median family size of 3.22 persons per family. On the other hand, single male/father families (3,636 | 5.4%) represent the smallest median family size with 2.70 persons per family.
| Family Type | # Families | Family Size |
| Married-Couple | 50,283 (75.3%) | 3.22 |
| Single Male/Father | 3,636 (5.4%) | 2.70 |
| Single Female/Mother | 12,841 (19.2%) | 3.02 |
| Total Families | 66,760 (100.0%) | 3.15 |
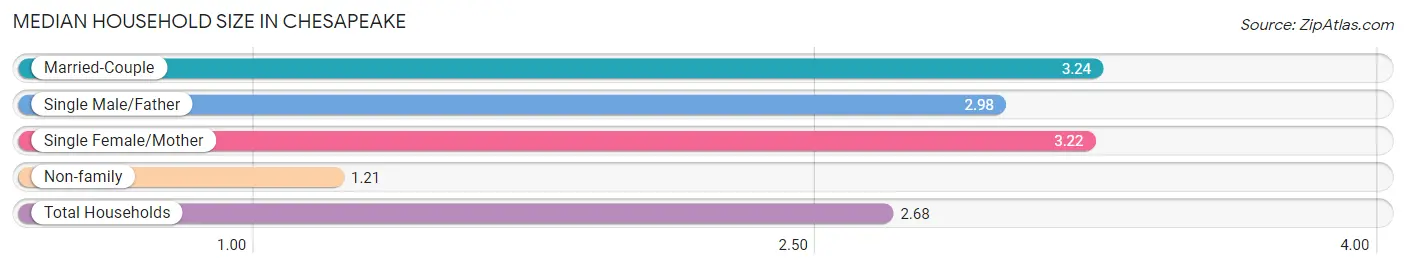
Median Household Size in Chesapeake
The median household size in Chesapeake is 2.68 persons per household, with married-couple households (50,283 | 55.0%) accounting for the largest median household size of 3.24 persons per household. non-family households (24,608 | 26.9%) represent the smallest median household size with 1.21 persons per household.
| Household Type | # Households | Household Size |
| Married-Couple | 50,283 (55.0%) | 3.24 |
| Single Male/Father | 3,636 (4.0%) | 2.98 |
| Single Female/Mother | 12,841 (14.1%) | 3.22 |
| Non-family | 24,608 (26.9%) | 1.21 |
| Total Households | 91,368 (100.0%) | 2.68 |
Household Size by Marriage Status in Chesapeake
Out of a total of 91,368 households in Chesapeake, 66,760 (73.1%) are family households, while 24,608 (26.9%) are nonfamily households. The most numerous type of family households are 2-person households, comprising 27,459, and the most common type of nonfamily households are 1-person households, comprising 20,345.
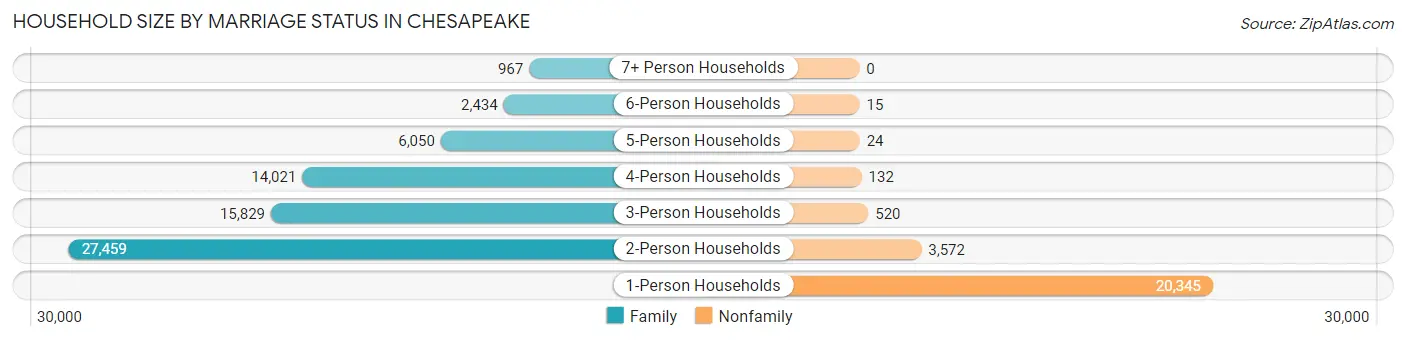
| Household Size | Family Households | Nonfamily Households |
| 1-Person Households | - | 20,345 (22.3%) |
| 2-Person Households | 27,459 (30.0%) | 3,572 (3.9%) |
| 3-Person Households | 15,829 (17.3%) | 520 (0.6%) |
| 4-Person Households | 14,021 (15.3%) | 132 (0.1%) |
| 5-Person Households | 6,050 (6.6%) | 24 (0.0%) |
| 6-Person Households | 2,434 (2.7%) | 15 (0.0%) |
| 7+ Person Households | 967 (1.1%) | 0 (0.0%) |
| Total | 66,760 (73.1%) | 24,608 (26.9%) |
Female Fertility in Chesapeake
Fertility by Age in Chesapeake
Average fertility rate in Chesapeake is 54.0 births per 1,000 women. Women in the age bracket of 20 to 34 years have the highest fertility rate with 94.0 births per 1,000 women. Women in the age bracket of 20 to 34 years acount for 70.6% of all women with births.
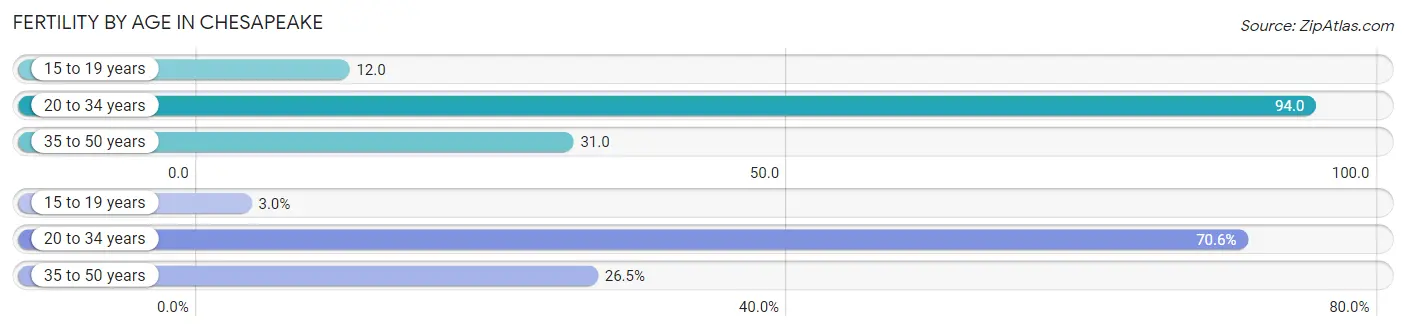
| Age Bracket | Women with Births | Births / 1,000 Women |
| 15 to 19 years | 96 (2.9%) | 12.0 |
| 20 to 34 years | 2,295 (70.6%) | 94.0 |
| 35 to 50 years | 860 (26.5%) | 31.0 |
| Total | 3,251 (100.0%) | 54.0 |
Fertility by Age by Marriage Status in Chesapeake
77.9% of women with births (3,251) in Chesapeake are married. The highest percentage of unmarried women with births falls into 15 to 19 years age bracket with 100.0% of them unmarried at the time of birth, while the lowest percentage of unmarried women with births belong to 20 to 34 years age bracket with 19.6% of them unmarried.
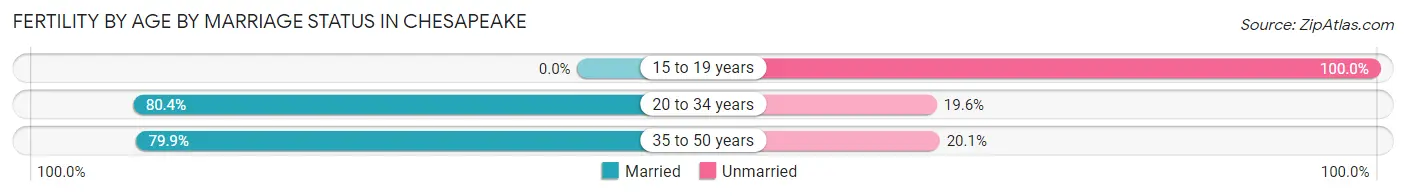
| Age Bracket | Married | Unmarried |
| 15 to 19 years | 0 (0.0%) | 96 (100.0%) |
| 20 to 34 years | 1,845 (80.4%) | 450 (19.6%) |
| 35 to 50 years | 687 (79.9%) | 173 (20.1%) |
| Total | 2,533 (77.9%) | 718 (22.1%) |
Fertility by Education in Chesapeake
Average fertility rate in Chesapeake is 54.0 births per 1,000 women. Women with the education attainment of bachelor's degree have the highest fertility rate of 70.0 births per 1,000 women, while women with the education attainment of less than high school have the lowest fertility at 28.0 births per 1,000 women. Women with the education attainment of college or associate's degree represent 34.1% of all women with births.
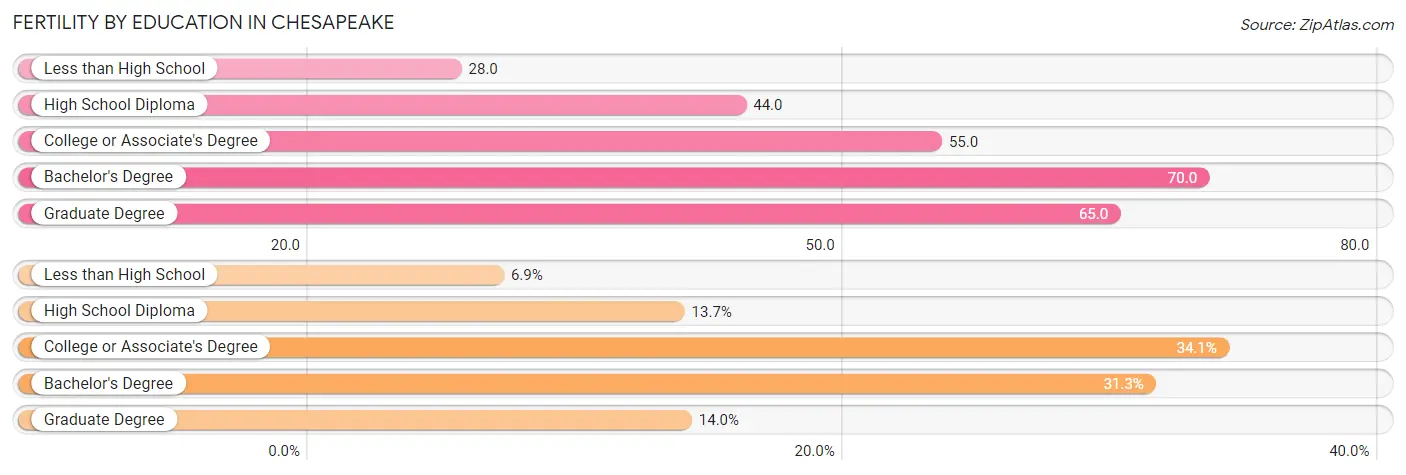
| Educational Attainment | Women with Births | Births / 1,000 Women |
| Less than High School | 225 (6.9%) | 28.0 |
| High School Diploma | 445 (13.7%) | 44.0 |
| College or Associate's Degree | 1,108 (34.1%) | 55.0 |
| Bachelor's Degree | 1,019 (31.3%) | 70.0 |
| Graduate Degree | 454 (14.0%) | 65.0 |
| Total | 3,251 (100.0%) | 54.0 |
Fertility by Education by Marriage Status in Chesapeake
22.1% of women with births in Chesapeake are unmarried. Women with the educational attainment of bachelor's degree are most likely to be married with 92.0% of them married at childbirth, while women with the educational attainment of less than high school are least likely to be married with 51.6% of them unmarried at childbirth.
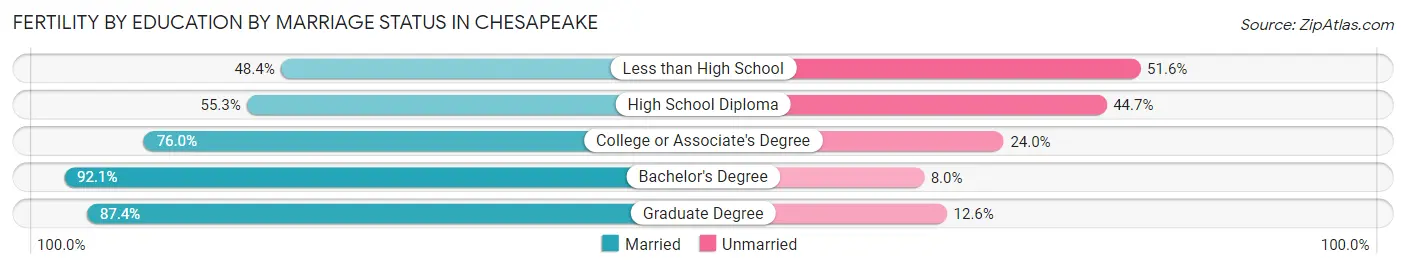
| Educational Attainment | Married | Unmarried |
| Less than High School | 109 (48.4%) | 116 (51.6%) |
| High School Diploma | 246 (55.3%) | 199 (44.7%) |
| College or Associate's Degree | 842 (76.0%) | 266 (24.0%) |
| Bachelor's Degree | 938 (92.0%) | 81 (8.0%) |
| Graduate Degree | 397 (87.4%) | 57 (12.6%) |
| Total | 2,533 (77.9%) | 718 (22.1%) |
Employment Characteristics in Chesapeake
Employment by Class of Employer in Chesapeake
Among the 123,540 employed individuals in Chesapeake, private company employees (68,568 | 55.5%), federal government employees (21,121 | 17.1%), and local government employees (10,942 | 8.9%) make up the most common classes of employment.
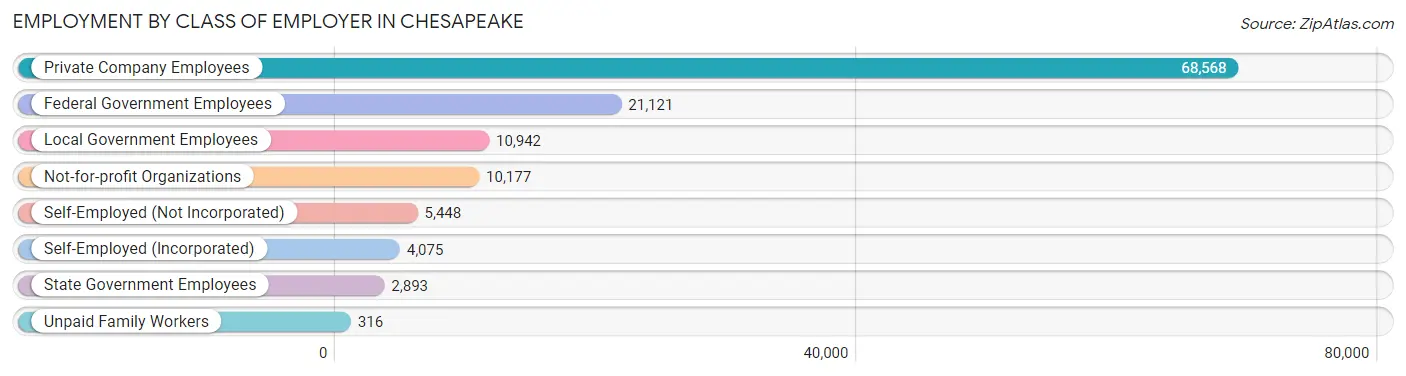
| Employer Class | # Employees | % Employees |
| Private Company Employees | 68,568 | 55.5% |
| Self-Employed (Incorporated) | 4,075 | 3.3% |
| Self-Employed (Not Incorporated) | 5,448 | 4.4% |
| Not-for-profit Organizations | 10,177 | 8.2% |
| Local Government Employees | 10,942 | 8.9% |
| State Government Employees | 2,893 | 2.3% |
| Federal Government Employees | 21,121 | 17.1% |
| Unpaid Family Workers | 316 | 0.3% |
| Total | 123,540 | 100.0% |
Employment Status by Age in Chesapeake
According to the labor force statistics for Chesapeake, out of the total population over 16 years of age (196,635), 67.2% or 132,139 individuals are in the labor force, with 5.0% or 6,607 of them unemployed. The age group with the highest labor force participation rate is 30 to 34 years, with 85.3% or 15,398 individuals in the labor force. Within the labor force, the 16 to 19 years age range has the highest percentage of unemployed individuals, with 14.9% or 807 of them being unemployed.
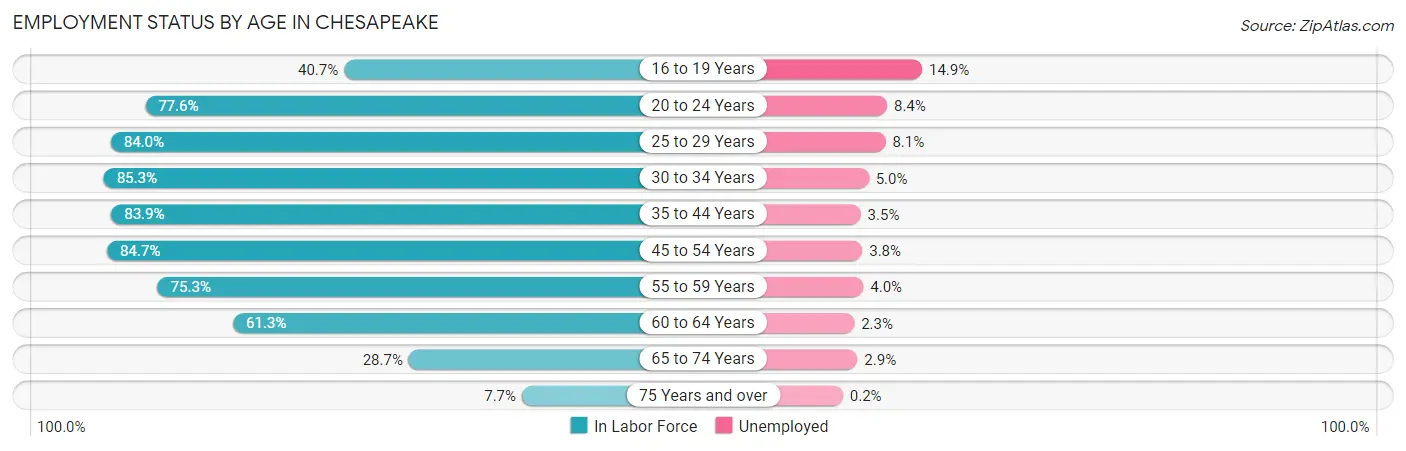
| Age Bracket | In Labor Force | Unemployed |
| 16 to 19 Years | 5,415 (40.7%) | 807 (14.9%) |
| 20 to 24 Years | 11,722 (77.6%) | 985 (8.4%) |
| 25 to 29 Years | 13,785 (84.0%) | 1,117 (8.1%) |
| 30 to 34 Years | 15,398 (85.3%) | 770 (5.0%) |
| 35 to 44 Years | 30,228 (83.9%) | 1,058 (3.5%) |
| 45 to 54 Years | 26,238 (84.7%) | 997 (3.8%) |
| 55 to 59 Years | 12,880 (75.3%) | 515 (4.0%) |
| 60 to 64 Years | 9,364 (61.3%) | 215 (2.3%) |
| 65 to 74 Years | 6,178 (28.7%) | 179 (2.9%) |
| 75 Years and over | 989 (7.7%) | 2 (0.2%) |
| Total | 132,139 (67.2%) | 6,607 (5.0%) |
Employment Status by Educational Attainment in Chesapeake
According to labor force statistics for Chesapeake, 80.6% of individuals (107,882) out of the total population between 25 and 64 years of age (133,849) are in the labor force, with 4.3% or 4,639 of them being unemployed. The group with the highest labor force participation rate are those with the educational attainment of bachelor's degree or higher, with 88.4% or 44,187 individuals in the labor force. Within the labor force, individuals with less than high school education have the highest percentage of unemployment, with 8.3% or 367 of them being unemployed.
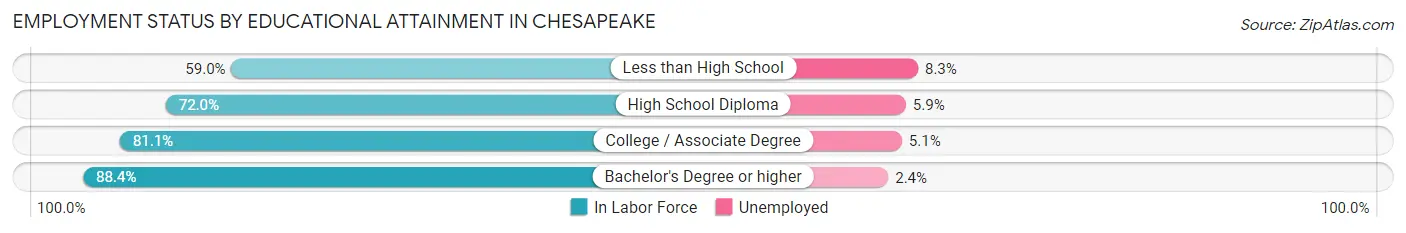
| Educational Attainment | In Labor Force | Unemployed |
| Less than High School | 4,419 (59.0%) | 622 (8.3%) |
| High School Diploma | 20,873 (72.0%) | 1,710 (5.9%) |
| College / Associate Degree | 38,428 (81.1%) | 2,417 (5.1%) |
| Bachelor's Degree or higher | 44,187 (88.4%) | 1,200 (2.4%) |
| Total | 107,882 (80.6%) | 5,756 (4.3%) |
Employment Occupations by Sex in Chesapeake
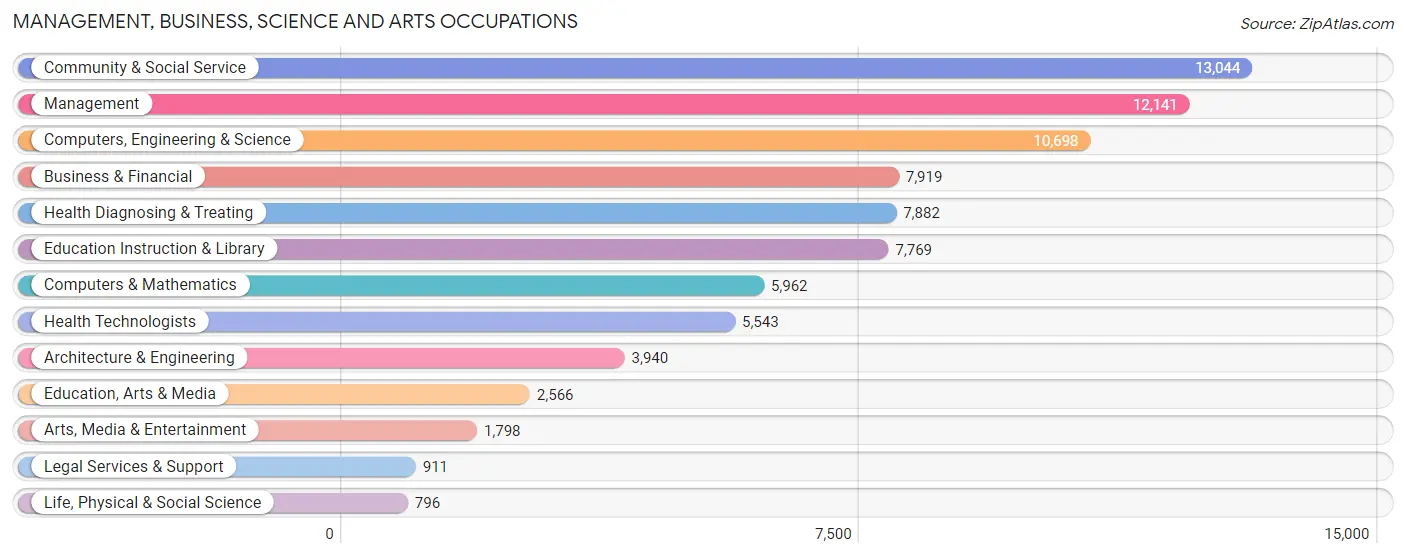
Management, Business, Science and Arts Occupations
The most common Management, Business, Science and Arts occupations in Chesapeake are Community & Social Service (13,044 | 11.1%), Management (12,141 | 10.3%), Computers, Engineering & Science (10,698 | 9.1%), Business & Financial (7,919 | 6.7%), and Health Diagnosing & Treating (7,882 | 6.7%).
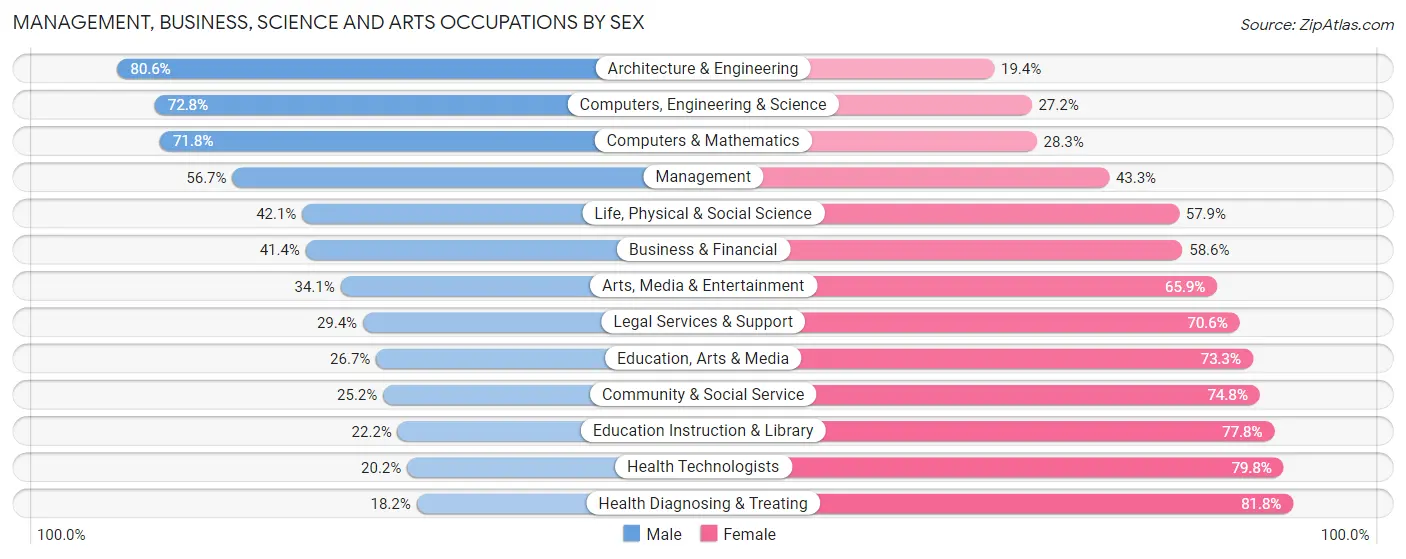
Management, Business, Science and Arts Occupations by Sex
Within the Management, Business, Science and Arts occupations in Chesapeake, the most male-oriented occupations are Architecture & Engineering (80.6%), Computers, Engineering & Science (72.8%), and Computers & Mathematics (71.8%), while the most female-oriented occupations are Health Diagnosing & Treating (81.8%), Health Technologists (79.8%), and Education Instruction & Library (77.8%).
| Occupation | Male | Female |
| Management | 6,879 (56.7%) | 5,262 (43.3%) |
| Business & Financial | 3,275 (41.4%) | 4,644 (58.6%) |
| Computers, Engineering & Science | 7,790 (72.8%) | 2,908 (27.2%) |
| Computers & Mathematics | 4,278 (71.8%) | 1,684 (28.2%) |
| Architecture & Engineering | 3,177 (80.6%) | 763 (19.4%) |
| Life, Physical & Social Science | 335 (42.1%) | 461 (57.9%) |
| Community & Social Service | 3,288 (25.2%) | 9,756 (74.8%) |
| Education, Arts & Media | 684 (26.7%) | 1,882 (73.3%) |
| Legal Services & Support | 268 (29.4%) | 643 (70.6%) |
| Education Instruction & Library | 1,723 (22.2%) | 6,046 (77.8%) |
| Arts, Media & Entertainment | 613 (34.1%) | 1,185 (65.9%) |
| Health Diagnosing & Treating | 1,437 (18.2%) | 6,445 (81.8%) |
| Health Technologists | 1,120 (20.2%) | 4,423 (79.8%) |
| Total (Category) | 22,669 (43.9%) | 29,015 (56.1%) |
| Total (Overall) | 58,641 (49.8%) | 59,041 (50.2%) |
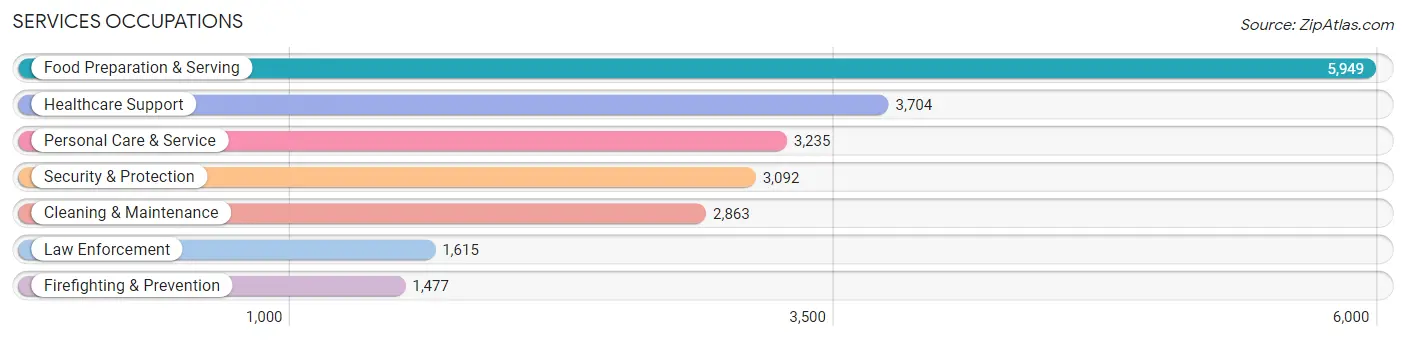
Services Occupations
The most common Services occupations in Chesapeake are Food Preparation & Serving (5,949 | 5.1%), Healthcare Support (3,704 | 3.2%), Personal Care & Service (3,235 | 2.8%), Security & Protection (3,092 | 2.6%), and Cleaning & Maintenance (2,863 | 2.4%).
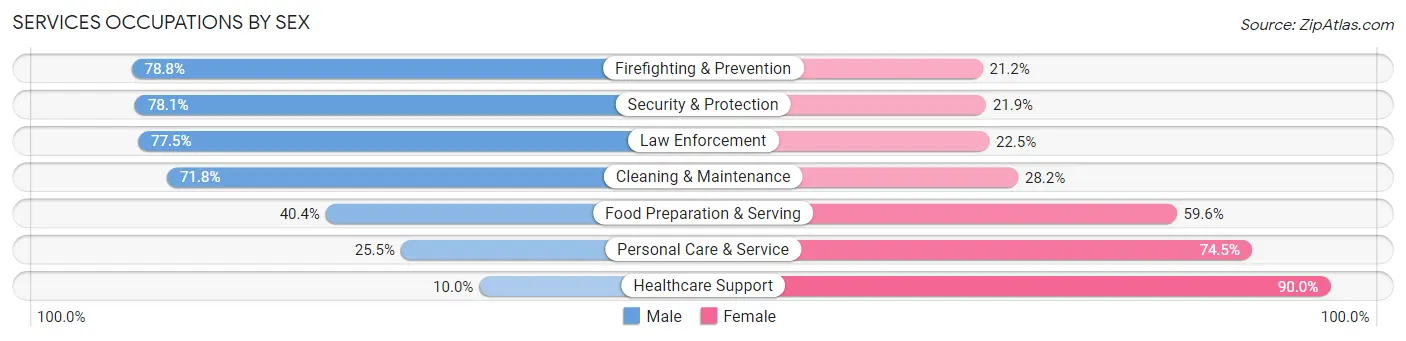
Services Occupations by Sex
Within the Services occupations in Chesapeake, the most male-oriented occupations are Firefighting & Prevention (78.8%), Security & Protection (78.1%), and Law Enforcement (77.5%), while the most female-oriented occupations are Healthcare Support (90.0%), Personal Care & Service (74.5%), and Food Preparation & Serving (59.6%).
| Occupation | Male | Female |
| Healthcare Support | 370 (10.0%) | 3,334 (90.0%) |
| Security & Protection | 2,416 (78.1%) | 676 (21.9%) |
| Firefighting & Prevention | 1,164 (78.8%) | 313 (21.2%) |
| Law Enforcement | 1,252 (77.5%) | 363 (22.5%) |
| Food Preparation & Serving | 2,402 (40.4%) | 3,547 (59.6%) |
| Cleaning & Maintenance | 2,055 (71.8%) | 808 (28.2%) |
| Personal Care & Service | 825 (25.5%) | 2,410 (74.5%) |
| Total (Category) | 8,068 (42.8%) | 10,775 (57.2%) |
| Total (Overall) | 58,641 (49.8%) | 59,041 (50.2%) |
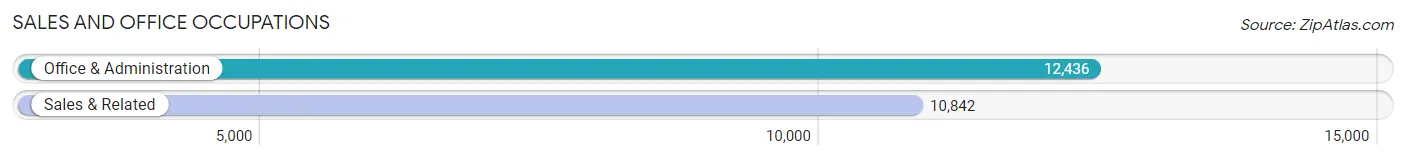
Sales and Office Occupations
The most common Sales and Office occupations in Chesapeake are Office & Administration (12,436 | 10.6%), and Sales & Related (10,842 | 9.2%).
Sales and Office Occupations by Sex
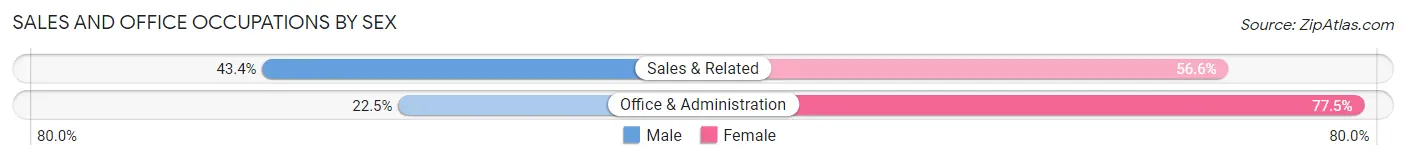
| Occupation | Male | Female |
| Sales & Related | 4,706 (43.4%) | 6,136 (56.6%) |
| Office & Administration | 2,798 (22.5%) | 9,638 (77.5%) |
| Total (Category) | 7,504 (32.2%) | 15,774 (67.8%) |
| Total (Overall) | 58,641 (49.8%) | 59,041 (50.2%) |
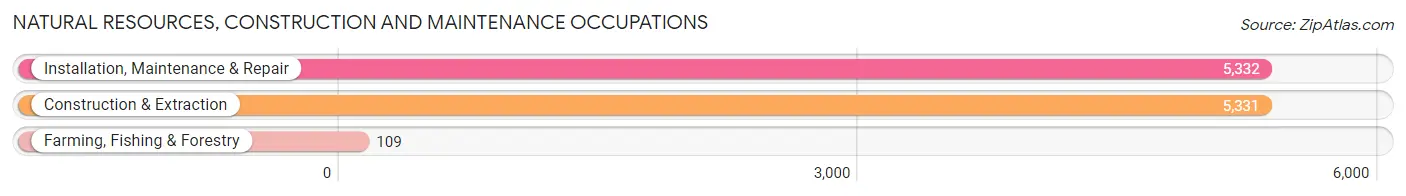
Natural Resources, Construction and Maintenance Occupations
The most common Natural Resources, Construction and Maintenance occupations in Chesapeake are Installation, Maintenance & Repair (5,332 | 4.5%), Construction & Extraction (5,331 | 4.5%), and Farming, Fishing & Forestry (109 | 0.1%).
Natural Resources, Construction and Maintenance Occupations by Sex
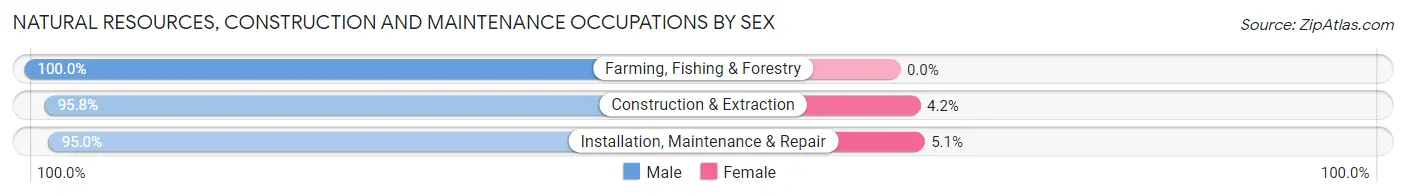
| Occupation | Male | Female |
| Farming, Fishing & Forestry | 109 (100.0%) | 0 (0.0%) |
| Construction & Extraction | 5,107 (95.8%) | 224 (4.2%) |
| Installation, Maintenance & Repair | 5,063 (95.0%) | 269 (5.1%) |
| Total (Category) | 10,279 (95.4%) | 493 (4.6%) |
| Total (Overall) | 58,641 (49.8%) | 59,041 (50.2%) |
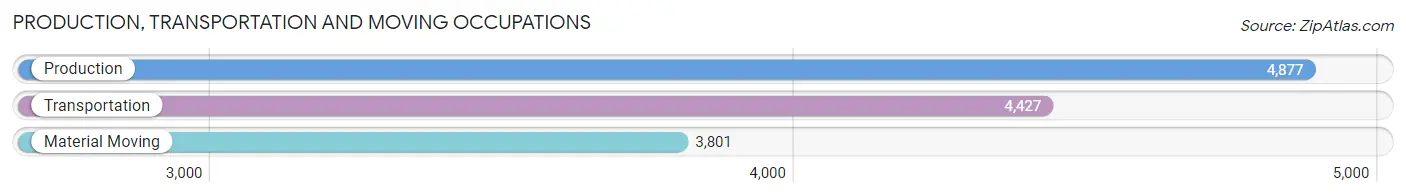
Production, Transportation and Moving Occupations
The most common Production, Transportation and Moving occupations in Chesapeake are Production (4,877 | 4.1%), Transportation (4,427 | 3.8%), and Material Moving (3,801 | 3.2%).
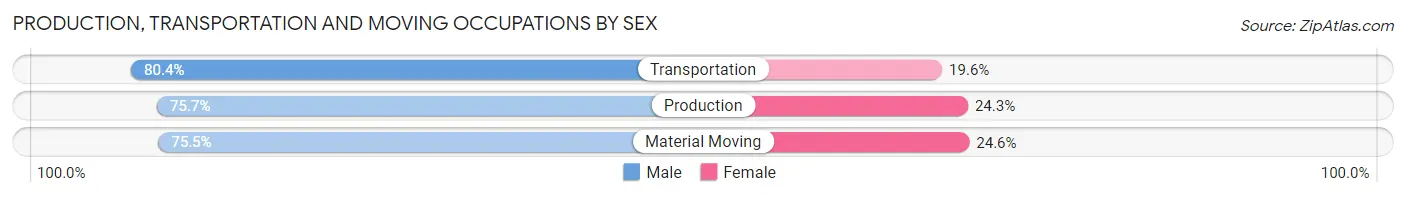
Production, Transportation and Moving Occupations by Sex
| Occupation | Male | Female |
| Production | 3,692 (75.7%) | 1,185 (24.3%) |
| Transportation | 3,561 (80.4%) | 866 (19.6%) |
| Material Moving | 2,868 (75.4%) | 933 (24.5%) |
| Total (Category) | 10,121 (77.2%) | 2,984 (22.8%) |
| Total (Overall) | 58,641 (49.8%) | 59,041 (50.2%) |
Employment Industries by Sex in Chesapeake
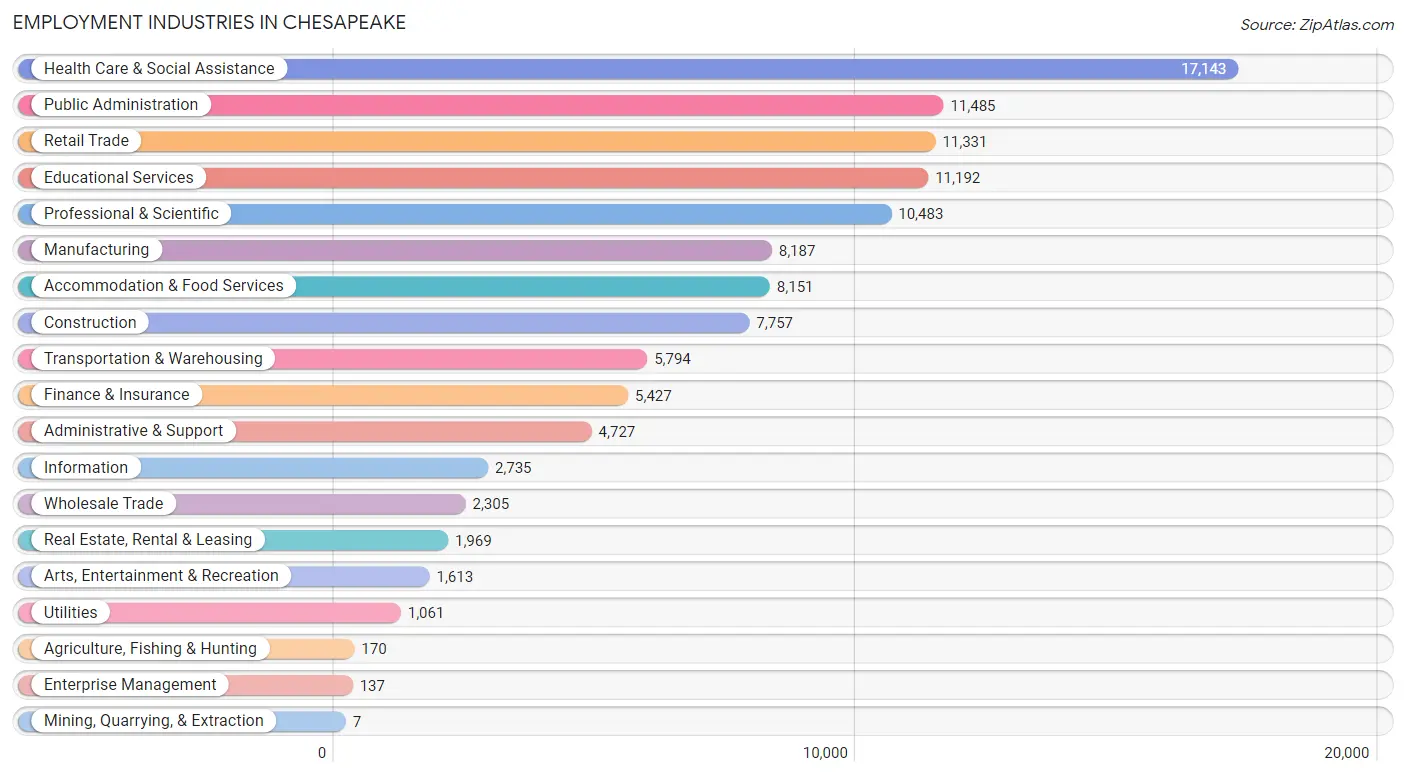
Employment Industries in Chesapeake
The major employment industries in Chesapeake include Health Care & Social Assistance (17,143 | 14.6%), Public Administration (11,485 | 9.8%), Retail Trade (11,331 | 9.6%), Educational Services (11,192 | 9.5%), and Professional & Scientific (10,483 | 8.9%).
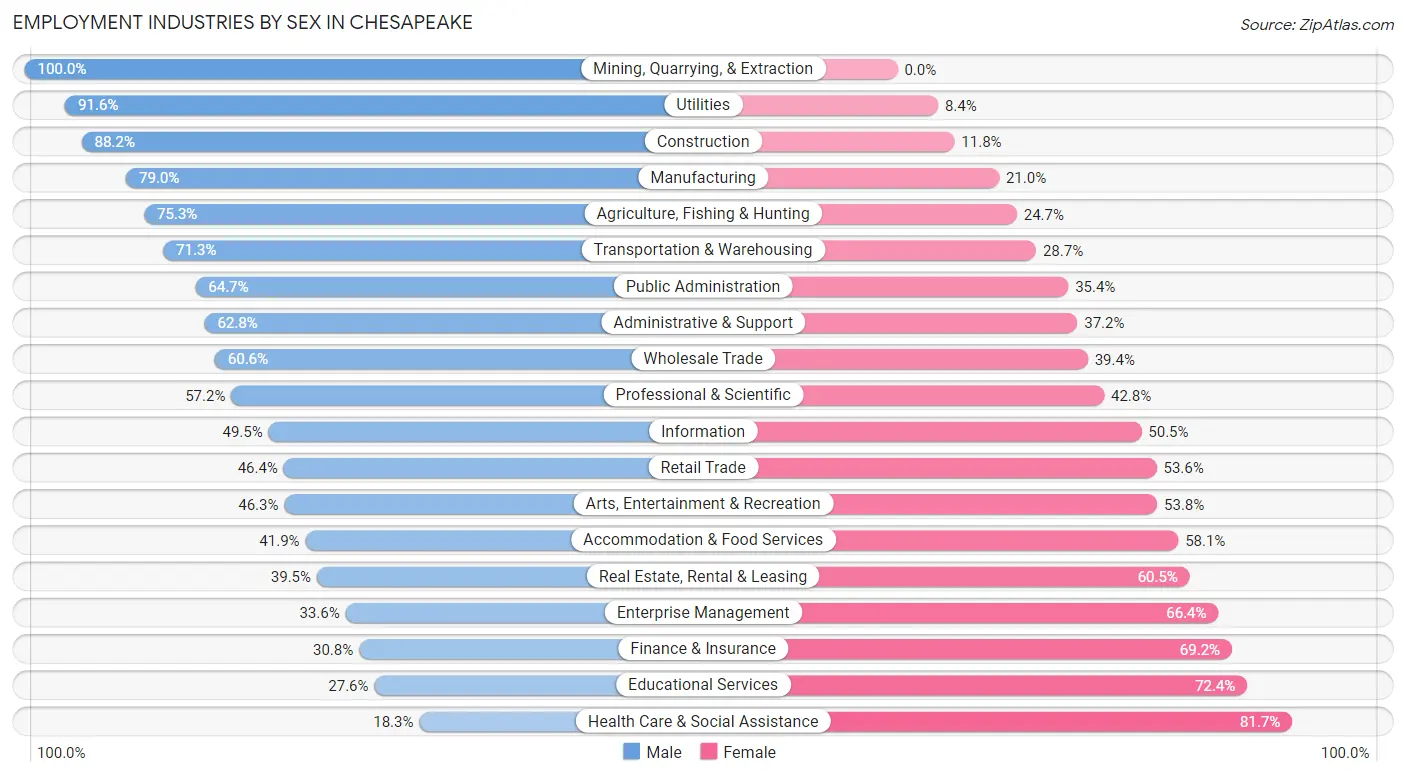
Employment Industries by Sex in Chesapeake
The Chesapeake industries that see more men than women are Mining, Quarrying, & Extraction (100.0%), Utilities (91.6%), and Construction (88.2%), whereas the industries that tend to have a higher number of women are Health Care & Social Assistance (81.7%), Educational Services (72.4%), and Finance & Insurance (69.2%).
| Industry | Male | Female |
| Agriculture, Fishing & Hunting | 128 (75.3%) | 42 (24.7%) |
| Mining, Quarrying, & Extraction | 7 (100.0%) | 0 (0.0%) |
| Construction | 6,842 (88.2%) | 915 (11.8%) |
| Manufacturing | 6,466 (79.0%) | 1,721 (21.0%) |
| Wholesale Trade | 1,397 (60.6%) | 908 (39.4%) |
| Retail Trade | 5,254 (46.4%) | 6,077 (53.6%) |
| Transportation & Warehousing | 4,132 (71.3%) | 1,662 (28.7%) |
| Utilities | 972 (91.6%) | 89 (8.4%) |
| Information | 1,354 (49.5%) | 1,381 (50.5%) |
| Finance & Insurance | 1,670 (30.8%) | 3,757 (69.2%) |
| Real Estate, Rental & Leasing | 778 (39.5%) | 1,191 (60.5%) |
| Professional & Scientific | 5,999 (57.2%) | 4,484 (42.8%) |
| Enterprise Management | 46 (33.6%) | 91 (66.4%) |
| Administrative & Support | 2,967 (62.8%) | 1,760 (37.2%) |
| Educational Services | 3,090 (27.6%) | 8,102 (72.4%) |
| Health Care & Social Assistance | 3,138 (18.3%) | 14,005 (81.7%) |
| Arts, Entertainment & Recreation | 746 (46.3%) | 867 (53.7%) |
| Accommodation & Food Services | 3,414 (41.9%) | 4,737 (58.1%) |
| Public Administration | 7,425 (64.6%) | 4,060 (35.3%) |
| Total | 58,641 (49.8%) | 59,041 (50.2%) |
Education in Chesapeake
School Enrollment in Chesapeake
The most common levels of schooling among the 63,858 students in Chesapeake are high school (14,553 | 22.8%), middle school (13,512 | 21.2%), and elementary school (13,069 | 20.5%).
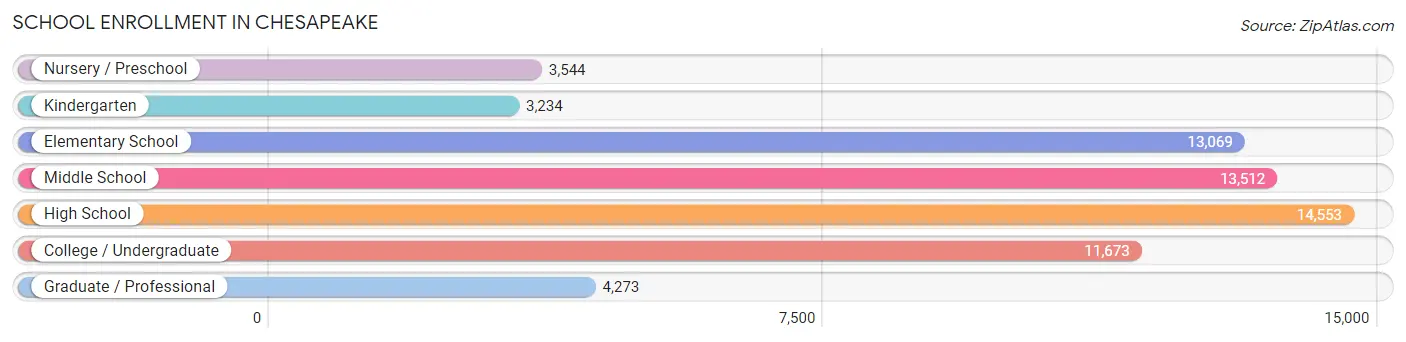
| School Level | # Students | % Students |
| Nursery / Preschool | 3,544 | 5.6% |
| Kindergarten | 3,234 | 5.1% |
| Elementary School | 13,069 | 20.5% |
| Middle School | 13,512 | 21.2% |
| High School | 14,553 | 22.8% |
| College / Undergraduate | 11,673 | 18.3% |
| Graduate / Professional | 4,273 | 6.7% |
| Total | 63,858 | 100.0% |
School Enrollment by Age by Funding Source in Chesapeake
Out of a total of 63,858 students who are enrolled in schools in Chesapeake, 11,622 (18.2%) attend a private institution, while the remaining 52,236 (81.8%) are enrolled in public schools. The age group of 3 to 4 year olds has the highest likelihood of being enrolled in private schools, with 1,644 (60.9% in the age bracket) enrolled. Conversely, the age group of 15 to 17 year olds has the lowest likelihood of being enrolled in a private school, with 9,697 (92.7% in the age bracket) attending a public institution.
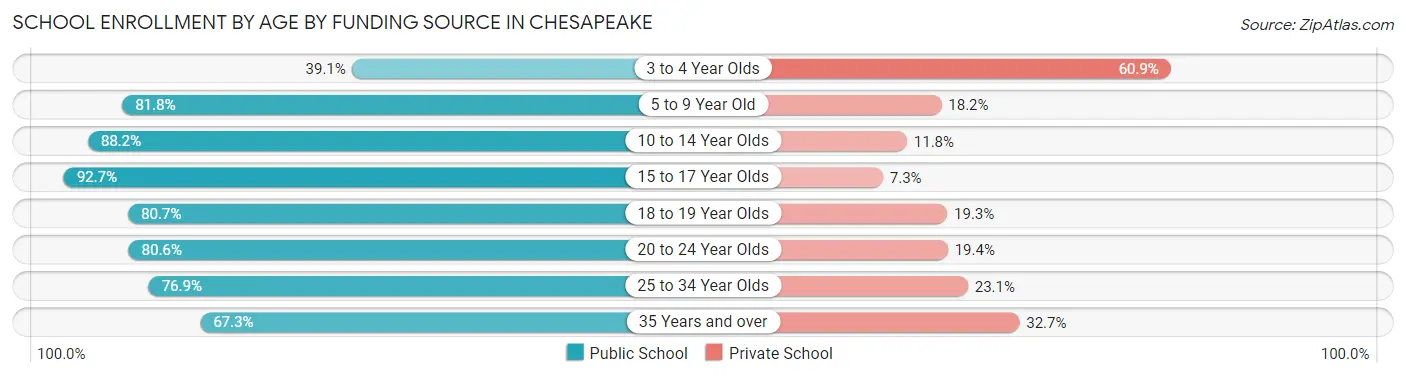
| Age Bracket | Public School | Private School |
| 3 to 4 Year Olds | 1,055 (39.1%) | 1,644 (60.9%) |
| 5 to 9 Year Old | 12,547 (81.8%) | 2,789 (18.2%) |
| 10 to 14 Year Olds | 14,902 (88.2%) | 1,988 (11.8%) |
| 15 to 17 Year Olds | 9,697 (92.7%) | 764 (7.3%) |
| 18 to 19 Year Olds | 3,314 (80.7%) | 791 (19.3%) |
| 20 to 24 Year Olds | 3,706 (80.6%) | 891 (19.4%) |
| 25 to 34 Year Olds | 3,734 (76.9%) | 1,123 (23.1%) |
| 35 Years and over | 3,306 (67.3%) | 1,607 (32.7%) |
| Total | 52,236 (81.8%) | 11,622 (18.2%) |
Educational Attainment by Field of Study in Chesapeake
Business (12,572 | 19.4%), science & technology (6,932 | 10.7%), education (6,917 | 10.6%), arts & humanities (5,982 | 9.2%), and social sciences (4,359 | 6.7%) are the most common fields of study among 64,971 individuals in Chesapeake who have obtained a bachelor's degree or higher.
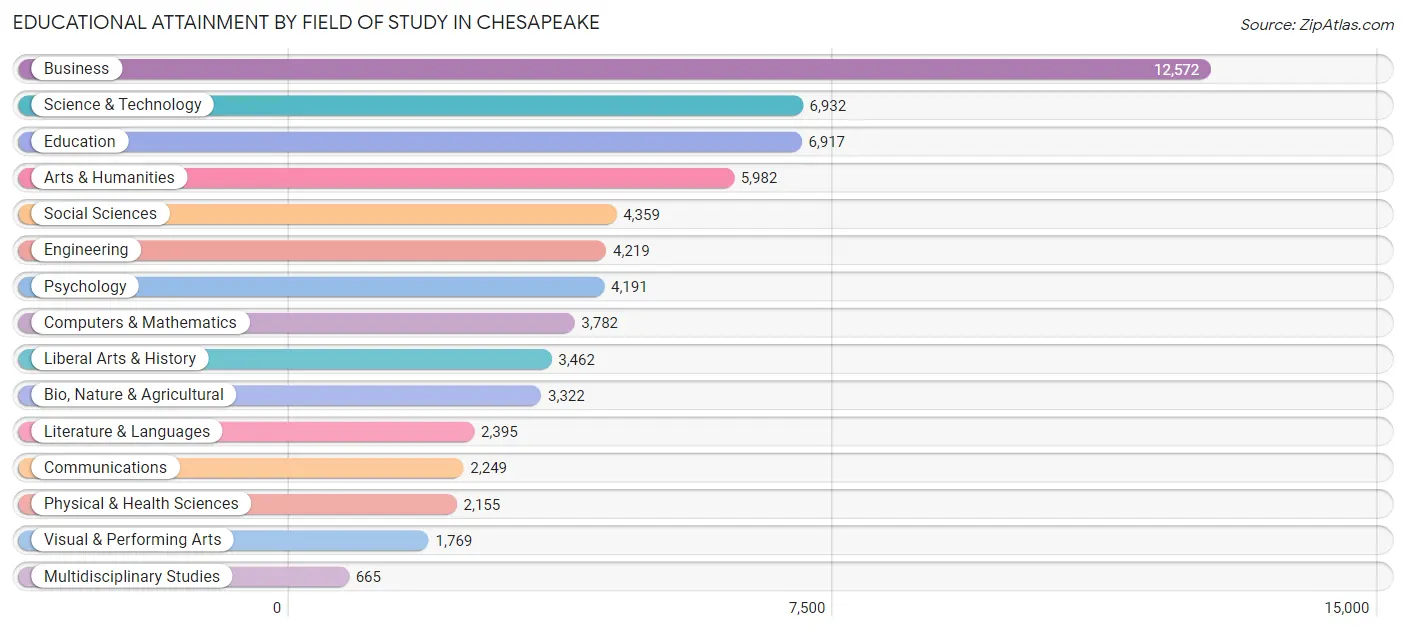
| Field of Study | # Graduates | % Graduates |
| Computers & Mathematics | 3,782 | 5.8% |
| Bio, Nature & Agricultural | 3,322 | 5.1% |
| Physical & Health Sciences | 2,155 | 3.3% |
| Psychology | 4,191 | 6.5% |
| Social Sciences | 4,359 | 6.7% |
| Engineering | 4,219 | 6.5% |
| Multidisciplinary Studies | 665 | 1.0% |
| Science & Technology | 6,932 | 10.7% |
| Business | 12,572 | 19.4% |
| Education | 6,917 | 10.6% |
| Literature & Languages | 2,395 | 3.7% |
| Liberal Arts & History | 3,462 | 5.3% |
| Visual & Performing Arts | 1,769 | 2.7% |
| Communications | 2,249 | 3.5% |
| Arts & Humanities | 5,982 | 9.2% |
| Total | 64,971 | 100.0% |
Transportation & Commute in Chesapeake
Vehicle Availability by Sex in Chesapeake
The most prevalent vehicle ownership categories in Chesapeake are males with 2 vehicles (27,879, accounting for 43.6%) and females with 2 vehicles (23,780, making up 47.1%).
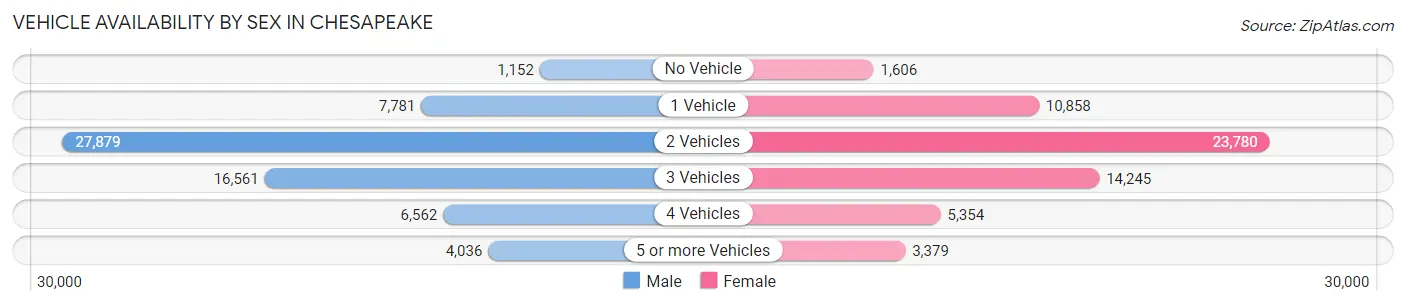
| Vehicles Available | Male | Female |
| No Vehicle | 1,152 (1.8%) | 1,606 (2.7%) |
| 1 Vehicle | 7,781 (12.2%) | 10,858 (18.3%) |
| 2 Vehicles | 27,879 (43.6%) | 23,780 (40.2%) |
| 3 Vehicles | 16,561 (25.9%) | 14,245 (24.0%) |
| 4 Vehicles | 6,562 (10.3%) | 5,354 (9.0%) |
| 5 or more Vehicles | 4,036 (6.3%) | 3,379 (5.7%) |
| Total | 63,971 (100.0%) | 59,222 (100.0%) |
Commute Time in Chesapeake
The most frequently occuring commute durations in Chesapeake are 30 to 34 minutes (19,186 commuters, 17.2%), 15 to 19 minutes (18,396 commuters, 16.5%), and 20 to 24 minutes (18,188 commuters, 16.3%).
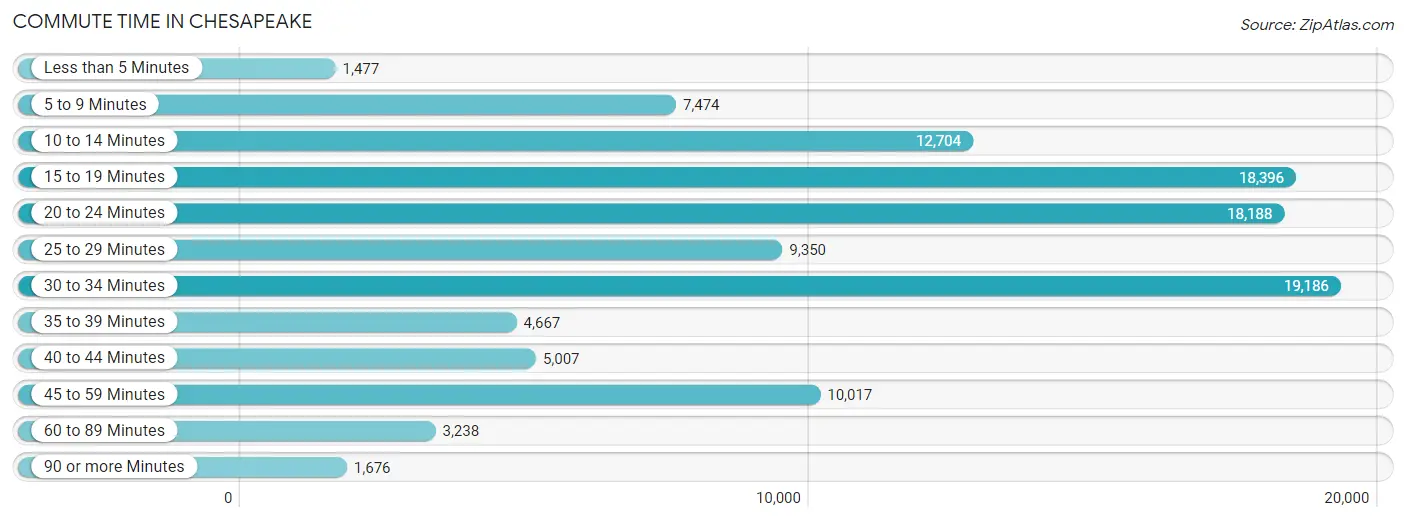
| Commute Time | # Commuters | % Commuters |
| Less than 5 Minutes | 1,477 | 1.3% |
| 5 to 9 Minutes | 7,474 | 6.7% |
| 10 to 14 Minutes | 12,704 | 11.4% |
| 15 to 19 Minutes | 18,396 | 16.5% |
| 20 to 24 Minutes | 18,188 | 16.3% |
| 25 to 29 Minutes | 9,350 | 8.4% |
| 30 to 34 Minutes | 19,186 | 17.2% |
| 35 to 39 Minutes | 4,667 | 4.2% |
| 40 to 44 Minutes | 5,007 | 4.5% |
| 45 to 59 Minutes | 10,017 | 9.0% |
| 60 to 89 Minutes | 3,238 | 2.9% |
| 90 or more Minutes | 1,676 | 1.5% |
Commute Time by Sex in Chesapeake
The most common commute times in Chesapeake are 30 to 34 minutes (11,346 commuters, 19.1%) for males and 20 to 24 minutes (9,672 commuters, 18.6%) for females.
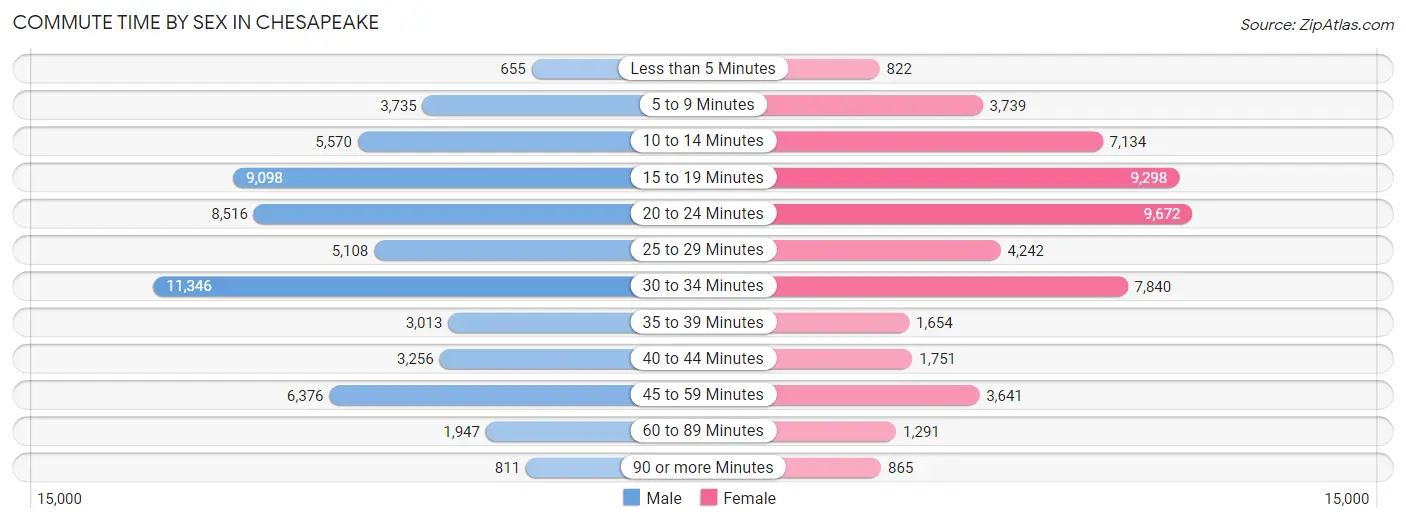
| Commute Time | Male | Female |
| Less than 5 Minutes | 655 (1.1%) | 822 (1.6%) |
| 5 to 9 Minutes | 3,735 (6.3%) | 3,739 (7.2%) |
| 10 to 14 Minutes | 5,570 (9.4%) | 7,134 (13.7%) |
| 15 to 19 Minutes | 9,098 (15.3%) | 9,298 (17.9%) |
| 20 to 24 Minutes | 8,516 (14.3%) | 9,672 (18.6%) |
| 25 to 29 Minutes | 5,108 (8.6%) | 4,242 (8.2%) |
| 30 to 34 Minutes | 11,346 (19.1%) | 7,840 (15.1%) |
| 35 to 39 Minutes | 3,013 (5.1%) | 1,654 (3.2%) |
| 40 to 44 Minutes | 3,256 (5.5%) | 1,751 (3.4%) |
| 45 to 59 Minutes | 6,376 (10.7%) | 3,641 (7.0%) |
| 60 to 89 Minutes | 1,947 (3.3%) | 1,291 (2.5%) |
| 90 or more Minutes | 811 (1.4%) | 865 (1.7%) |
Time of Departure to Work by Sex in Chesapeake
The most frequent times of departure to work in Chesapeake are 7:00 AM to 7:29 AM (8,655, 14.6%) for males and 7:00 AM to 7:29 AM (8,982, 17.3%) for females.
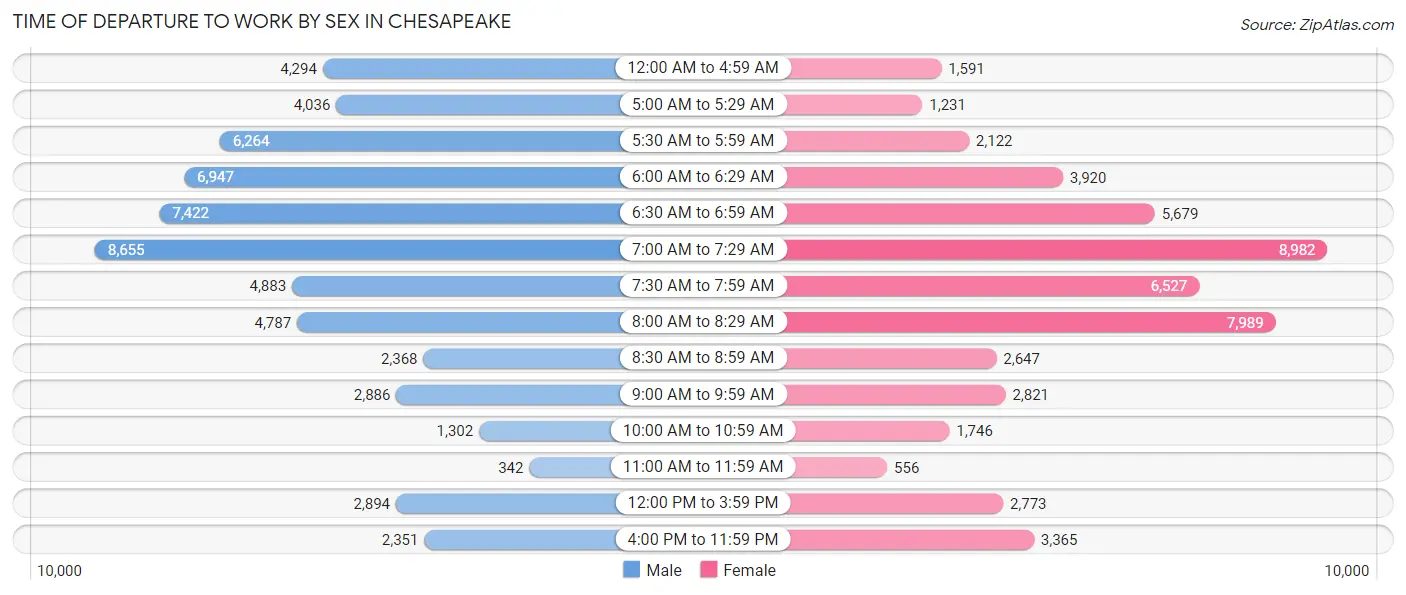
| Time of Departure | Male | Female |
| 12:00 AM to 4:59 AM | 4,294 (7.2%) | 1,591 (3.1%) |
| 5:00 AM to 5:29 AM | 4,036 (6.8%) | 1,231 (2.4%) |
| 5:30 AM to 5:59 AM | 6,264 (10.5%) | 2,122 (4.1%) |
| 6:00 AM to 6:29 AM | 6,947 (11.7%) | 3,920 (7.5%) |
| 6:30 AM to 6:59 AM | 7,422 (12.5%) | 5,679 (10.9%) |
| 7:00 AM to 7:29 AM | 8,655 (14.6%) | 8,982 (17.3%) |
| 7:30 AM to 7:59 AM | 4,883 (8.2%) | 6,527 (12.6%) |
| 8:00 AM to 8:29 AM | 4,787 (8.1%) | 7,989 (15.4%) |
| 8:30 AM to 8:59 AM | 2,368 (4.0%) | 2,647 (5.1%) |
| 9:00 AM to 9:59 AM | 2,886 (4.9%) | 2,821 (5.4%) |
| 10:00 AM to 10:59 AM | 1,302 (2.2%) | 1,746 (3.4%) |
| 11:00 AM to 11:59 AM | 342 (0.6%) | 556 (1.1%) |
| 12:00 PM to 3:59 PM | 2,894 (4.9%) | 2,773 (5.3%) |
| 4:00 PM to 11:59 PM | 2,351 (4.0%) | 3,365 (6.5%) |
| Total | 59,431 (100.0%) | 51,949 (100.0%) |
Housing Occupancy in Chesapeake
Occupancy by Ownership in Chesapeake
Of the total 91,368 dwellings in Chesapeake, owner-occupied units account for 66,988 (73.3%), while renter-occupied units make up 24,380 (26.7%).
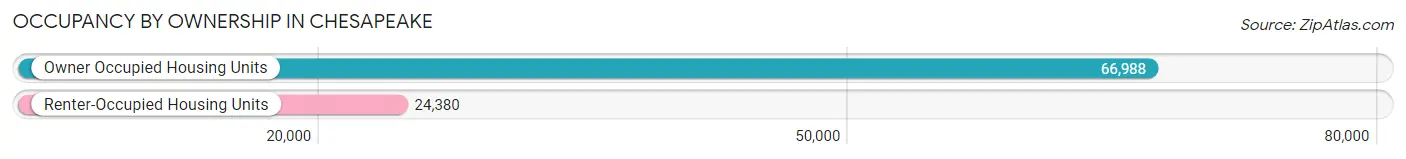
| Occupancy | # Housing Units | % Housing Units |
| Owner Occupied Housing Units | 66,988 | 73.3% |
| Renter-Occupied Housing Units | 24,380 | 26.7% |
| Total Occupied Housing Units | 91,368 | 100.0% |
Occupancy by Household Size in Chesapeake
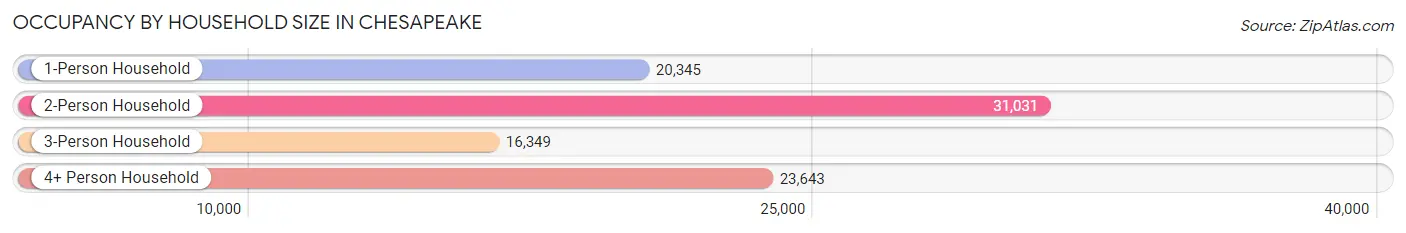
| Household Size | # Housing Units | % Housing Units |
| 1-Person Household | 20,345 | 22.3% |
| 2-Person Household | 31,031 | 34.0% |
| 3-Person Household | 16,349 | 17.9% |
| 4+ Person Household | 23,643 | 25.9% |
| Total Housing Units | 91,368 | 100.0% |
Occupancy by Ownership by Household Size in Chesapeake
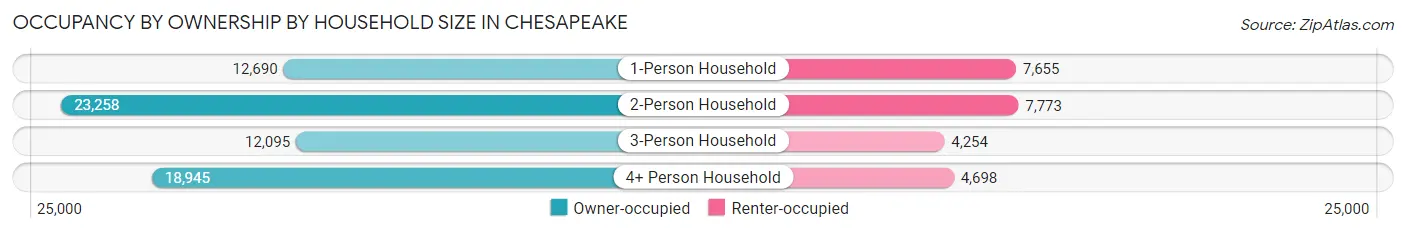
| Household Size | Owner-occupied | Renter-occupied |
| 1-Person Household | 12,690 (62.4%) | 7,655 (37.6%) |
| 2-Person Household | 23,258 (75.0%) | 7,773 (25.1%) |
| 3-Person Household | 12,095 (74.0%) | 4,254 (26.0%) |
| 4+ Person Household | 18,945 (80.1%) | 4,698 (19.9%) |
| Total Housing Units | 66,988 (73.3%) | 24,380 (26.7%) |
Occupancy by Educational Attainment in Chesapeake
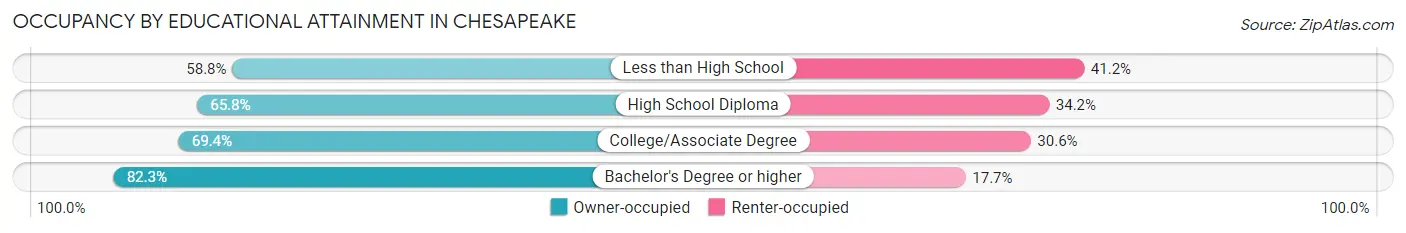
| Household Size | Owner-occupied | Renter-occupied |
| Less than High School | 2,546 (58.8%) | 1,783 (41.2%) |
| High School Diploma | 11,487 (65.8%) | 5,981 (34.2%) |
| College/Associate Degree | 23,207 (69.4%) | 10,225 (30.6%) |
| Bachelor's Degree or higher | 29,748 (82.3%) | 6,391 (17.7%) |
Occupancy by Age of Householder in Chesapeake
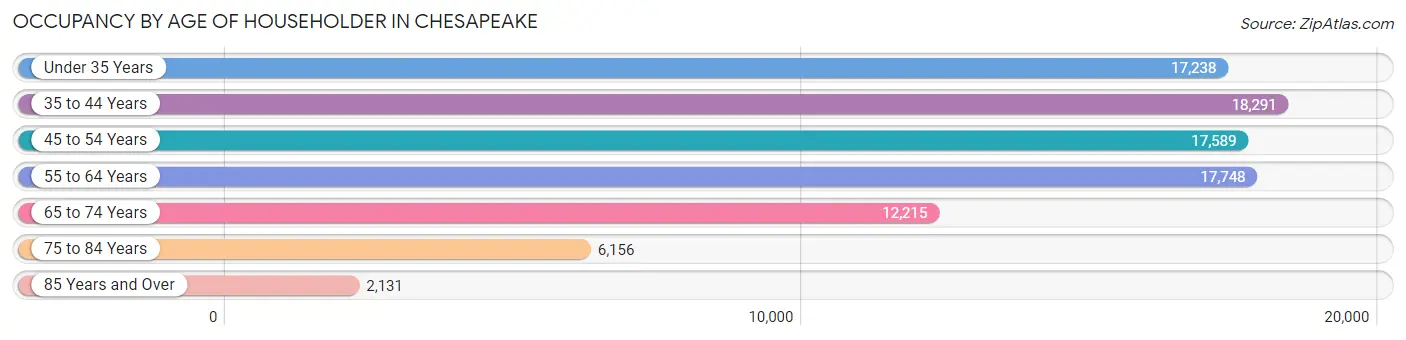
| Age Bracket | # Households | % Households |
| Under 35 Years | 17,238 | 18.9% |
| 35 to 44 Years | 18,291 | 20.0% |
| 45 to 54 Years | 17,589 | 19.3% |
| 55 to 64 Years | 17,748 | 19.4% |
| 65 to 74 Years | 12,215 | 13.4% |
| 75 to 84 Years | 6,156 | 6.7% |
| 85 Years and Over | 2,131 | 2.3% |
| Total | 91,368 | 100.0% |
Housing Finances in Chesapeake
Median Income by Occupancy in Chesapeake
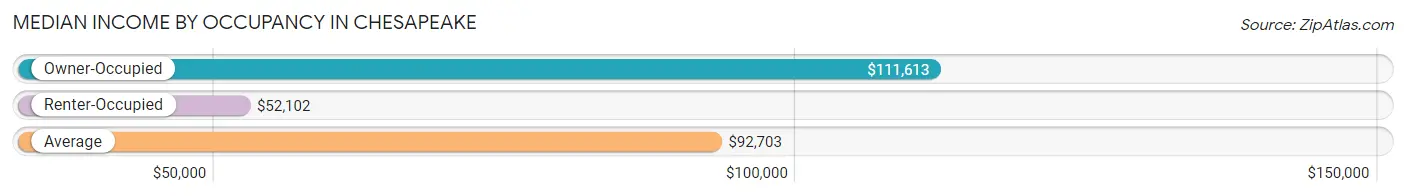
| Occupancy Type | # Households | Median Income |
| Owner-Occupied | 66,988 (73.3%) | $111,613 |
| Renter-Occupied | 24,380 (26.7%) | $52,102 |
| Average | 91,368 (100.0%) | $92,703 |
Occupancy by Householder Income Bracket in Chesapeake
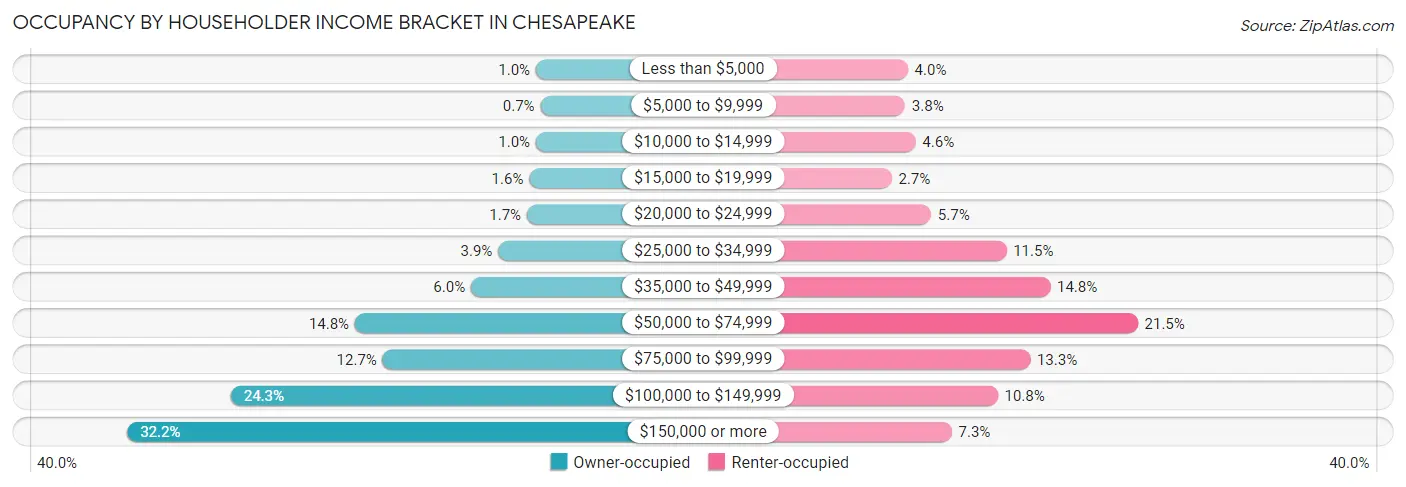
| Income Bracket | Owner-occupied | Renter-occupied |
| Less than $5,000 | 694 (1.0%) | 967 (4.0%) |
| $5,000 to $9,999 | 471 (0.7%) | 916 (3.8%) |
| $10,000 to $14,999 | 700 (1.0%) | 1,112 (4.6%) |
| $15,000 to $19,999 | 1,039 (1.5%) | 669 (2.7%) |
| $20,000 to $24,999 | 1,158 (1.7%) | 1,400 (5.7%) |
| $25,000 to $34,999 | 2,625 (3.9%) | 2,800 (11.5%) |
| $35,000 to $49,999 | 4,015 (6.0%) | 3,613 (14.8%) |
| $50,000 to $74,999 | 9,934 (14.8%) | 5,240 (21.5%) |
| $75,000 to $99,999 | 8,522 (12.7%) | 3,239 (13.3%) |
| $100,000 to $149,999 | 16,274 (24.3%) | 2,639 (10.8%) |
| $150,000 or more | 21,556 (32.2%) | 1,785 (7.3%) |
| Total | 66,988 (100.0%) | 24,380 (100.0%) |
Monthly Housing Cost Tiers in Chesapeake
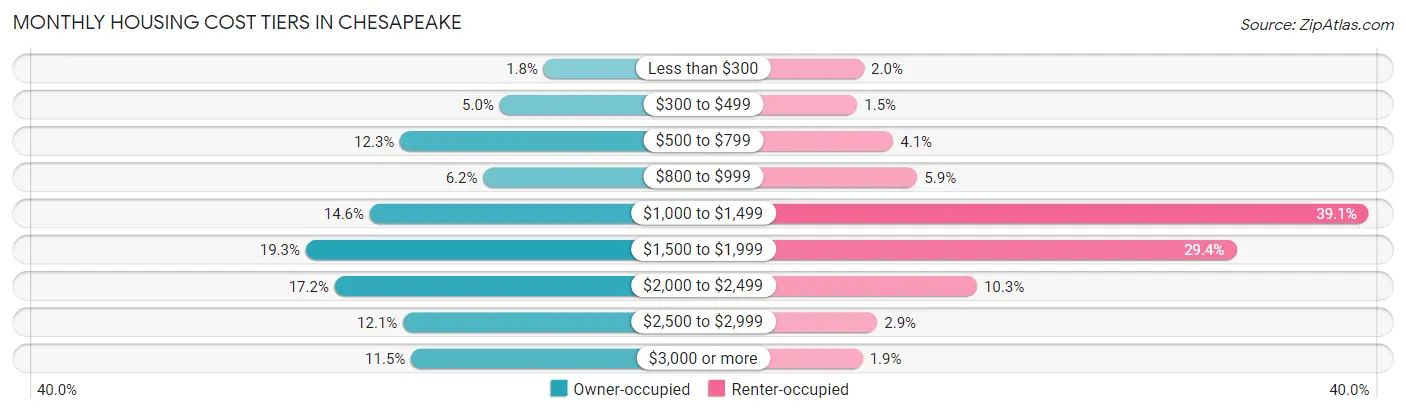
| Monthly Cost | Owner-occupied | Renter-occupied |
| Less than $300 | 1,179 (1.8%) | 481 (2.0%) |
| $300 to $499 | 3,357 (5.0%) | 359 (1.5%) |
| $500 to $799 | 8,265 (12.3%) | 1,004 (4.1%) |
| $800 to $999 | 4,167 (6.2%) | 1,437 (5.9%) |
| $1,000 to $1,499 | 9,760 (14.6%) | 9,534 (39.1%) |
| $1,500 to $1,999 | 12,921 (19.3%) | 7,161 (29.4%) |
| $2,000 to $2,499 | 11,497 (17.2%) | 2,506 (10.3%) |
| $2,500 to $2,999 | 8,121 (12.1%) | 717 (2.9%) |
| $3,000 or more | 7,721 (11.5%) | 454 (1.9%) |
| Total | 66,988 (100.0%) | 24,380 (100.0%) |
Physical Housing Characteristics in Chesapeake
Housing Structures in Chesapeake
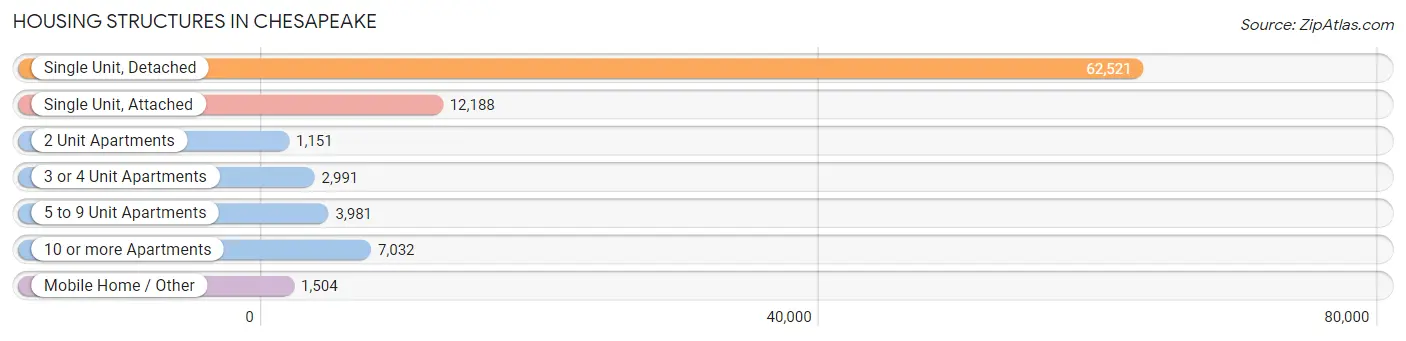
| Structure Type | # Housing Units | % Housing Units |
| Single Unit, Detached | 62,521 | 68.4% |
| Single Unit, Attached | 12,188 | 13.3% |
| 2 Unit Apartments | 1,151 | 1.3% |
| 3 or 4 Unit Apartments | 2,991 | 3.3% |
| 5 to 9 Unit Apartments | 3,981 | 4.4% |
| 10 or more Apartments | 7,032 | 7.7% |
| Mobile Home / Other | 1,504 | 1.7% |
| Total | 91,368 | 100.0% |
Housing Structures by Occupancy in Chesapeake
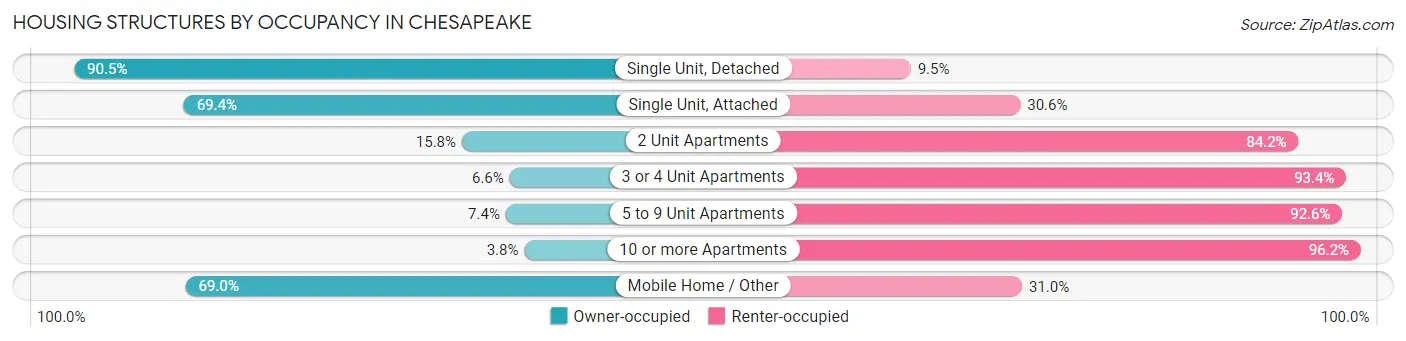
| Structure Type | Owner-occupied | Renter-occupied |
| Single Unit, Detached | 56,557 (90.5%) | 5,964 (9.5%) |
| Single Unit, Attached | 8,454 (69.4%) | 3,734 (30.6%) |
| 2 Unit Apartments | 182 (15.8%) | 969 (84.2%) |
| 3 or 4 Unit Apartments | 198 (6.6%) | 2,793 (93.4%) |
| 5 to 9 Unit Apartments | 293 (7.4%) | 3,688 (92.6%) |
| 10 or more Apartments | 266 (3.8%) | 6,766 (96.2%) |
| Mobile Home / Other | 1,038 (69.0%) | 466 (31.0%) |
| Total | 66,988 (73.3%) | 24,380 (26.7%) |
Housing Structures by Number of Rooms in Chesapeake
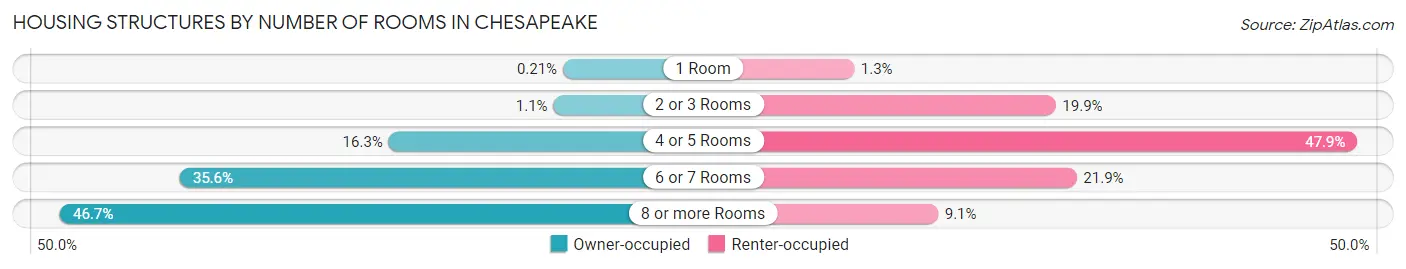
| Number of Rooms | Owner-occupied | Renter-occupied |
| 1 Room | 143 (0.2%) | 315 (1.3%) |
| 2 or 3 Rooms | 732 (1.1%) | 4,860 (19.9%) |
| 4 or 5 Rooms | 10,937 (16.3%) | 11,667 (47.8%) |
| 6 or 7 Rooms | 23,877 (35.6%) | 5,331 (21.9%) |
| 8 or more Rooms | 31,299 (46.7%) | 2,207 (9.0%) |
| Total | 66,988 (100.0%) | 24,380 (100.0%) |
Housing Structure by Heating Type in Chesapeake
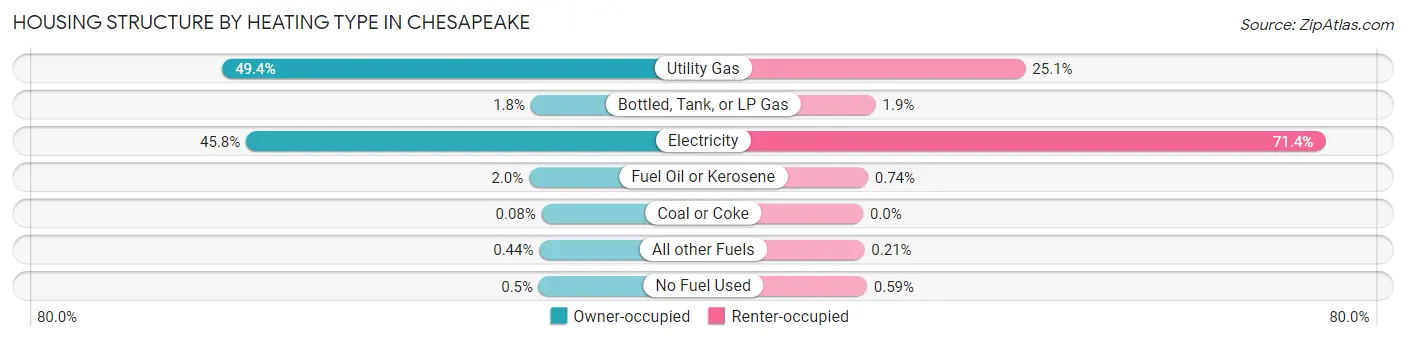
| Heating Type | Owner-occupied | Renter-occupied |
| Utility Gas | 33,116 (49.4%) | 6,119 (25.1%) |
| Bottled, Tank, or LP Gas | 1,175 (1.8%) | 472 (1.9%) |
| Electricity | 30,654 (45.8%) | 17,414 (71.4%) |
| Fuel Oil or Kerosene | 1,354 (2.0%) | 181 (0.7%) |
| Coal or Coke | 55 (0.1%) | 0 (0.0%) |
| All other Fuels | 297 (0.4%) | 50 (0.2%) |
| No Fuel Used | 337 (0.5%) | 144 (0.6%) |
| Total | 66,988 (100.0%) | 24,380 (100.0%) |
Household Vehicle Usage in Chesapeake
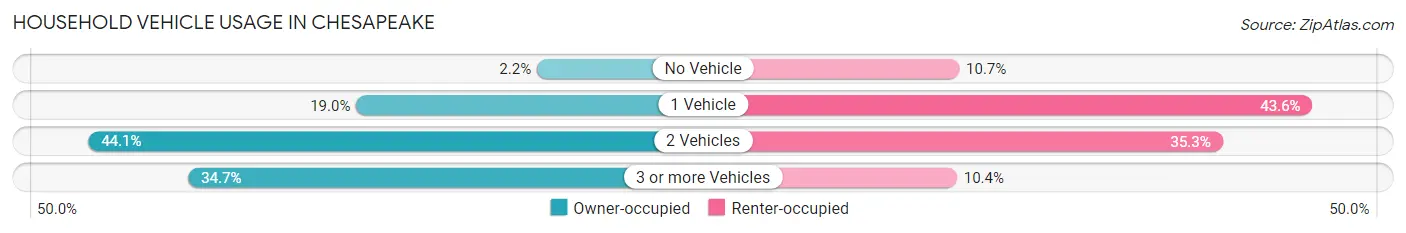
| Vehicles per Household | Owner-occupied | Renter-occupied |
| No Vehicle | 1,453 (2.2%) | 2,600 (10.7%) |
| 1 Vehicle | 12,755 (19.0%) | 10,640 (43.6%) |
| 2 Vehicles | 29,514 (44.1%) | 8,594 (35.2%) |
| 3 or more Vehicles | 23,266 (34.7%) | 2,546 (10.4%) |
| Total | 66,988 (100.0%) | 24,380 (100.0%) |
Real Estate & Mortgages in Chesapeake
Real Estate and Mortgage Overview in Chesapeake
| Characteristic | Without Mortgage | With Mortgage |
| Housing Units | 16,556 | 50,432 |
| Median Property Value | $313,700 | $348,000 |
| Median Household Income | $81,174 | $17,903 |
| Monthly Housing Costs | $647 | $7,643 |
| Real Estate Taxes | $2,855 | $2,488 |
Property Value by Mortgage Status in Chesapeake
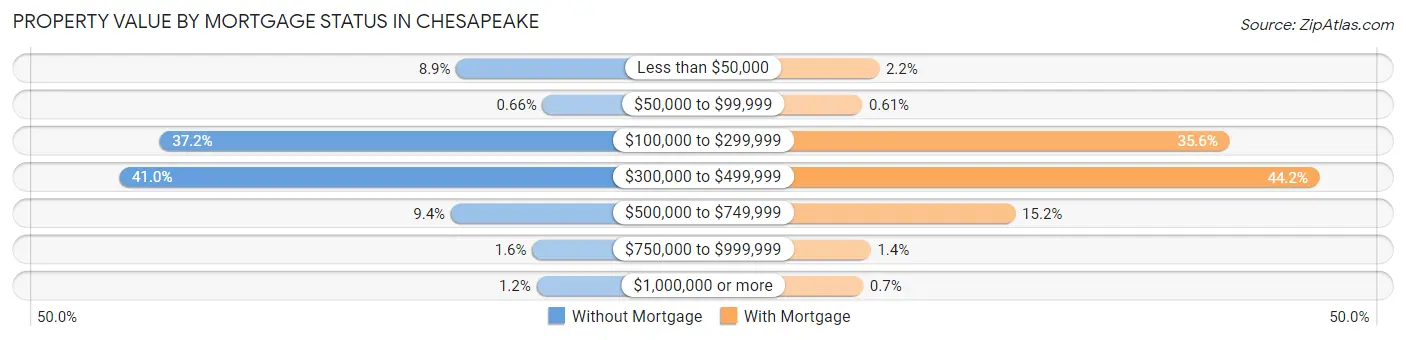
| Property Value | Without Mortgage | With Mortgage |
| Less than $50,000 | 1,470 (8.9%) | 1,124 (2.2%) |
| $50,000 to $99,999 | 110 (0.7%) | 307 (0.6%) |
| $100,000 to $299,999 | 6,154 (37.2%) | 17,972 (35.6%) |
| $300,000 to $499,999 | 6,789 (41.0%) | 22,294 (44.2%) |
| $500,000 to $749,999 | 1,556 (9.4%) | 7,664 (15.2%) |
| $750,000 to $999,999 | 272 (1.6%) | 718 (1.4%) |
| $1,000,000 or more | 205 (1.2%) | 353 (0.7%) |
| Total | 16,556 (100.0%) | 50,432 (100.0%) |
Household Income by Mortgage Status in Chesapeake
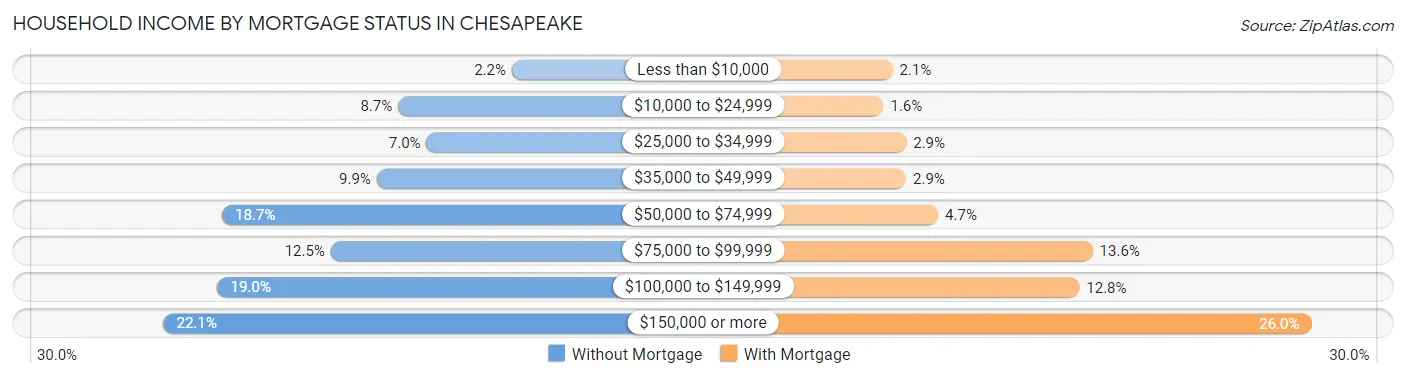
| Household Income | Without Mortgage | With Mortgage |
| Less than $10,000 | 358 (2.2%) | 1,066 (2.1%) |
| $10,000 to $24,999 | 1,434 (8.7%) | 807 (1.6%) |
| $25,000 to $34,999 | 1,166 (7.0%) | 1,463 (2.9%) |
| $35,000 to $49,999 | 1,636 (9.9%) | 1,459 (2.9%) |
| $50,000 to $74,999 | 3,098 (18.7%) | 2,379 (4.7%) |
| $75,000 to $99,999 | 2,071 (12.5%) | 6,836 (13.6%) |
| $100,000 to $149,999 | 3,140 (19.0%) | 6,451 (12.8%) |
| $150,000 or more | 3,653 (22.1%) | 13,134 (26.0%) |
| Total | 16,556 (100.0%) | 50,432 (100.0%) |
Property Value to Household Income Ratio in Chesapeake
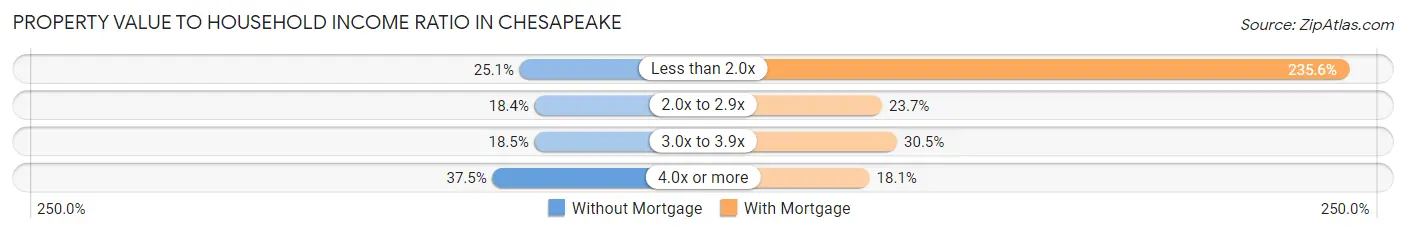
| Value-to-Income Ratio | Without Mortgage | With Mortgage |
| Less than 2.0x | 4,160 (25.1%) | 118,791 (235.6%) |
| 2.0x to 2.9x | 3,042 (18.4%) | 11,960 (23.7%) |
| 3.0x to 3.9x | 3,056 (18.5%) | 15,388 (30.5%) |
| 4.0x or more | 6,211 (37.5%) | 9,103 (18.0%) |
| Total | 16,556 (100.0%) | 50,432 (100.0%) |
Real Estate Taxes by Mortgage Status in Chesapeake
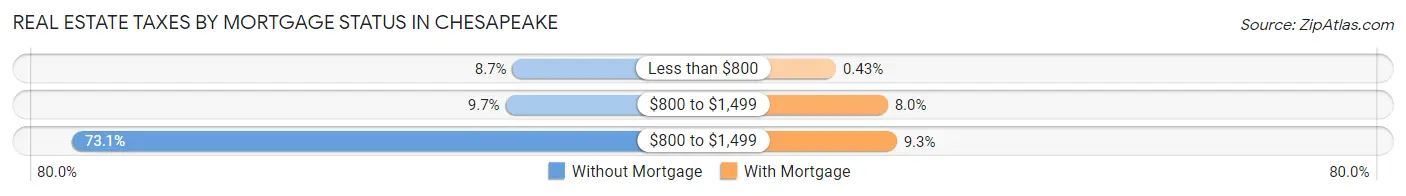
| Property Taxes | Without Mortgage | With Mortgage |
| Less than $800 | 1,444 (8.7%) | 218 (0.4%) |
| $800 to $1,499 | 1,613 (9.7%) | 4,027 (8.0%) |
| $800 to $1,499 | 12,101 (73.1%) | 4,688 (9.3%) |
| Total | 16,556 (100.0%) | 50,432 (100.0%) |
Health & Disability in Chesapeake
Health Insurance Coverage by Age in Chesapeake
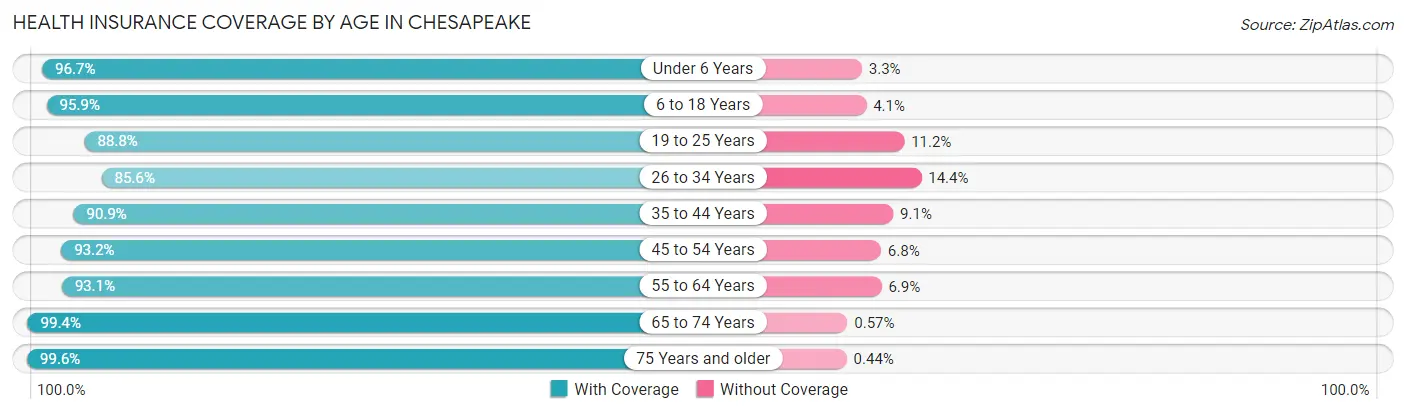
| Age Bracket | With Coverage | Without Coverage |
| Under 6 Years | 17,870 (96.7%) | 605 (3.3%) |
| 6 to 18 Years | 42,785 (95.9%) | 1,825 (4.1%) |
| 19 to 25 Years | 17,036 (88.8%) | 2,142 (11.2%) |
| 26 to 34 Years | 23,518 (85.6%) | 3,943 (14.4%) |
| 35 to 44 Years | 28,976 (90.9%) | 2,906 (9.1%) |
| 45 to 54 Years | 27,885 (93.2%) | 2,045 (6.8%) |
| 55 to 64 Years | 29,653 (93.1%) | 2,209 (6.9%) |
| 65 to 74 Years | 21,102 (99.4%) | 122 (0.6%) |
| 75 Years and older | 12,340 (99.6%) | 54 (0.4%) |
| Total | 221,165 (93.3%) | 15,851 (6.7%) |
Health Insurance Coverage by Citizenship Status in Chesapeake
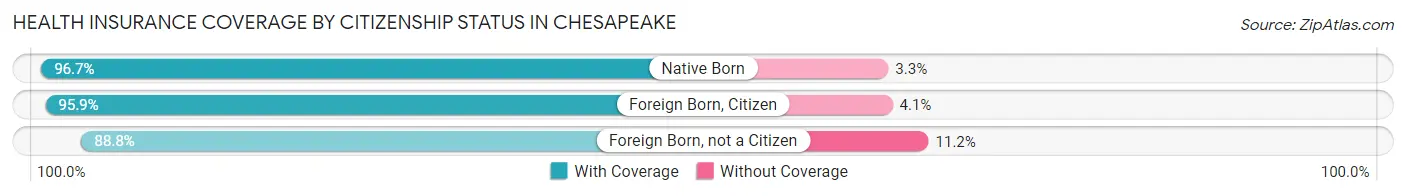
| Citizenship Status | With Coverage | Without Coverage |
| Native Born | 17,870 (96.7%) | 605 (3.3%) |
| Foreign Born, Citizen | 42,785 (95.9%) | 1,825 (4.1%) |
| Foreign Born, not a Citizen | 17,036 (88.8%) | 2,142 (11.2%) |
Health Insurance Coverage by Household Income in Chesapeake
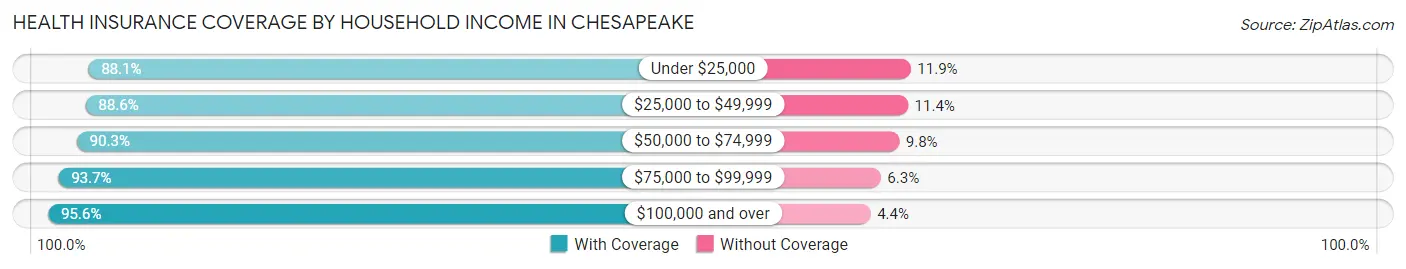
| Household Income | With Coverage | Without Coverage |
| Under $25,000 | 14,976 (88.1%) | 2,027 (11.9%) |
| $25,000 to $49,999 | 23,182 (88.6%) | 2,982 (11.4%) |
| $50,000 to $74,999 | 29,959 (90.2%) | 3,235 (9.8%) |
| $75,000 to $99,999 | 28,022 (93.7%) | 1,885 (6.3%) |
| $100,000 and over | 124,701 (95.6%) | 5,720 (4.4%) |
Public vs Private Health Insurance Coverage by Age in Chesapeake
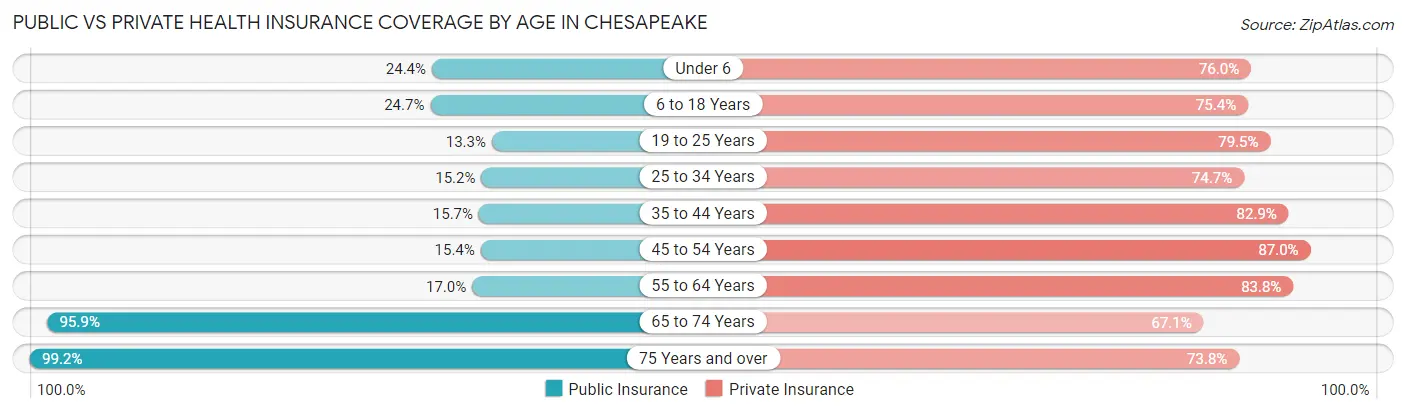
| Age Bracket | Public Insurance | Private Insurance |
| Under 6 | 4,510 (24.4%) | 14,032 (75.9%) |
| 6 to 18 Years | 11,022 (24.7%) | 33,632 (75.4%) |
| 19 to 25 Years | 2,548 (13.3%) | 15,255 (79.5%) |
| 25 to 34 Years | 4,182 (15.2%) | 20,504 (74.7%) |
| 35 to 44 Years | 5,000 (15.7%) | 26,443 (82.9%) |
| 45 to 54 Years | 4,596 (15.4%) | 26,034 (87.0%) |
| 55 to 64 Years | 5,402 (17.0%) | 26,694 (83.8%) |
| 65 to 74 Years | 20,361 (95.9%) | 14,250 (67.1%) |
| 75 Years and over | 12,290 (99.2%) | 9,140 (73.8%) |
| Total | 69,911 (29.5%) | 185,984 (78.5%) |
Disability Status by Sex by Age in Chesapeake
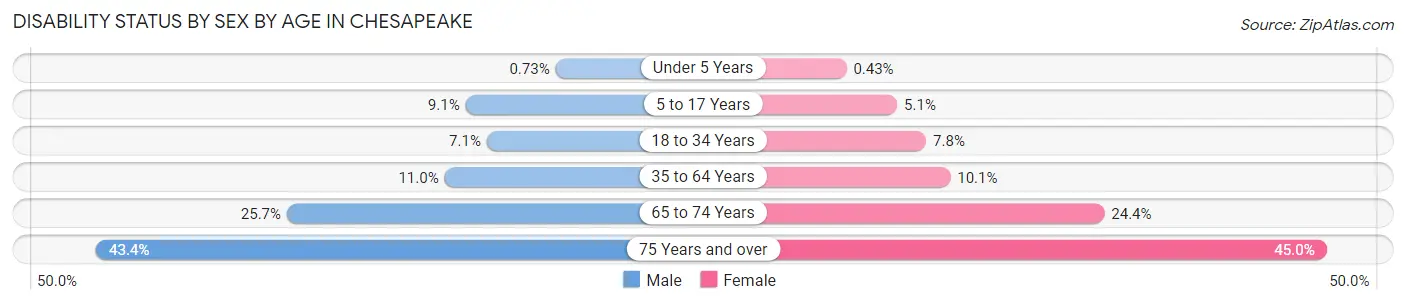
| Age Bracket | Male | Female |
| Under 5 Years | 57 (0.7%) | 32 (0.4%) |
| 5 to 17 Years | 2,084 (9.1%) | 1,125 (5.1%) |
| 18 to 34 Years | 1,686 (7.1%) | 2,030 (7.8%) |
| 35 to 64 Years | 4,824 (11.0%) | 5,029 (10.1%) |
| 65 to 74 Years | 2,456 (25.7%) | 2,840 (24.4%) |
| 75 Years and over | 2,142 (43.4%) | 3,353 (45.0%) |
Disability Class by Sex by Age in Chesapeake
Disability Class: Hearing Difficulty
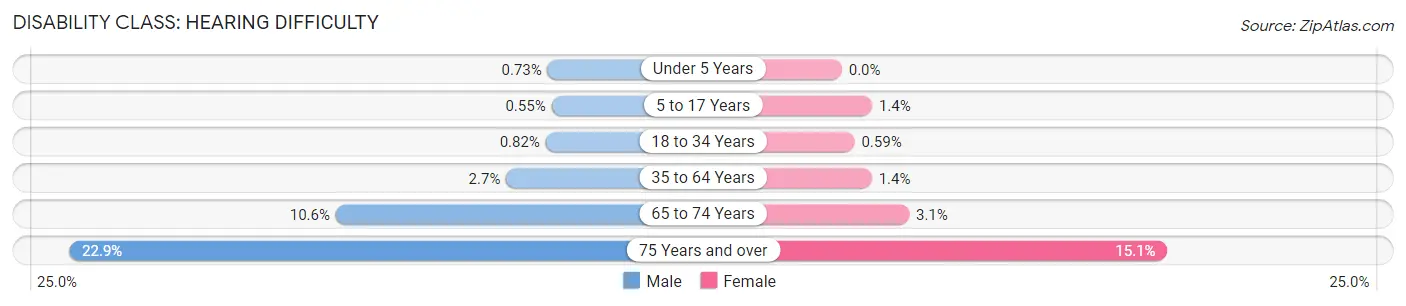
| Age Bracket | Male | Female |
| Under 5 Years | 57 (0.7%) | 0 (0.0%) |
| 5 to 17 Years | 126 (0.5%) | 306 (1.4%) |
| 18 to 34 Years | 194 (0.8%) | 153 (0.6%) |
| 35 to 64 Years | 1,161 (2.6%) | 694 (1.4%) |
| 65 to 74 Years | 1,011 (10.6%) | 364 (3.1%) |
| 75 Years and over | 1,133 (22.9%) | 1,126 (15.1%) |
Disability Class: Vision Difficulty
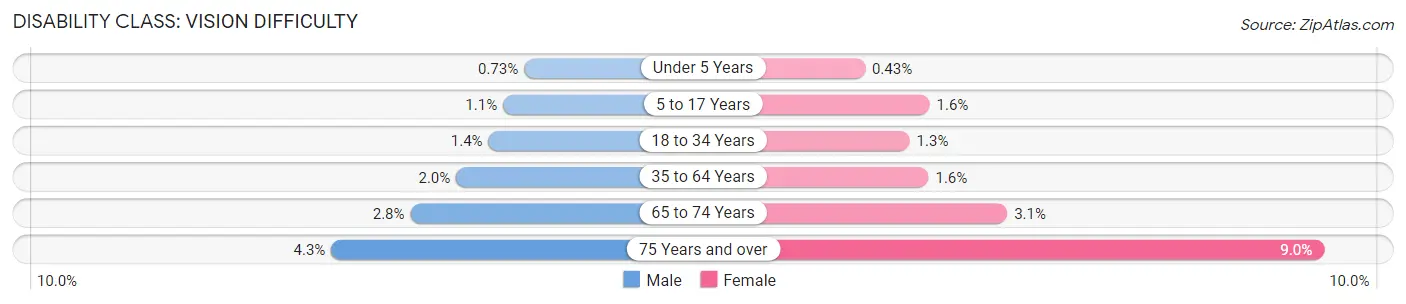
| Age Bracket | Male | Female |
| Under 5 Years | 57 (0.7%) | 32 (0.4%) |
| 5 to 17 Years | 258 (1.1%) | 358 (1.6%) |
| 18 to 34 Years | 330 (1.4%) | 327 (1.3%) |
| 35 to 64 Years | 870 (2.0%) | 805 (1.6%) |
| 65 to 74 Years | 272 (2.8%) | 358 (3.1%) |
| 75 Years and over | 213 (4.3%) | 667 (8.9%) |
Disability Class: Cognitive Difficulty
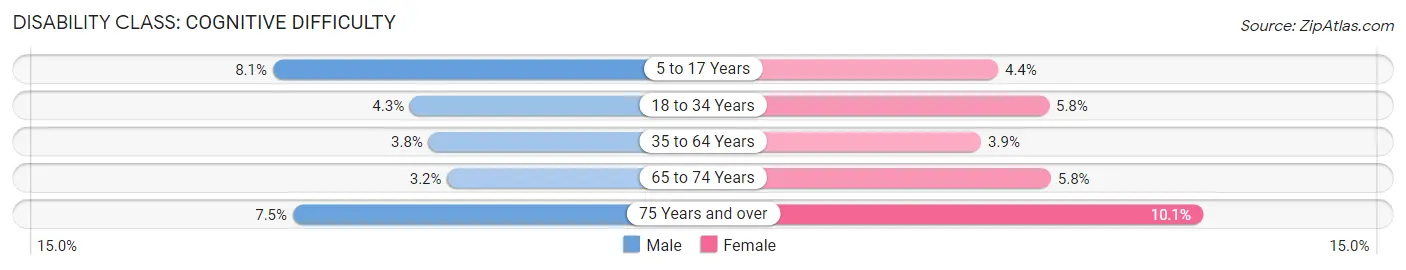
| Age Bracket | Male | Female |
| 5 to 17 Years | 1,857 (8.1%) | 952 (4.3%) |
| 18 to 34 Years | 1,014 (4.3%) | 1,495 (5.8%) |
| 35 to 64 Years | 1,639 (3.7%) | 1,936 (3.9%) |
| 65 to 74 Years | 309 (3.2%) | 678 (5.8%) |
| 75 Years and over | 372 (7.5%) | 749 (10.1%) |
Disability Class: Ambulatory Difficulty
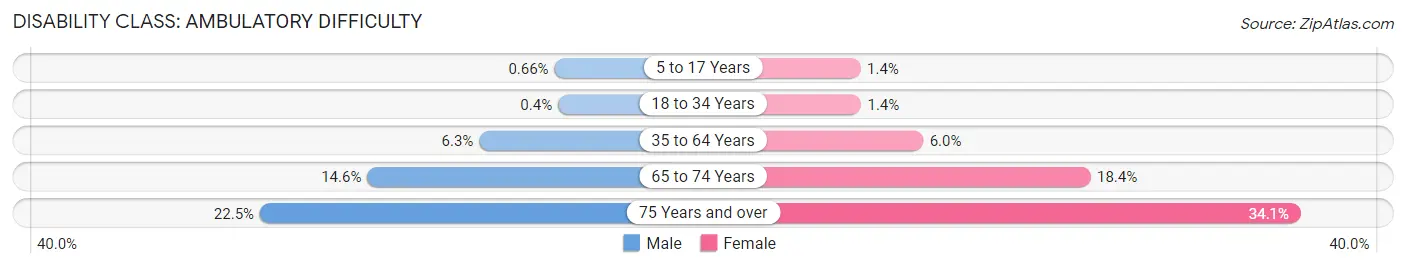
| Age Bracket | Male | Female |
| 5 to 17 Years | 151 (0.7%) | 298 (1.4%) |
| 18 to 34 Years | 96 (0.4%) | 360 (1.4%) |
| 35 to 64 Years | 2,735 (6.2%) | 3,003 (6.0%) |
| 65 to 74 Years | 1,394 (14.6%) | 2,147 (18.4%) |
| 75 Years and over | 1,113 (22.5%) | 2,540 (34.1%) |
Disability Class: Self-Care Difficulty
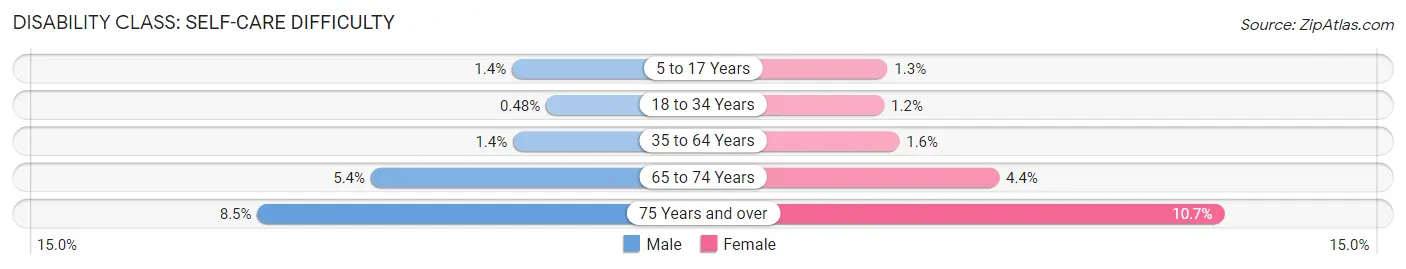
| Age Bracket | Male | Female |
| 5 to 17 Years | 329 (1.4%) | 278 (1.3%) |
| 18 to 34 Years | 114 (0.5%) | 305 (1.2%) |
| 35 to 64 Years | 613 (1.4%) | 801 (1.6%) |
| 65 to 74 Years | 513 (5.4%) | 510 (4.4%) |
| 75 Years and over | 421 (8.5%) | 794 (10.6%) |
Technology Access in Chesapeake
Computing Device Access in Chesapeake
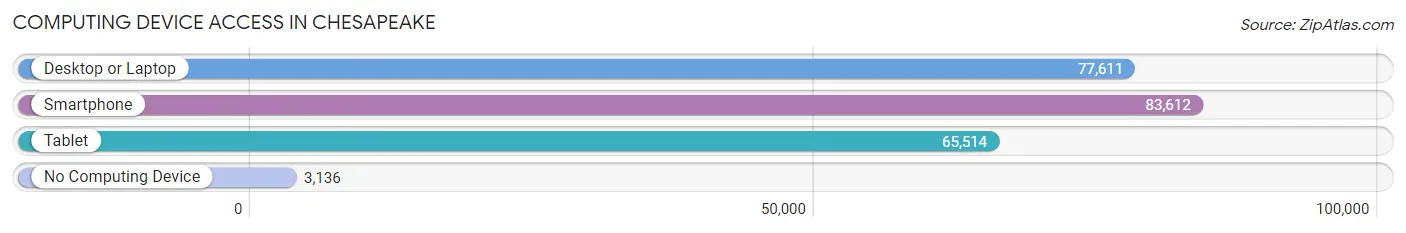
| Device Type | # Households | % Households |
| Desktop or Laptop | 77,611 | 84.9% |
| Smartphone | 83,612 | 91.5% |
| Tablet | 65,514 | 71.7% |
| No Computing Device | 3,136 | 3.4% |
| Total | 91,368 | 100.0% |
Internet Access in Chesapeake
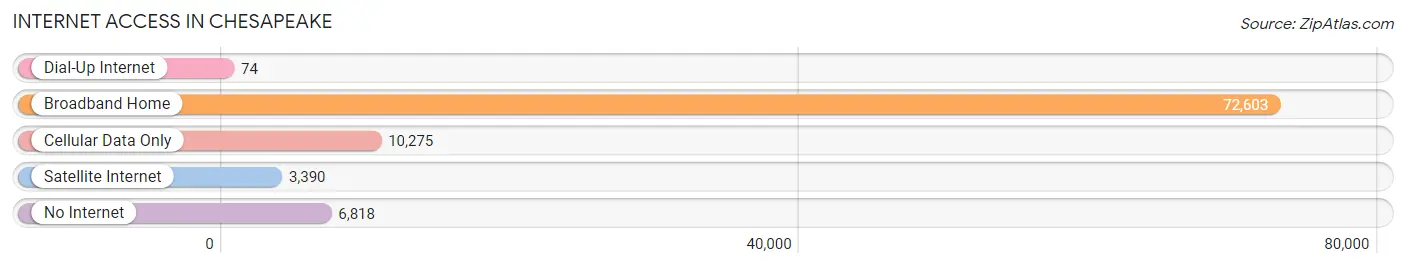
| Internet Type | # Households | % Households |
| Dial-Up Internet | 74 | 0.1% |
| Broadband Home | 72,603 | 79.5% |
| Cellular Data Only | 10,275 | 11.3% |
| Satellite Internet | 3,390 | 3.7% |
| No Internet | 6,818 | 7.5% |
| Total | 91,368 | 100.0% |
Chesapeake Summary
Chesapeake, Virginia is a city located in the Hampton Roads region of the Commonwealth of Virginia. It is the second-largest city in the state, with a population of 222,209 as of the 2010 census. Chesapeake is located in the southeastern corner of Virginia, just south of Norfolk and north of Virginia Beach. It is bordered by the Elizabeth River to the west, the Great Dismal Swamp National Wildlife Refuge to the north, and the Atlantic Ocean to the east.
History
The area that is now Chesapeake was first settled in 1620 by English colonists. The area was originally known as South Norfolk, and was part of the Elizabeth City Shire. In 1790, the area was officially incorporated as the City of South Norfolk. In 1963, the city merged with the neighboring City of Norfolk, and the name was changed to Chesapeake.
Geography
Chesapeake is located in the southeastern corner of Virginia, just south of Norfolk and north of Virginia Beach. It is bordered by the Elizabeth River to the west, the Great Dismal Swamp National Wildlife Refuge to the north, and the Atlantic Ocean to the east. The city covers an area of 351 square miles, making it the largest city in Virginia by land area.
The city is divided into seven boroughs: Great Bridge, Deep Creek, Western Branch, Hickory, Indian River, South Norfolk, and Greenbrier. The city is also home to several large lakes, including Lake Drummond, Lake Gaston, and Lake Meade.
Economy
Chesapeake is home to a diverse economy, with a variety of industries represented. The city is home to several large employers, including the U.S. Navy, the U.S. Coast Guard, and the U.S. Department of Defense. The city is also home to several large corporations, including Dollar Tree, Dollar General, and Dollar Tree Stores.
The city is also home to several large retail centers, including Chesapeake Square Mall, Greenbrier Mall, and Chesapeake Town Center. The city is also home to several large industrial parks, including the Chesapeake Industrial Park, the Chesapeake Commerce Center, and the Chesapeake Technology Park.
Demographics
As of the 2010 census, the population of Chesapeake was 222,209. The racial makeup of the city was 68.3% White, 24.2% African American, 0.5% Native American, 2.3% Asian, 0.1% Pacific Islander, 2.2% from other races, and 2.4% from two or more races. Hispanic or Latino of any race were 5.2% of the population.
The median income for a household in the city was $54,945, and the median income for a family was $63,945. The per capita income for the city was $25,945. About 8.7% of families and 11.2% of the population were below the poverty line, including 15.2% of those under age 18 and 8.2% of those age 65 or over.
Common Questions
What is Per Capita Income in Chesapeake?
Per Capita income in Chesapeake is $42,753.
What is the Median Family Income in Chesapeake?
Median Family Income in Chesapeake is $109,923.
What is the Median Household income in Chesapeake?
Median Household Income in Chesapeake is $92,703.
What is Income or Wage Gap in Chesapeake?
Income or Wage Gap in Chesapeake is 35.2%.
Women in Chesapeake earn 64.8 cents for every dollar earned by a man.
What is Family Income Deficit in Chesapeake?
Family Income Deficit in Chesapeake is $11,162.
Families that are below poverty line in Chesapeake earn $11,162 less on average than the poverty threshold level.
What is Inequality or Gini Index in Chesapeake?
Inequality or Gini Index in Chesapeake is 0.42.
What is the Total Population of Chesapeake?
Total Population of Chesapeake is 249,377.
What is the Total Male Population of Chesapeake?
Total Male Population of Chesapeake is 122,672.
What is the Total Female Population of Chesapeake?
Total Female Population of Chesapeake is 126,705.
What is the Ratio of Males per 100 Females in Chesapeake?
There are 96.82 Males per 100 Females in Chesapeake.
What is the Ratio of Females per 100 Males in Chesapeake?
There are 103.29 Females per 100 Males in Chesapeake.
What is the Median Population Age in Chesapeake?
Median Population Age in Chesapeake is 37.4 Years.
What is the Average Family Size in Chesapeake
Average Family Size in Chesapeake is 3.1 People.
What is the Average Household Size in Chesapeake
Average Household Size in Chesapeake is 2.7 People.
How Large is the Labor Force in Chesapeake?
There are 132,139 People in the Labor Forcein in Chesapeake.
What is the Percentage of People in the Labor Force in Chesapeake?
67.2% of People are in the Labor Force in Chesapeake.
What is the Unemployment Rate in Chesapeake?
Unemployment Rate in Chesapeake is 5.0%.