Grand Prairie, TX Map & Demographics
Grand Prairie Map
Grand Prairie Overview
$32,444
PER CAPITA INCOME
$88,342
AVG FAMILY INCOME
$76,626
AVG HOUSEHOLD INCOME
31.6%
WAGE / INCOME GAP [ % ]
68.4¢/ $1
WAGE / INCOME GAP [ $ ]
$10,362
FAMILY INCOME DEFICIT
0.41
INEQUALITY / GINI INDEX
197,279
TOTAL POPULATION
96,719
MALE POPULATION
100,560
FEMALE POPULATION
96.18
MALES / 100 FEMALES
103.97
FEMALES / 100 MALES
33.7
MEDIAN AGE
3.6
AVG FAMILY SIZE
3.0
AVG HOUSEHOLD SIZE
105,197
LABOR FORCE [ PEOPLE ]
70.0%
PERCENT IN LABOR FORCE
5.0%
UNEMPLOYMENT RATE
Income in Grand Prairie
Income Overview in Grand Prairie
Per Capita Income in Grand Prairie is $32,444, while median incomes of families and households are $88,342 and $76,626 respectively.
| Characteristic | Number | Measure |
| Per Capita Income | 197,279 | $32,444 |
| Median Family Income | 47,778 | $88,342 |
| Mean Family Income | 47,778 | $105,808 |
| Median Household Income | 65,740 | $76,626 |
| Mean Household Income | 65,740 | $95,155 |
| Income Deficit | 47,778 | $10,362 |
| Wage / Income Gap (%) | 197,279 | 31.55% |
| Wage / Income Gap ($) | 197,279 | 68.45¢ per $1 |
| Gini / Inequality Index | 197,279 | 0.41 |
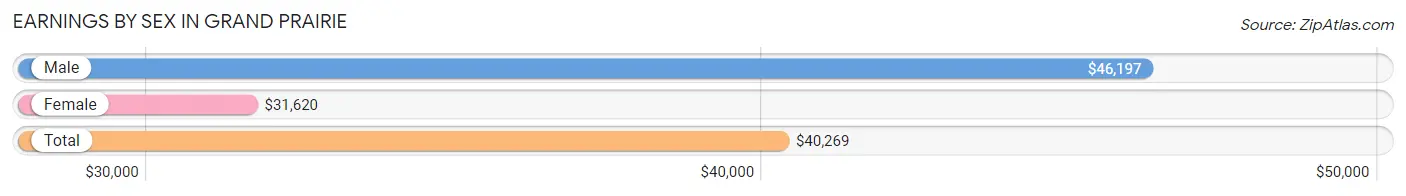
Earnings by Sex in Grand Prairie
Average Earnings in Grand Prairie are $40,269, $46,197 for men and $31,620 for women, a difference of 31.6%.
| Sex | Number | Average Earnings |
| Male | 57,377 (52.9%) | $46,197 |
| Female | 51,093 (47.1%) | $31,620 |
| Total | 108,470 (100.0%) | $40,269 |
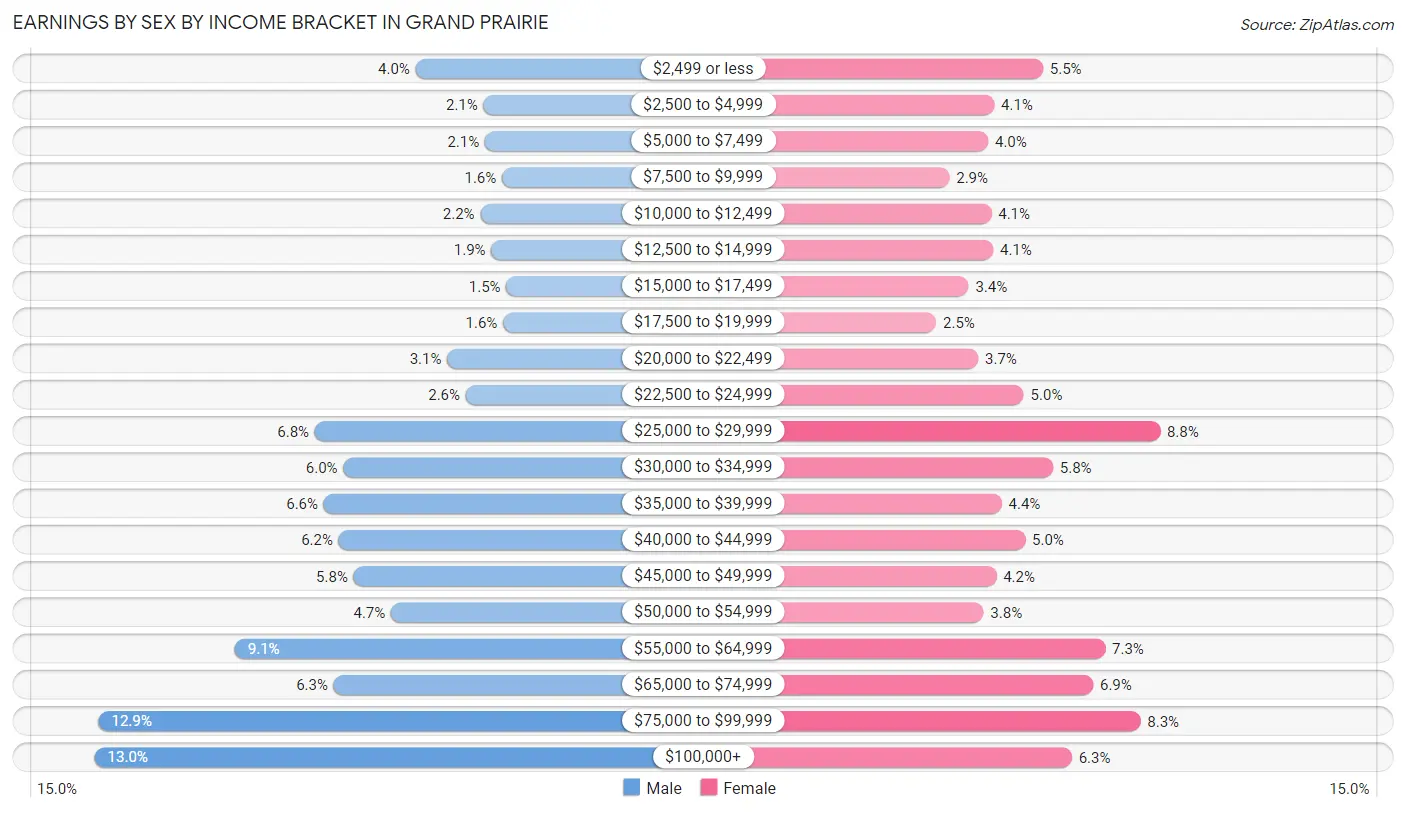
Earnings by Sex by Income Bracket in Grand Prairie
The most common earnings brackets in Grand Prairie are $100,000+ for men (7,474 | 13.0%) and $25,000 to $29,999 for women (4,495 | 8.8%).
| Income | Male | Female |
| $2,499 or less | 2,300 (4.0%) | 2,814 (5.5%) |
| $2,500 to $4,999 | 1,205 (2.1%) | 2,114 (4.1%) |
| $5,000 to $7,499 | 1,184 (2.1%) | 2,026 (4.0%) |
| $7,500 to $9,999 | 906 (1.6%) | 1,470 (2.9%) |
| $10,000 to $12,499 | 1,258 (2.2%) | 2,076 (4.1%) |
| $12,500 to $14,999 | 1,081 (1.9%) | 2,100 (4.1%) |
| $15,000 to $17,499 | 840 (1.5%) | 1,749 (3.4%) |
| $17,500 to $19,999 | 890 (1.5%) | 1,284 (2.5%) |
| $20,000 to $22,499 | 1,790 (3.1%) | 1,887 (3.7%) |
| $22,500 to $24,999 | 1,491 (2.6%) | 2,537 (5.0%) |
| $25,000 to $29,999 | 3,925 (6.8%) | 4,495 (8.8%) |
| $30,000 to $34,999 | 3,464 (6.0%) | 2,960 (5.8%) |
| $35,000 to $39,999 | 3,780 (6.6%) | 2,223 (4.3%) |
| $40,000 to $44,999 | 3,542 (6.2%) | 2,561 (5.0%) |
| $45,000 to $49,999 | 3,301 (5.8%) | 2,145 (4.2%) |
| $50,000 to $54,999 | 2,698 (4.7%) | 1,962 (3.8%) |
| $55,000 to $64,999 | 5,215 (9.1%) | 3,709 (7.3%) |
| $65,000 to $74,999 | 3,621 (6.3%) | 3,535 (6.9%) |
| $75,000 to $99,999 | 7,412 (12.9%) | 4,217 (8.3%) |
| $100,000+ | 7,474 (13.0%) | 3,229 (6.3%) |
| Total | 57,377 (100.0%) | 51,093 (100.0%) |
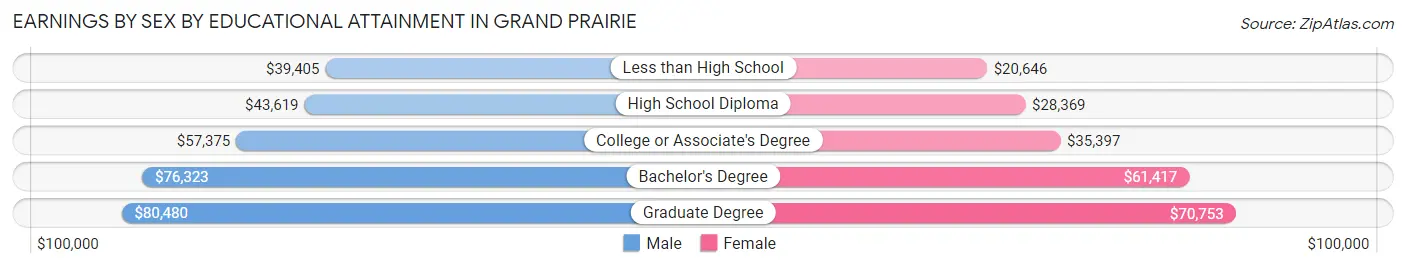
Earnings by Sex by Educational Attainment in Grand Prairie
Average earnings in Grand Prairie are $52,861 for men and $38,506 for women, a difference of 27.2%. Men with an educational attainment of graduate degree enjoy the highest average annual earnings of $80,480, while those with less than high school education earn the least with $39,405. Women with an educational attainment of graduate degree earn the most with the average annual earnings of $70,753, while those with less than high school education have the smallest earnings of $20,646.
| Educational Attainment | Male Income | Female Income |
| Less than High School | $39,405 | $20,646 |
| High School Diploma | $43,619 | $28,369 |
| College or Associate's Degree | $57,375 | $35,397 |
| Bachelor's Degree | $76,323 | $61,417 |
| Graduate Degree | $80,480 | $70,753 |
| Total | $52,861 | $38,506 |
Family Income in Grand Prairie
Family Income Brackets in Grand Prairie
According to the Grand Prairie family income data, there are 10,941 families falling into the $100,000 to $149,999 income range, which is the most common income bracket and makes up 22.9% of all families. Conversely, the less than $10,000 income bracket is the least frequent group with only 1,051 families (2.2%) belonging to this category.
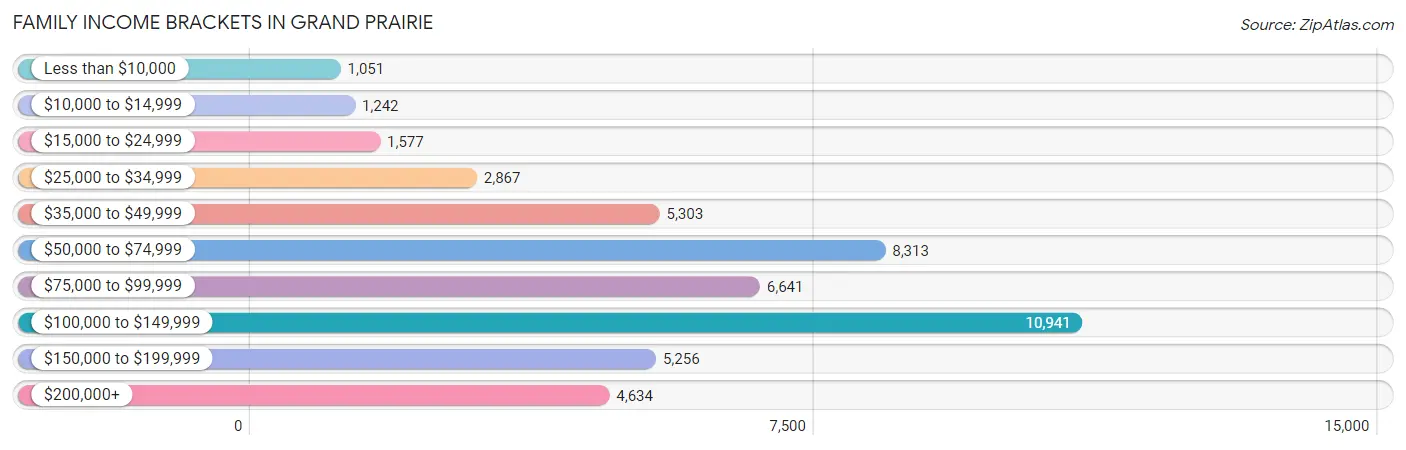
| Income Bracket | # Families | % Families |
| Less than $10,000 | 1,051 | 2.2% |
| $10,000 to $14,999 | 1,242 | 2.6% |
| $15,000 to $24,999 | 1,577 | 3.3% |
| $25,000 to $34,999 | 2,867 | 6.0% |
| $35,000 to $49,999 | 5,303 | 11.1% |
| $50,000 to $74,999 | 8,313 | 17.4% |
| $75,000 to $99,999 | 6,641 | 13.9% |
| $100,000 to $149,999 | 10,941 | 22.9% |
| $150,000 to $199,999 | 5,256 | 11.0% |
| $200,000+ | 4,634 | 9.7% |
Family Income by Famaliy Size in Grand Prairie
7+ person families (1,359 | 2.8%) account for the highest median family income in Grand Prairie with $121,671 per family, while 2-person families (17,090 | 35.8%) have the highest median income of $35,946 per family member.
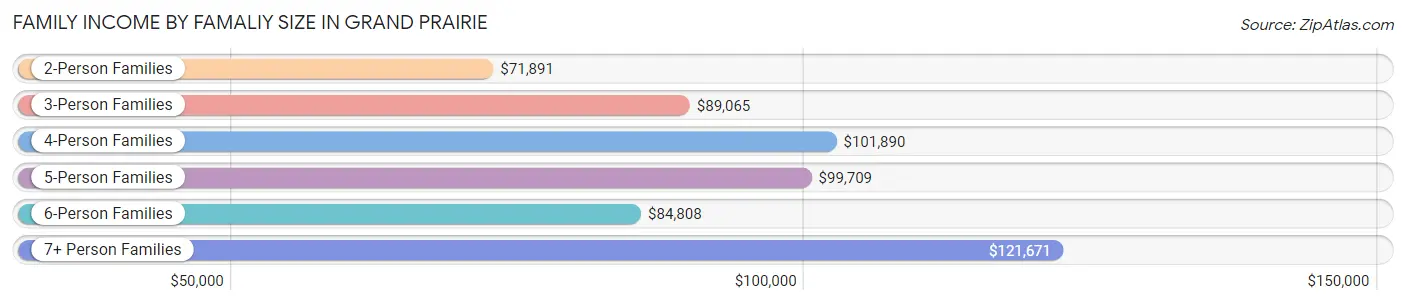
| Income Bracket | # Families | Median Income |
| 2-Person Families | 17,090 (35.8%) | $71,891 |
| 3-Person Families | 10,828 (22.7%) | $89,065 |
| 4-Person Families | 10,020 (21.0%) | $101,890 |
| 5-Person Families | 5,837 (12.2%) | $99,709 |
| 6-Person Families | 2,644 (5.5%) | $84,808 |
| 7+ Person Families | 1,359 (2.8%) | $121,671 |
| Total | 47,778 (100.0%) | $88,342 |
Family Income by Number of Earners in Grand Prairie
The median family income in Grand Prairie is $88,342, with families comprising 3+ earners (8,991) having the highest median family income of $128,109, while families with no earners (3,600) have the lowest median family income of $36,019, accounting for 18.8% and 7.5% of families, respectively.
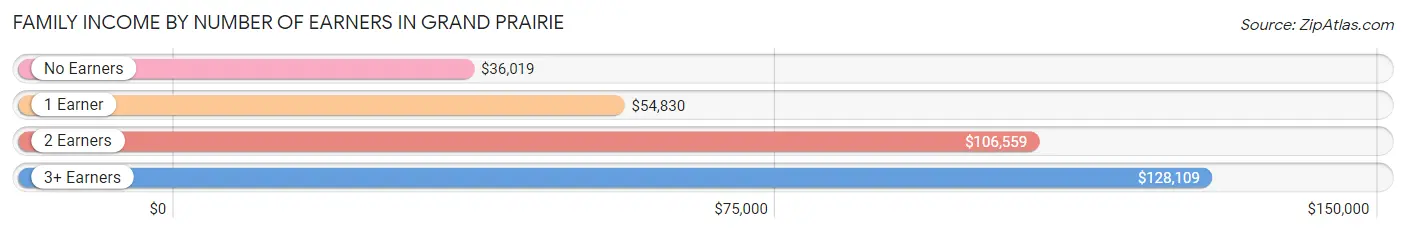
| Number of Earners | # Families | Median Income |
| No Earners | 3,600 (7.5%) | $36,019 |
| 1 Earner | 14,882 (31.1%) | $54,830 |
| 2 Earners | 20,305 (42.5%) | $106,559 |
| 3+ Earners | 8,991 (18.8%) | $128,109 |
| Total | 47,778 (100.0%) | $88,342 |
Household Income in Grand Prairie
Household Income Brackets in Grand Prairie
With 13,082 households falling in the category, the $100,000 to $149,999 income range is the most frequent in Grand Prairie, accounting for 19.9% of all households. In contrast, only 1,775 households (2.7%) fall into the less than $10,000 income bracket, making it the least populous group.
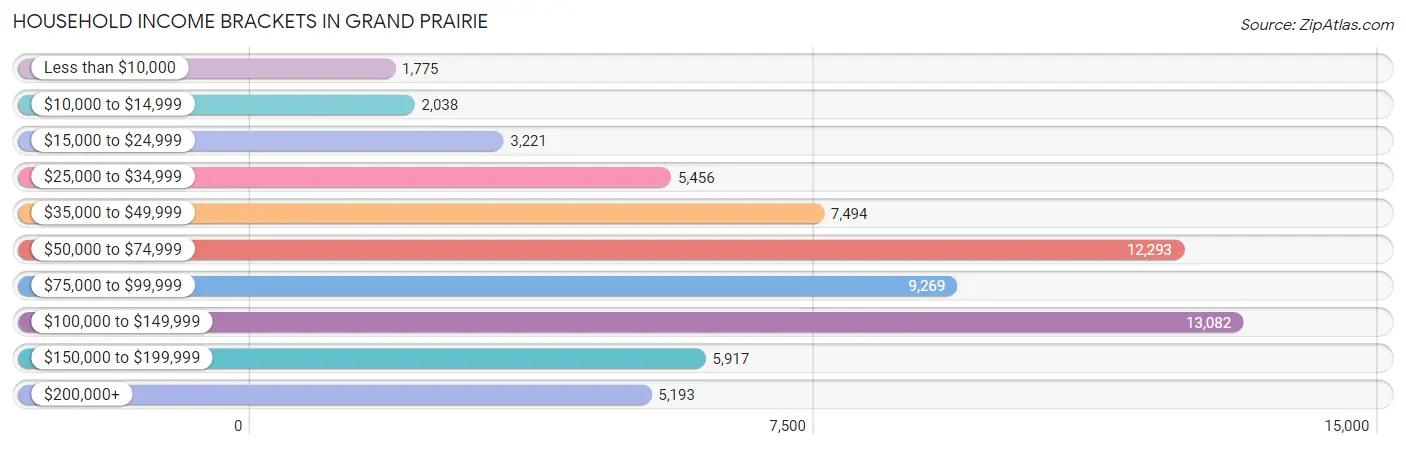
| Income Bracket | # Households | % Households |
| Less than $10,000 | 1,775 | 2.7% |
| $10,000 to $14,999 | 2,038 | 3.1% |
| $15,000 to $24,999 | 3,221 | 4.9% |
| $25,000 to $34,999 | 5,456 | 8.3% |
| $35,000 to $49,999 | 7,494 | 11.4% |
| $50,000 to $74,999 | 12,293 | 18.7% |
| $75,000 to $99,999 | 9,269 | 14.1% |
| $100,000 to $149,999 | 13,082 | 19.9% |
| $150,000 to $199,999 | 5,917 | 9.0% |
| $200,000+ | 5,193 | 7.9% |
Household Income by Householder Age in Grand Prairie
The median household income in Grand Prairie is $76,626, with the highest median household income of $94,151 found in the 45 to 64 years age bracket for the primary householder. A total of 26,054 households (39.6%) fall into this category. Meanwhile, the 15 to 24 years age bracket for the primary householder has the lowest median household income of $40,346, with 2,883 households (4.4%) in this group.
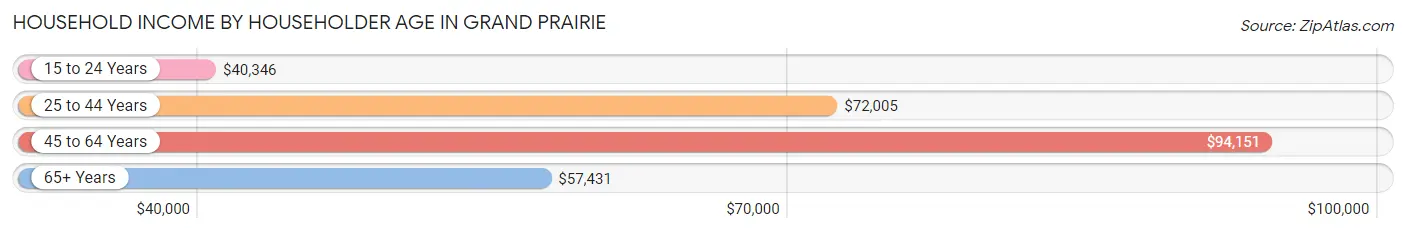
| Income Bracket | # Households | Median Income |
| 15 to 24 Years | 2,883 (4.4%) | $40,346 |
| 25 to 44 Years | 25,760 (39.2%) | $72,005 |
| 45 to 64 Years | 26,054 (39.6%) | $94,151 |
| 65+ Years | 11,043 (16.8%) | $57,431 |
| Total | 65,740 (100.0%) | $76,626 |
Poverty in Grand Prairie
Income Below Poverty by Sex and Age in Grand Prairie
With 9.8% poverty level for males and 13.1% for females among the residents of Grand Prairie, under 5 year old males and 12 to 14 year old females are the most vulnerable to poverty, with 1,325 males (20.8%) and 991 females (22.8%) in their respective age groups living below the poverty level.
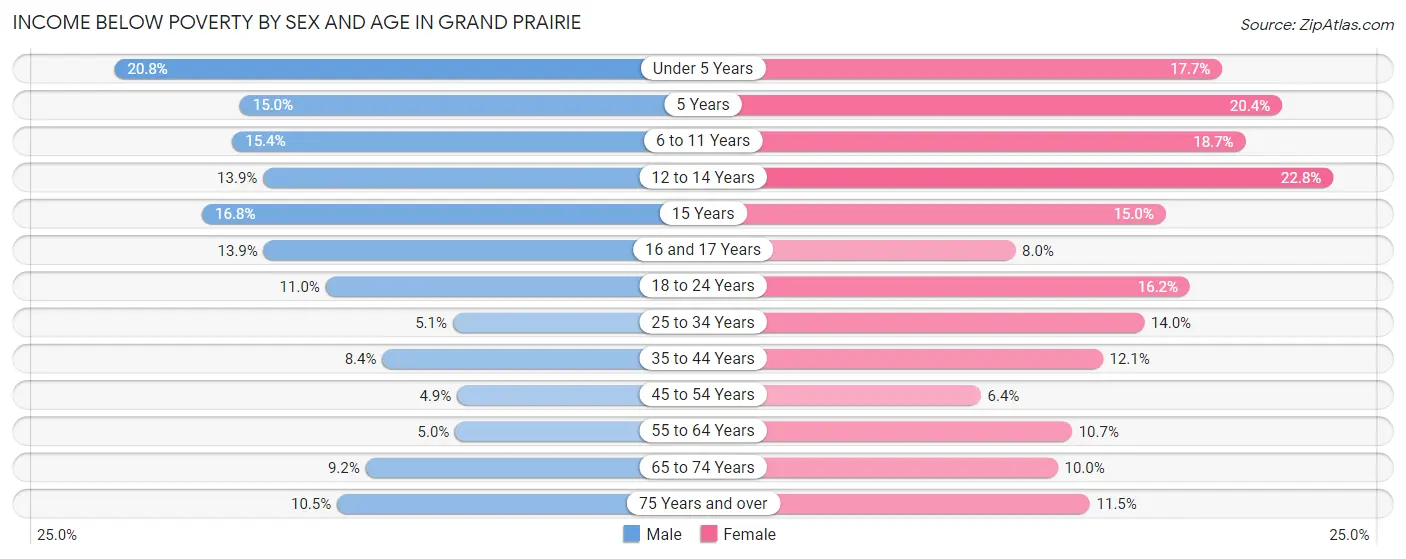
| Age Bracket | Male | Female |
| Under 5 Years | 1,325 (20.8%) | 996 (17.6%) |
| 5 Years | 177 (15.0%) | 409 (20.4%) |
| 6 to 11 Years | 1,443 (15.4%) | 1,657 (18.7%) |
| 12 to 14 Years | 752 (13.9%) | 991 (22.8%) |
| 15 Years | 304 (16.8%) | 238 (15.0%) |
| 16 and 17 Years | 472 (13.9%) | 329 (8.0%) |
| 18 to 24 Years | 1,096 (11.0%) | 1,525 (16.2%) |
| 25 to 34 Years | 684 (5.1%) | 2,050 (14.0%) |
| 35 to 44 Years | 1,126 (8.4%) | 1,730 (12.1%) |
| 45 to 54 Years | 614 (4.9%) | 829 (6.4%) |
| 55 to 64 Years | 539 (5.0%) | 1,209 (10.7%) |
| 65 to 74 Years | 542 (9.2%) | 736 (10.0%) |
| 75 Years and over | 324 (10.5%) | 430 (11.5%) |
| Total | 9,398 (9.8%) | 13,129 (13.1%) |
Income Above Poverty by Sex and Age in Grand Prairie
According to the poverty statistics in Grand Prairie, males aged 45 to 54 years and females aged 45 to 54 years are the age groups that are most secure financially, with 95.1% of males and 93.6% of females in these age groups living above the poverty line.
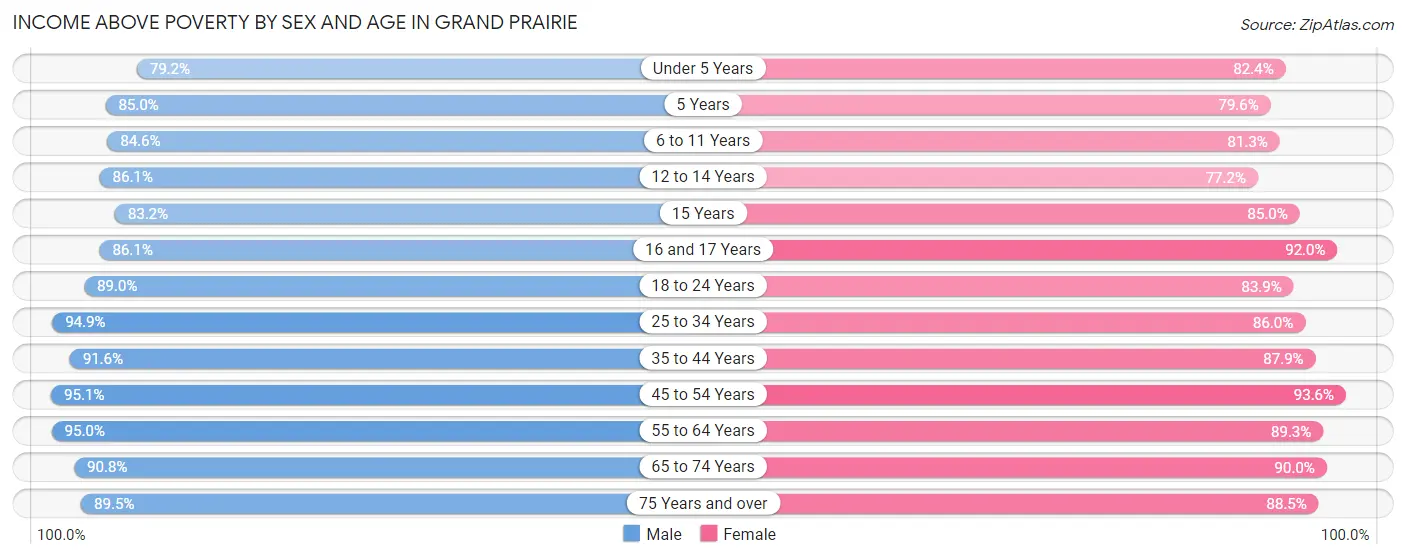
| Age Bracket | Male | Female |
| Under 5 Years | 5,036 (79.2%) | 4,648 (82.4%) |
| 5 Years | 1,002 (85.0%) | 1,593 (79.6%) |
| 6 to 11 Years | 7,954 (84.6%) | 7,191 (81.3%) |
| 12 to 14 Years | 4,645 (86.1%) | 3,355 (77.2%) |
| 15 Years | 1,510 (83.2%) | 1,345 (85.0%) |
| 16 and 17 Years | 2,922 (86.1%) | 3,764 (92.0%) |
| 18 to 24 Years | 8,844 (89.0%) | 7,917 (83.9%) |
| 25 to 34 Years | 12,642 (94.9%) | 12,571 (86.0%) |
| 35 to 44 Years | 12,277 (91.6%) | 12,569 (87.9%) |
| 45 to 54 Years | 11,840 (95.1%) | 12,037 (93.6%) |
| 55 to 64 Years | 10,208 (95.0%) | 10,125 (89.3%) |
| 65 to 74 Years | 5,365 (90.8%) | 6,613 (90.0%) |
| 75 Years and over | 2,761 (89.5%) | 3,308 (88.5%) |
| Total | 87,006 (90.2%) | 87,036 (86.9%) |
Income Below Poverty Among Married-Couple Families in Grand Prairie
The poverty statistics for married-couple families in Grand Prairie show that 4.8% or 1,661 of the total 34,386 families live below the poverty line. Families with 3 or 4 children have the highest poverty rate of 17.0%, comprising of 678 families. On the other hand, families with no children have the lowest poverty rate of 2.6%, which includes 455 families.
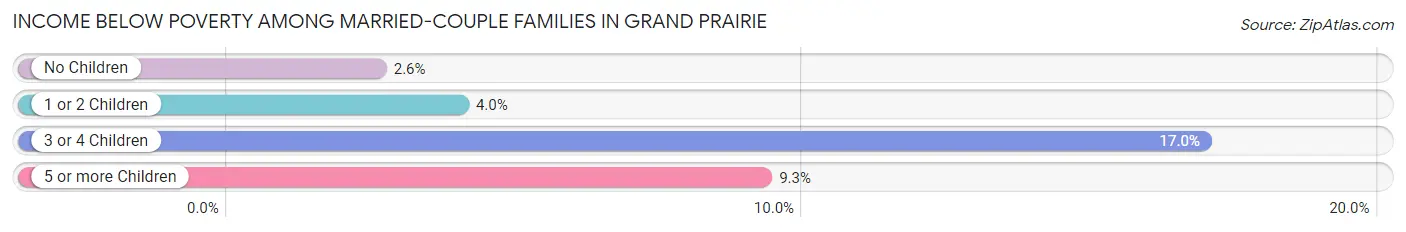
| Children | Above Poverty | Below Poverty |
| No Children | 17,130 (97.4%) | 455 (2.6%) |
| 1 or 2 Children | 12,038 (96.0%) | 504 (4.0%) |
| 3 or 4 Children | 3,323 (83.1%) | 678 (17.0%) |
| 5 or more Children | 234 (90.7%) | 24 (9.3%) |
| Total | 32,725 (95.2%) | 1,661 (4.8%) |
Income Below Poverty Among Single-Parent Households in Grand Prairie
According to the poverty data in Grand Prairie, 11.8% or 415 single-father households and 24.7% or 2,433 single-mother households are living below the poverty line. Among single-father households, those with no children have the highest poverty rate, with 260 households (16.1%) experiencing poverty. Likewise, among single-mother households, those with 5 or more children have the highest poverty rate, with 32 households (68.1%) falling below the poverty line.
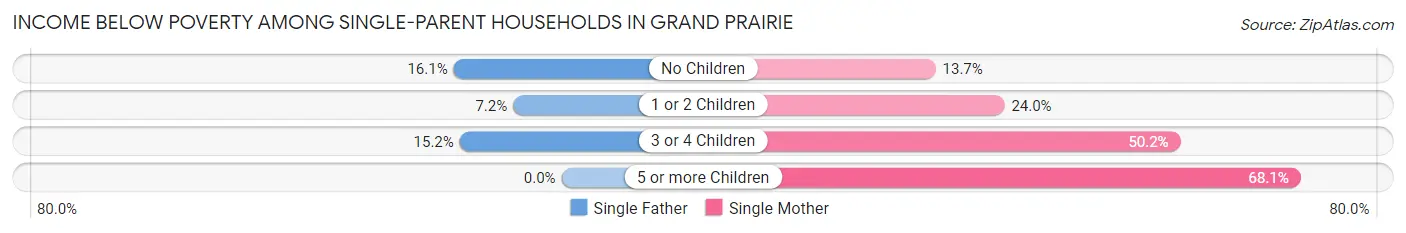
| Children | Single Father | Single Mother |
| No Children | 260 (16.1%) | 417 (13.7%) |
| 1 or 2 Children | 121 (7.2%) | 1,293 (24.0%) |
| 3 or 4 Children | 34 (15.2%) | 691 (50.2%) |
| 5 or more Children | 0 (0.0%) | 32 (68.1%) |
| Total | 415 (11.8%) | 2,433 (24.7%) |
Income Below Poverty Among Married-Couple vs Single-Parent Households in Grand Prairie
The poverty data for Grand Prairie shows that 1,661 of the married-couple family households (4.8%) and 2,848 of the single-parent households (21.3%) are living below the poverty level. Within the married-couple family households, those with 3 or 4 children have the highest poverty rate, with 678 households (17.0%) falling below the poverty line. Among the single-parent households, those with 5 or more children have the highest poverty rate, with 32 household (56.1%) living below poverty.
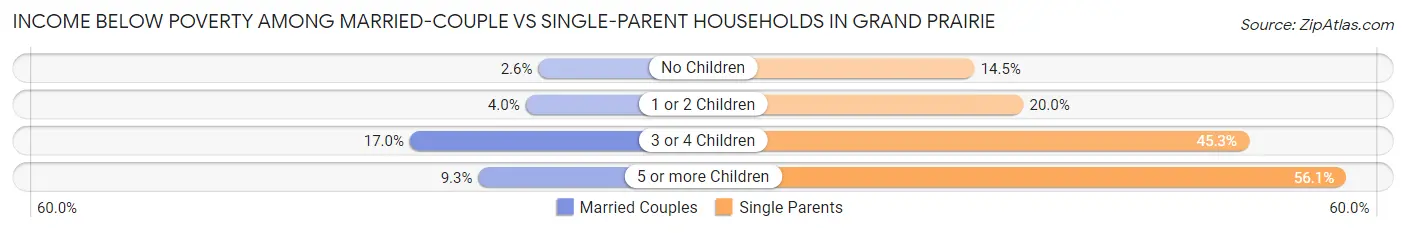
| Children | Married-Couple Families | Single-Parent Households |
| No Children | 455 (2.6%) | 677 (14.5%) |
| 1 or 2 Children | 504 (4.0%) | 1,414 (20.0%) |
| 3 or 4 Children | 678 (17.0%) | 725 (45.3%) |
| 5 or more Children | 24 (9.3%) | 32 (56.1%) |
| Total | 1,661 (4.8%) | 2,848 (21.3%) |
Race in Grand Prairie
The most populous races in Grand Prairie are Hispanic or Latino (93,780 | 47.5%), White / Caucasian (78,264 | 39.7%), and Black / African American (46,057 | 23.4%).
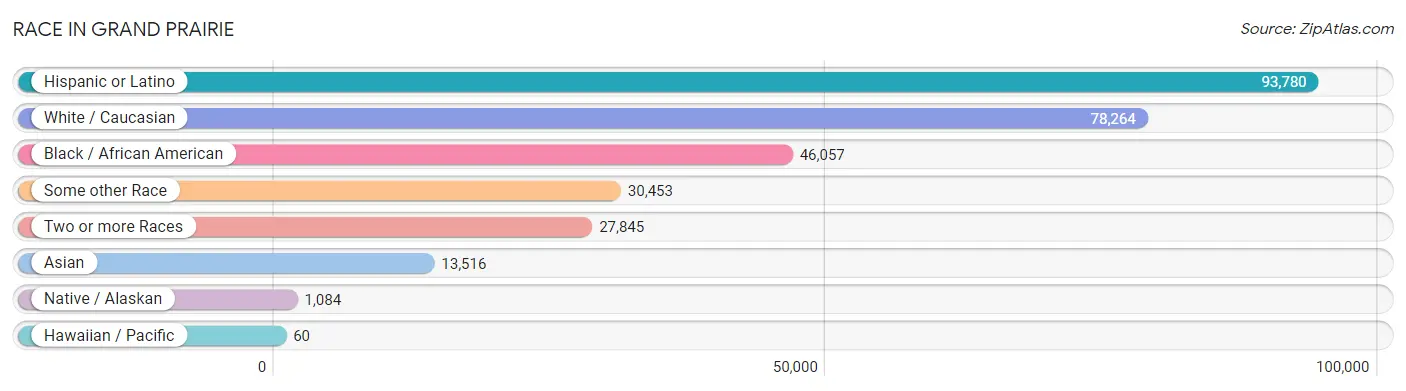
| Race | # Population | % Population |
| Asian | 13,516 | 6.9% |
| Black / African American | 46,057 | 23.4% |
| Hawaiian / Pacific | 60 | 0.0% |
| Hispanic or Latino | 93,780 | 47.5% |
| Native / Alaskan | 1,084 | 0.5% |
| White / Caucasian | 78,264 | 39.7% |
| Two or more Races | 27,845 | 14.1% |
| Some other Race | 30,453 | 15.4% |
| Total | 197,279 | 100.0% |
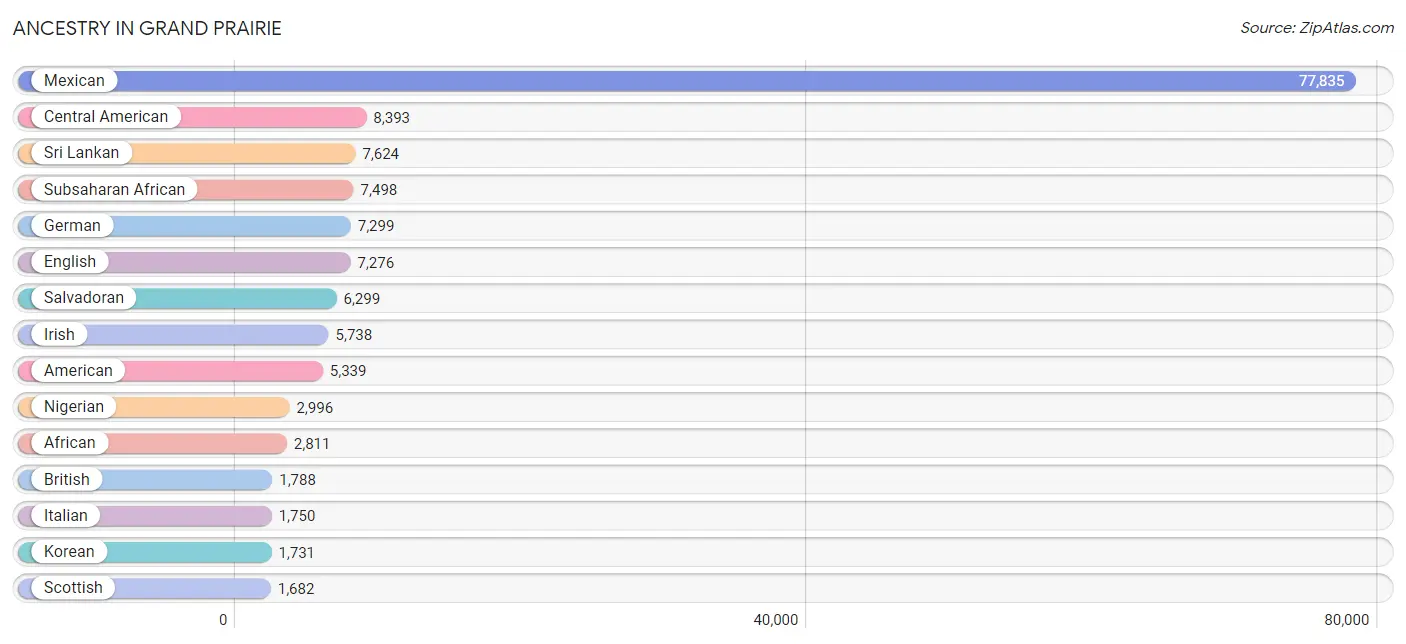
Ancestry in Grand Prairie
The most populous ancestries reported in Grand Prairie are Mexican (77,835 | 39.5%), Central American (8,393 | 4.3%), Sri Lankan (7,624 | 3.9%), Subsaharan African (7,498 | 3.8%), and German (7,299 | 3.7%), together accounting for 55.1% of all Grand Prairie residents.
| Ancestry | # Population | % Population |
| Afghan | 8 | 0.0% |
| African | 2,811 | 1.4% |
| American | 5,339 | 2.7% |
| Apache | 36 | 0.0% |
| Arab | 1,197 | 0.6% |
| Argentinean | 69 | 0.0% |
| Australian | 16 | 0.0% |
| Austrian | 155 | 0.1% |
| Bangladeshi | 94 | 0.1% |
| Belgian | 48 | 0.0% |
| Belizean | 103 | 0.1% |
| Bermudan | 72 | 0.0% |
| Bhutanese | 461 | 0.2% |
| Blackfeet | 6 | 0.0% |
| British | 1,788 | 0.9% |
| British West Indian | 44 | 0.0% |
| Burmese | 525 | 0.3% |
| Cajun | 11 | 0.0% |
| Canadian | 119 | 0.1% |
| Celtic | 6 | 0.0% |
| Central American | 8,393 | 4.3% |
| Central American Indian | 290 | 0.2% |
| Cherokee | 454 | 0.2% |
| Choctaw | 133 | 0.1% |
| Colombian | 482 | 0.2% |
| Comanche | 49 | 0.0% |
| Creek | 56 | 0.0% |
| Croatian | 68 | 0.0% |
| Cuban | 353 | 0.2% |
| Czech | 297 | 0.2% |
| Czechoslovakian | 63 | 0.0% |
| Danish | 178 | 0.1% |
| Dominican | 286 | 0.1% |
| Dutch | 526 | 0.3% |
| Dutch West Indian | 11 | 0.0% |
| Eastern European | 54 | 0.0% |
| Ecuadorian | 122 | 0.1% |
| Egyptian | 13 | 0.0% |
| English | 7,276 | 3.7% |
| Ethiopian | 259 | 0.1% |
| European | 1,443 | 0.7% |
| Filipino | 109 | 0.1% |
| Finnish | 76 | 0.0% |
| French | 1,341 | 0.7% |
| French American Indian | 5 | 0.0% |
| French Canadian | 309 | 0.2% |
| German | 7,299 | 3.7% |
| Ghanaian | 329 | 0.2% |
| Greek | 194 | 0.1% |
| Guatemalan | 996 | 0.5% |
| Guyanese | 27 | 0.0% |
| Haitian | 12 | 0.0% |
| Honduran | 730 | 0.4% |
| Hungarian | 51 | 0.0% |
| Indian (Asian) | 1,524 | 0.8% |
| Iranian | 25 | 0.0% |
| Iraqi | 57 | 0.0% |
| Irish | 5,738 | 2.9% |
| Italian | 1,750 | 0.9% |
| Jamaican | 152 | 0.1% |
| Japanese | 148 | 0.1% |
| Jordanian | 96 | 0.1% |
| Kenyan | 178 | 0.1% |
| Kiowa | 11 | 0.0% |
| Korean | 1,731 | 0.9% |
| Laotian | 31 | 0.0% |
| Lebanese | 323 | 0.2% |
| Liberian | 87 | 0.0% |
| Lithuanian | 52 | 0.0% |
| Malaysian | 1,014 | 0.5% |
| Maltese | 12 | 0.0% |
| Mexican | 77,835 | 39.5% |
| Mexican American Indian | 862 | 0.4% |
| Mongolian | 51 | 0.0% |
| Moroccan | 72 | 0.0% |
| Native Hawaiian | 130 | 0.1% |
| Navajo | 28 | 0.0% |
| Nicaraguan | 129 | 0.1% |
| Nigerian | 2,996 | 1.5% |
| Northern European | 92 | 0.1% |
| Norwegian | 648 | 0.3% |
| Ottawa | 41 | 0.0% |
| Pakistani | 171 | 0.1% |
| Palestinian | 116 | 0.1% |
| Panamanian | 233 | 0.1% |
| Peruvian | 480 | 0.2% |
| Polish | 829 | 0.4% |
| Portuguese | 116 | 0.1% |
| Potawatomi | 7 | 0.0% |
| Pueblo | 2 | 0.0% |
| Puerto Rican | 1,379 | 0.7% |
| Romanian | 73 | 0.0% |
| Russian | 308 | 0.2% |
| Salvadoran | 6,299 | 3.2% |
| Samoan | 36 | 0.0% |
| Scandinavian | 268 | 0.1% |
| Scotch-Irish | 612 | 0.3% |
| Scottish | 1,682 | 0.9% |
| Serbian | 8 | 0.0% |
| Sioux | 90 | 0.1% |
| Slavic | 19 | 0.0% |
| Somali | 286 | 0.1% |
| South African | 22 | 0.0% |
| South American | 1,257 | 0.6% |
| Spaniard | 631 | 0.3% |
| Spanish | 452 | 0.2% |
| Spanish American Indian | 21 | 0.0% |
| Sri Lankan | 7,624 | 3.9% |
| Subsaharan African | 7,498 | 3.8% |
| Sudanese | 10 | 0.0% |
| Swedish | 571 | 0.3% |
| Swiss | 43 | 0.0% |
| Syrian | 5 | 0.0% |
| Thai | 1,676 | 0.9% |
| Tongan | 119 | 0.1% |
| Trinidadian and Tobagonian | 162 | 0.1% |
| Turkish | 78 | 0.0% |
| Ukrainian | 20 | 0.0% |
| Ute | 27 | 0.0% |
| Venezuelan | 98 | 0.1% |
| Vietnamese | 56 | 0.0% |
| Welsh | 378 | 0.2% |
| West Indian | 6 | 0.0% |
| Yugoslavian | 53 | 0.0% |
| Zimbabwean | 377 | 0.2% | View All 125 Rows |
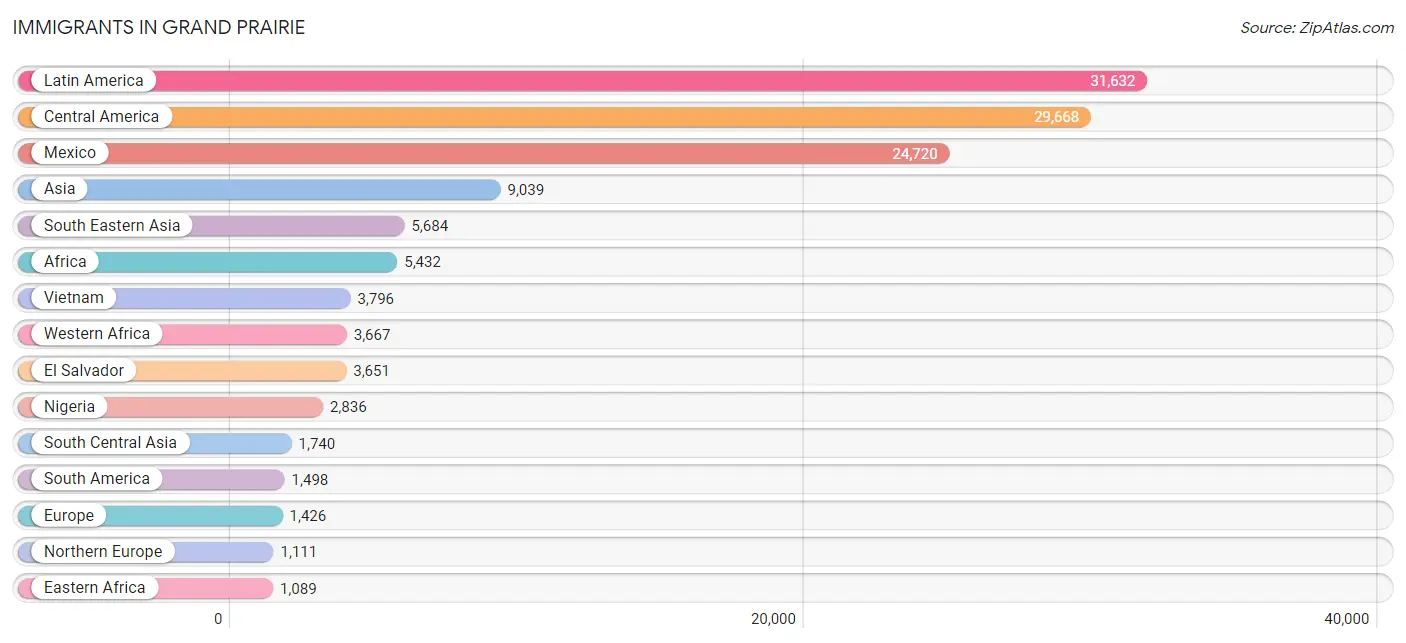
Immigrants in Grand Prairie
The most numerous immigrant groups reported in Grand Prairie came from Latin America (31,632 | 16.0%), Central America (29,668 | 15.0%), Mexico (24,720 | 12.5%), Asia (9,039 | 4.6%), and South Eastern Asia (5,684 | 2.9%), together accounting for 51.1% of all Grand Prairie residents.
| Immigration Origin | # Population | % Population |
| Afghanistan | 277 | 0.1% |
| Africa | 5,432 | 2.8% |
| Argentina | 69 | 0.0% |
| Asia | 9,039 | 4.6% |
| Bangladesh | 56 | 0.0% |
| Belize | 36 | 0.0% |
| Bosnia and Herzegovina | 11 | 0.0% |
| Brazil | 116 | 0.1% |
| Cambodia | 114 | 0.1% |
| Cameroon | 296 | 0.2% |
| Canada | 119 | 0.1% |
| Caribbean | 466 | 0.2% |
| Central America | 29,668 | 15.0% |
| Chile | 13 | 0.0% |
| China | 629 | 0.3% |
| Colombia | 320 | 0.2% |
| Congo | 45 | 0.0% |
| Cuba | 253 | 0.1% |
| Dominican Republic | 96 | 0.1% |
| Eastern Africa | 1,089 | 0.5% |
| Eastern Asia | 1,080 | 0.5% |
| Eastern Europe | 185 | 0.1% |
| Ecuador | 216 | 0.1% |
| Egypt | 2 | 0.0% |
| El Salvador | 3,651 | 1.8% |
| England | 58 | 0.0% |
| Eritrea | 30 | 0.0% |
| Ethiopia | 166 | 0.1% |
| Europe | 1,426 | 0.7% |
| France | 9 | 0.0% |
| Germany | 107 | 0.1% |
| Ghana | 547 | 0.3% |
| Guatemala | 677 | 0.3% |
| Guyana | 173 | 0.1% |
| Honduras | 418 | 0.2% |
| Hong Kong | 72 | 0.0% |
| India | 716 | 0.4% |
| Indonesia | 52 | 0.0% |
| Iran | 2 | 0.0% |
| Iraq | 125 | 0.1% |
| Ireland | 5 | 0.0% |
| Israel | 68 | 0.0% |
| Jamaica | 28 | 0.0% |
| Japan | 92 | 0.1% |
| Jordan | 23 | 0.0% |
| Kenya | 320 | 0.2% |
| Korea | 359 | 0.2% |
| Kuwait | 191 | 0.1% |
| Laos | 568 | 0.3% |
| Latin America | 31,632 | 16.0% |
| Lebanon | 11 | 0.0% |
| Liberia | 187 | 0.1% |
| Malaysia | 82 | 0.0% |
| Mexico | 24,720 | 12.5% |
| Middle Africa | 366 | 0.2% |
| Moldova | 14 | 0.0% |
| Morocco | 34 | 0.0% |
| Nepal | 404 | 0.2% |
| Nicaragua | 85 | 0.0% |
| Nigeria | 2,836 | 1.4% |
| Northern Africa | 84 | 0.0% |
| Northern Europe | 1,111 | 0.6% |
| Oceania | 55 | 0.0% |
| Pakistan | 285 | 0.1% |
| Panama | 81 | 0.0% |
| Peru | 439 | 0.2% |
| Philippines | 923 | 0.5% |
| Portugal | 14 | 0.0% |
| Romania | 49 | 0.0% |
| Russia | 111 | 0.1% |
| Saudi Arabia | 79 | 0.0% |
| Senegal | 23 | 0.0% |
| Somalia | 287 | 0.2% |
| South Africa | 10 | 0.0% |
| South America | 1,498 | 0.8% |
| South Central Asia | 1,740 | 0.9% |
| South Eastern Asia | 5,684 | 2.9% |
| Southern Europe | 14 | 0.0% |
| Sudan | 5 | 0.0% |
| Taiwan | 338 | 0.2% |
| Thailand | 115 | 0.1% |
| Trinidad and Tobago | 45 | 0.0% |
| Uganda | 26 | 0.0% |
| Venezuela | 117 | 0.1% |
| Vietnam | 3,796 | 1.9% |
| Western Africa | 3,667 | 1.9% |
| Western Asia | 508 | 0.3% |
| Western Europe | 116 | 0.1% |
| Zaire | 25 | 0.0% |
| Zimbabwe | 196 | 0.1% | View All 90 Rows |
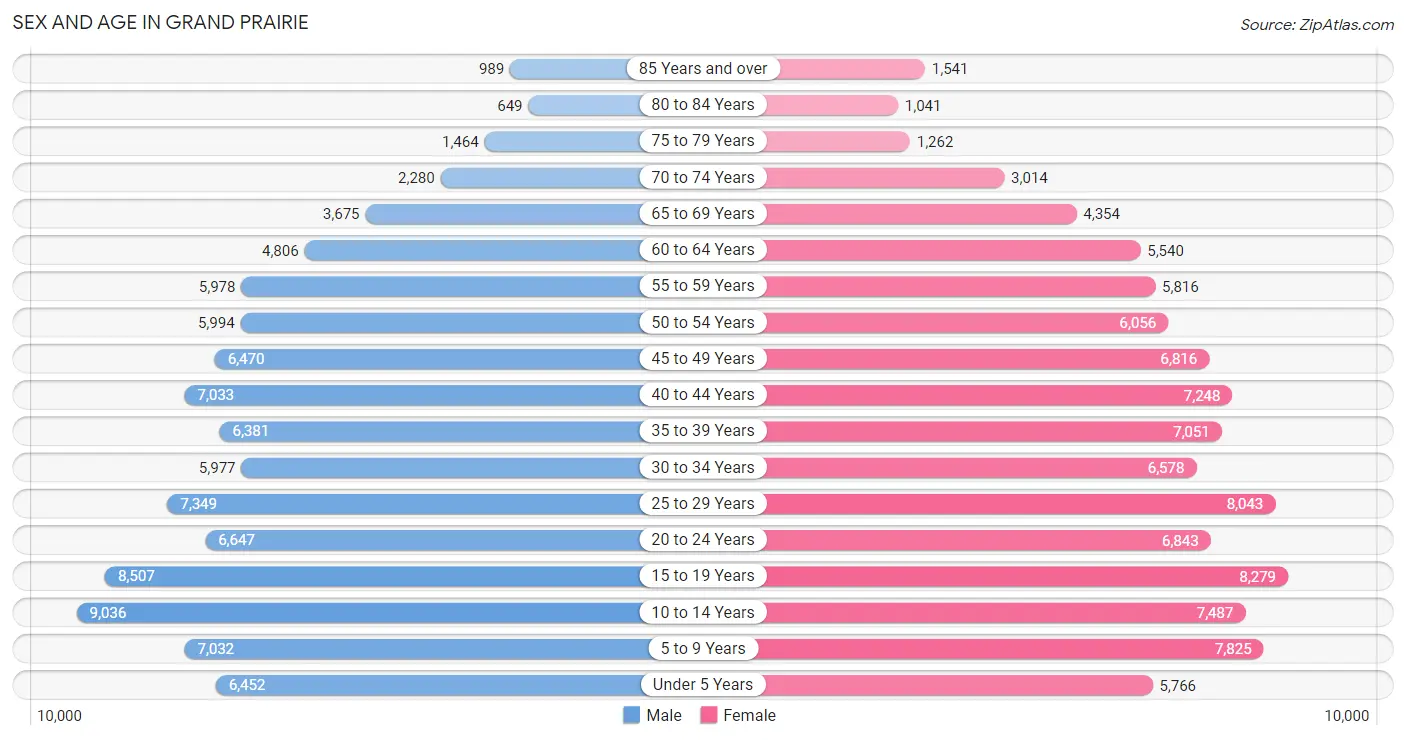
Sex and Age in Grand Prairie
Sex and Age in Grand Prairie
The most populous age groups in Grand Prairie are 10 to 14 Years (9,036 | 9.3%) for men and 15 to 19 Years (8,279 | 8.2%) for women.
| Age Bracket | Male | Female |
| Under 5 Years | 6,452 (6.7%) | 5,766 (5.7%) |
| 5 to 9 Years | 7,032 (7.3%) | 7,825 (7.8%) |
| 10 to 14 Years | 9,036 (9.3%) | 7,487 (7.4%) |
| 15 to 19 Years | 8,507 (8.8%) | 8,279 (8.2%) |
| 20 to 24 Years | 6,647 (6.9%) | 6,843 (6.8%) |
| 25 to 29 Years | 7,349 (7.6%) | 8,043 (8.0%) |
| 30 to 34 Years | 5,977 (6.2%) | 6,578 (6.5%) |
| 35 to 39 Years | 6,381 (6.6%) | 7,051 (7.0%) |
| 40 to 44 Years | 7,033 (7.3%) | 7,248 (7.2%) |
| 45 to 49 Years | 6,470 (6.7%) | 6,816 (6.8%) |
| 50 to 54 Years | 5,994 (6.2%) | 6,056 (6.0%) |
| 55 to 59 Years | 5,978 (6.2%) | 5,816 (5.8%) |
| 60 to 64 Years | 4,806 (5.0%) | 5,540 (5.5%) |
| 65 to 69 Years | 3,675 (3.8%) | 4,354 (4.3%) |
| 70 to 74 Years | 2,280 (2.4%) | 3,014 (3.0%) |
| 75 to 79 Years | 1,464 (1.5%) | 1,262 (1.3%) |
| 80 to 84 Years | 649 (0.7%) | 1,041 (1.0%) |
| 85 Years and over | 989 (1.0%) | 1,541 (1.5%) |
| Total | 96,719 (100.0%) | 100,560 (100.0%) |
Families and Households in Grand Prairie
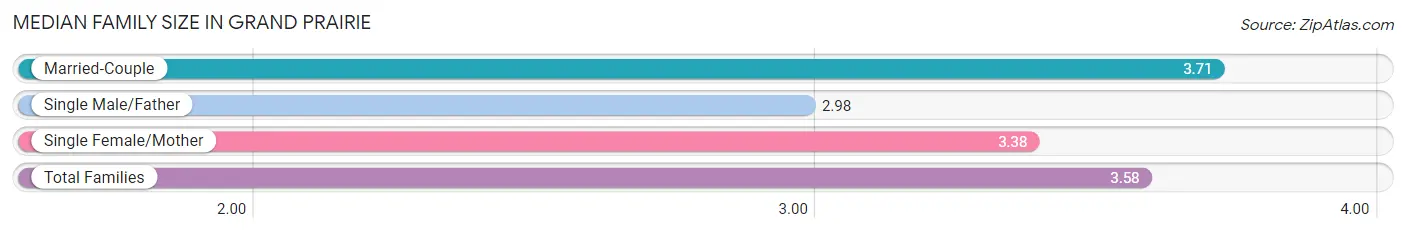
Median Family Size in Grand Prairie
The median family size in Grand Prairie is 3.58 persons per family, with married-couple families (34,386 | 72.0%) accounting for the largest median family size of 3.71 persons per family. On the other hand, single male/father families (3,529 | 7.4%) represent the smallest median family size with 2.98 persons per family.
| Family Type | # Families | Family Size |
| Married-Couple | 34,386 (72.0%) | 3.71 |
| Single Male/Father | 3,529 (7.4%) | 2.98 |
| Single Female/Mother | 9,863 (20.6%) | 3.38 |
| Total Families | 47,778 (100.0%) | 3.58 |
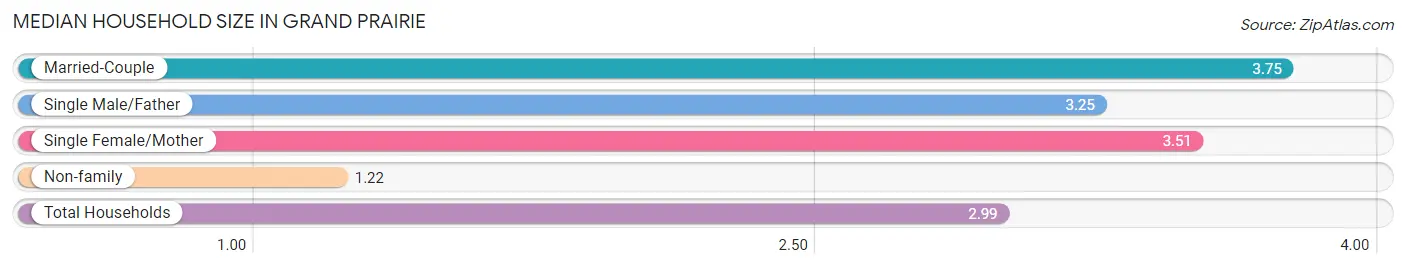
Median Household Size in Grand Prairie
The median household size in Grand Prairie is 2.99 persons per household, with married-couple households (34,386 | 52.3%) accounting for the largest median household size of 3.75 persons per household. non-family households (17,962 | 27.3%) represent the smallest median household size with 1.22 persons per household.
| Household Type | # Households | Household Size |
| Married-Couple | 34,386 (52.3%) | 3.75 |
| Single Male/Father | 3,529 (5.4%) | 3.25 |
| Single Female/Mother | 9,863 (15.0%) | 3.51 |
| Non-family | 17,962 (27.3%) | 1.22 |
| Total Households | 65,740 (100.0%) | 2.99 |
Household Size by Marriage Status in Grand Prairie
Out of a total of 65,740 households in Grand Prairie, 47,778 (72.7%) are family households, while 17,962 (27.3%) are nonfamily households. The most numerous type of family households are 2-person households, comprising 16,113, and the most common type of nonfamily households are 1-person households, comprising 14,895.
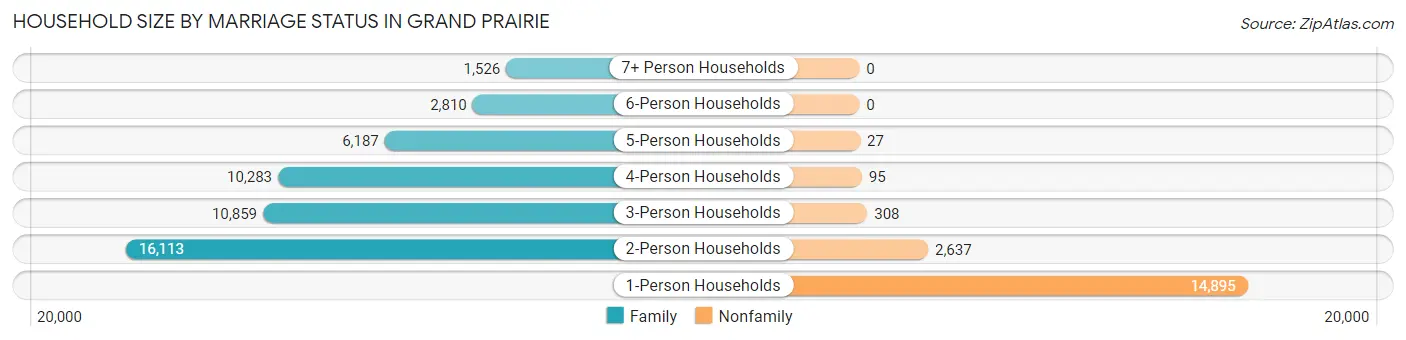
| Household Size | Family Households | Nonfamily Households |
| 1-Person Households | - | 14,895 (22.7%) |
| 2-Person Households | 16,113 (24.5%) | 2,637 (4.0%) |
| 3-Person Households | 10,859 (16.5%) | 308 (0.5%) |
| 4-Person Households | 10,283 (15.6%) | 95 (0.1%) |
| 5-Person Households | 6,187 (9.4%) | 27 (0.0%) |
| 6-Person Households | 2,810 (4.3%) | 0 (0.0%) |
| 7+ Person Households | 1,526 (2.3%) | 0 (0.0%) |
| Total | 47,778 (72.7%) | 17,962 (27.3%) |
Female Fertility in Grand Prairie
Fertility by Age in Grand Prairie
Average fertility rate in Grand Prairie is 51.0 births per 1,000 women. Women in the age bracket of 20 to 34 years have the highest fertility rate with 95.0 births per 1,000 women. Women in the age bracket of 20 to 34 years acount for 77.6% of all women with births.
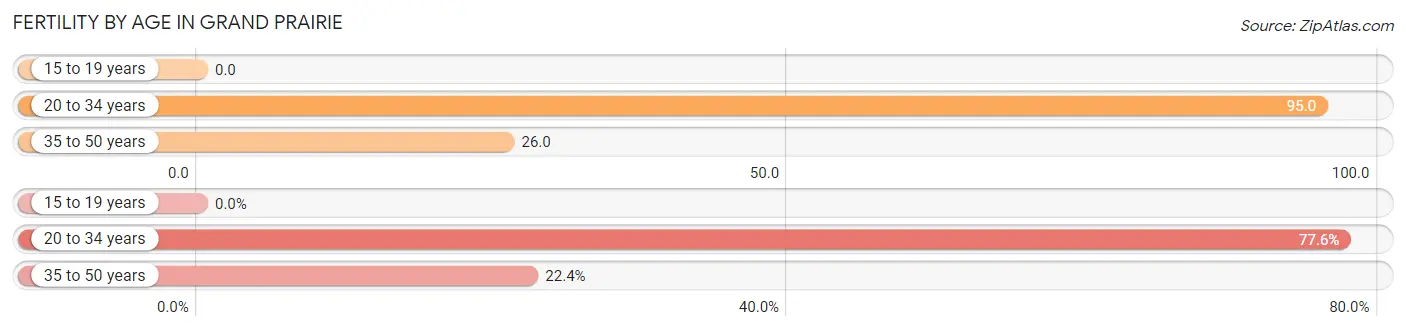
| Age Bracket | Women with Births | Births / 1,000 Women |
| 15 to 19 years | 0 (0.0%) | 0.0 |
| 20 to 34 years | 2,048 (77.6%) | 95.0 |
| 35 to 50 years | 592 (22.4%) | 26.0 |
| Total | 2,640 (100.0%) | 51.0 |
Fertility by Age by Marriage Status in Grand Prairie
66.8% of women with births (2,640) in Grand Prairie are married. The highest percentage of unmarried women with births falls into 20 to 34 years age bracket with 36.7% of them unmarried at the time of birth, while the lowest percentage of unmarried women with births belong to 35 to 50 years age bracket with 21.3% of them unmarried.
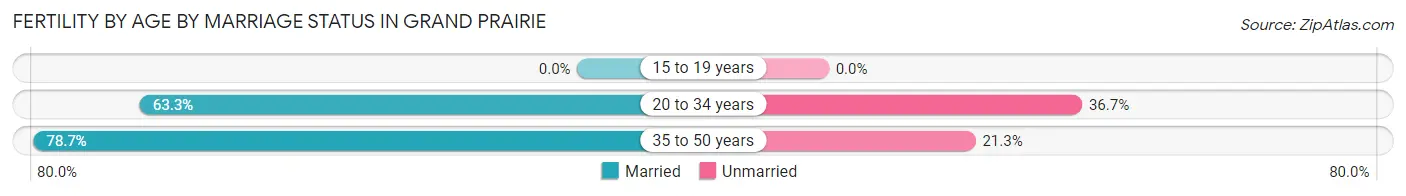
| Age Bracket | Married | Unmarried |
| 15 to 19 years | 0 (0.0%) | 0 (0.0%) |
| 20 to 34 years | 1,296 (63.3%) | 752 (36.7%) |
| 35 to 50 years | 466 (78.7%) | 126 (21.3%) |
| Total | 1,764 (66.8%) | 876 (33.2%) |
Fertility by Education in Grand Prairie
Average fertility rate in Grand Prairie is 51.0 births per 1,000 women. Women with the education attainment of graduate degree have the highest fertility rate of 111.0 births per 1,000 women, while women with the education attainment of less than high school have the lowest fertility at 21.0 births per 1,000 women. Women with the education attainment of high school diploma represent 28.9% of all women with births.
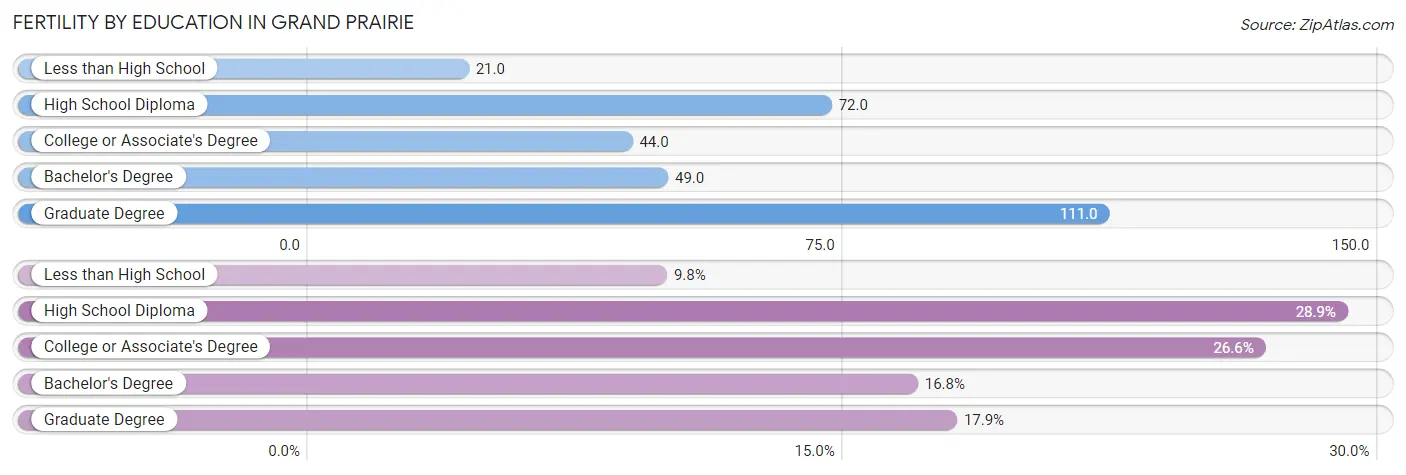
| Educational Attainment | Women with Births | Births / 1,000 Women |
| Less than High School | 258 (9.8%) | 21.0 |
| High School Diploma | 763 (28.9%) | 72.0 |
| College or Associate's Degree | 702 (26.6%) | 44.0 |
| Bachelor's Degree | 444 (16.8%) | 49.0 |
| Graduate Degree | 473 (17.9%) | 111.0 |
| Total | 2,640 (100.0%) | 51.0 |
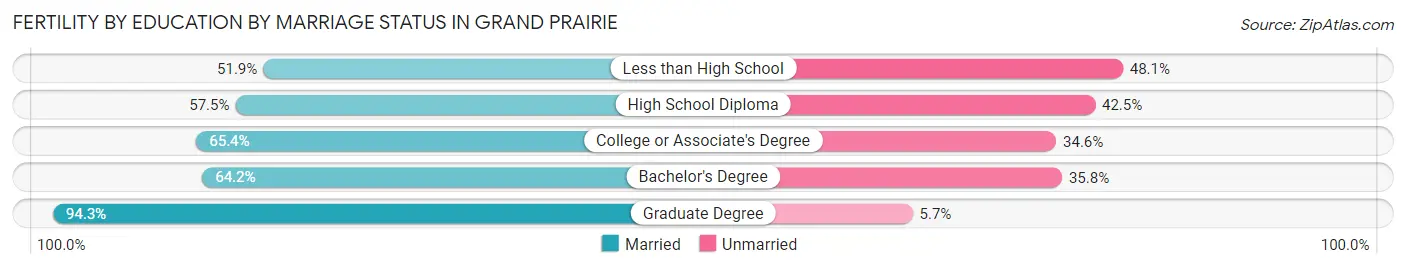
Fertility by Education by Marriage Status in Grand Prairie
33.2% of women with births in Grand Prairie are unmarried. Women with the educational attainment of graduate degree are most likely to be married with 94.3% of them married at childbirth, while women with the educational attainment of less than high school are least likely to be married with 48.1% of them unmarried at childbirth.
| Educational Attainment | Married | Unmarried |
| Less than High School | 134 (51.9%) | 124 (48.1%) |
| High School Diploma | 439 (57.5%) | 324 (42.5%) |
| College or Associate's Degree | 459 (65.4%) | 243 (34.6%) |
| Bachelor's Degree | 285 (64.2%) | 159 (35.8%) |
| Graduate Degree | 446 (94.3%) | 27 (5.7%) |
| Total | 1,764 (66.8%) | 876 (33.2%) |
Employment Characteristics in Grand Prairie
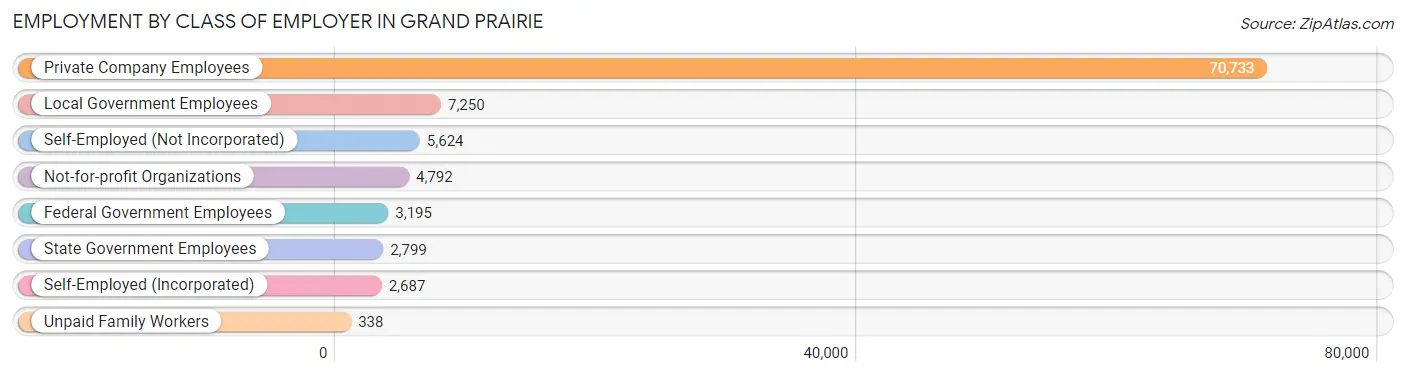
Employment by Class of Employer in Grand Prairie
Among the 97,418 employed individuals in Grand Prairie, private company employees (70,733 | 72.6%), local government employees (7,250 | 7.4%), and self-employed (not incorporated) (5,624 | 5.8%) make up the most common classes of employment.
| Employer Class | # Employees | % Employees |
| Private Company Employees | 70,733 | 72.6% |
| Self-Employed (Incorporated) | 2,687 | 2.8% |
| Self-Employed (Not Incorporated) | 5,624 | 5.8% |
| Not-for-profit Organizations | 4,792 | 4.9% |
| Local Government Employees | 7,250 | 7.4% |
| State Government Employees | 2,799 | 2.9% |
| Federal Government Employees | 3,195 | 3.3% |
| Unpaid Family Workers | 338 | 0.4% |
| Total | 97,418 | 100.0% |
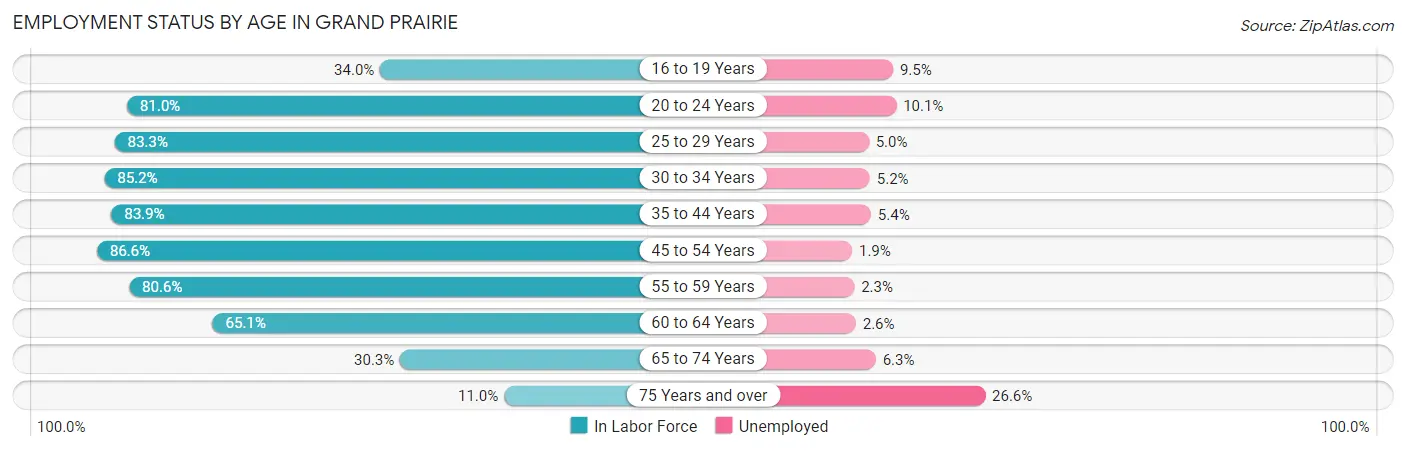
Employment Status by Age in Grand Prairie
According to the labor force statistics for Grand Prairie, out of the total population over 16 years of age (150,282), 70.0% or 105,197 individuals are in the labor force, with 5.0% or 5,260 of them unemployed. The age group with the highest labor force participation rate is 45 to 54 years, with 86.6% or 21,941 individuals in the labor force. Within the labor force, the 75 years and over age range has the highest percentage of unemployed individuals, with 26.6% or 203 of them being unemployed.
| Age Bracket | In Labor Force | Unemployed |
| 16 to 19 Years | 4,552 (34.0%) | 432 (9.5%) |
| 20 to 24 Years | 10,927 (81.0%) | 1,104 (10.1%) |
| 25 to 29 Years | 12,822 (83.3%) | 641 (5.0%) |
| 30 to 34 Years | 10,697 (85.2%) | 556 (5.2%) |
| 35 to 44 Years | 23,251 (83.9%) | 1,256 (5.4%) |
| 45 to 54 Years | 21,941 (86.6%) | 417 (1.9%) |
| 55 to 59 Years | 9,506 (80.6%) | 219 (2.3%) |
| 60 to 64 Years | 6,735 (65.1%) | 175 (2.6%) |
| 65 to 74 Years | 4,037 (30.3%) | 254 (6.3%) |
| 75 Years and over | 764 (11.0%) | 203 (26.6%) |
| Total | 105,197 (70.0%) | 5,260 (5.0%) |
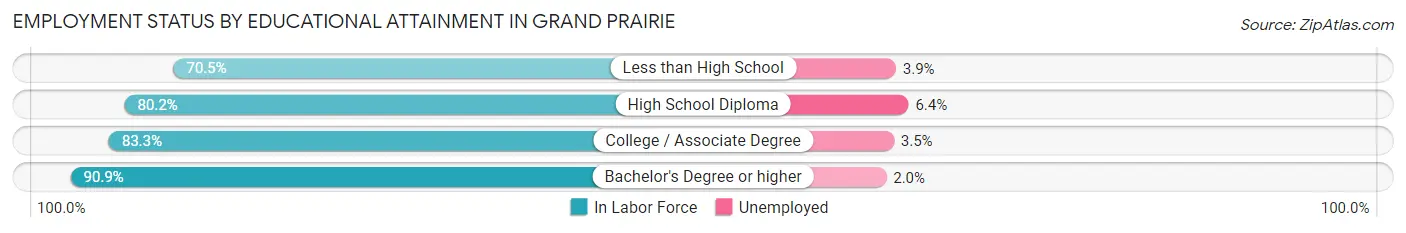
Employment Status by Educational Attainment in Grand Prairie
According to labor force statistics for Grand Prairie, 82.4% of individuals (84,984) out of the total population between 25 and 64 years of age (103,136) are in the labor force, with 3.8% or 3,229 of them being unemployed. The group with the highest labor force participation rate are those with the educational attainment of bachelor's degree or higher, with 90.9% or 25,998 individuals in the labor force. Within the labor force, individuals with high school diploma education have the highest percentage of unemployment, with 6.4% or 1,380 of them being unemployed.
| Educational Attainment | In Labor Force | Unemployed |
| Less than High School | 12,745 (70.5%) | 705 (3.9%) |
| High School Diploma | 21,563 (80.2%) | 1,721 (6.4%) |
| College / Associate Degree | 24,633 (83.3%) | 1,035 (3.5%) |
| Bachelor's Degree or higher | 25,998 (90.9%) | 572 (2.0%) |
| Total | 84,984 (82.4%) | 3,919 (3.8%) |
Employment Occupations by Sex in Grand Prairie
Management, Business, Science and Arts Occupations
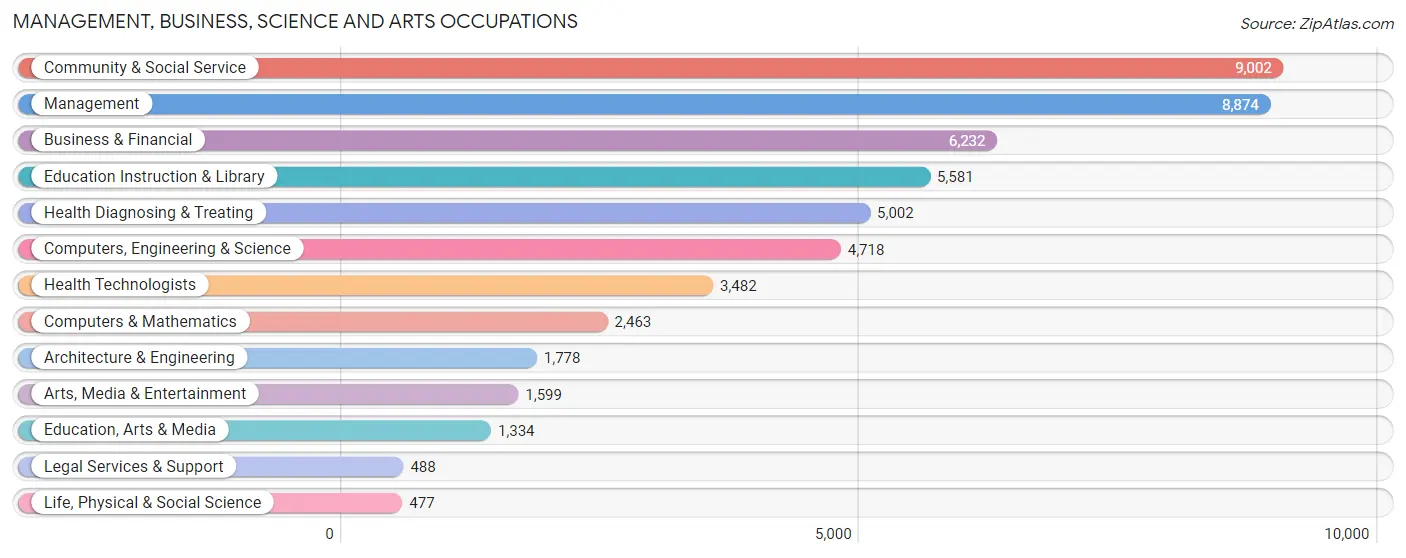
The most common Management, Business, Science and Arts occupations in Grand Prairie are Community & Social Service (9,002 | 9.0%), Management (8,874 | 8.9%), Business & Financial (6,232 | 6.2%), Education Instruction & Library (5,581 | 5.6%), and Health Diagnosing & Treating (5,002 | 5.0%).
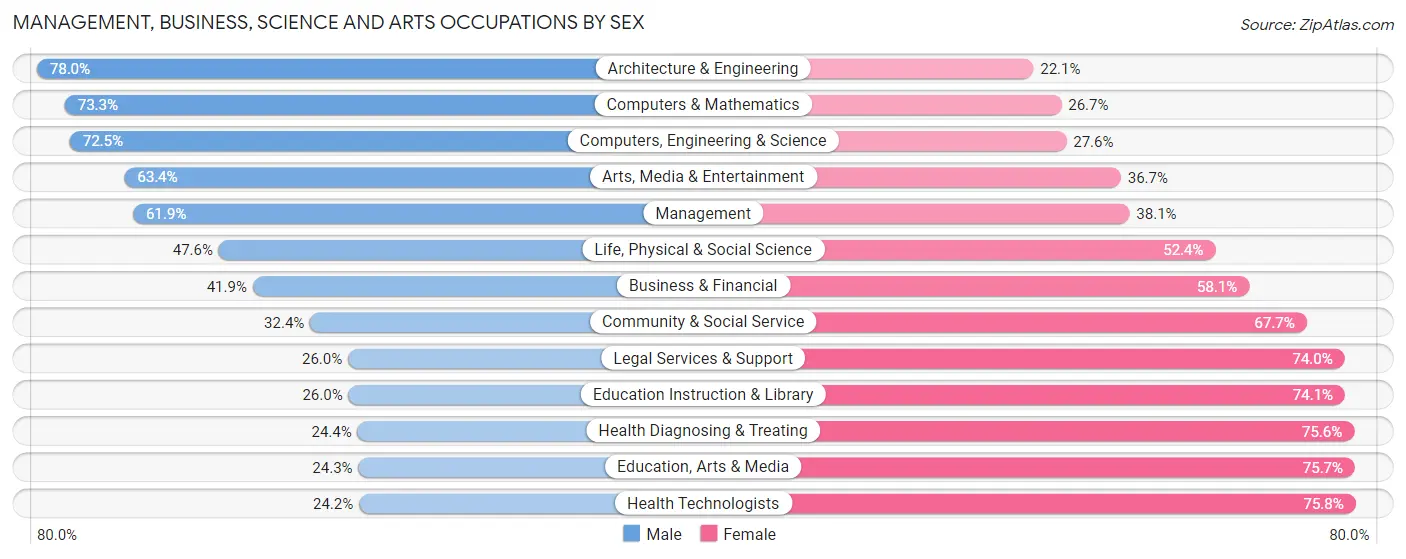
Management, Business, Science and Arts Occupations by Sex
Within the Management, Business, Science and Arts occupations in Grand Prairie, the most male-oriented occupations are Architecture & Engineering (77.9%), Computers & Mathematics (73.3%), and Computers, Engineering & Science (72.5%), while the most female-oriented occupations are Health Technologists (75.8%), Education, Arts & Media (75.7%), and Health Diagnosing & Treating (75.6%).
| Occupation | Male | Female |
| Management | 5,494 (61.9%) | 3,380 (38.1%) |
| Business & Financial | 2,613 (41.9%) | 3,619 (58.1%) |
| Computers, Engineering & Science | 3,418 (72.5%) | 1,300 (27.6%) |
| Computers & Mathematics | 1,805 (73.3%) | 658 (26.7%) |
| Architecture & Engineering | 1,386 (77.9%) | 392 (22.1%) |
| Life, Physical & Social Science | 227 (47.6%) | 250 (52.4%) |
| Community & Social Service | 2,912 (32.4%) | 6,090 (67.6%) |
| Education, Arts & Media | 324 (24.3%) | 1,010 (75.7%) |
| Legal Services & Support | 127 (26.0%) | 361 (74.0%) |
| Education Instruction & Library | 1,448 (26.0%) | 4,133 (74.1%) |
| Arts, Media & Entertainment | 1,013 (63.3%) | 586 (36.6%) |
| Health Diagnosing & Treating | 1,222 (24.4%) | 3,780 (75.6%) |
| Health Technologists | 842 (24.2%) | 2,640 (75.8%) |
| Total (Category) | 15,659 (46.3%) | 18,169 (53.7%) |
| Total (Overall) | 53,753 (53.8%) | 46,121 (46.2%) |
Services Occupations
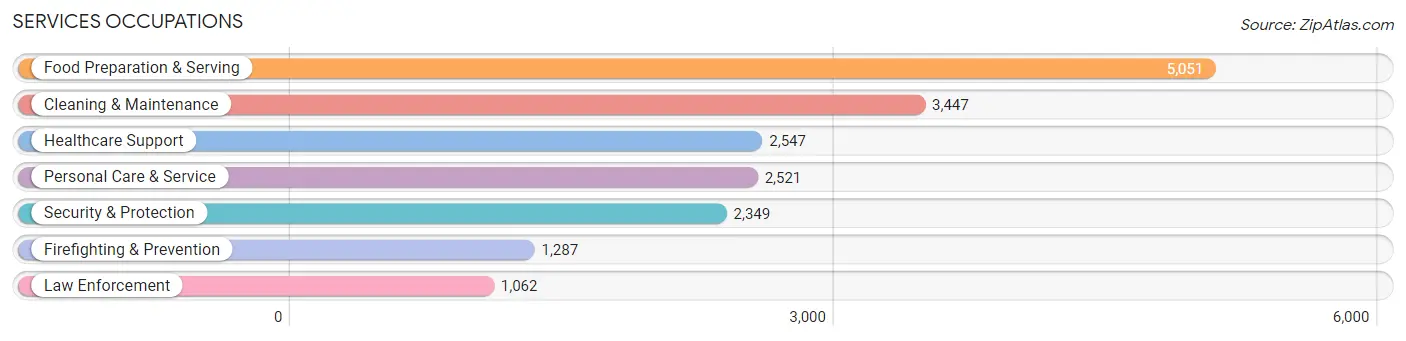
The most common Services occupations in Grand Prairie are Food Preparation & Serving (5,051 | 5.1%), Cleaning & Maintenance (3,447 | 3.5%), Healthcare Support (2,547 | 2.5%), Personal Care & Service (2,521 | 2.5%), and Security & Protection (2,349 | 2.4%).
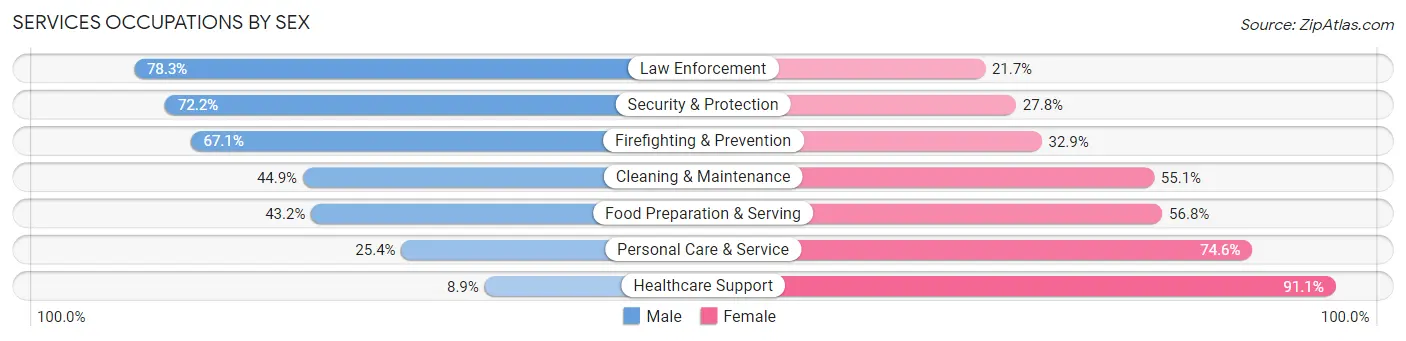
Services Occupations by Sex
Within the Services occupations in Grand Prairie, the most male-oriented occupations are Law Enforcement (78.3%), Security & Protection (72.2%), and Firefighting & Prevention (67.1%), while the most female-oriented occupations are Healthcare Support (91.1%), Personal Care & Service (74.6%), and Food Preparation & Serving (56.8%).
| Occupation | Male | Female |
| Healthcare Support | 227 (8.9%) | 2,320 (91.1%) |
| Security & Protection | 1,696 (72.2%) | 653 (27.8%) |
| Firefighting & Prevention | 864 (67.1%) | 423 (32.9%) |
| Law Enforcement | 832 (78.3%) | 230 (21.7%) |
| Food Preparation & Serving | 2,184 (43.2%) | 2,867 (56.8%) |
| Cleaning & Maintenance | 1,547 (44.9%) | 1,900 (55.1%) |
| Personal Care & Service | 640 (25.4%) | 1,881 (74.6%) |
| Total (Category) | 6,294 (39.6%) | 9,621 (60.5%) |
| Total (Overall) | 53,753 (53.8%) | 46,121 (46.2%) |
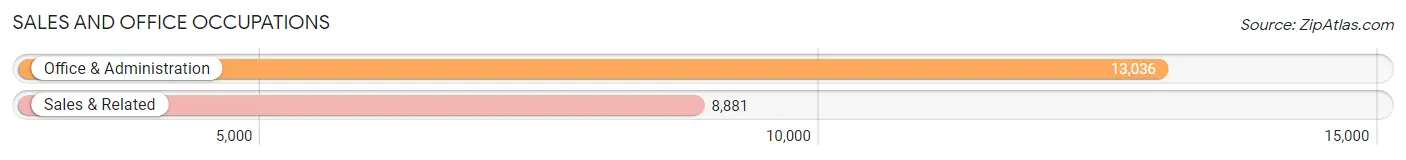
Sales and Office Occupations
The most common Sales and Office occupations in Grand Prairie are Office & Administration (13,036 | 13.1%), and Sales & Related (8,881 | 8.9%).
Sales and Office Occupations by Sex
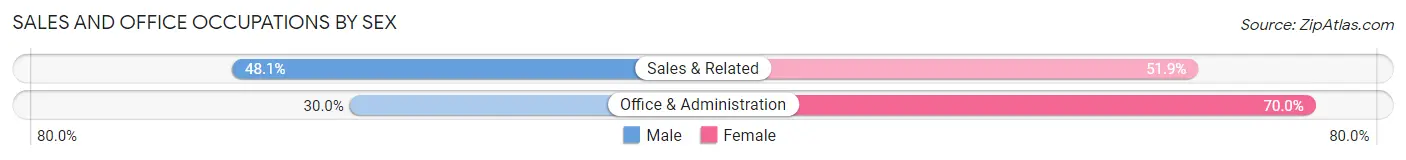
| Occupation | Male | Female |
| Sales & Related | 4,268 (48.1%) | 4,613 (51.9%) |
| Office & Administration | 3,911 (30.0%) | 9,125 (70.0%) |
| Total (Category) | 8,179 (37.3%) | 13,738 (62.7%) |
| Total (Overall) | 53,753 (53.8%) | 46,121 (46.2%) |
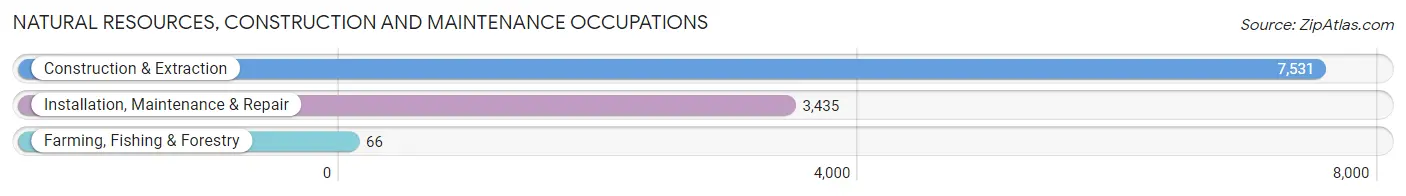
Natural Resources, Construction and Maintenance Occupations
The most common Natural Resources, Construction and Maintenance occupations in Grand Prairie are Construction & Extraction (7,531 | 7.5%), Installation, Maintenance & Repair (3,435 | 3.4%), and Farming, Fishing & Forestry (66 | 0.1%).
Natural Resources, Construction and Maintenance Occupations by Sex
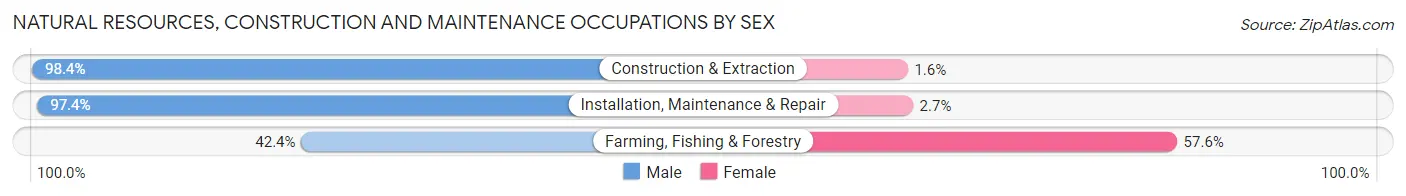
| Occupation | Male | Female |
| Farming, Fishing & Forestry | 28 (42.4%) | 38 (57.6%) |
| Construction & Extraction | 7,413 (98.4%) | 118 (1.6%) |
| Installation, Maintenance & Repair | 3,344 (97.4%) | 91 (2.6%) |
| Total (Category) | 10,785 (97.8%) | 247 (2.2%) |
| Total (Overall) | 53,753 (53.8%) | 46,121 (46.2%) |
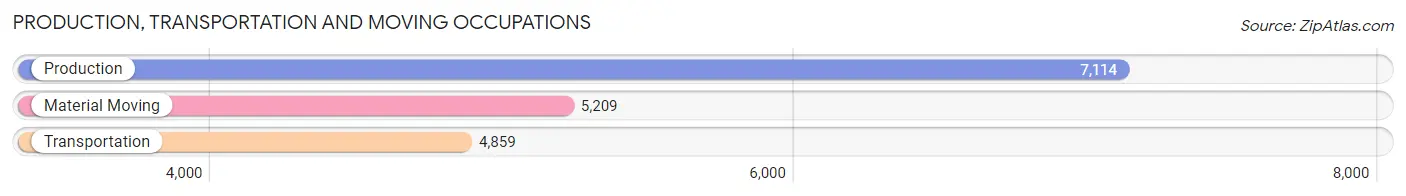
Production, Transportation and Moving Occupations
The most common Production, Transportation and Moving occupations in Grand Prairie are Production (7,114 | 7.1%), Material Moving (5,209 | 5.2%), and Transportation (4,859 | 4.9%).
Production, Transportation and Moving Occupations by Sex
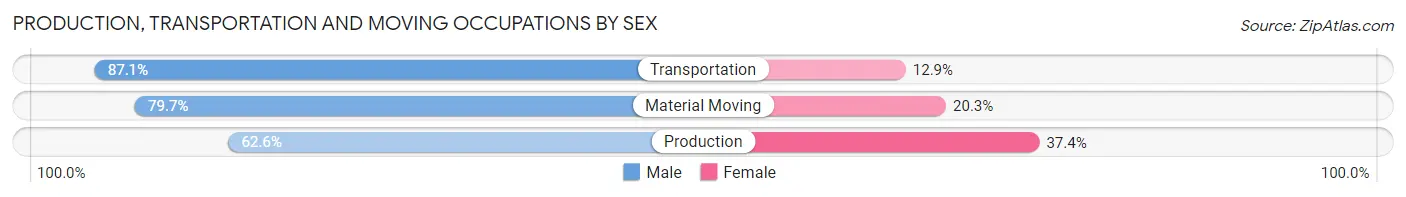
| Occupation | Male | Female |
| Production | 4,452 (62.6%) | 2,662 (37.4%) |
| Transportation | 4,232 (87.1%) | 627 (12.9%) |
| Material Moving | 4,152 (79.7%) | 1,057 (20.3%) |
| Total (Category) | 12,836 (74.7%) | 4,346 (25.3%) |
| Total (Overall) | 53,753 (53.8%) | 46,121 (46.2%) |
Employment Industries by Sex in Grand Prairie
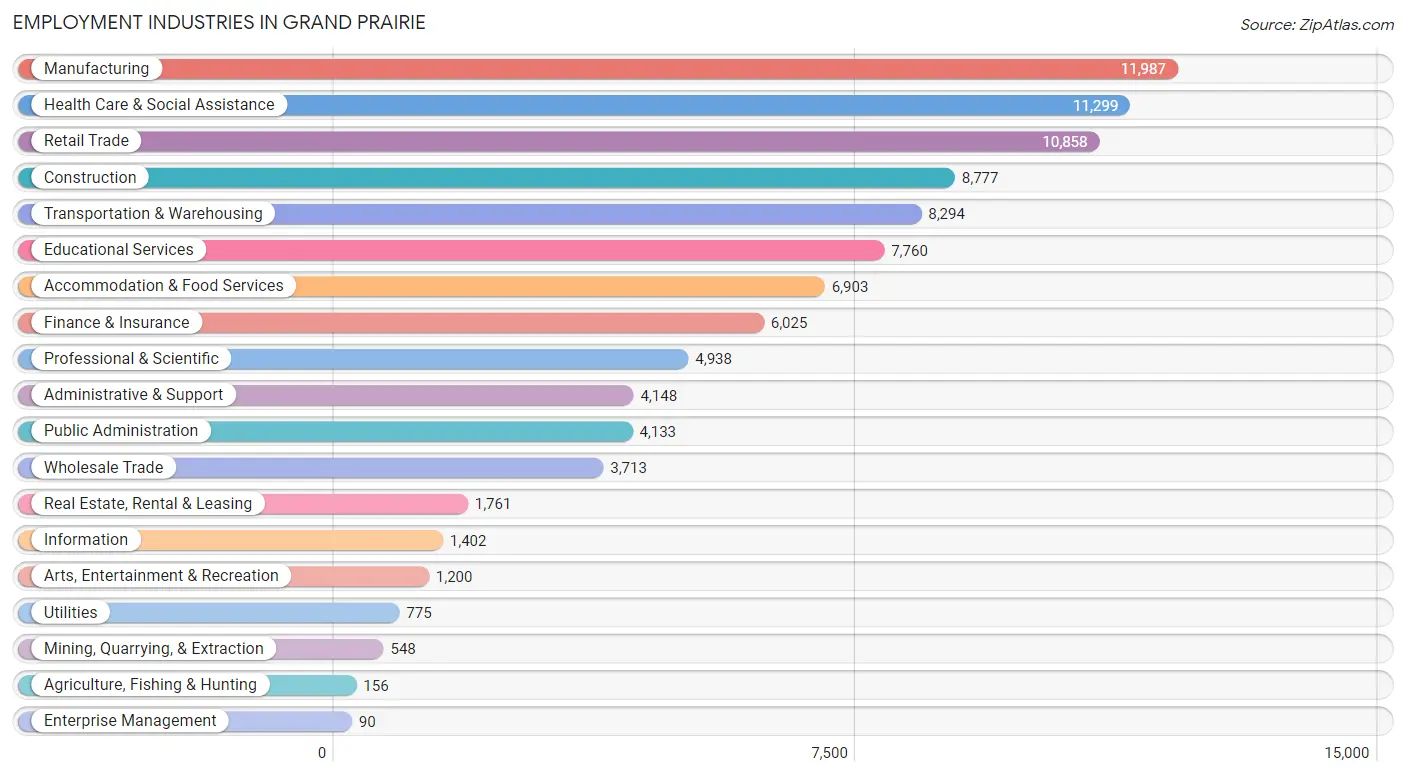
Employment Industries in Grand Prairie
The major employment industries in Grand Prairie include Manufacturing (11,987 | 12.0%), Health Care & Social Assistance (11,299 | 11.3%), Retail Trade (10,858 | 10.9%), Construction (8,777 | 8.8%), and Transportation & Warehousing (8,294 | 8.3%).
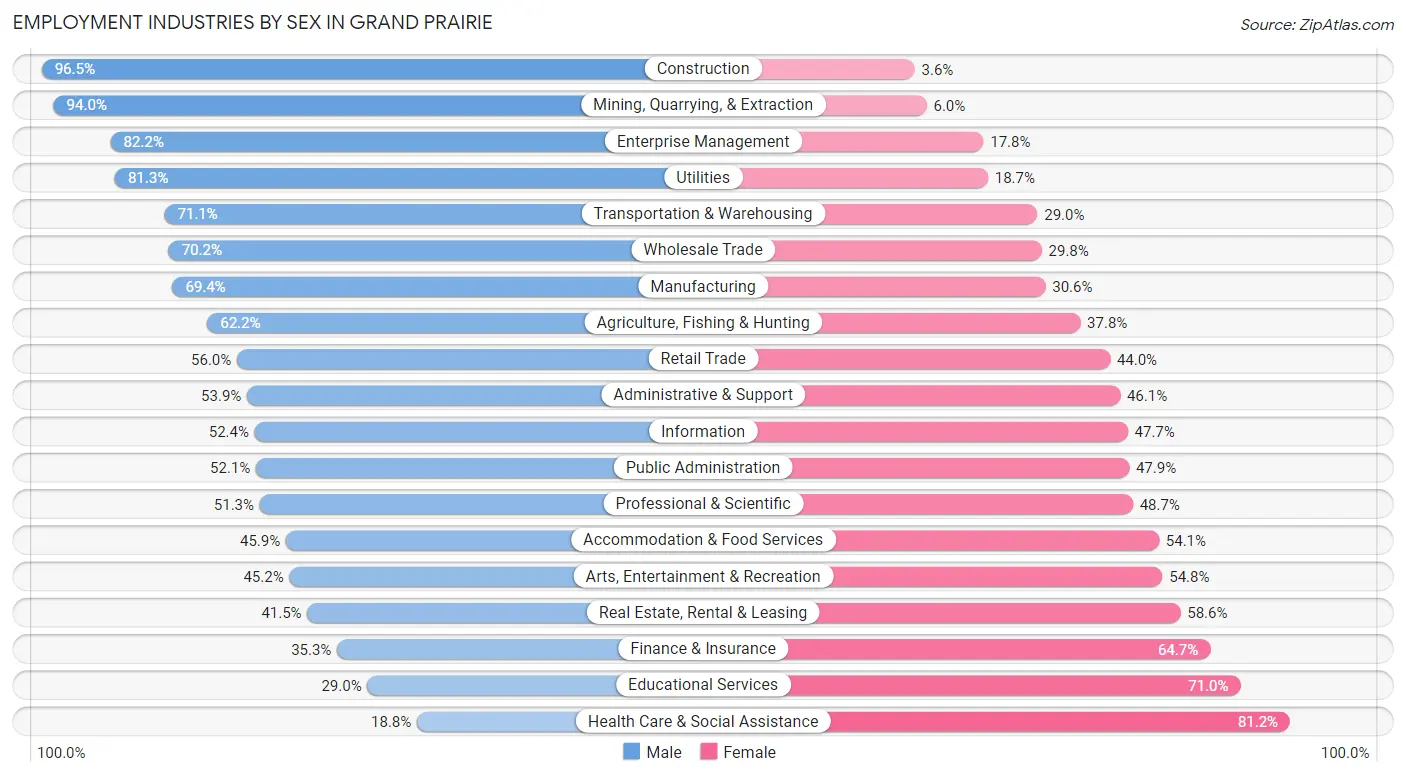
Employment Industries by Sex in Grand Prairie
The Grand Prairie industries that see more men than women are Construction (96.5%), Mining, Quarrying, & Extraction (94.0%), and Enterprise Management (82.2%), whereas the industries that tend to have a higher number of women are Health Care & Social Assistance (81.2%), Educational Services (71.0%), and Finance & Insurance (64.7%).
| Industry | Male | Female |
| Agriculture, Fishing & Hunting | 97 (62.2%) | 59 (37.8%) |
| Mining, Quarrying, & Extraction | 515 (94.0%) | 33 (6.0%) |
| Construction | 8,465 (96.5%) | 312 (3.5%) |
| Manufacturing | 8,318 (69.4%) | 3,669 (30.6%) |
| Wholesale Trade | 2,605 (70.2%) | 1,108 (29.8%) |
| Retail Trade | 6,082 (56.0%) | 4,776 (44.0%) |
| Transportation & Warehousing | 5,893 (71.1%) | 2,401 (28.9%) |
| Utilities | 630 (81.3%) | 145 (18.7%) |
| Information | 734 (52.3%) | 668 (47.6%) |
| Finance & Insurance | 2,127 (35.3%) | 3,898 (64.7%) |
| Real Estate, Rental & Leasing | 730 (41.4%) | 1,031 (58.6%) |
| Professional & Scientific | 2,533 (51.3%) | 2,405 (48.7%) |
| Enterprise Management | 74 (82.2%) | 16 (17.8%) |
| Administrative & Support | 2,237 (53.9%) | 1,911 (46.1%) |
| Educational Services | 2,253 (29.0%) | 5,507 (71.0%) |
| Health Care & Social Assistance | 2,120 (18.8%) | 9,179 (81.2%) |
| Arts, Entertainment & Recreation | 542 (45.2%) | 658 (54.8%) |
| Accommodation & Food Services | 3,168 (45.9%) | 3,735 (54.1%) |
| Public Administration | 2,152 (52.1%) | 1,981 (47.9%) |
| Total | 53,753 (53.8%) | 46,121 (46.2%) |
Education in Grand Prairie
School Enrollment in Grand Prairie
The most common levels of schooling among the 58,309 students in Grand Prairie are high school (14,198 | 24.3%), middle school (12,672 | 21.7%), and elementary school (11,744 | 20.1%).
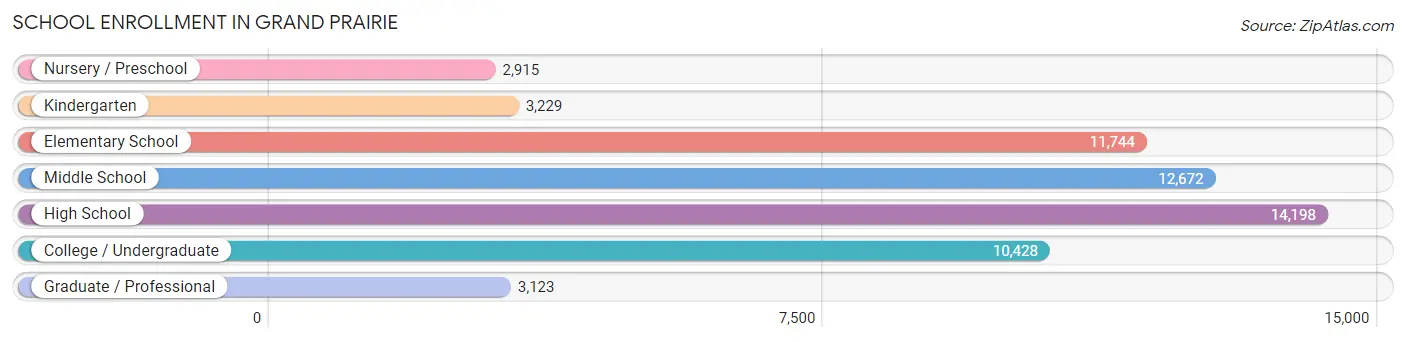
| School Level | # Students | % Students |
| Nursery / Preschool | 2,915 | 5.0% |
| Kindergarten | 3,229 | 5.5% |
| Elementary School | 11,744 | 20.1% |
| Middle School | 12,672 | 21.7% |
| High School | 14,198 | 24.3% |
| College / Undergraduate | 10,428 | 17.9% |
| Graduate / Professional | 3,123 | 5.4% |
| Total | 58,309 | 100.0% |
School Enrollment by Age by Funding Source in Grand Prairie
Out of a total of 58,309 students who are enrolled in schools in Grand Prairie, 5,948 (10.2%) attend a private institution, while the remaining 52,361 (89.8%) are enrolled in public schools. The age group of 35 years and over has the highest likelihood of being enrolled in private schools, with 1,192 (34.5% in the age bracket) enrolled. Conversely, the age group of 15 to 17 year olds has the lowest likelihood of being enrolled in a private school, with 10,075 (96.5% in the age bracket) attending a public institution.
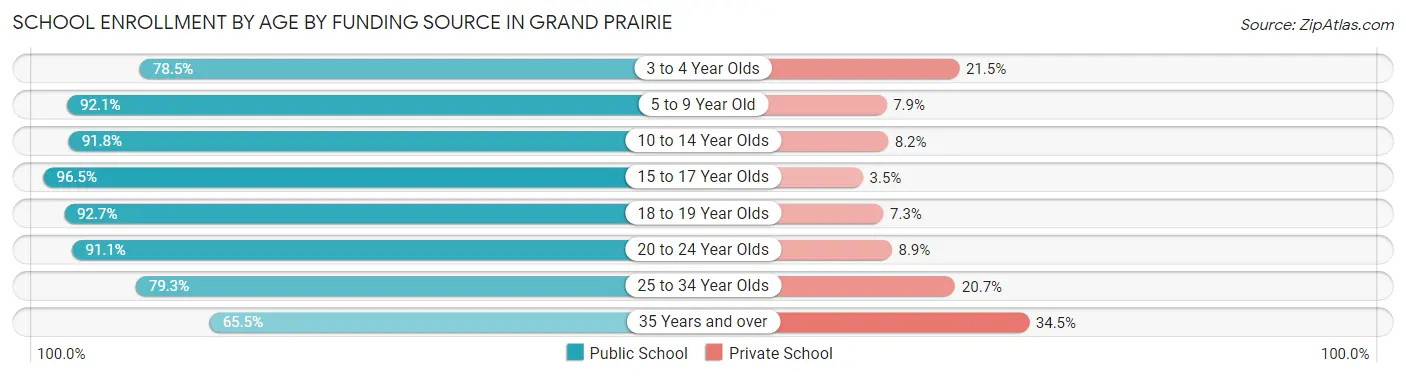
| Age Bracket | Public School | Private School |
| 3 to 4 Year Olds | 1,736 (78.5%) | 475 (21.5%) |
| 5 to 9 Year Old | 12,714 (92.1%) | 1,094 (7.9%) |
| 10 to 14 Year Olds | 14,686 (91.8%) | 1,315 (8.2%) |
| 15 to 17 Year Olds | 10,075 (96.5%) | 369 (3.5%) |
| 18 to 19 Year Olds | 3,609 (92.7%) | 286 (7.3%) |
| 20 to 24 Year Olds | 4,136 (91.1%) | 405 (8.9%) |
| 25 to 34 Year Olds | 3,134 (79.3%) | 819 (20.7%) |
| 35 Years and over | 2,264 (65.5%) | 1,192 (34.5%) |
| Total | 52,361 (89.8%) | 5,948 (10.2%) |
Educational Attainment by Field of Study in Grand Prairie
Business (10,701 | 30.0%), science & technology (3,893 | 10.9%), education (3,458 | 9.7%), arts & humanities (2,638 | 7.4%), and computers & mathematics (2,196 | 6.1%) are the most common fields of study among 35,706 individuals in Grand Prairie who have obtained a bachelor's degree or higher.
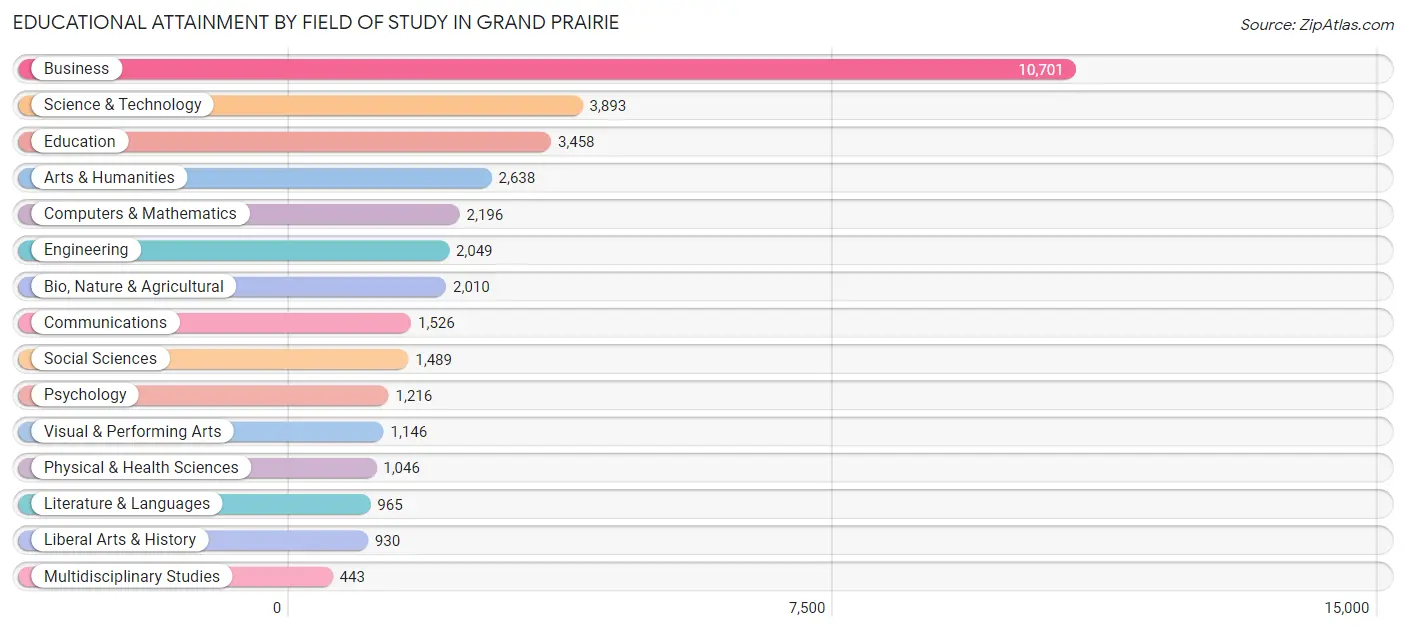
| Field of Study | # Graduates | % Graduates |
| Computers & Mathematics | 2,196 | 6.1% |
| Bio, Nature & Agricultural | 2,010 | 5.6% |
| Physical & Health Sciences | 1,046 | 2.9% |
| Psychology | 1,216 | 3.4% |
| Social Sciences | 1,489 | 4.2% |
| Engineering | 2,049 | 5.7% |
| Multidisciplinary Studies | 443 | 1.2% |
| Science & Technology | 3,893 | 10.9% |
| Business | 10,701 | 30.0% |
| Education | 3,458 | 9.7% |
| Literature & Languages | 965 | 2.7% |
| Liberal Arts & History | 930 | 2.6% |
| Visual & Performing Arts | 1,146 | 3.2% |
| Communications | 1,526 | 4.3% |
| Arts & Humanities | 2,638 | 7.4% |
| Total | 35,706 | 100.0% |
Transportation & Commute in Grand Prairie
Vehicle Availability by Sex in Grand Prairie
The most prevalent vehicle ownership categories in Grand Prairie are males with 2 vehicles (19,324, accounting for 36.5%) and females with 2 vehicles (15,571, making up 43.4%).
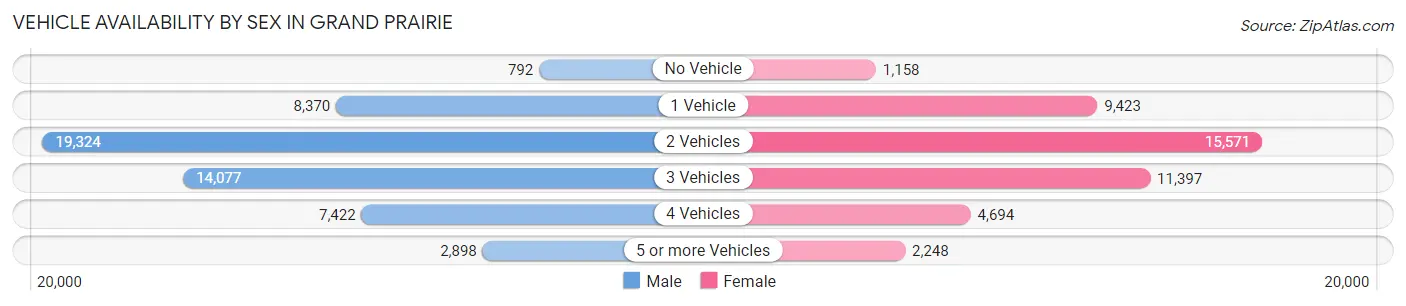
| Vehicles Available | Male | Female |
| No Vehicle | 792 (1.5%) | 1,158 (2.6%) |
| 1 Vehicle | 8,370 (15.8%) | 9,423 (21.2%) |
| 2 Vehicles | 19,324 (36.5%) | 15,571 (35.0%) |
| 3 Vehicles | 14,077 (26.6%) | 11,397 (25.6%) |
| 4 Vehicles | 7,422 (14.0%) | 4,694 (10.5%) |
| 5 or more Vehicles | 2,898 (5.5%) | 2,248 (5.1%) |
| Total | 52,883 (100.0%) | 44,491 (100.0%) |
Commute Time in Grand Prairie
The most frequently occuring commute durations in Grand Prairie are 30 to 34 minutes (16,157 commuters, 18.2%), 20 to 24 minutes (12,478 commuters, 14.1%), and 15 to 19 minutes (12,104 commuters, 13.7%).
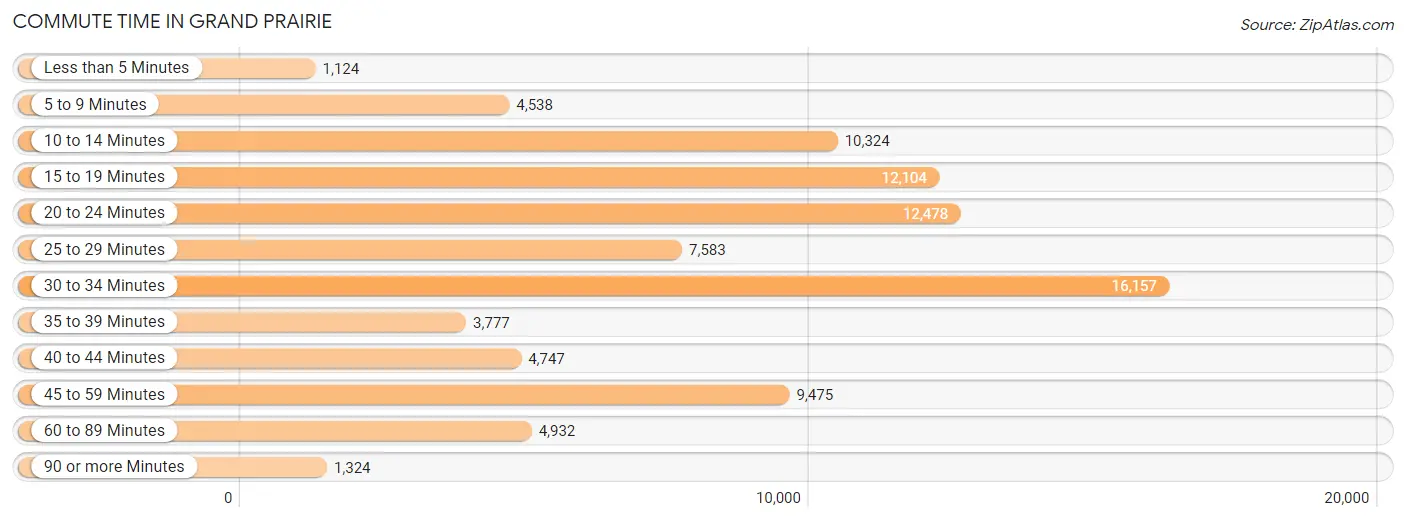
| Commute Time | # Commuters | % Commuters |
| Less than 5 Minutes | 1,124 | 1.3% |
| 5 to 9 Minutes | 4,538 | 5.1% |
| 10 to 14 Minutes | 10,324 | 11.7% |
| 15 to 19 Minutes | 12,104 | 13.7% |
| 20 to 24 Minutes | 12,478 | 14.1% |
| 25 to 29 Minutes | 7,583 | 8.6% |
| 30 to 34 Minutes | 16,157 | 18.2% |
| 35 to 39 Minutes | 3,777 | 4.3% |
| 40 to 44 Minutes | 4,747 | 5.4% |
| 45 to 59 Minutes | 9,475 | 10.7% |
| 60 to 89 Minutes | 4,932 | 5.6% |
| 90 or more Minutes | 1,324 | 1.5% |
Commute Time by Sex in Grand Prairie
The most common commute times in Grand Prairie are 30 to 34 minutes (8,946 commuters, 18.3%) for males and 30 to 34 minutes (7,211 commuters, 18.2%) for females.
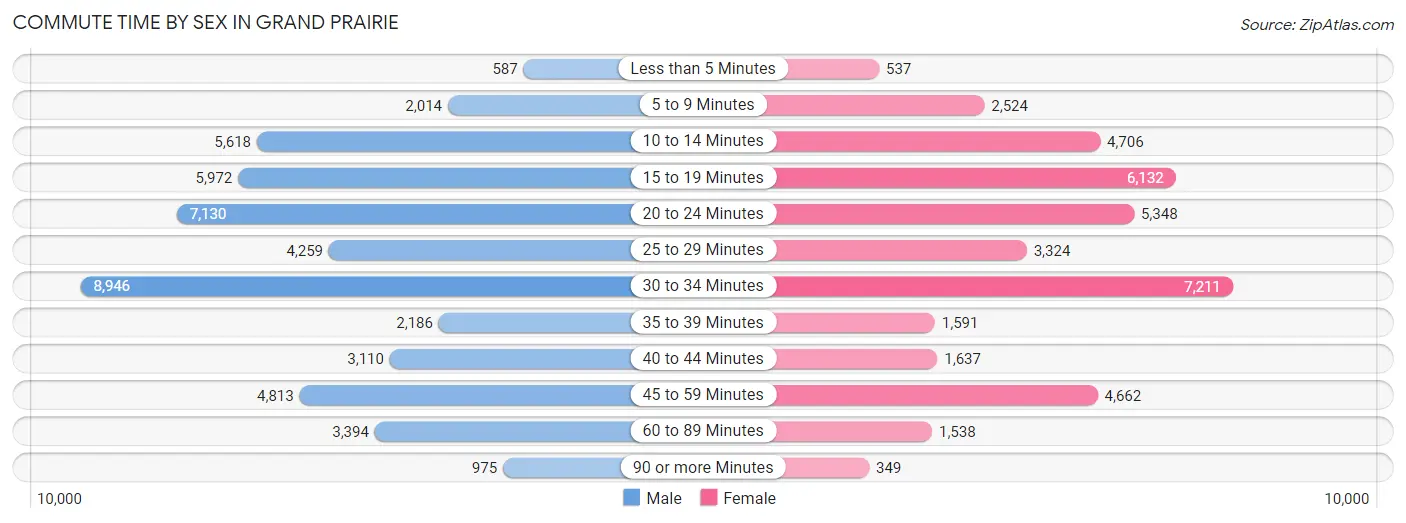
| Commute Time | Male | Female |
| Less than 5 Minutes | 587 (1.2%) | 537 (1.4%) |
| 5 to 9 Minutes | 2,014 (4.1%) | 2,524 (6.4%) |
| 10 to 14 Minutes | 5,618 (11.5%) | 4,706 (11.9%) |
| 15 to 19 Minutes | 5,972 (12.2%) | 6,132 (15.5%) |
| 20 to 24 Minutes | 7,130 (14.5%) | 5,348 (13.5%) |
| 25 to 29 Minutes | 4,259 (8.7%) | 3,324 (8.4%) |
| 30 to 34 Minutes | 8,946 (18.3%) | 7,211 (18.2%) |
| 35 to 39 Minutes | 2,186 (4.5%) | 1,591 (4.0%) |
| 40 to 44 Minutes | 3,110 (6.4%) | 1,637 (4.1%) |
| 45 to 59 Minutes | 4,813 (9.8%) | 4,662 (11.8%) |
| 60 to 89 Minutes | 3,394 (6.9%) | 1,538 (3.9%) |
| 90 or more Minutes | 975 (2.0%) | 349 (0.9%) |
Time of Departure to Work by Sex in Grand Prairie
The most frequent times of departure to work in Grand Prairie are 6:00 AM to 6:29 AM (6,605, 13.5%) for males and 7:00 AM to 7:29 AM (7,344, 18.6%) for females.
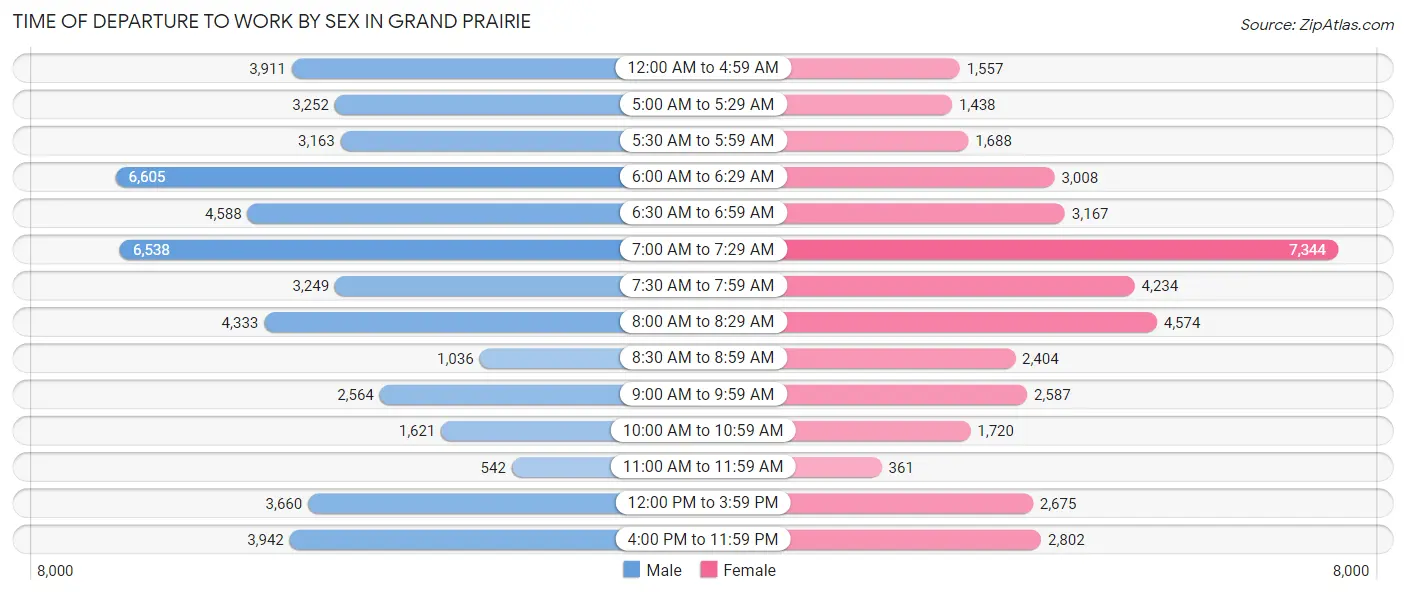
| Time of Departure | Male | Female |
| 12:00 AM to 4:59 AM | 3,911 (8.0%) | 1,557 (3.9%) |
| 5:00 AM to 5:29 AM | 3,252 (6.6%) | 1,438 (3.6%) |
| 5:30 AM to 5:59 AM | 3,163 (6.5%) | 1,688 (4.3%) |
| 6:00 AM to 6:29 AM | 6,605 (13.5%) | 3,008 (7.6%) |
| 6:30 AM to 6:59 AM | 4,588 (9.4%) | 3,167 (8.0%) |
| 7:00 AM to 7:29 AM | 6,538 (13.3%) | 7,344 (18.6%) |
| 7:30 AM to 7:59 AM | 3,249 (6.6%) | 4,234 (10.7%) |
| 8:00 AM to 8:29 AM | 4,333 (8.8%) | 4,574 (11.6%) |
| 8:30 AM to 8:59 AM | 1,036 (2.1%) | 2,404 (6.1%) |
| 9:00 AM to 9:59 AM | 2,564 (5.2%) | 2,587 (6.5%) |
| 10:00 AM to 10:59 AM | 1,621 (3.3%) | 1,720 (4.3%) |
| 11:00 AM to 11:59 AM | 542 (1.1%) | 361 (0.9%) |
| 12:00 PM to 3:59 PM | 3,660 (7.5%) | 2,675 (6.8%) |
| 4:00 PM to 11:59 PM | 3,942 (8.0%) | 2,802 (7.1%) |
| Total | 49,004 (100.0%) | 39,559 (100.0%) |
Housing Occupancy in Grand Prairie
Occupancy by Ownership in Grand Prairie
Of the total 65,740 dwellings in Grand Prairie, owner-occupied units account for 38,891 (59.2%), while renter-occupied units make up 26,849 (40.8%).
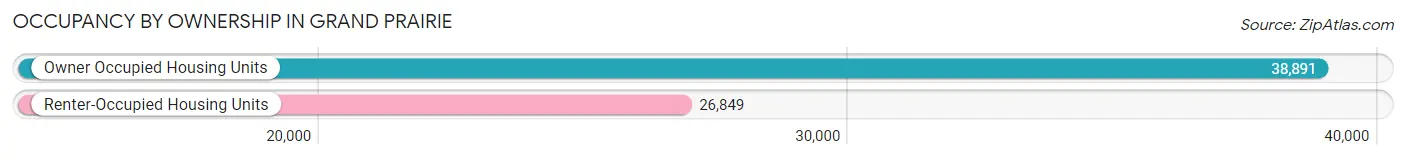
| Occupancy | # Housing Units | % Housing Units |
| Owner Occupied Housing Units | 38,891 | 59.2% |
| Renter-Occupied Housing Units | 26,849 | 40.8% |
| Total Occupied Housing Units | 65,740 | 100.0% |
Occupancy by Household Size in Grand Prairie
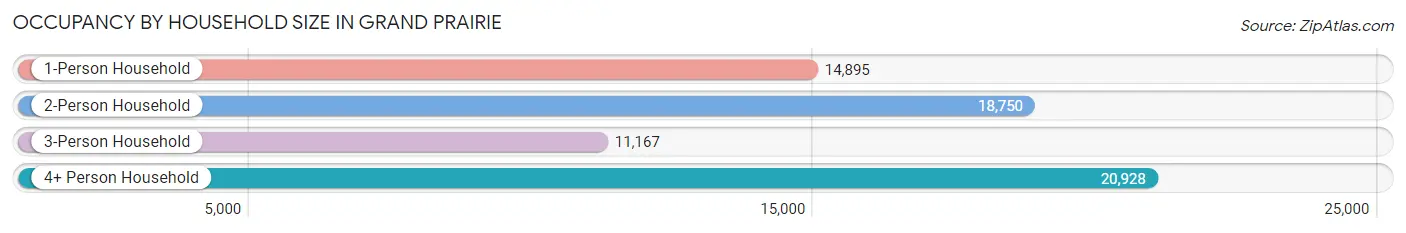
| Household Size | # Housing Units | % Housing Units |
| 1-Person Household | 14,895 | 22.7% |
| 2-Person Household | 18,750 | 28.5% |
| 3-Person Household | 11,167 | 17.0% |
| 4+ Person Household | 20,928 | 31.8% |
| Total Housing Units | 65,740 | 100.0% |
Occupancy by Ownership by Household Size in Grand Prairie
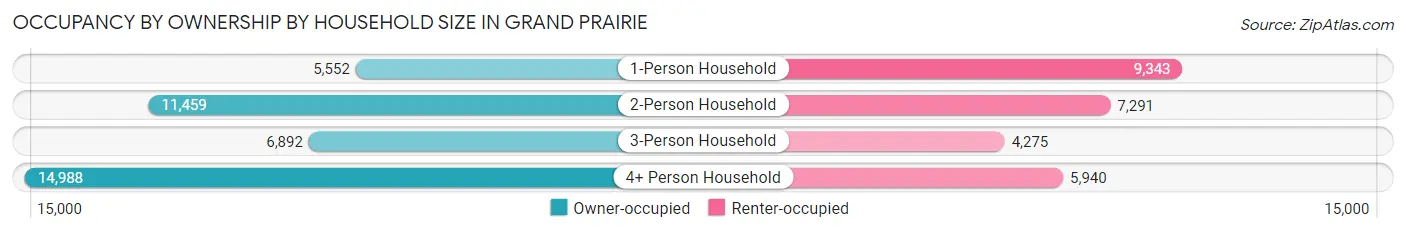
| Household Size | Owner-occupied | Renter-occupied |
| 1-Person Household | 5,552 (37.3%) | 9,343 (62.7%) |
| 2-Person Household | 11,459 (61.1%) | 7,291 (38.9%) |
| 3-Person Household | 6,892 (61.7%) | 4,275 (38.3%) |
| 4+ Person Household | 14,988 (71.6%) | 5,940 (28.4%) |
| Total Housing Units | 38,891 (59.2%) | 26,849 (40.8%) |
Occupancy by Educational Attainment in Grand Prairie
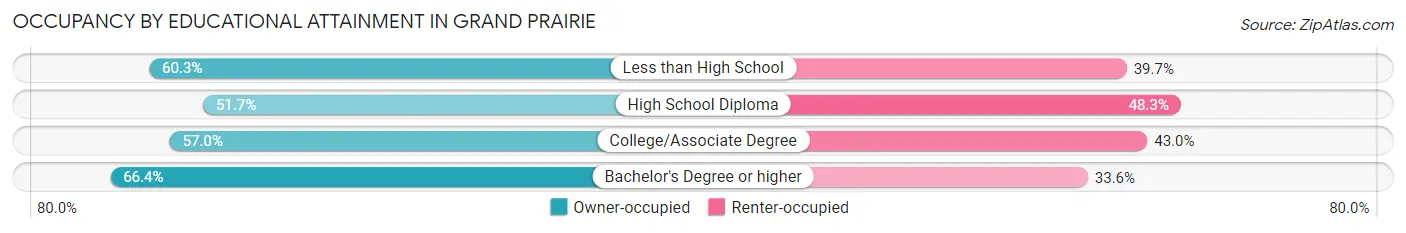
| Household Size | Owner-occupied | Renter-occupied |
| Less than High School | 6,014 (60.3%) | 3,966 (39.7%) |
| High School Diploma | 8,180 (51.7%) | 7,642 (48.3%) |
| College/Associate Degree | 11,060 (57.0%) | 8,345 (43.0%) |
| Bachelor's Degree or higher | 13,637 (66.4%) | 6,896 (33.6%) |
Occupancy by Age of Householder in Grand Prairie
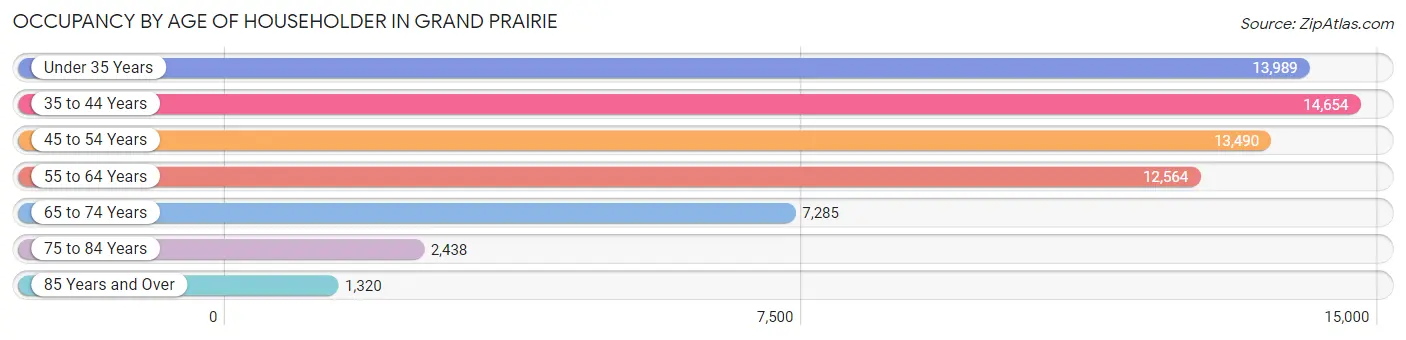
| Age Bracket | # Households | % Households |
| Under 35 Years | 13,989 | 21.3% |
| 35 to 44 Years | 14,654 | 22.3% |
| 45 to 54 Years | 13,490 | 20.5% |
| 55 to 64 Years | 12,564 | 19.1% |
| 65 to 74 Years | 7,285 | 11.1% |
| 75 to 84 Years | 2,438 | 3.7% |
| 85 Years and Over | 1,320 | 2.0% |
| Total | 65,740 | 100.0% |
Housing Finances in Grand Prairie
Median Income by Occupancy in Grand Prairie
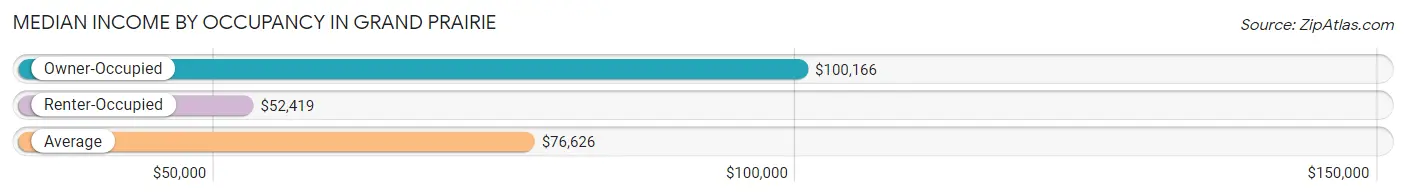
| Occupancy Type | # Households | Median Income |
| Owner-Occupied | 38,891 (59.2%) | $100,166 |
| Renter-Occupied | 26,849 (40.8%) | $52,419 |
| Average | 65,740 (100.0%) | $76,626 |
Occupancy by Householder Income Bracket in Grand Prairie
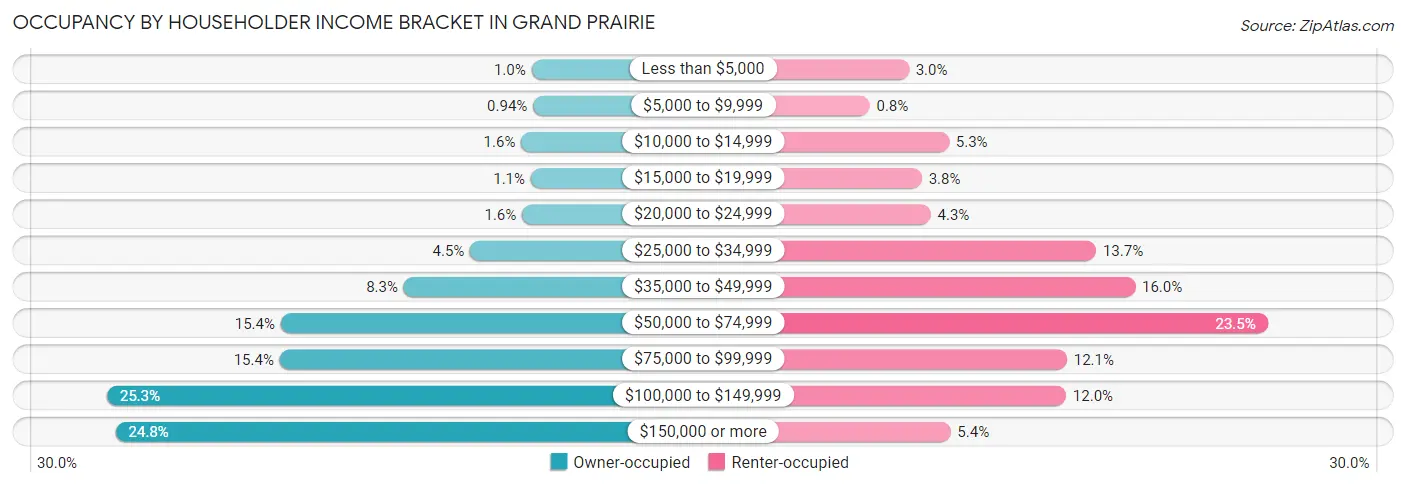
| Income Bracket | Owner-occupied | Renter-occupied |
| Less than $5,000 | 401 (1.0%) | 816 (3.0%) |
| $5,000 to $9,999 | 365 (0.9%) | 215 (0.8%) |
| $10,000 to $14,999 | 631 (1.6%) | 1,432 (5.3%) |
| $15,000 to $19,999 | 417 (1.1%) | 1,016 (3.8%) |
| $20,000 to $24,999 | 612 (1.6%) | 1,152 (4.3%) |
| $25,000 to $34,999 | 1,767 (4.5%) | 3,688 (13.7%) |
| $35,000 to $49,999 | 3,239 (8.3%) | 4,288 (16.0%) |
| $50,000 to $74,999 | 5,973 (15.4%) | 6,320 (23.5%) |
| $75,000 to $99,999 | 5,998 (15.4%) | 3,241 (12.1%) |
| $100,000 to $149,999 | 9,839 (25.3%) | 3,226 (12.0%) |
| $150,000 or more | 9,649 (24.8%) | 1,455 (5.4%) |
| Total | 38,891 (100.0%) | 26,849 (100.0%) |
Monthly Housing Cost Tiers in Grand Prairie
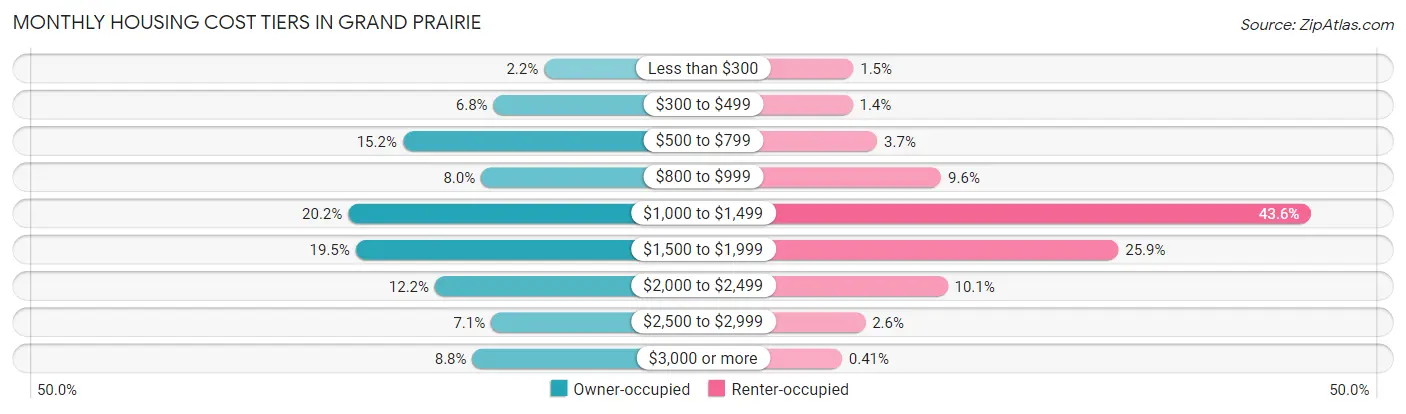
| Monthly Cost | Owner-occupied | Renter-occupied |
| Less than $300 | 847 (2.2%) | 393 (1.5%) |
| $300 to $499 | 2,659 (6.8%) | 374 (1.4%) |
| $500 to $799 | 5,908 (15.2%) | 982 (3.7%) |
| $800 to $999 | 3,103 (8.0%) | 2,565 (9.6%) |
| $1,000 to $1,499 | 7,863 (20.2%) | 11,708 (43.6%) |
| $1,500 to $1,999 | 7,595 (19.5%) | 6,943 (25.9%) |
| $2,000 to $2,499 | 4,756 (12.2%) | 2,722 (10.1%) |
| $2,500 to $2,999 | 2,744 (7.1%) | 687 (2.6%) |
| $3,000 or more | 3,416 (8.8%) | 110 (0.4%) |
| Total | 38,891 (100.0%) | 26,849 (100.0%) |
Physical Housing Characteristics in Grand Prairie
Housing Structures in Grand Prairie
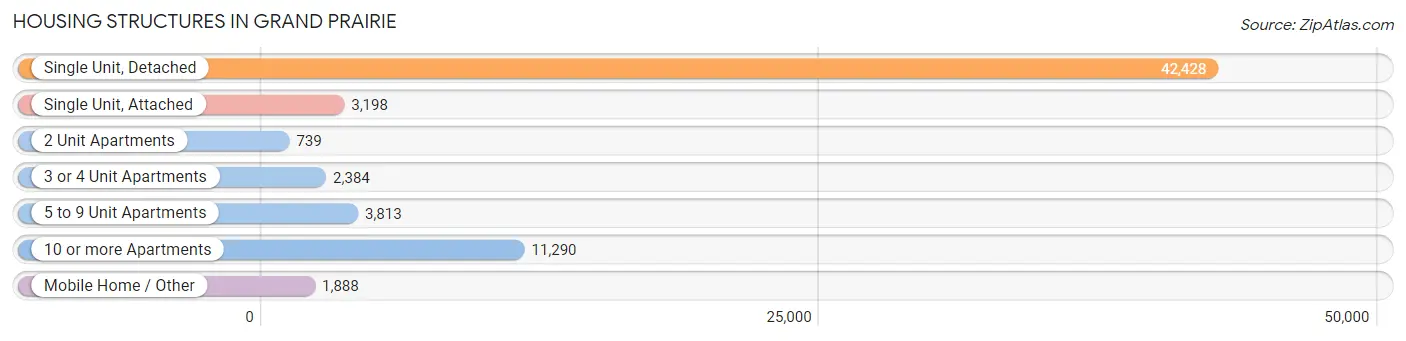
| Structure Type | # Housing Units | % Housing Units |
| Single Unit, Detached | 42,428 | 64.5% |
| Single Unit, Attached | 3,198 | 4.9% |
| 2 Unit Apartments | 739 | 1.1% |
| 3 or 4 Unit Apartments | 2,384 | 3.6% |
| 5 to 9 Unit Apartments | 3,813 | 5.8% |
| 10 or more Apartments | 11,290 | 17.2% |
| Mobile Home / Other | 1,888 | 2.9% |
| Total | 65,740 | 100.0% |
Housing Structures by Occupancy in Grand Prairie
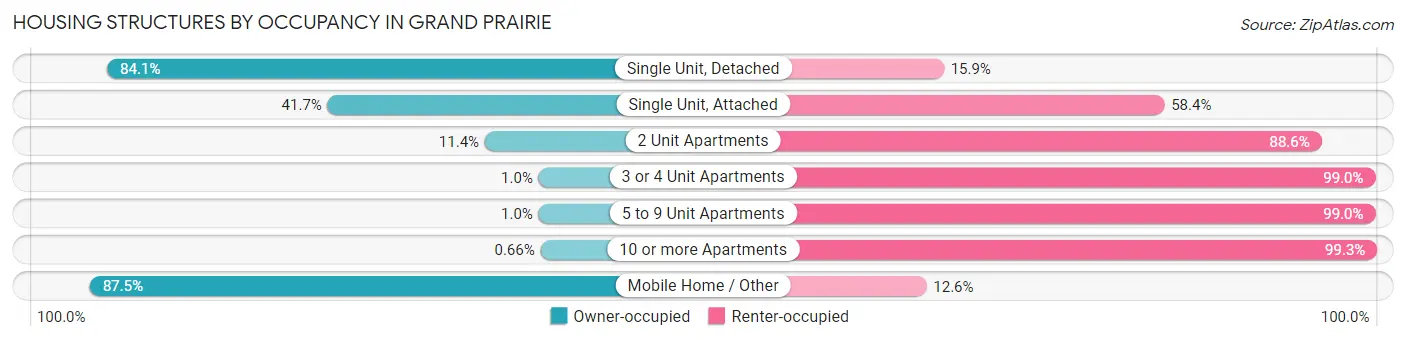
| Structure Type | Owner-occupied | Renter-occupied |
| Single Unit, Detached | 35,687 (84.1%) | 6,741 (15.9%) |
| Single Unit, Attached | 1,332 (41.6%) | 1,866 (58.4%) |
| 2 Unit Apartments | 84 (11.4%) | 655 (88.6%) |
| 3 or 4 Unit Apartments | 24 (1.0%) | 2,360 (99.0%) |
| 5 to 9 Unit Apartments | 39 (1.0%) | 3,774 (99.0%) |
| 10 or more Apartments | 74 (0.7%) | 11,216 (99.3%) |
| Mobile Home / Other | 1,651 (87.5%) | 237 (12.6%) |
| Total | 38,891 (59.2%) | 26,849 (40.8%) |
Housing Structures by Number of Rooms in Grand Prairie
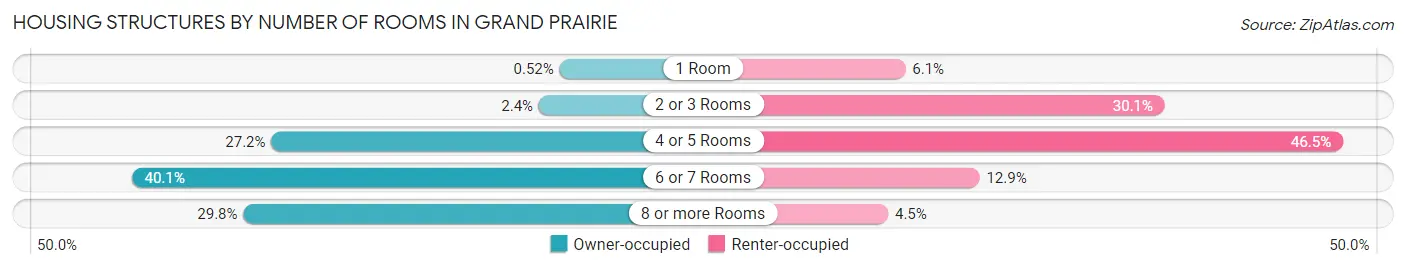
| Number of Rooms | Owner-occupied | Renter-occupied |
| 1 Room | 203 (0.5%) | 1,625 (6.0%) |
| 2 or 3 Rooms | 944 (2.4%) | 8,069 (30.0%) |
| 4 or 5 Rooms | 10,570 (27.2%) | 12,493 (46.5%) |
| 6 or 7 Rooms | 15,598 (40.1%) | 3,466 (12.9%) |
| 8 or more Rooms | 11,576 (29.8%) | 1,196 (4.4%) |
| Total | 38,891 (100.0%) | 26,849 (100.0%) |
Housing Structure by Heating Type in Grand Prairie
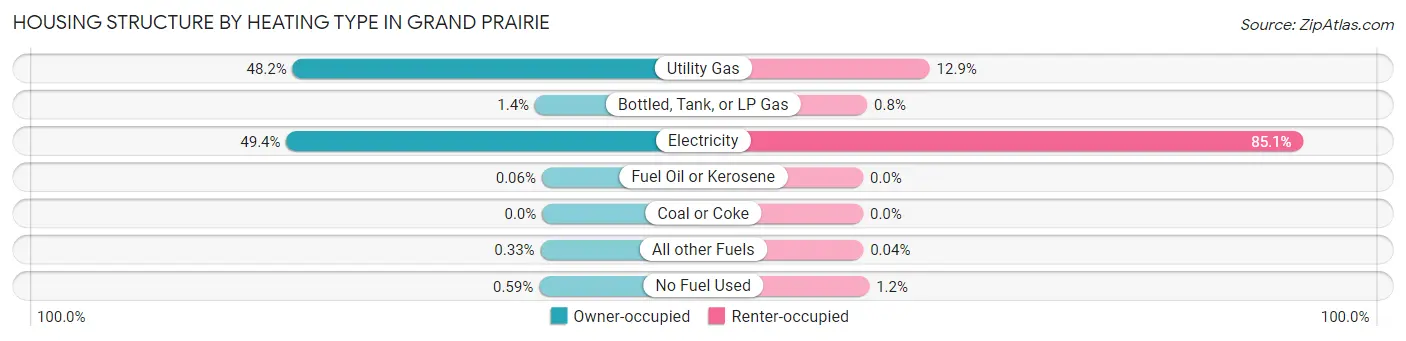
| Heating Type | Owner-occupied | Renter-occupied |
| Utility Gas | 18,755 (48.2%) | 3,455 (12.9%) |
| Bottled, Tank, or LP Gas | 538 (1.4%) | 216 (0.8%) |
| Electricity | 19,218 (49.4%) | 22,845 (85.1%) |
| Fuel Oil or Kerosene | 23 (0.1%) | 0 (0.0%) |
| Coal or Coke | 0 (0.0%) | 0 (0.0%) |
| All other Fuels | 128 (0.3%) | 10 (0.0%) |
| No Fuel Used | 229 (0.6%) | 323 (1.2%) |
| Total | 38,891 (100.0%) | 26,849 (100.0%) |
Household Vehicle Usage in Grand Prairie
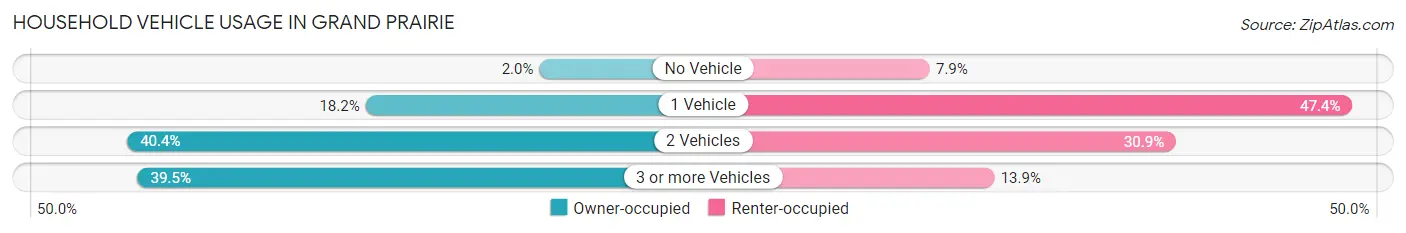
| Vehicles per Household | Owner-occupied | Renter-occupied |
| No Vehicle | 758 (1.9%) | 2,108 (7.9%) |
| 1 Vehicle | 7,069 (18.2%) | 12,715 (47.4%) |
| 2 Vehicles | 15,720 (40.4%) | 8,297 (30.9%) |
| 3 or more Vehicles | 15,344 (39.5%) | 3,729 (13.9%) |
| Total | 38,891 (100.0%) | 26,849 (100.0%) |
Real Estate & Mortgages in Grand Prairie
Real Estate and Mortgage Overview in Grand Prairie
| Characteristic | Without Mortgage | With Mortgage |
| Housing Units | 14,637 | 24,254 |
| Median Property Value | $212,700 | $261,100 |
| Median Household Income | $80,489 | $7,328 |
| Monthly Housing Costs | $710 | $3,394 |
| Real Estate Taxes | $3,449 | $710 |
Property Value by Mortgage Status in Grand Prairie
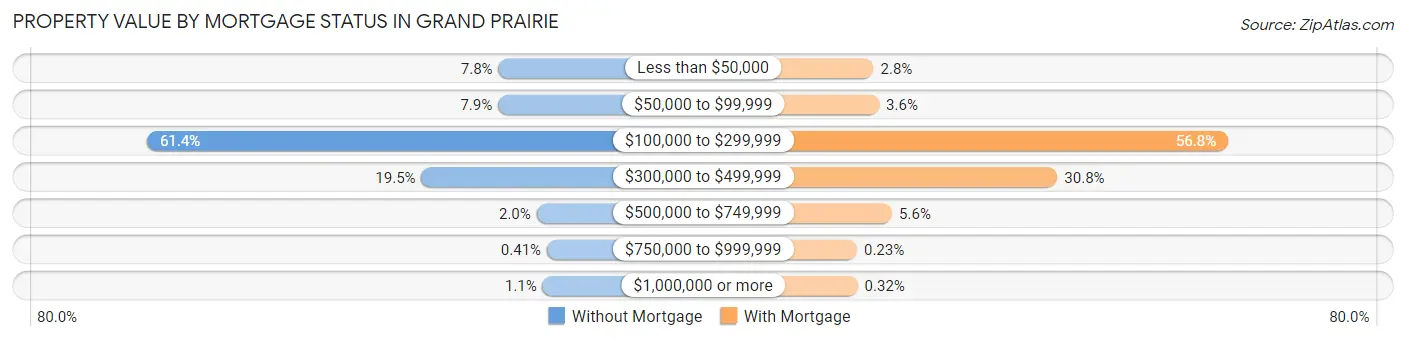
| Property Value | Without Mortgage | With Mortgage |
| Less than $50,000 | 1,142 (7.8%) | 666 (2.8%) |
| $50,000 to $99,999 | 1,151 (7.9%) | 874 (3.6%) |
| $100,000 to $299,999 | 8,980 (61.4%) | 13,767 (56.8%) |
| $300,000 to $499,999 | 2,859 (19.5%) | 7,460 (30.8%) |
| $500,000 to $749,999 | 290 (2.0%) | 1,354 (5.6%) |
| $750,000 to $999,999 | 60 (0.4%) | 56 (0.2%) |
| $1,000,000 or more | 155 (1.1%) | 77 (0.3%) |
| Total | 14,637 (100.0%) | 24,254 (100.0%) |
Household Income by Mortgage Status in Grand Prairie
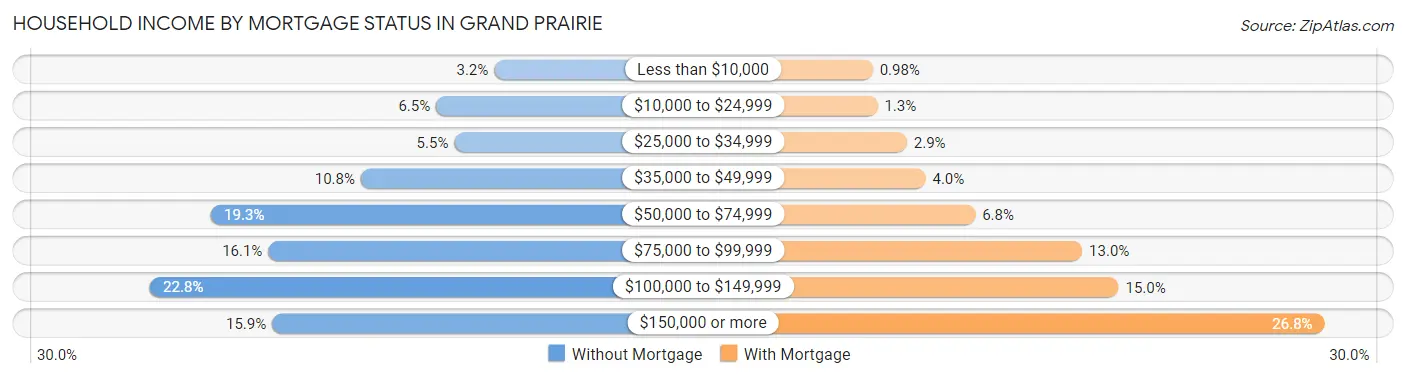
| Household Income | Without Mortgage | With Mortgage |
| Less than $10,000 | 464 (3.2%) | 237 (1.0%) |
| $10,000 to $24,999 | 950 (6.5%) | 302 (1.3%) |
| $25,000 to $34,999 | 797 (5.4%) | 710 (2.9%) |
| $35,000 to $49,999 | 1,579 (10.8%) | 970 (4.0%) |
| $50,000 to $74,999 | 2,831 (19.3%) | 1,660 (6.8%) |
| $75,000 to $99,999 | 2,353 (16.1%) | 3,142 (13.0%) |
| $100,000 to $149,999 | 3,342 (22.8%) | 3,645 (15.0%) |
| $150,000 or more | 2,321 (15.9%) | 6,497 (26.8%) |
| Total | 14,637 (100.0%) | 24,254 (100.0%) |
Property Value to Household Income Ratio in Grand Prairie
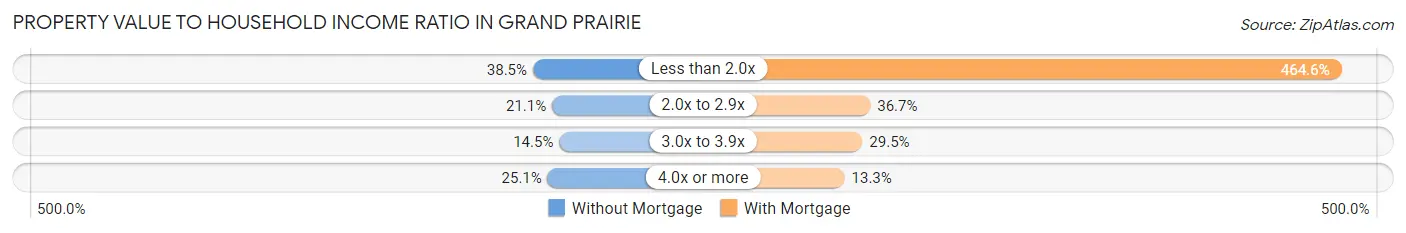
| Value-to-Income Ratio | Without Mortgage | With Mortgage |
| Less than 2.0x | 5,629 (38.5%) | 112,677 (464.6%) |
| 2.0x to 2.9x | 3,084 (21.1%) | 8,897 (36.7%) |
| 3.0x to 3.9x | 2,126 (14.5%) | 7,149 (29.5%) |
| 4.0x or more | 3,669 (25.1%) | 3,234 (13.3%) |
| Total | 14,637 (100.0%) | 24,254 (100.0%) |
Real Estate Taxes by Mortgage Status in Grand Prairie
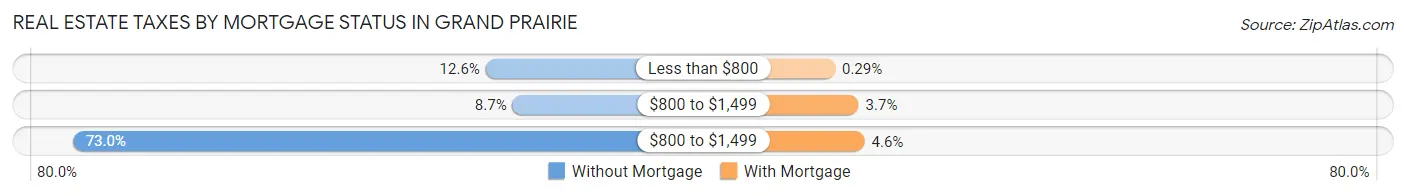
| Property Taxes | Without Mortgage | With Mortgage |
| Less than $800 | 1,848 (12.6%) | 70 (0.3%) |
| $800 to $1,499 | 1,275 (8.7%) | 908 (3.7%) |
| $800 to $1,499 | 10,681 (73.0%) | 1,117 (4.6%) |
| Total | 14,637 (100.0%) | 24,254 (100.0%) |
Health & Disability in Grand Prairie
Health Insurance Coverage by Age in Grand Prairie
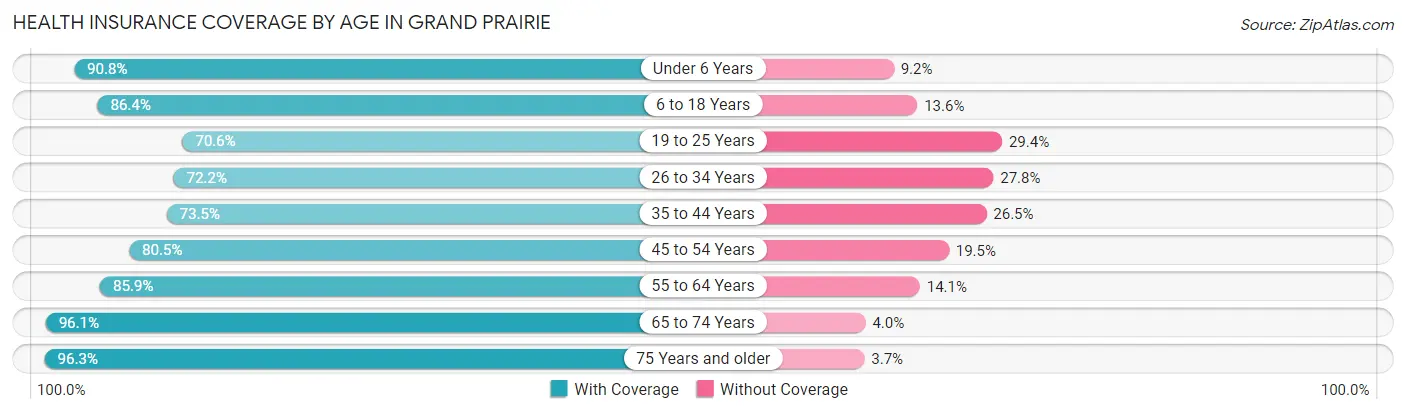
| Age Bracket | With Coverage | Without Coverage |
| Under 6 Years | 13,986 (90.8%) | 1,420 (9.2%) |
| 6 to 18 Years | 36,583 (86.4%) | 5,758 (13.6%) |
| 19 to 25 Years | 13,369 (70.6%) | 5,570 (29.4%) |
| 26 to 34 Years | 18,077 (72.2%) | 6,953 (27.8%) |
| 35 to 44 Years | 20,343 (73.5%) | 7,331 (26.5%) |
| 45 to 54 Years | 20,374 (80.5%) | 4,932 (19.5%) |
| 55 to 64 Years | 18,972 (85.9%) | 3,109 (14.1%) |
| 65 to 74 Years | 12,732 (96.1%) | 524 (4.0%) |
| 75 Years and older | 6,568 (96.3%) | 255 (3.7%) |
| Total | 161,004 (81.8%) | 35,852 (18.2%) |
Health Insurance Coverage by Citizenship Status in Grand Prairie
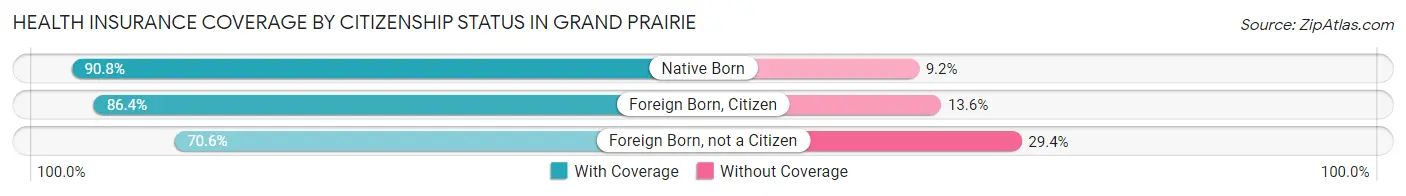
| Citizenship Status | With Coverage | Without Coverage |
| Native Born | 13,986 (90.8%) | 1,420 (9.2%) |
| Foreign Born, Citizen | 36,583 (86.4%) | 5,758 (13.6%) |
| Foreign Born, not a Citizen | 13,369 (70.6%) | 5,570 (29.4%) |
Health Insurance Coverage by Household Income in Grand Prairie
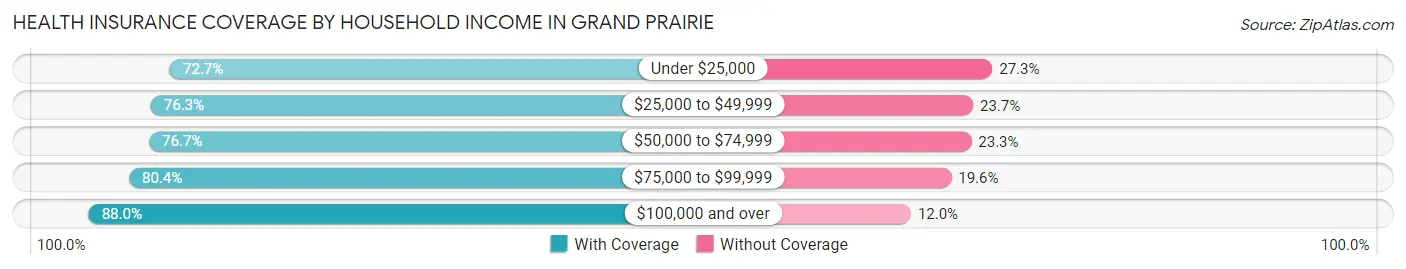
| Household Income | With Coverage | Without Coverage |
| Under $25,000 | 11,262 (72.7%) | 4,221 (27.3%) |
| $25,000 to $49,999 | 25,547 (76.3%) | 7,916 (23.7%) |
| $50,000 to $74,999 | 25,980 (76.7%) | 7,908 (23.3%) |
| $75,000 to $99,999 | 22,112 (80.4%) | 5,380 (19.6%) |
| $100,000 and over | 75,964 (88.0%) | 10,375 (12.0%) |
Public vs Private Health Insurance Coverage by Age in Grand Prairie
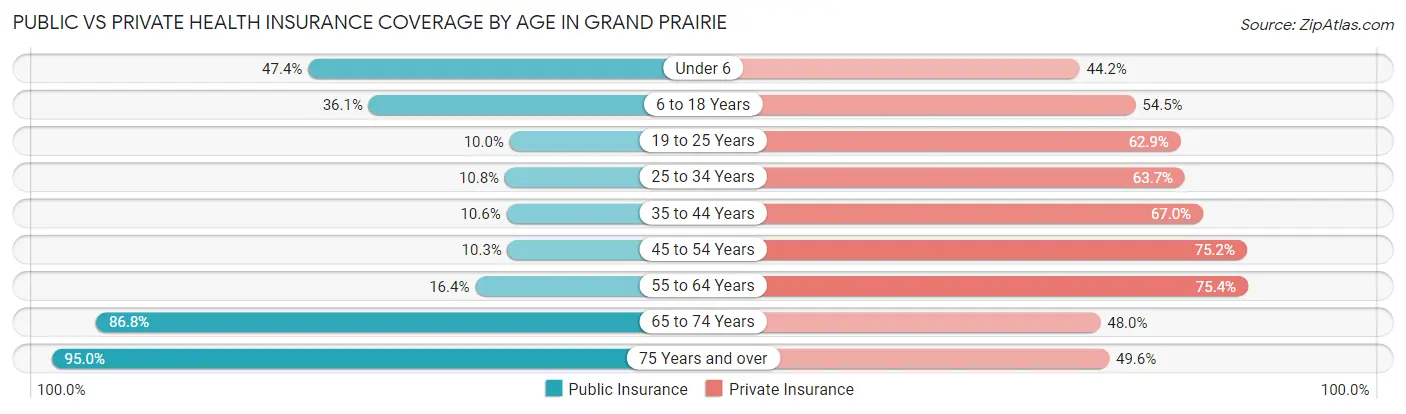
| Age Bracket | Public Insurance | Private Insurance |
| Under 6 | 7,298 (47.4%) | 6,802 (44.2%) |
| 6 to 18 Years | 15,294 (36.1%) | 23,077 (54.5%) |
| 19 to 25 Years | 1,886 (10.0%) | 11,913 (62.9%) |
| 25 to 34 Years | 2,714 (10.8%) | 15,938 (63.7%) |
| 35 to 44 Years | 2,921 (10.6%) | 18,550 (67.0%) |
| 45 to 54 Years | 2,616 (10.3%) | 19,021 (75.2%) |
| 55 to 64 Years | 3,613 (16.4%) | 16,642 (75.4%) |
| 65 to 74 Years | 11,500 (86.8%) | 6,360 (48.0%) |
| 75 Years and over | 6,480 (95.0%) | 3,384 (49.6%) |
| Total | 54,322 (27.6%) | 121,687 (61.8%) |
Disability Status by Sex by Age in Grand Prairie
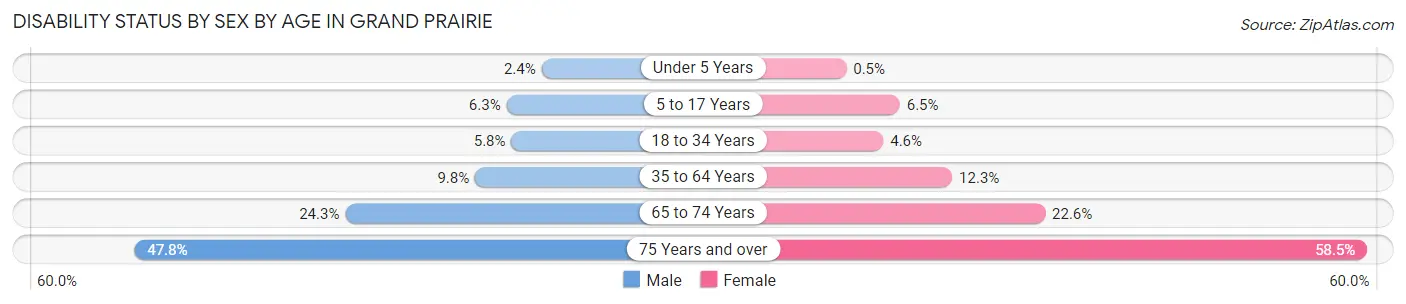
| Age Bracket | Male | Female |
| Under 5 Years | 157 (2.4%) | 29 (0.5%) |
| 5 to 17 Years | 1,347 (6.3%) | 1,356 (6.5%) |
| 18 to 34 Years | 1,341 (5.8%) | 1,112 (4.6%) |
| 35 to 64 Years | 3,593 (9.8%) | 4,730 (12.3%) |
| 65 to 74 Years | 1,435 (24.3%) | 1,664 (22.6%) |
| 75 Years and over | 1,474 (47.8%) | 2,187 (58.5%) |
Disability Class by Sex by Age in Grand Prairie
Disability Class: Hearing Difficulty
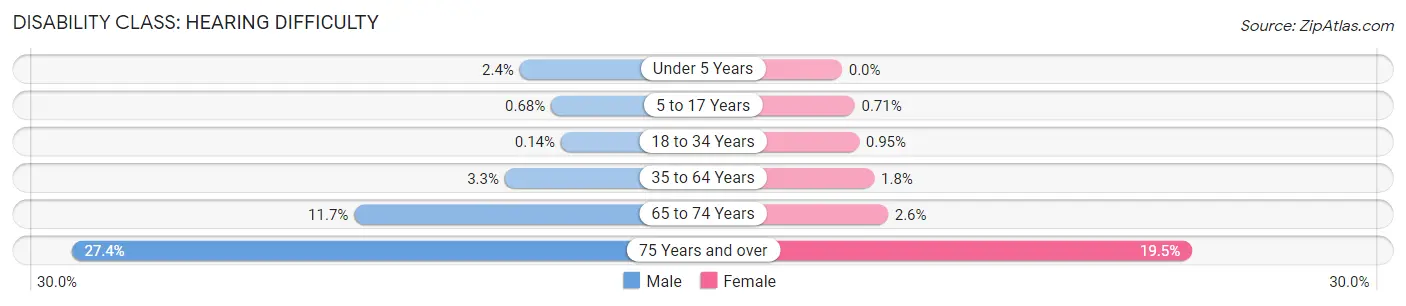
| Age Bracket | Male | Female |
| Under 5 Years | 157 (2.4%) | 0 (0.0%) |
| 5 to 17 Years | 145 (0.7%) | 148 (0.7%) |
| 18 to 34 Years | 32 (0.1%) | 228 (0.9%) |
| 35 to 64 Years | 1,191 (3.3%) | 691 (1.8%) |
| 65 to 74 Years | 688 (11.7%) | 188 (2.6%) |
| 75 Years and over | 845 (27.4%) | 729 (19.5%) |
Disability Class: Vision Difficulty
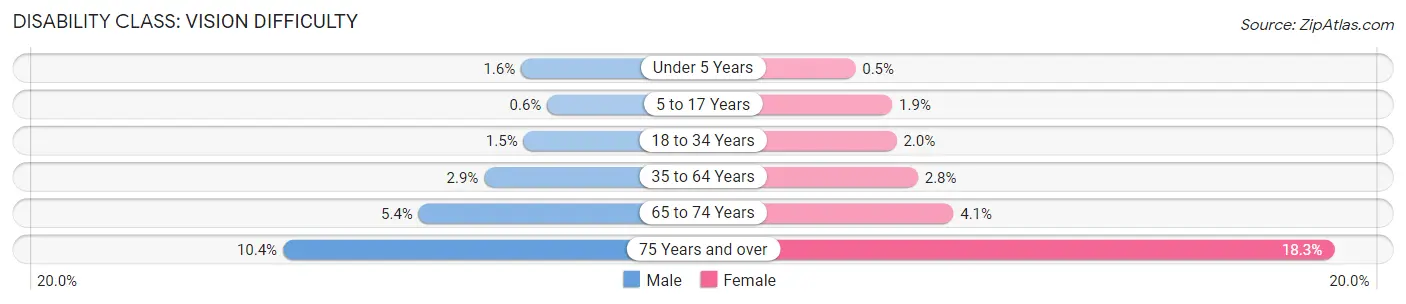
| Age Bracket | Male | Female |
| Under 5 Years | 101 (1.6%) | 29 (0.5%) |
| 5 to 17 Years | 127 (0.6%) | 393 (1.9%) |
| 18 to 34 Years | 343 (1.5%) | 488 (2.0%) |
| 35 to 64 Years | 1,076 (2.9%) | 1,087 (2.8%) |
| 65 to 74 Years | 317 (5.4%) | 304 (4.1%) |
| 75 Years and over | 321 (10.4%) | 683 (18.3%) |
Disability Class: Cognitive Difficulty
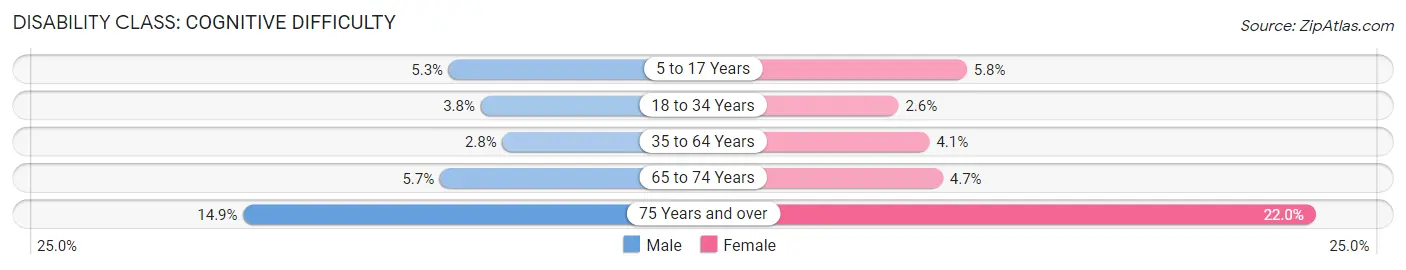
| Age Bracket | Male | Female |
| 5 to 17 Years | 1,130 (5.3%) | 1,217 (5.8%) |
| 18 to 34 Years | 887 (3.8%) | 634 (2.6%) |
| 35 to 64 Years | 1,033 (2.8%) | 1,565 (4.1%) |
| 65 to 74 Years | 338 (5.7%) | 345 (4.7%) |
| 75 Years and over | 458 (14.8%) | 822 (22.0%) |
Disability Class: Ambulatory Difficulty
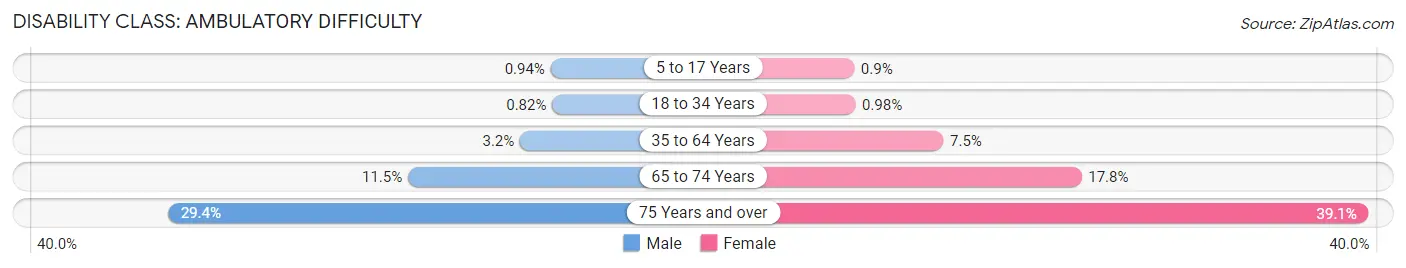
| Age Bracket | Male | Female |
| 5 to 17 Years | 201 (0.9%) | 189 (0.9%) |
| 18 to 34 Years | 189 (0.8%) | 237 (1.0%) |
| 35 to 64 Years | 1,175 (3.2%) | 2,895 (7.5%) |
| 65 to 74 Years | 681 (11.5%) | 1,307 (17.8%) |
| 75 Years and over | 906 (29.4%) | 1,462 (39.1%) |
Disability Class: Self-Care Difficulty
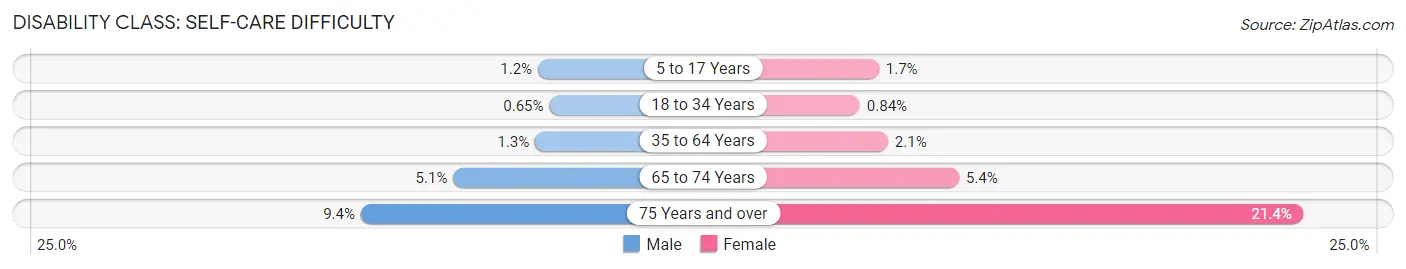
| Age Bracket | Male | Female |
| 5 to 17 Years | 252 (1.2%) | 360 (1.7%) |
| 18 to 34 Years | 150 (0.6%) | 201 (0.8%) |
| 35 to 64 Years | 478 (1.3%) | 824 (2.1%) |
| 65 to 74 Years | 302 (5.1%) | 400 (5.4%) |
| 75 Years and over | 290 (9.4%) | 801 (21.4%) |
Technology Access in Grand Prairie
Computing Device Access in Grand Prairie
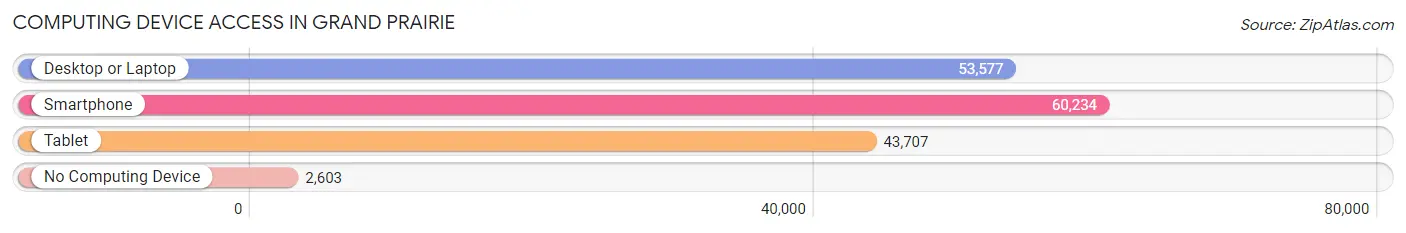
| Device Type | # Households | % Households |
| Desktop or Laptop | 53,577 | 81.5% |
| Smartphone | 60,234 | 91.6% |
| Tablet | 43,707 | 66.5% |
| No Computing Device | 2,603 | 4.0% |
| Total | 65,740 | 100.0% |
Internet Access in Grand Prairie
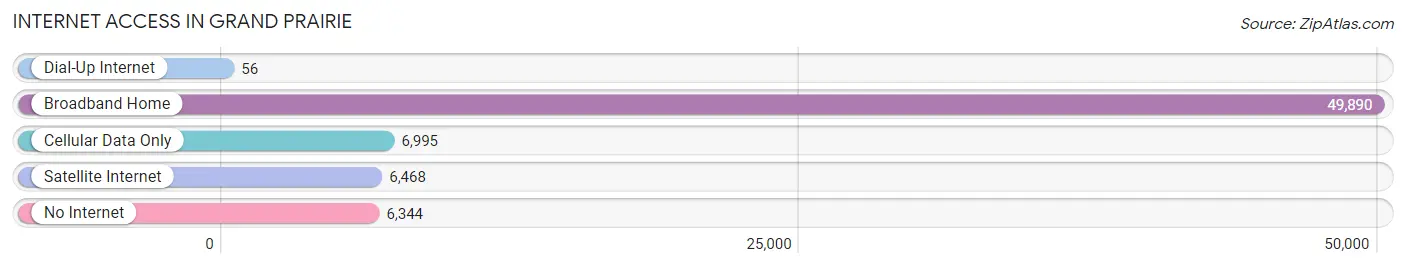
| Internet Type | # Households | % Households |
| Dial-Up Internet | 56 | 0.1% |
| Broadband Home | 49,890 | 75.9% |
| Cellular Data Only | 6,995 | 10.6% |
| Satellite Internet | 6,468 | 9.8% |
| No Internet | 6,344 | 9.7% |
| Total | 65,740 | 100.0% |
Grand Prairie Summary
Geography
Geographically, Grand Prairie is located in the Dallas-Fort Worth Metroplex in the U.S. state of Texas. It is situated in the center of Dallas, Tarrant, and Denton counties, and is part of the Mid-Cities region. Grand Prairie is bordered by the cities of Arlington to the north, Irving to the west, Cedar Hill to the south, and Mesquite to the east. The city is situated on the Trinity River, which is a tributary of the Trinity River, and is part of the Trinity River watershed.
Grand Prairie covers an area of approximately 60 square miles, with a population of approximately 175,396 people as of the 2010 census. The city is divided into four distinct geographic regions: the northern, central, southern, and western regions. The northern region is primarily residential, while the central region is home to the city's downtown area and is the most densely populated. The southern region is mostly industrial, while the western region is mostly rural.
History
Grand Prairie was first settled in the late 1800s by settlers from the nearby city of Dallas. The city was originally known as Dechman, after the family who owned the land. In 1902, the city was renamed Grand Prairie after the nearby prairie.
The city was officially incorporated in 1909, and the first mayor was elected in 1910. The city quickly grew in population and industry, and by the 1920s, Grand Prairie was home to several cotton gins, a cottonseed oil mill, and a flour mill.
In the 1950s, the city experienced a period of rapid growth, as the population increased from 4,000 to over 20,000. This growth was largely due to the city's proximity to Dallas and Fort Worth, as well as the development of the Dallas-Fort Worth International Airport.
Economy
Grand Prairie is home to a diverse economy, with a variety of industries represented. The city is home to several large employers, including Lockheed Martin, Bell Helicopter, and the Grand Prairie Independent School District.
The city is also home to a number of retail and entertainment venues, including the Grand Prairie Premium Outlets, the Grand Prairie AirHogs baseball team, and the Verizon Theatre.
Demographics
As of the 2010 census, Grand Prairie had a population of 175,396 people. The racial makeup of the city was 57.2% White, 24.2% African American, 0.7% Native American, 4.3% Asian, 0.1% Pacific Islander, 11.3% from other races, and 2.2% from two or more races. Hispanic or Latino of any race were 28.2% of the population.
The median income for a household in the city was $45,945, and the median income for a family was $51,914. The per capita income for the city was $21,845. About 11.3% of families and 14.2% of the population were below the poverty line, including 19.2% of those under age 18 and 8.2% of those age 65 or over.
Common Questions
What is Per Capita Income in Grand Prairie?
Per Capita income in Grand Prairie is $32,444.
What is the Median Family Income in Grand Prairie?
Median Family Income in Grand Prairie is $88,342.
What is the Median Household income in Grand Prairie?
Median Household Income in Grand Prairie is $76,626.
What is Income or Wage Gap in Grand Prairie?
Income or Wage Gap in Grand Prairie is 31.6%.
Women in Grand Prairie earn 68.4 cents for every dollar earned by a man.
What is Family Income Deficit in Grand Prairie?
Family Income Deficit in Grand Prairie is $10,362.
Families that are below poverty line in Grand Prairie earn $10,362 less on average than the poverty threshold level.
What is Inequality or Gini Index in Grand Prairie?
Inequality or Gini Index in Grand Prairie is 0.41.
What is the Total Population of Grand Prairie?
Total Population of Grand Prairie is 197,279.
What is the Total Male Population of Grand Prairie?
Total Male Population of Grand Prairie is 96,719.
What is the Total Female Population of Grand Prairie?
Total Female Population of Grand Prairie is 100,560.
What is the Ratio of Males per 100 Females in Grand Prairie?
There are 96.18 Males per 100 Females in Grand Prairie.
What is the Ratio of Females per 100 Males in Grand Prairie?
There are 103.97 Females per 100 Males in Grand Prairie.
What is the Median Population Age in Grand Prairie?
Median Population Age in Grand Prairie is 33.7 Years.
What is the Average Family Size in Grand Prairie
Average Family Size in Grand Prairie is 3.6 People.
What is the Average Household Size in Grand Prairie
Average Household Size in Grand Prairie is 3.0 People.
How Large is the Labor Force in Grand Prairie?
There are 105,197 People in the Labor Forcein in Grand Prairie.
What is the Percentage of People in the Labor Force in Grand Prairie?
70.0% of People are in the Labor Force in Grand Prairie.
What is the Unemployment Rate in Grand Prairie?
Unemployment Rate in Grand Prairie is 5.0%.