Akron, OH Map & Demographics
Akron Map
Akron Overview
$28,390
PER CAPITA INCOME
$60,328
AVG FAMILY INCOME
$46,596
AVG HOUSEHOLD INCOME
20.1%
WAGE / INCOME GAP [ % ]
79.9¢/ $1
WAGE / INCOME GAP [ $ ]
$11,016
FAMILY INCOME DEFICIT
0.46
INEQUALITY / GINI INDEX
190,273
TOTAL POPULATION
91,892
MALE POPULATION
98,381
FEMALE POPULATION
93.40
MALES / 100 FEMALES
107.06
FEMALES / 100 MALES
37.1
MEDIAN AGE
3.0
AVG FAMILY SIZE
2.2
AVG HOUSEHOLD SIZE
97,372
LABOR FORCE [ PEOPLE ]
63.2%
PERCENT IN LABOR FORCE
7.7%
UNEMPLOYMENT RATE
Akron Zip Codes
Income in Akron
Income Overview in Akron
Per Capita Income in Akron is $28,390, while median incomes of families and households are $60,328 and $46,596 respectively.
| Characteristic | Number | Measure |
| Per Capita Income | 190,273 | $28,390 |
| Median Family Income | 43,623 | $60,328 |
| Mean Family Income | 43,623 | $76,682 |
| Median Household Income | 83,935 | $46,596 |
| Mean Household Income | 83,935 | $62,186 |
| Income Deficit | 43,623 | $11,016 |
| Wage / Income Gap (%) | 190,273 | 20.13% |
| Wage / Income Gap ($) | 190,273 | 79.87¢ per $1 |
| Gini / Inequality Index | 190,273 | 0.46 |
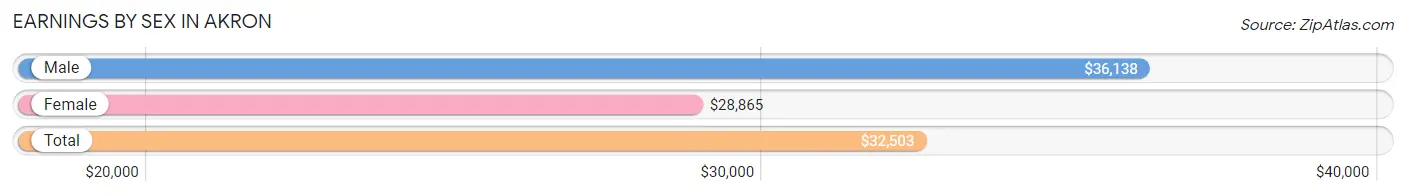
Earnings by Sex in Akron
Average Earnings in Akron are $32,503, $36,138 for men and $28,865 for women, a difference of 20.1%.
| Sex | Number | Average Earnings |
| Male | 51,623 (50.8%) | $36,138 |
| Female | 49,983 (49.2%) | $28,865 |
| Total | 101,606 (100.0%) | $32,503 |
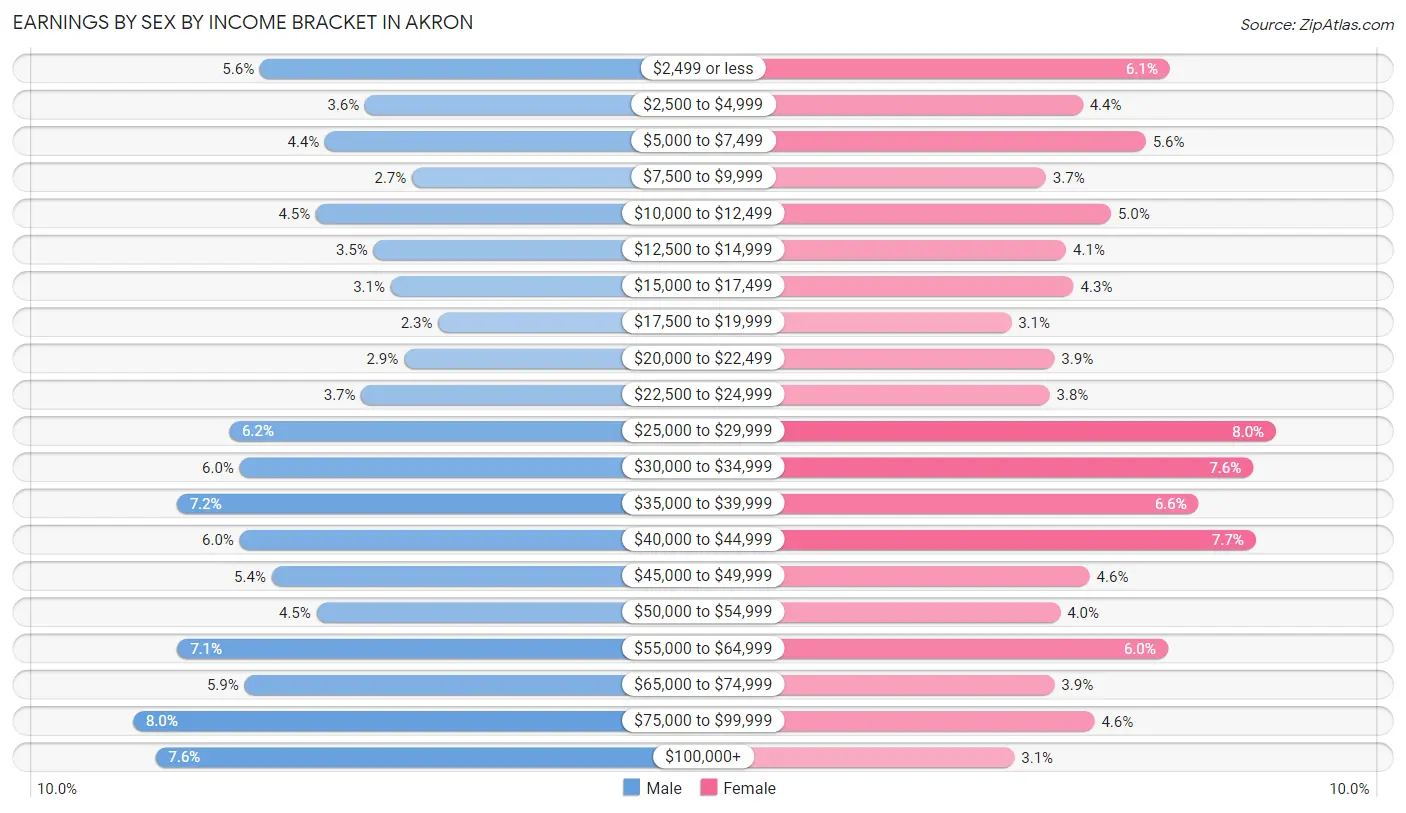
Earnings by Sex by Income Bracket in Akron
The most common earnings brackets in Akron are $75,000 to $99,999 for men (4,115 | 8.0%) and $25,000 to $29,999 for women (4,019 | 8.0%).
| Income | Male | Female |
| $2,499 or less | 2,885 (5.6%) | 3,026 (6.0%) |
| $2,500 to $4,999 | 1,867 (3.6%) | 2,207 (4.4%) |
| $5,000 to $7,499 | 2,255 (4.4%) | 2,801 (5.6%) |
| $7,500 to $9,999 | 1,416 (2.7%) | 1,863 (3.7%) |
| $10,000 to $12,499 | 2,343 (4.5%) | 2,474 (5.0%) |
| $12,500 to $14,999 | 1,784 (3.5%) | 2,054 (4.1%) |
| $15,000 to $17,499 | 1,622 (3.1%) | 2,123 (4.3%) |
| $17,500 to $19,999 | 1,164 (2.2%) | 1,537 (3.1%) |
| $20,000 to $22,499 | 1,493 (2.9%) | 1,946 (3.9%) |
| $22,500 to $24,999 | 1,906 (3.7%) | 1,898 (3.8%) |
| $25,000 to $29,999 | 3,184 (6.2%) | 4,019 (8.0%) |
| $30,000 to $34,999 | 3,082 (6.0%) | 3,803 (7.6%) |
| $35,000 to $39,999 | 3,693 (7.1%) | 3,295 (6.6%) |
| $40,000 to $44,999 | 3,084 (6.0%) | 3,831 (7.7%) |
| $45,000 to $49,999 | 2,774 (5.4%) | 2,274 (4.5%) |
| $50,000 to $54,999 | 2,338 (4.5%) | 1,999 (4.0%) |
| $55,000 to $64,999 | 3,685 (7.1%) | 3,002 (6.0%) |
| $65,000 to $74,999 | 3,037 (5.9%) | 1,943 (3.9%) |
| $75,000 to $99,999 | 4,115 (8.0%) | 2,318 (4.6%) |
| $100,000+ | 3,896 (7.5%) | 1,570 (3.1%) |
| Total | 51,623 (100.0%) | 49,983 (100.0%) |
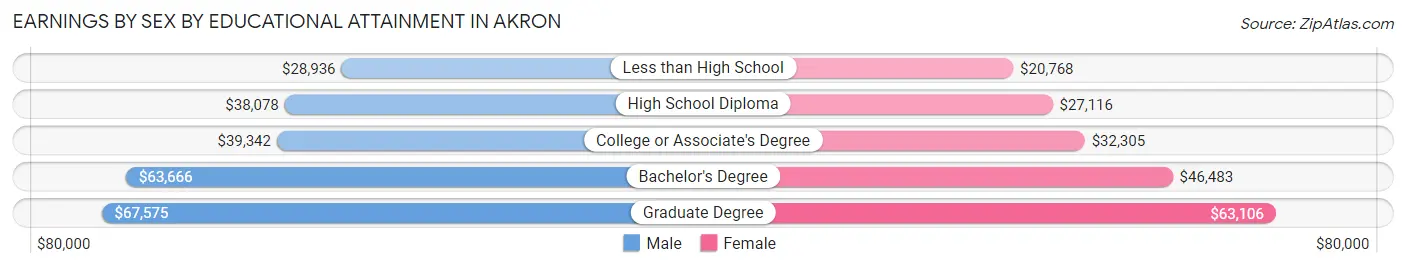
Earnings by Sex by Educational Attainment in Akron
Average earnings in Akron are $41,166 for men and $33,445 for women, a difference of 18.8%. Men with an educational attainment of graduate degree enjoy the highest average annual earnings of $67,575, while those with less than high school education earn the least with $28,936. Women with an educational attainment of graduate degree earn the most with the average annual earnings of $63,106, while those with less than high school education have the smallest earnings of $20,768.
| Educational Attainment | Male Income | Female Income |
| Less than High School | $28,936 | $20,768 |
| High School Diploma | $38,078 | $27,116 |
| College or Associate's Degree | $39,342 | $32,305 |
| Bachelor's Degree | $63,666 | $46,483 |
| Graduate Degree | $67,575 | $63,106 |
| Total | $41,166 | $33,445 |
Family Income in Akron
Family Income Brackets in Akron
According to the Akron family income data, there are 8,855 families falling into the $50,000 to $74,999 income range, which is the most common income bracket and makes up 20.3% of all families. Conversely, the $150,000 to $199,999 income bracket is the least frequent group with only 1,876 families (4.3%) belonging to this category.
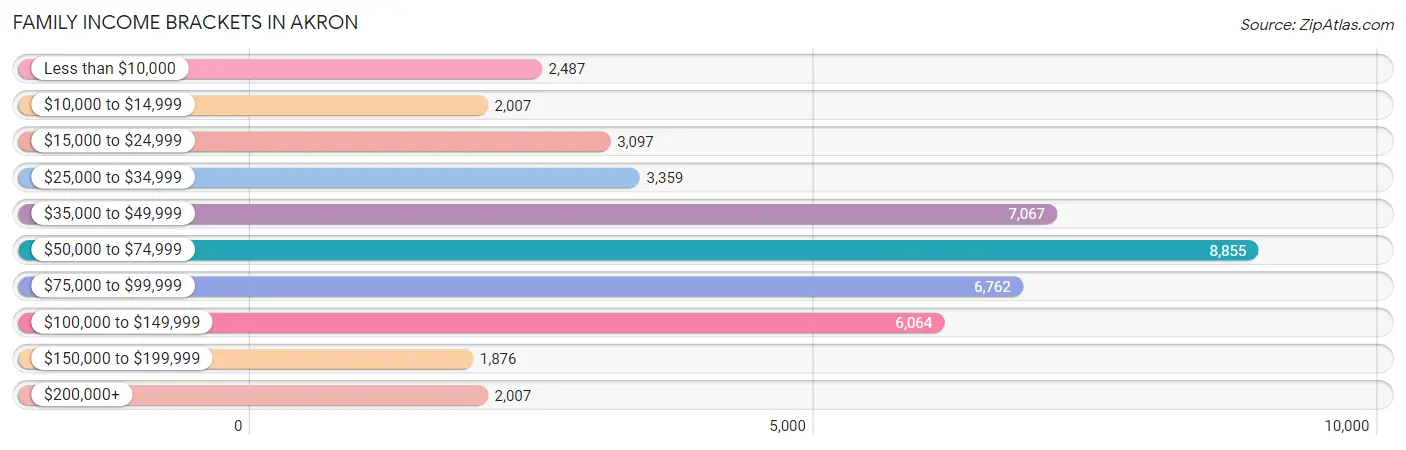
| Income Bracket | # Families | % Families |
| Less than $10,000 | 2,487 | 5.7% |
| $10,000 to $14,999 | 2,007 | 4.6% |
| $15,000 to $24,999 | 3,097 | 7.1% |
| $25,000 to $34,999 | 3,359 | 7.7% |
| $35,000 to $49,999 | 7,067 | 16.2% |
| $50,000 to $74,999 | 8,855 | 20.3% |
| $75,000 to $99,999 | 6,762 | 15.5% |
| $100,000 to $149,999 | 6,064 | 13.9% |
| $150,000 to $199,999 | 1,876 | 4.3% |
| $200,000+ | 2,007 | 4.6% |
Family Income by Famaliy Size in Akron
7+ person families (770 | 1.8%) account for the highest median family income in Akron with $64,737 per family, while 2-person families (22,364 | 51.3%) have the highest median income of $31,099 per family member.
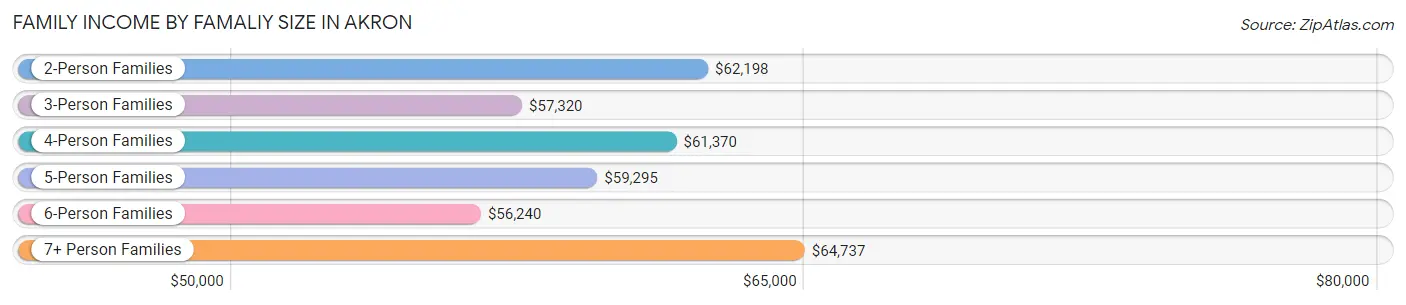
| Income Bracket | # Families | Median Income |
| 2-Person Families | 22,364 (51.3%) | $62,198 |
| 3-Person Families | 10,280 (23.6%) | $57,320 |
| 4-Person Families | 6,383 (14.6%) | $61,370 |
| 5-Person Families | 2,992 (6.9%) | $59,295 |
| 6-Person Families | 834 (1.9%) | $56,240 |
| 7+ Person Families | 770 (1.8%) | $64,737 |
| Total | 43,623 (100.0%) | $60,328 |
Family Income by Number of Earners in Akron
The median family income in Akron is $60,328, with families comprising 3+ earners (3,819) having the highest median family income of $103,589, while families with no earners (6,996) have the lowest median family income of $36,303, accounting for 8.7% and 16.0% of families, respectively.
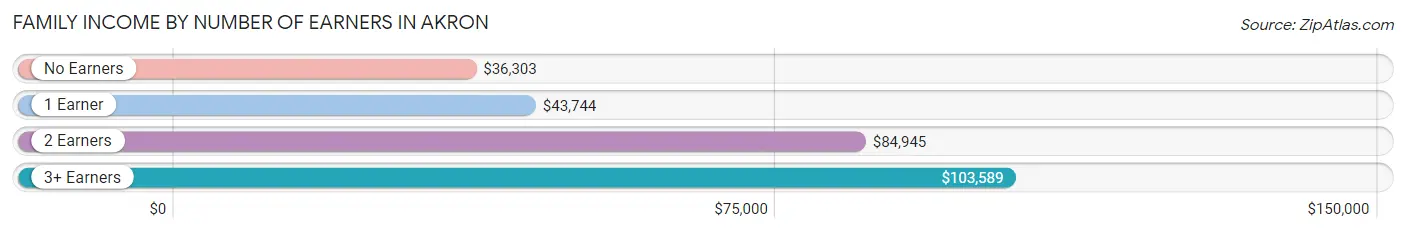
| Number of Earners | # Families | Median Income |
| No Earners | 6,996 (16.0%) | $36,303 |
| 1 Earner | 17,920 (41.1%) | $43,744 |
| 2 Earners | 14,888 (34.1%) | $84,945 |
| 3+ Earners | 3,819 (8.7%) | $103,589 |
| Total | 43,623 (100.0%) | $60,328 |
Household Income in Akron
Household Income Brackets in Akron
With 15,360 households falling in the category, the $50,000 to $74,999 income range is the most frequent in Akron, accounting for 18.3% of all households. In contrast, only 2,266 households (2.7%) fall into the $200,000+ income bracket, making it the least populous group.
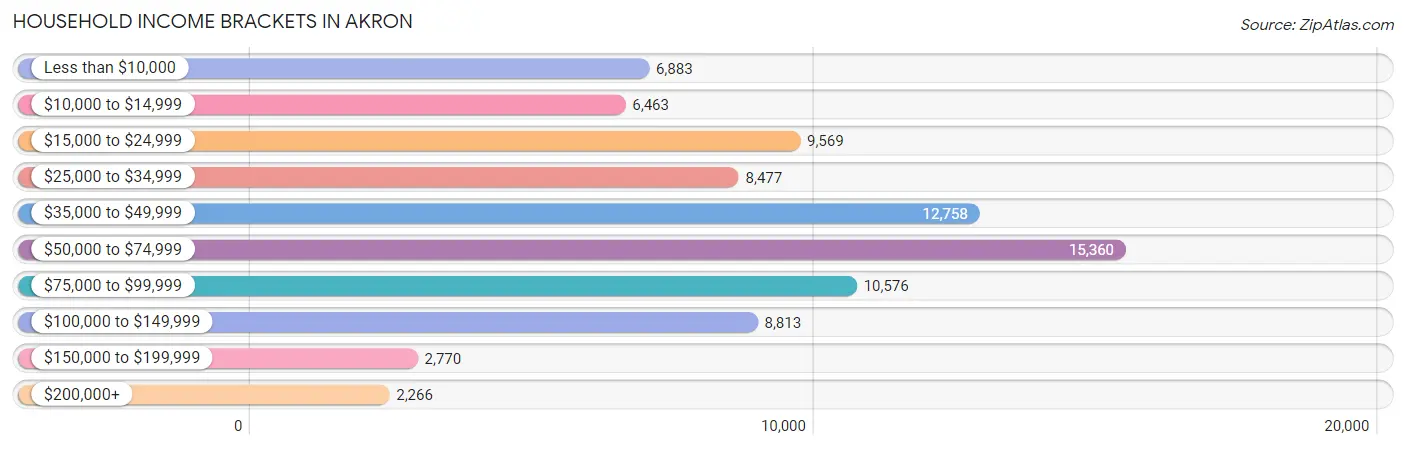
| Income Bracket | # Households | % Households |
| Less than $10,000 | 6,883 | 8.2% |
| $10,000 to $14,999 | 6,463 | 7.7% |
| $15,000 to $24,999 | 9,569 | 11.4% |
| $25,000 to $34,999 | 8,477 | 10.1% |
| $35,000 to $49,999 | 12,758 | 15.2% |
| $50,000 to $74,999 | 15,360 | 18.3% |
| $75,000 to $99,999 | 10,576 | 12.6% |
| $100,000 to $149,999 | 8,813 | 10.5% |
| $150,000 to $199,999 | 2,770 | 3.3% |
| $200,000+ | 2,266 | 2.7% |
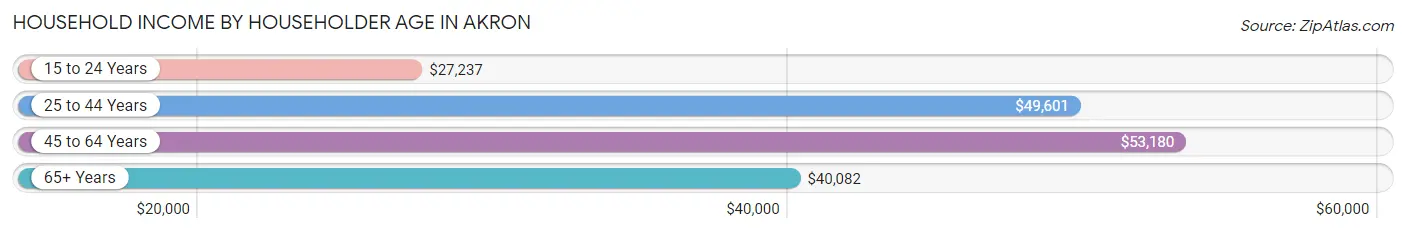
Household Income by Householder Age in Akron
The median household income in Akron is $46,596, with the highest median household income of $53,180 found in the 45 to 64 years age bracket for the primary householder. A total of 30,540 households (36.4%) fall into this category. Meanwhile, the 15 to 24 years age bracket for the primary householder has the lowest median household income of $27,237, with 4,846 households (5.8%) in this group.
| Income Bracket | # Households | Median Income |
| 15 to 24 Years | 4,846 (5.8%) | $27,237 |
| 25 to 44 Years | 28,423 (33.9%) | $49,601 |
| 45 to 64 Years | 30,540 (36.4%) | $53,180 |
| 65+ Years | 20,126 (24.0%) | $40,082 |
| Total | 83,935 (100.0%) | $46,596 |
Poverty in Akron
Income Below Poverty by Sex and Age in Akron
With 21.0% poverty level for males and 24.3% for females among the residents of Akron, 5 year old males and under 5 year old females are the most vulnerable to poverty, with 524 males (44.5%) and 2,252 females (39.8%) in their respective age groups living below the poverty level.
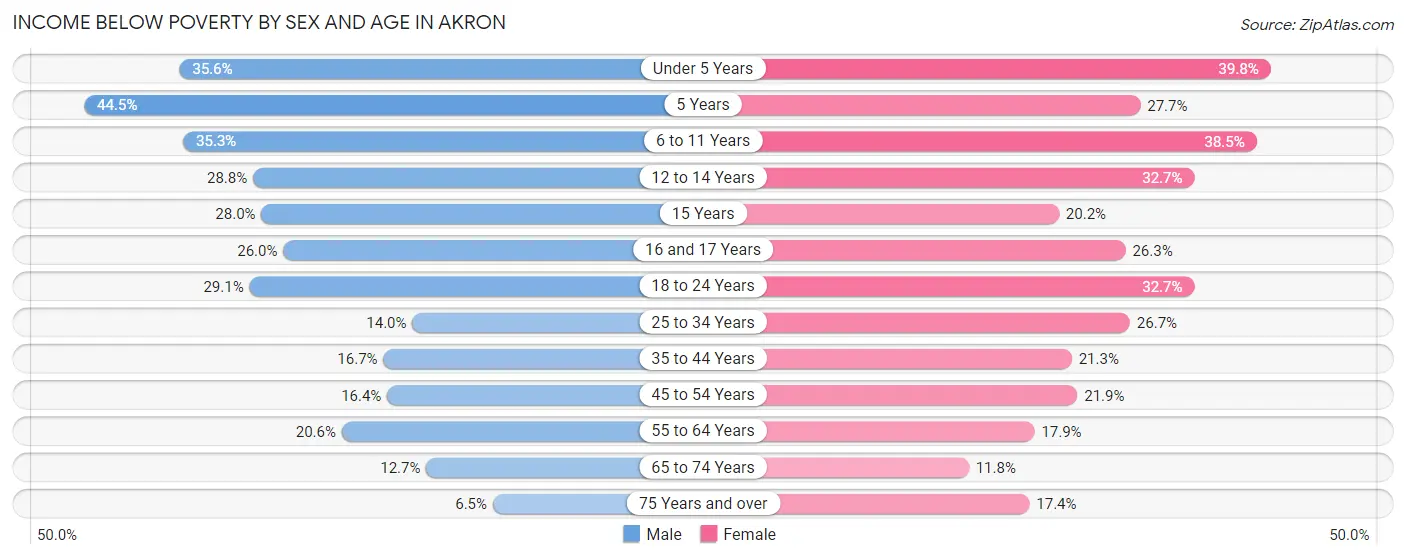
| Age Bracket | Male | Female |
| Under 5 Years | 2,028 (35.6%) | 2,252 (39.8%) |
| 5 Years | 524 (44.5%) | 375 (27.7%) |
| 6 to 11 Years | 2,448 (35.3%) | 2,457 (38.5%) |
| 12 to 14 Years | 851 (28.8%) | 1,011 (32.7%) |
| 15 Years | 329 (28.0%) | 250 (20.2%) |
| 16 and 17 Years | 466 (26.0%) | 564 (26.3%) |
| 18 to 24 Years | 2,775 (29.1%) | 3,017 (32.7%) |
| 25 to 34 Years | 1,996 (14.0%) | 3,861 (26.7%) |
| 35 to 44 Years | 1,825 (16.7%) | 2,444 (21.3%) |
| 45 to 54 Years | 1,740 (16.4%) | 2,591 (21.9%) |
| 55 to 64 Years | 2,435 (20.6%) | 2,339 (17.9%) |
| 65 to 74 Years | 1,029 (12.7%) | 1,199 (11.8%) |
| 75 Years and over | 270 (6.5%) | 1,137 (17.4%) |
| Total | 18,716 (21.0%) | 23,497 (24.3%) |
Income Above Poverty by Sex and Age in Akron
According to the poverty statistics in Akron, males aged 75 years and over and females aged 65 to 74 years are the age groups that are most secure financially, with 93.5% of males and 88.2% of females in these age groups living above the poverty line.
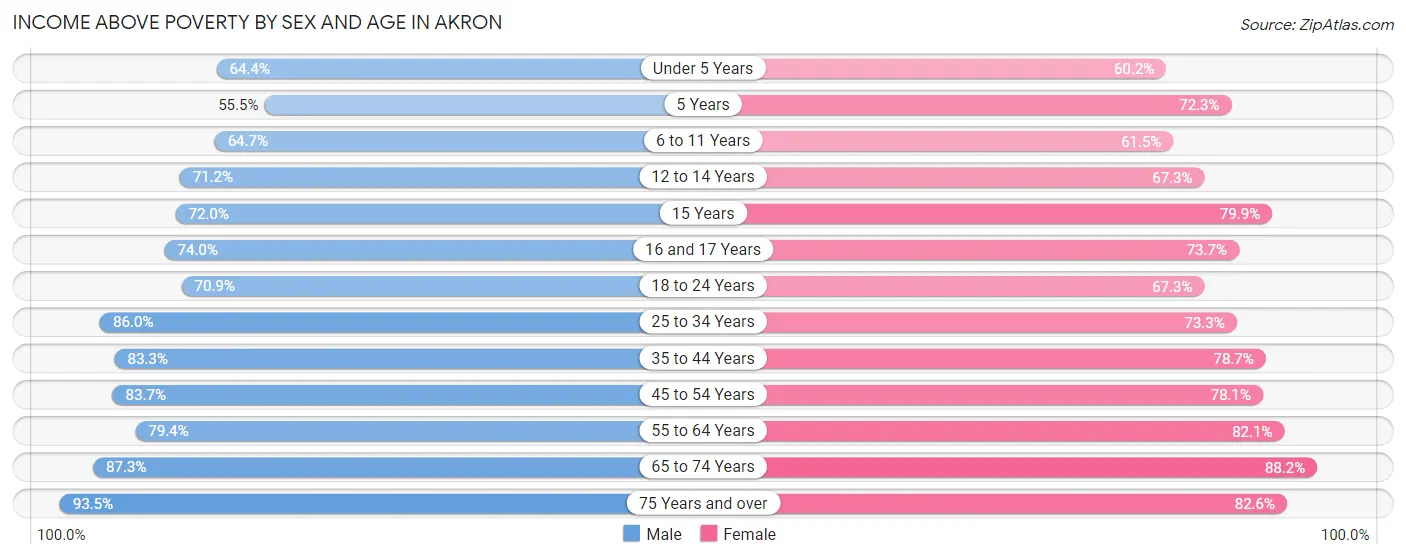
| Age Bracket | Male | Female |
| Under 5 Years | 3,662 (64.4%) | 3,407 (60.2%) |
| 5 Years | 654 (55.5%) | 979 (72.3%) |
| 6 to 11 Years | 4,487 (64.7%) | 3,926 (61.5%) |
| 12 to 14 Years | 2,104 (71.2%) | 2,080 (67.3%) |
| 15 Years | 845 (72.0%) | 991 (79.8%) |
| 16 and 17 Years | 1,327 (74.0%) | 1,578 (73.7%) |
| 18 to 24 Years | 6,751 (70.9%) | 6,203 (67.3%) |
| 25 to 34 Years | 12,254 (86.0%) | 10,577 (73.3%) |
| 35 to 44 Years | 9,105 (83.3%) | 9,010 (78.7%) |
| 45 to 54 Years | 8,899 (83.7%) | 9,259 (78.1%) |
| 55 to 64 Years | 9,407 (79.4%) | 10,740 (82.1%) |
| 65 to 74 Years | 7,063 (87.3%) | 8,980 (88.2%) |
| 75 Years and over | 3,857 (93.5%) | 5,393 (82.6%) |
| Total | 70,415 (79.0%) | 73,123 (75.7%) |
Income Below Poverty Among Married-Couple Families in Akron
The poverty statistics for married-couple families in Akron show that 6.7% or 1,568 of the total 23,387 families live below the poverty line. Families with 5 or more children have the highest poverty rate of 45.9%, comprising of 96 families. On the other hand, families with no children have the lowest poverty rate of 3.3%, which includes 503 families.
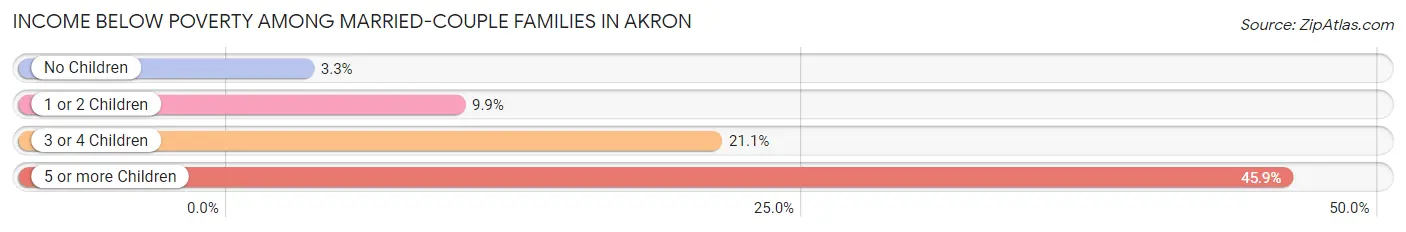
| Children | Above Poverty | Below Poverty |
| No Children | 14,731 (96.7%) | 503 (3.3%) |
| 1 or 2 Children | 5,675 (90.1%) | 622 (9.9%) |
| 3 or 4 Children | 1,300 (78.9%) | 347 (21.1%) |
| 5 or more Children | 113 (54.1%) | 96 (45.9%) |
| Total | 21,819 (93.3%) | 1,568 (6.7%) |
Income Below Poverty Among Single-Parent Households in Akron
According to the poverty data in Akron, 19.2% or 900 single-father households and 33.3% or 5,170 single-mother households are living below the poverty line. Among single-father households, those with 3 or 4 children have the highest poverty rate, with 112 households (34.8%) experiencing poverty. Likewise, among single-mother households, those with 5 or more children have the highest poverty rate, with 151 households (62.9%) falling below the poverty line.
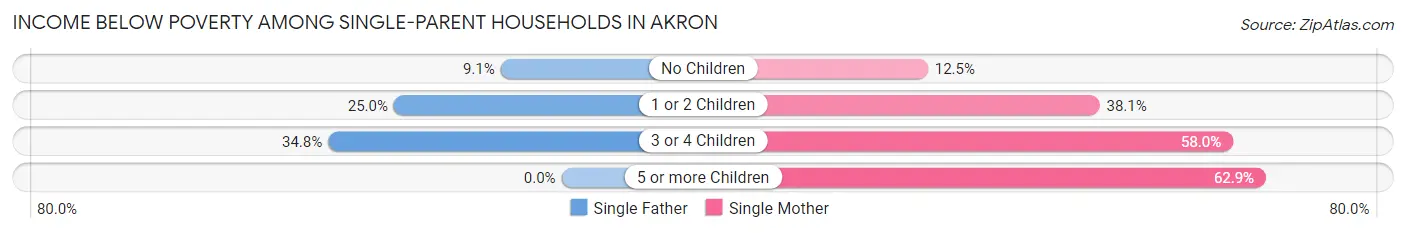
| Children | Single Father | Single Mother |
| No Children | 165 (9.1%) | 635 (12.5%) |
| 1 or 2 Children | 623 (25.0%) | 2,991 (38.1%) |
| 3 or 4 Children | 112 (34.8%) | 1,393 (58.0%) |
| 5 or more Children | 0 (0.0%) | 151 (62.9%) |
| Total | 900 (19.2%) | 5,170 (33.3%) |
Income Below Poverty Among Married-Couple vs Single-Parent Households in Akron
The poverty data for Akron shows that 1,568 of the married-couple family households (6.7%) and 6,070 of the single-parent households (30.0%) are living below the poverty level. Within the married-couple family households, those with 5 or more children have the highest poverty rate, with 96 households (45.9%) falling below the poverty line. Among the single-parent households, those with 3 or 4 children have the highest poverty rate, with 1,505 household (55.3%) living below poverty.
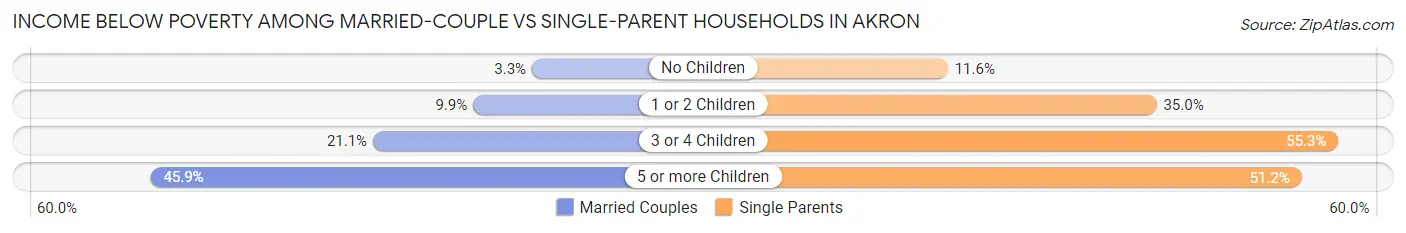
| Children | Married-Couple Families | Single-Parent Households |
| No Children | 503 (3.3%) | 800 (11.6%) |
| 1 or 2 Children | 622 (9.9%) | 3,614 (35.0%) |
| 3 or 4 Children | 347 (21.1%) | 1,505 (55.3%) |
| 5 or more Children | 96 (45.9%) | 151 (51.2%) |
| Total | 1,568 (6.7%) | 6,070 (30.0%) |
Race in Akron
The most populous races in Akron are White / Caucasian (109,029 | 57.3%), Black / African American (56,085 | 29.5%), and Two or more Races (14,361 | 7.5%).
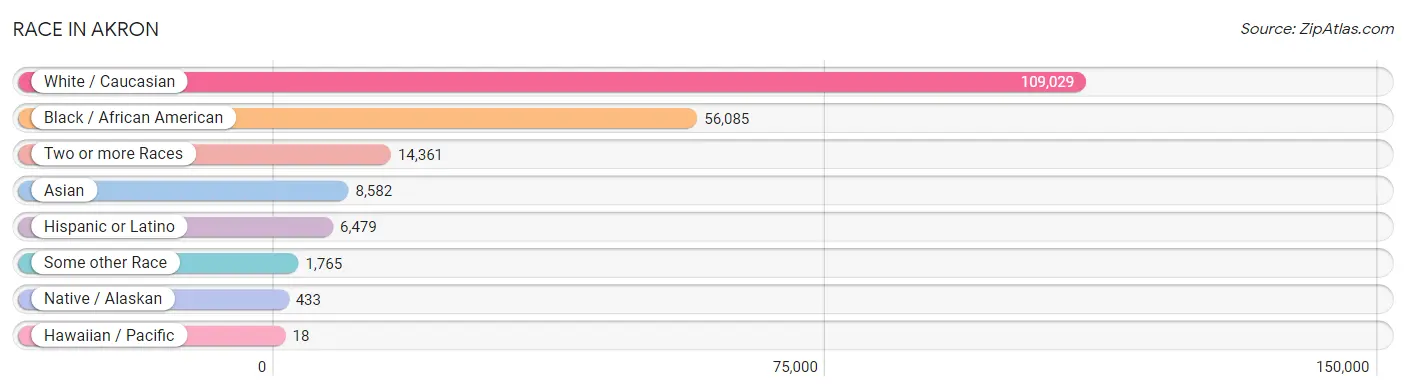
| Race | # Population | % Population |
| Asian | 8,582 | 4.5% |
| Black / African American | 56,085 | 29.5% |
| Hawaiian / Pacific | 18 | 0.0% |
| Hispanic or Latino | 6,479 | 3.4% |
| Native / Alaskan | 433 | 0.2% |
| White / Caucasian | 109,029 | 57.3% |
| Two or more Races | 14,361 | 7.5% |
| Some other Race | 1,765 | 0.9% |
| Total | 190,273 | 100.0% |
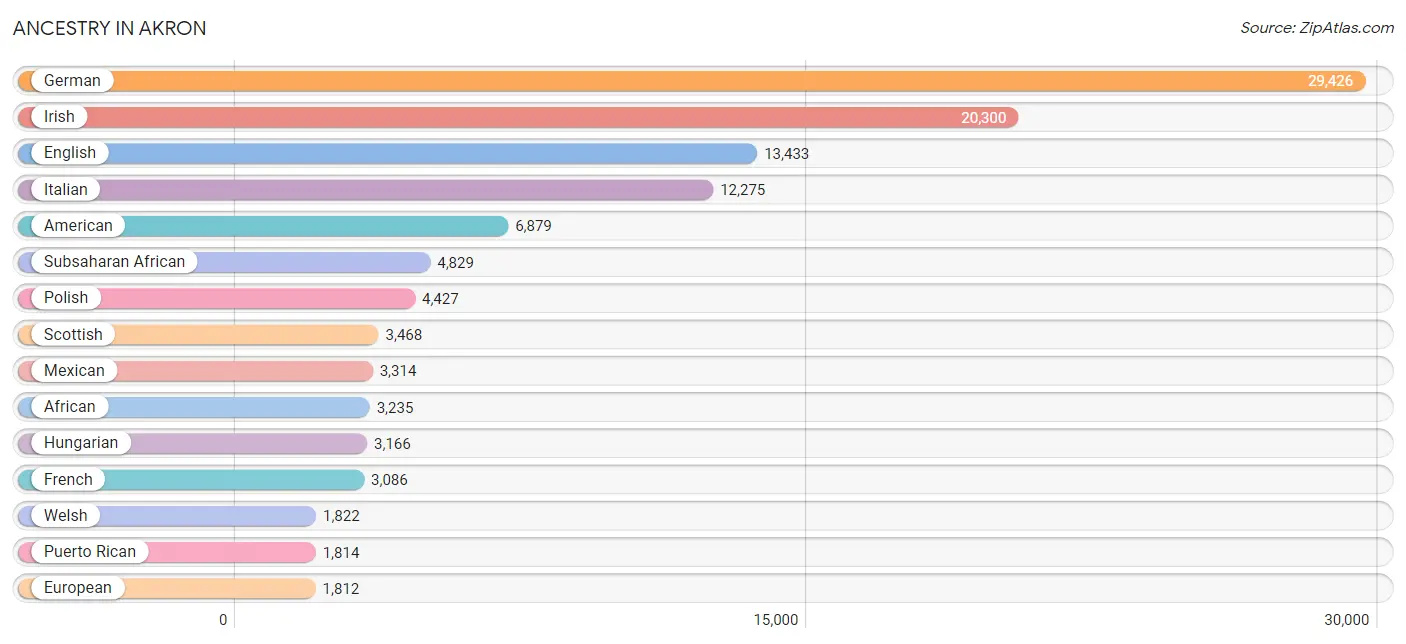
Ancestry in Akron
The most populous ancestries reported in Akron are German (29,426 | 15.5%), Irish (20,300 | 10.7%), English (13,433 | 7.1%), Italian (12,275 | 6.5%), and American (6,879 | 3.6%), together accounting for 43.3% of all Akron residents.
| Ancestry | # Population | % Population |
| African | 3,235 | 1.7% |
| Alsatian | 6 | 0.0% |
| American | 6,879 | 3.6% |
| Apache | 79 | 0.0% |
| Arab | 1,272 | 0.7% |
| Argentinean | 6 | 0.0% |
| Armenian | 48 | 0.0% |
| Australian | 7 | 0.0% |
| Austrian | 382 | 0.2% |
| Bangladeshi | 66 | 0.0% |
| Belgian | 166 | 0.1% |
| Belizean | 32 | 0.0% |
| Bhutanese | 142 | 0.1% |
| Blackfeet | 539 | 0.3% |
| Brazilian | 17 | 0.0% |
| British | 1,112 | 0.6% |
| British West Indian | 10 | 0.0% |
| Bulgarian | 11 | 0.0% |
| Burmese | 306 | 0.2% |
| Cajun | 12 | 0.0% |
| Cambodian | 29 | 0.0% |
| Canadian | 324 | 0.2% |
| Celtic | 20 | 0.0% |
| Central American | 612 | 0.3% |
| Central American Indian | 119 | 0.1% |
| Cherokee | 758 | 0.4% |
| Chickasaw | 9 | 0.0% |
| Chippewa | 39 | 0.0% |
| Choctaw | 99 | 0.1% |
| Colombian | 19 | 0.0% |
| Colville | 4 | 0.0% |
| Comanche | 7 | 0.0% |
| Costa Rican | 26 | 0.0% |
| Creek | 19 | 0.0% |
| Croatian | 655 | 0.3% |
| Crow | 3 | 0.0% |
| Cuban | 158 | 0.1% |
| Czech | 645 | 0.3% |
| Czechoslovakian | 239 | 0.1% |
| Danish | 254 | 0.1% |
| Delaware | 2 | 0.0% |
| Dominican | 121 | 0.1% |
| Dutch | 1,398 | 0.7% |
| Eastern European | 544 | 0.3% |
| Ecuadorian | 7 | 0.0% |
| Egyptian | 27 | 0.0% |
| English | 13,433 | 7.1% |
| Ethiopian | 5 | 0.0% |
| European | 1,812 | 0.9% |
| Filipino | 23 | 0.0% |
| Finnish | 126 | 0.1% |
| French | 3,086 | 1.6% |
| French Canadian | 602 | 0.3% |
| German | 29,426 | 15.5% |
| German Russian | 8 | 0.0% |
| Ghanaian | 148 | 0.1% |
| Greek | 954 | 0.5% |
| Guamanian / Chamorro | 54 | 0.0% |
| Guatemalan | 116 | 0.1% |
| Guyanese | 13 | 0.0% |
| Haitian | 24 | 0.0% |
| Honduran | 364 | 0.2% |
| Hopi | 1 | 0.0% |
| Hungarian | 3,166 | 1.7% |
| Indian (Asian) | 998 | 0.5% |
| Indonesian | 1,546 | 0.8% |
| Iranian | 55 | 0.0% |
| Irish | 20,300 | 10.7% |
| Iroquois | 105 | 0.1% |
| Israeli | 150 | 0.1% |
| Italian | 12,275 | 6.5% |
| Jamaican | 563 | 0.3% |
| Japanese | 57 | 0.0% |
| Jordanian | 38 | 0.0% |
| Kenyan | 10 | 0.0% |
| Korean | 485 | 0.3% |
| Lebanese | 831 | 0.4% |
| Liberian | 57 | 0.0% |
| Lithuanian | 257 | 0.1% |
| Macedonian | 49 | 0.0% |
| Malaysian | 299 | 0.2% |
| Mexican | 3,314 | 1.7% |
| Mexican American Indian | 177 | 0.1% |
| Moroccan | 45 | 0.0% |
| Native Hawaiian | 6 | 0.0% |
| Navajo | 74 | 0.0% |
| Nicaraguan | 32 | 0.0% |
| Nigerian | 234 | 0.1% |
| Northern European | 120 | 0.1% |
| Norwegian | 412 | 0.2% |
| Okinawan | 188 | 0.1% |
| Paiute | 4 | 0.0% |
| Pakistani | 62 | 0.0% |
| Palestinian | 49 | 0.0% |
| Panamanian | 61 | 0.0% |
| Pennsylvania German | 261 | 0.1% |
| Peruvian | 53 | 0.0% |
| Polish | 4,427 | 2.3% |
| Portuguese | 164 | 0.1% |
| Puerto Rican | 1,814 | 0.9% |
| Romanian | 521 | 0.3% |
| Russian | 1,310 | 0.7% |
| Salvadoran | 13 | 0.0% |
| Samoan | 14 | 0.0% |
| Scandinavian | 246 | 0.1% |
| Scotch-Irish | 1,529 | 0.8% |
| Scottish | 3,468 | 1.8% |
| Seminole | 13 | 0.0% |
| Serbian | 953 | 0.5% |
| Sioux | 59 | 0.0% |
| Slavic | 20 | 0.0% |
| Slovak | 1,189 | 0.6% |
| Slovene | 358 | 0.2% |
| South American | 85 | 0.0% |
| Soviet Union | 13 | 0.0% |
| Spaniard | 137 | 0.1% |
| Spanish | 100 | 0.1% |
| Sri Lankan | 261 | 0.1% |
| Subsaharan African | 4,829 | 2.5% |
| Sudanese | 63 | 0.0% |
| Swedish | 1,158 | 0.6% |
| Swiss | 943 | 0.5% |
| Syrian | 113 | 0.1% |
| Thai | 990 | 0.5% |
| Trinidadian and Tobagonian | 2 | 0.0% |
| Turkish | 11 | 0.0% |
| Ugandan | 9 | 0.0% |
| Ukrainian | 411 | 0.2% |
| Vietnamese | 50 | 0.0% |
| Welsh | 1,822 | 1.0% |
| West Indian | 130 | 0.1% |
| Yugoslavian | 476 | 0.3% | View All 132 Rows |
Immigrants in Akron
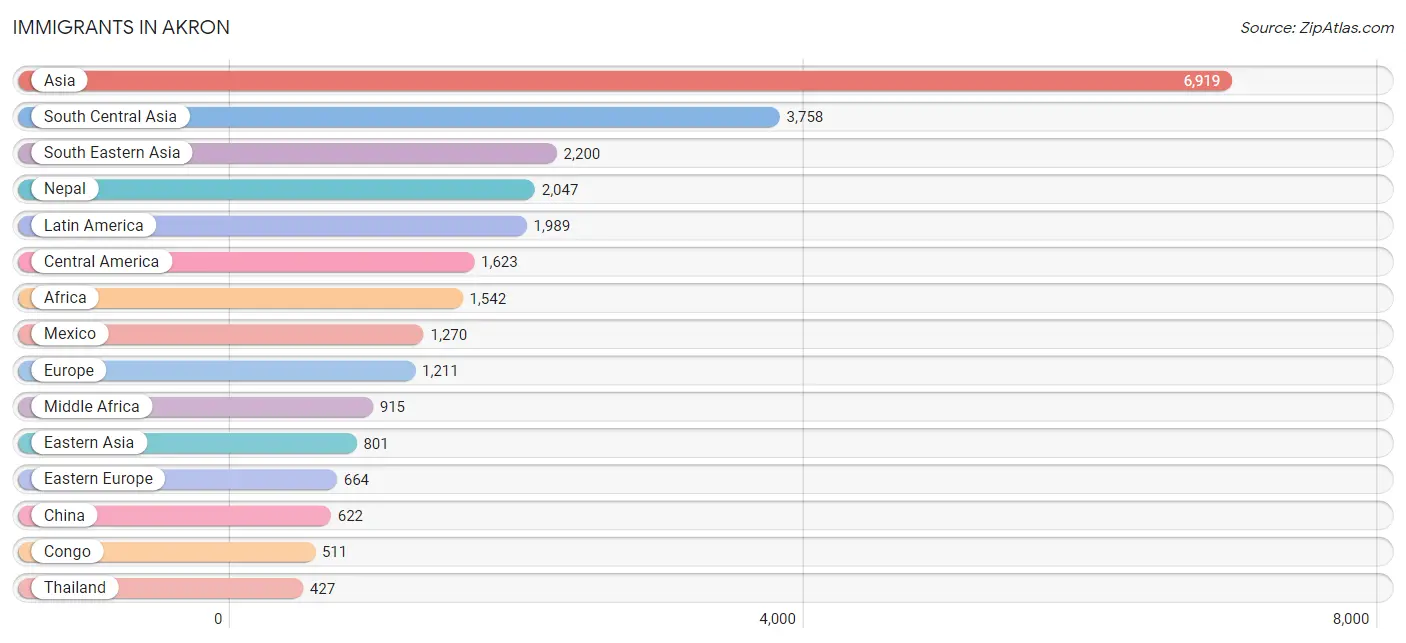
The most numerous immigrant groups reported in Akron came from Asia (6,919 | 3.6%), South Central Asia (3,758 | 2.0%), South Eastern Asia (2,200 | 1.2%), Nepal (2,047 | 1.1%), and Latin America (1,989 | 1.1%), together accounting for 8.9% of all Akron residents.
| Immigration Origin | # Population | % Population |
| Africa | 1,542 | 0.8% |
| Argentina | 8 | 0.0% |
| Asia | 6,919 | 3.6% |
| Australia | 16 | 0.0% |
| Austria | 43 | 0.0% |
| Bahamas | 40 | 0.0% |
| Bangladesh | 55 | 0.0% |
| Belize | 32 | 0.0% |
| Bosnia and Herzegovina | 224 | 0.1% |
| Brazil | 39 | 0.0% |
| Cambodia | 8 | 0.0% |
| Cameroon | 71 | 0.0% |
| Canada | 107 | 0.1% |
| Caribbean | 256 | 0.1% |
| Central America | 1,623 | 0.9% |
| China | 622 | 0.3% |
| Colombia | 19 | 0.0% |
| Congo | 511 | 0.3% |
| Costa Rica | 26 | 0.0% |
| Croatia | 47 | 0.0% |
| Cuba | 22 | 0.0% |
| Czechoslovakia | 13 | 0.0% |
| Dominican Republic | 41 | 0.0% |
| Eastern Africa | 218 | 0.1% |
| Eastern Asia | 801 | 0.4% |
| Eastern Europe | 664 | 0.4% |
| Ecuador | 7 | 0.0% |
| Egypt | 44 | 0.0% |
| England | 118 | 0.1% |
| Ethiopia | 5 | 0.0% |
| Europe | 1,211 | 0.6% |
| France | 35 | 0.0% |
| Germany | 119 | 0.1% |
| Ghana | 111 | 0.1% |
| Greece | 26 | 0.0% |
| Guatemala | 116 | 0.1% |
| Guyana | 20 | 0.0% |
| Honduras | 126 | 0.1% |
| Hungary | 32 | 0.0% |
| India | 327 | 0.2% |
| Indonesia | 54 | 0.0% |
| Iran | 9 | 0.0% |
| Italy | 64 | 0.0% |
| Jamaica | 130 | 0.1% |
| Japan | 95 | 0.1% |
| Jordan | 38 | 0.0% |
| Kenya | 6 | 0.0% |
| Korea | 84 | 0.0% |
| Laos | 249 | 0.1% |
| Latin America | 1,989 | 1.1% |
| Lebanon | 29 | 0.0% |
| Liberia | 57 | 0.0% |
| Mexico | 1,270 | 0.7% |
| Middle Africa | 915 | 0.5% |
| Nepal | 2,047 | 1.1% |
| Netherlands | 37 | 0.0% |
| Nicaragua | 45 | 0.0% |
| Nigeria | 98 | 0.1% |
| Northern Africa | 82 | 0.0% |
| Northern Europe | 210 | 0.1% |
| Oceania | 16 | 0.0% |
| Pakistan | 11 | 0.0% |
| Panama | 8 | 0.0% |
| Peru | 17 | 0.0% |
| Philippines | 344 | 0.2% |
| Poland | 22 | 0.0% |
| Romania | 43 | 0.0% |
| Russia | 115 | 0.1% |
| Serbia | 97 | 0.1% |
| Singapore | 56 | 0.0% |
| South Africa | 18 | 0.0% |
| South America | 110 | 0.1% |
| South Central Asia | 3,758 | 2.0% |
| South Eastern Asia | 2,200 | 1.2% |
| Southern Europe | 103 | 0.1% |
| Spain | 13 | 0.0% |
| Sri Lanka | 61 | 0.0% |
| St. Vincent and the Grenadines | 23 | 0.0% |
| Syria | 22 | 0.0% |
| Taiwan | 11 | 0.0% |
| Thailand | 427 | 0.2% |
| Turkey | 11 | 0.0% |
| Uganda | 9 | 0.0% |
| Vietnam | 215 | 0.1% |
| Western Africa | 266 | 0.1% |
| Western Asia | 153 | 0.1% |
| Western Europe | 234 | 0.1% |
| Zaire | 333 | 0.2% | View All 88 Rows |
Sex and Age in Akron
Sex and Age in Akron
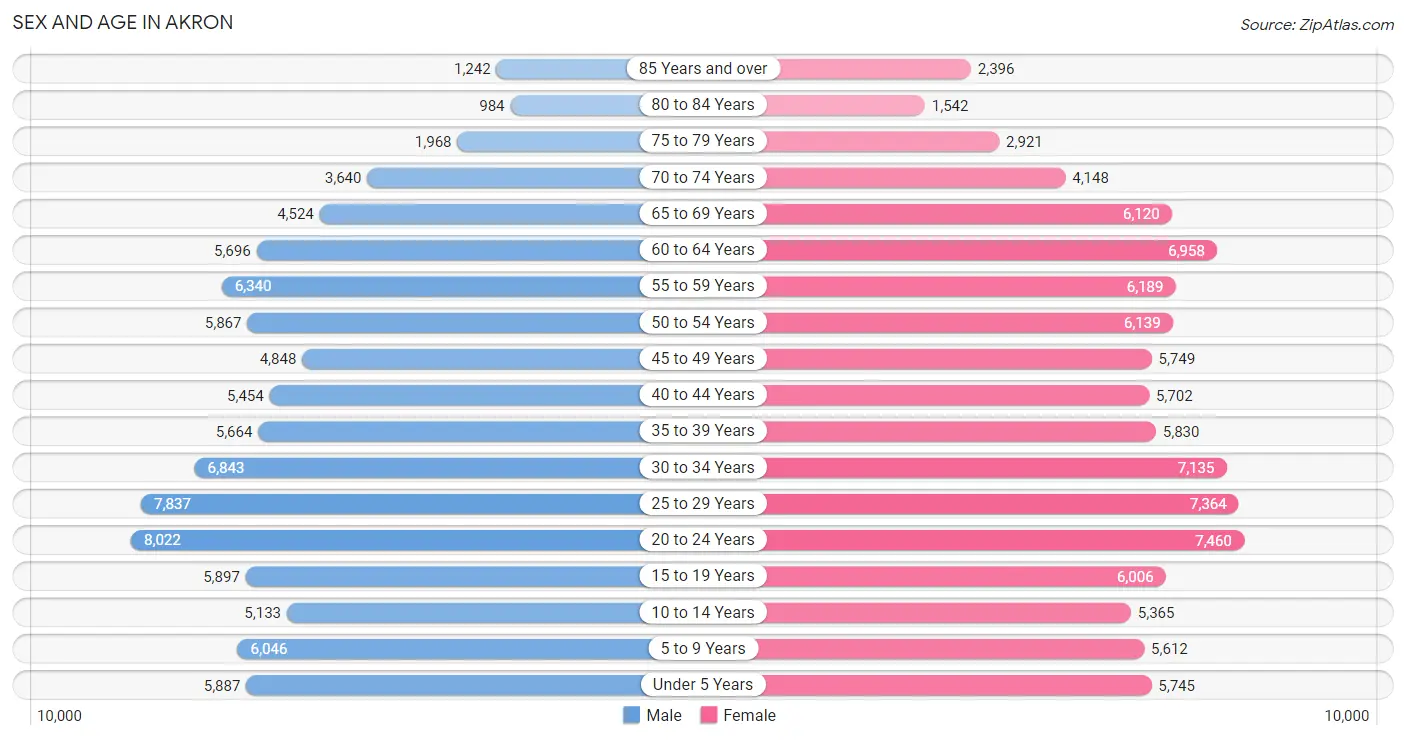
The most populous age groups in Akron are 20 to 24 Years (8,022 | 8.7%) for men and 20 to 24 Years (7,460 | 7.6%) for women.
| Age Bracket | Male | Female |
| Under 5 Years | 5,887 (6.4%) | 5,745 (5.8%) |
| 5 to 9 Years | 6,046 (6.6%) | 5,612 (5.7%) |
| 10 to 14 Years | 5,133 (5.6%) | 5,365 (5.4%) |
| 15 to 19 Years | 5,897 (6.4%) | 6,006 (6.1%) |
| 20 to 24 Years | 8,022 (8.7%) | 7,460 (7.6%) |
| 25 to 29 Years | 7,837 (8.5%) | 7,364 (7.5%) |
| 30 to 34 Years | 6,843 (7.4%) | 7,135 (7.2%) |
| 35 to 39 Years | 5,664 (6.2%) | 5,830 (5.9%) |
| 40 to 44 Years | 5,454 (5.9%) | 5,702 (5.8%) |
| 45 to 49 Years | 4,848 (5.3%) | 5,749 (5.8%) |
| 50 to 54 Years | 5,867 (6.4%) | 6,139 (6.2%) |
| 55 to 59 Years | 6,340 (6.9%) | 6,189 (6.3%) |
| 60 to 64 Years | 5,696 (6.2%) | 6,958 (7.1%) |
| 65 to 69 Years | 4,524 (4.9%) | 6,120 (6.2%) |
| 70 to 74 Years | 3,640 (4.0%) | 4,148 (4.2%) |
| 75 to 79 Years | 1,968 (2.1%) | 2,921 (3.0%) |
| 80 to 84 Years | 984 (1.1%) | 1,542 (1.6%) |
| 85 Years and over | 1,242 (1.3%) | 2,396 (2.4%) |
| Total | 91,892 (100.0%) | 98,381 (100.0%) |
Families and Households in Akron
Median Family Size in Akron
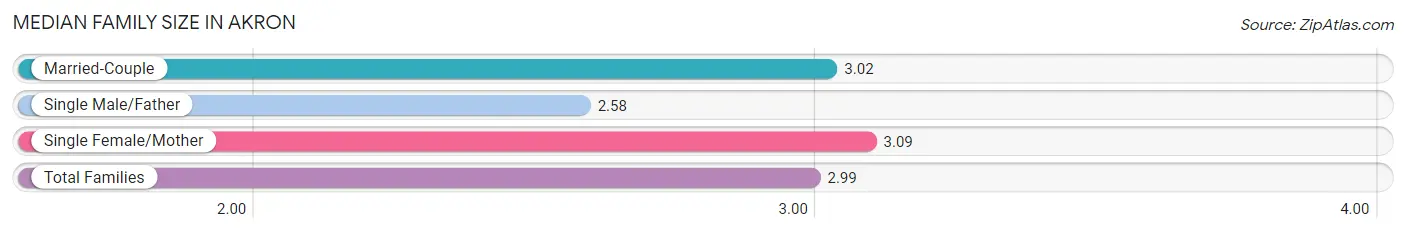
The median family size in Akron is 2.99 persons per family, with single female/mother families (15,547 | 35.6%) accounting for the largest median family size of 3.09 persons per family. On the other hand, single male/father families (4,689 | 10.7%) represent the smallest median family size with 2.58 persons per family.
| Family Type | # Families | Family Size |
| Married-Couple | 23,387 (53.6%) | 3.02 |
| Single Male/Father | 4,689 (10.7%) | 2.58 |
| Single Female/Mother | 15,547 (35.6%) | 3.09 |
| Total Families | 43,623 (100.0%) | 2.99 |
Median Household Size in Akron
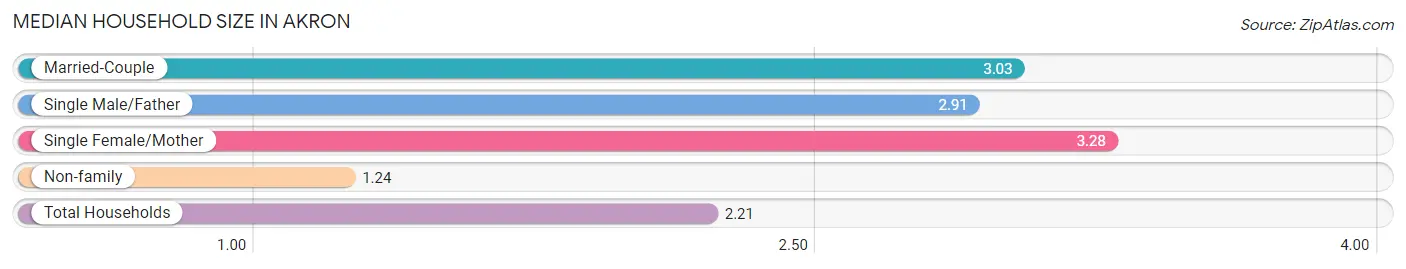
The median household size in Akron is 2.21 persons per household, with single female/mother households (15,547 | 18.5%) accounting for the largest median household size of 3.28 persons per household. non-family households (40,312 | 48.0%) represent the smallest median household size with 1.24 persons per household.
| Household Type | # Households | Household Size |
| Married-Couple | 23,387 (27.9%) | 3.03 |
| Single Male/Father | 4,689 (5.6%) | 2.91 |
| Single Female/Mother | 15,547 (18.5%) | 3.28 |
| Non-family | 40,312 (48.0%) | 1.24 |
| Total Households | 83,935 (100.0%) | 2.21 |
Household Size by Marriage Status in Akron
Out of a total of 83,935 households in Akron, 43,623 (52.0%) are family households, while 40,312 (48.0%) are nonfamily households. The most numerous type of family households are 2-person households, comprising 20,281, and the most common type of nonfamily households are 1-person households, comprising 33,042.
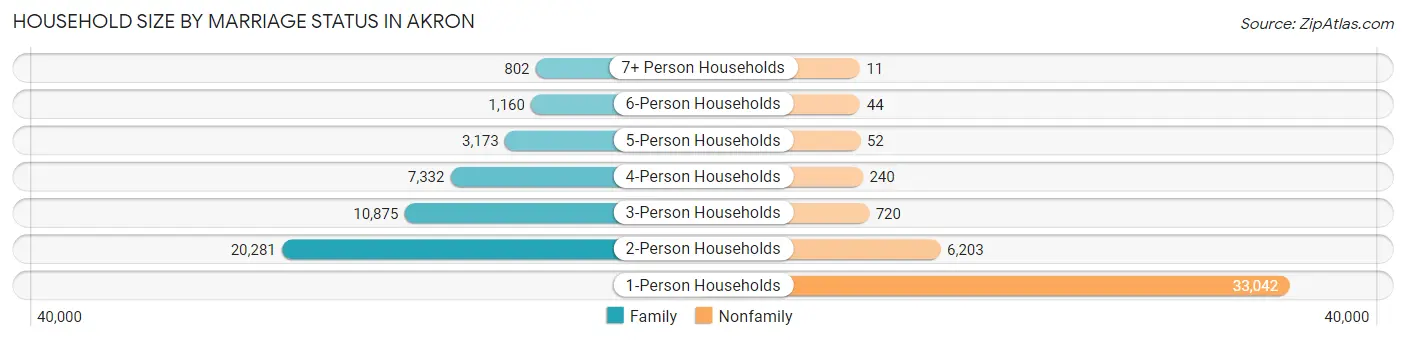
| Household Size | Family Households | Nonfamily Households |
| 1-Person Households | - | 33,042 (39.4%) |
| 2-Person Households | 20,281 (24.2%) | 6,203 (7.4%) |
| 3-Person Households | 10,875 (13.0%) | 720 (0.9%) |
| 4-Person Households | 7,332 (8.7%) | 240 (0.3%) |
| 5-Person Households | 3,173 (3.8%) | 52 (0.1%) |
| 6-Person Households | 1,160 (1.4%) | 44 (0.1%) |
| 7+ Person Households | 802 (1.0%) | 11 (0.0%) |
| Total | 43,623 (52.0%) | 40,312 (48.0%) |
Female Fertility in Akron
Fertility by Age in Akron
Average fertility rate in Akron is 52.0 births per 1,000 women. Women in the age bracket of 20 to 34 years have the highest fertility rate with 87.0 births per 1,000 women. Women in the age bracket of 20 to 34 years acount for 78.6% of all women with births.
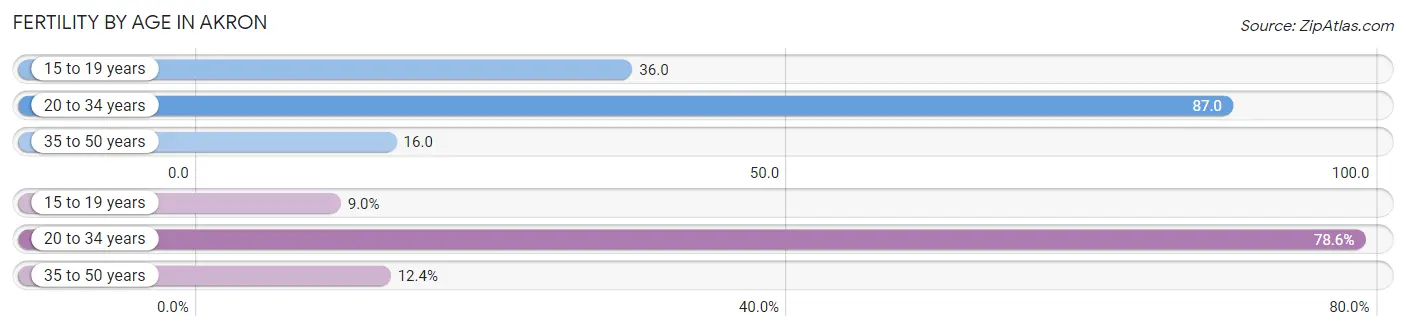
| Age Bracket | Women with Births | Births / 1,000 Women |
| 15 to 19 years | 218 (9.0%) | 36.0 |
| 20 to 34 years | 1,901 (78.6%) | 87.0 |
| 35 to 50 years | 300 (12.4%) | 16.0 |
| Total | 2,419 (100.0%) | 52.0 |
Fertility by Age by Marriage Status in Akron
33.6% of women with births (2,419) in Akron are married. The highest percentage of unmarried women with births falls into 15 to 19 years age bracket with 100.0% of them unmarried at the time of birth, while the lowest percentage of unmarried women with births belong to 35 to 50 years age bracket with 44.7% of them unmarried.
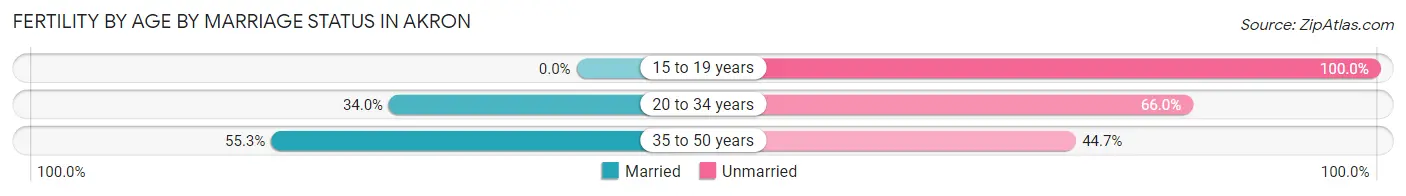
| Age Bracket | Married | Unmarried |
| 15 to 19 years | 0 (0.0%) | 218 (100.0%) |
| 20 to 34 years | 646 (34.0%) | 1,255 (66.0%) |
| 35 to 50 years | 166 (55.3%) | 134 (44.7%) |
| Total | 813 (33.6%) | 1,606 (66.4%) |
Fertility by Education in Akron
Average fertility rate in Akron is 52.0 births per 1,000 women. Women with the education attainment of high school diploma have the highest fertility rate of 73.0 births per 1,000 women, while women with the education attainment of bachelor's degree have the lowest fertility at 28.0 births per 1,000 women. Women with the education attainment of college or associate's degree represent 38.0% of all women with births.
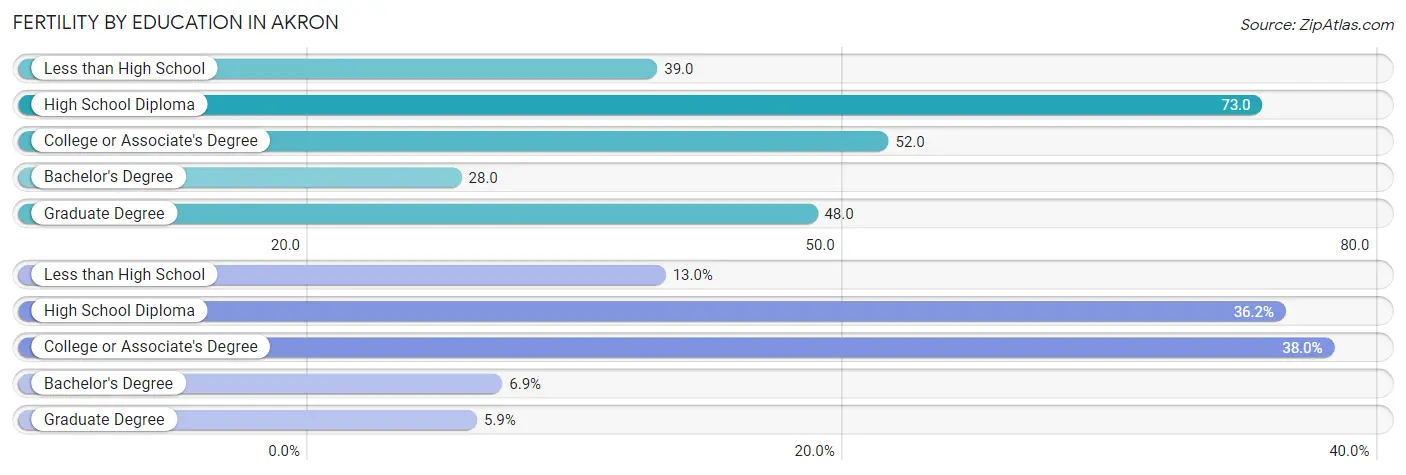
| Educational Attainment | Women with Births | Births / 1,000 Women |
| Less than High School | 314 (13.0%) | 39.0 |
| High School Diploma | 876 (36.2%) | 73.0 |
| College or Associate's Degree | 920 (38.0%) | 52.0 |
| Bachelor's Degree | 166 (6.9%) | 28.0 |
| Graduate Degree | 143 (5.9%) | 48.0 |
| Total | 2,419 (100.0%) | 52.0 |
Fertility by Education by Marriage Status in Akron
66.4% of women with births in Akron are unmarried. Women with the educational attainment of graduate degree are most likely to be married with 89.5% of them married at childbirth, while women with the educational attainment of less than high school are least likely to be married with 91.4% of them unmarried at childbirth.
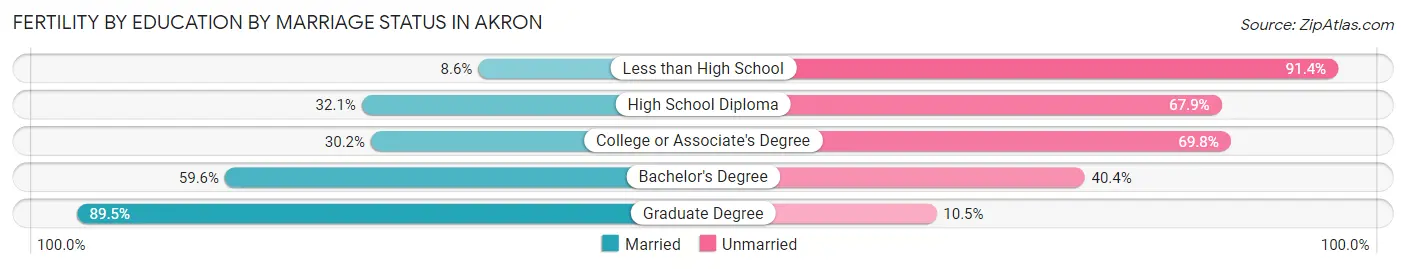
| Educational Attainment | Married | Unmarried |
| Less than High School | 27 (8.6%) | 287 (91.4%) |
| High School Diploma | 281 (32.1%) | 595 (67.9%) |
| College or Associate's Degree | 278 (30.2%) | 642 (69.8%) |
| Bachelor's Degree | 99 (59.6%) | 67 (40.4%) |
| Graduate Degree | 128 (89.5%) | 15 (10.5%) |
| Total | 813 (33.6%) | 1,606 (66.4%) |
Employment Characteristics in Akron
Employment by Class of Employer in Akron
Among the 87,428 employed individuals in Akron, private company employees (62,711 | 71.7%), not-for-profit organizations (8,786 | 10.1%), and local government employees (5,876 | 6.7%) make up the most common classes of employment.
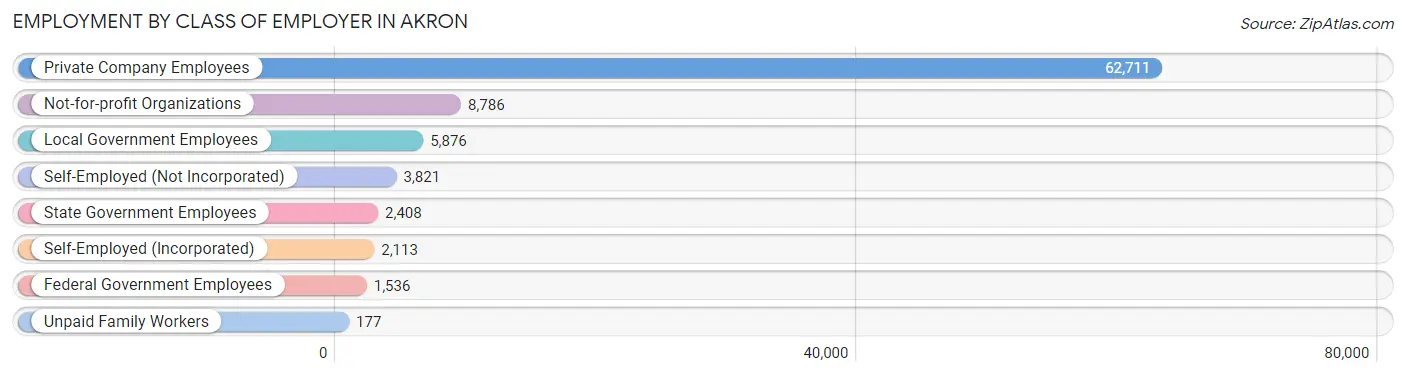
| Employer Class | # Employees | % Employees |
| Private Company Employees | 62,711 | 71.7% |
| Self-Employed (Incorporated) | 2,113 | 2.4% |
| Self-Employed (Not Incorporated) | 3,821 | 4.4% |
| Not-for-profit Organizations | 8,786 | 10.1% |
| Local Government Employees | 5,876 | 6.7% |
| State Government Employees | 2,408 | 2.8% |
| Federal Government Employees | 1,536 | 1.8% |
| Unpaid Family Workers | 177 | 0.2% |
| Total | 87,428 | 100.0% |
Employment Status by Age in Akron
According to the labor force statistics for Akron, out of the total population over 16 years of age (154,069), 63.2% or 97,372 individuals are in the labor force, with 7.7% or 7,498 of them unemployed. The age group with the highest labor force participation rate is 30 to 34 years, with 86.8% or 12,133 individuals in the labor force. Within the labor force, the 16 to 19 years age range has the highest percentage of unemployed individuals, with 15.9% or 665 of them being unemployed.
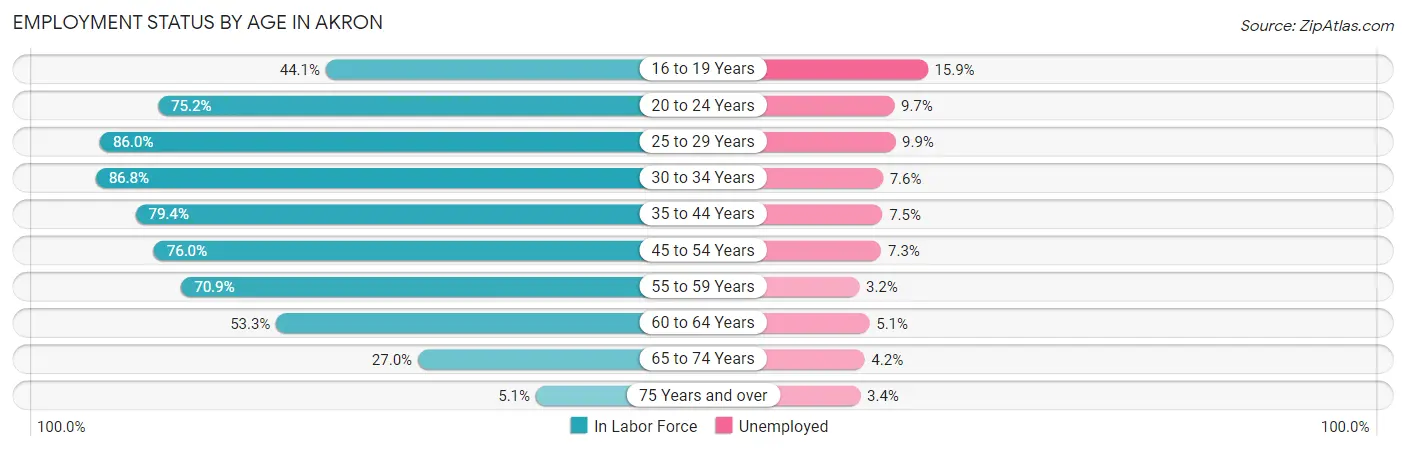
| Age Bracket | In Labor Force | Unemployed |
| 16 to 19 Years | 4,184 (44.1%) | 665 (15.9%) |
| 20 to 24 Years | 11,642 (75.2%) | 1,129 (9.7%) |
| 25 to 29 Years | 13,073 (86.0%) | 1,294 (9.9%) |
| 30 to 34 Years | 12,133 (86.8%) | 922 (7.6%) |
| 35 to 44 Years | 17,984 (79.4%) | 1,349 (7.5%) |
| 45 to 54 Years | 17,178 (76.0%) | 1,254 (7.3%) |
| 55 to 59 Years | 8,883 (70.9%) | 284 (3.2%) |
| 60 to 64 Years | 6,745 (53.3%) | 344 (5.1%) |
| 65 to 74 Years | 4,977 (27.0%) | 209 (4.2%) |
| 75 Years and over | 564 (5.1%) | 19 (3.4%) |
| Total | 97,372 (63.2%) | 7,498 (7.7%) |
Employment Status by Educational Attainment in Akron
According to labor force statistics for Akron, 76.3% of individuals (76,006) out of the total population between 25 and 64 years of age (99,615) are in the labor force, with 7.2% or 5,472 of them being unemployed. The group with the highest labor force participation rate are those with the educational attainment of bachelor's degree or higher, with 87.9% or 19,541 individuals in the labor force. Within the labor force, individuals with less than high school education have the highest percentage of unemployment, with 16.3% or 1,070 of them being unemployed.
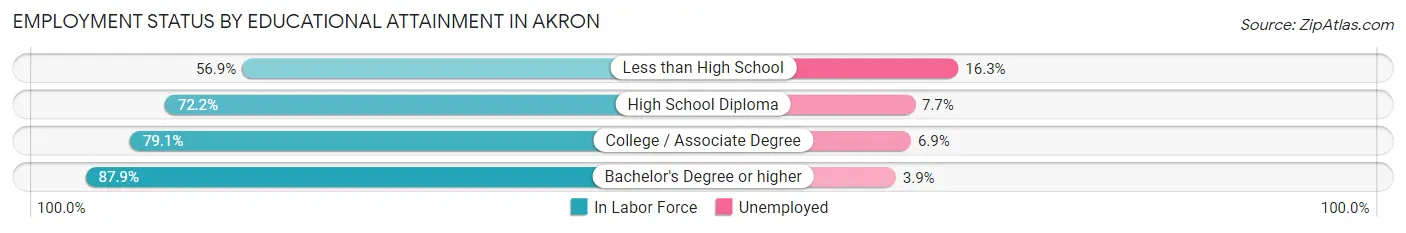
| Educational Attainment | In Labor Force | Unemployed |
| Less than High School | 6,563 (56.9%) | 1,880 (16.3%) |
| High School Diploma | 22,970 (72.2%) | 2,450 (7.7%) |
| College / Associate Degree | 26,922 (79.1%) | 2,348 (6.9%) |
| Bachelor's Degree or higher | 19,541 (87.9%) | 867 (3.9%) |
| Total | 76,006 (76.3%) | 7,172 (7.2%) |
Employment Occupations by Sex in Akron
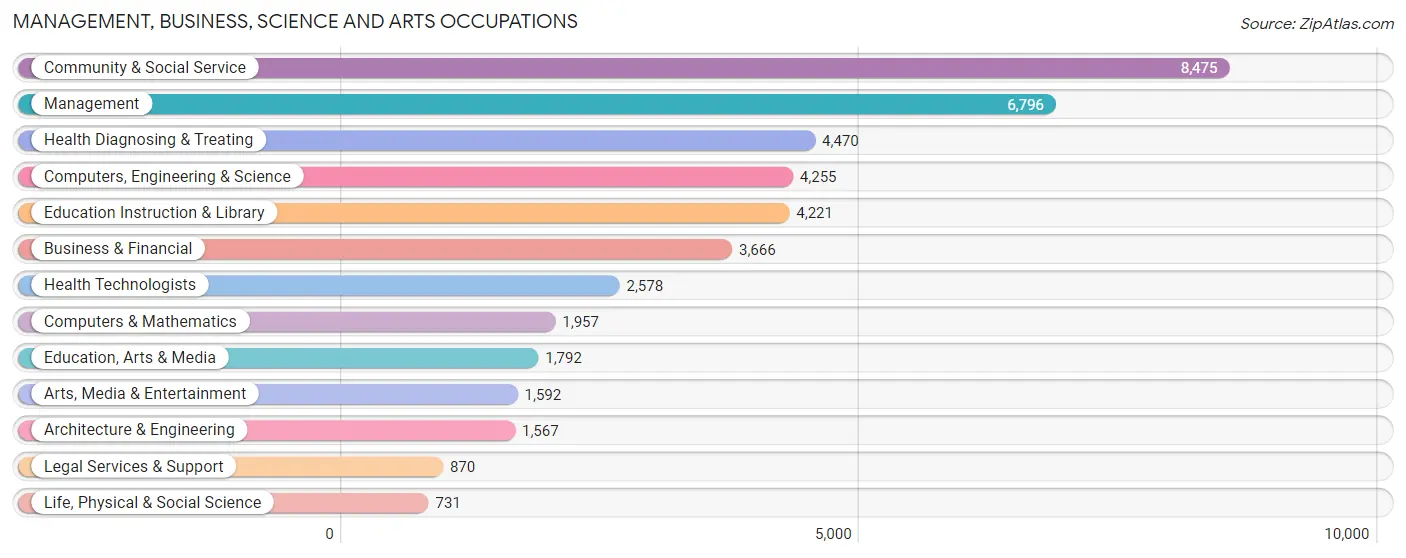
Management, Business, Science and Arts Occupations
The most common Management, Business, Science and Arts occupations in Akron are Community & Social Service (8,475 | 9.4%), Management (6,796 | 7.6%), Health Diagnosing & Treating (4,470 | 5.0%), Computers, Engineering & Science (4,255 | 4.7%), and Education Instruction & Library (4,221 | 4.7%).
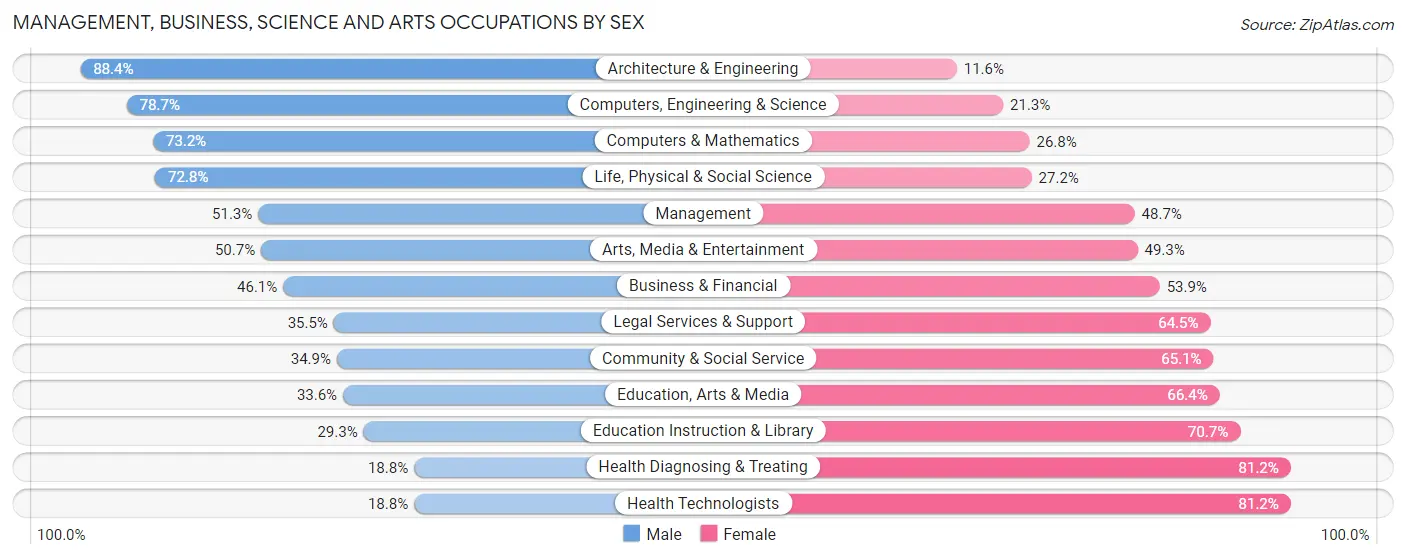
Management, Business, Science and Arts Occupations by Sex
Within the Management, Business, Science and Arts occupations in Akron, the most male-oriented occupations are Architecture & Engineering (88.4%), Computers, Engineering & Science (78.7%), and Computers & Mathematics (73.2%), while the most female-oriented occupations are Health Diagnosing & Treating (81.2%), Health Technologists (81.2%), and Education Instruction & Library (70.7%).
| Occupation | Male | Female |
| Management | 3,486 (51.3%) | 3,310 (48.7%) |
| Business & Financial | 1,689 (46.1%) | 1,977 (53.9%) |
| Computers, Engineering & Science | 3,350 (78.7%) | 905 (21.3%) |
| Computers & Mathematics | 1,433 (73.2%) | 524 (26.8%) |
| Architecture & Engineering | 1,385 (88.4%) | 182 (11.6%) |
| Life, Physical & Social Science | 532 (72.8%) | 199 (27.2%) |
| Community & Social Service | 2,955 (34.9%) | 5,520 (65.1%) |
| Education, Arts & Media | 602 (33.6%) | 1,190 (66.4%) |
| Legal Services & Support | 309 (35.5%) | 561 (64.5%) |
| Education Instruction & Library | 1,237 (29.3%) | 2,984 (70.7%) |
| Arts, Media & Entertainment | 807 (50.7%) | 785 (49.3%) |
| Health Diagnosing & Treating | 839 (18.8%) | 3,631 (81.2%) |
| Health Technologists | 484 (18.8%) | 2,094 (81.2%) |
| Total (Category) | 12,319 (44.5%) | 15,343 (55.5%) |
| Total (Overall) | 45,518 (50.7%) | 44,257 (49.3%) |
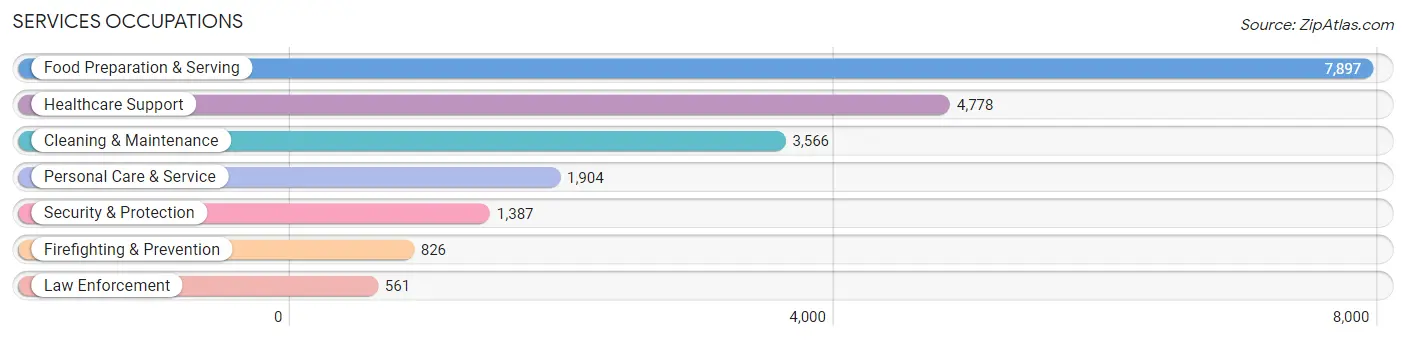
Services Occupations
The most common Services occupations in Akron are Food Preparation & Serving (7,897 | 8.8%), Healthcare Support (4,778 | 5.3%), Cleaning & Maintenance (3,566 | 4.0%), Personal Care & Service (1,904 | 2.1%), and Security & Protection (1,387 | 1.5%).
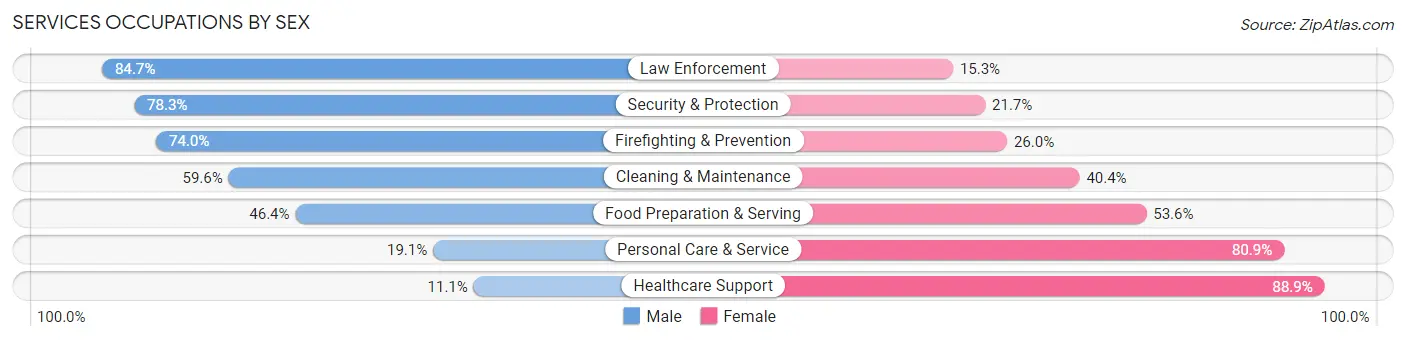
Services Occupations by Sex
Within the Services occupations in Akron, the most male-oriented occupations are Law Enforcement (84.7%), Security & Protection (78.3%), and Firefighting & Prevention (74.0%), while the most female-oriented occupations are Healthcare Support (88.9%), Personal Care & Service (80.9%), and Food Preparation & Serving (53.6%).
| Occupation | Male | Female |
| Healthcare Support | 530 (11.1%) | 4,248 (88.9%) |
| Security & Protection | 1,086 (78.3%) | 301 (21.7%) |
| Firefighting & Prevention | 611 (74.0%) | 215 (26.0%) |
| Law Enforcement | 475 (84.7%) | 86 (15.3%) |
| Food Preparation & Serving | 3,663 (46.4%) | 4,234 (53.6%) |
| Cleaning & Maintenance | 2,126 (59.6%) | 1,440 (40.4%) |
| Personal Care & Service | 364 (19.1%) | 1,540 (80.9%) |
| Total (Category) | 7,769 (39.8%) | 11,763 (60.2%) |
| Total (Overall) | 45,518 (50.7%) | 44,257 (49.3%) |
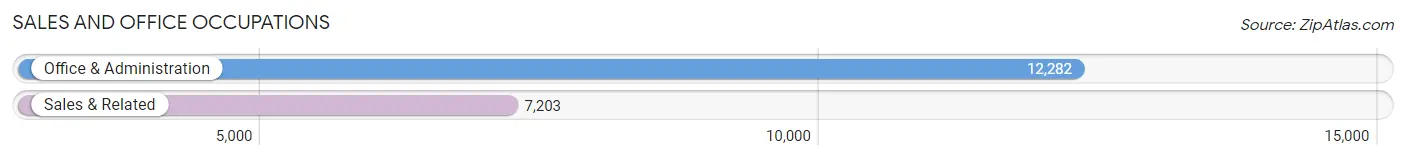
Sales and Office Occupations
The most common Sales and Office occupations in Akron are Office & Administration (12,282 | 13.7%), and Sales & Related (7,203 | 8.0%).
Sales and Office Occupations by Sex
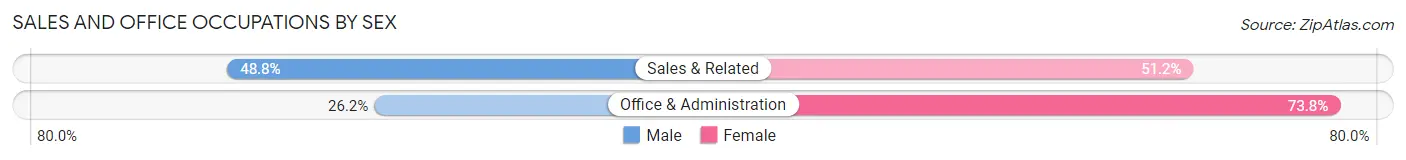
| Occupation | Male | Female |
| Sales & Related | 3,516 (48.8%) | 3,687 (51.2%) |
| Office & Administration | 3,222 (26.2%) | 9,060 (73.8%) |
| Total (Category) | 6,738 (34.6%) | 12,747 (65.4%) |
| Total (Overall) | 45,518 (50.7%) | 44,257 (49.3%) |
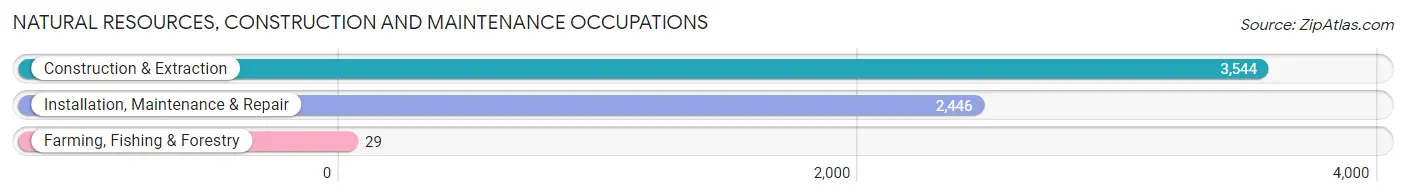
Natural Resources, Construction and Maintenance Occupations
The most common Natural Resources, Construction and Maintenance occupations in Akron are Construction & Extraction (3,544 | 4.0%), Installation, Maintenance & Repair (2,446 | 2.7%), and Farming, Fishing & Forestry (29 | 0.0%).
Natural Resources, Construction and Maintenance Occupations by Sex
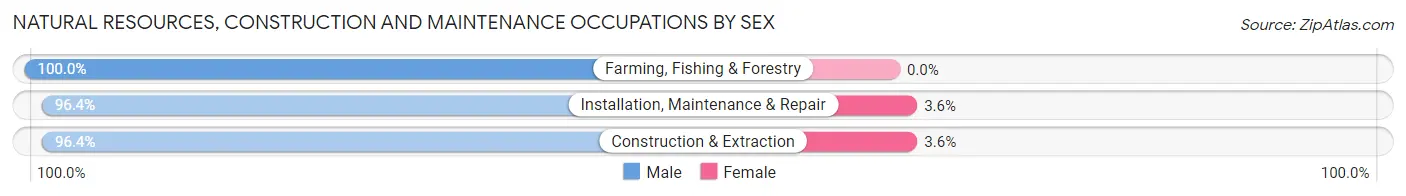
| Occupation | Male | Female |
| Farming, Fishing & Forestry | 29 (100.0%) | 0 (0.0%) |
| Construction & Extraction | 3,415 (96.4%) | 129 (3.6%) |
| Installation, Maintenance & Repair | 2,358 (96.4%) | 88 (3.6%) |
| Total (Category) | 5,802 (96.4%) | 217 (3.6%) |
| Total (Overall) | 45,518 (50.7%) | 44,257 (49.3%) |
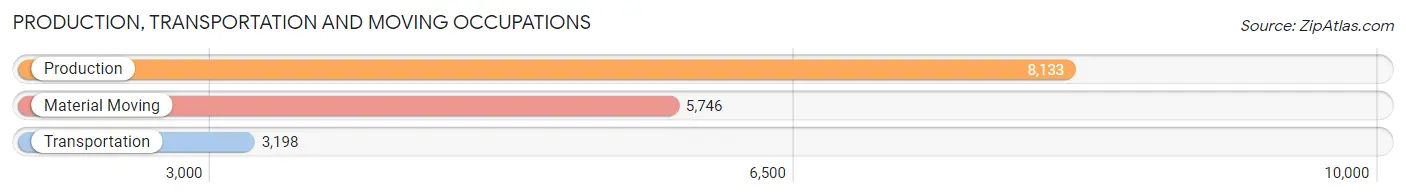
Production, Transportation and Moving Occupations
The most common Production, Transportation and Moving occupations in Akron are Production (8,133 | 9.1%), Material Moving (5,746 | 6.4%), and Transportation (3,198 | 3.6%).
Production, Transportation and Moving Occupations by Sex
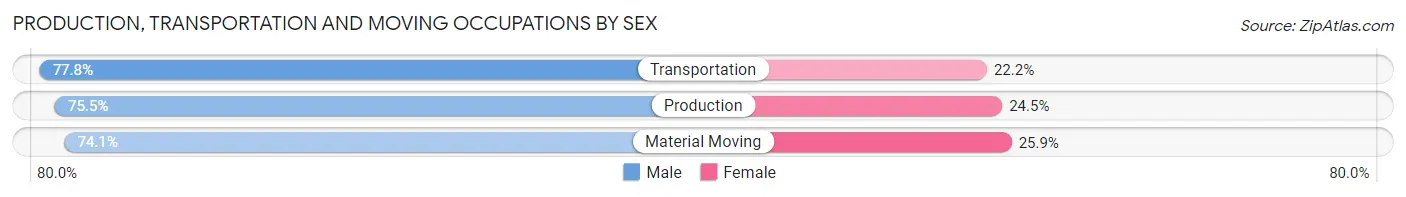
| Occupation | Male | Female |
| Production | 6,143 (75.5%) | 1,990 (24.5%) |
| Transportation | 2,487 (77.8%) | 711 (22.2%) |
| Material Moving | 4,260 (74.1%) | 1,486 (25.9%) |
| Total (Category) | 12,890 (75.5%) | 4,187 (24.5%) |
| Total (Overall) | 45,518 (50.7%) | 44,257 (49.3%) |
Employment Industries by Sex in Akron
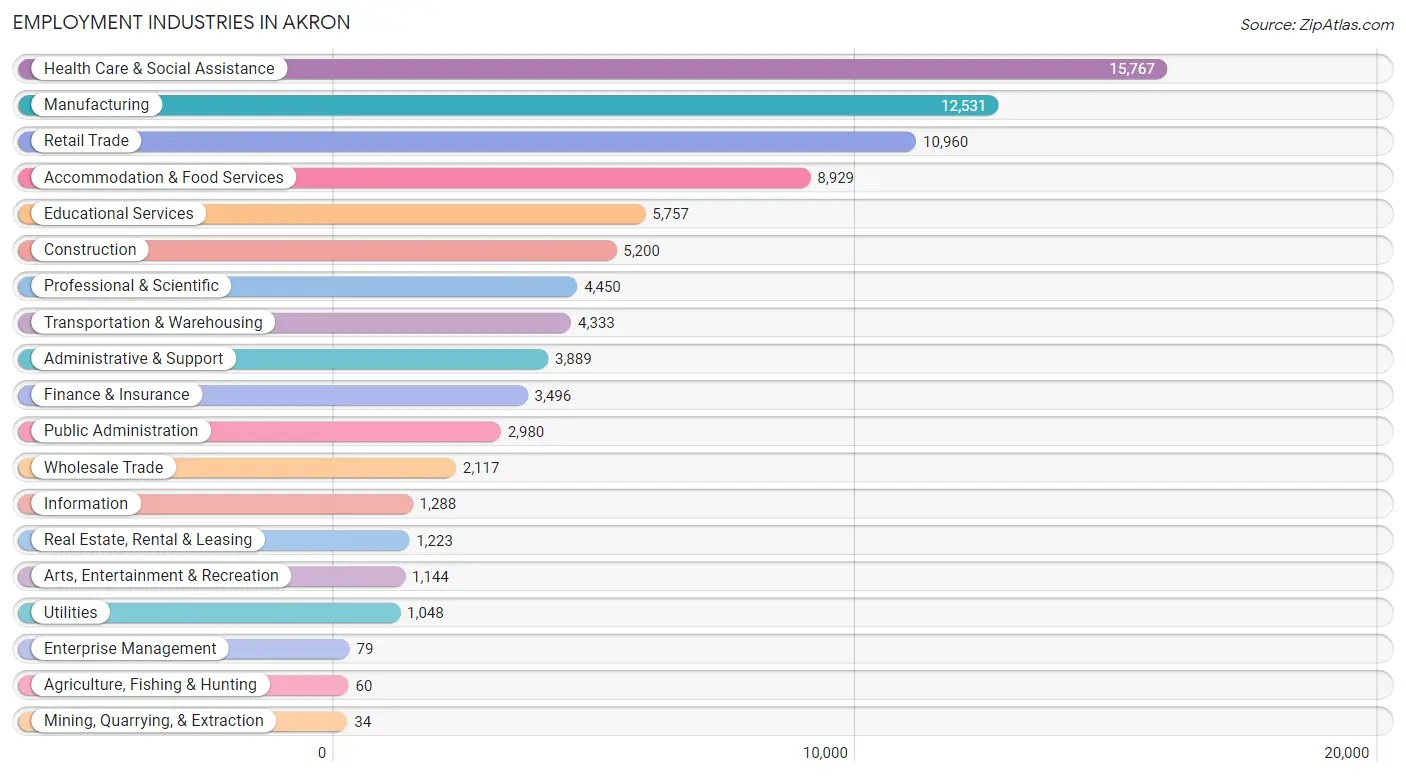
Employment Industries in Akron
The major employment industries in Akron include Health Care & Social Assistance (15,767 | 17.6%), Manufacturing (12,531 | 14.0%), Retail Trade (10,960 | 12.2%), Accommodation & Food Services (8,929 | 10.0%), and Educational Services (5,757 | 6.4%).
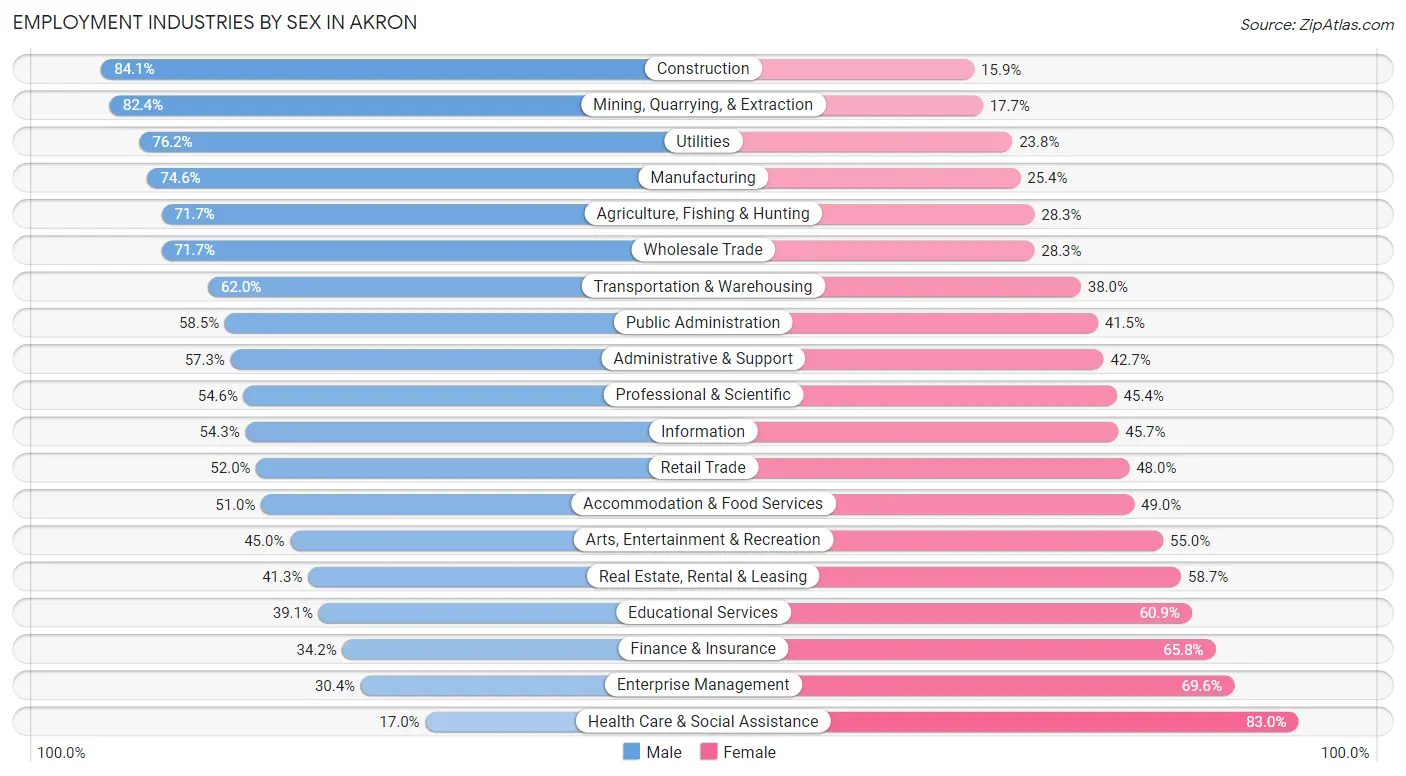
Employment Industries by Sex in Akron
The Akron industries that see more men than women are Construction (84.1%), Mining, Quarrying, & Extraction (82.4%), and Utilities (76.2%), whereas the industries that tend to have a higher number of women are Health Care & Social Assistance (83.0%), Enterprise Management (69.6%), and Finance & Insurance (65.8%).
| Industry | Male | Female |
| Agriculture, Fishing & Hunting | 43 (71.7%) | 17 (28.3%) |
| Mining, Quarrying, & Extraction | 28 (82.4%) | 6 (17.6%) |
| Construction | 4,374 (84.1%) | 826 (15.9%) |
| Manufacturing | 9,344 (74.6%) | 3,187 (25.4%) |
| Wholesale Trade | 1,517 (71.7%) | 600 (28.3%) |
| Retail Trade | 5,701 (52.0%) | 5,259 (48.0%) |
| Transportation & Warehousing | 2,688 (62.0%) | 1,645 (38.0%) |
| Utilities | 799 (76.2%) | 249 (23.8%) |
| Information | 699 (54.3%) | 589 (45.7%) |
| Finance & Insurance | 1,195 (34.2%) | 2,301 (65.8%) |
| Real Estate, Rental & Leasing | 505 (41.3%) | 718 (58.7%) |
| Professional & Scientific | 2,431 (54.6%) | 2,019 (45.4%) |
| Enterprise Management | 24 (30.4%) | 55 (69.6%) |
| Administrative & Support | 2,230 (57.3%) | 1,659 (42.7%) |
| Educational Services | 2,251 (39.1%) | 3,506 (60.9%) |
| Health Care & Social Assistance | 2,687 (17.0%) | 13,080 (83.0%) |
| Arts, Entertainment & Recreation | 515 (45.0%) | 629 (55.0%) |
| Accommodation & Food Services | 4,555 (51.0%) | 4,374 (49.0%) |
| Public Administration | 1,744 (58.5%) | 1,236 (41.5%) |
| Total | 45,518 (50.7%) | 44,257 (49.3%) |
Education in Akron
School Enrollment in Akron
The most common levels of schooling among the 43,938 students in Akron are college / undergraduate (11,112 | 25.3%), elementary school (9,347 | 21.3%), and high school (8,651 | 19.7%).
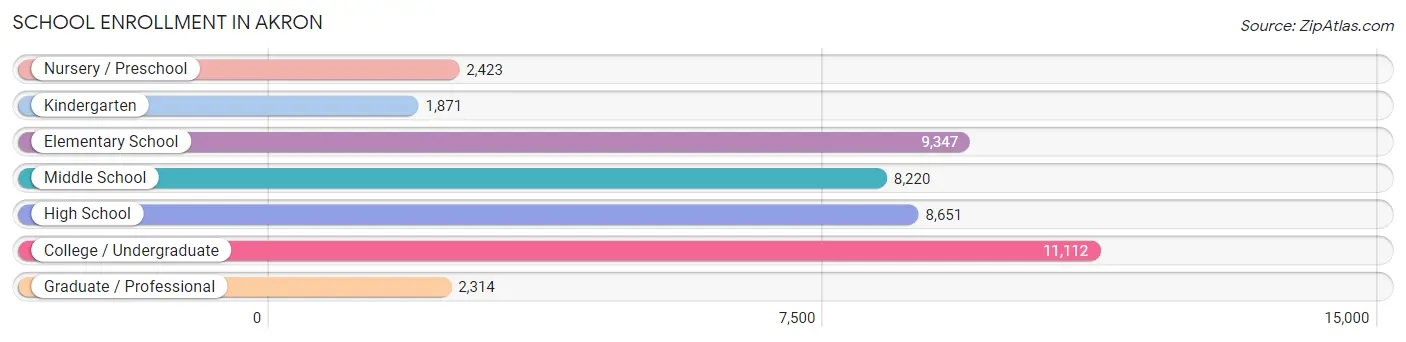
| School Level | # Students | % Students |
| Nursery / Preschool | 2,423 | 5.5% |
| Kindergarten | 1,871 | 4.3% |
| Elementary School | 9,347 | 21.3% |
| Middle School | 8,220 | 18.7% |
| High School | 8,651 | 19.7% |
| College / Undergraduate | 11,112 | 25.3% |
| Graduate / Professional | 2,314 | 5.3% |
| Total | 43,938 | 100.0% |
School Enrollment by Age by Funding Source in Akron
Out of a total of 43,938 students who are enrolled in schools in Akron, 7,030 (16.0%) attend a private institution, while the remaining 36,908 (84.0%) are enrolled in public schools. The age group of 3 to 4 year olds has the highest likelihood of being enrolled in private schools, with 613 (30.8% in the age bracket) enrolled. Conversely, the age group of 18 to 19 year olds has the lowest likelihood of being enrolled in a private school, with 3,774 (92.1% in the age bracket) attending a public institution.
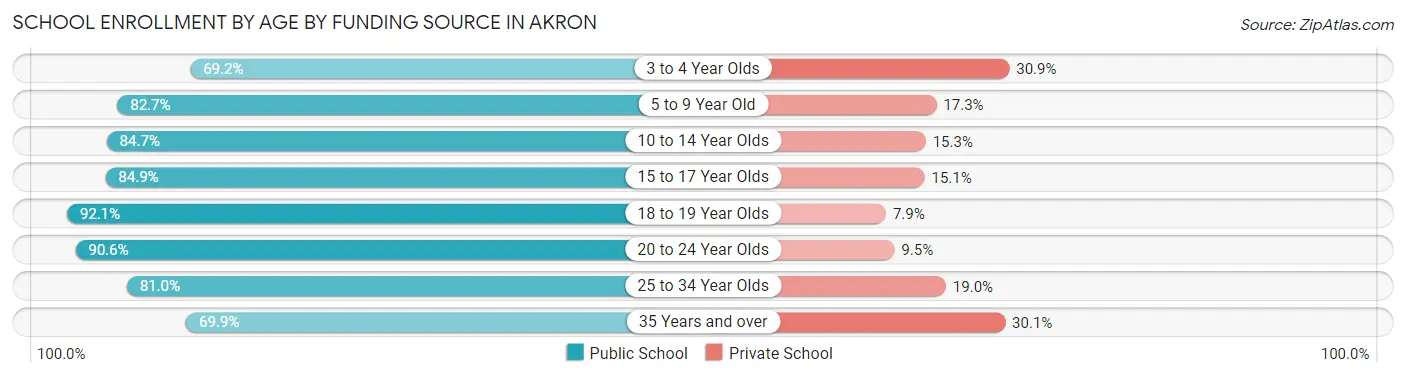
| Age Bracket | Public School | Private School |
| 3 to 4 Year Olds | 1,374 (69.2%) | 613 (30.8%) |
| 5 to 9 Year Old | 8,706 (82.7%) | 1,819 (17.3%) |
| 10 to 14 Year Olds | 8,601 (84.7%) | 1,553 (15.3%) |
| 15 to 17 Year Olds | 5,274 (84.9%) | 935 (15.1%) |
| 18 to 19 Year Olds | 3,774 (92.1%) | 323 (7.9%) |
| 20 to 24 Year Olds | 5,106 (90.5%) | 533 (9.5%) |
| 25 to 34 Year Olds | 2,569 (81.0%) | 604 (19.0%) |
| 35 Years and over | 1,506 (69.9%) | 648 (30.1%) |
| Total | 36,908 (84.0%) | 7,030 (16.0%) |
Educational Attainment by Field of Study in Akron
Business (5,259 | 16.6%), education (4,469 | 14.1%), science & technology (3,043 | 9.6%), social sciences (2,527 | 8.0%), and arts & humanities (2,253 | 7.1%) are the most common fields of study among 31,770 individuals in Akron who have obtained a bachelor's degree or higher.
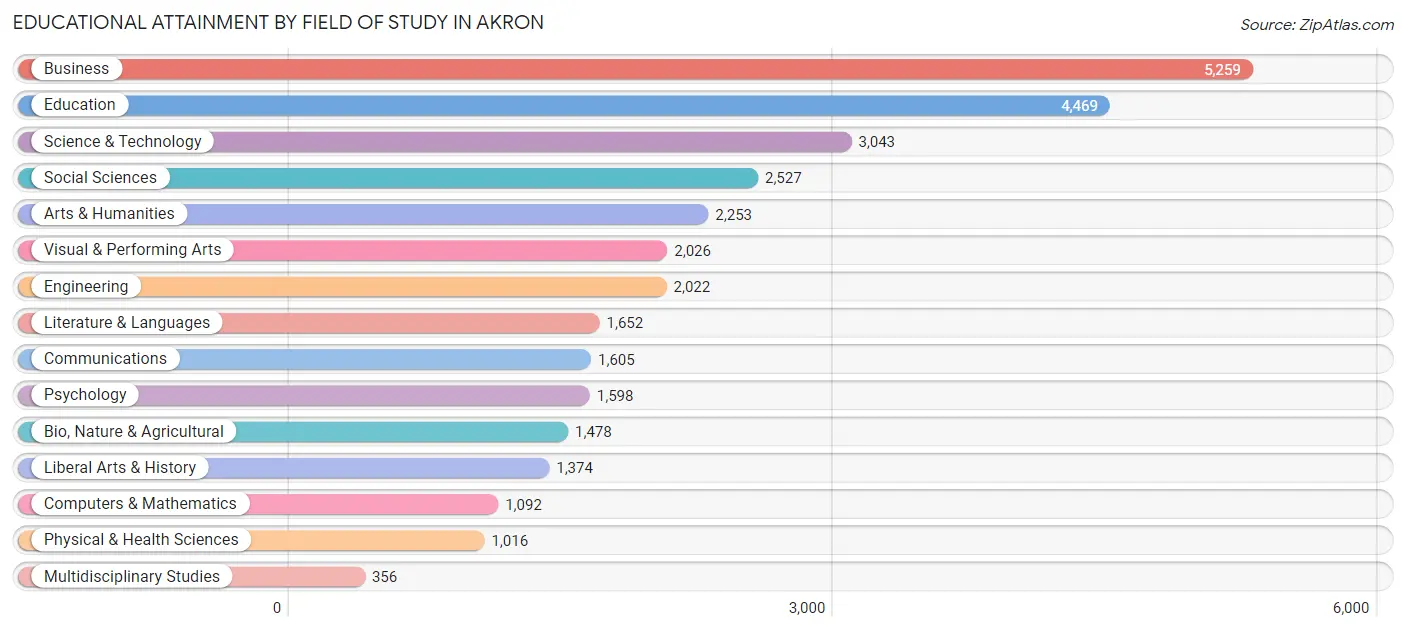
| Field of Study | # Graduates | % Graduates |
| Computers & Mathematics | 1,092 | 3.4% |
| Bio, Nature & Agricultural | 1,478 | 4.6% |
| Physical & Health Sciences | 1,016 | 3.2% |
| Psychology | 1,598 | 5.0% |
| Social Sciences | 2,527 | 8.0% |
| Engineering | 2,022 | 6.4% |
| Multidisciplinary Studies | 356 | 1.1% |
| Science & Technology | 3,043 | 9.6% |
| Business | 5,259 | 16.6% |
| Education | 4,469 | 14.1% |
| Literature & Languages | 1,652 | 5.2% |
| Liberal Arts & History | 1,374 | 4.3% |
| Visual & Performing Arts | 2,026 | 6.4% |
| Communications | 1,605 | 5.1% |
| Arts & Humanities | 2,253 | 7.1% |
| Total | 31,770 | 100.0% |
Transportation & Commute in Akron
Vehicle Availability by Sex in Akron
The most prevalent vehicle ownership categories in Akron are males with 2 vehicles (18,305, accounting for 41.7%) and females with 2 vehicles (16,091, making up 43.2%).
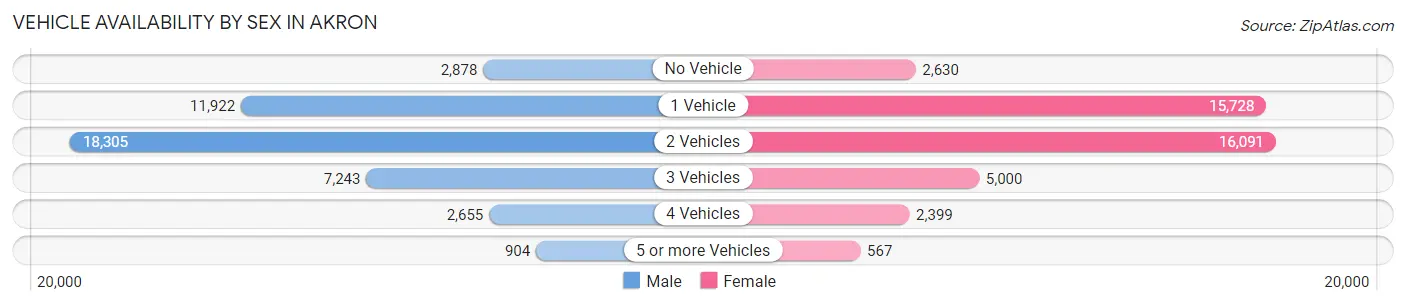
| Vehicles Available | Male | Female |
| No Vehicle | 2,878 (6.6%) | 2,630 (6.2%) |
| 1 Vehicle | 11,922 (27.2%) | 15,728 (37.1%) |
| 2 Vehicles | 18,305 (41.7%) | 16,091 (37.9%) |
| 3 Vehicles | 7,243 (16.5%) | 5,000 (11.8%) |
| 4 Vehicles | 2,655 (6.0%) | 2,399 (5.7%) |
| 5 or more Vehicles | 904 (2.1%) | 567 (1.3%) |
| Total | 43,907 (100.0%) | 42,415 (100.0%) |
Commute Time in Akron
The most frequently occuring commute durations in Akron are 15 to 19 minutes (16,687 commuters, 20.7%), 10 to 14 minutes (15,889 commuters, 19.7%), and 20 to 24 minutes (12,070 commuters, 14.9%).
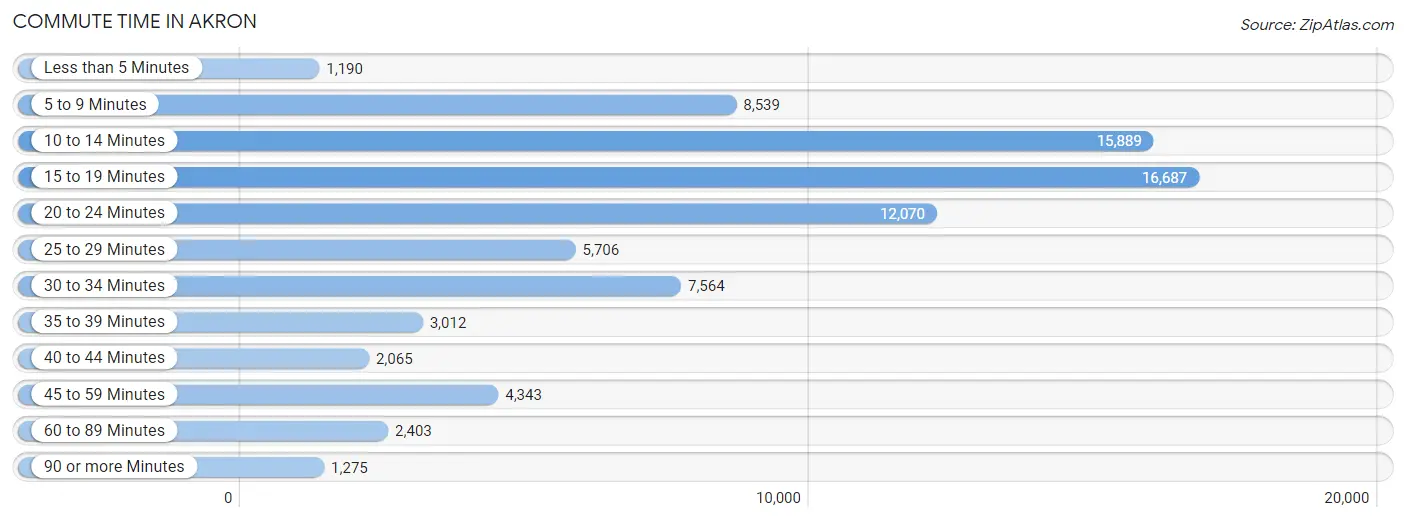
| Commute Time | # Commuters | % Commuters |
| Less than 5 Minutes | 1,190 | 1.5% |
| 5 to 9 Minutes | 8,539 | 10.6% |
| 10 to 14 Minutes | 15,889 | 19.7% |
| 15 to 19 Minutes | 16,687 | 20.7% |
| 20 to 24 Minutes | 12,070 | 14.9% |
| 25 to 29 Minutes | 5,706 | 7.1% |
| 30 to 34 Minutes | 7,564 | 9.4% |
| 35 to 39 Minutes | 3,012 | 3.7% |
| 40 to 44 Minutes | 2,065 | 2.6% |
| 45 to 59 Minutes | 4,343 | 5.4% |
| 60 to 89 Minutes | 2,403 | 3.0% |
| 90 or more Minutes | 1,275 | 1.6% |
Commute Time by Sex in Akron
The most common commute times in Akron are 10 to 14 minutes (7,921 commuters, 19.1%) for males and 15 to 19 minutes (8,804 commuters, 22.4%) for females.
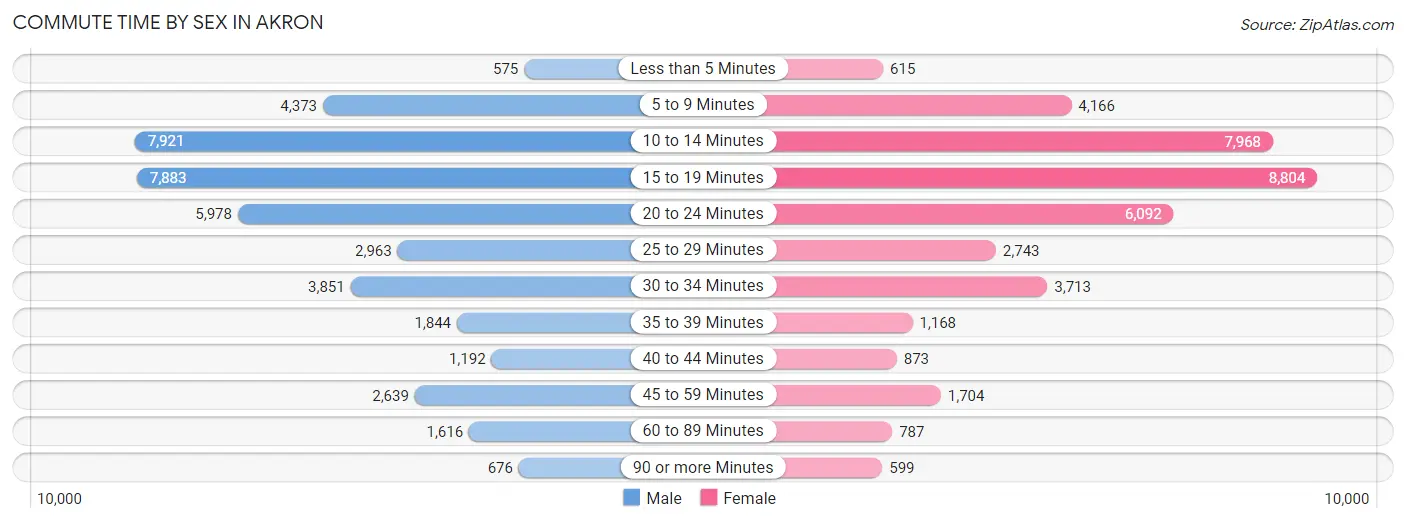
| Commute Time | Male | Female |
| Less than 5 Minutes | 575 (1.4%) | 615 (1.6%) |
| 5 to 9 Minutes | 4,373 (10.5%) | 4,166 (10.6%) |
| 10 to 14 Minutes | 7,921 (19.1%) | 7,968 (20.3%) |
| 15 to 19 Minutes | 7,883 (19.0%) | 8,804 (22.4%) |
| 20 to 24 Minutes | 5,978 (14.4%) | 6,092 (15.5%) |
| 25 to 29 Minutes | 2,963 (7.1%) | 2,743 (7.0%) |
| 30 to 34 Minutes | 3,851 (9.3%) | 3,713 (9.5%) |
| 35 to 39 Minutes | 1,844 (4.4%) | 1,168 (3.0%) |
| 40 to 44 Minutes | 1,192 (2.9%) | 873 (2.2%) |
| 45 to 59 Minutes | 2,639 (6.4%) | 1,704 (4.3%) |
| 60 to 89 Minutes | 1,616 (3.9%) | 787 (2.0%) |
| 90 or more Minutes | 676 (1.6%) | 599 (1.5%) |
Time of Departure to Work by Sex in Akron
The most frequent times of departure to work in Akron are 7:00 AM to 7:29 AM (5,186, 12.5%) for males and 7:30 AM to 7:59 AM (5,497, 14.0%) for females.
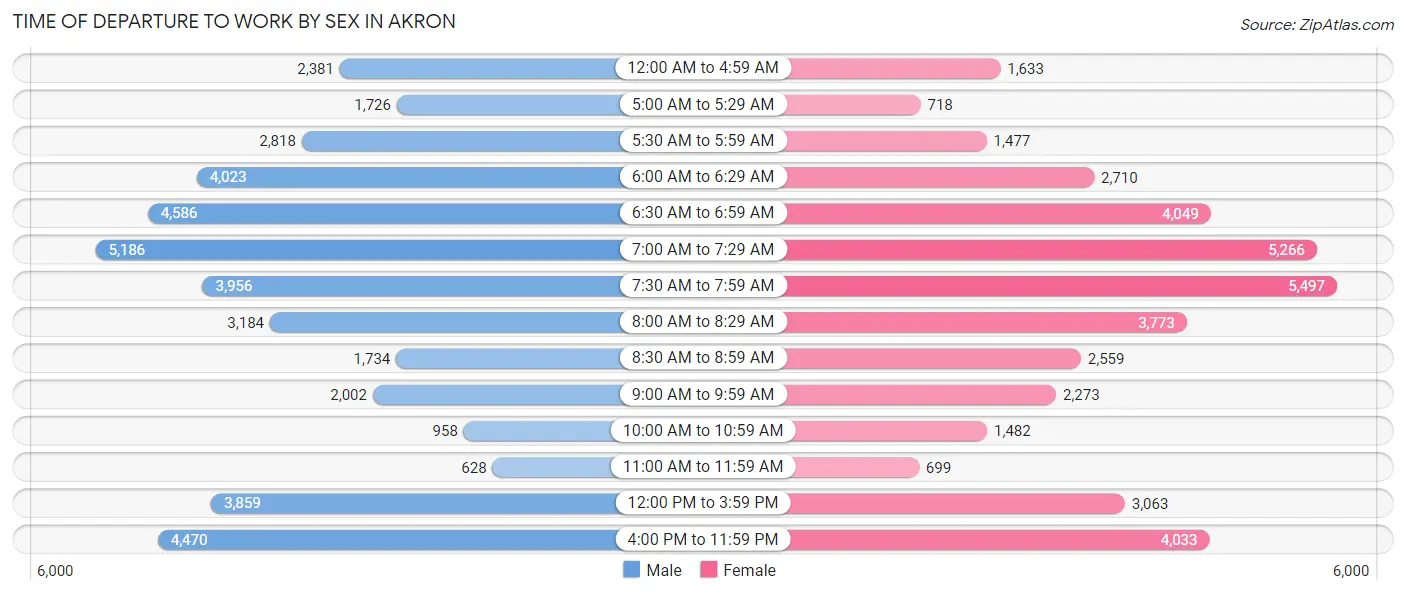
| Time of Departure | Male | Female |
| 12:00 AM to 4:59 AM | 2,381 (5.7%) | 1,633 (4.2%) |
| 5:00 AM to 5:29 AM | 1,726 (4.2%) | 718 (1.8%) |
| 5:30 AM to 5:59 AM | 2,818 (6.8%) | 1,477 (3.8%) |
| 6:00 AM to 6:29 AM | 4,023 (9.7%) | 2,710 (6.9%) |
| 6:30 AM to 6:59 AM | 4,586 (11.1%) | 4,049 (10.3%) |
| 7:00 AM to 7:29 AM | 5,186 (12.5%) | 5,266 (13.4%) |
| 7:30 AM to 7:59 AM | 3,956 (9.5%) | 5,497 (14.0%) |
| 8:00 AM to 8:29 AM | 3,184 (7.7%) | 3,773 (9.6%) |
| 8:30 AM to 8:59 AM | 1,734 (4.2%) | 2,559 (6.5%) |
| 9:00 AM to 9:59 AM | 2,002 (4.8%) | 2,273 (5.8%) |
| 10:00 AM to 10:59 AM | 958 (2.3%) | 1,482 (3.8%) |
| 11:00 AM to 11:59 AM | 628 (1.5%) | 699 (1.8%) |
| 12:00 PM to 3:59 PM | 3,859 (9.3%) | 3,063 (7.8%) |
| 4:00 PM to 11:59 PM | 4,470 (10.8%) | 4,033 (10.3%) |
| Total | 41,511 (100.0%) | 39,232 (100.0%) |
Housing Occupancy in Akron
Occupancy by Ownership in Akron
Of the total 83,935 dwellings in Akron, owner-occupied units account for 42,005 (50.0%), while renter-occupied units make up 41,930 (50.0%).
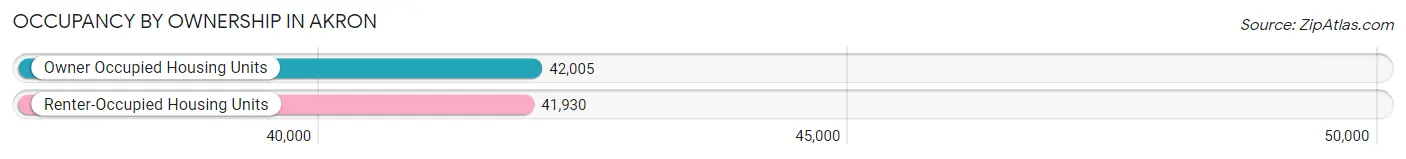
| Occupancy | # Housing Units | % Housing Units |
| Owner Occupied Housing Units | 42,005 | 50.0% |
| Renter-Occupied Housing Units | 41,930 | 50.0% |
| Total Occupied Housing Units | 83,935 | 100.0% |
Occupancy by Household Size in Akron
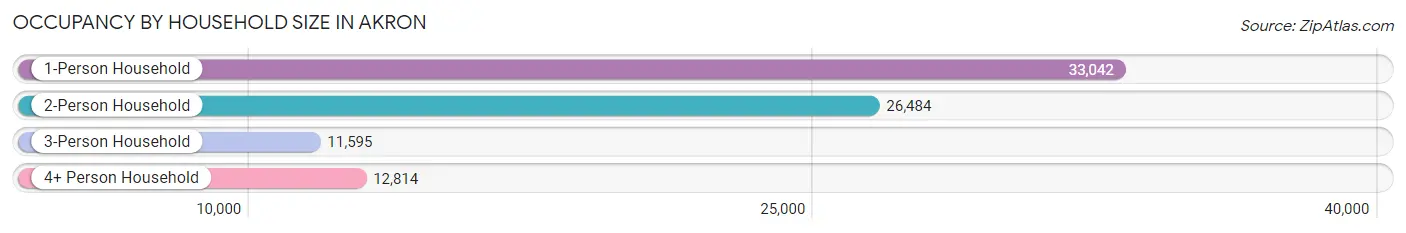
| Household Size | # Housing Units | % Housing Units |
| 1-Person Household | 33,042 | 39.4% |
| 2-Person Household | 26,484 | 31.6% |
| 3-Person Household | 11,595 | 13.8% |
| 4+ Person Household | 12,814 | 15.3% |
| Total Housing Units | 83,935 | 100.0% |
Occupancy by Ownership by Household Size in Akron
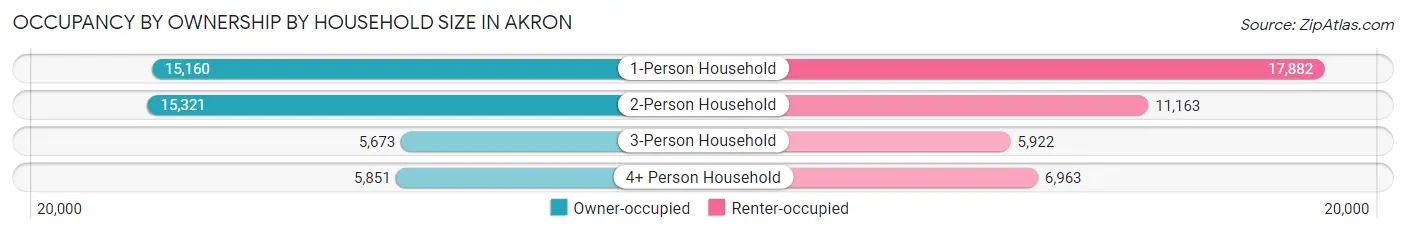
| Household Size | Owner-occupied | Renter-occupied |
| 1-Person Household | 15,160 (45.9%) | 17,882 (54.1%) |
| 2-Person Household | 15,321 (57.9%) | 11,163 (42.1%) |
| 3-Person Household | 5,673 (48.9%) | 5,922 (51.1%) |
| 4+ Person Household | 5,851 (45.7%) | 6,963 (54.3%) |
| Total Housing Units | 42,005 (50.0%) | 41,930 (50.0%) |
Occupancy by Educational Attainment in Akron
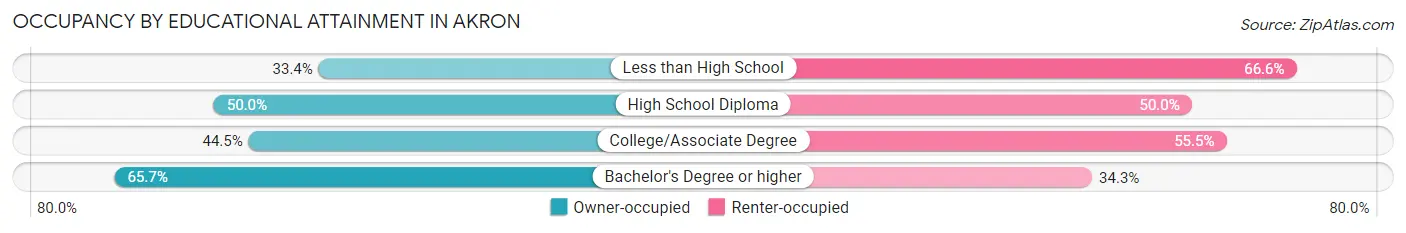
| Household Size | Owner-occupied | Renter-occupied |
| Less than High School | 2,862 (33.4%) | 5,714 (66.6%) |
| High School Diploma | 12,373 (50.0%) | 12,383 (50.0%) |
| College/Associate Degree | 13,594 (44.5%) | 16,967 (55.5%) |
| Bachelor's Degree or higher | 13,176 (65.7%) | 6,866 (34.3%) |
Occupancy by Age of Householder in Akron
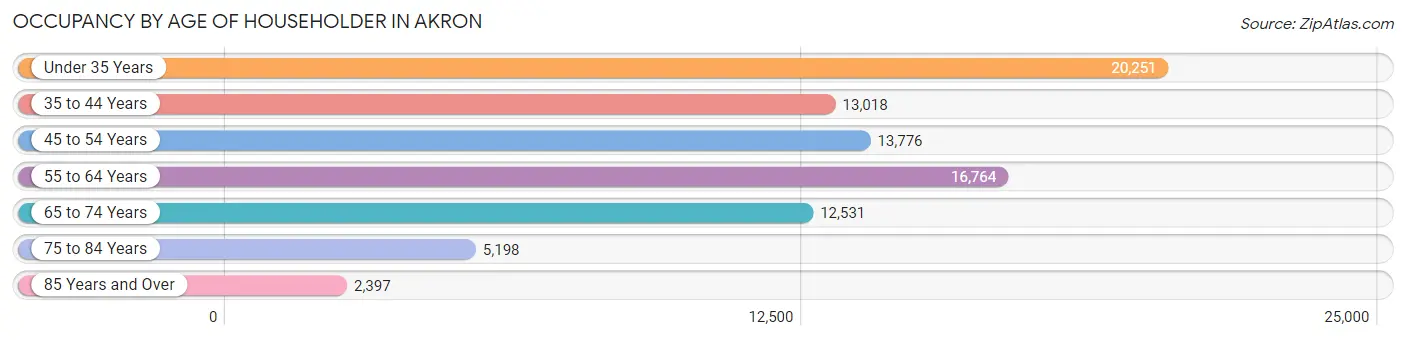
| Age Bracket | # Households | % Households |
| Under 35 Years | 20,251 | 24.1% |
| 35 to 44 Years | 13,018 | 15.5% |
| 45 to 54 Years | 13,776 | 16.4% |
| 55 to 64 Years | 16,764 | 20.0% |
| 65 to 74 Years | 12,531 | 14.9% |
| 75 to 84 Years | 5,198 | 6.2% |
| 85 Years and Over | 2,397 | 2.9% |
| Total | 83,935 | 100.0% |
Housing Finances in Akron
Median Income by Occupancy in Akron
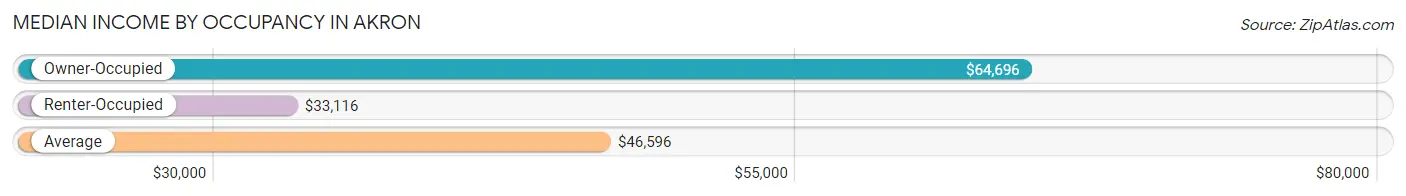
| Occupancy Type | # Households | Median Income |
| Owner-Occupied | 42,005 (50.0%) | $64,696 |
| Renter-Occupied | 41,930 (50.0%) | $33,116 |
| Average | 83,935 (100.0%) | $46,596 |
Occupancy by Householder Income Bracket in Akron
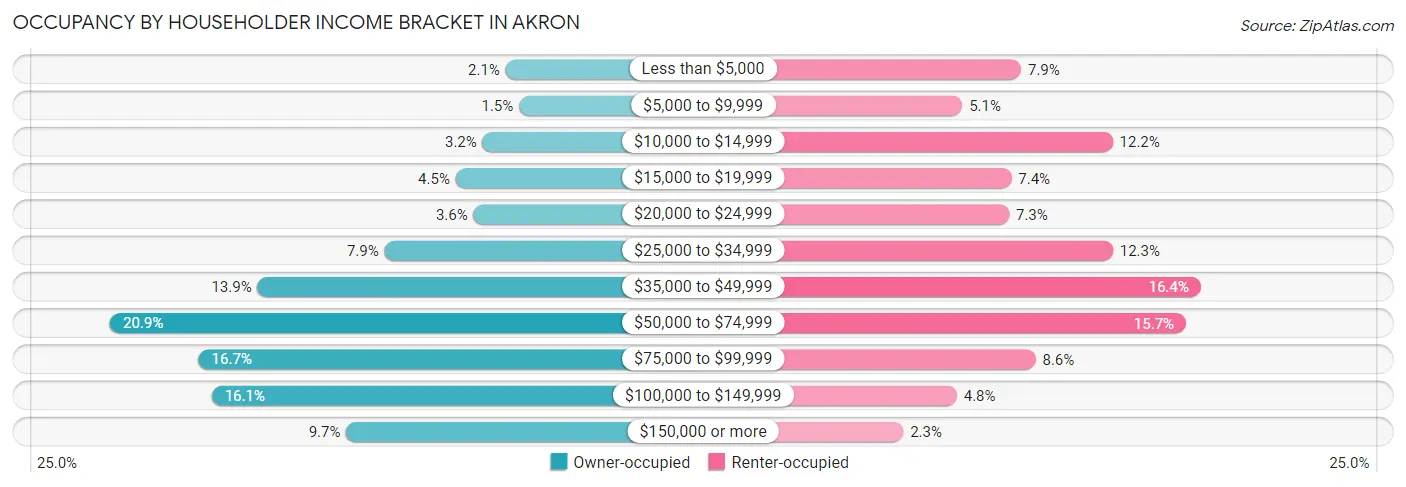
| Income Bracket | Owner-occupied | Renter-occupied |
| Less than $5,000 | 877 (2.1%) | 3,304 (7.9%) |
| $5,000 to $9,999 | 610 (1.5%) | 2,130 (5.1%) |
| $10,000 to $14,999 | 1,340 (3.2%) | 5,133 (12.2%) |
| $15,000 to $19,999 | 1,879 (4.5%) | 3,112 (7.4%) |
| $20,000 to $24,999 | 1,520 (3.6%) | 3,066 (7.3%) |
| $25,000 to $34,999 | 3,302 (7.9%) | 5,135 (12.2%) |
| $35,000 to $49,999 | 5,841 (13.9%) | 6,894 (16.4%) |
| $50,000 to $74,999 | 8,791 (20.9%) | 6,594 (15.7%) |
| $75,000 to $99,999 | 7,021 (16.7%) | 3,592 (8.6%) |
| $100,000 to $149,999 | 6,757 (16.1%) | 2,019 (4.8%) |
| $150,000 or more | 4,067 (9.7%) | 951 (2.3%) |
| Total | 42,005 (100.0%) | 41,930 (100.0%) |
Monthly Housing Cost Tiers in Akron
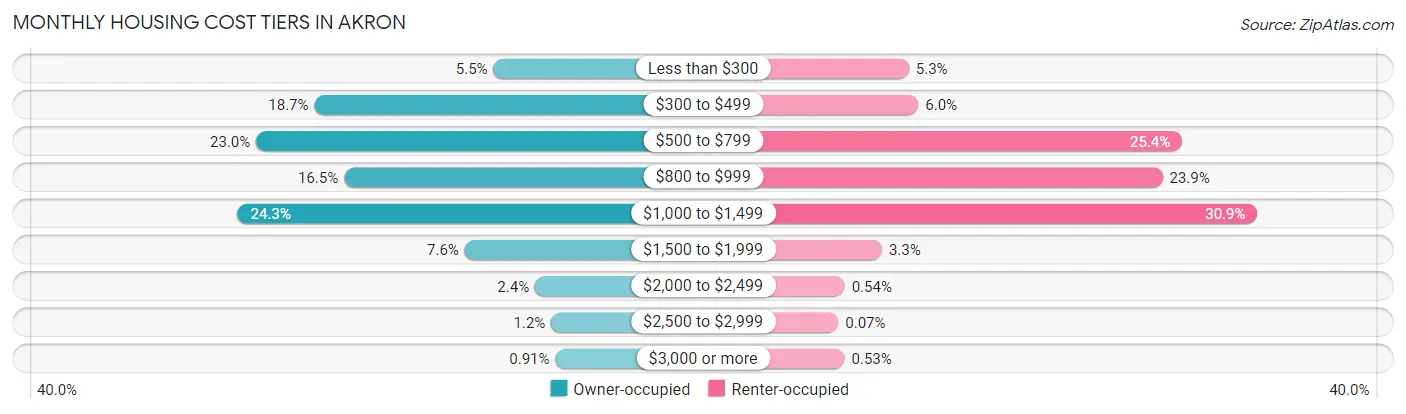
| Monthly Cost | Owner-occupied | Renter-occupied |
| Less than $300 | 2,297 (5.5%) | 2,205 (5.3%) |
| $300 to $499 | 7,837 (18.7%) | 2,501 (6.0%) |
| $500 to $799 | 9,642 (23.0%) | 10,641 (25.4%) |
| $800 to $999 | 6,922 (16.5%) | 10,037 (23.9%) |
| $1,000 to $1,499 | 10,213 (24.3%) | 12,964 (30.9%) |
| $1,500 to $1,999 | 3,188 (7.6%) | 1,375 (3.3%) |
| $2,000 to $2,499 | 1,013 (2.4%) | 225 (0.5%) |
| $2,500 to $2,999 | 511 (1.2%) | 29 (0.1%) |
| $3,000 or more | 382 (0.9%) | 222 (0.5%) |
| Total | 42,005 (100.0%) | 41,930 (100.0%) |
Physical Housing Characteristics in Akron
Housing Structures in Akron
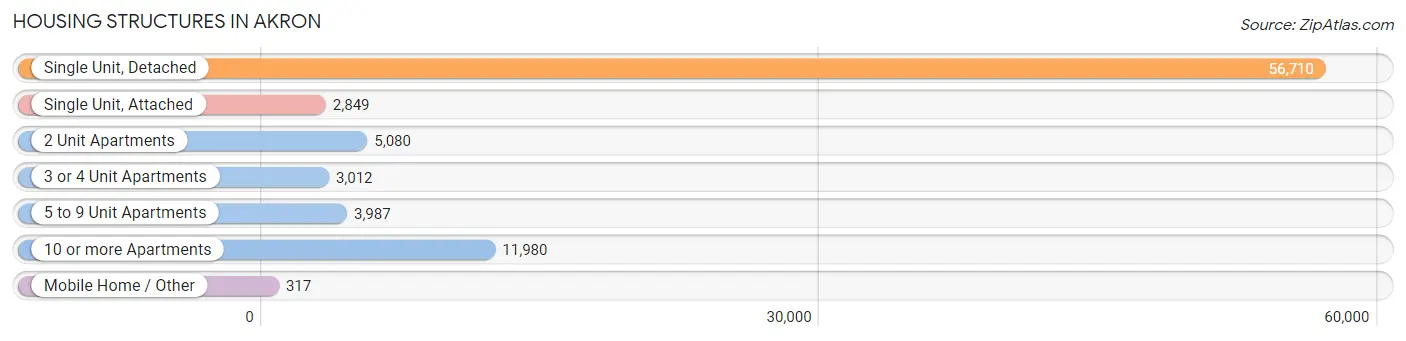
| Structure Type | # Housing Units | % Housing Units |
| Single Unit, Detached | 56,710 | 67.6% |
| Single Unit, Attached | 2,849 | 3.4% |
| 2 Unit Apartments | 5,080 | 6.0% |
| 3 or 4 Unit Apartments | 3,012 | 3.6% |
| 5 to 9 Unit Apartments | 3,987 | 4.8% |
| 10 or more Apartments | 11,980 | 14.3% |
| Mobile Home / Other | 317 | 0.4% |
| Total | 83,935 | 100.0% |
Housing Structures by Occupancy in Akron
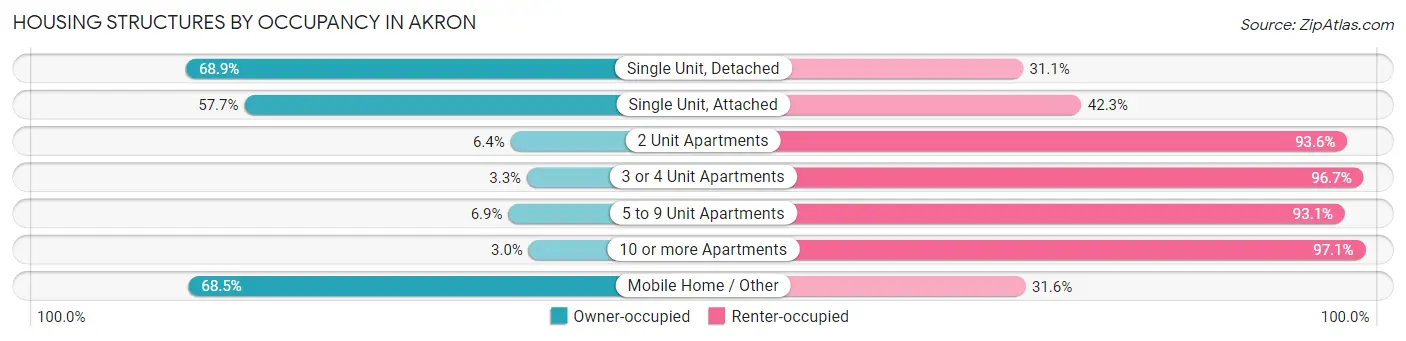
| Structure Type | Owner-occupied | Renter-occupied |
| Single Unit, Detached | 39,092 (68.9%) | 17,618 (31.1%) |
| Single Unit, Attached | 1,644 (57.7%) | 1,205 (42.3%) |
| 2 Unit Apartments | 326 (6.4%) | 4,754 (93.6%) |
| 3 or 4 Unit Apartments | 99 (3.3%) | 2,913 (96.7%) |
| 5 to 9 Unit Apartments | 274 (6.9%) | 3,713 (93.1%) |
| 10 or more Apartments | 353 (2.9%) | 11,627 (97.1%) |
| Mobile Home / Other | 217 (68.4%) | 100 (31.6%) |
| Total | 42,005 (50.0%) | 41,930 (50.0%) |
Housing Structures by Number of Rooms in Akron
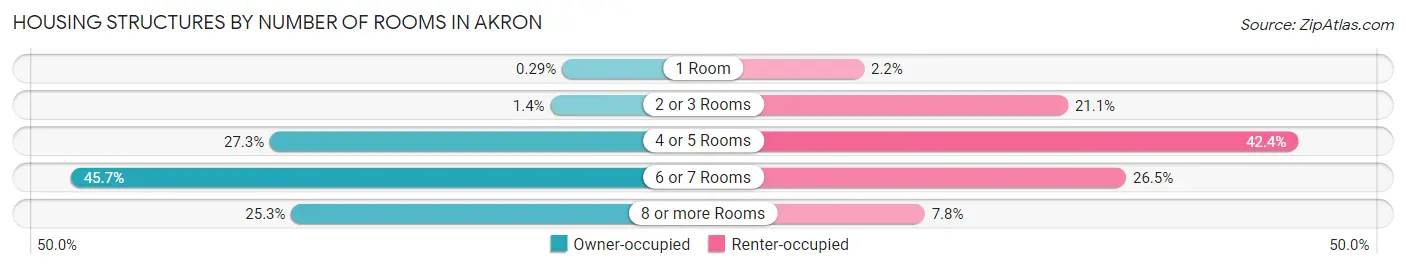
| Number of Rooms | Owner-occupied | Renter-occupied |
| 1 Room | 120 (0.3%) | 934 (2.2%) |
| 2 or 3 Rooms | 574 (1.4%) | 8,844 (21.1%) |
| 4 or 5 Rooms | 11,466 (27.3%) | 17,770 (42.4%) |
| 6 or 7 Rooms | 19,207 (45.7%) | 11,094 (26.5%) |
| 8 or more Rooms | 10,638 (25.3%) | 3,288 (7.8%) |
| Total | 42,005 (100.0%) | 41,930 (100.0%) |
Housing Structure by Heating Type in Akron
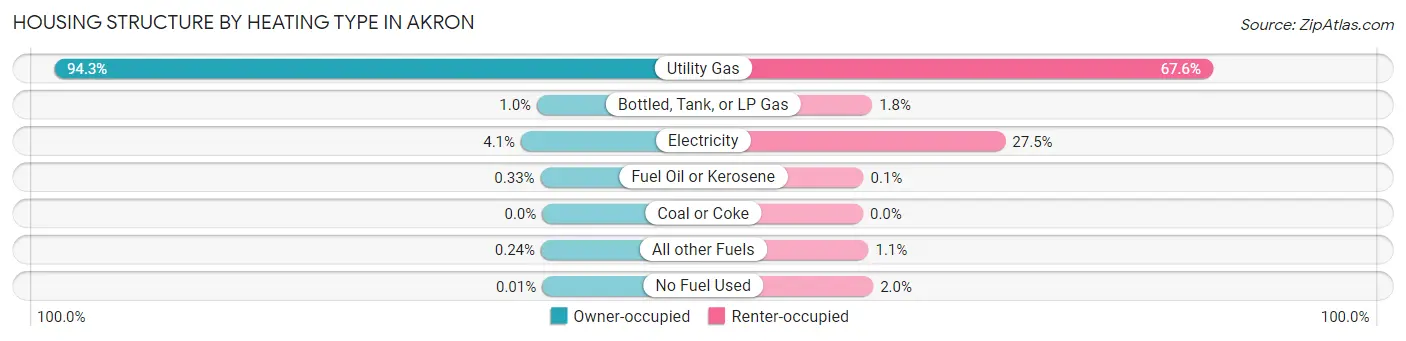
| Heating Type | Owner-occupied | Renter-occupied |
| Utility Gas | 39,620 (94.3%) | 28,336 (67.6%) |
| Bottled, Tank, or LP Gas | 420 (1.0%) | 743 (1.8%) |
| Electricity | 1,723 (4.1%) | 11,536 (27.5%) |
| Fuel Oil or Kerosene | 139 (0.3%) | 44 (0.1%) |
| Coal or Coke | 0 (0.0%) | 0 (0.0%) |
| All other Fuels | 99 (0.2%) | 445 (1.1%) |
| No Fuel Used | 4 (0.0%) | 826 (2.0%) |
| Total | 42,005 (100.0%) | 41,930 (100.0%) |
Household Vehicle Usage in Akron
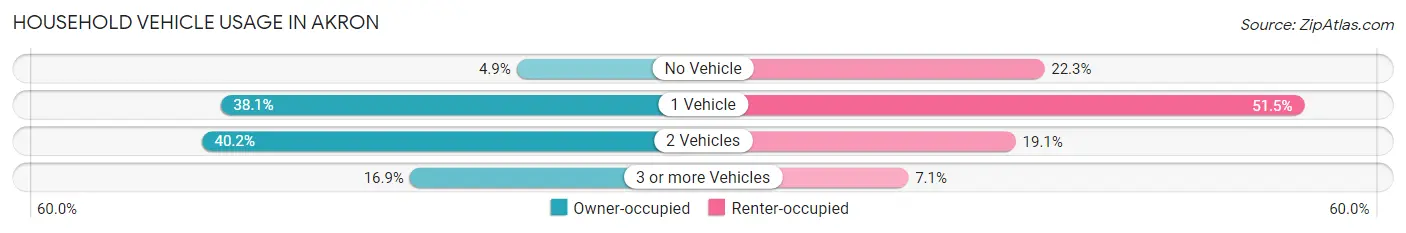
| Vehicles per Household | Owner-occupied | Renter-occupied |
| No Vehicle | 2,052 (4.9%) | 9,364 (22.3%) |
| 1 Vehicle | 15,991 (38.1%) | 21,576 (51.5%) |
| 2 Vehicles | 16,879 (40.2%) | 8,018 (19.1%) |
| 3 or more Vehicles | 7,083 (16.9%) | 2,972 (7.1%) |
| Total | 42,005 (100.0%) | 41,930 (100.0%) |
Real Estate & Mortgages in Akron
Real Estate and Mortgage Overview in Akron
| Characteristic | Without Mortgage | With Mortgage |
| Housing Units | 16,967 | 25,038 |
| Median Property Value | $93,300 | $107,300 |
| Median Household Income | $53,097 | $2,779 |
| Monthly Housing Costs | $466 | $382 |
| Real Estate Taxes | $1,665 | $688 |
Property Value by Mortgage Status in Akron
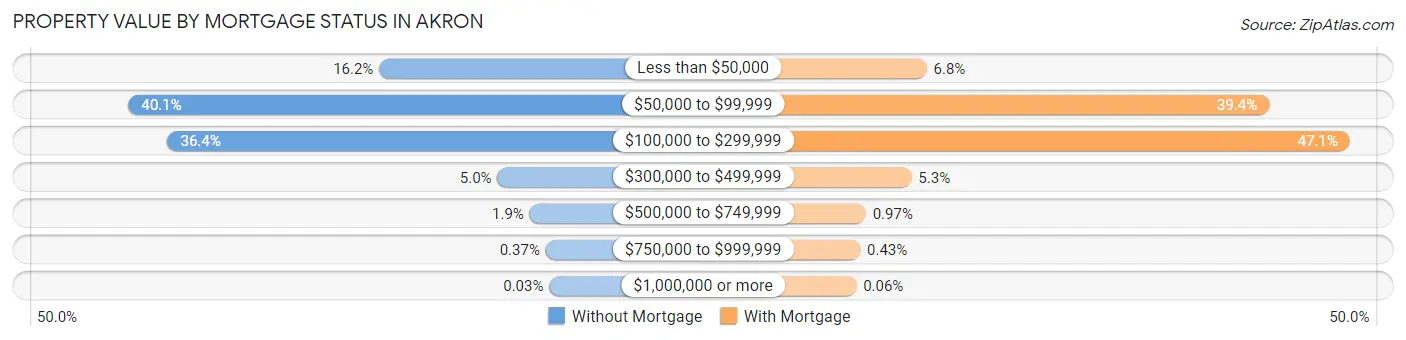
| Property Value | Without Mortgage | With Mortgage |
| Less than $50,000 | 2,754 (16.2%) | 1,694 (6.8%) |
| $50,000 to $99,999 | 6,808 (40.1%) | 9,861 (39.4%) |
| $100,000 to $299,999 | 6,172 (36.4%) | 11,785 (47.1%) |
| $300,000 to $499,999 | 844 (5.0%) | 1,332 (5.3%) |
| $500,000 to $749,999 | 322 (1.9%) | 244 (1.0%) |
| $750,000 to $999,999 | 62 (0.4%) | 108 (0.4%) |
| $1,000,000 or more | 5 (0.0%) | 14 (0.1%) |
| Total | 16,967 (100.0%) | 25,038 (100.0%) |
Household Income by Mortgage Status in Akron
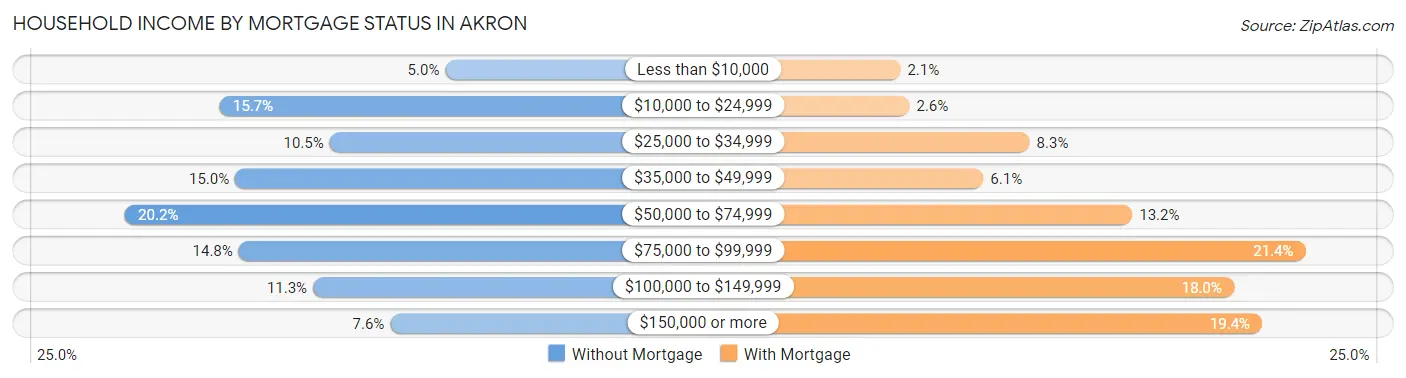
| Household Income | Without Mortgage | With Mortgage |
| Less than $10,000 | 843 (5.0%) | 536 (2.1%) |
| $10,000 to $24,999 | 2,663 (15.7%) | 644 (2.6%) |
| $25,000 to $34,999 | 1,778 (10.5%) | 2,076 (8.3%) |
| $35,000 to $49,999 | 2,541 (15.0%) | 1,524 (6.1%) |
| $50,000 to $74,999 | 3,429 (20.2%) | 3,300 (13.2%) |
| $75,000 to $99,999 | 2,512 (14.8%) | 5,362 (21.4%) |
| $100,000 to $149,999 | 1,913 (11.3%) | 4,509 (18.0%) |
| $150,000 or more | 1,288 (7.6%) | 4,844 (19.4%) |
| Total | 16,967 (100.0%) | 25,038 (100.0%) |
Property Value to Household Income Ratio in Akron
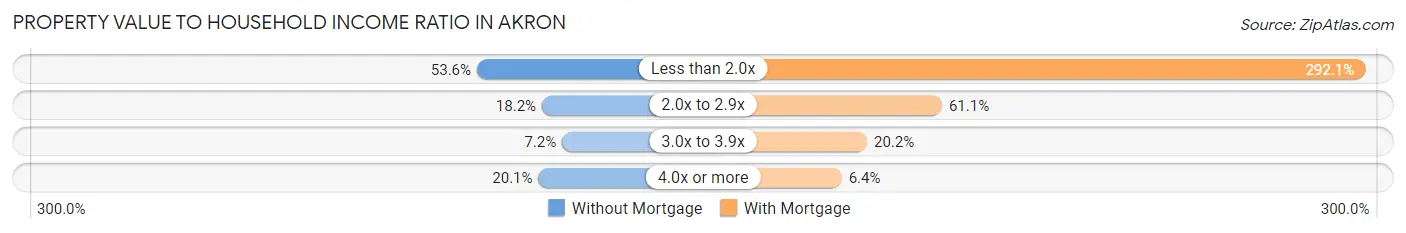
| Value-to-Income Ratio | Without Mortgage | With Mortgage |
| Less than 2.0x | 9,092 (53.6%) | 73,139 (292.1%) |
| 2.0x to 2.9x | 3,082 (18.2%) | 15,287 (61.1%) |
| 3.0x to 3.9x | 1,221 (7.2%) | 5,063 (20.2%) |
| 4.0x or more | 3,406 (20.1%) | 1,608 (6.4%) |
| Total | 16,967 (100.0%) | 25,038 (100.0%) |
Real Estate Taxes by Mortgage Status in Akron
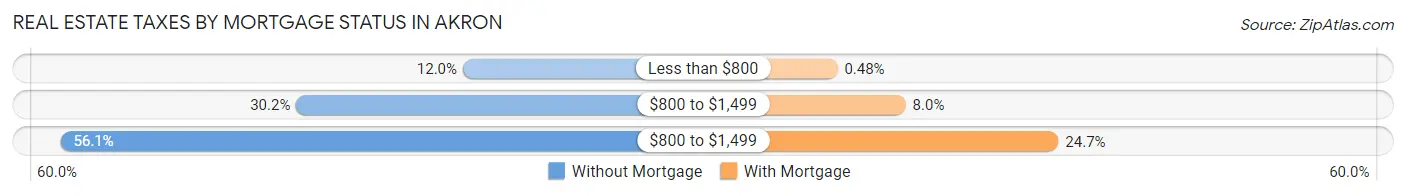
| Property Taxes | Without Mortgage | With Mortgage |
| Less than $800 | 2,031 (12.0%) | 119 (0.5%) |
| $800 to $1,499 | 5,129 (30.2%) | 1,992 (8.0%) |
| $800 to $1,499 | 9,513 (56.1%) | 6,184 (24.7%) |
| Total | 16,967 (100.0%) | 25,038 (100.0%) |
Health & Disability in Akron
Health Insurance Coverage by Age in Akron
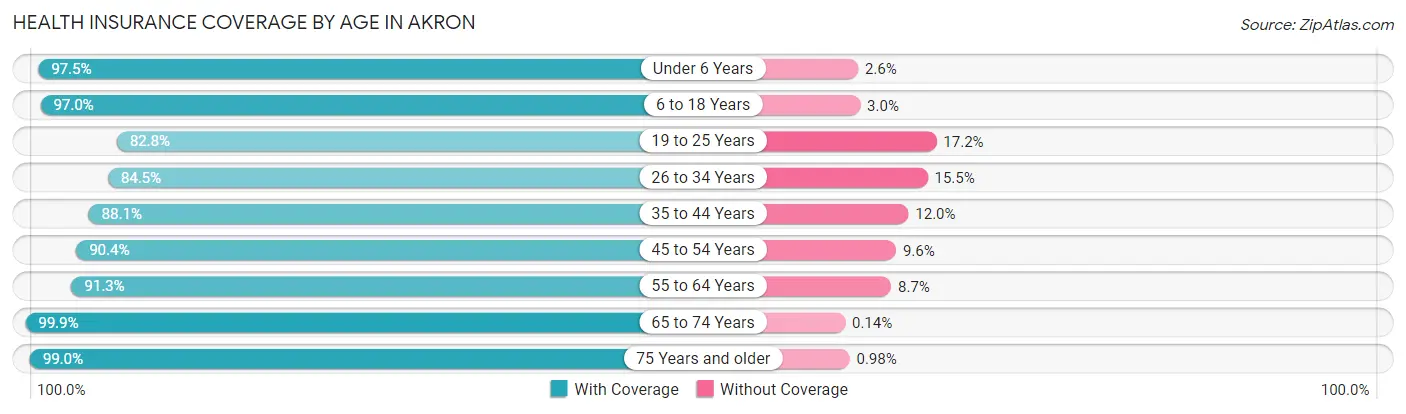
| Age Bracket | With Coverage | Without Coverage |
| Under 6 Years | 13,818 (97.5%) | 361 (2.5%) |
| 6 to 18 Years | 27,465 (97.0%) | 839 (3.0%) |
| 19 to 25 Years | 17,909 (82.8%) | 3,715 (17.2%) |
| 26 to 34 Years | 21,585 (84.5%) | 3,968 (15.5%) |
| 35 to 44 Years | 19,708 (88.0%) | 2,676 (11.9%) |
| 45 to 54 Years | 20,324 (90.4%) | 2,165 (9.6%) |
| 55 to 64 Years | 22,745 (91.3%) | 2,176 (8.7%) |
| 65 to 74 Years | 18,245 (99.9%) | 26 (0.1%) |
| 75 Years and older | 10,553 (99.0%) | 104 (1.0%) |
| Total | 172,352 (91.5%) | 16,030 (8.5%) |
Health Insurance Coverage by Citizenship Status in Akron
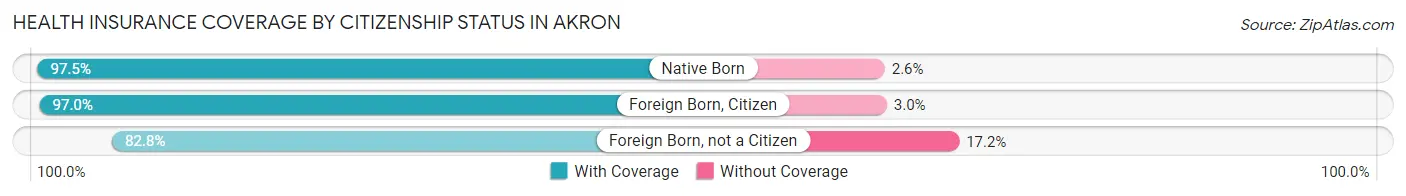
| Citizenship Status | With Coverage | Without Coverage |
| Native Born | 13,818 (97.5%) | 361 (2.5%) |
| Foreign Born, Citizen | 27,465 (97.0%) | 839 (3.0%) |
| Foreign Born, not a Citizen | 17,909 (82.8%) | 3,715 (17.2%) |
Health Insurance Coverage by Household Income in Akron
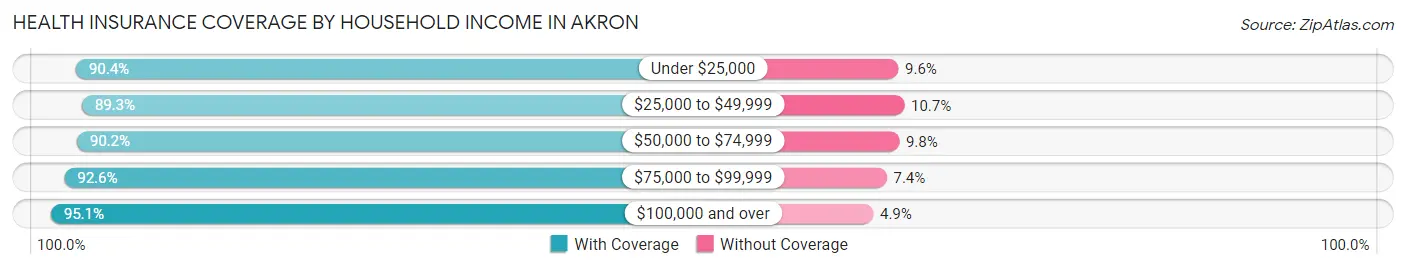
| Household Income | With Coverage | Without Coverage |
| Under $25,000 | 34,524 (90.4%) | 3,673 (9.6%) |
| $25,000 to $49,999 | 39,117 (89.3%) | 4,696 (10.7%) |
| $50,000 to $74,999 | 32,551 (90.2%) | 3,530 (9.8%) |
| $75,000 to $99,999 | 25,596 (92.6%) | 2,057 (7.4%) |
| $100,000 and over | 37,687 (95.1%) | 1,950 (4.9%) |
Public vs Private Health Insurance Coverage by Age in Akron
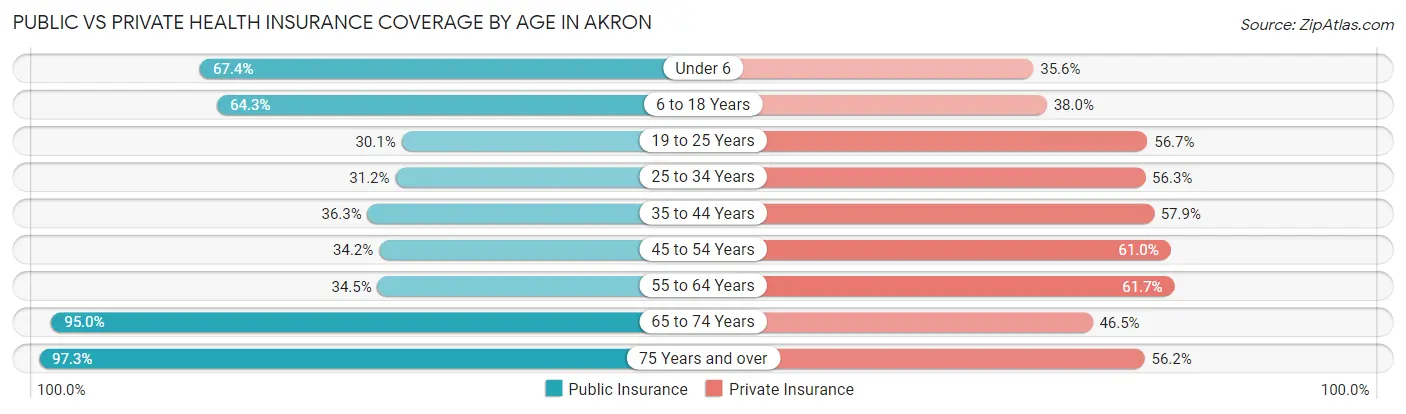
| Age Bracket | Public Insurance | Private Insurance |
| Under 6 | 9,563 (67.4%) | 5,041 (35.5%) |
| 6 to 18 Years | 18,193 (64.3%) | 10,766 (38.0%) |
| 19 to 25 Years | 6,499 (30.0%) | 12,261 (56.7%) |
| 25 to 34 Years | 7,968 (31.2%) | 14,388 (56.3%) |
| 35 to 44 Years | 8,134 (36.3%) | 12,961 (57.9%) |
| 45 to 54 Years | 7,692 (34.2%) | 13,725 (61.0%) |
| 55 to 64 Years | 8,595 (34.5%) | 15,384 (61.7%) |
| 65 to 74 Years | 17,365 (95.0%) | 8,499 (46.5%) |
| 75 Years and over | 10,370 (97.3%) | 5,988 (56.2%) |
| Total | 94,379 (50.1%) | 99,013 (52.6%) |
Disability Status by Sex by Age in Akron
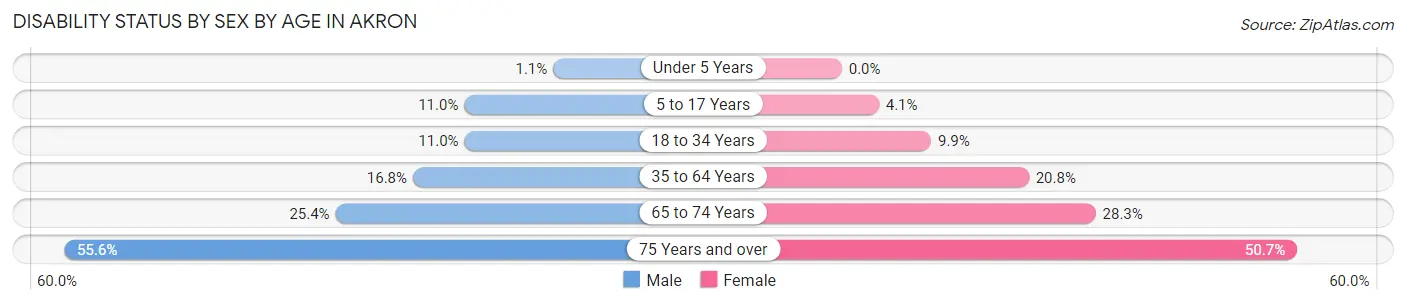
| Age Bracket | Male | Female |
| Under 5 Years | 67 (1.1%) | 0 (0.0%) |
| 5 to 17 Years | 1,562 (11.0%) | 592 (4.1%) |
| 18 to 34 Years | 2,765 (11.0%) | 2,429 (9.9%) |
| 35 to 64 Years | 5,601 (16.8%) | 7,575 (20.8%) |
| 65 to 74 Years | 2,054 (25.4%) | 2,878 (28.3%) |
| 75 Years and over | 2,295 (55.6%) | 3,311 (50.7%) |
Disability Class by Sex by Age in Akron
Disability Class: Hearing Difficulty
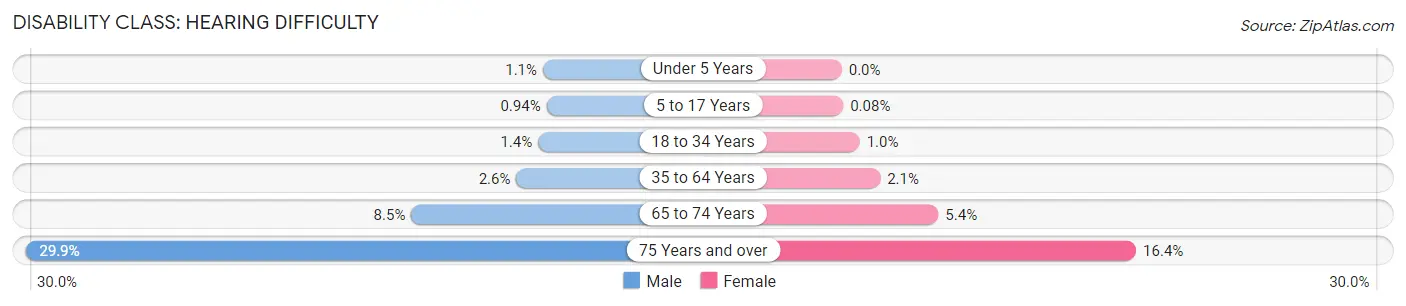
| Age Bracket | Male | Female |
| Under 5 Years | 67 (1.1%) | 0 (0.0%) |
| 5 to 17 Years | 133 (0.9%) | 12 (0.1%) |
| 18 to 34 Years | 353 (1.4%) | 244 (1.0%) |
| 35 to 64 Years | 874 (2.6%) | 779 (2.1%) |
| 65 to 74 Years | 685 (8.5%) | 548 (5.4%) |
| 75 Years and over | 1,234 (29.9%) | 1,070 (16.4%) |
Disability Class: Vision Difficulty
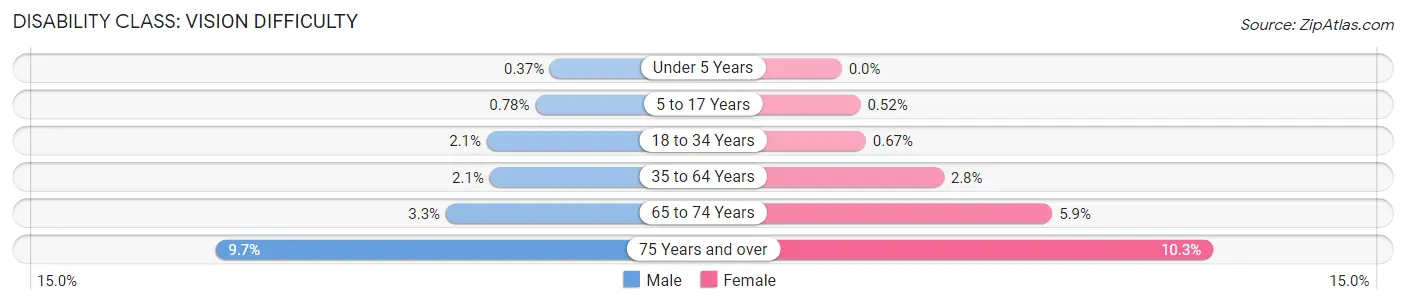
| Age Bracket | Male | Female |
| Under 5 Years | 22 (0.4%) | 0 (0.0%) |
| 5 to 17 Years | 110 (0.8%) | 74 (0.5%) |
| 18 to 34 Years | 535 (2.1%) | 163 (0.7%) |
| 35 to 64 Years | 684 (2.1%) | 1,032 (2.8%) |
| 65 to 74 Years | 265 (3.3%) | 596 (5.9%) |
| 75 Years and over | 400 (9.7%) | 675 (10.3%) |
Disability Class: Cognitive Difficulty
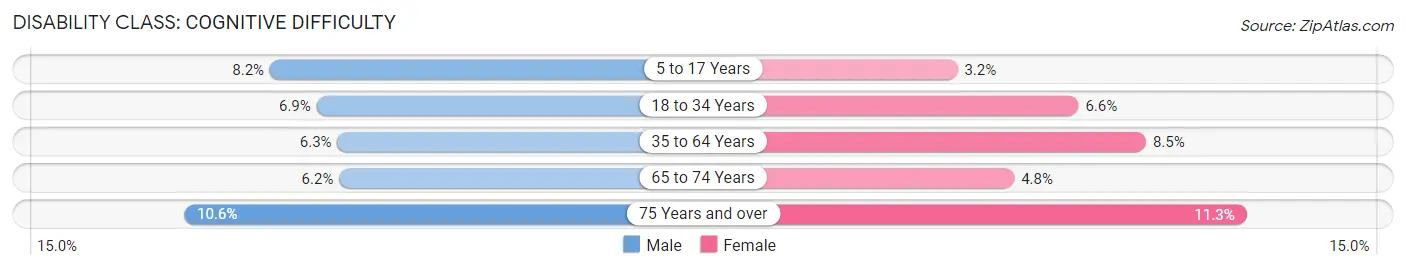
| Age Bracket | Male | Female |
| 5 to 17 Years | 1,156 (8.2%) | 462 (3.2%) |
| 18 to 34 Years | 1,724 (6.9%) | 1,611 (6.6%) |
| 35 to 64 Years | 2,102 (6.3%) | 3,081 (8.5%) |
| 65 to 74 Years | 505 (6.2%) | 489 (4.8%) |
| 75 Years and over | 436 (10.6%) | 736 (11.3%) |
Disability Class: Ambulatory Difficulty
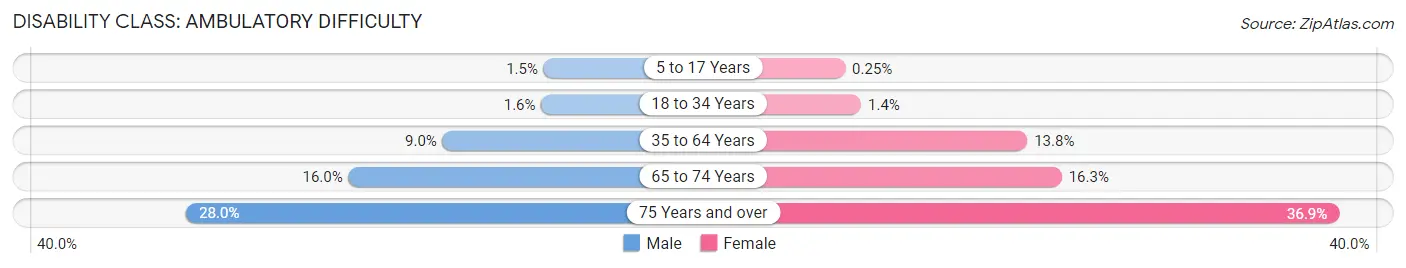
| Age Bracket | Male | Female |
| 5 to 17 Years | 205 (1.5%) | 36 (0.3%) |
| 18 to 34 Years | 410 (1.6%) | 349 (1.4%) |
| 35 to 64 Years | 2,995 (9.0%) | 5,011 (13.8%) |
| 65 to 74 Years | 1,291 (16.0%) | 1,662 (16.3%) |
| 75 Years and over | 1,156 (28.0%) | 2,411 (36.9%) |
Disability Class: Self-Care Difficulty
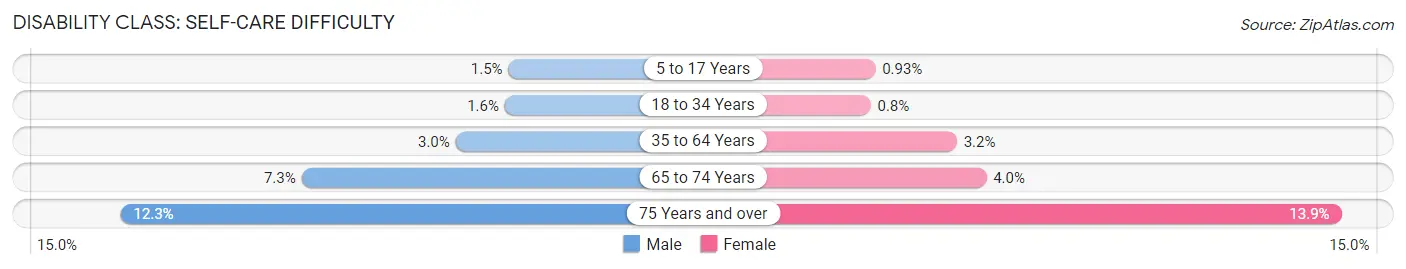
| Age Bracket | Male | Female |
| 5 to 17 Years | 217 (1.5%) | 133 (0.9%) |
| 18 to 34 Years | 408 (1.6%) | 195 (0.8%) |
| 35 to 64 Years | 1,004 (3.0%) | 1,163 (3.2%) |
| 65 to 74 Years | 590 (7.3%) | 409 (4.0%) |
| 75 Years and over | 509 (12.3%) | 908 (13.9%) |
Technology Access in Akron
Computing Device Access in Akron
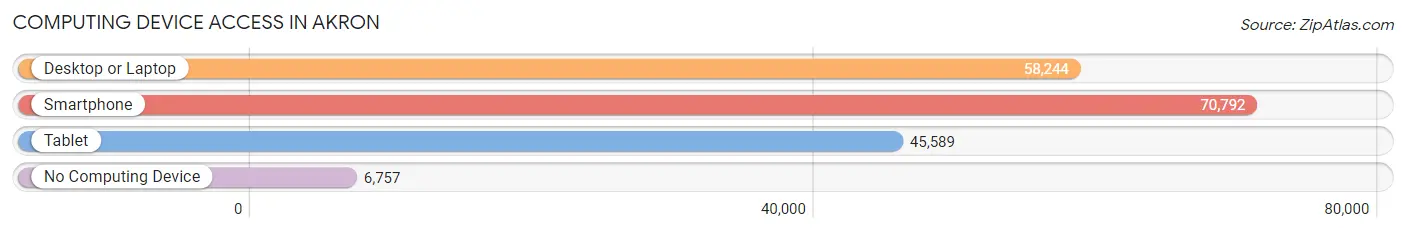
| Device Type | # Households | % Households |
| Desktop or Laptop | 58,244 | 69.4% |
| Smartphone | 70,792 | 84.3% |
| Tablet | 45,589 | 54.3% |
| No Computing Device | 6,757 | 8.1% |
| Total | 83,935 | 100.0% |
Internet Access in Akron
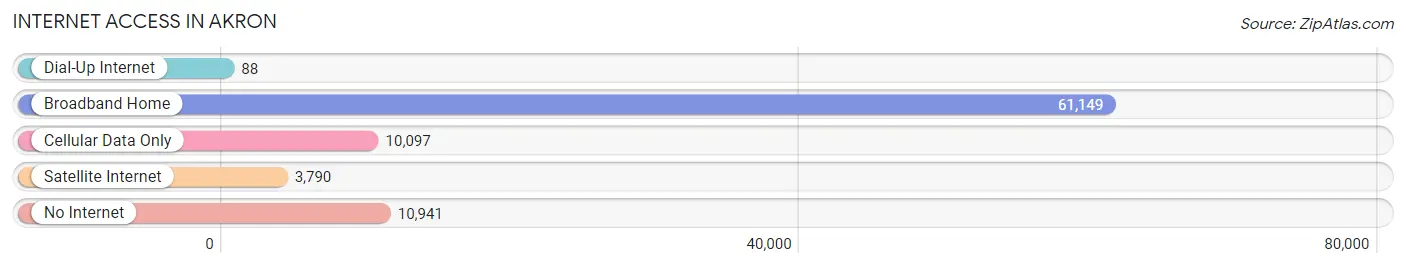
| Internet Type | # Households | % Households |
| Dial-Up Internet | 88 | 0.1% |
| Broadband Home | 61,149 | 72.9% |
| Cellular Data Only | 10,097 | 12.0% |
| Satellite Internet | 3,790 | 4.5% |
| No Internet | 10,941 | 13.0% |
| Total | 83,935 | 100.0% |
Akron Summary
Akron, Ohio is a city located in Summit County in the northeastern part of the state. It is the fifth-largest city in Ohio and the county seat of Summit County. The city is situated on the Little Cuyahoga River and is part of the Greater Cleveland metropolitan area. Akron is known for its rubber and tire industry, and is home to the University of Akron, the Goodyear Tire & Rubber Company, and the Akron-Canton Regional Airport.
History
The area that is now Akron was first settled in 1825 by Simon Perkins and Paul Williams. The two men named the settlement after the Greek word for “high point”, akros. The settlement was incorporated as a village in 1836 and as a city in 1865.
In the late 19th century, Akron became a major center for the rubber and tire industry. The Goodyear Tire & Rubber Company was founded in 1898 and is still headquartered in Akron. The city also became a major center for the production of stoneware and pottery.
Geography
Akron is located in Summit County in the northeastern part of Ohio. It is situated on the Little Cuyahoga River and is part of the Greater Cleveland metropolitan area. The city covers an area of 62.1 square miles and has an elevation of 1,037 feet.
The climate in Akron is classified as humid continental, with hot, humid summers and cold, snowy winters. The average annual temperature is 50.2°F, with an average high of 68.2°F in July and an average low of 32.2°F in January.
Economy
Akron’s economy is largely based on the rubber and tire industry. The Goodyear Tire & Rubber Company is the city’s largest employer, with over 5,000 employees. Other major employers include the University of Akron, Akron Children’s Hospital, and Summa Health System.
The city is also home to several manufacturing companies, including the B.F. Goodrich Company, the Firestone Tire & Rubber Company, and the General Tire Company. The city is also home to several technology companies, including the Akron Digital Media Center and the Akron Global Business Accelerator.
Demographics
As of the 2010 census, the population of Akron was 199,110. The racial makeup of the city was 63.2% White, 28.2% African American, 0.3% Native American, 2.2% Asian, and 5.9% from other races. The median household income was $33,945, and the median family income was $41,919.
The city is home to a large number of immigrants, with the largest groups coming from Mexico, India, and China. The city also has a large LGBT population, with an estimated 8.3% of the population identifying as LGBT.
Conclusion
Akron, Ohio is a city located in Summit County in the northeastern part of the state. It is the fifth-largest city in Ohio and the county seat of Summit County. The city is known for its rubber and tire industry, and is home to the University of Akron, the Goodyear Tire & Rubber Company, and the Akron-Canton Regional Airport. The city has a diverse population and economy, and is home to a large number of immigrants and a significant LGBT population.
Common Questions
What is Per Capita Income in Akron?
Per Capita income in Akron is $28,390.
What is the Median Family Income in Akron?
Median Family Income in Akron is $60,328.
What is the Median Household income in Akron?
Median Household Income in Akron is $46,596.
What is Income or Wage Gap in Akron?
Income or Wage Gap in Akron is 20.1%.
Women in Akron earn 79.9 cents for every dollar earned by a man.
What is Family Income Deficit in Akron?
Family Income Deficit in Akron is $11,016.
Families that are below poverty line in Akron earn $11,016 less on average than the poverty threshold level.
What is Inequality or Gini Index in Akron?
Inequality or Gini Index in Akron is 0.46.
What is the Total Population of Akron?
Total Population of Akron is 190,273.
What is the Total Male Population of Akron?
Total Male Population of Akron is 91,892.
What is the Total Female Population of Akron?
Total Female Population of Akron is 98,381.
What is the Ratio of Males per 100 Females in Akron?
There are 93.40 Males per 100 Females in Akron.
What is the Ratio of Females per 100 Males in Akron?
There are 107.06 Females per 100 Males in Akron.
What is the Median Population Age in Akron?
Median Population Age in Akron is 37.1 Years.
What is the Average Family Size in Akron
Average Family Size in Akron is 3.0 People.
What is the Average Household Size in Akron
Average Household Size in Akron is 2.2 People.
How Large is the Labor Force in Akron?
There are 97,372 People in the Labor Forcein in Akron.
What is the Percentage of People in the Labor Force in Akron?
63.2% of People are in the Labor Force in Akron.
What is the Unemployment Rate in Akron?
Unemployment Rate in Akron is 7.7%.