Greensboro, NC Map & Demographics
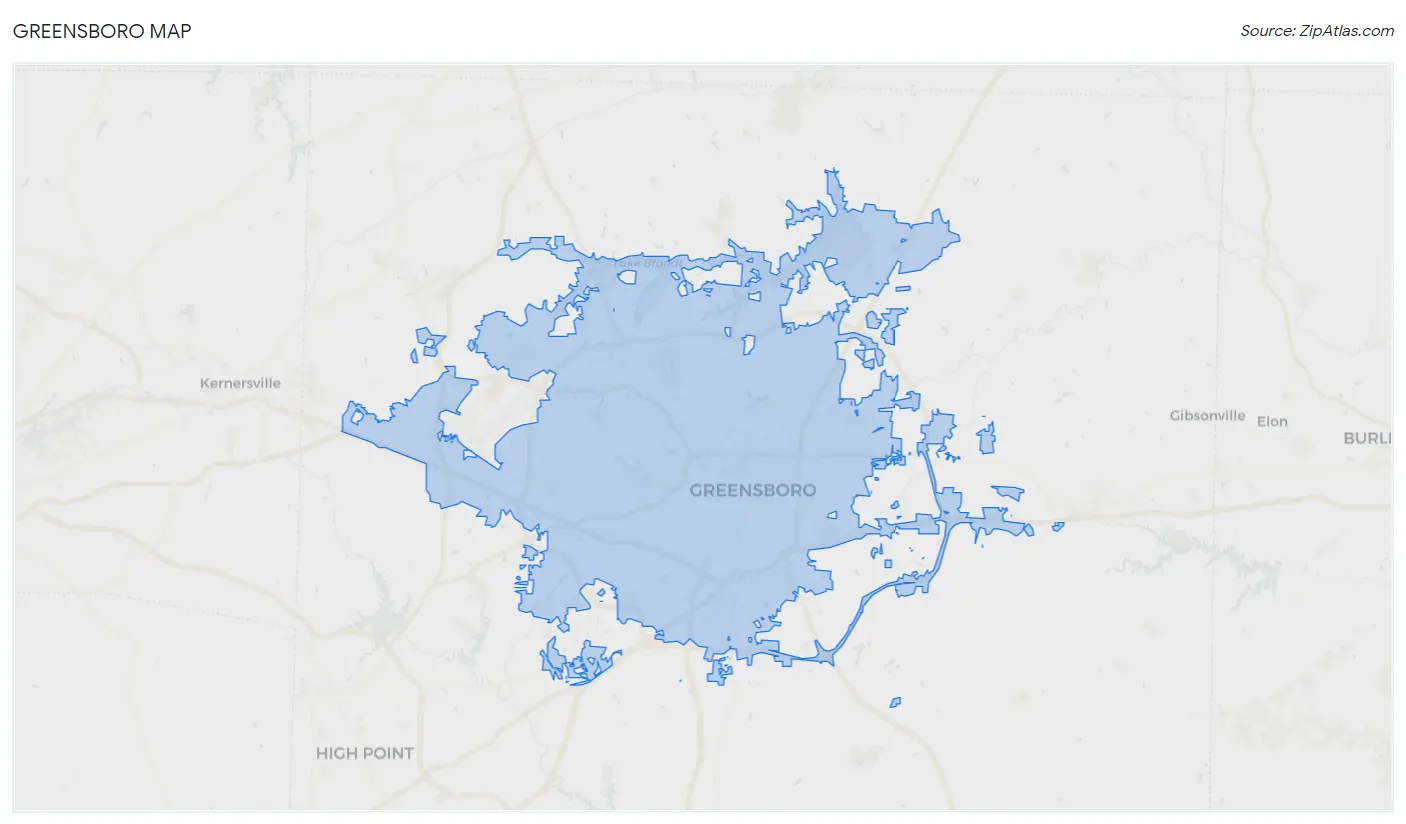
Greensboro Map
Greensboro Overview
$34,209
PER CAPITA INCOME
$71,934
AVG FAMILY INCOME
$55,051
AVG HOUSEHOLD INCOME
21.8%
WAGE / INCOME GAP [ % ]
78.2¢/ $1
WAGE / INCOME GAP [ $ ]
$11,307
FAMILY INCOME DEFICIT
0.50
INEQUALITY / GINI INDEX
297,202
TOTAL POPULATION
137,750
MALE POPULATION
159,452
FEMALE POPULATION
86.39
MALES / 100 FEMALES
115.75
FEMALES / 100 MALES
34.0
MEDIAN AGE
3.1
AVG FAMILY SIZE
2.3
AVG HOUSEHOLD SIZE
155,682
LABOR FORCE [ PEOPLE ]
65.3%
PERCENT IN LABOR FORCE
5.5%
UNEMPLOYMENT RATE
Greensboro Area Codes
Income in Greensboro
Income Overview in Greensboro
Per Capita Income in Greensboro is $34,209, while median incomes of families and households are $71,934 and $55,051 respectively.
| Characteristic | Number | Measure |
| Per Capita Income | 297,202 | $34,209 |
| Median Family Income | 67,647 | $71,934 |
| Mean Family Income | 67,647 | $99,644 |
| Median Household Income | 120,137 | $55,051 |
| Mean Household Income | 120,137 | $81,895 |
| Income Deficit | 67,647 | $11,307 |
| Wage / Income Gap (%) | 297,202 | 21.76% |
| Wage / Income Gap ($) | 297,202 | 78.24¢ per $1 |
| Gini / Inequality Index | 297,202 | 0.50 |
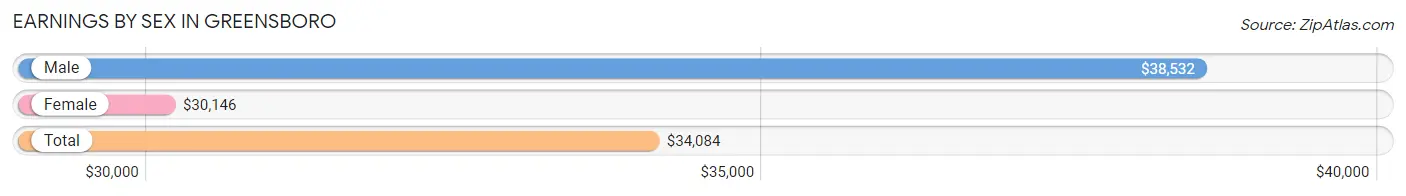
Earnings by Sex in Greensboro
Average Earnings in Greensboro are $34,084, $38,532 for men and $30,146 for women, a difference of 21.8%.
| Sex | Number | Average Earnings |
| Male | 78,569 (47.8%) | $38,532 |
| Female | 85,814 (52.2%) | $30,146 |
| Total | 164,383 (100.0%) | $34,084 |
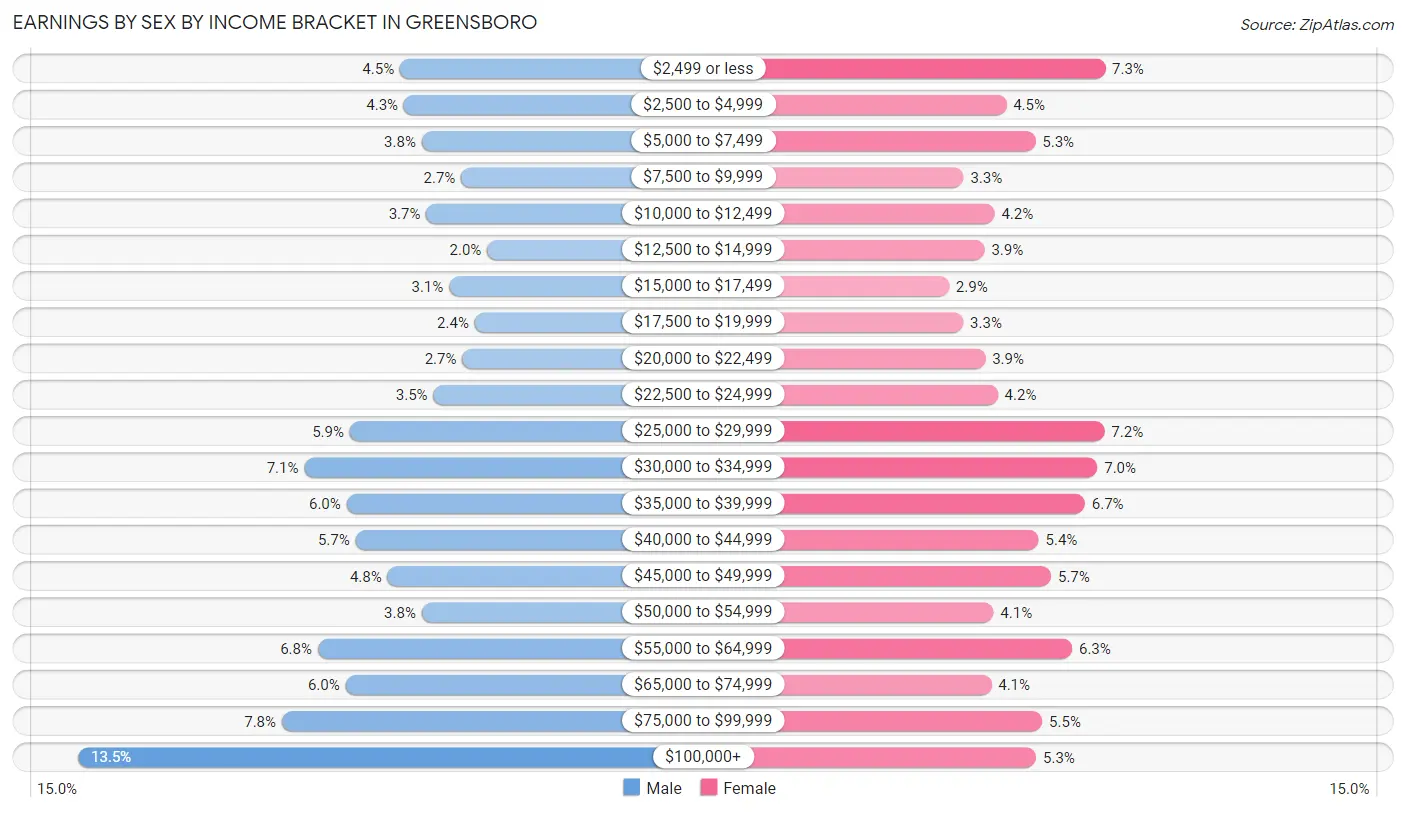
Earnings by Sex by Income Bracket in Greensboro
The most common earnings brackets in Greensboro are $100,000+ for men (10,610 | 13.5%) and $2,499 or less for women (6,232 | 7.3%).
| Income | Male | Female |
| $2,499 or less | 3,498 (4.4%) | 6,232 (7.3%) |
| $2,500 to $4,999 | 3,407 (4.3%) | 3,845 (4.5%) |
| $5,000 to $7,499 | 3,017 (3.8%) | 4,544 (5.3%) |
| $7,500 to $9,999 | 2,143 (2.7%) | 2,811 (3.3%) |
| $10,000 to $12,499 | 2,912 (3.7%) | 3,557 (4.2%) |
| $12,500 to $14,999 | 1,572 (2.0%) | 3,324 (3.9%) |
| $15,000 to $17,499 | 2,410 (3.1%) | 2,463 (2.9%) |
| $17,500 to $19,999 | 1,843 (2.4%) | 2,804 (3.3%) |
| $20,000 to $22,499 | 2,121 (2.7%) | 3,334 (3.9%) |
| $22,500 to $24,999 | 2,761 (3.5%) | 3,636 (4.2%) |
| $25,000 to $29,999 | 4,603 (5.9%) | 6,212 (7.2%) |
| $30,000 to $34,999 | 5,613 (7.1%) | 6,039 (7.0%) |
| $35,000 to $39,999 | 4,676 (5.9%) | 5,737 (6.7%) |
| $40,000 to $44,999 | 4,477 (5.7%) | 4,623 (5.4%) |
| $45,000 to $49,999 | 3,770 (4.8%) | 4,929 (5.7%) |
| $50,000 to $54,999 | 3,017 (3.8%) | 3,535 (4.1%) |
| $55,000 to $64,999 | 5,315 (6.8%) | 5,429 (6.3%) |
| $65,000 to $74,999 | 4,697 (6.0%) | 3,485 (4.1%) |
| $75,000 to $99,999 | 6,107 (7.8%) | 4,707 (5.5%) |
| $100,000+ | 10,610 (13.5%) | 4,568 (5.3%) |
| Total | 78,569 (100.0%) | 85,814 (100.0%) |
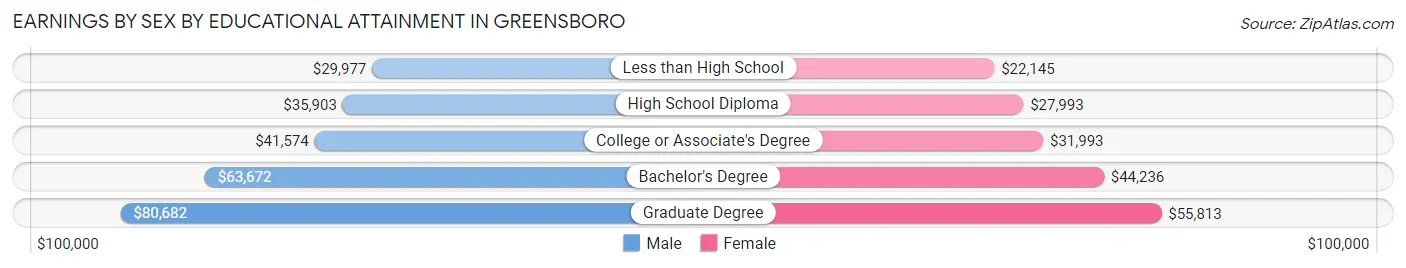
Earnings by Sex by Educational Attainment in Greensboro
Average earnings in Greensboro are $46,029 for men and $36,320 for women, a difference of 21.1%. Men with an educational attainment of graduate degree enjoy the highest average annual earnings of $80,682, while those with less than high school education earn the least with $29,977. Women with an educational attainment of graduate degree earn the most with the average annual earnings of $55,813, while those with less than high school education have the smallest earnings of $22,145.
| Educational Attainment | Male Income | Female Income |
| Less than High School | $29,977 | $22,145 |
| High School Diploma | $35,903 | $27,993 |
| College or Associate's Degree | $41,574 | $31,993 |
| Bachelor's Degree | $63,672 | $44,236 |
| Graduate Degree | $80,682 | $55,813 |
| Total | $46,029 | $36,320 |
Family Income in Greensboro
Family Income Brackets in Greensboro
According to the Greensboro family income data, there are 12,176 families falling into the $100,000 to $149,999 income range, which is the most common income bracket and makes up 18.0% of all families. Conversely, the $10,000 to $14,999 income bracket is the least frequent group with only 2,232 families (3.3%) belonging to this category.
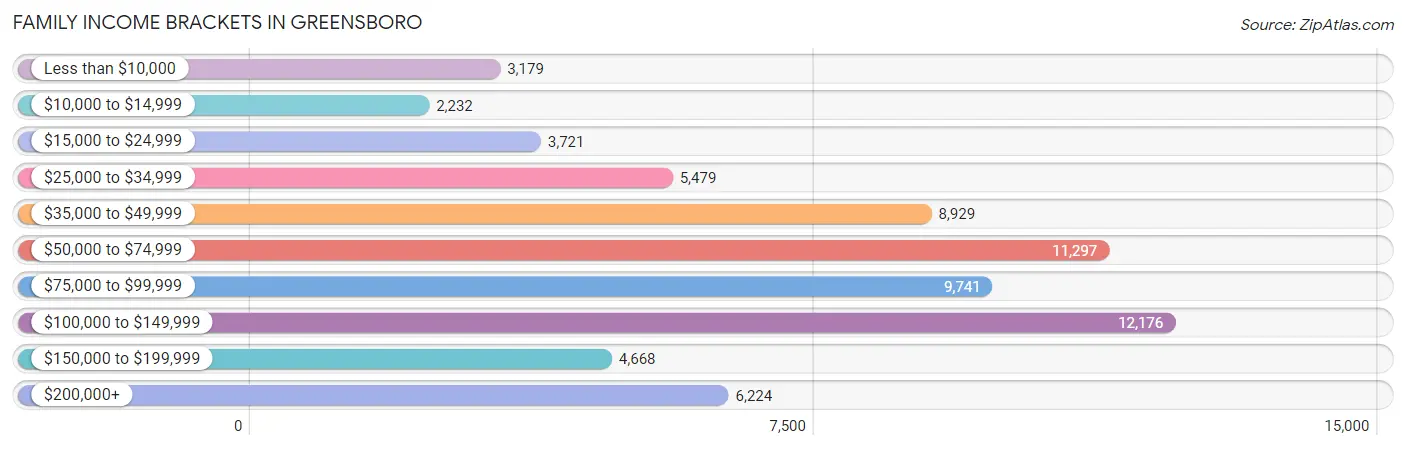
| Income Bracket | # Families | % Families |
| Less than $10,000 | 3,179 | 4.7% |
| $10,000 to $14,999 | 2,232 | 3.3% |
| $15,000 to $24,999 | 3,721 | 5.5% |
| $25,000 to $34,999 | 5,479 | 8.1% |
| $35,000 to $49,999 | 8,929 | 13.2% |
| $50,000 to $74,999 | 11,297 | 16.7% |
| $75,000 to $99,999 | 9,741 | 14.4% |
| $100,000 to $149,999 | 12,176 | 18.0% |
| $150,000 to $199,999 | 4,668 | 6.9% |
| $200,000+ | 6,224 | 9.2% |
Family Income by Famaliy Size in Greensboro
4-person families (11,346 | 16.8%) account for the highest median family income in Greensboro with $94,475 per family, while 2-person families (32,854 | 48.6%) have the highest median income of $32,218 per family member.
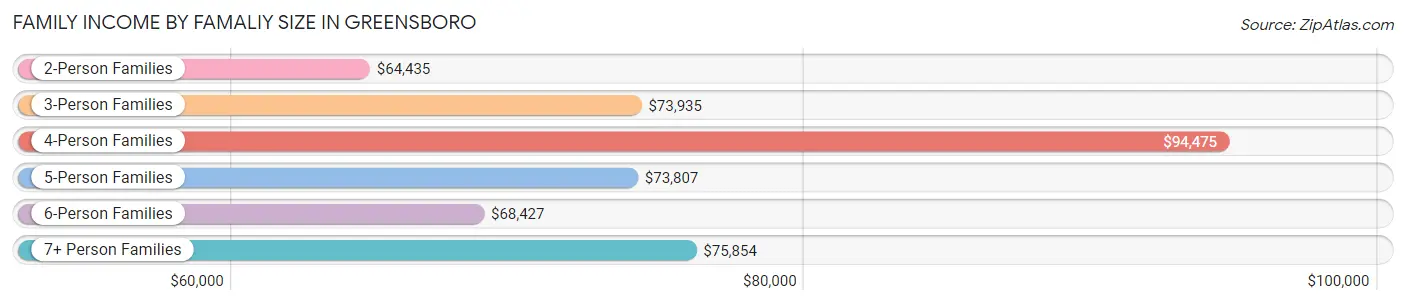
| Income Bracket | # Families | Median Income |
| 2-Person Families | 32,854 (48.6%) | $64,435 |
| 3-Person Families | 16,257 (24.0%) | $73,935 |
| 4-Person Families | 11,346 (16.8%) | $94,475 |
| 5-Person Families | 4,535 (6.7%) | $73,807 |
| 6-Person Families | 1,485 (2.2%) | $68,427 |
| 7+ Person Families | 1,170 (1.7%) | $75,854 |
| Total | 67,647 (100.0%) | $71,934 |
Family Income by Number of Earners in Greensboro
The median family income in Greensboro is $71,934, with families comprising 3+ earners (6,298) having the highest median family income of $116,361, while families with no earners (8,588) have the lowest median family income of $43,340, accounting for 9.3% and 12.7% of families, respectively.
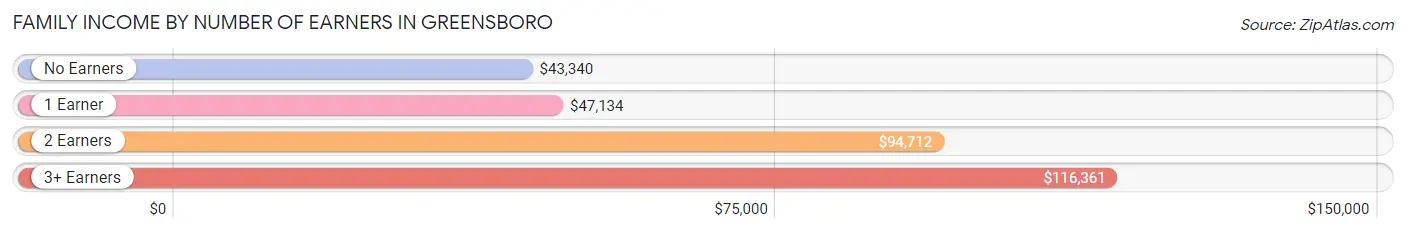
| Number of Earners | # Families | Median Income |
| No Earners | 8,588 (12.7%) | $43,340 |
| 1 Earner | 26,346 (39.0%) | $47,134 |
| 2 Earners | 26,415 (39.1%) | $94,712 |
| 3+ Earners | 6,298 (9.3%) | $116,361 |
| Total | 67,647 (100.0%) | $71,934 |
Household Income in Greensboro
Household Income Brackets in Greensboro
With 20,423 households falling in the category, the $50,000 to $74,999 income range is the most frequent in Greensboro, accounting for 17.0% of all households. In contrast, only 6,007 households (5.0%) fall into the $10,000 to $14,999 income bracket, making it the least populous group.
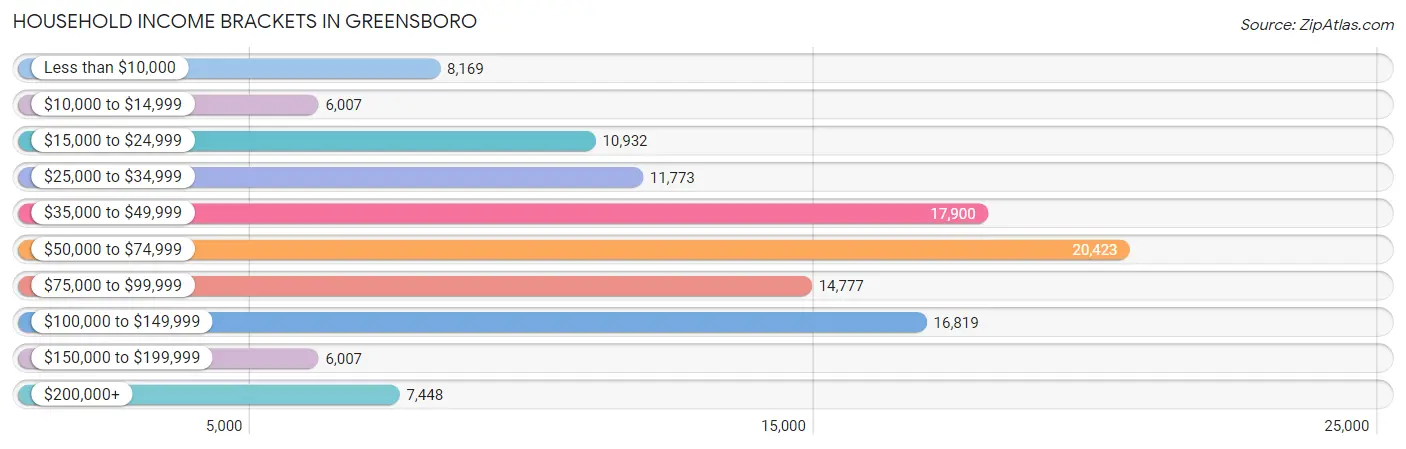
| Income Bracket | # Households | % Households |
| Less than $10,000 | 8,169 | 6.8% |
| $10,000 to $14,999 | 6,007 | 5.0% |
| $15,000 to $24,999 | 10,932 | 9.1% |
| $25,000 to $34,999 | 11,773 | 9.8% |
| $35,000 to $49,999 | 17,900 | 14.9% |
| $50,000 to $74,999 | 20,423 | 17.0% |
| $75,000 to $99,999 | 14,777 | 12.3% |
| $100,000 to $149,999 | 16,819 | 14.0% |
| $150,000 to $199,999 | 6,007 | 5.0% |
| $200,000+ | 7,448 | 6.2% |
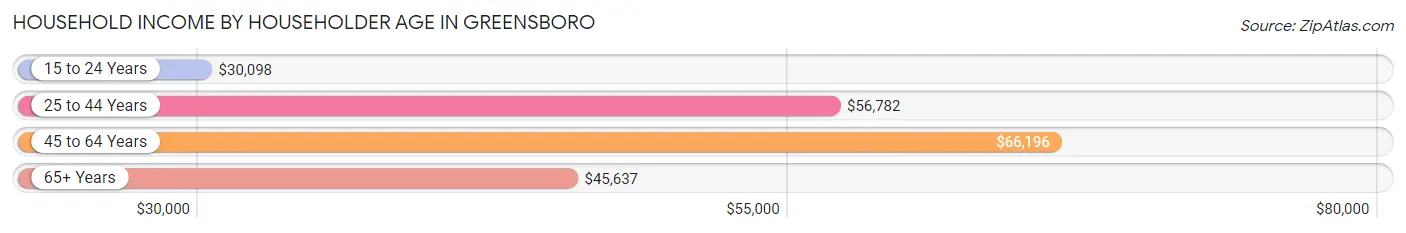
Household Income by Householder Age in Greensboro
The median household income in Greensboro is $55,051, with the highest median household income of $66,196 found in the 45 to 64 years age bracket for the primary householder. A total of 40,835 households (34.0%) fall into this category. Meanwhile, the 15 to 24 years age bracket for the primary householder has the lowest median household income of $30,098, with 7,282 households (6.1%) in this group.
| Income Bracket | # Households | Median Income |
| 15 to 24 Years | 7,282 (6.1%) | $30,098 |
| 25 to 44 Years | 45,595 (38.0%) | $56,782 |
| 45 to 64 Years | 40,835 (34.0%) | $66,196 |
| 65+ Years | 26,425 (22.0%) | $45,637 |
| Total | 120,137 (100.0%) | $55,051 |
Poverty in Greensboro
Income Below Poverty by Sex and Age in Greensboro
With 15.6% poverty level for males and 20.2% for females among the residents of Greensboro, 5 year old males and 18 to 24 year old females are the most vulnerable to poverty, with 406 males (29.2%) and 5,286 females (34.1%) in their respective age groups living below the poverty level.
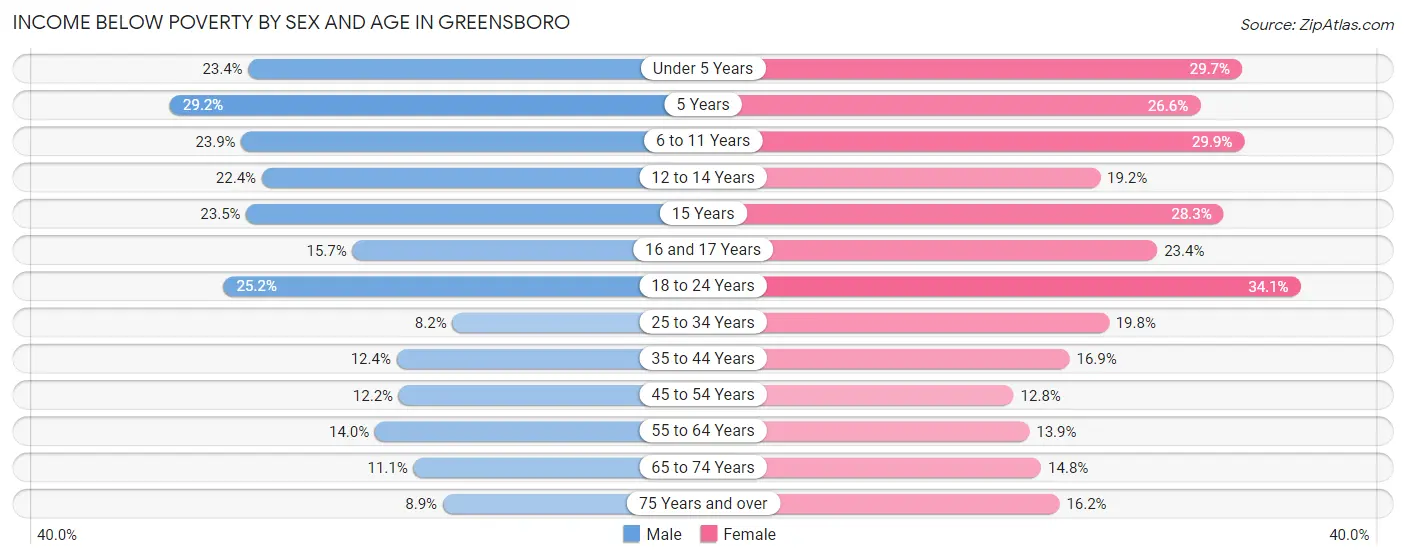
| Age Bracket | Male | Female |
| Under 5 Years | 2,070 (23.4%) | 2,502 (29.7%) |
| 5 Years | 406 (29.2%) | 389 (26.6%) |
| 6 to 11 Years | 2,714 (23.9%) | 3,292 (29.9%) |
| 12 to 14 Years | 1,244 (22.4%) | 1,119 (19.2%) |
| 15 Years | 505 (23.5%) | 588 (28.3%) |
| 16 and 17 Years | 592 (15.7%) | 683 (23.4%) |
| 18 to 24 Years | 3,522 (25.2%) | 5,286 (34.1%) |
| 25 to 34 Years | 1,705 (8.2%) | 4,938 (19.8%) |
| 35 to 44 Years | 2,076 (12.4%) | 3,303 (16.9%) |
| 45 to 54 Years | 2,007 (12.2%) | 2,342 (12.8%) |
| 55 to 64 Years | 1,992 (14.0%) | 2,463 (13.9%) |
| 65 to 74 Years | 1,169 (11.1%) | 1,914 (14.8%) |
| 75 Years and over | 526 (8.9%) | 1,582 (16.2%) |
| Total | 20,528 (15.6%) | 30,401 (20.2%) |
Income Above Poverty by Sex and Age in Greensboro
According to the poverty statistics in Greensboro, males aged 25 to 34 years and females aged 45 to 54 years are the age groups that are most secure financially, with 91.8% of males and 87.2% of females in these age groups living above the poverty line.
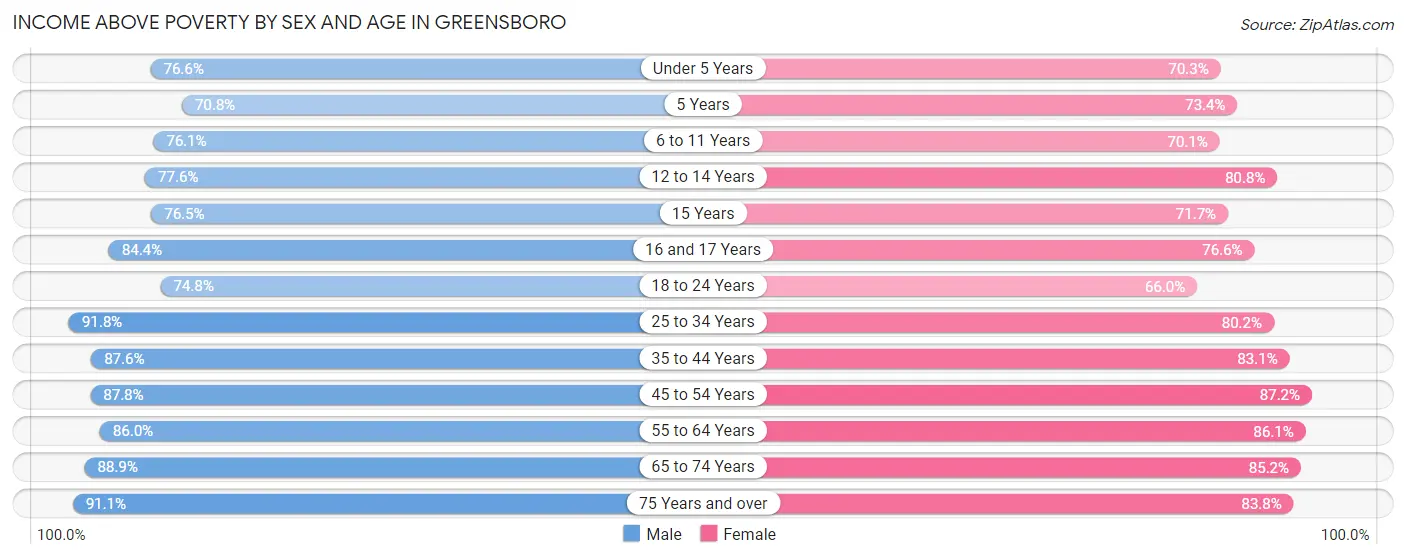
| Age Bracket | Male | Female |
| Under 5 Years | 6,782 (76.6%) | 5,921 (70.3%) |
| 5 Years | 984 (70.8%) | 1,074 (73.4%) |
| 6 to 11 Years | 8,642 (76.1%) | 7,730 (70.1%) |
| 12 to 14 Years | 4,314 (77.6%) | 4,716 (80.8%) |
| 15 Years | 1,641 (76.5%) | 1,487 (71.7%) |
| 16 and 17 Years | 3,190 (84.4%) | 2,233 (76.6%) |
| 18 to 24 Years | 10,438 (74.8%) | 10,237 (65.9%) |
| 25 to 34 Years | 19,005 (91.8%) | 19,973 (80.2%) |
| 35 to 44 Years | 14,703 (87.6%) | 16,231 (83.1%) |
| 45 to 54 Years | 14,432 (87.8%) | 16,012 (87.2%) |
| 55 to 64 Years | 12,253 (86.0%) | 15,234 (86.1%) |
| 65 to 74 Years | 9,341 (88.9%) | 11,019 (85.2%) |
| 75 Years and over | 5,358 (91.1%) | 8,209 (83.8%) |
| Total | 111,083 (84.4%) | 120,076 (79.8%) |
Income Below Poverty Among Married-Couple Families in Greensboro
The poverty statistics for married-couple families in Greensboro show that 6.5% or 2,639 of the total 40,665 families live below the poverty line. Families with 5 or more children have the highest poverty rate of 50.9%, comprising of 224 families. On the other hand, families with no children have the lowest poverty rate of 4.0%, which includes 925 families.
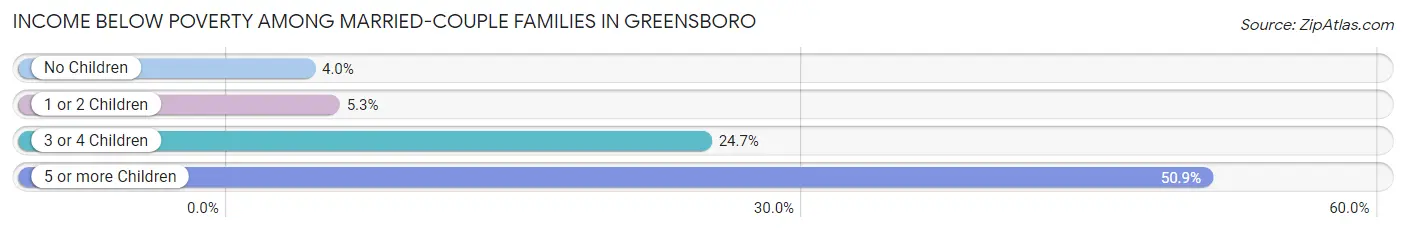
| Children | Above Poverty | Below Poverty |
| No Children | 22,058 (96.0%) | 925 (4.0%) |
| 1 or 2 Children | 13,528 (94.7%) | 759 (5.3%) |
| 3 or 4 Children | 2,224 (75.3%) | 731 (24.7%) |
| 5 or more Children | 216 (49.1%) | 224 (50.9%) |
| Total | 38,026 (93.5%) | 2,639 (6.5%) |
Income Below Poverty Among Single-Parent Households in Greensboro
According to the poverty data in Greensboro, 14.1% or 840 single-father households and 26.6% or 5,584 single-mother households are living below the poverty line. Among single-father households, those with 3 or 4 children have the highest poverty rate, with 56 households (16.3%) experiencing poverty. Likewise, among single-mother households, those with 5 or more children have the highest poverty rate, with 187 households (87.0%) falling below the poverty line.
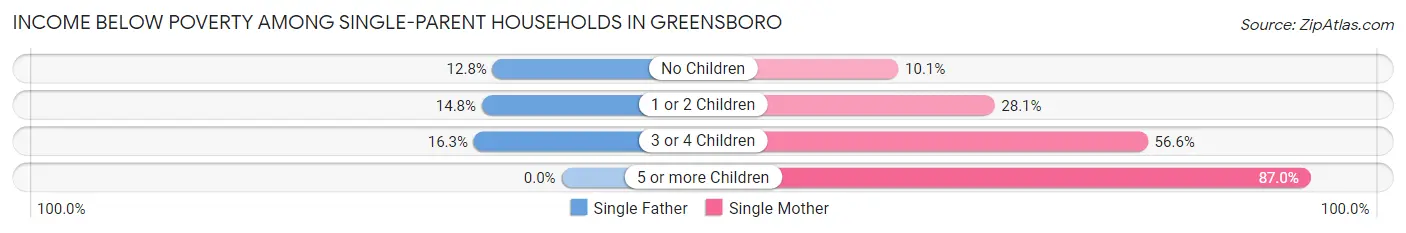
| Children | Single Father | Single Mother |
| No Children | 299 (12.8%) | 626 (10.1%) |
| 1 or 2 Children | 485 (14.8%) | 3,463 (28.1%) |
| 3 or 4 Children | 56 (16.3%) | 1,308 (56.6%) |
| 5 or more Children | 0 (0.0%) | 187 (87.0%) |
| Total | 840 (14.1%) | 5,584 (26.6%) |
Income Below Poverty Among Married-Couple vs Single-Parent Households in Greensboro
The poverty data for Greensboro shows that 2,639 of the married-couple family households (6.5%) and 6,424 of the single-parent households (23.8%) are living below the poverty level. Within the married-couple family households, those with 5 or more children have the highest poverty rate, with 224 households (50.9%) falling below the poverty line. Among the single-parent households, those with 5 or more children have the highest poverty rate, with 187 household (87.0%) living below poverty.
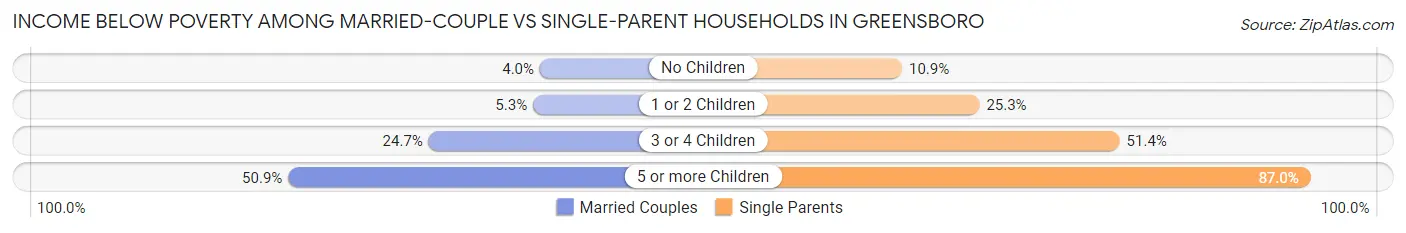
| Children | Married-Couple Families | Single-Parent Households |
| No Children | 925 (4.0%) | 925 (10.9%) |
| 1 or 2 Children | 759 (5.3%) | 3,948 (25.3%) |
| 3 or 4 Children | 731 (24.7%) | 1,364 (51.4%) |
| 5 or more Children | 224 (50.9%) | 187 (87.0%) |
| Total | 2,639 (6.5%) | 6,424 (23.8%) |
Race in Greensboro
The most populous races in Greensboro are Black / African American (127,965 | 43.1%), White / Caucasian (124,271 | 41.8%), and Hispanic or Latino (26,705 | 9.0%).
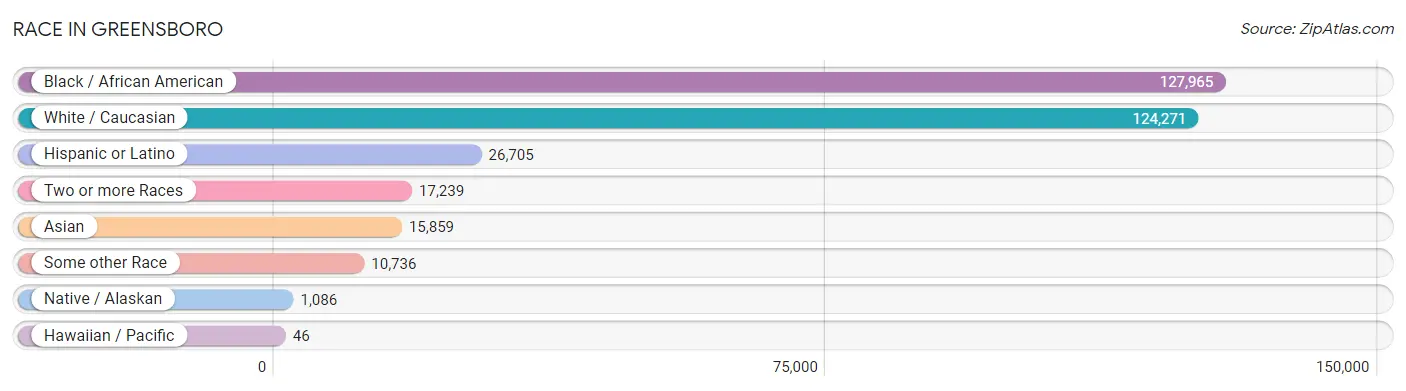
| Race | # Population | % Population |
| Asian | 15,859 | 5.3% |
| Black / African American | 127,965 | 43.1% |
| Hawaiian / Pacific | 46 | 0.0% |
| Hispanic or Latino | 26,705 | 9.0% |
| Native / Alaskan | 1,086 | 0.4% |
| White / Caucasian | 124,271 | 41.8% |
| Two or more Races | 17,239 | 5.8% |
| Some other Race | 10,736 | 3.6% |
| Total | 297,202 | 100.0% |
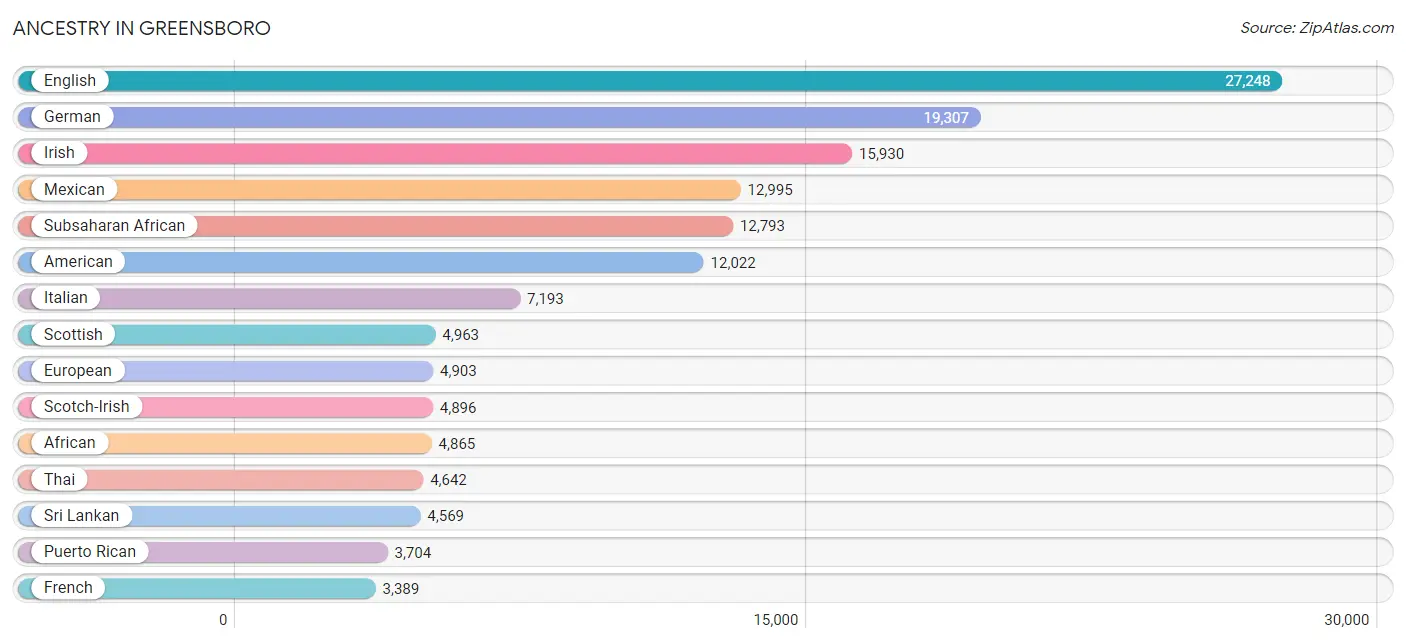
Ancestry in Greensboro
The most populous ancestries reported in Greensboro are English (27,248 | 9.2%), German (19,307 | 6.5%), Irish (15,930 | 5.4%), Mexican (12,995 | 4.4%), and Subsaharan African (12,793 | 4.3%), together accounting for 29.7% of all Greensboro residents.
| Ancestry | # Population | % Population |
| Afghan | 222 | 0.1% |
| African | 4,865 | 1.6% |
| Albanian | 14 | 0.0% |
| Alsatian | 6 | 0.0% |
| American | 12,022 | 4.1% |
| Arab | 1,893 | 0.6% |
| Argentinean | 266 | 0.1% |
| Armenian | 109 | 0.0% |
| Australian | 55 | 0.0% |
| Austrian | 315 | 0.1% |
| Bahamian | 186 | 0.1% |
| Bangladeshi | 426 | 0.1% |
| Barbadian | 295 | 0.1% |
| Belgian | 86 | 0.0% |
| Bermudan | 34 | 0.0% |
| Bhutanese | 588 | 0.2% |
| Blackfeet | 264 | 0.1% |
| Bolivian | 28 | 0.0% |
| Brazilian | 183 | 0.1% |
| British | 1,455 | 0.5% |
| British West Indian | 408 | 0.1% |
| Bulgarian | 188 | 0.1% |
| Burmese | 991 | 0.3% |
| Cajun | 39 | 0.0% |
| Cambodian | 12 | 0.0% |
| Canadian | 651 | 0.2% |
| Celtic | 4 | 0.0% |
| Central American | 3,106 | 1.1% |
| Central American Indian | 221 | 0.1% |
| Cherokee | 996 | 0.3% |
| Chilean | 90 | 0.0% |
| Chippewa | 51 | 0.0% |
| Choctaw | 42 | 0.0% |
| Colombian | 791 | 0.3% |
| Costa Rican | 166 | 0.1% |
| Creek | 316 | 0.1% |
| Croatian | 147 | 0.1% |
| Cuban | 791 | 0.3% |
| Czech | 410 | 0.1% |
| Czechoslovakian | 141 | 0.1% |
| Danish | 446 | 0.2% |
| Dominican | 1,519 | 0.5% |
| Dutch | 1,385 | 0.5% |
| Eastern European | 364 | 0.1% |
| Ecuadorian | 422 | 0.1% |
| Egyptian | 161 | 0.1% |
| English | 27,248 | 9.2% |
| Estonian | 67 | 0.0% |
| Ethiopian | 259 | 0.1% |
| European | 4,903 | 1.7% |
| Filipino | 108 | 0.0% |
| Finnish | 149 | 0.1% |
| French | 3,389 | 1.1% |
| French Canadian | 625 | 0.2% |
| German | 19,307 | 6.5% |
| Ghanaian | 246 | 0.1% |
| Greek | 523 | 0.2% |
| Guamanian / Chamorro | 63 | 0.0% |
| Guatemalan | 576 | 0.2% |
| Guyanese | 213 | 0.1% |
| Haitian | 426 | 0.1% |
| Honduran | 314 | 0.1% |
| Hungarian | 506 | 0.2% |
| Icelander | 28 | 0.0% |
| Indian (Asian) | 1,757 | 0.6% |
| Indonesian | 104 | 0.0% |
| Inupiat | 6 | 0.0% |
| Iranian | 283 | 0.1% |
| Iraqi | 235 | 0.1% |
| Irish | 15,930 | 5.4% |
| Iroquois | 32 | 0.0% |
| Israeli | 130 | 0.0% |
| Italian | 7,193 | 2.4% |
| Jamaican | 1,245 | 0.4% |
| Japanese | 1,084 | 0.4% |
| Jordanian | 67 | 0.0% |
| Kenyan | 85 | 0.0% |
| Korean | 1,611 | 0.5% |
| Latvian | 32 | 0.0% |
| Lebanese | 297 | 0.1% |
| Liberian | 299 | 0.1% |
| Lithuanian | 271 | 0.1% |
| Lumbee | 432 | 0.2% |
| Luxembourger | 13 | 0.0% |
| Malaysian | 296 | 0.1% |
| Maltese | 16 | 0.0% |
| Mexican | 12,995 | 4.4% |
| Mexican American Indian | 128 | 0.0% |
| Moroccan | 327 | 0.1% |
| Native Hawaiian | 125 | 0.0% |
| Navajo | 116 | 0.0% |
| New Zealander | 18 | 0.0% |
| Nicaraguan | 58 | 0.0% |
| Nigerian | 2,684 | 0.9% |
| Northern European | 359 | 0.1% |
| Norwegian | 1,226 | 0.4% |
| Pakistani | 108 | 0.0% |
| Palestinian | 49 | 0.0% |
| Panamanian | 157 | 0.1% |
| Pennsylvania German | 51 | 0.0% |
| Peruvian | 203 | 0.1% |
| Polish | 3,005 | 1.0% |
| Portuguese | 220 | 0.1% |
| Puerto Rican | 3,704 | 1.3% |
| Romanian | 119 | 0.0% |
| Russian | 804 | 0.3% |
| Salvadoran | 1,835 | 0.6% |
| Samoan | 1 | 0.0% |
| Scandinavian | 465 | 0.2% |
| Scotch-Irish | 4,896 | 1.7% |
| Scottish | 4,963 | 1.7% |
| Seminole | 41 | 0.0% |
| Senegalese | 764 | 0.3% |
| Serbian | 115 | 0.0% |
| Sierra Leonean | 154 | 0.1% |
| Sioux | 8 | 0.0% |
| Slavic | 41 | 0.0% |
| Slovak | 166 | 0.1% |
| Slovene | 93 | 0.0% |
| Somali | 264 | 0.1% |
| South African | 74 | 0.0% |
| South American | 2,089 | 0.7% |
| South American Indian | 12 | 0.0% |
| Spaniard | 494 | 0.2% |
| Spanish | 256 | 0.1% |
| Sri Lankan | 4,569 | 1.5% |
| Subsaharan African | 12,793 | 4.3% |
| Sudanese | 1,557 | 0.5% |
| Swedish | 1,547 | 0.5% |
| Swiss | 351 | 0.1% |
| Syrian | 77 | 0.0% |
| Thai | 4,642 | 1.6% |
| Trinidadian and Tobagonian | 179 | 0.1% |
| Turkish | 94 | 0.0% |
| Ugandan | 1 | 0.0% |
| Ukrainian | 408 | 0.1% |
| Uruguayan | 43 | 0.0% |
| Venezuelan | 228 | 0.1% |
| Vietnamese | 138 | 0.1% |
| Welsh | 1,423 | 0.5% |
| West Indian | 249 | 0.1% |
| Yugoslavian | 159 | 0.1% |
| Zimbabwean | 57 | 0.0% | View All 143 Rows |
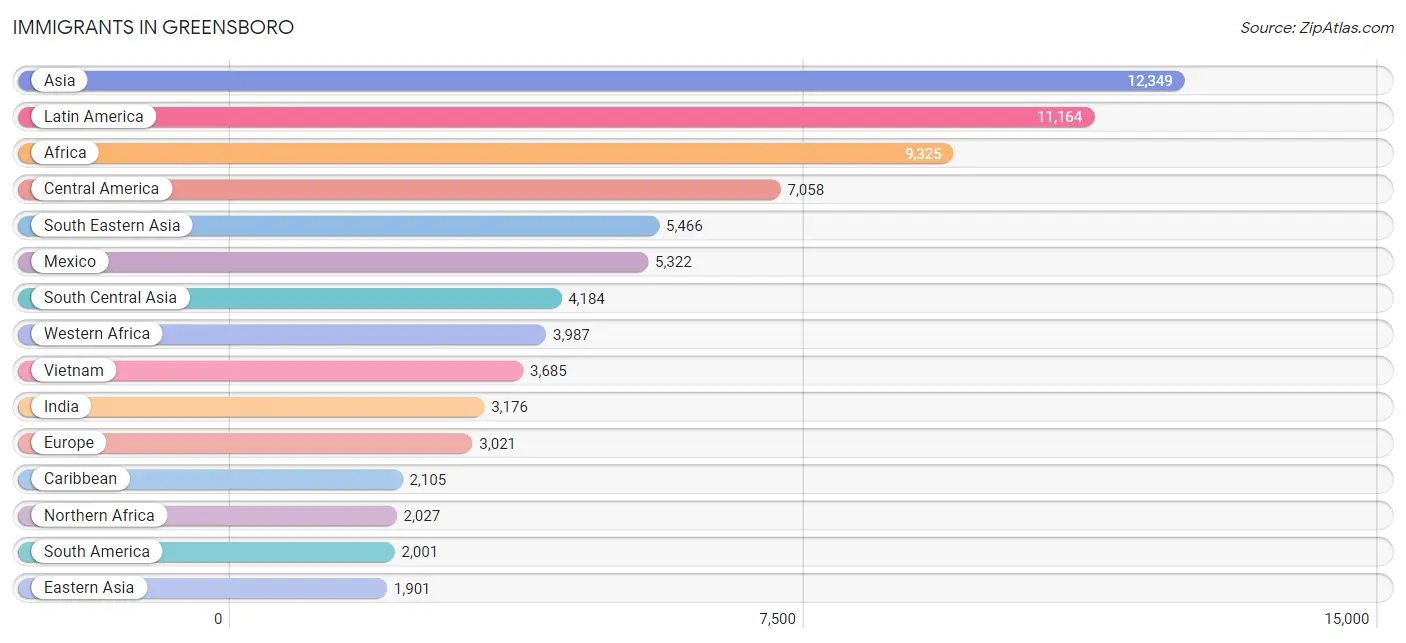
Immigrants in Greensboro
The most numerous immigrant groups reported in Greensboro came from Asia (12,349 | 4.2%), Latin America (11,164 | 3.8%), Africa (9,325 | 3.1%), Central America (7,058 | 2.4%), and South Eastern Asia (5,466 | 1.8%), together accounting for 15.3% of all Greensboro residents.
| Immigration Origin | # Population | % Population |
| Afghanistan | 140 | 0.1% |
| Africa | 9,325 | 3.1% |
| Albania | 59 | 0.0% |
| Argentina | 227 | 0.1% |
| Armenia | 13 | 0.0% |
| Asia | 12,349 | 4.2% |
| Australia | 14 | 0.0% |
| Austria | 14 | 0.0% |
| Azores | 5 | 0.0% |
| Bahamas | 128 | 0.0% |
| Bangladesh | 107 | 0.0% |
| Barbados | 189 | 0.1% |
| Belarus | 7 | 0.0% |
| Bosnia and Herzegovina | 561 | 0.2% |
| Brazil | 527 | 0.2% |
| Bulgaria | 110 | 0.0% |
| Cambodia | 354 | 0.1% |
| Cameroon | 81 | 0.0% |
| Canada | 739 | 0.3% |
| Caribbean | 2,105 | 0.7% |
| Central America | 7,058 | 2.4% |
| Chile | 91 | 0.0% |
| China | 984 | 0.3% |
| Colombia | 479 | 0.2% |
| Congo | 228 | 0.1% |
| Costa Rica | 80 | 0.0% |
| Croatia | 14 | 0.0% |
| Cuba | 321 | 0.1% |
| Czechoslovakia | 13 | 0.0% |
| Denmark | 15 | 0.0% |
| Dominica | 213 | 0.1% |
| Dominican Republic | 452 | 0.2% |
| Eastern Africa | 1,231 | 0.4% |
| Eastern Asia | 1,901 | 0.6% |
| Eastern Europe | 1,258 | 0.4% |
| Ecuador | 208 | 0.1% |
| Egypt | 91 | 0.0% |
| El Salvador | 501 | 0.2% |
| England | 552 | 0.2% |
| Eritrea | 217 | 0.1% |
| Ethiopia | 17 | 0.0% |
| Europe | 3,021 | 1.0% |
| France | 184 | 0.1% |
| Germany | 319 | 0.1% |
| Ghana | 279 | 0.1% |
| Greece | 42 | 0.0% |
| Guatemala | 375 | 0.1% |
| Guyana | 124 | 0.0% |
| Haiti | 68 | 0.0% |
| Honduras | 608 | 0.2% |
| Hong Kong | 42 | 0.0% |
| Hungary | 26 | 0.0% |
| India | 3,176 | 1.1% |
| Indonesia | 12 | 0.0% |
| Iran | 234 | 0.1% |
| Iraq | 334 | 0.1% |
| Ireland | 109 | 0.0% |
| Israel | 35 | 0.0% |
| Italy | 154 | 0.1% |
| Jamaica | 417 | 0.1% |
| Japan | 352 | 0.1% |
| Jordan | 25 | 0.0% |
| Kenya | 197 | 0.1% |
| Korea | 565 | 0.2% |
| Kuwait | 12 | 0.0% |
| Laos | 131 | 0.0% |
| Latin America | 11,164 | 3.8% |
| Lebanon | 7 | 0.0% |
| Liberia | 357 | 0.1% |
| Mexico | 5,322 | 1.8% |
| Middle Africa | 1,360 | 0.5% |
| Morocco | 116 | 0.0% |
| Nepal | 152 | 0.1% |
| Netherlands | 56 | 0.0% |
| Nicaragua | 69 | 0.0% |
| Nigeria | 1,661 | 0.6% |
| Northern Africa | 2,027 | 0.7% |
| Northern Europe | 941 | 0.3% |
| Oceania | 14 | 0.0% |
| Pakistan | 80 | 0.0% |
| Panama | 103 | 0.0% |
| Peru | 134 | 0.1% |
| Philippines | 912 | 0.3% |
| Poland | 24 | 0.0% |
| Portugal | 5 | 0.0% |
| Romania | 84 | 0.0% |
| Russia | 282 | 0.1% |
| Saudi Arabia | 197 | 0.1% |
| Scotland | 51 | 0.0% |
| Senegal | 346 | 0.1% |
| Serbia | 16 | 0.0% |
| Sierra Leone | 123 | 0.0% |
| Somalia | 197 | 0.1% |
| South Africa | 109 | 0.0% |
| South America | 2,001 | 0.7% |
| South Central Asia | 4,184 | 1.4% |
| South Eastern Asia | 5,466 | 1.8% |
| Southern Europe | 249 | 0.1% |
| Spain | 48 | 0.0% |
| Sri Lanka | 135 | 0.1% |
| Sudan | 1,581 | 0.5% |
| Sweden | 50 | 0.0% |
| Syria | 21 | 0.0% |
| Taiwan | 80 | 0.0% |
| Thailand | 314 | 0.1% |
| Trinidad and Tobago | 161 | 0.1% |
| Turkey | 51 | 0.0% |
| Uganda | 109 | 0.0% |
| Ukraine | 38 | 0.0% |
| Uruguay | 19 | 0.0% |
| Venezuela | 141 | 0.1% |
| Vietnam | 3,685 | 1.2% |
| Western Africa | 3,987 | 1.3% |
| Western Asia | 784 | 0.3% |
| Western Europe | 573 | 0.2% |
| Zaire | 623 | 0.2% |
| Zimbabwe | 82 | 0.0% | View All 117 Rows |
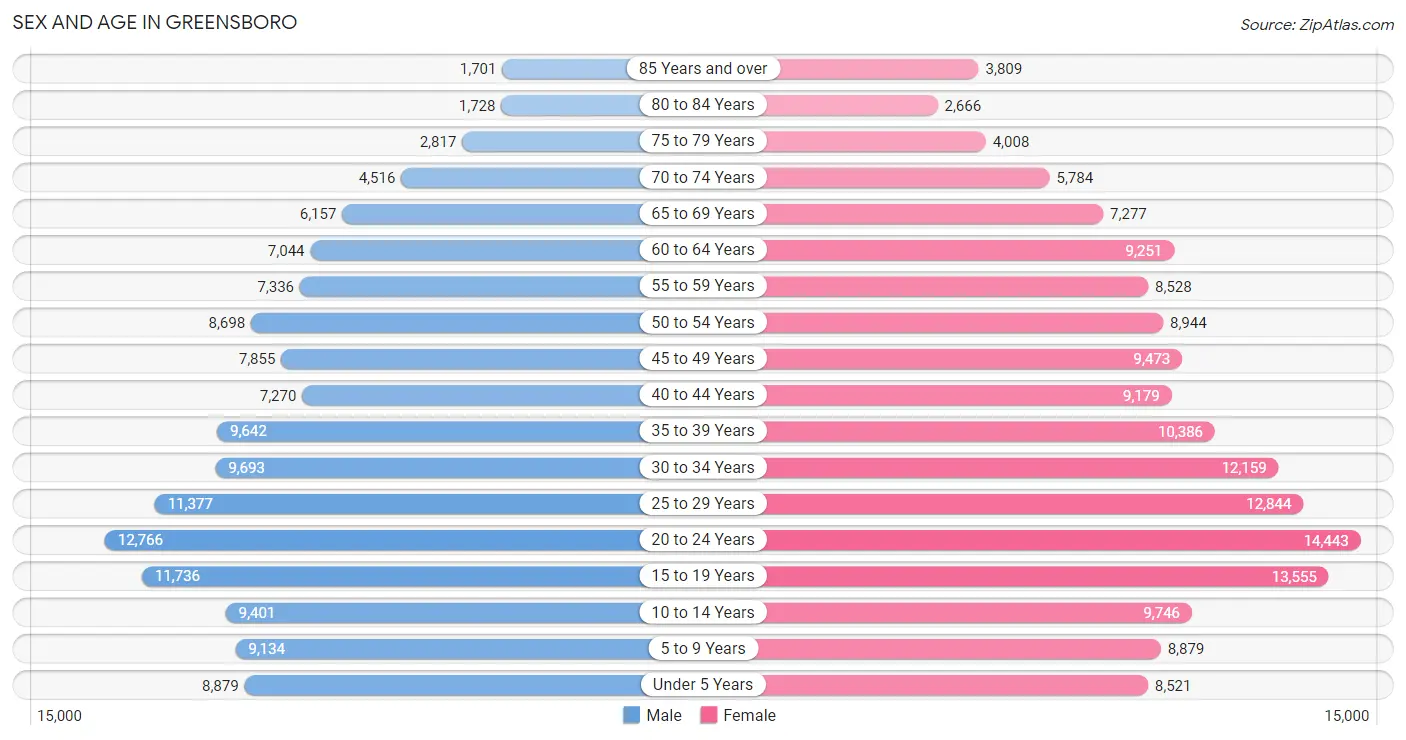
Sex and Age in Greensboro
Sex and Age in Greensboro
The most populous age groups in Greensboro are 20 to 24 Years (12,766 | 9.3%) for men and 20 to 24 Years (14,443 | 9.1%) for women.
| Age Bracket | Male | Female |
| Under 5 Years | 8,879 (6.5%) | 8,521 (5.3%) |
| 5 to 9 Years | 9,134 (6.6%) | 8,879 (5.6%) |
| 10 to 14 Years | 9,401 (6.8%) | 9,746 (6.1%) |
| 15 to 19 Years | 11,736 (8.5%) | 13,555 (8.5%) |
| 20 to 24 Years | 12,766 (9.3%) | 14,443 (9.1%) |
| 25 to 29 Years | 11,377 (8.3%) | 12,844 (8.1%) |
| 30 to 34 Years | 9,693 (7.0%) | 12,159 (7.6%) |
| 35 to 39 Years | 9,642 (7.0%) | 10,386 (6.5%) |
| 40 to 44 Years | 7,270 (5.3%) | 9,179 (5.8%) |
| 45 to 49 Years | 7,855 (5.7%) | 9,473 (5.9%) |
| 50 to 54 Years | 8,698 (6.3%) | 8,944 (5.6%) |
| 55 to 59 Years | 7,336 (5.3%) | 8,528 (5.3%) |
| 60 to 64 Years | 7,044 (5.1%) | 9,251 (5.8%) |
| 65 to 69 Years | 6,157 (4.5%) | 7,277 (4.6%) |
| 70 to 74 Years | 4,516 (3.3%) | 5,784 (3.6%) |
| 75 to 79 Years | 2,817 (2.1%) | 4,008 (2.5%) |
| 80 to 84 Years | 1,728 (1.3%) | 2,666 (1.7%) |
| 85 Years and over | 1,701 (1.2%) | 3,809 (2.4%) |
| Total | 137,750 (100.0%) | 159,452 (100.0%) |
Families and Households in Greensboro
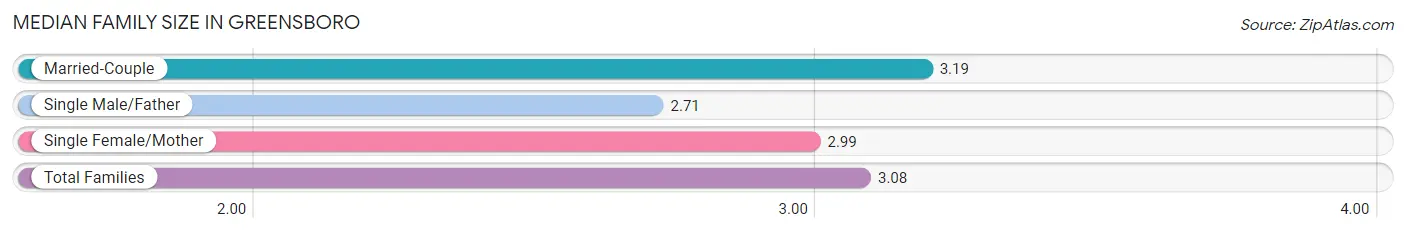
Median Family Size in Greensboro
The median family size in Greensboro is 3.08 persons per family, with married-couple families (40,665 | 60.1%) accounting for the largest median family size of 3.19 persons per family. On the other hand, single male/father families (5,947 | 8.8%) represent the smallest median family size with 2.71 persons per family.
| Family Type | # Families | Family Size |
| Married-Couple | 40,665 (60.1%) | 3.19 |
| Single Male/Father | 5,947 (8.8%) | 2.71 |
| Single Female/Mother | 21,035 (31.1%) | 2.99 |
| Total Families | 67,647 (100.0%) | 3.08 |
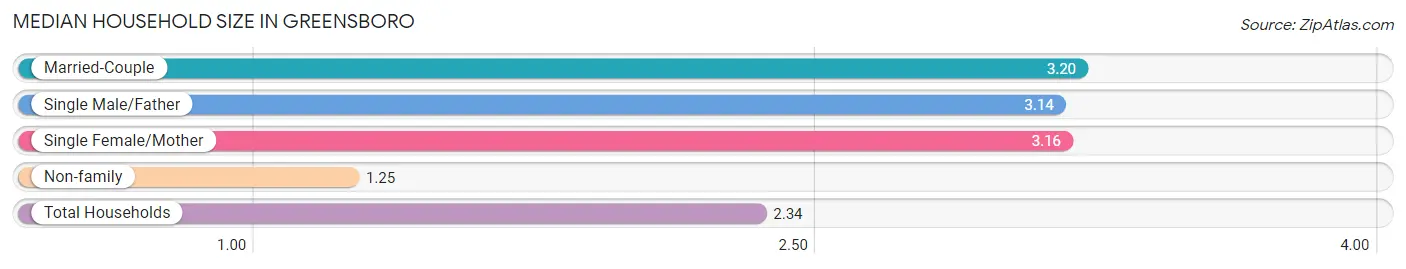
Median Household Size in Greensboro
The median household size in Greensboro is 2.34 persons per household, with married-couple households (40,665 | 33.9%) accounting for the largest median household size of 3.2 persons per household. non-family households (52,490 | 43.7%) represent the smallest median household size with 1.25 persons per household.
| Household Type | # Households | Household Size |
| Married-Couple | 40,665 (33.9%) | 3.20 |
| Single Male/Father | 5,947 (5.0%) | 3.14 |
| Single Female/Mother | 21,035 (17.5%) | 3.16 |
| Non-family | 52,490 (43.7%) | 1.25 |
| Total Households | 120,137 (100.0%) | 2.34 |
Household Size by Marriage Status in Greensboro
Out of a total of 120,137 households in Greensboro, 67,647 (56.3%) are family households, while 52,490 (43.7%) are nonfamily households. The most numerous type of family households are 2-person households, comprising 29,882, and the most common type of nonfamily households are 1-person households, comprising 42,878.
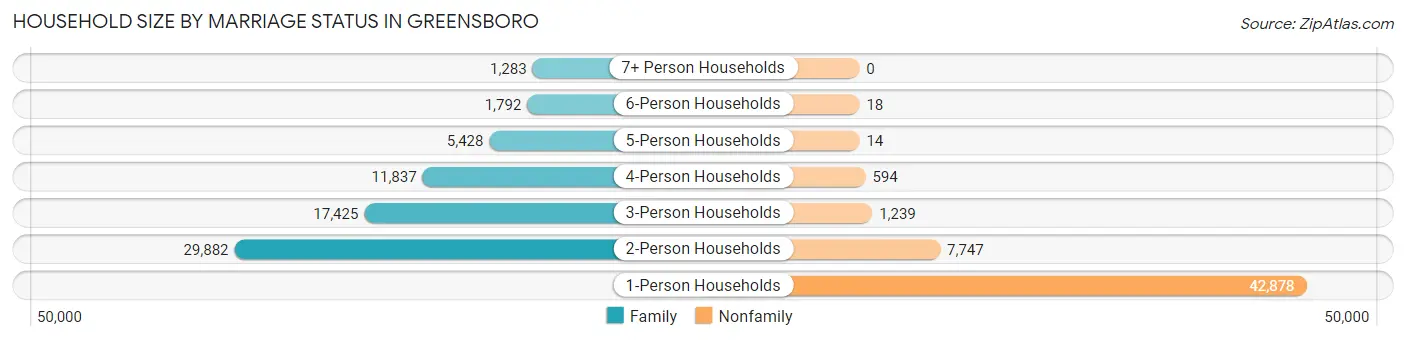
| Household Size | Family Households | Nonfamily Households |
| 1-Person Households | - | 42,878 (35.7%) |
| 2-Person Households | 29,882 (24.9%) | 7,747 (6.5%) |
| 3-Person Households | 17,425 (14.5%) | 1,239 (1.0%) |
| 4-Person Households | 11,837 (9.9%) | 594 (0.5%) |
| 5-Person Households | 5,428 (4.5%) | 14 (0.0%) |
| 6-Person Households | 1,792 (1.5%) | 18 (0.0%) |
| 7+ Person Households | 1,283 (1.1%) | 0 (0.0%) |
| Total | 67,647 (56.3%) | 52,490 (43.7%) |
Female Fertility in Greensboro
Fertility by Age in Greensboro
Average fertility rate in Greensboro is 51.0 births per 1,000 women. Women in the age bracket of 20 to 34 years have the highest fertility rate with 87.0 births per 1,000 women. Women in the age bracket of 20 to 34 years acount for 78.8% of all women with births.
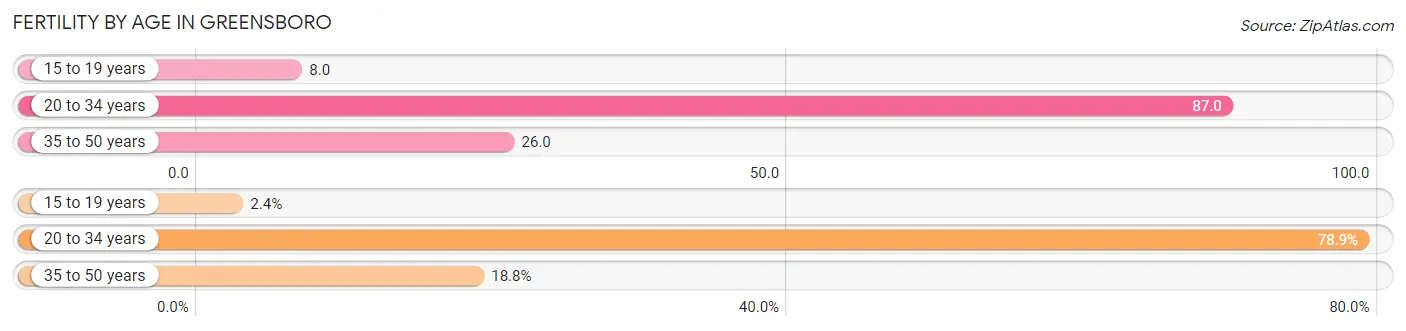
| Age Bracket | Women with Births | Births / 1,000 Women |
| 15 to 19 years | 104 (2.4%) | 8.0 |
| 20 to 34 years | 3,418 (78.8%) | 87.0 |
| 35 to 50 years | 813 (18.8%) | 26.0 |
| Total | 4,335 (100.0%) | 51.0 |
Fertility by Age by Marriage Status in Greensboro
45.2% of women with births (4,335) in Greensboro are married. The highest percentage of unmarried women with births falls into 15 to 19 years age bracket with 59.6% of them unmarried at the time of birth, while the lowest percentage of unmarried women with births belong to 35 to 50 years age bracket with 44.2% of them unmarried.
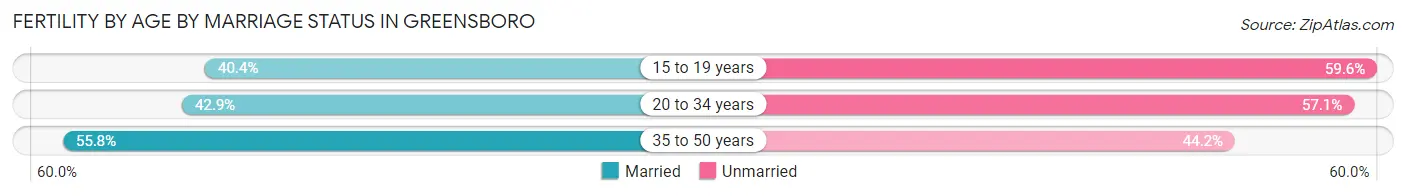
| Age Bracket | Married | Unmarried |
| 15 to 19 years | 42 (40.4%) | 62 (59.6%) |
| 20 to 34 years | 1,466 (42.9%) | 1,952 (57.1%) |
| 35 to 50 years | 454 (55.8%) | 359 (44.2%) |
| Total | 1,959 (45.2%) | 2,376 (54.8%) |
Fertility by Education in Greensboro
Average fertility rate in Greensboro is 51.0 births per 1,000 women. Women with the education attainment of high school diploma have the highest fertility rate of 87.0 births per 1,000 women, while women with the education attainment of college or associate's degree have the lowest fertility at 36.0 births per 1,000 women. Women with the education attainment of high school diploma represent 28.2% of all women with births.
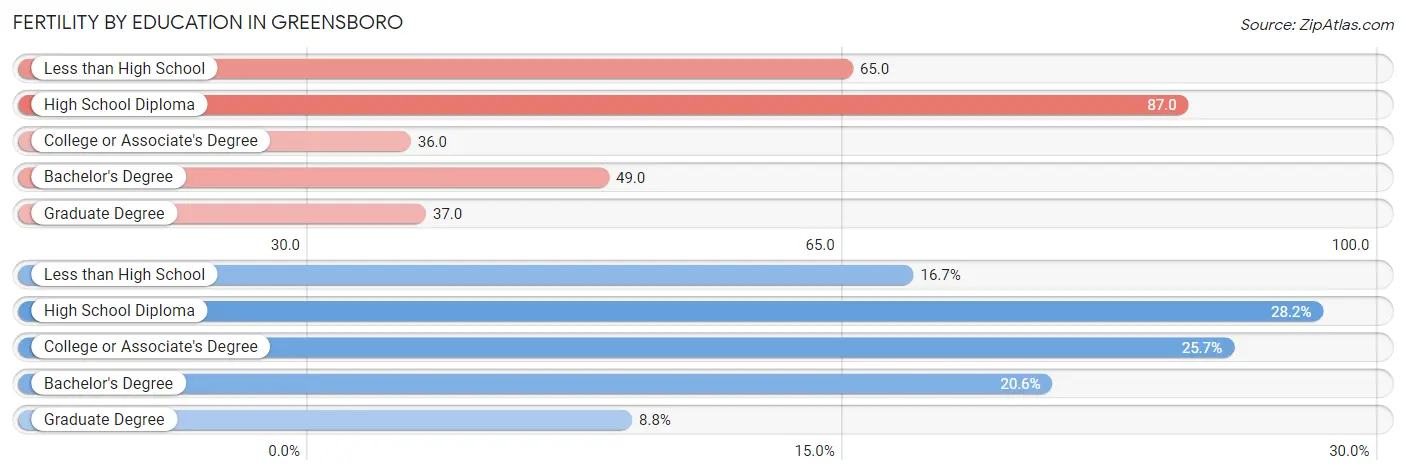
| Educational Attainment | Women with Births | Births / 1,000 Women |
| Less than High School | 724 (16.7%) | 65.0 |
| High School Diploma | 1,223 (28.2%) | 87.0 |
| College or Associate's Degree | 1,114 (25.7%) | 36.0 |
| Bachelor's Degree | 893 (20.6%) | 49.0 |
| Graduate Degree | 381 (8.8%) | 37.0 |
| Total | 4,335 (100.0%) | 51.0 |
Fertility by Education by Marriage Status in Greensboro
54.8% of women with births in Greensboro are unmarried. Women with the educational attainment of graduate degree are most likely to be married with 77.9% of them married at childbirth, while women with the educational attainment of high school diploma are least likely to be married with 76.4% of them unmarried at childbirth.
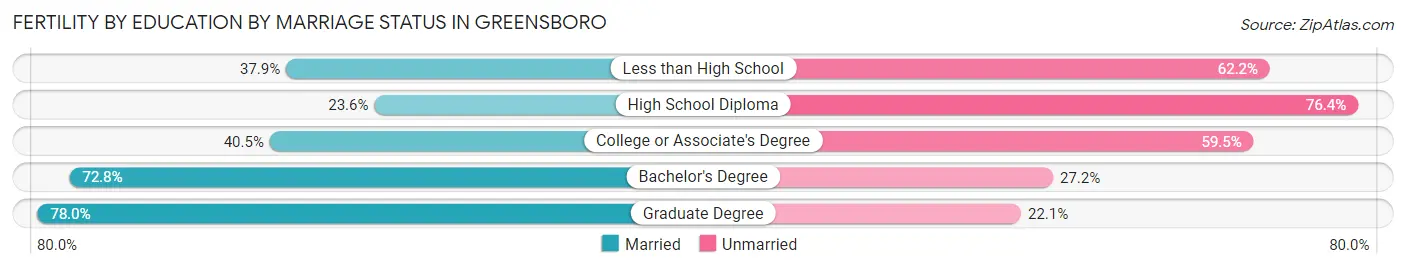
| Educational Attainment | Married | Unmarried |
| Less than High School | 274 (37.9%) | 450 (62.2%) |
| High School Diploma | 289 (23.6%) | 934 (76.4%) |
| College or Associate's Degree | 451 (40.5%) | 663 (59.5%) |
| Bachelor's Degree | 650 (72.8%) | 243 (27.2%) |
| Graduate Degree | 297 (77.9%) | 84 (22.1%) |
| Total | 1,959 (45.2%) | 2,376 (54.8%) |
Employment Characteristics in Greensboro
Employment by Class of Employer in Greensboro
Among the 143,224 employed individuals in Greensboro, private company employees (100,198 | 70.0%), not-for-profit organizations (12,369 | 8.6%), and state government employees (8,928 | 6.2%) make up the most common classes of employment.
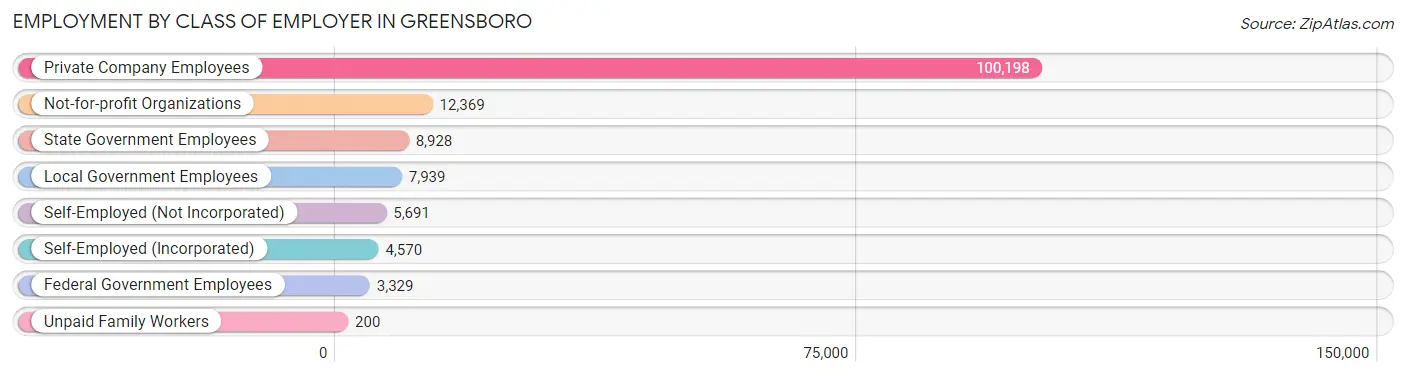
| Employer Class | # Employees | % Employees |
| Private Company Employees | 100,198 | 70.0% |
| Self-Employed (Incorporated) | 4,570 | 3.2% |
| Self-Employed (Not Incorporated) | 5,691 | 4.0% |
| Not-for-profit Organizations | 12,369 | 8.6% |
| Local Government Employees | 7,939 | 5.5% |
| State Government Employees | 8,928 | 6.2% |
| Federal Government Employees | 3,329 | 2.3% |
| Unpaid Family Workers | 200 | 0.1% |
| Total | 143,224 | 100.0% |
Employment Status by Age in Greensboro
According to the labor force statistics for Greensboro, out of the total population over 16 years of age (238,411), 65.3% or 155,682 individuals are in the labor force, with 5.5% or 8,563 of them unemployed. The age group with the highest labor force participation rate is 25 to 29 years, with 85.6% or 20,733 individuals in the labor force. Within the labor force, the 16 to 19 years age range has the highest percentage of unemployed individuals, with 17.4% or 1,330 of them being unemployed.
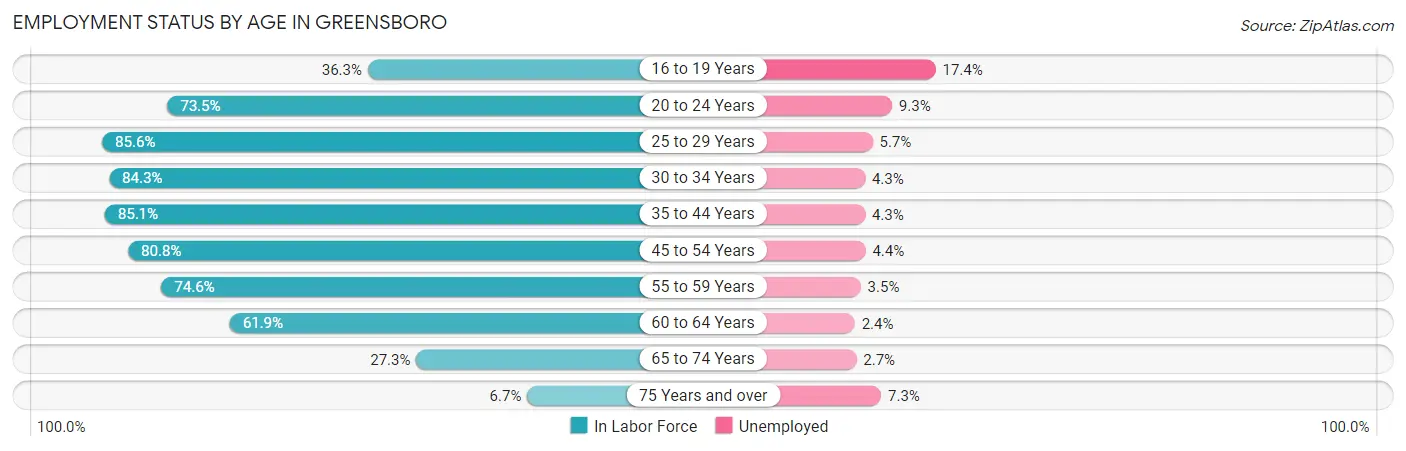
| Age Bracket | In Labor Force | Unemployed |
| 16 to 19 Years | 7,645 (36.3%) | 1,330 (17.4%) |
| 20 to 24 Years | 19,999 (73.5%) | 1,860 (9.3%) |
| 25 to 29 Years | 20,733 (85.6%) | 1,182 (5.7%) |
| 30 to 34 Years | 18,421 (84.3%) | 792 (4.3%) |
| 35 to 44 Years | 31,042 (85.1%) | 1,335 (4.3%) |
| 45 to 54 Years | 28,256 (80.8%) | 1,243 (4.4%) |
| 55 to 59 Years | 11,835 (74.6%) | 414 (3.5%) |
| 60 to 64 Years | 10,087 (61.9%) | 242 (2.4%) |
| 65 to 74 Years | 6,479 (27.3%) | 175 (2.7%) |
| 75 Years and over | 1,121 (6.7%) | 82 (7.3%) |
| Total | 155,682 (65.3%) | 8,563 (5.5%) |
Employment Status by Educational Attainment in Greensboro
According to labor force statistics for Greensboro, 80.4% of individuals (120,342) out of the total population between 25 and 64 years of age (149,679) are in the labor force, with 4.3% or 5,175 of them being unemployed. The group with the highest labor force participation rate are those with the educational attainment of bachelor's degree or higher, with 87.0% or 53,113 individuals in the labor force. Within the labor force, individuals with less than high school education have the highest percentage of unemployment, with 7.0% or 631 of them being unemployed.
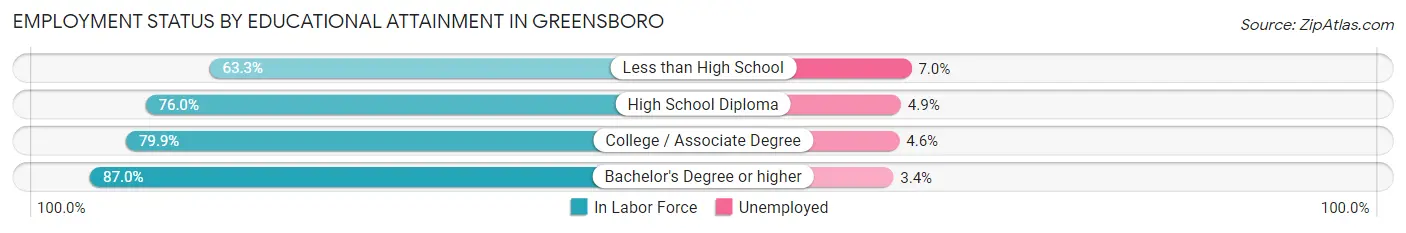
| Educational Attainment | In Labor Force | Unemployed |
| Less than High School | 9,019 (63.3%) | 997 (7.0%) |
| High School Diploma | 22,406 (76.0%) | 1,445 (4.9%) |
| College / Associate Degree | 35,875 (79.9%) | 2,065 (4.6%) |
| Bachelor's Degree or higher | 53,113 (87.0%) | 2,076 (3.4%) |
| Total | 120,342 (80.4%) | 6,436 (4.3%) |
Employment Occupations by Sex in Greensboro
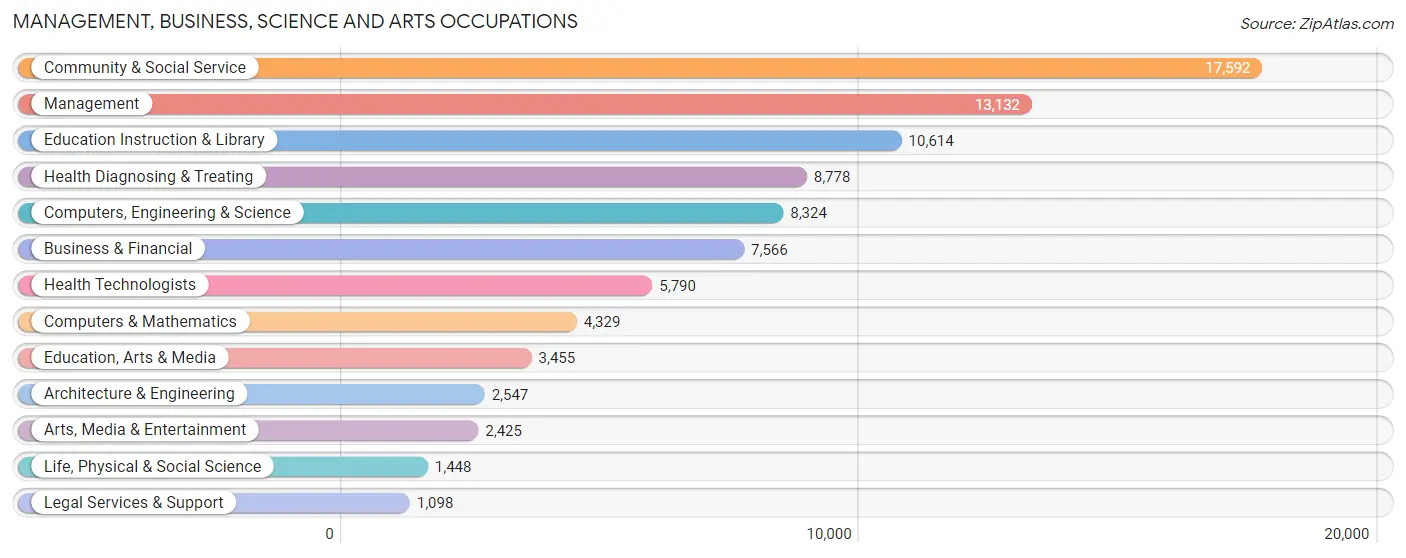
Management, Business, Science and Arts Occupations
The most common Management, Business, Science and Arts occupations in Greensboro are Community & Social Service (17,592 | 12.0%), Management (13,132 | 9.0%), Education Instruction & Library (10,614 | 7.2%), Health Diagnosing & Treating (8,778 | 6.0%), and Computers, Engineering & Science (8,324 | 5.7%).
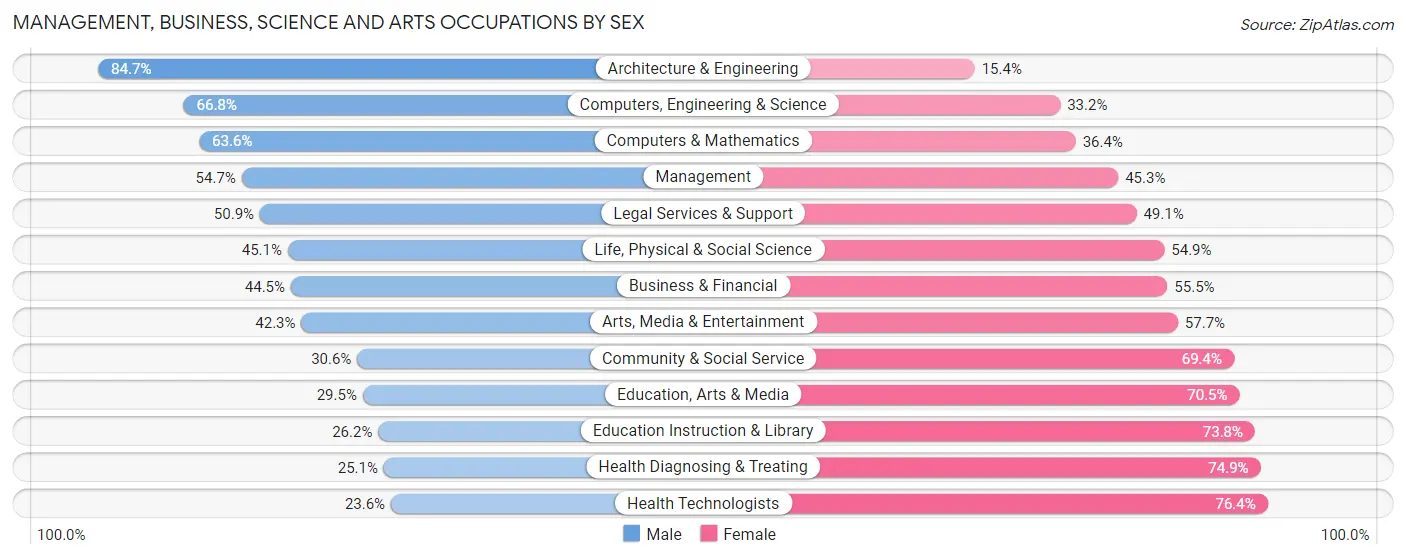
Management, Business, Science and Arts Occupations by Sex
Within the Management, Business, Science and Arts occupations in Greensboro, the most male-oriented occupations are Architecture & Engineering (84.7%), Computers, Engineering & Science (66.8%), and Computers & Mathematics (63.6%), while the most female-oriented occupations are Health Technologists (76.4%), Health Diagnosing & Treating (74.9%), and Education Instruction & Library (73.8%).
| Occupation | Male | Female |
| Management | 7,186 (54.7%) | 5,946 (45.3%) |
| Business & Financial | 3,364 (44.5%) | 4,202 (55.5%) |
| Computers, Engineering & Science | 5,562 (66.8%) | 2,762 (33.2%) |
| Computers & Mathematics | 2,753 (63.6%) | 1,576 (36.4%) |
| Architecture & Engineering | 2,156 (84.7%) | 391 (15.3%) |
| Life, Physical & Social Science | 653 (45.1%) | 795 (54.9%) |
| Community & Social Service | 5,386 (30.6%) | 12,206 (69.4%) |
| Education, Arts & Media | 1,018 (29.5%) | 2,437 (70.5%) |
| Legal Services & Support | 559 (50.9%) | 539 (49.1%) |
| Education Instruction & Library | 2,784 (26.2%) | 7,830 (73.8%) |
| Arts, Media & Entertainment | 1,025 (42.3%) | 1,400 (57.7%) |
| Health Diagnosing & Treating | 2,201 (25.1%) | 6,577 (74.9%) |
| Health Technologists | 1,365 (23.6%) | 4,425 (76.4%) |
| Total (Category) | 23,699 (42.8%) | 31,693 (57.2%) |
| Total (Overall) | 70,310 (47.9%) | 76,314 (52.0%) |
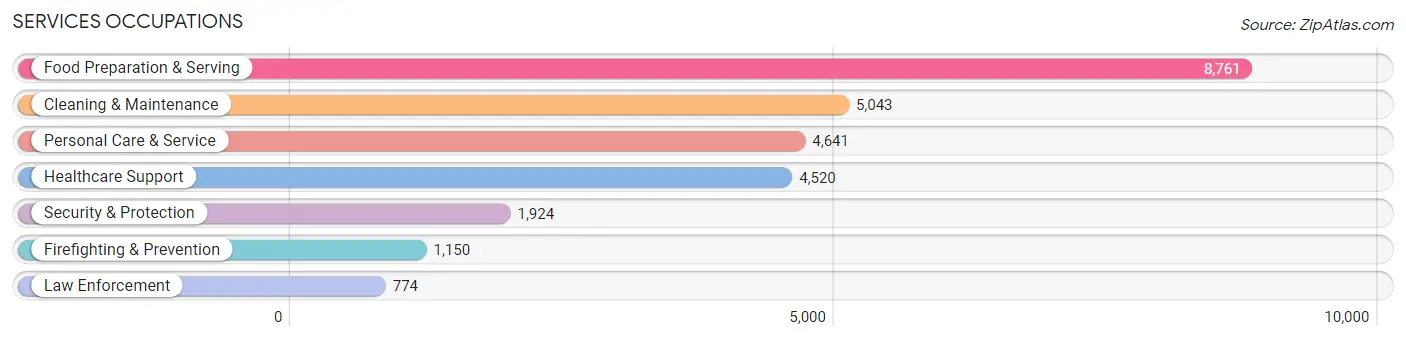
Services Occupations
The most common Services occupations in Greensboro are Food Preparation & Serving (8,761 | 6.0%), Cleaning & Maintenance (5,043 | 3.4%), Personal Care & Service (4,641 | 3.2%), Healthcare Support (4,520 | 3.1%), and Security & Protection (1,924 | 1.3%).
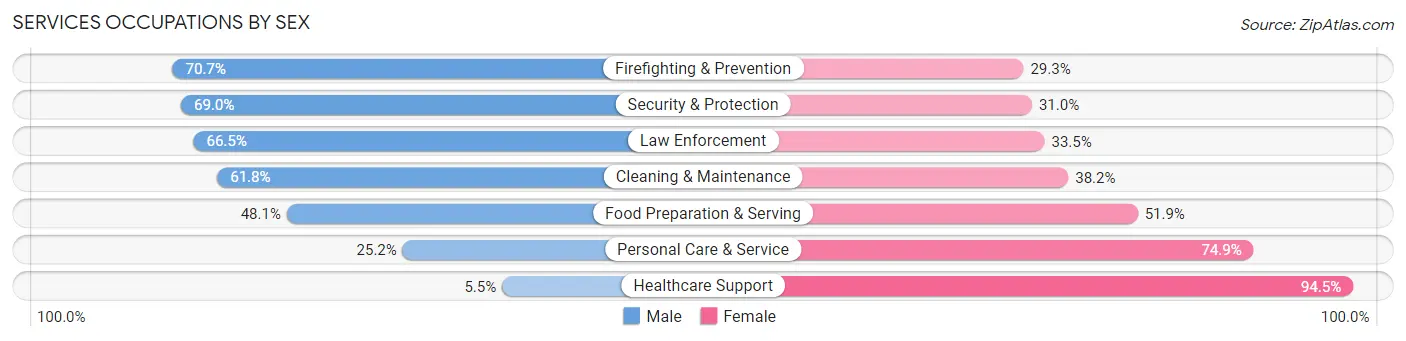
Services Occupations by Sex
Within the Services occupations in Greensboro, the most male-oriented occupations are Firefighting & Prevention (70.7%), Security & Protection (69.0%), and Law Enforcement (66.5%), while the most female-oriented occupations are Healthcare Support (94.5%), Personal Care & Service (74.9%), and Food Preparation & Serving (51.9%).
| Occupation | Male | Female |
| Healthcare Support | 247 (5.5%) | 4,273 (94.5%) |
| Security & Protection | 1,328 (69.0%) | 596 (31.0%) |
| Firefighting & Prevention | 813 (70.7%) | 337 (29.3%) |
| Law Enforcement | 515 (66.5%) | 259 (33.5%) |
| Food Preparation & Serving | 4,213 (48.1%) | 4,548 (51.9%) |
| Cleaning & Maintenance | 3,118 (61.8%) | 1,925 (38.2%) |
| Personal Care & Service | 1,167 (25.2%) | 3,474 (74.9%) |
| Total (Category) | 10,073 (40.5%) | 14,816 (59.5%) |
| Total (Overall) | 70,310 (47.9%) | 76,314 (52.0%) |
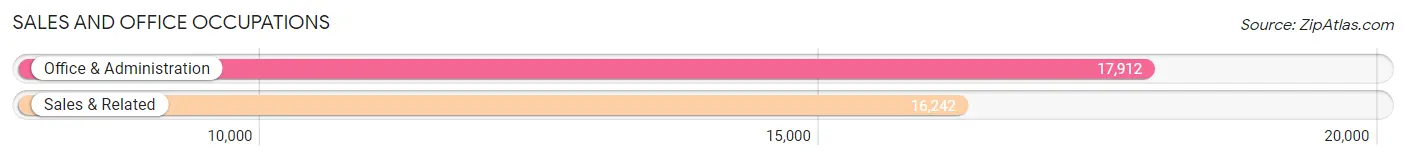
Sales and Office Occupations
The most common Sales and Office occupations in Greensboro are Office & Administration (17,912 | 12.2%), and Sales & Related (16,242 | 11.1%).
Sales and Office Occupations by Sex
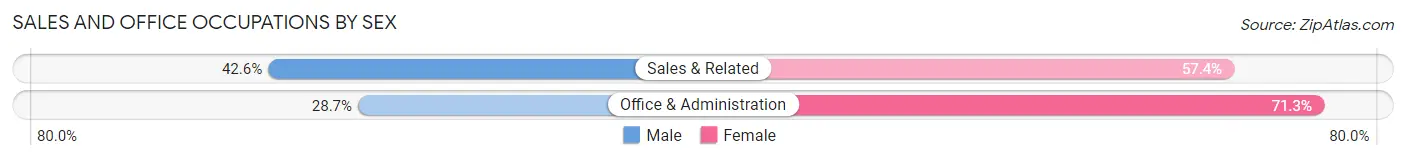
| Occupation | Male | Female |
| Sales & Related | 6,912 (42.6%) | 9,330 (57.4%) |
| Office & Administration | 5,146 (28.7%) | 12,766 (71.3%) |
| Total (Category) | 12,058 (35.3%) | 22,096 (64.7%) |
| Total (Overall) | 70,310 (47.9%) | 76,314 (52.0%) |
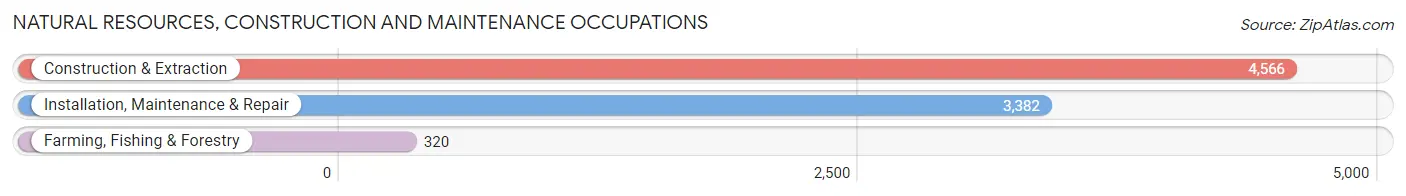
Natural Resources, Construction and Maintenance Occupations
The most common Natural Resources, Construction and Maintenance occupations in Greensboro are Construction & Extraction (4,566 | 3.1%), Installation, Maintenance & Repair (3,382 | 2.3%), and Farming, Fishing & Forestry (320 | 0.2%).
Natural Resources, Construction and Maintenance Occupations by Sex
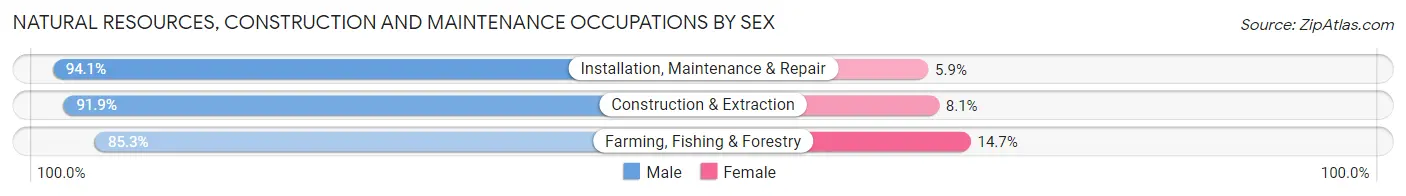
| Occupation | Male | Female |
| Farming, Fishing & Forestry | 273 (85.3%) | 47 (14.7%) |
| Construction & Extraction | 4,196 (91.9%) | 370 (8.1%) |
| Installation, Maintenance & Repair | 3,183 (94.1%) | 199 (5.9%) |
| Total (Category) | 7,652 (92.5%) | 616 (7.4%) |
| Total (Overall) | 70,310 (47.9%) | 76,314 (52.0%) |
Production, Transportation and Moving Occupations
The most common Production, Transportation and Moving occupations in Greensboro are Production (9,245 | 6.3%), Material Moving (8,808 | 6.0%), and Transportation (5,868 | 4.0%).
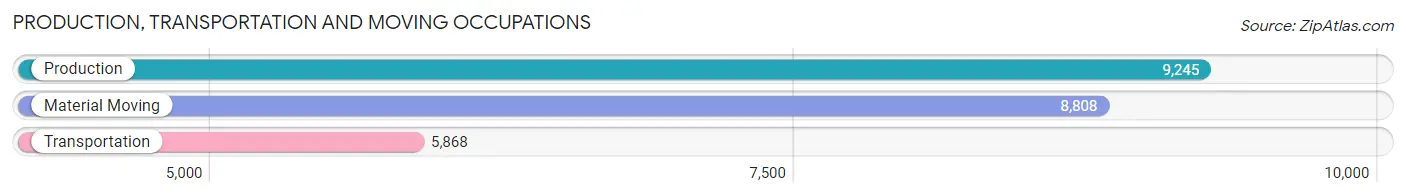
Production, Transportation and Moving Occupations by Sex
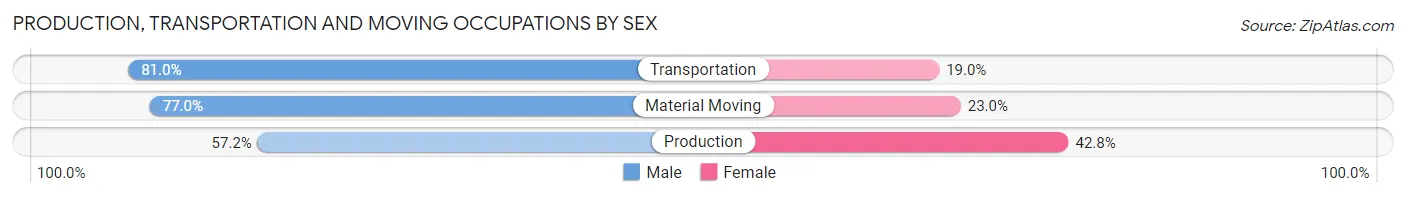
| Occupation | Male | Female |
| Production | 5,292 (57.2%) | 3,953 (42.8%) |
| Transportation | 4,752 (81.0%) | 1,116 (19.0%) |
| Material Moving | 6,784 (77.0%) | 2,024 (23.0%) |
| Total (Category) | 16,828 (70.4%) | 7,093 (29.6%) |
| Total (Overall) | 70,310 (47.9%) | 76,314 (52.0%) |
Employment Industries by Sex in Greensboro
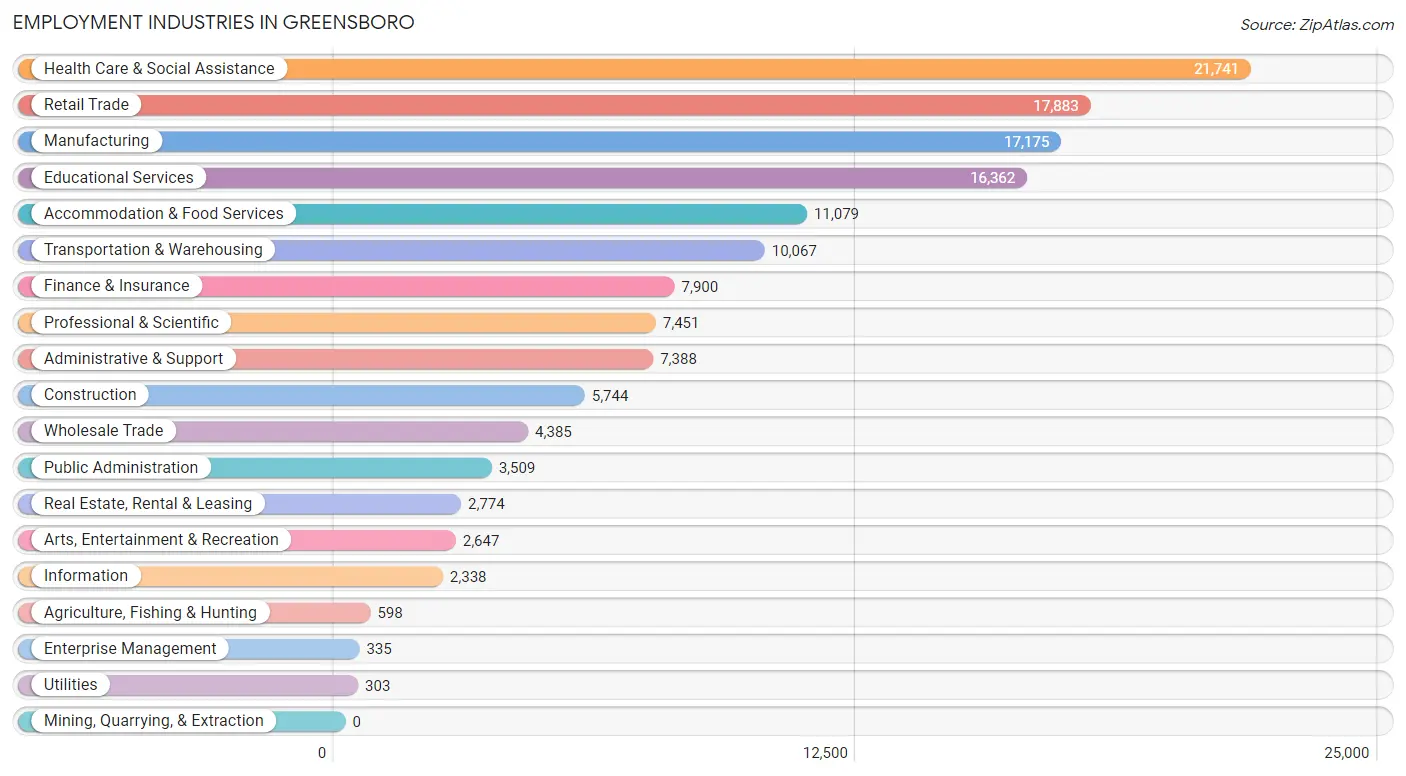
Employment Industries in Greensboro
The major employment industries in Greensboro include Health Care & Social Assistance (21,741 | 14.8%), Retail Trade (17,883 | 12.2%), Manufacturing (17,175 | 11.7%), Educational Services (16,362 | 11.2%), and Accommodation & Food Services (11,079 | 7.6%).
Employment Industries by Sex in Greensboro
The Greensboro industries that see more men than women are Utilities (89.8%), Construction (89.7%), and Transportation & Warehousing (73.4%), whereas the industries that tend to have a higher number of women are Health Care & Social Assistance (80.3%), Enterprise Management (73.4%), and Educational Services (69.3%).
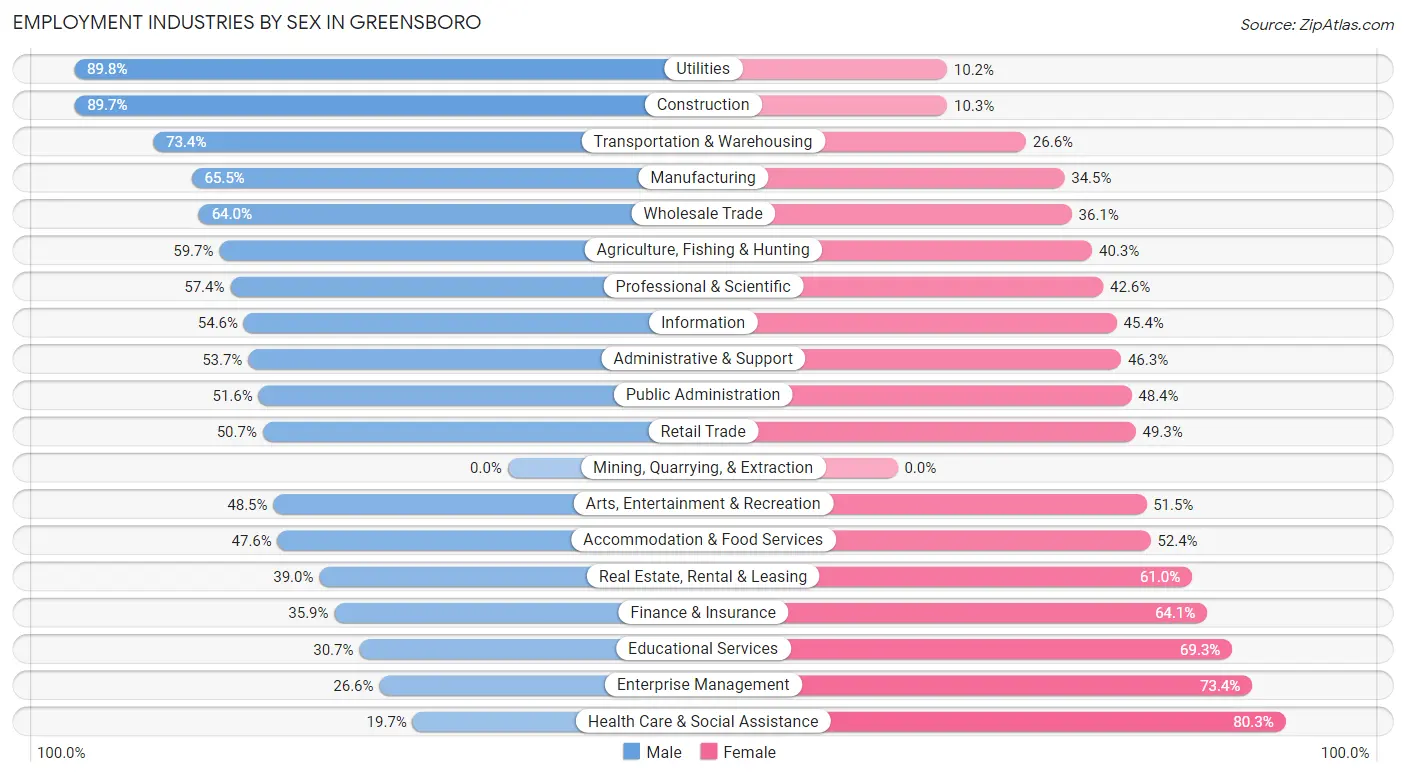
| Industry | Male | Female |
| Agriculture, Fishing & Hunting | 357 (59.7%) | 241 (40.3%) |
| Mining, Quarrying, & Extraction | 0 (0.0%) | 0 (0.0%) |
| Construction | 5,154 (89.7%) | 590 (10.3%) |
| Manufacturing | 11,243 (65.5%) | 5,932 (34.5%) |
| Wholesale Trade | 2,804 (63.9%) | 1,581 (36.0%) |
| Retail Trade | 9,068 (50.7%) | 8,815 (49.3%) |
| Transportation & Warehousing | 7,389 (73.4%) | 2,678 (26.6%) |
| Utilities | 272 (89.8%) | 31 (10.2%) |
| Information | 1,277 (54.6%) | 1,061 (45.4%) |
| Finance & Insurance | 2,835 (35.9%) | 5,065 (64.1%) |
| Real Estate, Rental & Leasing | 1,082 (39.0%) | 1,692 (61.0%) |
| Professional & Scientific | 4,279 (57.4%) | 3,172 (42.6%) |
| Enterprise Management | 89 (26.6%) | 246 (73.4%) |
| Administrative & Support | 3,969 (53.7%) | 3,419 (46.3%) |
| Educational Services | 5,027 (30.7%) | 11,335 (69.3%) |
| Health Care & Social Assistance | 4,279 (19.7%) | 17,462 (80.3%) |
| Arts, Entertainment & Recreation | 1,284 (48.5%) | 1,363 (51.5%) |
| Accommodation & Food Services | 5,277 (47.6%) | 5,802 (52.4%) |
| Public Administration | 1,810 (51.6%) | 1,699 (48.4%) |
| Total | 70,310 (47.9%) | 76,314 (52.0%) |
Education in Greensboro
School Enrollment in Greensboro
The most common levels of schooling among the 90,003 students in Greensboro are college / undergraduate (31,399 | 34.9%), middle school (15,469 | 17.2%), and high school (15,324 | 17.0%).
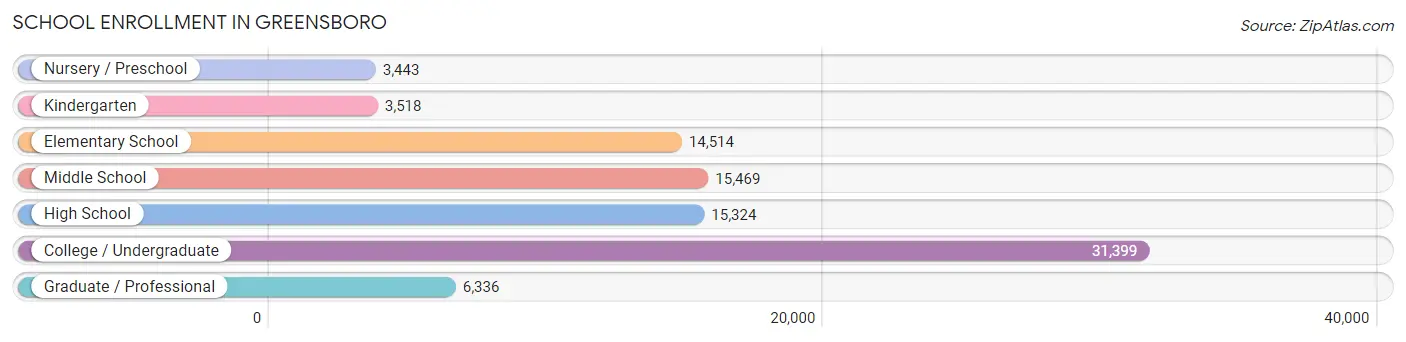
| School Level | # Students | % Students |
| Nursery / Preschool | 3,443 | 3.8% |
| Kindergarten | 3,518 | 3.9% |
| Elementary School | 14,514 | 16.1% |
| Middle School | 15,469 | 17.2% |
| High School | 15,324 | 17.0% |
| College / Undergraduate | 31,399 | 34.9% |
| Graduate / Professional | 6,336 | 7.0% |
| Total | 90,003 | 100.0% |
School Enrollment by Age by Funding Source in Greensboro
Out of a total of 90,003 students who are enrolled in schools in Greensboro, 13,050 (14.5%) attend a private institution, while the remaining 76,953 (85.5%) are enrolled in public schools. The age group of 3 to 4 year olds has the highest likelihood of being enrolled in private schools, with 1,114 (42.1% in the age bracket) enrolled. Conversely, the age group of 10 to 14 year olds has the lowest likelihood of being enrolled in a private school, with 16,962 (90.8% in the age bracket) attending a public institution.
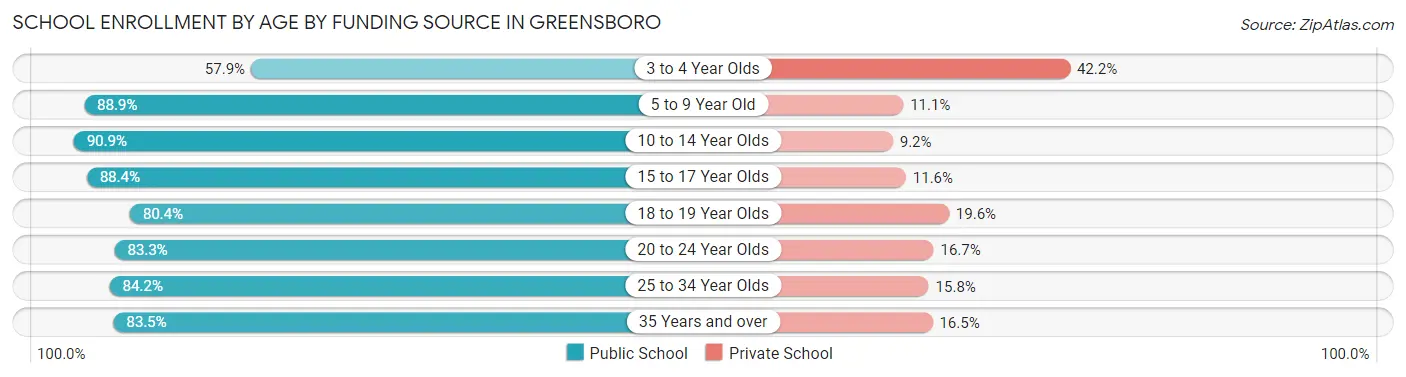
| Age Bracket | Public School | Private School |
| 3 to 4 Year Olds | 1,529 (57.9%) | 1,114 (42.1%) |
| 5 to 9 Year Old | 15,302 (88.9%) | 1,908 (11.1%) |
| 10 to 14 Year Olds | 16,962 (90.8%) | 1,708 (9.1%) |
| 15 to 17 Year Olds | 9,235 (88.4%) | 1,210 (11.6%) |
| 18 to 19 Year Olds | 9,902 (80.4%) | 2,414 (19.6%) |
| 20 to 24 Year Olds | 12,082 (83.3%) | 2,430 (16.7%) |
| 25 to 34 Year Olds | 6,239 (84.2%) | 1,173 (15.8%) |
| 35 Years and over | 5,671 (83.5%) | 1,124 (16.5%) |
| Total | 76,953 (85.5%) | 13,050 (14.5%) |
Educational Attainment by Field of Study in Greensboro
Business (15,443 | 18.5%), education (8,899 | 10.7%), science & technology (7,245 | 8.7%), social sciences (6,911 | 8.3%), and arts & humanities (6,334 | 7.6%) are the most common fields of study among 83,433 individuals in Greensboro who have obtained a bachelor's degree or higher.
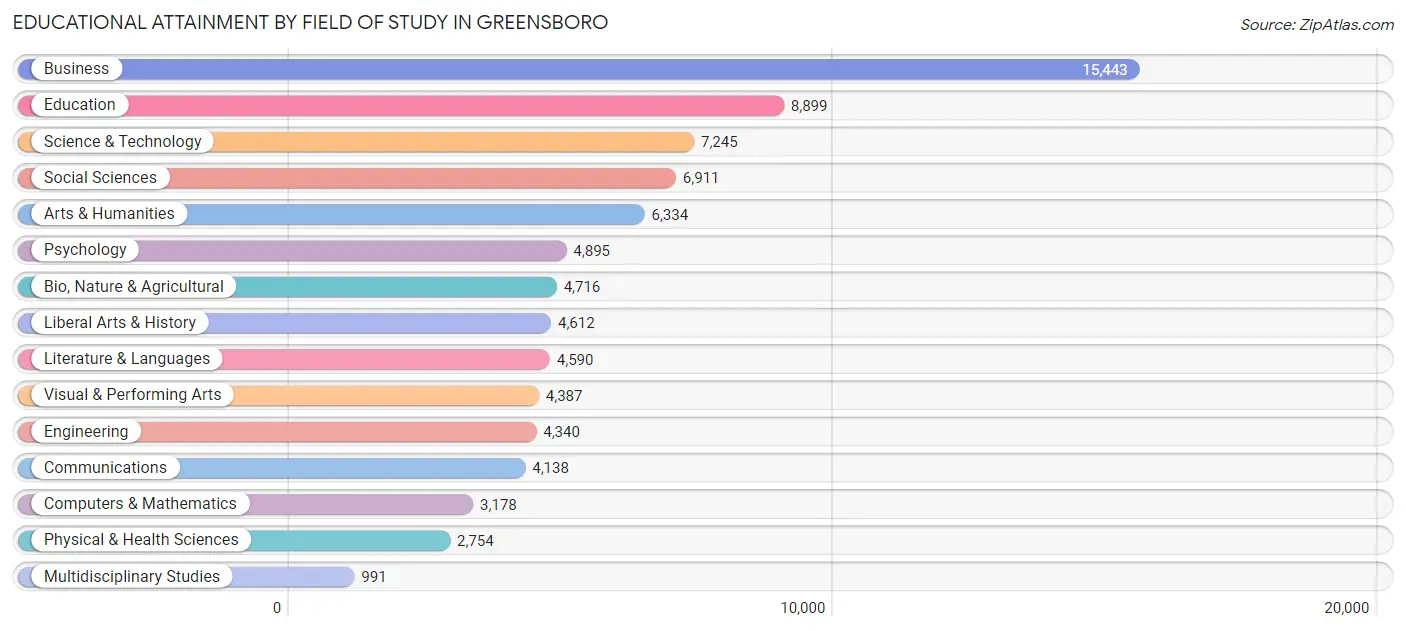
| Field of Study | # Graduates | % Graduates |
| Computers & Mathematics | 3,178 | 3.8% |
| Bio, Nature & Agricultural | 4,716 | 5.7% |
| Physical & Health Sciences | 2,754 | 3.3% |
| Psychology | 4,895 | 5.9% |
| Social Sciences | 6,911 | 8.3% |
| Engineering | 4,340 | 5.2% |
| Multidisciplinary Studies | 991 | 1.2% |
| Science & Technology | 7,245 | 8.7% |
| Business | 15,443 | 18.5% |
| Education | 8,899 | 10.7% |
| Literature & Languages | 4,590 | 5.5% |
| Liberal Arts & History | 4,612 | 5.5% |
| Visual & Performing Arts | 4,387 | 5.3% |
| Communications | 4,138 | 5.0% |
| Arts & Humanities | 6,334 | 7.6% |
| Total | 83,433 | 100.0% |
Transportation & Commute in Greensboro
Vehicle Availability by Sex in Greensboro
The most prevalent vehicle ownership categories in Greensboro are males with 2 vehicles (29,602, accounting for 43.6%) and females with 2 vehicles (28,061, making up 41.3%).
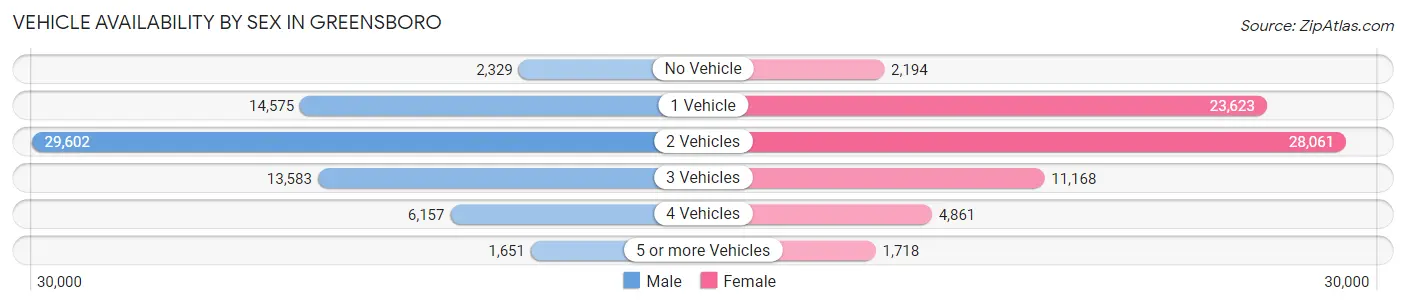
| Vehicles Available | Male | Female |
| No Vehicle | 2,329 (3.4%) | 2,194 (3.1%) |
| 1 Vehicle | 14,575 (21.5%) | 23,623 (33.0%) |
| 2 Vehicles | 29,602 (43.6%) | 28,061 (39.2%) |
| 3 Vehicles | 13,583 (20.0%) | 11,168 (15.6%) |
| 4 Vehicles | 6,157 (9.1%) | 4,861 (6.8%) |
| 5 or more Vehicles | 1,651 (2.4%) | 1,718 (2.4%) |
| Total | 67,897 (100.0%) | 71,625 (100.0%) |
Commute Time in Greensboro
The most frequently occuring commute durations in Greensboro are 15 to 19 minutes (29,535 commuters, 22.8%), 10 to 14 minutes (22,990 commuters, 17.8%), and 20 to 24 minutes (22,051 commuters, 17.0%).
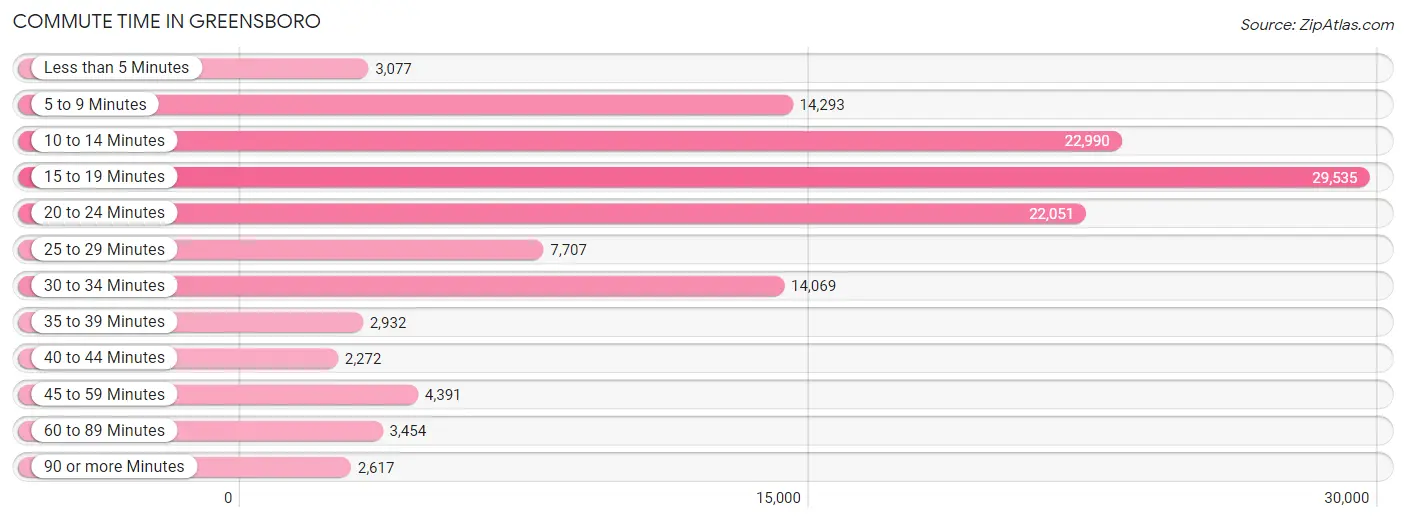
| Commute Time | # Commuters | % Commuters |
| Less than 5 Minutes | 3,077 | 2.4% |
| 5 to 9 Minutes | 14,293 | 11.1% |
| 10 to 14 Minutes | 22,990 | 17.8% |
| 15 to 19 Minutes | 29,535 | 22.8% |
| 20 to 24 Minutes | 22,051 | 17.0% |
| 25 to 29 Minutes | 7,707 | 6.0% |
| 30 to 34 Minutes | 14,069 | 10.9% |
| 35 to 39 Minutes | 2,932 | 2.3% |
| 40 to 44 Minutes | 2,272 | 1.8% |
| 45 to 59 Minutes | 4,391 | 3.4% |
| 60 to 89 Minutes | 3,454 | 2.7% |
| 90 or more Minutes | 2,617 | 2.0% |
Commute Time by Sex in Greensboro
The most common commute times in Greensboro are 15 to 19 minutes (13,753 commuters, 21.9%) for males and 15 to 19 minutes (15,782 commuters, 23.7%) for females.
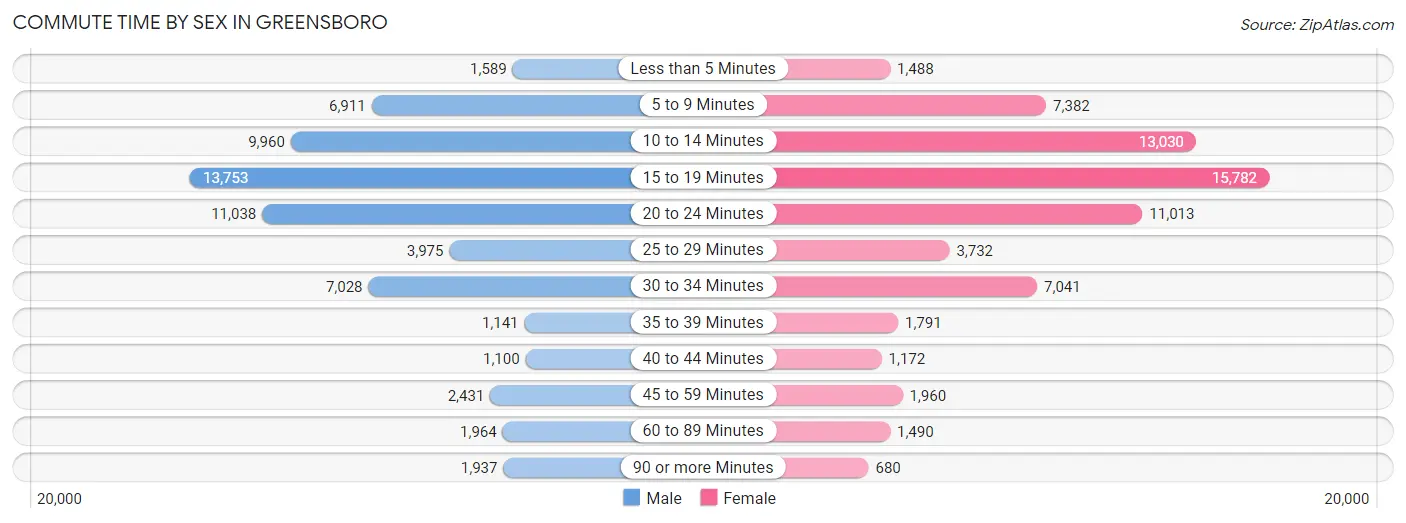
| Commute Time | Male | Female |
| Less than 5 Minutes | 1,589 (2.5%) | 1,488 (2.2%) |
| 5 to 9 Minutes | 6,911 (11.0%) | 7,382 (11.1%) |
| 10 to 14 Minutes | 9,960 (15.9%) | 13,030 (19.6%) |
| 15 to 19 Minutes | 13,753 (21.9%) | 15,782 (23.7%) |
| 20 to 24 Minutes | 11,038 (17.6%) | 11,013 (16.6%) |
| 25 to 29 Minutes | 3,975 (6.3%) | 3,732 (5.6%) |
| 30 to 34 Minutes | 7,028 (11.2%) | 7,041 (10.6%) |
| 35 to 39 Minutes | 1,141 (1.8%) | 1,791 (2.7%) |
| 40 to 44 Minutes | 1,100 (1.8%) | 1,172 (1.8%) |
| 45 to 59 Minutes | 2,431 (3.9%) | 1,960 (2.9%) |
| 60 to 89 Minutes | 1,964 (3.1%) | 1,490 (2.2%) |
| 90 or more Minutes | 1,937 (3.1%) | 680 (1.0%) |
Time of Departure to Work by Sex in Greensboro
The most frequent times of departure to work in Greensboro are 7:30 AM to 7:59 AM (8,903, 14.2%) for males and 7:30 AM to 7:59 AM (10,588, 15.9%) for females.
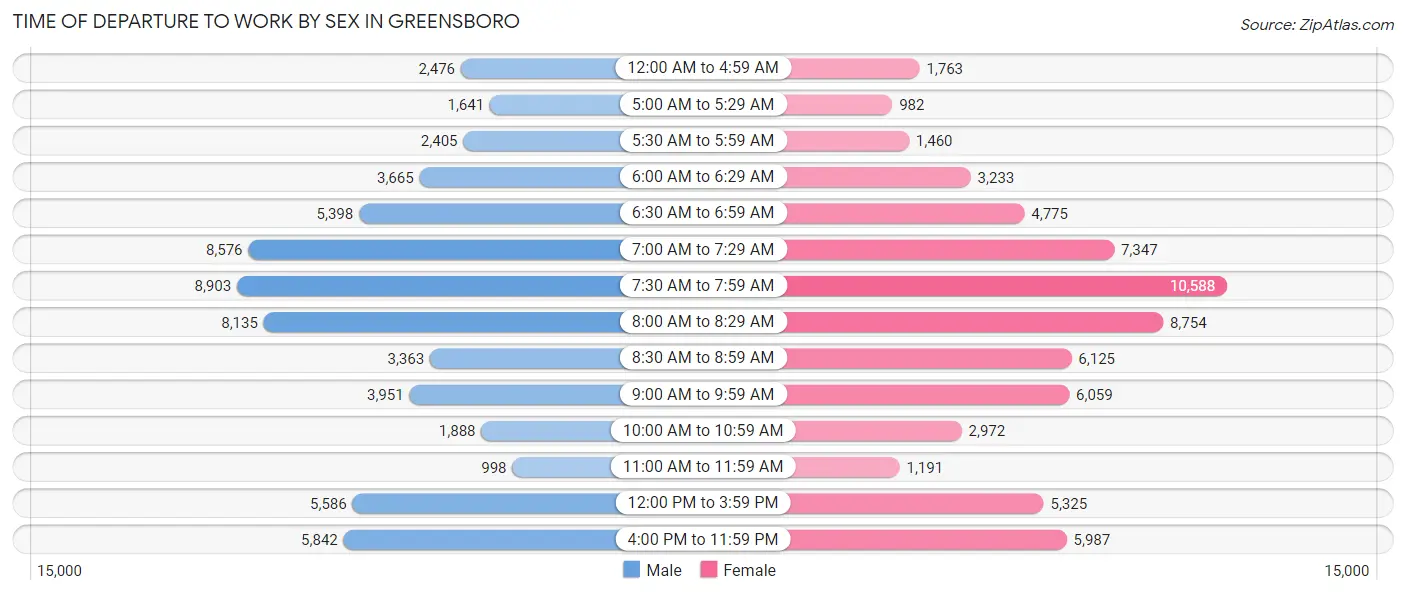
| Time of Departure | Male | Female |
| 12:00 AM to 4:59 AM | 2,476 (3.9%) | 1,763 (2.6%) |
| 5:00 AM to 5:29 AM | 1,641 (2.6%) | 982 (1.5%) |
| 5:30 AM to 5:59 AM | 2,405 (3.8%) | 1,460 (2.2%) |
| 6:00 AM to 6:29 AM | 3,665 (5.8%) | 3,233 (4.9%) |
| 6:30 AM to 6:59 AM | 5,398 (8.6%) | 4,775 (7.2%) |
| 7:00 AM to 7:29 AM | 8,576 (13.7%) | 7,347 (11.0%) |
| 7:30 AM to 7:59 AM | 8,903 (14.2%) | 10,588 (15.9%) |
| 8:00 AM to 8:29 AM | 8,135 (13.0%) | 8,754 (13.2%) |
| 8:30 AM to 8:59 AM | 3,363 (5.3%) | 6,125 (9.2%) |
| 9:00 AM to 9:59 AM | 3,951 (6.3%) | 6,059 (9.1%) |
| 10:00 AM to 10:59 AM | 1,888 (3.0%) | 2,972 (4.5%) |
| 11:00 AM to 11:59 AM | 998 (1.6%) | 1,191 (1.8%) |
| 12:00 PM to 3:59 PM | 5,586 (8.9%) | 5,325 (8.0%) |
| 4:00 PM to 11:59 PM | 5,842 (9.3%) | 5,987 (9.0%) |
| Total | 62,827 (100.0%) | 66,561 (100.0%) |
Housing Occupancy in Greensboro
Occupancy by Ownership in Greensboro
Of the total 120,137 dwellings in Greensboro, owner-occupied units account for 59,562 (49.6%), while renter-occupied units make up 60,575 (50.4%).
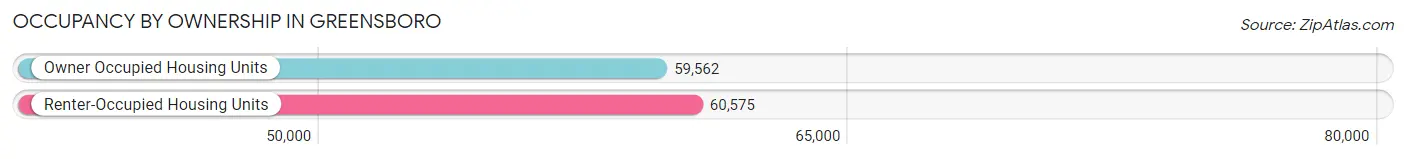
| Occupancy | # Housing Units | % Housing Units |
| Owner Occupied Housing Units | 59,562 | 49.6% |
| Renter-Occupied Housing Units | 60,575 | 50.4% |
| Total Occupied Housing Units | 120,137 | 100.0% |
Occupancy by Household Size in Greensboro
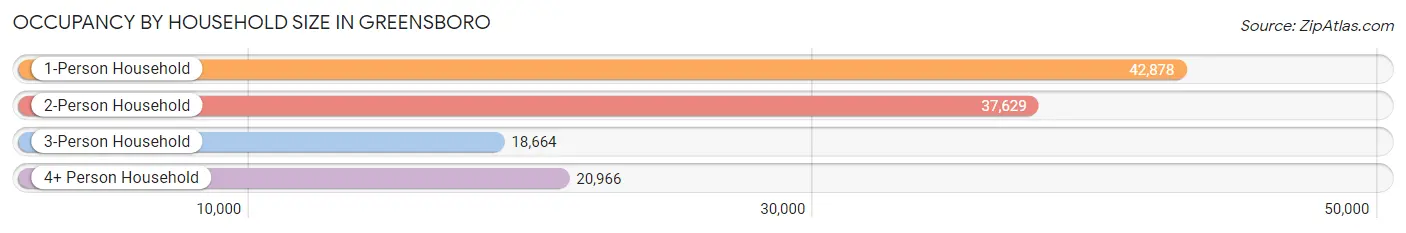
| Household Size | # Housing Units | % Housing Units |
| 1-Person Household | 42,878 | 35.7% |
| 2-Person Household | 37,629 | 31.3% |
| 3-Person Household | 18,664 | 15.5% |
| 4+ Person Household | 20,966 | 17.4% |
| Total Housing Units | 120,137 | 100.0% |
Occupancy by Ownership by Household Size in Greensboro
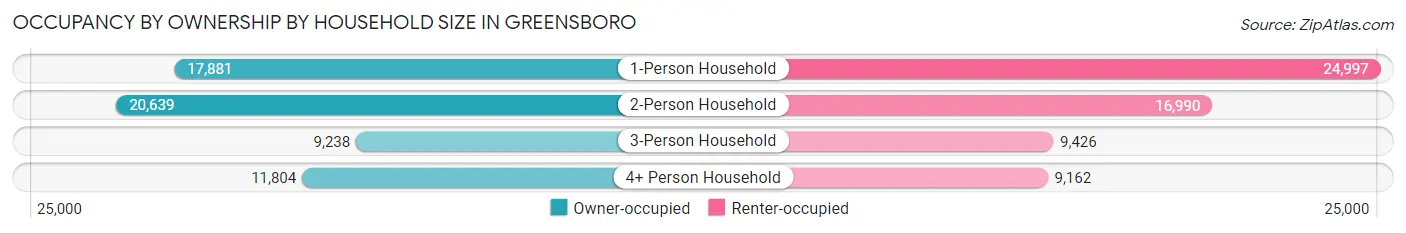
| Household Size | Owner-occupied | Renter-occupied |
| 1-Person Household | 17,881 (41.7%) | 24,997 (58.3%) |
| 2-Person Household | 20,639 (54.8%) | 16,990 (45.2%) |
| 3-Person Household | 9,238 (49.5%) | 9,426 (50.5%) |
| 4+ Person Household | 11,804 (56.3%) | 9,162 (43.7%) |
| Total Housing Units | 59,562 (49.6%) | 60,575 (50.4%) |
Occupancy by Educational Attainment in Greensboro
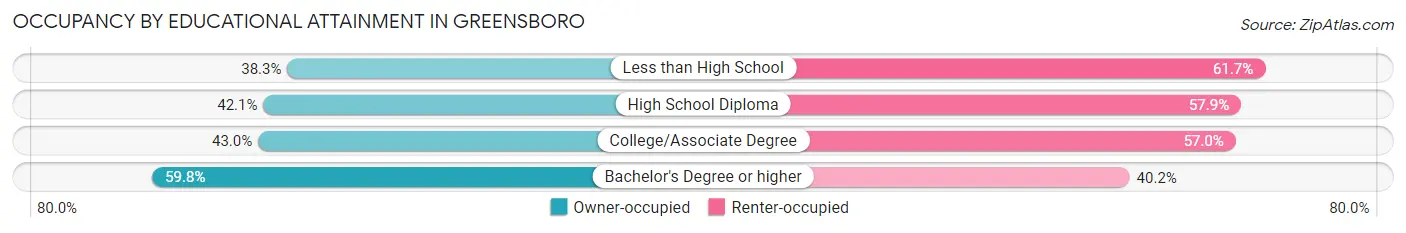
| Household Size | Owner-occupied | Renter-occupied |
| Less than High School | 3,400 (38.3%) | 5,470 (61.7%) |
| High School Diploma | 9,445 (42.1%) | 12,970 (57.9%) |
| College/Associate Degree | 16,378 (43.0%) | 21,732 (57.0%) |
| Bachelor's Degree or higher | 30,339 (59.8%) | 20,403 (40.2%) |
Occupancy by Age of Householder in Greensboro
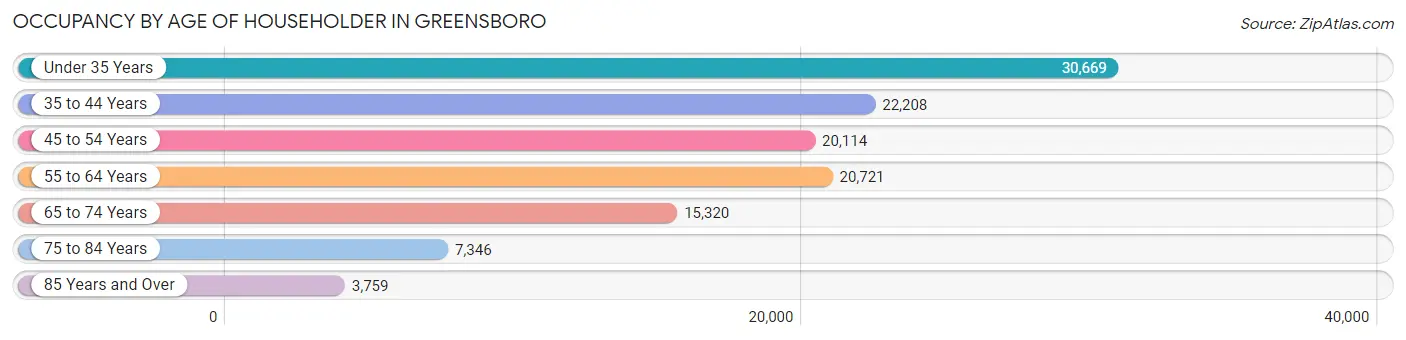
| Age Bracket | # Households | % Households |
| Under 35 Years | 30,669 | 25.5% |
| 35 to 44 Years | 22,208 | 18.5% |
| 45 to 54 Years | 20,114 | 16.7% |
| 55 to 64 Years | 20,721 | 17.2% |
| 65 to 74 Years | 15,320 | 12.8% |
| 75 to 84 Years | 7,346 | 6.1% |
| 85 Years and Over | 3,759 | 3.1% |
| Total | 120,137 | 100.0% |
Housing Finances in Greensboro
Median Income by Occupancy in Greensboro
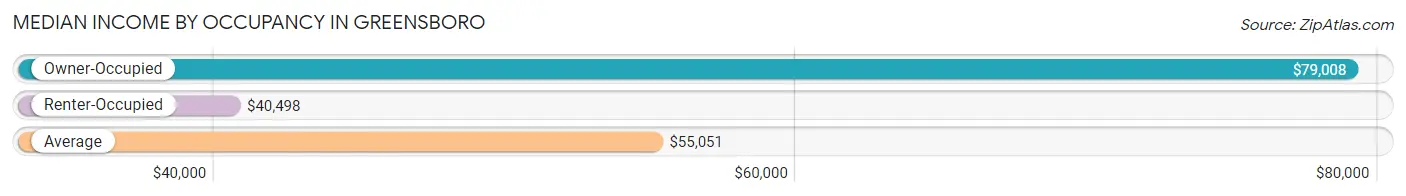
| Occupancy Type | # Households | Median Income |
| Owner-Occupied | 59,562 (49.6%) | $79,008 |
| Renter-Occupied | 60,575 (50.4%) | $40,498 |
| Average | 120,137 (100.0%) | $55,051 |
Occupancy by Householder Income Bracket in Greensboro
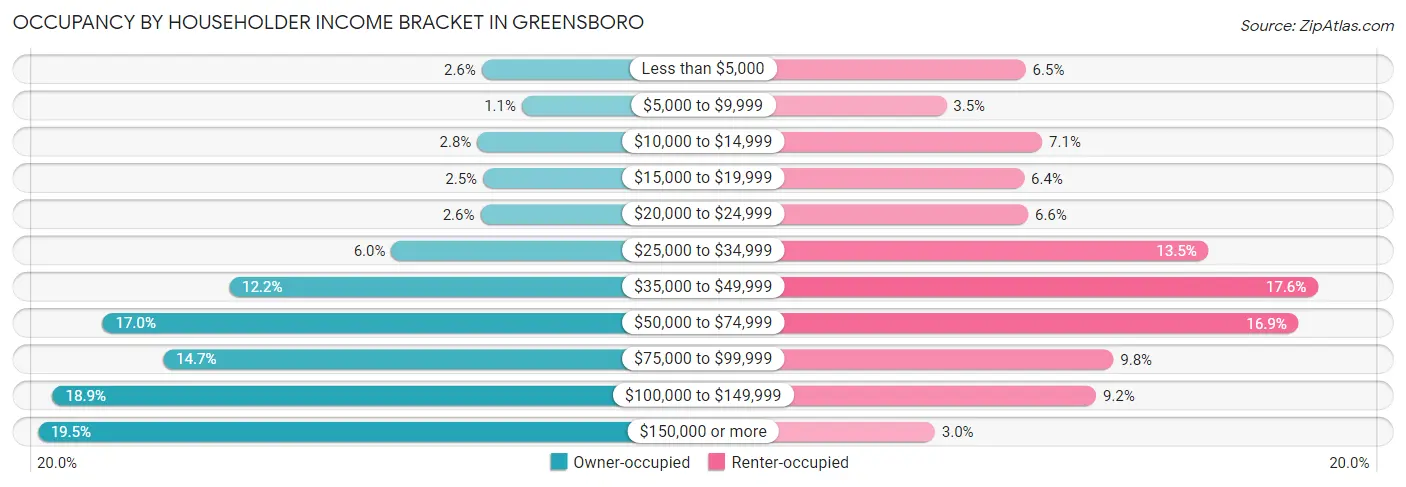
| Income Bracket | Owner-occupied | Renter-occupied |
| Less than $5,000 | 1,544 (2.6%) | 3,925 (6.5%) |
| $5,000 to $9,999 | 629 (1.1%) | 2,094 (3.5%) |
| $10,000 to $14,999 | 1,643 (2.8%) | 4,309 (7.1%) |
| $15,000 to $19,999 | 1,511 (2.5%) | 3,891 (6.4%) |
| $20,000 to $24,999 | 1,570 (2.6%) | 3,979 (6.6%) |
| $25,000 to $34,999 | 3,592 (6.0%) | 8,149 (13.5%) |
| $35,000 to $49,999 | 7,272 (12.2%) | 10,674 (17.6%) |
| $50,000 to $74,999 | 10,144 (17.0%) | 10,225 (16.9%) |
| $75,000 to $99,999 | 8,766 (14.7%) | 5,951 (9.8%) |
| $100,000 to $149,999 | 11,275 (18.9%) | 5,549 (9.2%) |
| $150,000 or more | 11,616 (19.5%) | 1,829 (3.0%) |
| Total | 59,562 (100.0%) | 60,575 (100.0%) |
Monthly Housing Cost Tiers in Greensboro
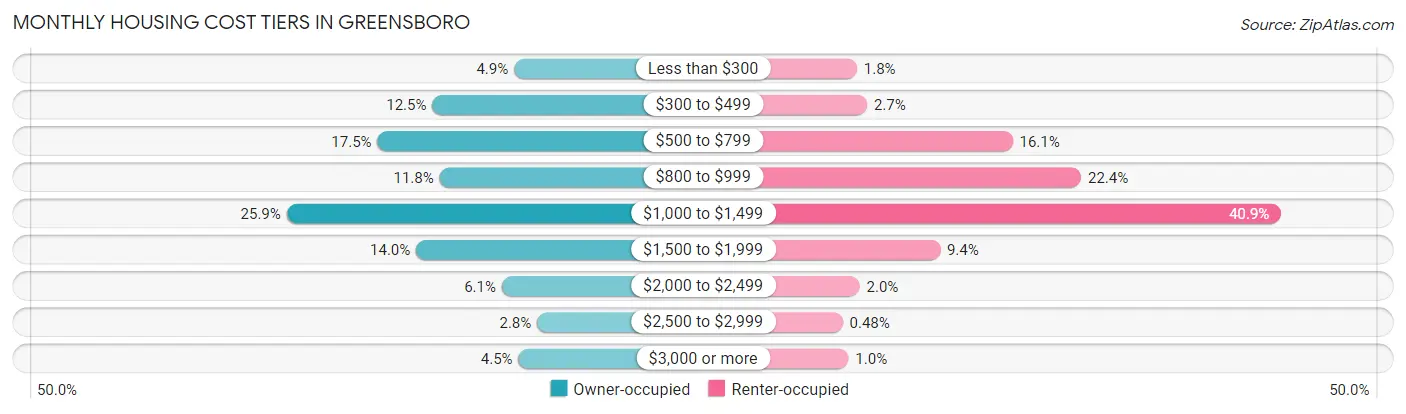
| Monthly Cost | Owner-occupied | Renter-occupied |
| Less than $300 | 2,940 (4.9%) | 1,082 (1.8%) |
| $300 to $499 | 7,427 (12.5%) | 1,645 (2.7%) |
| $500 to $799 | 10,434 (17.5%) | 9,765 (16.1%) |
| $800 to $999 | 7,027 (11.8%) | 13,585 (22.4%) |
| $1,000 to $1,499 | 15,415 (25.9%) | 24,742 (40.8%) |
| $1,500 to $1,999 | 8,313 (14.0%) | 5,716 (9.4%) |
| $2,000 to $2,499 | 3,618 (6.1%) | 1,235 (2.0%) |
| $2,500 to $2,999 | 1,682 (2.8%) | 292 (0.5%) |
| $3,000 or more | 2,706 (4.5%) | 612 (1.0%) |
| Total | 59,562 (100.0%) | 60,575 (100.0%) |
Physical Housing Characteristics in Greensboro
Housing Structures in Greensboro
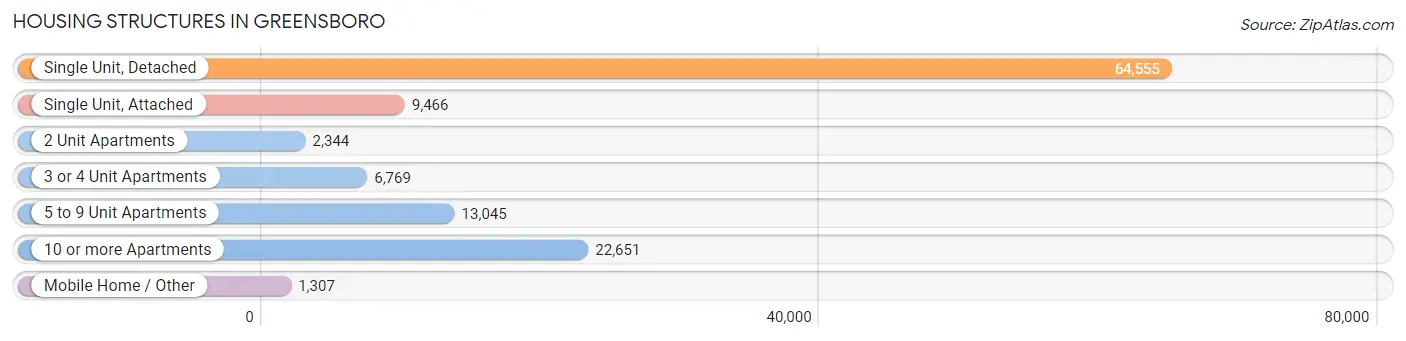
| Structure Type | # Housing Units | % Housing Units |
| Single Unit, Detached | 64,555 | 53.7% |
| Single Unit, Attached | 9,466 | 7.9% |
| 2 Unit Apartments | 2,344 | 1.9% |
| 3 or 4 Unit Apartments | 6,769 | 5.6% |
| 5 to 9 Unit Apartments | 13,045 | 10.9% |
| 10 or more Apartments | 22,651 | 18.9% |
| Mobile Home / Other | 1,307 | 1.1% |
| Total | 120,137 | 100.0% |
Housing Structures by Occupancy in Greensboro
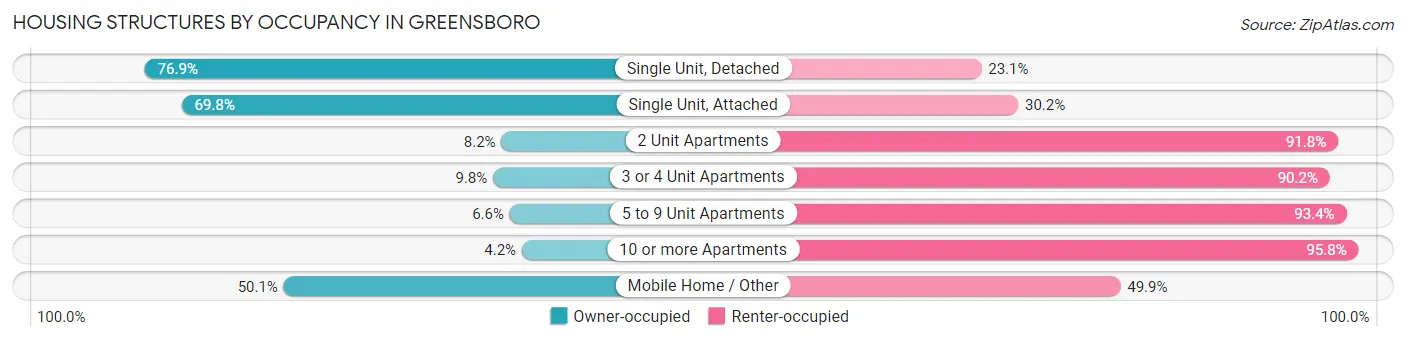
| Structure Type | Owner-occupied | Renter-occupied |
| Single Unit, Detached | 49,627 (76.9%) | 14,928 (23.1%) |
| Single Unit, Attached | 6,606 (69.8%) | 2,860 (30.2%) |
| 2 Unit Apartments | 192 (8.2%) | 2,152 (91.8%) |
| 3 or 4 Unit Apartments | 663 (9.8%) | 6,106 (90.2%) |
| 5 to 9 Unit Apartments | 859 (6.6%) | 12,186 (93.4%) |
| 10 or more Apartments | 960 (4.2%) | 21,691 (95.8%) |
| Mobile Home / Other | 655 (50.1%) | 652 (49.9%) |
| Total | 59,562 (49.6%) | 60,575 (50.4%) |
Housing Structures by Number of Rooms in Greensboro
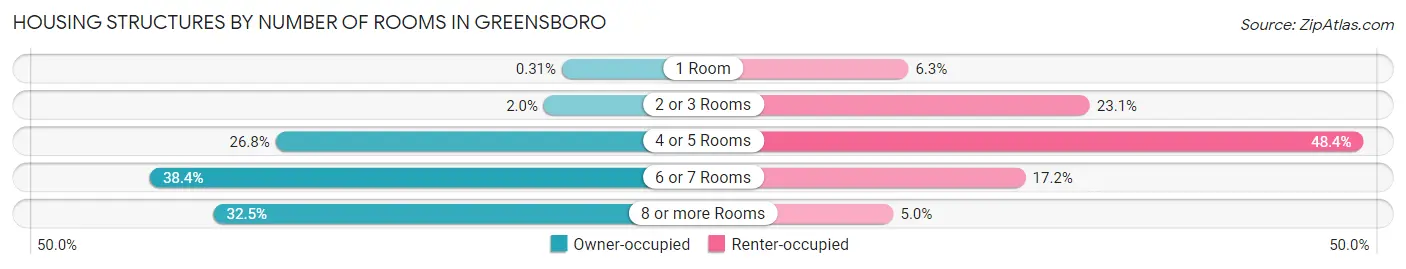
| Number of Rooms | Owner-occupied | Renter-occupied |
| 1 Room | 187 (0.3%) | 3,841 (6.3%) |
| 2 or 3 Rooms | 1,182 (2.0%) | 14,002 (23.1%) |
| 4 or 5 Rooms | 15,955 (26.8%) | 29,324 (48.4%) |
| 6 or 7 Rooms | 22,874 (38.4%) | 10,406 (17.2%) |
| 8 or more Rooms | 19,364 (32.5%) | 3,002 (5.0%) |
| Total | 59,562 (100.0%) | 60,575 (100.0%) |
Housing Structure by Heating Type in Greensboro
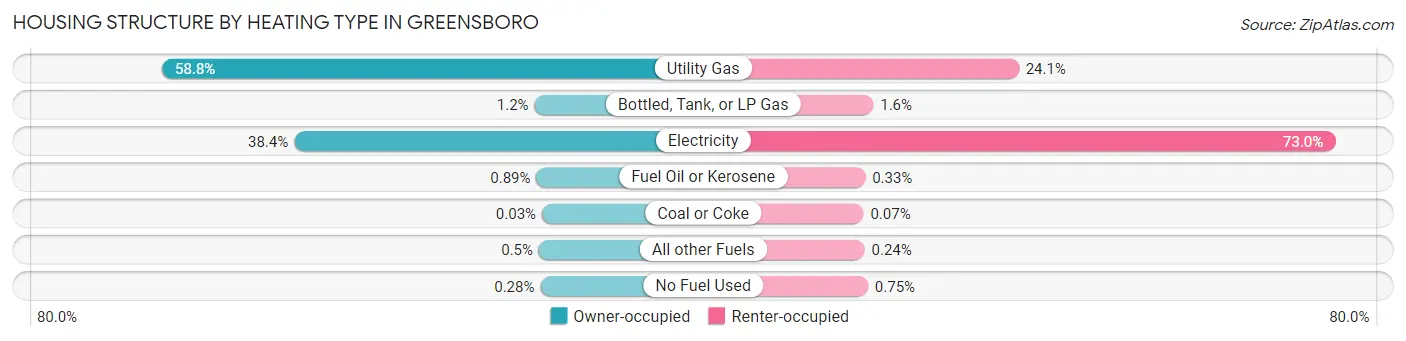
| Heating Type | Owner-occupied | Renter-occupied |
| Utility Gas | 35,003 (58.8%) | 14,573 (24.1%) |
| Bottled, Tank, or LP Gas | 709 (1.2%) | 959 (1.6%) |
| Electricity | 22,843 (38.4%) | 44,203 (73.0%) |
| Fuel Oil or Kerosene | 531 (0.9%) | 201 (0.3%) |
| Coal or Coke | 16 (0.0%) | 40 (0.1%) |
| All other Fuels | 295 (0.5%) | 145 (0.2%) |
| No Fuel Used | 165 (0.3%) | 454 (0.7%) |
| Total | 59,562 (100.0%) | 60,575 (100.0%) |
Household Vehicle Usage in Greensboro
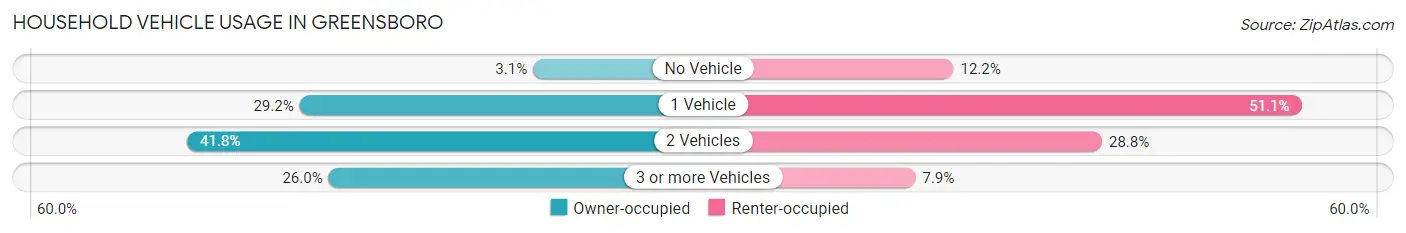
| Vehicles per Household | Owner-occupied | Renter-occupied |
| No Vehicle | 1,814 (3.0%) | 7,370 (12.2%) |
| 1 Vehicle | 17,396 (29.2%) | 30,966 (51.1%) |
| 2 Vehicles | 24,892 (41.8%) | 17,446 (28.8%) |
| 3 or more Vehicles | 15,460 (26.0%) | 4,793 (7.9%) |
| Total | 59,562 (100.0%) | 60,575 (100.0%) |
Real Estate & Mortgages in Greensboro
Real Estate and Mortgage Overview in Greensboro
| Characteristic | Without Mortgage | With Mortgage |
| Housing Units | 19,418 | 40,144 |
| Median Property Value | $186,900 | $201,200 |
| Median Household Income | $61,446 | $8,591 |
| Monthly Housing Costs | $494 | $2,684 |
| Real Estate Taxes | $1,984 | $797 |
Property Value by Mortgage Status in Greensboro
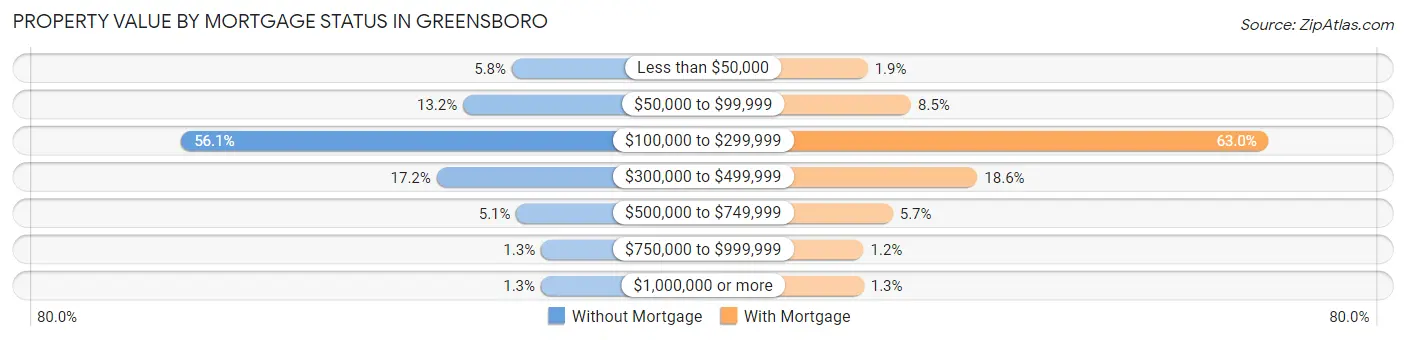
| Property Value | Without Mortgage | With Mortgage |
| Less than $50,000 | 1,117 (5.8%) | 746 (1.9%) |
| $50,000 to $99,999 | 2,561 (13.2%) | 3,402 (8.5%) |
| $100,000 to $299,999 | 10,900 (56.1%) | 25,269 (62.9%) |
| $300,000 to $499,999 | 3,344 (17.2%) | 7,454 (18.6%) |
| $500,000 to $749,999 | 983 (5.1%) | 2,276 (5.7%) |
| $750,000 to $999,999 | 255 (1.3%) | 495 (1.2%) |
| $1,000,000 or more | 258 (1.3%) | 502 (1.3%) |
| Total | 19,418 (100.0%) | 40,144 (100.0%) |
Household Income by Mortgage Status in Greensboro
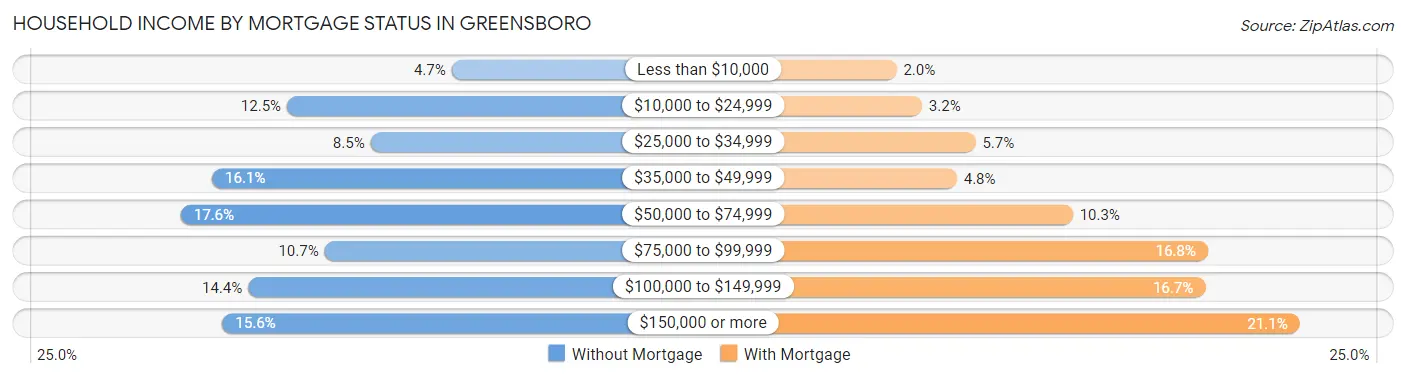
| Household Income | Without Mortgage | With Mortgage |
| Less than $10,000 | 906 (4.7%) | 784 (1.9%) |
| $10,000 to $24,999 | 2,430 (12.5%) | 1,267 (3.2%) |
| $25,000 to $34,999 | 1,657 (8.5%) | 2,294 (5.7%) |
| $35,000 to $49,999 | 3,121 (16.1%) | 1,935 (4.8%) |
| $50,000 to $74,999 | 3,410 (17.6%) | 4,151 (10.3%) |
| $75,000 to $99,999 | 2,081 (10.7%) | 6,734 (16.8%) |
| $100,000 to $149,999 | 2,788 (14.4%) | 6,685 (16.7%) |
| $150,000 or more | 3,025 (15.6%) | 8,487 (21.1%) |
| Total | 19,418 (100.0%) | 40,144 (100.0%) |
Property Value to Household Income Ratio in Greensboro
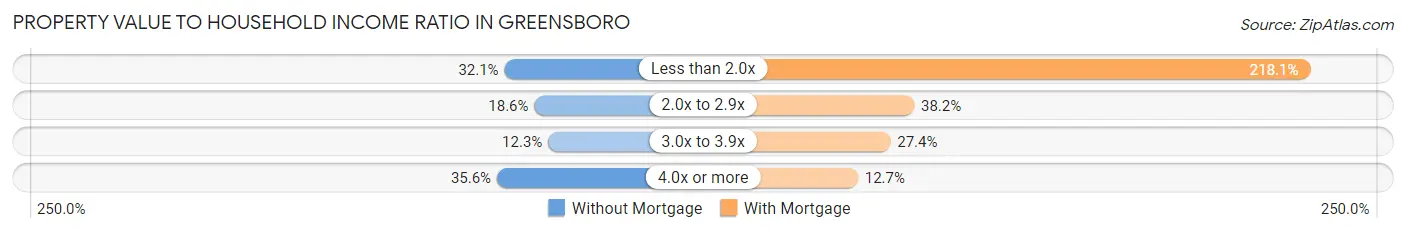
| Value-to-Income Ratio | Without Mortgage | With Mortgage |
| Less than 2.0x | 6,240 (32.1%) | 87,560 (218.1%) |
| 2.0x to 2.9x | 3,604 (18.6%) | 15,326 (38.2%) |
| 3.0x to 3.9x | 2,386 (12.3%) | 11,000 (27.4%) |
| 4.0x or more | 6,904 (35.5%) | 5,083 (12.7%) |
| Total | 19,418 (100.0%) | 40,144 (100.0%) |
Real Estate Taxes by Mortgage Status in Greensboro
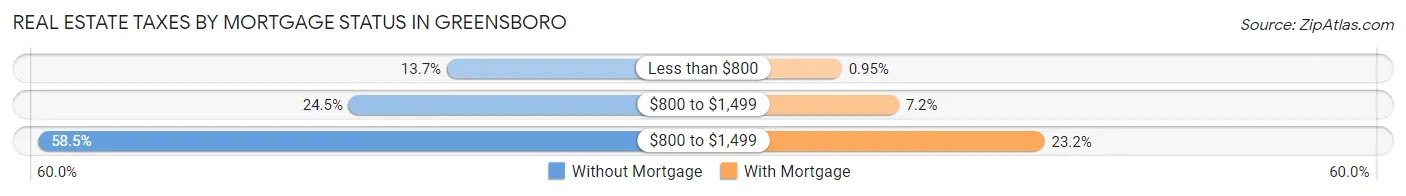
| Property Taxes | Without Mortgage | With Mortgage |
| Less than $800 | 2,665 (13.7%) | 382 (0.9%) |
| $800 to $1,499 | 4,752 (24.5%) | 2,892 (7.2%) |
| $800 to $1,499 | 11,360 (58.5%) | 9,306 (23.2%) |
| Total | 19,418 (100.0%) | 40,144 (100.0%) |
Health & Disability in Greensboro
Health Insurance Coverage by Age in Greensboro
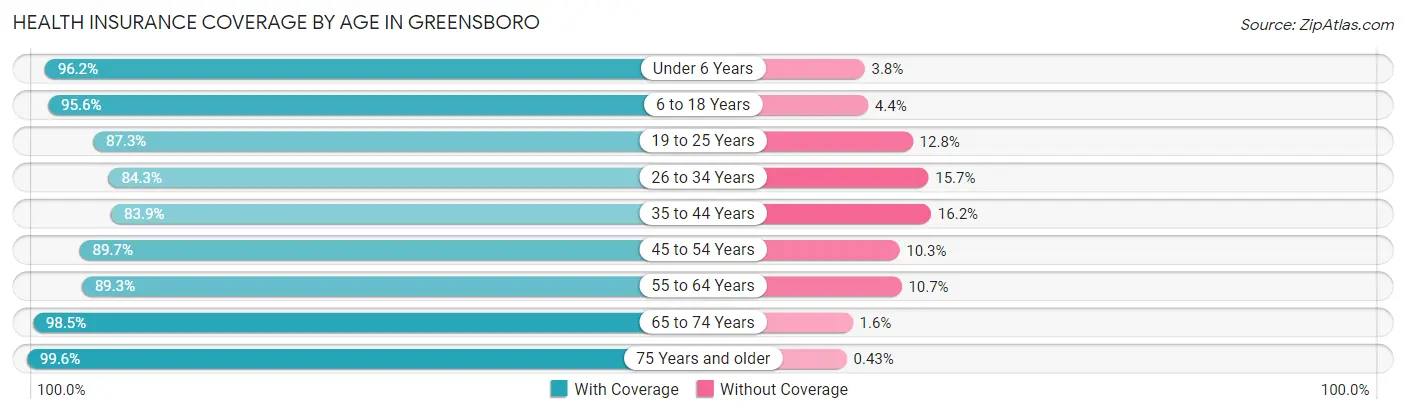
| Age Bracket | With Coverage | Without Coverage |
| Under 6 Years | 19,511 (96.2%) | 764 (3.8%) |
| 6 to 18 Years | 50,667 (95.6%) | 2,334 (4.4%) |
| 19 to 25 Years | 33,458 (87.3%) | 4,891 (12.8%) |
| 26 to 34 Years | 34,245 (84.3%) | 6,361 (15.7%) |
| 35 to 44 Years | 30,370 (83.9%) | 5,848 (16.2%) |
| 45 to 54 Years | 31,224 (89.7%) | 3,569 (10.3%) |
| 55 to 64 Years | 28,536 (89.3%) | 3,406 (10.7%) |
| 65 to 74 Years | 23,079 (98.5%) | 364 (1.5%) |
| 75 Years and older | 15,607 (99.6%) | 68 (0.4%) |
| Total | 266,697 (90.6%) | 27,605 (9.4%) |
Health Insurance Coverage by Citizenship Status in Greensboro
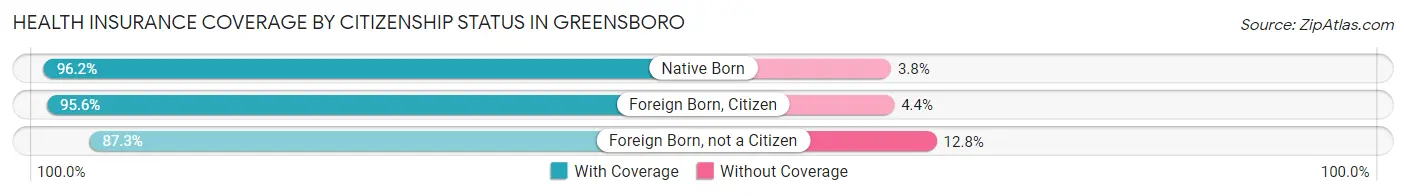
| Citizenship Status | With Coverage | Without Coverage |
| Native Born | 19,511 (96.2%) | 764 (3.8%) |
| Foreign Born, Citizen | 50,667 (95.6%) | 2,334 (4.4%) |
| Foreign Born, not a Citizen | 33,458 (87.3%) | 4,891 (12.8%) |
Health Insurance Coverage by Household Income in Greensboro
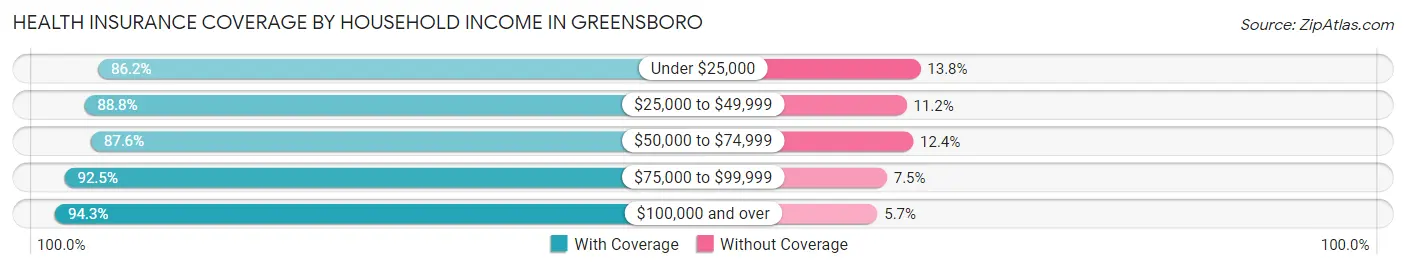
| Household Income | With Coverage | Without Coverage |
| Under $25,000 | 37,184 (86.2%) | 5,945 (13.8%) |
| $25,000 to $49,999 | 54,218 (88.8%) | 6,832 (11.2%) |
| $50,000 to $74,999 | 41,922 (87.6%) | 5,946 (12.4%) |
| $75,000 to $99,999 | 36,126 (92.5%) | 2,925 (7.5%) |
| $100,000 and over | 84,471 (94.3%) | 5,119 (5.7%) |
Public vs Private Health Insurance Coverage by Age in Greensboro
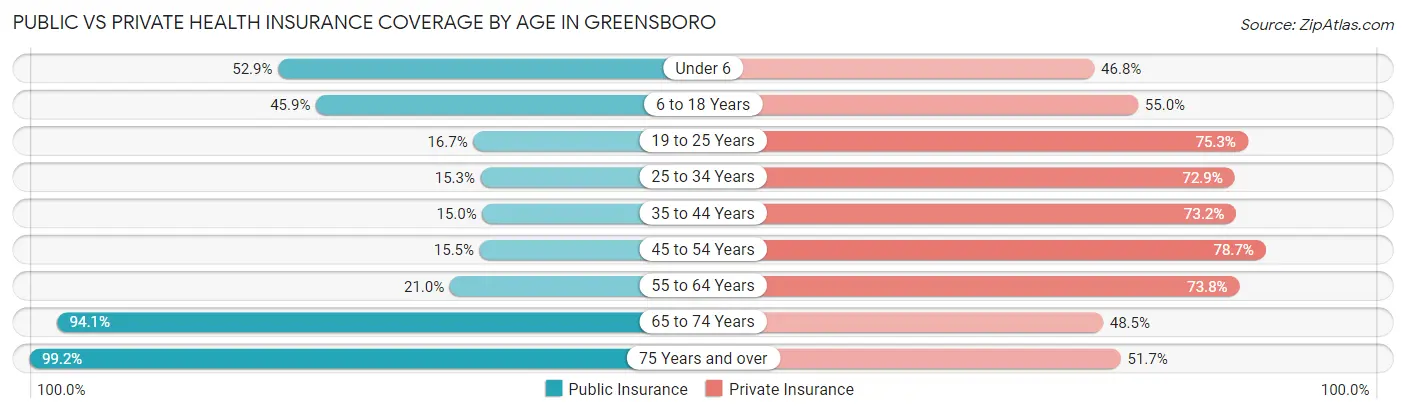
| Age Bracket | Public Insurance | Private Insurance |
| Under 6 | 10,728 (52.9%) | 9,497 (46.8%) |
| 6 to 18 Years | 24,314 (45.9%) | 29,131 (55.0%) |
| 19 to 25 Years | 6,397 (16.7%) | 28,888 (75.3%) |
| 25 to 34 Years | 6,225 (15.3%) | 29,598 (72.9%) |
| 35 to 44 Years | 5,432 (15.0%) | 26,508 (73.2%) |
| 45 to 54 Years | 5,394 (15.5%) | 27,372 (78.7%) |
| 55 to 64 Years | 6,717 (21.0%) | 23,573 (73.8%) |
| 65 to 74 Years | 22,047 (94.1%) | 11,358 (48.4%) |
| 75 Years and over | 15,548 (99.2%) | 8,111 (51.7%) |
| Total | 102,802 (34.9%) | 194,036 (65.9%) |
Disability Status by Sex by Age in Greensboro
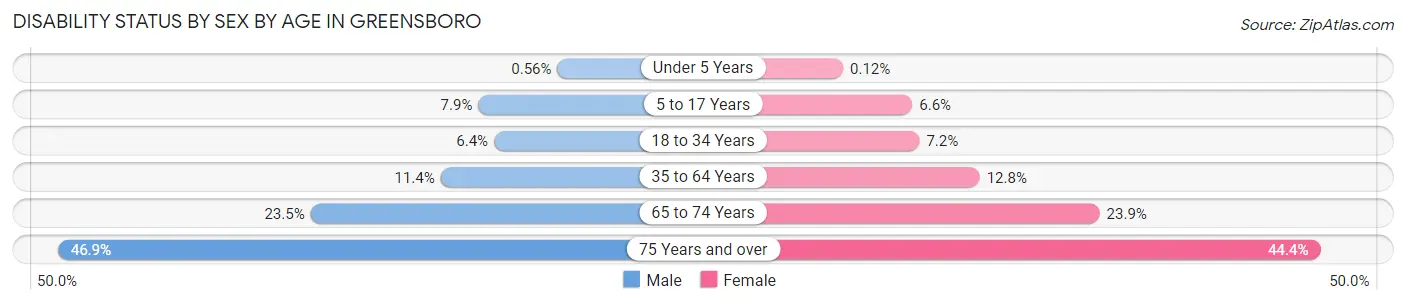
| Age Bracket | Male | Female |
| Under 5 Years | 50 (0.6%) | 10 (0.1%) |
| 5 to 17 Years | 1,931 (7.9%) | 1,550 (6.6%) |
| 18 to 34 Years | 2,510 (6.4%) | 3,445 (7.2%) |
| 35 to 64 Years | 5,405 (11.4%) | 7,112 (12.8%) |
| 65 to 74 Years | 2,467 (23.5%) | 3,095 (23.9%) |
| 75 Years and over | 2,761 (46.9%) | 4,347 (44.4%) |
Disability Class by Sex by Age in Greensboro
Disability Class: Hearing Difficulty
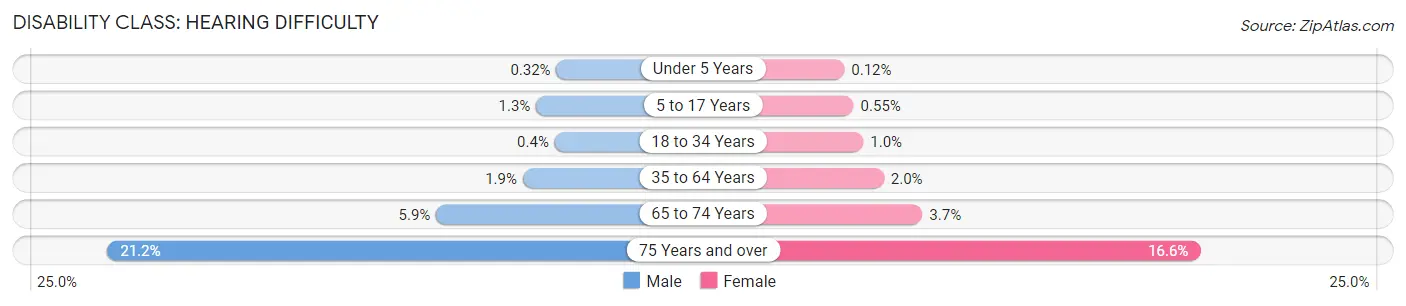
| Age Bracket | Male | Female |
| Under 5 Years | 28 (0.3%) | 10 (0.1%) |
| 5 to 17 Years | 309 (1.3%) | 131 (0.5%) |
| 18 to 34 Years | 156 (0.4%) | 480 (1.0%) |
| 35 to 64 Years | 893 (1.9%) | 1,085 (1.9%) |
| 65 to 74 Years | 620 (5.9%) | 484 (3.7%) |
| 75 Years and over | 1,245 (21.2%) | 1,628 (16.6%) |
Disability Class: Vision Difficulty
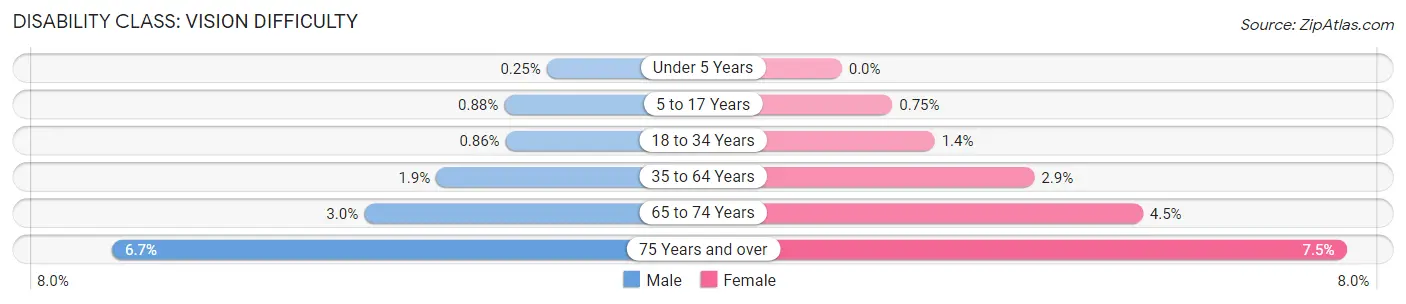
| Age Bracket | Male | Female |
| Under 5 Years | 22 (0.3%) | 0 (0.0%) |
| 5 to 17 Years | 214 (0.9%) | 177 (0.7%) |
| 18 to 34 Years | 333 (0.9%) | 661 (1.4%) |
| 35 to 64 Years | 897 (1.9%) | 1,589 (2.9%) |
| 65 to 74 Years | 311 (3.0%) | 578 (4.5%) |
| 75 Years and over | 394 (6.7%) | 733 (7.5%) |
Disability Class: Cognitive Difficulty
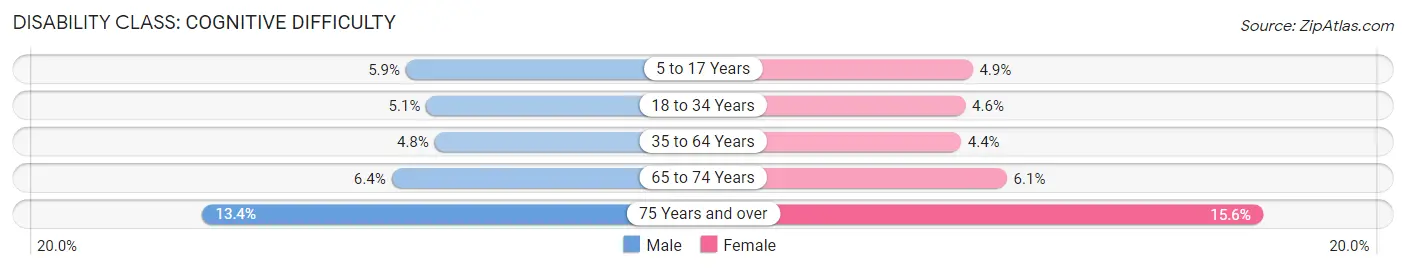
| Age Bracket | Male | Female |
| 5 to 17 Years | 1,430 (5.9%) | 1,148 (4.9%) |
| 18 to 34 Years | 1,982 (5.1%) | 2,187 (4.6%) |
| 35 to 64 Years | 2,265 (4.8%) | 2,454 (4.4%) |
| 65 to 74 Years | 671 (6.4%) | 791 (6.1%) |
| 75 Years and over | 788 (13.4%) | 1,529 (15.6%) |
Disability Class: Ambulatory Difficulty
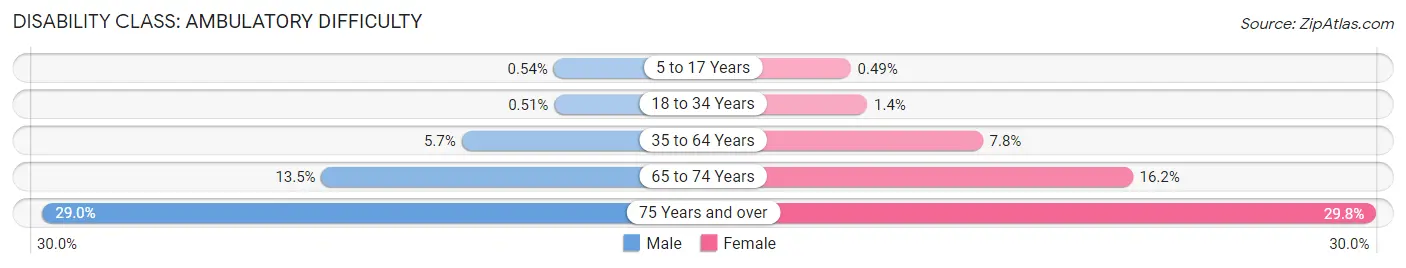
| Age Bracket | Male | Female |
| 5 to 17 Years | 133 (0.5%) | 115 (0.5%) |
| 18 to 34 Years | 197 (0.5%) | 675 (1.4%) |
| 35 to 64 Years | 2,689 (5.7%) | 4,354 (7.8%) |
| 65 to 74 Years | 1,416 (13.5%) | 2,094 (16.2%) |
| 75 Years and over | 1,707 (29.0%) | 2,913 (29.7%) |
Disability Class: Self-Care Difficulty
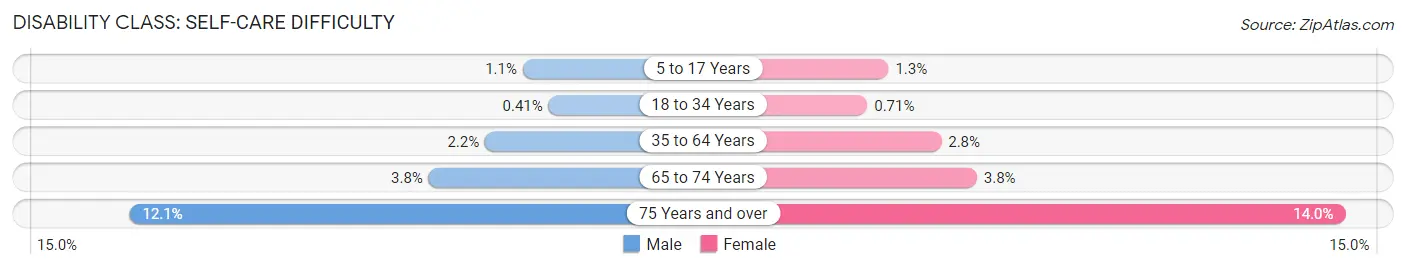
| Age Bracket | Male | Female |
| 5 to 17 Years | 276 (1.1%) | 307 (1.3%) |
| 18 to 34 Years | 160 (0.4%) | 339 (0.7%) |
| 35 to 64 Years | 1,033 (2.2%) | 1,541 (2.8%) |
| 65 to 74 Years | 394 (3.7%) | 486 (3.8%) |
| 75 Years and over | 711 (12.1%) | 1,373 (14.0%) |
Technology Access in Greensboro
Computing Device Access in Greensboro
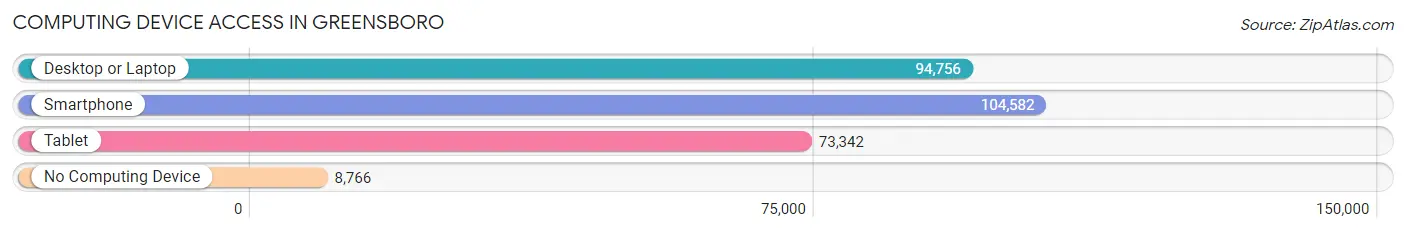
| Device Type | # Households | % Households |
| Desktop or Laptop | 94,756 | 78.9% |
| Smartphone | 104,582 | 87.1% |
| Tablet | 73,342 | 61.1% |
| No Computing Device | 8,766 | 7.3% |
| Total | 120,137 | 100.0% |
Internet Access in Greensboro
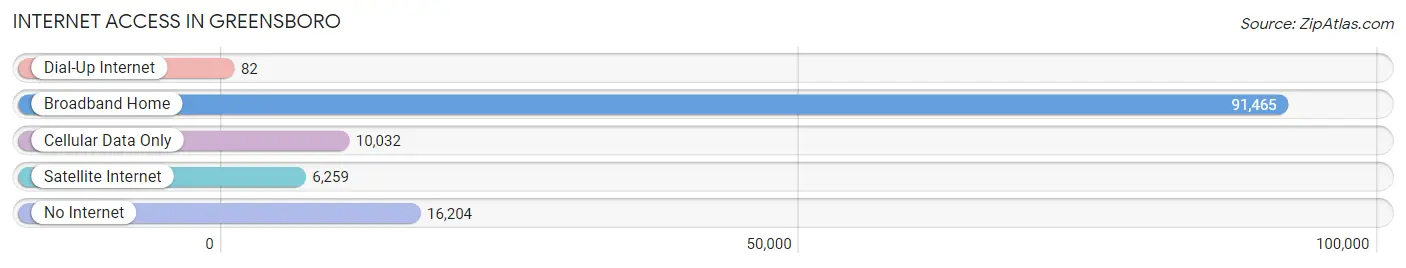
| Internet Type | # Households | % Households |
| Dial-Up Internet | 82 | 0.1% |
| Broadband Home | 91,465 | 76.1% |
| Cellular Data Only | 10,032 | 8.4% |
| Satellite Internet | 6,259 | 5.2% |
| No Internet | 16,204 | 13.5% |
| Total | 120,137 | 100.0% |
Greensboro Summary
Greensboro is a city located in the state of North Carolina, United States. It is the third-largest city in the state and the county seat of Guilford County. The city is situated in the Piedmont region of North Carolina, and is located at the intersection of two major interstate highways, I-85 and I-40. Greensboro is the largest city in the Piedmont Triad region, which also includes the cities of High Point and Winston-Salem.
History
Greensboro was founded in 1808 by Major General Nathanael Greene, a Revolutionary War hero. The city was named after him and was originally known as Greensborough. The city was incorporated in 1821 and has since grown to become the third-largest city in North Carolina.
Greensboro has a long and rich history. During the Civil War, the city was the site of the Battle of Greensboro, which was fought between the Confederate and Union forces. The city was also the site of the Greensboro sit-ins, which were a series of peaceful protests against racial segregation in the 1960s.
Geography
Greensboro is located in the Piedmont region of North Carolina, and is situated at the intersection of two major interstate highways, I-85 and I-40. The city is located in the center of the state, approximately 90 miles west of Raleigh and 90 miles east of Charlotte.
The city has a total area of 131.2 square miles, of which 130.2 square miles is land and 1.0 square mile is water. The city is located in the Piedmont region of North Carolina, and is situated at the intersection of two major interstate highways, I-85 and I-40.
Economy
Greensboro is a major economic center in the state of North Carolina. The city is home to several major corporations, including Volvo Trucks, Honda Aircraft Company, and Volvo Financial Services. The city is also home to several universities, including the University of North Carolina at Greensboro, North Carolina A&T State University, and Guilford College.
Greensboro is also home to several major industries, including manufacturing, healthcare, and education. The city is home to several major employers, including Volvo Trucks, Honda Aircraft Company, and Volvo Financial Services.
Demographics
As of the 2010 census, the population of Greensboro was 269,666. The city has a population density of 2,039 people per square mile. The racial makeup of the city is 57.2% White, 33.3% African American, 0.3% Native American, 3.2% Asian, 0.1% Pacific Islander, 3.7% from other races, and 1.4% from two or more races.
The median household income in Greensboro is $41,945, and the median family income is $50,945. The per capita income in Greensboro is $25,945. The city has a poverty rate of 22.3%.
Conclusion
Greensboro is a city located in the state of North Carolina, United States. It is the third-largest city in the state and the county seat of Guilford County. The city is situated in the Piedmont region of North Carolina, and is located at the intersection of two major interstate highways, I-85 and I-40. Greensboro has a long and rich history, and is a major economic center in the state of North Carolina. The city has a population of 269,666, and the median household income is $41,945.
Common Questions
What is Per Capita Income in Greensboro?
Per Capita income in Greensboro is $34,209.
What is the Median Family Income in Greensboro?
Median Family Income in Greensboro is $71,934.
What is the Median Household income in Greensboro?
Median Household Income in Greensboro is $55,051.
What is Income or Wage Gap in Greensboro?
Income or Wage Gap in Greensboro is 21.8%.
Women in Greensboro earn 78.2 cents for every dollar earned by a man.
What is Family Income Deficit in Greensboro?
Family Income Deficit in Greensboro is $11,307.
Families that are below poverty line in Greensboro earn $11,307 less on average than the poverty threshold level.
What is Inequality or Gini Index in Greensboro?
Inequality or Gini Index in Greensboro is 0.50.
What is the Total Population of Greensboro?
Total Population of Greensboro is 297,202.
What is the Total Male Population of Greensboro?
Total Male Population of Greensboro is 137,750.
What is the Total Female Population of Greensboro?
Total Female Population of Greensboro is 159,452.
What is the Ratio of Males per 100 Females in Greensboro?
There are 86.39 Males per 100 Females in Greensboro.
What is the Ratio of Females per 100 Males in Greensboro?
There are 115.75 Females per 100 Males in Greensboro.
What is the Median Population Age in Greensboro?
Median Population Age in Greensboro is 34.0 Years.
What is the Average Family Size in Greensboro
Average Family Size in Greensboro is 3.1 People.
What is the Average Household Size in Greensboro
Average Household Size in Greensboro is 2.3 People.
How Large is the Labor Force in Greensboro?
There are 155,682 People in the Labor Forcein in Greensboro.
What is the Percentage of People in the Labor Force in Greensboro?
65.3% of People are in the Labor Force in Greensboro.
What is the Unemployment Rate in Greensboro?
Unemployment Rate in Greensboro is 5.5%.