Newark, NJ Map & Demographics
Newark Map
Newark Overview
$24,716
PER CAPITA INCOME
$56,099
AVG FAMILY INCOME
$46,460
AVG HOUSEHOLD INCOME
26.9%
WAGE / INCOME GAP [ % ]
73.1¢/ $1
WAGE / INCOME GAP [ $ ]
$12,135
FAMILY INCOME DEFICIT
0.49
INEQUALITY / GINI INDEX
307,355
TOTAL POPULATION
152,326
MALE POPULATION
155,029
FEMALE POPULATION
98.26
MALES / 100 FEMALES
101.77
FEMALES / 100 MALES
34.7
MEDIAN AGE
3.4
AVG FAMILY SIZE
2.6
AVG HOUSEHOLD SIZE
149,929
LABOR FORCE [ PEOPLE ]
62.2%
PERCENT IN LABOR FORCE
10.7%
UNEMPLOYMENT RATE
Income in Newark
Income Overview in Newark
Per Capita Income in Newark is $24,716, while median incomes of families and households are $56,099 and $46,460 respectively.
| Characteristic | Number | Measure |
| Per Capita Income | 307,355 | $24,716 |
| Median Family Income | 68,097 | $56,099 |
| Mean Family Income | 68,097 | $74,497 |
| Median Household Income | 112,635 | $46,460 |
| Mean Household Income | 112,635 | $64,251 |
| Income Deficit | 68,097 | $12,135 |
| Wage / Income Gap (%) | 307,355 | 26.87% |
| Wage / Income Gap ($) | 307,355 | 73.13¢ per $1 |
| Gini / Inequality Index | 307,355 | 0.49 |
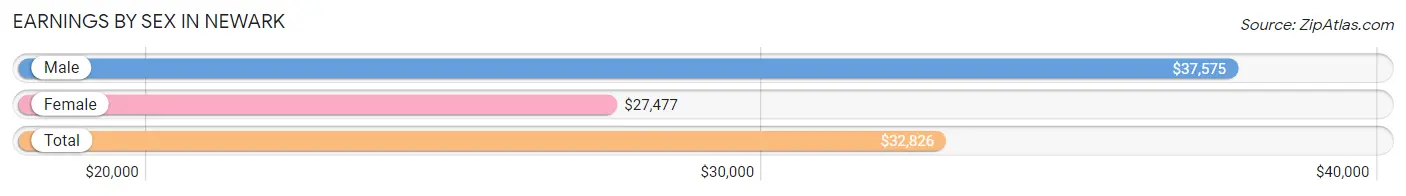
Earnings by Sex in Newark
Average Earnings in Newark are $32,826, $37,575 for men and $27,477 for women, a difference of 26.9%.
| Sex | Number | Average Earnings |
| Male | 76,460 (51.8%) | $37,575 |
| Female | 71,040 (48.2%) | $27,477 |
| Total | 147,500 (100.0%) | $32,826 |
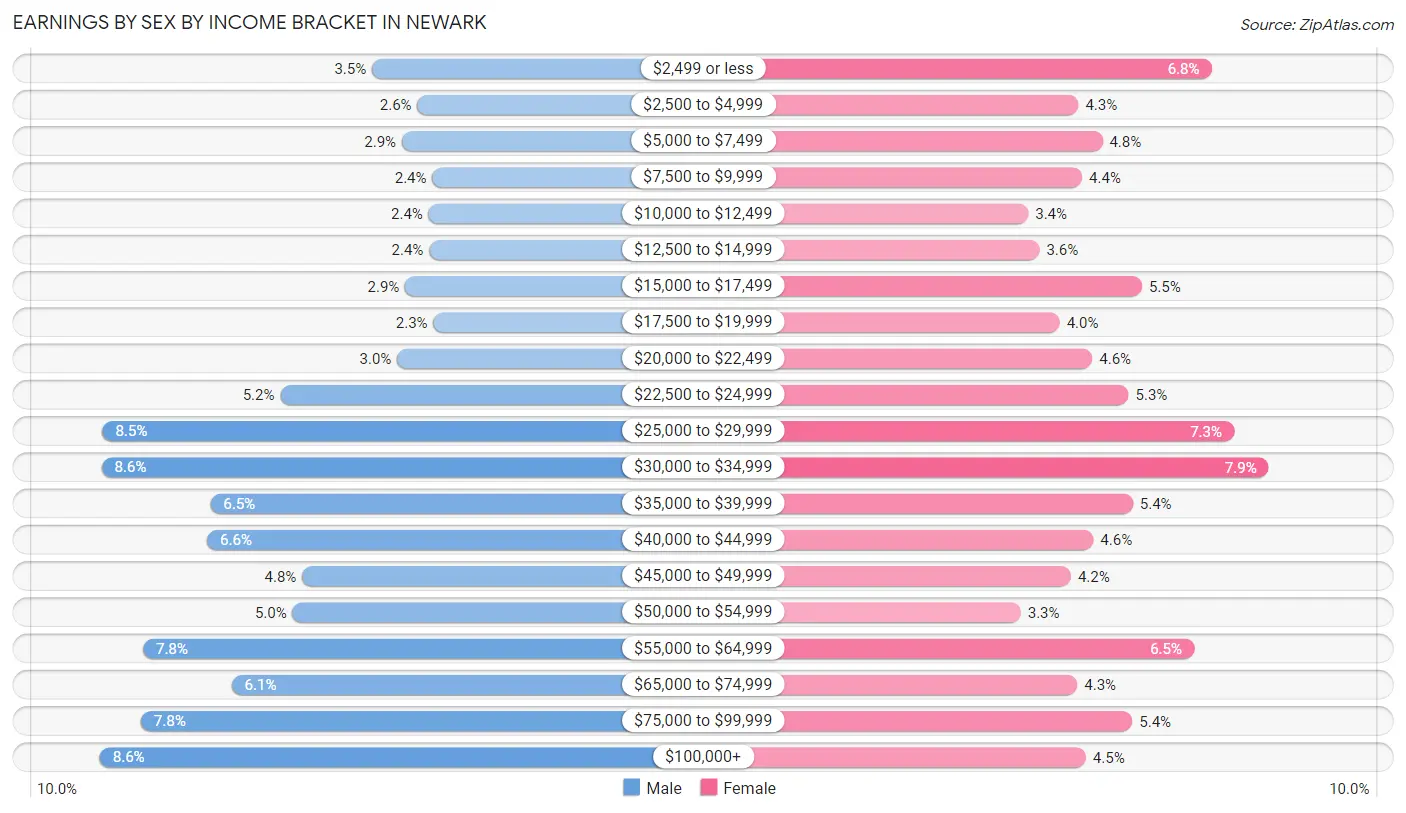
Earnings by Sex by Income Bracket in Newark
The most common earnings brackets in Newark are $100,000+ for men (6,569 | 8.6%) and $30,000 to $34,999 for women (5,611 | 7.9%).
| Income | Male | Female |
| $2,499 or less | 2,669 (3.5%) | 4,850 (6.8%) |
| $2,500 to $4,999 | 2,021 (2.6%) | 3,083 (4.3%) |
| $5,000 to $7,499 | 2,237 (2.9%) | 3,400 (4.8%) |
| $7,500 to $9,999 | 1,806 (2.4%) | 3,135 (4.4%) |
| $10,000 to $12,499 | 1,861 (2.4%) | 2,416 (3.4%) |
| $12,500 to $14,999 | 1,848 (2.4%) | 2,562 (3.6%) |
| $15,000 to $17,499 | 2,197 (2.9%) | 3,925 (5.5%) |
| $17,500 to $19,999 | 1,787 (2.3%) | 2,836 (4.0%) |
| $20,000 to $22,499 | 2,312 (3.0%) | 3,265 (4.6%) |
| $22,500 to $24,999 | 3,987 (5.2%) | 3,751 (5.3%) |
| $25,000 to $29,999 | 6,526 (8.5%) | 5,152 (7.2%) |
| $30,000 to $34,999 | 6,545 (8.6%) | 5,611 (7.9%) |
| $35,000 to $39,999 | 4,988 (6.5%) | 3,811 (5.4%) |
| $40,000 to $44,999 | 5,030 (6.6%) | 3,279 (4.6%) |
| $45,000 to $49,999 | 3,671 (4.8%) | 2,983 (4.2%) |
| $50,000 to $54,999 | 3,805 (5.0%) | 2,313 (3.3%) |
| $55,000 to $64,999 | 5,948 (7.8%) | 4,621 (6.5%) |
| $65,000 to $74,999 | 4,676 (6.1%) | 3,067 (4.3%) |
| $75,000 to $99,999 | 5,977 (7.8%) | 3,799 (5.3%) |
| $100,000+ | 6,569 (8.6%) | 3,181 (4.5%) |
| Total | 76,460 (100.0%) | 71,040 (100.0%) |
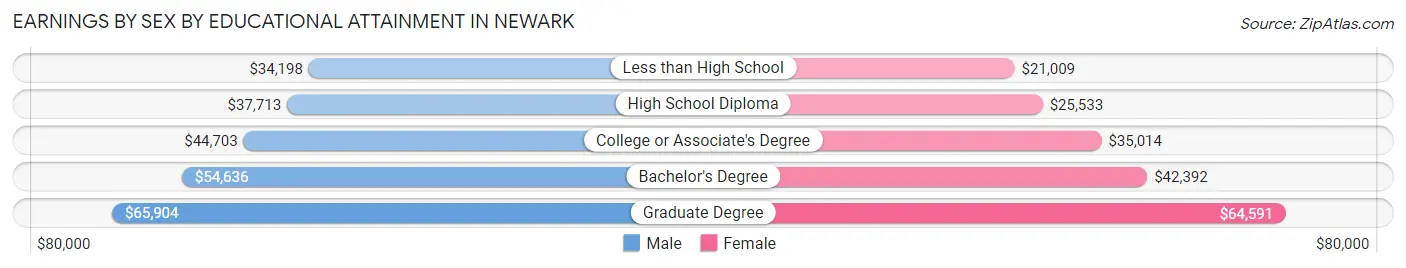
Earnings by Sex by Educational Attainment in Newark
Average earnings in Newark are $40,988 for men and $30,802 for women, a difference of 24.8%. Men with an educational attainment of graduate degree enjoy the highest average annual earnings of $65,904, while those with less than high school education earn the least with $34,198. Women with an educational attainment of graduate degree earn the most with the average annual earnings of $64,591, while those with less than high school education have the smallest earnings of $21,009.
| Educational Attainment | Male Income | Female Income |
| Less than High School | $34,198 | $21,009 |
| High School Diploma | $37,713 | $25,533 |
| College or Associate's Degree | $44,703 | $35,014 |
| Bachelor's Degree | $54,636 | $42,392 |
| Graduate Degree | $65,904 | $64,591 |
| Total | $40,988 | $30,802 |
Family Income in Newark
Family Income Brackets in Newark
According to the Newark family income data, there are 12,734 families falling into the $50,000 to $74,999 income range, which is the most common income bracket and makes up 18.7% of all families. Conversely, the $200,000+ income bracket is the least frequent group with only 2,860 families (4.2%) belonging to this category.
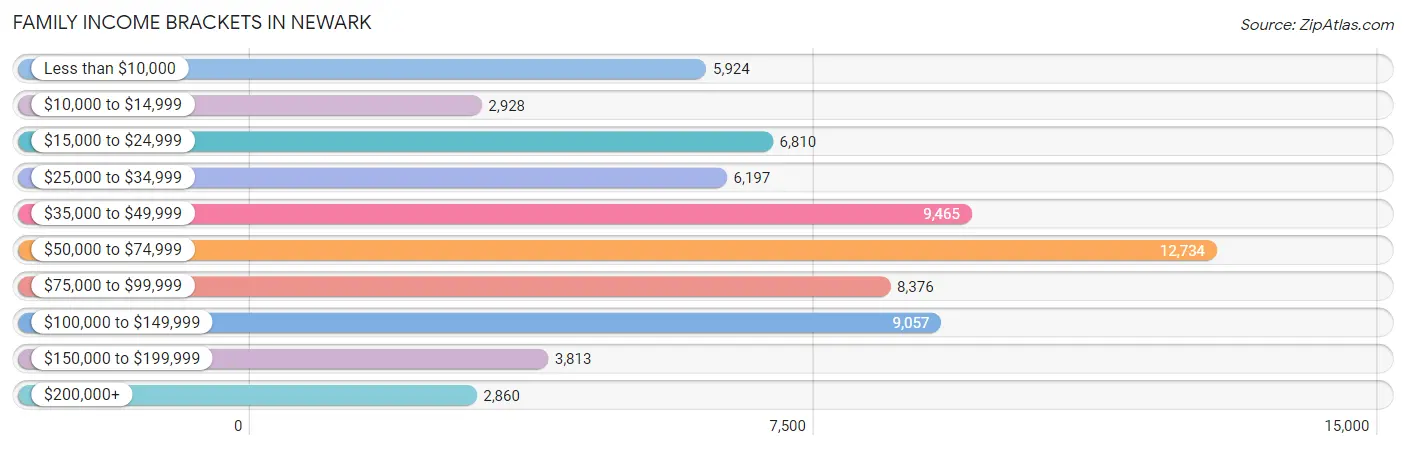
| Income Bracket | # Families | % Families |
| Less than $10,000 | 5,924 | 8.7% |
| $10,000 to $14,999 | 2,928 | 4.3% |
| $15,000 to $24,999 | 6,810 | 10.0% |
| $25,000 to $34,999 | 6,197 | 9.1% |
| $35,000 to $49,999 | 9,465 | 13.9% |
| $50,000 to $74,999 | 12,734 | 18.7% |
| $75,000 to $99,999 | 8,376 | 12.3% |
| $100,000 to $149,999 | 9,057 | 13.3% |
| $150,000 to $199,999 | 3,813 | 5.6% |
| $200,000+ | 2,860 | 4.2% |
Family Income by Famaliy Size in Newark
7+ person families (1,520 | 2.2%) account for the highest median family income in Newark with $95,750 per family, while 2-person families (25,433 | 37.3%) have the highest median income of $22,962 per family member.
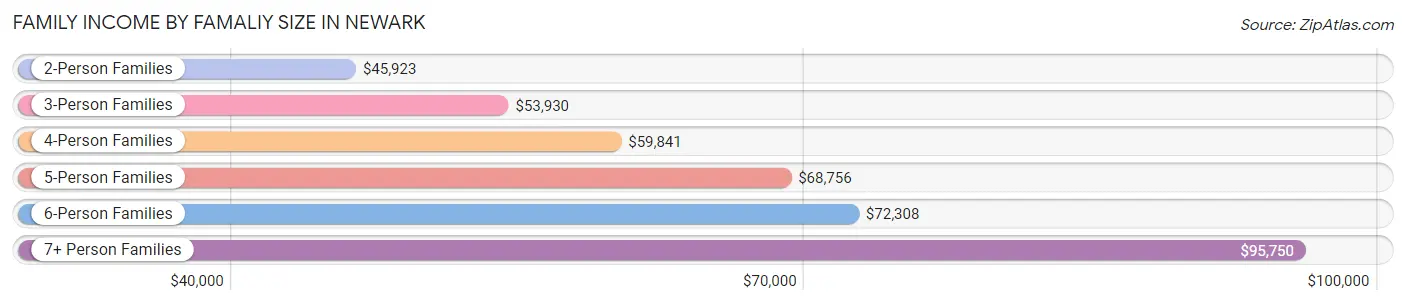
| Income Bracket | # Families | Median Income |
| 2-Person Families | 25,433 (37.3%) | $45,923 |
| 3-Person Families | 18,986 (27.9%) | $53,930 |
| 4-Person Families | 13,296 (19.5%) | $59,841 |
| 5-Person Families | 6,521 (9.6%) | $68,756 |
| 6-Person Families | 2,341 (3.4%) | $72,308 |
| 7+ Person Families | 1,520 (2.2%) | $95,750 |
| Total | 68,097 (100.0%) | $56,099 |
Family Income by Number of Earners in Newark
The median family income in Newark is $56,099, with families comprising 3+ earners (8,569) having the highest median family income of $114,232, while families with no earners (9,465) have the lowest median family income of $14,473, accounting for 12.6% and 13.9% of families, respectively.
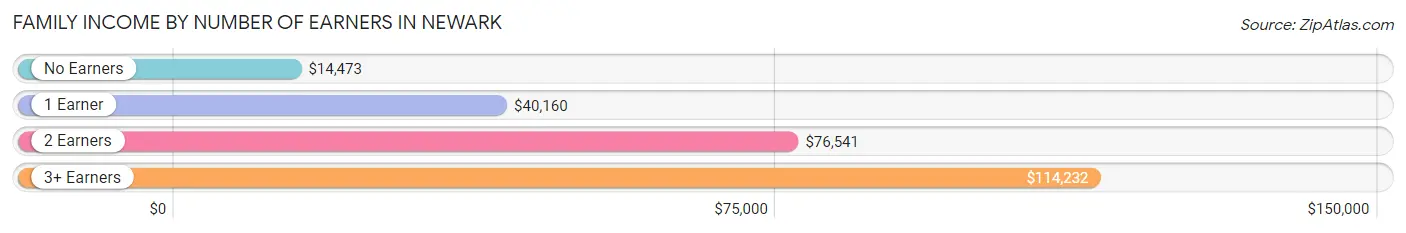
| Number of Earners | # Families | Median Income |
| No Earners | 9,465 (13.9%) | $14,473 |
| 1 Earner | 27,720 (40.7%) | $40,160 |
| 2 Earners | 22,343 (32.8%) | $76,541 |
| 3+ Earners | 8,569 (12.6%) | $114,232 |
| Total | 68,097 (100.0%) | $56,099 |
Household Income in Newark
Household Income Brackets in Newark
With 19,711 households falling in the category, the $50,000 to $74,999 income range is the most frequent in Newark, accounting for 17.5% of all households. In contrast, only 3,717 households (3.3%) fall into the $200,000+ income bracket, making it the least populous group.
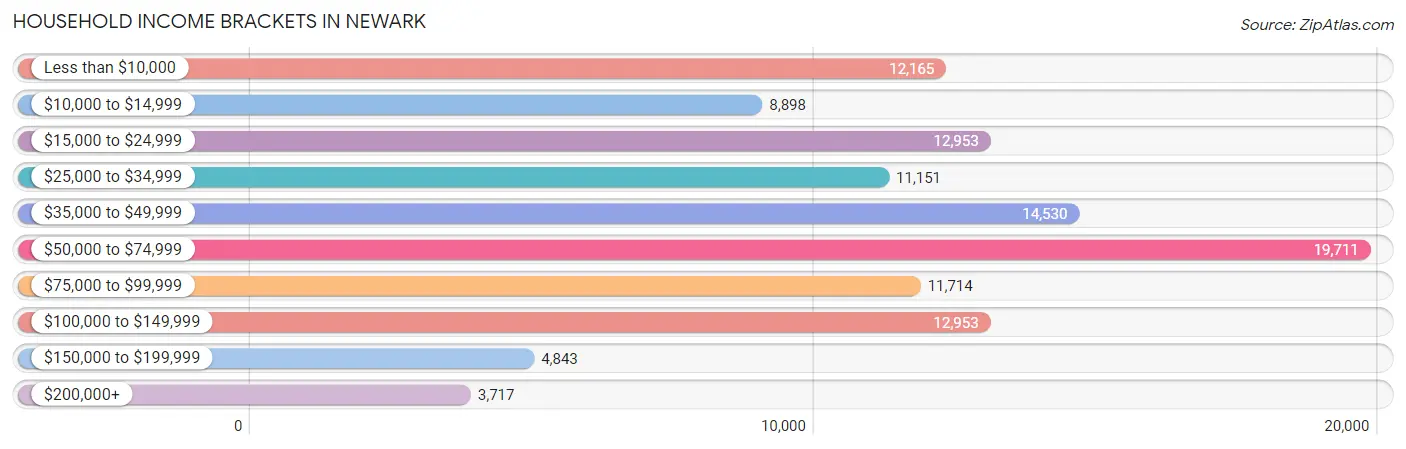
| Income Bracket | # Households | % Households |
| Less than $10,000 | 12,165 | 10.8% |
| $10,000 to $14,999 | 8,898 | 7.9% |
| $15,000 to $24,999 | 12,953 | 11.5% |
| $25,000 to $34,999 | 11,151 | 9.9% |
| $35,000 to $49,999 | 14,530 | 12.9% |
| $50,000 to $74,999 | 19,711 | 17.5% |
| $75,000 to $99,999 | 11,714 | 10.4% |
| $100,000 to $149,999 | 12,953 | 11.5% |
| $150,000 to $199,999 | 4,843 | 4.3% |
| $200,000+ | 3,717 | 3.3% |
Household Income by Householder Age in Newark
The median household income in Newark is $46,460, with the highest median household income of $50,793 found in the 45 to 64 years age bracket for the primary householder. A total of 44,163 households (39.2%) fall into this category. Meanwhile, the 65+ years age bracket for the primary householder has the lowest median household income of $29,657, with 21,773 households (19.3%) in this group.
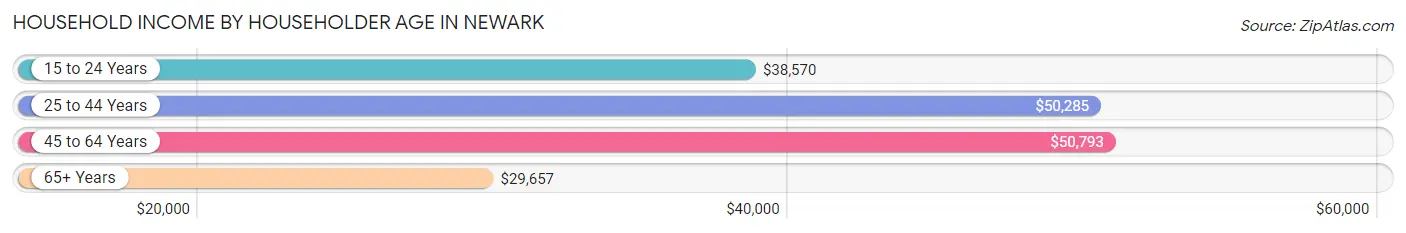
| Income Bracket | # Households | Median Income |
| 15 to 24 Years | 3,537 (3.1%) | $38,570 |
| 25 to 44 Years | 43,162 (38.3%) | $50,285 |
| 45 to 64 Years | 44,163 (39.2%) | $50,793 |
| 65+ Years | 21,773 (19.3%) | $29,657 |
| Total | 112,635 (100.0%) | $46,460 |
Poverty in Newark
Income Below Poverty by Sex and Age in Newark
With 21.7% poverty level for males and 27.0% for females among the residents of Newark, 5 year old males and 12 to 14 year old females are the most vulnerable to poverty, with 1,196 males (51.1%) and 2,468 females (37.4%) in their respective age groups living below the poverty level.
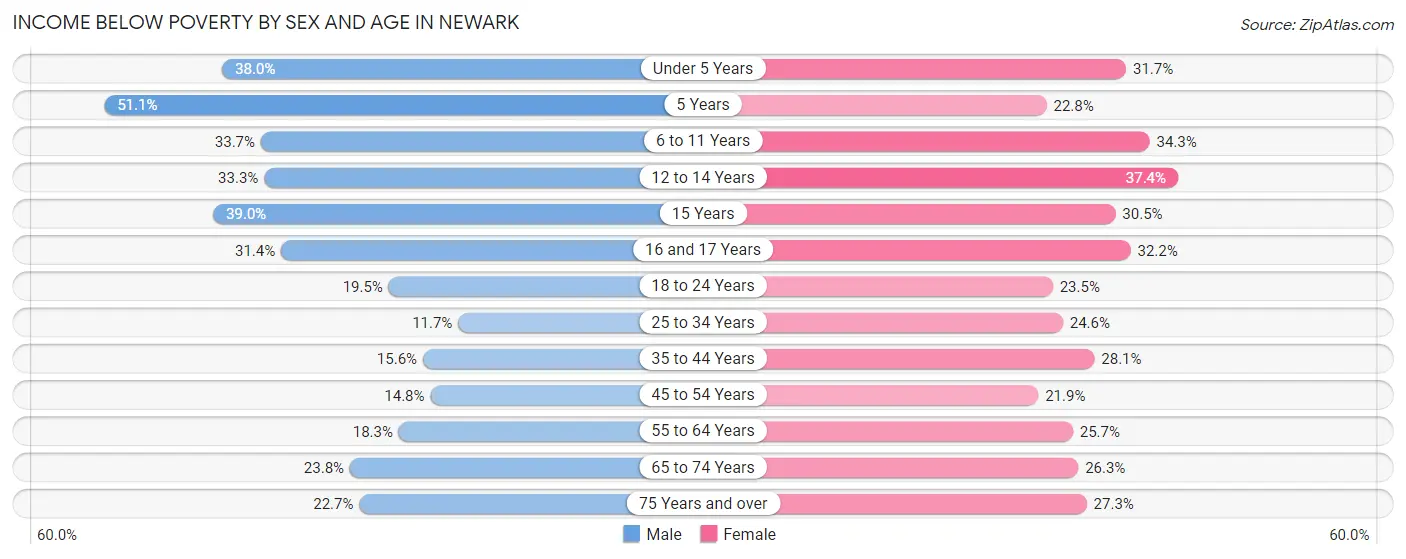
| Age Bracket | Male | Female |
| Under 5 Years | 3,931 (38.0%) | 3,111 (31.7%) |
| 5 Years | 1,196 (51.1%) | 448 (22.8%) |
| 6 to 11 Years | 4,290 (33.7%) | 3,782 (34.3%) |
| 12 to 14 Years | 2,217 (33.3%) | 2,468 (37.4%) |
| 15 Years | 956 (39.0%) | 437 (30.5%) |
| 16 and 17 Years | 1,166 (31.4%) | 1,256 (32.2%) |
| 18 to 24 Years | 2,783 (19.5%) | 3,441 (23.5%) |
| 25 to 34 Years | 2,603 (11.7%) | 5,753 (24.6%) |
| 35 to 44 Years | 3,244 (15.6%) | 6,060 (28.1%) |
| 45 to 54 Years | 2,767 (14.8%) | 4,436 (21.9%) |
| 55 to 64 Years | 2,908 (18.3%) | 4,652 (25.7%) |
| 65 to 74 Years | 2,132 (23.8%) | 2,868 (26.3%) |
| 75 Years and over | 1,004 (22.7%) | 2,296 (27.3%) |
| Total | 31,197 (21.7%) | 41,008 (27.0%) |
Income Above Poverty by Sex and Age in Newark
According to the poverty statistics in Newark, males aged 25 to 34 years and females aged 45 to 54 years are the age groups that are most secure financially, with 88.3% of males and 78.1% of females in these age groups living above the poverty line.
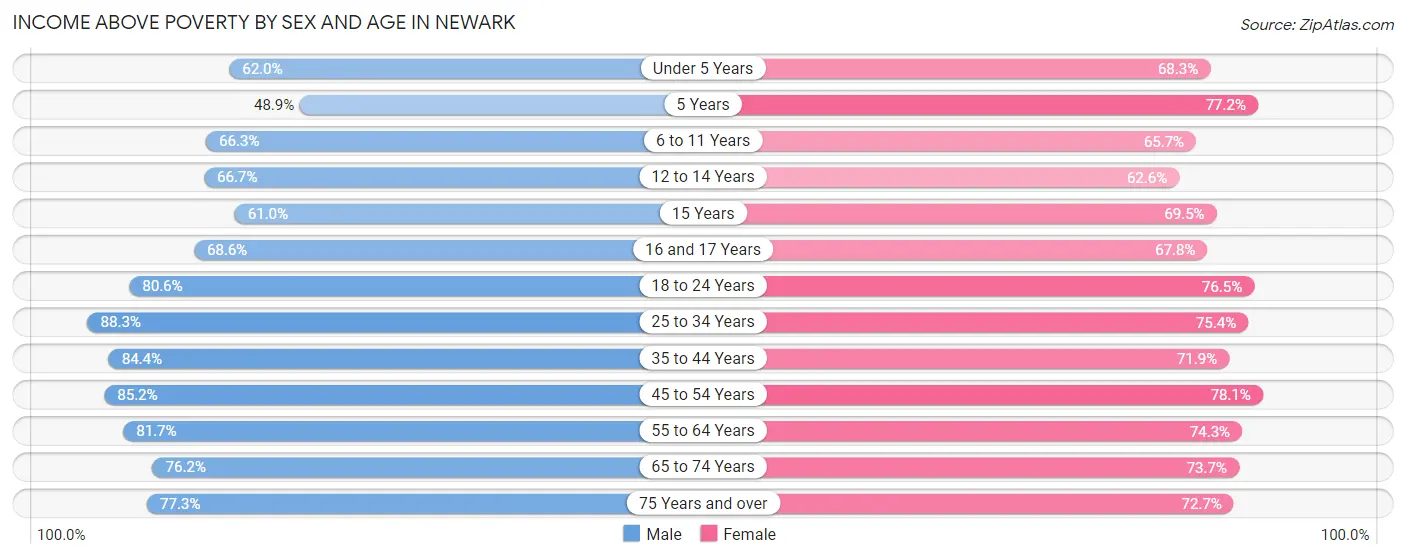
| Age Bracket | Male | Female |
| Under 5 Years | 6,413 (62.0%) | 6,716 (68.3%) |
| 5 Years | 1,143 (48.9%) | 1,517 (77.2%) |
| 6 to 11 Years | 8,442 (66.3%) | 7,255 (65.7%) |
| 12 to 14 Years | 4,436 (66.7%) | 4,128 (62.6%) |
| 15 Years | 1,494 (61.0%) | 997 (69.5%) |
| 16 and 17 Years | 2,543 (68.6%) | 2,650 (67.8%) |
| 18 to 24 Years | 11,526 (80.5%) | 11,210 (76.5%) |
| 25 to 34 Years | 19,631 (88.3%) | 17,620 (75.4%) |
| 35 to 44 Years | 17,497 (84.4%) | 15,483 (71.9%) |
| 45 to 54 Years | 15,912 (85.2%) | 15,840 (78.1%) |
| 55 to 64 Years | 12,955 (81.7%) | 13,428 (74.3%) |
| 65 to 74 Years | 6,838 (76.2%) | 8,025 (73.7%) |
| 75 Years and over | 3,414 (77.3%) | 6,124 (72.7%) |
| Total | 112,244 (78.2%) | 110,993 (73.0%) |
Income Below Poverty Among Married-Couple Families in Newark
The poverty statistics for married-couple families in Newark show that 10.6% or 3,374 of the total 31,700 families live below the poverty line. Families with 5 or more children have the highest poverty rate of 48.6%, comprising of 102 families. On the other hand, families with no children have the lowest poverty rate of 7.5%, which includes 1,217 families.
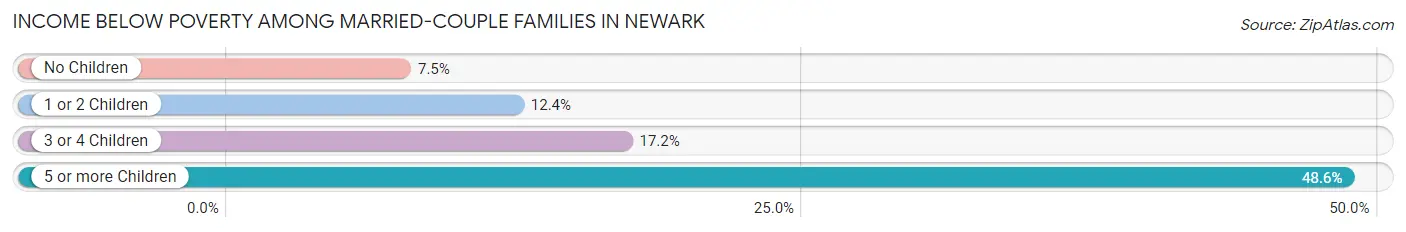
| Children | Above Poverty | Below Poverty |
| No Children | 14,952 (92.5%) | 1,217 (7.5%) |
| 1 or 2 Children | 10,666 (87.6%) | 1,516 (12.4%) |
| 3 or 4 Children | 2,600 (82.8%) | 539 (17.2%) |
| 5 or more Children | 108 (51.4%) | 102 (48.6%) |
| Total | 28,326 (89.4%) | 3,374 (10.6%) |
Income Below Poverty Among Single-Parent Households in Newark
According to the poverty data in Newark, 16.5% or 1,556 single-father households and 35.8% or 9,649 single-mother households are living below the poverty line. Among single-father households, those with 5 or more children have the highest poverty rate, with 34 households (47.2%) experiencing poverty. Likewise, among single-mother households, those with 5 or more children have the highest poverty rate, with 260 households (97.7%) falling below the poverty line.
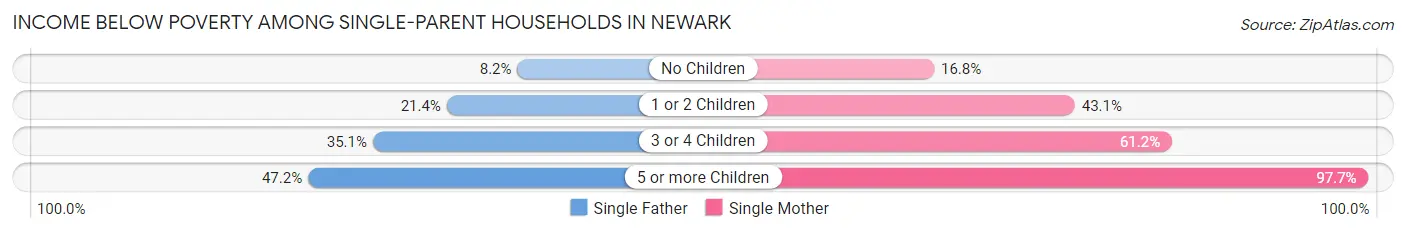
| Children | Single Father | Single Mother |
| No Children | 378 (8.2%) | 1,702 (16.8%) |
| 1 or 2 Children | 813 (21.4%) | 5,877 (43.0%) |
| 3 or 4 Children | 331 (35.1%) | 1,810 (61.2%) |
| 5 or more Children | 34 (47.2%) | 260 (97.7%) |
| Total | 1,556 (16.5%) | 9,649 (35.8%) |
Income Below Poverty Among Married-Couple vs Single-Parent Households in Newark
The poverty data for Newark shows that 3,374 of the married-couple family households (10.6%) and 11,205 of the single-parent households (30.8%) are living below the poverty level. Within the married-couple family households, those with 5 or more children have the highest poverty rate, with 102 households (48.6%) falling below the poverty line. Among the single-parent households, those with 5 or more children have the highest poverty rate, with 294 household (87.0%) living below poverty.
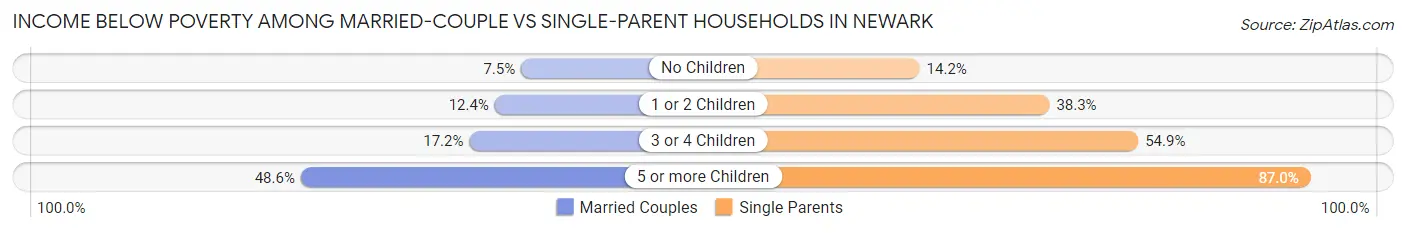
| Children | Married-Couple Families | Single-Parent Households |
| No Children | 1,217 (7.5%) | 2,080 (14.1%) |
| 1 or 2 Children | 1,516 (12.4%) | 6,690 (38.3%) |
| 3 or 4 Children | 539 (17.2%) | 2,141 (54.9%) |
| 5 or more Children | 102 (48.6%) | 294 (87.0%) |
| Total | 3,374 (10.6%) | 11,205 (30.8%) |
Race in Newark
The most populous races in Newark are Black / African American (144,557 | 47.0%), Hispanic or Latino (114,434 | 37.2%), and Some other Race (60,787 | 19.8%).
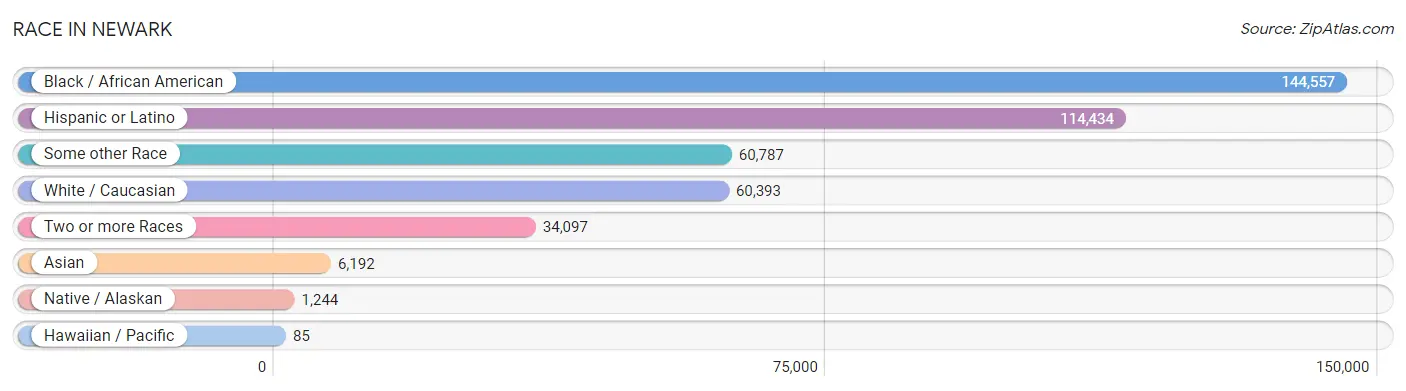
| Race | # Population | % Population |
| Asian | 6,192 | 2.0% |
| Black / African American | 144,557 | 47.0% |
| Hawaiian / Pacific | 85 | 0.0% |
| Hispanic or Latino | 114,434 | 37.2% |
| Native / Alaskan | 1,244 | 0.4% |
| White / Caucasian | 60,393 | 19.7% |
| Two or more Races | 34,097 | 11.1% |
| Some other Race | 60,787 | 19.8% |
| Total | 307,355 | 100.0% |
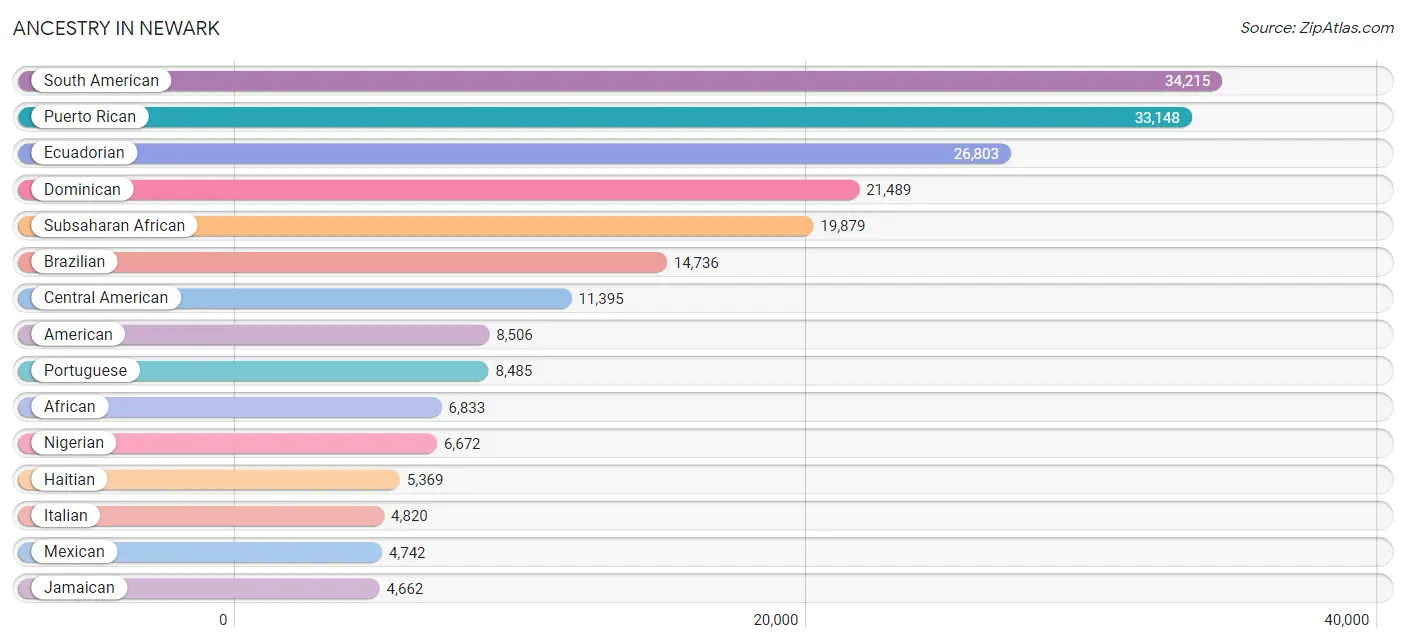
Ancestry in Newark
The most populous ancestries reported in Newark are South American (34,215 | 11.1%), Puerto Rican (33,148 | 10.8%), Ecuadorian (26,803 | 8.7%), Dominican (21,489 | 7.0%), and Subsaharan African (19,879 | 6.5%), together accounting for 44.1% of all Newark residents.
| Ancestry | # Population | % Population |
| Afghan | 16 | 0.0% |
| African | 6,833 | 2.2% |
| Alaska Native | 25 | 0.0% |
| Albanian | 56 | 0.0% |
| American | 8,506 | 2.8% |
| Apache | 25 | 0.0% |
| Arab | 996 | 0.3% |
| Argentinean | 314 | 0.1% |
| Armenian | 147 | 0.1% |
| Austrian | 106 | 0.0% |
| Bahamian | 22 | 0.0% |
| Barbadian | 179 | 0.1% |
| Belizean | 51 | 0.0% |
| Bhutanese | 90 | 0.0% |
| Blackfeet | 31 | 0.0% |
| Bolivian | 23 | 0.0% |
| Brazilian | 14,736 | 4.8% |
| British | 101 | 0.0% |
| British West Indian | 641 | 0.2% |
| Burmese | 697 | 0.2% |
| Canadian | 79 | 0.0% |
| Cape Verdean | 137 | 0.0% |
| Central American | 11,395 | 3.7% |
| Central American Indian | 559 | 0.2% |
| Cherokee | 136 | 0.0% |
| Chilean | 568 | 0.2% |
| Choctaw | 90 | 0.0% |
| Colombian | 1,681 | 0.5% |
| Costa Rican | 377 | 0.1% |
| Creek | 39 | 0.0% |
| Croatian | 12 | 0.0% |
| Cuban | 1,710 | 0.6% |
| Czech | 8 | 0.0% |
| Danish | 93 | 0.0% |
| Dominican | 21,489 | 7.0% |
| Dutch | 214 | 0.1% |
| Dutch West Indian | 106 | 0.0% |
| Eastern European | 142 | 0.1% |
| Ecuadorian | 26,803 | 8.7% |
| Egyptian | 208 | 0.1% |
| English | 859 | 0.3% |
| Ethiopian | 141 | 0.1% |
| European | 1,249 | 0.4% |
| Fijian | 68 | 0.0% |
| Finnish | 9 | 0.0% |
| French | 288 | 0.1% |
| French Canadian | 112 | 0.0% |
| German | 1,920 | 0.6% |
| German Russian | 322 | 0.1% |
| Ghanaian | 2,374 | 0.8% |
| Greek | 220 | 0.1% |
| Guatemalan | 4,184 | 1.4% |
| Guyanese | 2,572 | 0.8% |
| Haitian | 5,369 | 1.8% |
| Hmong | 5 | 0.0% |
| Honduran | 2,419 | 0.8% |
| Hungarian | 112 | 0.0% |
| Indian (Asian) | 1,116 | 0.4% |
| Iranian | 134 | 0.0% |
| Iraqi | 53 | 0.0% |
| Irish | 2,222 | 0.7% |
| Israeli | 18 | 0.0% |
| Italian | 4,820 | 1.6% |
| Jamaican | 4,662 | 1.5% |
| Japanese | 17 | 0.0% |
| Jordanian | 46 | 0.0% |
| Kenyan | 389 | 0.1% |
| Korean | 810 | 0.3% |
| Laotian | 24 | 0.0% |
| Latvian | 62 | 0.0% |
| Lebanese | 190 | 0.1% |
| Liberian | 920 | 0.3% |
| Lithuanian | 22 | 0.0% |
| Macedonian | 5 | 0.0% |
| Mexican | 4,742 | 1.5% |
| Mexican American Indian | 243 | 0.1% |
| Mongolian | 25 | 0.0% |
| Moroccan | 202 | 0.1% |
| Native Hawaiian | 68 | 0.0% |
| Navajo | 181 | 0.1% |
| New Zealander | 15 | 0.0% |
| Nicaraguan | 237 | 0.1% |
| Nigerian | 6,672 | 2.2% |
| Norwegian | 152 | 0.1% |
| Pakistani | 61 | 0.0% |
| Palestinian | 120 | 0.0% |
| Panamanian | 317 | 0.1% |
| Peruvian | 3,068 | 1.0% |
| Polish | 1,123 | 0.4% |
| Portuguese | 8,485 | 2.8% |
| Puerto Rican | 33,148 | 10.8% |
| Romanian | 32 | 0.0% |
| Russian | 287 | 0.1% |
| Salvadoran | 3,839 | 1.3% |
| Scandinavian | 35 | 0.0% |
| Scotch-Irish | 33 | 0.0% |
| Scottish | 194 | 0.1% |
| Senegalese | 455 | 0.2% |
| Serbian | 6 | 0.0% |
| Sierra Leonean | 31 | 0.0% |
| Slovak | 29 | 0.0% |
| South African | 12 | 0.0% |
| South American | 34,215 | 11.1% |
| South American Indian | 12 | 0.0% |
| Soviet Union | 12 | 0.0% |
| Spaniard | 1,753 | 0.6% |
| Spanish | 673 | 0.2% |
| Sri Lankan | 174 | 0.1% |
| Subsaharan African | 19,879 | 6.5% |
| Sudanese | 51 | 0.0% |
| Swedish | 102 | 0.0% |
| Syrian | 10 | 0.0% |
| Thai | 2,271 | 0.7% |
| Tongan | 7 | 0.0% |
| Trinidadian and Tobagonian | 1,378 | 0.4% |
| Turkish | 91 | 0.0% |
| Ugandan | 157 | 0.1% |
| Ukrainian | 176 | 0.1% |
| Uruguayan | 622 | 0.2% |
| Venezuelan | 789 | 0.3% |
| Vietnamese | 662 | 0.2% |
| Welsh | 62 | 0.0% |
| West Indian | 758 | 0.3% |
| Yugoslavian | 35 | 0.0% | View All 124 Rows |
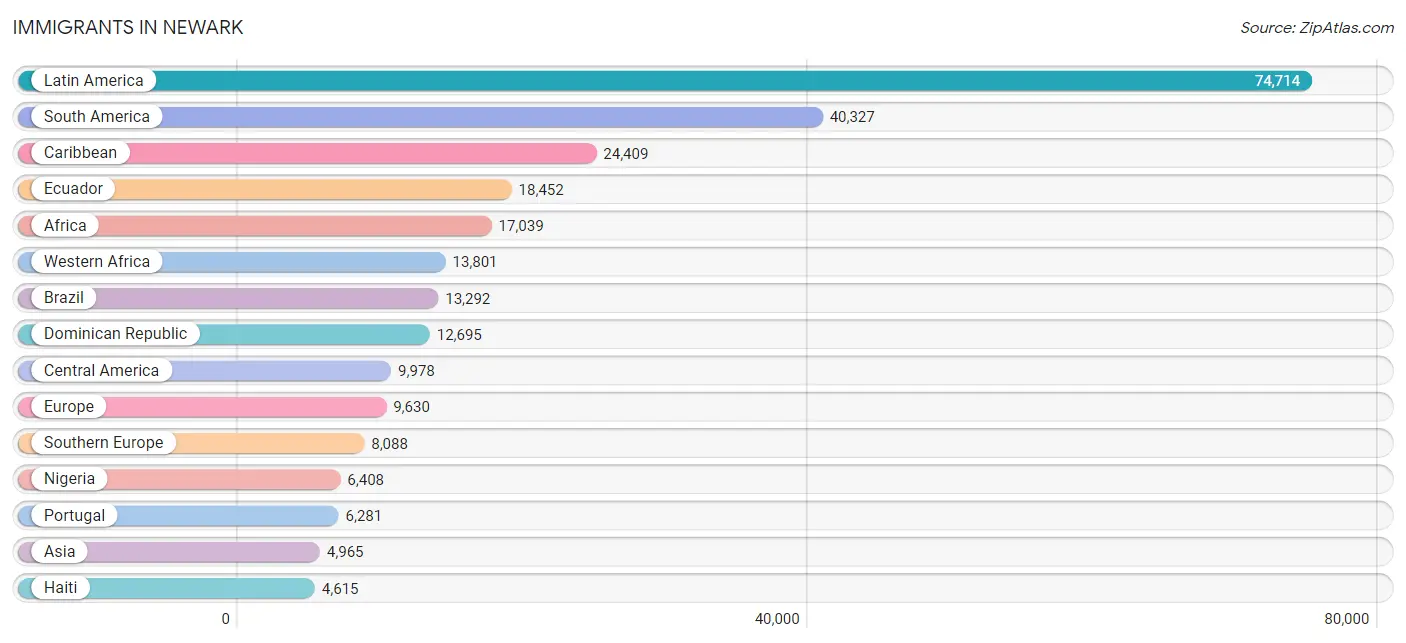
Immigrants in Newark
The most numerous immigrant groups reported in Newark came from Latin America (74,714 | 24.3%), South America (40,327 | 13.1%), Caribbean (24,409 | 7.9%), Ecuador (18,452 | 6.0%), and Africa (17,039 | 5.5%), together accounting for 56.9% of all Newark residents.
| Immigration Origin | # Population | % Population |
| Afghanistan | 10 | 0.0% |
| Africa | 17,039 | 5.5% |
| Albania | 46 | 0.0% |
| Argentina | 141 | 0.1% |
| Asia | 4,965 | 1.6% |
| Australia | 5 | 0.0% |
| Azores | 102 | 0.0% |
| Bahamas | 22 | 0.0% |
| Bangladesh | 529 | 0.2% |
| Barbados | 183 | 0.1% |
| Belarus | 30 | 0.0% |
| Belgium | 49 | 0.0% |
| Belize | 90 | 0.0% |
| Bolivia | 23 | 0.0% |
| Bosnia and Herzegovina | 4 | 0.0% |
| Brazil | 13,292 | 4.3% |
| Cabo Verde | 58 | 0.0% |
| Cambodia | 20 | 0.0% |
| Cameroon | 138 | 0.0% |
| Canada | 246 | 0.1% |
| Caribbean | 24,409 | 7.9% |
| Central America | 9,978 | 3.3% |
| Chile | 390 | 0.1% |
| China | 535 | 0.2% |
| Colombia | 1,217 | 0.4% |
| Congo | 141 | 0.1% |
| Costa Rica | 349 | 0.1% |
| Croatia | 2 | 0.0% |
| Cuba | 948 | 0.3% |
| Denmark | 16 | 0.0% |
| Dominica | 187 | 0.1% |
| Dominican Republic | 12,695 | 4.1% |
| Eastern Africa | 850 | 0.3% |
| Eastern Asia | 1,097 | 0.4% |
| Eastern Europe | 822 | 0.3% |
| Ecuador | 18,452 | 6.0% |
| Egypt | 200 | 0.1% |
| El Salvador | 2,367 | 0.8% |
| England | 159 | 0.1% |
| Ethiopia | 16 | 0.0% |
| Europe | 9,630 | 3.1% |
| France | 59 | 0.0% |
| Germany | 75 | 0.0% |
| Ghana | 3,798 | 1.2% |
| Greece | 55 | 0.0% |
| Grenada | 224 | 0.1% |
| Guatemala | 3,033 | 1.0% |
| Guyana | 2,898 | 0.9% |
| Haiti | 4,615 | 1.5% |
| Honduras | 1,611 | 0.5% |
| Hong Kong | 25 | 0.0% |
| Hungary | 30 | 0.0% |
| India | 1,441 | 0.5% |
| Indonesia | 24 | 0.0% |
| Iran | 94 | 0.0% |
| Israel | 9 | 0.0% |
| Italy | 184 | 0.1% |
| Jamaica | 3,300 | 1.1% |
| Japan | 68 | 0.0% |
| Jordan | 122 | 0.0% |
| Kenya | 612 | 0.2% |
| Korea | 494 | 0.2% |
| Kuwait | 43 | 0.0% |
| Latin America | 74,714 | 24.3% |
| Latvia | 20 | 0.0% |
| Lebanon | 95 | 0.0% |
| Liberia | 1,136 | 0.4% |
| Malaysia | 13 | 0.0% |
| Mexico | 2,383 | 0.8% |
| Middle Africa | 518 | 0.2% |
| Morocco | 61 | 0.0% |
| Nepal | 2 | 0.0% |
| Netherlands | 36 | 0.0% |
| Nicaragua | 71 | 0.0% |
| Nigeria | 6,408 | 2.1% |
| Northern Africa | 299 | 0.1% |
| Northern Europe | 501 | 0.2% |
| Oceania | 20 | 0.0% |
| Pakistan | 438 | 0.1% |
| Panama | 74 | 0.0% |
| Peru | 2,560 | 0.8% |
| Philippines | 487 | 0.2% |
| Poland | 273 | 0.1% |
| Portugal | 6,281 | 2.0% |
| Romania | 56 | 0.0% |
| Russia | 103 | 0.0% |
| Scotland | 18 | 0.0% |
| Senegal | 394 | 0.1% |
| Serbia | 6 | 0.0% |
| Sierra Leone | 74 | 0.0% |
| Somalia | 11 | 0.0% |
| South Africa | 29 | 0.0% |
| South America | 40,327 | 13.1% |
| South Central Asia | 2,604 | 0.9% |
| South Eastern Asia | 628 | 0.2% |
| Southern Europe | 8,088 | 2.6% |
| Spain | 1,568 | 0.5% |
| Sri Lanka | 52 | 0.0% |
| St. Vincent and the Grenadines | 127 | 0.0% |
| Sudan | 32 | 0.0% |
| Sweden | 2 | 0.0% |
| Taiwan | 48 | 0.0% |
| Thailand | 34 | 0.0% |
| Trinidad and Tobago | 1,566 | 0.5% |
| Turkey | 36 | 0.0% |
| Uganda | 118 | 0.0% |
| Ukraine | 154 | 0.1% |
| Uruguay | 620 | 0.2% |
| Venezuela | 518 | 0.2% |
| Vietnam | 50 | 0.0% |
| Western Africa | 13,801 | 4.5% |
| Western Asia | 636 | 0.2% |
| Western Europe | 219 | 0.1% |
| Zaire | 12 | 0.0% | View All 114 Rows |
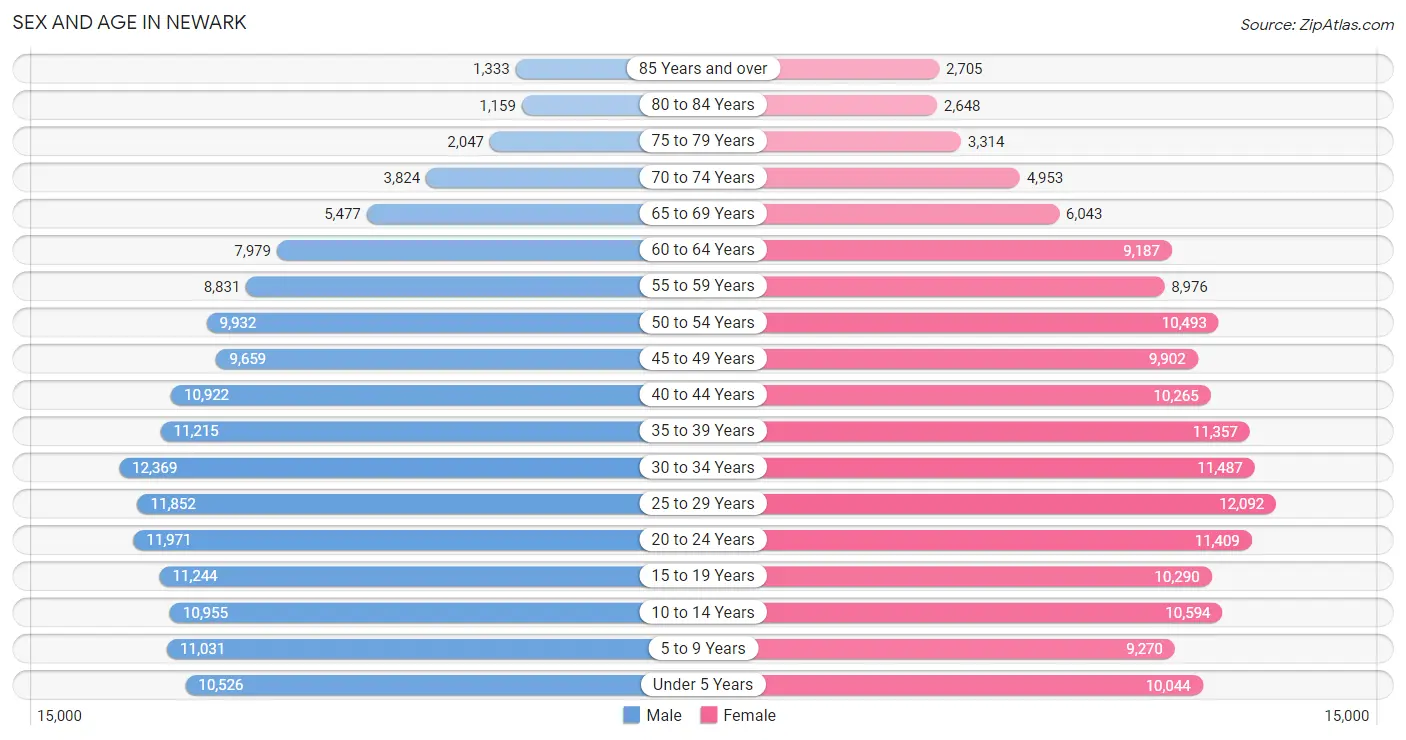
Sex and Age in Newark
Sex and Age in Newark
The most populous age groups in Newark are 30 to 34 Years (12,369 | 8.1%) for men and 25 to 29 Years (12,092 | 7.8%) for women.
| Age Bracket | Male | Female |
| Under 5 Years | 10,526 (6.9%) | 10,044 (6.5%) |
| 5 to 9 Years | 11,031 (7.2%) | 9,270 (6.0%) |
| 10 to 14 Years | 10,955 (7.2%) | 10,594 (6.8%) |
| 15 to 19 Years | 11,244 (7.4%) | 10,290 (6.6%) |
| 20 to 24 Years | 11,971 (7.9%) | 11,409 (7.4%) |
| 25 to 29 Years | 11,852 (7.8%) | 12,092 (7.8%) |
| 30 to 34 Years | 12,369 (8.1%) | 11,487 (7.4%) |
| 35 to 39 Years | 11,215 (7.4%) | 11,357 (7.3%) |
| 40 to 44 Years | 10,922 (7.2%) | 10,265 (6.6%) |
| 45 to 49 Years | 9,659 (6.3%) | 9,902 (6.4%) |
| 50 to 54 Years | 9,932 (6.5%) | 10,493 (6.8%) |
| 55 to 59 Years | 8,831 (5.8%) | 8,976 (5.8%) |
| 60 to 64 Years | 7,979 (5.2%) | 9,187 (5.9%) |
| 65 to 69 Years | 5,477 (3.6%) | 6,043 (3.9%) |
| 70 to 74 Years | 3,824 (2.5%) | 4,953 (3.2%) |
| 75 to 79 Years | 2,047 (1.3%) | 3,314 (2.1%) |
| 80 to 84 Years | 1,159 (0.8%) | 2,648 (1.7%) |
| 85 Years and over | 1,333 (0.9%) | 2,705 (1.7%) |
| Total | 152,326 (100.0%) | 155,029 (100.0%) |
Families and Households in Newark
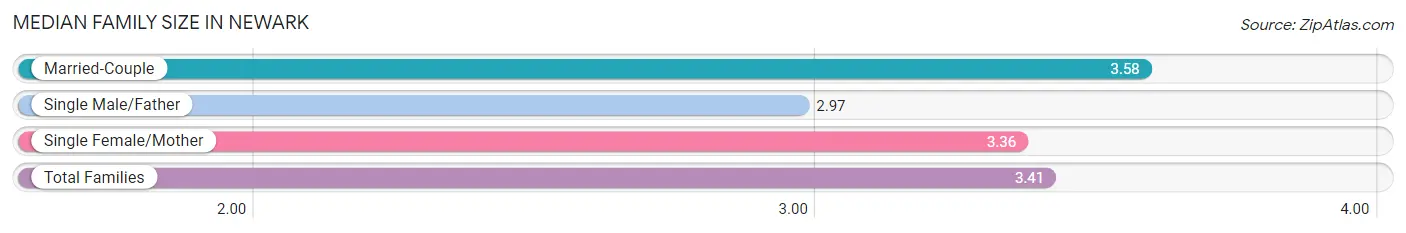
Median Family Size in Newark
The median family size in Newark is 3.41 persons per family, with married-couple families (31,700 | 46.6%) accounting for the largest median family size of 3.58 persons per family. On the other hand, single male/father families (9,413 | 13.8%) represent the smallest median family size with 2.97 persons per family.
| Family Type | # Families | Family Size |
| Married-Couple | 31,700 (46.6%) | 3.58 |
| Single Male/Father | 9,413 (13.8%) | 2.97 |
| Single Female/Mother | 26,984 (39.6%) | 3.36 |
| Total Families | 68,097 (100.0%) | 3.41 |
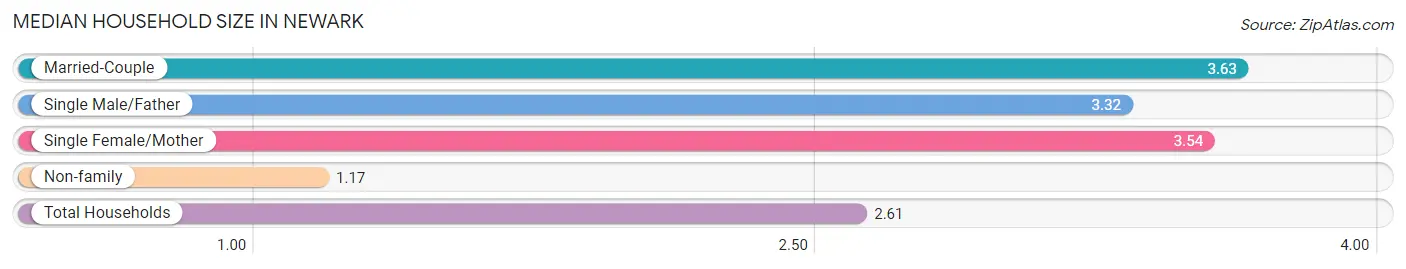
Median Household Size in Newark
The median household size in Newark is 2.61 persons per household, with married-couple households (31,700 | 28.1%) accounting for the largest median household size of 3.63 persons per household. non-family households (44,538 | 39.5%) represent the smallest median household size with 1.17 persons per household.
| Household Type | # Households | Household Size |
| Married-Couple | 31,700 (28.1%) | 3.63 |
| Single Male/Father | 9,413 (8.4%) | 3.32 |
| Single Female/Mother | 26,984 (24.0%) | 3.54 |
| Non-family | 44,538 (39.5%) | 1.17 |
| Total Households | 112,635 (100.0%) | 2.61 |
Household Size by Marriage Status in Newark
Out of a total of 112,635 households in Newark, 68,097 (60.5%) are family households, while 44,538 (39.5%) are nonfamily households. The most numerous type of family households are 2-person households, comprising 22,682, and the most common type of nonfamily households are 1-person households, comprising 38,811.
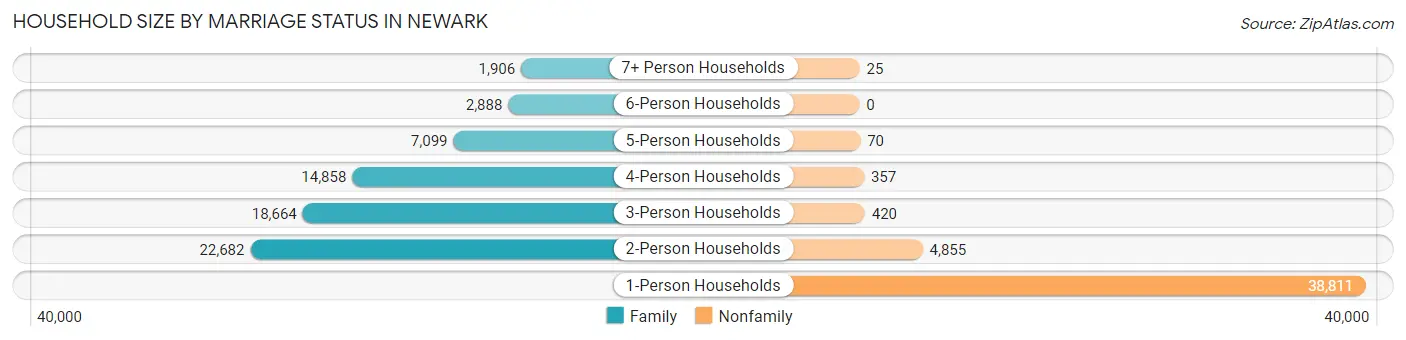
| Household Size | Family Households | Nonfamily Households |
| 1-Person Households | - | 38,811 (34.5%) |
| 2-Person Households | 22,682 (20.1%) | 4,855 (4.3%) |
| 3-Person Households | 18,664 (16.6%) | 420 (0.4%) |
| 4-Person Households | 14,858 (13.2%) | 357 (0.3%) |
| 5-Person Households | 7,099 (6.3%) | 70 (0.1%) |
| 6-Person Households | 2,888 (2.6%) | 0 (0.0%) |
| 7+ Person Households | 1,906 (1.7%) | 25 (0.0%) |
| Total | 68,097 (60.5%) | 44,538 (39.5%) |
Female Fertility in Newark
Fertility by Age in Newark
Average fertility rate in Newark is 63.0 births per 1,000 women. Women in the age bracket of 20 to 34 years have the highest fertility rate with 82.0 births per 1,000 women. Women in the age bracket of 20 to 34 years acount for 57.5% of all women with births.
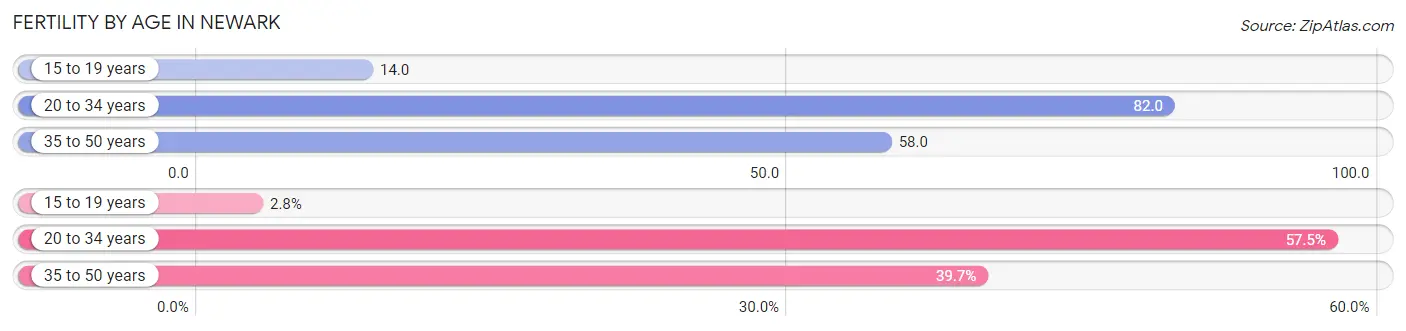
| Age Bracket | Women with Births | Births / 1,000 Women |
| 15 to 19 years | 139 (2.8%) | 14.0 |
| 20 to 34 years | 2,852 (57.5%) | 82.0 |
| 35 to 50 years | 1,969 (39.7%) | 58.0 |
| Total | 4,960 (100.0%) | 63.0 |
Fertility by Age by Marriage Status in Newark
51.0% of women with births (4,960) in Newark are married. The highest percentage of unmarried women with births falls into 15 to 19 years age bracket with 83.5% of them unmarried at the time of birth, while the lowest percentage of unmarried women with births belong to 35 to 50 years age bracket with 28.5% of them unmarried.
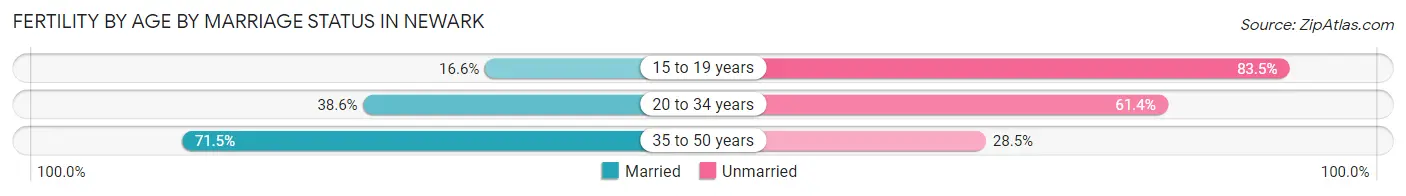
| Age Bracket | Married | Unmarried |
| 15 to 19 years | 23 (16.6%) | 116 (83.5%) |
| 20 to 34 years | 1,101 (38.6%) | 1,751 (61.4%) |
| 35 to 50 years | 1,408 (71.5%) | 561 (28.5%) |
| Total | 2,530 (51.0%) | 2,430 (49.0%) |
Fertility by Education in Newark
Average fertility rate in Newark is 63.0 births per 1,000 women. Women with the education attainment of high school diploma have the highest fertility rate of 71.0 births per 1,000 women, while women with the education attainment of bachelor's degree have the lowest fertility at 43.0 births per 1,000 women. Women with the education attainment of high school diploma represent 36.0% of all women with births.
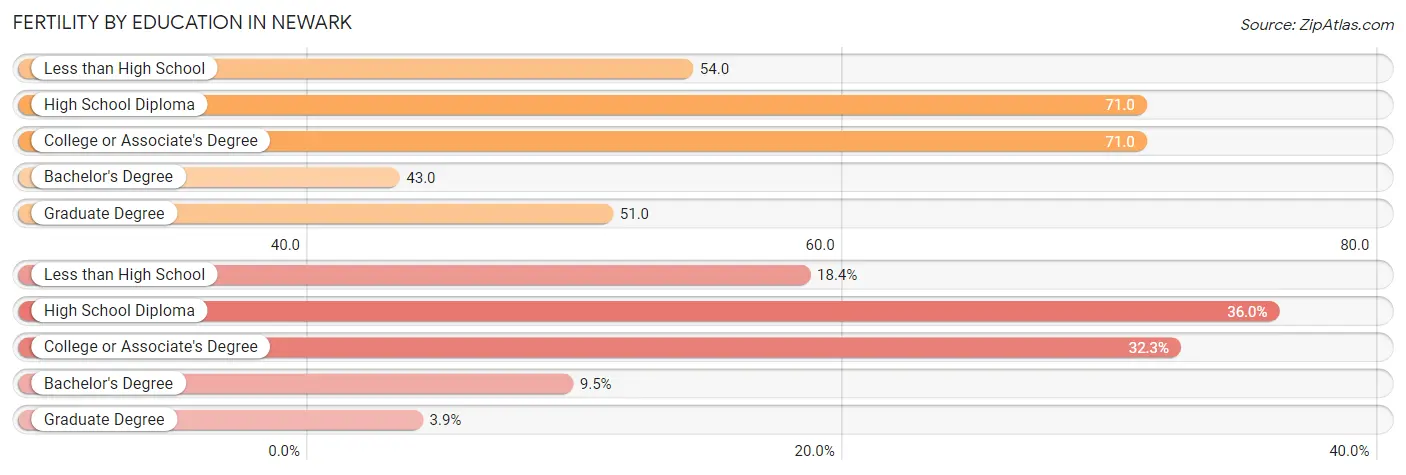
| Educational Attainment | Women with Births | Births / 1,000 Women |
| Less than High School | 912 (18.4%) | 54.0 |
| High School Diploma | 1,784 (36.0%) | 71.0 |
| College or Associate's Degree | 1,601 (32.3%) | 71.0 |
| Bachelor's Degree | 471 (9.5%) | 43.0 |
| Graduate Degree | 192 (3.9%) | 51.0 |
| Total | 4,960 (100.0%) | 63.0 |
Fertility by Education by Marriage Status in Newark
49.0% of women with births in Newark are unmarried. Women with the educational attainment of graduate degree are most likely to be married with 87.5% of them married at childbirth, while women with the educational attainment of college or associate's degree are least likely to be married with 56.8% of them unmarried at childbirth.
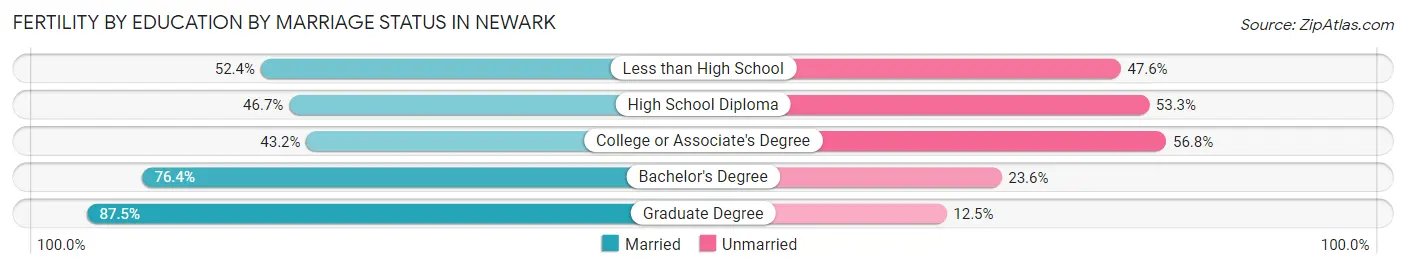
| Educational Attainment | Married | Unmarried |
| Less than High School | 478 (52.4%) | 434 (47.6%) |
| High School Diploma | 833 (46.7%) | 951 (53.3%) |
| College or Associate's Degree | 692 (43.2%) | 909 (56.8%) |
| Bachelor's Degree | 360 (76.4%) | 111 (23.6%) |
| Graduate Degree | 168 (87.5%) | 24 (12.5%) |
| Total | 2,530 (51.0%) | 2,430 (49.0%) |
Employment Characteristics in Newark
Employment by Class of Employer in Newark
Among the 128,392 employed individuals in Newark, private company employees (94,696 | 73.8%), not-for-profit organizations (8,712 | 6.8%), and local government employees (6,610 | 5.1%) make up the most common classes of employment.
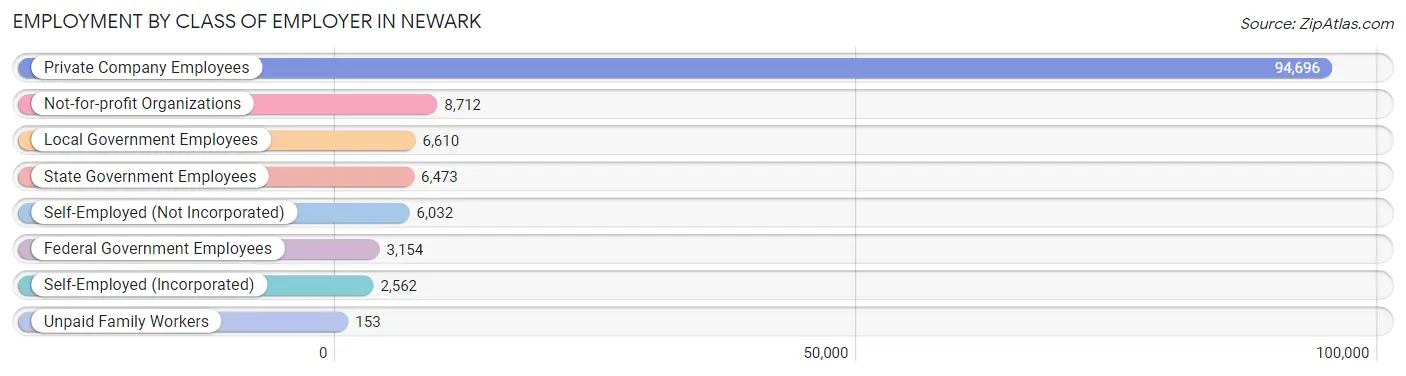
| Employer Class | # Employees | % Employees |
| Private Company Employees | 94,696 | 73.8% |
| Self-Employed (Incorporated) | 2,562 | 2.0% |
| Self-Employed (Not Incorporated) | 6,032 | 4.7% |
| Not-for-profit Organizations | 8,712 | 6.8% |
| Local Government Employees | 6,610 | 5.1% |
| State Government Employees | 6,473 | 5.0% |
| Federal Government Employees | 3,154 | 2.5% |
| Unpaid Family Workers | 153 | 0.1% |
| Total | 128,392 | 100.0% |
Employment Status by Age in Newark
According to the labor force statistics for Newark, out of the total population over 16 years of age (241,044), 62.2% or 149,929 individuals are in the labor force, with 10.7% or 16,042 of them unemployed. The age group with the highest labor force participation rate is 35 to 44 years, with 80.4% or 35,182 individuals in the labor force. Within the labor force, the 16 to 19 years age range has the highest percentage of unemployed individuals, with 27.7% or 1,359 of them being unemployed.
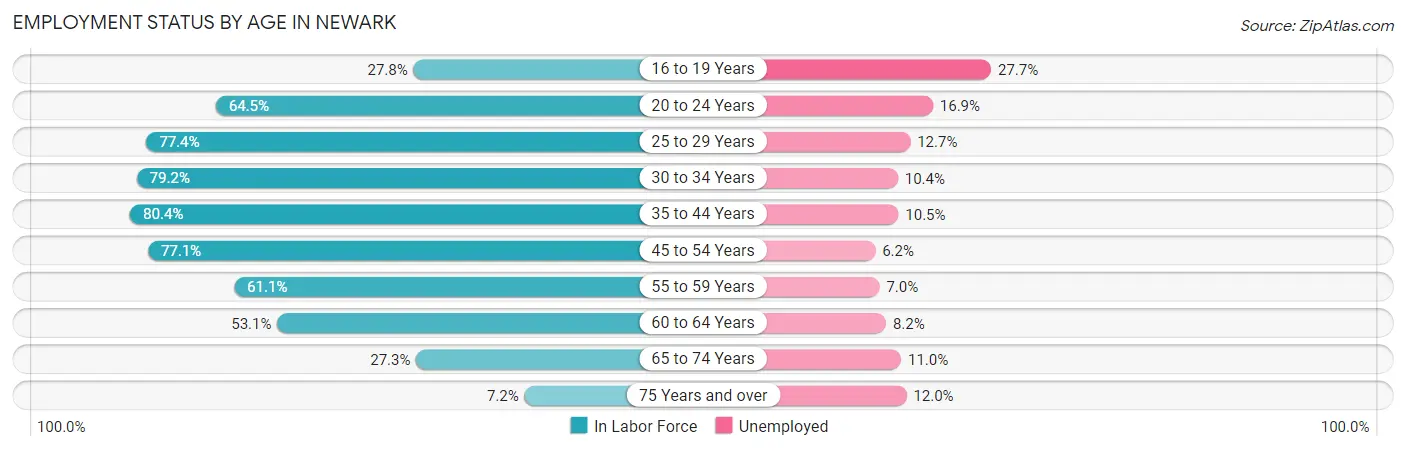
| Age Bracket | In Labor Force | Unemployed |
| 16 to 19 Years | 4,905 (27.8%) | 1,359 (27.7%) |
| 20 to 24 Years | 15,080 (64.5%) | 2,549 (16.9%) |
| 25 to 29 Years | 18,533 (77.4%) | 2,354 (12.7%) |
| 30 to 34 Years | 18,894 (79.2%) | 1,965 (10.4%) |
| 35 to 44 Years | 35,182 (80.4%) | 3,694 (10.5%) |
| 45 to 54 Years | 30,829 (77.1%) | 1,911 (6.2%) |
| 55 to 59 Years | 10,880 (61.1%) | 762 (7.0%) |
| 60 to 64 Years | 9,115 (53.1%) | 747 (8.2%) |
| 65 to 74 Years | 5,541 (27.3%) | 610 (11.0%) |
| 75 Years and over | 951 (7.2%) | 114 (12.0%) |
| Total | 149,929 (62.2%) | 16,042 (10.7%) |
Employment Status by Educational Attainment in Newark
According to labor force statistics for Newark, 74.1% of individuals (123,390) out of the total population between 25 and 64 years of age (166,518) are in the labor force, with 9.3% or 11,475 of them being unemployed. The group with the highest labor force participation rate are those with the educational attainment of bachelor's degree or higher, with 86.7% or 25,892 individuals in the labor force. Within the labor force, individuals with high school diploma education have the highest percentage of unemployment, with 10.9% or 4,810 of them being unemployed.
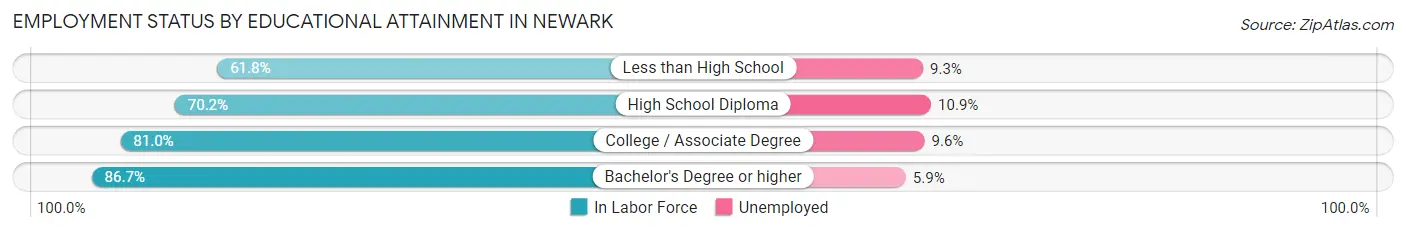
| Educational Attainment | In Labor Force | Unemployed |
| Less than High School | 20,502 (61.8%) | 3,085 (9.3%) |
| High School Diploma | 44,130 (70.2%) | 6,852 (10.9%) |
| College / Associate Degree | 32,899 (81.0%) | 3,899 (9.6%) |
| Bachelor's Degree or higher | 25,892 (86.7%) | 1,762 (5.9%) |
| Total | 123,390 (74.1%) | 15,486 (9.3%) |
Employment Occupations by Sex in Newark
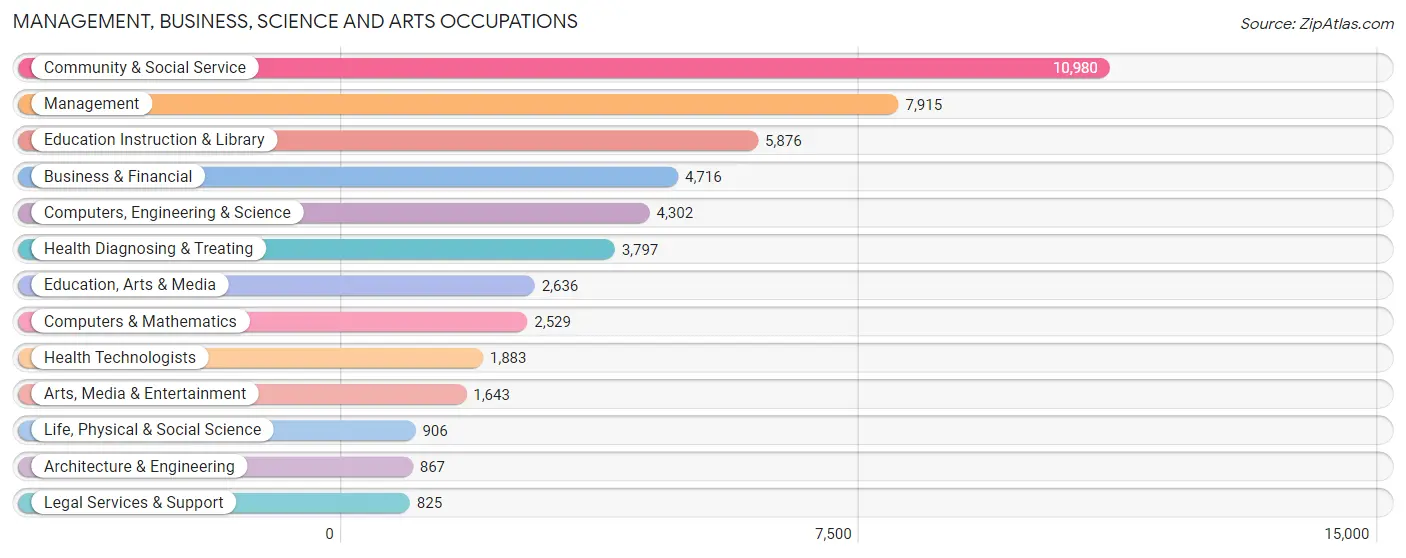
Management, Business, Science and Arts Occupations
The most common Management, Business, Science and Arts occupations in Newark are Community & Social Service (10,980 | 8.2%), Management (7,915 | 5.9%), Education Instruction & Library (5,876 | 4.4%), Business & Financial (4,716 | 3.5%), and Computers, Engineering & Science (4,302 | 3.2%).
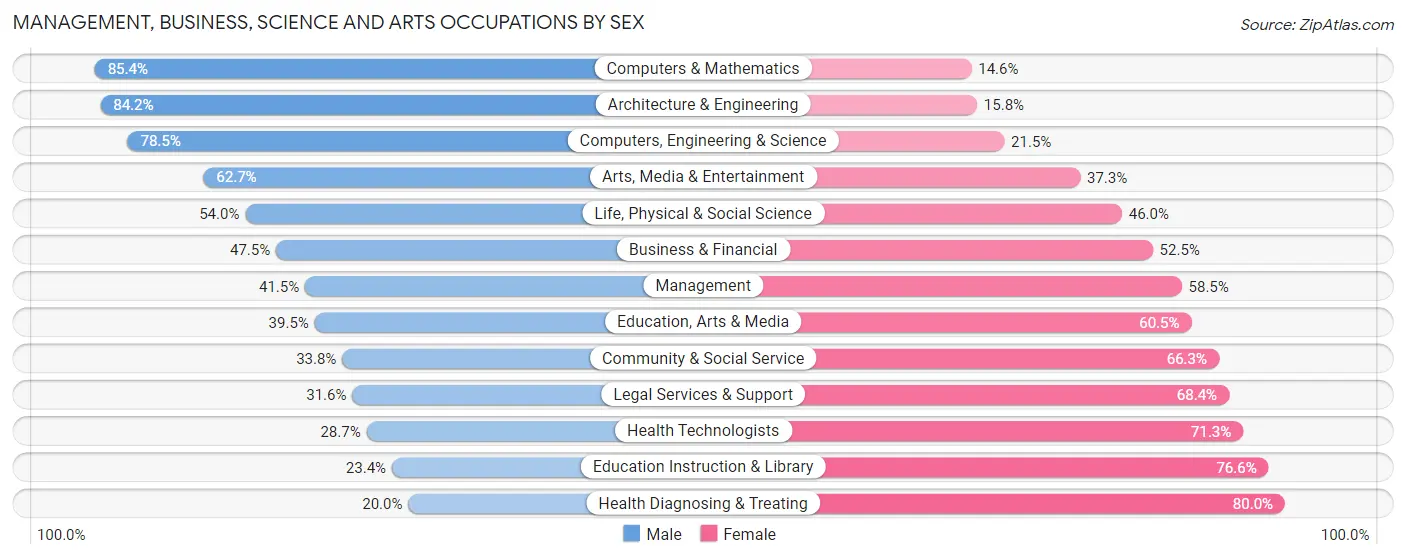
Management, Business, Science and Arts Occupations by Sex
Within the Management, Business, Science and Arts occupations in Newark, the most male-oriented occupations are Computers & Mathematics (85.4%), Architecture & Engineering (84.2%), and Computers, Engineering & Science (78.5%), while the most female-oriented occupations are Health Diagnosing & Treating (80.0%), Education Instruction & Library (76.6%), and Health Technologists (71.3%).
| Occupation | Male | Female |
| Management | 3,285 (41.5%) | 4,630 (58.5%) |
| Business & Financial | 2,242 (47.5%) | 2,474 (52.5%) |
| Computers, Engineering & Science | 3,378 (78.5%) | 924 (21.5%) |
| Computers & Mathematics | 2,159 (85.4%) | 370 (14.6%) |
| Architecture & Engineering | 730 (84.2%) | 137 (15.8%) |
| Life, Physical & Social Science | 489 (54.0%) | 417 (46.0%) |
| Community & Social Service | 3,706 (33.8%) | 7,274 (66.2%) |
| Education, Arts & Media | 1,041 (39.5%) | 1,595 (60.5%) |
| Legal Services & Support | 261 (31.6%) | 564 (68.4%) |
| Education Instruction & Library | 1,374 (23.4%) | 4,502 (76.6%) |
| Arts, Media & Entertainment | 1,030 (62.7%) | 613 (37.3%) |
| Health Diagnosing & Treating | 758 (20.0%) | 3,039 (80.0%) |
| Health Technologists | 540 (28.7%) | 1,343 (71.3%) |
| Total (Category) | 13,369 (42.2%) | 18,341 (57.8%) |
| Total (Overall) | 70,378 (52.6%) | 63,377 (47.4%) |
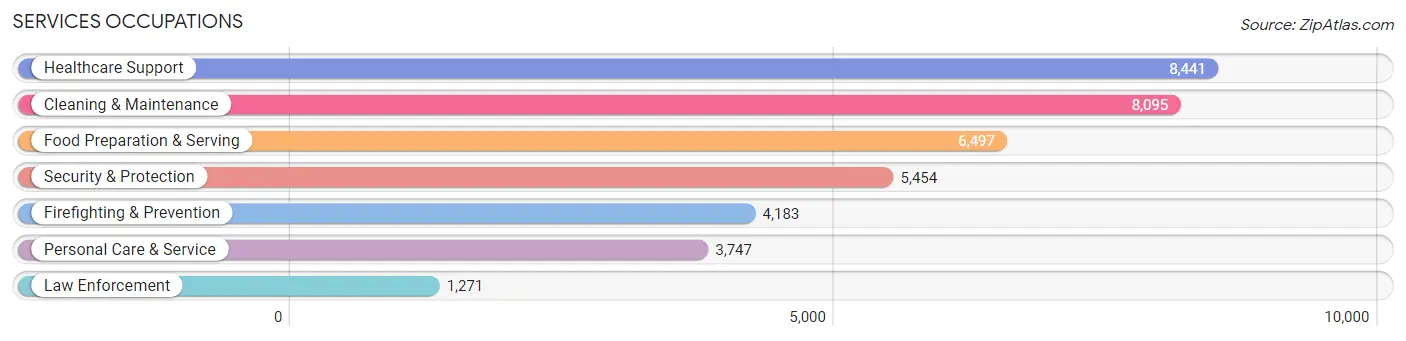
Services Occupations
The most common Services occupations in Newark are Healthcare Support (8,441 | 6.3%), Cleaning & Maintenance (8,095 | 6.0%), Food Preparation & Serving (6,497 | 4.9%), Security & Protection (5,454 | 4.1%), and Firefighting & Prevention (4,183 | 3.1%).
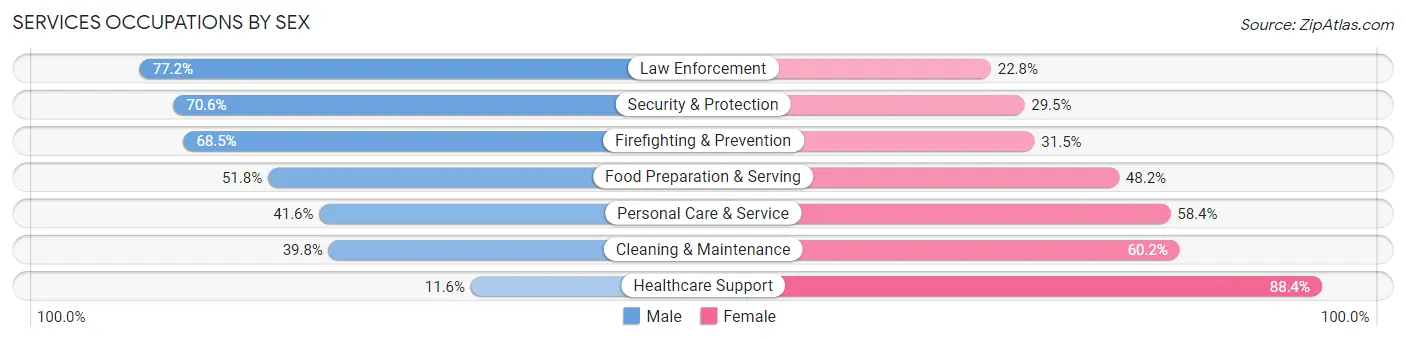
Services Occupations by Sex
Within the Services occupations in Newark, the most male-oriented occupations are Law Enforcement (77.2%), Security & Protection (70.6%), and Firefighting & Prevention (68.5%), while the most female-oriented occupations are Healthcare Support (88.4%), Cleaning & Maintenance (60.2%), and Personal Care & Service (58.4%).
| Occupation | Male | Female |
| Healthcare Support | 982 (11.6%) | 7,459 (88.4%) |
| Security & Protection | 3,848 (70.6%) | 1,606 (29.4%) |
| Firefighting & Prevention | 2,867 (68.5%) | 1,316 (31.5%) |
| Law Enforcement | 981 (77.2%) | 290 (22.8%) |
| Food Preparation & Serving | 3,366 (51.8%) | 3,131 (48.2%) |
| Cleaning & Maintenance | 3,220 (39.8%) | 4,875 (60.2%) |
| Personal Care & Service | 1,560 (41.6%) | 2,187 (58.4%) |
| Total (Category) | 12,976 (40.3%) | 19,258 (59.7%) |
| Total (Overall) | 70,378 (52.6%) | 63,377 (47.4%) |
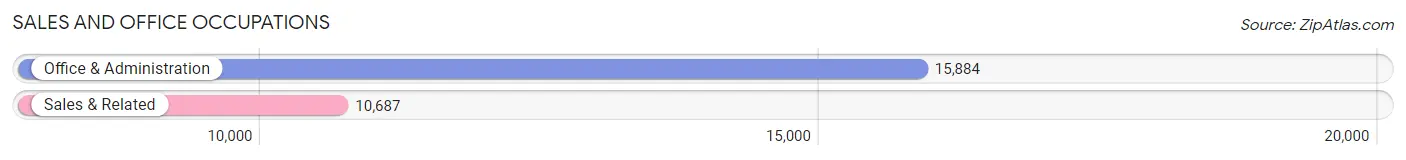
Sales and Office Occupations
The most common Sales and Office occupations in Newark are Office & Administration (15,884 | 11.9%), and Sales & Related (10,687 | 8.0%).
Sales and Office Occupations by Sex
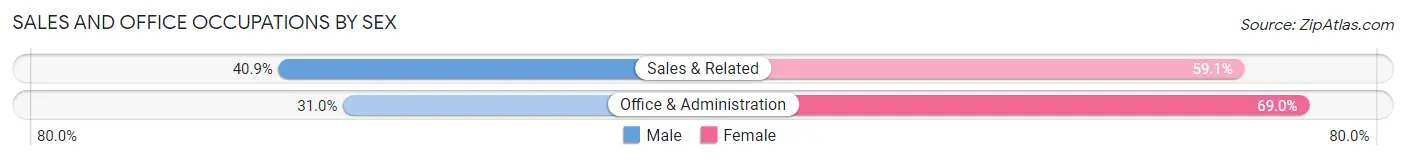
| Occupation | Male | Female |
| Sales & Related | 4,372 (40.9%) | 6,315 (59.1%) |
| Office & Administration | 4,919 (31.0%) | 10,965 (69.0%) |
| Total (Category) | 9,291 (35.0%) | 17,280 (65.0%) |
| Total (Overall) | 70,378 (52.6%) | 63,377 (47.4%) |
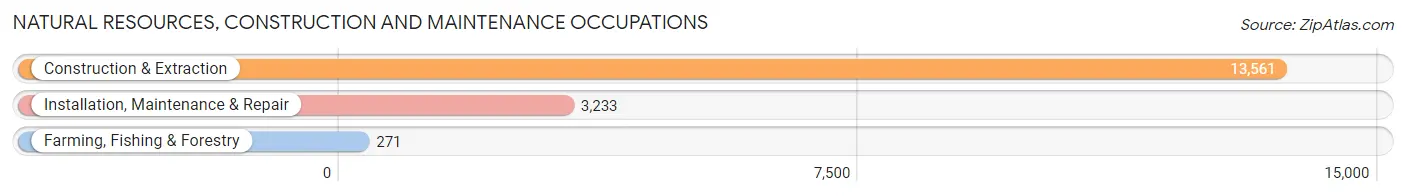
Natural Resources, Construction and Maintenance Occupations
The most common Natural Resources, Construction and Maintenance occupations in Newark are Construction & Extraction (13,561 | 10.1%), Installation, Maintenance & Repair (3,233 | 2.4%), and Farming, Fishing & Forestry (271 | 0.2%).
Natural Resources, Construction and Maintenance Occupations by Sex
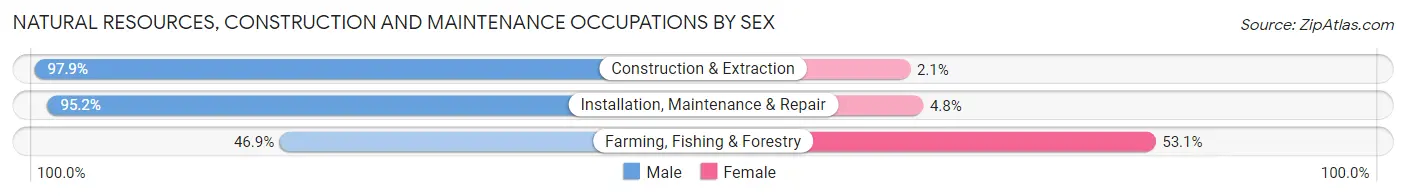
| Occupation | Male | Female |
| Farming, Fishing & Forestry | 127 (46.9%) | 144 (53.1%) |
| Construction & Extraction | 13,278 (97.9%) | 283 (2.1%) |
| Installation, Maintenance & Repair | 3,078 (95.2%) | 155 (4.8%) |
| Total (Category) | 16,483 (96.6%) | 582 (3.4%) |
| Total (Overall) | 70,378 (52.6%) | 63,377 (47.4%) |
Production, Transportation and Moving Occupations
The most common Production, Transportation and Moving occupations in Newark are Transportation (9,981 | 7.5%), Material Moving (8,363 | 6.2%), and Production (7,831 | 5.9%).
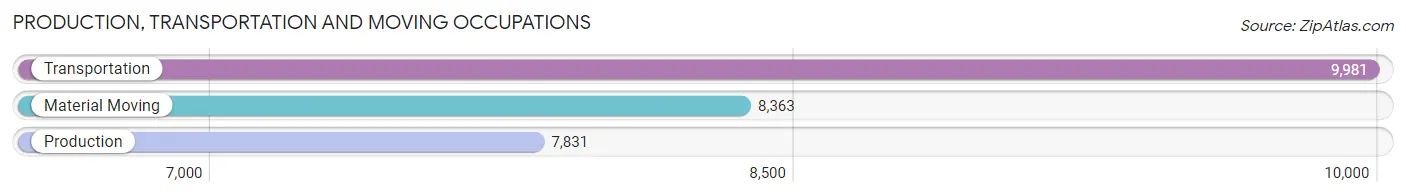
Production, Transportation and Moving Occupations by Sex
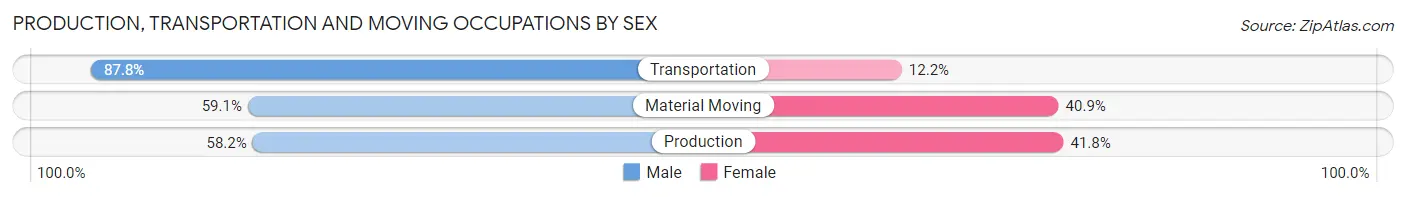
| Occupation | Male | Female |
| Production | 4,555 (58.2%) | 3,276 (41.8%) |
| Transportation | 8,765 (87.8%) | 1,216 (12.2%) |
| Material Moving | 4,939 (59.1%) | 3,424 (40.9%) |
| Total (Category) | 18,259 (69.8%) | 7,916 (30.2%) |
| Total (Overall) | 70,378 (52.6%) | 63,377 (47.4%) |
Employment Industries by Sex in Newark
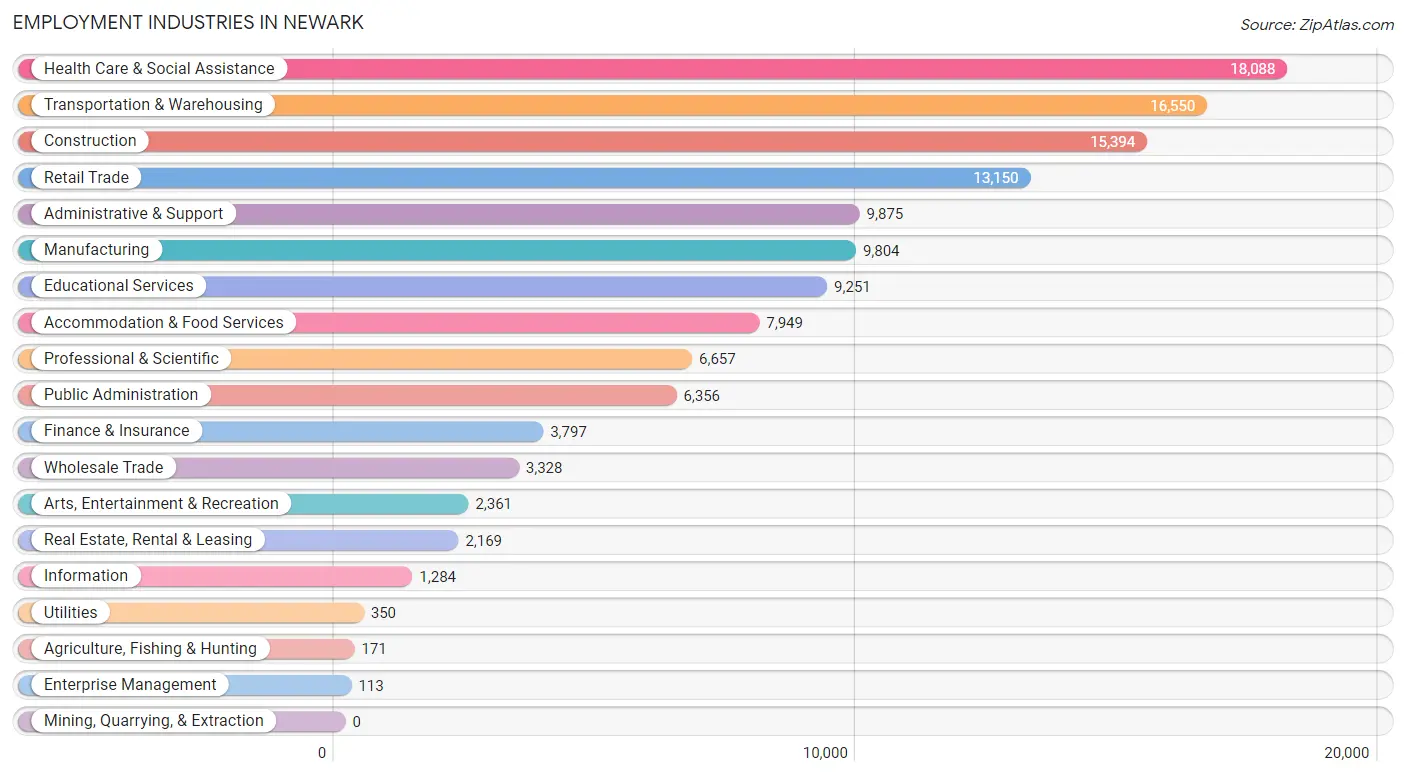
Employment Industries in Newark
The major employment industries in Newark include Health Care & Social Assistance (18,088 | 13.5%), Transportation & Warehousing (16,550 | 12.4%), Construction (15,394 | 11.5%), Retail Trade (13,150 | 9.8%), and Administrative & Support (9,875 | 7.4%).
Employment Industries by Sex in Newark
The Newark industries that see more men than women are Construction (95.5%), Information (72.6%), and Transportation & Warehousing (66.6%), whereas the industries that tend to have a higher number of women are Health Care & Social Assistance (80.9%), Agriculture, Fishing & Hunting (70.2%), and Enterprise Management (69.9%).
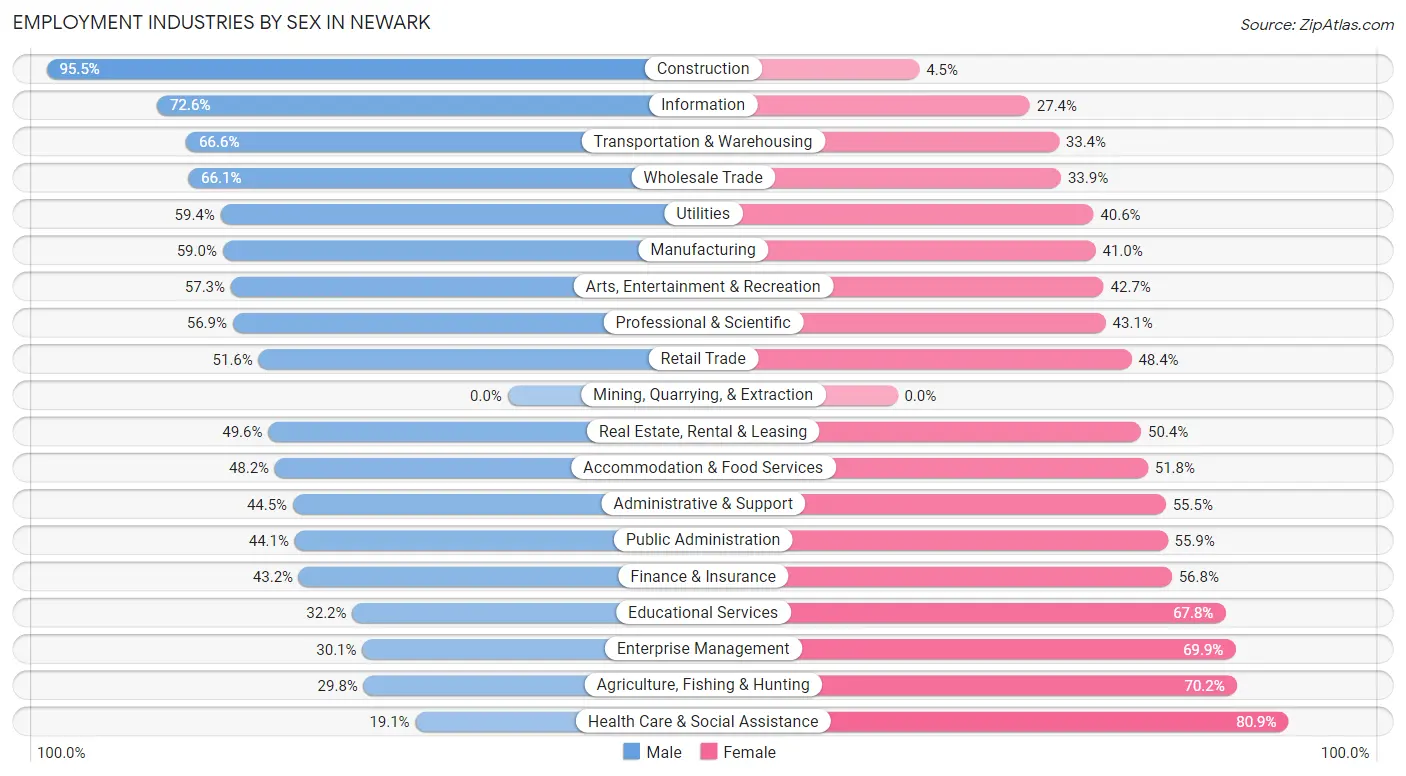
| Industry | Male | Female |
| Agriculture, Fishing & Hunting | 51 (29.8%) | 120 (70.2%) |
| Mining, Quarrying, & Extraction | 0 (0.0%) | 0 (0.0%) |
| Construction | 14,697 (95.5%) | 697 (4.5%) |
| Manufacturing | 5,783 (59.0%) | 4,021 (41.0%) |
| Wholesale Trade | 2,201 (66.1%) | 1,127 (33.9%) |
| Retail Trade | 6,780 (51.6%) | 6,370 (48.4%) |
| Transportation & Warehousing | 11,020 (66.6%) | 5,530 (33.4%) |
| Utilities | 208 (59.4%) | 142 (40.6%) |
| Information | 932 (72.6%) | 352 (27.4%) |
| Finance & Insurance | 1,641 (43.2%) | 2,156 (56.8%) |
| Real Estate, Rental & Leasing | 1,075 (49.6%) | 1,094 (50.4%) |
| Professional & Scientific | 3,788 (56.9%) | 2,869 (43.1%) |
| Enterprise Management | 34 (30.1%) | 79 (69.9%) |
| Administrative & Support | 4,390 (44.5%) | 5,485 (55.5%) |
| Educational Services | 2,975 (32.2%) | 6,276 (67.8%) |
| Health Care & Social Assistance | 3,455 (19.1%) | 14,633 (80.9%) |
| Arts, Entertainment & Recreation | 1,353 (57.3%) | 1,008 (42.7%) |
| Accommodation & Food Services | 3,830 (48.2%) | 4,119 (51.8%) |
| Public Administration | 2,801 (44.1%) | 3,555 (55.9%) |
| Total | 70,378 (52.6%) | 63,377 (47.4%) |
Education in Newark
School Enrollment in Newark
The most common levels of schooling among the 81,732 students in Newark are college / undergraduate (17,701 | 21.7%), middle school (16,969 | 20.8%), and high school (16,507 | 20.2%).
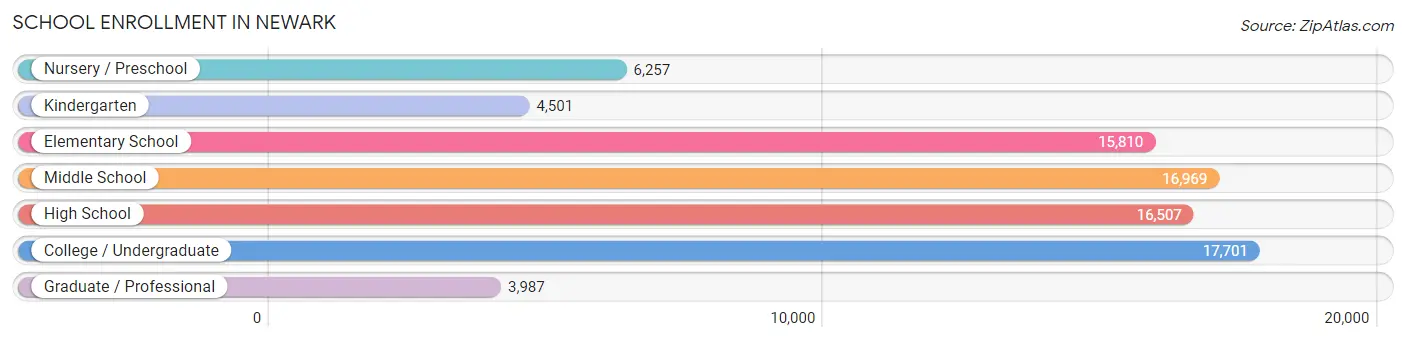
| School Level | # Students | % Students |
| Nursery / Preschool | 6,257 | 7.7% |
| Kindergarten | 4,501 | 5.5% |
| Elementary School | 15,810 | 19.3% |
| Middle School | 16,969 | 20.8% |
| High School | 16,507 | 20.2% |
| College / Undergraduate | 17,701 | 21.7% |
| Graduate / Professional | 3,987 | 4.9% |
| Total | 81,732 | 100.0% |
School Enrollment by Age by Funding Source in Newark
Out of a total of 81,732 students who are enrolled in schools in Newark, 9,726 (11.9%) attend a private institution, while the remaining 72,006 (88.1%) are enrolled in public schools. The age group of 35 years and over has the highest likelihood of being enrolled in private schools, with 1,329 (33.0% in the age bracket) enrolled. Conversely, the age group of 5 to 9 year old has the lowest likelihood of being enrolled in a private school, with 18,502 (95.1% in the age bracket) attending a public institution.
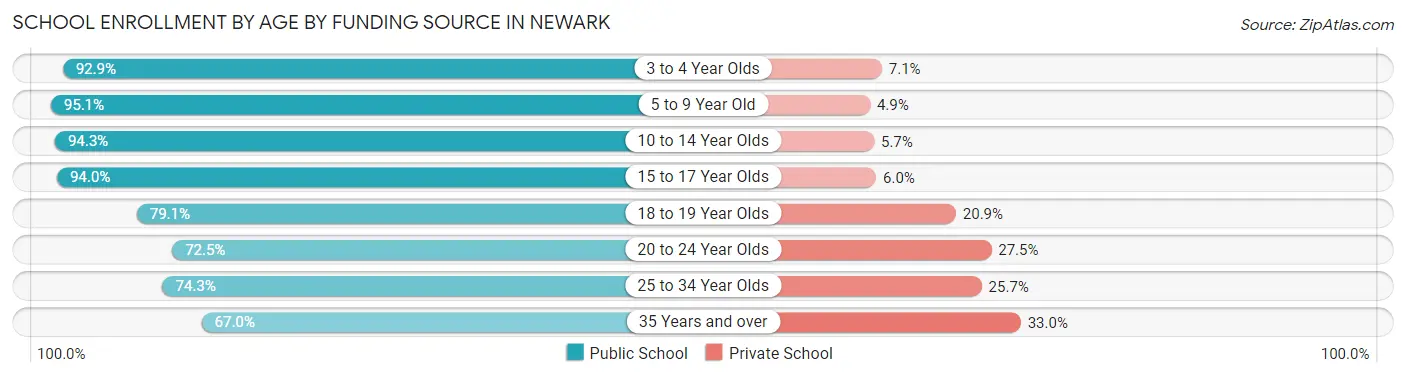
| Age Bracket | Public School | Private School |
| 3 to 4 Year Olds | 5,398 (92.9%) | 413 (7.1%) |
| 5 to 9 Year Old | 18,502 (95.1%) | 953 (4.9%) |
| 10 to 14 Year Olds | 19,355 (94.3%) | 1,161 (5.7%) |
| 15 to 17 Year Olds | 10,370 (94.0%) | 667 (6.0%) |
| 18 to 19 Year Olds | 5,572 (79.1%) | 1,472 (20.9%) |
| 20 to 24 Year Olds | 6,252 (72.5%) | 2,372 (27.5%) |
| 25 to 34 Year Olds | 3,875 (74.3%) | 1,340 (25.7%) |
| 35 Years and over | 2,701 (67.0%) | 1,329 (33.0%) |
| Total | 72,006 (88.1%) | 9,726 (11.9%) |
Educational Attainment by Field of Study in Newark
Business (7,923 | 21.9%), social sciences (3,898 | 10.8%), education (3,512 | 9.7%), science & technology (3,065 | 8.5%), and arts & humanities (2,552 | 7.0%) are the most common fields of study among 36,242 individuals in Newark who have obtained a bachelor's degree or higher.
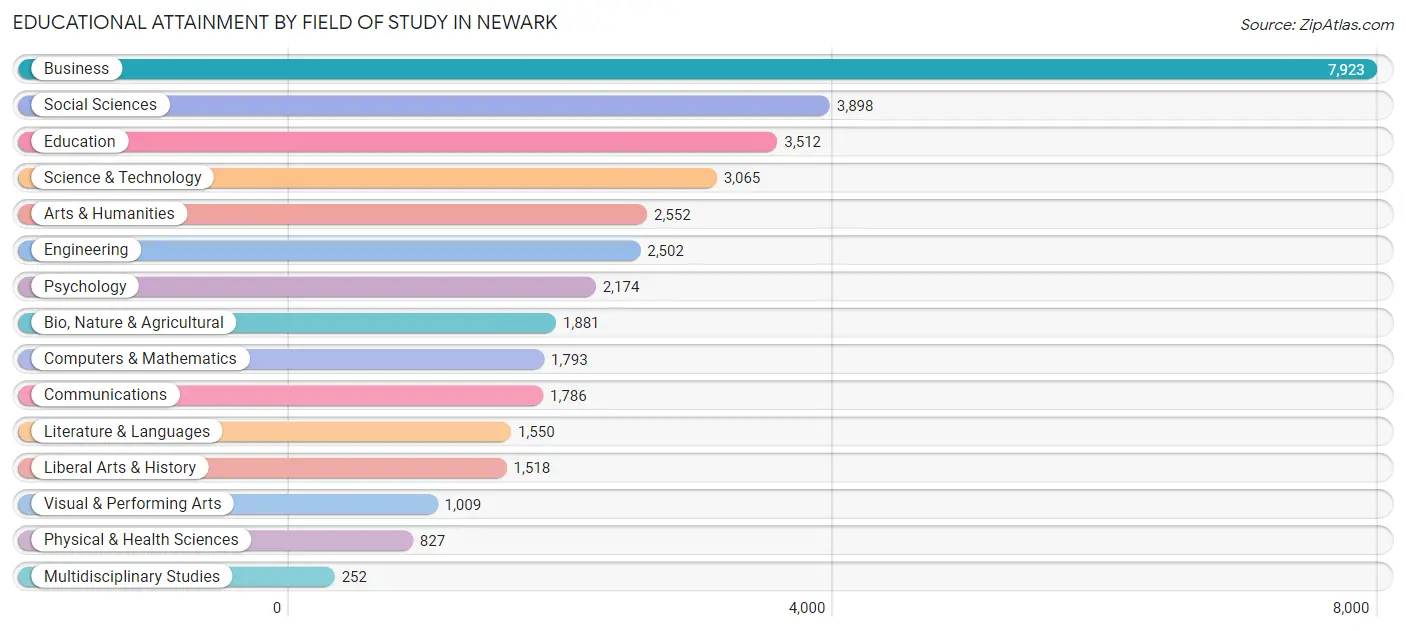
| Field of Study | # Graduates | % Graduates |
| Computers & Mathematics | 1,793 | 5.0% |
| Bio, Nature & Agricultural | 1,881 | 5.2% |
| Physical & Health Sciences | 827 | 2.3% |
| Psychology | 2,174 | 6.0% |
| Social Sciences | 3,898 | 10.8% |
| Engineering | 2,502 | 6.9% |
| Multidisciplinary Studies | 252 | 0.7% |
| Science & Technology | 3,065 | 8.5% |
| Business | 7,923 | 21.9% |
| Education | 3,512 | 9.7% |
| Literature & Languages | 1,550 | 4.3% |
| Liberal Arts & History | 1,518 | 4.2% |
| Visual & Performing Arts | 1,009 | 2.8% |
| Communications | 1,786 | 4.9% |
| Arts & Humanities | 2,552 | 7.0% |
| Total | 36,242 | 100.0% |
Transportation & Commute in Newark
Vehicle Availability by Sex in Newark
The most prevalent vehicle ownership categories in Newark are males with 1 vehicle (26,953, accounting for 39.8%) and females with 1 vehicle (24,394, making up 45.3%).
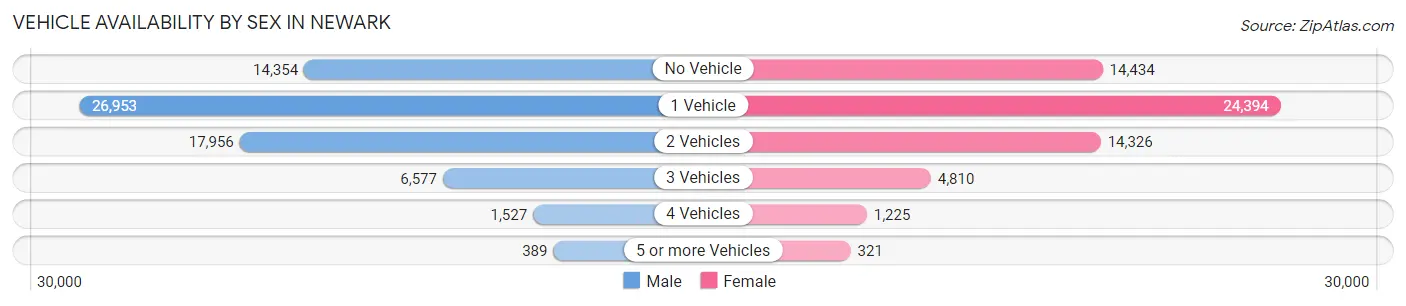
| Vehicles Available | Male | Female |
| No Vehicle | 14,354 (21.2%) | 14,434 (24.2%) |
| 1 Vehicle | 26,953 (39.8%) | 24,394 (41.0%) |
| 2 Vehicles | 17,956 (26.5%) | 14,326 (24.1%) |
| 3 Vehicles | 6,577 (9.7%) | 4,810 (8.1%) |
| 4 Vehicles | 1,527 (2.2%) | 1,225 (2.1%) |
| 5 or more Vehicles | 389 (0.6%) | 321 (0.5%) |
| Total | 67,756 (100.0%) | 59,510 (100.0%) |
Commute Time in Newark
The most frequently occuring commute durations in Newark are 30 to 34 minutes (24,115 commuters, 19.7%), 20 to 24 minutes (21,704 commuters, 17.7%), and 15 to 19 minutes (12,914 commuters, 10.5%).
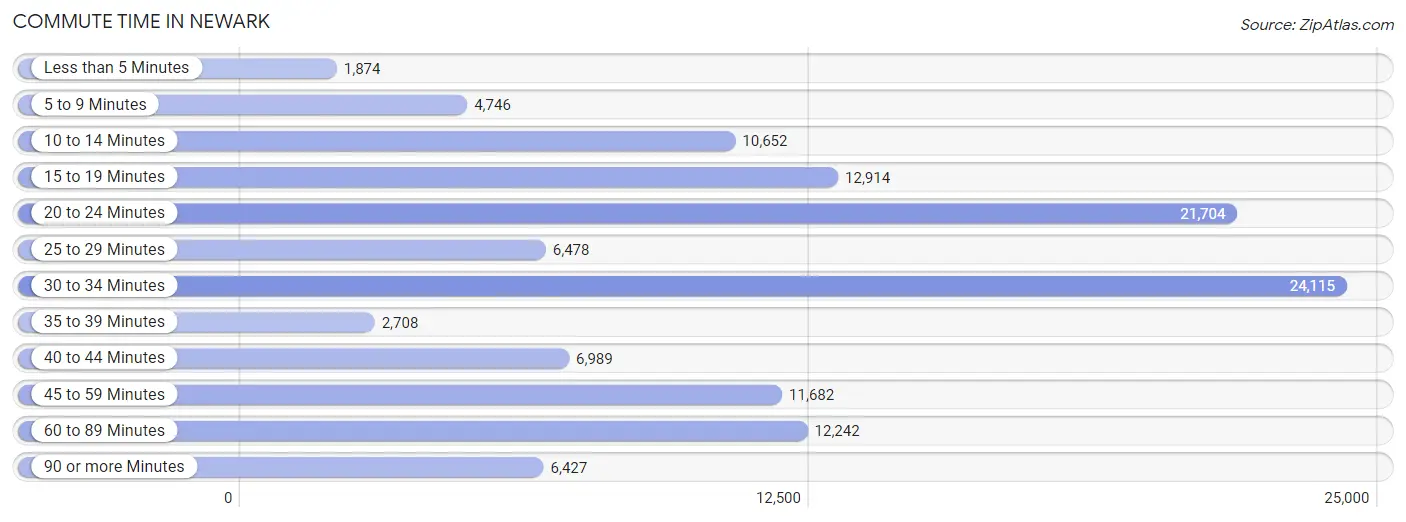
| Commute Time | # Commuters | % Commuters |
| Less than 5 Minutes | 1,874 | 1.5% |
| 5 to 9 Minutes | 4,746 | 3.9% |
| 10 to 14 Minutes | 10,652 | 8.7% |
| 15 to 19 Minutes | 12,914 | 10.5% |
| 20 to 24 Minutes | 21,704 | 17.7% |
| 25 to 29 Minutes | 6,478 | 5.3% |
| 30 to 34 Minutes | 24,115 | 19.7% |
| 35 to 39 Minutes | 2,708 | 2.2% |
| 40 to 44 Minutes | 6,989 | 5.7% |
| 45 to 59 Minutes | 11,682 | 9.5% |
| 60 to 89 Minutes | 12,242 | 10.0% |
| 90 or more Minutes | 6,427 | 5.2% |
Commute Time by Sex in Newark
The most common commute times in Newark are 30 to 34 minutes (13,602 commuters, 20.6%) for males and 30 to 34 minutes (10,513 commuters, 18.6%) for females.
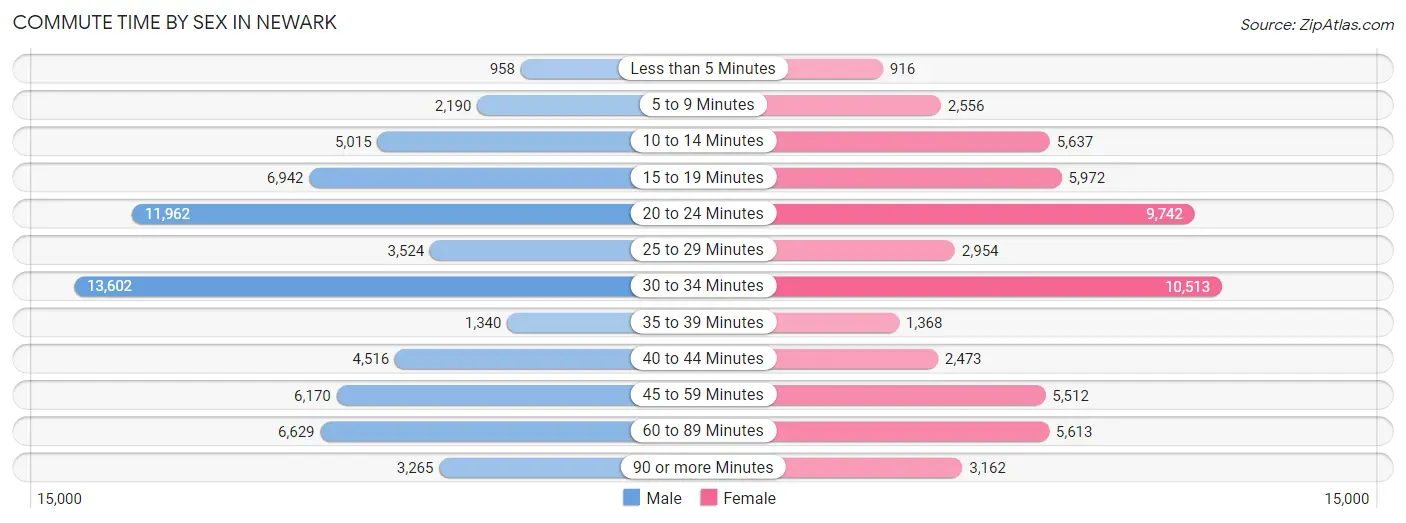
| Commute Time | Male | Female |
| Less than 5 Minutes | 958 (1.5%) | 916 (1.6%) |
| 5 to 9 Minutes | 2,190 (3.3%) | 2,556 (4.5%) |
| 10 to 14 Minutes | 5,015 (7.6%) | 5,637 (10.0%) |
| 15 to 19 Minutes | 6,942 (10.5%) | 5,972 (10.6%) |
| 20 to 24 Minutes | 11,962 (18.1%) | 9,742 (17.3%) |
| 25 to 29 Minutes | 3,524 (5.3%) | 2,954 (5.2%) |
| 30 to 34 Minutes | 13,602 (20.6%) | 10,513 (18.6%) |
| 35 to 39 Minutes | 1,340 (2.0%) | 1,368 (2.4%) |
| 40 to 44 Minutes | 4,516 (6.8%) | 2,473 (4.4%) |
| 45 to 59 Minutes | 6,170 (9.3%) | 5,512 (9.8%) |
| 60 to 89 Minutes | 6,629 (10.0%) | 5,613 (10.0%) |
| 90 or more Minutes | 3,265 (4.9%) | 3,162 (5.6%) |
Time of Departure to Work by Sex in Newark
The most frequent times of departure to work in Newark are 7:00 AM to 7:29 AM (14,730, 22.3%) for males and 8:00 AM to 8:29 AM (9,952, 17.6%) for females.
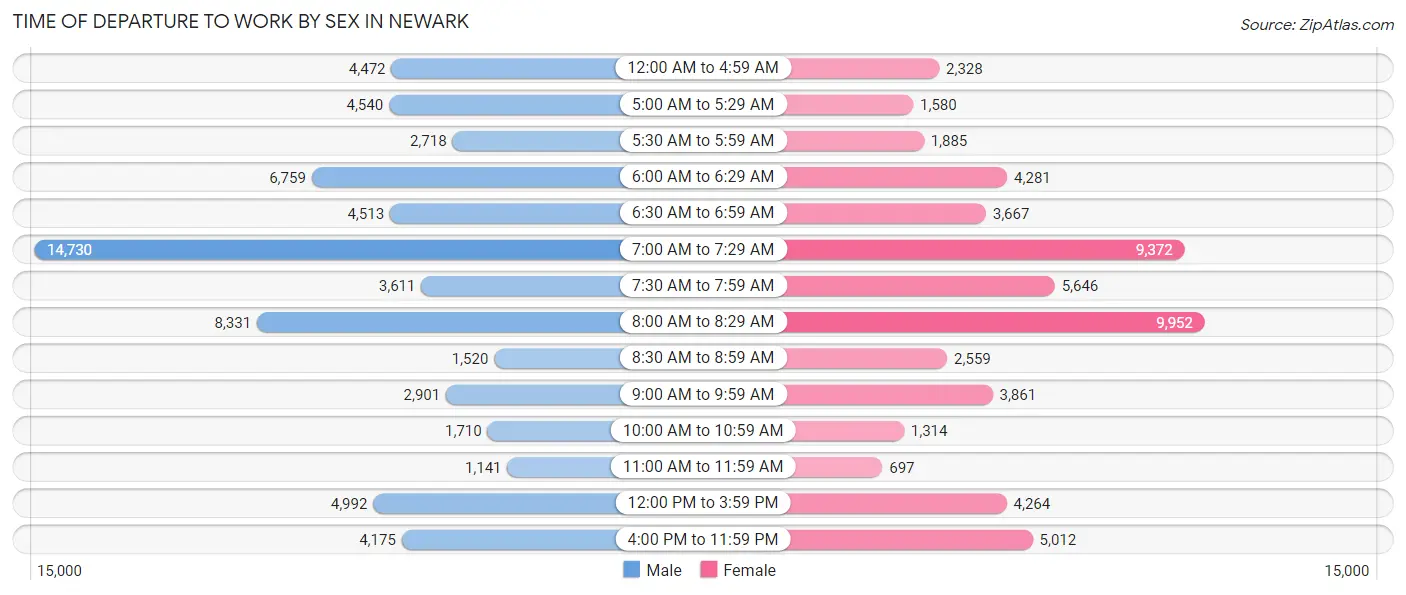
| Time of Departure | Male | Female |
| 12:00 AM to 4:59 AM | 4,472 (6.8%) | 2,328 (4.1%) |
| 5:00 AM to 5:29 AM | 4,540 (6.9%) | 1,580 (2.8%) |
| 5:30 AM to 5:59 AM | 2,718 (4.1%) | 1,885 (3.3%) |
| 6:00 AM to 6:29 AM | 6,759 (10.2%) | 4,281 (7.6%) |
| 6:30 AM to 6:59 AM | 4,513 (6.8%) | 3,667 (6.5%) |
| 7:00 AM to 7:29 AM | 14,730 (22.3%) | 9,372 (16.6%) |
| 7:30 AM to 7:59 AM | 3,611 (5.5%) | 5,646 (10.0%) |
| 8:00 AM to 8:29 AM | 8,331 (12.6%) | 9,952 (17.6%) |
| 8:30 AM to 8:59 AM | 1,520 (2.3%) | 2,559 (4.5%) |
| 9:00 AM to 9:59 AM | 2,901 (4.4%) | 3,861 (6.8%) |
| 10:00 AM to 10:59 AM | 1,710 (2.6%) | 1,314 (2.3%) |
| 11:00 AM to 11:59 AM | 1,141 (1.7%) | 697 (1.2%) |
| 12:00 PM to 3:59 PM | 4,992 (7.5%) | 4,264 (7.6%) |
| 4:00 PM to 11:59 PM | 4,175 (6.3%) | 5,012 (8.9%) |
| Total | 66,113 (100.0%) | 56,418 (100.0%) |
Housing Occupancy in Newark
Occupancy by Ownership in Newark
Of the total 112,635 dwellings in Newark, owner-occupied units account for 26,936 (23.9%), while renter-occupied units make up 85,699 (76.1%).
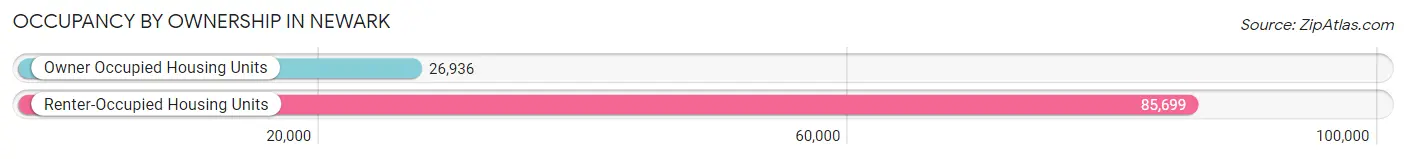
| Occupancy | # Housing Units | % Housing Units |
| Owner Occupied Housing Units | 26,936 | 23.9% |
| Renter-Occupied Housing Units | 85,699 | 76.1% |
| Total Occupied Housing Units | 112,635 | 100.0% |
Occupancy by Household Size in Newark
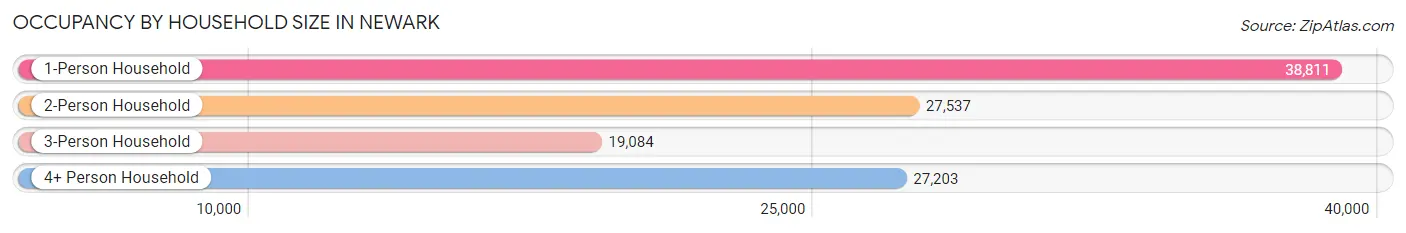
| Household Size | # Housing Units | % Housing Units |
| 1-Person Household | 38,811 | 34.5% |
| 2-Person Household | 27,537 | 24.4% |
| 3-Person Household | 19,084 | 16.9% |
| 4+ Person Household | 27,203 | 24.1% |
| Total Housing Units | 112,635 | 100.0% |
Occupancy by Ownership by Household Size in Newark
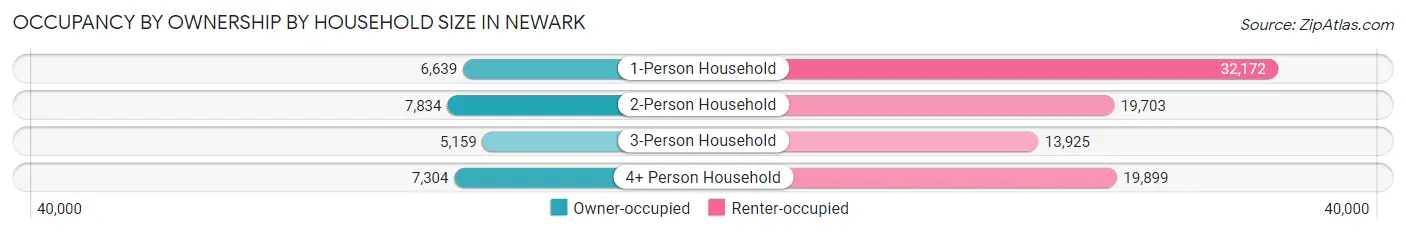
| Household Size | Owner-occupied | Renter-occupied |
| 1-Person Household | 6,639 (17.1%) | 32,172 (82.9%) |
| 2-Person Household | 7,834 (28.4%) | 19,703 (71.6%) |
| 3-Person Household | 5,159 (27.0%) | 13,925 (73.0%) |
| 4+ Person Household | 7,304 (26.9%) | 19,899 (73.2%) |
| Total Housing Units | 26,936 (23.9%) | 85,699 (76.1%) |
Occupancy by Educational Attainment in Newark
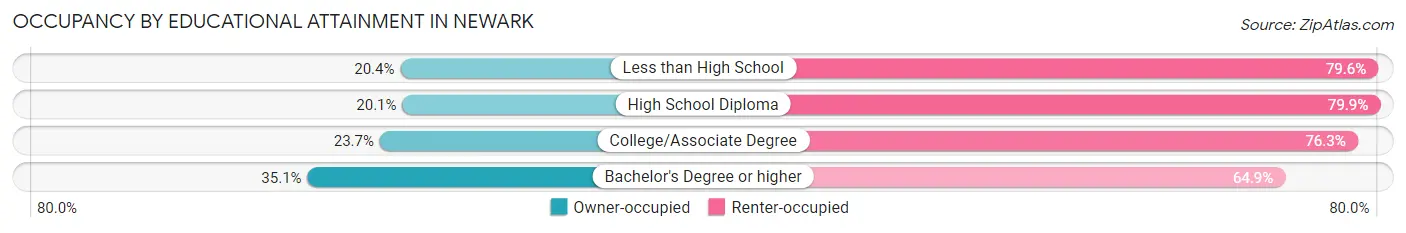
| Household Size | Owner-occupied | Renter-occupied |
| Less than High School | 4,743 (20.4%) | 18,497 (79.6%) |
| High School Diploma | 7,805 (20.1%) | 31,073 (79.9%) |
| College/Associate Degree | 6,933 (23.7%) | 22,370 (76.3%) |
| Bachelor's Degree or higher | 7,455 (35.1%) | 13,759 (64.9%) |
Occupancy by Age of Householder in Newark
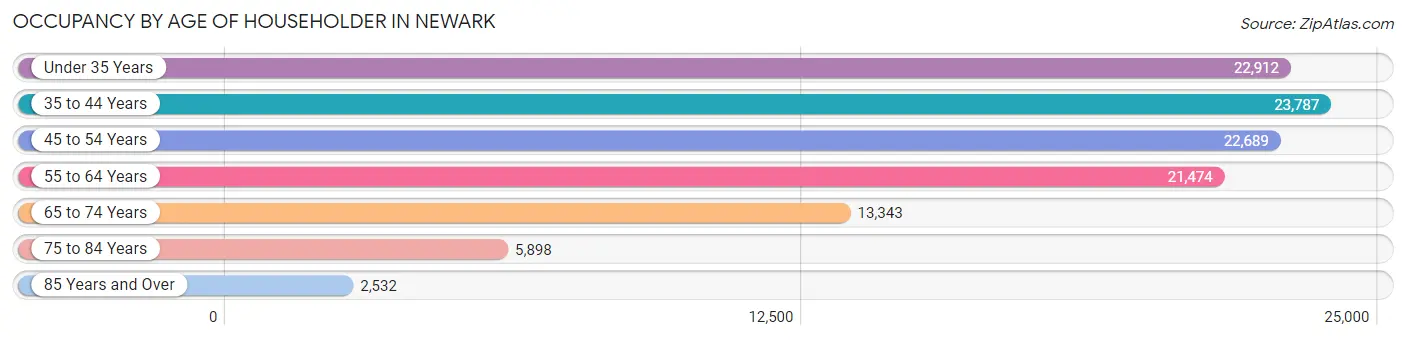
| Age Bracket | # Households | % Households |
| Under 35 Years | 22,912 | 20.3% |
| 35 to 44 Years | 23,787 | 21.1% |
| 45 to 54 Years | 22,689 | 20.1% |
| 55 to 64 Years | 21,474 | 19.1% |
| 65 to 74 Years | 13,343 | 11.8% |
| 75 to 84 Years | 5,898 | 5.2% |
| 85 Years and Over | 2,532 | 2.2% |
| Total | 112,635 | 100.0% |
Housing Finances in Newark
Median Income by Occupancy in Newark
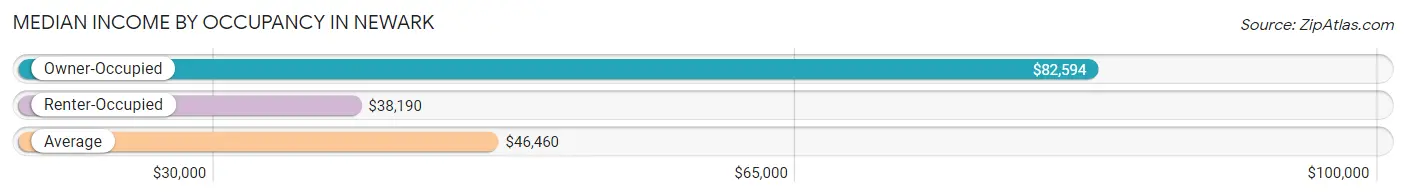
| Occupancy Type | # Households | Median Income |
| Owner-Occupied | 26,936 (23.9%) | $82,594 |
| Renter-Occupied | 85,699 (76.1%) | $38,190 |
| Average | 112,635 (100.0%) | $46,460 |
Occupancy by Householder Income Bracket in Newark
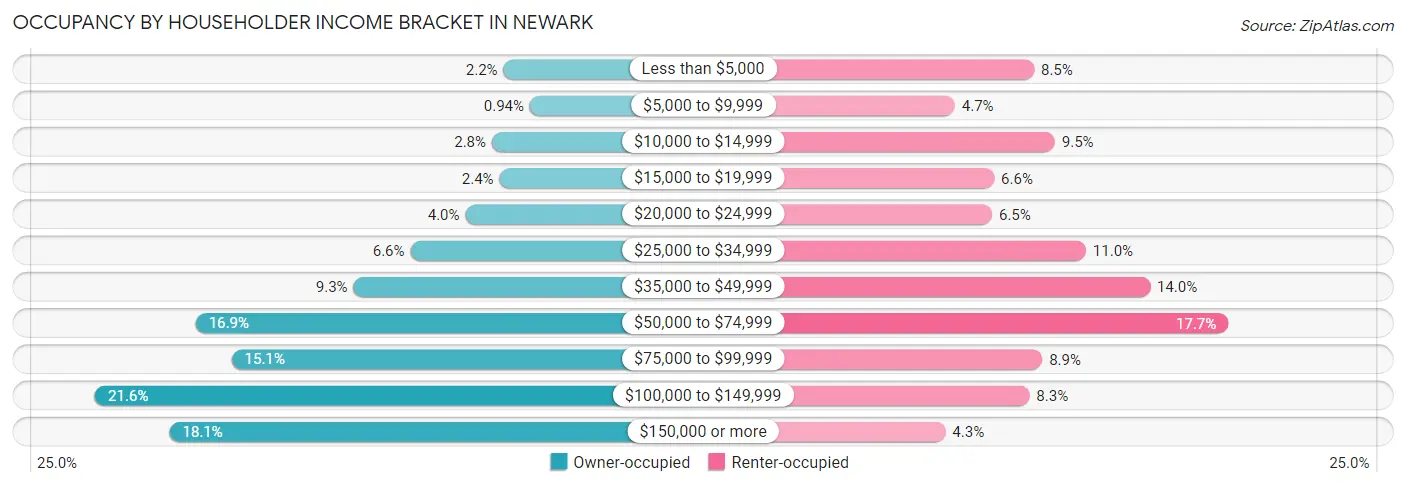
| Income Bracket | Owner-occupied | Renter-occupied |
| Less than $5,000 | 592 (2.2%) | 7,281 (8.5%) |
| $5,000 to $9,999 | 254 (0.9%) | 4,056 (4.7%) |
| $10,000 to $14,999 | 740 (2.8%) | 8,135 (9.5%) |
| $15,000 to $19,999 | 643 (2.4%) | 5,652 (6.6%) |
| $20,000 to $24,999 | 1,079 (4.0%) | 5,570 (6.5%) |
| $25,000 to $34,999 | 1,787 (6.6%) | 9,401 (11.0%) |
| $35,000 to $49,999 | 2,517 (9.3%) | 12,019 (14.0%) |
| $50,000 to $74,999 | 4,539 (16.9%) | 15,200 (17.7%) |
| $75,000 to $99,999 | 4,079 (15.1%) | 7,620 (8.9%) |
| $100,000 to $149,999 | 5,830 (21.6%) | 7,093 (8.3%) |
| $150,000 or more | 4,876 (18.1%) | 3,672 (4.3%) |
| Total | 26,936 (100.0%) | 85,699 (100.0%) |
Monthly Housing Cost Tiers in Newark
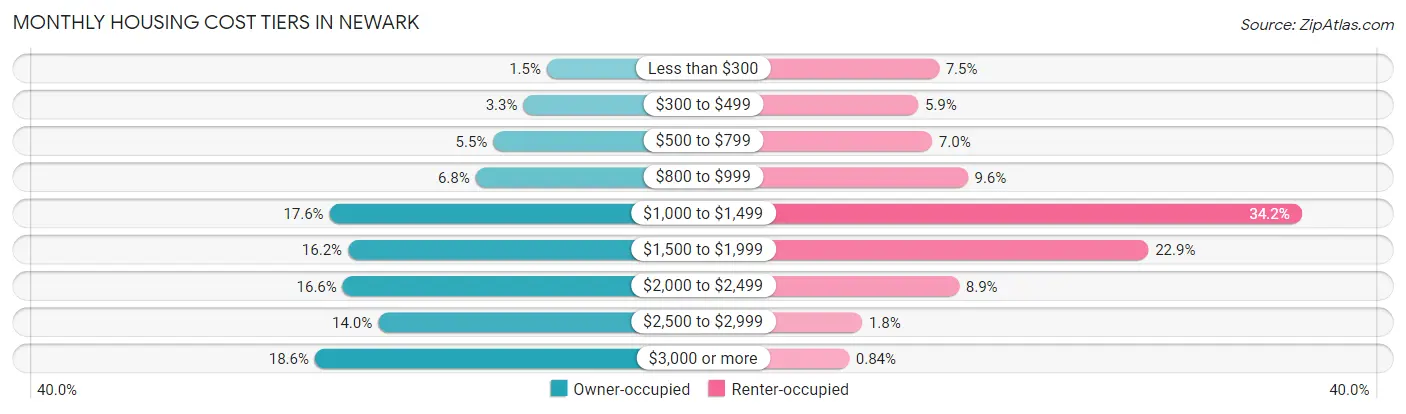
| Monthly Cost | Owner-occupied | Renter-occupied |
| Less than $300 | 414 (1.5%) | 6,394 (7.5%) |
| $300 to $499 | 880 (3.3%) | 5,086 (5.9%) |
| $500 to $799 | 1,480 (5.5%) | 5,965 (7.0%) |
| $800 to $999 | 1,829 (6.8%) | 8,211 (9.6%) |
| $1,000 to $1,499 | 4,728 (17.5%) | 29,289 (34.2%) |
| $1,500 to $1,999 | 4,360 (16.2%) | 19,616 (22.9%) |
| $2,000 to $2,499 | 4,465 (16.6%) | 7,658 (8.9%) |
| $2,500 to $2,999 | 3,763 (14.0%) | 1,553 (1.8%) |
| $3,000 or more | 5,017 (18.6%) | 718 (0.8%) |
| Total | 26,936 (100.0%) | 85,699 (100.0%) |
Physical Housing Characteristics in Newark
Housing Structures in Newark
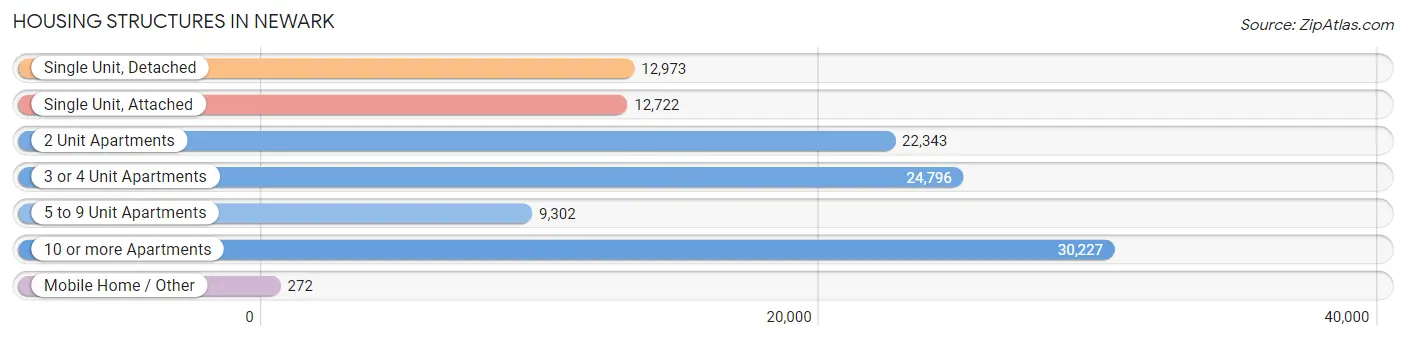
| Structure Type | # Housing Units | % Housing Units |
| Single Unit, Detached | 12,973 | 11.5% |
| Single Unit, Attached | 12,722 | 11.3% |
| 2 Unit Apartments | 22,343 | 19.8% |
| 3 or 4 Unit Apartments | 24,796 | 22.0% |
| 5 to 9 Unit Apartments | 9,302 | 8.3% |
| 10 or more Apartments | 30,227 | 26.8% |
| Mobile Home / Other | 272 | 0.2% |
| Total | 112,635 | 100.0% |
Housing Structures by Occupancy in Newark
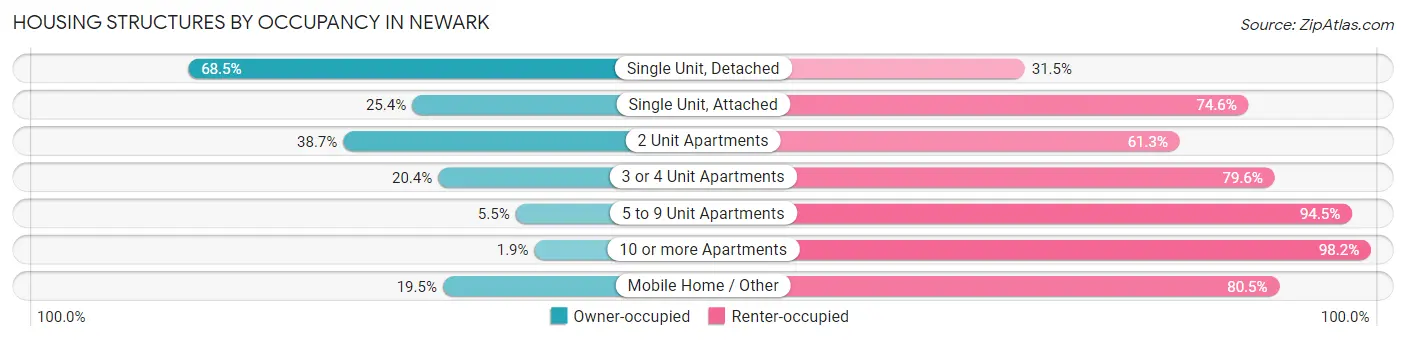
| Structure Type | Owner-occupied | Renter-occupied |
| Single Unit, Detached | 8,885 (68.5%) | 4,088 (31.5%) |
| Single Unit, Attached | 3,233 (25.4%) | 9,489 (74.6%) |
| 2 Unit Apartments | 8,639 (38.7%) | 13,704 (61.3%) |
| 3 or 4 Unit Apartments | 5,056 (20.4%) | 19,740 (79.6%) |
| 5 to 9 Unit Apartments | 510 (5.5%) | 8,792 (94.5%) |
| 10 or more Apartments | 560 (1.8%) | 29,667 (98.2%) |
| Mobile Home / Other | 53 (19.5%) | 219 (80.5%) |
| Total | 26,936 (23.9%) | 85,699 (76.1%) |
Housing Structures by Number of Rooms in Newark
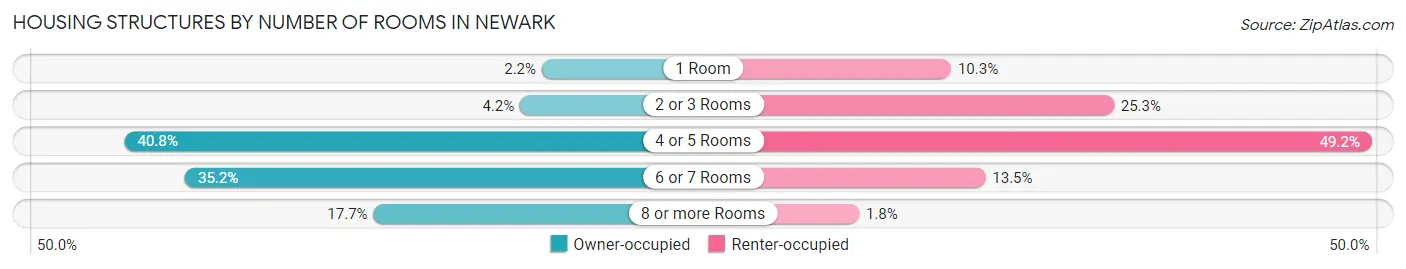
| Number of Rooms | Owner-occupied | Renter-occupied |
| 1 Room | 583 (2.2%) | 8,804 (10.3%) |
| 2 or 3 Rooms | 1,125 (4.2%) | 21,705 (25.3%) |
| 4 or 5 Rooms | 10,979 (40.8%) | 42,150 (49.2%) |
| 6 or 7 Rooms | 9,471 (35.2%) | 11,530 (13.5%) |
| 8 or more Rooms | 4,778 (17.7%) | 1,510 (1.8%) |
| Total | 26,936 (100.0%) | 85,699 (100.0%) |
Housing Structure by Heating Type in Newark
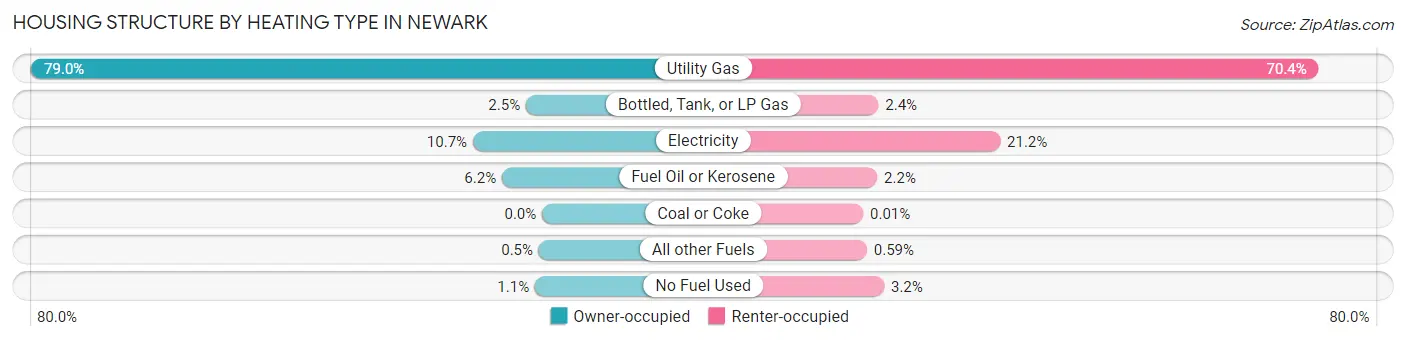
| Heating Type | Owner-occupied | Renter-occupied |
| Utility Gas | 21,283 (79.0%) | 60,351 (70.4%) |
| Bottled, Tank, or LP Gas | 672 (2.5%) | 2,031 (2.4%) |
| Electricity | 2,883 (10.7%) | 18,159 (21.2%) |
| Fuel Oil or Kerosene | 1,669 (6.2%) | 1,865 (2.2%) |
| Coal or Coke | 0 (0.0%) | 11 (0.0%) |
| All other Fuels | 134 (0.5%) | 506 (0.6%) |
| No Fuel Used | 295 (1.1%) | 2,776 (3.2%) |
| Total | 26,936 (100.0%) | 85,699 (100.0%) |
Household Vehicle Usage in Newark
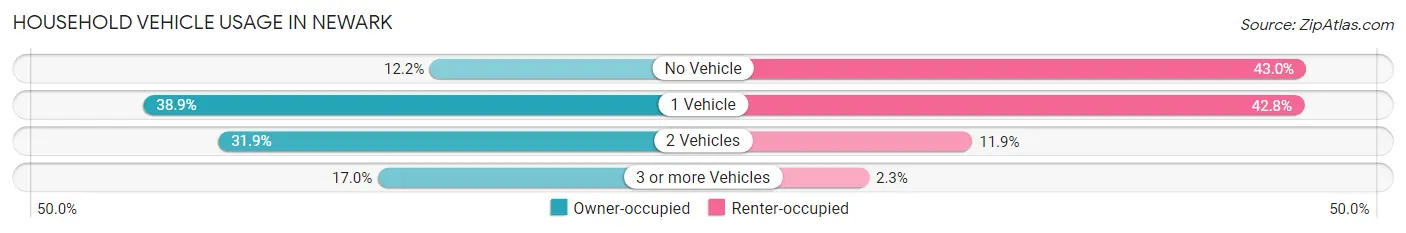
| Vehicles per Household | Owner-occupied | Renter-occupied |
| No Vehicle | 3,272 (12.1%) | 36,873 (43.0%) |
| 1 Vehicle | 10,482 (38.9%) | 36,711 (42.8%) |
| 2 Vehicles | 8,599 (31.9%) | 10,186 (11.9%) |
| 3 or more Vehicles | 4,583 (17.0%) | 1,929 (2.2%) |
| Total | 26,936 (100.0%) | 85,699 (100.0%) |
Real Estate & Mortgages in Newark
Real Estate and Mortgage Overview in Newark
| Characteristic | Without Mortgage | With Mortgage |
| Housing Units | 8,489 | 18,447 |
| Median Property Value | $286,900 | $321,100 |
| Median Household Income | $61,963 | $3,754 |
| Monthly Housing Costs | $1,044 | $4,864 |
| Real Estate Taxes | $6,880 | $1,386 |
Property Value by Mortgage Status in Newark
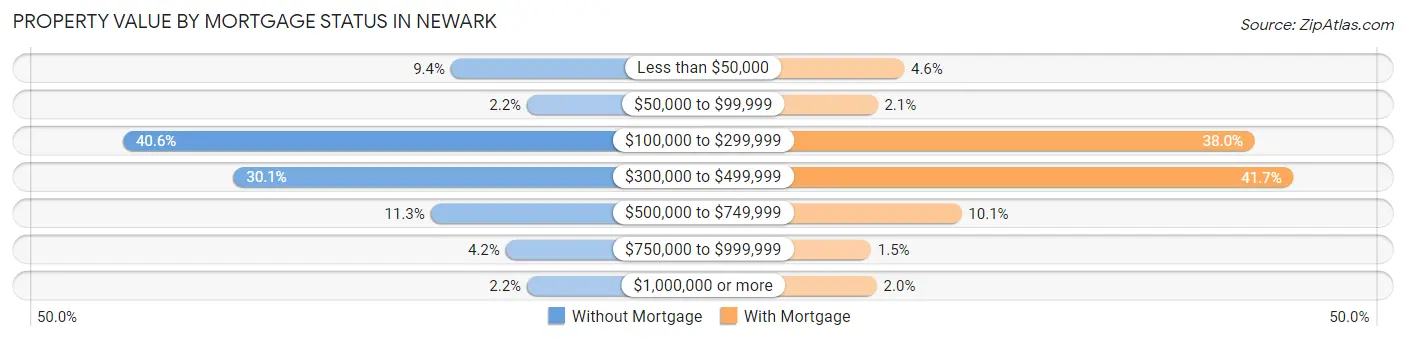
| Property Value | Without Mortgage | With Mortgage |
| Less than $50,000 | 799 (9.4%) | 852 (4.6%) |
| $50,000 to $99,999 | 183 (2.2%) | 386 (2.1%) |
| $100,000 to $299,999 | 3,449 (40.6%) | 7,015 (38.0%) |
| $300,000 to $499,999 | 2,556 (30.1%) | 7,695 (41.7%) |
| $500,000 to $749,999 | 963 (11.3%) | 1,859 (10.1%) |
| $750,000 to $999,999 | 356 (4.2%) | 269 (1.5%) |
| $1,000,000 or more | 183 (2.2%) | 371 (2.0%) |
| Total | 8,489 (100.0%) | 18,447 (100.0%) |
Household Income by Mortgage Status in Newark
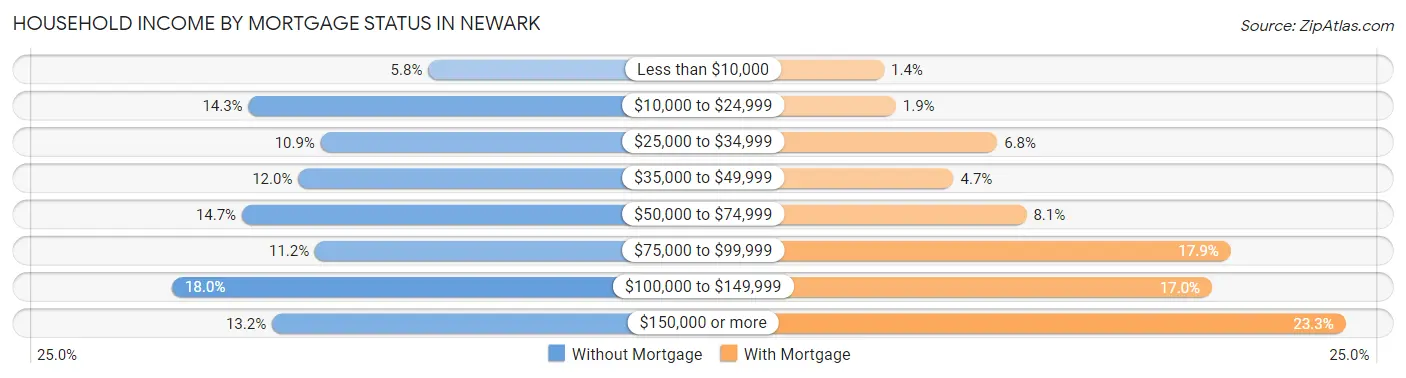
| Household Income | Without Mortgage | With Mortgage |
| Less than $10,000 | 491 (5.8%) | 251 (1.4%) |
| $10,000 to $24,999 | 1,217 (14.3%) | 355 (1.9%) |
| $25,000 to $34,999 | 925 (10.9%) | 1,245 (6.8%) |
| $35,000 to $49,999 | 1,016 (12.0%) | 862 (4.7%) |
| $50,000 to $74,999 | 1,244 (14.6%) | 1,501 (8.1%) |
| $75,000 to $99,999 | 948 (11.2%) | 3,295 (17.9%) |
| $100,000 to $149,999 | 1,526 (18.0%) | 3,131 (17.0%) |
| $150,000 or more | 1,122 (13.2%) | 4,304 (23.3%) |
| Total | 8,489 (100.0%) | 18,447 (100.0%) |
Property Value to Household Income Ratio in Newark
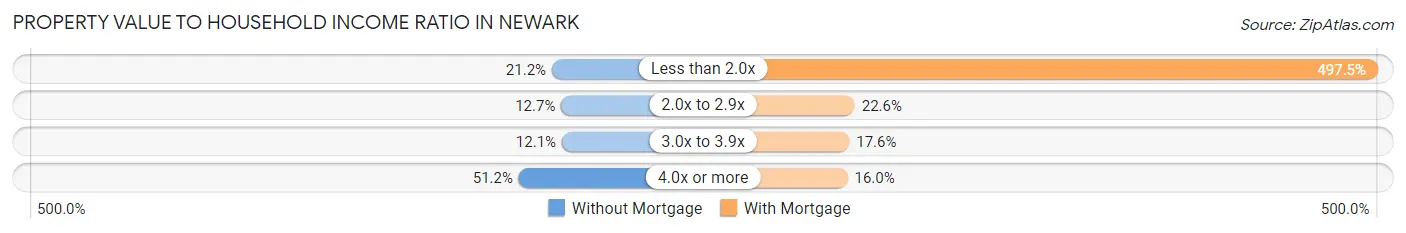
| Value-to-Income Ratio | Without Mortgage | With Mortgage |
| Less than 2.0x | 1,797 (21.2%) | 91,779 (497.5%) |
| 2.0x to 2.9x | 1,078 (12.7%) | 4,169 (22.6%) |
| 3.0x to 3.9x | 1,028 (12.1%) | 3,245 (17.6%) |
| 4.0x or more | 4,348 (51.2%) | 2,955 (16.0%) |
| Total | 8,489 (100.0%) | 18,447 (100.0%) |
Real Estate Taxes by Mortgage Status in Newark
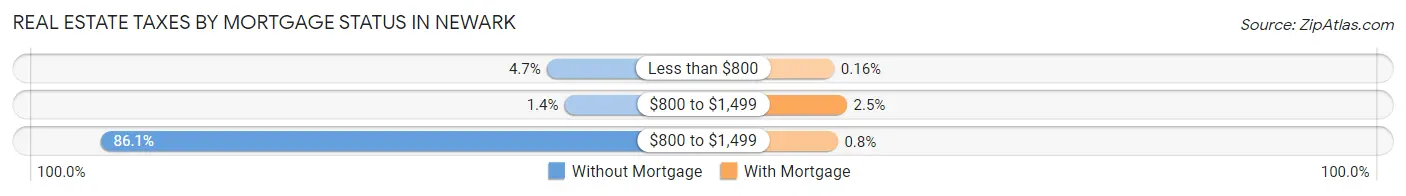
| Property Taxes | Without Mortgage | With Mortgage |
| Less than $800 | 396 (4.7%) | 30 (0.2%) |
| $800 to $1,499 | 121 (1.4%) | 455 (2.5%) |
| $800 to $1,499 | 7,309 (86.1%) | 147 (0.8%) |
| Total | 8,489 (100.0%) | 18,447 (100.0%) |
Health & Disability in Newark
Health Insurance Coverage by Age in Newark
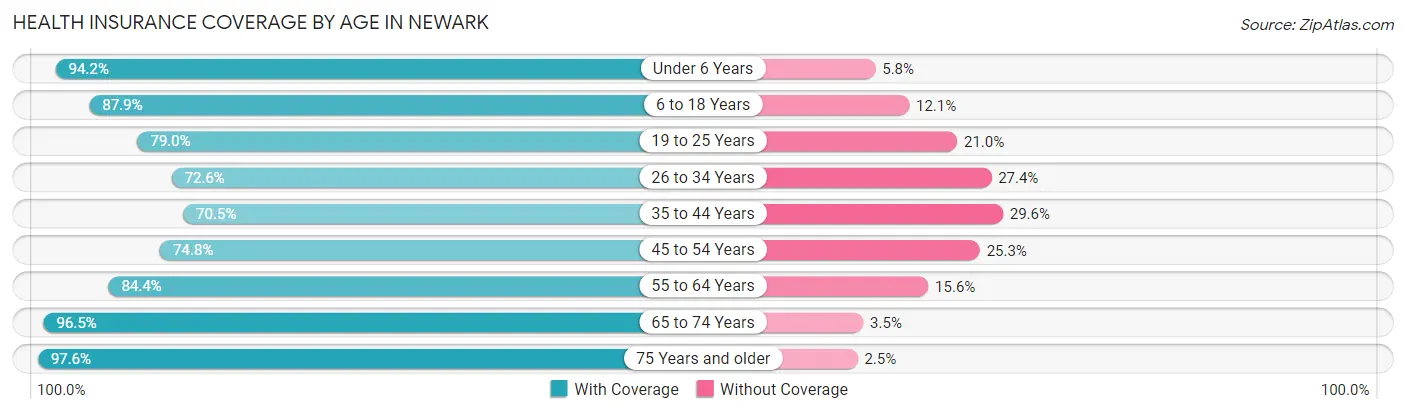
| Age Bracket | With Coverage | Without Coverage |
| Under 6 Years | 23,498 (94.2%) | 1,441 (5.8%) |
| 6 to 18 Years | 47,497 (87.9%) | 6,522 (12.1%) |
| 19 to 25 Years | 25,119 (79.0%) | 6,684 (21.0%) |
| 26 to 34 Years | 30,003 (72.6%) | 11,316 (27.4%) |
| 35 to 44 Years | 29,789 (70.5%) | 12,495 (29.5%) |
| 45 to 54 Years | 29,105 (74.8%) | 9,829 (25.3%) |
| 55 to 64 Years | 28,636 (84.4%) | 5,307 (15.6%) |
| 65 to 74 Years | 19,163 (96.5%) | 700 (3.5%) |
| 75 Years and older | 12,523 (97.6%) | 315 (2.5%) |
| Total | 245,333 (81.8%) | 54,609 (18.2%) |
Health Insurance Coverage by Citizenship Status in Newark
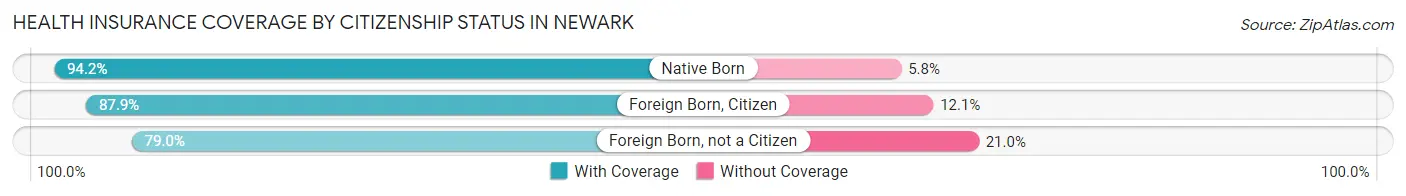
| Citizenship Status | With Coverage | Without Coverage |
| Native Born | 23,498 (94.2%) | 1,441 (5.8%) |
| Foreign Born, Citizen | 47,497 (87.9%) | 6,522 (12.1%) |
| Foreign Born, not a Citizen | 25,119 (79.0%) | 6,684 (21.0%) |
Health Insurance Coverage by Household Income in Newark
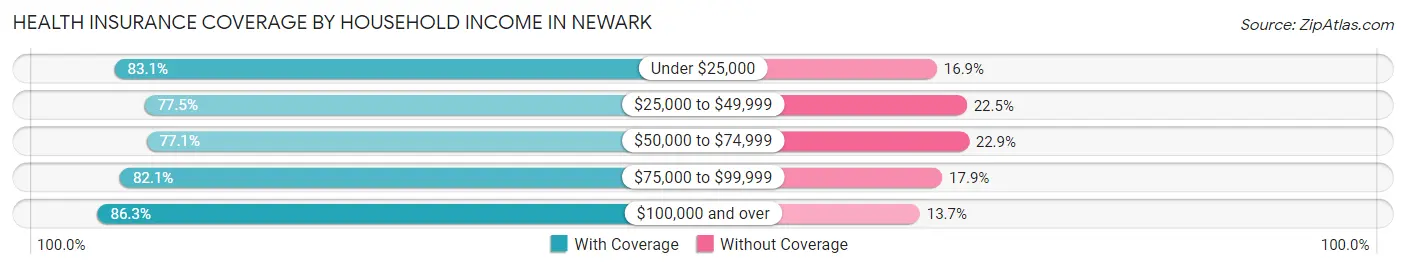
| Household Income | With Coverage | Without Coverage |
| Under $25,000 | 54,017 (83.1%) | 10,970 (16.9%) |
| $25,000 to $49,999 | 48,872 (77.5%) | 14,163 (22.5%) |
| $50,000 to $74,999 | 42,836 (77.1%) | 12,691 (22.9%) |
| $75,000 to $99,999 | 29,027 (82.1%) | 6,317 (17.9%) |
| $100,000 and over | 64,779 (86.3%) | 10,269 (13.7%) |
Public vs Private Health Insurance Coverage by Age in Newark
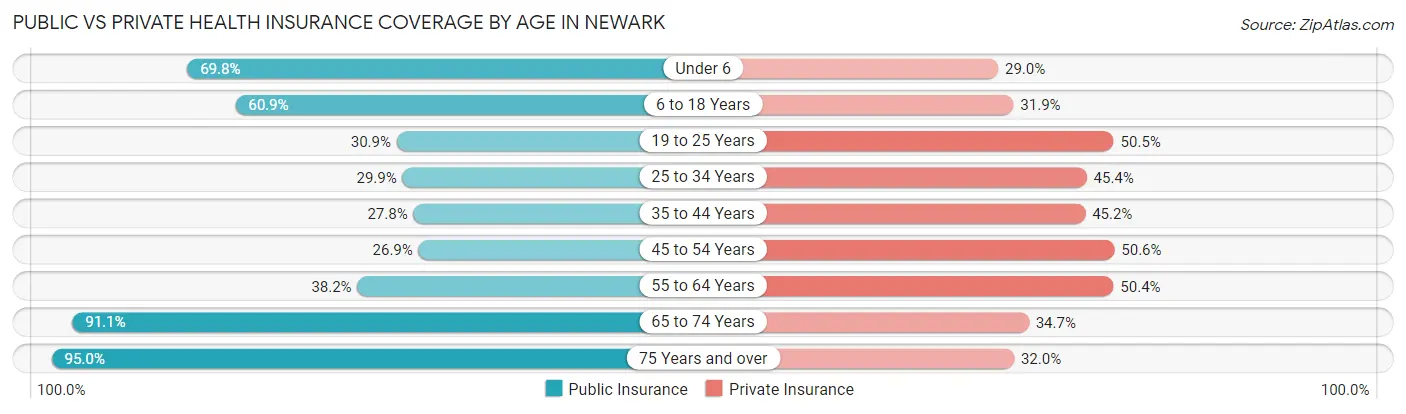
| Age Bracket | Public Insurance | Private Insurance |
| Under 6 | 17,409 (69.8%) | 7,232 (29.0%) |
| 6 to 18 Years | 32,887 (60.9%) | 17,207 (31.9%) |
| 19 to 25 Years | 9,833 (30.9%) | 16,049 (50.5%) |
| 25 to 34 Years | 12,335 (29.8%) | 18,774 (45.4%) |
| 35 to 44 Years | 11,762 (27.8%) | 19,104 (45.2%) |
| 45 to 54 Years | 10,463 (26.9%) | 19,696 (50.6%) |
| 55 to 64 Years | 12,974 (38.2%) | 17,109 (50.4%) |
| 65 to 74 Years | 18,103 (91.1%) | 6,892 (34.7%) |
| 75 Years and over | 12,196 (95.0%) | 4,103 (32.0%) |
| Total | 137,962 (46.0%) | 126,166 (42.1%) |
Disability Status by Sex by Age in Newark
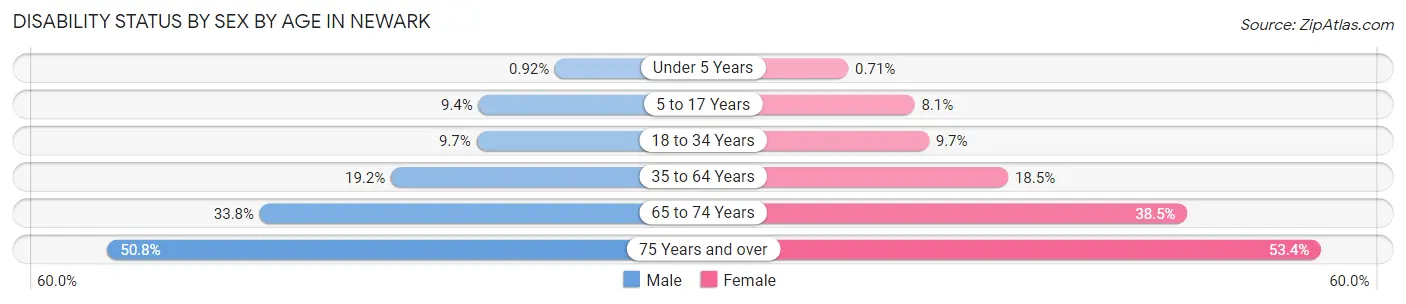
| Age Bracket | Male | Female |
| Under 5 Years | 97 (0.9%) | 71 (0.7%) |
| 5 to 17 Years | 2,659 (9.4%) | 2,042 (8.1%) |
| 18 to 34 Years | 3,711 (9.7%) | 3,851 (9.7%) |
| 35 to 64 Years | 10,601 (19.2%) | 11,087 (18.5%) |
| 65 to 74 Years | 3,032 (33.8%) | 4,193 (38.5%) |
| 75 Years and over | 2,244 (50.8%) | 4,495 (53.4%) |
Disability Class by Sex by Age in Newark
Disability Class: Hearing Difficulty
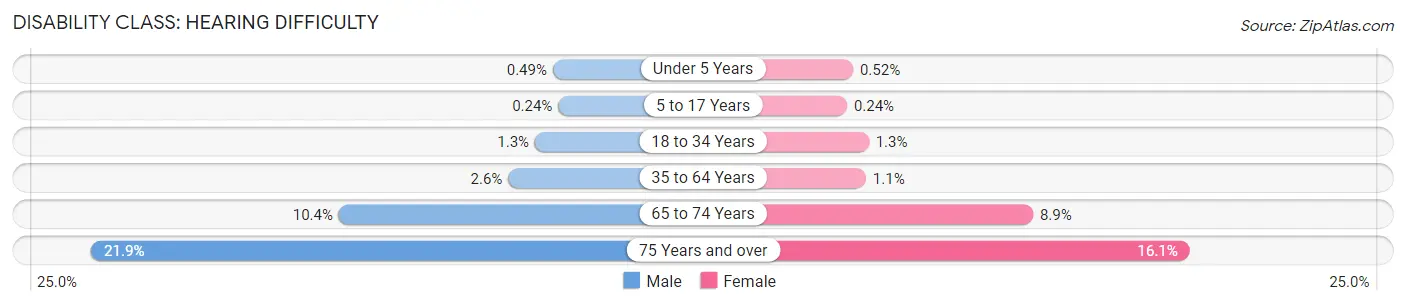
| Age Bracket | Male | Female |
| Under 5 Years | 52 (0.5%) | 52 (0.5%) |
| 5 to 17 Years | 68 (0.2%) | 61 (0.2%) |
| 18 to 34 Years | 506 (1.3%) | 496 (1.3%) |
| 35 to 64 Years | 1,416 (2.6%) | 670 (1.1%) |
| 65 to 74 Years | 935 (10.4%) | 966 (8.9%) |
| 75 Years and over | 968 (21.9%) | 1,359 (16.1%) |
Disability Class: Vision Difficulty
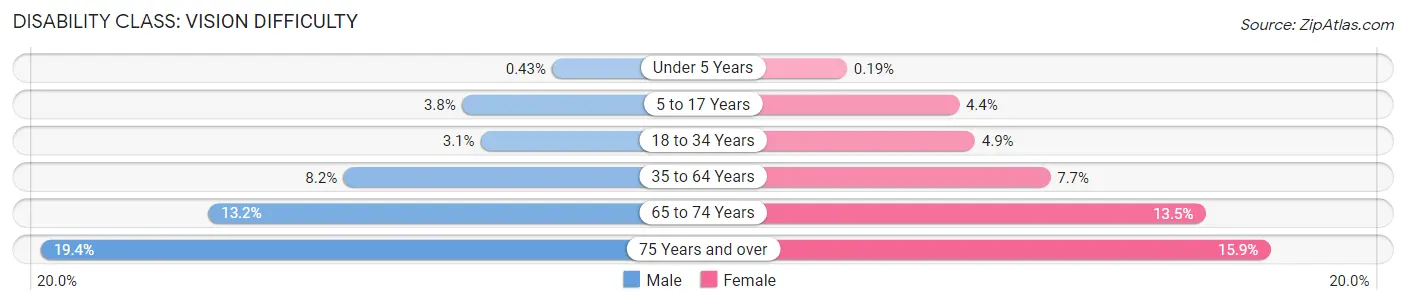
| Age Bracket | Male | Female |
| Under 5 Years | 45 (0.4%) | 19 (0.2%) |
| 5 to 17 Years | 1,063 (3.8%) | 1,097 (4.3%) |
| 18 to 34 Years | 1,180 (3.1%) | 1,965 (4.9%) |
| 35 to 64 Years | 4,523 (8.2%) | 4,636 (7.7%) |
| 65 to 74 Years | 1,182 (13.2%) | 1,469 (13.5%) |
| 75 Years and over | 857 (19.4%) | 1,339 (15.9%) |
Disability Class: Cognitive Difficulty
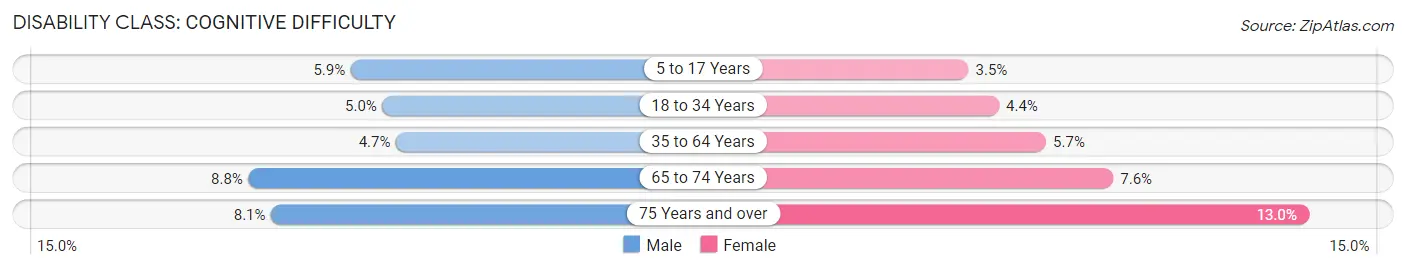
| Age Bracket | Male | Female |
| 5 to 17 Years | 1,665 (5.9%) | 891 (3.5%) |
| 18 to 34 Years | 1,931 (5.0%) | 1,740 (4.4%) |
| 35 to 64 Years | 2,571 (4.6%) | 3,407 (5.7%) |
| 65 to 74 Years | 786 (8.8%) | 824 (7.6%) |
| 75 Years and over | 359 (8.1%) | 1,095 (13.0%) |
Disability Class: Ambulatory Difficulty
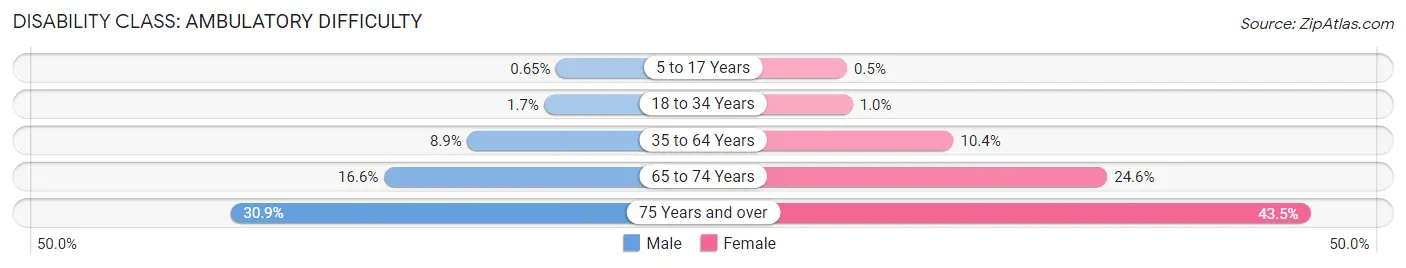
| Age Bracket | Male | Female |
| 5 to 17 Years | 183 (0.6%) | 126 (0.5%) |
| 18 to 34 Years | 665 (1.7%) | 406 (1.0%) |
| 35 to 64 Years | 4,911 (8.9%) | 6,214 (10.4%) |
| 65 to 74 Years | 1,492 (16.6%) | 2,684 (24.6%) |
| 75 Years and over | 1,365 (30.9%) | 3,662 (43.5%) |
Disability Class: Self-Care Difficulty
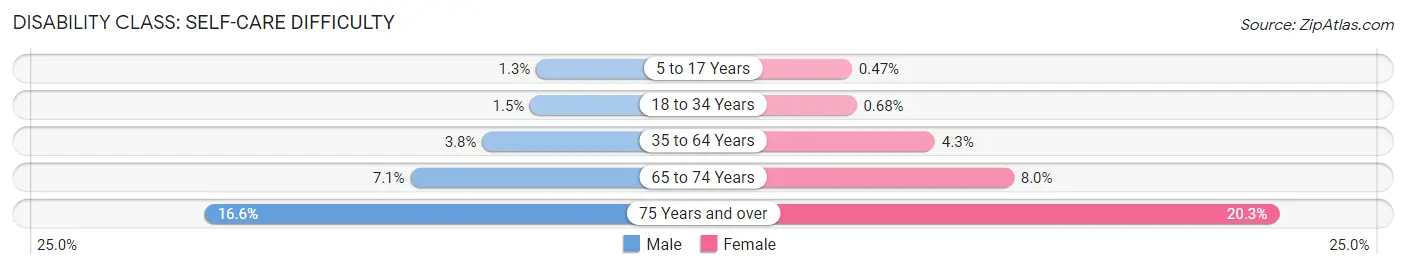
| Age Bracket | Male | Female |
| 5 to 17 Years | 355 (1.3%) | 118 (0.5%) |
| 18 to 34 Years | 590 (1.5%) | 270 (0.7%) |
| 35 to 64 Years | 2,078 (3.8%) | 2,585 (4.3%) |
| 65 to 74 Years | 637 (7.1%) | 869 (8.0%) |
| 75 Years and over | 735 (16.6%) | 1,708 (20.3%) |
Technology Access in Newark
Computing Device Access in Newark
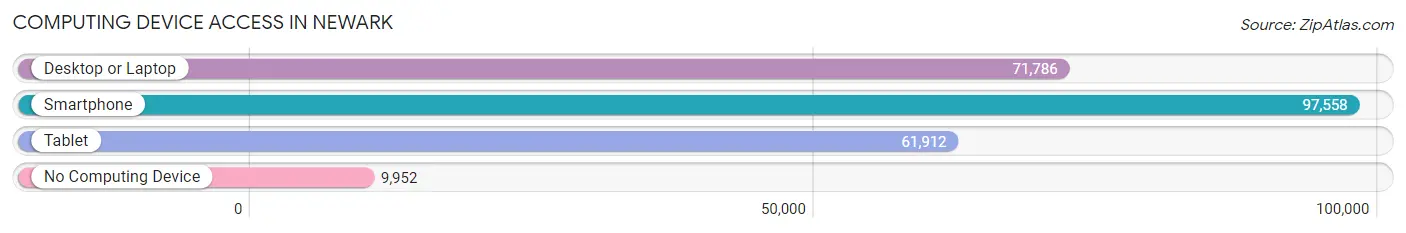
| Device Type | # Households | % Households |
| Desktop or Laptop | 71,786 | 63.7% |
| Smartphone | 97,558 | 86.6% |
| Tablet | 61,912 | 55.0% |
| No Computing Device | 9,952 | 8.8% |
| Total | 112,635 | 100.0% |
Internet Access in Newark
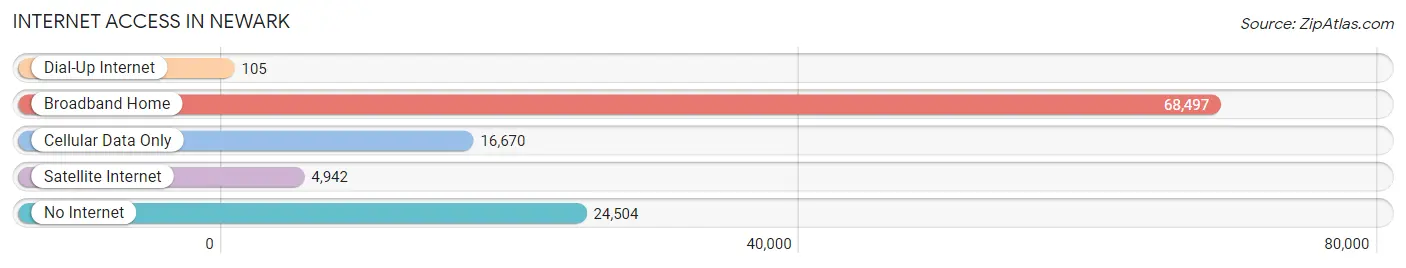
| Internet Type | # Households | % Households |
| Dial-Up Internet | 105 | 0.1% |
| Broadband Home | 68,497 | 60.8% |
| Cellular Data Only | 16,670 | 14.8% |
| Satellite Internet | 4,942 | 4.4% |
| No Internet | 24,504 | 21.8% |
| Total | 112,635 | 100.0% |
Newark Summary
Newark, New Jersey is the largest city in the state and the county seat of Essex County. It is located in the northeastern part of the state, just 8 miles west of Manhattan. Newark is a major port city and the largest city in the New York metropolitan area. It is home to a diverse population of over 280,000 people, making it the third-largest city in New Jersey.
History
The area that is now Newark was first settled by the Lenape Native Americans in the 1600s. The first European settlers arrived in 1666 and the city was officially founded in 1666 by Puritans from Connecticut. The city was named after Newark-on-Trent in England. Newark was an important port city during the American Revolution and was the site of several battles. In the 19th century, Newark became an industrial center and a major transportation hub. The city was a major center of immigration in the early 20th century, with many immigrants from Europe and the Caribbean settling in the city.
Geography
Newark is located in the northeastern part of New Jersey, just 8 miles west of Manhattan. It is situated on the Passaic River and is bordered by the cities of Elizabeth, Irvington, and East Orange. Newark is part of the Gateway Region, which includes the cities of Jersey City, Hoboken, and Bayonne. The city has a total area of 24.06 square miles, of which 23.45 square miles is land and 0.61 square miles is water.
Economy
Newark is a major economic center in the region. The city is home to several major corporations, including Prudential Financial, Panasonic, Audible, and IDT Corporation. Newark is also home to the Port Newark-Elizabeth Marine Terminal, the largest port on the East Coast. The city is also a major transportation hub, with Newark Liberty International Airport, Amtrak, and several major highways and rail lines running through the city.
Demographics
As of the 2010 census, the population of Newark was 277,140, making it the third-largest city in New Jersey. The population is racially and ethnically diverse, with African Americans making up the largest racial group at 54.2%, followed by Hispanics at 29.2%, whites at 13.2%, and Asians at 3.2%. The median household income in Newark is $35,890, and the median age is 33.7 years. The city has a poverty rate of 28.2%, which is higher than the national average.
Common Questions
What is Per Capita Income in Newark?
Per Capita income in Newark is $24,716.
What is the Median Family Income in Newark?
Median Family Income in Newark is $56,099.
What is the Median Household income in Newark?
Median Household Income in Newark is $46,460.
What is Income or Wage Gap in Newark?
Income or Wage Gap in Newark is 26.9%.
Women in Newark earn 73.1 cents for every dollar earned by a man.
What is Family Income Deficit in Newark?
Family Income Deficit in Newark is $12,135.
Families that are below poverty line in Newark earn $12,135 less on average than the poverty threshold level.
What is Inequality or Gini Index in Newark?
Inequality or Gini Index in Newark is 0.49.
What is the Total Population of Newark?
Total Population of Newark is 307,355.
What is the Total Male Population of Newark?
Total Male Population of Newark is 152,326.
What is the Total Female Population of Newark?
Total Female Population of Newark is 155,029.
What is the Ratio of Males per 100 Females in Newark?
There are 98.26 Males per 100 Females in Newark.
What is the Ratio of Females per 100 Males in Newark?
There are 101.77 Females per 100 Males in Newark.
What is the Median Population Age in Newark?
Median Population Age in Newark is 34.7 Years.
What is the Average Family Size in Newark
Average Family Size in Newark is 3.4 People.
What is the Average Household Size in Newark
Average Household Size in Newark is 2.6 People.
How Large is the Labor Force in Newark?
There are 149,929 People in the Labor Forcein in Newark.
What is the Percentage of People in the Labor Force in Newark?
62.2% of People are in the Labor Force in Newark.
What is the Unemployment Rate in Newark?
Unemployment Rate in Newark is 10.7%.