Gary, IN Map & Demographics
Gary Map
Gary Overview
$20,954
PER CAPITA INCOME
$41,355
AVG FAMILY INCOME
$36,874
AVG HOUSEHOLD INCOME
21.4%
WAGE / INCOME GAP [ % ]
78.6¢/ $1
WAGE / INCOME GAP [ $ ]
$13,614
FAMILY INCOME DEFICIT
0.47
INEQUALITY / GINI INDEX
69,136
TOTAL POPULATION
32,206
MALE POPULATION
36,930
FEMALE POPULATION
87.21
MALES / 100 FEMALES
114.67
FEMALES / 100 MALES
36.9
MEDIAN AGE
3.3
AVG FAMILY SIZE
2.5
AVG HOUSEHOLD SIZE
26,661
LABOR FORCE [ PEOPLE ]
51.0%
PERCENT IN LABOR FORCE
13.5%
UNEMPLOYMENT RATE
Gary Area Codes
Income in Gary
Income Overview in Gary
Per Capita Income in Gary is $20,954, while median incomes of families and households are $41,355 and $36,874 respectively.
| Characteristic | Number | Measure |
| Per Capita Income | 69,136 | $20,954 |
| Median Family Income | 15,844 | $41,355 |
| Mean Family Income | 15,844 | $56,475 |
| Median Household Income | 27,612 | $36,874 |
| Mean Household Income | 27,612 | $50,016 |
| Income Deficit | 15,844 | $13,614 |
| Wage / Income Gap (%) | 69,136 | 21.41% |
| Wage / Income Gap ($) | 69,136 | 78.59¢ per $1 |
| Gini / Inequality Index | 69,136 | 0.47 |
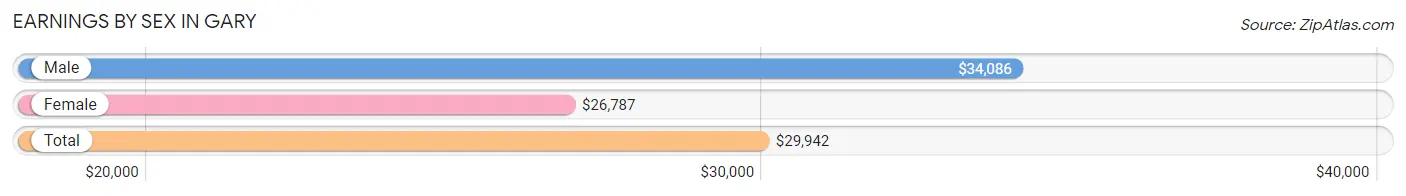
Earnings by Sex in Gary
Average Earnings in Gary are $29,942, $34,086 for men and $26,787 for women, a difference of 21.4%.
| Sex | Number | Average Earnings |
| Male | 12,249 (45.9%) | $34,086 |
| Female | 14,412 (54.1%) | $26,787 |
| Total | 26,661 (100.0%) | $29,942 |
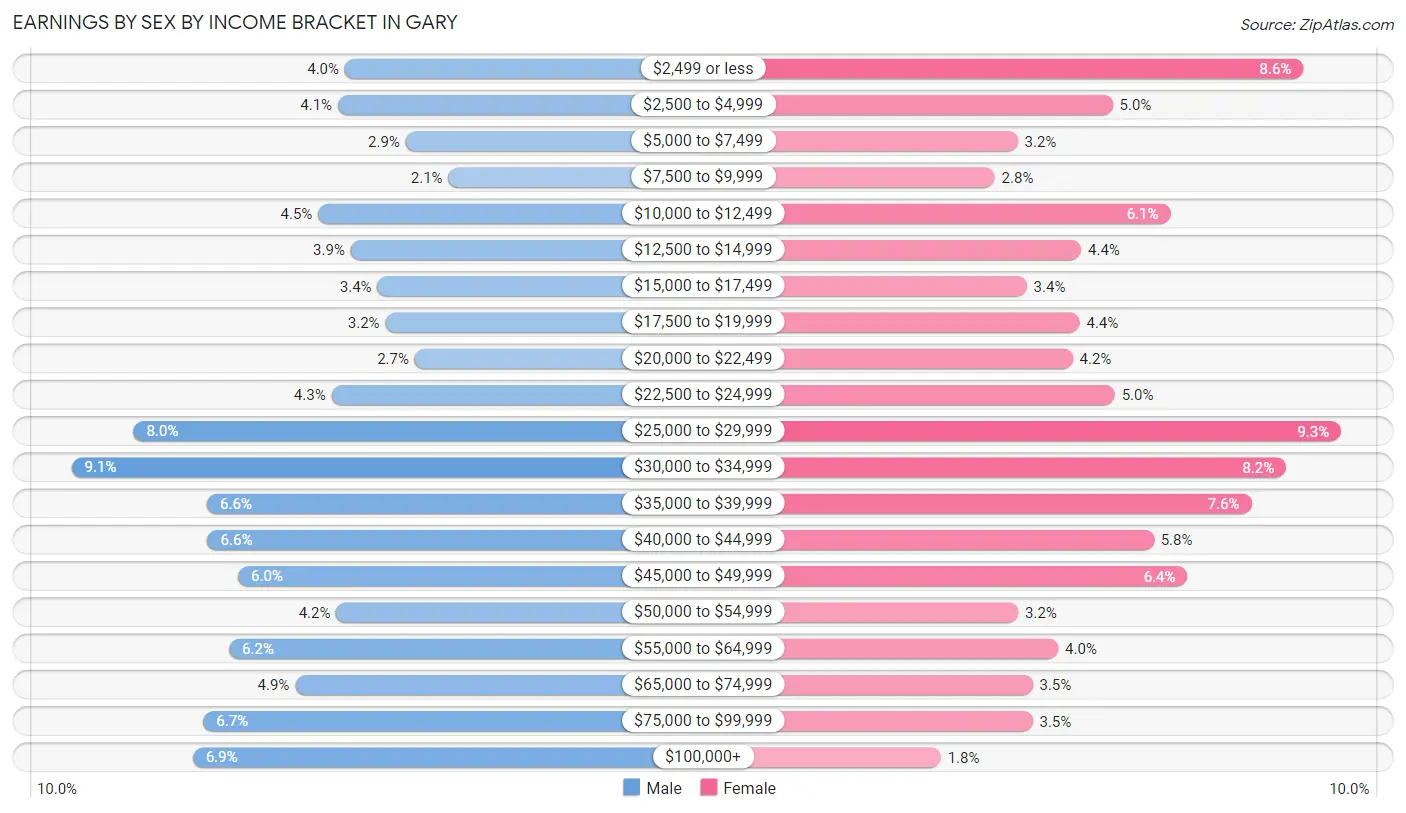
Earnings by Sex by Income Bracket in Gary
The most common earnings brackets in Gary are $30,000 to $34,999 for men (1,117 | 9.1%) and $25,000 to $29,999 for women (1,335 | 9.3%).
| Income | Male | Female |
| $2,499 or less | 490 (4.0%) | 1,232 (8.6%) |
| $2,500 to $4,999 | 506 (4.1%) | 717 (5.0%) |
| $5,000 to $7,499 | 350 (2.9%) | 461 (3.2%) |
| $7,500 to $9,999 | 252 (2.1%) | 399 (2.8%) |
| $10,000 to $12,499 | 551 (4.5%) | 873 (6.1%) |
| $12,500 to $14,999 | 477 (3.9%) | 633 (4.4%) |
| $15,000 to $17,499 | 415 (3.4%) | 486 (3.4%) |
| $17,500 to $19,999 | 397 (3.2%) | 628 (4.4%) |
| $20,000 to $22,499 | 330 (2.7%) | 609 (4.2%) |
| $22,500 to $24,999 | 520 (4.3%) | 724 (5.0%) |
| $25,000 to $29,999 | 975 (8.0%) | 1,335 (9.3%) |
| $30,000 to $34,999 | 1,117 (9.1%) | 1,186 (8.2%) |
| $35,000 to $39,999 | 806 (6.6%) | 1,092 (7.6%) |
| $40,000 to $44,999 | 805 (6.6%) | 829 (5.8%) |
| $45,000 to $49,999 | 735 (6.0%) | 919 (6.4%) |
| $50,000 to $54,999 | 509 (4.2%) | 463 (3.2%) |
| $55,000 to $64,999 | 756 (6.2%) | 570 (4.0%) |
| $65,000 to $74,999 | 604 (4.9%) | 501 (3.5%) |
| $75,000 to $99,999 | 815 (6.7%) | 502 (3.5%) |
| $100,000+ | 839 (6.9%) | 253 (1.8%) |
| Total | 12,249 (100.0%) | 14,412 (100.0%) |
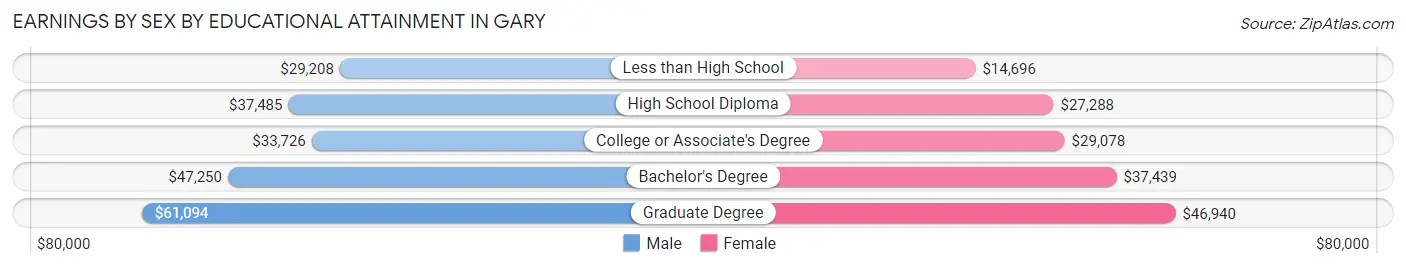
Earnings by Sex by Educational Attainment in Gary
Average earnings in Gary are $36,549 for men and $29,353 for women, a difference of 19.7%. Men with an educational attainment of graduate degree enjoy the highest average annual earnings of $61,094, while those with less than high school education earn the least with $29,208. Women with an educational attainment of graduate degree earn the most with the average annual earnings of $46,940, while those with less than high school education have the smallest earnings of $14,696.
| Educational Attainment | Male Income | Female Income |
| Less than High School | $29,208 | $14,696 |
| High School Diploma | $37,485 | $27,288 |
| College or Associate's Degree | $33,726 | $29,078 |
| Bachelor's Degree | $47,250 | $37,439 |
| Graduate Degree | $61,094 | $46,940 |
| Total | $36,549 | $29,353 |
Family Income in Gary
Family Income Brackets in Gary
According to the Gary family income data, there are 2,868 families falling into the $50,000 to $74,999 income range, which is the most common income bracket and makes up 18.1% of all families. Conversely, the $200,000+ income bracket is the least frequent group with only 301 families (1.9%) belonging to this category.
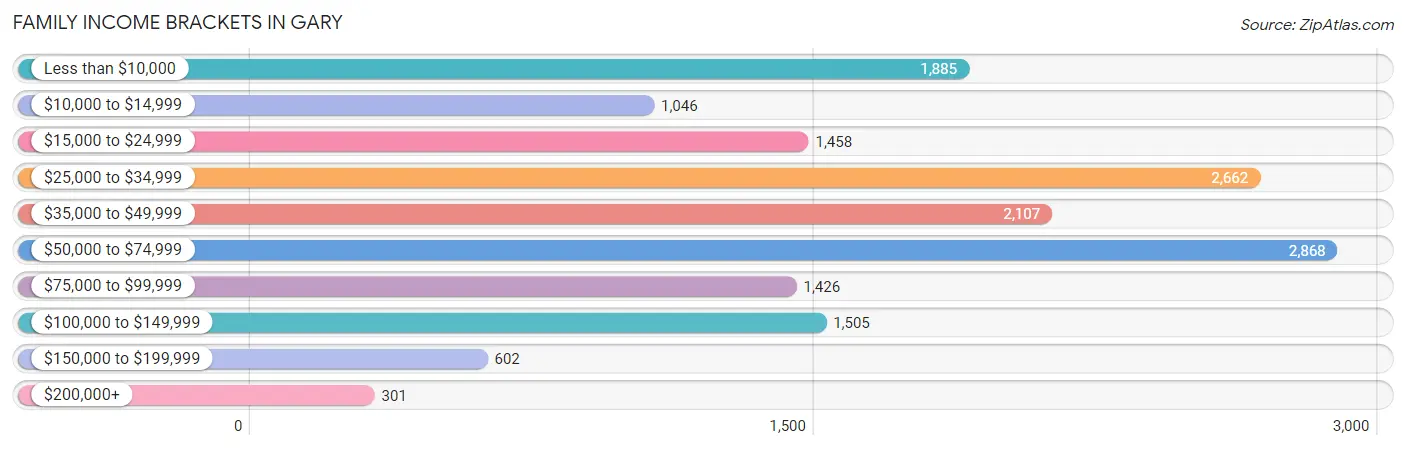
| Income Bracket | # Families | % Families |
| Less than $10,000 | 1,885 | 11.9% |
| $10,000 to $14,999 | 1,046 | 6.6% |
| $15,000 to $24,999 | 1,458 | 9.2% |
| $25,000 to $34,999 | 2,662 | 16.8% |
| $35,000 to $49,999 | 2,107 | 13.3% |
| $50,000 to $74,999 | 2,868 | 18.1% |
| $75,000 to $99,999 | 1,426 | 9.0% |
| $100,000 to $149,999 | 1,505 | 9.5% |
| $150,000 to $199,999 | 602 | 3.8% |
| $200,000+ | 301 | 1.9% |
Family Income by Famaliy Size in Gary
6-person families (504 | 3.2%) account for the highest median family income in Gary with $51,636 per family, while 2-person families (7,580 | 47.8%) have the highest median income of $24,131 per family member.
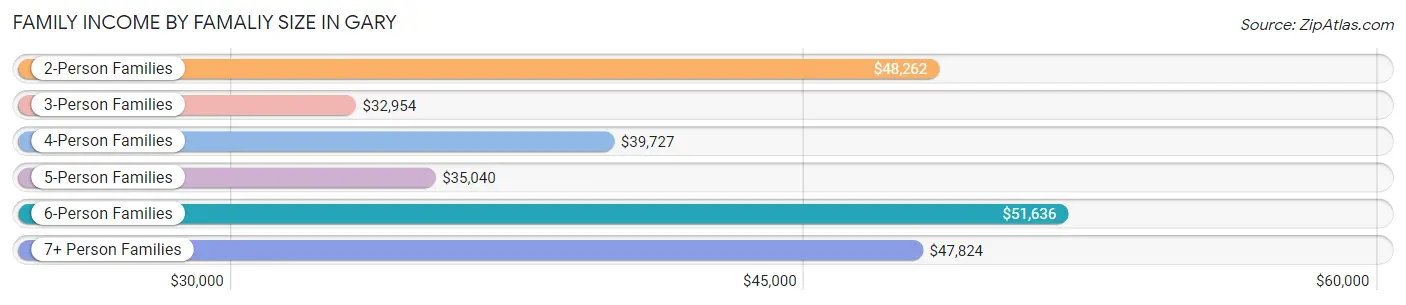
| Income Bracket | # Families | Median Income |
| 2-Person Families | 7,580 (47.8%) | $48,262 |
| 3-Person Families | 3,804 (24.0%) | $32,954 |
| 4-Person Families | 2,232 (14.1%) | $39,727 |
| 5-Person Families | 1,145 (7.2%) | $35,040 |
| 6-Person Families | 504 (3.2%) | $51,636 |
| 7+ Person Families | 579 (3.6%) | $47,824 |
| Total | 15,844 (100.0%) | $41,355 |
Family Income by Number of Earners in Gary
The median family income in Gary is $41,355, with families comprising 3+ earners (1,016) having the highest median family income of $128,370, while families with no earners (3,908) have the lowest median family income of $22,937, accounting for 6.4% and 24.7% of families, respectively.
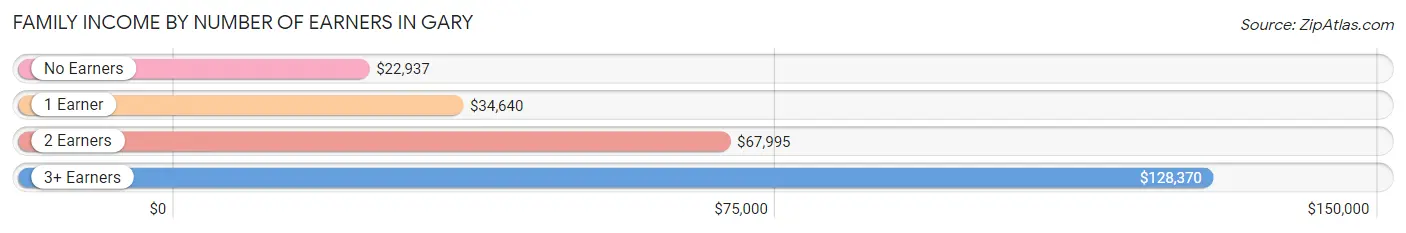
| Number of Earners | # Families | Median Income |
| No Earners | 3,908 (24.7%) | $22,937 |
| 1 Earner | 7,447 (47.0%) | $34,640 |
| 2 Earners | 3,473 (21.9%) | $67,995 |
| 3+ Earners | 1,016 (6.4%) | $128,370 |
| Total | 15,844 (100.0%) | $41,355 |
Household Income in Gary
Household Income Brackets in Gary
With 4,611 households falling in the category, the $50,000 to $74,999 income range is the most frequent in Gary, accounting for 16.7% of all households. In contrast, only 331 households (1.2%) fall into the $200,000+ income bracket, making it the least populous group.
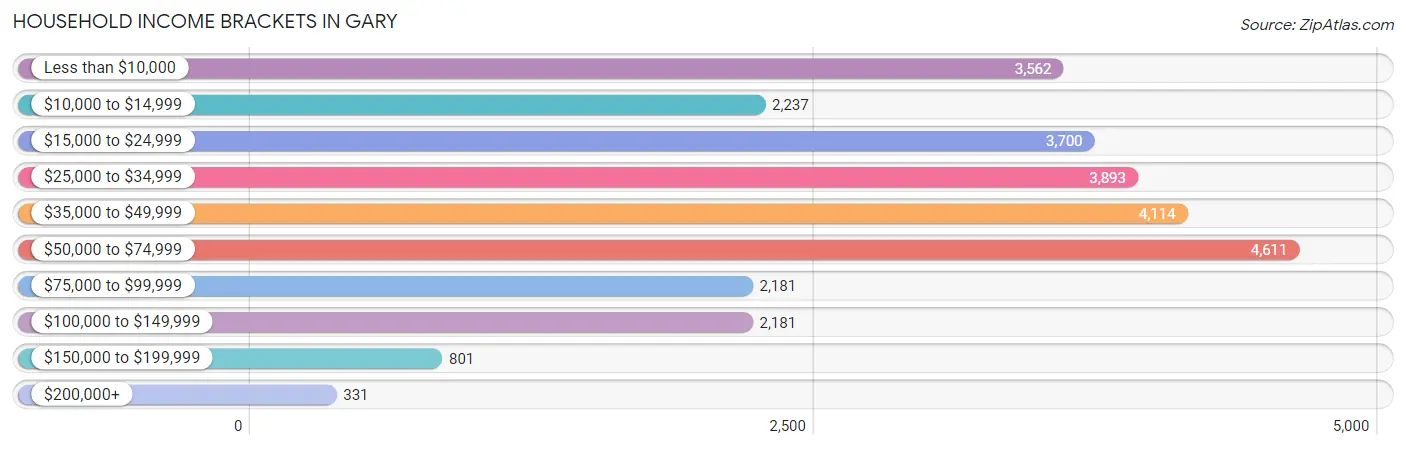
| Income Bracket | # Households | % Households |
| Less than $10,000 | 3,562 | 12.9% |
| $10,000 to $14,999 | 2,237 | 8.1% |
| $15,000 to $24,999 | 3,700 | 13.4% |
| $25,000 to $34,999 | 3,893 | 14.1% |
| $35,000 to $49,999 | 4,114 | 14.9% |
| $50,000 to $74,999 | 4,611 | 16.7% |
| $75,000 to $99,999 | 2,181 | 7.9% |
| $100,000 to $149,999 | 2,181 | 7.9% |
| $150,000 to $199,999 | 801 | 2.9% |
| $200,000+ | 331 | 1.2% |
Household Income by Householder Age in Gary
The median household income in Gary is $36,874, with the highest median household income of $45,299 found in the 45 to 64 years age bracket for the primary householder. A total of 9,291 households (33.7%) fall into this category. Meanwhile, the 15 to 24 years age bracket for the primary householder has the lowest median household income of $24,737, with 832 households (3.0%) in this group.
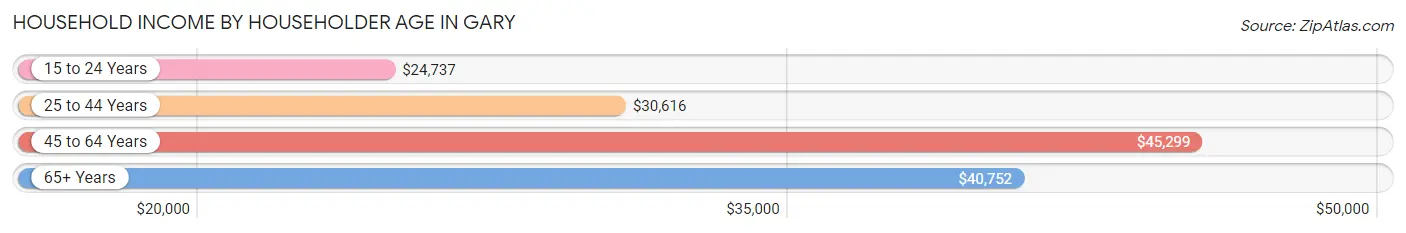
| Income Bracket | # Households | Median Income |
| 15 to 24 Years | 832 (3.0%) | $24,737 |
| 25 to 44 Years | 8,478 (30.7%) | $30,616 |
| 45 to 64 Years | 9,291 (33.7%) | $45,299 |
| 65+ Years | 9,011 (32.6%) | $40,752 |
| Total | 27,612 (100.0%) | $36,874 |
Poverty in Gary
Income Below Poverty by Sex and Age in Gary
With 30.0% poverty level for males and 34.1% for females among the residents of Gary, 15 year old males and 15 year old females are the most vulnerable to poverty, with 365 males (74.5%) and 307 females (63.4%) in their respective age groups living below the poverty level.
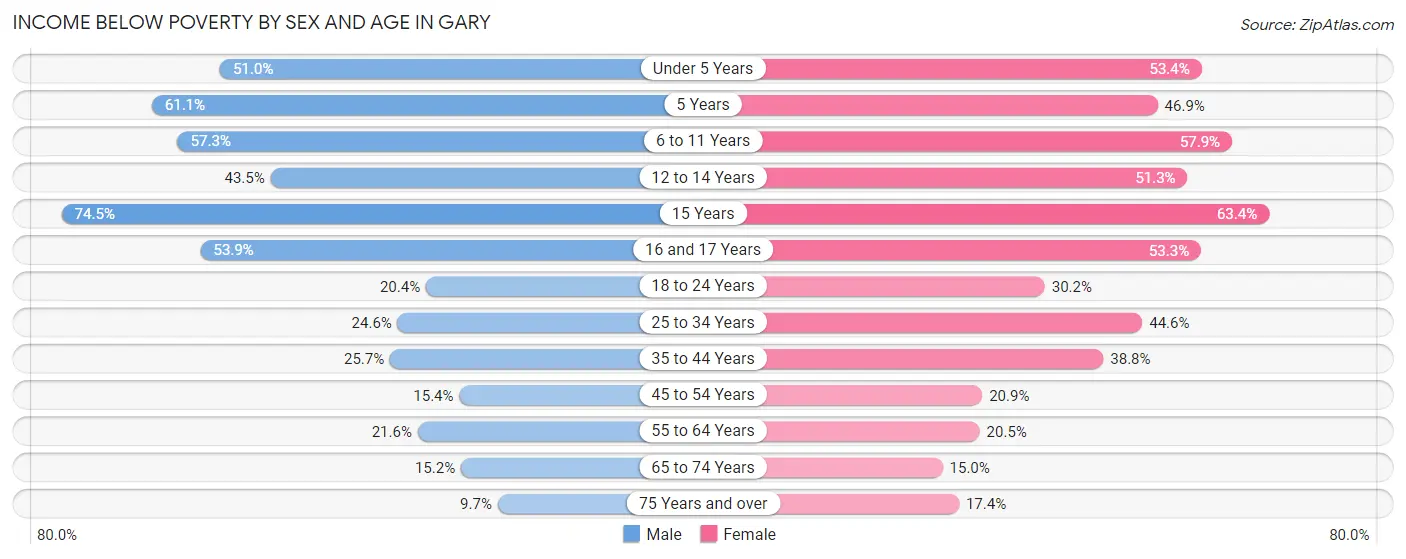
| Age Bracket | Male | Female |
| Under 5 Years | 1,349 (51.0%) | 1,144 (53.4%) |
| 5 Years | 223 (61.1%) | 454 (46.9%) |
| 6 to 11 Years | 2,079 (57.3%) | 1,728 (57.9%) |
| 12 to 14 Years | 583 (43.5%) | 757 (51.3%) |
| 15 Years | 365 (74.5%) | 307 (63.4%) |
| 16 and 17 Years | 582 (53.9%) | 601 (53.3%) |
| 18 to 24 Years | 551 (20.4%) | 928 (30.1%) |
| 25 to 34 Years | 861 (24.6%) | 2,001 (44.6%) |
| 35 to 44 Years | 888 (25.7%) | 1,737 (38.8%) |
| 45 to 54 Years | 573 (15.4%) | 748 (20.8%) |
| 55 to 64 Years | 807 (21.6%) | 918 (20.5%) |
| 65 to 74 Years | 504 (15.2%) | 673 (15.0%) |
| 75 Years and over | 183 (9.7%) | 497 (17.4%) |
| Total | 9,548 (30.0%) | 12,493 (34.1%) |
Income Above Poverty by Sex and Age in Gary
According to the poverty statistics in Gary, males aged 75 years and over and females aged 65 to 74 years are the age groups that are most secure financially, with 90.3% of males and 85.0% of females in these age groups living above the poverty line.
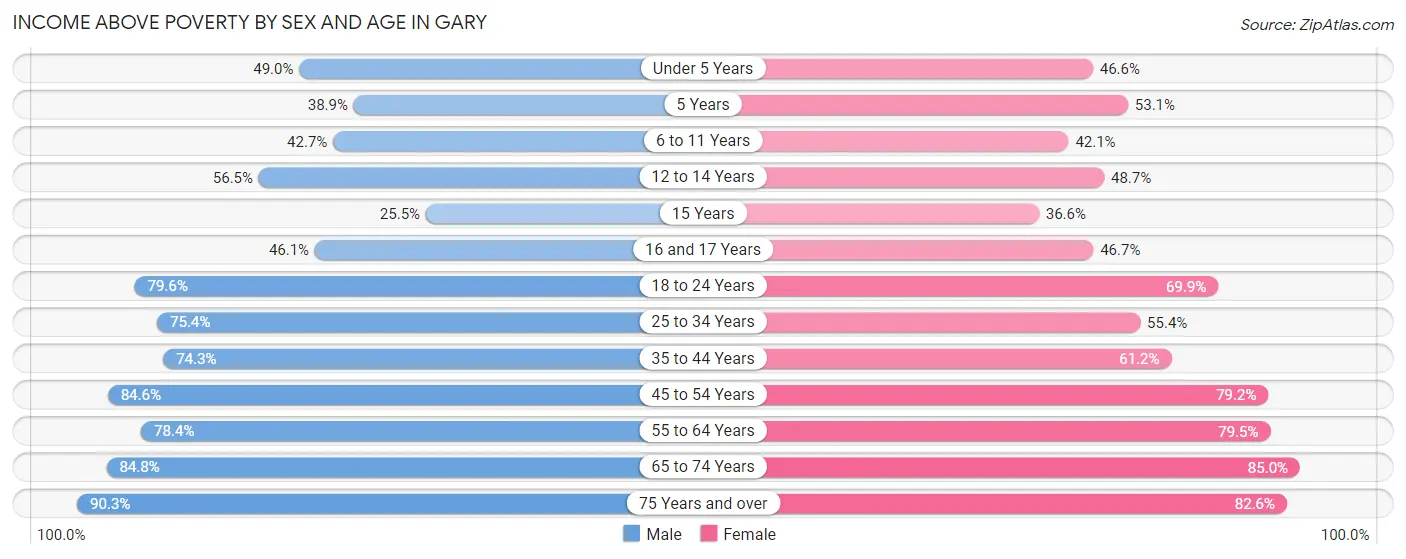
| Age Bracket | Male | Female |
| Under 5 Years | 1,297 (49.0%) | 998 (46.6%) |
| 5 Years | 142 (38.9%) | 514 (53.1%) |
| 6 to 11 Years | 1,551 (42.7%) | 1,255 (42.1%) |
| 12 to 14 Years | 758 (56.5%) | 718 (48.7%) |
| 15 Years | 125 (25.5%) | 177 (36.6%) |
| 16 and 17 Years | 498 (46.1%) | 526 (46.7%) |
| 18 to 24 Years | 2,150 (79.6%) | 2,150 (69.9%) |
| 25 to 34 Years | 2,639 (75.4%) | 2,484 (55.4%) |
| 35 to 44 Years | 2,563 (74.3%) | 2,735 (61.2%) |
| 45 to 54 Years | 3,137 (84.6%) | 2,839 (79.1%) |
| 55 to 64 Years | 2,926 (78.4%) | 3,567 (79.5%) |
| 65 to 74 Years | 2,811 (84.8%) | 3,823 (85.0%) |
| 75 Years and over | 1,696 (90.3%) | 2,359 (82.6%) |
| Total | 22,293 (70.0%) | 24,145 (65.9%) |
Income Below Poverty Among Married-Couple Families in Gary
The poverty statistics for married-couple families in Gary show that 7.9% or 448 of the total 5,661 families live below the poverty line. Families with 5 or more children have the highest poverty rate of 53.8%, comprising of 70 families. On the other hand, families with no children have the lowest poverty rate of 5.8%, which includes 239 families.
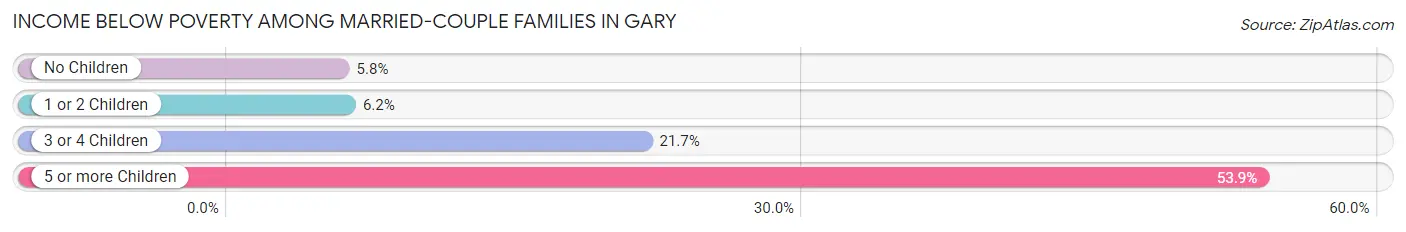
| Children | Above Poverty | Below Poverty |
| No Children | 3,860 (94.2%) | 239 (5.8%) |
| 1 or 2 Children | 1,036 (93.8%) | 68 (6.2%) |
| 3 or 4 Children | 257 (78.3%) | 71 (21.6%) |
| 5 or more Children | 60 (46.2%) | 70 (53.8%) |
| Total | 5,213 (92.1%) | 448 (7.9%) |
Income Below Poverty Among Single-Parent Households in Gary
According to the poverty data in Gary, 28.3% or 566 single-father households and 41.7% or 3,410 single-mother households are living below the poverty line. Among single-father households, those with 3 or 4 children have the highest poverty rate, with 167 households (61.4%) experiencing poverty. Likewise, among single-mother households, those with 5 or more children have the highest poverty rate, with 317 households (97.2%) falling below the poverty line.
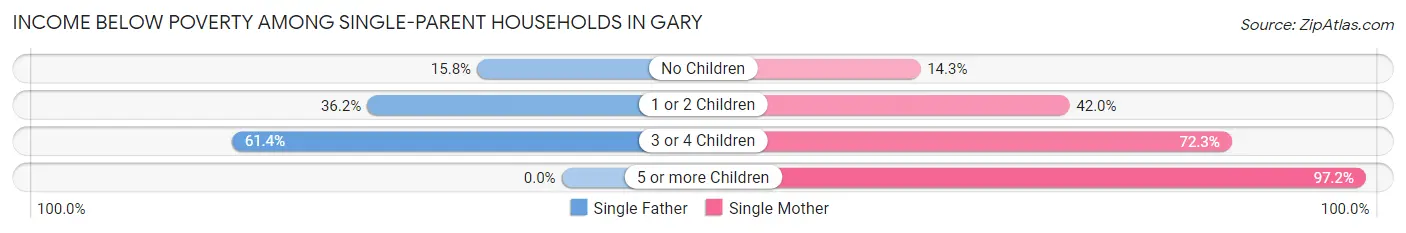
| Children | Single Father | Single Mother |
| No Children | 174 (15.8%) | 325 (14.3%) |
| 1 or 2 Children | 225 (36.2%) | 1,758 (42.0%) |
| 3 or 4 Children | 167 (61.4%) | 1,010 (72.3%) |
| 5 or more Children | 0 (0.0%) | 317 (97.2%) |
| Total | 566 (28.3%) | 3,410 (41.7%) |
Income Below Poverty Among Married-Couple vs Single-Parent Households in Gary
The poverty data for Gary shows that 448 of the married-couple family households (7.9%) and 3,976 of the single-parent households (39.1%) are living below the poverty level. Within the married-couple family households, those with 5 or more children have the highest poverty rate, with 70 households (53.8%) falling below the poverty line. Among the single-parent households, those with 5 or more children have the highest poverty rate, with 317 household (97.2%) living below poverty.
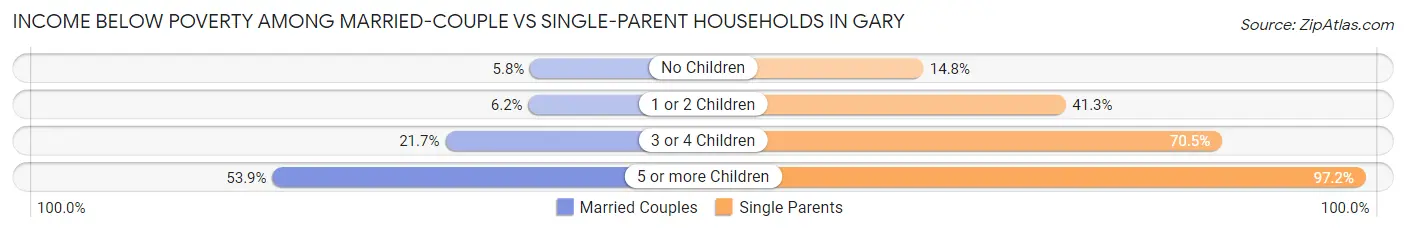
| Children | Married-Couple Families | Single-Parent Households |
| No Children | 239 (5.8%) | 499 (14.7%) |
| 1 or 2 Children | 68 (6.2%) | 1,983 (41.3%) |
| 3 or 4 Children | 71 (21.6%) | 1,177 (70.5%) |
| 5 or more Children | 70 (53.8%) | 317 (97.2%) |
| Total | 448 (7.9%) | 3,976 (39.1%) |
Race in Gary
The most populous races in Gary are Black / African American (53,623 | 77.6%), White / Caucasian (9,041 | 13.1%), and Hispanic or Latino (6,502 | 9.4%).
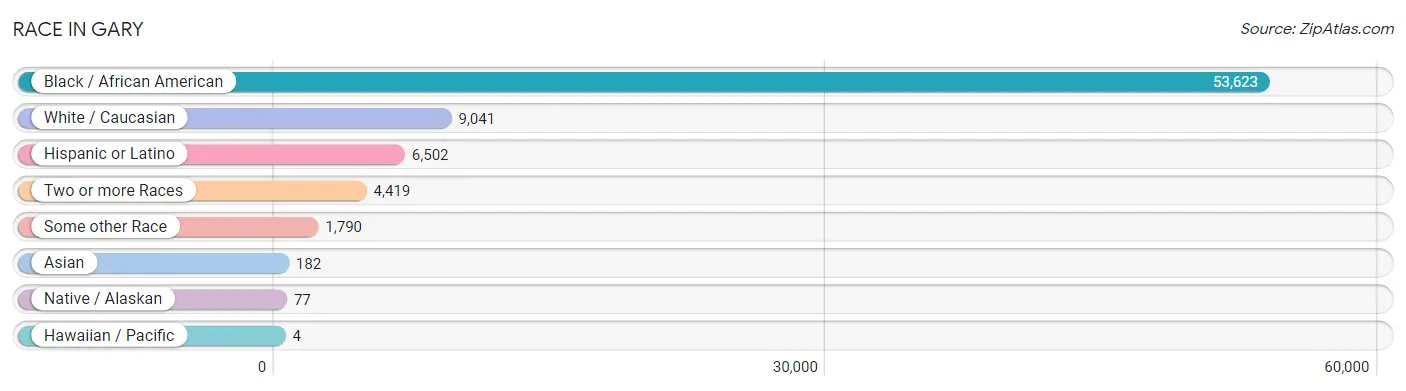
| Race | # Population | % Population |
| Asian | 182 | 0.3% |
| Black / African American | 53,623 | 77.6% |
| Hawaiian / Pacific | 4 | 0.0% |
| Hispanic or Latino | 6,502 | 9.4% |
| Native / Alaskan | 77 | 0.1% |
| White / Caucasian | 9,041 | 13.1% |
| Two or more Races | 4,419 | 6.4% |
| Some other Race | 1,790 | 2.6% |
| Total | 69,136 | 100.0% |
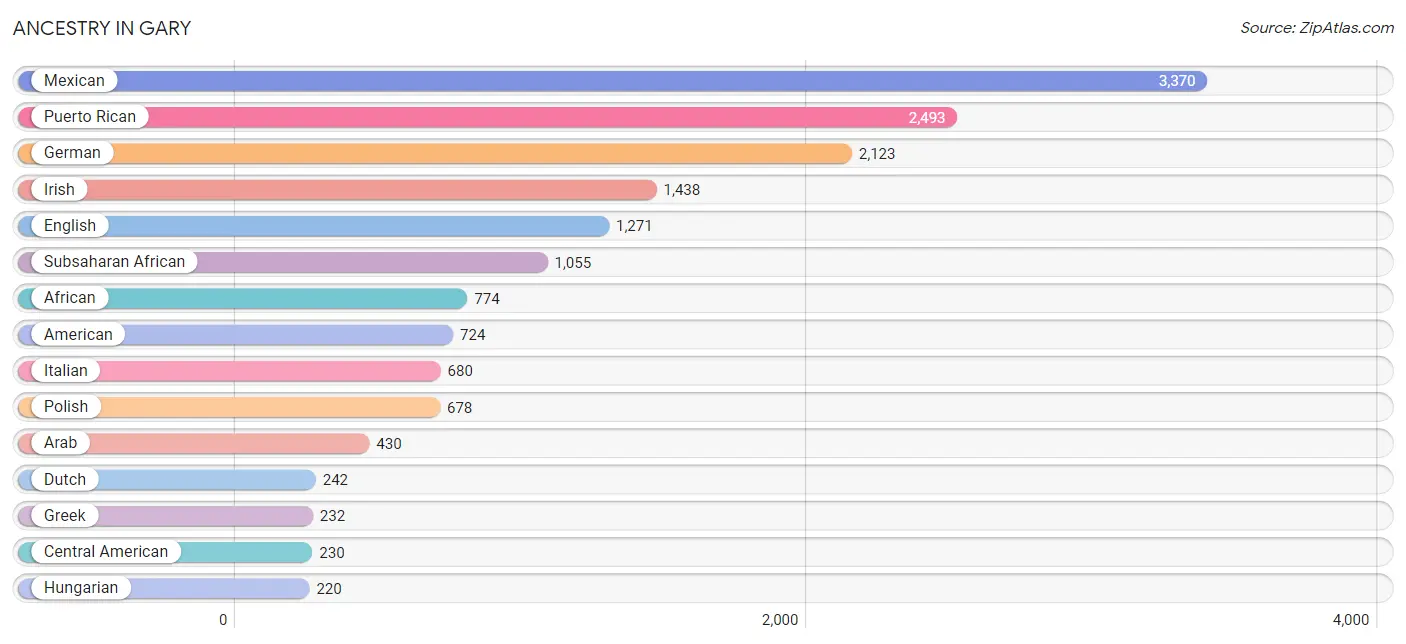
Ancestry in Gary
The most populous ancestries reported in Gary are Mexican (3,370 | 4.9%), Puerto Rican (2,493 | 3.6%), German (2,123 | 3.1%), Irish (1,438 | 2.1%), and English (1,271 | 1.8%), together accounting for 15.5% of all Gary residents.
| Ancestry | # Population | % Population |
| African | 774 | 1.1% |
| American | 724 | 1.1% |
| Arab | 430 | 0.6% |
| Armenian | 14 | 0.0% |
| Australian | 8 | 0.0% |
| Barbadian | 2 | 0.0% |
| Belgian | 9 | 0.0% |
| Bhutanese | 10 | 0.0% |
| Blackfeet | 50 | 0.1% |
| Brazilian | 45 | 0.1% |
| British | 59 | 0.1% |
| Burmese | 41 | 0.1% |
| Central American | 230 | 0.3% |
| Cherokee | 209 | 0.3% |
| Choctaw | 61 | 0.1% |
| Croatian | 75 | 0.1% |
| Cuban | 85 | 0.1% |
| Czech | 22 | 0.0% |
| Czechoslovakian | 27 | 0.0% |
| Danish | 11 | 0.0% |
| Delaware | 10 | 0.0% |
| Dutch | 242 | 0.4% |
| English | 1,271 | 1.8% |
| Estonian | 5 | 0.0% |
| Ethiopian | 113 | 0.2% |
| European | 142 | 0.2% |
| Finnish | 13 | 0.0% |
| French | 196 | 0.3% |
| French Canadian | 10 | 0.0% |
| German | 2,123 | 3.1% |
| Greek | 232 | 0.3% |
| Guatemalan | 99 | 0.1% |
| Haitian | 160 | 0.2% |
| Honduran | 131 | 0.2% |
| Hungarian | 220 | 0.3% |
| Indian (Asian) | 102 | 0.2% |
| Irish | 1,438 | 2.1% |
| Iroquois | 88 | 0.1% |
| Israeli | 35 | 0.1% |
| Italian | 680 | 1.0% |
| Jamaican | 44 | 0.1% |
| Korean | 158 | 0.2% |
| Lebanese | 192 | 0.3% |
| Lithuanian | 32 | 0.1% |
| Macedonian | 36 | 0.1% |
| Mexican | 3,370 | 4.9% |
| Mexican American Indian | 5 | 0.0% |
| Native Hawaiian | 26 | 0.0% |
| Nigerian | 123 | 0.2% |
| Northern European | 19 | 0.0% |
| Norwegian | 38 | 0.1% |
| Ottawa | 16 | 0.0% |
| Pakistani | 22 | 0.0% |
| Peruvian | 8 | 0.0% |
| Polish | 678 | 1.0% |
| Potawatomi | 8 | 0.0% |
| Puerto Rican | 2,493 | 3.6% |
| Romanian | 3 | 0.0% |
| Russian | 5 | 0.0% |
| Samoan | 4 | 0.0% |
| Scandinavian | 17 | 0.0% |
| Scotch-Irish | 37 | 0.1% |
| Scottish | 175 | 0.3% |
| Serbian | 80 | 0.1% |
| Sioux | 14 | 0.0% |
| Slovak | 144 | 0.2% |
| South African | 11 | 0.0% |
| South American | 74 | 0.1% |
| Spaniard | 80 | 0.1% |
| Subsaharan African | 1,055 | 1.5% |
| Sudanese | 34 | 0.1% |
| Swedish | 125 | 0.2% |
| Syrian | 14 | 0.0% |
| Thai | 20 | 0.0% |
| Trinidadian and Tobagonian | 5 | 0.0% |
| Turkish | 123 | 0.2% |
| Venezuelan | 66 | 0.1% |
| Yugoslavian | 22 | 0.0% | View All 78 Rows |
Immigrants in Gary
The most numerous immigrant groups reported in Gary came from Latin America (803 | 1.2%), Central America (685 | 1.0%), Mexico (538 | 0.8%), Africa (221 | 0.3%), and Eastern Africa (137 | 0.2%), together accounting for 3.5% of all Gary residents.
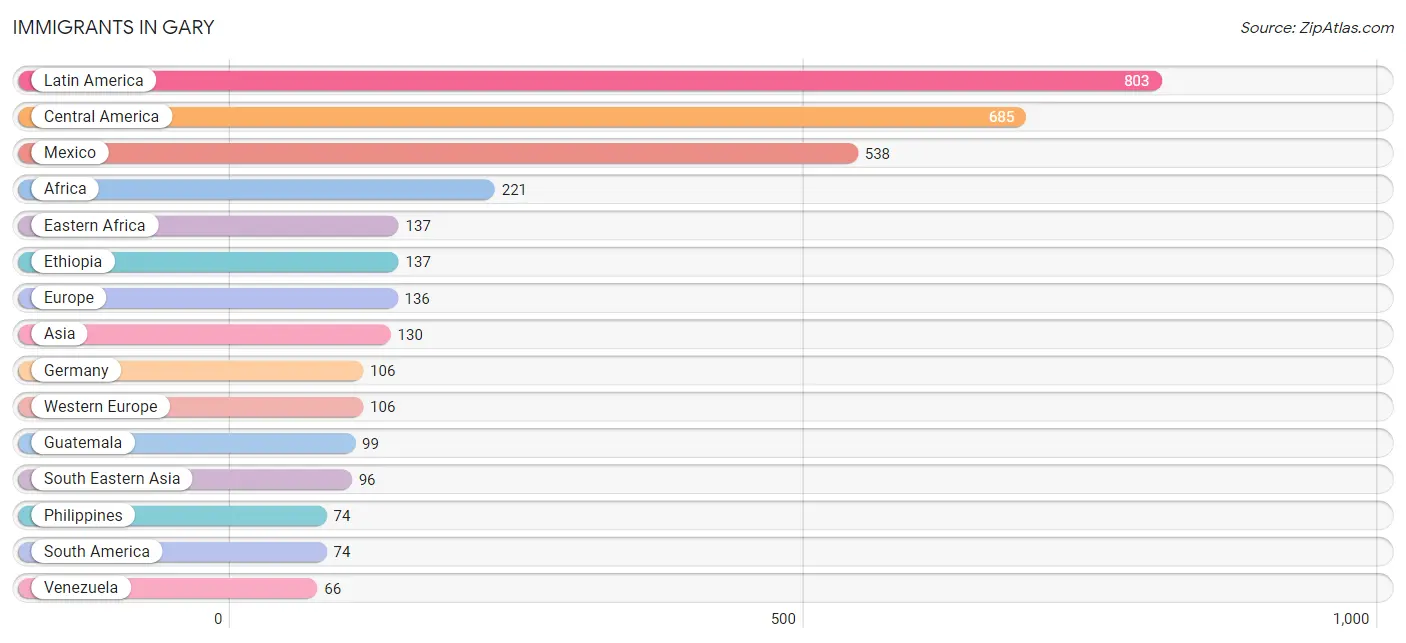
| Immigration Origin | # Population | % Population |
| Africa | 221 | 0.3% |
| Asia | 130 | 0.2% |
| Australia | 8 | 0.0% |
| Canada | 8 | 0.0% |
| Caribbean | 44 | 0.1% |
| Central America | 685 | 1.0% |
| China | 18 | 0.0% |
| Cuba | 20 | 0.0% |
| Eastern Africa | 137 | 0.2% |
| Eastern Asia | 34 | 0.1% |
| Eastern Europe | 3 | 0.0% |
| England | 20 | 0.0% |
| Ethiopia | 137 | 0.2% |
| Europe | 136 | 0.2% |
| Germany | 106 | 0.2% |
| Guatemala | 99 | 0.1% |
| Haiti | 10 | 0.0% |
| Honduras | 30 | 0.0% |
| Jamaica | 9 | 0.0% |
| Korea | 16 | 0.0% |
| Latin America | 803 | 1.2% |
| Mexico | 538 | 0.8% |
| Nigeria | 29 | 0.0% |
| Northern Africa | 13 | 0.0% |
| Northern Europe | 20 | 0.0% |
| Oceania | 12 | 0.0% |
| Peru | 8 | 0.0% |
| Philippines | 74 | 0.1% |
| Romania | 3 | 0.0% |
| South Africa | 17 | 0.0% |
| South America | 74 | 0.1% |
| South Eastern Asia | 96 | 0.1% |
| Southern Europe | 7 | 0.0% |
| Spain | 7 | 0.0% |
| Sudan | 13 | 0.0% |
| Taiwan | 18 | 0.0% |
| Thailand | 22 | 0.0% |
| Trinidad and Tobago | 5 | 0.0% |
| Venezuela | 66 | 0.1% |
| Western Africa | 29 | 0.0% |
| Western Europe | 106 | 0.2% | View All 41 Rows |
Sex and Age in Gary
Sex and Age in Gary
The most populous age groups in Gary are 10 to 14 Years (2,781 | 8.6%) for men and 5 to 9 Years (3,113 | 8.4%) for women.

| Age Bracket | Male | Female |
| Under 5 Years | 2,691 (8.4%) | 2,174 (5.9%) |
| 5 to 9 Years | 2,674 (8.3%) | 3,113 (8.4%) |
| 10 to 14 Years | 2,781 (8.6%) | 2,448 (6.6%) |
| 15 to 19 Years | 2,264 (7.0%) | 2,427 (6.6%) |
| 20 to 24 Years | 2,016 (6.3%) | 2,264 (6.1%) |
| 25 to 29 Years | 1,782 (5.5%) | 2,140 (5.8%) |
| 30 to 34 Years | 1,723 (5.3%) | 2,345 (6.4%) |
| 35 to 39 Years | 2,171 (6.7%) | 2,039 (5.5%) |
| 40 to 44 Years | 1,280 (4.0%) | 2,438 (6.6%) |
| 45 to 49 Years | 1,621 (5.0%) | 1,584 (4.3%) |
| 50 to 54 Years | 2,104 (6.5%) | 2,008 (5.4%) |
| 55 to 59 Years | 1,957 (6.1%) | 1,943 (5.3%) |
| 60 to 64 Years | 1,806 (5.6%) | 2,555 (6.9%) |
| 65 to 69 Years | 1,857 (5.8%) | 2,688 (7.3%) |
| 70 to 74 Years | 1,525 (4.7%) | 1,837 (5.0%) |
| 75 to 79 Years | 754 (2.3%) | 1,114 (3.0%) |
| 80 to 84 Years | 719 (2.2%) | 828 (2.2%) |
| 85 Years and over | 481 (1.5%) | 985 (2.7%) |
| Total | 32,206 (100.0%) | 36,930 (100.0%) |
Families and Households in Gary
Median Family Size in Gary
The median family size in Gary is 3.34 persons per family, with single female/mother families (8,185 | 51.7%) accounting for the largest median family size of 3.47 persons per family. On the other hand, single male/father families (1,998 | 12.6%) represent the smallest median family size with 2.80 persons per family.
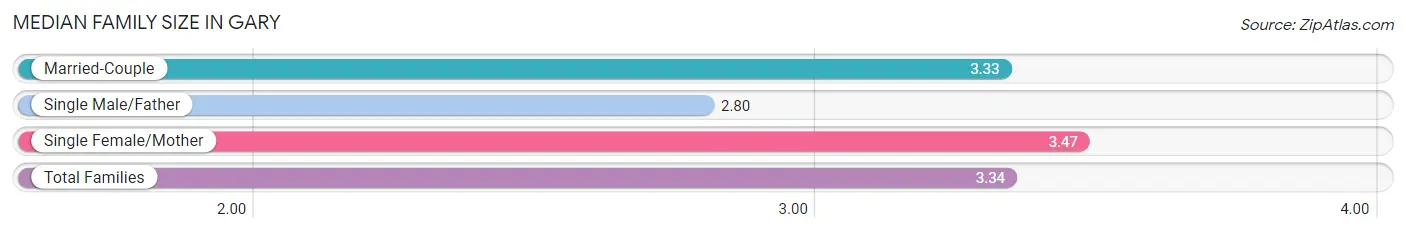
| Family Type | # Families | Family Size |
| Married-Couple | 5,661 (35.7%) | 3.33 |
| Single Male/Father | 1,998 (12.6%) | 2.80 |
| Single Female/Mother | 8,185 (51.7%) | 3.47 |
| Total Families | 15,844 (100.0%) | 3.34 |
Median Household Size in Gary
The median household size in Gary is 2.48 persons per household, with single female/mother households (8,185 | 29.6%) accounting for the largest median household size of 3.62 persons per household. non-family households (11,768 | 42.6%) represent the smallest median household size with 1.16 persons per household.
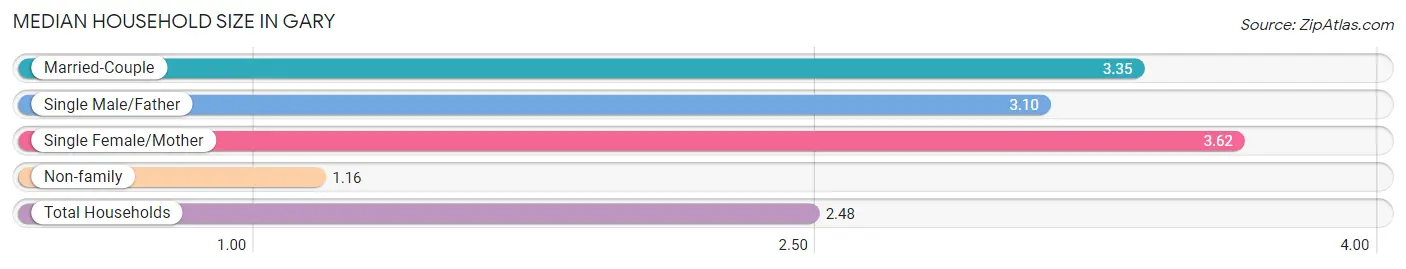
| Household Type | # Households | Household Size |
| Married-Couple | 5,661 (20.5%) | 3.35 |
| Single Male/Father | 1,998 (7.2%) | 3.10 |
| Single Female/Mother | 8,185 (29.6%) | 3.62 |
| Non-family | 11,768 (42.6%) | 1.16 |
| Total Households | 27,612 (100.0%) | 2.48 |
Household Size by Marriage Status in Gary
Out of a total of 27,612 households in Gary, 15,844 (57.4%) are family households, while 11,768 (42.6%) are nonfamily households. The most numerous type of family households are 2-person households, comprising 6,949, and the most common type of nonfamily households are 1-person households, comprising 10,415.
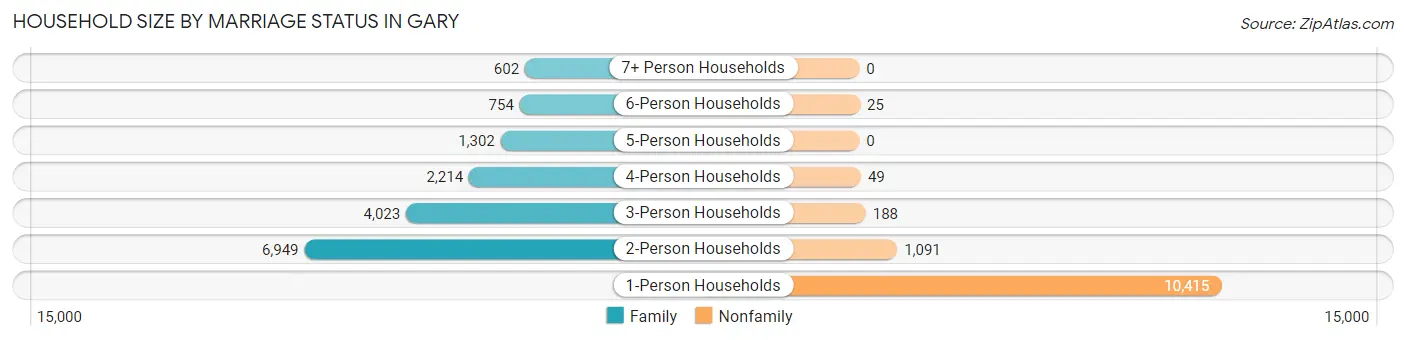
| Household Size | Family Households | Nonfamily Households |
| 1-Person Households | - | 10,415 (37.7%) |
| 2-Person Households | 6,949 (25.2%) | 1,091 (4.0%) |
| 3-Person Households | 4,023 (14.6%) | 188 (0.7%) |
| 4-Person Households | 2,214 (8.0%) | 49 (0.2%) |
| 5-Person Households | 1,302 (4.7%) | 0 (0.0%) |
| 6-Person Households | 754 (2.7%) | 25 (0.1%) |
| 7+ Person Households | 602 (2.2%) | 0 (0.0%) |
| Total | 15,844 (57.4%) | 11,768 (42.6%) |
Female Fertility in Gary
Fertility by Age in Gary
Average fertility rate in Gary is 80.0 births per 1,000 women. Women in the age bracket of 20 to 34 years have the highest fertility rate with 142.0 births per 1,000 women. Women in the age bracket of 20 to 34 years acount for 75.7% of all women with births.
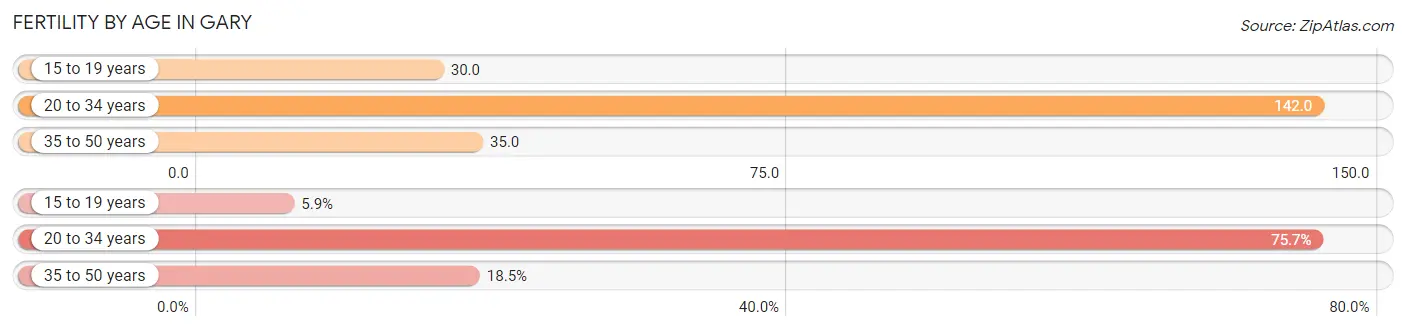
| Age Bracket | Women with Births | Births / 1,000 Women |
| 15 to 19 years | 74 (5.9%) | 30.0 |
| 20 to 34 years | 956 (75.7%) | 142.0 |
| 35 to 50 years | 233 (18.4%) | 35.0 |
| Total | 1,263 (100.0%) | 80.0 |
Fertility by Age by Marriage Status in Gary
18.9% of women with births (1,263) in Gary are married. The highest percentage of unmarried women with births falls into 15 to 19 years age bracket with 100.0% of them unmarried at the time of birth, while the lowest percentage of unmarried women with births belong to 35 to 50 years age bracket with 49.4% of them unmarried.
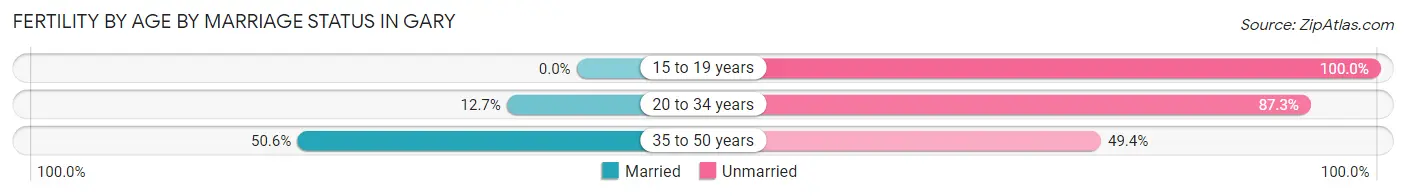
| Age Bracket | Married | Unmarried |
| 15 to 19 years | 0 (0.0%) | 74 (100.0%) |
| 20 to 34 years | 121 (12.7%) | 835 (87.3%) |
| 35 to 50 years | 118 (50.6%) | 115 (49.4%) |
| Total | 239 (18.9%) | 1,024 (81.1%) |
Fertility by Education in Gary
Average fertility rate in Gary is 80.0 births per 1,000 women. Women with the education attainment of high school diploma have the highest fertility rate of 117.0 births per 1,000 women, while women with the education attainment of less than high school have the lowest fertility at 53.0 births per 1,000 women. Women with the education attainment of high school diploma represent 48.3% of all women with births.
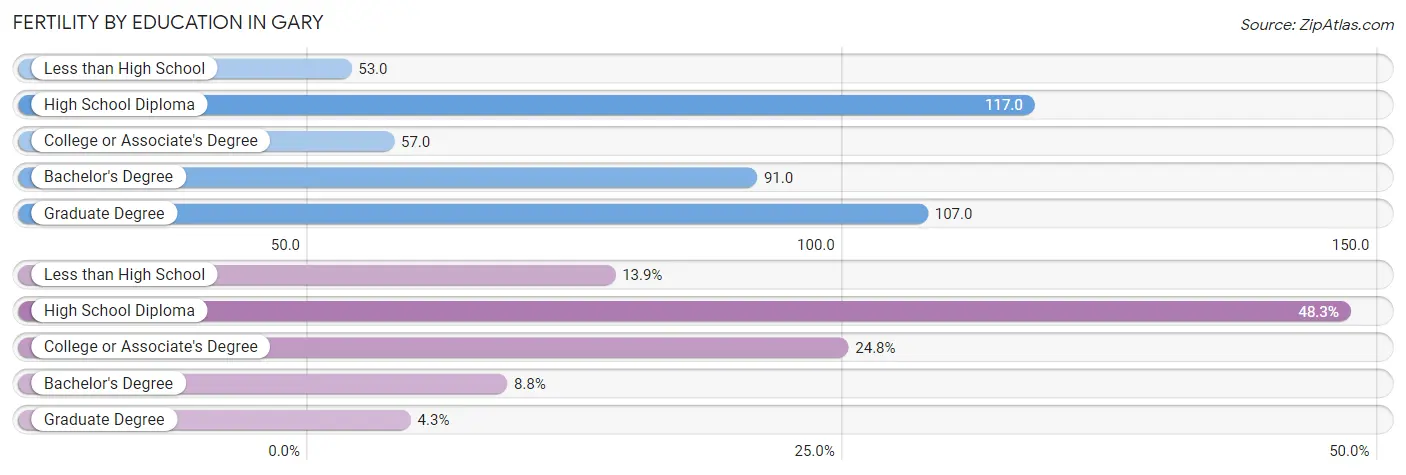
| Educational Attainment | Women with Births | Births / 1,000 Women |
| Less than High School | 175 (13.9%) | 53.0 |
| High School Diploma | 610 (48.3%) | 117.0 |
| College or Associate's Degree | 313 (24.8%) | 57.0 |
| Bachelor's Degree | 111 (8.8%) | 91.0 |
| Graduate Degree | 54 (4.3%) | 107.0 |
| Total | 1,263 (100.0%) | 80.0 |
Fertility by Education by Marriage Status in Gary
81.1% of women with births in Gary are unmarried. Women with the educational attainment of graduate degree are most likely to be married with 100.0% of them married at childbirth, while women with the educational attainment of less than high school are least likely to be married with 100.0% of them unmarried at childbirth.
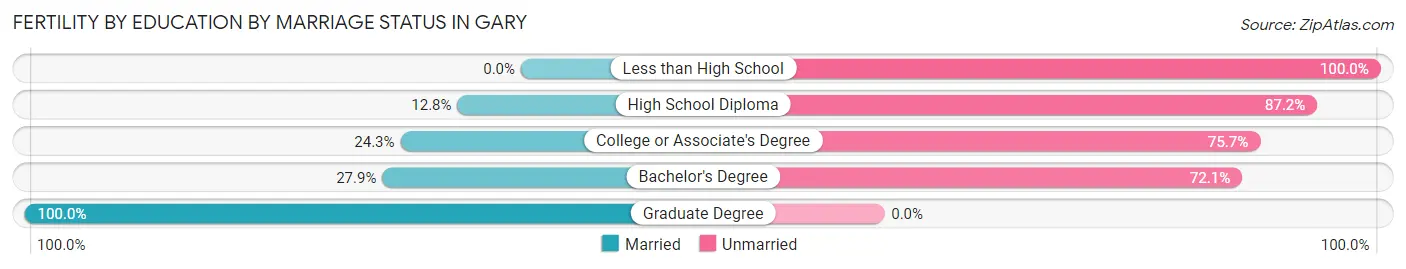
| Educational Attainment | Married | Unmarried |
| Less than High School | 0 (0.0%) | 175 (100.0%) |
| High School Diploma | 78 (12.8%) | 532 (87.2%) |
| College or Associate's Degree | 76 (24.3%) | 237 (75.7%) |
| Bachelor's Degree | 31 (27.9%) | 80 (72.1%) |
| Graduate Degree | 54 (100.0%) | 0 (0.0%) |
| Total | 239 (18.9%) | 1,024 (81.1%) |
Employment Characteristics in Gary
Employment by Class of Employer in Gary
Among the 22,271 employed individuals in Gary, private company employees (17,293 | 77.6%), not-for-profit organizations (1,748 | 7.9%), and local government employees (1,039 | 4.7%) make up the most common classes of employment.
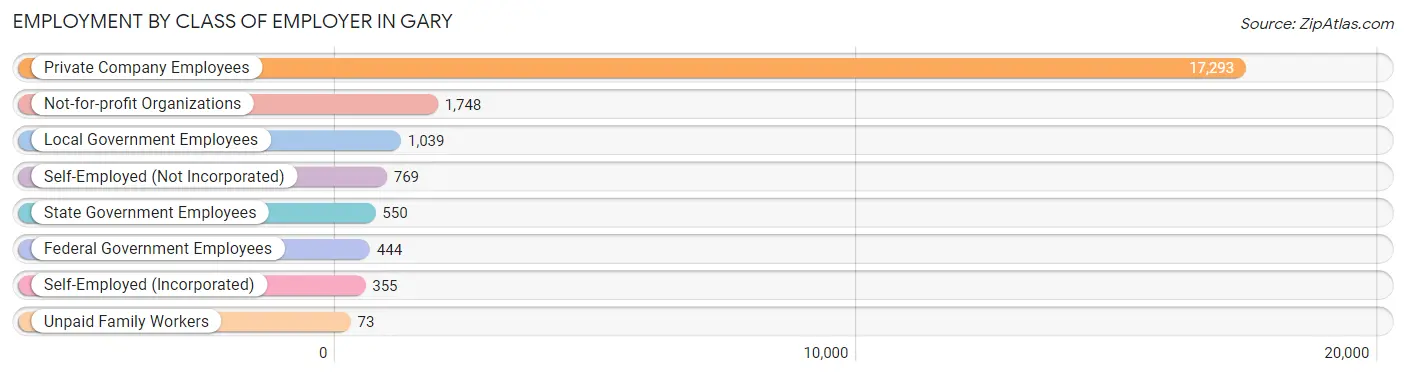
| Employer Class | # Employees | % Employees |
| Private Company Employees | 17,293 | 77.6% |
| Self-Employed (Incorporated) | 355 | 1.6% |
| Self-Employed (Not Incorporated) | 769 | 3.5% |
| Not-for-profit Organizations | 1,748 | 7.9% |
| Local Government Employees | 1,039 | 4.7% |
| State Government Employees | 550 | 2.5% |
| Federal Government Employees | 444 | 2.0% |
| Unpaid Family Workers | 73 | 0.3% |
| Total | 22,271 | 100.0% |
Employment Status by Age in Gary
According to the labor force statistics for Gary, out of the total population over 16 years of age (52,277), 51.0% or 26,661 individuals are in the labor force, with 13.5% or 3,599 of them unemployed. The age group with the highest labor force participation rate is 35 to 44 years, with 76.9% or 6,097 individuals in the labor force. Within the labor force, the 16 to 19 years age range has the highest percentage of unemployed individuals, with 39.3% or 409 of them being unemployed.
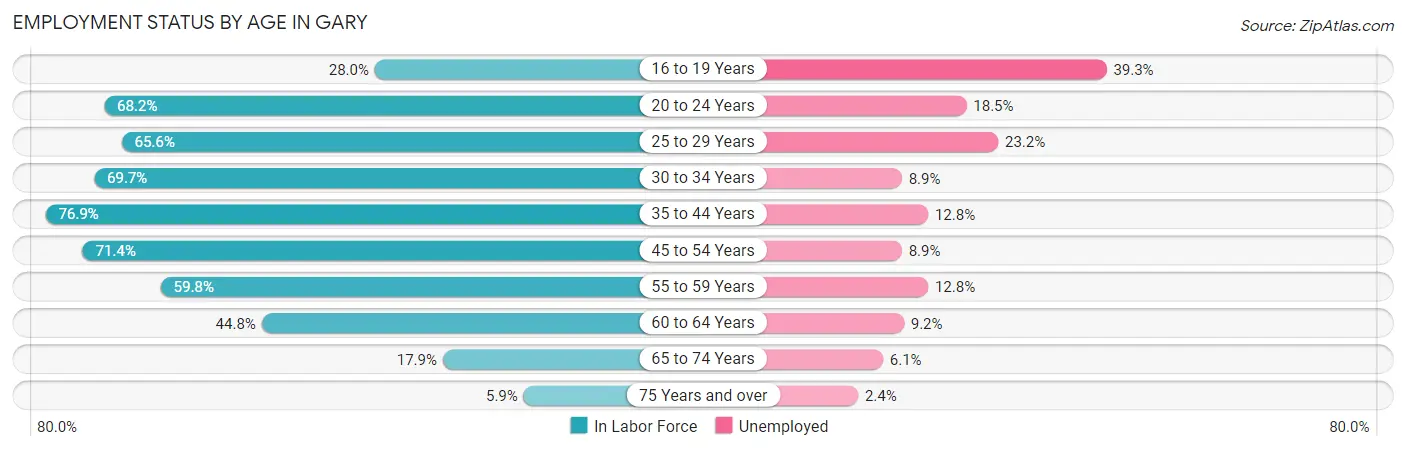
| Age Bracket | In Labor Force | Unemployed |
| 16 to 19 Years | 1,040 (28.0%) | 409 (39.3%) |
| 20 to 24 Years | 2,919 (68.2%) | 540 (18.5%) |
| 25 to 29 Years | 2,573 (65.6%) | 597 (23.2%) |
| 30 to 34 Years | 2,835 (69.7%) | 252 (8.9%) |
| 35 to 44 Years | 6,097 (76.9%) | 780 (12.8%) |
| 45 to 54 Years | 5,224 (71.4%) | 465 (8.9%) |
| 55 to 59 Years | 2,332 (59.8%) | 298 (12.8%) |
| 60 to 64 Years | 1,954 (44.8%) | 180 (9.2%) |
| 65 to 74 Years | 1,415 (17.9%) | 86 (6.1%) |
| 75 Years and over | 288 (5.9%) | 7 (2.4%) |
| Total | 26,661 (51.0%) | 3,599 (13.5%) |
Employment Status by Educational Attainment in Gary
According to labor force statistics for Gary, 66.7% of individuals (21,008) out of the total population between 25 and 64 years of age (31,496) are in the labor force, with 12.2% or 2,563 of them being unemployed. The group with the highest labor force participation rate are those with the educational attainment of bachelor's degree or higher, with 79.6% or 3,501 individuals in the labor force. Within the labor force, individuals with high school diploma education have the highest percentage of unemployment, with 13.7% or 1,001 of them being unemployed.
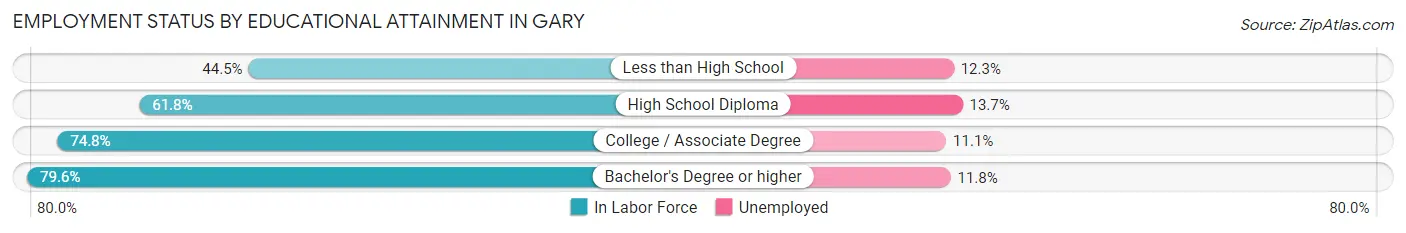
| Educational Attainment | In Labor Force | Unemployed |
| Less than High School | 1,776 (44.5%) | 491 (12.3%) |
| High School Diploma | 7,307 (61.8%) | 1,620 (13.7%) |
| College / Associate Degree | 8,440 (74.8%) | 1,253 (11.1%) |
| Bachelor's Degree or higher | 3,501 (79.6%) | 519 (11.8%) |
| Total | 21,008 (66.7%) | 3,843 (12.2%) |
Employment Occupations by Sex in Gary
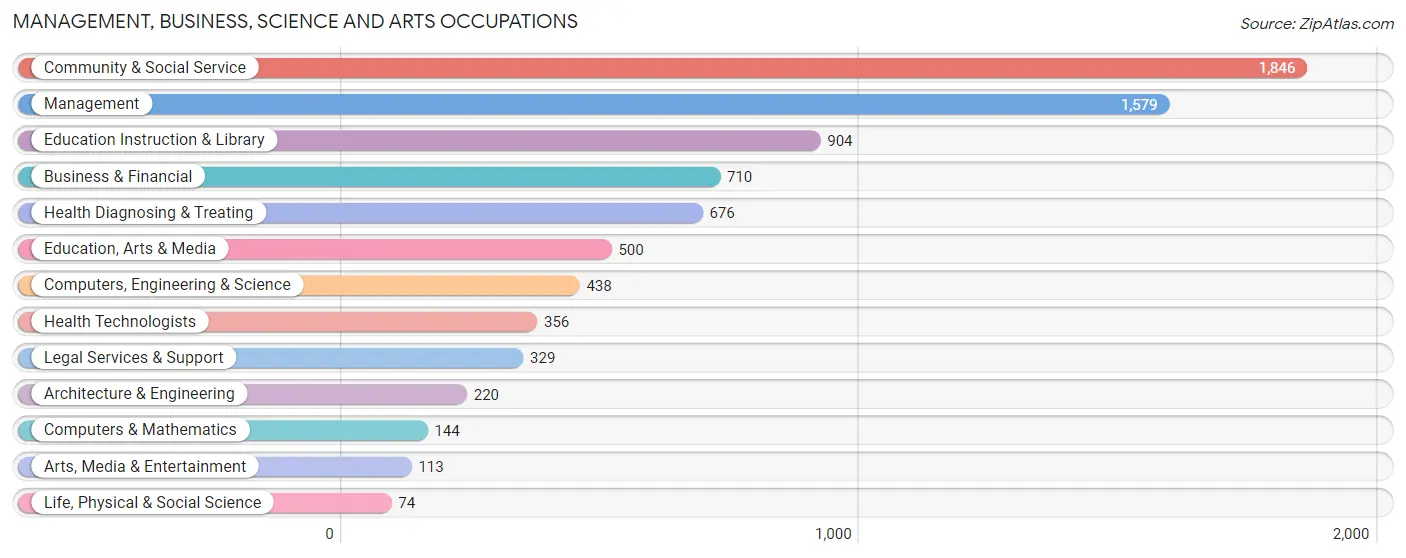
Management, Business, Science and Arts Occupations
The most common Management, Business, Science and Arts occupations in Gary are Community & Social Service (1,846 | 8.0%), Management (1,579 | 6.9%), Education Instruction & Library (904 | 3.9%), Business & Financial (710 | 3.1%), and Health Diagnosing & Treating (676 | 2.9%).
Management, Business, Science and Arts Occupations by Sex
Within the Management, Business, Science and Arts occupations in Gary, the most male-oriented occupations are Legal Services & Support (94.2%), Computers & Mathematics (72.9%), and Arts, Media & Entertainment (68.1%), while the most female-oriented occupations are Health Technologists (87.6%), Health Diagnosing & Treating (84.0%), and Education Instruction & Library (83.5%).
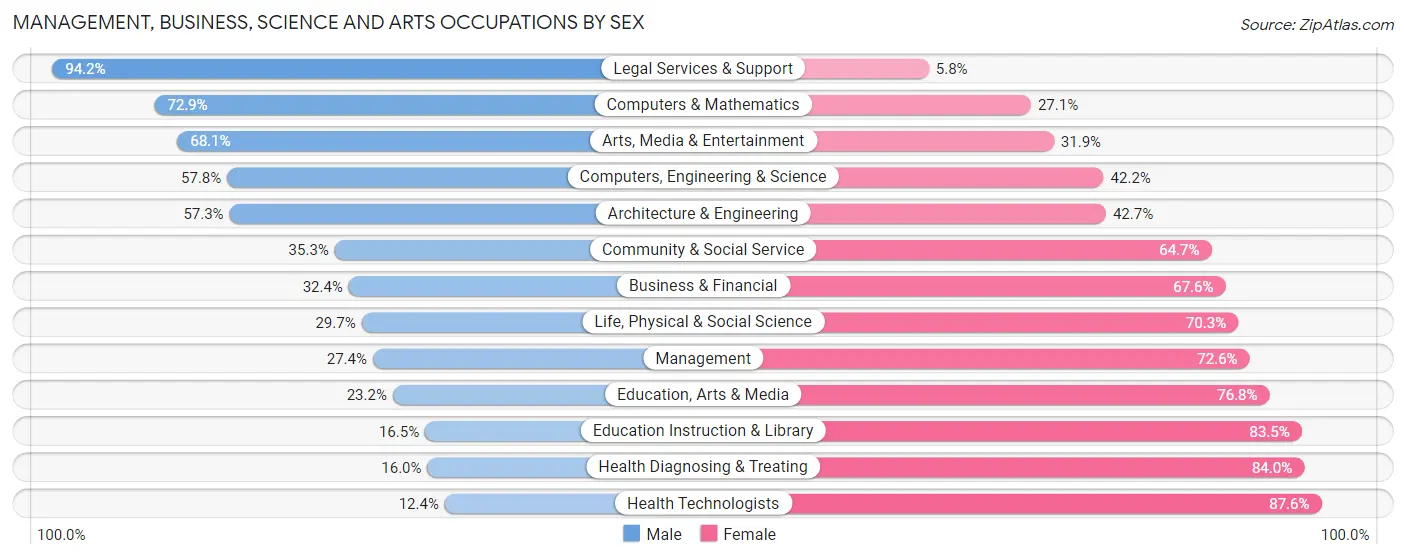
| Occupation | Male | Female |
| Management | 432 (27.4%) | 1,147 (72.6%) |
| Business & Financial | 230 (32.4%) | 480 (67.6%) |
| Computers, Engineering & Science | 253 (57.8%) | 185 (42.2%) |
| Computers & Mathematics | 105 (72.9%) | 39 (27.1%) |
| Architecture & Engineering | 126 (57.3%) | 94 (42.7%) |
| Life, Physical & Social Science | 22 (29.7%) | 52 (70.3%) |
| Community & Social Service | 652 (35.3%) | 1,194 (64.7%) |
| Education, Arts & Media | 116 (23.2%) | 384 (76.8%) |
| Legal Services & Support | 310 (94.2%) | 19 (5.8%) |
| Education Instruction & Library | 149 (16.5%) | 755 (83.5%) |
| Arts, Media & Entertainment | 77 (68.1%) | 36 (31.9%) |
| Health Diagnosing & Treating | 108 (16.0%) | 568 (84.0%) |
| Health Technologists | 44 (12.4%) | 312 (87.6%) |
| Total (Category) | 1,675 (31.9%) | 3,574 (68.1%) |
| Total (Overall) | 10,324 (44.8%) | 12,717 (55.2%) |
Services Occupations
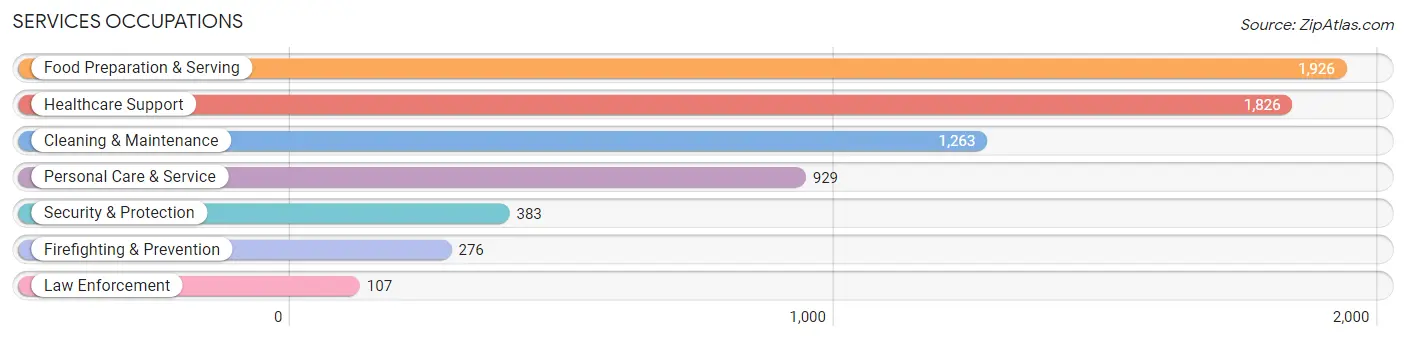
The most common Services occupations in Gary are Food Preparation & Serving (1,926 | 8.4%), Healthcare Support (1,826 | 7.9%), Cleaning & Maintenance (1,263 | 5.5%), Personal Care & Service (929 | 4.0%), and Security & Protection (383 | 1.7%).
Services Occupations by Sex
Within the Services occupations in Gary, the most male-oriented occupations are Law Enforcement (68.2%), Security & Protection (57.2%), and Cleaning & Maintenance (55.8%), while the most female-oriented occupations are Healthcare Support (91.7%), Personal Care & Service (70.0%), and Food Preparation & Serving (56.9%).
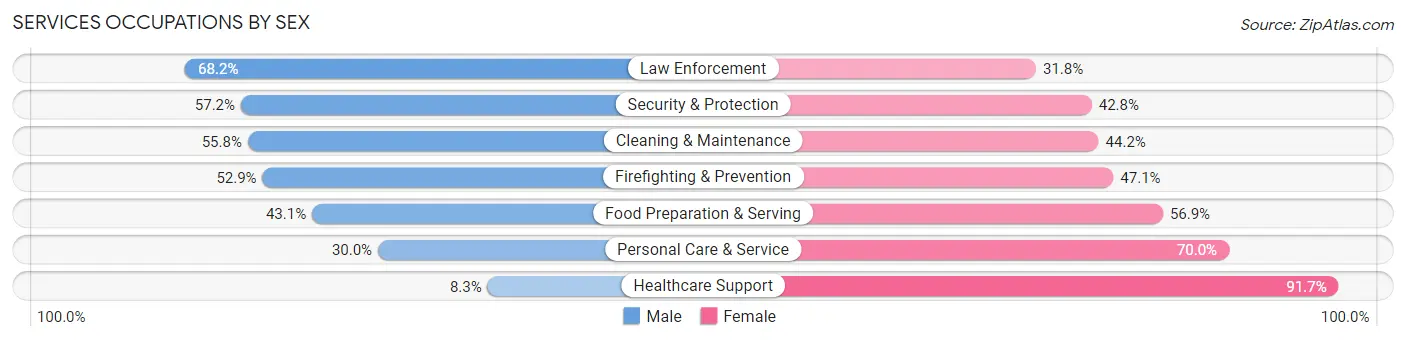
| Occupation | Male | Female |
| Healthcare Support | 152 (8.3%) | 1,674 (91.7%) |
| Security & Protection | 219 (57.2%) | 164 (42.8%) |
| Firefighting & Prevention | 146 (52.9%) | 130 (47.1%) |
| Law Enforcement | 73 (68.2%) | 34 (31.8%) |
| Food Preparation & Serving | 830 (43.1%) | 1,096 (56.9%) |
| Cleaning & Maintenance | 705 (55.8%) | 558 (44.2%) |
| Personal Care & Service | 279 (30.0%) | 650 (70.0%) |
| Total (Category) | 2,185 (34.5%) | 4,142 (65.5%) |
| Total (Overall) | 10,324 (44.8%) | 12,717 (55.2%) |
Sales and Office Occupations
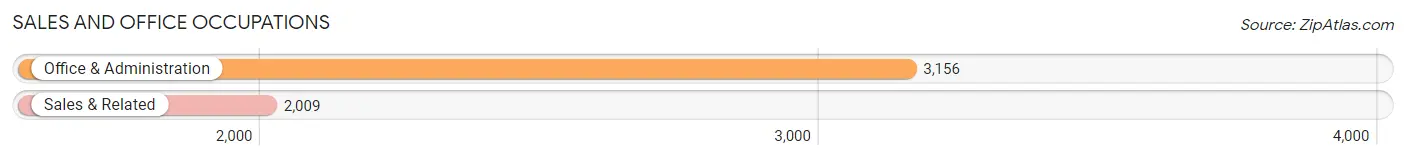
The most common Sales and Office occupations in Gary are Office & Administration (3,156 | 13.7%), and Sales & Related (2,009 | 8.7%).
Sales and Office Occupations by Sex
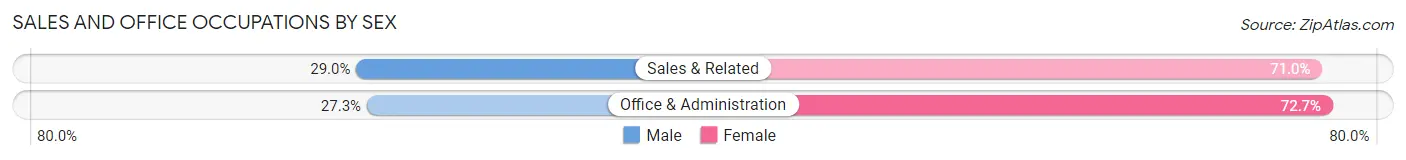
| Occupation | Male | Female |
| Sales & Related | 582 (29.0%) | 1,427 (71.0%) |
| Office & Administration | 863 (27.3%) | 2,293 (72.7%) |
| Total (Category) | 1,445 (28.0%) | 3,720 (72.0%) |
| Total (Overall) | 10,324 (44.8%) | 12,717 (55.2%) |
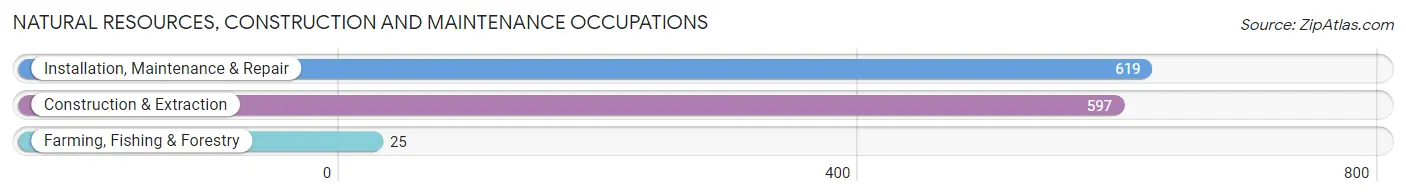
Natural Resources, Construction and Maintenance Occupations
The most common Natural Resources, Construction and Maintenance occupations in Gary are Installation, Maintenance & Repair (619 | 2.7%), Construction & Extraction (597 | 2.6%), and Farming, Fishing & Forestry (25 | 0.1%).
Natural Resources, Construction and Maintenance Occupations by Sex
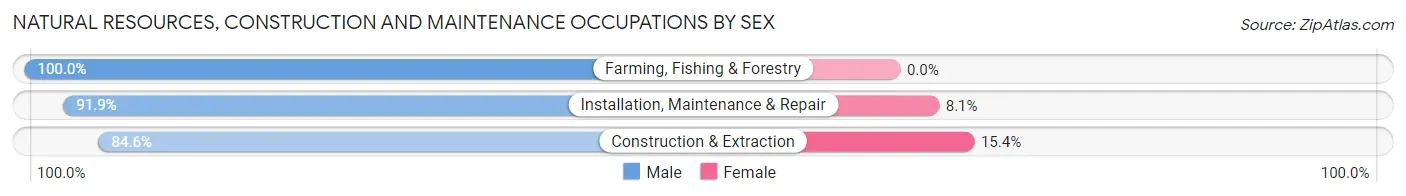
| Occupation | Male | Female |
| Farming, Fishing & Forestry | 25 (100.0%) | 0 (0.0%) |
| Construction & Extraction | 505 (84.6%) | 92 (15.4%) |
| Installation, Maintenance & Repair | 569 (91.9%) | 50 (8.1%) |
| Total (Category) | 1,099 (88.6%) | 142 (11.4%) |
| Total (Overall) | 10,324 (44.8%) | 12,717 (55.2%) |
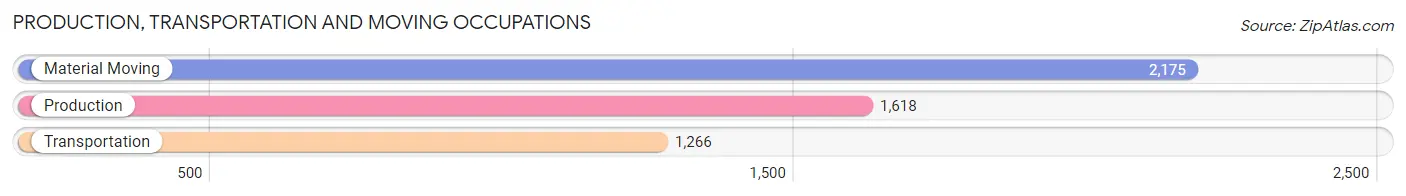
Production, Transportation and Moving Occupations
The most common Production, Transportation and Moving occupations in Gary are Material Moving (2,175 | 9.4%), Production (1,618 | 7.0%), and Transportation (1,266 | 5.5%).
Production, Transportation and Moving Occupations by Sex
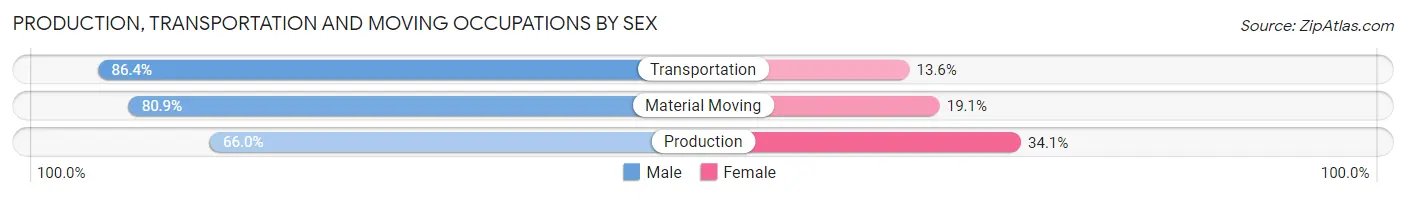
| Occupation | Male | Female |
| Production | 1,067 (65.9%) | 551 (34.1%) |
| Transportation | 1,094 (86.4%) | 172 (13.6%) |
| Material Moving | 1,759 (80.9%) | 416 (19.1%) |
| Total (Category) | 3,920 (77.5%) | 1,139 (22.5%) |
| Total (Overall) | 10,324 (44.8%) | 12,717 (55.2%) |
Employment Industries by Sex in Gary
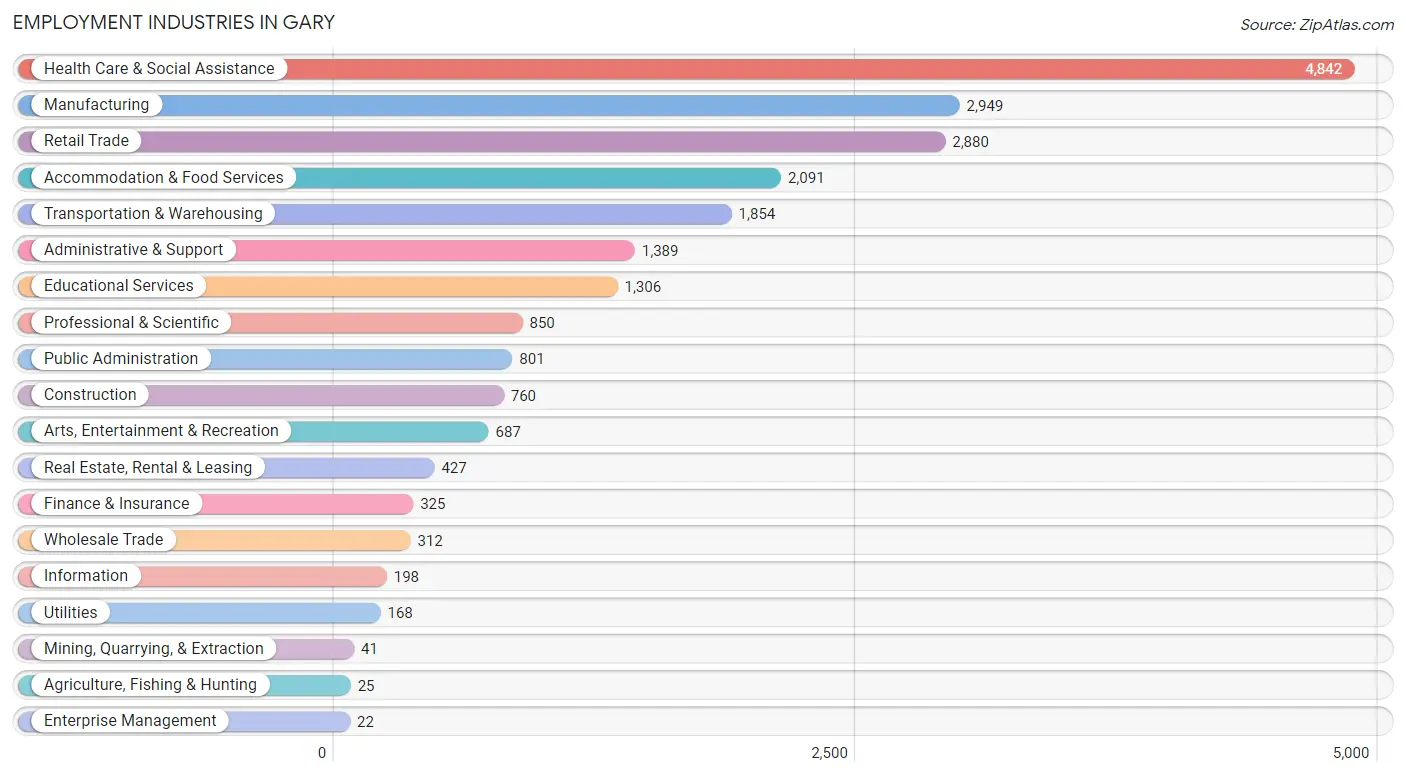
Employment Industries in Gary
The major employment industries in Gary include Health Care & Social Assistance (4,842 | 21.0%), Manufacturing (2,949 | 12.8%), Retail Trade (2,880 | 12.5%), Accommodation & Food Services (2,091 | 9.1%), and Transportation & Warehousing (1,854 | 8.1%).
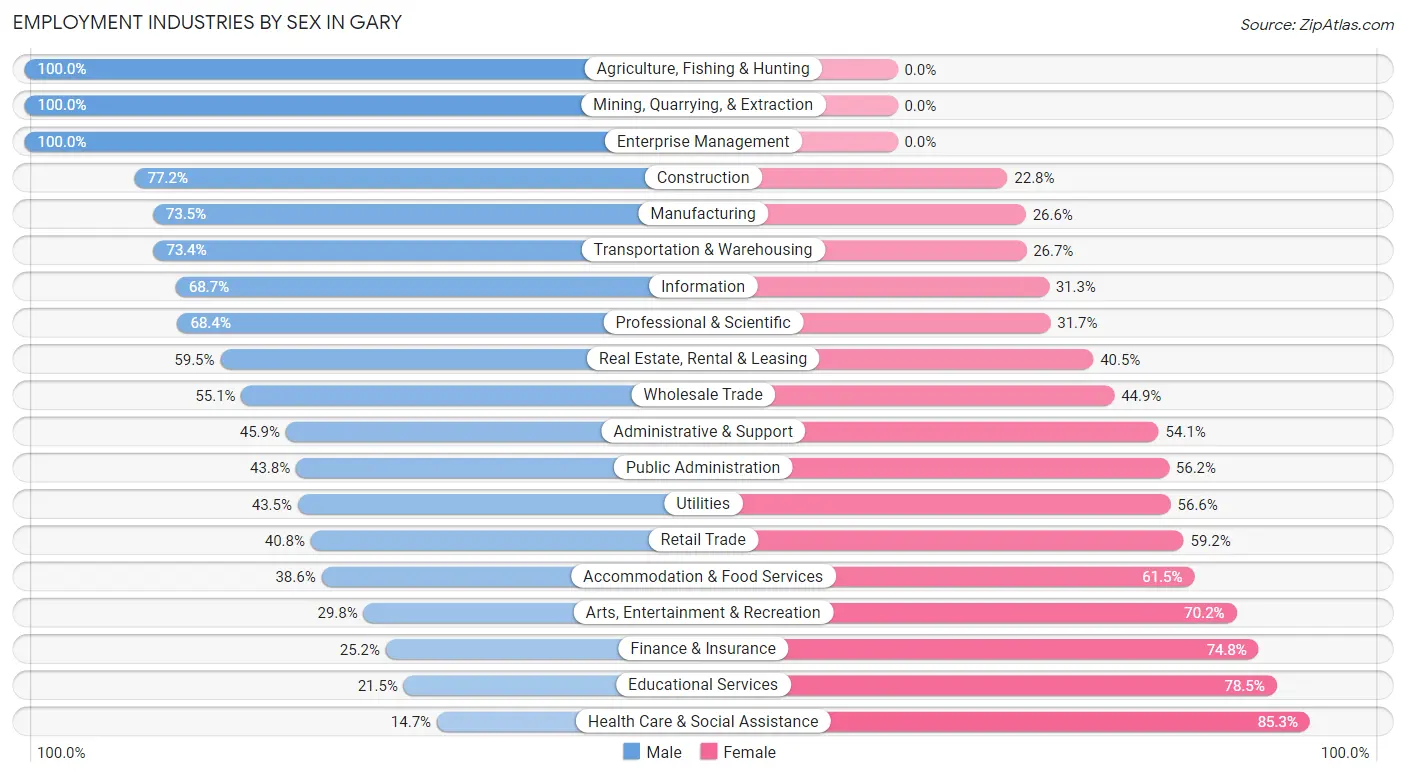
Employment Industries by Sex in Gary
The Gary industries that see more men than women are Agriculture, Fishing & Hunting (100.0%), Mining, Quarrying, & Extraction (100.0%), and Enterprise Management (100.0%), whereas the industries that tend to have a higher number of women are Health Care & Social Assistance (85.3%), Educational Services (78.5%), and Finance & Insurance (74.8%).
| Industry | Male | Female |
| Agriculture, Fishing & Hunting | 25 (100.0%) | 0 (0.0%) |
| Mining, Quarrying, & Extraction | 41 (100.0%) | 0 (0.0%) |
| Construction | 587 (77.2%) | 173 (22.8%) |
| Manufacturing | 2,166 (73.5%) | 783 (26.6%) |
| Wholesale Trade | 172 (55.1%) | 140 (44.9%) |
| Retail Trade | 1,174 (40.8%) | 1,706 (59.2%) |
| Transportation & Warehousing | 1,360 (73.4%) | 494 (26.7%) |
| Utilities | 73 (43.4%) | 95 (56.6%) |
| Information | 136 (68.7%) | 62 (31.3%) |
| Finance & Insurance | 82 (25.2%) | 243 (74.8%) |
| Real Estate, Rental & Leasing | 254 (59.5%) | 173 (40.5%) |
| Professional & Scientific | 581 (68.3%) | 269 (31.7%) |
| Enterprise Management | 22 (100.0%) | 0 (0.0%) |
| Administrative & Support | 638 (45.9%) | 751 (54.1%) |
| Educational Services | 281 (21.5%) | 1,025 (78.5%) |
| Health Care & Social Assistance | 710 (14.7%) | 4,132 (85.3%) |
| Arts, Entertainment & Recreation | 205 (29.8%) | 482 (70.2%) |
| Accommodation & Food Services | 806 (38.6%) | 1,285 (61.5%) |
| Public Administration | 351 (43.8%) | 450 (56.2%) |
| Total | 10,324 (44.8%) | 12,717 (55.2%) |
Education in Gary
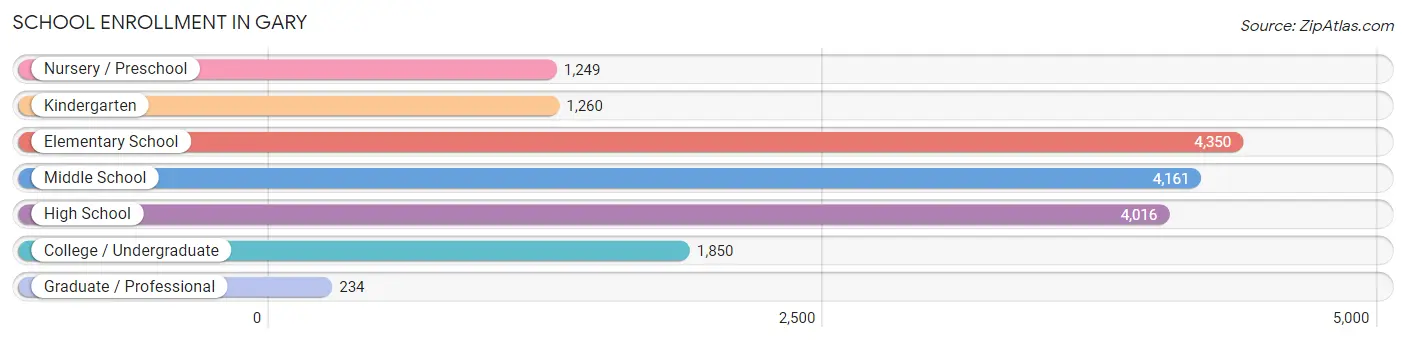
School Enrollment in Gary
The most common levels of schooling among the 17,120 students in Gary are elementary school (4,350 | 25.4%), middle school (4,161 | 24.3%), and high school (4,016 | 23.5%).
| School Level | # Students | % Students |
| Nursery / Preschool | 1,249 | 7.3% |
| Kindergarten | 1,260 | 7.4% |
| Elementary School | 4,350 | 25.4% |
| Middle School | 4,161 | 24.3% |
| High School | 4,016 | 23.5% |
| College / Undergraduate | 1,850 | 10.8% |
| Graduate / Professional | 234 | 1.4% |
| Total | 17,120 | 100.0% |
School Enrollment by Age by Funding Source in Gary
Out of a total of 17,120 students who are enrolled in schools in Gary, 2,294 (13.4%) attend a private institution, while the remaining 14,826 (86.6%) are enrolled in public schools. The age group of 35 years and over has the highest likelihood of being enrolled in private schools, with 358 (36.8% in the age bracket) enrolled. Conversely, the age group of 18 to 19 year olds has the lowest likelihood of being enrolled in a private school, with 727 (97.6% in the age bracket) attending a public institution.
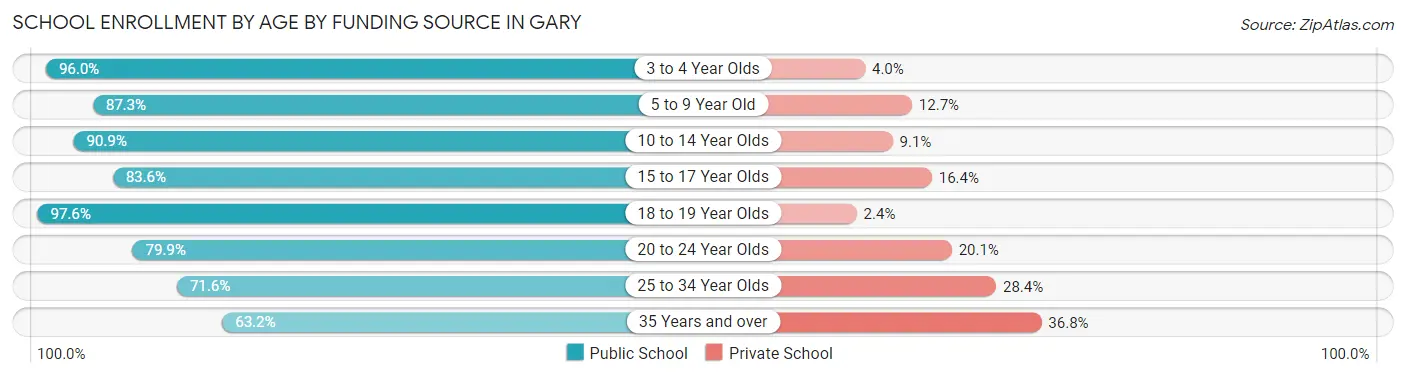
| Age Bracket | Public School | Private School |
| 3 to 4 Year Olds | 821 (96.0%) | 34 (4.0%) |
| 5 to 9 Year Old | 4,545 (87.3%) | 662 (12.7%) |
| 10 to 14 Year Olds | 4,678 (90.9%) | 469 (9.1%) |
| 15 to 17 Year Olds | 2,607 (83.6%) | 512 (16.4%) |
| 18 to 19 Year Olds | 727 (97.6%) | 18 (2.4%) |
| 20 to 24 Year Olds | 552 (79.9%) | 139 (20.1%) |
| 25 to 34 Year Olds | 275 (71.6%) | 109 (28.4%) |
| 35 Years and over | 614 (63.2%) | 358 (36.8%) |
| Total | 14,826 (86.6%) | 2,294 (13.4%) |
Educational Attainment by Field of Study in Gary
Education (1,299 | 19.1%), business (1,294 | 19.0%), science & technology (866 | 12.7%), arts & humanities (553 | 8.1%), and social sciences (417 | 6.1%) are the most common fields of study among 6,798 individuals in Gary who have obtained a bachelor's degree or higher.
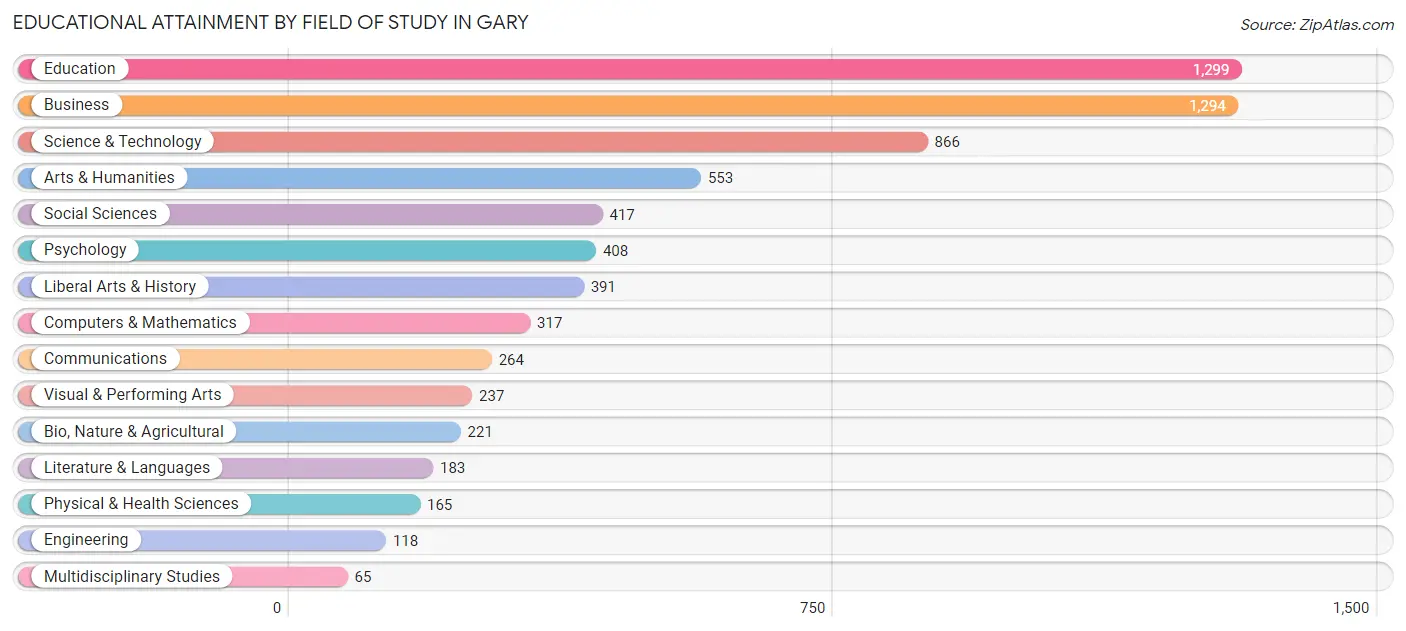
| Field of Study | # Graduates | % Graduates |
| Computers & Mathematics | 317 | 4.7% |
| Bio, Nature & Agricultural | 221 | 3.3% |
| Physical & Health Sciences | 165 | 2.4% |
| Psychology | 408 | 6.0% |
| Social Sciences | 417 | 6.1% |
| Engineering | 118 | 1.7% |
| Multidisciplinary Studies | 65 | 1.0% |
| Science & Technology | 866 | 12.7% |
| Business | 1,294 | 19.0% |
| Education | 1,299 | 19.1% |
| Literature & Languages | 183 | 2.7% |
| Liberal Arts & History | 391 | 5.8% |
| Visual & Performing Arts | 237 | 3.5% |
| Communications | 264 | 3.9% |
| Arts & Humanities | 553 | 8.1% |
| Total | 6,798 | 100.0% |
Transportation & Commute in Gary
Vehicle Availability by Sex in Gary
The most prevalent vehicle ownership categories in Gary are males with 2 vehicles (3,463, accounting for 34.5%) and females with 2 vehicles (3,571, making up 28.4%).
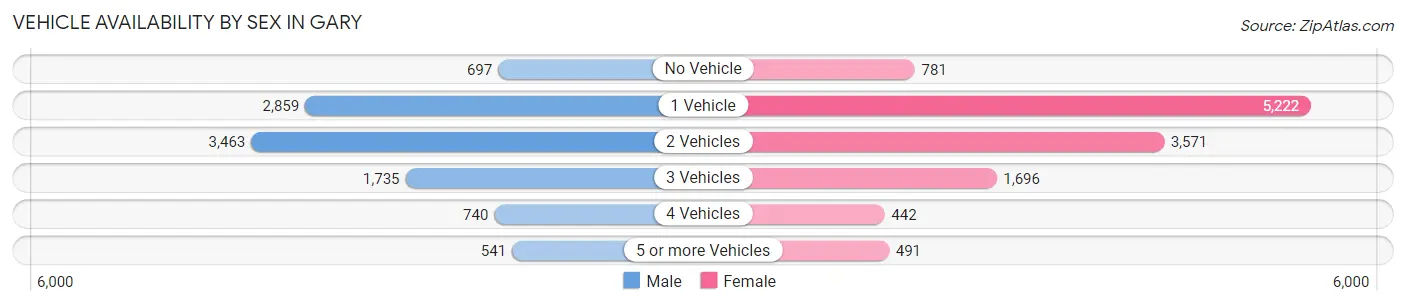
| Vehicles Available | Male | Female |
| No Vehicle | 697 (7.0%) | 781 (6.4%) |
| 1 Vehicle | 2,859 (28.5%) | 5,222 (42.8%) |
| 2 Vehicles | 3,463 (34.5%) | 3,571 (29.3%) |
| 3 Vehicles | 1,735 (17.3%) | 1,696 (13.9%) |
| 4 Vehicles | 740 (7.4%) | 442 (3.6%) |
| 5 or more Vehicles | 541 (5.4%) | 491 (4.0%) |
| Total | 10,035 (100.0%) | 12,203 (100.0%) |
Commute Time in Gary
The most frequently occuring commute durations in Gary are 20 to 24 minutes (3,992 commuters, 18.7%), 15 to 19 minutes (3,465 commuters, 16.2%), and 30 to 34 minutes (3,309 commuters, 15.5%).
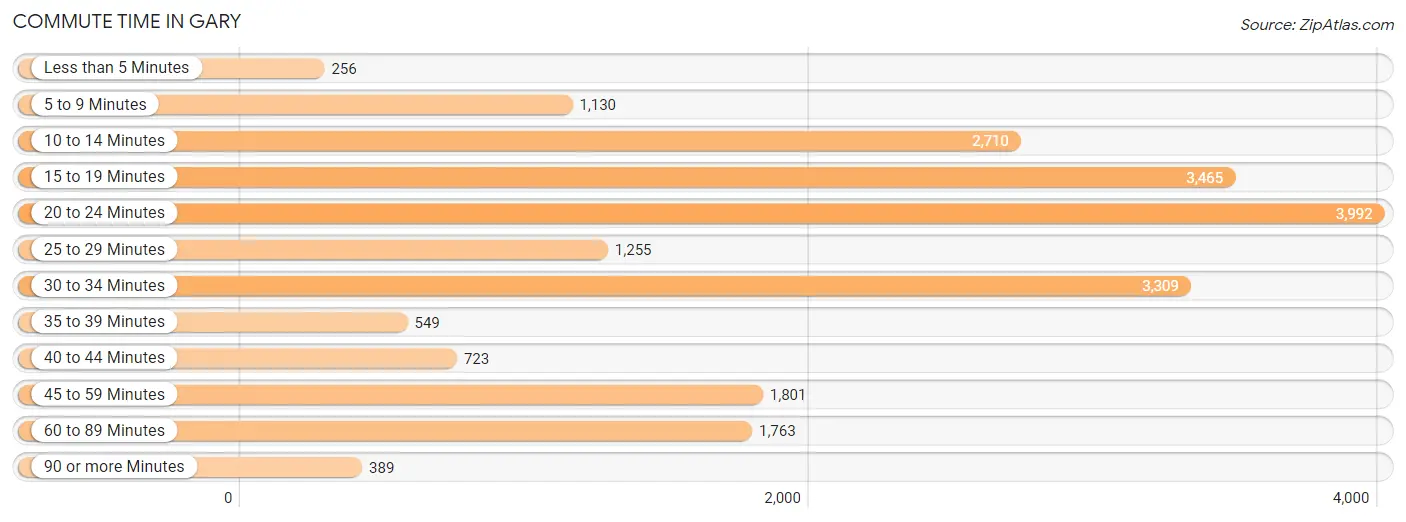
| Commute Time | # Commuters | % Commuters |
| Less than 5 Minutes | 256 | 1.2% |
| 5 to 9 Minutes | 1,130 | 5.3% |
| 10 to 14 Minutes | 2,710 | 12.7% |
| 15 to 19 Minutes | 3,465 | 16.2% |
| 20 to 24 Minutes | 3,992 | 18.7% |
| 25 to 29 Minutes | 1,255 | 5.9% |
| 30 to 34 Minutes | 3,309 | 15.5% |
| 35 to 39 Minutes | 549 | 2.6% |
| 40 to 44 Minutes | 723 | 3.4% |
| 45 to 59 Minutes | 1,801 | 8.4% |
| 60 to 89 Minutes | 1,763 | 8.3% |
| 90 or more Minutes | 389 | 1.8% |
Commute Time by Sex in Gary
The most common commute times in Gary are 20 to 24 minutes (1,667 commuters, 17.2%) for males and 20 to 24 minutes (2,325 commuters, 20.0%) for females.
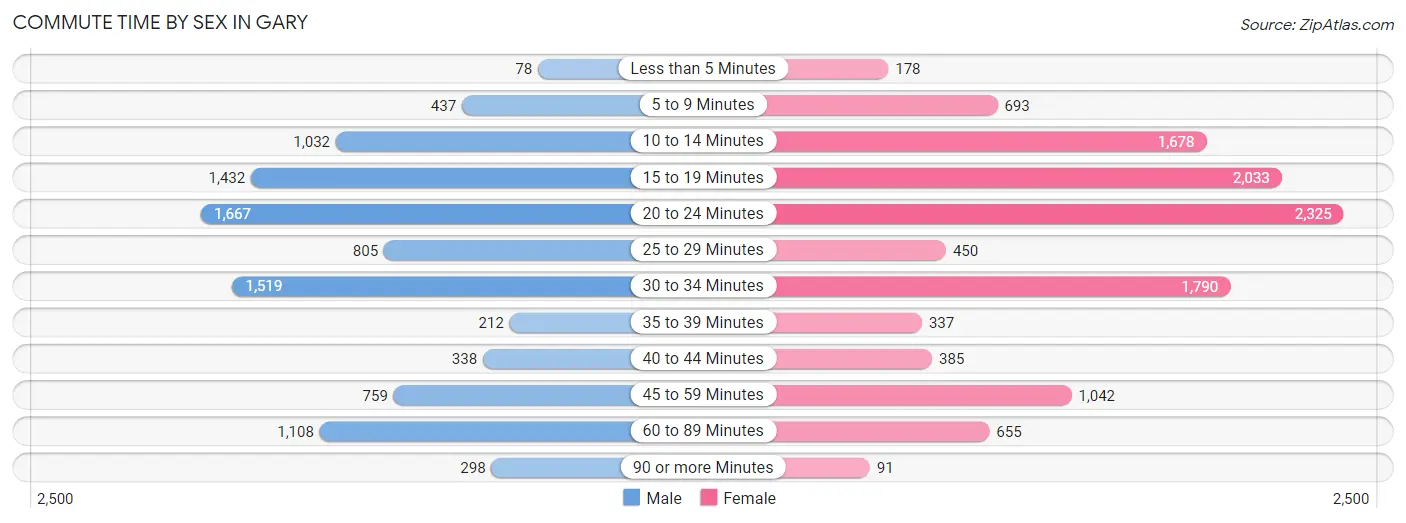
| Commute Time | Male | Female |
| Less than 5 Minutes | 78 (0.8%) | 178 (1.5%) |
| 5 to 9 Minutes | 437 (4.5%) | 693 (5.9%) |
| 10 to 14 Minutes | 1,032 (10.7%) | 1,678 (14.4%) |
| 15 to 19 Minutes | 1,432 (14.8%) | 2,033 (17.4%) |
| 20 to 24 Minutes | 1,667 (17.2%) | 2,325 (20.0%) |
| 25 to 29 Minutes | 805 (8.3%) | 450 (3.9%) |
| 30 to 34 Minutes | 1,519 (15.7%) | 1,790 (15.4%) |
| 35 to 39 Minutes | 212 (2.2%) | 337 (2.9%) |
| 40 to 44 Minutes | 338 (3.5%) | 385 (3.3%) |
| 45 to 59 Minutes | 759 (7.8%) | 1,042 (8.9%) |
| 60 to 89 Minutes | 1,108 (11.4%) | 655 (5.6%) |
| 90 or more Minutes | 298 (3.1%) | 91 (0.8%) |
Time of Departure to Work by Sex in Gary
The most frequent times of departure to work in Gary are 12:00 PM to 3:59 PM (1,336, 13.8%) for males and 12:00 PM to 3:59 PM (1,518, 13.0%) for females.
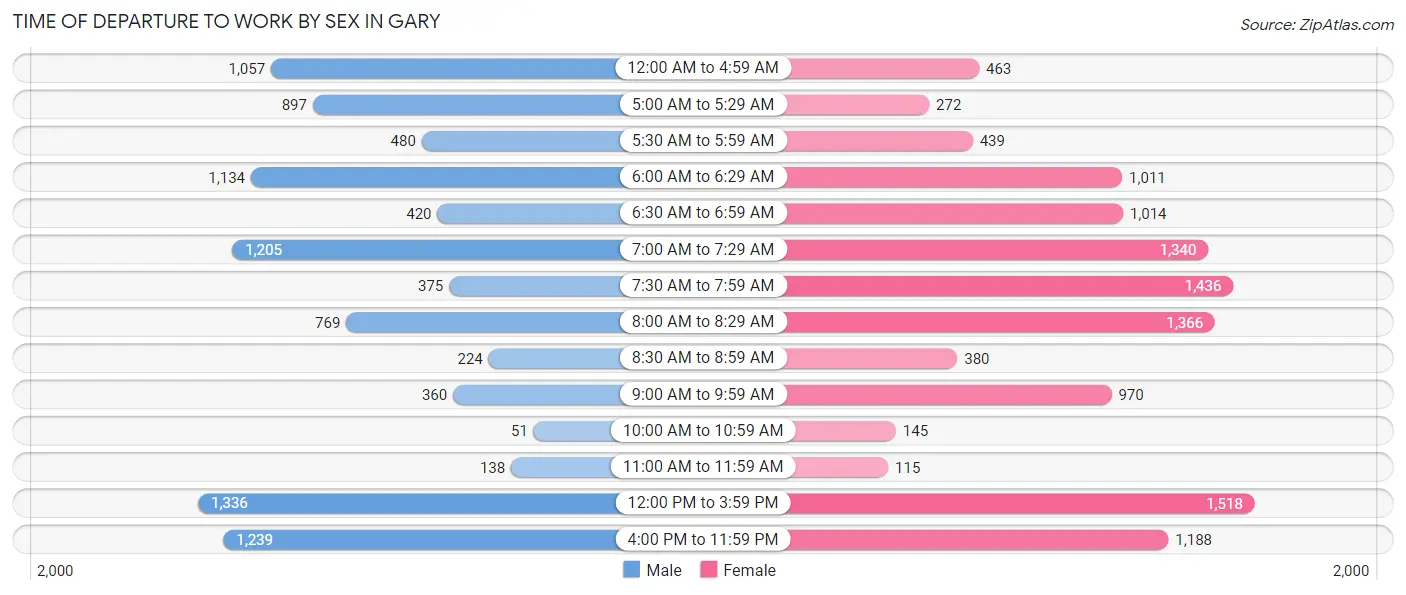
| Time of Departure | Male | Female |
| 12:00 AM to 4:59 AM | 1,057 (10.9%) | 463 (4.0%) |
| 5:00 AM to 5:29 AM | 897 (9.3%) | 272 (2.3%) |
| 5:30 AM to 5:59 AM | 480 (5.0%) | 439 (3.8%) |
| 6:00 AM to 6:29 AM | 1,134 (11.7%) | 1,011 (8.7%) |
| 6:30 AM to 6:59 AM | 420 (4.3%) | 1,014 (8.7%) |
| 7:00 AM to 7:29 AM | 1,205 (12.4%) | 1,340 (11.5%) |
| 7:30 AM to 7:59 AM | 375 (3.9%) | 1,436 (12.3%) |
| 8:00 AM to 8:29 AM | 769 (7.9%) | 1,366 (11.7%) |
| 8:30 AM to 8:59 AM | 224 (2.3%) | 380 (3.3%) |
| 9:00 AM to 9:59 AM | 360 (3.7%) | 970 (8.3%) |
| 10:00 AM to 10:59 AM | 51 (0.5%) | 145 (1.2%) |
| 11:00 AM to 11:59 AM | 138 (1.4%) | 115 (1.0%) |
| 12:00 PM to 3:59 PM | 1,336 (13.8%) | 1,518 (13.0%) |
| 4:00 PM to 11:59 PM | 1,239 (12.8%) | 1,188 (10.2%) |
| Total | 9,685 (100.0%) | 11,657 (100.0%) |
Housing Occupancy in Gary
Occupancy by Ownership in Gary
Of the total 27,612 dwellings in Gary, owner-occupied units account for 13,324 (48.2%), while renter-occupied units make up 14,288 (51.7%).
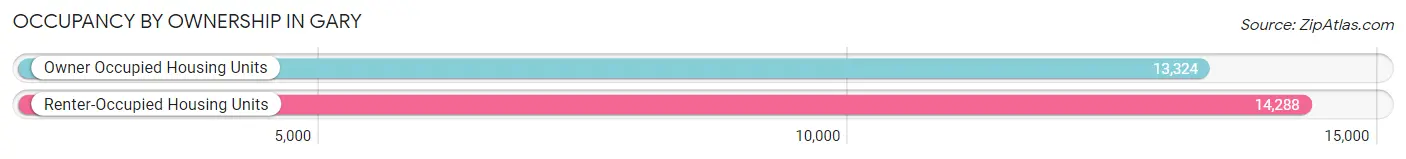
| Occupancy | # Housing Units | % Housing Units |
| Owner Occupied Housing Units | 13,324 | 48.2% |
| Renter-Occupied Housing Units | 14,288 | 51.7% |
| Total Occupied Housing Units | 27,612 | 100.0% |
Occupancy by Household Size in Gary
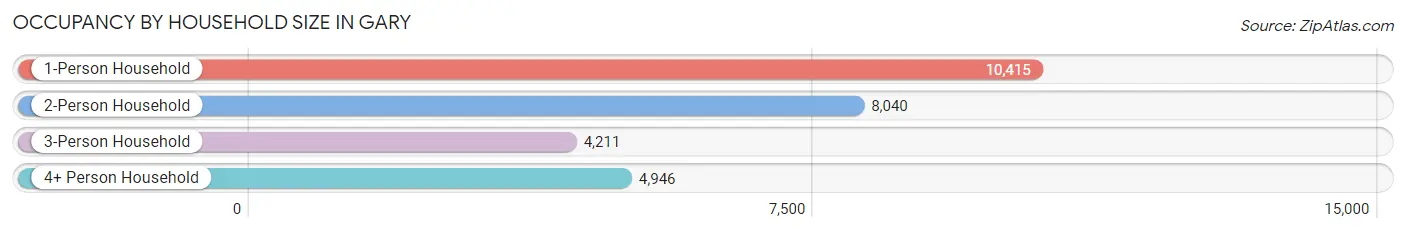
| Household Size | # Housing Units | % Housing Units |
| 1-Person Household | 10,415 | 37.7% |
| 2-Person Household | 8,040 | 29.1% |
| 3-Person Household | 4,211 | 15.2% |
| 4+ Person Household | 4,946 | 17.9% |
| Total Housing Units | 27,612 | 100.0% |
Occupancy by Ownership by Household Size in Gary
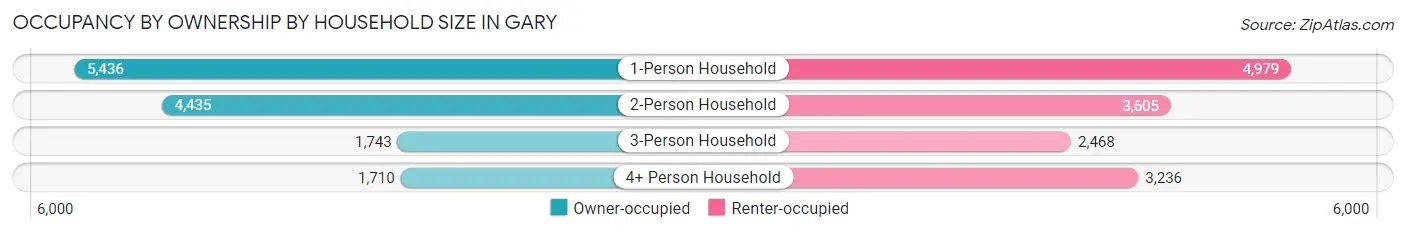
| Household Size | Owner-occupied | Renter-occupied |
| 1-Person Household | 5,436 (52.2%) | 4,979 (47.8%) |
| 2-Person Household | 4,435 (55.2%) | 3,605 (44.8%) |
| 3-Person Household | 1,743 (41.4%) | 2,468 (58.6%) |
| 4+ Person Household | 1,710 (34.6%) | 3,236 (65.4%) |
| Total Housing Units | 13,324 (48.2%) | 14,288 (51.7%) |
Occupancy by Educational Attainment in Gary
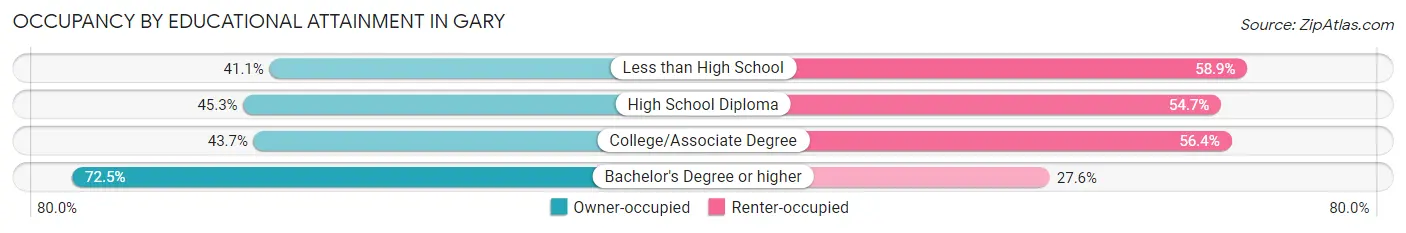
| Household Size | Owner-occupied | Renter-occupied |
| Less than High School | 1,547 (41.1%) | 2,213 (58.9%) |
| High School Diploma | 4,608 (45.3%) | 5,566 (54.7%) |
| College/Associate Degree | 4,155 (43.6%) | 5,363 (56.4%) |
| Bachelor's Degree or higher | 3,014 (72.5%) | 1,146 (27.6%) |
Occupancy by Age of Householder in Gary
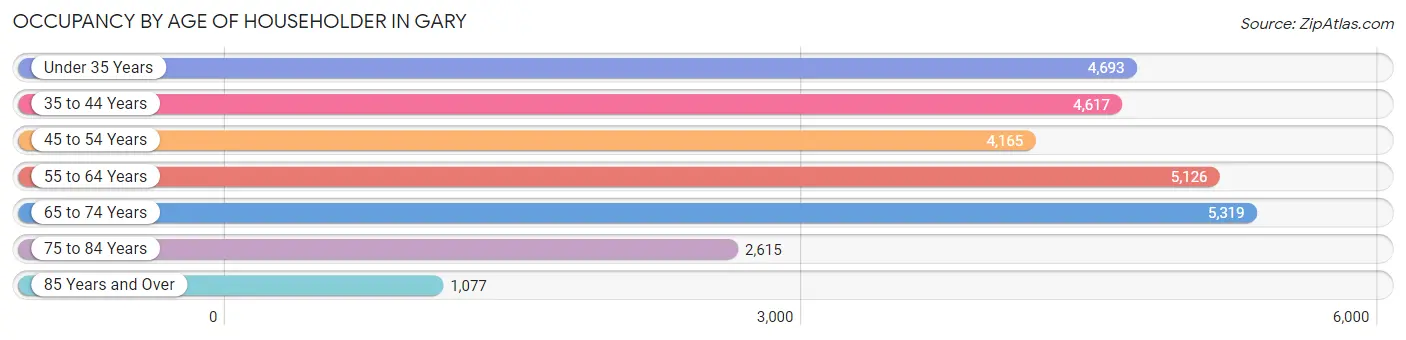
| Age Bracket | # Households | % Households |
| Under 35 Years | 4,693 | 17.0% |
| 35 to 44 Years | 4,617 | 16.7% |
| 45 to 54 Years | 4,165 | 15.1% |
| 55 to 64 Years | 5,126 | 18.6% |
| 65 to 74 Years | 5,319 | 19.3% |
| 75 to 84 Years | 2,615 | 9.5% |
| 85 Years and Over | 1,077 | 3.9% |
| Total | 27,612 | 100.0% |
Housing Finances in Gary
Median Income by Occupancy in Gary
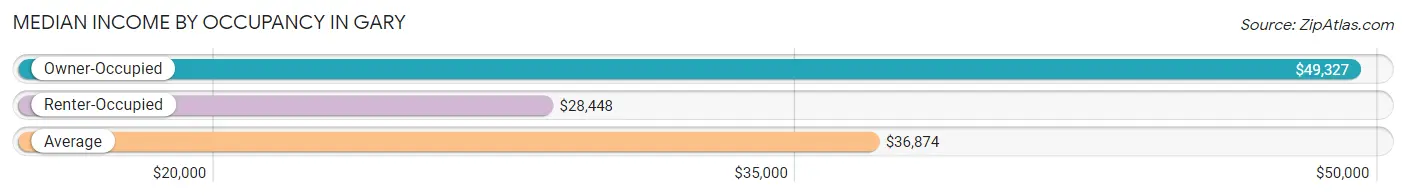
| Occupancy Type | # Households | Median Income |
| Owner-Occupied | 13,324 (48.2%) | $49,327 |
| Renter-Occupied | 14,288 (51.7%) | $28,448 |
| Average | 27,612 (100.0%) | $36,874 |
Occupancy by Householder Income Bracket in Gary
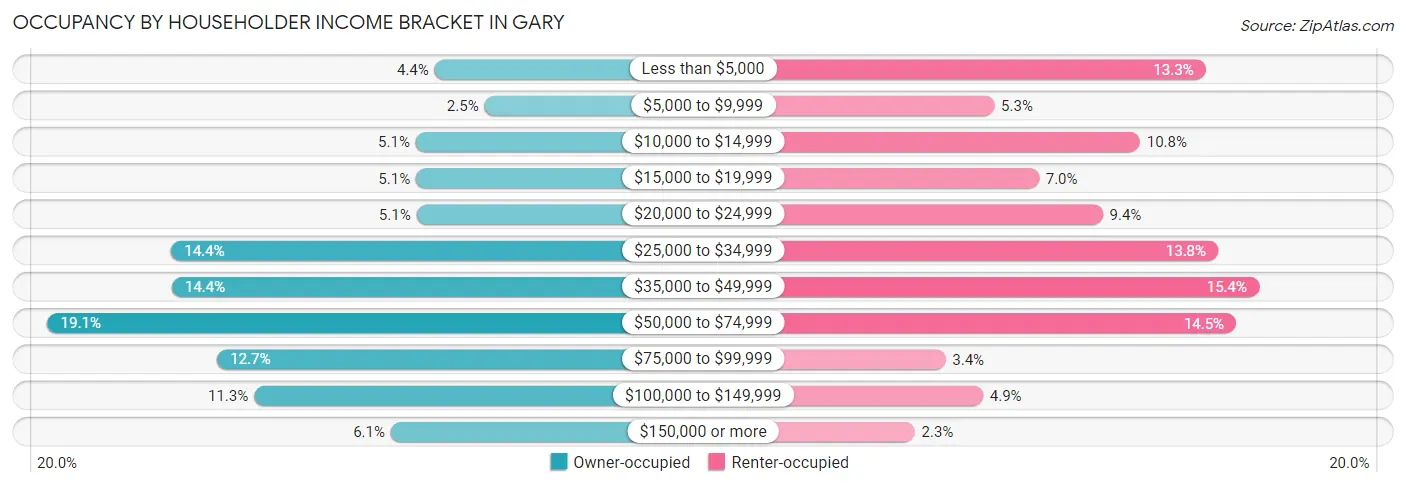
| Income Bracket | Owner-occupied | Renter-occupied |
| Less than $5,000 | 583 (4.4%) | 1,904 (13.3%) |
| $5,000 to $9,999 | 330 (2.5%) | 755 (5.3%) |
| $10,000 to $14,999 | 680 (5.1%) | 1,547 (10.8%) |
| $15,000 to $19,999 | 678 (5.1%) | 998 (7.0%) |
| $20,000 to $24,999 | 676 (5.1%) | 1,344 (9.4%) |
| $25,000 to $34,999 | 1,920 (14.4%) | 1,972 (13.8%) |
| $35,000 to $49,999 | 1,917 (14.4%) | 2,194 (15.4%) |
| $50,000 to $74,999 | 2,547 (19.1%) | 2,070 (14.5%) |
| $75,000 to $99,999 | 1,687 (12.7%) | 489 (3.4%) |
| $100,000 to $149,999 | 1,500 (11.3%) | 693 (4.9%) |
| $150,000 or more | 806 (6.0%) | 322 (2.2%) |
| Total | 13,324 (100.0%) | 14,288 (100.0%) |
Monthly Housing Cost Tiers in Gary
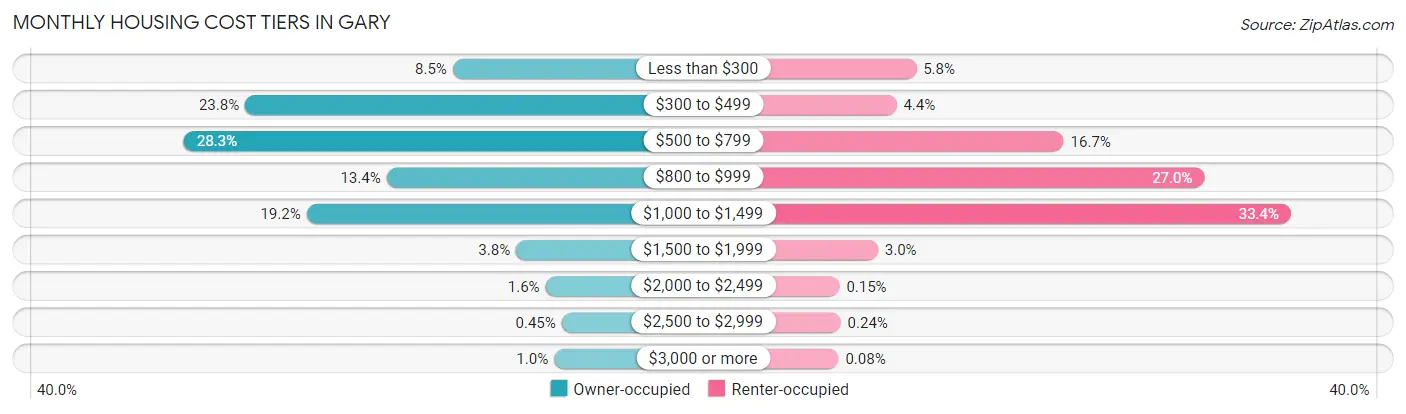
| Monthly Cost | Owner-occupied | Renter-occupied |
| Less than $300 | 1,128 (8.5%) | 829 (5.8%) |
| $300 to $499 | 3,167 (23.8%) | 622 (4.3%) |
| $500 to $799 | 3,767 (28.3%) | 2,381 (16.7%) |
| $800 to $999 | 1,779 (13.4%) | 3,859 (27.0%) |
| $1,000 to $1,499 | 2,563 (19.2%) | 4,771 (33.4%) |
| $1,500 to $1,999 | 507 (3.8%) | 426 (3.0%) |
| $2,000 to $2,499 | 219 (1.6%) | 22 (0.2%) |
| $2,500 to $2,999 | 60 (0.4%) | 34 (0.2%) |
| $3,000 or more | 134 (1.0%) | 12 (0.1%) |
| Total | 13,324 (100.0%) | 14,288 (100.0%) |
Physical Housing Characteristics in Gary
Housing Structures in Gary
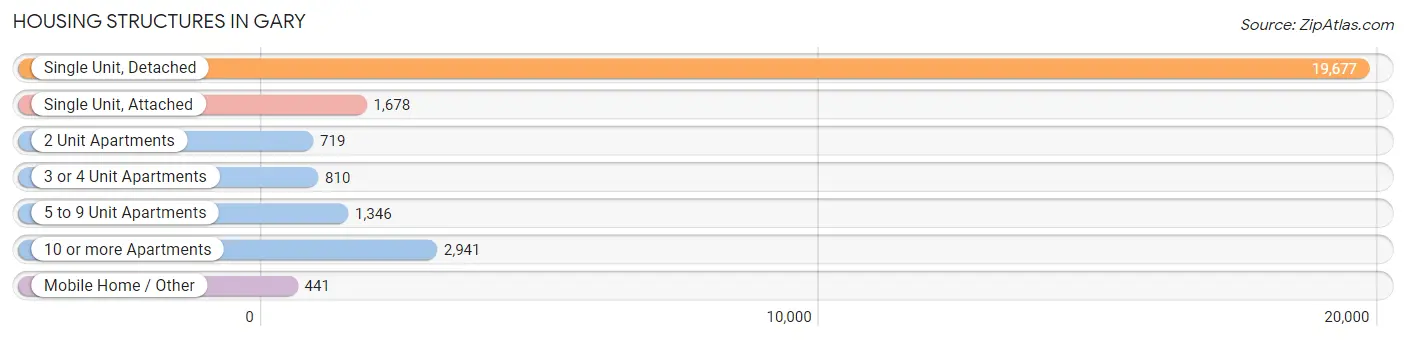
| Structure Type | # Housing Units | % Housing Units |
| Single Unit, Detached | 19,677 | 71.3% |
| Single Unit, Attached | 1,678 | 6.1% |
| 2 Unit Apartments | 719 | 2.6% |
| 3 or 4 Unit Apartments | 810 | 2.9% |
| 5 to 9 Unit Apartments | 1,346 | 4.9% |
| 10 or more Apartments | 2,941 | 10.6% |
| Mobile Home / Other | 441 | 1.6% |
| Total | 27,612 | 100.0% |
Housing Structures by Occupancy in Gary
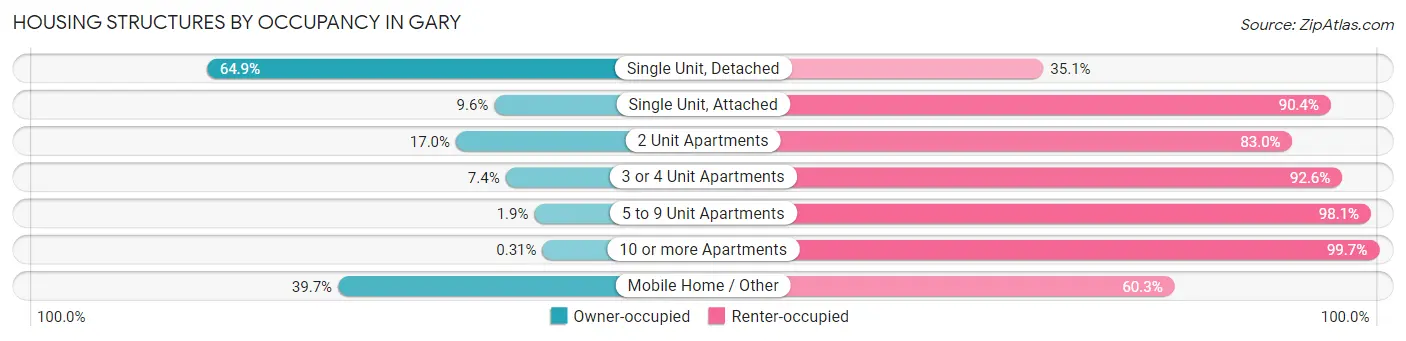
| Structure Type | Owner-occupied | Renter-occupied |
| Single Unit, Detached | 12,772 (64.9%) | 6,905 (35.1%) |
| Single Unit, Attached | 161 (9.6%) | 1,517 (90.4%) |
| 2 Unit Apartments | 122 (17.0%) | 597 (83.0%) |
| 3 or 4 Unit Apartments | 60 (7.4%) | 750 (92.6%) |
| 5 to 9 Unit Apartments | 25 (1.9%) | 1,321 (98.1%) |
| 10 or more Apartments | 9 (0.3%) | 2,932 (99.7%) |
| Mobile Home / Other | 175 (39.7%) | 266 (60.3%) |
| Total | 13,324 (48.2%) | 14,288 (51.7%) |
Housing Structures by Number of Rooms in Gary
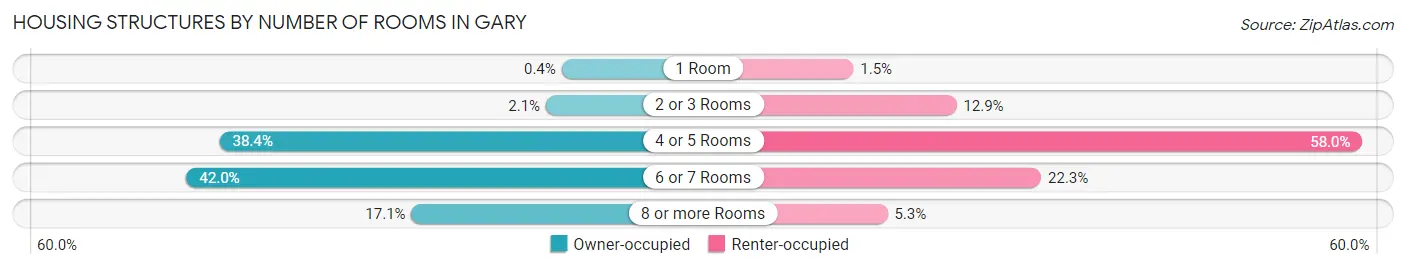
| Number of Rooms | Owner-occupied | Renter-occupied |
| 1 Room | 53 (0.4%) | 213 (1.5%) |
| 2 or 3 Rooms | 285 (2.1%) | 1,848 (12.9%) |
| 4 or 5 Rooms | 5,111 (38.4%) | 8,283 (58.0%) |
| 6 or 7 Rooms | 5,601 (42.0%) | 3,190 (22.3%) |
| 8 or more Rooms | 2,274 (17.1%) | 754 (5.3%) |
| Total | 13,324 (100.0%) | 14,288 (100.0%) |
Housing Structure by Heating Type in Gary
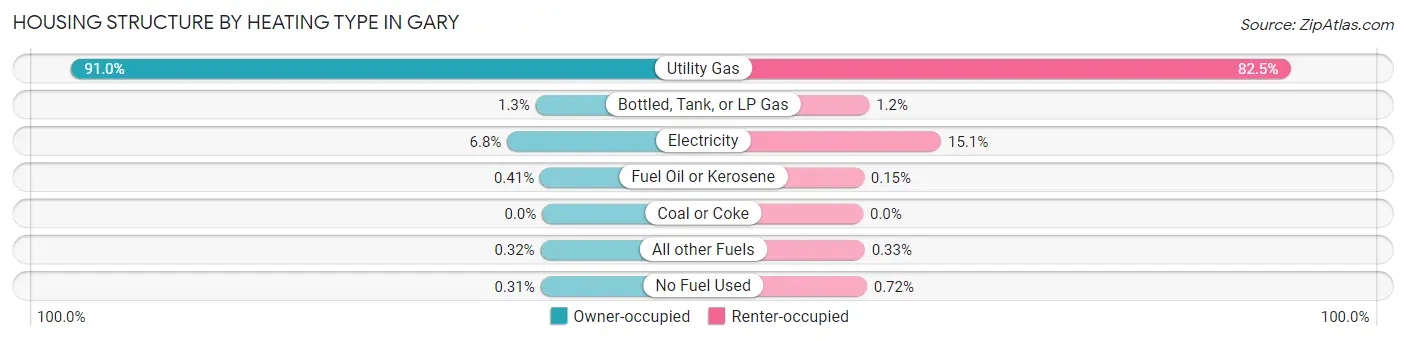
| Heating Type | Owner-occupied | Renter-occupied |
| Utility Gas | 12,120 (91.0%) | 11,791 (82.5%) |
| Bottled, Tank, or LP Gas | 167 (1.3%) | 172 (1.2%) |
| Electricity | 899 (6.8%) | 2,153 (15.1%) |
| Fuel Oil or Kerosene | 54 (0.4%) | 22 (0.2%) |
| Coal or Coke | 0 (0.0%) | 0 (0.0%) |
| All other Fuels | 43 (0.3%) | 47 (0.3%) |
| No Fuel Used | 41 (0.3%) | 103 (0.7%) |
| Total | 13,324 (100.0%) | 14,288 (100.0%) |
Household Vehicle Usage in Gary
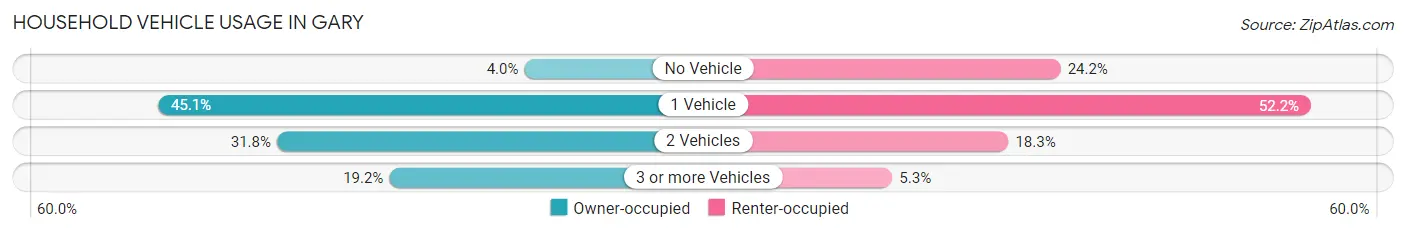
| Vehicles per Household | Owner-occupied | Renter-occupied |
| No Vehicle | 536 (4.0%) | 3,453 (24.2%) |
| 1 Vehicle | 6,004 (45.1%) | 7,458 (52.2%) |
| 2 Vehicles | 4,231 (31.8%) | 2,617 (18.3%) |
| 3 or more Vehicles | 2,553 (19.2%) | 760 (5.3%) |
| Total | 13,324 (100.0%) | 14,288 (100.0%) |
Real Estate & Mortgages in Gary
Real Estate and Mortgage Overview in Gary
| Characteristic | Without Mortgage | With Mortgage |
| Housing Units | 7,877 | 5,447 |
| Median Property Value | $69,000 | $100,600 |
| Median Household Income | $43,056 | $392 |
| Monthly Housing Costs | $485 | $77 |
| Real Estate Taxes | $863 | $253 |
Property Value by Mortgage Status in Gary
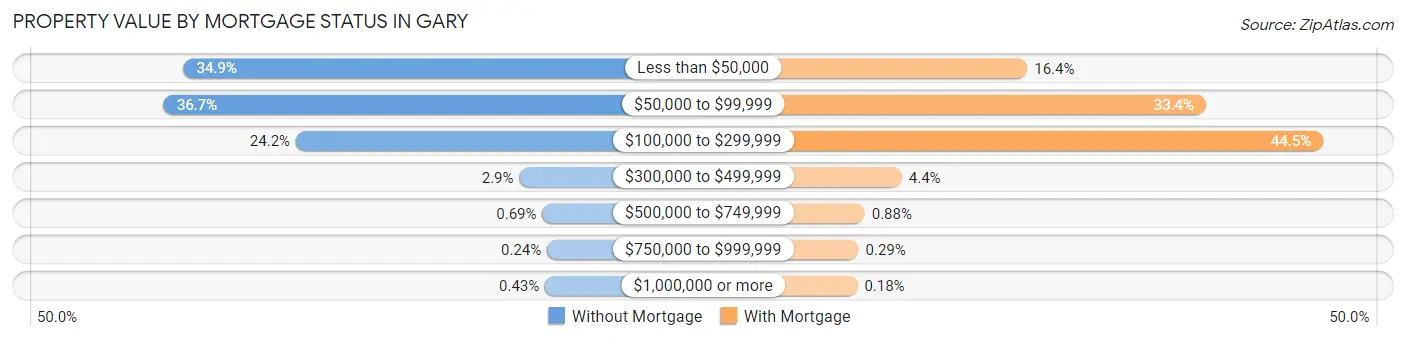
| Property Value | Without Mortgage | With Mortgage |
| Less than $50,000 | 2,746 (34.9%) | 891 (16.4%) |
| $50,000 to $99,999 | 2,894 (36.7%) | 1,817 (33.4%) |
| $100,000 to $299,999 | 1,903 (24.2%) | 2,425 (44.5%) |
| $300,000 to $499,999 | 227 (2.9%) | 240 (4.4%) |
| $500,000 to $749,999 | 54 (0.7%) | 48 (0.9%) |
| $750,000 to $999,999 | 19 (0.2%) | 16 (0.3%) |
| $1,000,000 or more | 34 (0.4%) | 10 (0.2%) |
| Total | 7,877 (100.0%) | 5,447 (100.0%) |
Household Income by Mortgage Status in Gary
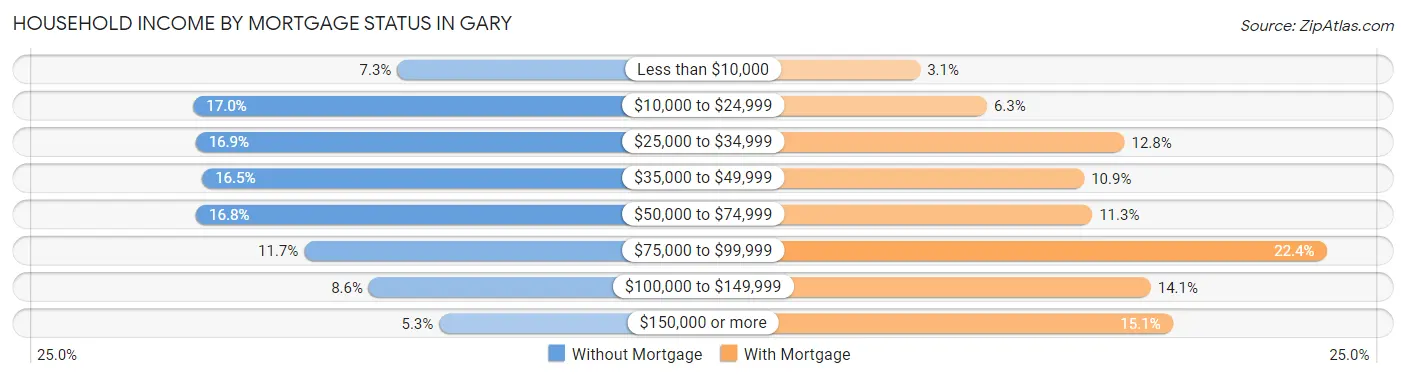
| Household Income | Without Mortgage | With Mortgage |
| Less than $10,000 | 572 (7.3%) | 168 (3.1%) |
| $10,000 to $24,999 | 1,336 (17.0%) | 341 (6.3%) |
| $25,000 to $34,999 | 1,327 (16.9%) | 698 (12.8%) |
| $35,000 to $49,999 | 1,303 (16.5%) | 593 (10.9%) |
| $50,000 to $74,999 | 1,326 (16.8%) | 614 (11.3%) |
| $75,000 to $99,999 | 921 (11.7%) | 1,221 (22.4%) |
| $100,000 to $149,999 | 678 (8.6%) | 766 (14.1%) |
| $150,000 or more | 414 (5.3%) | 822 (15.1%) |
| Total | 7,877 (100.0%) | 5,447 (100.0%) |
Property Value to Household Income Ratio in Gary
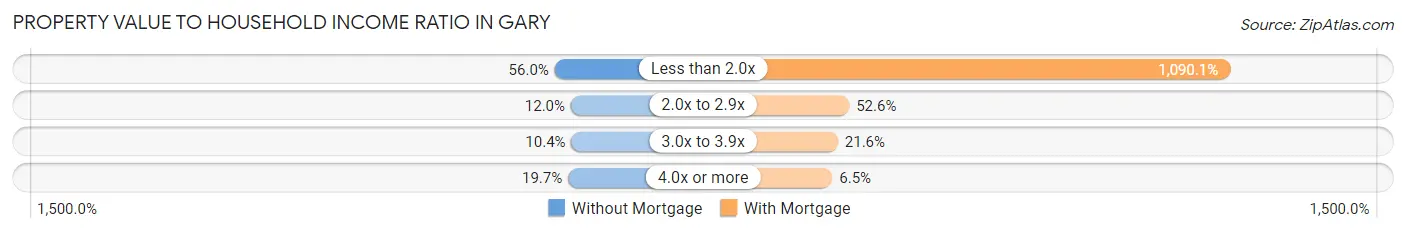
| Value-to-Income Ratio | Without Mortgage | With Mortgage |
| Less than 2.0x | 4,410 (56.0%) | 59,375 (1,090.0%) |
| 2.0x to 2.9x | 943 (12.0%) | 2,866 (52.6%) |
| 3.0x to 3.9x | 817 (10.4%) | 1,175 (21.6%) |
| 4.0x or more | 1,550 (19.7%) | 354 (6.5%) |
| Total | 7,877 (100.0%) | 5,447 (100.0%) |
Real Estate Taxes by Mortgage Status in Gary
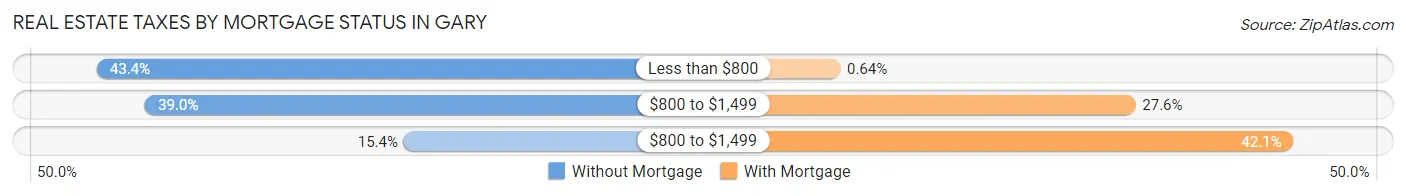
| Property Taxes | Without Mortgage | With Mortgage |
| Less than $800 | 3,419 (43.4%) | 35 (0.6%) |
| $800 to $1,499 | 3,071 (39.0%) | 1,504 (27.6%) |
| $800 to $1,499 | 1,211 (15.4%) | 2,291 (42.1%) |
| Total | 7,877 (100.0%) | 5,447 (100.0%) |
Health & Disability in Gary
Health Insurance Coverage by Age in Gary

| Age Bracket | With Coverage | Without Coverage |
| Under 6 Years | 5,949 (95.8%) | 264 (4.3%) |
| 6 to 18 Years | 12,958 (94.7%) | 723 (5.3%) |
| 19 to 25 Years | 4,613 (82.4%) | 983 (17.6%) |
| 26 to 34 Years | 5,799 (79.3%) | 1,509 (20.6%) |
| 35 to 44 Years | 6,870 (86.7%) | 1,053 (13.3%) |
| 45 to 54 Years | 6,396 (87.6%) | 901 (12.3%) |
| 55 to 64 Years | 7,430 (90.4%) | 788 (9.6%) |
| 65 to 74 Years | 7,787 (99.7%) | 24 (0.3%) |
| 75 Years and older | 4,724 (99.8%) | 11 (0.2%) |
| Total | 62,526 (90.9%) | 6,256 (9.1%) |
Health Insurance Coverage by Citizenship Status in Gary
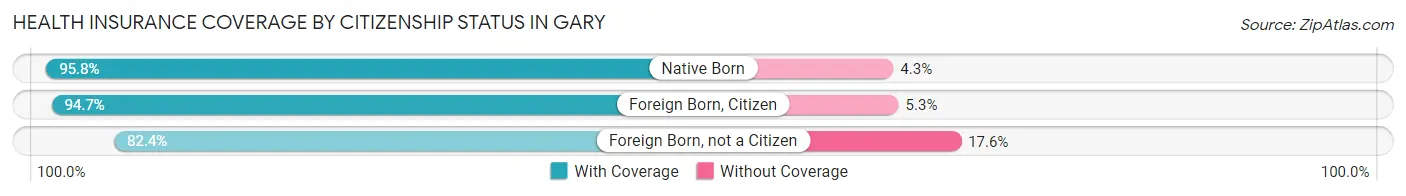
| Citizenship Status | With Coverage | Without Coverage |
| Native Born | 5,949 (95.8%) | 264 (4.3%) |
| Foreign Born, Citizen | 12,958 (94.7%) | 723 (5.3%) |
| Foreign Born, not a Citizen | 4,613 (82.4%) | 983 (17.6%) |
Health Insurance Coverage by Household Income in Gary
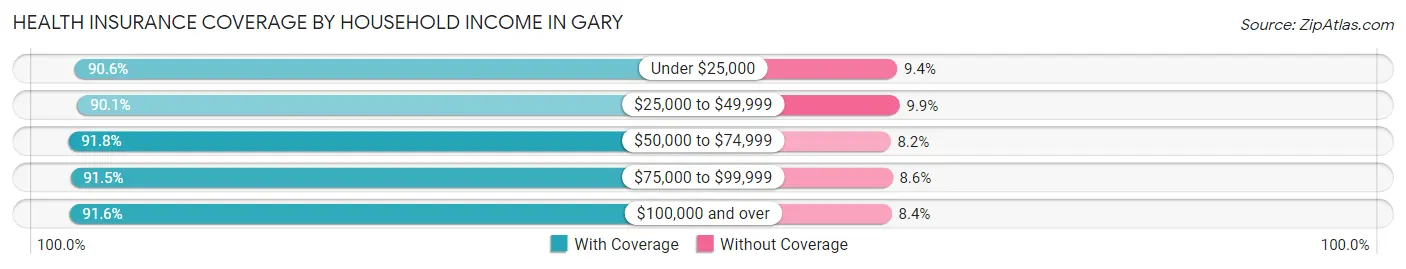
| Household Income | With Coverage | Without Coverage |
| Under $25,000 | 18,458 (90.6%) | 1,924 (9.4%) |
| $25,000 to $49,999 | 17,606 (90.1%) | 1,930 (9.9%) |
| $50,000 to $74,999 | 10,358 (91.8%) | 923 (8.2%) |
| $75,000 to $99,999 | 5,862 (91.4%) | 548 (8.6%) |
| $100,000 and over | 9,940 (91.6%) | 910 (8.4%) |
Public vs Private Health Insurance Coverage by Age in Gary
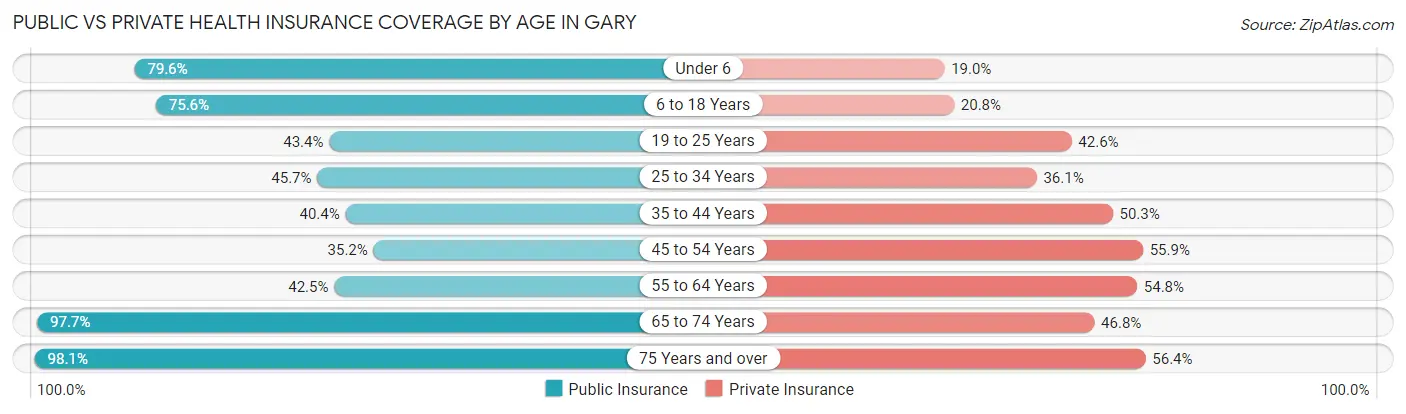
| Age Bracket | Public Insurance | Private Insurance |
| Under 6 | 4,947 (79.6%) | 1,181 (19.0%) |
| 6 to 18 Years | 10,347 (75.6%) | 2,846 (20.8%) |
| 19 to 25 Years | 2,431 (43.4%) | 2,385 (42.6%) |
| 25 to 34 Years | 3,337 (45.7%) | 2,641 (36.1%) |
| 35 to 44 Years | 3,203 (40.4%) | 3,981 (50.2%) |
| 45 to 54 Years | 2,570 (35.2%) | 4,076 (55.9%) |
| 55 to 64 Years | 3,494 (42.5%) | 4,501 (54.8%) |
| 65 to 74 Years | 7,630 (97.7%) | 3,659 (46.8%) |
| 75 Years and over | 4,647 (98.1%) | 2,668 (56.4%) |
| Total | 42,606 (61.9%) | 27,938 (40.6%) |
Disability Status by Sex by Age in Gary
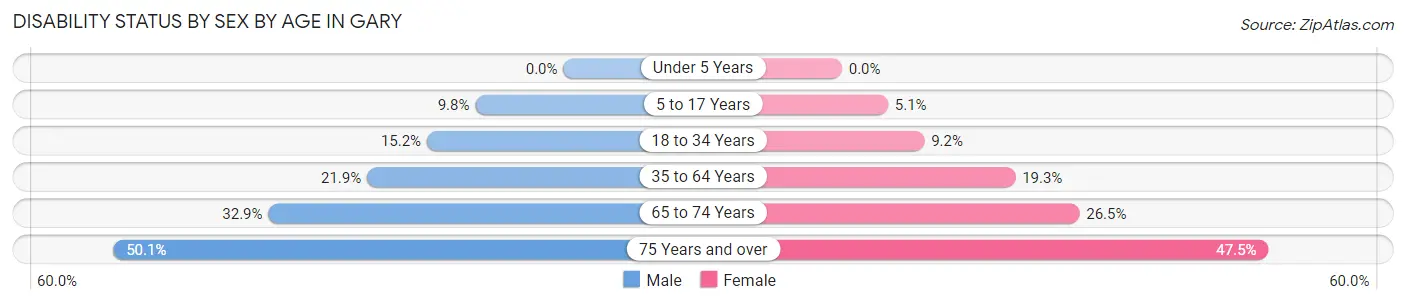
| Age Bracket | Male | Female |
| Under 5 Years | 0 (0.0%) | 0 (0.0%) |
| 5 to 17 Years | 689 (9.8%) | 368 (5.1%) |
| 18 to 34 Years | 938 (15.2%) | 694 (9.2%) |
| 35 to 64 Years | 2,381 (21.9%) | 2,422 (19.3%) |
| 65 to 74 Years | 1,089 (32.9%) | 1,189 (26.5%) |
| 75 Years and over | 942 (50.1%) | 1,357 (47.5%) |
Disability Class by Sex by Age in Gary
Disability Class: Hearing Difficulty
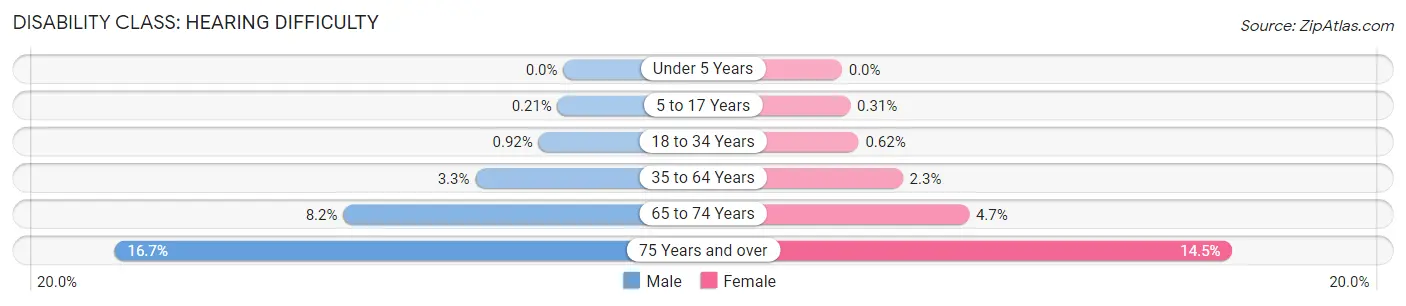
| Age Bracket | Male | Female |
| Under 5 Years | 0 (0.0%) | 0 (0.0%) |
| 5 to 17 Years | 15 (0.2%) | 22 (0.3%) |
| 18 to 34 Years | 57 (0.9%) | 47 (0.6%) |
| 35 to 64 Years | 356 (3.3%) | 284 (2.3%) |
| 65 to 74 Years | 271 (8.2%) | 212 (4.7%) |
| 75 Years and over | 313 (16.7%) | 414 (14.5%) |
Disability Class: Vision Difficulty
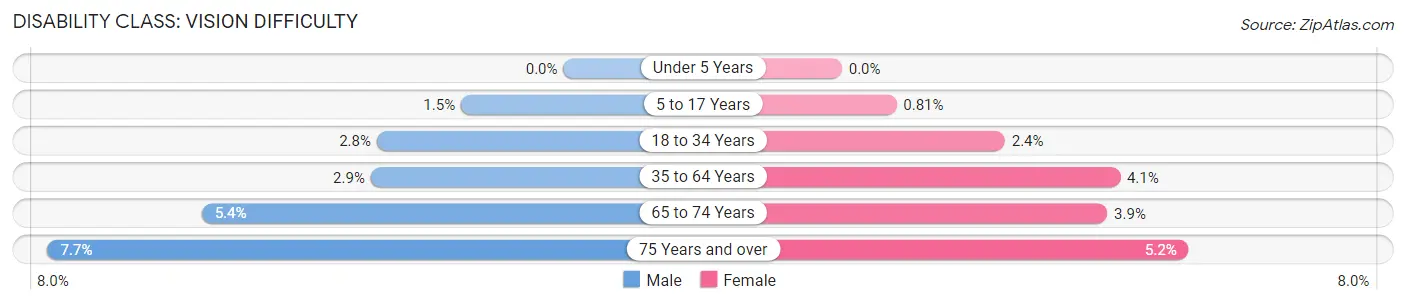
| Age Bracket | Male | Female |
| Under 5 Years | 0 (0.0%) | 0 (0.0%) |
| 5 to 17 Years | 107 (1.5%) | 58 (0.8%) |
| 18 to 34 Years | 171 (2.8%) | 183 (2.4%) |
| 35 to 64 Years | 312 (2.9%) | 518 (4.1%) |
| 65 to 74 Years | 178 (5.4%) | 177 (3.9%) |
| 75 Years and over | 144 (7.7%) | 147 (5.1%) |
Disability Class: Cognitive Difficulty
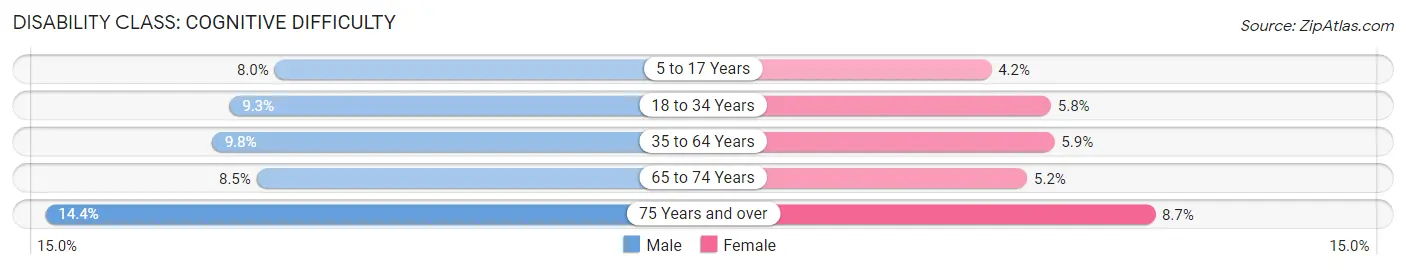
| Age Bracket | Male | Female |
| 5 to 17 Years | 565 (8.0%) | 298 (4.2%) |
| 18 to 34 Years | 574 (9.3%) | 440 (5.8%) |
| 35 to 64 Years | 1,066 (9.8%) | 743 (5.9%) |
| 65 to 74 Years | 283 (8.5%) | 232 (5.2%) |
| 75 Years and over | 271 (14.4%) | 249 (8.7%) |
Disability Class: Ambulatory Difficulty
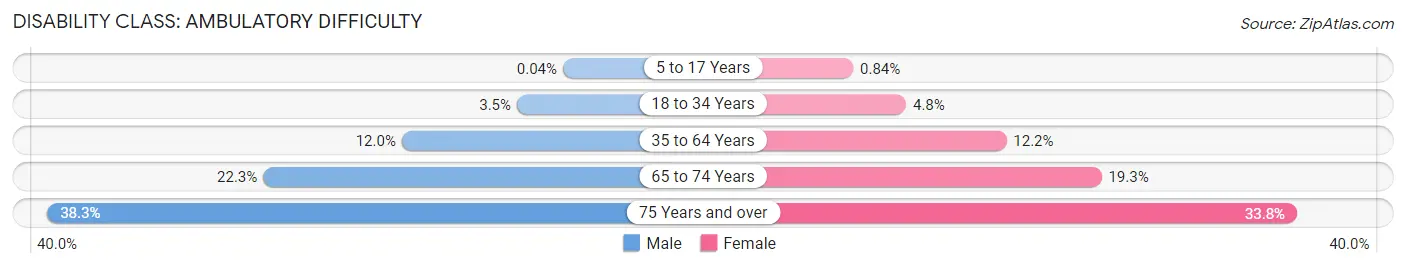
| Age Bracket | Male | Female |
| 5 to 17 Years | 3 (0.0%) | 60 (0.8%) |
| 18 to 34 Years | 213 (3.5%) | 361 (4.8%) |
| 35 to 64 Years | 1,307 (12.0%) | 1,533 (12.2%) |
| 65 to 74 Years | 739 (22.3%) | 867 (19.3%) |
| 75 Years and over | 720 (38.3%) | 965 (33.8%) |
Disability Class: Self-Care Difficulty
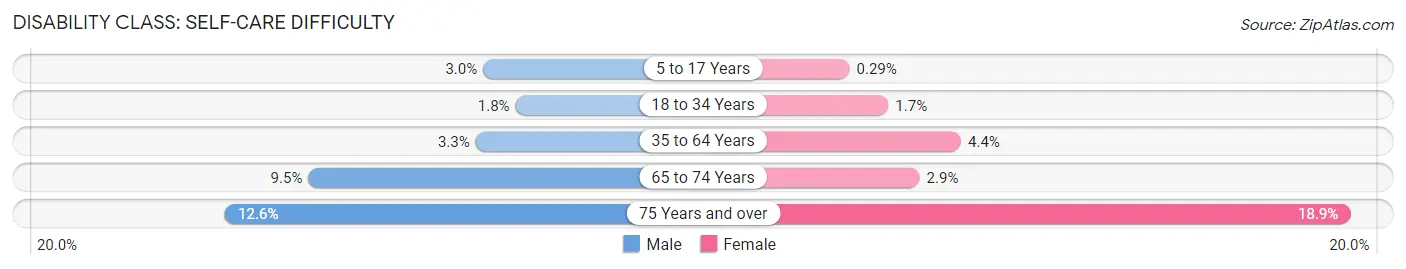
| Age Bracket | Male | Female |
| 5 to 17 Years | 209 (3.0%) | 21 (0.3%) |
| 18 to 34 Years | 110 (1.8%) | 131 (1.7%) |
| 35 to 64 Years | 355 (3.3%) | 556 (4.4%) |
| 65 to 74 Years | 314 (9.5%) | 130 (2.9%) |
| 75 Years and over | 236 (12.6%) | 539 (18.9%) |
Technology Access in Gary
Computing Device Access in Gary
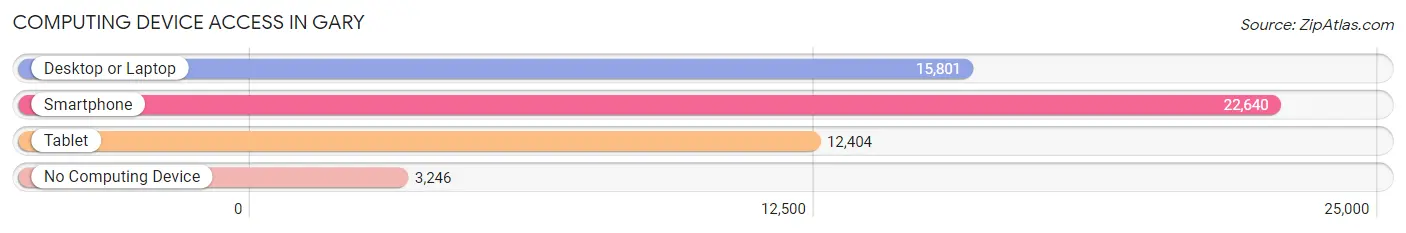
| Device Type | # Households | % Households |
| Desktop or Laptop | 15,801 | 57.2% |
| Smartphone | 22,640 | 82.0% |
| Tablet | 12,404 | 44.9% |
| No Computing Device | 3,246 | 11.8% |
| Total | 27,612 | 100.0% |
Internet Access in Gary
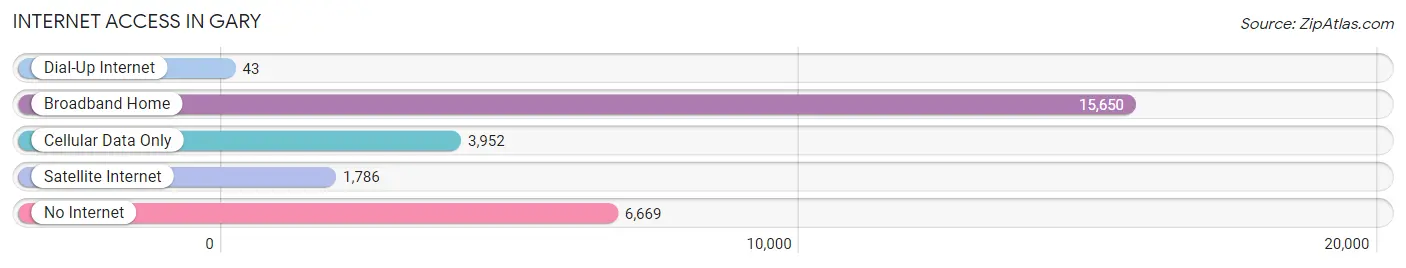
| Internet Type | # Households | % Households |
| Dial-Up Internet | 43 | 0.2% |
| Broadband Home | 15,650 | 56.7% |
| Cellular Data Only | 3,952 | 14.3% |
| Satellite Internet | 1,786 | 6.5% |
| No Internet | 6,669 | 24.1% |
| Total | 27,612 | 100.0% |
Gary Summary
Gary, Indiana is a city located in Lake County, Indiana, United States. It is part of the Chicago metropolitan area and is the largest city in Lake County. As of the 2010 census, the city had a total population of 80,294, making it the ninth-largest city in the state of Indiana. It is the home of the Gary SouthShore RailCats professional baseball team.
History
The city of Gary was founded in 1906 by the United States Steel Corporation as the home for its new plant, Gary Works. The city was named after lawyer Elbert Henry Gary, who was the founding chairman of the United States Steel Corporation. The city quickly grew as thousands of immigrants from Eastern and Southern Europe, as well as African Americans from the South, moved to the city to work in the steel mills. By 1910, the city had a population of over 30,000 and was the fifth-largest city in Indiana.
During the 1920s and 1930s, Gary experienced a period of rapid growth and industrialization. The city's population grew to over 100,000 by 1930, and the city became a major industrial center. The city was also home to a vibrant jazz scene, and was the birthplace of the Jackson 5.
In the 1950s and 1960s, Gary experienced a period of economic decline as the steel industry began to decline. The city's population began to decline as well, and by the 1970s the city had lost over half of its population.
Geography
Gary is located in the southeastern corner of Lake County, Indiana, on the southern shore of Lake Michigan. The city is bordered to the north by the city of Hammond, to the east by the city of East Chicago, to the south by the city of Hobart, and to the west by the city of Griffith. The city covers an area of approximately 25 square miles.
The city is situated on a low-lying plain, with an elevation of approximately 590 feet above sea level. The city is located in the humid continental climate zone, with hot, humid summers and cold, snowy winters.
Economy
Gary's economy is largely based on manufacturing and industry. The city is home to several large steel mills, including the Gary Works, which is the largest steel mill in the United States. The city is also home to several other manufacturing companies, including the Gary Sanitary District, which produces sanitary products.
The city is also home to several large employers, including the University of Chicago Medical Center, Methodist Hospitals, and the Gary Community School Corporation. The city is also home to several large retail stores, including Walmart, Target, and Kohl's.
Demographics
As of the 2010 census, the city had a population of 80,294. The racial makeup of the city was 57.2% African American, 33.3% White, 0.5% Native American, 0.7% Asian, 0.1% Pacific Islander, 5.7% from other races, and 2.5% from two or more races. Hispanic or Latino of any race were 11.2% of the population.
The median income for a household in the city was $30,935, and the median income for a family was $36,945. The per capita income for the city was $15,945. About 22.2% of families and 25.7% of the population were below the poverty line, including 36.2% of those under age 18 and 15.2% of those age 65 or over.
Common Questions
What is Per Capita Income in Gary?
Per Capita income in Gary is $20,954.
What is the Median Family Income in Gary?
Median Family Income in Gary is $41,355.
What is the Median Household income in Gary?
Median Household Income in Gary is $36,874.
What is Income or Wage Gap in Gary?
Income or Wage Gap in Gary is 21.4%.
Women in Gary earn 78.6 cents for every dollar earned by a man.
What is Family Income Deficit in Gary?
Family Income Deficit in Gary is $13,614.
Families that are below poverty line in Gary earn $13,614 less on average than the poverty threshold level.
What is Inequality or Gini Index in Gary?
Inequality or Gini Index in Gary is 0.47.
What is the Total Population of Gary?
Total Population of Gary is 69,136.
What is the Total Male Population of Gary?
Total Male Population of Gary is 32,206.
What is the Total Female Population of Gary?
Total Female Population of Gary is 36,930.
What is the Ratio of Males per 100 Females in Gary?
There are 87.21 Males per 100 Females in Gary.
What is the Ratio of Females per 100 Males in Gary?
There are 114.67 Females per 100 Males in Gary.
What is the Median Population Age in Gary?
Median Population Age in Gary is 36.9 Years.
What is the Average Family Size in Gary
Average Family Size in Gary is 3.3 People.
What is the Average Household Size in Gary
Average Household Size in Gary is 2.5 People.
How Large is the Labor Force in Gary?
There are 26,661 People in the Labor Forcein in Gary.
What is the Percentage of People in the Labor Force in Gary?
51.0% of People are in the Labor Force in Gary.
What is the Unemployment Rate in Gary?
Unemployment Rate in Gary is 13.5%.