Mobile, AL
Mobile Map
Mobile Overview
186,316
TOTAL POPULATION
87,658
MALE POPULATION
98,658
FEMALE POPULATION
88.85
MALES / 100 FEMALES
112.55
FEMALES / 100 MALES
37.6
MEDIAN AGE
3.2
AVG FAMILY SIZE
2.3
AVG HOUSEHOLD SIZE
$31,328
PER CAPITA INCOME
$64,558
AVG FAMILY INCOME
$48,524
AVG HOUSEHOLD INCOME
33.4%
WAGE / INCOME GAP [ % ]
66.6¢/ $1
WAGE / INCOME GAP [ $ ]
$11,311
FAMILY INCOME DEFICIT
0.50
INEQUALITY / GINI INDEX
87,496
LABOR FORCE [ PEOPLE ]
58.1%
PERCENT IN LABOR FORCE
6.5%
UNEMPLOYMENT RATE
Mobile Zip Codes
Mobile Area Codes
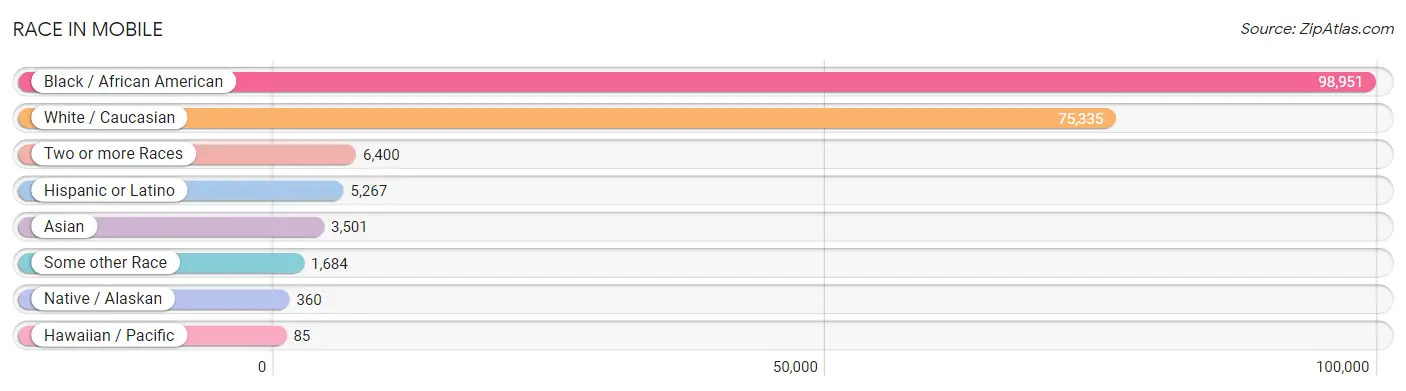
Race in Mobile
The most populous races in Mobile are Black / African American (98,951 | 53.1%), White / Caucasian (75,335 | 40.4%), and Two or more Races (6,400 | 3.4%).
| Race | # Population | % Population |
| Asian | 3,501 | 1.9% |
| Black / African American | 98,951 | 53.1% |
| Hawaiian / Pacific | 85 | 0.1% |
| Hispanic or Latino | 5,267 | 2.8% |
| Native / Alaskan | 360 | 0.2% |
| White / Caucasian | 75,335 | 40.4% |
| Two or more Races | 6,400 | 3.4% |
| Some other Race | 1,684 | 0.9% |
| Total | 186,316 | 100.0% |
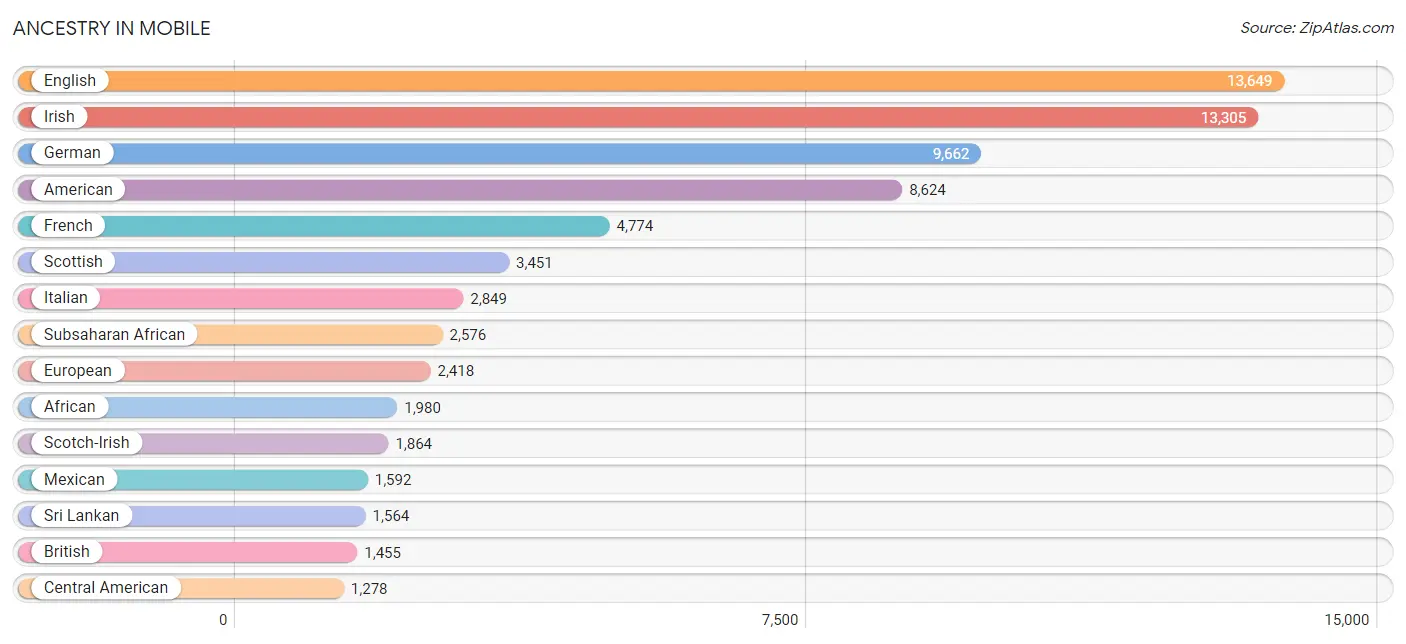
Ancestry in Mobile
The most populous ancestries reported in Mobile are English (13,649 | 7.3%), Irish (13,305 | 7.1%), German (9,662 | 5.2%), American (8,624 | 4.6%), and French (4,774 | 2.6%), together accounting for 26.9% of all Mobile residents.
| Ancestry | # Population | % Population |
| African | 1,980 | 1.1% |
| American | 8,624 | 4.6% |
| Apache | 5 | 0.0% |
| Arab | 1,045 | 0.6% |
| Argentinean | 36 | 0.0% |
| Armenian | 15 | 0.0% |
| Australian | 28 | 0.0% |
| Austrian | 165 | 0.1% |
| Bahamian | 70 | 0.0% |
| Belgian | 8 | 0.0% |
| Bhutanese | 140 | 0.1% |
| Blackfeet | 7 | 0.0% |
| British | 1,455 | 0.8% |
| British West Indian | 5 | 0.0% |
| Bulgarian | 25 | 0.0% |
| Burmese | 316 | 0.2% |
| Cajun | 53 | 0.0% |
| Canadian | 66 | 0.0% |
| Carpatho Rusyn | 12 | 0.0% |
| Central American | 1,278 | 0.7% |
| Central American Indian | 43 | 0.0% |
| Cherokee | 358 | 0.2% |
| Chickasaw | 10 | 0.0% |
| Chilean | 127 | 0.1% |
| Chinese | 3 | 0.0% |
| Chippewa | 17 | 0.0% |
| Choctaw | 129 | 0.1% |
| Colombian | 82 | 0.0% |
| Comanche | 8 | 0.0% |
| Costa Rican | 17 | 0.0% |
| Creek | 164 | 0.1% |
| Croatian | 31 | 0.0% |
| Cuban | 233 | 0.1% |
| Czech | 174 | 0.1% |
| Czechoslovakian | 62 | 0.0% |
| Danish | 183 | 0.1% |
| Dominican | 585 | 0.3% |
| Dutch | 465 | 0.3% |
| Eastern European | 175 | 0.1% |
| Ecuadorian | 24 | 0.0% |
| Egyptian | 84 | 0.1% |
| English | 13,649 | 7.3% |
| Estonian | 4 | 0.0% |
| European | 2,418 | 1.3% |
| French | 4,774 | 2.6% |
| French American Indian | 9 | 0.0% |
| French Canadian | 194 | 0.1% |
| German | 9,662 | 5.2% |
| Ghanaian | 10 | 0.0% |
| Greek | 578 | 0.3% |
| Guatemalan | 601 | 0.3% |
| Guyanese | 6 | 0.0% |
| Honduran | 217 | 0.1% |
| Hungarian | 255 | 0.1% |
| Indian (Asian) | 789 | 0.4% |
| Iranian | 27 | 0.0% |
| Iraqi | 83 | 0.0% |
| Irish | 13,305 | 7.1% |
| Iroquois | 15 | 0.0% |
| Italian | 2,849 | 1.5% |
| Jamaican | 127 | 0.1% |
| Japanese | 7 | 0.0% |
| Jordanian | 8 | 0.0% |
| Kenyan | 22 | 0.0% |
| Korean | 621 | 0.3% |
| Laotian | 35 | 0.0% |
| Lebanese | 414 | 0.2% |
| Lithuanian | 64 | 0.0% |
| Malaysian | 37 | 0.0% |
| Maltese | 10 | 0.0% |
| Mexican | 1,592 | 0.9% |
| Mexican American Indian | 5 | 0.0% |
| Mongolian | 101 | 0.1% |
| Moroccan | 33 | 0.0% |
| Native Hawaiian | 9 | 0.0% |
| Nicaraguan | 275 | 0.2% |
| Nigerian | 83 | 0.0% |
| Northern European | 136 | 0.1% |
| Norwegian | 681 | 0.4% |
| Pakistani | 62 | 0.0% |
| Panamanian | 44 | 0.0% |
| Paraguayan | 47 | 0.0% |
| Peruvian | 27 | 0.0% |
| Polish | 620 | 0.3% |
| Portuguese | 81 | 0.0% |
| Potawatomi | 17 | 0.0% |
| Puerto Rican | 624 | 0.3% |
| Romanian | 71 | 0.0% |
| Russian | 290 | 0.2% |
| Salvadoran | 71 | 0.0% |
| Samoan | 30 | 0.0% |
| Scandinavian | 585 | 0.3% |
| Scotch-Irish | 1,864 | 1.0% |
| Scottish | 3,451 | 1.8% |
| Seminole | 1 | 0.0% |
| Serbian | 10 | 0.0% |
| Sioux | 4 | 0.0% |
| Slovak | 46 | 0.0% |
| Slovene | 5 | 0.0% |
| South African | 17 | 0.0% |
| South American | 385 | 0.2% |
| South American Indian | 14 | 0.0% |
| Spaniard | 172 | 0.1% |
| Spanish | 148 | 0.1% |
| Sri Lankan | 1,564 | 0.8% |
| Subsaharan African | 2,576 | 1.4% |
| Swedish | 599 | 0.3% |
| Swiss | 50 | 0.0% |
| Syrian | 58 | 0.0% |
| Thai | 498 | 0.3% |
| Trinidadian and Tobagonian | 12 | 0.0% |
| Turkish | 25 | 0.0% |
| Ukrainian | 103 | 0.1% |
| Venezuelan | 42 | 0.0% |
| Vietnamese | 52 | 0.0% |
| Welsh | 617 | 0.3% |
| West Indian | 113 | 0.1% |
| Yugoslavian | 97 | 0.1% |
| Zimbabwean | 7 | 0.0% | View All 119 Rows |
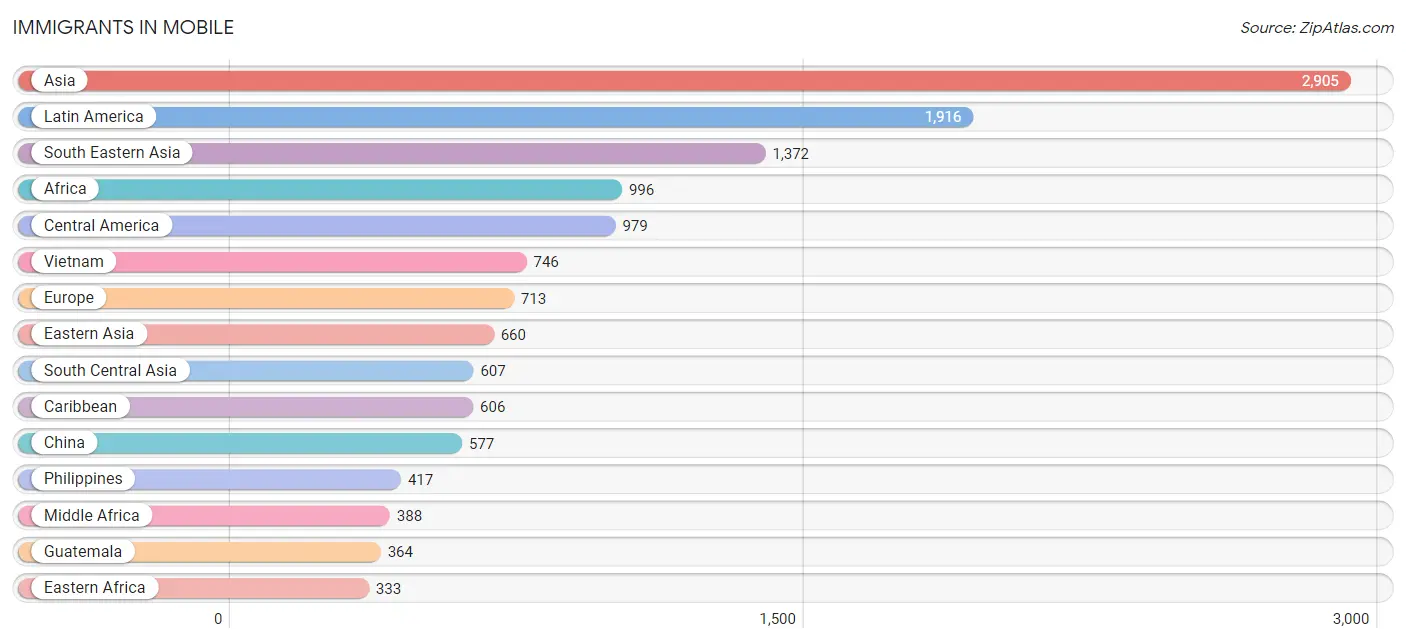
Immigrants in Mobile
The most numerous immigrant groups reported in Mobile came from Asia (2,905 | 1.6%), Latin America (1,916 | 1.0%), South Eastern Asia (1,372 | 0.7%), Africa (996 | 0.5%), and Central America (979 | 0.5%), together accounting for 4.4% of all Mobile residents.
| Immigration Origin | # Population | % Population |
| Africa | 996 | 0.5% |
| Asia | 2,905 | 1.6% |
| Australia | 33 | 0.0% |
| Bangladesh | 65 | 0.0% |
| Bosnia and Herzegovina | 45 | 0.0% |
| Brazil | 32 | 0.0% |
| Canada | 86 | 0.1% |
| Caribbean | 606 | 0.3% |
| Central America | 979 | 0.5% |
| Chile | 127 | 0.1% |
| China | 577 | 0.3% |
| Colombia | 78 | 0.0% |
| Congo | 160 | 0.1% |
| Croatia | 16 | 0.0% |
| Cuba | 47 | 0.0% |
| Czechoslovakia | 7 | 0.0% |
| Dominican Republic | 327 | 0.2% |
| Eastern Africa | 333 | 0.2% |
| Eastern Asia | 660 | 0.4% |
| Eastern Europe | 161 | 0.1% |
| Egypt | 74 | 0.0% |
| El Salvador | 122 | 0.1% |
| England | 132 | 0.1% |
| Ethiopia | 33 | 0.0% |
| Europe | 713 | 0.4% |
| Fiji | 14 | 0.0% |
| France | 45 | 0.0% |
| Germany | 203 | 0.1% |
| Greece | 18 | 0.0% |
| Grenada | 7 | 0.0% |
| Guatemala | 364 | 0.2% |
| Haiti | 6 | 0.0% |
| Honduras | 90 | 0.1% |
| India | 277 | 0.2% |
| Indonesia | 35 | 0.0% |
| Iran | 33 | 0.0% |
| Iraq | 80 | 0.0% |
| Ireland | 35 | 0.0% |
| Italy | 21 | 0.0% |
| Jamaica | 126 | 0.1% |
| Japan | 8 | 0.0% |
| Jordan | 27 | 0.0% |
| Kazakhstan | 22 | 0.0% |
| Kenya | 89 | 0.1% |
| Korea | 75 | 0.0% |
| Kuwait | 6 | 0.0% |
| Laos | 19 | 0.0% |
| Latin America | 1,916 | 1.0% |
| Lebanon | 39 | 0.0% |
| Malaysia | 73 | 0.0% |
| Mexico | 236 | 0.1% |
| Micronesia | 41 | 0.0% |
| Middle Africa | 388 | 0.2% |
| Nepal | 35 | 0.0% |
| Netherlands | 46 | 0.0% |
| Nicaragua | 150 | 0.1% |
| Nigeria | 49 | 0.0% |
| Northern Africa | 148 | 0.1% |
| Northern Europe | 219 | 0.1% |
| Norway | 13 | 0.0% |
| Oceania | 96 | 0.1% |
| Pakistan | 169 | 0.1% |
| Panama | 17 | 0.0% |
| Peru | 19 | 0.0% |
| Philippines | 417 | 0.2% |
| Poland | 15 | 0.0% |
| Russia | 15 | 0.0% |
| Saudi Arabia | 6 | 0.0% |
| South Africa | 16 | 0.0% |
| South America | 331 | 0.2% |
| South Central Asia | 607 | 0.3% |
| South Eastern Asia | 1,372 | 0.7% |
| Southern Europe | 39 | 0.0% |
| Sri Lanka | 6 | 0.0% |
| Syria | 39 | 0.0% |
| Taiwan | 165 | 0.1% |
| Thailand | 82 | 0.0% |
| Trinidad and Tobago | 5 | 0.0% |
| Turkey | 30 | 0.0% |
| Ukraine | 44 | 0.0% |
| Venezuela | 42 | 0.0% |
| Vietnam | 746 | 0.4% |
| West Indies | 49 | 0.0% |
| Western Africa | 49 | 0.0% |
| Western Asia | 266 | 0.1% |
| Western Europe | 294 | 0.2% |
| Zaire | 175 | 0.1% |
| Zimbabwe | 7 | 0.0% | View All 88 Rows |
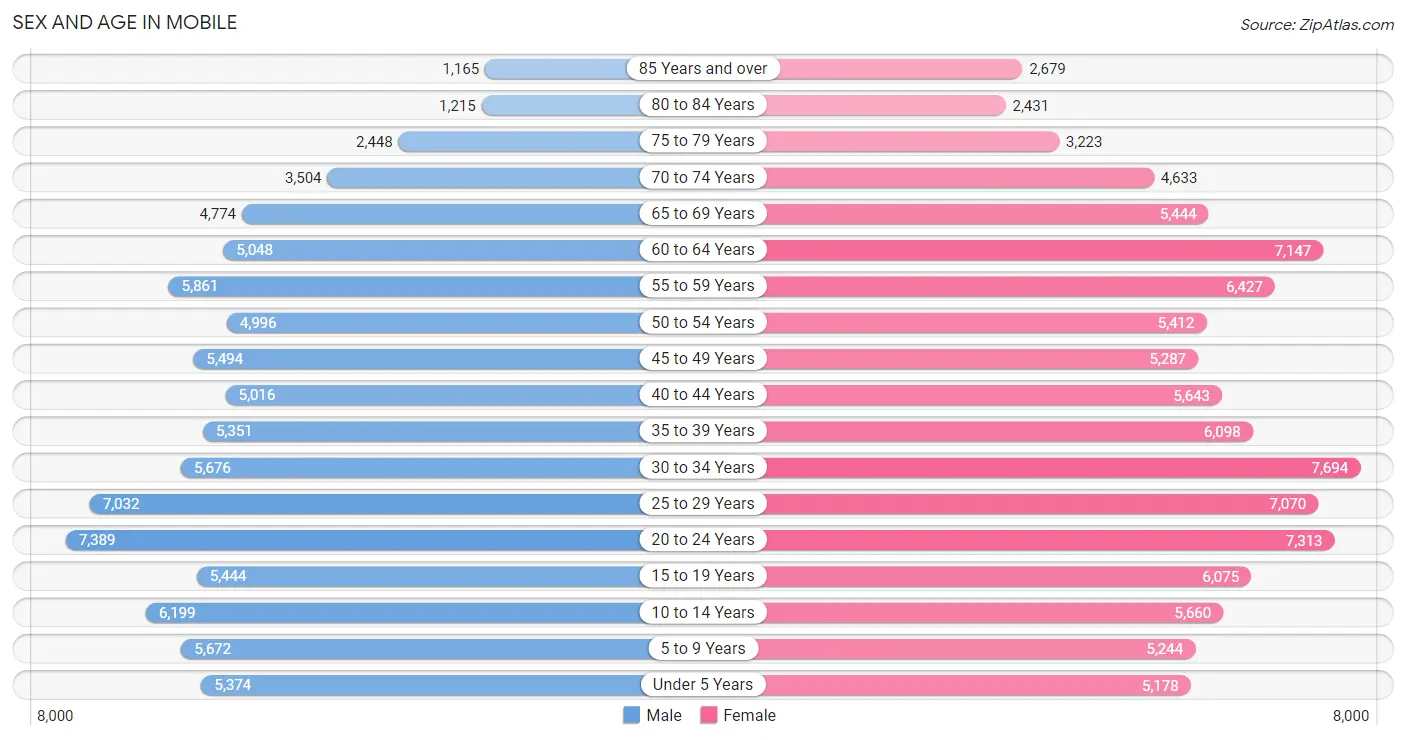
Sex and Age in Mobile
Sex and Age in Mobile
The most populous age groups in Mobile are 20 to 24 Years (7,389 | 8.4%) for men and 30 to 34 Years (7,694 | 7.8%) for women.
| Age Bracket | Male | Female |
| Under 5 Years | 5,374 (6.1%) | 5,178 (5.2%) |
| 5 to 9 Years | 5,672 (6.5%) | 5,244 (5.3%) |
| 10 to 14 Years | 6,199 (7.1%) | 5,660 (5.7%) |
| 15 to 19 Years | 5,444 (6.2%) | 6,075 (6.2%) |
| 20 to 24 Years | 7,389 (8.4%) | 7,313 (7.4%) |
| 25 to 29 Years | 7,032 (8.0%) | 7,070 (7.2%) |
| 30 to 34 Years | 5,676 (6.5%) | 7,694 (7.8%) |
| 35 to 39 Years | 5,351 (6.1%) | 6,098 (6.2%) |
| 40 to 44 Years | 5,016 (5.7%) | 5,643 (5.7%) |
| 45 to 49 Years | 5,494 (6.3%) | 5,287 (5.4%) |
| 50 to 54 Years | 4,996 (5.7%) | 5,412 (5.5%) |
| 55 to 59 Years | 5,861 (6.7%) | 6,427 (6.5%) |
| 60 to 64 Years | 5,048 (5.8%) | 7,147 (7.2%) |
| 65 to 69 Years | 4,774 (5.4%) | 5,444 (5.5%) |
| 70 to 74 Years | 3,504 (4.0%) | 4,633 (4.7%) |
| 75 to 79 Years | 2,448 (2.8%) | 3,223 (3.3%) |
| 80 to 84 Years | 1,215 (1.4%) | 2,431 (2.5%) |
| 85 Years and over | 1,165 (1.3%) | 2,679 (2.7%) |
| Total | 87,658 (100.0%) | 98,658 (100.0%) |
Families and Households in Mobile
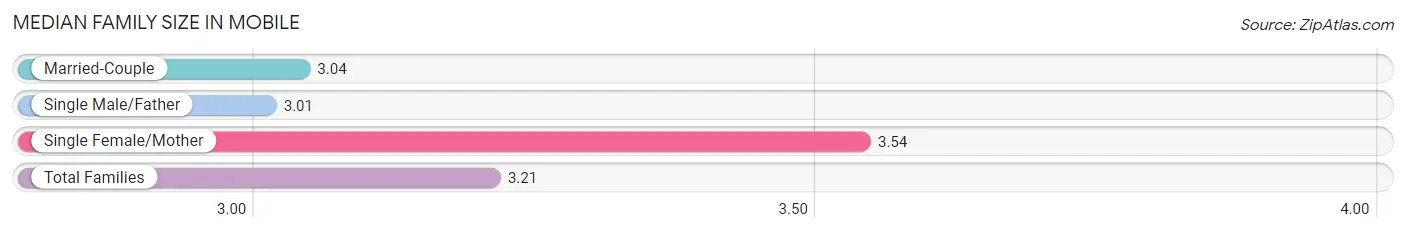
Median Family Size in Mobile
The median family size in Mobile is 3.21 persons per family, with single female/mother families (13,977 | 33.1%) accounting for the largest median family size of 3.54 persons per family. On the other hand, single male/father families (3,060 | 7.2%) represent the smallest median family size with 3.01 persons per family.
| Family Type | # Families | Family Size |
| Married-Couple | 25,148 (59.6%) | 3.04 |
| Single Male/Father | 3,060 (7.2%) | 3.01 |
| Single Female/Mother | 13,977 (33.1%) | 3.54 |
| Total Families | 42,185 (100.0%) | 3.21 |
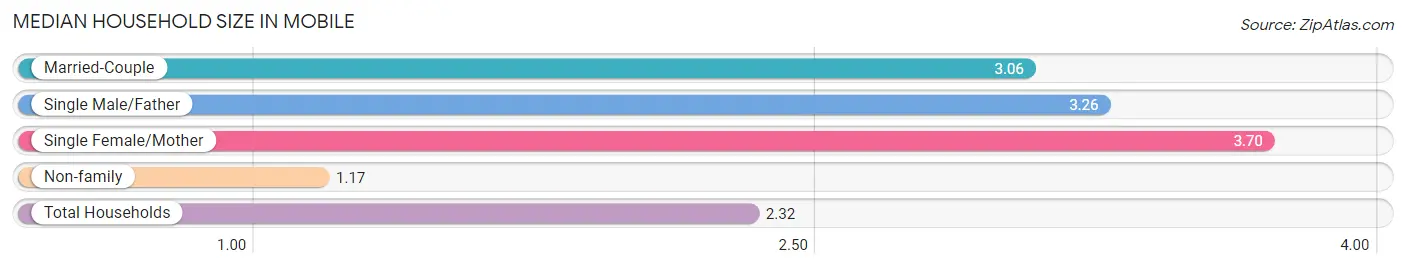
Median Household Size in Mobile
The median household size in Mobile is 2.32 persons per household, with single female/mother households (13,977 | 18.0%) accounting for the largest median household size of 3.7 persons per household. non-family households (35,659 | 45.8%) represent the smallest median household size with 1.17 persons per household.
| Household Type | # Households | Household Size |
| Married-Couple | 25,148 (32.3%) | 3.06 |
| Single Male/Father | 3,060 (3.9%) | 3.26 |
| Single Female/Mother | 13,977 (18.0%) | 3.70 |
| Non-family | 35,659 (45.8%) | 1.17 |
| Total Households | 77,844 (100.0%) | 2.32 |
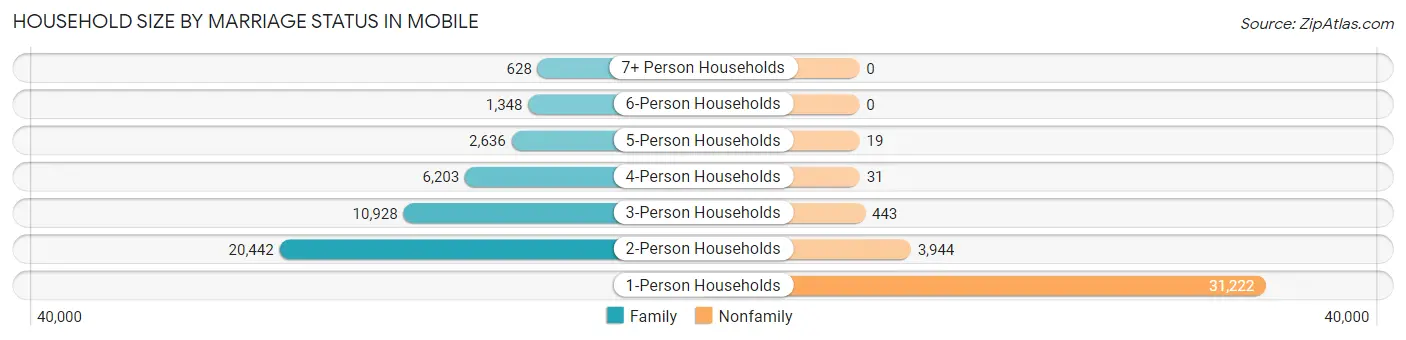
Household Size by Marriage Status in Mobile
Out of a total of 77,844 households in Mobile, 42,185 (54.2%) are family households, while 35,659 (45.8%) are nonfamily households. The most numerous type of family households are 2-person households, comprising 20,442, and the most common type of nonfamily households are 1-person households, comprising 31,222.
| Household Size | Family Households | Nonfamily Households |
| 1-Person Households | - | 31,222 (40.1%) |
| 2-Person Households | 20,442 (26.3%) | 3,944 (5.1%) |
| 3-Person Households | 10,928 (14.0%) | 443 (0.6%) |
| 4-Person Households | 6,203 (8.0%) | 31 (0.0%) |
| 5-Person Households | 2,636 (3.4%) | 19 (0.0%) |
| 6-Person Households | 1,348 (1.7%) | 0 (0.0%) |
| 7+ Person Households | 628 (0.8%) | 0 (0.0%) |
| Total | 42,185 (54.2%) | 35,659 (45.8%) |
Female Fertility in Mobile
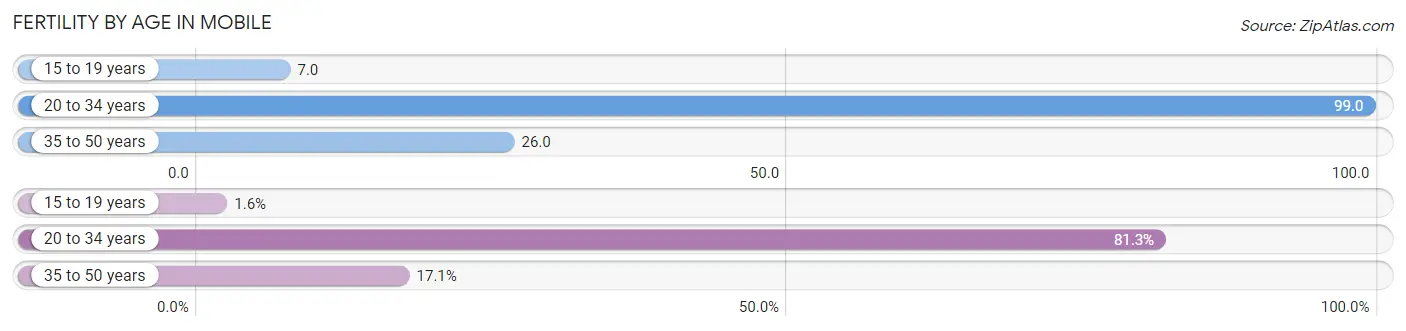
Fertility by Age in Mobile
Average fertility rate in Mobile is 58.0 births per 1,000 women. Women in the age bracket of 20 to 34 years have the highest fertility rate with 99.0 births per 1,000 women. Women in the age bracket of 20 to 34 years acount for 81.3% of all women with births.
| Age Bracket | Women with Births | Births / 1,000 Women |
| 15 to 19 years | 44 (1.6%) | 7.0 |
| 20 to 34 years | 2,177 (81.3%) | 99.0 |
| 35 to 50 years | 458 (17.1%) | 26.0 |
| Total | 2,679 (100.0%) | 58.0 |
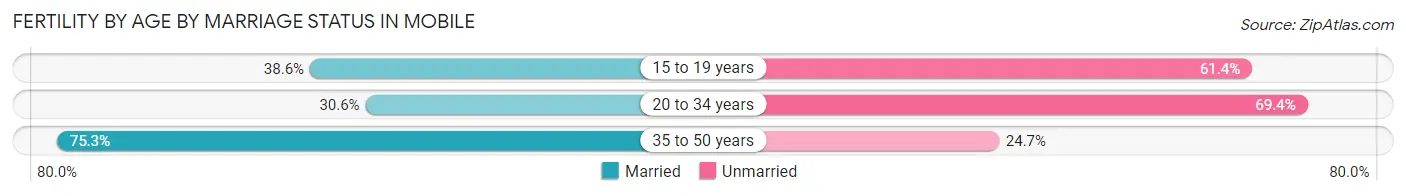
Fertility by Age by Marriage Status in Mobile
38.4% of women with births (2,679) in Mobile are married. The highest percentage of unmarried women with births falls into 20 to 34 years age bracket with 69.4% of them unmarried at the time of birth, while the lowest percentage of unmarried women with births belong to 35 to 50 years age bracket with 24.7% of them unmarried.
| Age Bracket | Married | Unmarried |
| 15 to 19 years | 17 (38.6%) | 27 (61.4%) |
| 20 to 34 years | 666 (30.6%) | 1,511 (69.4%) |
| 35 to 50 years | 345 (75.3%) | 113 (24.7%) |
| Total | 1,029 (38.4%) | 1,650 (61.6%) |
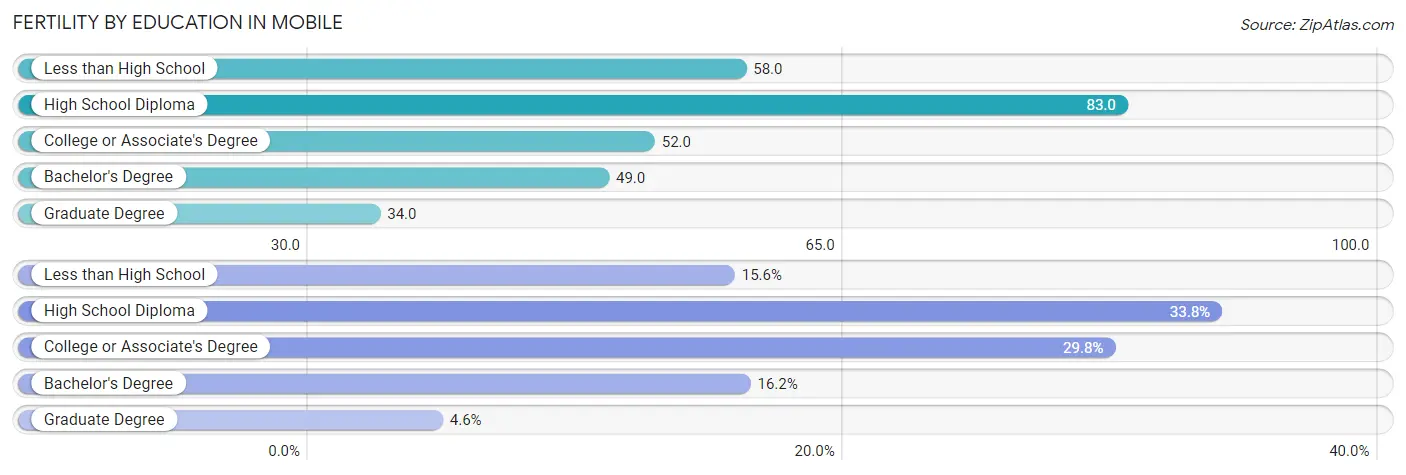
Fertility by Education in Mobile
Average fertility rate in Mobile is 58.0 births per 1,000 women. Women with the education attainment of high school diploma have the highest fertility rate of 83.0 births per 1,000 women, while women with the education attainment of graduate degree have the lowest fertility at 34.0 births per 1,000 women. Women with the education attainment of high school diploma represent 33.8% of all women with births.
| Educational Attainment | Women with Births | Births / 1,000 Women |
| Less than High School | 417 (15.6%) | 58.0 |
| High School Diploma | 906 (33.8%) | 83.0 |
| College or Associate's Degree | 799 (29.8%) | 52.0 |
| Bachelor's Degree | 433 (16.2%) | 49.0 |
| Graduate Degree | 124 (4.6%) | 34.0 |
| Total | 2,679 (100.0%) | 58.0 |
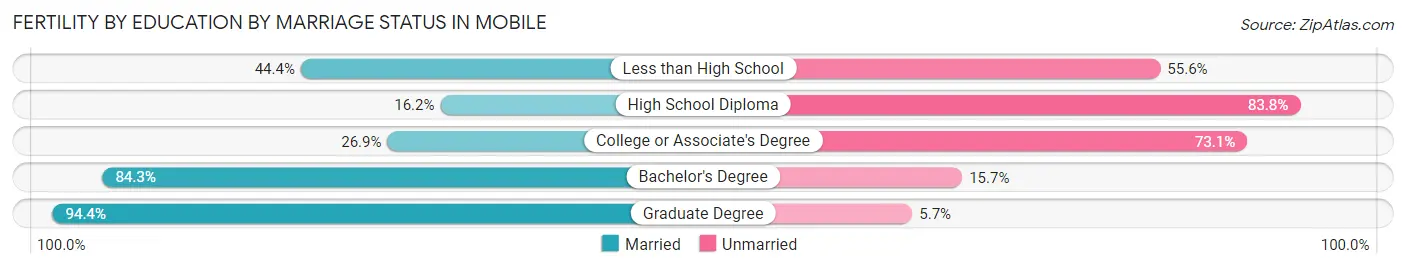
Fertility by Education by Marriage Status in Mobile
61.6% of women with births in Mobile are unmarried. Women with the educational attainment of graduate degree are most likely to be married with 94.4% of them married at childbirth, while women with the educational attainment of high school diploma are least likely to be married with 83.8% of them unmarried at childbirth.
| Educational Attainment | Married | Unmarried |
| Less than High School | 185 (44.4%) | 232 (55.6%) |
| High School Diploma | 147 (16.2%) | 759 (83.8%) |
| College or Associate's Degree | 215 (26.9%) | 584 (73.1%) |
| Bachelor's Degree | 365 (84.3%) | 68 (15.7%) |
| Graduate Degree | 117 (94.4%) | 7 (5.7%) |
| Total | 1,029 (38.4%) | 1,650 (61.6%) |
Income in Mobile
Income Overview in Mobile
Per Capita Income in Mobile is $31,328, while median incomes of families and households are $64,558 and $48,524 respectively.
| Characteristic | Number | Measure |
| Per Capita Income | 186,316 | $31,328 |
| Median Family Income | 42,185 | $64,558 |
| Mean Family Income | 42,185 | $90,489 |
| Median Household Income | 77,844 | $48,524 |
| Mean Household Income | 77,844 | $71,452 |
| Income Deficit | 42,185 | $11,311 |
| Wage / Income Gap (%) | 186,316 | 33.39% |
| Wage / Income Gap ($) | 186,316 | 66.61¢ per $1 |
| Gini / Inequality Index | 186,316 | 0.50 |
Earnings by Sex in Mobile
Average Earnings in Mobile are $34,223, $41,964 for men and $27,953 for women, a difference of 33.4%.
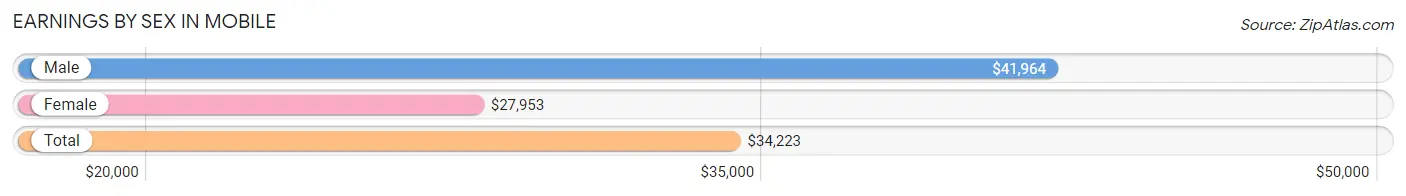
| Sex | Number | Average Earnings |
| Male | 44,576 (49.6%) | $41,964 |
| Female | 45,233 (50.4%) | $27,953 |
| Total | 89,809 (100.0%) | $34,223 |
Earnings by Sex by Income Bracket in Mobile
The most common earnings brackets in Mobile are $100,000+ for men (6,221 | 14.0%) and $25,000 to $29,999 for women (4,027 | 8.9%).
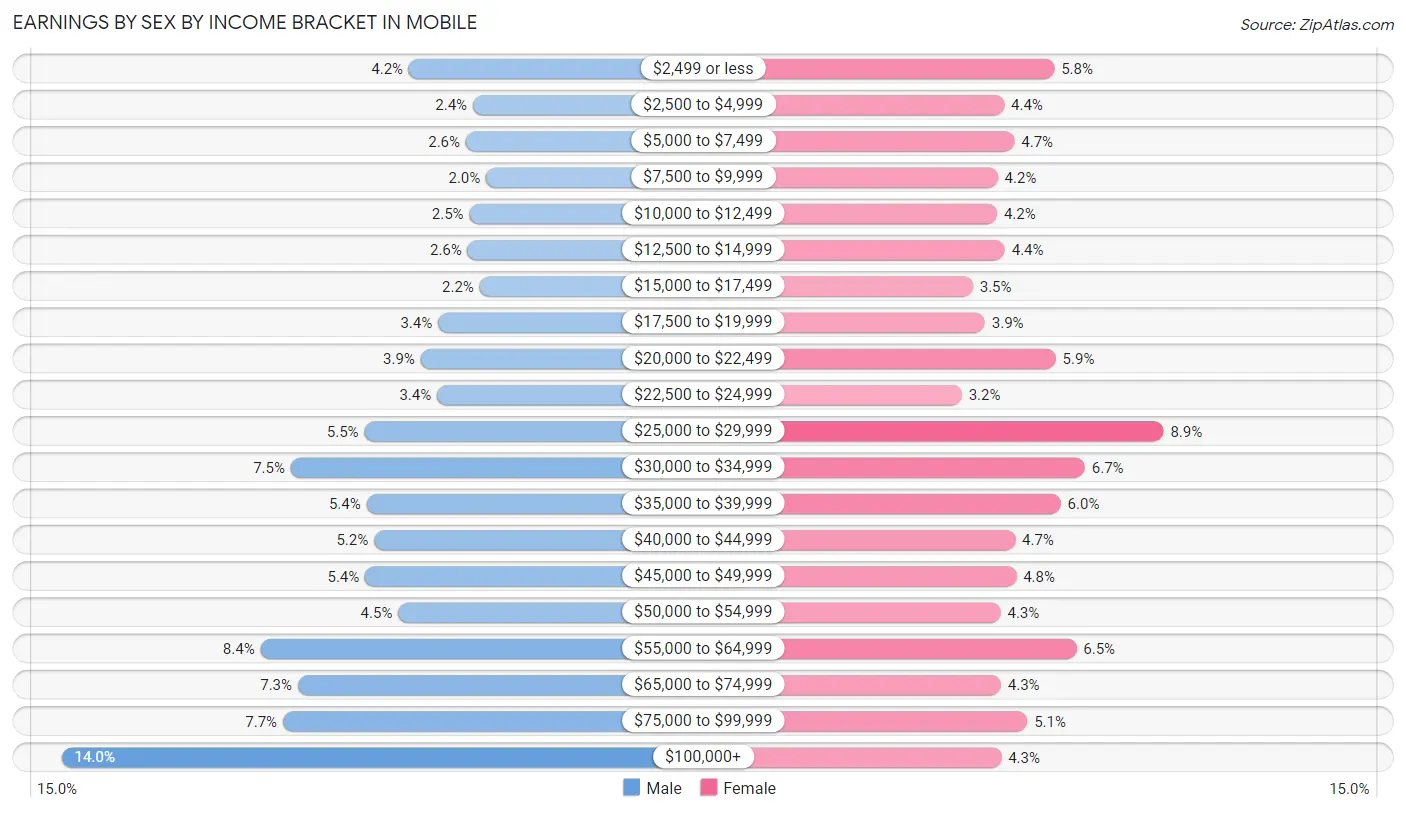
| Income | Male | Female |
| $2,499 or less | 1,873 (4.2%) | 2,639 (5.8%) |
| $2,500 to $4,999 | 1,070 (2.4%) | 1,998 (4.4%) |
| $5,000 to $7,499 | 1,159 (2.6%) | 2,131 (4.7%) |
| $7,500 to $9,999 | 906 (2.0%) | 1,919 (4.2%) |
| $10,000 to $12,499 | 1,113 (2.5%) | 1,908 (4.2%) |
| $12,500 to $14,999 | 1,138 (2.5%) | 2,010 (4.4%) |
| $15,000 to $17,499 | 987 (2.2%) | 1,599 (3.5%) |
| $17,500 to $19,999 | 1,506 (3.4%) | 1,756 (3.9%) |
| $20,000 to $22,499 | 1,723 (3.9%) | 2,655 (5.9%) |
| $22,500 to $24,999 | 1,520 (3.4%) | 1,462 (3.2%) |
| $25,000 to $29,999 | 2,431 (5.4%) | 4,027 (8.9%) |
| $30,000 to $34,999 | 3,352 (7.5%) | 3,024 (6.7%) |
| $35,000 to $39,999 | 2,401 (5.4%) | 2,720 (6.0%) |
| $40,000 to $44,999 | 2,310 (5.2%) | 2,140 (4.7%) |
| $45,000 to $49,999 | 2,419 (5.4%) | 2,155 (4.8%) |
| $50,000 to $54,999 | 2,004 (4.5%) | 1,955 (4.3%) |
| $55,000 to $64,999 | 3,731 (8.4%) | 2,918 (6.5%) |
| $65,000 to $74,999 | 3,263 (7.3%) | 1,959 (4.3%) |
| $75,000 to $99,999 | 3,449 (7.7%) | 2,294 (5.1%) |
| $100,000+ | 6,221 (14.0%) | 1,964 (4.3%) |
| Total | 44,576 (100.0%) | 45,233 (100.0%) |
Earnings by Sex by Educational Attainment in Mobile
Average earnings in Mobile are $48,746 for men and $32,349 for women, a difference of 33.6%. Men with an educational attainment of graduate degree enjoy the highest average annual earnings of $88,900, while those with less than high school education earn the least with $25,888. Women with an educational attainment of graduate degree earn the most with the average annual earnings of $54,587, while those with less than high school education have the smallest earnings of $19,175.
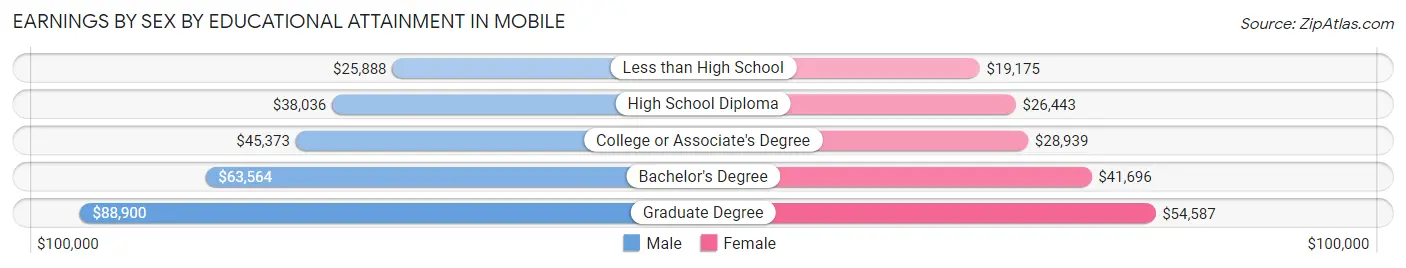
| Educational Attainment | Male Income | Female Income |
| Less than High School | $25,888 | $19,175 |
| High School Diploma | $38,036 | $26,443 |
| College or Associate's Degree | $45,373 | $28,939 |
| Bachelor's Degree | $63,564 | $41,696 |
| Graduate Degree | $88,900 | $54,587 |
| Total | $48,746 | $32,349 |
Family Income in Mobile
Family Income Brackets in Mobile
According to the Mobile family income data, there are 7,551 families falling into the $50,000 to $74,999 income range, which is the most common income bracket and makes up 17.9% of all families. Conversely, the $10,000 to $14,999 income bracket is the least frequent group with only 1,561 families (3.7%) belonging to this category.
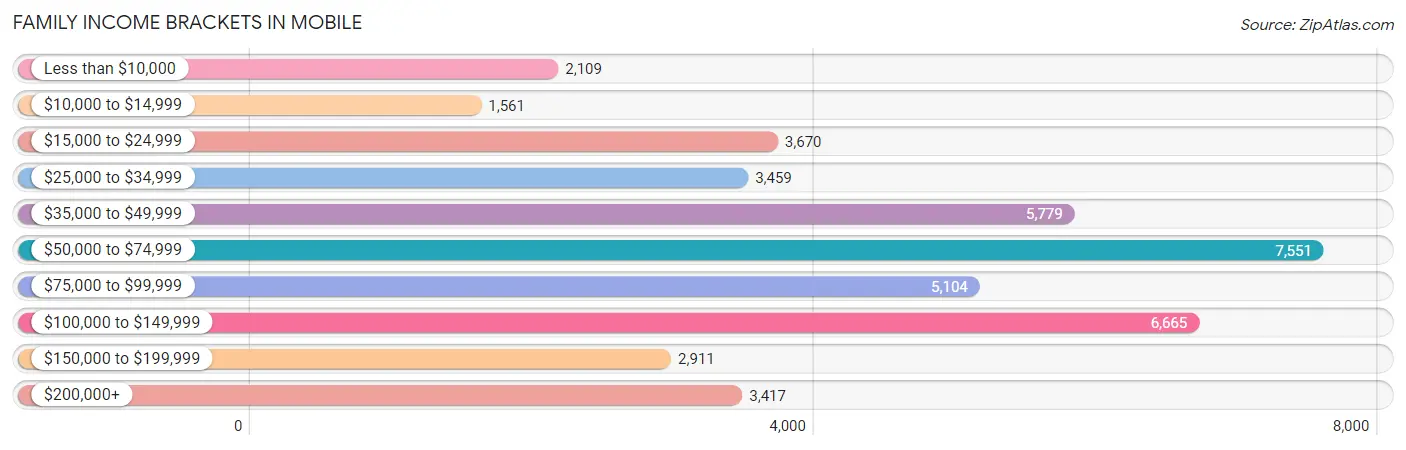
| Income Bracket | # Families | % Families |
| Less than $10,000 | 2,109 | 5.0% |
| $10,000 to $14,999 | 1,561 | 3.7% |
| $15,000 to $24,999 | 3,670 | 8.7% |
| $25,000 to $34,999 | 3,459 | 8.2% |
| $35,000 to $49,999 | 5,779 | 13.7% |
| $50,000 to $74,999 | 7,551 | 17.9% |
| $75,000 to $99,999 | 5,104 | 12.1% |
| $100,000 to $149,999 | 6,665 | 15.8% |
| $150,000 to $199,999 | 2,911 | 6.9% |
| $200,000+ | 3,417 | 8.1% |
Family Income by Famaliy Size in Mobile
7+ person families (541 | 1.3%) account for the highest median family income in Mobile with $94,464 per family, while 2-person families (22,103 | 52.4%) have the highest median income of $29,436 per family member.
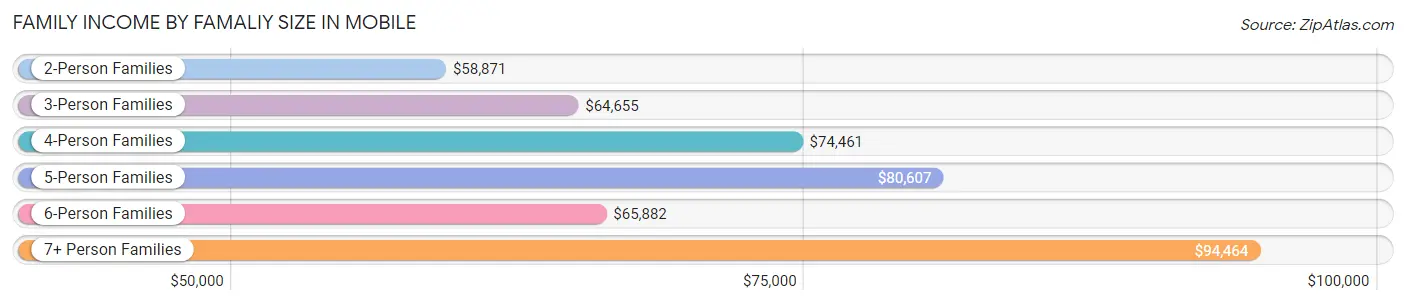
| Income Bracket | # Families | Median Income |
| 2-Person Families | 22,103 (52.4%) | $58,871 |
| 3-Person Families | 9,772 (23.2%) | $64,655 |
| 4-Person Families | 6,036 (14.3%) | $74,461 |
| 5-Person Families | 2,653 (6.3%) | $80,607 |
| 6-Person Families | 1,080 (2.6%) | $65,882 |
| 7+ Person Families | 541 (1.3%) | $94,464 |
| Total | 42,185 (100.0%) | $64,558 |
Family Income by Number of Earners in Mobile
The median family income in Mobile is $64,558, with families comprising 3+ earners (2,480) having the highest median family income of $115,227, while families with no earners (7,742) have the lowest median family income of $36,283, accounting for 5.9% and 18.3% of families, respectively.
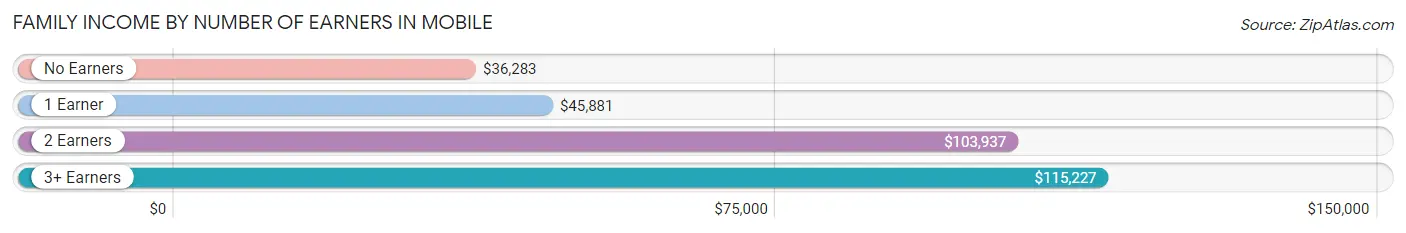
| Number of Earners | # Families | Median Income |
| No Earners | 7,742 (18.3%) | $36,283 |
| 1 Earner | 17,053 (40.4%) | $45,881 |
| 2 Earners | 14,910 (35.3%) | $103,937 |
| 3+ Earners | 2,480 (5.9%) | $115,227 |
| Total | 42,185 (100.0%) | $64,558 |
Household Income in Mobile
Household Income Brackets in Mobile
With 13,156 households falling in the category, the $50,000 to $74,999 income range is the most frequent in Mobile, accounting for 16.9% of all households. In contrast, only 3,659 households (4.7%) fall into the $150,000 to $199,999 income bracket, making it the least populous group.
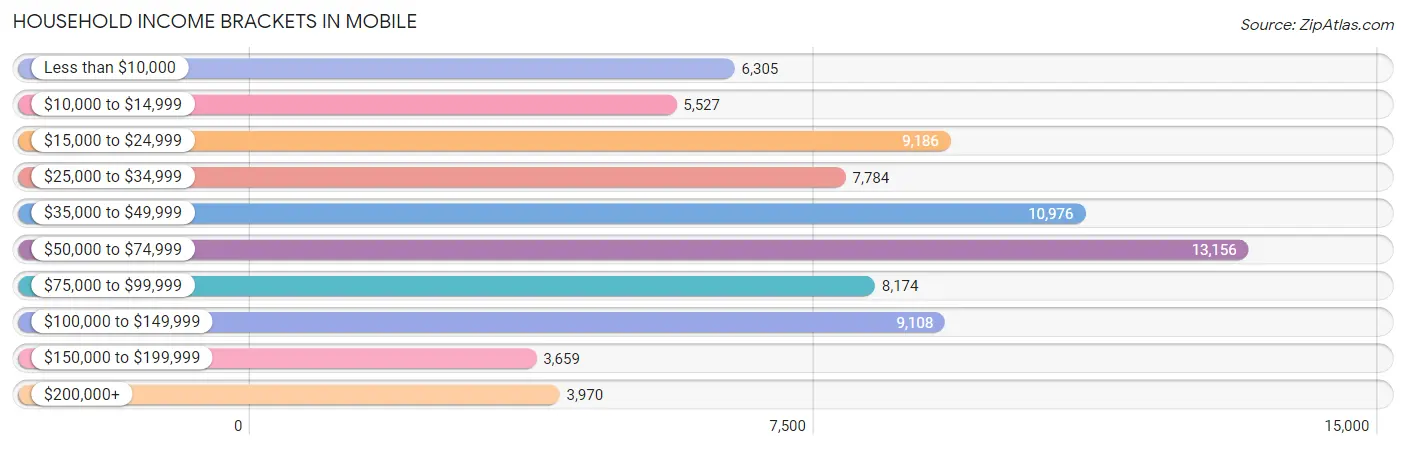
| Income Bracket | # Households | % Households |
| Less than $10,000 | 6,305 | 8.1% |
| $10,000 to $14,999 | 5,527 | 7.1% |
| $15,000 to $24,999 | 9,186 | 11.8% |
| $25,000 to $34,999 | 7,784 | 10.0% |
| $35,000 to $49,999 | 10,976 | 14.1% |
| $50,000 to $74,999 | 13,156 | 16.9% |
| $75,000 to $99,999 | 8,174 | 10.5% |
| $100,000 to $149,999 | 9,108 | 11.7% |
| $150,000 to $199,999 | 3,659 | 4.7% |
| $200,000+ | 3,970 | 5.1% |
Household Income by Householder Age in Mobile
The median household income in Mobile is $48,524, with the highest median household income of $58,466 found in the 45 to 64 years age bracket for the primary householder. A total of 26,354 households (33.9%) fall into this category. Meanwhile, the 15 to 24 years age bracket for the primary householder has the lowest median household income of $22,211, with 4,586 households (5.9%) in this group.
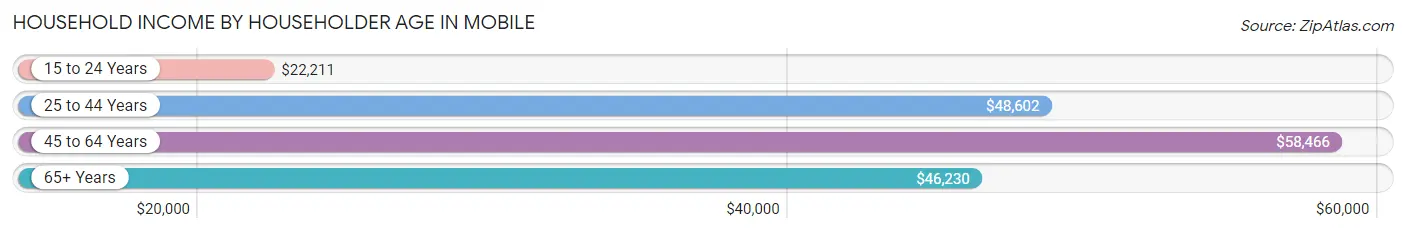
| Income Bracket | # Households | Median Income |
| 15 to 24 Years | 4,586 (5.9%) | $22,211 |
| 25 to 44 Years | 26,438 (34.0%) | $48,602 |
| 45 to 64 Years | 26,354 (33.9%) | $58,466 |
| 65+ Years | 20,466 (26.3%) | $46,230 |
| Total | 77,844 (100.0%) | $48,524 |
Poverty in Mobile
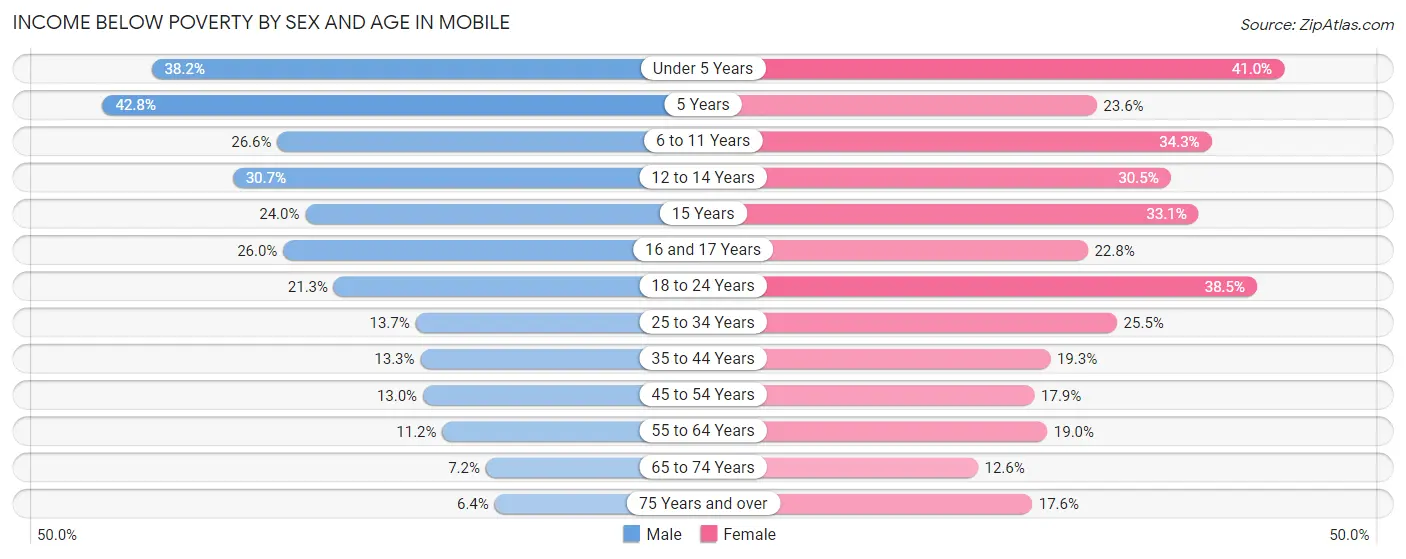
Income Below Poverty by Sex and Age in Mobile
With 17.1% poverty level for males and 23.8% for females among the residents of Mobile, 5 year old males and under 5 year old females are the most vulnerable to poverty, with 438 males (42.8%) and 2,083 females (41.0%) in their respective age groups living below the poverty level.
| Age Bracket | Male | Female |
| Under 5 Years | 2,035 (38.2%) | 2,083 (41.0%) |
| 5 Years | 438 (42.8%) | 186 (23.6%) |
| 6 to 11 Years | 1,790 (26.6%) | 2,441 (34.3%) |
| 12 to 14 Years | 1,199 (30.7%) | 884 (30.5%) |
| 15 Years | 280 (23.9%) | 399 (33.1%) |
| 16 and 17 Years | 512 (26.0%) | 537 (22.8%) |
| 18 to 24 Years | 1,799 (21.3%) | 3,296 (38.5%) |
| 25 to 34 Years | 1,685 (13.7%) | 3,732 (25.5%) |
| 35 to 44 Years | 1,340 (13.3%) | 2,254 (19.3%) |
| 45 to 54 Years | 1,345 (13.0%) | 1,902 (17.8%) |
| 55 to 64 Years | 1,197 (11.2%) | 2,550 (19.0%) |
| 65 to 74 Years | 591 (7.2%) | 1,244 (12.6%) |
| 75 Years and over | 295 (6.4%) | 1,365 (17.6%) |
| Total | 14,506 (17.1%) | 22,873 (23.8%) |
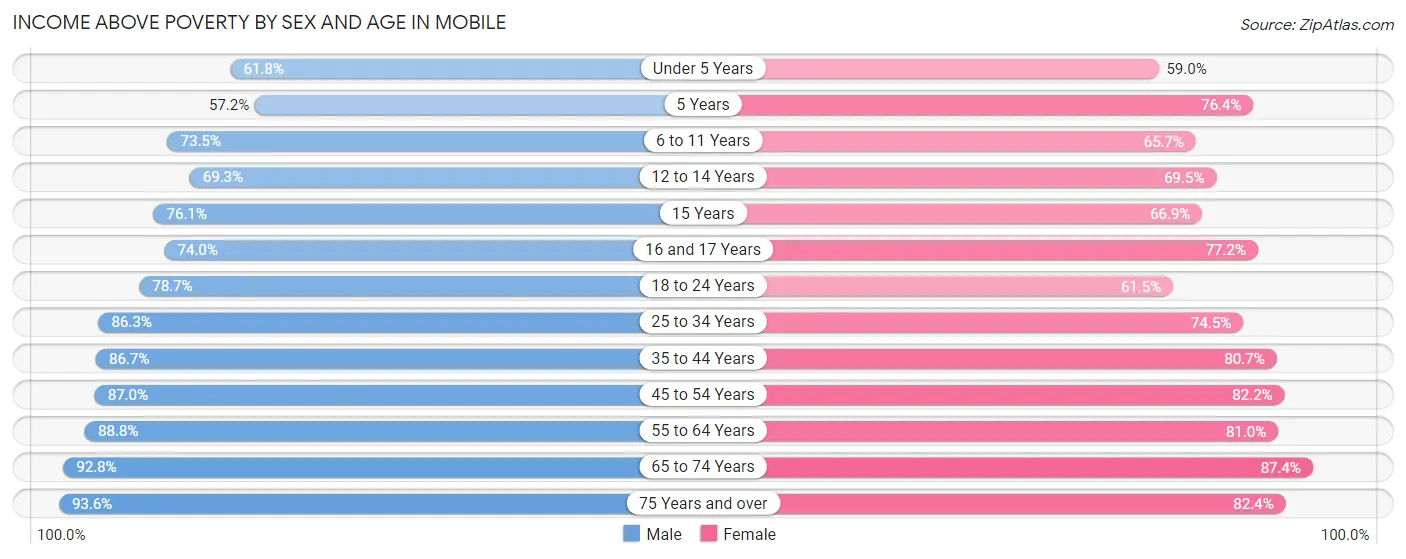
Income Above Poverty by Sex and Age in Mobile
According to the poverty statistics in Mobile, males aged 75 years and over and females aged 65 to 74 years are the age groups that are most secure financially, with 93.6% of males and 87.4% of females in these age groups living above the poverty line.
| Age Bracket | Male | Female |
| Under 5 Years | 3,289 (61.8%) | 2,994 (59.0%) |
| 5 Years | 586 (57.2%) | 601 (76.4%) |
| 6 to 11 Years | 4,951 (73.5%) | 4,675 (65.7%) |
| 12 to 14 Years | 2,709 (69.3%) | 2,014 (69.5%) |
| 15 Years | 889 (76.0%) | 806 (66.9%) |
| 16 and 17 Years | 1,457 (74.0%) | 1,818 (77.2%) |
| 18 to 24 Years | 6,647 (78.7%) | 5,263 (61.5%) |
| 25 to 34 Years | 10,593 (86.3%) | 10,898 (74.5%) |
| 35 to 44 Years | 8,760 (86.7%) | 9,411 (80.7%) |
| 45 to 54 Years | 8,980 (87.0%) | 8,752 (82.2%) |
| 55 to 64 Years | 9,462 (88.8%) | 10,848 (81.0%) |
| 65 to 74 Years | 7,612 (92.8%) | 8,630 (87.4%) |
| 75 Years and over | 4,327 (93.6%) | 6,376 (82.4%) |
| Total | 70,262 (82.9%) | 73,086 (76.2%) |
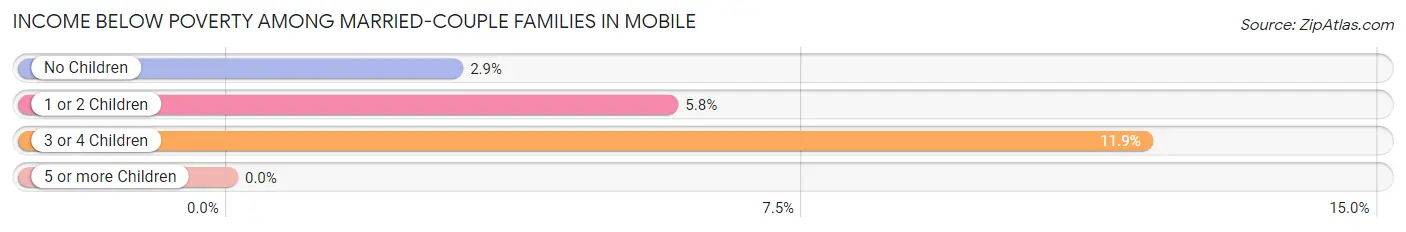
Income Below Poverty Among Married-Couple Families in Mobile
The poverty statistics for married-couple families in Mobile show that 4.3% or 1,069 of the total 25,148 families live below the poverty line. Families with 3 or 4 children have the highest poverty rate of 11.9%, comprising of 171 families. On the other hand, families with 5 or more children have the lowest poverty rate of 0.0%, which includes 0 families.
| Children | Above Poverty | Below Poverty |
| No Children | 15,670 (97.1%) | 475 (2.9%) |
| 1 or 2 Children | 6,931 (94.3%) | 423 (5.8%) |
| 3 or 4 Children | 1,261 (88.1%) | 171 (11.9%) |
| 5 or more Children | 217 (100.0%) | 0 (0.0%) |
| Total | 24,079 (95.8%) | 1,069 (4.3%) |
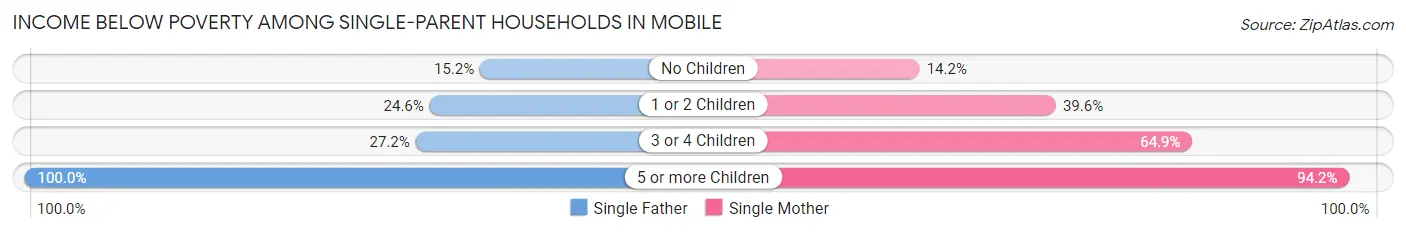
Income Below Poverty Among Single-Parent Households in Mobile
According to the poverty data in Mobile, 21.0% or 644 single-father households and 34.3% or 4,796 single-mother households are living below the poverty line. Among single-father households, those with 5 or more children have the highest poverty rate, with 45 households (100.0%) experiencing poverty. Likewise, among single-mother households, those with 5 or more children have the highest poverty rate, with 194 households (94.2%) falling below the poverty line.
| Children | Single Father | Single Mother |
| No Children | 233 (15.2%) | 710 (14.2%) |
| 1 or 2 Children | 338 (24.6%) | 2,798 (39.6%) |
| 3 or 4 Children | 28 (27.2%) | 1,094 (64.9%) |
| 5 or more Children | 45 (100.0%) | 194 (94.2%) |
| Total | 644 (21.0%) | 4,796 (34.3%) |
Income Below Poverty Among Married-Couple vs Single-Parent Households in Mobile
The poverty data for Mobile shows that 1,069 of the married-couple family households (4.3%) and 5,440 of the single-parent households (31.9%) are living below the poverty level. Within the married-couple family households, those with 3 or 4 children have the highest poverty rate, with 171 households (11.9%) falling below the poverty line. Among the single-parent households, those with 5 or more children have the highest poverty rate, with 239 household (95.2%) living below poverty.
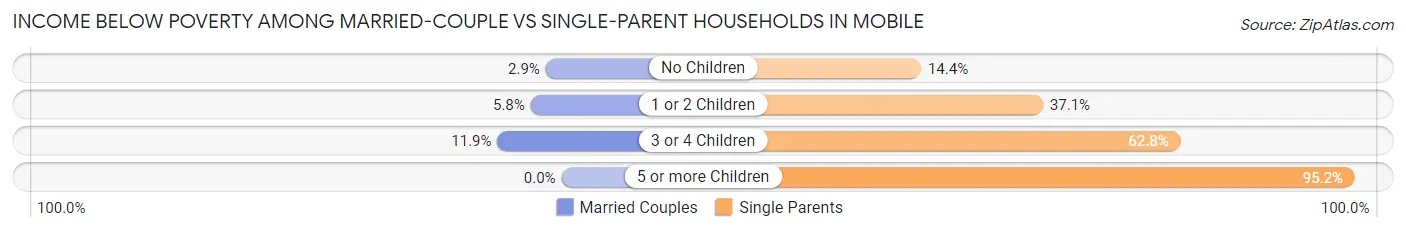
| Children | Married-Couple Families | Single-Parent Households |
| No Children | 475 (2.9%) | 943 (14.4%) |
| 1 or 2 Children | 423 (5.8%) | 3,136 (37.1%) |
| 3 or 4 Children | 171 (11.9%) | 1,122 (62.7%) |
| 5 or more Children | 0 (0.0%) | 239 (95.2%) |
| Total | 1,069 (4.3%) | 5,440 (31.9%) |
Employment Characteristics in Mobile
Employment by Class of Employer in Mobile
Among the 80,634 employed individuals in Mobile, private company employees (54,576 | 67.7%), not-for-profit organizations (6,684 | 8.3%), and local government employees (5,127 | 6.4%) make up the most common classes of employment.
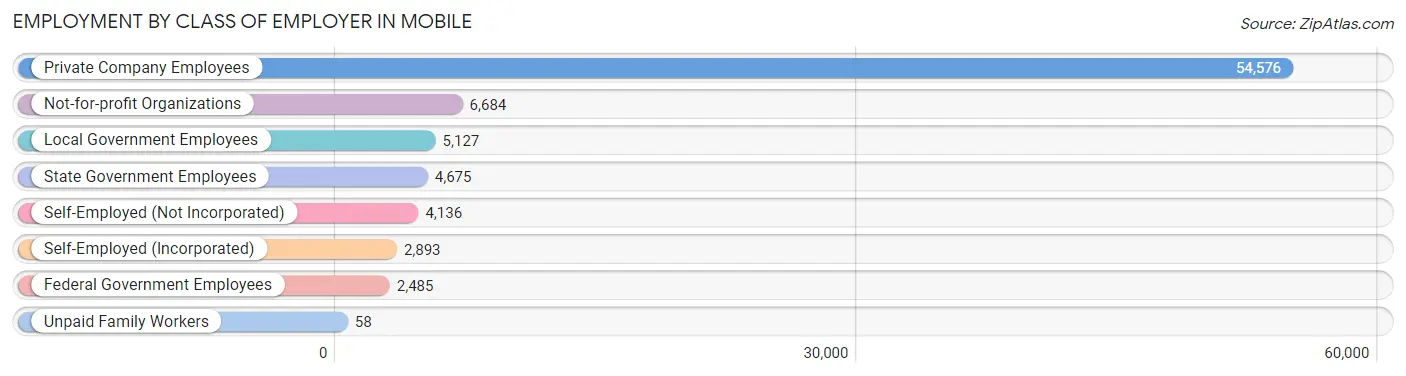
| Employer Class | # Employees | % Employees |
| Private Company Employees | 54,576 | 67.7% |
| Self-Employed (Incorporated) | 2,893 | 3.6% |
| Self-Employed (Not Incorporated) | 4,136 | 5.1% |
| Not-for-profit Organizations | 6,684 | 8.3% |
| Local Government Employees | 5,127 | 6.4% |
| State Government Employees | 4,675 | 5.8% |
| Federal Government Employees | 2,485 | 3.1% |
| Unpaid Family Workers | 58 | 0.1% |
| Total | 80,634 | 100.0% |
Employment Status by Age in Mobile
According to the labor force statistics for Mobile, out of the total population over 16 years of age (150,595), 58.1% or 87,496 individuals are in the labor force, with 6.5% or 5,687 of them unemployed. The age group with the highest labor force participation rate is 30 to 34 years, with 82.4% or 11,017 individuals in the labor force. Within the labor force, the 16 to 19 years age range has the highest percentage of unemployed individuals, with 15.7% or 425 of them being unemployed.
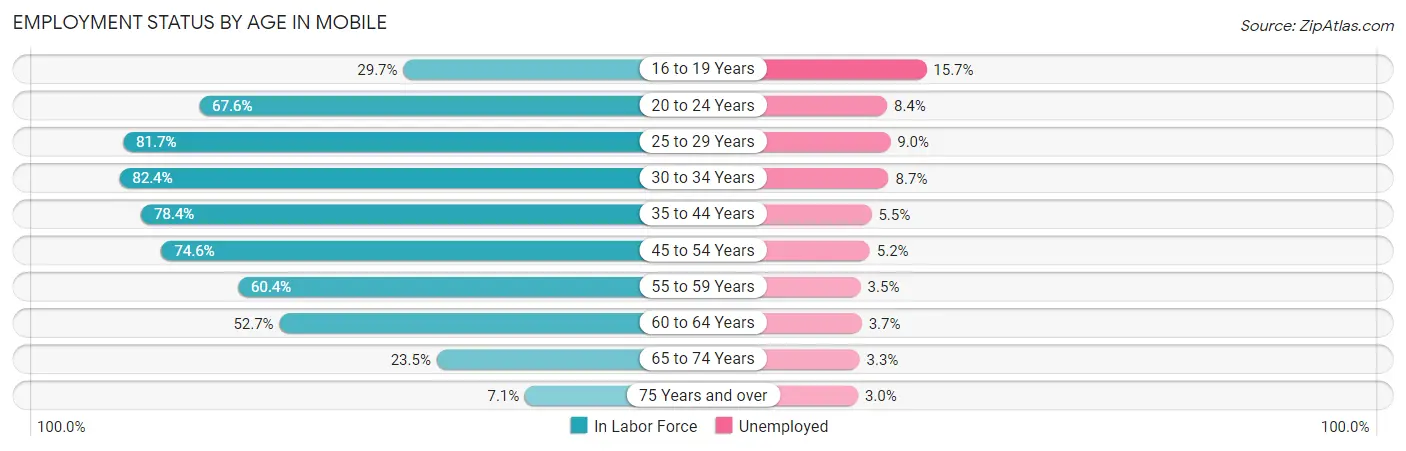
| Age Bracket | In Labor Force | Unemployed |
| 16 to 19 Years | 2,710 (29.7%) | 425 (15.7%) |
| 20 to 24 Years | 9,939 (67.6%) | 835 (8.4%) |
| 25 to 29 Years | 11,521 (81.7%) | 1,037 (9.0%) |
| 30 to 34 Years | 11,017 (82.4%) | 958 (8.7%) |
| 35 to 44 Years | 17,333 (78.4%) | 953 (5.5%) |
| 45 to 54 Years | 15,807 (74.6%) | 822 (5.2%) |
| 55 to 59 Years | 7,422 (60.4%) | 260 (3.5%) |
| 60 to 64 Years | 6,427 (52.7%) | 238 (3.7%) |
| 65 to 74 Years | 4,313 (23.5%) | 142 (3.3%) |
| 75 Years and over | 934 (7.1%) | 28 (3.0%) |
| Total | 87,496 (58.1%) | 5,687 (6.5%) |
Employment Status by Educational Attainment in Mobile
According to labor force statistics for Mobile, 73.0% of individuals (69,534) out of the total population between 25 and 64 years of age (95,252) are in the labor force, with 6.1% or 4,242 of them being unemployed. The group with the highest labor force participation rate are those with the educational attainment of bachelor's degree or higher, with 86.6% or 24,950 individuals in the labor force. Within the labor force, individuals with less than high school education have the highest percentage of unemployment, with 19.4% or 980 of them being unemployed.
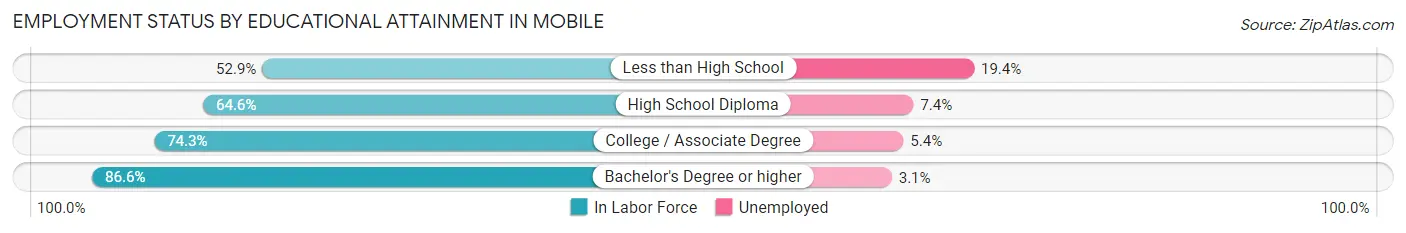
| Educational Attainment | In Labor Force | Unemployed |
| Less than High School | 5,052 (52.9%) | 1,853 (19.4%) |
| High School Diploma | 18,417 (64.6%) | 2,110 (7.4%) |
| College / Associate Degree | 21,087 (74.3%) | 1,533 (5.4%) |
| Bachelor's Degree or higher | 24,950 (86.6%) | 893 (3.1%) |
| Total | 69,534 (73.0%) | 5,810 (6.1%) |
Employment Occupations by Sex in Mobile
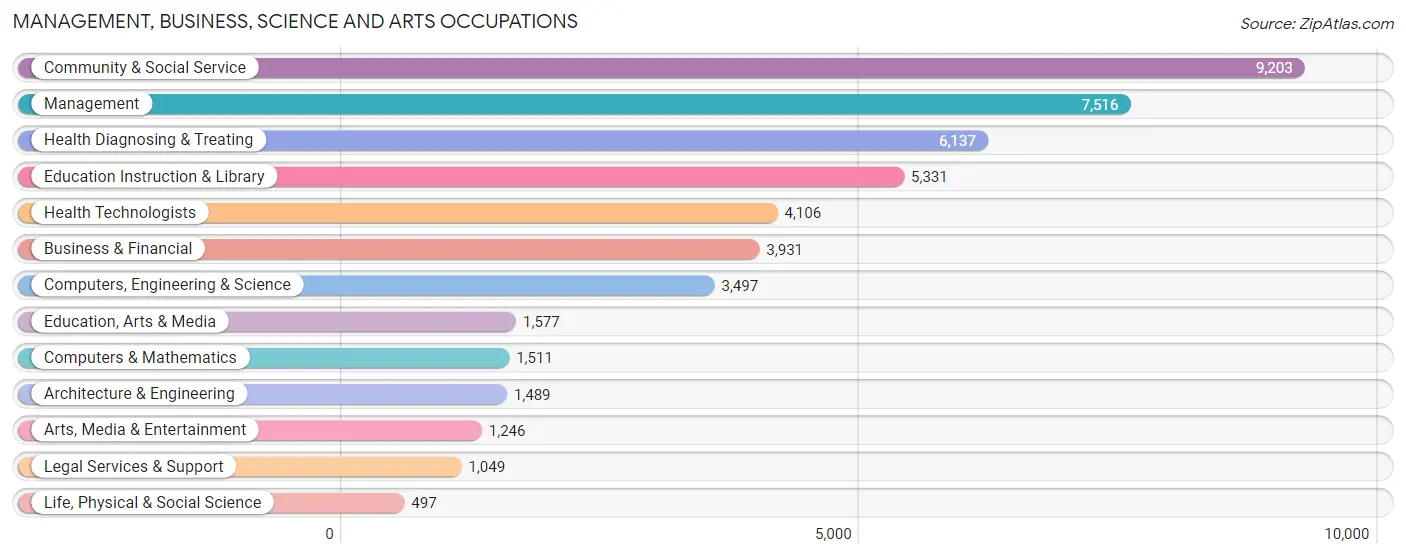
Management, Business, Science and Arts Occupations
The most common Management, Business, Science and Arts occupations in Mobile are Community & Social Service (9,203 | 11.3%), Management (7,516 | 9.2%), Health Diagnosing & Treating (6,137 | 7.5%), Education Instruction & Library (5,331 | 6.5%), and Health Technologists (4,106 | 5.0%).
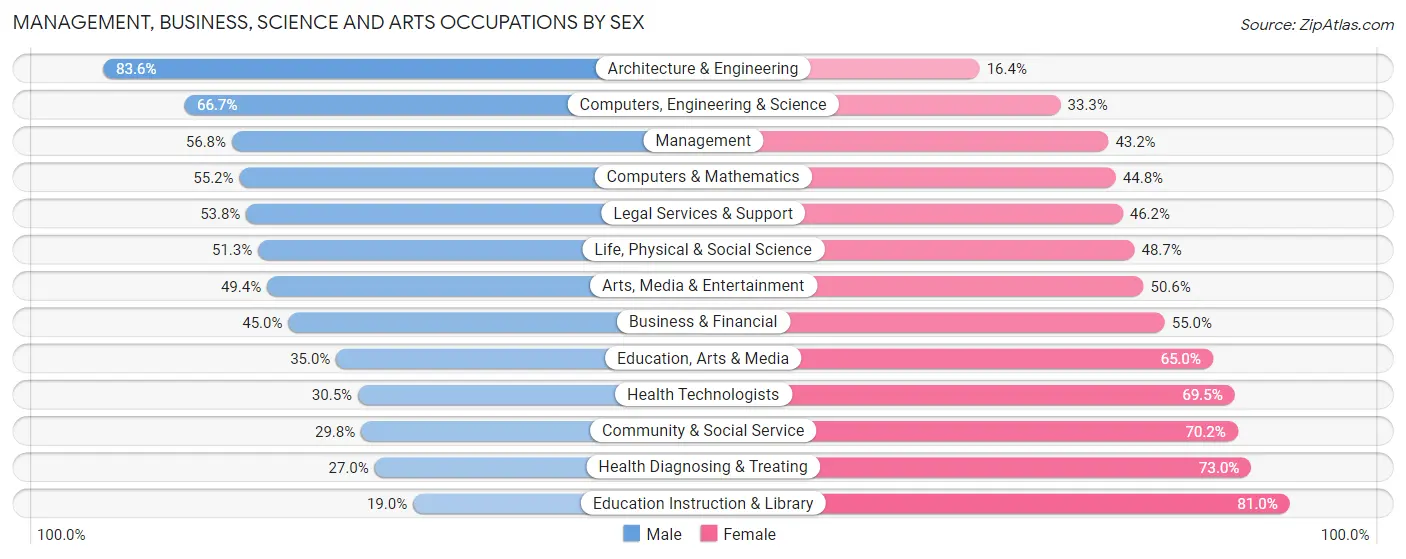
Management, Business, Science and Arts Occupations by Sex
Within the Management, Business, Science and Arts occupations in Mobile, the most male-oriented occupations are Architecture & Engineering (83.6%), Computers, Engineering & Science (66.7%), and Management (56.8%), while the most female-oriented occupations are Education Instruction & Library (81.0%), Health Diagnosing & Treating (73.0%), and Community & Social Service (70.2%).
| Occupation | Male | Female |
| Management | 4,266 (56.8%) | 3,250 (43.2%) |
| Business & Financial | 1,769 (45.0%) | 2,162 (55.0%) |
| Computers, Engineering & Science | 2,334 (66.7%) | 1,163 (33.3%) |
| Computers & Mathematics | 834 (55.2%) | 677 (44.8%) |
| Architecture & Engineering | 1,245 (83.6%) | 244 (16.4%) |
| Life, Physical & Social Science | 255 (51.3%) | 242 (48.7%) |
| Community & Social Service | 2,744 (29.8%) | 6,459 (70.2%) |
| Education, Arts & Media | 552 (35.0%) | 1,025 (65.0%) |
| Legal Services & Support | 564 (53.8%) | 485 (46.2%) |
| Education Instruction & Library | 1,012 (19.0%) | 4,319 (81.0%) |
| Arts, Media & Entertainment | 616 (49.4%) | 630 (50.6%) |
| Health Diagnosing & Treating | 1,657 (27.0%) | 4,480 (73.0%) |
| Health Technologists | 1,251 (30.5%) | 2,855 (69.5%) |
| Total (Category) | 12,770 (42.2%) | 17,514 (57.8%) |
| Total (Overall) | 40,510 (49.7%) | 40,979 (50.3%) |
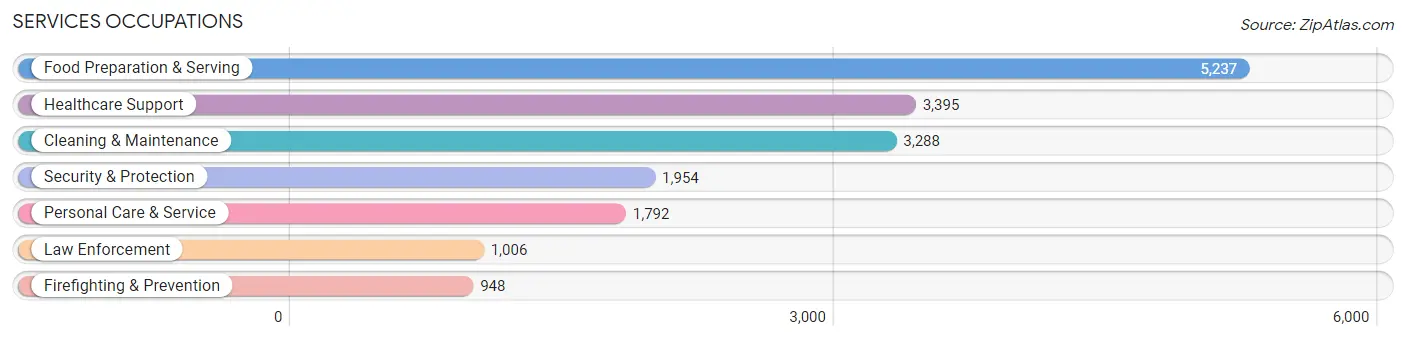
Services Occupations
The most common Services occupations in Mobile are Food Preparation & Serving (5,237 | 6.4%), Healthcare Support (3,395 | 4.2%), Cleaning & Maintenance (3,288 | 4.0%), Security & Protection (1,954 | 2.4%), and Personal Care & Service (1,792 | 2.2%).
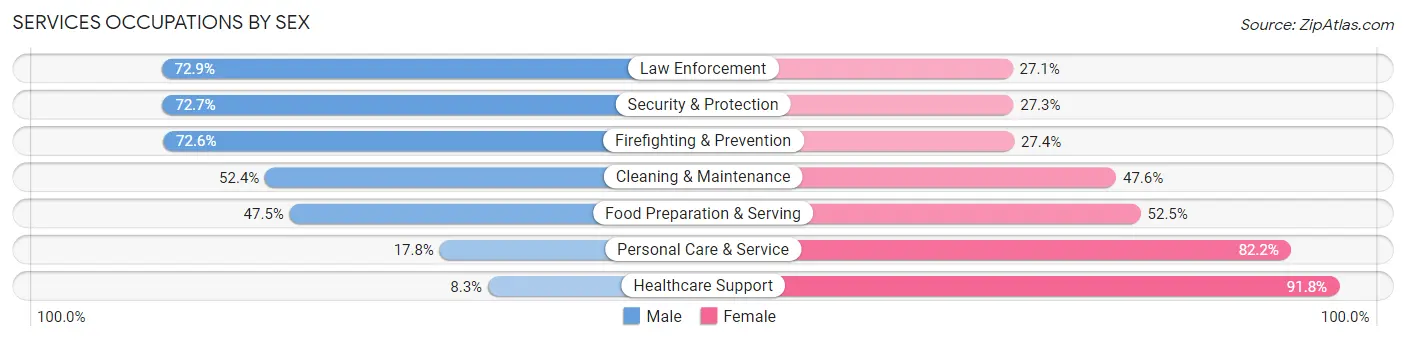
Services Occupations by Sex
Within the Services occupations in Mobile, the most male-oriented occupations are Law Enforcement (72.9%), Security & Protection (72.7%), and Firefighting & Prevention (72.6%), while the most female-oriented occupations are Healthcare Support (91.7%), Personal Care & Service (82.2%), and Food Preparation & Serving (52.5%).
| Occupation | Male | Female |
| Healthcare Support | 280 (8.3%) | 3,115 (91.7%) |
| Security & Protection | 1,421 (72.7%) | 533 (27.3%) |
| Firefighting & Prevention | 688 (72.6%) | 260 (27.4%) |
| Law Enforcement | 733 (72.9%) | 273 (27.1%) |
| Food Preparation & Serving | 2,488 (47.5%) | 2,749 (52.5%) |
| Cleaning & Maintenance | 1,722 (52.4%) | 1,566 (47.6%) |
| Personal Care & Service | 319 (17.8%) | 1,473 (82.2%) |
| Total (Category) | 6,230 (39.8%) | 9,436 (60.2%) |
| Total (Overall) | 40,510 (49.7%) | 40,979 (50.3%) |
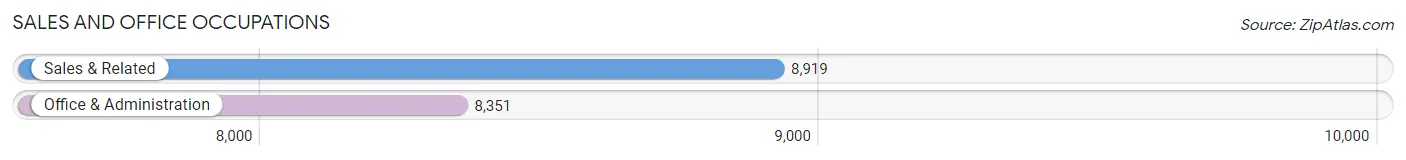
Sales and Office Occupations
The most common Sales and Office occupations in Mobile are Sales & Related (8,919 | 11.0%), and Office & Administration (8,351 | 10.2%).
Sales and Office Occupations by Sex
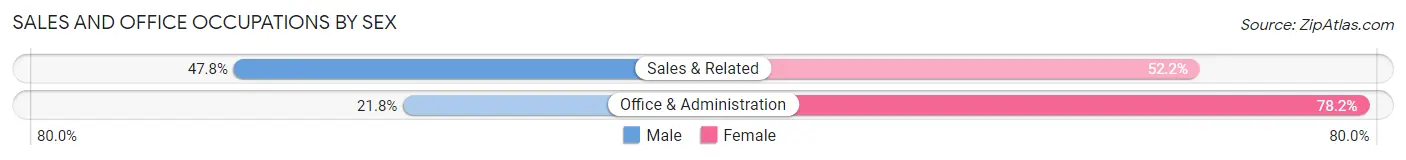
| Occupation | Male | Female |
| Sales & Related | 4,264 (47.8%) | 4,655 (52.2%) |
| Office & Administration | 1,817 (21.8%) | 6,534 (78.2%) |
| Total (Category) | 6,081 (35.2%) | 11,189 (64.8%) |
| Total (Overall) | 40,510 (49.7%) | 40,979 (50.3%) |
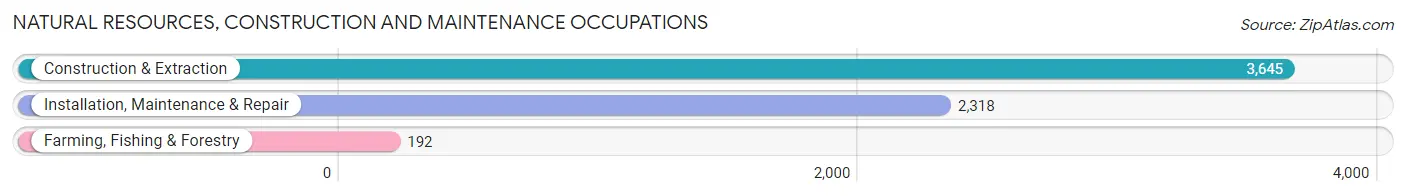
Natural Resources, Construction and Maintenance Occupations
The most common Natural Resources, Construction and Maintenance occupations in Mobile are Construction & Extraction (3,645 | 4.5%), Installation, Maintenance & Repair (2,318 | 2.8%), and Farming, Fishing & Forestry (192 | 0.2%).
Natural Resources, Construction and Maintenance Occupations by Sex
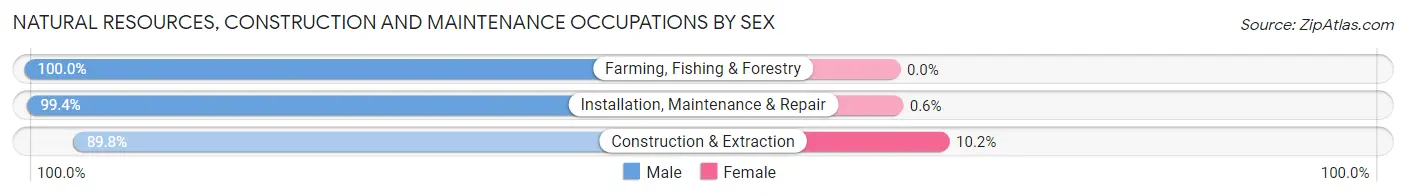
| Occupation | Male | Female |
| Farming, Fishing & Forestry | 192 (100.0%) | 0 (0.0%) |
| Construction & Extraction | 3,272 (89.8%) | 373 (10.2%) |
| Installation, Maintenance & Repair | 2,304 (99.4%) | 14 (0.6%) |
| Total (Category) | 5,768 (93.7%) | 387 (6.3%) |
| Total (Overall) | 40,510 (49.7%) | 40,979 (50.3%) |
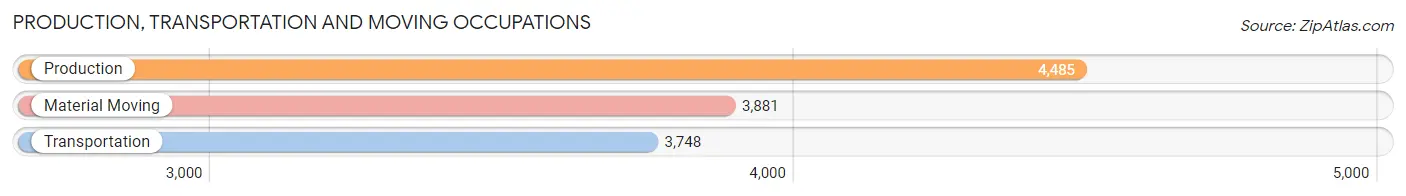
Production, Transportation and Moving Occupations
The most common Production, Transportation and Moving occupations in Mobile are Production (4,485 | 5.5%), Material Moving (3,881 | 4.8%), and Transportation (3,748 | 4.6%).
Production, Transportation and Moving Occupations by Sex
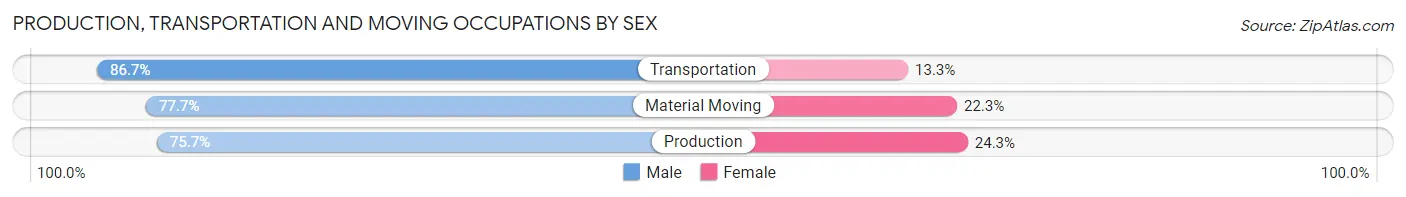
| Occupation | Male | Female |
| Production | 3,396 (75.7%) | 1,089 (24.3%) |
| Transportation | 3,249 (86.7%) | 499 (13.3%) |
| Material Moving | 3,016 (77.7%) | 865 (22.3%) |
| Total (Category) | 9,661 (79.7%) | 2,453 (20.3%) |
| Total (Overall) | 40,510 (49.7%) | 40,979 (50.3%) |
Employment Industries by Sex in Mobile
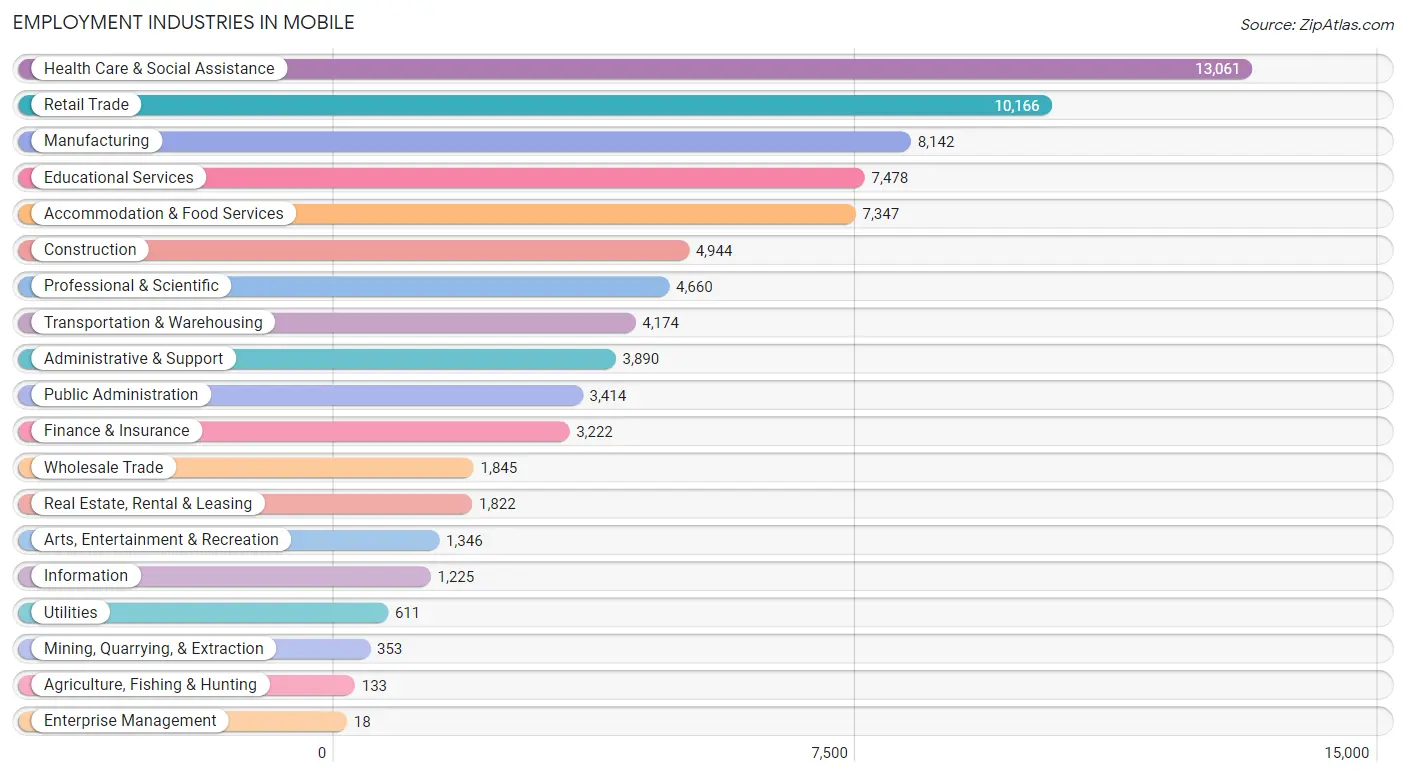
Employment Industries in Mobile
The major employment industries in Mobile include Health Care & Social Assistance (13,061 | 16.0%), Retail Trade (10,166 | 12.5%), Manufacturing (8,142 | 10.0%), Educational Services (7,478 | 9.2%), and Accommodation & Food Services (7,347 | 9.0%).
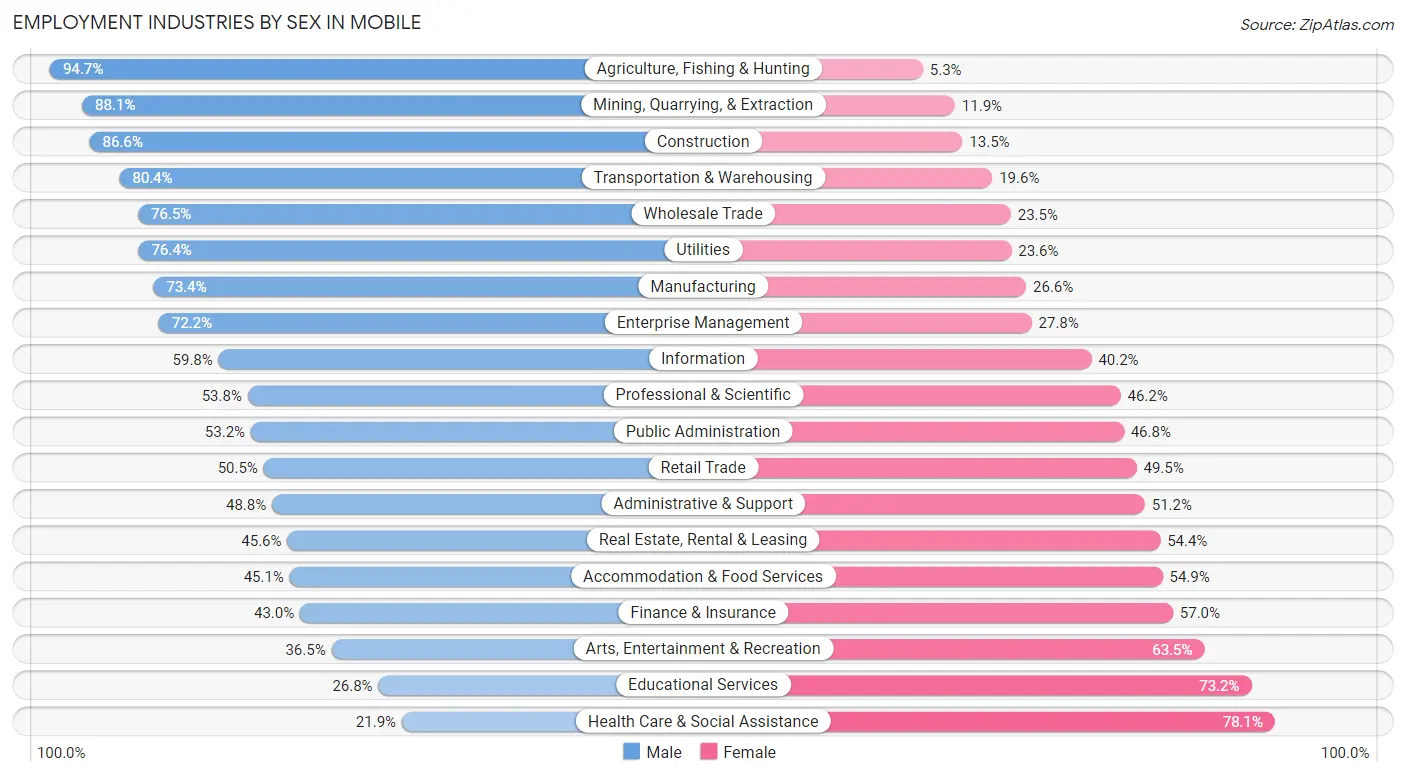
Employment Industries by Sex in Mobile
The Mobile industries that see more men than women are Agriculture, Fishing & Hunting (94.7%), Mining, Quarrying, & Extraction (88.1%), and Construction (86.6%), whereas the industries that tend to have a higher number of women are Health Care & Social Assistance (78.1%), Educational Services (73.2%), and Arts, Entertainment & Recreation (63.5%).
| Industry | Male | Female |
| Agriculture, Fishing & Hunting | 126 (94.7%) | 7 (5.3%) |
| Mining, Quarrying, & Extraction | 311 (88.1%) | 42 (11.9%) |
| Construction | 4,279 (86.6%) | 665 (13.5%) |
| Manufacturing | 5,973 (73.4%) | 2,169 (26.6%) |
| Wholesale Trade | 1,412 (76.5%) | 433 (23.5%) |
| Retail Trade | 5,135 (50.5%) | 5,031 (49.5%) |
| Transportation & Warehousing | 3,355 (80.4%) | 819 (19.6%) |
| Utilities | 467 (76.4%) | 144 (23.6%) |
| Information | 733 (59.8%) | 492 (40.2%) |
| Finance & Insurance | 1,385 (43.0%) | 1,837 (57.0%) |
| Real Estate, Rental & Leasing | 831 (45.6%) | 991 (54.4%) |
| Professional & Scientific | 2,508 (53.8%) | 2,152 (46.2%) |
| Enterprise Management | 13 (72.2%) | 5 (27.8%) |
| Administrative & Support | 1,898 (48.8%) | 1,992 (51.2%) |
| Educational Services | 2,001 (26.8%) | 5,477 (73.2%) |
| Health Care & Social Assistance | 2,861 (21.9%) | 10,200 (78.1%) |
| Arts, Entertainment & Recreation | 491 (36.5%) | 855 (63.5%) |
| Accommodation & Food Services | 3,316 (45.1%) | 4,031 (54.9%) |
| Public Administration | 1,815 (53.2%) | 1,599 (46.8%) |
| Total | 40,510 (49.7%) | 40,979 (50.3%) |
Education in Mobile
School Enrollment in Mobile
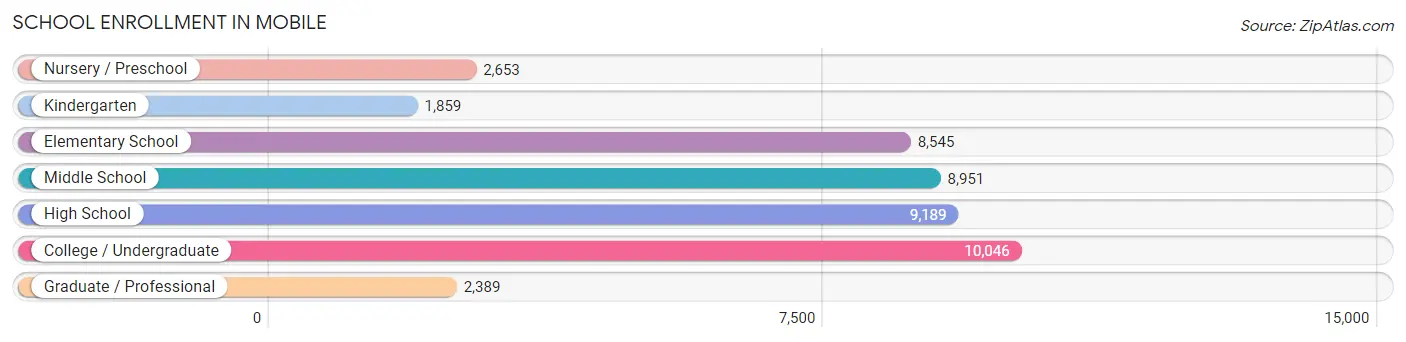
The most common levels of schooling among the 43,632 students in Mobile are college / undergraduate (10,046 | 23.0%), high school (9,189 | 21.1%), and middle school (8,951 | 20.5%).
| School Level | # Students | % Students |
| Nursery / Preschool | 2,653 | 6.1% |
| Kindergarten | 1,859 | 4.3% |
| Elementary School | 8,545 | 19.6% |
| Middle School | 8,951 | 20.5% |
| High School | 9,189 | 21.1% |
| College / Undergraduate | 10,046 | 23.0% |
| Graduate / Professional | 2,389 | 5.5% |
| Total | 43,632 | 100.0% |
School Enrollment by Age by Funding Source in Mobile
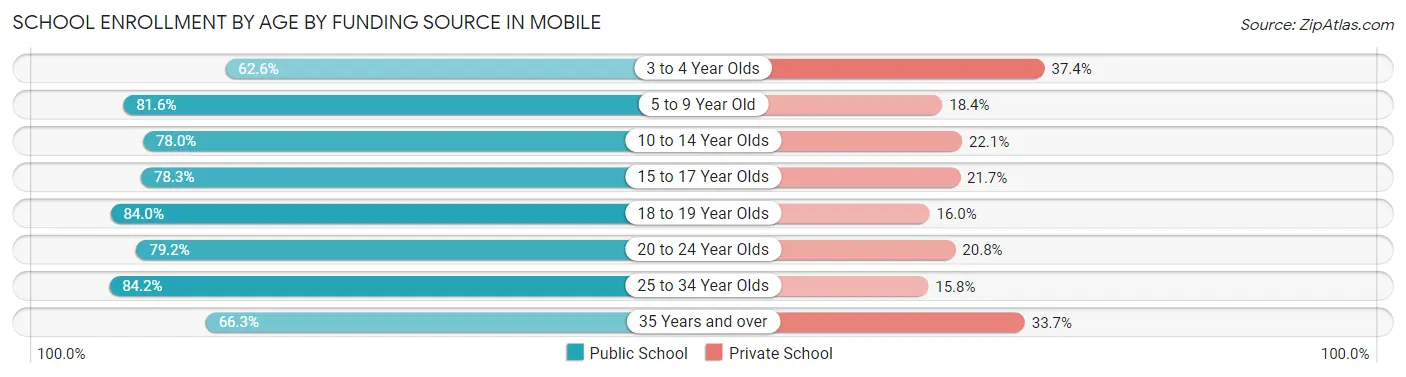
Out of a total of 43,632 students who are enrolled in schools in Mobile, 9,294 (21.3%) attend a private institution, while the remaining 34,338 (78.7%) are enrolled in public schools. The age group of 3 to 4 year olds has the highest likelihood of being enrolled in private schools, with 734 (37.4% in the age bracket) enrolled. Conversely, the age group of 25 to 34 year olds has the lowest likelihood of being enrolled in a private school, with 2,176 (84.2% in the age bracket) attending a public institution.
| Age Bracket | Public School | Private School |
| 3 to 4 Year Olds | 1,228 (62.6%) | 734 (37.4%) |
| 5 to 9 Year Old | 8,168 (81.6%) | 1,838 (18.4%) |
| 10 to 14 Year Olds | 8,812 (77.9%) | 2,492 (22.1%) |
| 15 to 17 Year Olds | 4,957 (78.3%) | 1,373 (21.7%) |
| 18 to 19 Year Olds | 3,081 (84.0%) | 587 (16.0%) |
| 20 to 24 Year Olds | 4,726 (79.2%) | 1,242 (20.8%) |
| 25 to 34 Year Olds | 2,176 (84.2%) | 407 (15.8%) |
| 35 Years and over | 1,200 (66.3%) | 611 (33.7%) |
| Total | 34,338 (78.7%) | 9,294 (21.3%) |
Educational Attainment by Field of Study in Mobile
Business (8,946 | 22.0%), education (6,302 | 15.5%), science & technology (4,367 | 10.7%), arts & humanities (3,127 | 7.7%), and engineering (2,888 | 7.1%) are the most common fields of study among 40,651 individuals in Mobile who have obtained a bachelor's degree or higher.
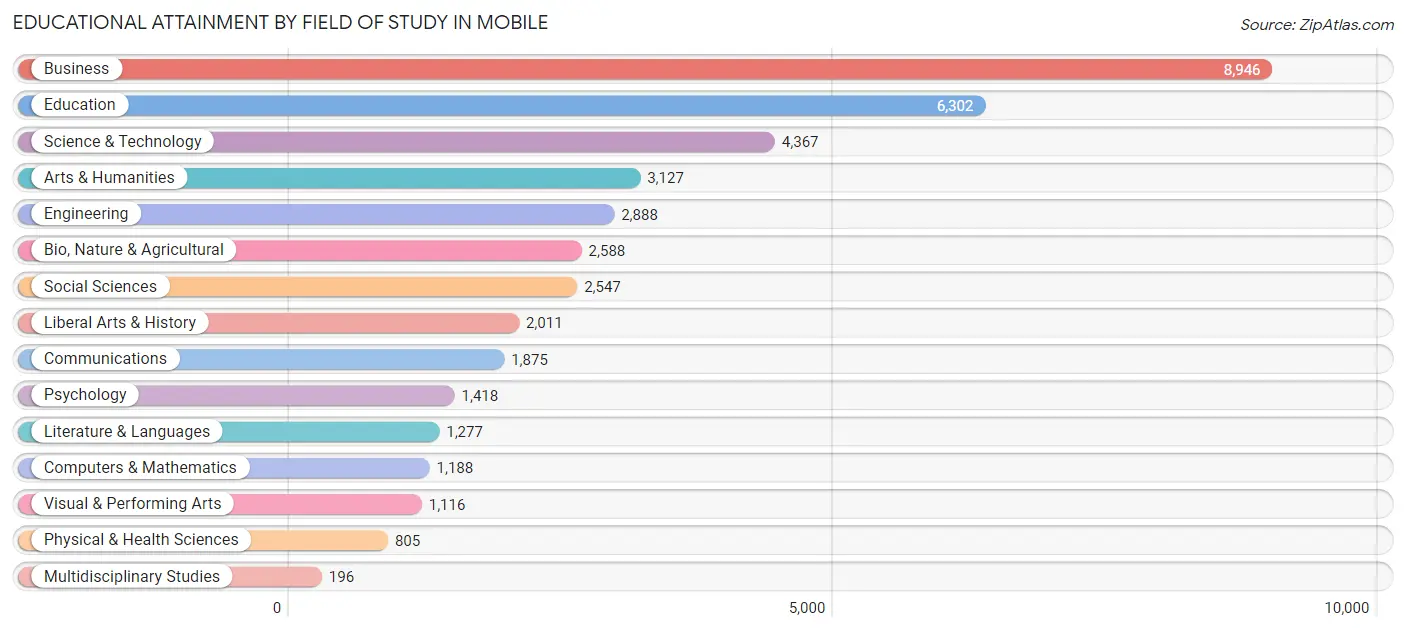
| Field of Study | # Graduates | % Graduates |
| Computers & Mathematics | 1,188 | 2.9% |
| Bio, Nature & Agricultural | 2,588 | 6.4% |
| Physical & Health Sciences | 805 | 2.0% |
| Psychology | 1,418 | 3.5% |
| Social Sciences | 2,547 | 6.3% |
| Engineering | 2,888 | 7.1% |
| Multidisciplinary Studies | 196 | 0.5% |
| Science & Technology | 4,367 | 10.7% |
| Business | 8,946 | 22.0% |
| Education | 6,302 | 15.5% |
| Literature & Languages | 1,277 | 3.1% |
| Liberal Arts & History | 2,011 | 5.0% |
| Visual & Performing Arts | 1,116 | 2.8% |
| Communications | 1,875 | 4.6% |
| Arts & Humanities | 3,127 | 7.7% |
| Total | 40,651 | 100.0% |
Transportation & Commute in Mobile
Vehicle Availability by Sex in Mobile
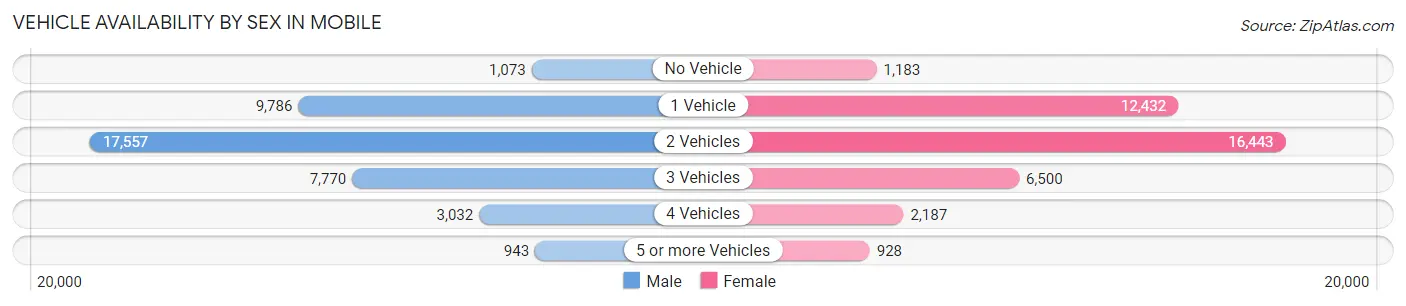
The most prevalent vehicle ownership categories in Mobile are males with 2 vehicles (17,557, accounting for 43.7%) and females with 2 vehicles (16,443, making up 44.3%).
| Vehicles Available | Male | Female |
| No Vehicle | 1,073 (2.7%) | 1,183 (3.0%) |
| 1 Vehicle | 9,786 (24.4%) | 12,432 (31.3%) |
| 2 Vehicles | 17,557 (43.7%) | 16,443 (41.4%) |
| 3 Vehicles | 7,770 (19.4%) | 6,500 (16.4%) |
| 4 Vehicles | 3,032 (7.5%) | 2,187 (5.5%) |
| 5 or more Vehicles | 943 (2.4%) | 928 (2.3%) |
| Total | 40,161 (100.0%) | 39,673 (100.0%) |
Commute Time in Mobile
The most frequently occuring commute durations in Mobile are 15 to 19 minutes (17,019 commuters, 22.6%), 20 to 24 minutes (14,914 commuters, 19.8%), and 30 to 34 minutes (10,520 commuters, 14.0%).
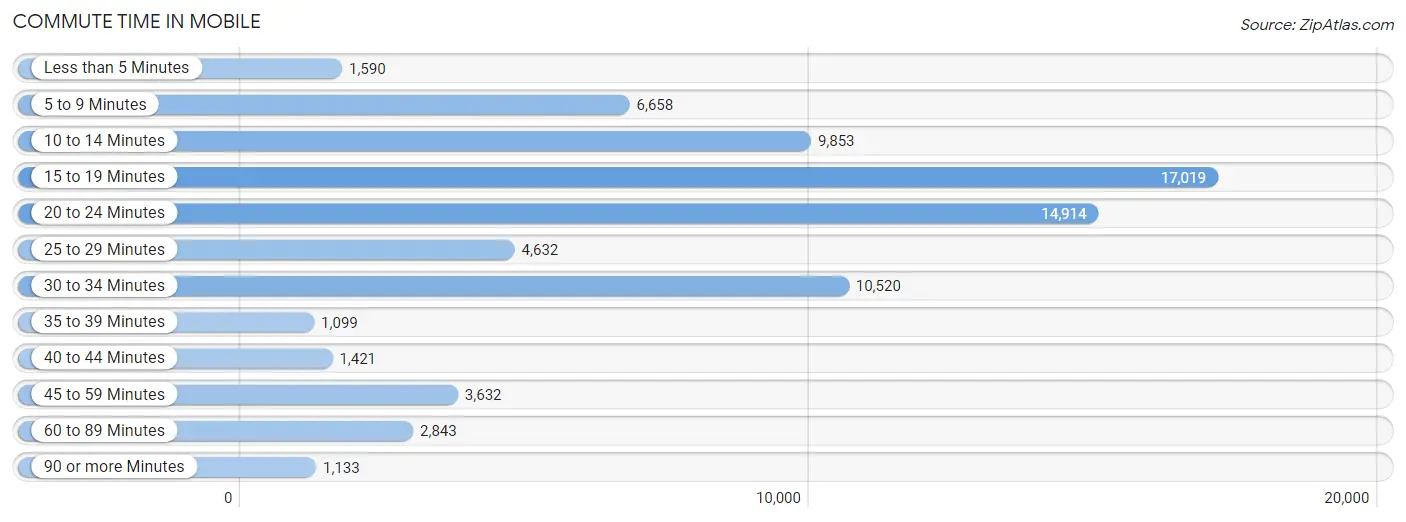
| Commute Time | # Commuters | % Commuters |
| Less than 5 Minutes | 1,590 | 2.1% |
| 5 to 9 Minutes | 6,658 | 8.8% |
| 10 to 14 Minutes | 9,853 | 13.1% |
| 15 to 19 Minutes | 17,019 | 22.6% |
| 20 to 24 Minutes | 14,914 | 19.8% |
| 25 to 29 Minutes | 4,632 | 6.1% |
| 30 to 34 Minutes | 10,520 | 14.0% |
| 35 to 39 Minutes | 1,099 | 1.5% |
| 40 to 44 Minutes | 1,421 | 1.9% |
| 45 to 59 Minutes | 3,632 | 4.8% |
| 60 to 89 Minutes | 2,843 | 3.8% |
| 90 or more Minutes | 1,133 | 1.5% |
Commute Time by Sex in Mobile
The most common commute times in Mobile are 15 to 19 minutes (8,832 commuters, 23.1%) for males and 15 to 19 minutes (8,187 commuters, 22.1%) for females.

| Commute Time | Male | Female |
| Less than 5 Minutes | 805 (2.1%) | 785 (2.1%) |
| 5 to 9 Minutes | 2,943 (7.7%) | 3,715 (10.0%) |
| 10 to 14 Minutes | 3,919 (10.3%) | 5,934 (16.0%) |
| 15 to 19 Minutes | 8,832 (23.1%) | 8,187 (22.1%) |
| 20 to 24 Minutes | 7,425 (19.5%) | 7,489 (20.2%) |
| 25 to 29 Minutes | 2,438 (6.4%) | 2,194 (5.9%) |
| 30 to 34 Minutes | 5,823 (15.2%) | 4,697 (12.7%) |
| 35 to 39 Minutes | 510 (1.3%) | 589 (1.6%) |
| 40 to 44 Minutes | 730 (1.9%) | 691 (1.9%) |
| 45 to 59 Minutes | 2,166 (5.7%) | 1,466 (4.0%) |
| 60 to 89 Minutes | 1,874 (4.9%) | 969 (2.6%) |
| 90 or more Minutes | 712 (1.9%) | 421 (1.1%) |
Time of Departure to Work by Sex in Mobile
The most frequent times of departure to work in Mobile are 7:00 AM to 7:29 AM (5,021, 13.2%) for males and 7:00 AM to 7:29 AM (5,724, 15.4%) for females.
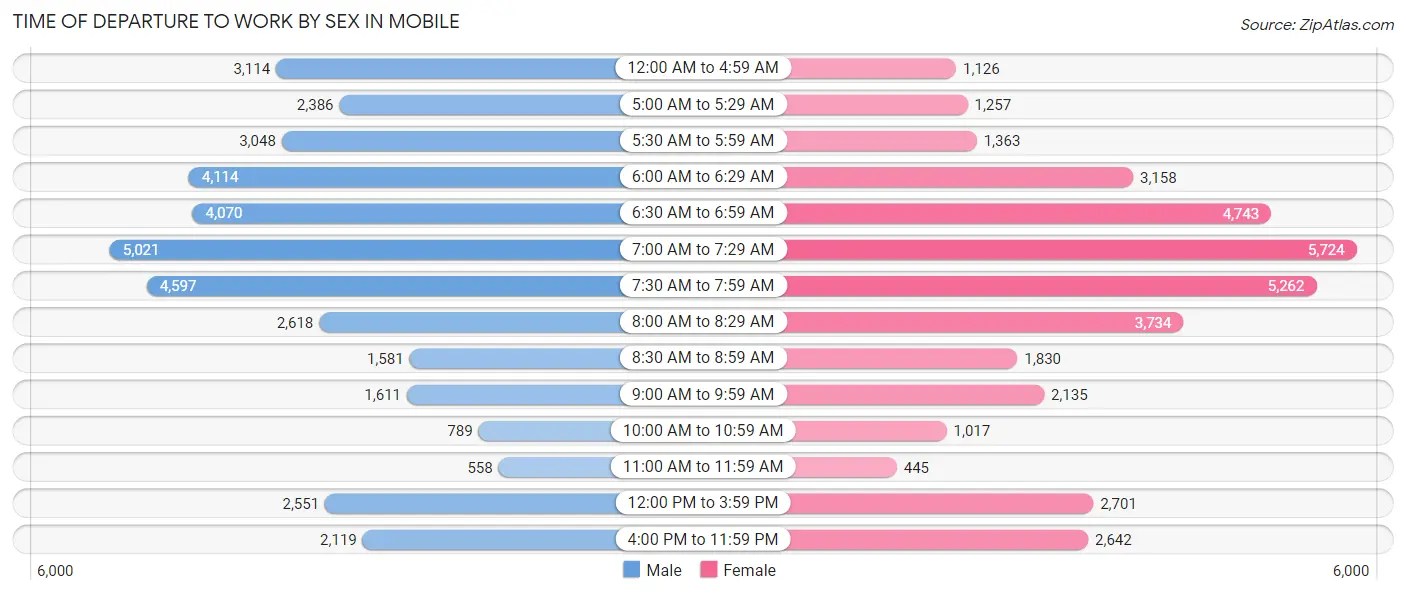
| Time of Departure | Male | Female |
| 12:00 AM to 4:59 AM | 3,114 (8.2%) | 1,126 (3.0%) |
| 5:00 AM to 5:29 AM | 2,386 (6.2%) | 1,257 (3.4%) |
| 5:30 AM to 5:59 AM | 3,048 (8.0%) | 1,363 (3.7%) |
| 6:00 AM to 6:29 AM | 4,114 (10.8%) | 3,158 (8.5%) |
| 6:30 AM to 6:59 AM | 4,070 (10.7%) | 4,743 (12.8%) |
| 7:00 AM to 7:29 AM | 5,021 (13.2%) | 5,724 (15.4%) |
| 7:30 AM to 7:59 AM | 4,597 (12.0%) | 5,262 (14.2%) |
| 8:00 AM to 8:29 AM | 2,618 (6.9%) | 3,734 (10.1%) |
| 8:30 AM to 8:59 AM | 1,581 (4.1%) | 1,830 (4.9%) |
| 9:00 AM to 9:59 AM | 1,611 (4.2%) | 2,135 (5.8%) |
| 10:00 AM to 10:59 AM | 789 (2.1%) | 1,017 (2.7%) |
| 11:00 AM to 11:59 AM | 558 (1.5%) | 445 (1.2%) |
| 12:00 PM to 3:59 PM | 2,551 (6.7%) | 2,701 (7.3%) |
| 4:00 PM to 11:59 PM | 2,119 (5.6%) | 2,642 (7.1%) |
| Total | 38,177 (100.0%) | 37,137 (100.0%) |
Housing Occupancy in Mobile
Occupancy by Ownership in Mobile
Of the total 77,844 dwellings in Mobile, owner-occupied units account for 39,424 (50.6%), while renter-occupied units make up 38,420 (49.4%).
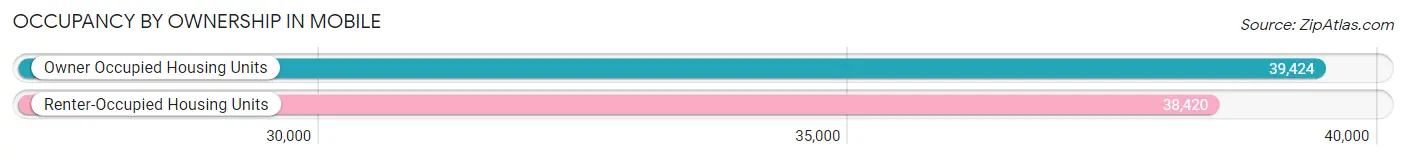
| Occupancy | # Housing Units | % Housing Units |
| Owner Occupied Housing Units | 39,424 | 50.6% |
| Renter-Occupied Housing Units | 38,420 | 49.4% |
| Total Occupied Housing Units | 77,844 | 100.0% |
Occupancy by Household Size in Mobile
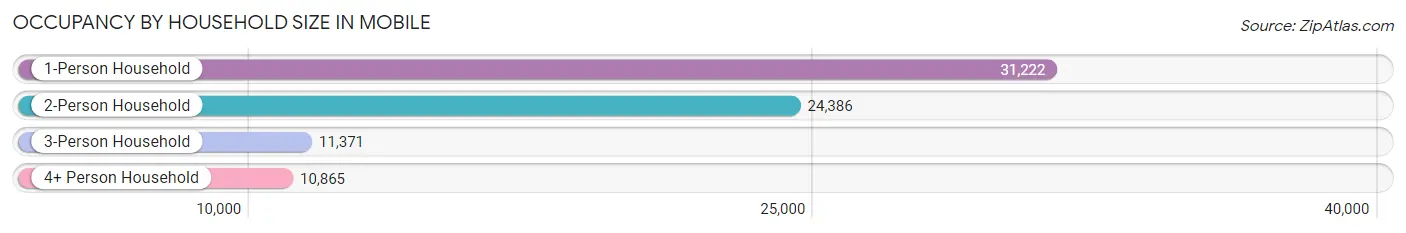
| Household Size | # Housing Units | % Housing Units |
| 1-Person Household | 31,222 | 40.1% |
| 2-Person Household | 24,386 | 31.3% |
| 3-Person Household | 11,371 | 14.6% |
| 4+ Person Household | 10,865 | 14.0% |
| Total Housing Units | 77,844 | 100.0% |
Occupancy by Ownership by Household Size in Mobile
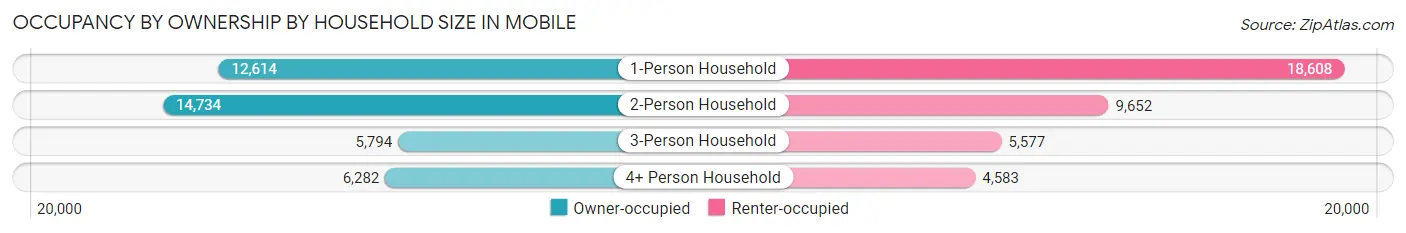
| Household Size | Owner-occupied | Renter-occupied |
| 1-Person Household | 12,614 (40.4%) | 18,608 (59.6%) |
| 2-Person Household | 14,734 (60.4%) | 9,652 (39.6%) |
| 3-Person Household | 5,794 (50.9%) | 5,577 (49.0%) |
| 4+ Person Household | 6,282 (57.8%) | 4,583 (42.2%) |
| Total Housing Units | 39,424 (50.6%) | 38,420 (49.4%) |
Occupancy by Educational Attainment in Mobile
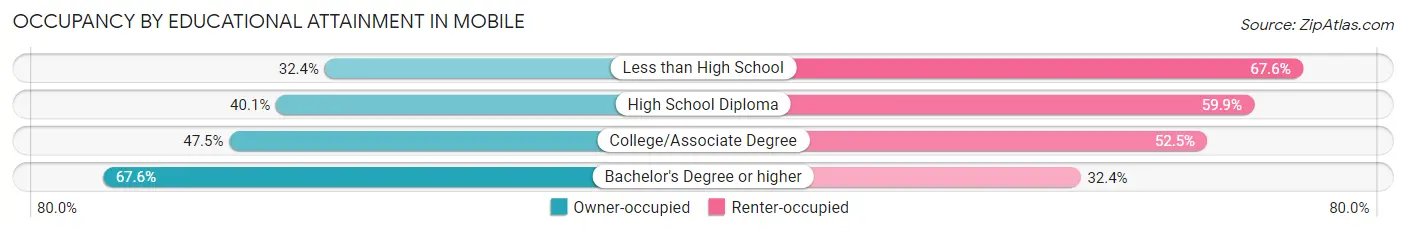
| Household Size | Owner-occupied | Renter-occupied |
| Less than High School | 2,140 (32.4%) | 4,467 (67.6%) |
| High School Diploma | 8,357 (40.1%) | 12,481 (59.9%) |
| College/Associate Degree | 12,185 (47.5%) | 13,448 (52.5%) |
| Bachelor's Degree or higher | 16,742 (67.6%) | 8,024 (32.4%) |
Occupancy by Age of Householder in Mobile
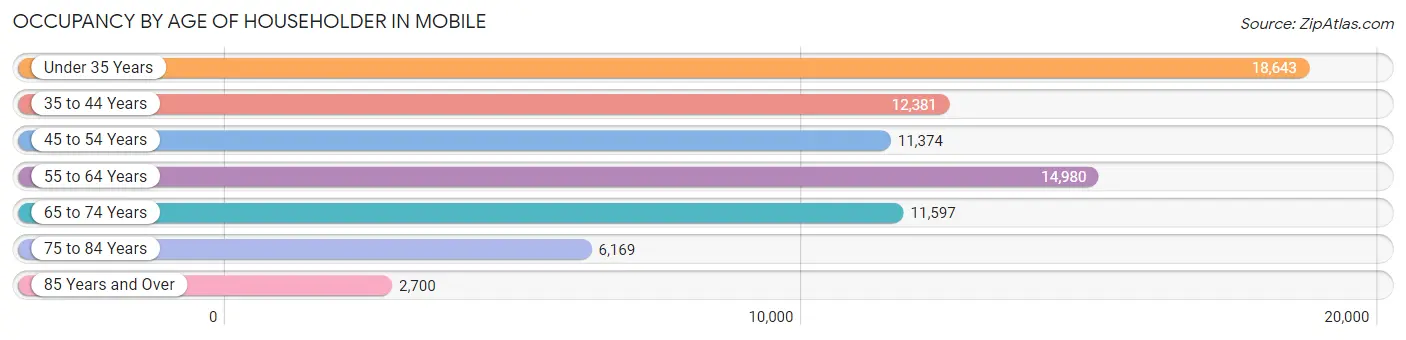
| Age Bracket | # Households | % Households |
| Under 35 Years | 18,643 | 23.9% |
| 35 to 44 Years | 12,381 | 15.9% |
| 45 to 54 Years | 11,374 | 14.6% |
| 55 to 64 Years | 14,980 | 19.2% |
| 65 to 74 Years | 11,597 | 14.9% |
| 75 to 84 Years | 6,169 | 7.9% |
| 85 Years and Over | 2,700 | 3.5% |
| Total | 77,844 | 100.0% |
Housing Finances in Mobile
Median Income by Occupancy in Mobile
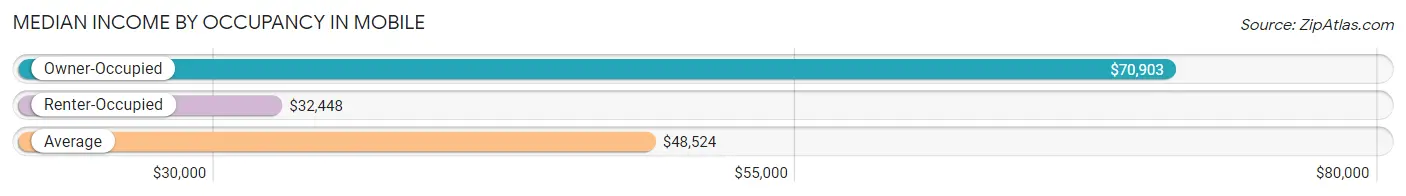
| Occupancy Type | # Households | Median Income |
| Owner-Occupied | 39,424 (50.6%) | $70,903 |
| Renter-Occupied | 38,420 (49.4%) | $32,448 |
| Average | 77,844 (100.0%) | $48,524 |
Occupancy by Householder Income Bracket in Mobile
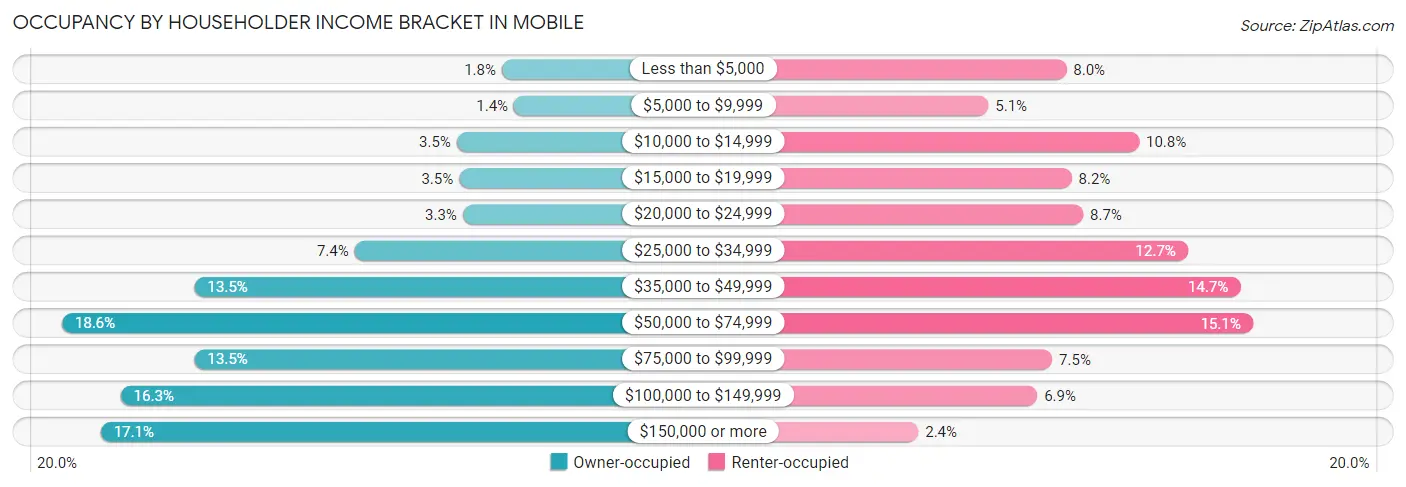
| Income Bracket | Owner-occupied | Renter-occupied |
| Less than $5,000 | 719 (1.8%) | 3,084 (8.0%) |
| $5,000 to $9,999 | 538 (1.4%) | 1,944 (5.1%) |
| $10,000 to $14,999 | 1,394 (3.5%) | 4,151 (10.8%) |
| $15,000 to $19,999 | 1,359 (3.5%) | 3,161 (8.2%) |
| $20,000 to $24,999 | 1,306 (3.3%) | 3,331 (8.7%) |
| $25,000 to $34,999 | 2,931 (7.4%) | 4,859 (12.7%) |
| $35,000 to $49,999 | 5,335 (13.5%) | 5,627 (14.6%) |
| $50,000 to $74,999 | 7,325 (18.6%) | 5,812 (15.1%) |
| $75,000 to $99,999 | 5,336 (13.5%) | 2,876 (7.5%) |
| $100,000 to $149,999 | 6,440 (16.3%) | 2,657 (6.9%) |
| $150,000 or more | 6,741 (17.1%) | 918 (2.4%) |
| Total | 39,424 (100.0%) | 38,420 (100.0%) |
Monthly Housing Cost Tiers in Mobile
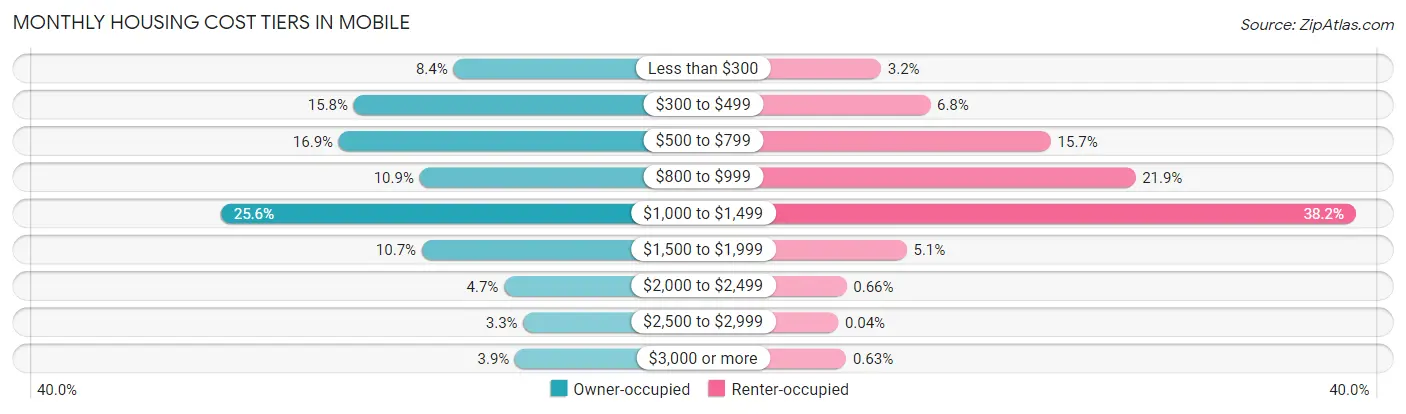
| Monthly Cost | Owner-occupied | Renter-occupied |
| Less than $300 | 3,317 (8.4%) | 1,229 (3.2%) |
| $300 to $499 | 6,211 (15.8%) | 2,619 (6.8%) |
| $500 to $799 | 6,642 (16.9%) | 6,032 (15.7%) |
| $800 to $999 | 4,296 (10.9%) | 8,425 (21.9%) |
| $1,000 to $1,499 | 10,071 (25.6%) | 14,664 (38.2%) |
| $1,500 to $1,999 | 4,235 (10.7%) | 1,954 (5.1%) |
| $2,000 to $2,499 | 1,844 (4.7%) | 253 (0.7%) |
| $2,500 to $2,999 | 1,284 (3.3%) | 16 (0.0%) |
| $3,000 or more | 1,524 (3.9%) | 242 (0.6%) |
| Total | 39,424 (100.0%) | 38,420 (100.0%) |
Physical Housing Characteristics in Mobile
Housing Structures in Mobile
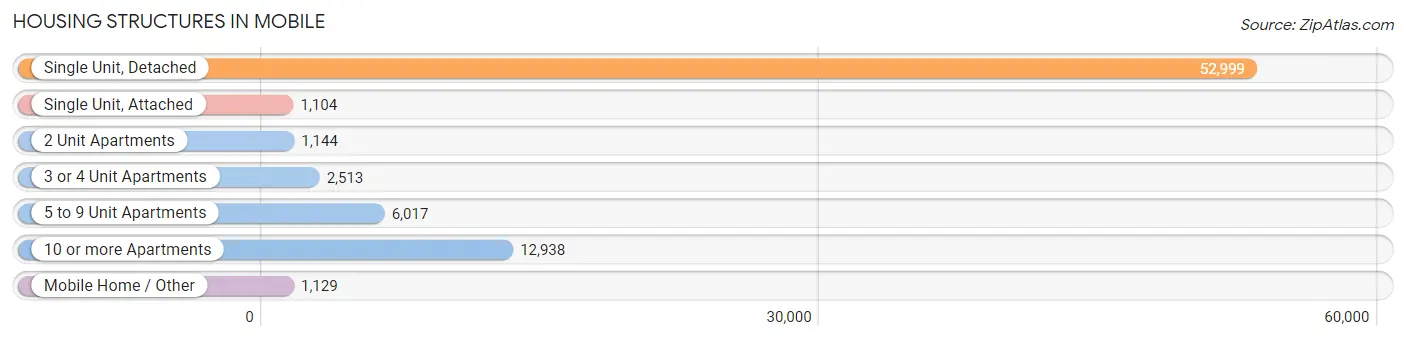
| Structure Type | # Housing Units | % Housing Units |
| Single Unit, Detached | 52,999 | 68.1% |
| Single Unit, Attached | 1,104 | 1.4% |
| 2 Unit Apartments | 1,144 | 1.5% |
| 3 or 4 Unit Apartments | 2,513 | 3.2% |
| 5 to 9 Unit Apartments | 6,017 | 7.7% |
| 10 or more Apartments | 12,938 | 16.6% |
| Mobile Home / Other | 1,129 | 1.5% |
| Total | 77,844 | 100.0% |
Housing Structures by Occupancy in Mobile
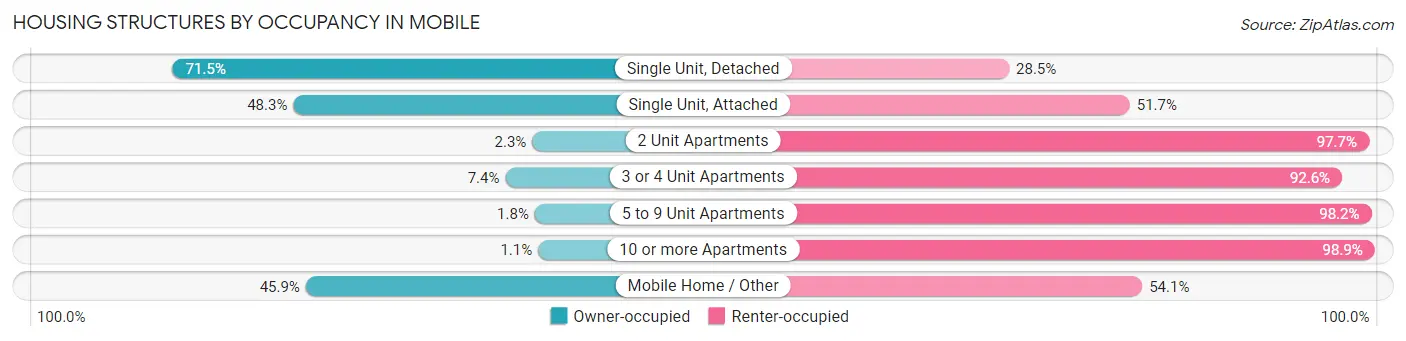
| Structure Type | Owner-occupied | Renter-occupied |
| Single Unit, Detached | 37,906 (71.5%) | 15,093 (28.5%) |
| Single Unit, Attached | 533 (48.3%) | 571 (51.7%) |
| 2 Unit Apartments | 26 (2.3%) | 1,118 (97.7%) |
| 3 or 4 Unit Apartments | 187 (7.4%) | 2,326 (92.6%) |
| 5 to 9 Unit Apartments | 107 (1.8%) | 5,910 (98.2%) |
| 10 or more Apartments | 147 (1.1%) | 12,791 (98.9%) |
| Mobile Home / Other | 518 (45.9%) | 611 (54.1%) |
| Total | 39,424 (50.6%) | 38,420 (49.4%) |
Housing Structures by Number of Rooms in Mobile
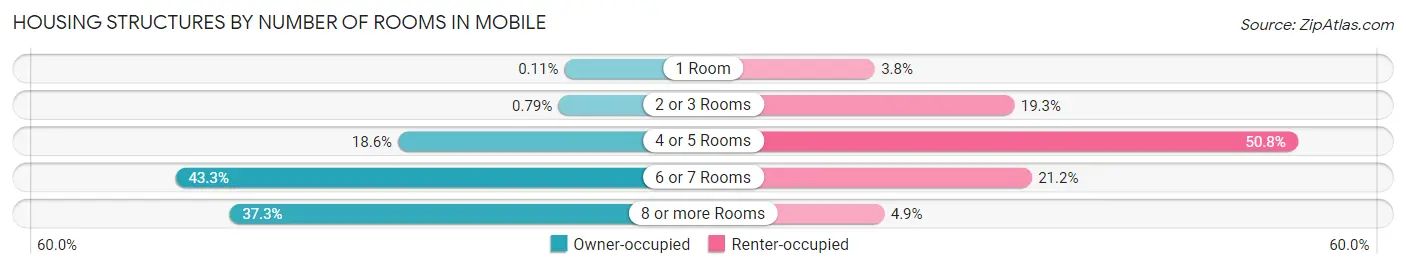
| Number of Rooms | Owner-occupied | Renter-occupied |
| 1 Room | 44 (0.1%) | 1,464 (3.8%) |
| 2 or 3 Rooms | 310 (0.8%) | 7,414 (19.3%) |
| 4 or 5 Rooms | 7,320 (18.6%) | 19,514 (50.8%) |
| 6 or 7 Rooms | 17,049 (43.2%) | 8,156 (21.2%) |
| 8 or more Rooms | 14,701 (37.3%) | 1,872 (4.9%) |
| Total | 39,424 (100.0%) | 38,420 (100.0%) |
Housing Structure by Heating Type in Mobile
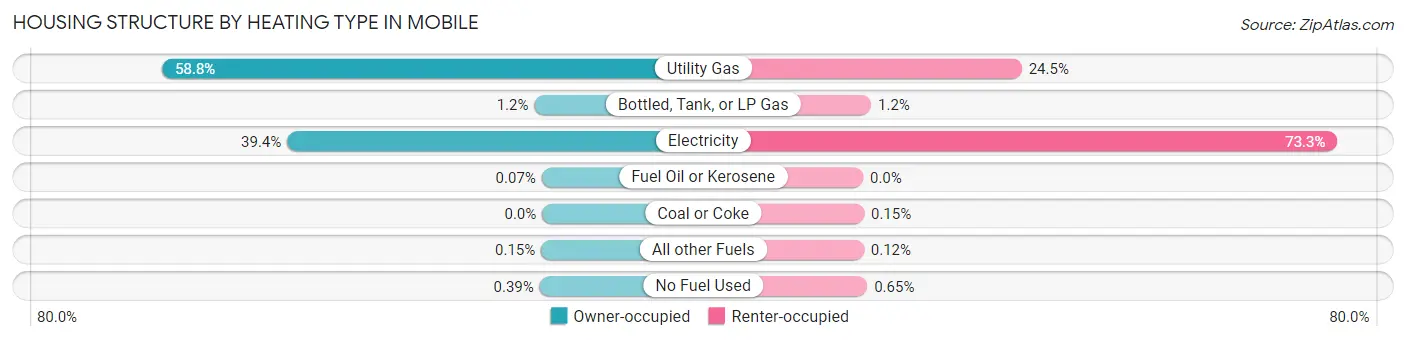
| Heating Type | Owner-occupied | Renter-occupied |
| Utility Gas | 23,167 (58.8%) | 9,424 (24.5%) |
| Bottled, Tank, or LP Gas | 475 (1.2%) | 476 (1.2%) |
| Electricity | 15,541 (39.4%) | 28,166 (73.3%) |
| Fuel Oil or Kerosene | 28 (0.1%) | 0 (0.0%) |
| Coal or Coke | 0 (0.0%) | 58 (0.2%) |
| All other Fuels | 59 (0.2%) | 47 (0.1%) |
| No Fuel Used | 154 (0.4%) | 249 (0.6%) |
| Total | 39,424 (100.0%) | 38,420 (100.0%) |
Household Vehicle Usage in Mobile
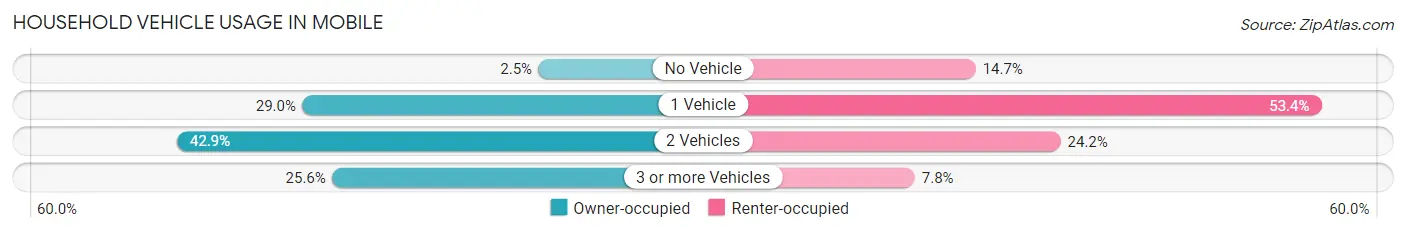
| Vehicles per Household | Owner-occupied | Renter-occupied |
| No Vehicle | 987 (2.5%) | 5,629 (14.6%) |
| 1 Vehicle | 11,415 (28.9%) | 20,500 (53.4%) |
| 2 Vehicles | 16,927 (42.9%) | 9,281 (24.2%) |
| 3 or more Vehicles | 10,095 (25.6%) | 3,010 (7.8%) |
| Total | 39,424 (100.0%) | 38,420 (100.0%) |
Real Estate & Mortgages in Mobile
Real Estate and Mortgage Overview in Mobile
| Characteristic | Without Mortgage | With Mortgage |
| Housing Units | 15,618 | 23,806 |
| Median Property Value | $133,800 | $172,000 |
| Median Household Income | $58,041 | $4,750 |
| Monthly Housing Costs | $449 | $1,500 |
| Real Estate Taxes | $746 | $3,190 |
Property Value by Mortgage Status in Mobile
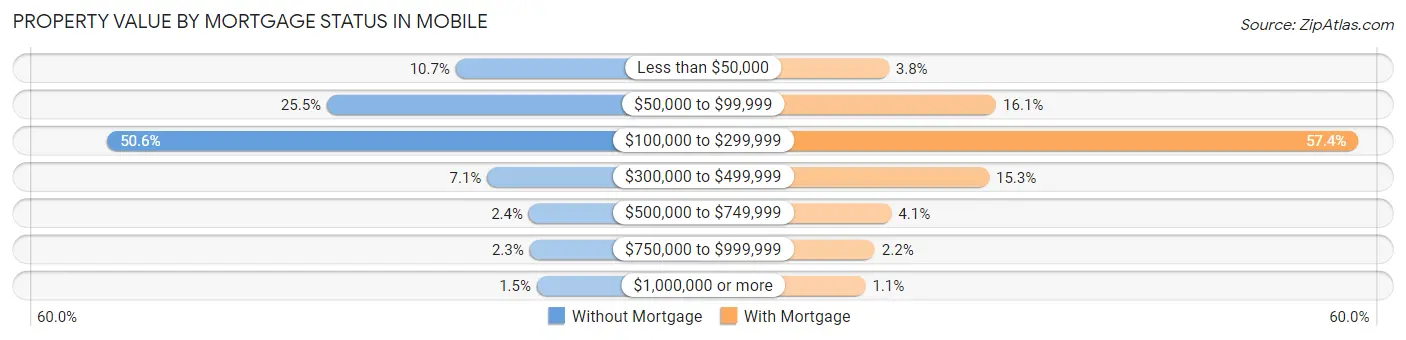
| Property Value | Without Mortgage | With Mortgage |
| Less than $50,000 | 1,676 (10.7%) | 906 (3.8%) |
| $50,000 to $99,999 | 3,975 (25.5%) | 3,825 (16.1%) |
| $100,000 to $299,999 | 7,895 (50.5%) | 13,674 (57.4%) |
| $300,000 to $499,999 | 1,114 (7.1%) | 3,632 (15.3%) |
| $500,000 to $749,999 | 372 (2.4%) | 975 (4.1%) |
| $750,000 to $999,999 | 358 (2.3%) | 525 (2.2%) |
| $1,000,000 or more | 228 (1.5%) | 269 (1.1%) |
| Total | 15,618 (100.0%) | 23,806 (100.0%) |
Household Income by Mortgage Status in Mobile
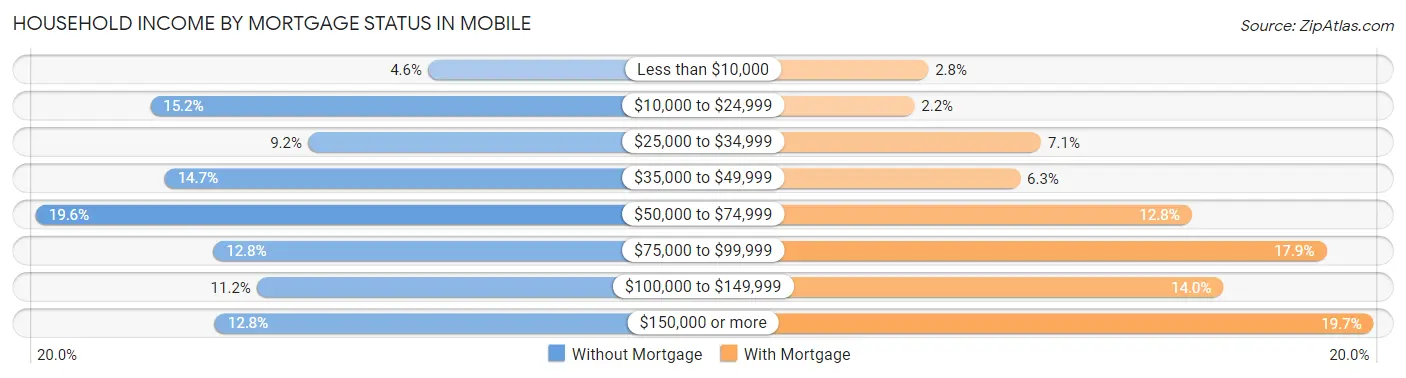
| Household Income | Without Mortgage | With Mortgage |
| Less than $10,000 | 724 (4.6%) | 659 (2.8%) |
| $10,000 to $24,999 | 2,375 (15.2%) | 533 (2.2%) |
| $25,000 to $34,999 | 1,439 (9.2%) | 1,684 (7.1%) |
| $35,000 to $49,999 | 2,289 (14.7%) | 1,492 (6.3%) |
| $50,000 to $74,999 | 3,056 (19.6%) | 3,046 (12.8%) |
| $75,000 to $99,999 | 2,001 (12.8%) | 4,269 (17.9%) |
| $100,000 to $149,999 | 1,743 (11.2%) | 3,335 (14.0%) |
| $150,000 or more | 1,991 (12.8%) | 4,697 (19.7%) |
| Total | 15,618 (100.0%) | 23,806 (100.0%) |
Property Value to Household Income Ratio in Mobile
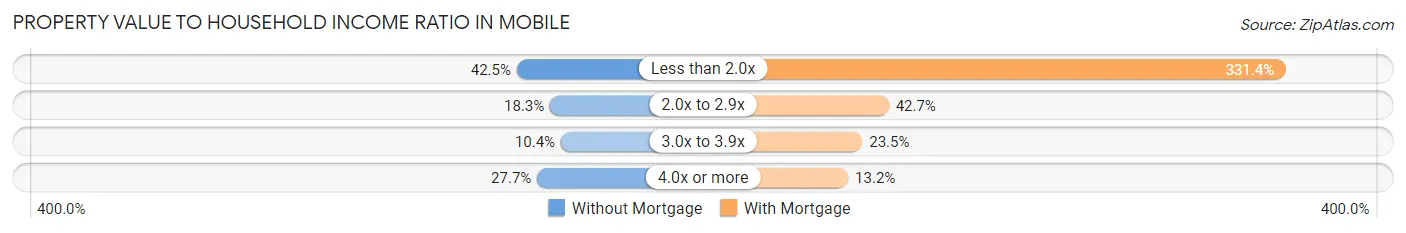
| Value-to-Income Ratio | Without Mortgage | With Mortgage |
| Less than 2.0x | 6,635 (42.5%) | 78,884 (331.4%) |
| 2.0x to 2.9x | 2,856 (18.3%) | 10,165 (42.7%) |
| 3.0x to 3.9x | 1,620 (10.4%) | 5,605 (23.5%) |
| 4.0x or more | 4,320 (27.7%) | 3,153 (13.2%) |
| Total | 15,618 (100.0%) | 23,806 (100.0%) |
Real Estate Taxes by Mortgage Status in Mobile
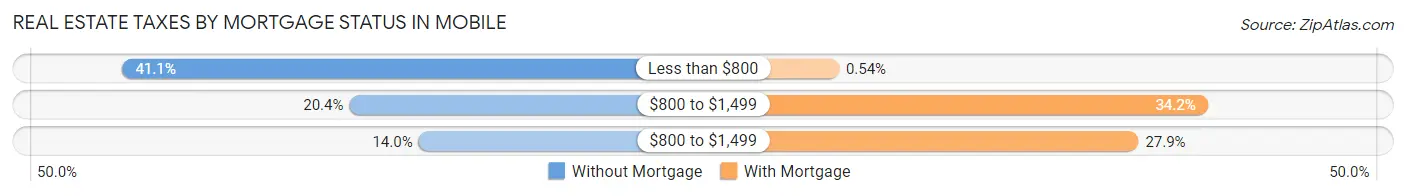
| Property Taxes | Without Mortgage | With Mortgage |
| Less than $800 | 6,413 (41.1%) | 129 (0.5%) |
| $800 to $1,499 | 3,179 (20.3%) | 8,143 (34.2%) |
| $800 to $1,499 | 2,191 (14.0%) | 6,639 (27.9%) |
| Total | 15,618 (100.0%) | 23,806 (100.0%) |
Health & Disability in Mobile
Health Insurance Coverage by Age in Mobile
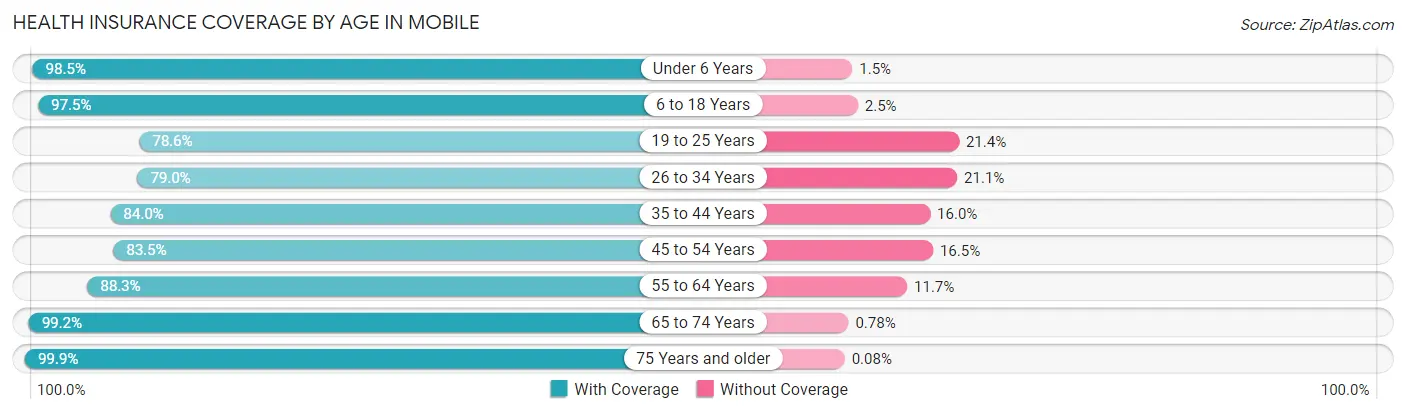
| Age Bracket | With Coverage | Without Coverage |
| Under 6 Years | 12,254 (98.5%) | 186 (1.5%) |
| 6 to 18 Years | 29,313 (97.5%) | 761 (2.5%) |
| 19 to 25 Years | 15,220 (78.6%) | 4,141 (21.4%) |
| 26 to 34 Years | 19,096 (78.9%) | 5,091 (21.0%) |
| 35 to 44 Years | 18,209 (84.0%) | 3,471 (16.0%) |
| 45 to 54 Years | 17,504 (83.5%) | 3,469 (16.5%) |
| 55 to 64 Years | 21,228 (88.3%) | 2,816 (11.7%) |
| 65 to 74 Years | 17,936 (99.2%) | 141 (0.8%) |
| 75 Years and older | 12,353 (99.9%) | 10 (0.1%) |
| Total | 163,113 (89.0%) | 20,086 (11.0%) |
Health Insurance Coverage by Citizenship Status in Mobile
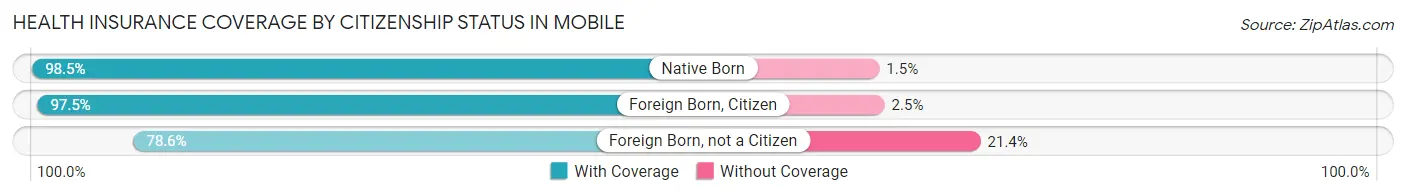
| Citizenship Status | With Coverage | Without Coverage |
| Native Born | 12,254 (98.5%) | 186 (1.5%) |
| Foreign Born, Citizen | 29,313 (97.5%) | 761 (2.5%) |
| Foreign Born, not a Citizen | 15,220 (78.6%) | 4,141 (21.4%) |
Health Insurance Coverage by Household Income in Mobile
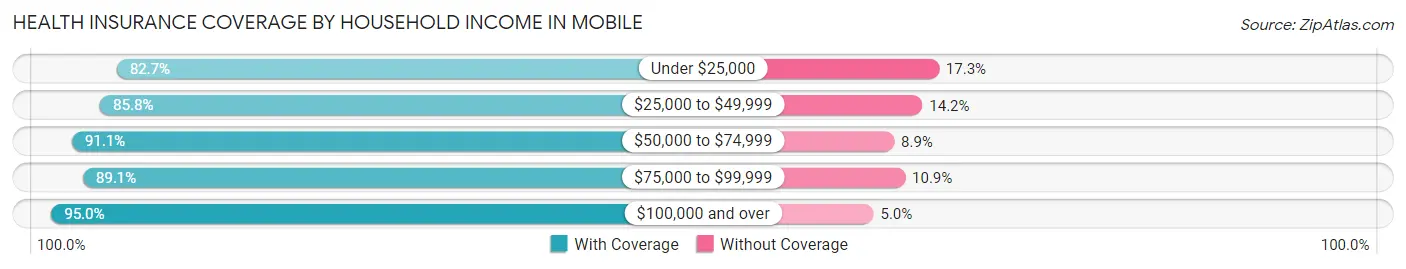
| Household Income | With Coverage | Without Coverage |
| Under $25,000 | 32,011 (82.7%) | 6,680 (17.3%) |
| $25,000 to $49,999 | 32,330 (85.8%) | 5,333 (14.2%) |
| $50,000 to $74,999 | 29,085 (91.1%) | 2,831 (8.9%) |
| $75,000 to $99,999 | 19,802 (89.1%) | 2,427 (10.9%) |
| $100,000 and over | 47,097 (95.0%) | 2,482 (5.0%) |
Public vs Private Health Insurance Coverage by Age in Mobile
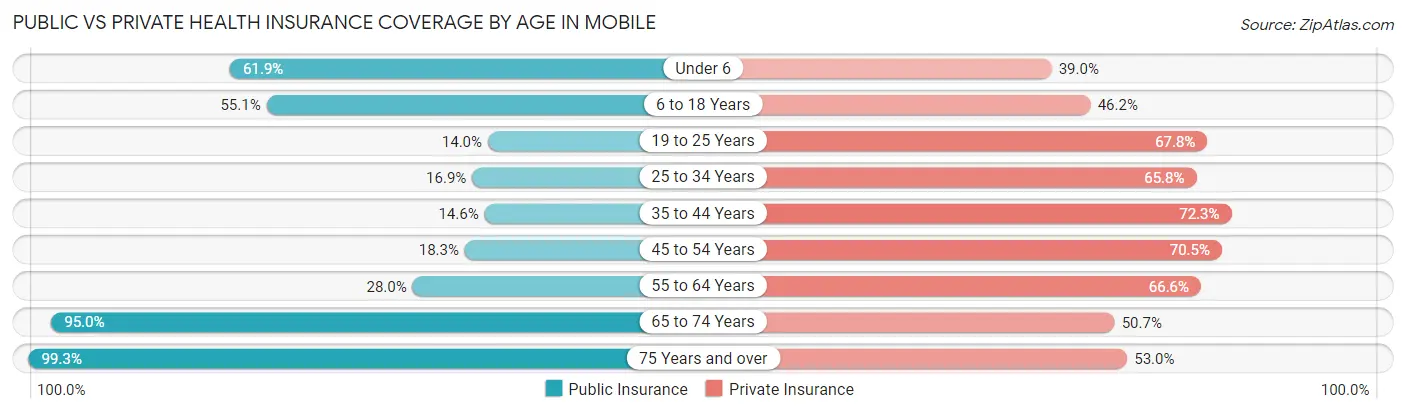
| Age Bracket | Public Insurance | Private Insurance |
| Under 6 | 7,698 (61.9%) | 4,848 (39.0%) |
| 6 to 18 Years | 16,572 (55.1%) | 13,897 (46.2%) |
| 19 to 25 Years | 2,712 (14.0%) | 13,130 (67.8%) |
| 25 to 34 Years | 4,095 (16.9%) | 15,916 (65.8%) |
| 35 to 44 Years | 3,173 (14.6%) | 15,672 (72.3%) |
| 45 to 54 Years | 3,839 (18.3%) | 14,790 (70.5%) |
| 55 to 64 Years | 6,729 (28.0%) | 16,022 (66.6%) |
| 65 to 74 Years | 17,181 (95.0%) | 9,158 (50.7%) |
| 75 Years and over | 12,273 (99.3%) | 6,553 (53.0%) |
| Total | 74,272 (40.5%) | 109,986 (60.0%) |
Disability Status by Sex by Age in Mobile
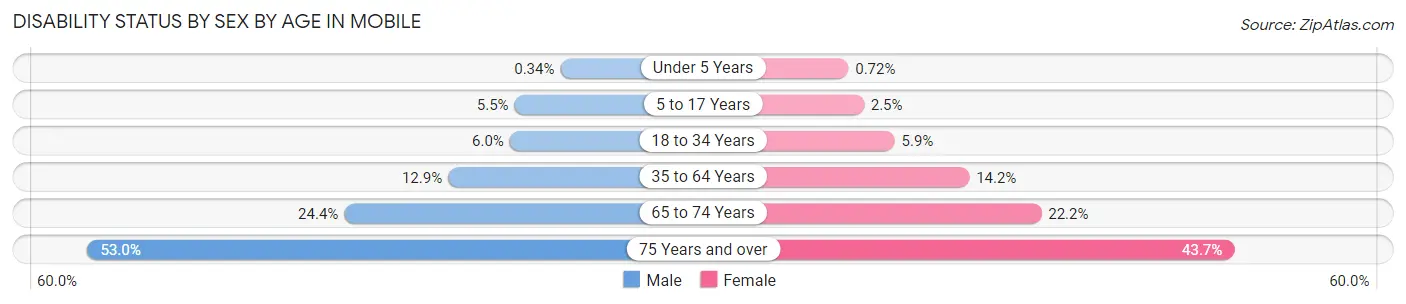
| Age Bracket | Male | Female |
| Under 5 Years | 18 (0.3%) | 37 (0.7%) |
| 5 to 17 Years | 819 (5.4%) | 355 (2.5%) |
| 18 to 34 Years | 1,296 (6.0%) | 1,433 (5.9%) |
| 35 to 64 Years | 3,980 (12.9%) | 5,067 (14.2%) |
| 65 to 74 Years | 2,002 (24.4%) | 2,194 (22.2%) |
| 75 Years and over | 2,449 (53.0%) | 3,382 (43.7%) |
Disability Class by Sex by Age in Mobile
Disability Class: Hearing Difficulty
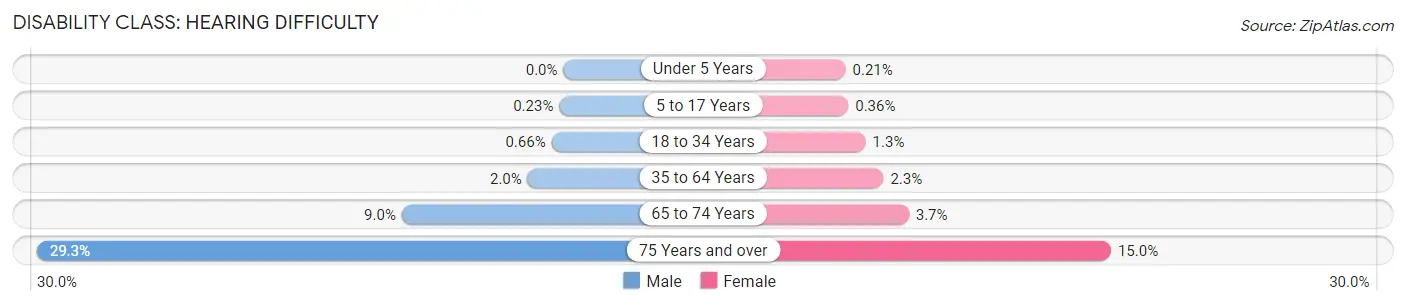
| Age Bracket | Male | Female |
| Under 5 Years | 0 (0.0%) | 11 (0.2%) |
| 5 to 17 Years | 34 (0.2%) | 52 (0.4%) |
| 18 to 34 Years | 143 (0.7%) | 324 (1.3%) |
| 35 to 64 Years | 616 (2.0%) | 827 (2.3%) |
| 65 to 74 Years | 738 (9.0%) | 368 (3.7%) |
| 75 Years and over | 1,355 (29.3%) | 1,160 (15.0%) |
Disability Class: Vision Difficulty
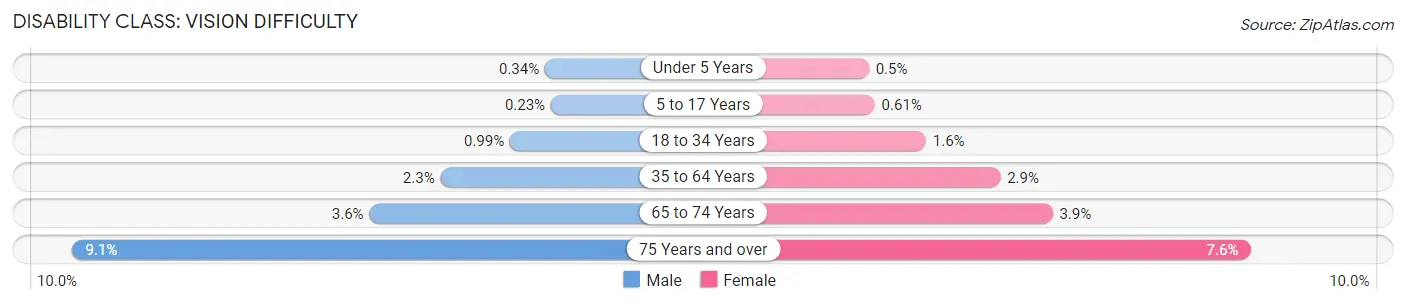
| Age Bracket | Male | Female |
| Under 5 Years | 18 (0.3%) | 26 (0.5%) |
| 5 to 17 Years | 34 (0.2%) | 88 (0.6%) |
| 18 to 34 Years | 214 (1.0%) | 381 (1.6%) |
| 35 to 64 Years | 707 (2.3%) | 1,050 (2.9%) |
| 65 to 74 Years | 295 (3.6%) | 386 (3.9%) |
| 75 Years and over | 421 (9.1%) | 587 (7.6%) |
Disability Class: Cognitive Difficulty
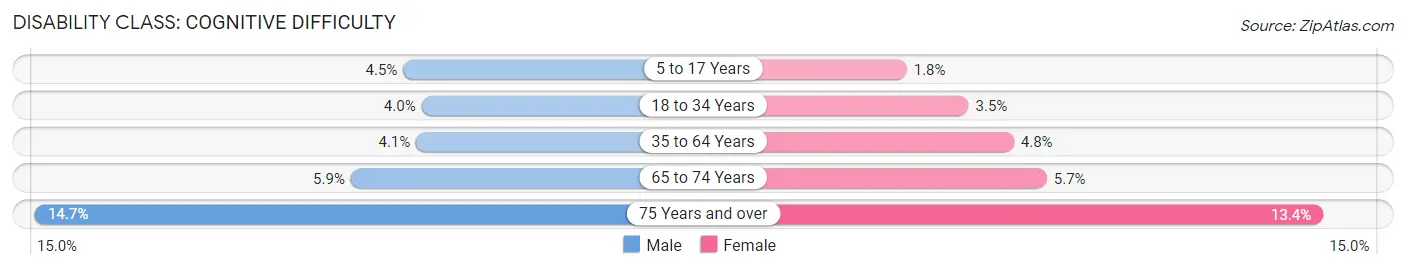
| Age Bracket | Male | Female |
| 5 to 17 Years | 670 (4.5%) | 262 (1.8%) |
| 18 to 34 Years | 857 (4.0%) | 860 (3.5%) |
| 35 to 64 Years | 1,271 (4.1%) | 1,711 (4.8%) |
| 65 to 74 Years | 486 (5.9%) | 564 (5.7%) |
| 75 Years and over | 680 (14.7%) | 1,037 (13.4%) |
Disability Class: Ambulatory Difficulty
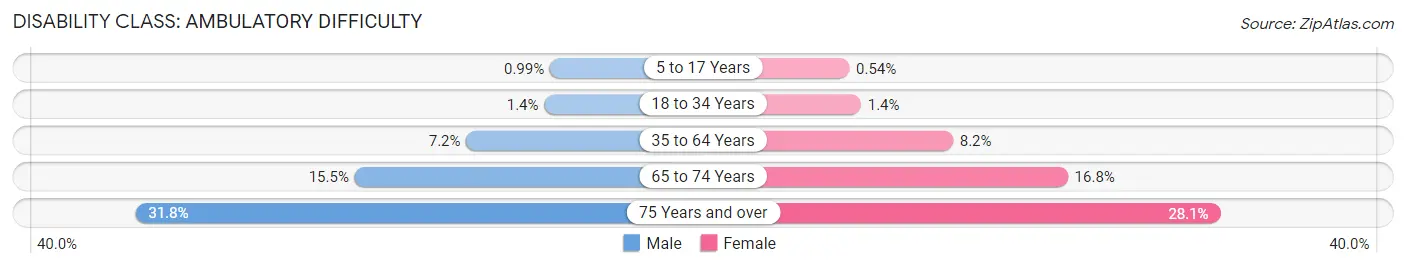
| Age Bracket | Male | Female |
| 5 to 17 Years | 149 (1.0%) | 78 (0.5%) |
| 18 to 34 Years | 305 (1.4%) | 344 (1.4%) |
| 35 to 64 Years | 2,232 (7.2%) | 2,944 (8.2%) |
| 65 to 74 Years | 1,271 (15.5%) | 1,656 (16.8%) |
| 75 Years and over | 1,469 (31.8%) | 2,176 (28.1%) |
Disability Class: Self-Care Difficulty
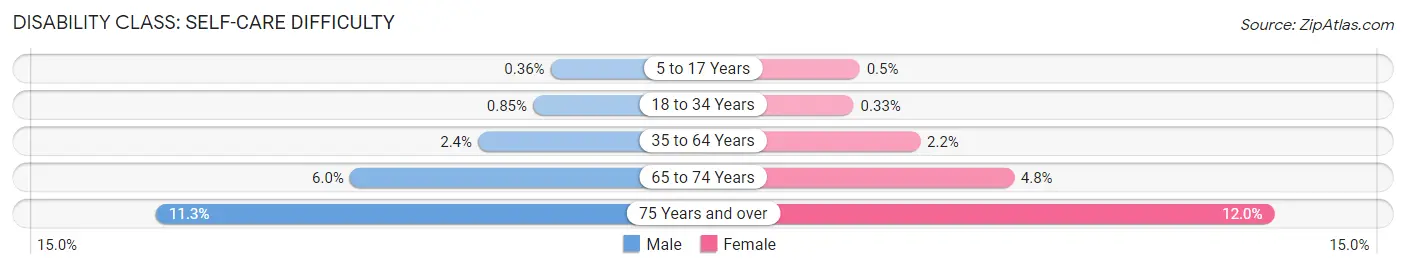
| Age Bracket | Male | Female |
| 5 to 17 Years | 54 (0.4%) | 73 (0.5%) |
| 18 to 34 Years | 184 (0.9%) | 81 (0.3%) |
| 35 to 64 Years | 738 (2.4%) | 778 (2.2%) |
| 65 to 74 Years | 488 (5.9%) | 473 (4.8%) |
| 75 Years and over | 524 (11.3%) | 932 (12.0%) |
Technology Access in Mobile
Computing Device Access in Mobile
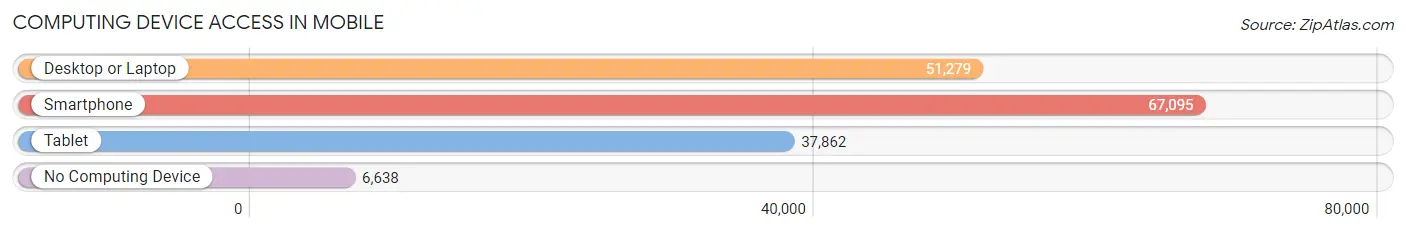
| Device Type | # Households | % Households |
| Desktop or Laptop | 51,279 | 65.9% |
| Smartphone | 67,095 | 86.2% |
| Tablet | 37,862 | 48.6% |
| No Computing Device | 6,638 | 8.5% |
| Total | 77,844 | 100.0% |
Internet Access in Mobile
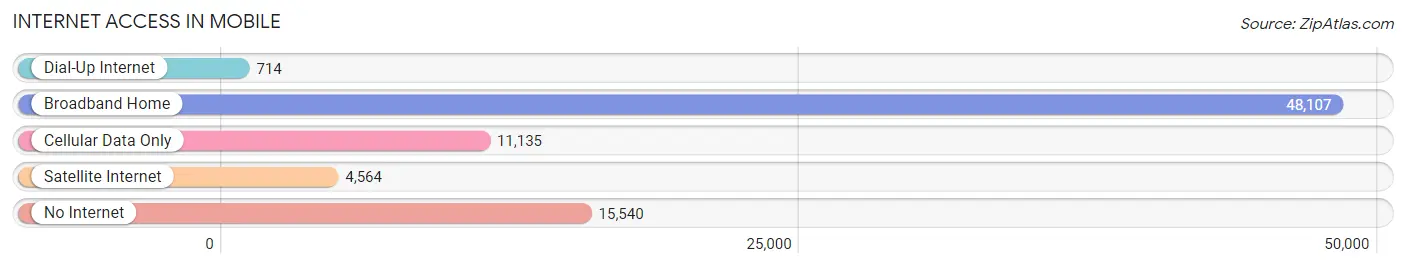
| Internet Type | # Households | % Households |
| Dial-Up Internet | 714 | 0.9% |
| Broadband Home | 48,107 | 61.8% |
| Cellular Data Only | 11,135 | 14.3% |
| Satellite Internet | 4,564 | 5.9% |
| No Internet | 15,540 | 20.0% |
| Total | 77,844 | 100.0% |
Mobile Summary
Mobile, Alabama is a city located in the southwestern corner of the state, on the Gulf Coast. It is the third-largest city in Alabama, with a population of 195,111 as of the 2010 census. Mobile is the county seat of Mobile County, and is the only incorporated municipality in the county. The city is located at the head of Mobile Bay, and is the principal municipality of the Mobile metropolitan area, which includes all of Mobile County.
Geography
Mobile is located at the head of Mobile Bay, which is an inlet of the Gulf of Mexico. The city is situated at the mouth of the Mobile River, which empties into the bay. The city is located on the Mobile-Tensaw River Delta, which is the largest delta in the United States. The city is located on the Gulf Coastal Plain, and is bordered by the Mobile-Tensaw River Delta to the north, the Mobile Bay to the east, and the Gulf of Mexico to the south. The city is located approximately 60 miles (97 km) north of the Florida border.
Climate
Mobile has a humid subtropical climate, with hot, humid summers and mild winters. The average annual temperature is 64.4°F (18°C). The average high temperature in July is 90°F (32°C), and the average low temperature in January is 40°F (4°C). The average annual precipitation is 64.2 inches (163 cm).
History
Mobile was founded in 1702 by French colonists, and was the first capital of the French colony of Louisiana. The city was named after the Native American tribe that inhabited the area, the Mobilian. The city was a major port for the French, and was the site of the first Mardi Gras celebration in the United States.
In 1763, the city was ceded to the British, and in 1780, it was captured by the Spanish. The city was returned to the United States in 1813, and in 1814, it was incorporated as a city.
In 1861, Mobile was the site of the Battle of Mobile Bay, which was a major victory for the Union forces. During the Civil War, the city was occupied by Union forces, and in 1865, it was captured by the Union.
Economy
Mobile is a major port city, and is the home of the Alabama State Docks. The city is also a major center for the aerospace industry, and is home to the Brookley Aeroplex, which is a major aerospace industrial complex. The city is also home to several major manufacturing companies, including Austal USA, which is a major shipbuilder.
The city is also a major center for the health care industry, and is home to several major hospitals, including the University of South Alabama Medical Center, Mobile Infirmary Medical Center, and Springhill Medical Center.
Demographics
As of the 2010 census, the population of Mobile was 195,111. The racial makeup of the city was 57.2% White, 37.3% African American, 0.6% Native American, 1.7% Asian, 0.1% Pacific Islander, 1.2% from other races, and 2.1% from two or more races. Hispanic or Latino of any race were 4.2% of the population.
The median income for a household in the city was $37,837, and the median income for a family was $45,837. The per capita income for the city was $20,837. About 19.2% of the population was below the poverty line.
Common Questions
What is the Total Population of Mobile?
Total Population of Mobile is 186,316.
What is the Total Male Population of Mobile?
Total Male Population of Mobile is 87,658.
What is the Total Female Population of Mobile?
Total Female Population of Mobile is 98,658.
What is the Ratio of Males per 100 Females in Mobile?
There are 88.85 Males per 100 Females in Mobile.
What is the Ratio of Females per 100 Males in Mobile?
There are 112.55 Females per 100 Males in Mobile.
What is the Median Population Age in Mobile?
Median Population Age in Mobile is 37.6 Years.
What is the Average Family Size in Mobile
Average Family Size in Mobile is 3.2 People.
What is the Average Household Size in Mobile
Average Household Size in Mobile is 2.3 People.
What is Per Capita Income in Mobile?
Per Capita income in Mobile is $31,328.
What is the Median Family Income in Mobile?
Median Family Income in Mobile is $64,558.
What is the Median Household income in Mobile?
Median Household Income in Mobile is $48,524.
What is Income or Wage Gap in Mobile?
Income or Wage Gap in Mobile is 33.4%.
Women in Mobile earn 66.6 cents for every dollar earned by a man.
What is Family Income Deficit in Mobile?
Family Income Deficit in Mobile is $11,311.
Families that are below poverty line in Mobile earn $11,311 less on average than the poverty threshold level.
What is Inequality or Gini Index in Mobile?
Inequality or Gini Index in Mobile is 0.50.
How Large is the Labor Force in Mobile?
There are 87,496 People in the Labor Forcein in Mobile.
What is the Percentage of People in the Labor Force in Mobile?
58.1% of People are in the Labor Force in Mobile.
What is the Unemployment Rate in Mobile?
Unemployment Rate in Mobile is 6.5%.