Fayetteville, NC Map & Demographics
Fayetteville Map
Fayetteville Overview
$30,039
PER CAPITA INCOME
$63,485
AVG FAMILY INCOME
$53,424
AVG HOUSEHOLD INCOME
15.3%
WAGE / INCOME GAP [ % ]
84.7¢/ $1
WAGE / INCOME GAP [ $ ]
$10,693
FAMILY INCOME DEFICIT
0.45
INEQUALITY / GINI INDEX
208,697
TOTAL POPULATION
106,029
MALE POPULATION
102,668
FEMALE POPULATION
103.27
MALES / 100 FEMALES
96.83
FEMALES / 100 MALES
30.5
MEDIAN AGE
3.1
AVG FAMILY SIZE
2.4
AVG HOUSEHOLD SIZE
108,889
LABOR FORCE [ PEOPLE ]
66.4%
PERCENT IN LABOR FORCE
8.4%
UNEMPLOYMENT RATE
Fayetteville Area Codes
Income in Fayetteville
Income Overview in Fayetteville
Per Capita Income in Fayetteville is $30,039, while median incomes of families and households are $63,485 and $53,424 respectively.
| Characteristic | Number | Measure |
| Per Capita Income | 208,697 | $30,039 |
| Median Family Income | 47,175 | $63,485 |
| Mean Family Income | 47,175 | $82,568 |
| Median Household Income | 80,852 | $53,424 |
| Mean Household Income | 80,852 | $70,355 |
| Income Deficit | 47,175 | $10,693 |
| Wage / Income Gap (%) | 208,697 | 15.34% |
| Wage / Income Gap ($) | 208,697 | 84.66¢ per $1 |
| Gini / Inequality Index | 208,697 | 0.45 |
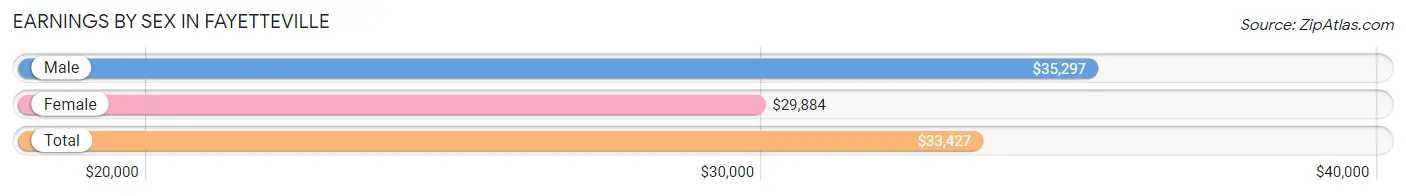
Earnings by Sex in Fayetteville
Average Earnings in Fayetteville are $33,427, $35,297 for men and $29,884 for women, a difference of 15.3%.
| Sex | Number | Average Earnings |
| Male | 62,230 (56.0%) | $35,297 |
| Female | 48,928 (44.0%) | $29,884 |
| Total | 111,158 (100.0%) | $33,427 |
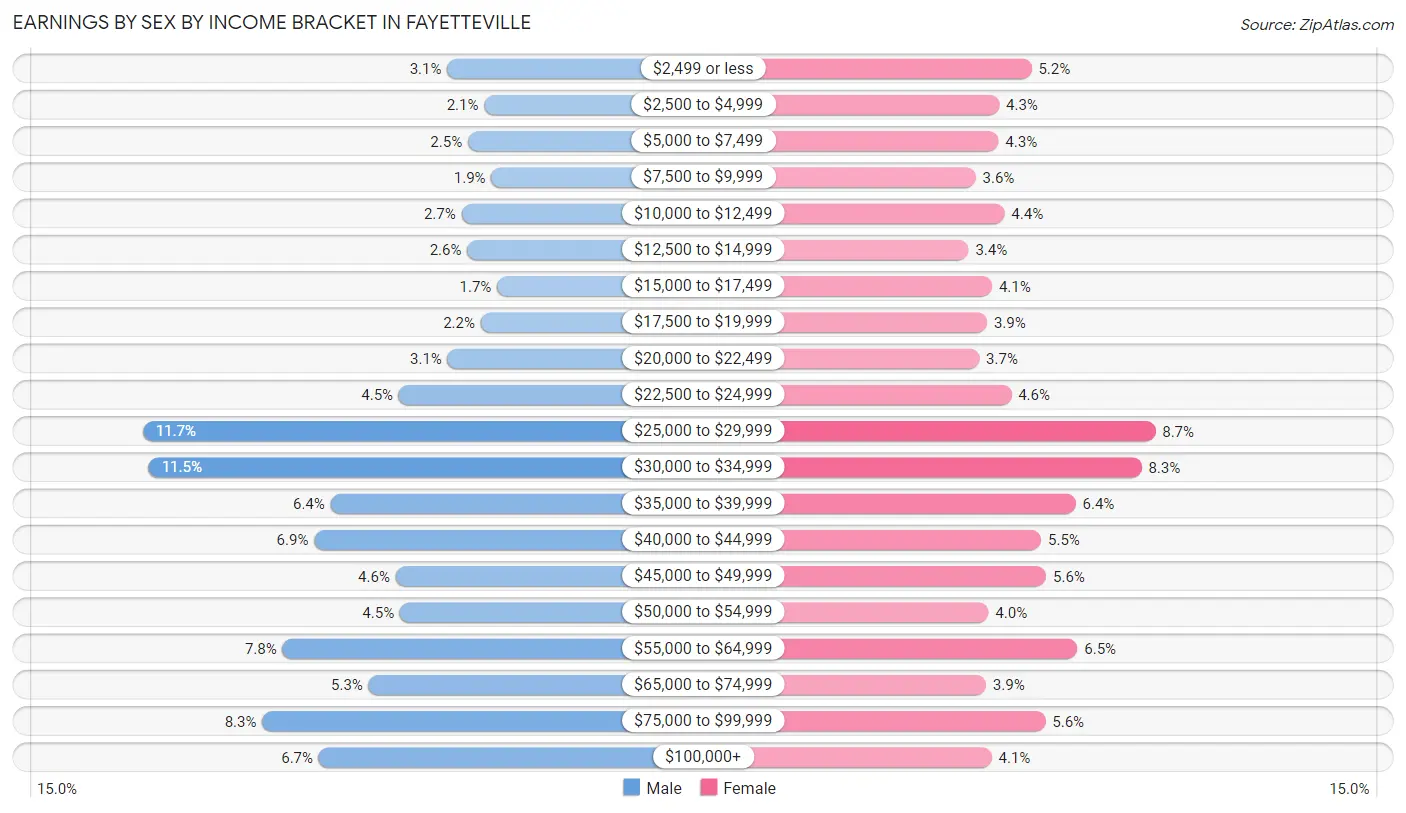
Earnings by Sex by Income Bracket in Fayetteville
The most common earnings brackets in Fayetteville are $25,000 to $29,999 for men (7,269 | 11.7%) and $25,000 to $29,999 for women (4,240 | 8.7%).
| Income | Male | Female |
| $2,499 or less | 1,944 (3.1%) | 2,540 (5.2%) |
| $2,500 to $4,999 | 1,293 (2.1%) | 2,095 (4.3%) |
| $5,000 to $7,499 | 1,579 (2.5%) | 2,086 (4.3%) |
| $7,500 to $9,999 | 1,169 (1.9%) | 1,769 (3.6%) |
| $10,000 to $12,499 | 1,693 (2.7%) | 2,167 (4.4%) |
| $12,500 to $14,999 | 1,595 (2.6%) | 1,671 (3.4%) |
| $15,000 to $17,499 | 1,068 (1.7%) | 1,995 (4.1%) |
| $17,500 to $19,999 | 1,357 (2.2%) | 1,929 (3.9%) |
| $20,000 to $22,499 | 1,934 (3.1%) | 1,818 (3.7%) |
| $22,500 to $24,999 | 2,785 (4.5%) | 2,260 (4.6%) |
| $25,000 to $29,999 | 7,269 (11.7%) | 4,240 (8.7%) |
| $30,000 to $34,999 | 7,165 (11.5%) | 4,049 (8.3%) |
| $35,000 to $39,999 | 3,985 (6.4%) | 3,144 (6.4%) |
| $40,000 to $44,999 | 4,272 (6.9%) | 2,671 (5.5%) |
| $45,000 to $49,999 | 2,841 (4.6%) | 2,741 (5.6%) |
| $50,000 to $54,999 | 2,772 (4.4%) | 1,948 (4.0%) |
| $55,000 to $64,999 | 4,822 (7.7%) | 3,172 (6.5%) |
| $65,000 to $74,999 | 3,318 (5.3%) | 1,912 (3.9%) |
| $75,000 to $99,999 | 5,179 (8.3%) | 2,731 (5.6%) |
| $100,000+ | 4,190 (6.7%) | 1,990 (4.1%) |
| Total | 62,230 (100.0%) | 48,928 (100.0%) |
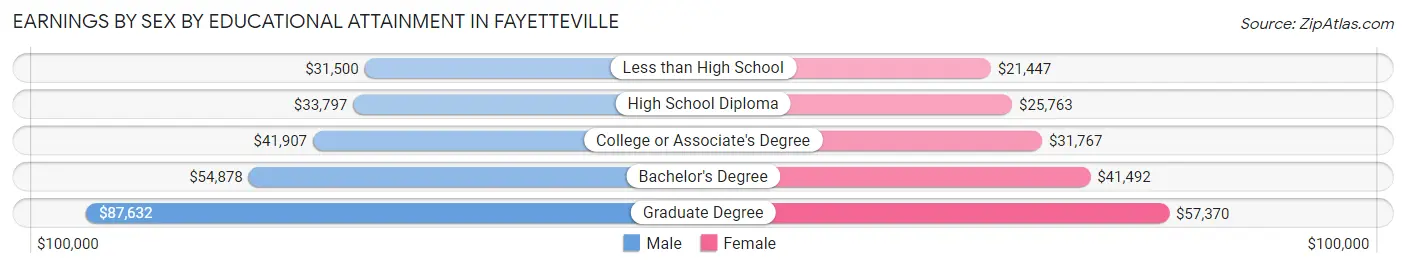
Earnings by Sex by Educational Attainment in Fayetteville
Average earnings in Fayetteville are $42,916 for men and $34,243 for women, a difference of 20.2%. Men with an educational attainment of graduate degree enjoy the highest average annual earnings of $87,632, while those with less than high school education earn the least with $31,500. Women with an educational attainment of graduate degree earn the most with the average annual earnings of $57,370, while those with less than high school education have the smallest earnings of $21,447.
| Educational Attainment | Male Income | Female Income |
| Less than High School | $31,500 | $21,447 |
| High School Diploma | $33,797 | $25,763 |
| College or Associate's Degree | $41,907 | $31,767 |
| Bachelor's Degree | $54,878 | $41,492 |
| Graduate Degree | $87,632 | $57,370 |
| Total | $42,916 | $34,243 |
Family Income in Fayetteville
Family Income Brackets in Fayetteville
According to the Fayetteville family income data, there are 9,105 families falling into the $50,000 to $74,999 income range, which is the most common income bracket and makes up 19.3% of all families. Conversely, the $10,000 to $14,999 income bracket is the least frequent group with only 1,368 families (2.9%) belonging to this category.
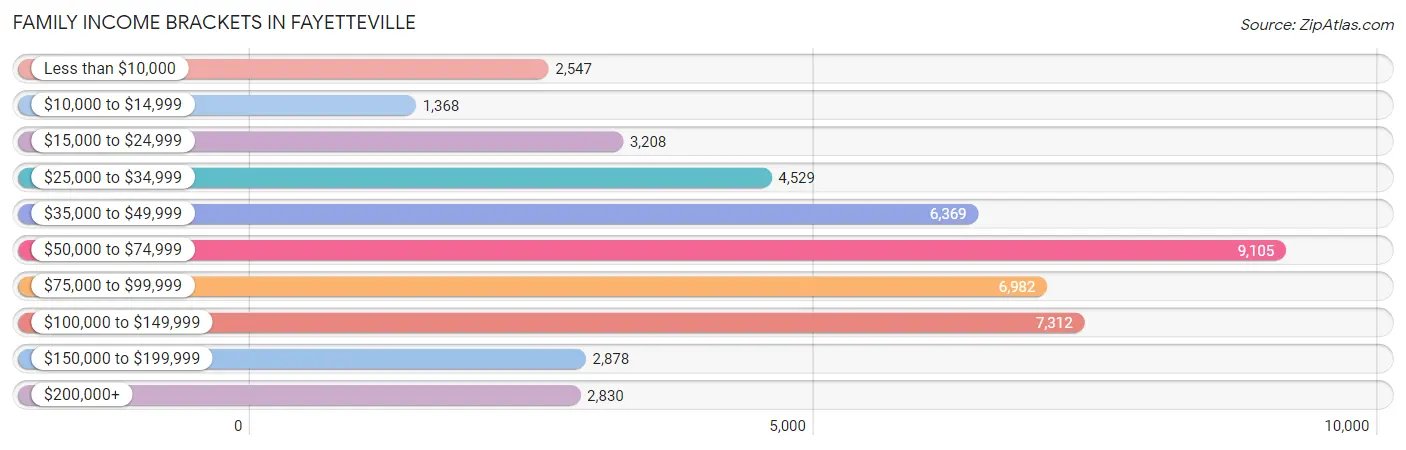
| Income Bracket | # Families | % Families |
| Less than $10,000 | 2,547 | 5.4% |
| $10,000 to $14,999 | 1,368 | 2.9% |
| $15,000 to $24,999 | 3,208 | 6.8% |
| $25,000 to $34,999 | 4,529 | 9.6% |
| $35,000 to $49,999 | 6,369 | 13.5% |
| $50,000 to $74,999 | 9,105 | 19.3% |
| $75,000 to $99,999 | 6,982 | 14.8% |
| $100,000 to $149,999 | 7,312 | 15.5% |
| $150,000 to $199,999 | 2,878 | 6.1% |
| $200,000+ | 2,830 | 6.0% |
Family Income by Famaliy Size in Fayetteville
5-person families (2,911 | 6.2%) account for the highest median family income in Fayetteville with $78,785 per family, while 2-person families (23,586 | 50.0%) have the highest median income of $30,917 per family member.
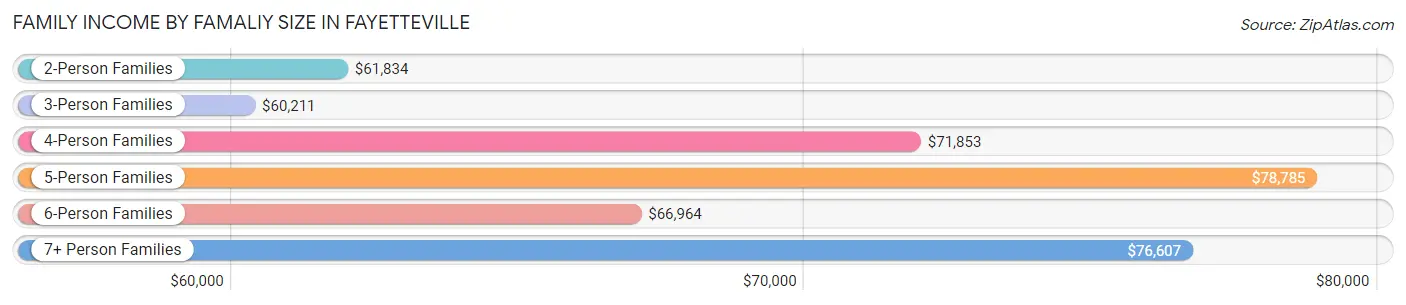
| Income Bracket | # Families | Median Income |
| 2-Person Families | 23,586 (50.0%) | $61,834 |
| 3-Person Families | 11,320 (24.0%) | $60,211 |
| 4-Person Families | 7,336 (15.5%) | $71,853 |
| 5-Person Families | 2,911 (6.2%) | $78,785 |
| 6-Person Families | 1,304 (2.8%) | $66,964 |
| 7+ Person Families | 718 (1.5%) | $76,607 |
| Total | 47,175 (100.0%) | $63,485 |
Family Income by Number of Earners in Fayetteville
The median family income in Fayetteville is $63,485, with families comprising 3+ earners (3,144) having the highest median family income of $115,588, while families with no earners (7,106) have the lowest median family income of $35,603, accounting for 6.7% and 15.1% of families, respectively.
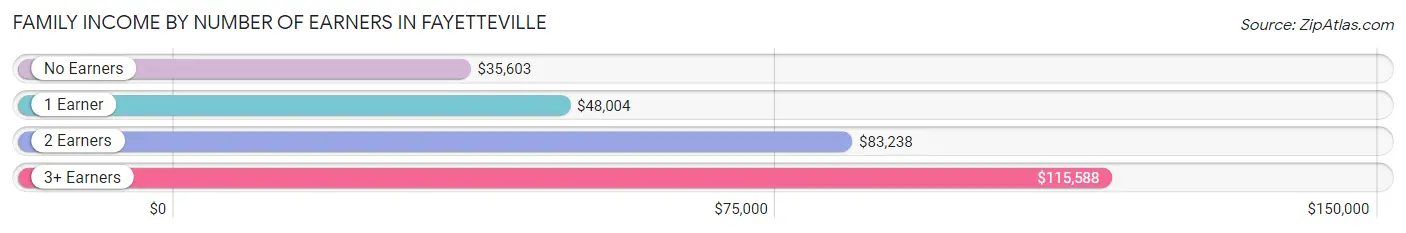
| Number of Earners | # Families | Median Income |
| No Earners | 7,106 (15.1%) | $35,603 |
| 1 Earner | 19,180 (40.7%) | $48,004 |
| 2 Earners | 17,745 (37.6%) | $83,238 |
| 3+ Earners | 3,144 (6.7%) | $115,588 |
| Total | 47,175 (100.0%) | $63,485 |
Household Income in Fayetteville
Household Income Brackets in Fayetteville
With 15,604 households falling in the category, the $50,000 to $74,999 income range is the most frequent in Fayetteville, accounting for 19.3% of all households. In contrast, only 3,315 households (4.1%) fall into the $200,000+ income bracket, making it the least populous group.
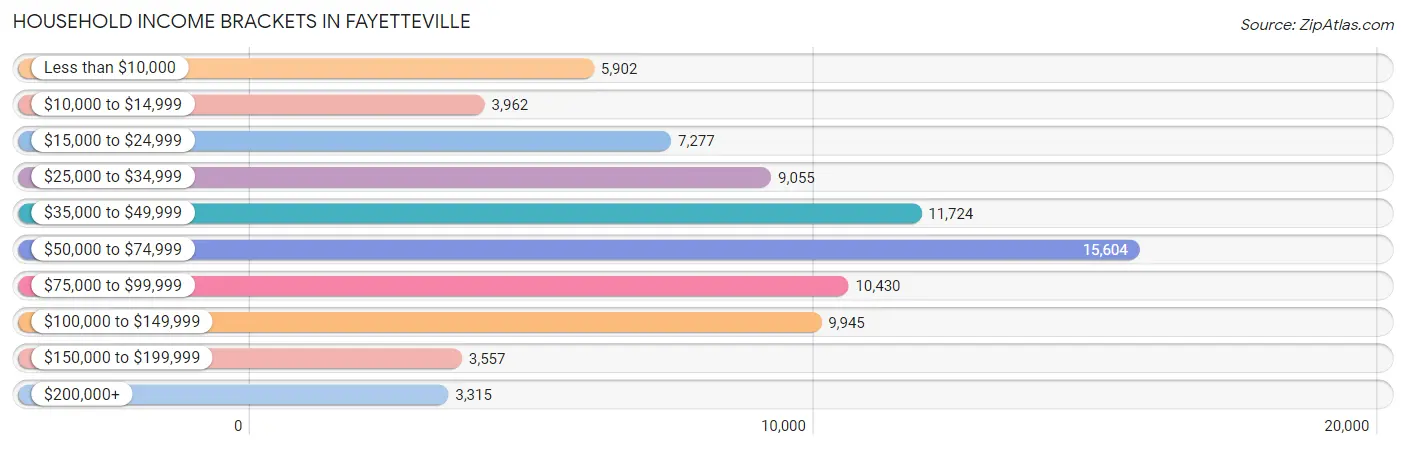
| Income Bracket | # Households | % Households |
| Less than $10,000 | 5,902 | 7.3% |
| $10,000 to $14,999 | 3,962 | 4.9% |
| $15,000 to $24,999 | 7,277 | 9.0% |
| $25,000 to $34,999 | 9,055 | 11.2% |
| $35,000 to $49,999 | 11,724 | 14.5% |
| $50,000 to $74,999 | 15,604 | 19.3% |
| $75,000 to $99,999 | 10,430 | 12.9% |
| $100,000 to $149,999 | 9,945 | 12.3% |
| $150,000 to $199,999 | 3,557 | 4.4% |
| $200,000+ | 3,315 | 4.1% |
Household Income by Householder Age in Fayetteville
The median household income in Fayetteville is $53,424, with the highest median household income of $61,279 found in the 45 to 64 years age bracket for the primary householder. A total of 23,640 households (29.2%) fall into this category. Meanwhile, the 15 to 24 years age bracket for the primary householder has the lowest median household income of $41,366, with 7,145 households (8.8%) in this group.
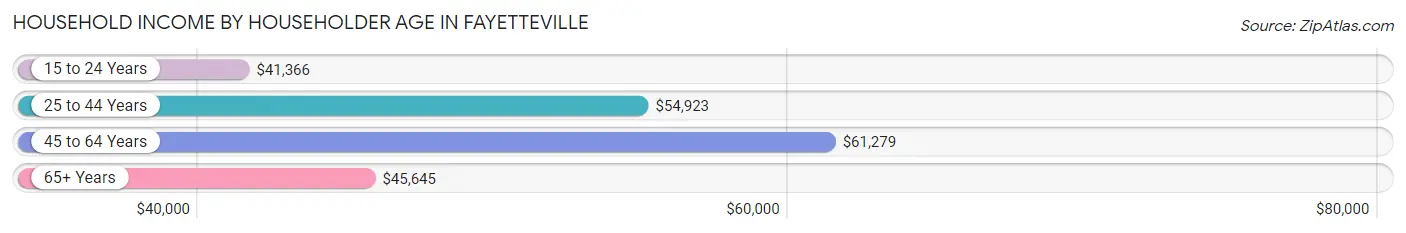
| Income Bracket | # Households | Median Income |
| 15 to 24 Years | 7,145 (8.8%) | $41,366 |
| 25 to 44 Years | 33,267 (41.1%) | $54,923 |
| 45 to 64 Years | 23,640 (29.2%) | $61,279 |
| 65+ Years | 16,800 (20.8%) | $45,645 |
| Total | 80,852 (100.0%) | $53,424 |
Poverty in Fayetteville
Income Below Poverty by Sex and Age in Fayetteville
With 16.5% poverty level for males and 20.9% for females among the residents of Fayetteville, 12 to 14 year old males and 12 to 14 year old females are the most vulnerable to poverty, with 974 males (28.7%) and 988 females (28.6%) in their respective age groups living below the poverty level.
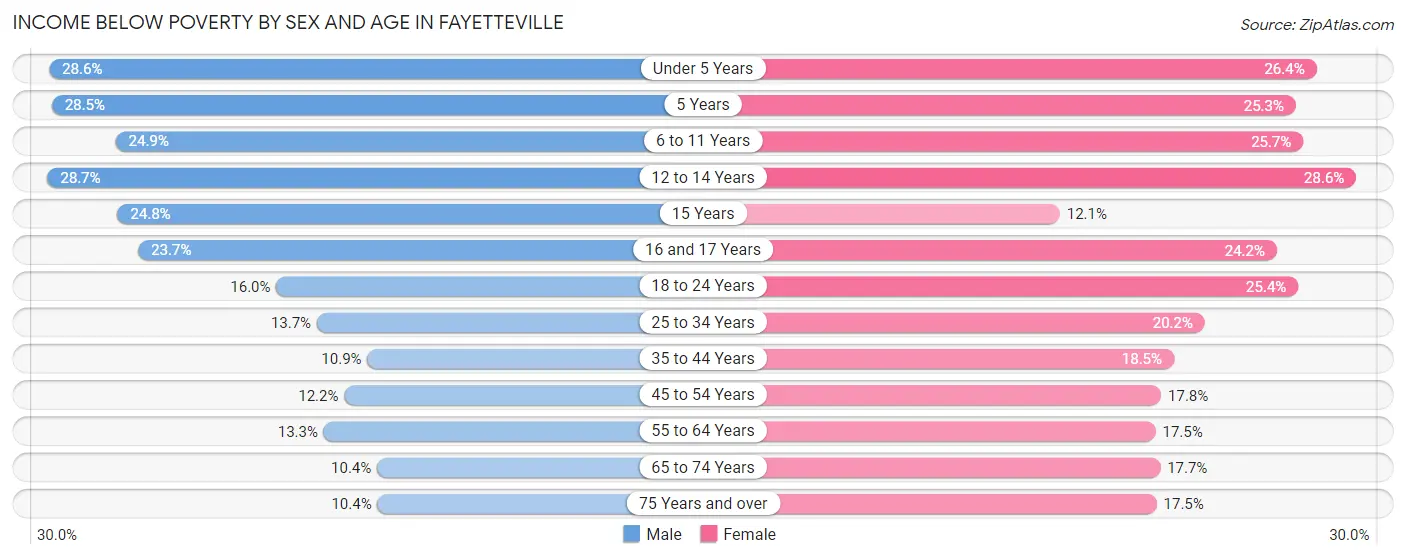
| Age Bracket | Male | Female |
| Under 5 Years | 2,212 (28.6%) | 2,107 (26.4%) |
| 5 Years | 496 (28.5%) | 356 (25.3%) |
| 6 to 11 Years | 1,966 (24.9%) | 2,057 (25.7%) |
| 12 to 14 Years | 974 (28.7%) | 988 (28.6%) |
| 15 Years | 300 (24.8%) | 140 (12.1%) |
| 16 and 17 Years | 546 (23.7%) | 520 (24.2%) |
| 18 to 24 Years | 1,712 (16.0%) | 2,522 (25.4%) |
| 25 to 34 Years | 2,557 (13.7%) | 3,611 (20.2%) |
| 35 to 44 Years | 1,260 (10.9%) | 2,275 (18.5%) |
| 45 to 54 Years | 1,021 (12.2%) | 1,807 (17.8%) |
| 55 to 64 Years | 1,226 (13.3%) | 1,915 (17.5%) |
| 65 to 74 Years | 701 (10.4%) | 1,482 (17.7%) |
| 75 Years and over | 408 (10.3%) | 1,140 (17.5%) |
| Total | 15,379 (16.5%) | 20,920 (20.9%) |
Income Above Poverty by Sex and Age in Fayetteville
According to the poverty statistics in Fayetteville, males aged 75 years and over and females aged 15 years are the age groups that are most secure financially, with 89.6% of males and 87.9% of females in these age groups living above the poverty line.
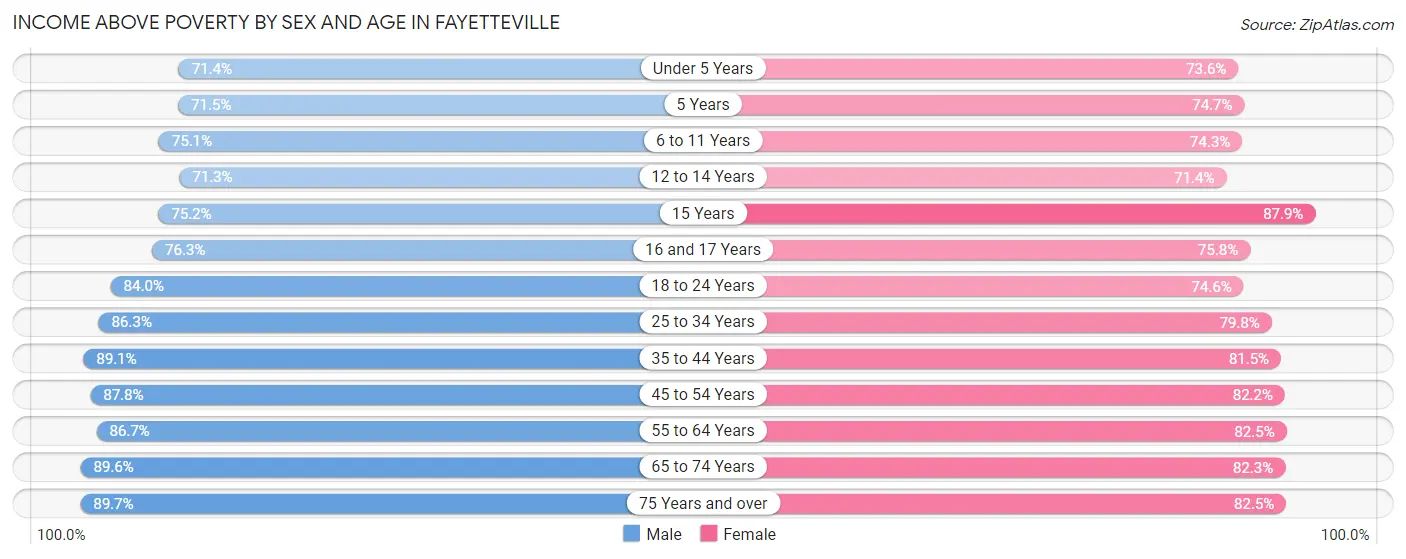
| Age Bracket | Male | Female |
| Under 5 Years | 5,515 (71.4%) | 5,865 (73.6%) |
| 5 Years | 1,245 (71.5%) | 1,052 (74.7%) |
| 6 to 11 Years | 5,919 (75.1%) | 5,951 (74.3%) |
| 12 to 14 Years | 2,416 (71.3%) | 2,462 (71.4%) |
| 15 Years | 908 (75.2%) | 1,013 (87.9%) |
| 16 and 17 Years | 1,760 (76.3%) | 1,627 (75.8%) |
| 18 to 24 Years | 9,002 (84.0%) | 7,405 (74.6%) |
| 25 to 34 Years | 16,074 (86.3%) | 14,253 (79.8%) |
| 35 to 44 Years | 10,286 (89.1%) | 10,029 (81.5%) |
| 45 to 54 Years | 7,351 (87.8%) | 8,357 (82.2%) |
| 55 to 64 Years | 7,963 (86.7%) | 9,044 (82.5%) |
| 65 to 74 Years | 6,058 (89.6%) | 6,875 (82.3%) |
| 75 Years and over | 3,535 (89.6%) | 5,364 (82.5%) |
| Total | 78,032 (83.5%) | 79,297 (79.1%) |
Income Below Poverty Among Married-Couple Families in Fayetteville
The poverty statistics for married-couple families in Fayetteville show that 6.9% or 2,079 of the total 30,075 families live below the poverty line. Families with 5 or more children have the highest poverty rate of 27.8%, comprising of 57 families. On the other hand, families with no children have the lowest poverty rate of 5.8%, which includes 1,025 families.
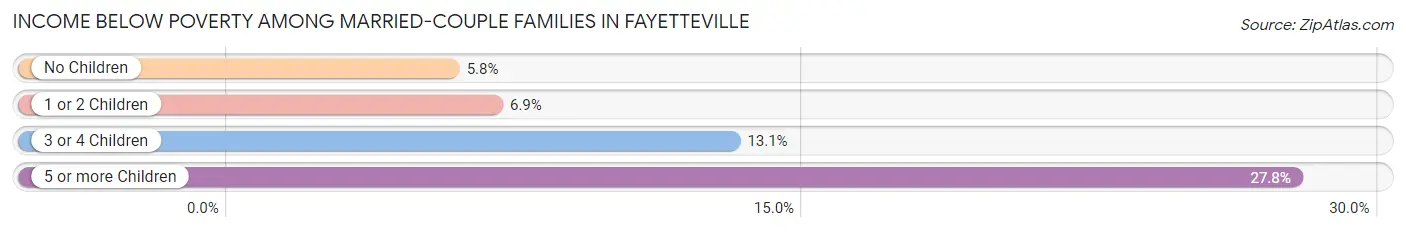
| Children | Above Poverty | Below Poverty |
| No Children | 16,671 (94.2%) | 1,025 (5.8%) |
| 1 or 2 Children | 9,012 (93.1%) | 670 (6.9%) |
| 3 or 4 Children | 2,165 (86.9%) | 327 (13.1%) |
| 5 or more Children | 148 (72.2%) | 57 (27.8%) |
| Total | 27,996 (93.1%) | 2,079 (6.9%) |
Income Below Poverty Among Single-Parent Households in Fayetteville
According to the poverty data in Fayetteville, 17.1% or 615 single-father households and 32.5% or 4,393 single-mother households are living below the poverty line. Among single-father households, those with 3 or 4 children have the highest poverty rate, with 106 households (29.6%) experiencing poverty. Likewise, among single-mother households, those with 5 or more children have the highest poverty rate, with 156 households (100.0%) falling below the poverty line.
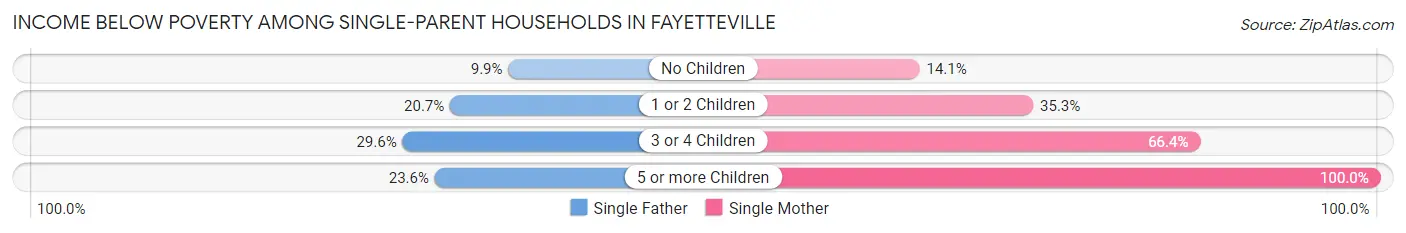
| Children | Single Father | Single Mother |
| No Children | 150 (9.9%) | 614 (14.1%) |
| 1 or 2 Children | 338 (20.7%) | 2,676 (35.3%) |
| 3 or 4 Children | 106 (29.6%) | 947 (66.4%) |
| 5 or more Children | 21 (23.6%) | 156 (100.0%) |
| Total | 615 (17.1%) | 4,393 (32.5%) |
Income Below Poverty Among Married-Couple vs Single-Parent Households in Fayetteville
The poverty data for Fayetteville shows that 2,079 of the married-couple family households (6.9%) and 5,008 of the single-parent households (29.3%) are living below the poverty level. Within the married-couple family households, those with 5 or more children have the highest poverty rate, with 57 households (27.8%) falling below the poverty line. Among the single-parent households, those with 5 or more children have the highest poverty rate, with 177 household (72.2%) living below poverty.
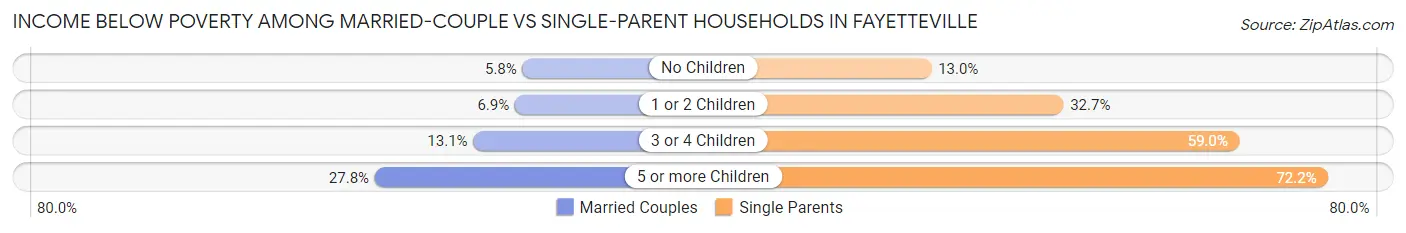
| Children | Married-Couple Families | Single-Parent Households |
| No Children | 1,025 (5.8%) | 764 (13.0%) |
| 1 or 2 Children | 670 (6.9%) | 3,014 (32.7%) |
| 3 or 4 Children | 327 (13.1%) | 1,053 (59.0%) |
| 5 or more Children | 57 (27.8%) | 177 (72.2%) |
| Total | 2,079 (6.9%) | 5,008 (29.3%) |
Race in Fayetteville
The most populous races in Fayetteville are Black / African American (88,538 | 42.4%), White / Caucasian (82,314 | 39.4%), and Hispanic or Latino (26,857 | 12.9%).
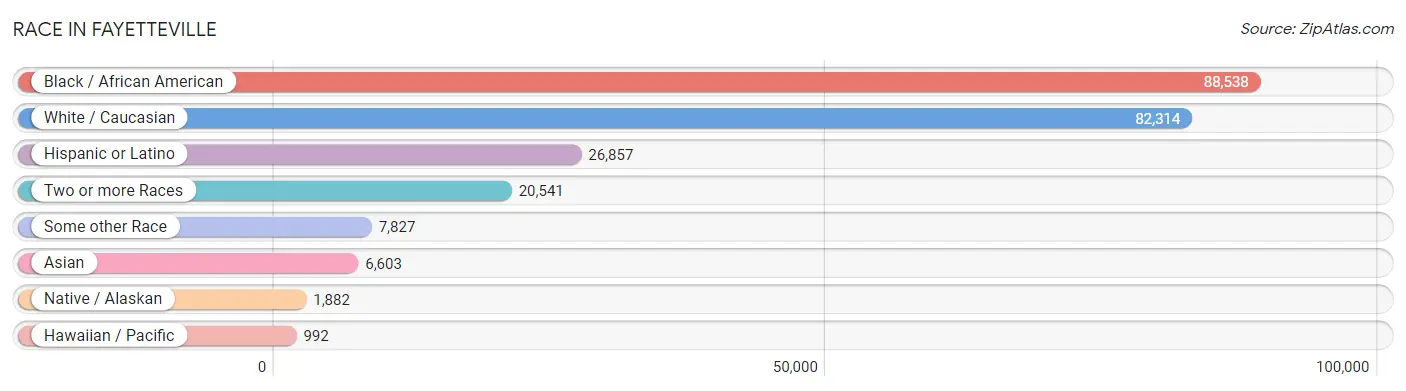
| Race | # Population | % Population |
| Asian | 6,603 | 3.2% |
| Black / African American | 88,538 | 42.4% |
| Hawaiian / Pacific | 992 | 0.5% |
| Hispanic or Latino | 26,857 | 12.9% |
| Native / Alaskan | 1,882 | 0.9% |
| White / Caucasian | 82,314 | 39.4% |
| Two or more Races | 20,541 | 9.8% |
| Some other Race | 7,827 | 3.7% |
| Total | 208,697 | 100.0% |
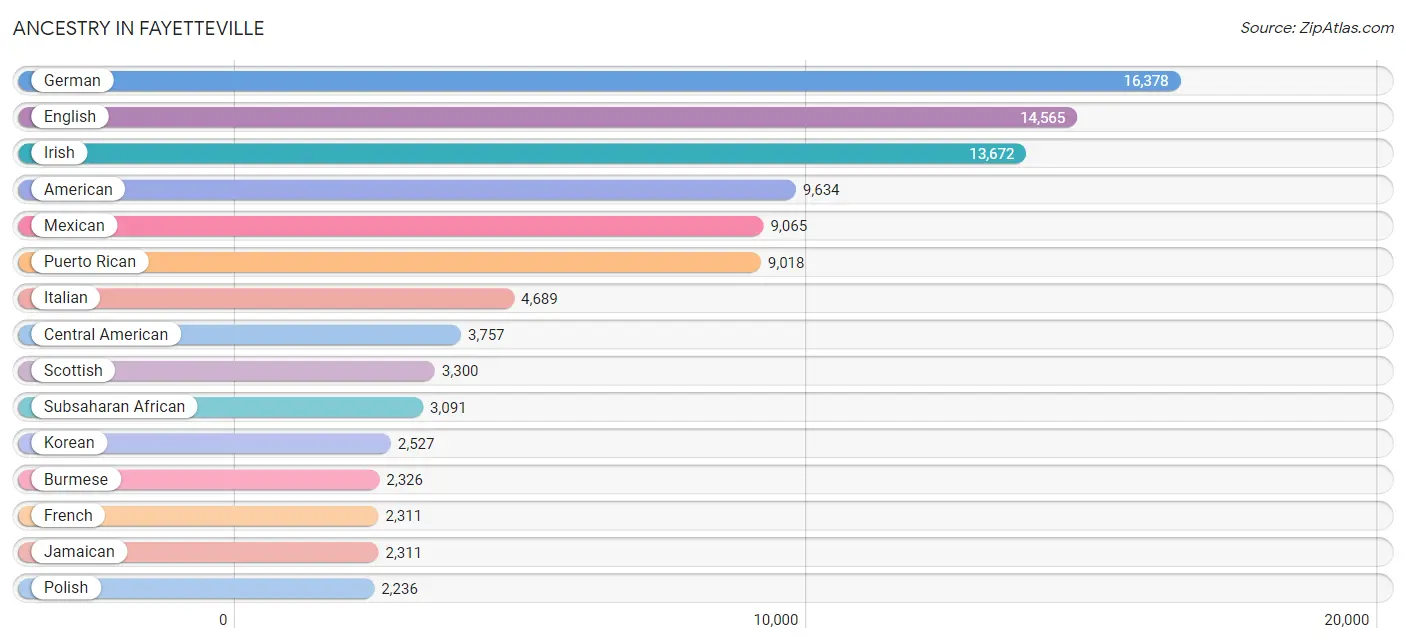
Ancestry in Fayetteville
The most populous ancestries reported in Fayetteville are German (16,378 | 7.9%), English (14,565 | 7.0%), Irish (13,672 | 6.6%), American (9,634 | 4.6%), and Mexican (9,065 | 4.3%), together accounting for 30.3% of all Fayetteville residents.
| Ancestry | # Population | % Population |
| Afghan | 27 | 0.0% |
| African | 1,587 | 0.8% |
| Albanian | 28 | 0.0% |
| American | 9,634 | 4.6% |
| Apache | 151 | 0.1% |
| Arab | 1,301 | 0.6% |
| Argentinean | 40 | 0.0% |
| Armenian | 70 | 0.0% |
| Assyrian / Chaldean / Syriac | 8 | 0.0% |
| Australian | 25 | 0.0% |
| Austrian | 240 | 0.1% |
| Bahamian | 75 | 0.0% |
| Barbadian | 162 | 0.1% |
| Belgian | 38 | 0.0% |
| Bermudan | 7 | 0.0% |
| Bhutanese | 793 | 0.4% |
| Blackfeet | 437 | 0.2% |
| Bolivian | 71 | 0.0% |
| Brazilian | 136 | 0.1% |
| British | 818 | 0.4% |
| British West Indian | 141 | 0.1% |
| Bulgarian | 91 | 0.0% |
| Burmese | 2,326 | 1.1% |
| Cajun | 51 | 0.0% |
| Cambodian | 69 | 0.0% |
| Canadian | 133 | 0.1% |
| Cape Verdean | 19 | 0.0% |
| Celtic | 27 | 0.0% |
| Central American | 3,757 | 1.8% |
| Central American Indian | 359 | 0.2% |
| Cherokee | 1,573 | 0.7% |
| Chickasaw | 119 | 0.1% |
| Chilean | 310 | 0.2% |
| Chippewa | 136 | 0.1% |
| Choctaw | 53 | 0.0% |
| Colombian | 758 | 0.4% |
| Comanche | 18 | 0.0% |
| Costa Rican | 146 | 0.1% |
| Creek | 19 | 0.0% |
| Croatian | 177 | 0.1% |
| Cuban | 692 | 0.3% |
| Czech | 286 | 0.1% |
| Czechoslovakian | 126 | 0.1% |
| Danish | 533 | 0.3% |
| Delaware | 11 | 0.0% |
| Dominican | 1,116 | 0.5% |
| Dutch | 894 | 0.4% |
| Dutch West Indian | 99 | 0.1% |
| Eastern European | 204 | 0.1% |
| Ecuadorian | 518 | 0.3% |
| Egyptian | 70 | 0.0% |
| English | 14,565 | 7.0% |
| Ethiopian | 188 | 0.1% |
| European | 2,128 | 1.0% |
| Filipino | 22 | 0.0% |
| Finnish | 231 | 0.1% |
| French | 2,311 | 1.1% |
| French American Indian | 23 | 0.0% |
| French Canadian | 407 | 0.2% |
| German | 16,378 | 7.9% |
| German Russian | 28 | 0.0% |
| Ghanaian | 414 | 0.2% |
| Greek | 472 | 0.2% |
| Guamanian / Chamorro | 559 | 0.3% |
| Guatemalan | 748 | 0.4% |
| Guyanese | 110 | 0.1% |
| Haitian | 703 | 0.3% |
| Honduran | 580 | 0.3% |
| Hungarian | 455 | 0.2% |
| Icelander | 10 | 0.0% |
| Indian (Asian) | 864 | 0.4% |
| Indonesian | 76 | 0.0% |
| Inupiat | 32 | 0.0% |
| Iranian | 83 | 0.0% |
| Iraqi | 218 | 0.1% |
| Irish | 13,672 | 6.6% |
| Iroquois | 100 | 0.1% |
| Israeli | 70 | 0.0% |
| Italian | 4,689 | 2.2% |
| Jamaican | 2,311 | 1.1% |
| Japanese | 32 | 0.0% |
| Kenyan | 73 | 0.0% |
| Korean | 2,527 | 1.2% |
| Laotian | 53 | 0.0% |
| Latvian | 15 | 0.0% |
| Lebanese | 151 | 0.1% |
| Liberian | 17 | 0.0% |
| Lithuanian | 46 | 0.0% |
| Lumbee | 1,472 | 0.7% |
| Macedonian | 17 | 0.0% |
| Malaysian | 125 | 0.1% |
| Marshallese | 5 | 0.0% |
| Mexican | 9,065 | 4.3% |
| Mexican American Indian | 109 | 0.1% |
| Moroccan | 232 | 0.1% |
| Native Hawaiian | 463 | 0.2% |
| Navajo | 97 | 0.1% |
| Nepalese | 4 | 0.0% |
| New Zealander | 42 | 0.0% |
| Nicaraguan | 109 | 0.1% |
| Nigerian | 310 | 0.2% |
| Northern European | 213 | 0.1% |
| Norwegian | 733 | 0.4% |
| Pakistani | 421 | 0.2% |
| Palestinian | 15 | 0.0% |
| Panamanian | 1,543 | 0.7% |
| Paraguayan | 16 | 0.0% |
| Pennsylvania German | 61 | 0.0% |
| Peruvian | 306 | 0.2% |
| Polish | 2,236 | 1.1% |
| Portuguese | 410 | 0.2% |
| Puerto Rican | 9,018 | 4.3% |
| Romanian | 103 | 0.1% |
| Russian | 705 | 0.3% |
| Salvadoran | 631 | 0.3% |
| Samoan | 162 | 0.1% |
| Scandinavian | 504 | 0.2% |
| Scotch-Irish | 2,015 | 1.0% |
| Scottish | 3,300 | 1.6% |
| Seminole | 4 | 0.0% |
| Serbian | 21 | 0.0% |
| Shoshone | 4 | 0.0% |
| Sierra Leonean | 19 | 0.0% |
| Sioux | 111 | 0.1% |
| Slavic | 52 | 0.0% |
| Slovak | 122 | 0.1% |
| Slovene | 12 | 0.0% |
| Somali | 6 | 0.0% |
| South African | 27 | 0.0% |
| South American | 2,144 | 1.0% |
| Spaniard | 463 | 0.2% |
| Spanish | 181 | 0.1% |
| Sri Lankan | 1,019 | 0.5% |
| Subsaharan African | 3,091 | 1.5% |
| Sudanese | 139 | 0.1% |
| Swedish | 1,034 | 0.5% |
| Swiss | 251 | 0.1% |
| Syrian | 39 | 0.0% |
| Thai | 1,258 | 0.6% |
| Tohono O'Odham | 19 | 0.0% |
| Tongan | 26 | 0.0% |
| Trinidadian and Tobagonian | 326 | 0.2% |
| Turkish | 226 | 0.1% |
| U.S. Virgin Islander | 10 | 0.0% |
| Ukrainian | 156 | 0.1% |
| Ute | 46 | 0.0% |
| Venezuelan | 125 | 0.1% |
| Vietnamese | 11 | 0.0% |
| Welsh | 857 | 0.4% |
| West Indian | 331 | 0.2% |
| Yaqui | 15 | 0.0% |
| Yugoslavian | 43 | 0.0% |
| Zimbabwean | 10 | 0.0% | View All 153 Rows |
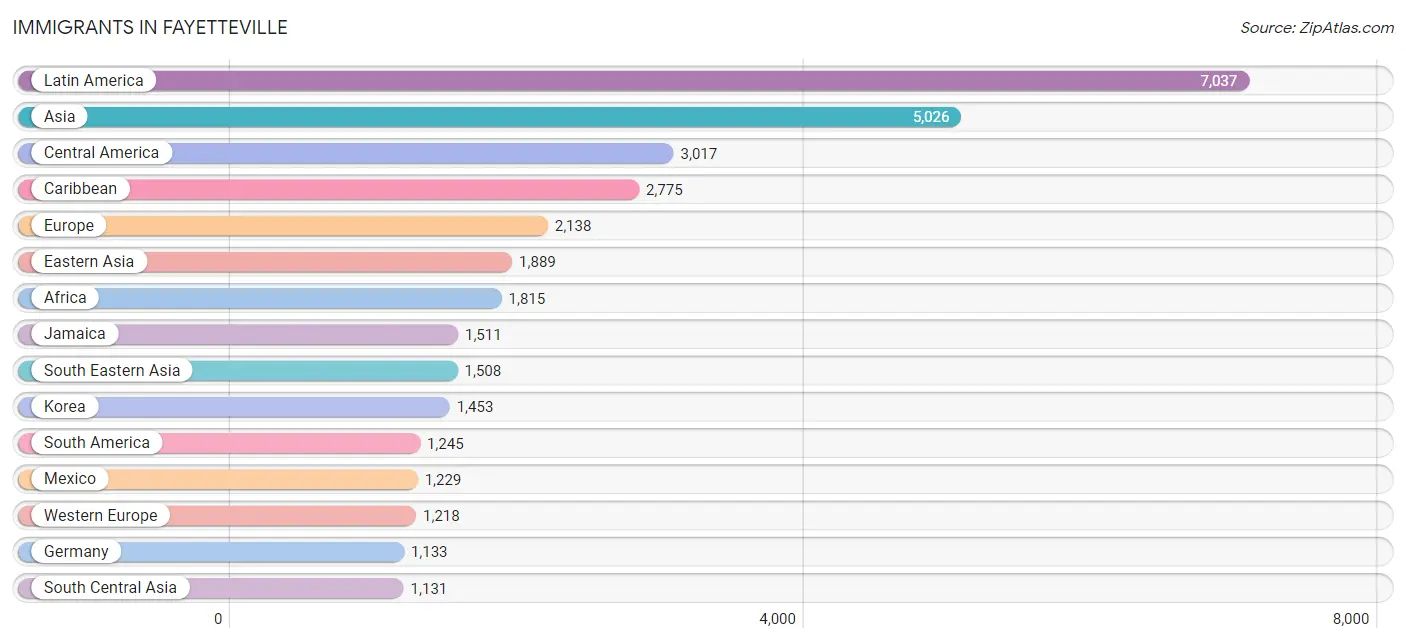
Immigrants in Fayetteville
The most numerous immigrant groups reported in Fayetteville came from Latin America (7,037 | 3.4%), Asia (5,026 | 2.4%), Central America (3,017 | 1.5%), Caribbean (2,775 | 1.3%), and Europe (2,138 | 1.0%), together accounting for 9.6% of all Fayetteville residents.
| Immigration Origin | # Population | % Population |
| Afghanistan | 27 | 0.0% |
| Africa | 1,815 | 0.9% |
| Albania | 11 | 0.0% |
| Argentina | 14 | 0.0% |
| Asia | 5,026 | 2.4% |
| Austria | 11 | 0.0% |
| Bahamas | 64 | 0.0% |
| Bangladesh | 78 | 0.0% |
| Barbados | 151 | 0.1% |
| Bolivia | 38 | 0.0% |
| Brazil | 112 | 0.1% |
| Bulgaria | 39 | 0.0% |
| Cabo Verde | 7 | 0.0% |
| Cambodia | 11 | 0.0% |
| Cameroon | 109 | 0.1% |
| Canada | 129 | 0.1% |
| Caribbean | 2,775 | 1.3% |
| Central America | 3,017 | 1.5% |
| Chile | 109 | 0.1% |
| China | 175 | 0.1% |
| Colombia | 430 | 0.2% |
| Costa Rica | 100 | 0.1% |
| Cuba | 87 | 0.0% |
| Czechoslovakia | 42 | 0.0% |
| Dominica | 10 | 0.0% |
| Dominican Republic | 405 | 0.2% |
| Eastern Africa | 297 | 0.1% |
| Eastern Asia | 1,889 | 0.9% |
| Eastern Europe | 467 | 0.2% |
| Ecuador | 135 | 0.1% |
| Egypt | 41 | 0.0% |
| El Salvador | 323 | 0.2% |
| England | 146 | 0.1% |
| Eritrea | 20 | 0.0% |
| Ethiopia | 65 | 0.0% |
| Europe | 2,138 | 1.0% |
| Fiji | 9 | 0.0% |
| France | 49 | 0.0% |
| Germany | 1,133 | 0.5% |
| Ghana | 515 | 0.3% |
| Greece | 93 | 0.0% |
| Grenada | 77 | 0.0% |
| Guatemala | 330 | 0.2% |
| Guyana | 139 | 0.1% |
| Haiti | 223 | 0.1% |
| Honduras | 293 | 0.1% |
| Hong Kong | 15 | 0.0% |
| Hungary | 41 | 0.0% |
| India | 654 | 0.3% |
| Indonesia | 9 | 0.0% |
| Iraq | 215 | 0.1% |
| Ireland | 6 | 0.0% |
| Italy | 43 | 0.0% |
| Jamaica | 1,511 | 0.7% |
| Japan | 208 | 0.1% |
| Kazakhstan | 46 | 0.0% |
| Kenya | 99 | 0.1% |
| Korea | 1,453 | 0.7% |
| Laos | 3 | 0.0% |
| Latin America | 7,037 | 3.4% |
| Lebanon | 45 | 0.0% |
| Liberia | 61 | 0.0% |
| Malaysia | 20 | 0.0% |
| Mexico | 1,229 | 0.6% |
| Micronesia | 89 | 0.0% |
| Middle Africa | 137 | 0.1% |
| Morocco | 47 | 0.0% |
| Nepal | 190 | 0.1% |
| Netherlands | 25 | 0.0% |
| Nicaragua | 22 | 0.0% |
| Nigeria | 246 | 0.1% |
| Northern Africa | 145 | 0.1% |
| Northern Europe | 295 | 0.1% |
| Norway | 16 | 0.0% |
| Oceania | 273 | 0.1% |
| Pakistan | 106 | 0.1% |
| Panama | 720 | 0.3% |
| Peru | 155 | 0.1% |
| Philippines | 855 | 0.4% |
| Poland | 66 | 0.0% |
| Romania | 34 | 0.0% |
| Russia | 130 | 0.1% |
| Saudi Arabia | 13 | 0.0% |
| Scotland | 23 | 0.0% |
| Serbia | 8 | 0.0% |
| Sierra Leone | 19 | 0.0% |
| Somalia | 27 | 0.0% |
| South Africa | 16 | 0.0% |
| South America | 1,245 | 0.6% |
| South Central Asia | 1,131 | 0.5% |
| South Eastern Asia | 1,508 | 0.7% |
| Southern Europe | 158 | 0.1% |
| Spain | 22 | 0.0% |
| Sudan | 20 | 0.0% |
| Taiwan | 9 | 0.0% |
| Thailand | 208 | 0.1% |
| Trinidad and Tobago | 189 | 0.1% |
| Turkey | 61 | 0.0% |
| Ukraine | 61 | 0.0% |
| Uzbekistan | 6 | 0.0% |
| Venezuela | 113 | 0.1% |
| Vietnam | 380 | 0.2% |
| Western Africa | 1,107 | 0.5% |
| Western Asia | 474 | 0.2% |
| Western Europe | 1,218 | 0.6% |
| Yemen | 121 | 0.1% |
| Zimbabwe | 60 | 0.0% | View All 107 Rows |
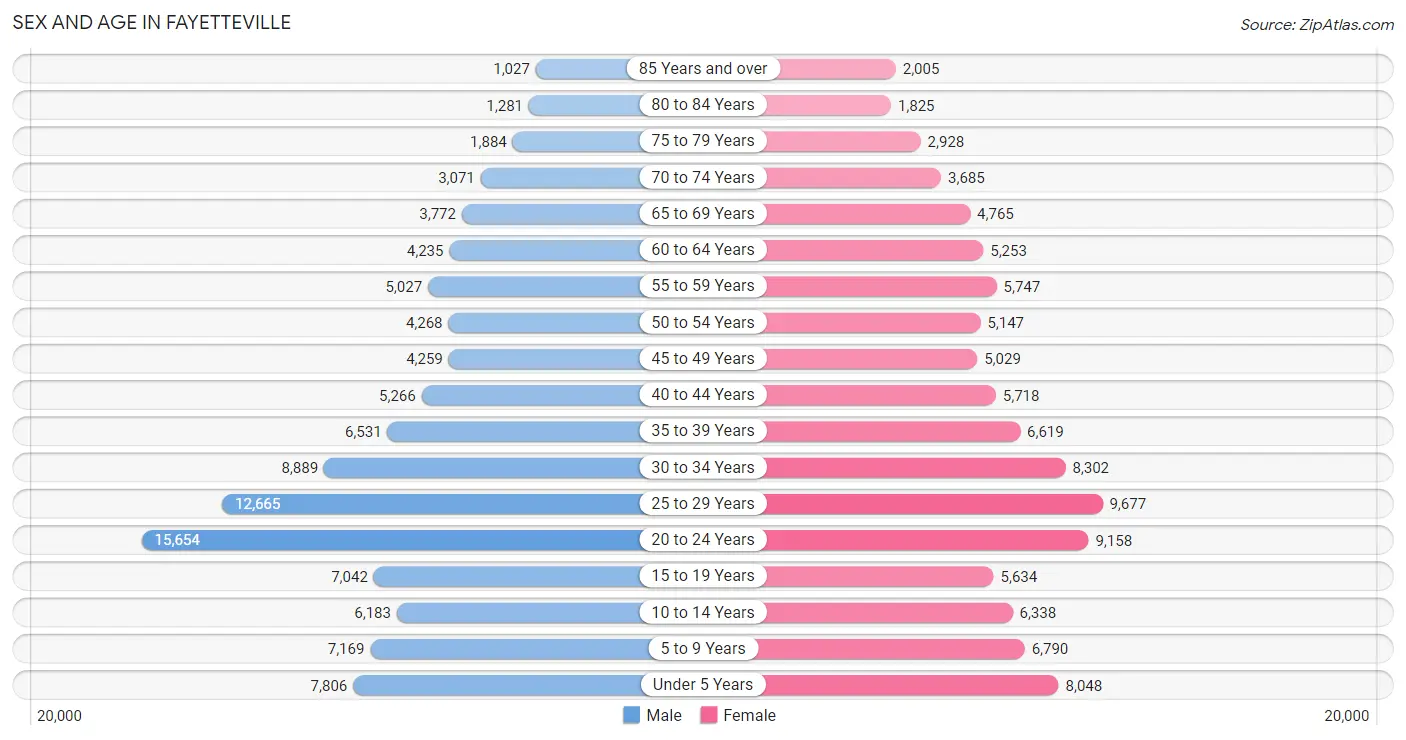
Sex and Age in Fayetteville
Sex and Age in Fayetteville
The most populous age groups in Fayetteville are 20 to 24 Years (15,654 | 14.8%) for men and 25 to 29 Years (9,677 | 9.4%) for women.
| Age Bracket | Male | Female |
| Under 5 Years | 7,806 (7.4%) | 8,048 (7.8%) |
| 5 to 9 Years | 7,169 (6.8%) | 6,790 (6.6%) |
| 10 to 14 Years | 6,183 (5.8%) | 6,338 (6.2%) |
| 15 to 19 Years | 7,042 (6.6%) | 5,634 (5.5%) |
| 20 to 24 Years | 15,654 (14.8%) | 9,158 (8.9%) |
| 25 to 29 Years | 12,665 (11.9%) | 9,677 (9.4%) |
| 30 to 34 Years | 8,889 (8.4%) | 8,302 (8.1%) |
| 35 to 39 Years | 6,531 (6.2%) | 6,619 (6.5%) |
| 40 to 44 Years | 5,266 (5.0%) | 5,718 (5.6%) |
| 45 to 49 Years | 4,259 (4.0%) | 5,029 (4.9%) |
| 50 to 54 Years | 4,268 (4.0%) | 5,147 (5.0%) |
| 55 to 59 Years | 5,027 (4.7%) | 5,747 (5.6%) |
| 60 to 64 Years | 4,235 (4.0%) | 5,253 (5.1%) |
| 65 to 69 Years | 3,772 (3.6%) | 4,765 (4.6%) |
| 70 to 74 Years | 3,071 (2.9%) | 3,685 (3.6%) |
| 75 to 79 Years | 1,884 (1.8%) | 2,928 (2.9%) |
| 80 to 84 Years | 1,281 (1.2%) | 1,825 (1.8%) |
| 85 Years and over | 1,027 (1.0%) | 2,005 (1.9%) |
| Total | 106,029 (100.0%) | 102,668 (100.0%) |
Families and Households in Fayetteville
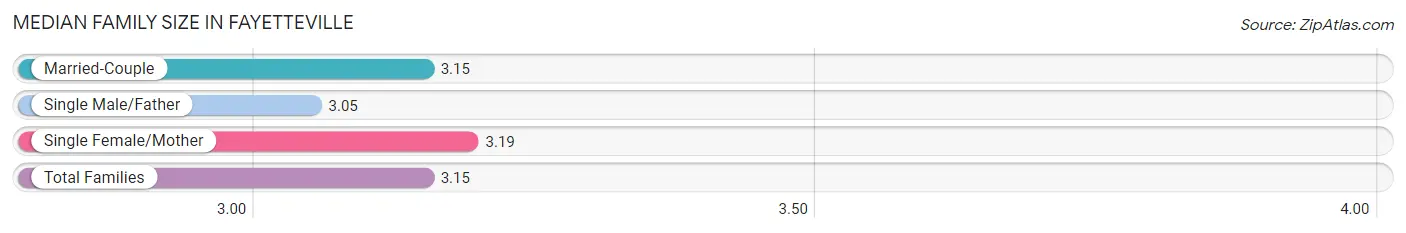
Median Family Size in Fayetteville
The median family size in Fayetteville is 3.15 persons per family, with single female/mother families (13,506 | 28.6%) accounting for the largest median family size of 3.19 persons per family. On the other hand, single male/father families (3,594 | 7.6%) represent the smallest median family size with 3.05 persons per family.
| Family Type | # Families | Family Size |
| Married-Couple | 30,075 (63.7%) | 3.15 |
| Single Male/Father | 3,594 (7.6%) | 3.05 |
| Single Female/Mother | 13,506 (28.6%) | 3.19 |
| Total Families | 47,175 (100.0%) | 3.15 |
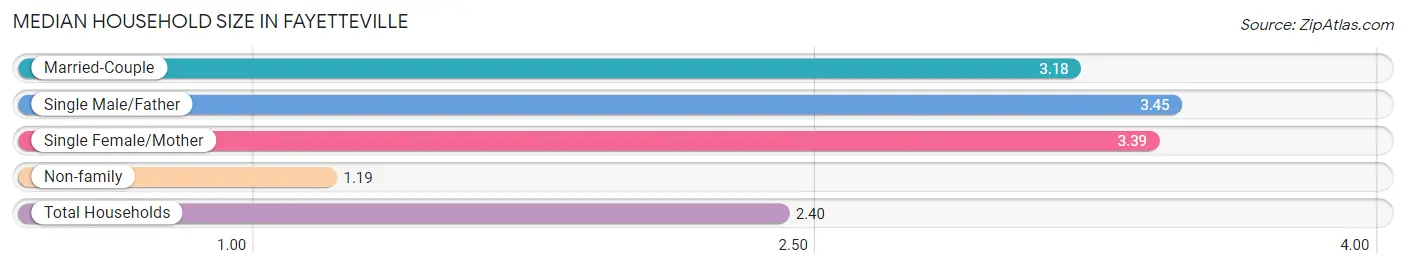
Median Household Size in Fayetteville
The median household size in Fayetteville is 2.40 persons per household, with single male/father households (3,594 | 4.4%) accounting for the largest median household size of 3.45 persons per household. non-family households (33,677 | 41.6%) represent the smallest median household size with 1.19 persons per household.
| Household Type | # Households | Household Size |
| Married-Couple | 30,075 (37.2%) | 3.18 |
| Single Male/Father | 3,594 (4.4%) | 3.45 |
| Single Female/Mother | 13,506 (16.7%) | 3.39 |
| Non-family | 33,677 (41.6%) | 1.19 |
| Total Households | 80,852 (100.0%) | 2.40 |
Household Size by Marriage Status in Fayetteville
Out of a total of 80,852 households in Fayetteville, 47,175 (58.4%) are family households, while 33,677 (41.6%) are nonfamily households. The most numerous type of family households are 2-person households, comprising 21,611, and the most common type of nonfamily households are 1-person households, comprising 28,755.
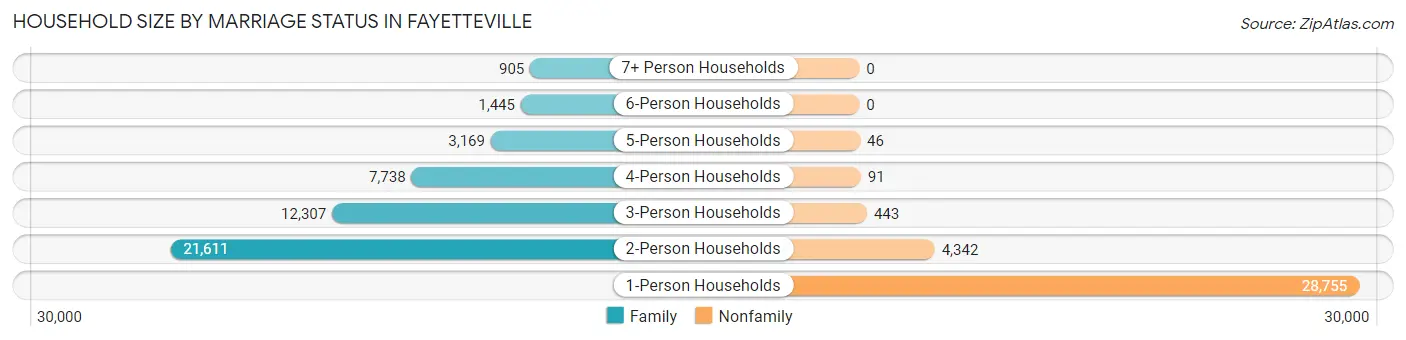
| Household Size | Family Households | Nonfamily Households |
| 1-Person Households | - | 28,755 (35.6%) |
| 2-Person Households | 21,611 (26.7%) | 4,342 (5.4%) |
| 3-Person Households | 12,307 (15.2%) | 443 (0.5%) |
| 4-Person Households | 7,738 (9.6%) | 91 (0.1%) |
| 5-Person Households | 3,169 (3.9%) | 46 (0.1%) |
| 6-Person Households | 1,445 (1.8%) | 0 (0.0%) |
| 7+ Person Households | 905 (1.1%) | 0 (0.0%) |
| Total | 47,175 (58.4%) | 33,677 (41.6%) |
Female Fertility in Fayetteville
Fertility by Age in Fayetteville
Average fertility rate in Fayetteville is 61.0 births per 1,000 women. Women in the age bracket of 20 to 34 years have the highest fertility rate with 98.0 births per 1,000 women. Women in the age bracket of 20 to 34 years acount for 84.8% of all women with births.
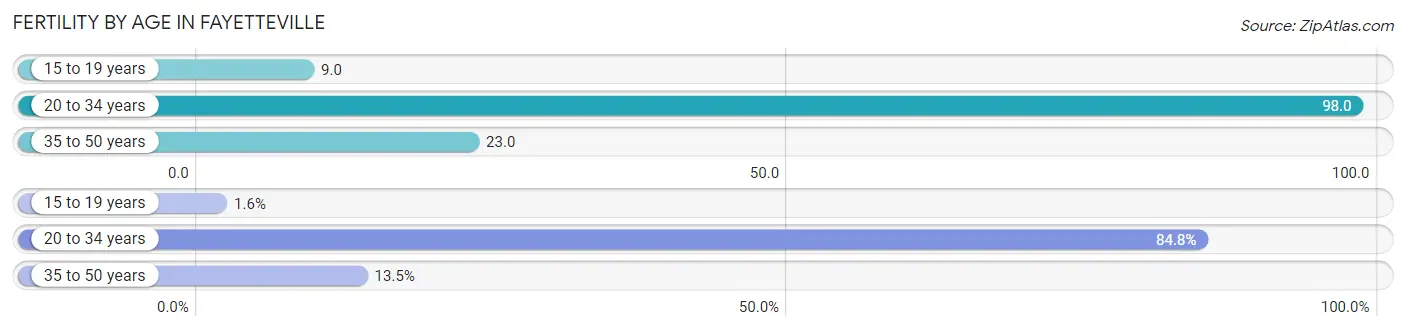
| Age Bracket | Women with Births | Births / 1,000 Women |
| 15 to 19 years | 51 (1.6%) | 9.0 |
| 20 to 34 years | 2,670 (84.8%) | 98.0 |
| 35 to 50 years | 426 (13.5%) | 23.0 |
| Total | 3,147 (100.0%) | 61.0 |
Fertility by Age by Marriage Status in Fayetteville
67.2% of women with births (3,147) in Fayetteville are married. The highest percentage of unmarried women with births falls into 20 to 34 years age bracket with 35.7% of them unmarried at the time of birth, while the lowest percentage of unmarried women with births belong to 15 to 19 years age bracket with 13.7% of them unmarried.
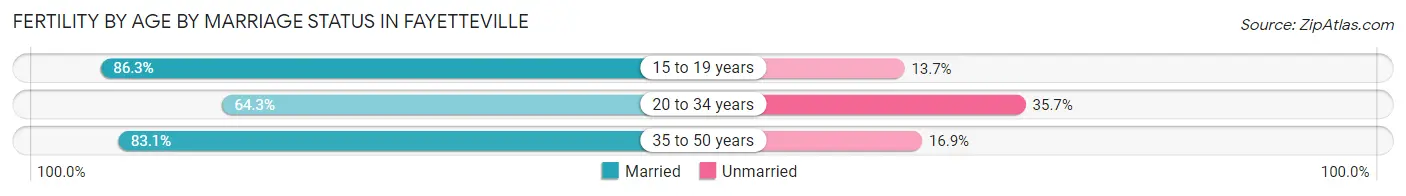
| Age Bracket | Married | Unmarried |
| 15 to 19 years | 44 (86.3%) | 7 (13.7%) |
| 20 to 34 years | 1,717 (64.3%) | 953 (35.7%) |
| 35 to 50 years | 354 (83.1%) | 72 (16.9%) |
| Total | 2,115 (67.2%) | 1,032 (32.8%) |
Fertility by Education in Fayetteville
Average fertility rate in Fayetteville is 61.0 births per 1,000 women. Women with the education attainment of college or associate's degree have the highest fertility rate of 76.0 births per 1,000 women, while women with the education attainment of less than high school have the lowest fertility at 25.0 births per 1,000 women. Women with the education attainment of college or associate's degree represent 51.2% of all women with births.
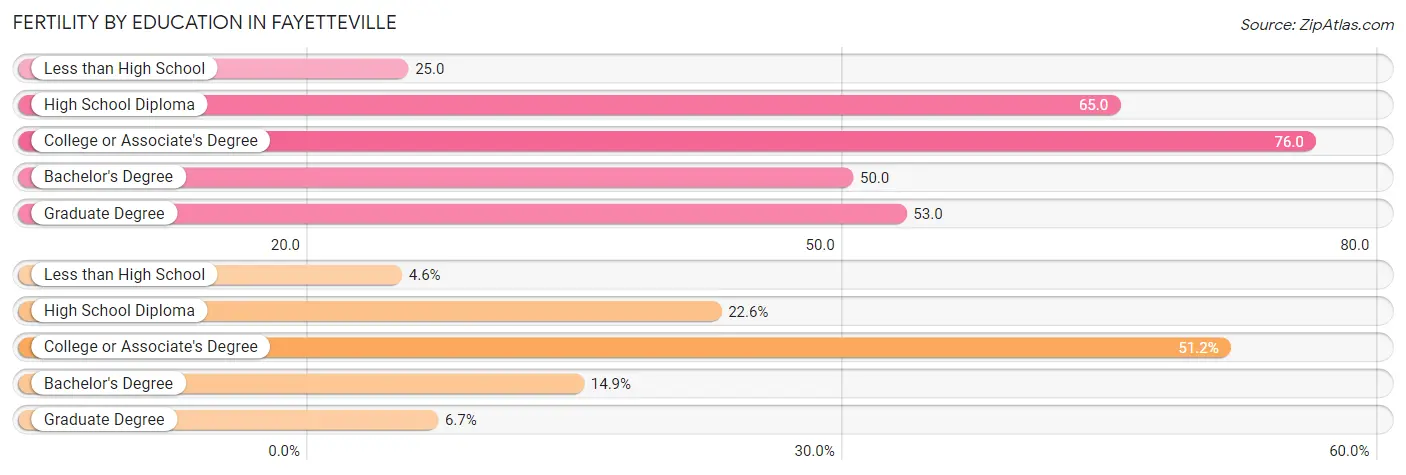
| Educational Attainment | Women with Births | Births / 1,000 Women |
| Less than High School | 146 (4.6%) | 25.0 |
| High School Diploma | 711 (22.6%) | 65.0 |
| College or Associate's Degree | 1,612 (51.2%) | 76.0 |
| Bachelor's Degree | 468 (14.9%) | 50.0 |
| Graduate Degree | 210 (6.7%) | 53.0 |
| Total | 3,147 (100.0%) | 61.0 |
Fertility by Education by Marriage Status in Fayetteville
32.8% of women with births in Fayetteville are unmarried. Women with the educational attainment of graduate degree are most likely to be married with 95.2% of them married at childbirth, while women with the educational attainment of high school diploma are least likely to be married with 51.6% of them unmarried at childbirth.
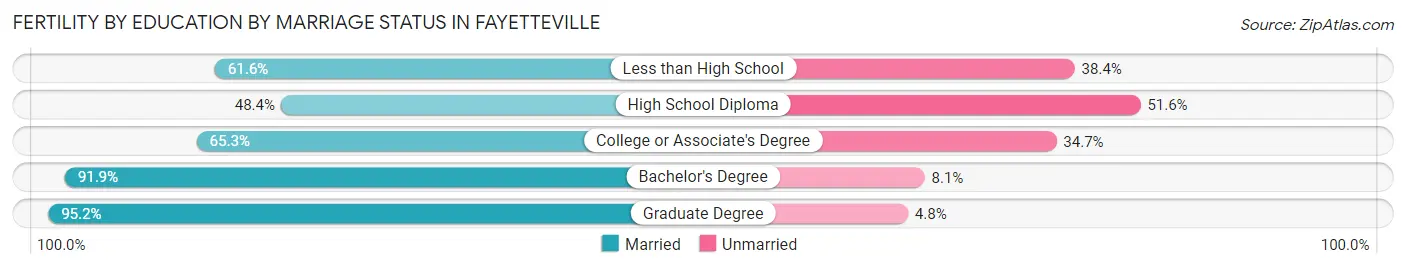
| Educational Attainment | Married | Unmarried |
| Less than High School | 90 (61.6%) | 56 (38.4%) |
| High School Diploma | 344 (48.4%) | 367 (51.6%) |
| College or Associate's Degree | 1,053 (65.3%) | 559 (34.7%) |
| Bachelor's Degree | 430 (91.9%) | 38 (8.1%) |
| Graduate Degree | 200 (95.2%) | 10 (4.8%) |
| Total | 2,115 (67.2%) | 1,032 (32.8%) |
Employment Characteristics in Fayetteville
Employment by Class of Employer in Fayetteville
Among the 100,261 employed individuals in Fayetteville, private company employees (48,426 | 48.3%), federal government employees (32,967 | 32.9%), and local government employees (4,916 | 4.9%) make up the most common classes of employment.
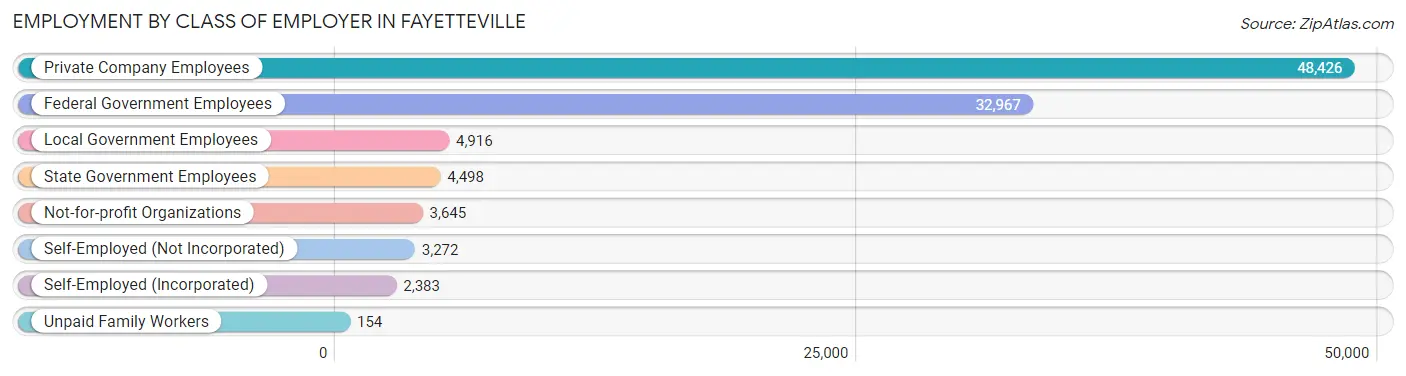
| Employer Class | # Employees | % Employees |
| Private Company Employees | 48,426 | 48.3% |
| Self-Employed (Incorporated) | 2,383 | 2.4% |
| Self-Employed (Not Incorporated) | 3,272 | 3.3% |
| Not-for-profit Organizations | 3,645 | 3.6% |
| Local Government Employees | 4,916 | 4.9% |
| State Government Employees | 4,498 | 4.5% |
| Federal Government Employees | 32,967 | 32.9% |
| Unpaid Family Workers | 154 | 0.2% |
| Total | 100,261 | 100.0% |
Employment Status by Age in Fayetteville
According to the labor force statistics for Fayetteville, out of the total population over 16 years of age (163,990), 66.4% or 108,889 individuals are in the labor force, with 8.4% or 9,147 of them unemployed. The age group with the highest labor force participation rate is 25 to 29 years, with 84.9% or 18,968 individuals in the labor force. Within the labor force, the 16 to 19 years age range has the highest percentage of unemployed individuals, with 18.6% or 828 of them being unemployed.
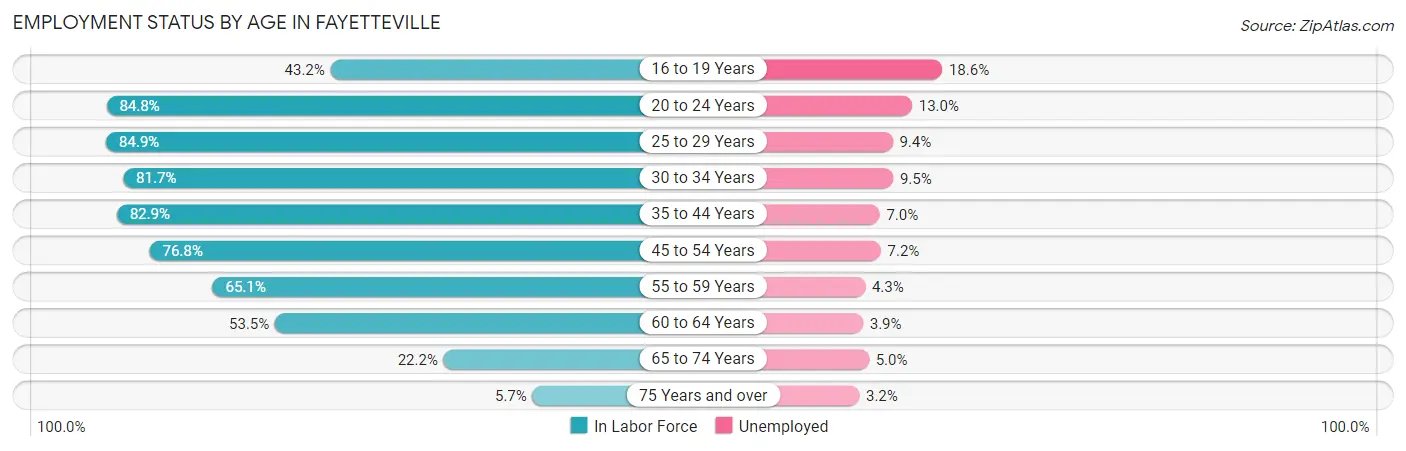
| Age Bracket | In Labor Force | Unemployed |
| 16 to 19 Years | 4,451 (43.2%) | 828 (18.6%) |
| 20 to 24 Years | 21,041 (84.8%) | 2,735 (13.0%) |
| 25 to 29 Years | 18,968 (84.9%) | 1,783 (9.4%) |
| 30 to 34 Years | 14,045 (81.7%) | 1,334 (9.5%) |
| 35 to 44 Years | 20,007 (82.9%) | 1,400 (7.0%) |
| 45 to 54 Years | 14,364 (76.8%) | 1,034 (7.2%) |
| 55 to 59 Years | 7,014 (65.1%) | 302 (4.3%) |
| 60 to 64 Years | 5,076 (53.5%) | 198 (3.9%) |
| 65 to 74 Years | 3,395 (22.2%) | 170 (5.0%) |
| 75 Years and over | 624 (5.7%) | 20 (3.2%) |
| Total | 108,889 (66.4%) | 9,147 (8.4%) |
Employment Status by Educational Attainment in Fayetteville
According to labor force statistics for Fayetteville, 77.4% of individuals (79,437) out of the total population between 25 and 64 years of age (102,632) are in the labor force, with 7.4% or 5,878 of them being unemployed. The group with the highest labor force participation rate are those with the educational attainment of bachelor's degree or higher, with 85.6% or 25,614 individuals in the labor force. Within the labor force, individuals with less than high school education have the highest percentage of unemployment, with 15.6% or 538 of them being unemployed.
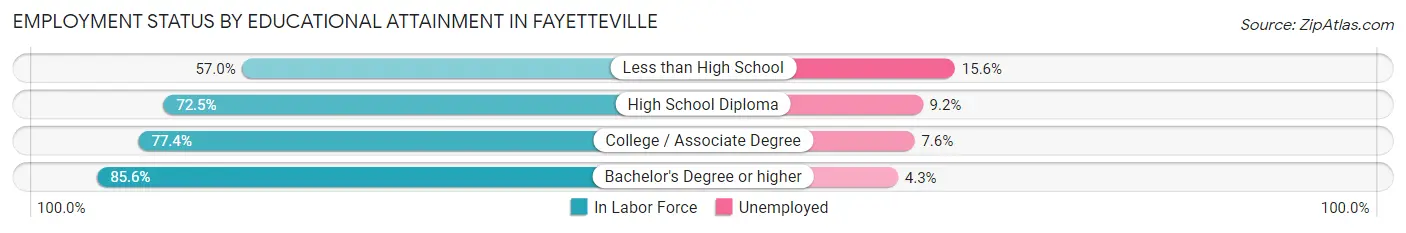
| Educational Attainment | In Labor Force | Unemployed |
| Less than High School | 3,448 (57.0%) | 944 (15.6%) |
| High School Diploma | 17,855 (72.5%) | 2,266 (9.2%) |
| College / Associate Degree | 32,534 (77.4%) | 3,195 (7.6%) |
| Bachelor's Degree or higher | 25,614 (85.6%) | 1,287 (4.3%) |
| Total | 79,437 (77.4%) | 7,595 (7.4%) |
Employment Occupations by Sex in Fayetteville
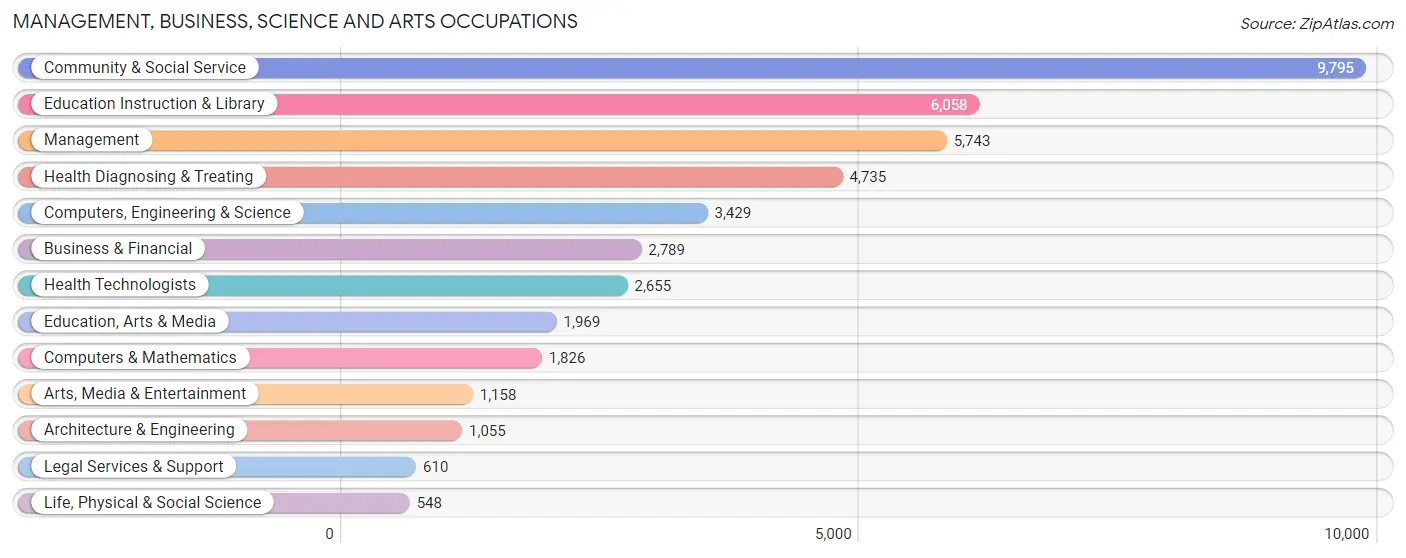
Management, Business, Science and Arts Occupations
The most common Management, Business, Science and Arts occupations in Fayetteville are Community & Social Service (9,795 | 12.9%), Education Instruction & Library (6,058 | 8.0%), Management (5,743 | 7.6%), Health Diagnosing & Treating (4,735 | 6.2%), and Computers, Engineering & Science (3,429 | 4.5%).
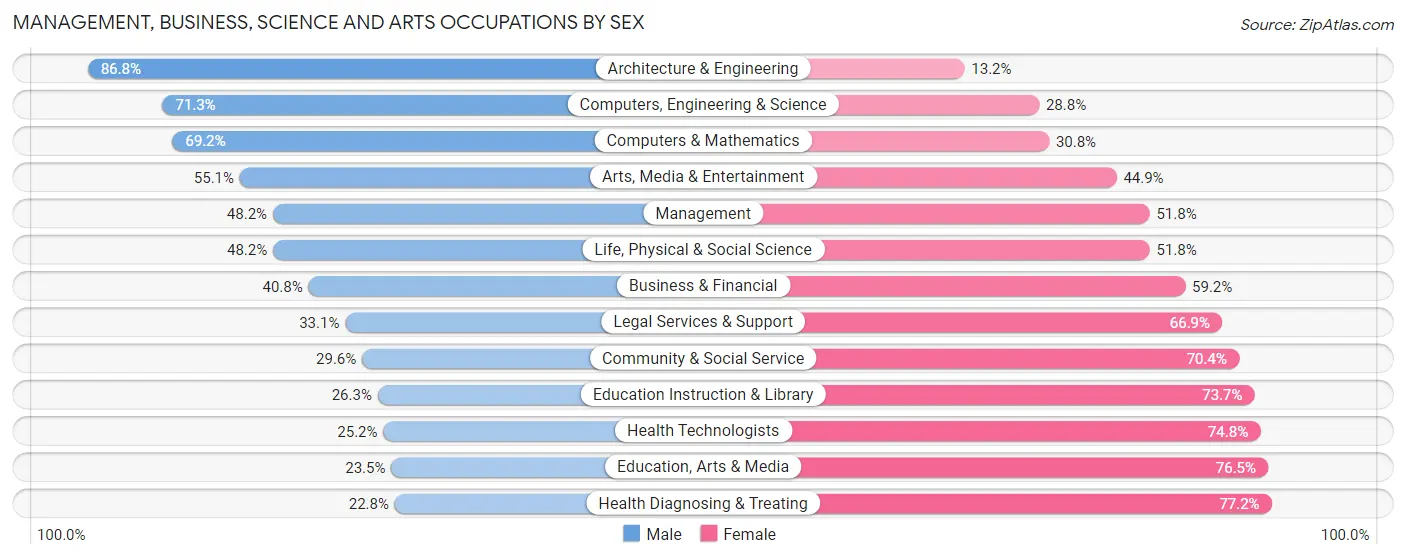
Management, Business, Science and Arts Occupations by Sex
Within the Management, Business, Science and Arts occupations in Fayetteville, the most male-oriented occupations are Architecture & Engineering (86.8%), Computers, Engineering & Science (71.3%), and Computers & Mathematics (69.2%), while the most female-oriented occupations are Health Diagnosing & Treating (77.2%), Education, Arts & Media (76.5%), and Health Technologists (74.8%).
| Occupation | Male | Female |
| Management | 2,768 (48.2%) | 2,975 (51.8%) |
| Business & Financial | 1,137 (40.8%) | 1,652 (59.2%) |
| Computers, Engineering & Science | 2,443 (71.3%) | 986 (28.7%) |
| Computers & Mathematics | 1,263 (69.2%) | 563 (30.8%) |
| Architecture & Engineering | 916 (86.8%) | 139 (13.2%) |
| Life, Physical & Social Science | 264 (48.2%) | 284 (51.8%) |
| Community & Social Service | 2,898 (29.6%) | 6,897 (70.4%) |
| Education, Arts & Media | 463 (23.5%) | 1,506 (76.5%) |
| Legal Services & Support | 202 (33.1%) | 408 (66.9%) |
| Education Instruction & Library | 1,595 (26.3%) | 4,463 (73.7%) |
| Arts, Media & Entertainment | 638 (55.1%) | 520 (44.9%) |
| Health Diagnosing & Treating | 1,078 (22.8%) | 3,657 (77.2%) |
| Health Technologists | 668 (25.2%) | 1,987 (74.8%) |
| Total (Category) | 10,324 (39.0%) | 16,167 (61.0%) |
| Total (Overall) | 35,109 (46.3%) | 40,719 (53.7%) |
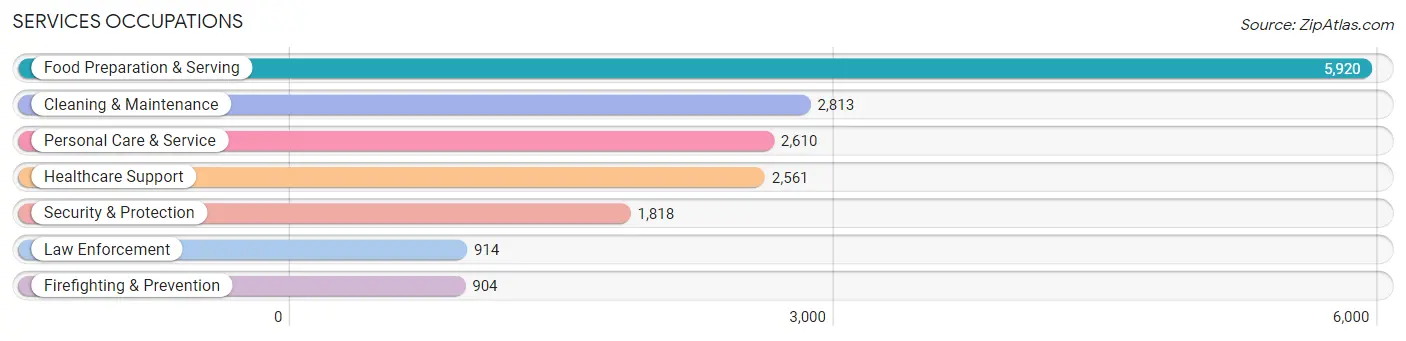
Services Occupations
The most common Services occupations in Fayetteville are Food Preparation & Serving (5,920 | 7.8%), Cleaning & Maintenance (2,813 | 3.7%), Personal Care & Service (2,610 | 3.4%), Healthcare Support (2,561 | 3.4%), and Security & Protection (1,818 | 2.4%).
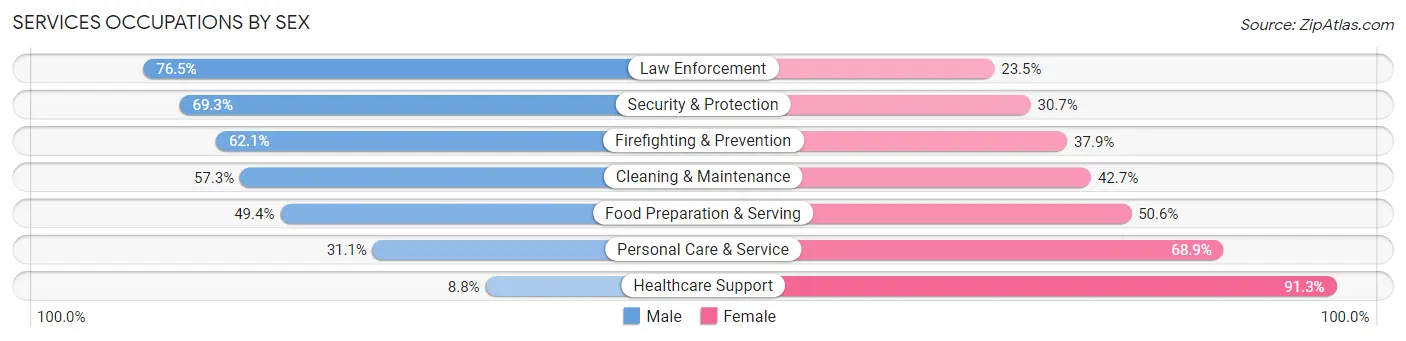
Services Occupations by Sex
Within the Services occupations in Fayetteville, the most male-oriented occupations are Law Enforcement (76.5%), Security & Protection (69.3%), and Firefighting & Prevention (62.1%), while the most female-oriented occupations are Healthcare Support (91.2%), Personal Care & Service (68.9%), and Food Preparation & Serving (50.6%).
| Occupation | Male | Female |
| Healthcare Support | 224 (8.7%) | 2,337 (91.2%) |
| Security & Protection | 1,260 (69.3%) | 558 (30.7%) |
| Firefighting & Prevention | 561 (62.1%) | 343 (37.9%) |
| Law Enforcement | 699 (76.5%) | 215 (23.5%) |
| Food Preparation & Serving | 2,923 (49.4%) | 2,997 (50.6%) |
| Cleaning & Maintenance | 1,613 (57.3%) | 1,200 (42.7%) |
| Personal Care & Service | 811 (31.1%) | 1,799 (68.9%) |
| Total (Category) | 6,831 (43.4%) | 8,891 (56.6%) |
| Total (Overall) | 35,109 (46.3%) | 40,719 (53.7%) |
Sales and Office Occupations
The most common Sales and Office occupations in Fayetteville are Sales & Related (8,261 | 10.9%), and Office & Administration (8,018 | 10.6%).

Sales and Office Occupations by Sex
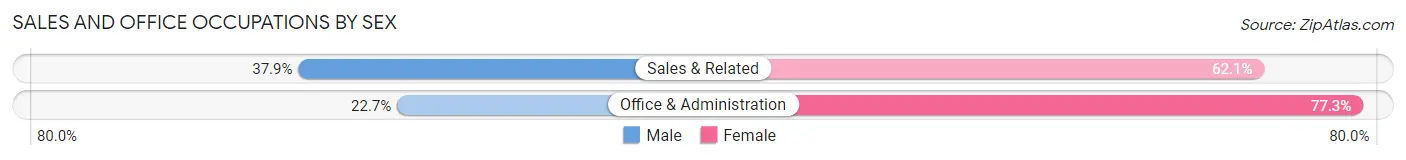
| Occupation | Male | Female |
| Sales & Related | 3,130 (37.9%) | 5,131 (62.1%) |
| Office & Administration | 1,819 (22.7%) | 6,199 (77.3%) |
| Total (Category) | 4,949 (30.4%) | 11,330 (69.6%) |
| Total (Overall) | 35,109 (46.3%) | 40,719 (53.7%) |
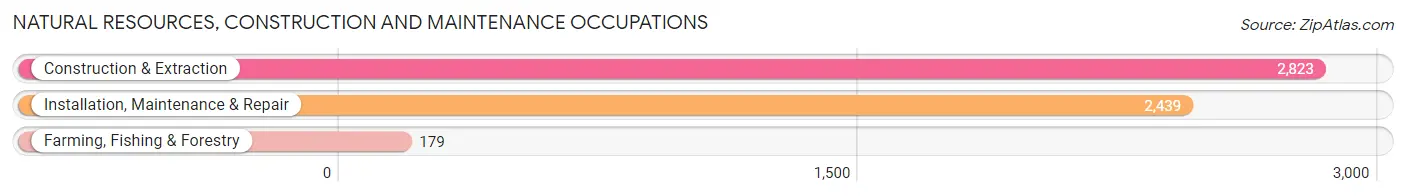
Natural Resources, Construction and Maintenance Occupations
The most common Natural Resources, Construction and Maintenance occupations in Fayetteville are Construction & Extraction (2,823 | 3.7%), Installation, Maintenance & Repair (2,439 | 3.2%), and Farming, Fishing & Forestry (179 | 0.2%).
Natural Resources, Construction and Maintenance Occupations by Sex
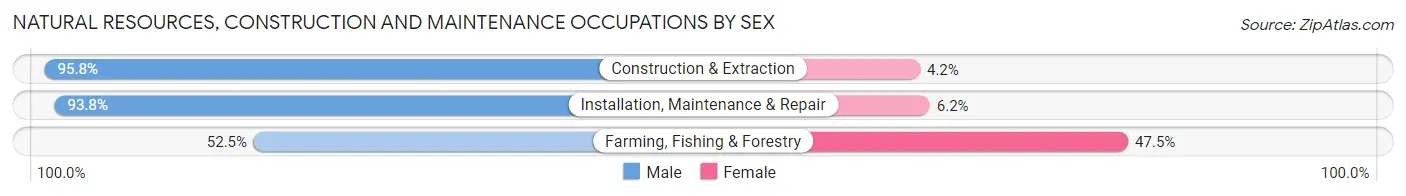
| Occupation | Male | Female |
| Farming, Fishing & Forestry | 94 (52.5%) | 85 (47.5%) |
| Construction & Extraction | 2,705 (95.8%) | 118 (4.2%) |
| Installation, Maintenance & Repair | 2,287 (93.8%) | 152 (6.2%) |
| Total (Category) | 5,086 (93.5%) | 355 (6.5%) |
| Total (Overall) | 35,109 (46.3%) | 40,719 (53.7%) |
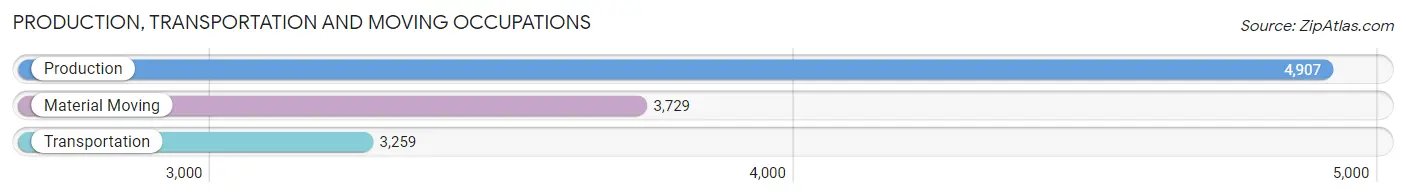
Production, Transportation and Moving Occupations
The most common Production, Transportation and Moving occupations in Fayetteville are Production (4,907 | 6.5%), Material Moving (3,729 | 4.9%), and Transportation (3,259 | 4.3%).
Production, Transportation and Moving Occupations by Sex
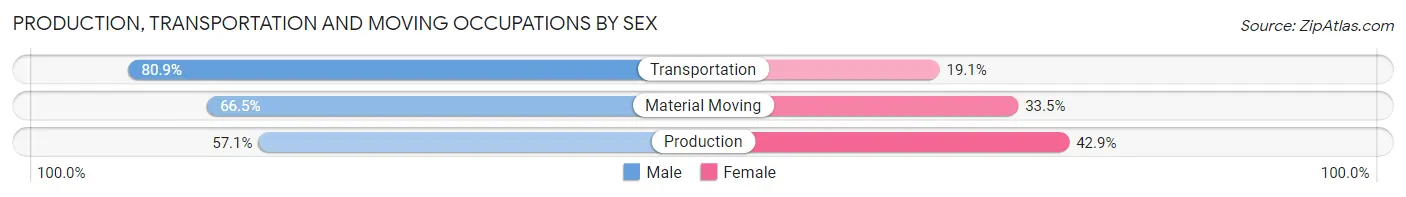
| Occupation | Male | Female |
| Production | 2,803 (57.1%) | 2,104 (42.9%) |
| Transportation | 2,637 (80.9%) | 622 (19.1%) |
| Material Moving | 2,479 (66.5%) | 1,250 (33.5%) |
| Total (Category) | 7,919 (66.6%) | 3,976 (33.4%) |
| Total (Overall) | 35,109 (46.3%) | 40,719 (53.7%) |
Employment Industries by Sex in Fayetteville
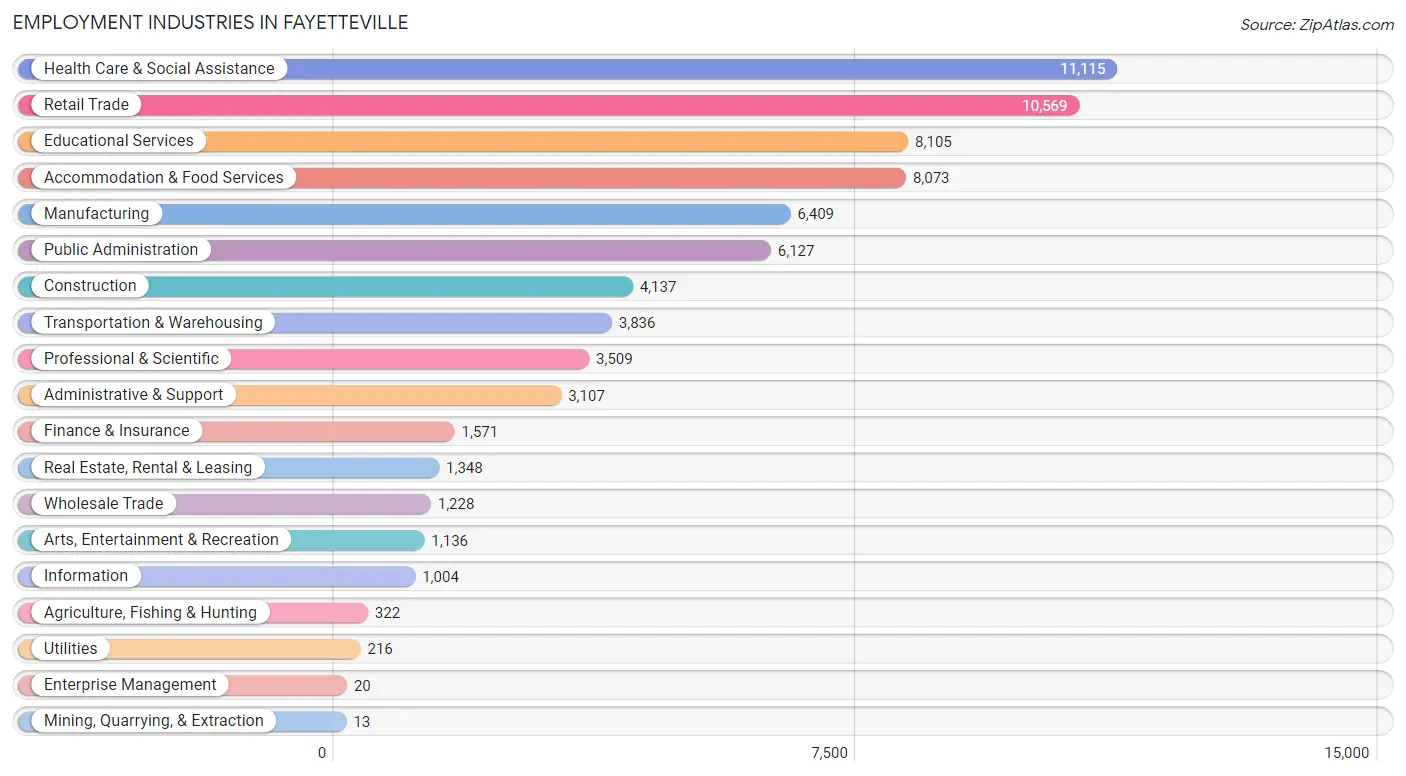
Employment Industries in Fayetteville
The major employment industries in Fayetteville include Health Care & Social Assistance (11,115 | 14.7%), Retail Trade (10,569 | 13.9%), Educational Services (8,105 | 10.7%), Accommodation & Food Services (8,073 | 10.6%), and Manufacturing (6,409 | 8.5%).
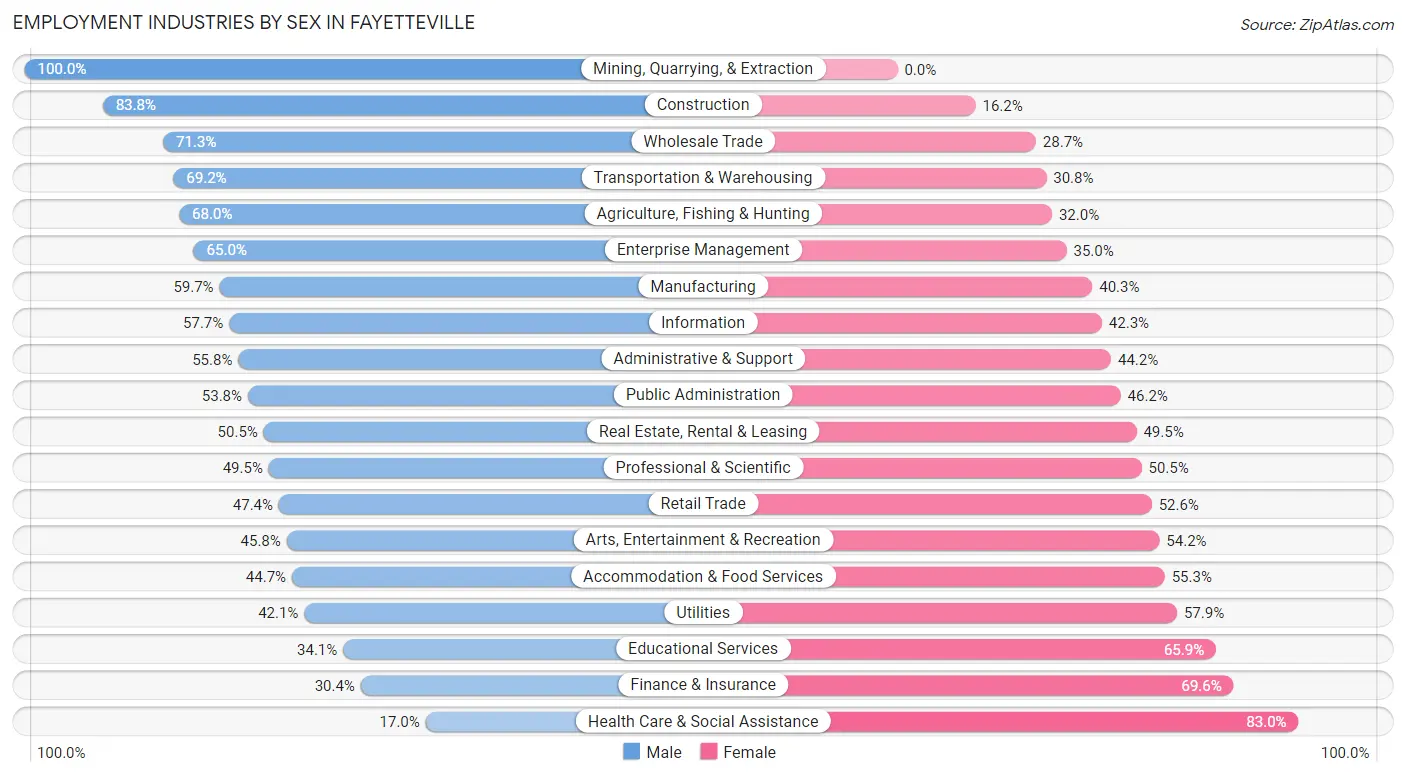
Employment Industries by Sex in Fayetteville
The Fayetteville industries that see more men than women are Mining, Quarrying, & Extraction (100.0%), Construction (83.8%), and Wholesale Trade (71.3%), whereas the industries that tend to have a higher number of women are Health Care & Social Assistance (83.0%), Finance & Insurance (69.6%), and Educational Services (65.9%).
| Industry | Male | Female |
| Agriculture, Fishing & Hunting | 219 (68.0%) | 103 (32.0%) |
| Mining, Quarrying, & Extraction | 13 (100.0%) | 0 (0.0%) |
| Construction | 3,468 (83.8%) | 669 (16.2%) |
| Manufacturing | 3,824 (59.7%) | 2,585 (40.3%) |
| Wholesale Trade | 876 (71.3%) | 352 (28.7%) |
| Retail Trade | 5,007 (47.4%) | 5,562 (52.6%) |
| Transportation & Warehousing | 2,654 (69.2%) | 1,182 (30.8%) |
| Utilities | 91 (42.1%) | 125 (57.9%) |
| Information | 579 (57.7%) | 425 (42.3%) |
| Finance & Insurance | 478 (30.4%) | 1,093 (69.6%) |
| Real Estate, Rental & Leasing | 681 (50.5%) | 667 (49.5%) |
| Professional & Scientific | 1,736 (49.5%) | 1,773 (50.5%) |
| Enterprise Management | 13 (65.0%) | 7 (35.0%) |
| Administrative & Support | 1,733 (55.8%) | 1,374 (44.2%) |
| Educational Services | 2,761 (34.1%) | 5,344 (65.9%) |
| Health Care & Social Assistance | 1,890 (17.0%) | 9,225 (83.0%) |
| Arts, Entertainment & Recreation | 520 (45.8%) | 616 (54.2%) |
| Accommodation & Food Services | 3,606 (44.7%) | 4,467 (55.3%) |
| Public Administration | 3,296 (53.8%) | 2,831 (46.2%) |
| Total | 35,109 (46.3%) | 40,719 (53.7%) |
Education in Fayetteville
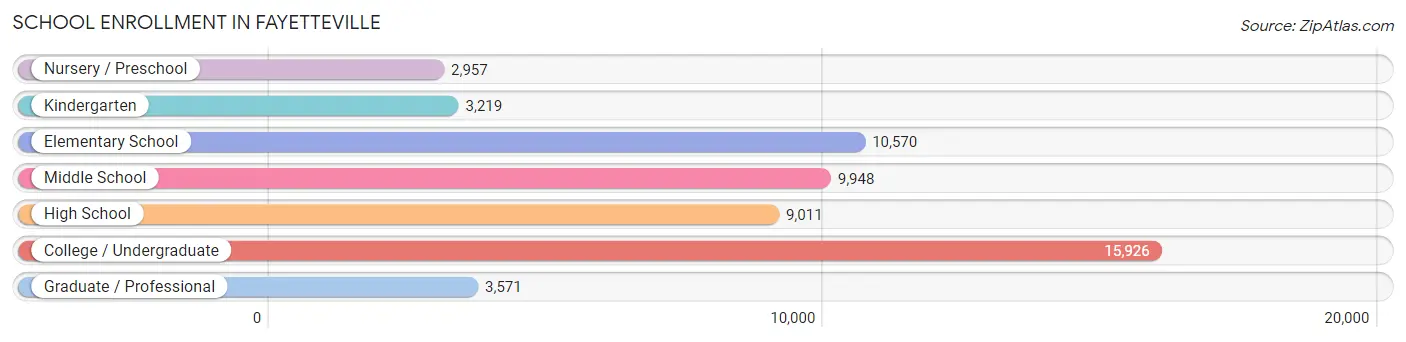
School Enrollment in Fayetteville
The most common levels of schooling among the 55,202 students in Fayetteville are college / undergraduate (15,926 | 28.8%), elementary school (10,570 | 19.2%), and middle school (9,948 | 18.0%).
| School Level | # Students | % Students |
| Nursery / Preschool | 2,957 | 5.4% |
| Kindergarten | 3,219 | 5.8% |
| Elementary School | 10,570 | 19.2% |
| Middle School | 9,948 | 18.0% |
| High School | 9,011 | 16.3% |
| College / Undergraduate | 15,926 | 28.8% |
| Graduate / Professional | 3,571 | 6.5% |
| Total | 55,202 | 100.0% |
School Enrollment by Age by Funding Source in Fayetteville
Out of a total of 55,202 students who are enrolled in schools in Fayetteville, 9,550 (17.3%) attend a private institution, while the remaining 45,652 (82.7%) are enrolled in public schools. The age group of 3 to 4 year olds has the highest likelihood of being enrolled in private schools, with 786 (33.1% in the age bracket) enrolled. Conversely, the age group of 15 to 17 year olds has the lowest likelihood of being enrolled in a private school, with 6,094 (92.7% in the age bracket) attending a public institution.
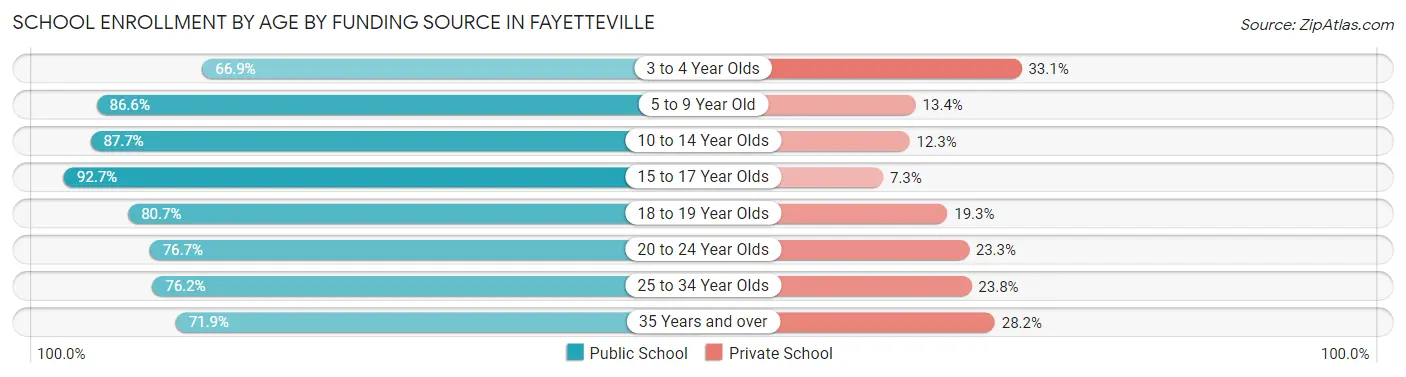
| Age Bracket | Public School | Private School |
| 3 to 4 Year Olds | 1,587 (66.9%) | 786 (33.1%) |
| 5 to 9 Year Old | 11,198 (86.6%) | 1,734 (13.4%) |
| 10 to 14 Year Olds | 10,692 (87.7%) | 1,496 (12.3%) |
| 15 to 17 Year Olds | 6,094 (92.7%) | 482 (7.3%) |
| 18 to 19 Year Olds | 2,530 (80.7%) | 605 (19.3%) |
| 20 to 24 Year Olds | 5,135 (76.7%) | 1,561 (23.3%) |
| 25 to 34 Year Olds | 5,080 (76.2%) | 1,586 (23.8%) |
| 35 Years and over | 3,331 (71.9%) | 1,305 (28.1%) |
| Total | 45,652 (82.7%) | 9,550 (17.3%) |
Educational Attainment by Field of Study in Fayetteville
Business (7,184 | 18.1%), education (5,496 | 13.9%), arts & humanities (4,822 | 12.2%), science & technology (3,858 | 9.8%), and social sciences (3,354 | 8.5%) are the most common fields of study among 39,580 individuals in Fayetteville who have obtained a bachelor's degree or higher.
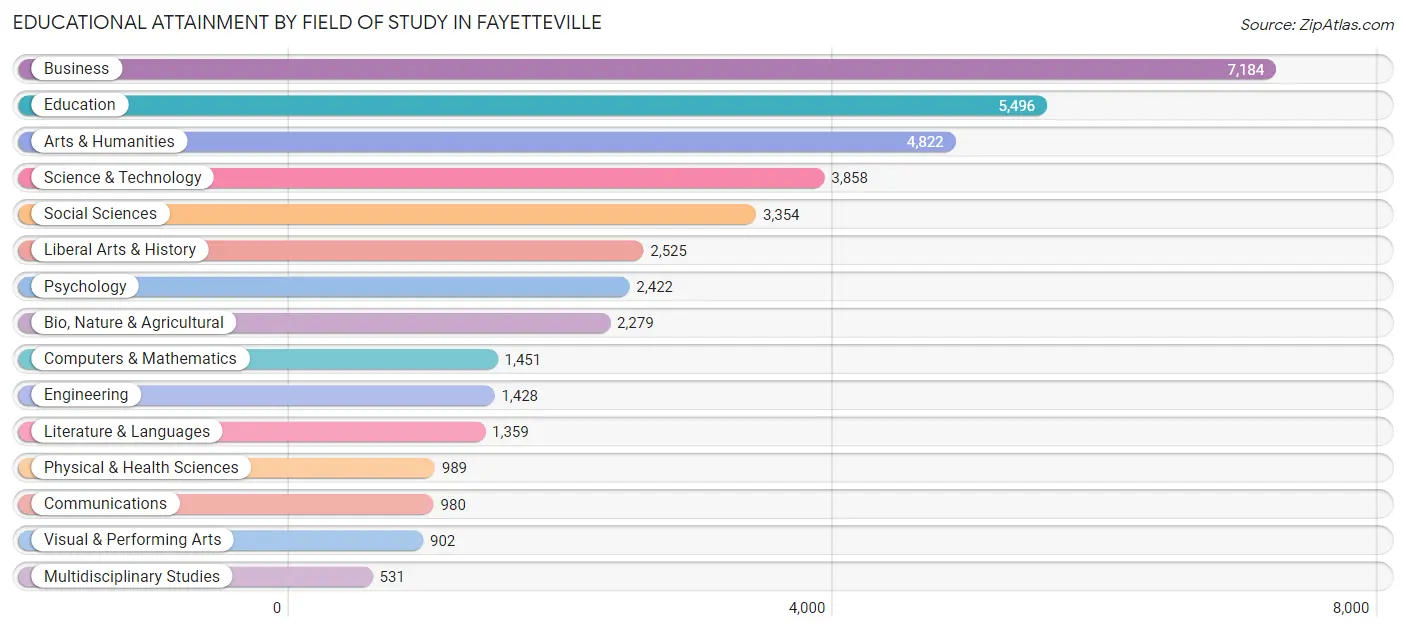
| Field of Study | # Graduates | % Graduates |
| Computers & Mathematics | 1,451 | 3.7% |
| Bio, Nature & Agricultural | 2,279 | 5.8% |
| Physical & Health Sciences | 989 | 2.5% |
| Psychology | 2,422 | 6.1% |
| Social Sciences | 3,354 | 8.5% |
| Engineering | 1,428 | 3.6% |
| Multidisciplinary Studies | 531 | 1.3% |
| Science & Technology | 3,858 | 9.8% |
| Business | 7,184 | 18.1% |
| Education | 5,496 | 13.9% |
| Literature & Languages | 1,359 | 3.4% |
| Liberal Arts & History | 2,525 | 6.4% |
| Visual & Performing Arts | 902 | 2.3% |
| Communications | 980 | 2.5% |
| Arts & Humanities | 4,822 | 12.2% |
| Total | 39,580 | 100.0% |
Transportation & Commute in Fayetteville
Vehicle Availability by Sex in Fayetteville
The most prevalent vehicle ownership categories in Fayetteville are males with 2 vehicles (20,834, accounting for 44.6%) and females with 2 vehicles (16,213, making up 50.0%).
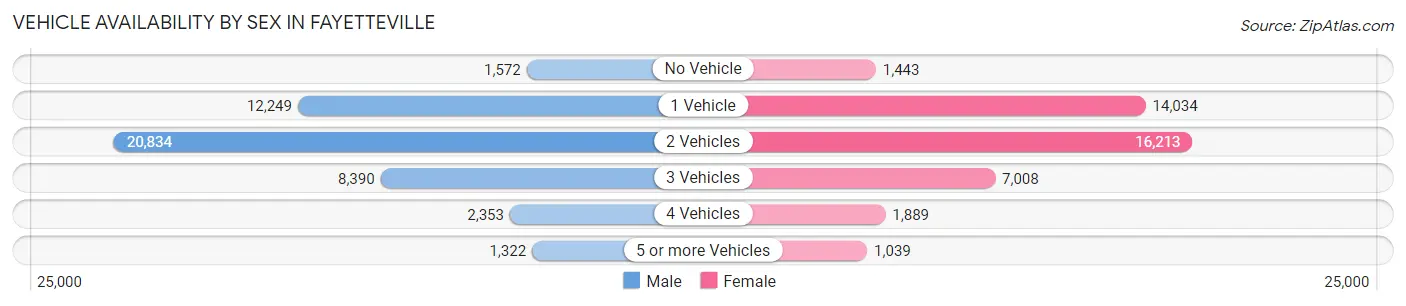
| Vehicles Available | Male | Female |
| No Vehicle | 1,572 (3.4%) | 1,443 (3.5%) |
| 1 Vehicle | 12,249 (26.2%) | 14,034 (33.7%) |
| 2 Vehicles | 20,834 (44.6%) | 16,213 (39.0%) |
| 3 Vehicles | 8,390 (18.0%) | 7,008 (16.8%) |
| 4 Vehicles | 2,353 (5.0%) | 1,889 (4.5%) |
| 5 or more Vehicles | 1,322 (2.8%) | 1,039 (2.5%) |
| Total | 46,720 (100.0%) | 41,626 (100.0%) |
Commute Time in Fayetteville
The most frequently occuring commute durations in Fayetteville are 15 to 19 minutes (20,886 commuters, 22.0%), 20 to 24 minutes (15,342 commuters, 16.2%), and 10 to 14 minutes (15,224 commuters, 16.1%).
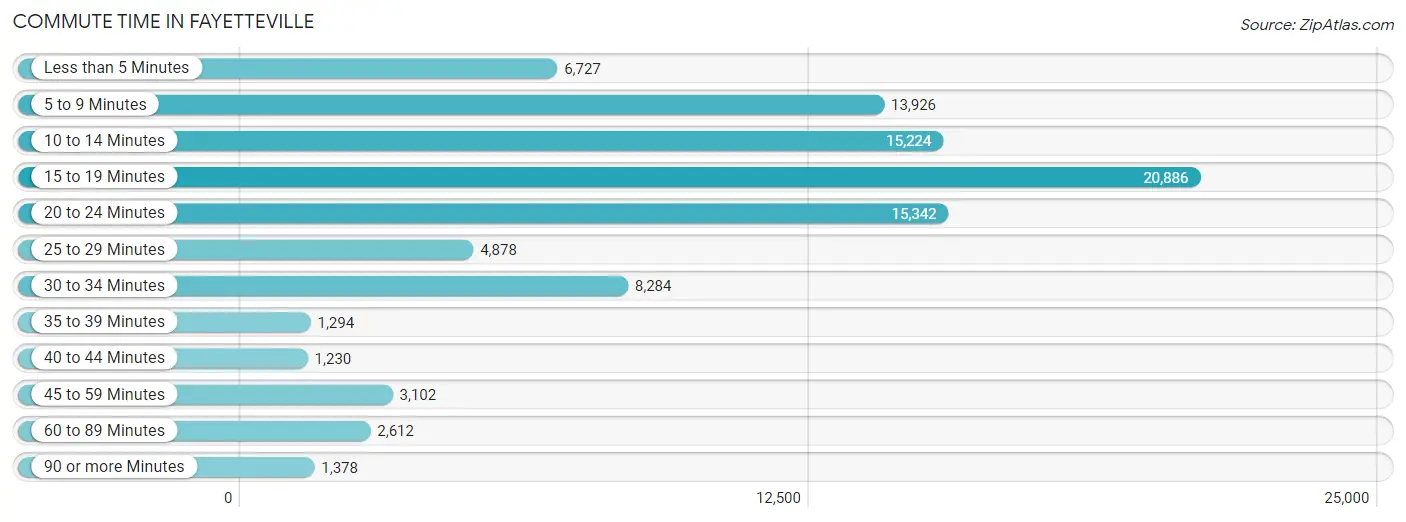
| Commute Time | # Commuters | % Commuters |
| Less than 5 Minutes | 6,727 | 7.1% |
| 5 to 9 Minutes | 13,926 | 14.7% |
| 10 to 14 Minutes | 15,224 | 16.1% |
| 15 to 19 Minutes | 20,886 | 22.0% |
| 20 to 24 Minutes | 15,342 | 16.2% |
| 25 to 29 Minutes | 4,878 | 5.1% |
| 30 to 34 Minutes | 8,284 | 8.7% |
| 35 to 39 Minutes | 1,294 | 1.4% |
| 40 to 44 Minutes | 1,230 | 1.3% |
| 45 to 59 Minutes | 3,102 | 3.3% |
| 60 to 89 Minutes | 2,612 | 2.8% |
| 90 or more Minutes | 1,378 | 1.5% |
Commute Time by Sex in Fayetteville
The most common commute times in Fayetteville are 15 to 19 minutes (11,199 commuters, 20.2%) for males and 15 to 19 minutes (9,687 commuters, 24.5%) for females.
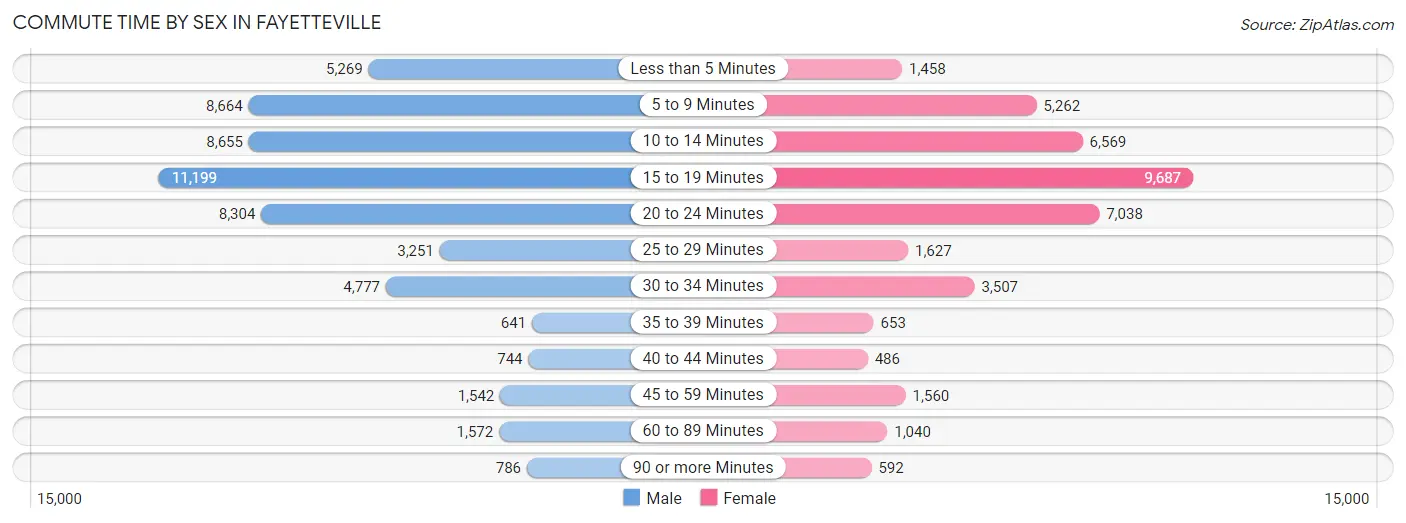
| Commute Time | Male | Female |
| Less than 5 Minutes | 5,269 (9.5%) | 1,458 (3.7%) |
| 5 to 9 Minutes | 8,664 (15.6%) | 5,262 (13.3%) |
| 10 to 14 Minutes | 8,655 (15.6%) | 6,569 (16.6%) |
| 15 to 19 Minutes | 11,199 (20.2%) | 9,687 (24.5%) |
| 20 to 24 Minutes | 8,304 (15.0%) | 7,038 (17.8%) |
| 25 to 29 Minutes | 3,251 (5.9%) | 1,627 (4.1%) |
| 30 to 34 Minutes | 4,777 (8.6%) | 3,507 (8.9%) |
| 35 to 39 Minutes | 641 (1.2%) | 653 (1.7%) |
| 40 to 44 Minutes | 744 (1.3%) | 486 (1.2%) |
| 45 to 59 Minutes | 1,542 (2.8%) | 1,560 (4.0%) |
| 60 to 89 Minutes | 1,572 (2.8%) | 1,040 (2.6%) |
| 90 or more Minutes | 786 (1.4%) | 592 (1.5%) |
Time of Departure to Work by Sex in Fayetteville
The most frequent times of departure to work in Fayetteville are 7:00 AM to 7:29 AM (7,831, 14.1%) for males and 7:00 AM to 7:29 AM (5,682, 14.4%) for females.
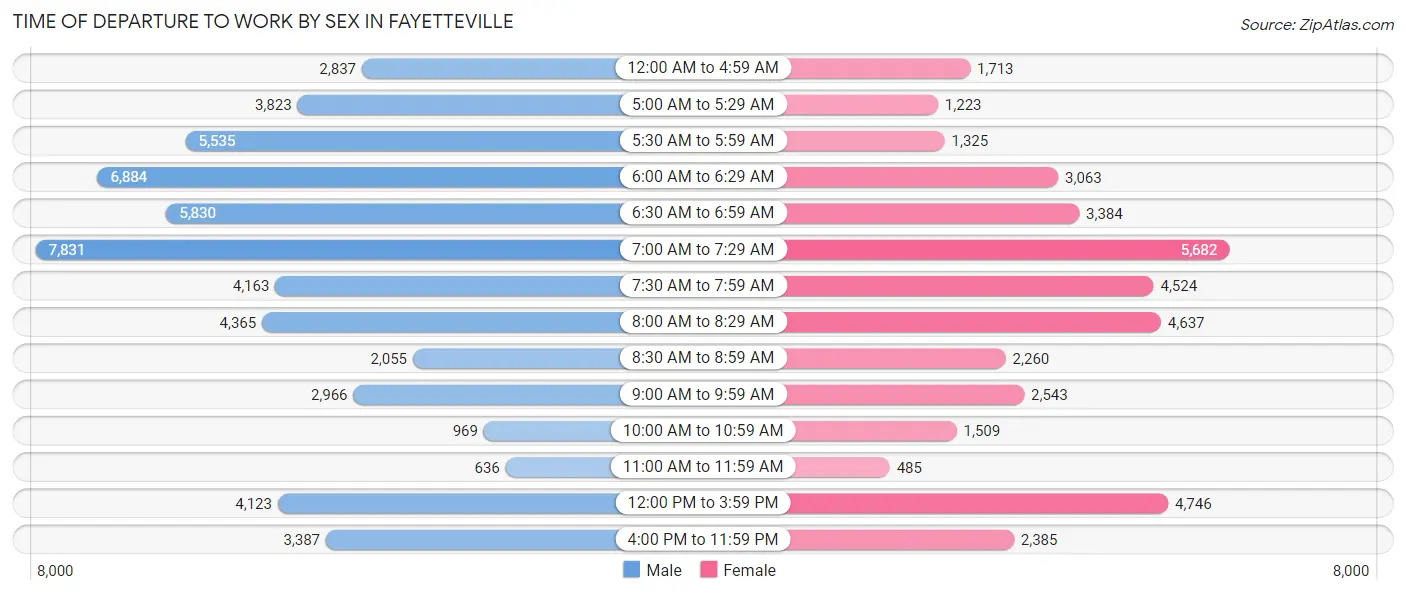
| Time of Departure | Male | Female |
| 12:00 AM to 4:59 AM | 2,837 (5.1%) | 1,713 (4.3%) |
| 5:00 AM to 5:29 AM | 3,823 (6.9%) | 1,223 (3.1%) |
| 5:30 AM to 5:59 AM | 5,535 (10.0%) | 1,325 (3.4%) |
| 6:00 AM to 6:29 AM | 6,884 (12.4%) | 3,063 (7.8%) |
| 6:30 AM to 6:59 AM | 5,830 (10.5%) | 3,384 (8.6%) |
| 7:00 AM to 7:29 AM | 7,831 (14.1%) | 5,682 (14.4%) |
| 7:30 AM to 7:59 AM | 4,163 (7.5%) | 4,524 (11.5%) |
| 8:00 AM to 8:29 AM | 4,365 (7.9%) | 4,637 (11.7%) |
| 8:30 AM to 8:59 AM | 2,055 (3.7%) | 2,260 (5.7%) |
| 9:00 AM to 9:59 AM | 2,966 (5.3%) | 2,543 (6.4%) |
| 10:00 AM to 10:59 AM | 969 (1.8%) | 1,509 (3.8%) |
| 11:00 AM to 11:59 AM | 636 (1.1%) | 485 (1.2%) |
| 12:00 PM to 3:59 PM | 4,123 (7.4%) | 4,746 (12.0%) |
| 4:00 PM to 11:59 PM | 3,387 (6.1%) | 2,385 (6.0%) |
| Total | 55,404 (100.0%) | 39,479 (100.0%) |
Housing Occupancy in Fayetteville
Occupancy by Ownership in Fayetteville
Of the total 80,852 dwellings in Fayetteville, owner-occupied units account for 36,739 (45.4%), while renter-occupied units make up 44,113 (54.6%).
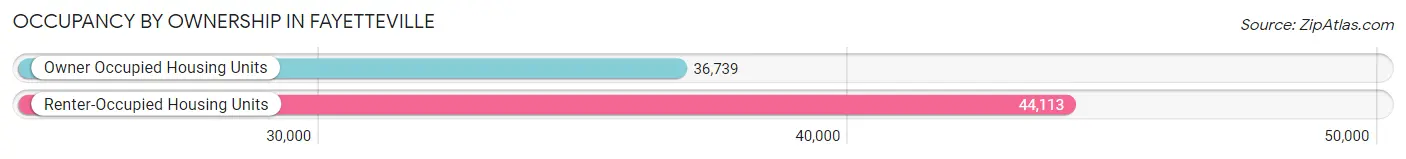
| Occupancy | # Housing Units | % Housing Units |
| Owner Occupied Housing Units | 36,739 | 45.4% |
| Renter-Occupied Housing Units | 44,113 | 54.6% |
| Total Occupied Housing Units | 80,852 | 100.0% |
Occupancy by Household Size in Fayetteville
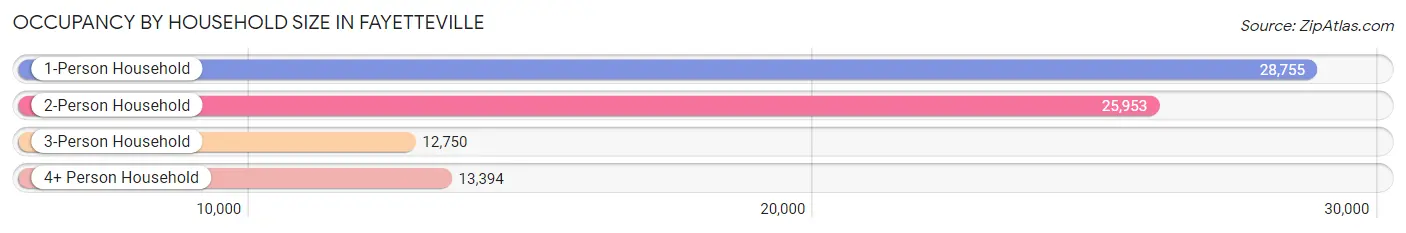
| Household Size | # Housing Units | % Housing Units |
| 1-Person Household | 28,755 | 35.6% |
| 2-Person Household | 25,953 | 32.1% |
| 3-Person Household | 12,750 | 15.8% |
| 4+ Person Household | 13,394 | 16.6% |
| Total Housing Units | 80,852 | 100.0% |
Occupancy by Ownership by Household Size in Fayetteville
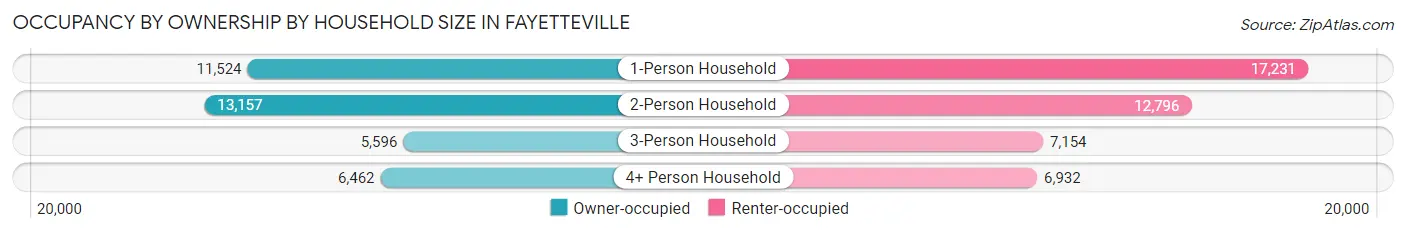
| Household Size | Owner-occupied | Renter-occupied |
| 1-Person Household | 11,524 (40.1%) | 17,231 (59.9%) |
| 2-Person Household | 13,157 (50.7%) | 12,796 (49.3%) |
| 3-Person Household | 5,596 (43.9%) | 7,154 (56.1%) |
| 4+ Person Household | 6,462 (48.2%) | 6,932 (51.7%) |
| Total Housing Units | 36,739 (45.4%) | 44,113 (54.6%) |
Occupancy by Educational Attainment in Fayetteville
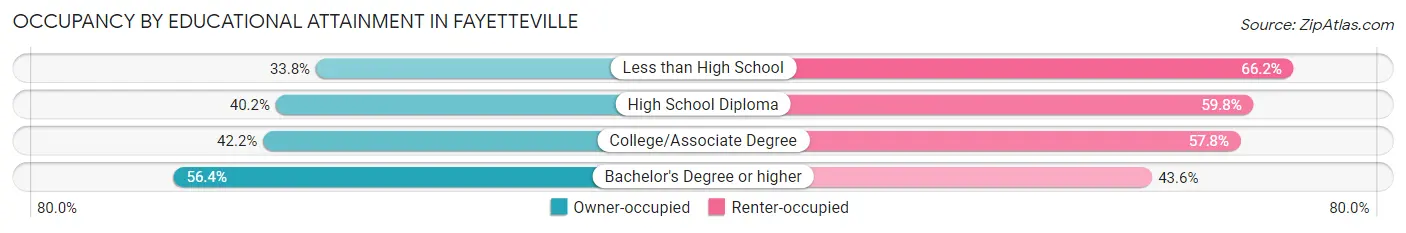
| Household Size | Owner-occupied | Renter-occupied |
| Less than High School | 1,563 (33.8%) | 3,063 (66.2%) |
| High School Diploma | 7,253 (40.2%) | 10,807 (59.8%) |
| College/Associate Degree | 14,441 (42.2%) | 19,810 (57.8%) |
| Bachelor's Degree or higher | 13,482 (56.4%) | 10,433 (43.6%) |
Occupancy by Age of Householder in Fayetteville
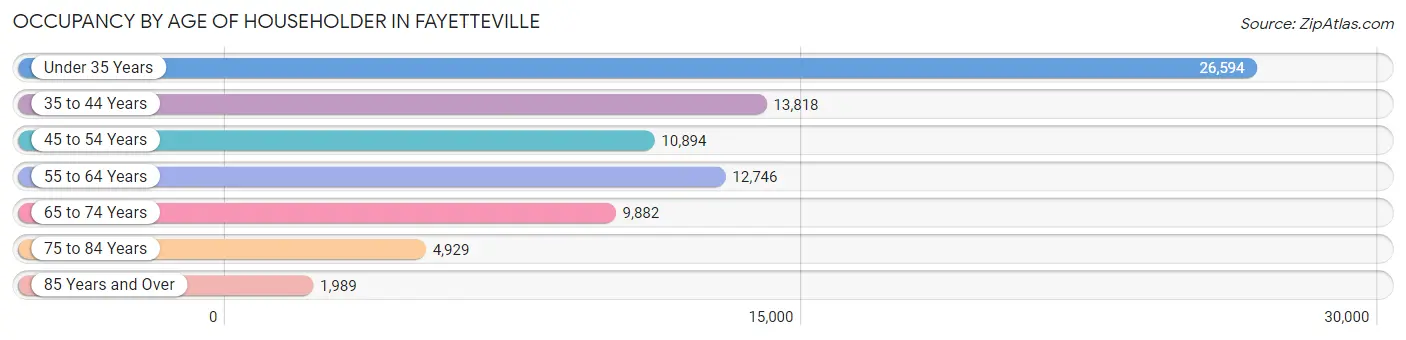
| Age Bracket | # Households | % Households |
| Under 35 Years | 26,594 | 32.9% |
| 35 to 44 Years | 13,818 | 17.1% |
| 45 to 54 Years | 10,894 | 13.5% |
| 55 to 64 Years | 12,746 | 15.8% |
| 65 to 74 Years | 9,882 | 12.2% |
| 75 to 84 Years | 4,929 | 6.1% |
| 85 Years and Over | 1,989 | 2.5% |
| Total | 80,852 | 100.0% |
Housing Finances in Fayetteville
Median Income by Occupancy in Fayetteville
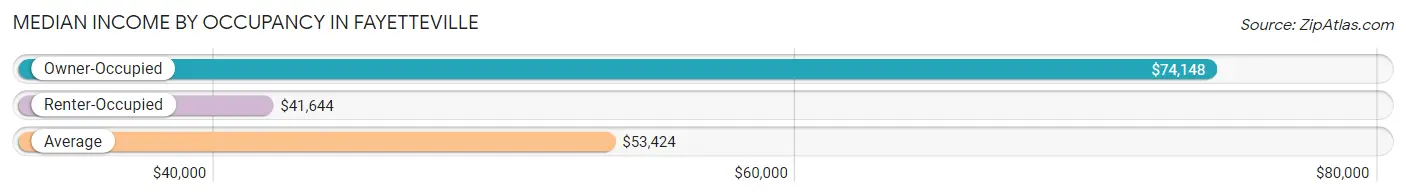
| Occupancy Type | # Households | Median Income |
| Owner-Occupied | 36,739 (45.4%) | $74,148 |
| Renter-Occupied | 44,113 (54.6%) | $41,644 |
| Average | 80,852 (100.0%) | $53,424 |
Occupancy by Householder Income Bracket in Fayetteville
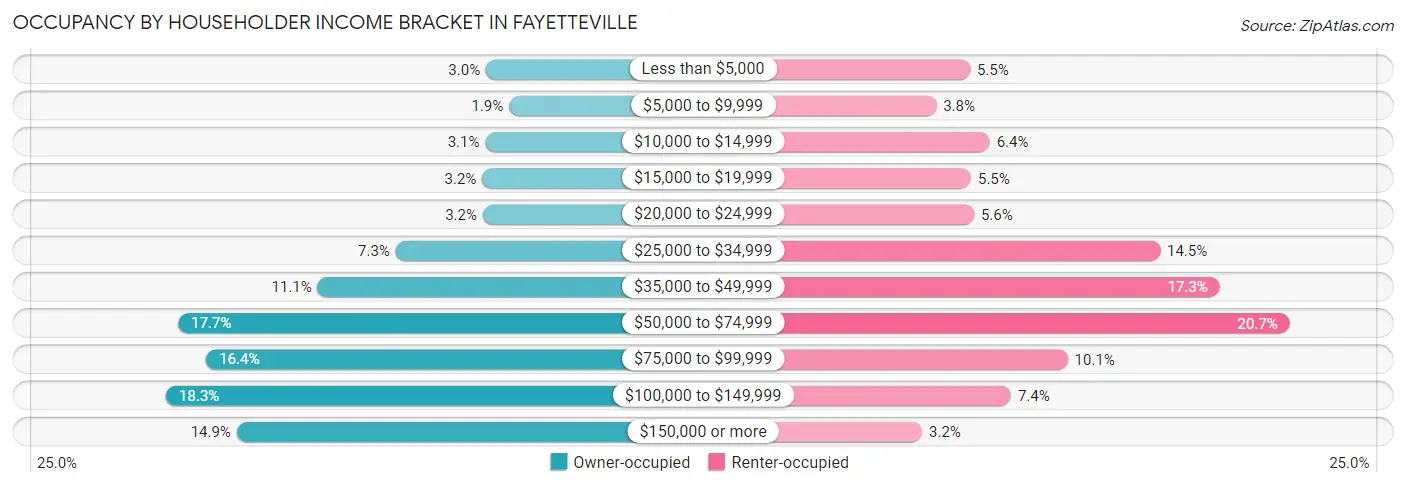
| Income Bracket | Owner-occupied | Renter-occupied |
| Less than $5,000 | 1,113 (3.0%) | 2,406 (5.4%) |
| $5,000 to $9,999 | 708 (1.9%) | 1,693 (3.8%) |
| $10,000 to $14,999 | 1,125 (3.1%) | 2,819 (6.4%) |
| $15,000 to $19,999 | 1,179 (3.2%) | 2,425 (5.5%) |
| $20,000 to $24,999 | 1,168 (3.2%) | 2,490 (5.6%) |
| $25,000 to $34,999 | 2,693 (7.3%) | 6,395 (14.5%) |
| $35,000 to $49,999 | 4,061 (11.1%) | 7,648 (17.3%) |
| $50,000 to $74,999 | 6,499 (17.7%) | 9,119 (20.7%) |
| $75,000 to $99,999 | 6,007 (16.4%) | 4,455 (10.1%) |
| $100,000 to $149,999 | 6,711 (18.3%) | 3,265 (7.4%) |
| $150,000 or more | 5,475 (14.9%) | 1,398 (3.2%) |
| Total | 36,739 (100.0%) | 44,113 (100.0%) |
Monthly Housing Cost Tiers in Fayetteville
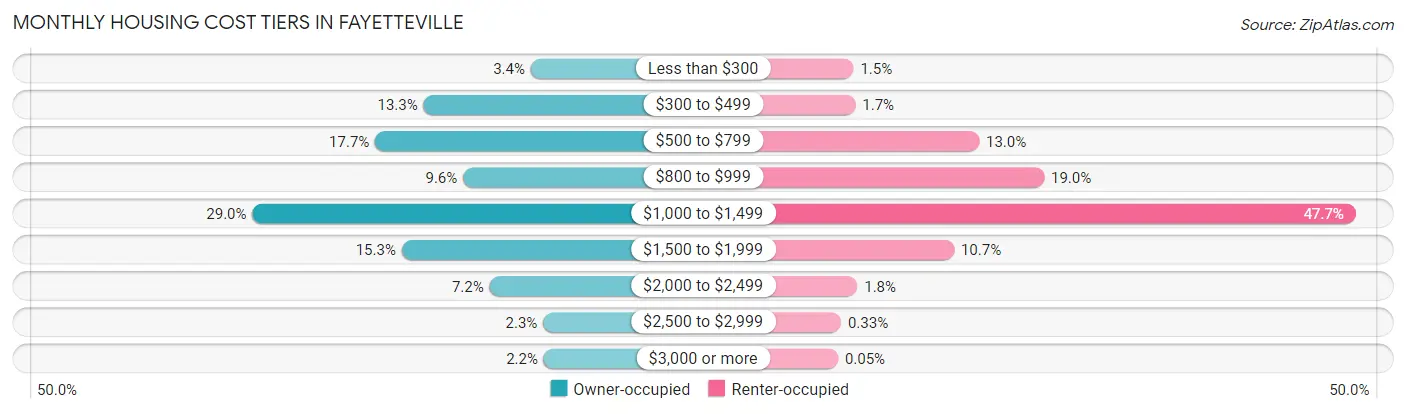
| Monthly Cost | Owner-occupied | Renter-occupied |
| Less than $300 | 1,249 (3.4%) | 654 (1.5%) |
| $300 to $499 | 4,876 (13.3%) | 730 (1.7%) |
| $500 to $799 | 6,513 (17.7%) | 5,751 (13.0%) |
| $800 to $999 | 3,537 (9.6%) | 8,391 (19.0%) |
| $1,000 to $1,499 | 10,664 (29.0%) | 21,046 (47.7%) |
| $1,500 to $1,999 | 5,613 (15.3%) | 4,735 (10.7%) |
| $2,000 to $2,499 | 2,645 (7.2%) | 806 (1.8%) |
| $2,500 to $2,999 | 832 (2.3%) | 144 (0.3%) |
| $3,000 or more | 810 (2.2%) | 22 (0.1%) |
| Total | 36,739 (100.0%) | 44,113 (100.0%) |
Physical Housing Characteristics in Fayetteville
Housing Structures in Fayetteville
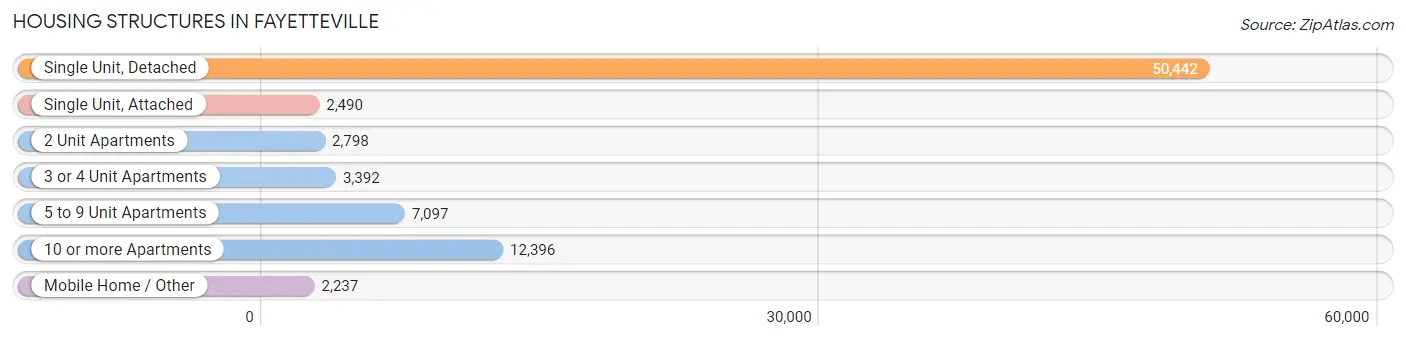
| Structure Type | # Housing Units | % Housing Units |
| Single Unit, Detached | 50,442 | 62.4% |
| Single Unit, Attached | 2,490 | 3.1% |
| 2 Unit Apartments | 2,798 | 3.5% |
| 3 or 4 Unit Apartments | 3,392 | 4.2% |
| 5 to 9 Unit Apartments | 7,097 | 8.8% |
| 10 or more Apartments | 12,396 | 15.3% |
| Mobile Home / Other | 2,237 | 2.8% |
| Total | 80,852 | 100.0% |
Housing Structures by Occupancy in Fayetteville
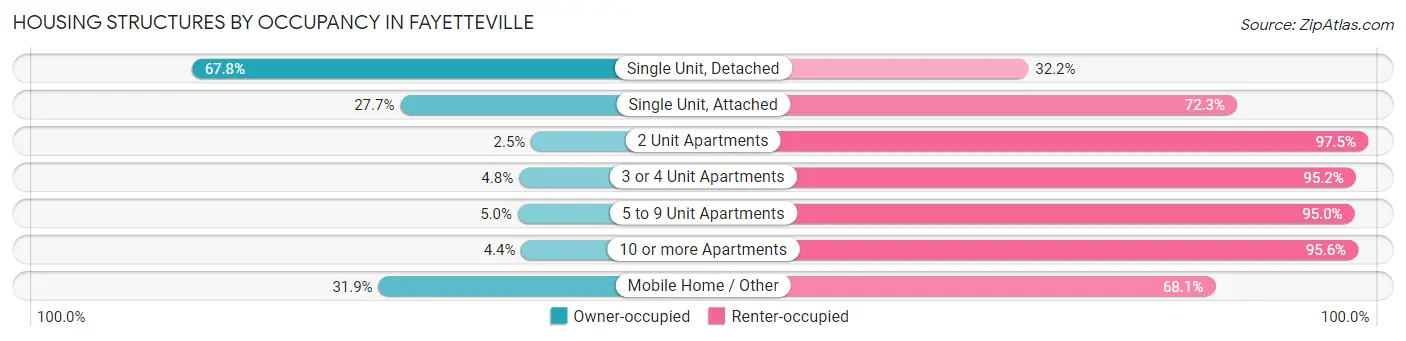
| Structure Type | Owner-occupied | Renter-occupied |
| Single Unit, Detached | 34,207 (67.8%) | 16,235 (32.2%) |
| Single Unit, Attached | 689 (27.7%) | 1,801 (72.3%) |
| 2 Unit Apartments | 69 (2.5%) | 2,729 (97.5%) |
| 3 or 4 Unit Apartments | 163 (4.8%) | 3,229 (95.2%) |
| 5 to 9 Unit Apartments | 357 (5.0%) | 6,740 (95.0%) |
| 10 or more Apartments | 541 (4.4%) | 11,855 (95.6%) |
| Mobile Home / Other | 713 (31.9%) | 1,524 (68.1%) |
| Total | 36,739 (45.4%) | 44,113 (54.6%) |
Housing Structures by Number of Rooms in Fayetteville
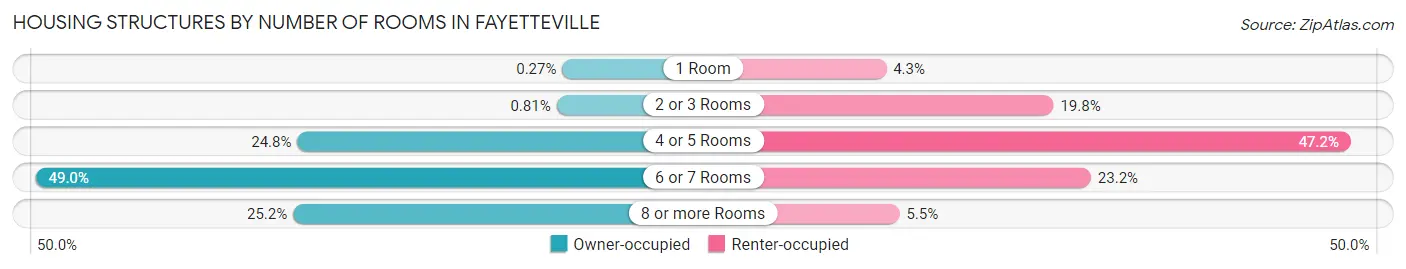
| Number of Rooms | Owner-occupied | Renter-occupied |
| 1 Room | 99 (0.3%) | 1,890 (4.3%) |
| 2 or 3 Rooms | 296 (0.8%) | 8,714 (19.8%) |
| 4 or 5 Rooms | 9,104 (24.8%) | 20,841 (47.2%) |
| 6 or 7 Rooms | 17,993 (49.0%) | 10,238 (23.2%) |
| 8 or more Rooms | 9,247 (25.2%) | 2,430 (5.5%) |
| Total | 36,739 (100.0%) | 44,113 (100.0%) |
Housing Structure by Heating Type in Fayetteville
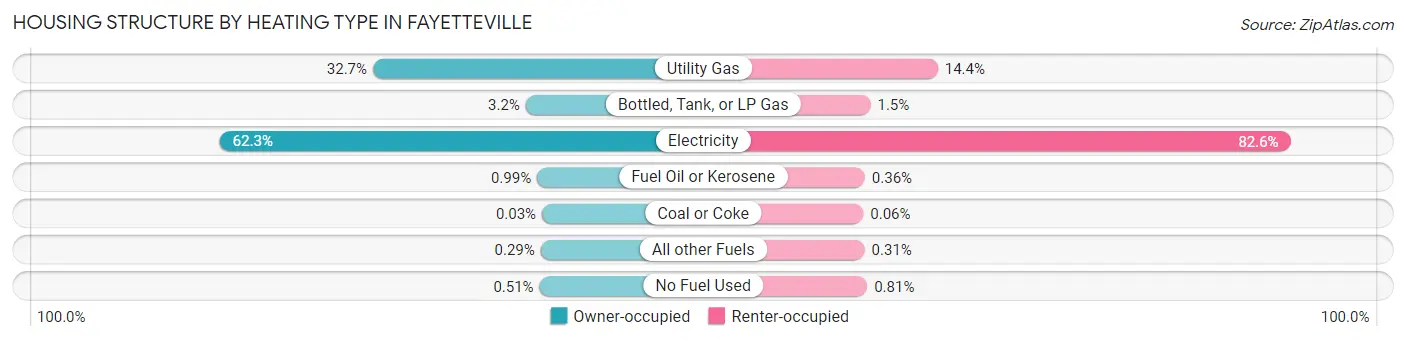
| Heating Type | Owner-occupied | Renter-occupied |
| Utility Gas | 12,012 (32.7%) | 6,368 (14.4%) |
| Bottled, Tank, or LP Gas | 1,168 (3.2%) | 640 (1.5%) |
| Electricity | 22,889 (62.3%) | 36,427 (82.6%) |
| Fuel Oil or Kerosene | 363 (1.0%) | 158 (0.4%) |
| Coal or Coke | 12 (0.0%) | 26 (0.1%) |
| All other Fuels | 108 (0.3%) | 135 (0.3%) |
| No Fuel Used | 187 (0.5%) | 359 (0.8%) |
| Total | 36,739 (100.0%) | 44,113 (100.0%) |
Household Vehicle Usage in Fayetteville
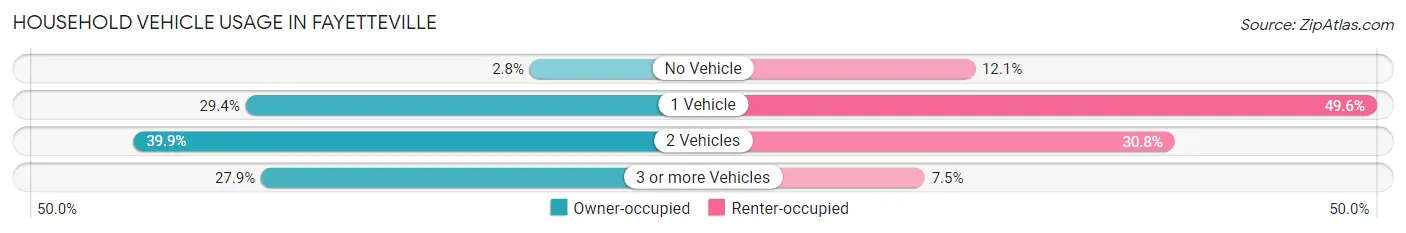
| Vehicles per Household | Owner-occupied | Renter-occupied |
| No Vehicle | 1,045 (2.8%) | 5,355 (12.1%) |
| 1 Vehicle | 10,793 (29.4%) | 21,896 (49.6%) |
| 2 Vehicles | 14,645 (39.9%) | 13,577 (30.8%) |
| 3 or more Vehicles | 10,256 (27.9%) | 3,285 (7.4%) |
| Total | 36,739 (100.0%) | 44,113 (100.0%) |
Real Estate & Mortgages in Fayetteville
Real Estate and Mortgage Overview in Fayetteville
| Characteristic | Without Mortgage | With Mortgage |
| Housing Units | 12,578 | 24,161 |
| Median Property Value | $126,000 | $173,900 |
| Median Household Income | $57,347 | $3,964 |
| Monthly Housing Costs | $514 | $797 |
| Real Estate Taxes | $1,676 | $711 |
Property Value by Mortgage Status in Fayetteville
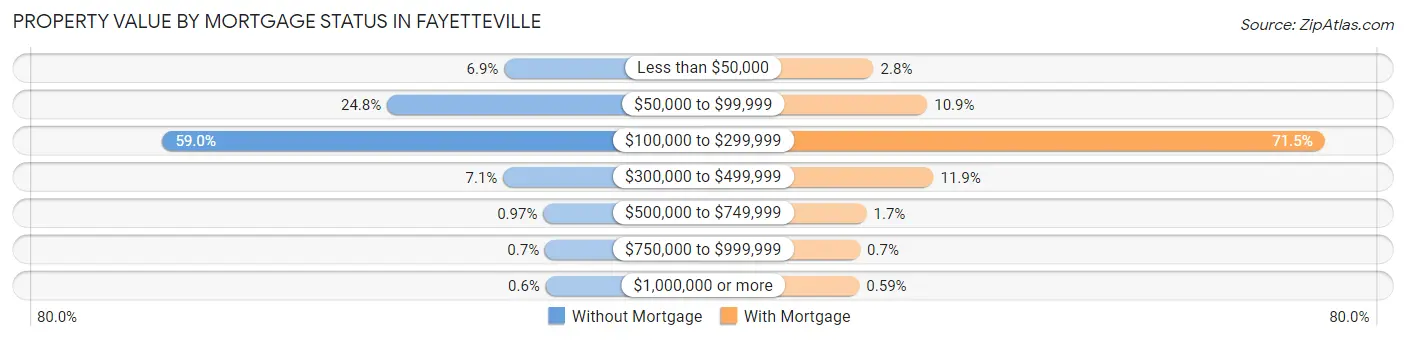
| Property Value | Without Mortgage | With Mortgage |
| Less than $50,000 | 870 (6.9%) | 668 (2.8%) |
| $50,000 to $99,999 | 3,115 (24.8%) | 2,641 (10.9%) |
| $100,000 to $299,999 | 7,418 (59.0%) | 17,263 (71.5%) |
| $300,000 to $499,999 | 890 (7.1%) | 2,872 (11.9%) |
| $500,000 to $749,999 | 122 (1.0%) | 406 (1.7%) |
| $750,000 to $999,999 | 88 (0.7%) | 169 (0.7%) |
| $1,000,000 or more | 75 (0.6%) | 142 (0.6%) |
| Total | 12,578 (100.0%) | 24,161 (100.0%) |
Household Income by Mortgage Status in Fayetteville
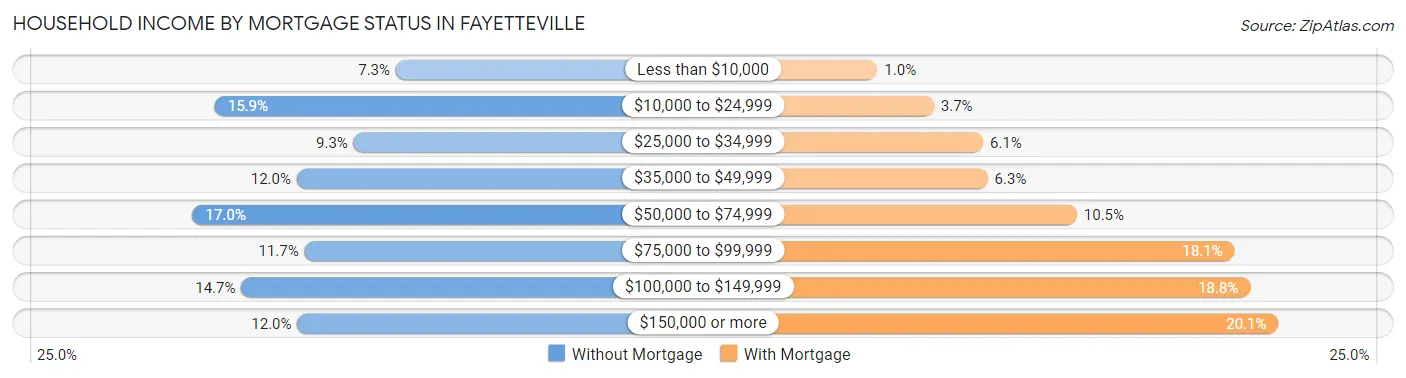
| Household Income | Without Mortgage | With Mortgage |
| Less than $10,000 | 921 (7.3%) | 251 (1.0%) |
| $10,000 to $24,999 | 2,005 (15.9%) | 900 (3.7%) |
| $25,000 to $34,999 | 1,174 (9.3%) | 1,467 (6.1%) |
| $35,000 to $49,999 | 1,514 (12.0%) | 1,519 (6.3%) |
| $50,000 to $74,999 | 2,138 (17.0%) | 2,547 (10.5%) |
| $75,000 to $99,999 | 1,468 (11.7%) | 4,361 (18.0%) |
| $100,000 to $149,999 | 1,847 (14.7%) | 4,539 (18.8%) |
| $150,000 or more | 1,511 (12.0%) | 4,864 (20.1%) |
| Total | 12,578 (100.0%) | 24,161 (100.0%) |
Property Value to Household Income Ratio in Fayetteville
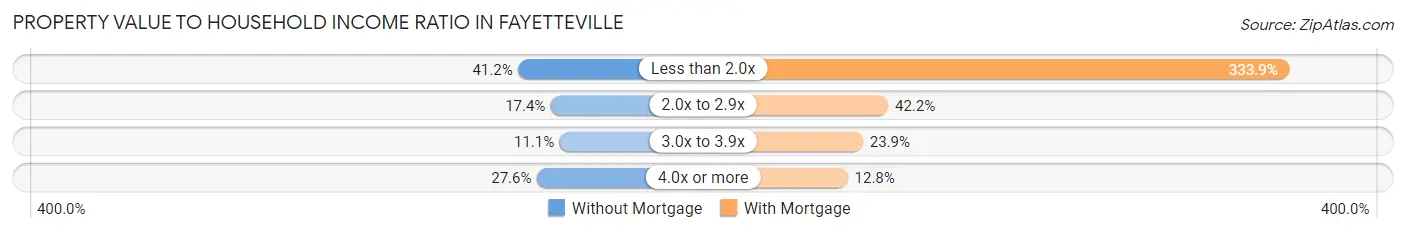
| Value-to-Income Ratio | Without Mortgage | With Mortgage |
| Less than 2.0x | 5,185 (41.2%) | 80,676 (333.9%) |
| 2.0x to 2.9x | 2,194 (17.4%) | 10,200 (42.2%) |
| 3.0x to 3.9x | 1,390 (11.1%) | 5,771 (23.9%) |
| 4.0x or more | 3,468 (27.6%) | 3,101 (12.8%) |
| Total | 12,578 (100.0%) | 24,161 (100.0%) |
Real Estate Taxes by Mortgage Status in Fayetteville
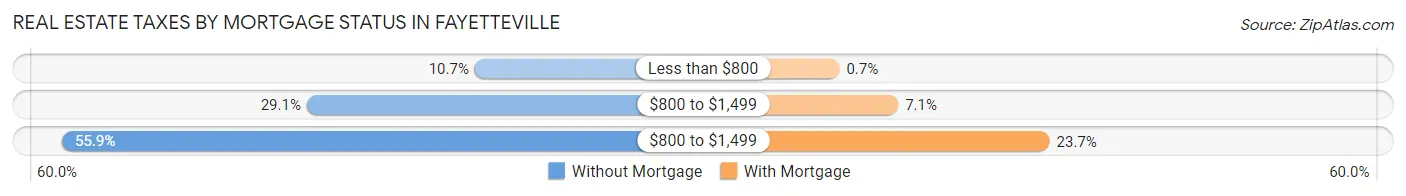
| Property Taxes | Without Mortgage | With Mortgage |
| Less than $800 | 1,342 (10.7%) | 168 (0.7%) |
| $800 to $1,499 | 3,658 (29.1%) | 1,724 (7.1%) |
| $800 to $1,499 | 7,031 (55.9%) | 5,736 (23.7%) |
| Total | 12,578 (100.0%) | 24,161 (100.0%) |
Health & Disability in Fayetteville
Health Insurance Coverage by Age in Fayetteville
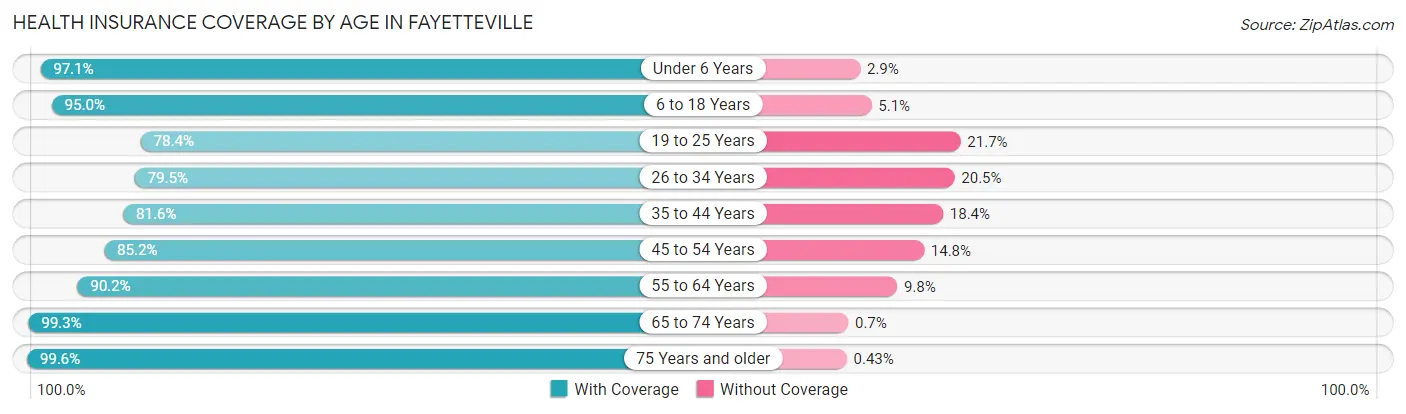
| Age Bracket | With Coverage | Without Coverage |
| Under 6 Years | 18,467 (97.1%) | 558 (2.9%) |
| 6 to 18 Years | 30,825 (95.0%) | 1,639 (5.1%) |
| 19 to 25 Years | 14,961 (78.3%) | 4,135 (21.6%) |
| 26 to 34 Years | 20,093 (79.5%) | 5,191 (20.5%) |
| 35 to 44 Years | 17,159 (81.6%) | 3,865 (18.4%) |
| 45 to 54 Years | 15,286 (85.2%) | 2,664 (14.8%) |
| 55 to 64 Years | 18,075 (90.2%) | 1,971 (9.8%) |
| 65 to 74 Years | 15,010 (99.3%) | 106 (0.7%) |
| 75 Years and older | 10,402 (99.6%) | 45 (0.4%) |
| Total | 160,278 (88.8%) | 20,174 (11.2%) |
Health Insurance Coverage by Citizenship Status in Fayetteville
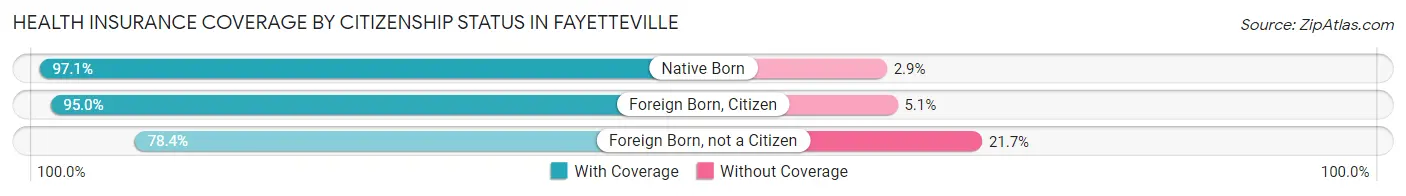
| Citizenship Status | With Coverage | Without Coverage |
| Native Born | 18,467 (97.1%) | 558 (2.9%) |
| Foreign Born, Citizen | 30,825 (95.0%) | 1,639 (5.1%) |
| Foreign Born, not a Citizen | 14,961 (78.3%) | 4,135 (21.6%) |
Health Insurance Coverage by Household Income in Fayetteville
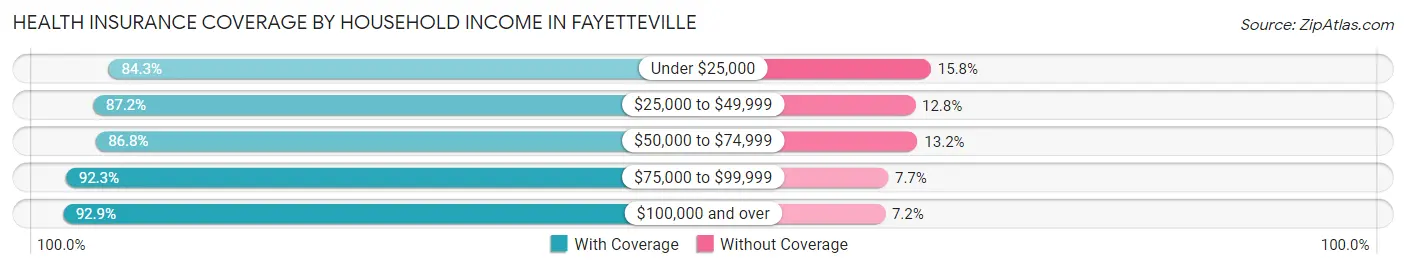
| Household Income | With Coverage | Without Coverage |
| Under $25,000 | 26,006 (84.3%) | 4,862 (15.8%) |
| $25,000 to $49,999 | 36,341 (87.2%) | 5,330 (12.8%) |
| $50,000 to $74,999 | 29,065 (86.8%) | 4,431 (13.2%) |
| $75,000 to $99,999 | 23,292 (92.3%) | 1,952 (7.7%) |
| $100,000 and over | 43,944 (92.8%) | 3,382 (7.1%) |
Public vs Private Health Insurance Coverage by Age in Fayetteville
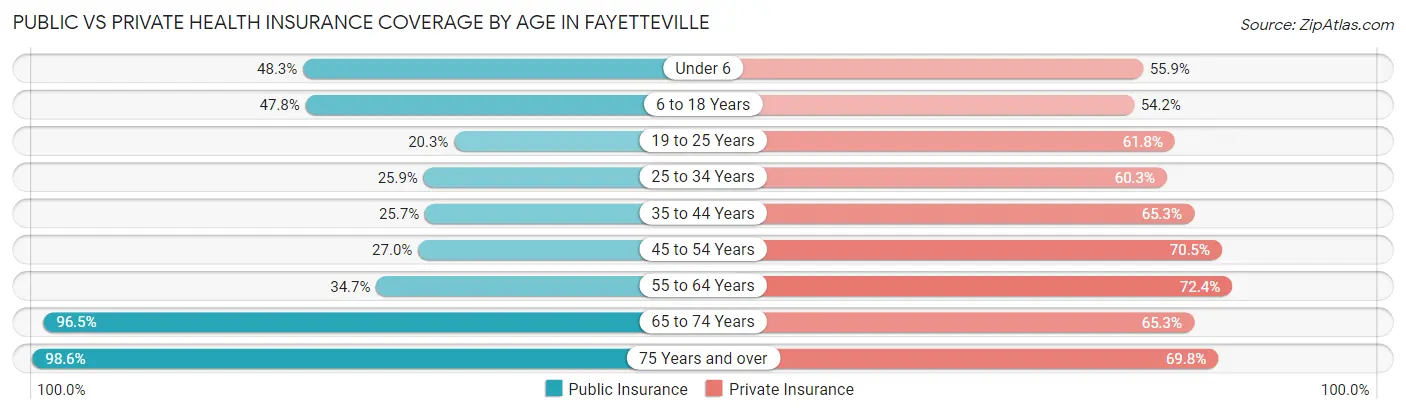
| Age Bracket | Public Insurance | Private Insurance |
| Under 6 | 9,189 (48.3%) | 10,625 (55.8%) |
| 6 to 18 Years | 15,530 (47.8%) | 17,588 (54.2%) |
| 19 to 25 Years | 3,868 (20.3%) | 11,801 (61.8%) |
| 25 to 34 Years | 6,553 (25.9%) | 15,252 (60.3%) |
| 35 to 44 Years | 5,397 (25.7%) | 13,735 (65.3%) |
| 45 to 54 Years | 4,837 (27.0%) | 12,662 (70.5%) |
| 55 to 64 Years | 6,960 (34.7%) | 14,518 (72.4%) |
| 65 to 74 Years | 14,592 (96.5%) | 9,876 (65.3%) |
| 75 Years and over | 10,295 (98.6%) | 7,294 (69.8%) |
| Total | 77,221 (42.8%) | 113,351 (62.8%) |
Disability Status by Sex by Age in Fayetteville
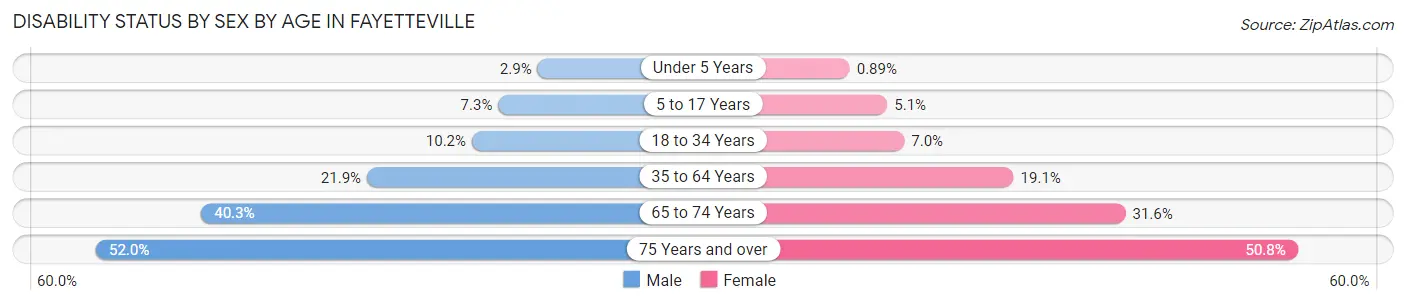
| Age Bracket | Male | Female |
| Under 5 Years | 225 (2.9%) | 72 (0.9%) |
| 5 to 17 Years | 1,221 (7.2%) | 832 (5.1%) |
| 18 to 34 Years | 2,055 (10.2%) | 1,852 (7.0%) |
| 35 to 64 Years | 5,668 (21.9%) | 6,338 (19.1%) |
| 65 to 74 Years | 2,725 (40.3%) | 2,641 (31.6%) |
| 75 Years and over | 2,052 (52.0%) | 3,301 (50.7%) |
Disability Class by Sex by Age in Fayetteville
Disability Class: Hearing Difficulty
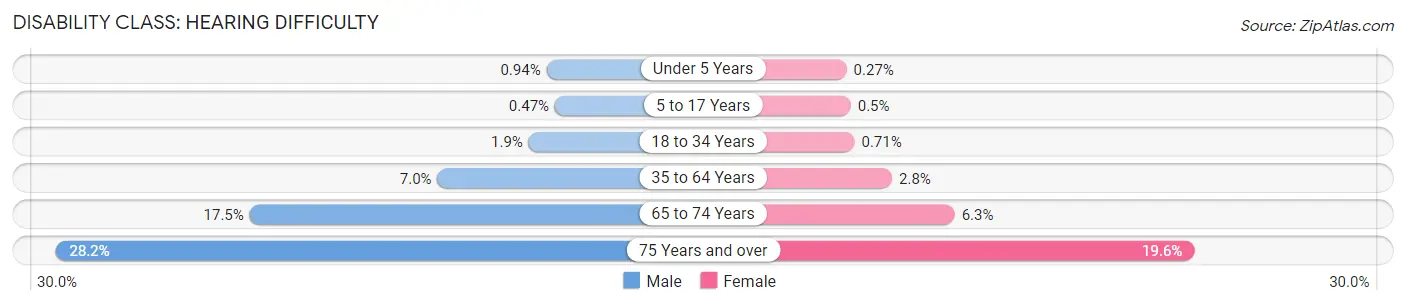
| Age Bracket | Male | Female |
| Under 5 Years | 73 (0.9%) | 22 (0.3%) |
| 5 to 17 Years | 80 (0.5%) | 82 (0.5%) |
| 18 to 34 Years | 389 (1.9%) | 188 (0.7%) |
| 35 to 64 Years | 1,815 (7.0%) | 928 (2.8%) |
| 65 to 74 Years | 1,181 (17.5%) | 526 (6.3%) |
| 75 Years and over | 1,113 (28.2%) | 1,276 (19.6%) |
Disability Class: Vision Difficulty
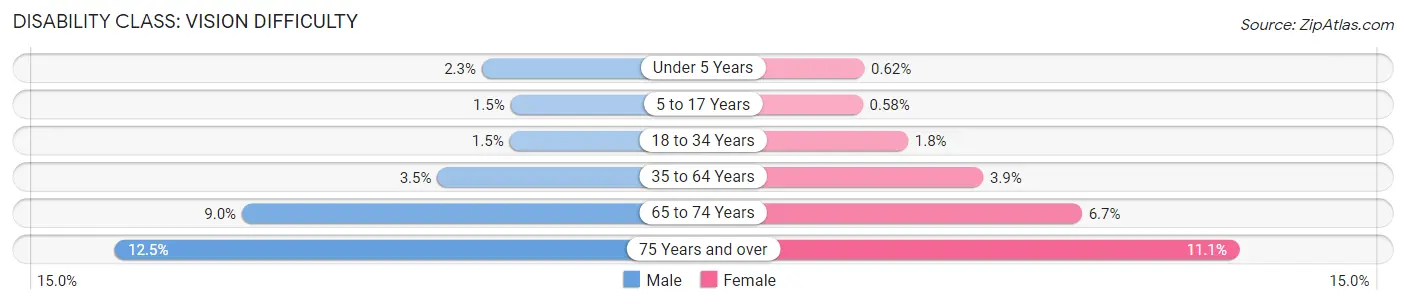
| Age Bracket | Male | Female |
| Under 5 Years | 177 (2.3%) | 50 (0.6%) |
| 5 to 17 Years | 248 (1.5%) | 96 (0.6%) |
| 18 to 34 Years | 303 (1.5%) | 488 (1.8%) |
| 35 to 64 Years | 910 (3.5%) | 1,301 (3.9%) |
| 65 to 74 Years | 605 (8.9%) | 558 (6.7%) |
| 75 Years and over | 492 (12.5%) | 719 (11.1%) |
Disability Class: Cognitive Difficulty
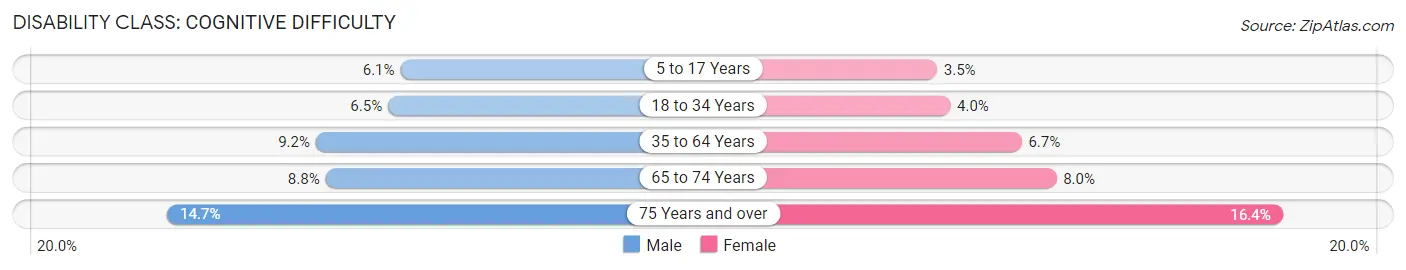
| Age Bracket | Male | Female |
| 5 to 17 Years | 1,020 (6.0%) | 580 (3.5%) |
| 18 to 34 Years | 1,313 (6.5%) | 1,069 (4.0%) |
| 35 to 64 Years | 2,381 (9.2%) | 2,210 (6.7%) |
| 65 to 74 Years | 597 (8.8%) | 665 (8.0%) |
| 75 Years and over | 580 (14.7%) | 1,064 (16.4%) |
Disability Class: Ambulatory Difficulty
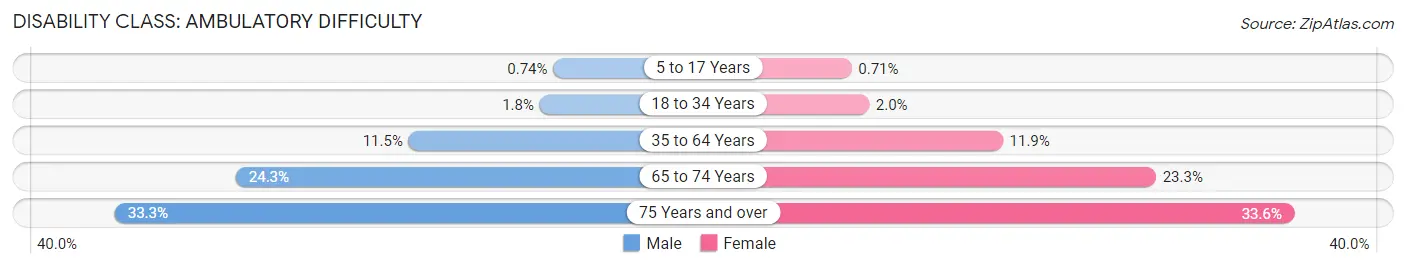
| Age Bracket | Male | Female |
| 5 to 17 Years | 125 (0.7%) | 116 (0.7%) |
| 18 to 34 Years | 352 (1.8%) | 535 (2.0%) |
| 35 to 64 Years | 2,974 (11.5%) | 3,953 (11.9%) |
| 65 to 74 Years | 1,643 (24.3%) | 1,948 (23.3%) |
| 75 Years and over | 1,313 (33.3%) | 2,182 (33.6%) |
Disability Class: Self-Care Difficulty
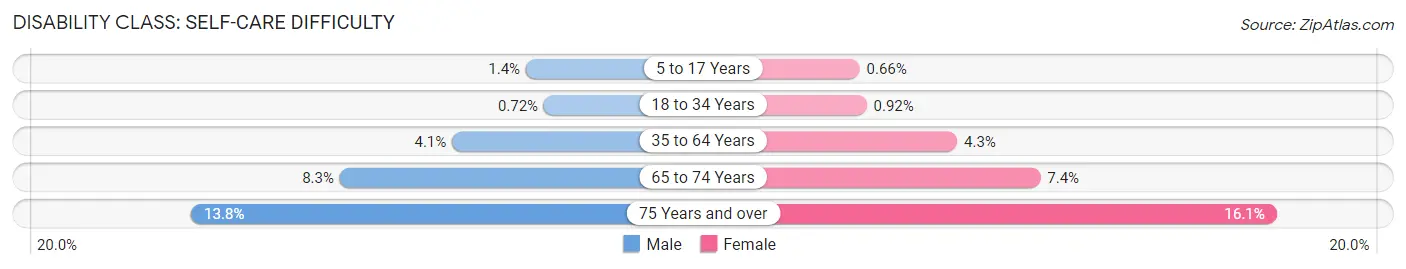
| Age Bracket | Male | Female |
| 5 to 17 Years | 235 (1.4%) | 108 (0.7%) |
| 18 to 34 Years | 145 (0.7%) | 245 (0.9%) |
| 35 to 64 Years | 1,071 (4.1%) | 1,418 (4.3%) |
| 65 to 74 Years | 561 (8.3%) | 616 (7.4%) |
| 75 Years and over | 545 (13.8%) | 1,050 (16.1%) |
Technology Access in Fayetteville
Computing Device Access in Fayetteville
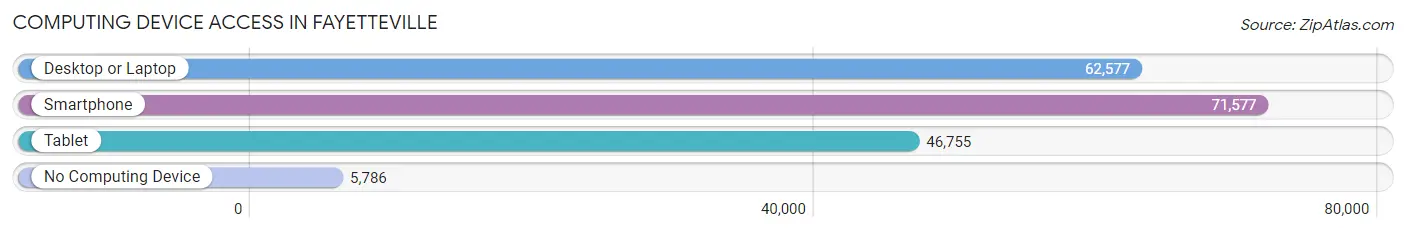
| Device Type | # Households | % Households |
| Desktop or Laptop | 62,577 | 77.4% |
| Smartphone | 71,577 | 88.5% |
| Tablet | 46,755 | 57.8% |
| No Computing Device | 5,786 | 7.2% |
| Total | 80,852 | 100.0% |
Internet Access in Fayetteville
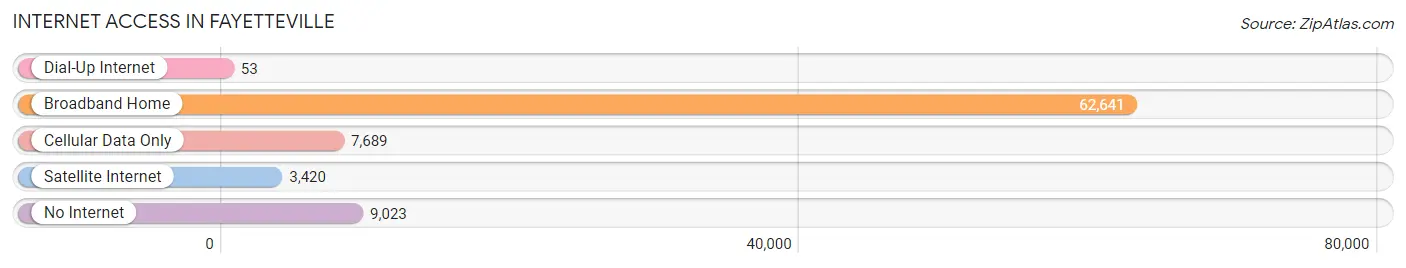
| Internet Type | # Households | % Households |
| Dial-Up Internet | 53 | 0.1% |
| Broadband Home | 62,641 | 77.5% |
| Cellular Data Only | 7,689 | 9.5% |
| Satellite Internet | 3,420 | 4.2% |
| No Internet | 9,023 | 11.2% |
| Total | 80,852 | 100.0% |
Fayetteville Summary
Fayetteville, North Carolina is a city located in Cumberland County in the state of North Carolina. It is the county seat of Cumberland County and is the sixth-largest city in the state. The city is situated in the Sandhills region of North Carolina and is located in the southeastern part of the state, near the border with South Carolina. Fayetteville is home to Fort Bragg, a major U.S. Army installation, and Pope Air Force Base, which is adjacent to Fort Bragg.
Geography
Fayetteville is located in the Sandhills region of North Carolina, which is characterized by rolling hills and sandy soils. The city is situated in the southeastern part of the state, near the border with South Carolina. The city is located at the intersection of Interstate 95 and U.S. Route 401, and is approximately 60 miles south of Raleigh, the state capital. The city is located in the Cape Fear River basin, and is bordered by the towns of Hope Mills, Spring Lake, and Wade.
The city has a total area of approximately 75 square miles, of which 73.3 square miles is land and 1.7 square miles is water. The city is located at an elevation of approximately 200 feet above sea level.
Climate
Fayetteville has a humid subtropical climate, with hot, humid summers and mild winters. The average annual temperature is approximately 61 degrees Fahrenheit, with an average high of 79 degrees Fahrenheit in July and an average low of 43 degrees Fahrenheit in January. The average annual precipitation is approximately 47 inches, with an average of 4.5 inches of snowfall per year.
Demographics
As of the 2010 census, the population of Fayetteville was 203,924, making it the sixth-largest city in North Carolina. The population density was 2,717 people per square mile. The racial makeup of the city was 54.3% White, 33.2% African American, 0.5% Native American, 3.2% Asian, 0.1% Pacific Islander, 5.7% from other races, and 2.9% from two or more races. Hispanic or Latino of any race were 11.2% of the population.
The median household income in Fayetteville was $41,845, and the median family income was $50,845. The per capita income was $21,845. About 17.2% of the population was below the poverty line.
Economy
Fayetteville is home to a number of major employers, including Fort Bragg, Pope Air Force Base, and Fayetteville State University. The city is also home to a number of manufacturing and technology companies, including Goodyear Tire and Rubber Company, General Electric, and IBM.
The city's economy is also supported by a number of retail and service businesses, including restaurants, hotels, and entertainment venues. The city is also home to a number of cultural attractions, including the Airborne and Special Operations Museum, the Fayetteville Museum of Art, and the Cape Fear Botanical Garden.
Conclusion
Fayetteville, North Carolina is a city located in Cumberland County in the state of North Carolina. It is the county seat of Cumberland County and is the sixth-largest city in the state. The city is situated in the Sandhills region of North Carolina and is located in the southeastern part of the state, near the border with South Carolina. Fayetteville is home to Fort Bragg, a major U.S. Army installation, and Pope Air Force Base, which is adjacent to Fort Bragg. The city has a humid subtropical climate, with hot, humid summers and mild winters. As of the 2010 census, the population of Fayetteville was 203,924, making it the sixth-largest city in North Carolina. The city's economy is supported by a number of major employers, including Fort Bragg, Pope Air Force Base, and Fayetteville State University, as well as a number of manufacturing and technology companies, retail and service businesses, and cultural attractions.
Common Questions
What is Per Capita Income in Fayetteville?
Per Capita income in Fayetteville is $30,039.
What is the Median Family Income in Fayetteville?
Median Family Income in Fayetteville is $63,485.
What is the Median Household income in Fayetteville?
Median Household Income in Fayetteville is $53,424.
What is Income or Wage Gap in Fayetteville?
Income or Wage Gap in Fayetteville is 15.3%.
Women in Fayetteville earn 84.7 cents for every dollar earned by a man.
What is Family Income Deficit in Fayetteville?
Family Income Deficit in Fayetteville is $10,693.
Families that are below poverty line in Fayetteville earn $10,693 less on average than the poverty threshold level.
What is Inequality or Gini Index in Fayetteville?
Inequality or Gini Index in Fayetteville is 0.45.
What is the Total Population of Fayetteville?
Total Population of Fayetteville is 208,697.
What is the Total Male Population of Fayetteville?
Total Male Population of Fayetteville is 106,029.
What is the Total Female Population of Fayetteville?
Total Female Population of Fayetteville is 102,668.
What is the Ratio of Males per 100 Females in Fayetteville?
There are 103.27 Males per 100 Females in Fayetteville.
What is the Ratio of Females per 100 Males in Fayetteville?
There are 96.83 Females per 100 Males in Fayetteville.
What is the Median Population Age in Fayetteville?
Median Population Age in Fayetteville is 30.5 Years.
What is the Average Family Size in Fayetteville
Average Family Size in Fayetteville is 3.1 People.
What is the Average Household Size in Fayetteville
Average Household Size in Fayetteville is 2.4 People.
How Large is the Labor Force in Fayetteville?
There are 108,889 People in the Labor Forcein in Fayetteville.
What is the Percentage of People in the Labor Force in Fayetteville?
66.4% of People are in the Labor Force in Fayetteville.
What is the Unemployment Rate in Fayetteville?
Unemployment Rate in Fayetteville is 8.4%.