Baton Rouge, LA Map & Demographics
Baton Rouge Map
Baton Rouge Overview
$33,910
PER CAPITA INCOME
$68,228
AVG FAMILY INCOME
$50,155
AVG HOUSEHOLD INCOME
30.7%
WAGE / INCOME GAP [ % ]
69.3¢/ $1
WAGE / INCOME GAP [ $ ]
$10,881
FAMILY INCOME DEFICIT
0.55
INEQUALITY / GINI INDEX
225,500
TOTAL POPULATION
107,800
MALE POPULATION
117,700
FEMALE POPULATION
91.59
MALES / 100 FEMALES
109.18
FEMALES / 100 MALES
31.9
MEDIAN AGE
3.3
AVG FAMILY SIZE
2.5
AVG HOUSEHOLD SIZE
114,813
LABOR FORCE [ PEOPLE ]
62.1%
PERCENT IN LABOR FORCE
8.6%
UNEMPLOYMENT RATE
Baton Rouge Zip Codes
Baton Rouge Area Codes
Income in Baton Rouge
Income Overview in Baton Rouge
Per Capita Income in Baton Rouge is $33,910, while median incomes of families and households are $68,228 and $50,155 respectively.
| Characteristic | Number | Measure |
| Per Capita Income | 225,500 | $33,910 |
| Median Family Income | 45,461 | $68,228 |
| Mean Family Income | 45,461 | $105,417 |
| Median Household Income | 87,486 | $50,155 |
| Mean Household Income | 87,486 | $83,025 |
| Income Deficit | 45,461 | $10,881 |
| Wage / Income Gap (%) | 225,500 | 30.67% |
| Wage / Income Gap ($) | 225,500 | 69.33¢ per $1 |
| Gini / Inequality Index | 225,500 | 0.55 |
Earnings by Sex in Baton Rouge
Average Earnings in Baton Rouge are $31,750, $38,094 for men and $26,409 for women, a difference of 30.7%.
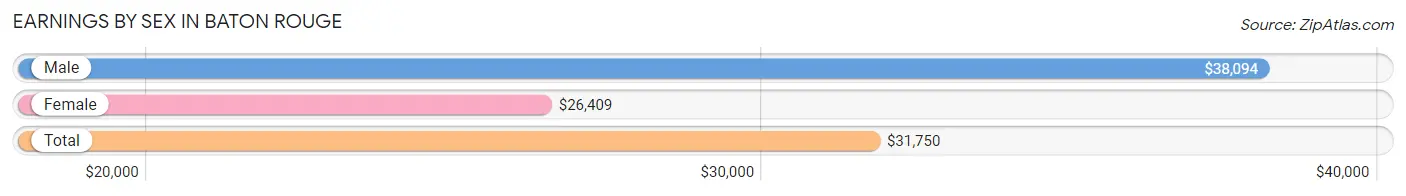
| Sex | Number | Average Earnings |
| Male | 58,945 (49.4%) | $38,094 |
| Female | 60,368 (50.6%) | $26,409 |
| Total | 119,313 (100.0%) | $31,750 |
Earnings by Sex by Income Bracket in Baton Rouge
The most common earnings brackets in Baton Rouge are $100,000+ for men (8,933 | 15.1%) and $25,000 to $29,999 for women (4,793 | 7.9%).
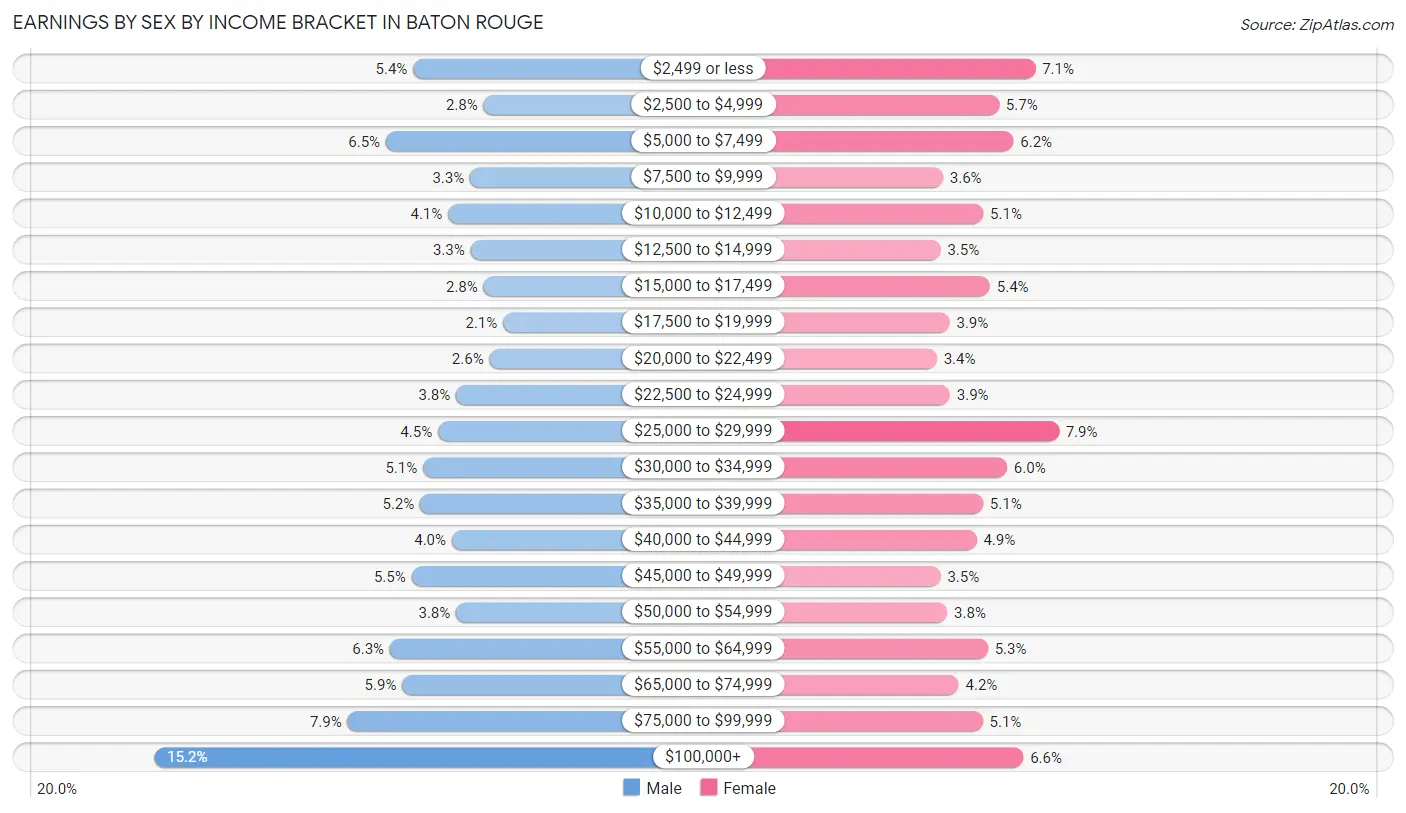
| Income | Male | Female |
| $2,499 or less | 3,205 (5.4%) | 4,261 (7.1%) |
| $2,500 to $4,999 | 1,653 (2.8%) | 3,442 (5.7%) |
| $5,000 to $7,499 | 3,808 (6.5%) | 3,769 (6.2%) |
| $7,500 to $9,999 | 1,954 (3.3%) | 2,176 (3.6%) |
| $10,000 to $12,499 | 2,433 (4.1%) | 3,082 (5.1%) |
| $12,500 to $14,999 | 1,941 (3.3%) | 2,118 (3.5%) |
| $15,000 to $17,499 | 1,649 (2.8%) | 3,236 (5.4%) |
| $17,500 to $19,999 | 1,218 (2.1%) | 2,327 (3.8%) |
| $20,000 to $22,499 | 1,519 (2.6%) | 2,034 (3.4%) |
| $22,500 to $24,999 | 2,257 (3.8%) | 2,328 (3.9%) |
| $25,000 to $29,999 | 2,659 (4.5%) | 4,793 (7.9%) |
| $30,000 to $34,999 | 2,986 (5.1%) | 3,625 (6.0%) |
| $35,000 to $39,999 | 3,052 (5.2%) | 3,076 (5.1%) |
| $40,000 to $44,999 | 2,350 (4.0%) | 2,935 (4.9%) |
| $45,000 to $49,999 | 3,244 (5.5%) | 2,119 (3.5%) |
| $50,000 to $54,999 | 2,255 (3.8%) | 2,269 (3.8%) |
| $55,000 to $64,999 | 3,720 (6.3%) | 3,186 (5.3%) |
| $65,000 to $74,999 | 3,450 (5.9%) | 2,530 (4.2%) |
| $75,000 to $99,999 | 4,659 (7.9%) | 3,070 (5.1%) |
| $100,000+ | 8,933 (15.1%) | 3,992 (6.6%) |
| Total | 58,945 (100.0%) | 60,368 (100.0%) |
Earnings by Sex by Educational Attainment in Baton Rouge
Average earnings in Baton Rouge are $50,185 for men and $34,944 for women, a difference of 30.4%. Men with an educational attainment of graduate degree enjoy the highest average annual earnings of $91,176, while those with less than high school education earn the least with $27,799. Women with an educational attainment of graduate degree earn the most with the average annual earnings of $55,973, while those with less than high school education have the smallest earnings of $21,503.
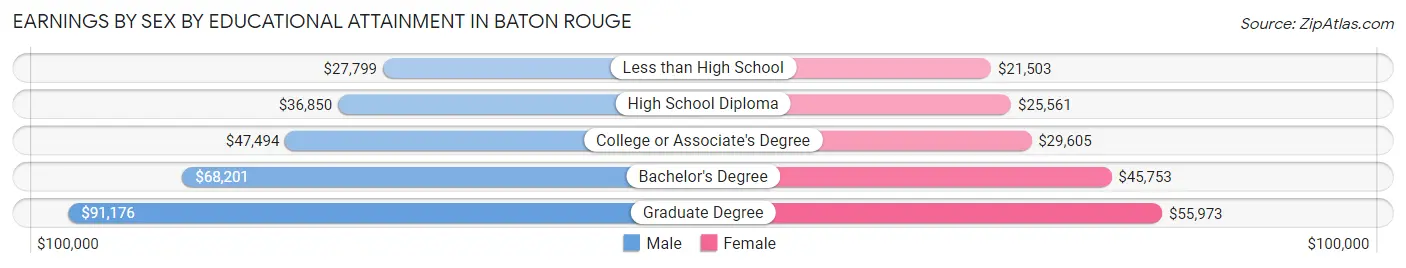
| Educational Attainment | Male Income | Female Income |
| Less than High School | $27,799 | $21,503 |
| High School Diploma | $36,850 | $25,561 |
| College or Associate's Degree | $47,494 | $29,605 |
| Bachelor's Degree | $68,201 | $45,753 |
| Graduate Degree | $91,176 | $55,973 |
| Total | $50,185 | $34,944 |
Family Income in Baton Rouge
Family Income Brackets in Baton Rouge
According to the Baton Rouge family income data, there are 7,001 families falling into the $100,000 to $149,999 income range, which is the most common income bracket and makes up 15.4% of all families. Conversely, the $10,000 to $14,999 income bracket is the least frequent group with only 2,091 families (4.6%) belonging to this category.
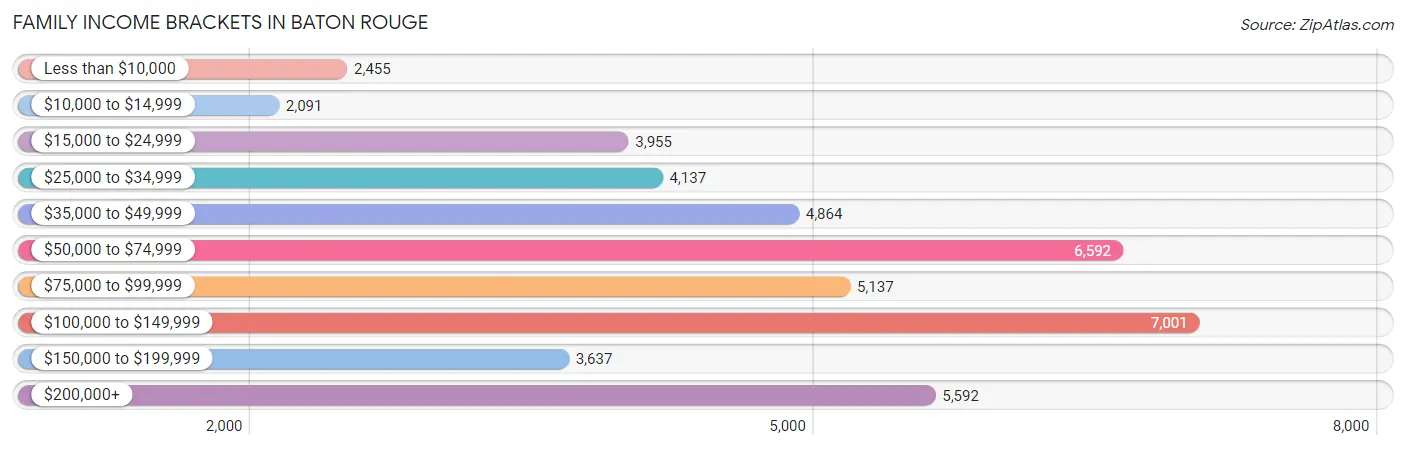
| Income Bracket | # Families | % Families |
| Less than $10,000 | 2,455 | 5.4% |
| $10,000 to $14,999 | 2,091 | 4.6% |
| $15,000 to $24,999 | 3,955 | 8.7% |
| $25,000 to $34,999 | 4,137 | 9.1% |
| $35,000 to $49,999 | 4,864 | 10.7% |
| $50,000 to $74,999 | 6,592 | 14.5% |
| $75,000 to $99,999 | 5,137 | 11.3% |
| $100,000 to $149,999 | 7,001 | 15.4% |
| $150,000 to $199,999 | 3,637 | 8.0% |
| $200,000+ | 5,592 | 12.3% |
Family Income by Famaliy Size in Baton Rouge
7+ person families (646 | 1.4%) account for the highest median family income in Baton Rouge with $97,237 per family, while 2-person families (22,246 | 48.9%) have the highest median income of $33,330 per family member.
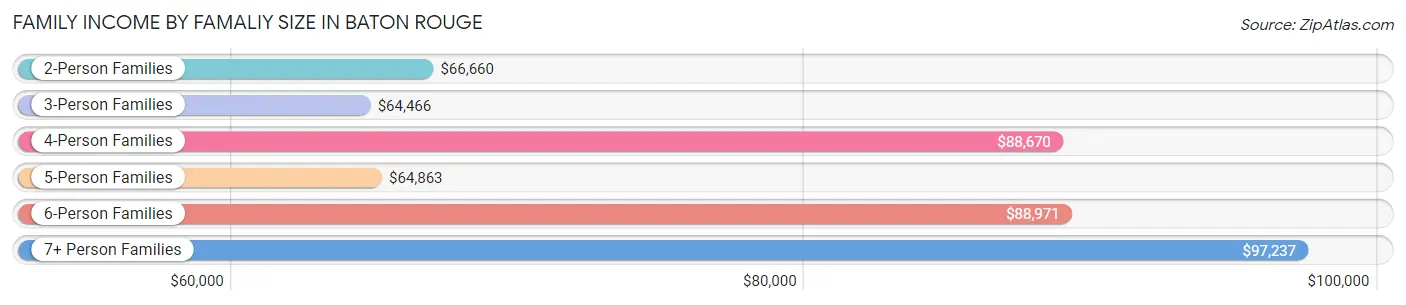
| Income Bracket | # Families | Median Income |
| 2-Person Families | 22,246 (48.9%) | $66,660 |
| 3-Person Families | 11,463 (25.2%) | $64,466 |
| 4-Person Families | 6,831 (15.0%) | $88,670 |
| 5-Person Families | 3,503 (7.7%) | $64,863 |
| 6-Person Families | 772 (1.7%) | $88,971 |
| 7+ Person Families | 646 (1.4%) | $97,237 |
| Total | 45,461 (100.0%) | $68,228 |
Family Income by Number of Earners in Baton Rouge
The median family income in Baton Rouge is $68,228, with families comprising 3+ earners (3,403) having the highest median family income of $137,686, while families with no earners (7,092) have the lowest median family income of $30,380, accounting for 7.5% and 15.6% of families, respectively.
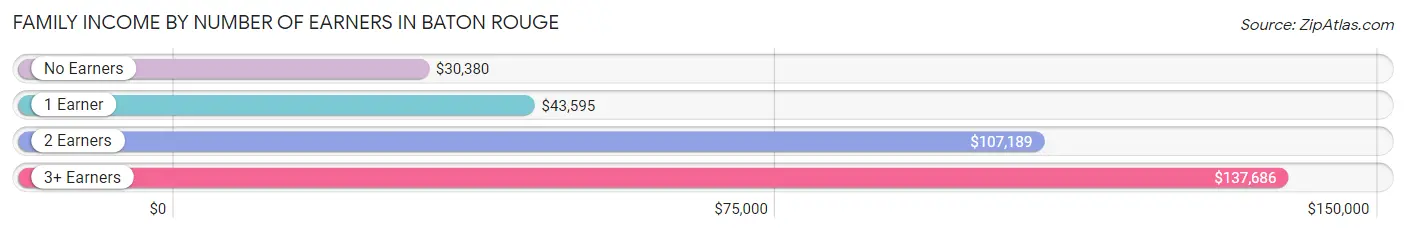
| Number of Earners | # Families | Median Income |
| No Earners | 7,092 (15.6%) | $30,380 |
| 1 Earner | 17,653 (38.8%) | $43,595 |
| 2 Earners | 17,313 (38.1%) | $107,189 |
| 3+ Earners | 3,403 (7.5%) | $137,686 |
| Total | 45,461 (100.0%) | $68,228 |
Household Income in Baton Rouge
Household Income Brackets in Baton Rouge
With 13,385 households falling in the category, the $50,000 to $74,999 income range is the most frequent in Baton Rouge, accounting for 15.3% of all households. In contrast, only 4,724 households (5.4%) fall into the $150,000 to $199,999 income bracket, making it the least populous group.
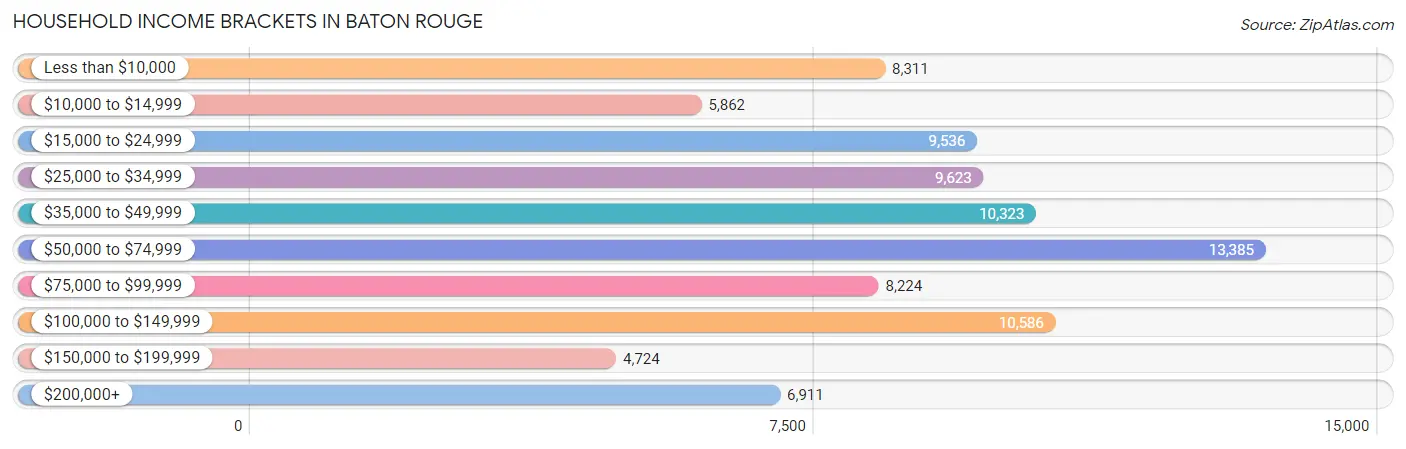
| Income Bracket | # Households | % Households |
| Less than $10,000 | 8,311 | 9.5% |
| $10,000 to $14,999 | 5,862 | 6.7% |
| $15,000 to $24,999 | 9,536 | 10.9% |
| $25,000 to $34,999 | 9,623 | 11.0% |
| $35,000 to $49,999 | 10,323 | 11.8% |
| $50,000 to $74,999 | 13,385 | 15.3% |
| $75,000 to $99,999 | 8,224 | 9.4% |
| $100,000 to $149,999 | 10,586 | 12.1% |
| $150,000 to $199,999 | 4,724 | 5.4% |
| $200,000+ | 6,911 | 7.9% |
Household Income by Householder Age in Baton Rouge
The median household income in Baton Rouge is $50,155, with the highest median household income of $58,727 found in the 45 to 64 years age bracket for the primary householder. A total of 28,050 households (32.1%) fall into this category. Meanwhile, the 15 to 24 years age bracket for the primary householder has the lowest median household income of $26,542, with 9,721 households (11.1%) in this group.
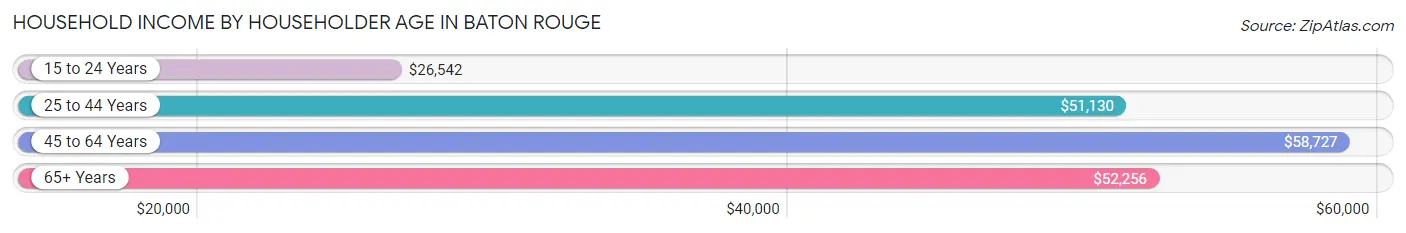
| Income Bracket | # Households | Median Income |
| 15 to 24 Years | 9,721 (11.1%) | $26,542 |
| 25 to 44 Years | 28,220 (32.3%) | $51,130 |
| 45 to 64 Years | 28,050 (32.1%) | $58,727 |
| 65+ Years | 21,495 (24.6%) | $52,256 |
| Total | 87,486 (100.0%) | $50,155 |
Poverty in Baton Rouge
Income Below Poverty by Sex and Age in Baton Rouge
With 22.9% poverty level for males and 25.0% for females among the residents of Baton Rouge, 5 year old males and 18 to 24 year old females are the most vulnerable to poverty, with 561 males (47.5%) and 8,529 females (48.7%) in their respective age groups living below the poverty level.
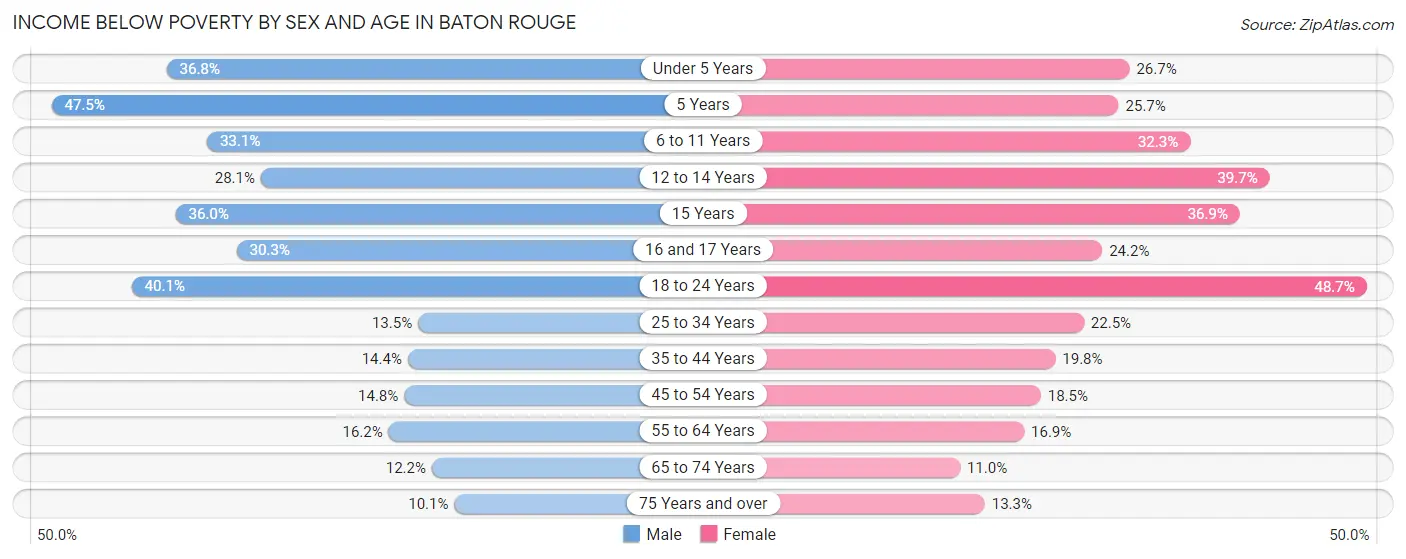
| Age Bracket | Male | Female |
| Under 5 Years | 2,795 (36.8%) | 1,754 (26.7%) |
| 5 Years | 561 (47.5%) | 306 (25.7%) |
| 6 to 11 Years | 2,390 (33.1%) | 2,183 (32.3%) |
| 12 to 14 Years | 874 (28.1%) | 1,322 (39.7%) |
| 15 Years | 555 (36.0%) | 370 (36.9%) |
| 16 and 17 Years | 904 (30.3%) | 546 (24.2%) |
| 18 to 24 Years | 6,818 (40.1%) | 8,529 (48.7%) |
| 25 to 34 Years | 2,086 (13.5%) | 3,575 (22.5%) |
| 35 to 44 Years | 1,686 (14.4%) | 2,549 (19.8%) |
| 45 to 54 Years | 1,577 (14.8%) | 2,127 (18.5%) |
| 55 to 64 Years | 1,899 (16.2%) | 2,273 (16.9%) |
| 65 to 74 Years | 965 (12.2%) | 1,143 (11.0%) |
| 75 Years and over | 505 (10.1%) | 1,061 (13.3%) |
| Total | 23,615 (22.9%) | 27,738 (25.0%) |
Income Above Poverty by Sex and Age in Baton Rouge
According to the poverty statistics in Baton Rouge, males aged 75 years and over and females aged 65 to 74 years are the age groups that are most secure financially, with 89.9% of males and 89.0% of females in these age groups living above the poverty line.
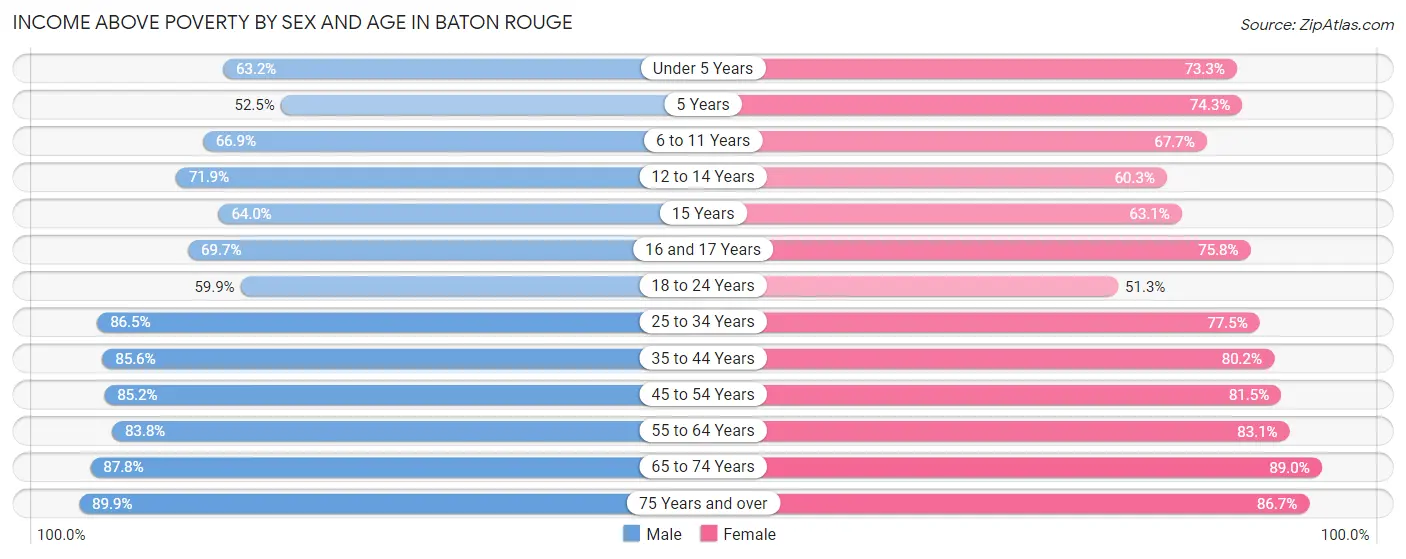
| Age Bracket | Male | Female |
| Under 5 Years | 4,795 (63.2%) | 4,816 (73.3%) |
| 5 Years | 620 (52.5%) | 885 (74.3%) |
| 6 to 11 Years | 4,837 (66.9%) | 4,573 (67.7%) |
| 12 to 14 Years | 2,238 (71.9%) | 2,009 (60.3%) |
| 15 Years | 987 (64.0%) | 632 (63.1%) |
| 16 and 17 Years | 2,077 (69.7%) | 1,713 (75.8%) |
| 18 to 24 Years | 10,203 (59.9%) | 8,984 (51.3%) |
| 25 to 34 Years | 13,383 (86.5%) | 12,336 (77.5%) |
| 35 to 44 Years | 9,988 (85.6%) | 10,313 (80.2%) |
| 45 to 54 Years | 9,096 (85.2%) | 9,389 (81.5%) |
| 55 to 64 Years | 9,808 (83.8%) | 11,158 (83.1%) |
| 65 to 74 Years | 6,939 (87.8%) | 9,279 (89.0%) |
| 75 Years and over | 4,483 (89.9%) | 6,936 (86.7%) |
| Total | 79,454 (77.1%) | 83,023 (75.0%) |
Income Below Poverty Among Married-Couple Families in Baton Rouge
The poverty statistics for married-couple families in Baton Rouge show that 5.2% or 1,322 of the total 25,448 families live below the poverty line. Families with 3 or 4 children have the highest poverty rate of 11.2%, comprising of 174 families. On the other hand, families with 5 or more children have the lowest poverty rate of 1.5%, which includes 2 families.
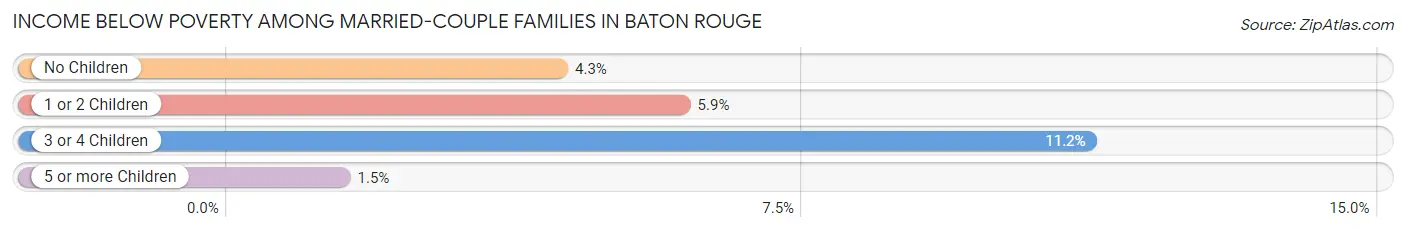
| Children | Above Poverty | Below Poverty |
| No Children | 15,425 (95.7%) | 694 (4.3%) |
| 1 or 2 Children | 7,190 (94.1%) | 452 (5.9%) |
| 3 or 4 Children | 1,377 (88.8%) | 174 (11.2%) |
| 5 or more Children | 134 (98.5%) | 2 (1.5%) |
| Total | 24,126 (94.8%) | 1,322 (5.2%) |
Income Below Poverty Among Single-Parent Households in Baton Rouge
According to the poverty data in Baton Rouge, 27.0% or 1,066 single-father households and 34.4% or 5,532 single-mother households are living below the poverty line. Among single-father households, those with 5 or more children have the highest poverty rate, with 22 households (84.6%) experiencing poverty. Likewise, among single-mother households, those with 5 or more children have the highest poverty rate, with 124 households (76.5%) falling below the poverty line.
| Children | Single Father | Single Mother |
| No Children | 363 (17.4%) | 1,133 (17.1%) |
| 1 or 2 Children | 648 (37.0%) | 3,143 (42.3%) |
| 3 or 4 Children | 33 (41.8%) | 1,132 (61.7%) |
| 5 or more Children | 22 (84.6%) | 124 (76.5%) |
| Total | 1,066 (27.0%) | 5,532 (34.4%) |
Income Below Poverty Among Married-Couple vs Single-Parent Households in Baton Rouge
The poverty data for Baton Rouge shows that 1,322 of the married-couple family households (5.2%) and 6,598 of the single-parent households (33.0%) are living below the poverty level. Within the married-couple family households, those with 3 or 4 children have the highest poverty rate, with 174 households (11.2%) falling below the poverty line. Among the single-parent households, those with 5 or more children have the highest poverty rate, with 146 household (77.7%) living below poverty.
| Children | Married-Couple Families | Single-Parent Households |
| No Children | 694 (4.3%) | 1,496 (17.1%) |
| 1 or 2 Children | 452 (5.9%) | 3,791 (41.3%) |
| 3 or 4 Children | 174 (11.2%) | 1,165 (60.9%) |
| 5 or more Children | 2 (1.5%) | 146 (77.7%) |
| Total | 1,322 (5.2%) | 6,598 (33.0%) |
Race in Baton Rouge
The most populous races in Baton Rouge are Black / African American (118,457 | 52.5%), White / Caucasian (83,917 | 37.2%), and Hispanic or Latino (9,856 | 4.4%).
| Race | # Population | % Population |
| Asian | 8,617 | 3.8% |
| Black / African American | 118,457 | 52.5% |
| Hawaiian / Pacific | 0 | 0.0% |
| Hispanic or Latino | 9,856 | 4.4% |
| Native / Alaskan | 362 | 0.2% |
| White / Caucasian | 83,917 | 37.2% |
| Two or more Races | 9,117 | 4.0% |
| Some other Race | 5,030 | 2.2% |
| Total | 225,500 | 100.0% |
Ancestry in Baton Rouge
The most populous ancestries reported in Baton Rouge are French (14,161 | 6.3%), German (12,223 | 5.4%), American (11,913 | 5.3%), English (11,892 | 5.3%), and Irish (10,243 | 4.5%), together accounting for 26.8% of all Baton Rouge residents.
| Ancestry | # Population | % Population |
| African | 2,250 | 1.0% |
| Alaska Native | 20 | 0.0% |
| American | 11,913 | 5.3% |
| Arab | 1,894 | 0.8% |
| Argentinean | 10 | 0.0% |
| Armenian | 79 | 0.0% |
| Australian | 138 | 0.1% |
| Austrian | 87 | 0.0% |
| Basque | 21 | 0.0% |
| Belgian | 160 | 0.1% |
| Belizean | 31 | 0.0% |
| Bhutanese | 125 | 0.1% |
| Blackfeet | 12 | 0.0% |
| Brazilian | 34 | 0.0% |
| British | 541 | 0.2% |
| Bulgarian | 41 | 0.0% |
| Burmese | 318 | 0.1% |
| Cajun | 957 | 0.4% |
| Canadian | 71 | 0.0% |
| Cape Verdean | 20 | 0.0% |
| Celtic | 6 | 0.0% |
| Central American | 4,755 | 2.1% |
| Central American Indian | 19 | 0.0% |
| Cherokee | 236 | 0.1% |
| Chickasaw | 16 | 0.0% |
| Chilean | 2 | 0.0% |
| Choctaw | 316 | 0.1% |
| Colombian | 184 | 0.1% |
| Comanche | 7 | 0.0% |
| Costa Rican | 62 | 0.0% |
| Creek | 4 | 0.0% |
| Croatian | 123 | 0.1% |
| Cuban | 314 | 0.1% |
| Czech | 220 | 0.1% |
| Czechoslovakian | 18 | 0.0% |
| Danish | 124 | 0.1% |
| Dominican | 203 | 0.1% |
| Dutch | 767 | 0.3% |
| Eastern European | 198 | 0.1% |
| Ecuadorian | 13 | 0.0% |
| Egyptian | 171 | 0.1% |
| English | 11,892 | 5.3% |
| Estonian | 9 | 0.0% |
| Ethiopian | 10 | 0.0% |
| European | 1,937 | 0.9% |
| Filipino | 70 | 0.0% |
| Finnish | 95 | 0.0% |
| French | 14,161 | 6.3% |
| French Canadian | 1,712 | 0.8% |
| German | 12,223 | 5.4% |
| Ghanaian | 184 | 0.1% |
| Greek | 328 | 0.2% |
| Guamanian / Chamorro | 8 | 0.0% |
| Guatemalan | 540 | 0.2% |
| Haitian | 72 | 0.0% |
| Honduran | 2,633 | 1.2% |
| Houma | 347 | 0.2% |
| Hungarian | 263 | 0.1% |
| Indian (Asian) | 1,825 | 0.8% |
| Iranian | 240 | 0.1% |
| Irish | 10,243 | 4.5% |
| Iroquois | 44 | 0.0% |
| Israeli | 456 | 0.2% |
| Italian | 7,963 | 3.5% |
| Jamaican | 105 | 0.1% |
| Jordanian | 9 | 0.0% |
| Korean | 1,287 | 0.6% |
| Laotian | 85 | 0.0% |
| Lebanese | 404 | 0.2% |
| Lithuanian | 146 | 0.1% |
| Macedonian | 28 | 0.0% |
| Malaysian | 92 | 0.0% |
| Menominee | 43 | 0.0% |
| Mexican | 2,053 | 0.9% |
| Mexican American Indian | 12 | 0.0% |
| Moroccan | 32 | 0.0% |
| Native Hawaiian | 21 | 0.0% |
| Nicaraguan | 588 | 0.3% |
| Nigerian | 702 | 0.3% |
| Northern European | 93 | 0.0% |
| Norwegian | 551 | 0.2% |
| Pakistani | 125 | 0.1% |
| Palestinian | 166 | 0.1% |
| Paraguayan | 1 | 0.0% |
| Peruvian | 38 | 0.0% |
| Polish | 810 | 0.4% |
| Portuguese | 31 | 0.0% |
| Potawatomi | 32 | 0.0% |
| Puerto Rican | 642 | 0.3% |
| Romanian | 205 | 0.1% |
| Russian | 473 | 0.2% |
| Salvadoran | 932 | 0.4% |
| Samoan | 15 | 0.0% |
| Scandinavian | 291 | 0.1% |
| Scotch-Irish | 1,391 | 0.6% |
| Scottish | 2,392 | 1.1% |
| Serbian | 10 | 0.0% |
| Slovak | 60 | 0.0% |
| Slovene | 32 | 0.0% |
| South African | 11 | 0.0% |
| South American | 587 | 0.3% |
| South American Indian | 50 | 0.0% |
| Spaniard | 234 | 0.1% |
| Spanish | 377 | 0.2% |
| Spanish American Indian | 73 | 0.0% |
| Sri Lankan | 3,961 | 1.8% |
| Subsaharan African | 3,309 | 1.5% |
| Sudanese | 22 | 0.0% |
| Swedish | 602 | 0.3% |
| Swiss | 139 | 0.1% |
| Syrian | 53 | 0.0% |
| Thai | 1,378 | 0.6% |
| Trinidadian and Tobagonian | 33 | 0.0% |
| Turkish | 86 | 0.0% |
| Ugandan | 86 | 0.0% |
| Ukrainian | 270 | 0.1% |
| Venezuelan | 339 | 0.2% |
| Vietnamese | 143 | 0.1% |
| Welsh | 991 | 0.4% |
| West Indian | 46 | 0.0% |
| Zimbabwean | 22 | 0.0% | View All 121 Rows |
Immigrants in Baton Rouge
The most numerous immigrant groups reported in Baton Rouge came from Asia (7,428 | 3.3%), Latin America (4,333 | 1.9%), Central America (3,580 | 1.6%), South Eastern Asia (3,451 | 1.5%), and Vietnam (2,600 | 1.1%), together accounting for 9.5% of all Baton Rouge residents.
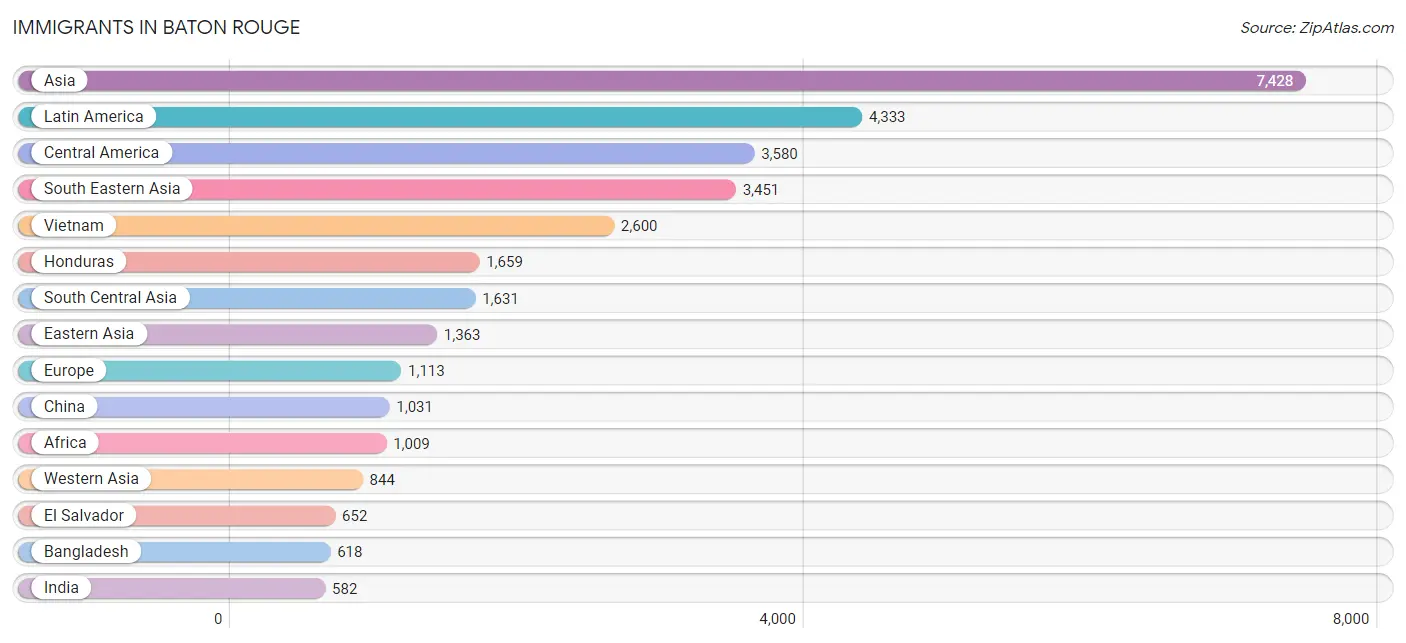
| Immigration Origin | # Population | % Population |
| Africa | 1,009 | 0.4% |
| Argentina | 10 | 0.0% |
| Asia | 7,428 | 3.3% |
| Australia | 144 | 0.1% |
| Bangladesh | 618 | 0.3% |
| Belgium | 5 | 0.0% |
| Brazil | 145 | 0.1% |
| Bulgaria | 41 | 0.0% |
| Cameroon | 45 | 0.0% |
| Canada | 156 | 0.1% |
| Caribbean | 360 | 0.2% |
| Central America | 3,580 | 1.6% |
| China | 1,031 | 0.5% |
| Colombia | 32 | 0.0% |
| Costa Rica | 49 | 0.0% |
| Croatia | 122 | 0.1% |
| Cuba | 202 | 0.1% |
| Dominican Republic | 96 | 0.0% |
| Eastern Africa | 278 | 0.1% |
| Eastern Asia | 1,363 | 0.6% |
| Eastern Europe | 576 | 0.3% |
| Ecuador | 12 | 0.0% |
| Egypt | 47 | 0.0% |
| El Salvador | 652 | 0.3% |
| England | 50 | 0.0% |
| Ethiopia | 108 | 0.1% |
| Europe | 1,113 | 0.5% |
| France | 9 | 0.0% |
| Germany | 285 | 0.1% |
| Ghana | 107 | 0.1% |
| Guatemala | 360 | 0.2% |
| Guyana | 53 | 0.0% |
| Honduras | 1,659 | 0.7% |
| Hong Kong | 71 | 0.0% |
| India | 582 | 0.3% |
| Indonesia | 85 | 0.0% |
| Iran | 223 | 0.1% |
| Iraq | 31 | 0.0% |
| Ireland | 6 | 0.0% |
| Italy | 81 | 0.0% |
| Jamaica | 29 | 0.0% |
| Japan | 62 | 0.0% |
| Jordan | 24 | 0.0% |
| Kazakhstan | 14 | 0.0% |
| Kenya | 15 | 0.0% |
| Korea | 270 | 0.1% |
| Kuwait | 43 | 0.0% |
| Laos | 37 | 0.0% |
| Latin America | 4,333 | 1.9% |
| Lithuania | 21 | 0.0% |
| Malaysia | 9 | 0.0% |
| Mexico | 398 | 0.2% |
| Middle Africa | 45 | 0.0% |
| Morocco | 32 | 0.0% |
| Nepal | 150 | 0.1% |
| Netherlands | 17 | 0.0% |
| Nicaragua | 462 | 0.2% |
| Nigeria | 261 | 0.1% |
| Northern Africa | 220 | 0.1% |
| Northern Europe | 115 | 0.1% |
| Oceania | 150 | 0.1% |
| Peru | 13 | 0.0% |
| Philippines | 581 | 0.3% |
| Poland | 8 | 0.0% |
| Romania | 24 | 0.0% |
| Russia | 226 | 0.1% |
| Saudi Arabia | 84 | 0.0% |
| Scotland | 6 | 0.0% |
| South Africa | 38 | 0.0% |
| South America | 393 | 0.2% |
| South Central Asia | 1,631 | 0.7% |
| South Eastern Asia | 3,451 | 1.5% |
| Southern Europe | 106 | 0.1% |
| Spain | 25 | 0.0% |
| Sri Lanka | 44 | 0.0% |
| Sudan | 7 | 0.0% |
| Sweden | 28 | 0.0% |
| Syria | 126 | 0.1% |
| Taiwan | 58 | 0.0% |
| Thailand | 139 | 0.1% |
| Trinidad and Tobago | 33 | 0.0% |
| Turkey | 64 | 0.0% |
| Uganda | 86 | 0.0% |
| Ukraine | 134 | 0.1% |
| Venezuela | 119 | 0.1% |
| Vietnam | 2,600 | 1.1% |
| Western Africa | 379 | 0.2% |
| Western Asia | 844 | 0.4% |
| Western Europe | 316 | 0.1% |
| Yemen | 427 | 0.2% |
| Zimbabwe | 69 | 0.0% | View All 91 Rows |
Sex and Age in Baton Rouge
Sex and Age in Baton Rouge
The most populous age groups in Baton Rouge are 20 to 24 Years (14,317 | 13.3%) for men and 20 to 24 Years (15,622 | 13.3%) for women.
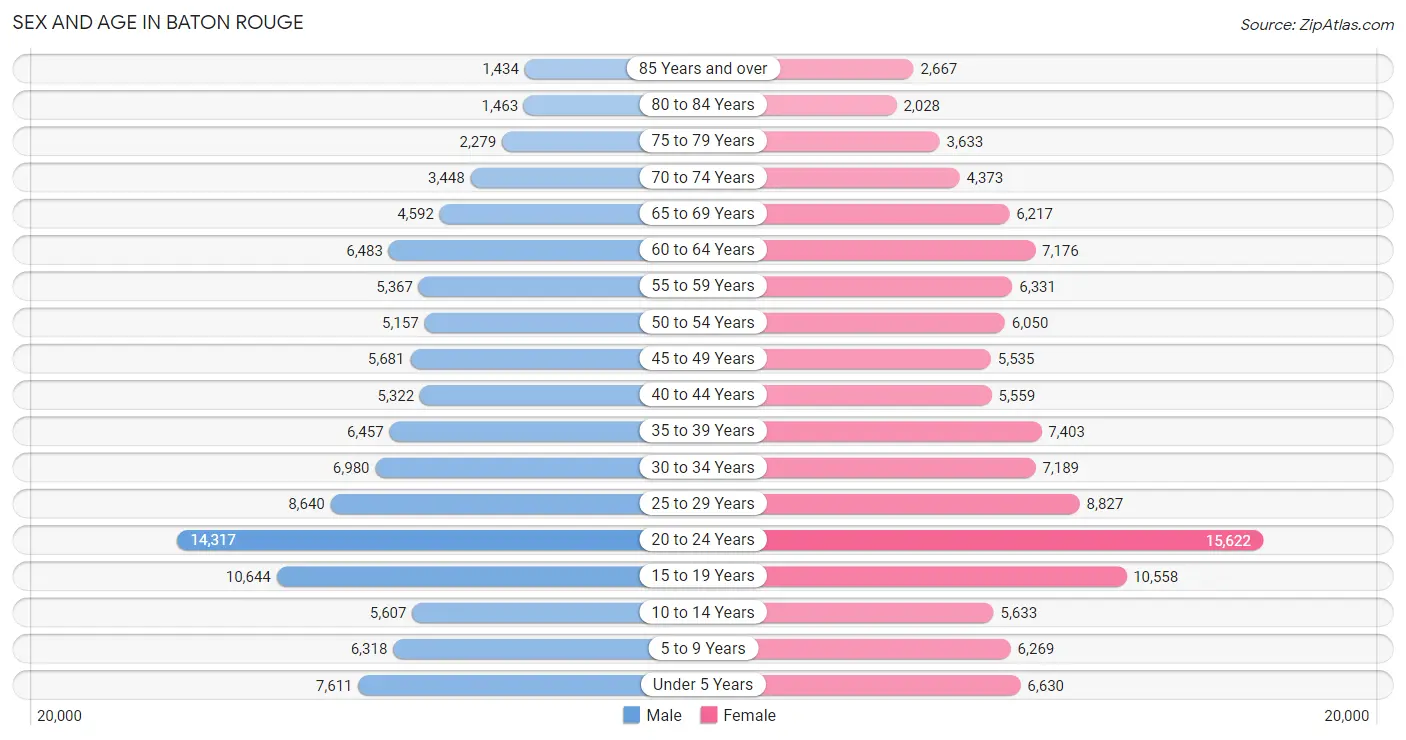
| Age Bracket | Male | Female |
| Under 5 Years | 7,611 (7.1%) | 6,630 (5.6%) |
| 5 to 9 Years | 6,318 (5.9%) | 6,269 (5.3%) |
| 10 to 14 Years | 5,607 (5.2%) | 5,633 (4.8%) |
| 15 to 19 Years | 10,644 (9.9%) | 10,558 (9.0%) |
| 20 to 24 Years | 14,317 (13.3%) | 15,622 (13.3%) |
| 25 to 29 Years | 8,640 (8.0%) | 8,827 (7.5%) |
| 30 to 34 Years | 6,980 (6.5%) | 7,189 (6.1%) |
| 35 to 39 Years | 6,457 (6.0%) | 7,403 (6.3%) |
| 40 to 44 Years | 5,322 (4.9%) | 5,559 (4.7%) |
| 45 to 49 Years | 5,681 (5.3%) | 5,535 (4.7%) |
| 50 to 54 Years | 5,157 (4.8%) | 6,050 (5.1%) |
| 55 to 59 Years | 5,367 (5.0%) | 6,331 (5.4%) |
| 60 to 64 Years | 6,483 (6.0%) | 7,176 (6.1%) |
| 65 to 69 Years | 4,592 (4.3%) | 6,217 (5.3%) |
| 70 to 74 Years | 3,448 (3.2%) | 4,373 (3.7%) |
| 75 to 79 Years | 2,279 (2.1%) | 3,633 (3.1%) |
| 80 to 84 Years | 1,463 (1.4%) | 2,028 (1.7%) |
| 85 Years and over | 1,434 (1.3%) | 2,667 (2.3%) |
| Total | 107,800 (100.0%) | 117,700 (100.0%) |
Families and Households in Baton Rouge
Median Family Size in Baton Rouge
The median family size in Baton Rouge is 3.34 persons per family, with single female/mother families (16,071 | 35.3%) accounting for the largest median family size of 3.66 persons per family. On the other hand, single male/father families (3,942 | 8.7%) represent the smallest median family size with 2.96 persons per family.
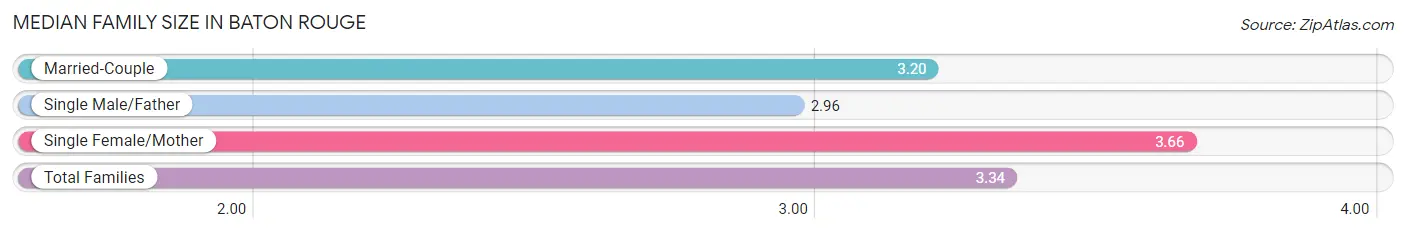
| Family Type | # Families | Family Size |
| Married-Couple | 25,448 (56.0%) | 3.20 |
| Single Male/Father | 3,942 (8.7%) | 2.96 |
| Single Female/Mother | 16,071 (35.3%) | 3.66 |
| Total Families | 45,461 (100.0%) | 3.34 |
Median Household Size in Baton Rouge
The median household size in Baton Rouge is 2.45 persons per household, with single female/mother households (16,071 | 18.4%) accounting for the largest median household size of 3.78 persons per household. non-family households (42,025 | 48.0%) represent the smallest median household size with 1.37 persons per household.
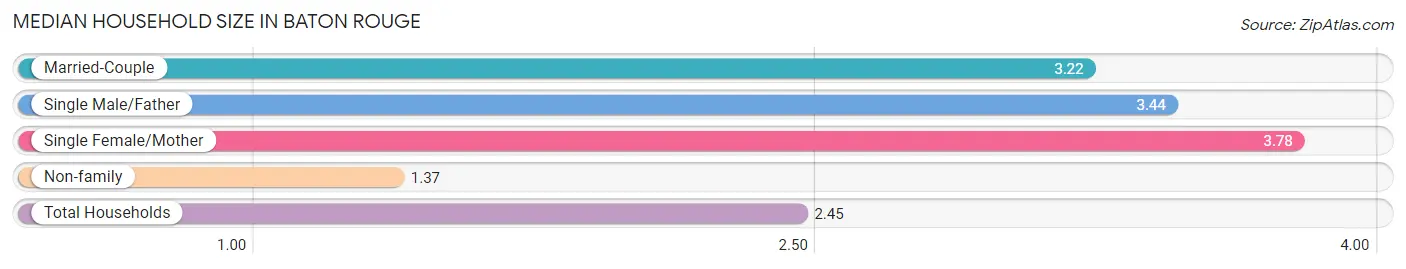
| Household Type | # Households | Household Size |
| Married-Couple | 25,448 (29.1%) | 3.22 |
| Single Male/Father | 3,942 (4.5%) | 3.44 |
| Single Female/Mother | 16,071 (18.4%) | 3.78 |
| Non-family | 42,025 (48.0%) | 1.37 |
| Total Households | 87,486 (100.0%) | 2.45 |
Household Size by Marriage Status in Baton Rouge
Out of a total of 87,486 households in Baton Rouge, 45,461 (52.0%) are family households, while 42,025 (48.0%) are nonfamily households. The most numerous type of family households are 2-person households, comprising 20,802, and the most common type of nonfamily households are 1-person households, comprising 32,781.
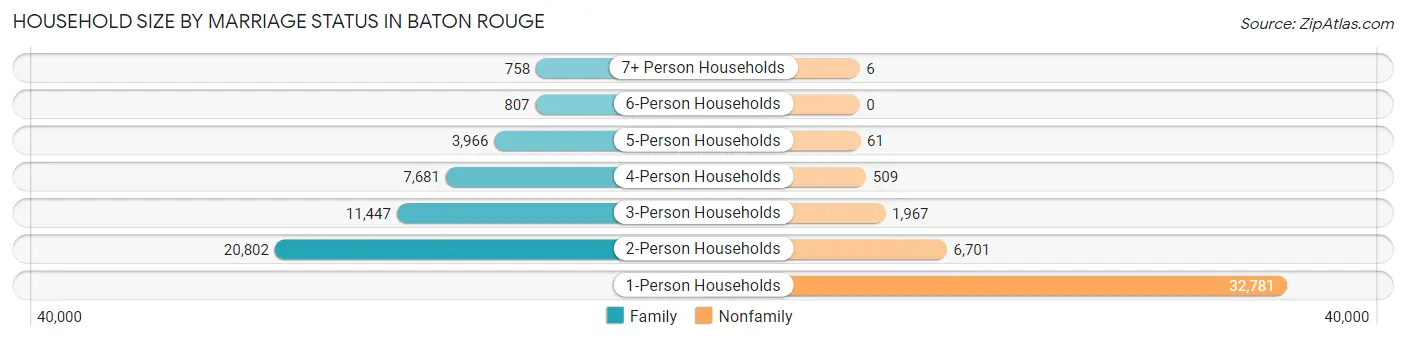
| Household Size | Family Households | Nonfamily Households |
| 1-Person Households | - | 32,781 (37.5%) |
| 2-Person Households | 20,802 (23.8%) | 6,701 (7.7%) |
| 3-Person Households | 11,447 (13.1%) | 1,967 (2.2%) |
| 4-Person Households | 7,681 (8.8%) | 509 (0.6%) |
| 5-Person Households | 3,966 (4.5%) | 61 (0.1%) |
| 6-Person Households | 807 (0.9%) | 0 (0.0%) |
| 7+ Person Households | 758 (0.9%) | 6 (0.0%) |
| Total | 45,461 (52.0%) | 42,025 (48.0%) |
Female Fertility in Baton Rouge
Fertility by Age in Baton Rouge
Average fertility rate in Baton Rouge is 39.0 births per 1,000 women. Women in the age bracket of 20 to 34 years have the highest fertility rate with 61.0 births per 1,000 women. Women in the age bracket of 20 to 34 years acount for 78.4% of all women with births.
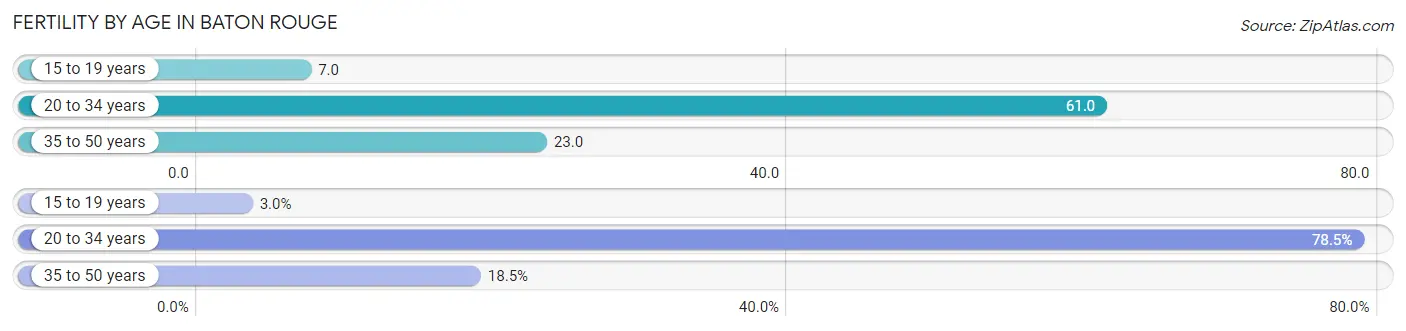
| Age Bracket | Women with Births | Births / 1,000 Women |
| 15 to 19 years | 74 (3.0%) | 7.0 |
| 20 to 34 years | 1,919 (78.4%) | 61.0 |
| 35 to 50 years | 453 (18.5%) | 23.0 |
| Total | 2,446 (100.0%) | 39.0 |
Fertility by Age by Marriage Status in Baton Rouge
32.9% of women with births (2,446) in Baton Rouge are married. The highest percentage of unmarried women with births falls into 15 to 19 years age bracket with 100.0% of them unmarried at the time of birth, while the lowest percentage of unmarried women with births belong to 35 to 50 years age bracket with 35.5% of them unmarried.
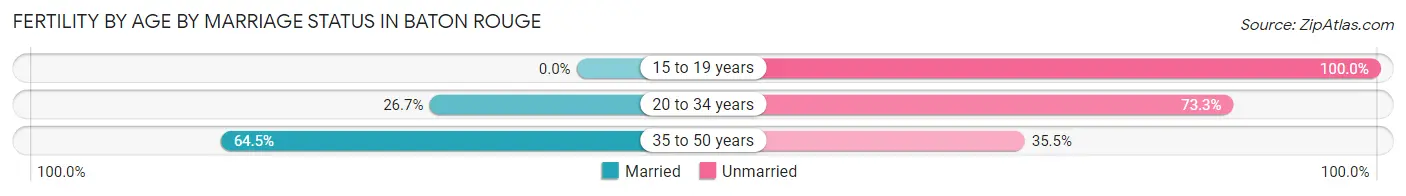
| Age Bracket | Married | Unmarried |
| 15 to 19 years | 0 (0.0%) | 74 (100.0%) |
| 20 to 34 years | 512 (26.7%) | 1,407 (73.3%) |
| 35 to 50 years | 292 (64.5%) | 161 (35.5%) |
| Total | 805 (32.9%) | 1,641 (67.1%) |
Fertility by Education in Baton Rouge
Average fertility rate in Baton Rouge is 39.0 births per 1,000 women. Women with the education attainment of high school diploma have the highest fertility rate of 64.0 births per 1,000 women, while women with the education attainment of college or associate's degree have the lowest fertility at 27.0 births per 1,000 women. Women with the education attainment of high school diploma represent 33.6% of all women with births.
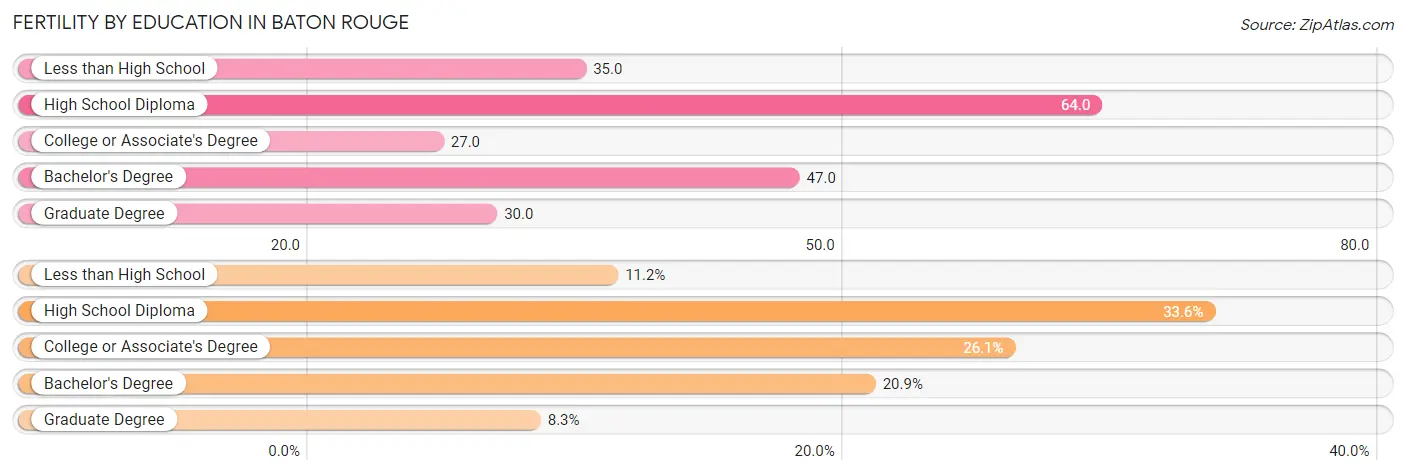
| Educational Attainment | Women with Births | Births / 1,000 Women |
| Less than High School | 274 (11.2%) | 35.0 |
| High School Diploma | 821 (33.6%) | 64.0 |
| College or Associate's Degree | 638 (26.1%) | 27.0 |
| Bachelor's Degree | 510 (20.8%) | 47.0 |
| Graduate Degree | 203 (8.3%) | 30.0 |
| Total | 2,446 (100.0%) | 39.0 |
Fertility by Education by Marriage Status in Baton Rouge
67.1% of women with births in Baton Rouge are unmarried. Women with the educational attainment of bachelor's degree are most likely to be married with 83.7% of them married at childbirth, while women with the educational attainment of less than high school are least likely to be married with 90.9% of them unmarried at childbirth.
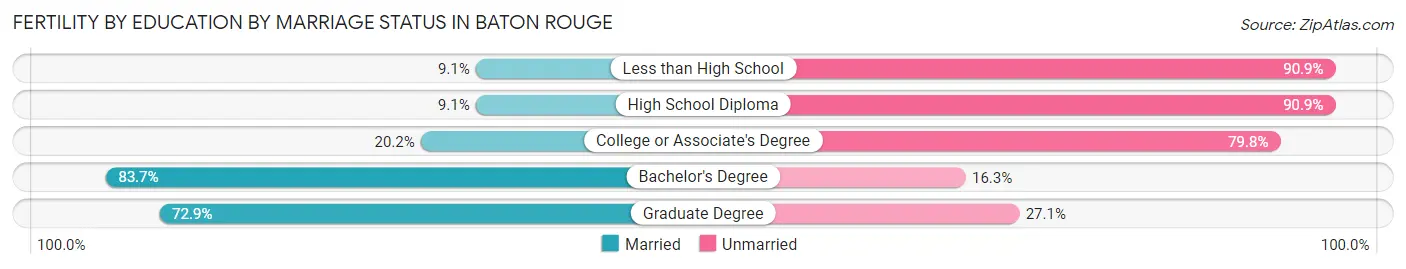
| Educational Attainment | Married | Unmarried |
| Less than High School | 25 (9.1%) | 249 (90.9%) |
| High School Diploma | 75 (9.1%) | 746 (90.9%) |
| College or Associate's Degree | 129 (20.2%) | 509 (79.8%) |
| Bachelor's Degree | 427 (83.7%) | 83 (16.3%) |
| Graduate Degree | 148 (72.9%) | 55 (27.1%) |
| Total | 805 (32.9%) | 1,641 (67.1%) |
Employment Characteristics in Baton Rouge
Employment by Class of Employer in Baton Rouge
Among the 102,474 employed individuals in Baton Rouge, private company employees (67,772 | 66.1%), state government employees (11,667 | 11.4%), and not-for-profit organizations (7,763 | 7.6%) make up the most common classes of employment.
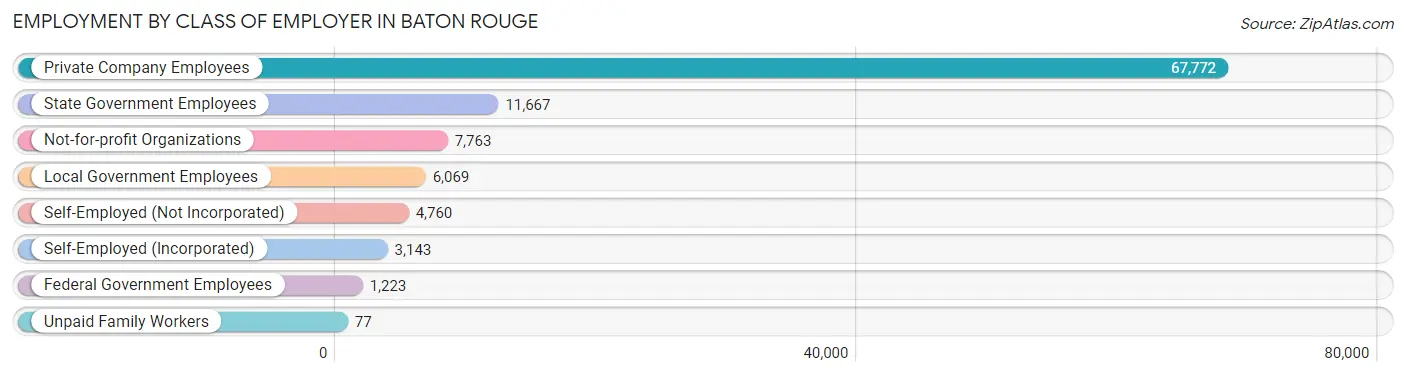
| Employer Class | # Employees | % Employees |
| Private Company Employees | 67,772 | 66.1% |
| Self-Employed (Incorporated) | 3,143 | 3.1% |
| Self-Employed (Not Incorporated) | 4,760 | 4.6% |
| Not-for-profit Organizations | 7,763 | 7.6% |
| Local Government Employees | 6,069 | 5.9% |
| State Government Employees | 11,667 | 11.4% |
| Federal Government Employees | 1,223 | 1.2% |
| Unpaid Family Workers | 77 | 0.1% |
| Total | 102,474 | 100.0% |
Employment Status by Age in Baton Rouge
According to the labor force statistics for Baton Rouge, out of the total population over 16 years of age (184,884), 62.1% or 114,813 individuals are in the labor force, with 8.6% or 9,874 of them unemployed. The age group with the highest labor force participation rate is 35 to 44 years, with 84.8% or 20,980 individuals in the labor force. Within the labor force, the 16 to 19 years age range has the highest percentage of unemployed individuals, with 24.0% or 1,795 of them being unemployed.
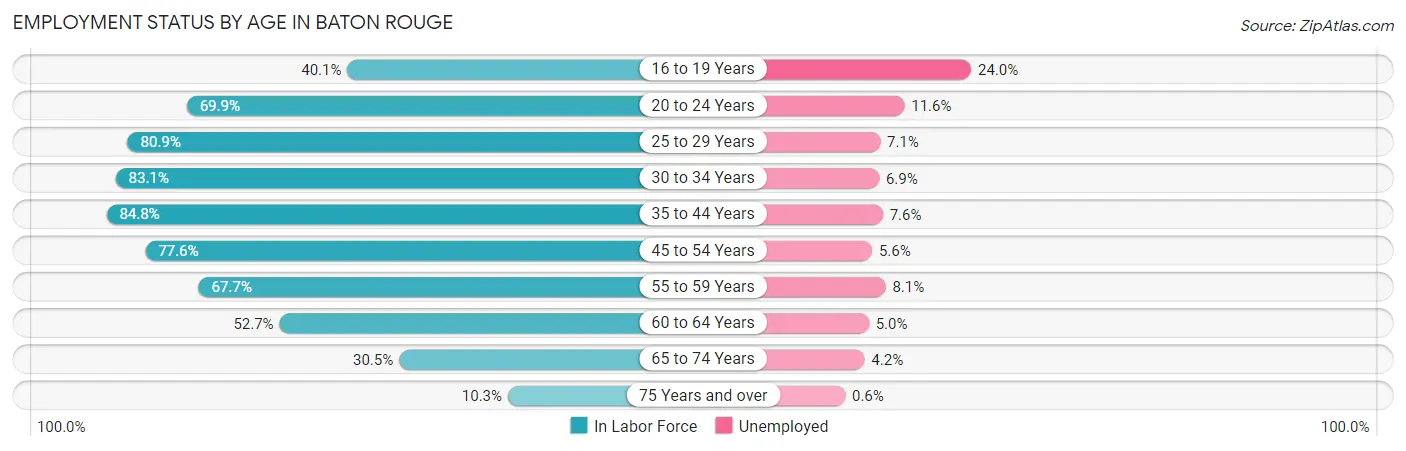
| Age Bracket | In Labor Force | Unemployed |
| 16 to 19 Years | 7,480 (40.1%) | 1,795 (24.0%) |
| 20 to 24 Years | 20,927 (69.9%) | 2,428 (11.6%) |
| 25 to 29 Years | 14,131 (80.9%) | 1,003 (7.1%) |
| 30 to 34 Years | 11,774 (83.1%) | 812 (6.9%) |
| 35 to 44 Years | 20,980 (84.8%) | 1,594 (7.6%) |
| 45 to 54 Years | 17,400 (77.6%) | 974 (5.6%) |
| 55 to 59 Years | 7,920 (67.7%) | 642 (8.1%) |
| 60 to 64 Years | 7,198 (52.7%) | 360 (5.0%) |
| 65 to 74 Years | 5,682 (30.5%) | 239 (4.2%) |
| 75 Years and over | 1,391 (10.3%) | 8 (0.6%) |
| Total | 114,813 (62.1%) | 9,874 (8.6%) |
Employment Status by Educational Attainment in Baton Rouge
According to labor force statistics for Baton Rouge, 76.2% of individuals (79,368) out of the total population between 25 and 64 years of age (104,157) are in the labor force, with 6.8% or 5,397 of them being unemployed. The group with the highest labor force participation rate are those with the educational attainment of bachelor's degree or higher, with 84.5% or 31,367 individuals in the labor force. Within the labor force, individuals with less than high school education have the highest percentage of unemployment, with 13.0% or 1,037 of them being unemployed.
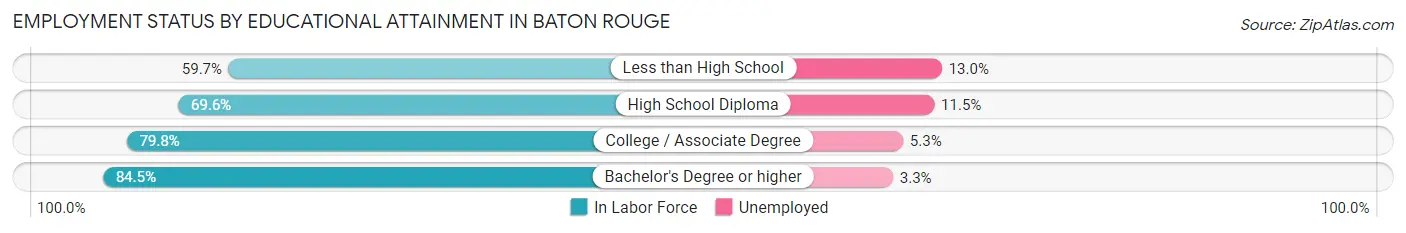
| Educational Attainment | In Labor Force | Unemployed |
| Less than High School | 7,979 (59.7%) | 1,737 (13.0%) |
| High School Diploma | 19,020 (69.6%) | 3,143 (11.5%) |
| College / Associate Degree | 21,023 (79.8%) | 1,396 (5.3%) |
| Bachelor's Degree or higher | 31,367 (84.5%) | 1,225 (3.3%) |
| Total | 79,368 (76.2%) | 7,083 (6.8%) |
Employment Occupations by Sex in Baton Rouge
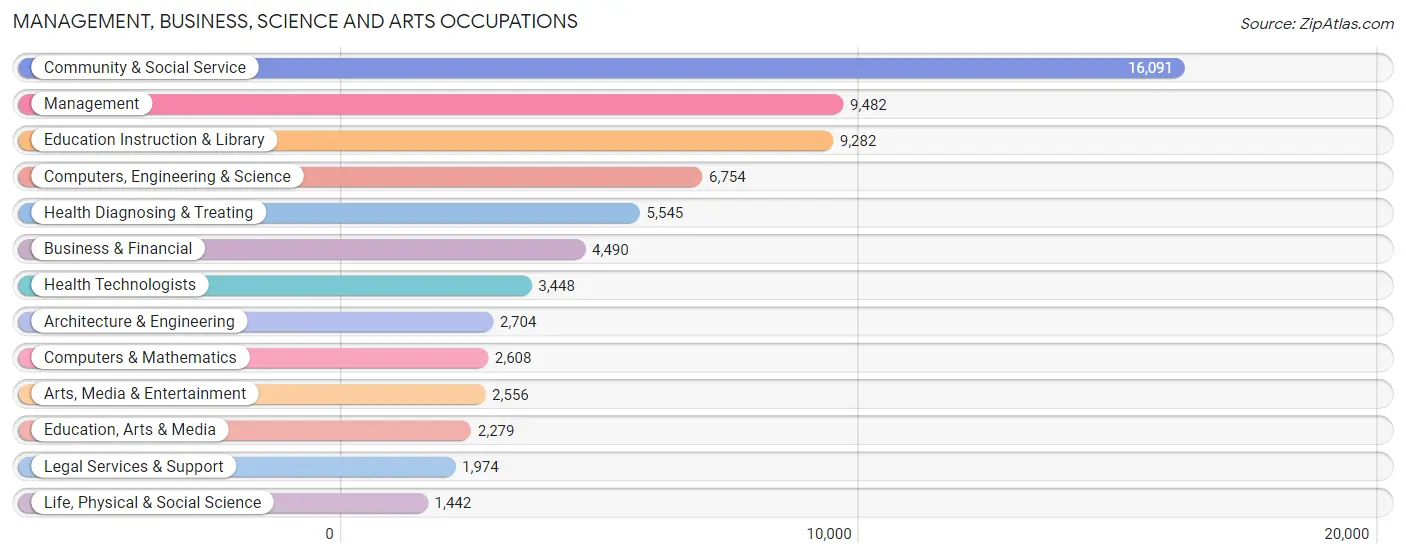
Management, Business, Science and Arts Occupations
The most common Management, Business, Science and Arts occupations in Baton Rouge are Community & Social Service (16,091 | 15.3%), Management (9,482 | 9.0%), Education Instruction & Library (9,282 | 8.8%), Computers, Engineering & Science (6,754 | 6.4%), and Health Diagnosing & Treating (5,545 | 5.3%).
Management, Business, Science and Arts Occupations by Sex
Within the Management, Business, Science and Arts occupations in Baton Rouge, the most male-oriented occupations are Architecture & Engineering (80.8%), Computers, Engineering & Science (67.2%), and Computers & Mathematics (60.5%), while the most female-oriented occupations are Health Diagnosing & Treating (72.4%), Education, Arts & Media (71.3%), and Health Technologists (71.1%).
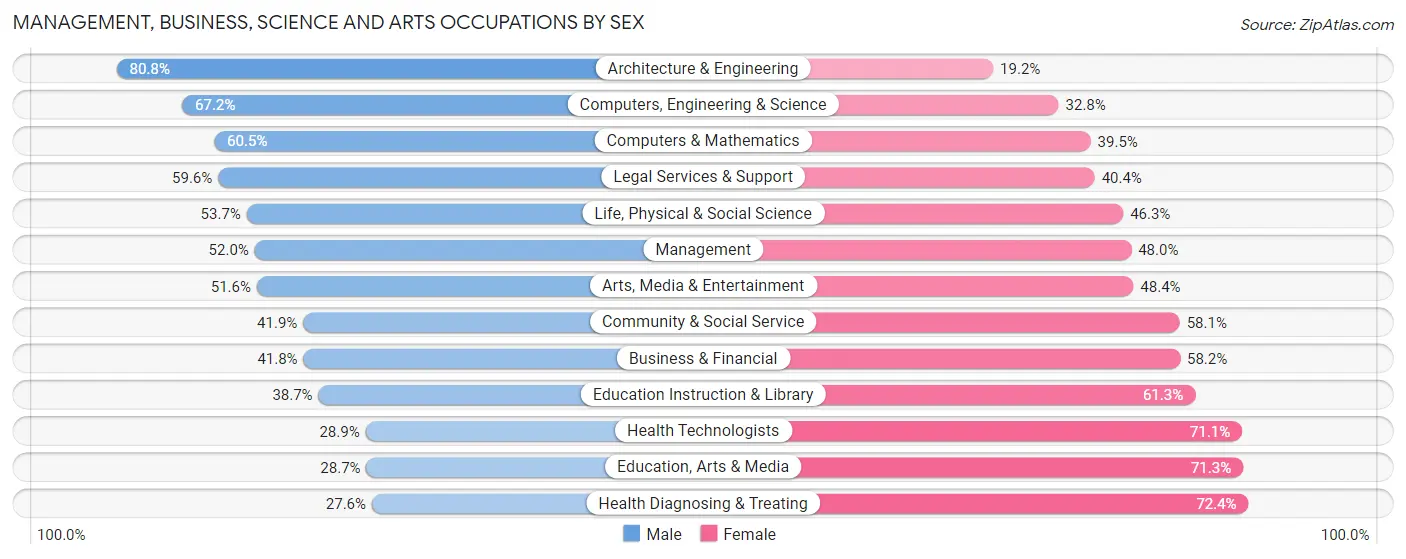
| Occupation | Male | Female |
| Management | 4,932 (52.0%) | 4,550 (48.0%) |
| Business & Financial | 1,878 (41.8%) | 2,612 (58.2%) |
| Computers, Engineering & Science | 4,536 (67.2%) | 2,218 (32.8%) |
| Computers & Mathematics | 1,577 (60.5%) | 1,031 (39.5%) |
| Architecture & Engineering | 2,185 (80.8%) | 519 (19.2%) |
| Life, Physical & Social Science | 774 (53.7%) | 668 (46.3%) |
| Community & Social Service | 6,741 (41.9%) | 9,350 (58.1%) |
| Education, Arts & Media | 654 (28.7%) | 1,625 (71.3%) |
| Legal Services & Support | 1,177 (59.6%) | 797 (40.4%) |
| Education Instruction & Library | 3,592 (38.7%) | 5,690 (61.3%) |
| Arts, Media & Entertainment | 1,318 (51.6%) | 1,238 (48.4%) |
| Health Diagnosing & Treating | 1,528 (27.6%) | 4,017 (72.4%) |
| Health Technologists | 996 (28.9%) | 2,452 (71.1%) |
| Total (Category) | 19,615 (46.3%) | 22,747 (53.7%) |
| Total (Overall) | 51,793 (49.3%) | 53,162 (50.6%) |
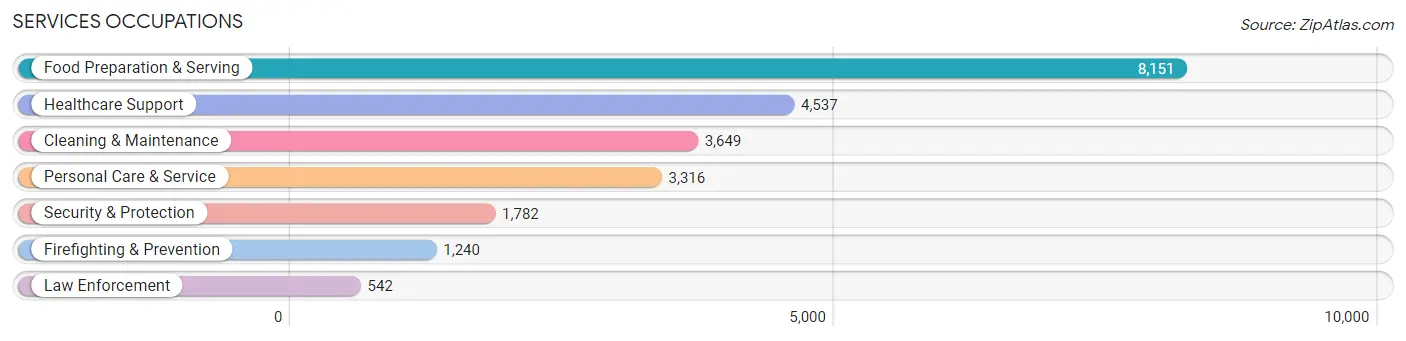
Services Occupations
The most common Services occupations in Baton Rouge are Food Preparation & Serving (8,151 | 7.8%), Healthcare Support (4,537 | 4.3%), Cleaning & Maintenance (3,649 | 3.5%), Personal Care & Service (3,316 | 3.2%), and Security & Protection (1,782 | 1.7%).
Services Occupations by Sex
Within the Services occupations in Baton Rouge, the most male-oriented occupations are Law Enforcement (83.0%), Security & Protection (63.1%), and Cleaning & Maintenance (55.1%), while the most female-oriented occupations are Healthcare Support (90.9%), Personal Care & Service (73.8%), and Food Preparation & Serving (51.0%).
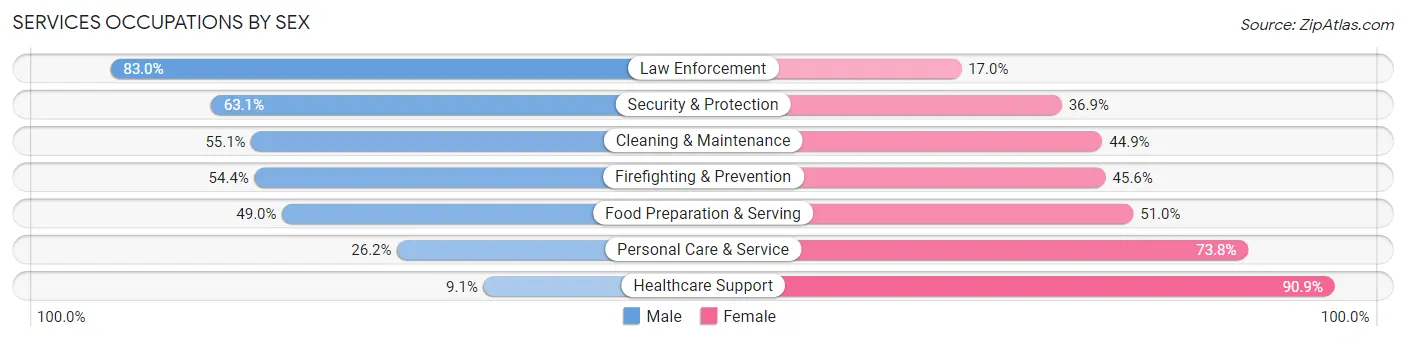
| Occupation | Male | Female |
| Healthcare Support | 412 (9.1%) | 4,125 (90.9%) |
| Security & Protection | 1,125 (63.1%) | 657 (36.9%) |
| Firefighting & Prevention | 675 (54.4%) | 565 (45.6%) |
| Law Enforcement | 450 (83.0%) | 92 (17.0%) |
| Food Preparation & Serving | 3,991 (49.0%) | 4,160 (51.0%) |
| Cleaning & Maintenance | 2,010 (55.1%) | 1,639 (44.9%) |
| Personal Care & Service | 868 (26.2%) | 2,448 (73.8%) |
| Total (Category) | 8,406 (39.2%) | 13,029 (60.8%) |
| Total (Overall) | 51,793 (49.3%) | 53,162 (50.6%) |
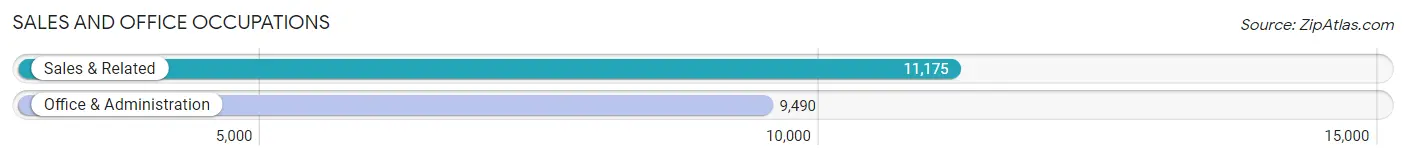
Sales and Office Occupations
The most common Sales and Office occupations in Baton Rouge are Sales & Related (11,175 | 10.6%), and Office & Administration (9,490 | 9.0%).
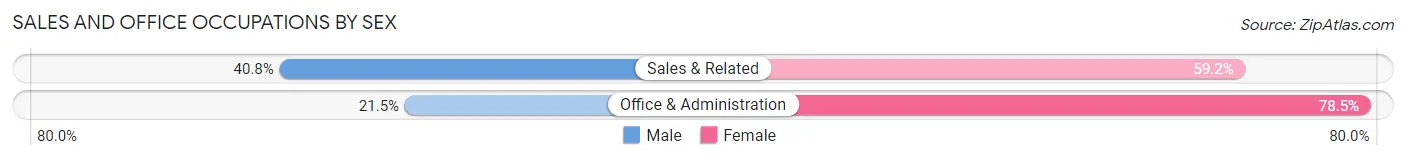
Sales and Office Occupations by Sex
| Occupation | Male | Female |
| Sales & Related | 4,556 (40.8%) | 6,619 (59.2%) |
| Office & Administration | 2,039 (21.5%) | 7,451 (78.5%) |
| Total (Category) | 6,595 (31.9%) | 14,070 (68.1%) |
| Total (Overall) | 51,793 (49.3%) | 53,162 (50.6%) |
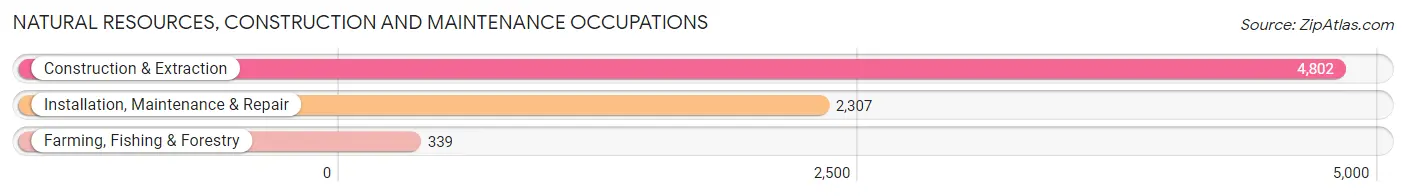
Natural Resources, Construction and Maintenance Occupations
The most common Natural Resources, Construction and Maintenance occupations in Baton Rouge are Construction & Extraction (4,802 | 4.6%), Installation, Maintenance & Repair (2,307 | 2.2%), and Farming, Fishing & Forestry (339 | 0.3%).
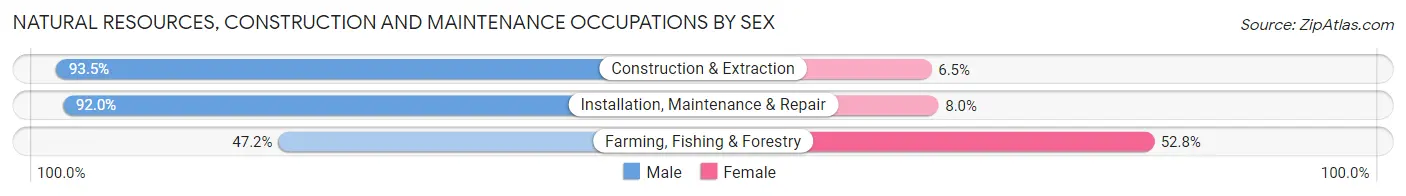
Natural Resources, Construction and Maintenance Occupations by Sex
| Occupation | Male | Female |
| Farming, Fishing & Forestry | 160 (47.2%) | 179 (52.8%) |
| Construction & Extraction | 4,489 (93.5%) | 313 (6.5%) |
| Installation, Maintenance & Repair | 2,123 (92.0%) | 184 (8.0%) |
| Total (Category) | 6,772 (90.9%) | 676 (9.1%) |
| Total (Overall) | 51,793 (49.3%) | 53,162 (50.6%) |
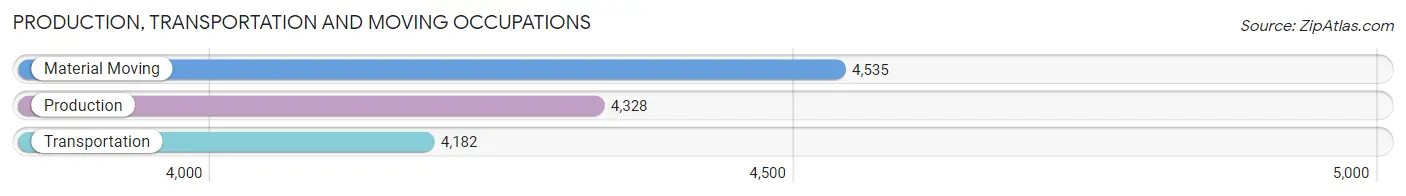
Production, Transportation and Moving Occupations
The most common Production, Transportation and Moving occupations in Baton Rouge are Material Moving (4,535 | 4.3%), Production (4,328 | 4.1%), and Transportation (4,182 | 4.0%).
Production, Transportation and Moving Occupations by Sex
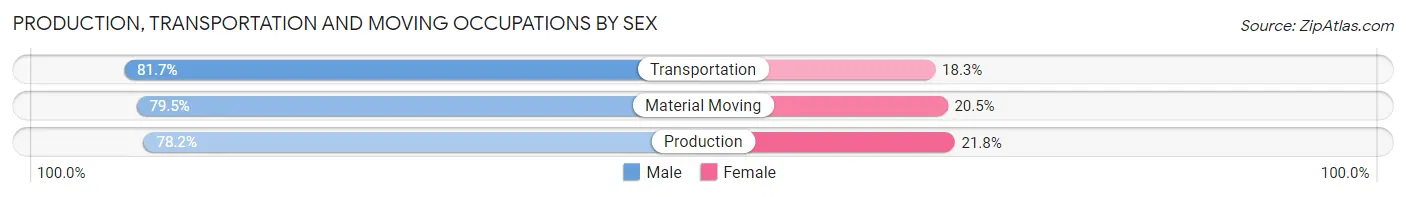
| Occupation | Male | Female |
| Production | 3,383 (78.2%) | 945 (21.8%) |
| Transportation | 3,418 (81.7%) | 764 (18.3%) |
| Material Moving | 3,604 (79.5%) | 931 (20.5%) |
| Total (Category) | 10,405 (79.8%) | 2,640 (20.2%) |
| Total (Overall) | 51,793 (49.3%) | 53,162 (50.6%) |
Employment Industries by Sex in Baton Rouge
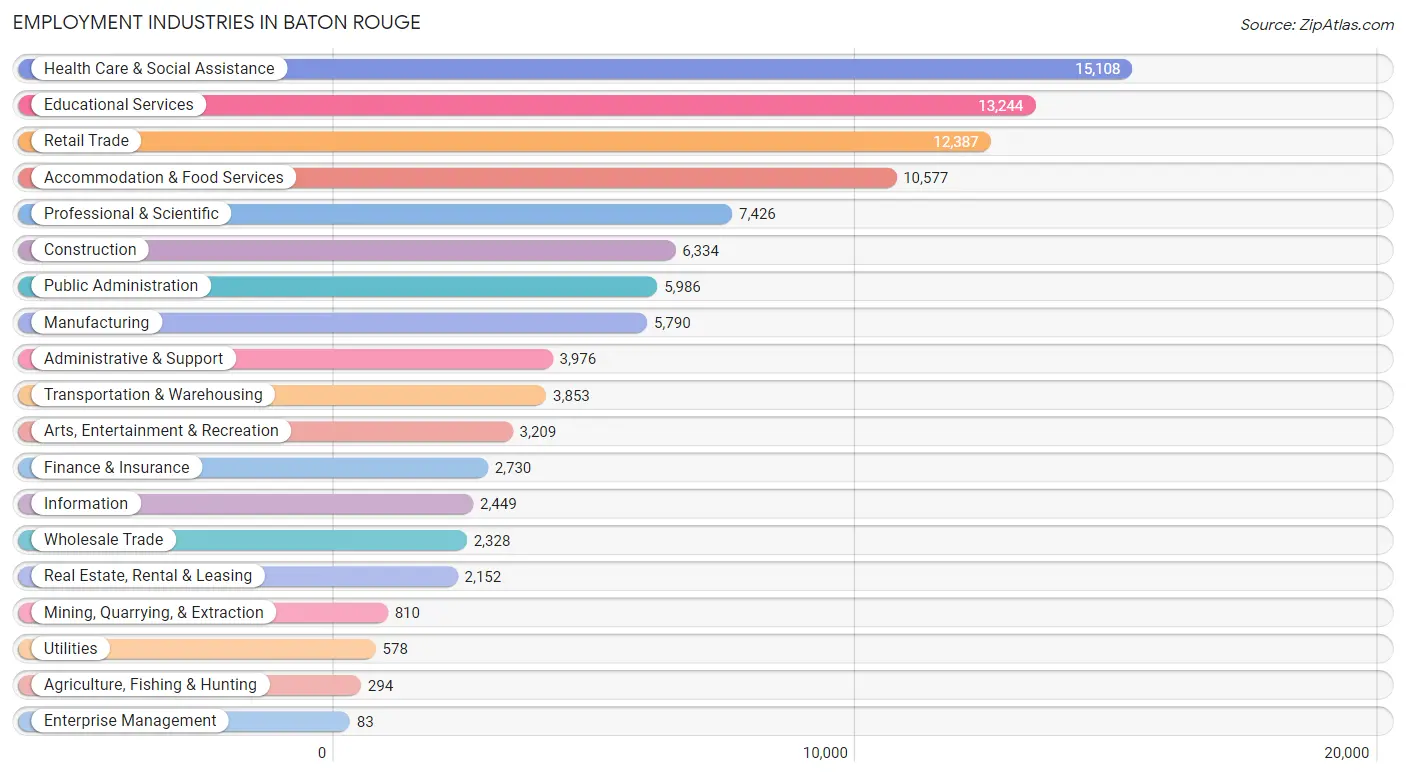
Employment Industries in Baton Rouge
The major employment industries in Baton Rouge include Health Care & Social Assistance (15,108 | 14.4%), Educational Services (13,244 | 12.6%), Retail Trade (12,387 | 11.8%), Accommodation & Food Services (10,577 | 10.1%), and Professional & Scientific (7,426 | 7.1%).
Employment Industries by Sex in Baton Rouge
The Baton Rouge industries that see more men than women are Construction (84.2%), Wholesale Trade (83.6%), and Agriculture, Fishing & Hunting (80.6%), whereas the industries that tend to have a higher number of women are Enterprise Management (100.0%), Health Care & Social Assistance (79.6%), and Educational Services (63.3%).
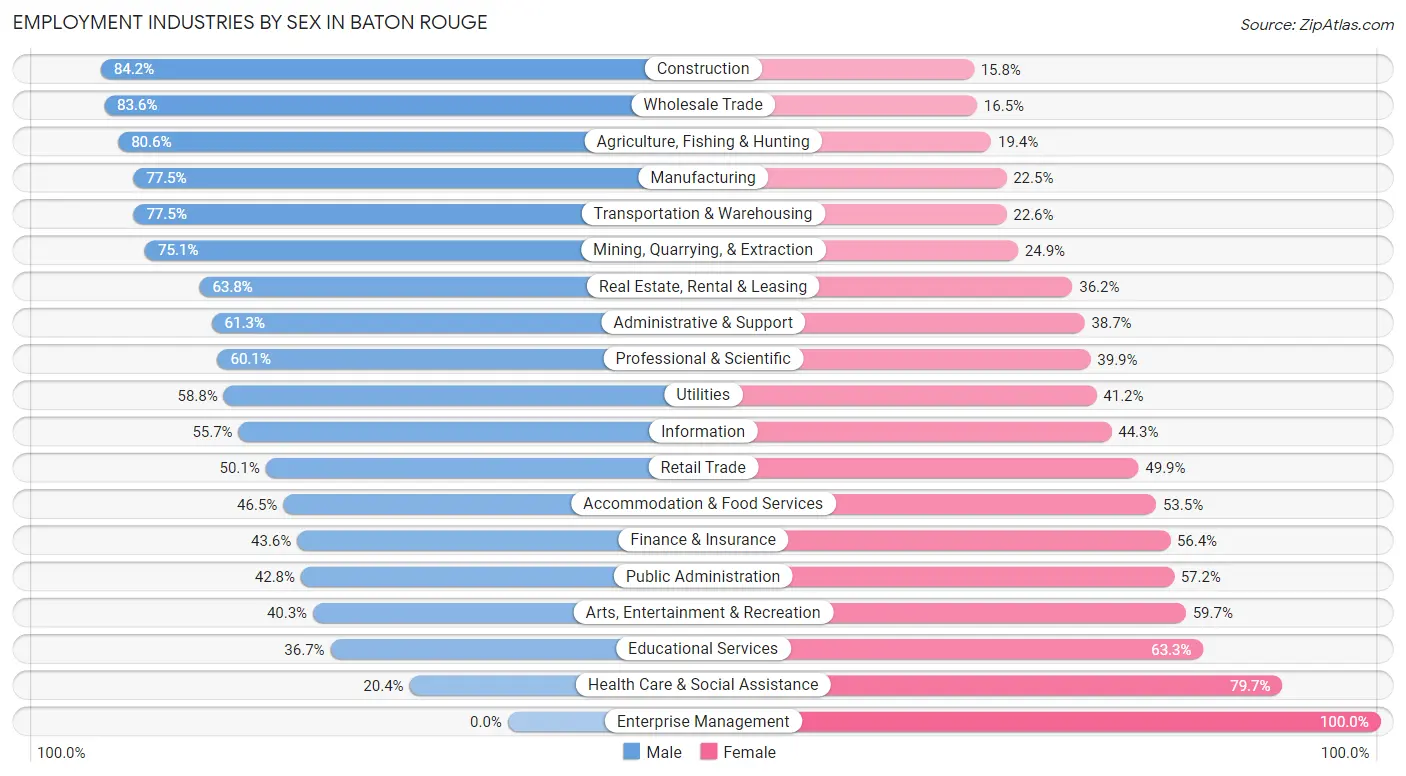
| Industry | Male | Female |
| Agriculture, Fishing & Hunting | 237 (80.6%) | 57 (19.4%) |
| Mining, Quarrying, & Extraction | 608 (75.1%) | 202 (24.9%) |
| Construction | 5,334 (84.2%) | 1,000 (15.8%) |
| Manufacturing | 4,486 (77.5%) | 1,304 (22.5%) |
| Wholesale Trade | 1,945 (83.6%) | 383 (16.5%) |
| Retail Trade | 6,210 (50.1%) | 6,177 (49.9%) |
| Transportation & Warehousing | 2,984 (77.4%) | 869 (22.6%) |
| Utilities | 340 (58.8%) | 238 (41.2%) |
| Information | 1,365 (55.7%) | 1,084 (44.3%) |
| Finance & Insurance | 1,190 (43.6%) | 1,540 (56.4%) |
| Real Estate, Rental & Leasing | 1,373 (63.8%) | 779 (36.2%) |
| Professional & Scientific | 4,460 (60.1%) | 2,966 (39.9%) |
| Enterprise Management | 0 (0.0%) | 83 (100.0%) |
| Administrative & Support | 2,437 (61.3%) | 1,539 (38.7%) |
| Educational Services | 4,860 (36.7%) | 8,384 (63.3%) |
| Health Care & Social Assistance | 3,074 (20.3%) | 12,034 (79.6%) |
| Arts, Entertainment & Recreation | 1,294 (40.3%) | 1,915 (59.7%) |
| Accommodation & Food Services | 4,916 (46.5%) | 5,661 (53.5%) |
| Public Administration | 2,563 (42.8%) | 3,423 (57.2%) |
| Total | 51,793 (49.3%) | 53,162 (50.6%) |
Education in Baton Rouge
School Enrollment in Baton Rouge
The most common levels of schooling among the 68,784 students in Baton Rouge are college / undergraduate (27,296 | 39.7%), high school (9,720 | 14.1%), and elementary school (9,456 | 13.8%).
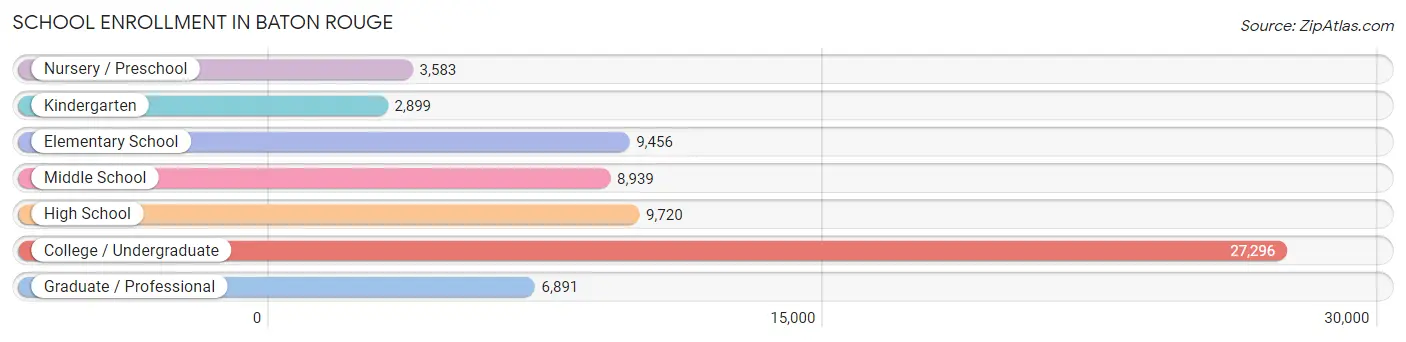
| School Level | # Students | % Students |
| Nursery / Preschool | 3,583 | 5.2% |
| Kindergarten | 2,899 | 4.2% |
| Elementary School | 9,456 | 13.8% |
| Middle School | 8,939 | 13.0% |
| High School | 9,720 | 14.1% |
| College / Undergraduate | 27,296 | 39.7% |
| Graduate / Professional | 6,891 | 10.0% |
| Total | 68,784 | 100.0% |
School Enrollment by Age by Funding Source in Baton Rouge
Out of a total of 68,784 students who are enrolled in schools in Baton Rouge, 11,143 (16.2%) attend a private institution, while the remaining 57,641 (83.8%) are enrolled in public schools. The age group of 3 to 4 year olds has the highest likelihood of being enrolled in private schools, with 1,408 (42.8% in the age bracket) enrolled. Conversely, the age group of 18 to 19 year olds has the lowest likelihood of being enrolled in a private school, with 10,520 (95.3% in the age bracket) attending a public institution.
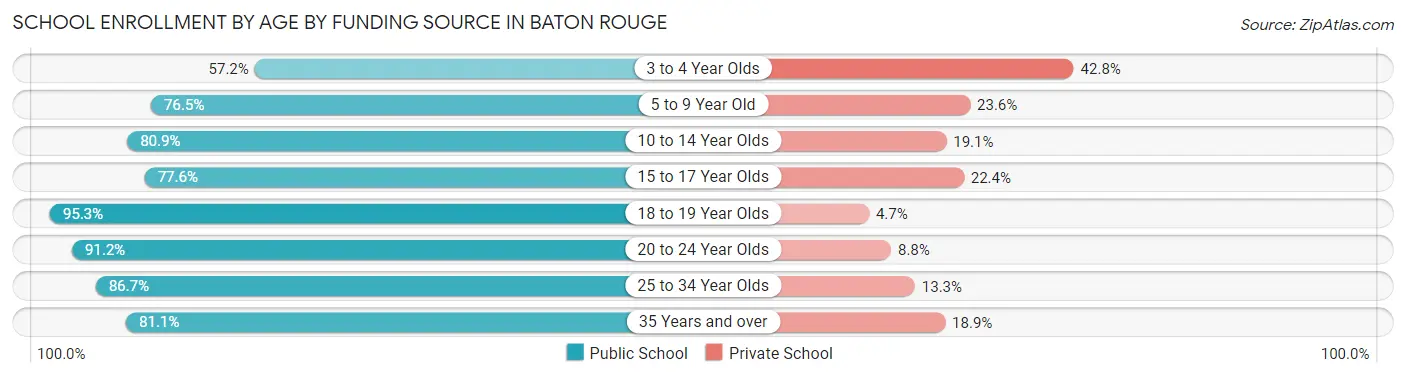
| Age Bracket | Public School | Private School |
| 3 to 4 Year Olds | 1,879 (57.2%) | 1,408 (42.8%) |
| 5 to 9 Year Old | 8,851 (76.4%) | 2,726 (23.5%) |
| 10 to 14 Year Olds | 8,573 (80.9%) | 2,026 (19.1%) |
| 15 to 17 Year Olds | 5,922 (77.6%) | 1,707 (22.4%) |
| 18 to 19 Year Olds | 10,520 (95.3%) | 520 (4.7%) |
| 20 to 24 Year Olds | 15,164 (91.2%) | 1,467 (8.8%) |
| 25 to 34 Year Olds | 3,906 (86.7%) | 597 (13.3%) |
| 35 Years and over | 2,853 (81.1%) | 665 (18.9%) |
| Total | 57,641 (83.8%) | 11,143 (16.2%) |
Educational Attainment by Field of Study in Baton Rouge
Business (8,754 | 16.6%), education (6,539 | 12.4%), science & technology (5,026 | 9.6%), engineering (4,292 | 8.2%), and arts & humanities (3,846 | 7.3%) are the most common fields of study among 52,640 individuals in Baton Rouge who have obtained a bachelor's degree or higher.
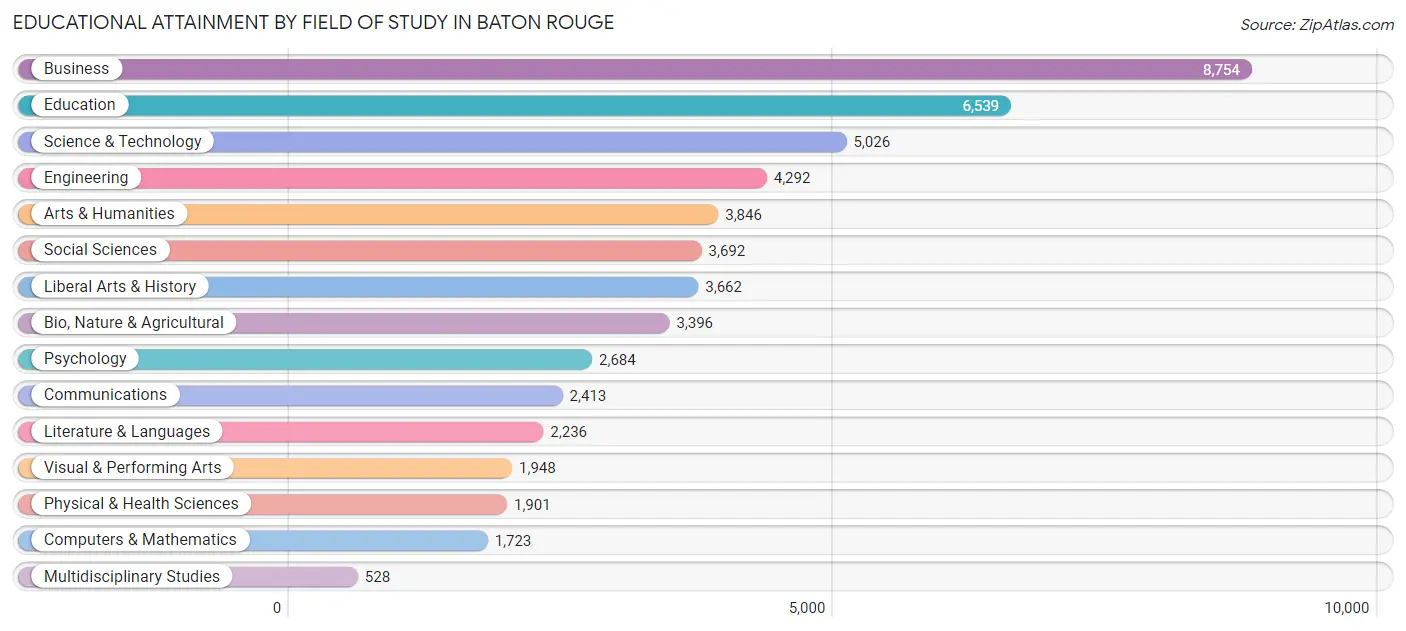
| Field of Study | # Graduates | % Graduates |
| Computers & Mathematics | 1,723 | 3.3% |
| Bio, Nature & Agricultural | 3,396 | 6.5% |
| Physical & Health Sciences | 1,901 | 3.6% |
| Psychology | 2,684 | 5.1% |
| Social Sciences | 3,692 | 7.0% |
| Engineering | 4,292 | 8.2% |
| Multidisciplinary Studies | 528 | 1.0% |
| Science & Technology | 5,026 | 9.6% |
| Business | 8,754 | 16.6% |
| Education | 6,539 | 12.4% |
| Literature & Languages | 2,236 | 4.3% |
| Liberal Arts & History | 3,662 | 7.0% |
| Visual & Performing Arts | 1,948 | 3.7% |
| Communications | 2,413 | 4.6% |
| Arts & Humanities | 3,846 | 7.3% |
| Total | 52,640 | 100.0% |
Transportation & Commute in Baton Rouge
Vehicle Availability by Sex in Baton Rouge
The most prevalent vehicle ownership categories in Baton Rouge are males with 2 vehicles (20,622, accounting for 41.3%) and females with 2 vehicles (19,783, making up 41.6%).
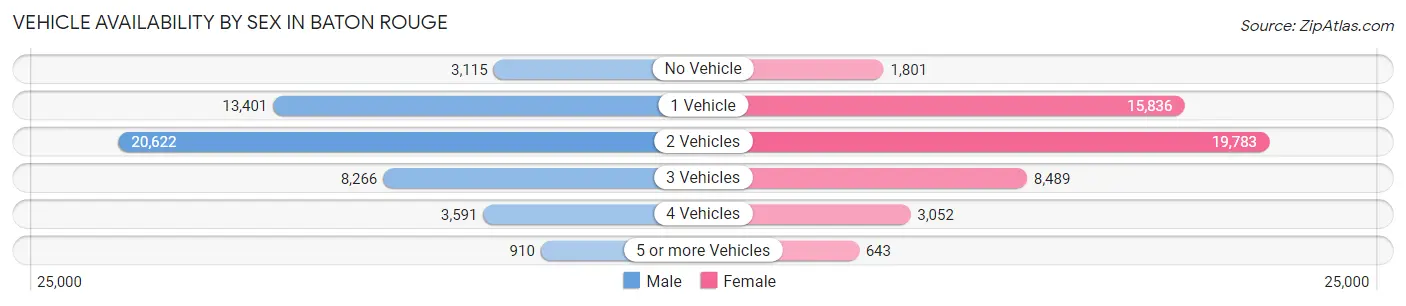
| Vehicles Available | Male | Female |
| No Vehicle | 3,115 (6.2%) | 1,801 (3.6%) |
| 1 Vehicle | 13,401 (26.9%) | 15,836 (31.9%) |
| 2 Vehicles | 20,622 (41.3%) | 19,783 (39.9%) |
| 3 Vehicles | 8,266 (16.6%) | 8,489 (17.1%) |
| 4 Vehicles | 3,591 (7.2%) | 3,052 (6.1%) |
| 5 or more Vehicles | 910 (1.8%) | 643 (1.3%) |
| Total | 49,905 (100.0%) | 49,604 (100.0%) |
Commute Time in Baton Rouge
The most frequently occuring commute durations in Baton Rouge are 15 to 19 minutes (22,923 commuters, 23.8%), 10 to 14 minutes (16,661 commuters, 17.3%), and 20 to 24 minutes (15,907 commuters, 16.6%).
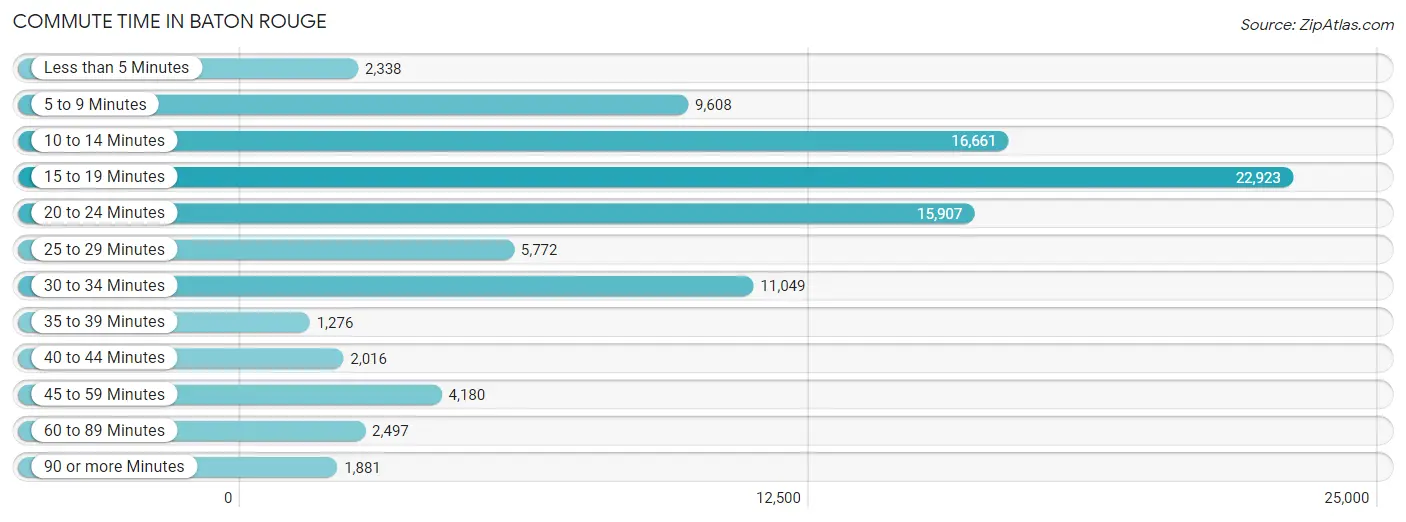
| Commute Time | # Commuters | % Commuters |
| Less than 5 Minutes | 2,338 | 2.4% |
| 5 to 9 Minutes | 9,608 | 10.0% |
| 10 to 14 Minutes | 16,661 | 17.3% |
| 15 to 19 Minutes | 22,923 | 23.8% |
| 20 to 24 Minutes | 15,907 | 16.6% |
| 25 to 29 Minutes | 5,772 | 6.0% |
| 30 to 34 Minutes | 11,049 | 11.5% |
| 35 to 39 Minutes | 1,276 | 1.3% |
| 40 to 44 Minutes | 2,016 | 2.1% |
| 45 to 59 Minutes | 4,180 | 4.3% |
| 60 to 89 Minutes | 2,497 | 2.6% |
| 90 or more Minutes | 1,881 | 2.0% |
Commute Time by Sex in Baton Rouge
The most common commute times in Baton Rouge are 15 to 19 minutes (11,086 commuters, 23.4%) for males and 15 to 19 minutes (11,837 commuters, 24.3%) for females.
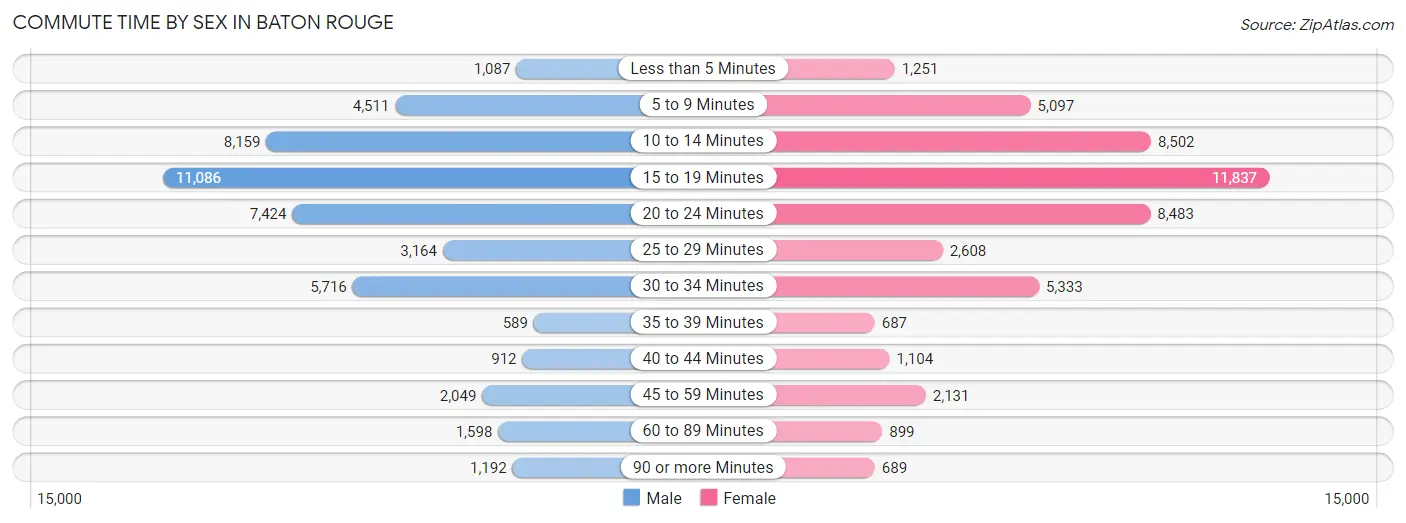
| Commute Time | Male | Female |
| Less than 5 Minutes | 1,087 (2.3%) | 1,251 (2.6%) |
| 5 to 9 Minutes | 4,511 (9.5%) | 5,097 (10.5%) |
| 10 to 14 Minutes | 8,159 (17.2%) | 8,502 (17.5%) |
| 15 to 19 Minutes | 11,086 (23.4%) | 11,837 (24.3%) |
| 20 to 24 Minutes | 7,424 (15.6%) | 8,483 (17.4%) |
| 25 to 29 Minutes | 3,164 (6.7%) | 2,608 (5.4%) |
| 30 to 34 Minutes | 5,716 (12.0%) | 5,333 (11.0%) |
| 35 to 39 Minutes | 589 (1.2%) | 687 (1.4%) |
| 40 to 44 Minutes | 912 (1.9%) | 1,104 (2.3%) |
| 45 to 59 Minutes | 2,049 (4.3%) | 2,131 (4.4%) |
| 60 to 89 Minutes | 1,598 (3.4%) | 899 (1.8%) |
| 90 or more Minutes | 1,192 (2.5%) | 689 (1.4%) |
Time of Departure to Work by Sex in Baton Rouge
The most frequent times of departure to work in Baton Rouge are 7:30 AM to 7:59 AM (6,013, 12.7%) for males and 7:30 AM to 7:59 AM (7,337, 15.1%) for females.
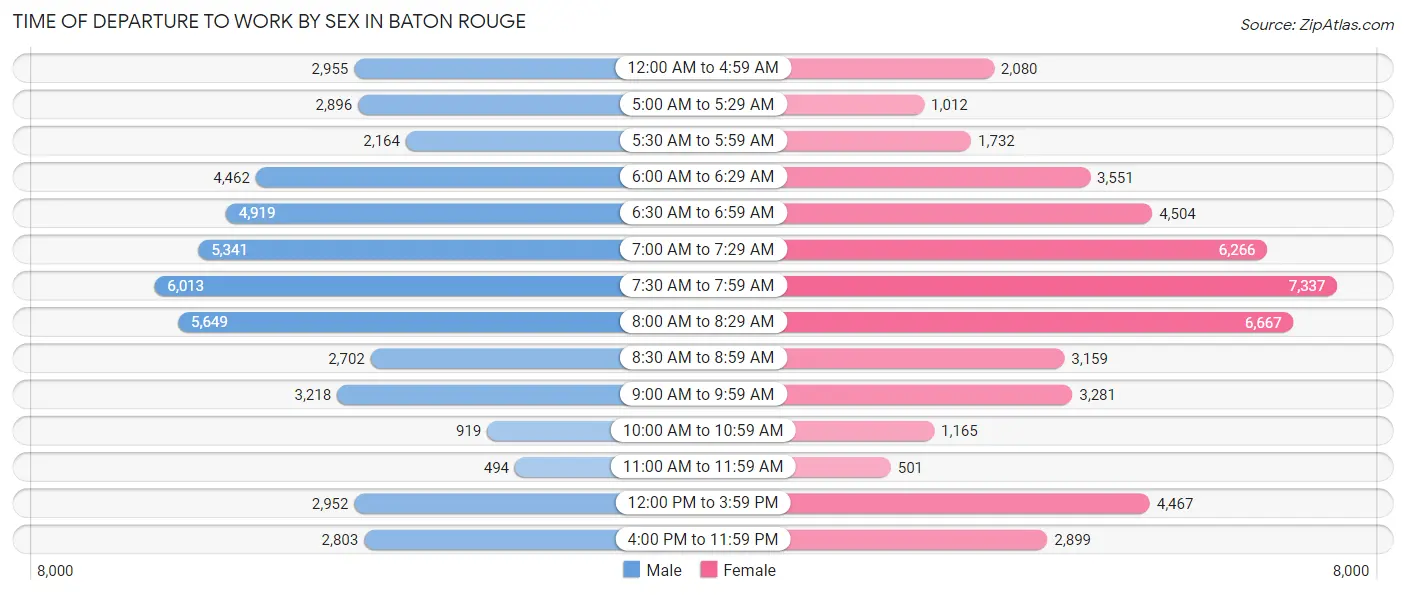
| Time of Departure | Male | Female |
| 12:00 AM to 4:59 AM | 2,955 (6.2%) | 2,080 (4.3%) |
| 5:00 AM to 5:29 AM | 2,896 (6.1%) | 1,012 (2.1%) |
| 5:30 AM to 5:59 AM | 2,164 (4.6%) | 1,732 (3.6%) |
| 6:00 AM to 6:29 AM | 4,462 (9.4%) | 3,551 (7.3%) |
| 6:30 AM to 6:59 AM | 4,919 (10.4%) | 4,504 (9.3%) |
| 7:00 AM to 7:29 AM | 5,341 (11.3%) | 6,266 (12.9%) |
| 7:30 AM to 7:59 AM | 6,013 (12.7%) | 7,337 (15.1%) |
| 8:00 AM to 8:29 AM | 5,649 (11.9%) | 6,667 (13.7%) |
| 8:30 AM to 8:59 AM | 2,702 (5.7%) | 3,159 (6.5%) |
| 9:00 AM to 9:59 AM | 3,218 (6.8%) | 3,281 (6.8%) |
| 10:00 AM to 10:59 AM | 919 (1.9%) | 1,165 (2.4%) |
| 11:00 AM to 11:59 AM | 494 (1.0%) | 501 (1.0%) |
| 12:00 PM to 3:59 PM | 2,952 (6.2%) | 4,467 (9.2%) |
| 4:00 PM to 11:59 PM | 2,803 (5.9%) | 2,899 (6.0%) |
| Total | 47,487 (100.0%) | 48,621 (100.0%) |
Housing Occupancy in Baton Rouge
Occupancy by Ownership in Baton Rouge
Of the total 87,486 dwellings in Baton Rouge, owner-occupied units account for 41,891 (47.9%), while renter-occupied units make up 45,595 (52.1%).
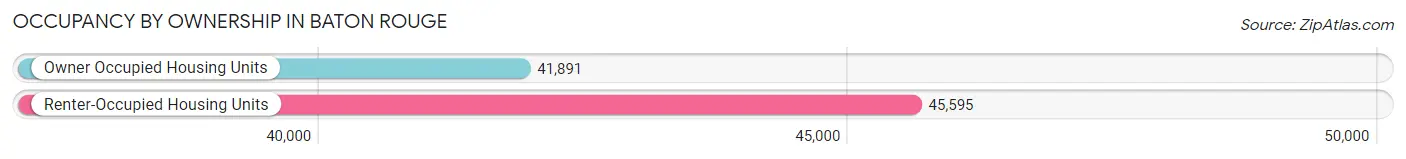
| Occupancy | # Housing Units | % Housing Units |
| Owner Occupied Housing Units | 41,891 | 47.9% |
| Renter-Occupied Housing Units | 45,595 | 52.1% |
| Total Occupied Housing Units | 87,486 | 100.0% |
Occupancy by Household Size in Baton Rouge
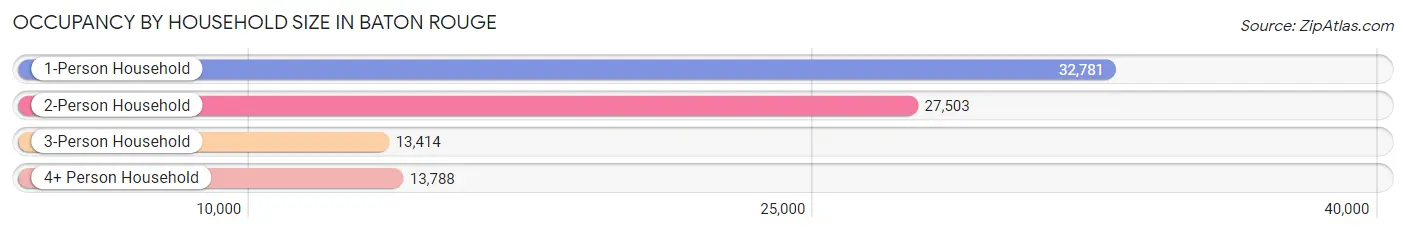
| Household Size | # Housing Units | % Housing Units |
| 1-Person Household | 32,781 | 37.5% |
| 2-Person Household | 27,503 | 31.4% |
| 3-Person Household | 13,414 | 15.3% |
| 4+ Person Household | 13,788 | 15.8% |
| Total Housing Units | 87,486 | 100.0% |
Occupancy by Ownership by Household Size in Baton Rouge
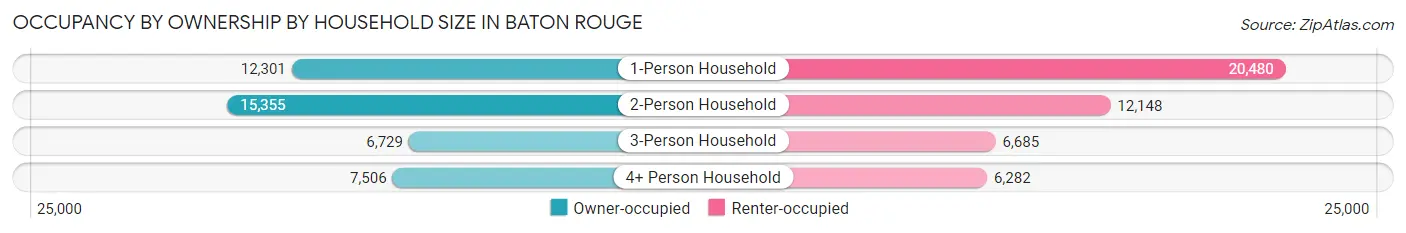
| Household Size | Owner-occupied | Renter-occupied |
| 1-Person Household | 12,301 (37.5%) | 20,480 (62.5%) |
| 2-Person Household | 15,355 (55.8%) | 12,148 (44.2%) |
| 3-Person Household | 6,729 (50.2%) | 6,685 (49.8%) |
| 4+ Person Household | 7,506 (54.4%) | 6,282 (45.6%) |
| Total Housing Units | 41,891 (47.9%) | 45,595 (52.1%) |
Occupancy by Educational Attainment in Baton Rouge
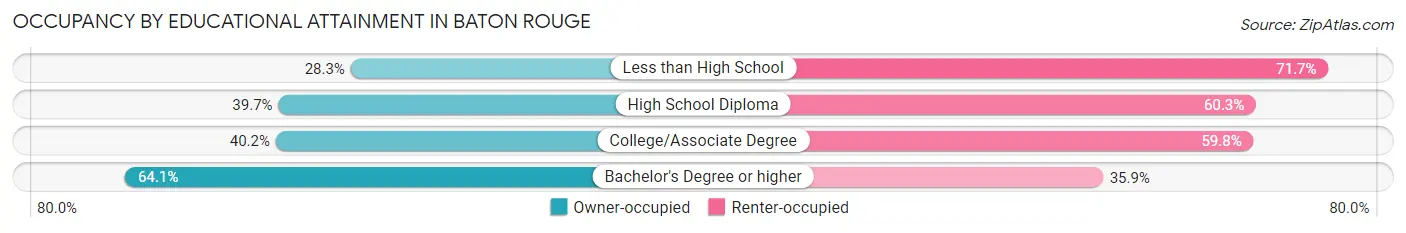
| Household Size | Owner-occupied | Renter-occupied |
| Less than High School | 2,524 (28.3%) | 6,400 (71.7%) |
| High School Diploma | 8,123 (39.7%) | 12,319 (60.3%) |
| College/Associate Degree | 10,068 (40.2%) | 15,000 (59.8%) |
| Bachelor's Degree or higher | 21,176 (64.1%) | 11,876 (35.9%) |
Occupancy by Age of Householder in Baton Rouge
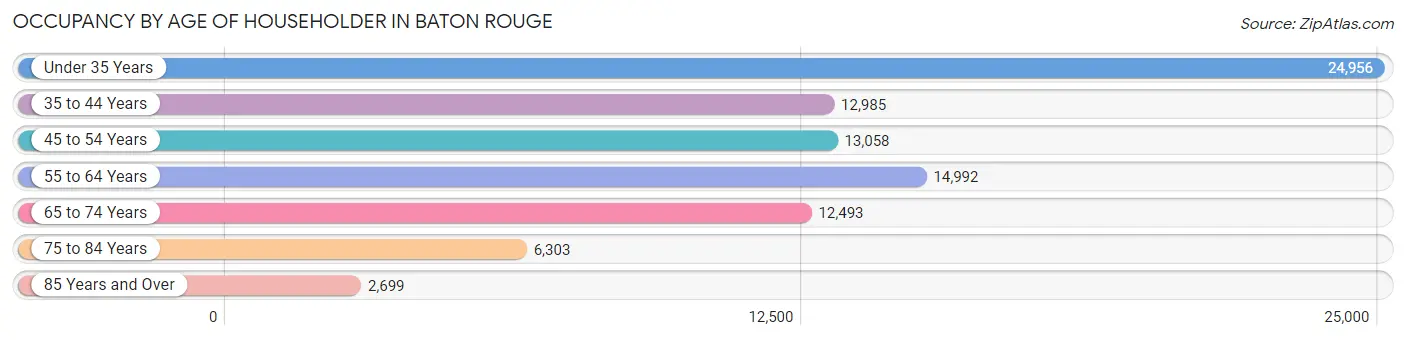
| Age Bracket | # Households | % Households |
| Under 35 Years | 24,956 | 28.5% |
| 35 to 44 Years | 12,985 | 14.8% |
| 45 to 54 Years | 13,058 | 14.9% |
| 55 to 64 Years | 14,992 | 17.1% |
| 65 to 74 Years | 12,493 | 14.3% |
| 75 to 84 Years | 6,303 | 7.2% |
| 85 Years and Over | 2,699 | 3.1% |
| Total | 87,486 | 100.0% |
Housing Finances in Baton Rouge
Median Income by Occupancy in Baton Rouge
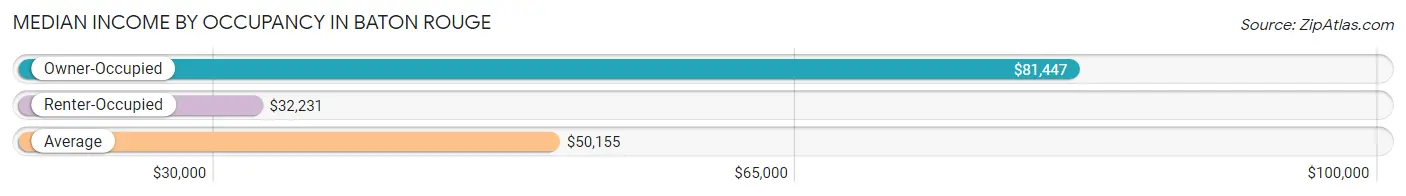
| Occupancy Type | # Households | Median Income |
| Owner-Occupied | 41,891 (47.9%) | $81,447 |
| Renter-Occupied | 45,595 (52.1%) | $32,231 |
| Average | 87,486 (100.0%) | $50,155 |
Occupancy by Householder Income Bracket in Baton Rouge
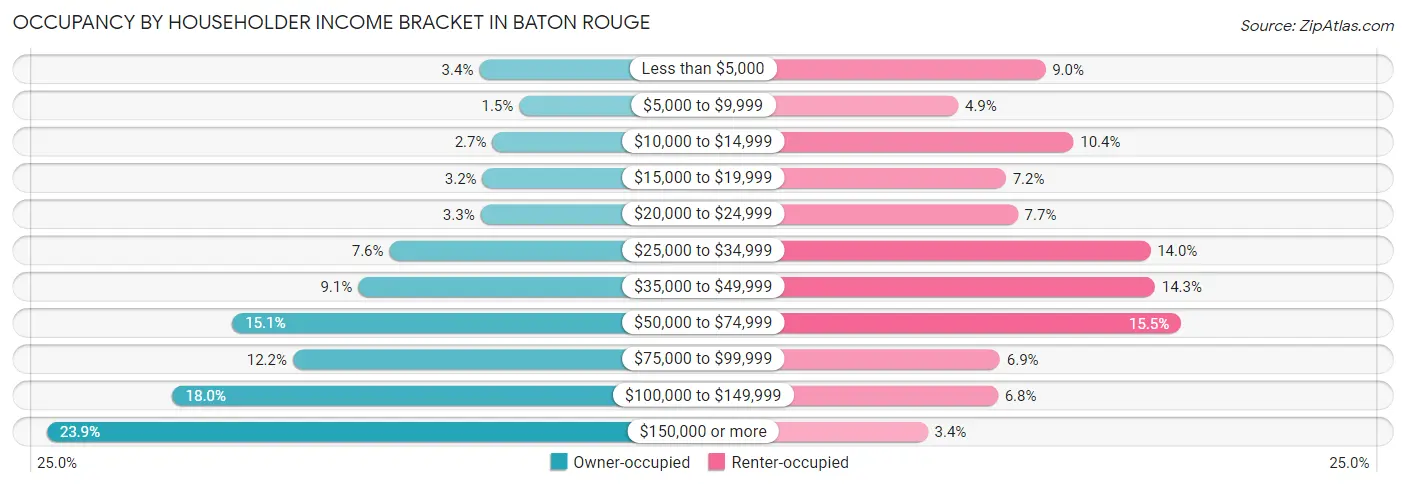
| Income Bracket | Owner-occupied | Renter-occupied |
| Less than $5,000 | 1,402 (3.4%) | 4,116 (9.0%) |
| $5,000 to $9,999 | 606 (1.5%) | 2,227 (4.9%) |
| $10,000 to $14,999 | 1,143 (2.7%) | 4,727 (10.4%) |
| $15,000 to $19,999 | 1,341 (3.2%) | 3,259 (7.1%) |
| $20,000 to $24,999 | 1,377 (3.3%) | 3,518 (7.7%) |
| $25,000 to $34,999 | 3,198 (7.6%) | 6,396 (14.0%) |
| $35,000 to $49,999 | 3,820 (9.1%) | 6,499 (14.2%) |
| $50,000 to $74,999 | 6,329 (15.1%) | 7,067 (15.5%) |
| $75,000 to $99,999 | 5,124 (12.2%) | 3,134 (6.9%) |
| $100,000 to $149,999 | 7,521 (17.9%) | 3,088 (6.8%) |
| $150,000 or more | 10,030 (23.9%) | 1,564 (3.4%) |
| Total | 41,891 (100.0%) | 45,595 (100.0%) |
Monthly Housing Cost Tiers in Baton Rouge
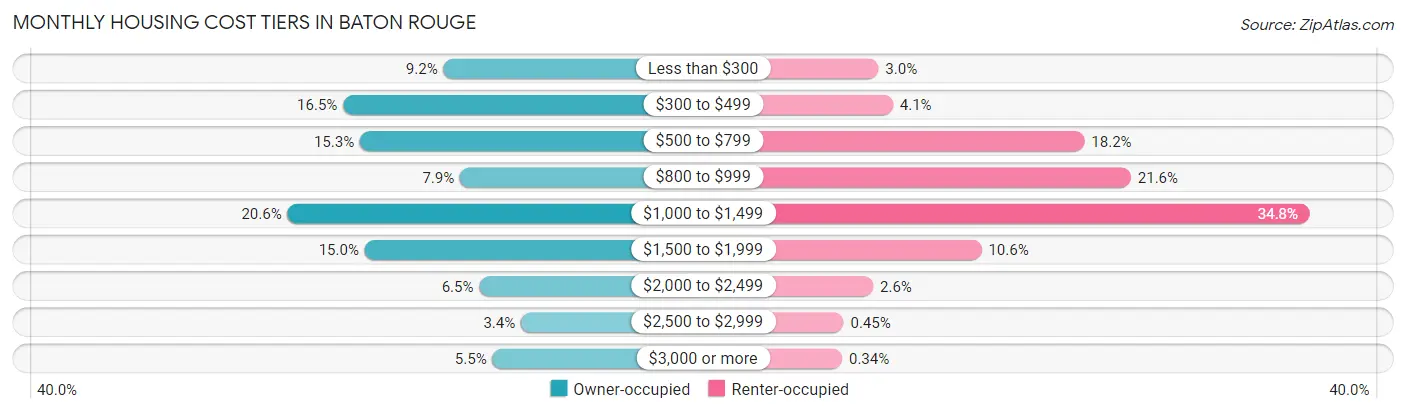
| Monthly Cost | Owner-occupied | Renter-occupied |
| Less than $300 | 3,835 (9.1%) | 1,376 (3.0%) |
| $300 to $499 | 6,930 (16.5%) | 1,861 (4.1%) |
| $500 to $799 | 6,409 (15.3%) | 8,294 (18.2%) |
| $800 to $999 | 3,320 (7.9%) | 9,855 (21.6%) |
| $1,000 to $1,499 | 8,645 (20.6%) | 15,861 (34.8%) |
| $1,500 to $1,999 | 6,262 (14.9%) | 4,838 (10.6%) |
| $2,000 to $2,499 | 2,726 (6.5%) | 1,199 (2.6%) |
| $2,500 to $2,999 | 1,442 (3.4%) | 207 (0.4%) |
| $3,000 or more | 2,322 (5.5%) | 156 (0.3%) |
| Total | 41,891 (100.0%) | 45,595 (100.0%) |
Physical Housing Characteristics in Baton Rouge
Housing Structures in Baton Rouge
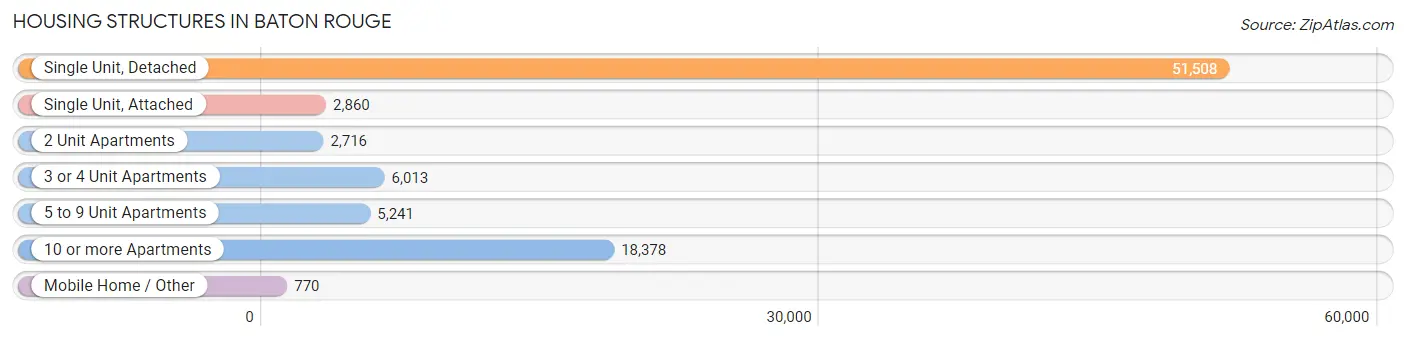
| Structure Type | # Housing Units | % Housing Units |
| Single Unit, Detached | 51,508 | 58.9% |
| Single Unit, Attached | 2,860 | 3.3% |
| 2 Unit Apartments | 2,716 | 3.1% |
| 3 or 4 Unit Apartments | 6,013 | 6.9% |
| 5 to 9 Unit Apartments | 5,241 | 6.0% |
| 10 or more Apartments | 18,378 | 21.0% |
| Mobile Home / Other | 770 | 0.9% |
| Total | 87,486 | 100.0% |
Housing Structures by Occupancy in Baton Rouge
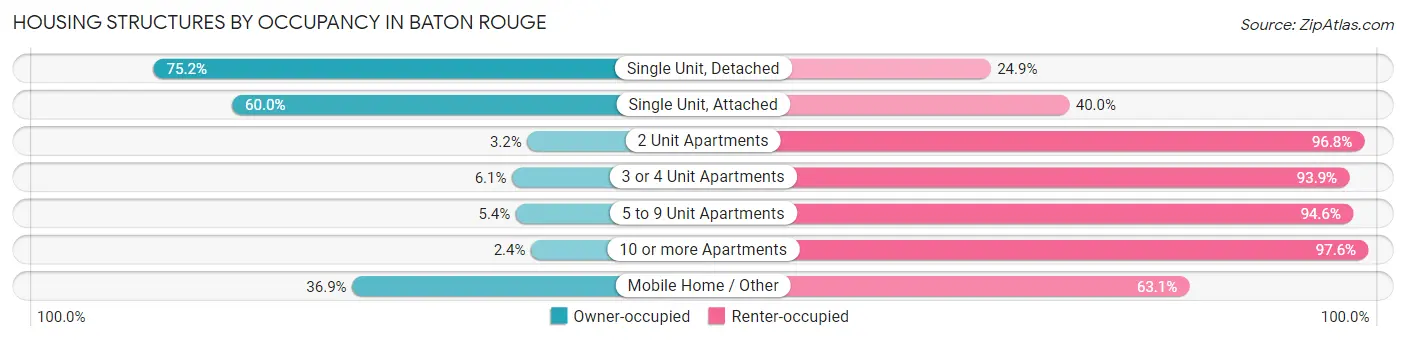
| Structure Type | Owner-occupied | Renter-occupied |
| Single Unit, Detached | 38,708 (75.1%) | 12,800 (24.8%) |
| Single Unit, Attached | 1,717 (60.0%) | 1,143 (40.0%) |
| 2 Unit Apartments | 86 (3.2%) | 2,630 (96.8%) |
| 3 or 4 Unit Apartments | 367 (6.1%) | 5,646 (93.9%) |
| 5 to 9 Unit Apartments | 281 (5.4%) | 4,960 (94.6%) |
| 10 or more Apartments | 448 (2.4%) | 17,930 (97.6%) |
| Mobile Home / Other | 284 (36.9%) | 486 (63.1%) |
| Total | 41,891 (47.9%) | 45,595 (52.1%) |
Housing Structures by Number of Rooms in Baton Rouge
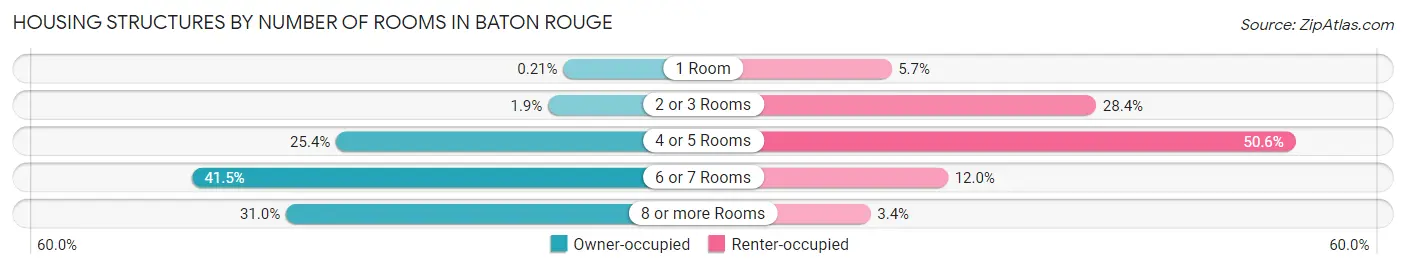
| Number of Rooms | Owner-occupied | Renter-occupied |
| 1 Room | 86 (0.2%) | 2,596 (5.7%) |
| 2 or 3 Rooms | 794 (1.9%) | 12,952 (28.4%) |
| 4 or 5 Rooms | 10,649 (25.4%) | 23,057 (50.6%) |
| 6 or 7 Rooms | 17,378 (41.5%) | 5,451 (12.0%) |
| 8 or more Rooms | 12,984 (31.0%) | 1,539 (3.4%) |
| Total | 41,891 (100.0%) | 45,595 (100.0%) |
Housing Structure by Heating Type in Baton Rouge
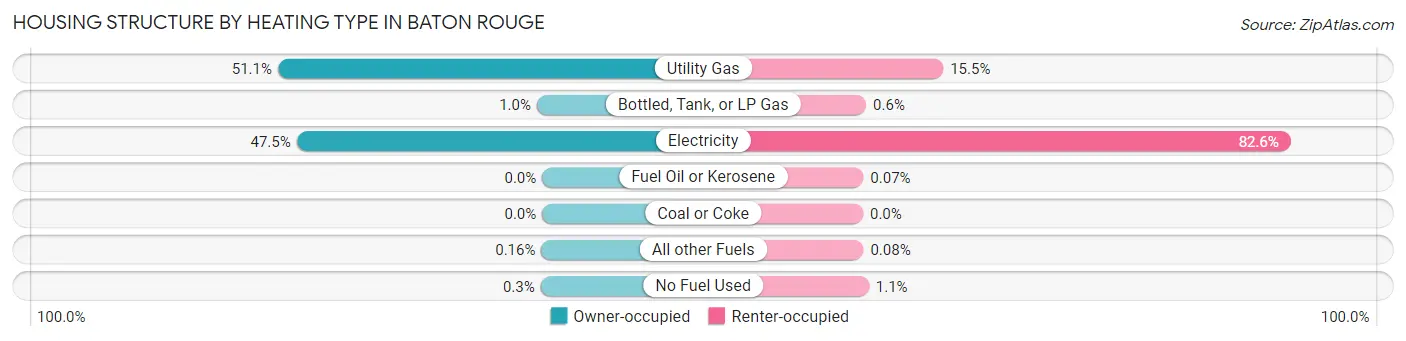
| Heating Type | Owner-occupied | Renter-occupied |
| Utility Gas | 21,395 (51.1%) | 7,067 (15.5%) |
| Bottled, Tank, or LP Gas | 427 (1.0%) | 274 (0.6%) |
| Electricity | 19,878 (47.4%) | 37,673 (82.6%) |
| Fuel Oil or Kerosene | 0 (0.0%) | 33 (0.1%) |
| Coal or Coke | 0 (0.0%) | 0 (0.0%) |
| All other Fuels | 67 (0.2%) | 38 (0.1%) |
| No Fuel Used | 124 (0.3%) | 510 (1.1%) |
| Total | 41,891 (100.0%) | 45,595 (100.0%) |
Household Vehicle Usage in Baton Rouge
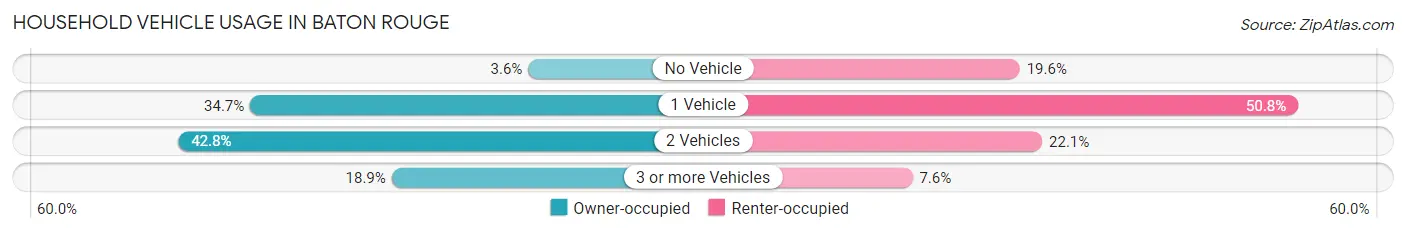
| Vehicles per Household | Owner-occupied | Renter-occupied |
| No Vehicle | 1,504 (3.6%) | 8,927 (19.6%) |
| 1 Vehicle | 14,551 (34.7%) | 23,142 (50.8%) |
| 2 Vehicles | 17,924 (42.8%) | 10,073 (22.1%) |
| 3 or more Vehicles | 7,912 (18.9%) | 3,453 (7.6%) |
| Total | 41,891 (100.0%) | 45,595 (100.0%) |
Real Estate & Mortgages in Baton Rouge
Real Estate and Mortgage Overview in Baton Rouge
| Characteristic | Without Mortgage | With Mortgage |
| Housing Units | 18,282 | 23,609 |
| Median Property Value | $188,100 | $236,900 |
| Median Household Income | $63,795 | $6,985 |
| Monthly Housing Costs | $452 | $2,198 |
| Real Estate Taxes | $800 | $874 |
Property Value by Mortgage Status in Baton Rouge
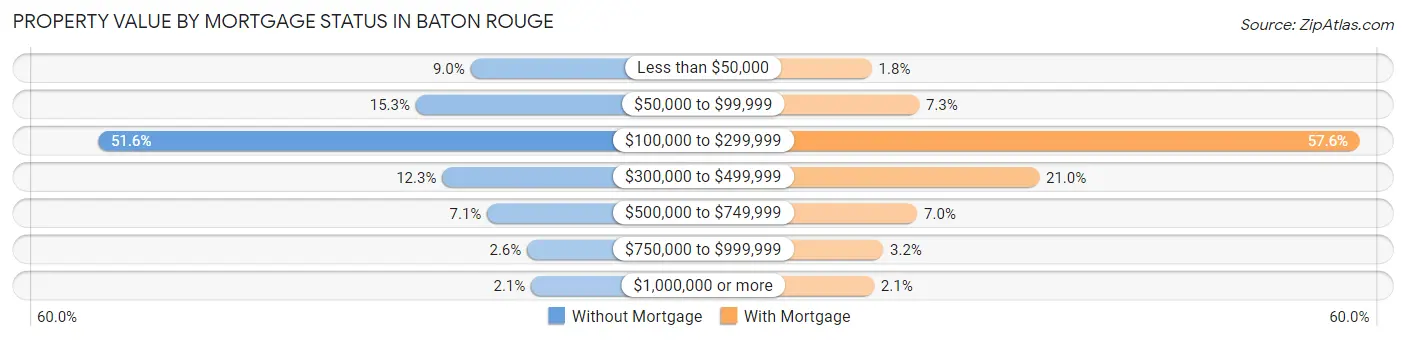
| Property Value | Without Mortgage | With Mortgage |
| Less than $50,000 | 1,650 (9.0%) | 435 (1.8%) |
| $50,000 to $99,999 | 2,795 (15.3%) | 1,712 (7.2%) |
| $100,000 to $299,999 | 9,436 (51.6%) | 13,609 (57.6%) |
| $300,000 to $499,999 | 2,244 (12.3%) | 4,951 (21.0%) |
| $500,000 to $749,999 | 1,303 (7.1%) | 1,663 (7.0%) |
| $750,000 to $999,999 | 469 (2.6%) | 743 (3.2%) |
| $1,000,000 or more | 385 (2.1%) | 496 (2.1%) |
| Total | 18,282 (100.0%) | 23,609 (100.0%) |
Household Income by Mortgage Status in Baton Rouge
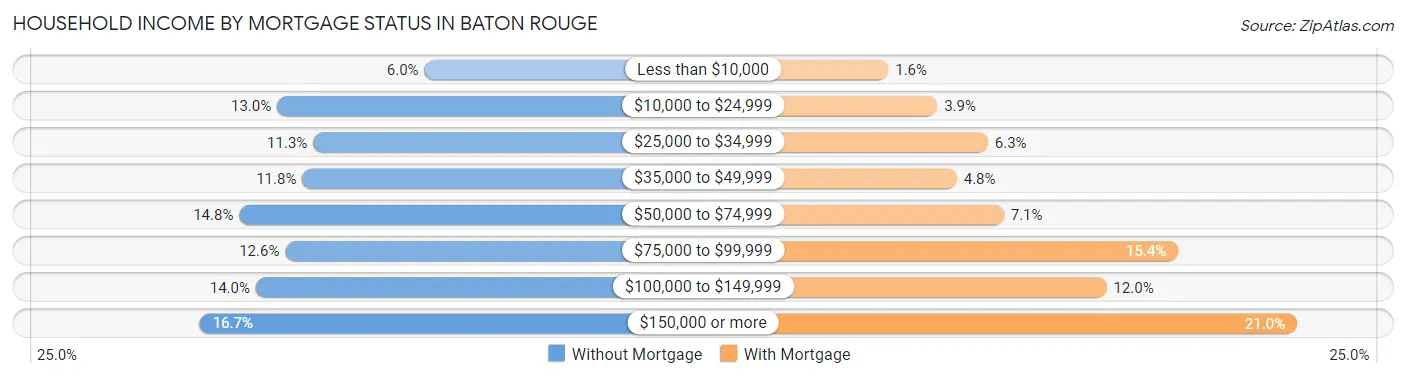
| Household Income | Without Mortgage | With Mortgage |
| Less than $10,000 | 1,089 (6.0%) | 369 (1.6%) |
| $10,000 to $24,999 | 2,373 (13.0%) | 919 (3.9%) |
| $25,000 to $34,999 | 2,059 (11.3%) | 1,488 (6.3%) |
| $35,000 to $49,999 | 2,154 (11.8%) | 1,139 (4.8%) |
| $50,000 to $74,999 | 2,702 (14.8%) | 1,666 (7.1%) |
| $75,000 to $99,999 | 2,302 (12.6%) | 3,627 (15.4%) |
| $100,000 to $149,999 | 2,558 (14.0%) | 2,822 (11.9%) |
| $150,000 or more | 3,045 (16.7%) | 4,963 (21.0%) |
| Total | 18,282 (100.0%) | 23,609 (100.0%) |
Property Value to Household Income Ratio in Baton Rouge
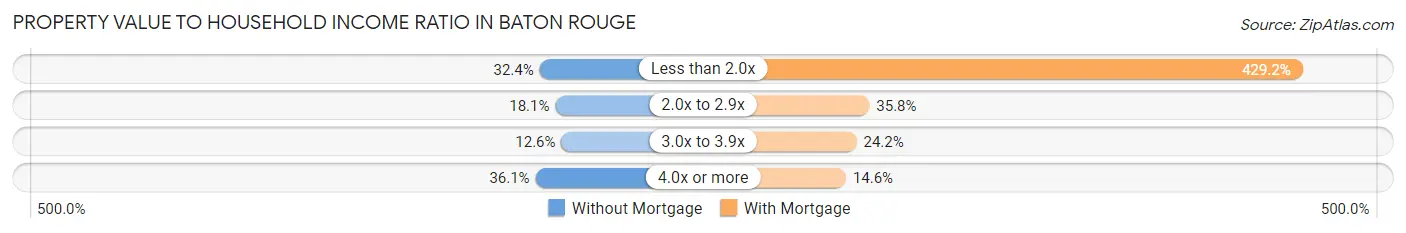
| Value-to-Income Ratio | Without Mortgage | With Mortgage |
| Less than 2.0x | 5,918 (32.4%) | 101,334 (429.2%) |
| 2.0x to 2.9x | 3,309 (18.1%) | 8,451 (35.8%) |
| 3.0x to 3.9x | 2,302 (12.6%) | 5,705 (24.2%) |
| 4.0x or more | 6,608 (36.1%) | 3,438 (14.6%) |
| Total | 18,282 (100.0%) | 23,609 (100.0%) |
Real Estate Taxes by Mortgage Status in Baton Rouge
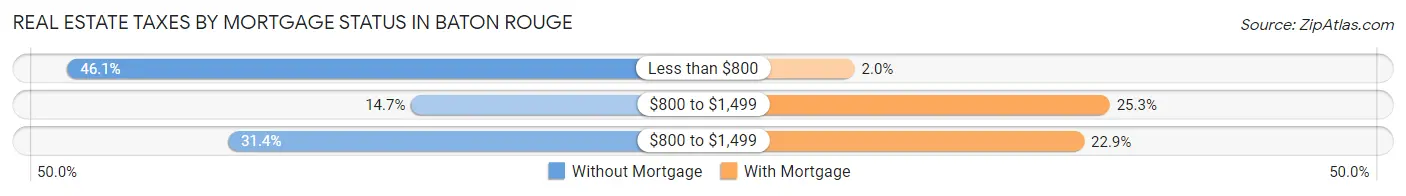
| Property Taxes | Without Mortgage | With Mortgage |
| Less than $800 | 8,427 (46.1%) | 465 (2.0%) |
| $800 to $1,499 | 2,686 (14.7%) | 5,966 (25.3%) |
| $800 to $1,499 | 5,742 (31.4%) | 5,414 (22.9%) |
| Total | 18,282 (100.0%) | 23,609 (100.0%) |
Health & Disability in Baton Rouge
Health Insurance Coverage by Age in Baton Rouge
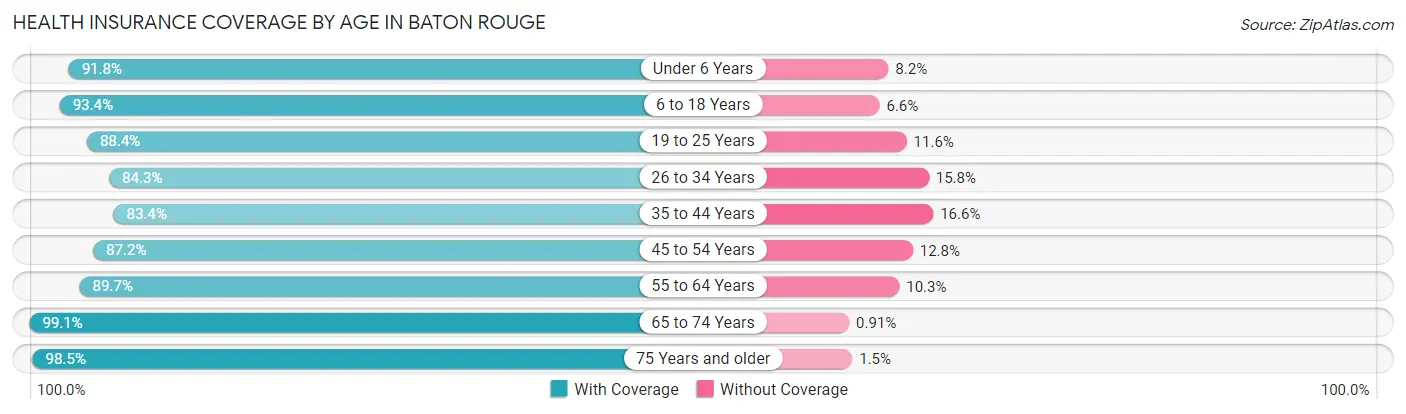
| Age Bracket | With Coverage | Without Coverage |
| Under 6 Years | 15,542 (91.8%) | 1,394 (8.2%) |
| 6 to 18 Years | 33,695 (93.4%) | 2,364 (6.6%) |
| 19 to 25 Years | 34,927 (88.4%) | 4,597 (11.6%) |
| 26 to 34 Years | 23,516 (84.3%) | 4,395 (15.8%) |
| 35 to 44 Years | 20,470 (83.4%) | 4,071 (16.6%) |
| 45 to 54 Years | 19,355 (87.2%) | 2,834 (12.8%) |
| 55 to 64 Years | 22,559 (89.7%) | 2,579 (10.3%) |
| 65 to 74 Years | 18,160 (99.1%) | 166 (0.9%) |
| 75 Years and older | 12,791 (98.5%) | 194 (1.5%) |
| Total | 201,015 (89.9%) | 22,594 (10.1%) |
Health Insurance Coverage by Citizenship Status in Baton Rouge
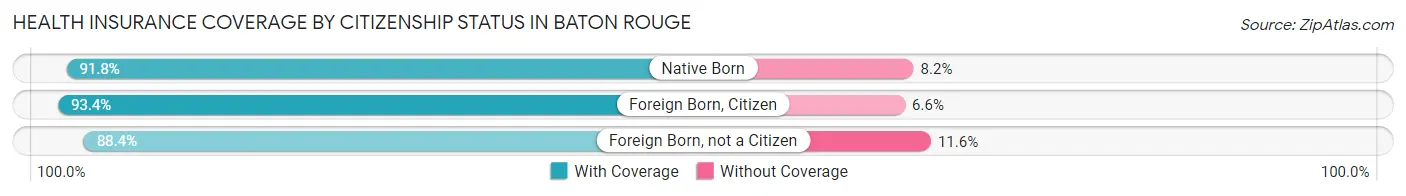
| Citizenship Status | With Coverage | Without Coverage |
| Native Born | 15,542 (91.8%) | 1,394 (8.2%) |
| Foreign Born, Citizen | 33,695 (93.4%) | 2,364 (6.6%) |
| Foreign Born, not a Citizen | 34,927 (88.4%) | 4,597 (11.6%) |
Health Insurance Coverage by Household Income in Baton Rouge
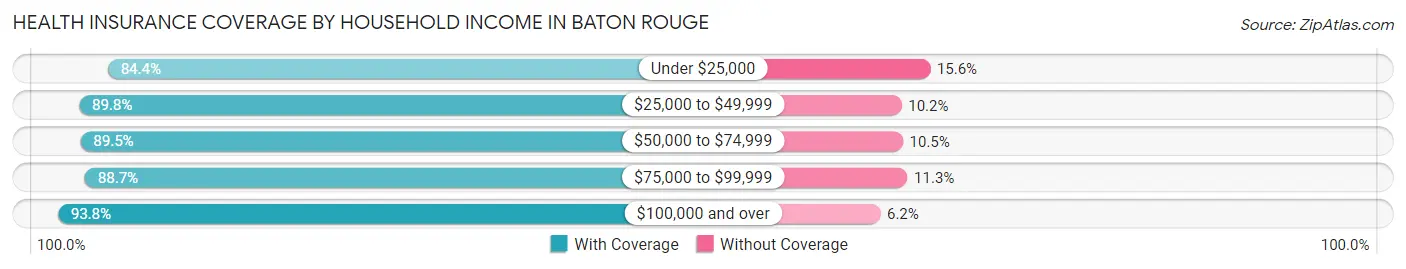
| Household Income | With Coverage | Without Coverage |
| Under $25,000 | 39,134 (84.4%) | 7,224 (15.6%) |
| $25,000 to $49,999 | 41,972 (89.8%) | 4,774 (10.2%) |
| $50,000 to $74,999 | 28,074 (89.5%) | 3,281 (10.5%) |
| $75,000 to $99,999 | 19,900 (88.7%) | 2,537 (11.3%) |
| $100,000 and over | 62,831 (93.8%) | 4,172 (6.2%) |
Public vs Private Health Insurance Coverage by Age in Baton Rouge
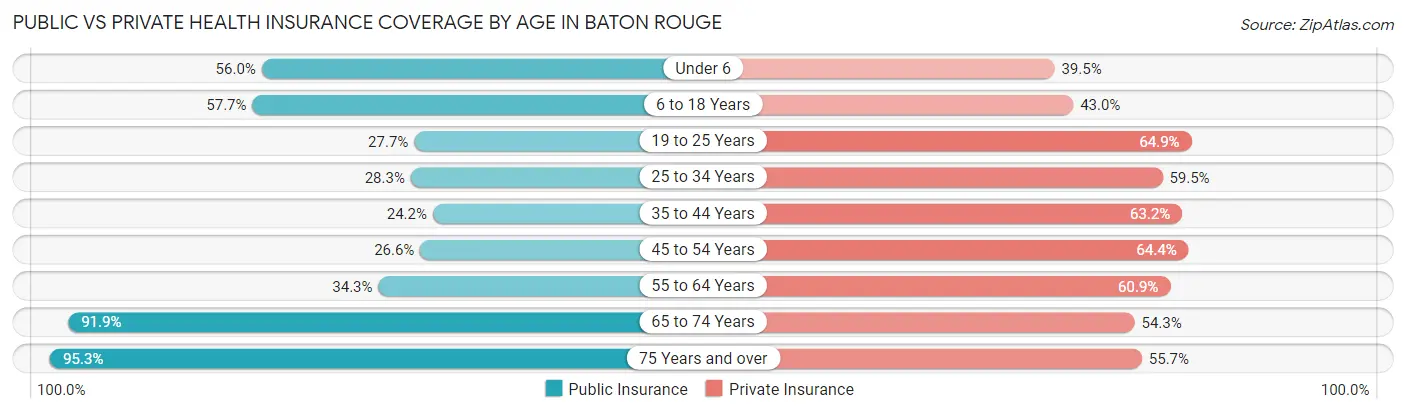
| Age Bracket | Public Insurance | Private Insurance |
| Under 6 | 9,484 (56.0%) | 6,687 (39.5%) |
| 6 to 18 Years | 20,815 (57.7%) | 15,487 (42.9%) |
| 19 to 25 Years | 10,944 (27.7%) | 25,647 (64.9%) |
| 25 to 34 Years | 7,906 (28.3%) | 16,614 (59.5%) |
| 35 to 44 Years | 5,947 (24.2%) | 15,502 (63.2%) |
| 45 to 54 Years | 5,896 (26.6%) | 14,285 (64.4%) |
| 55 to 64 Years | 8,633 (34.3%) | 15,319 (60.9%) |
| 65 to 74 Years | 16,842 (91.9%) | 9,958 (54.3%) |
| 75 Years and over | 12,372 (95.3%) | 7,233 (55.7%) |
| Total | 98,839 (44.2%) | 126,732 (56.7%) |
Disability Status by Sex by Age in Baton Rouge
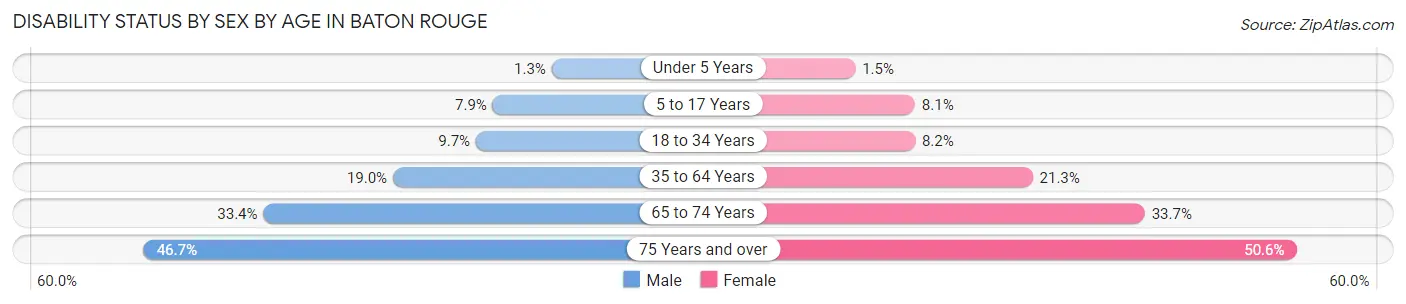
| Age Bracket | Male | Female |
| Under 5 Years | 99 (1.3%) | 99 (1.5%) |
| 5 to 17 Years | 1,298 (7.9%) | 1,237 (8.1%) |
| 18 to 34 Years | 3,489 (9.7%) | 3,151 (8.2%) |
| 35 to 64 Years | 6,463 (19.0%) | 8,035 (21.2%) |
| 65 to 74 Years | 2,641 (33.4%) | 3,516 (33.7%) |
| 75 Years and over | 2,331 (46.7%) | 4,047 (50.6%) |
Disability Class by Sex by Age in Baton Rouge
Disability Class: Hearing Difficulty
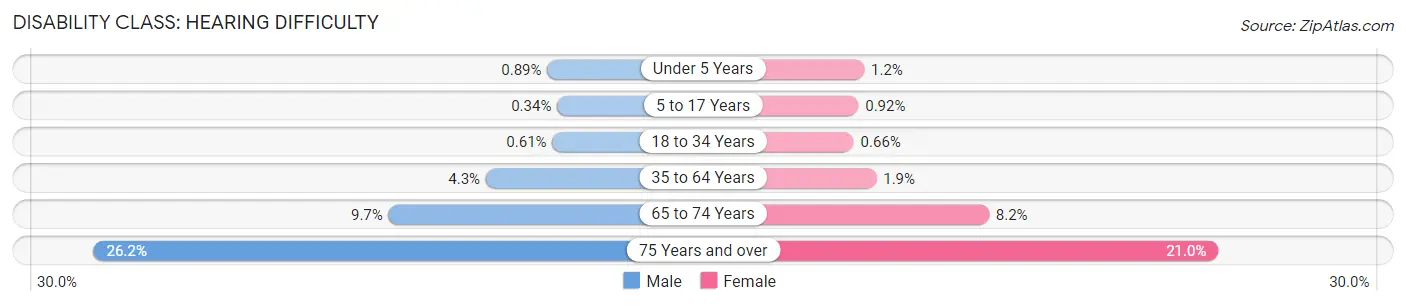
| Age Bracket | Male | Female |
| Under 5 Years | 68 (0.9%) | 82 (1.2%) |
| 5 to 17 Years | 56 (0.3%) | 139 (0.9%) |
| 18 to 34 Years | 217 (0.6%) | 254 (0.7%) |
| 35 to 64 Years | 1,469 (4.3%) | 725 (1.9%) |
| 65 to 74 Years | 769 (9.7%) | 854 (8.2%) |
| 75 Years and over | 1,305 (26.2%) | 1,676 (21.0%) |
Disability Class: Vision Difficulty
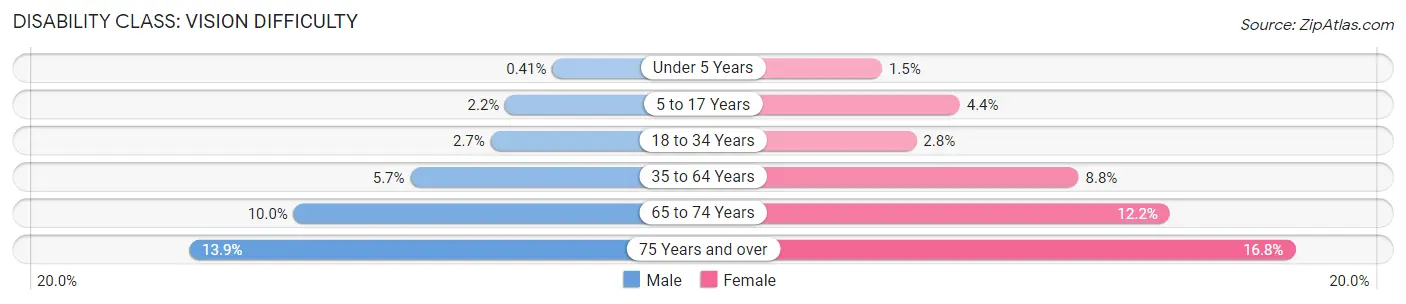
| Age Bracket | Male | Female |
| Under 5 Years | 31 (0.4%) | 99 (1.5%) |
| 5 to 17 Years | 357 (2.2%) | 665 (4.4%) |
| 18 to 34 Years | 969 (2.7%) | 1,070 (2.8%) |
| 35 to 64 Years | 1,933 (5.7%) | 3,325 (8.8%) |
| 65 to 74 Years | 791 (10.0%) | 1,268 (12.2%) |
| 75 Years and over | 693 (13.9%) | 1,346 (16.8%) |
Disability Class: Cognitive Difficulty
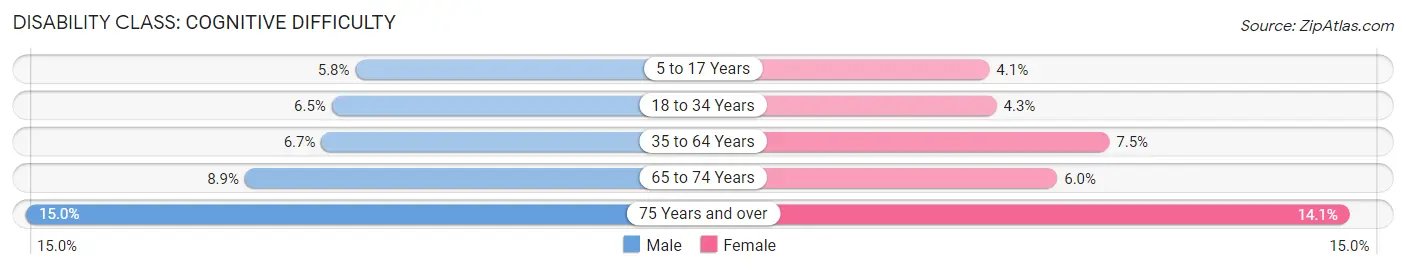
| Age Bracket | Male | Female |
| 5 to 17 Years | 955 (5.8%) | 624 (4.1%) |
| 18 to 34 Years | 2,312 (6.5%) | 1,668 (4.3%) |
| 35 to 64 Years | 2,294 (6.7%) | 2,818 (7.4%) |
| 65 to 74 Years | 701 (8.9%) | 625 (6.0%) |
| 75 Years and over | 746 (15.0%) | 1,131 (14.1%) |
Disability Class: Ambulatory Difficulty
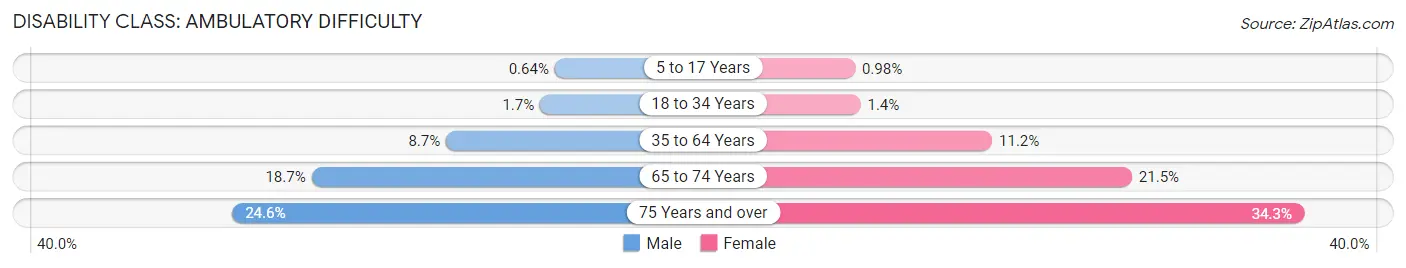
| Age Bracket | Male | Female |
| 5 to 17 Years | 106 (0.6%) | 149 (1.0%) |
| 18 to 34 Years | 619 (1.7%) | 539 (1.4%) |
| 35 to 64 Years | 2,965 (8.7%) | 4,218 (11.2%) |
| 65 to 74 Years | 1,478 (18.7%) | 2,245 (21.5%) |
| 75 Years and over | 1,226 (24.6%) | 2,743 (34.3%) |
Disability Class: Self-Care Difficulty
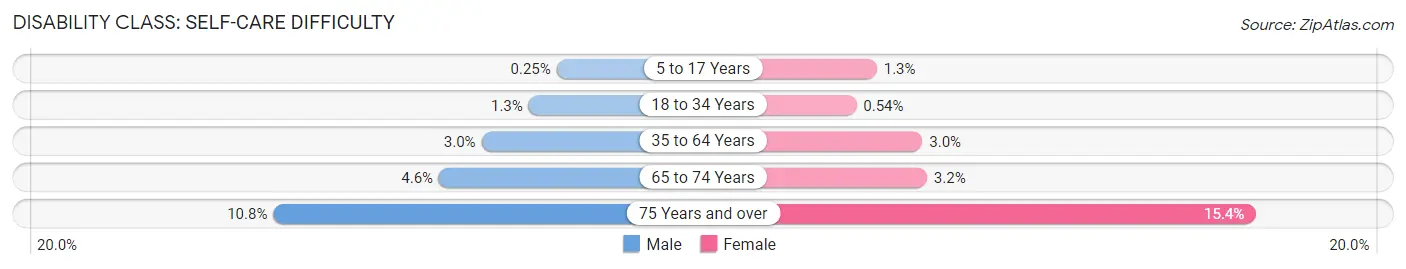
| Age Bracket | Male | Female |
| 5 to 17 Years | 42 (0.3%) | 198 (1.3%) |
| 18 to 34 Years | 462 (1.3%) | 208 (0.5%) |
| 35 to 64 Years | 1,037 (3.0%) | 1,129 (3.0%) |
| 65 to 74 Years | 365 (4.6%) | 329 (3.2%) |
| 75 Years and over | 537 (10.8%) | 1,230 (15.4%) |
Technology Access in Baton Rouge
Computing Device Access in Baton Rouge
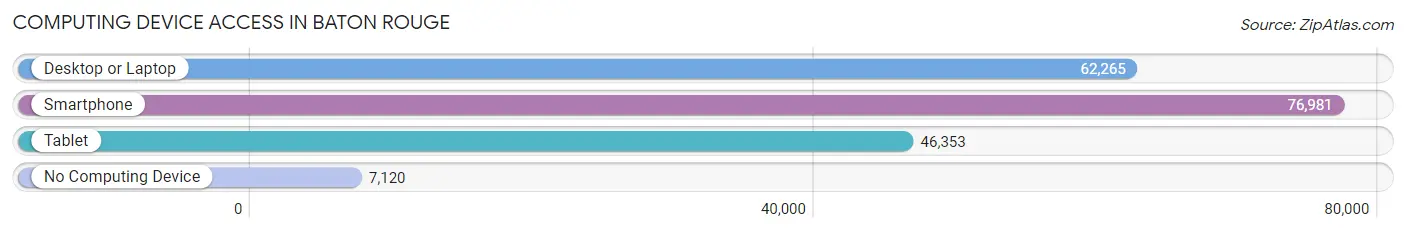
| Device Type | # Households | % Households |
| Desktop or Laptop | 62,265 | 71.2% |
| Smartphone | 76,981 | 88.0% |
| Tablet | 46,353 | 53.0% |
| No Computing Device | 7,120 | 8.1% |
| Total | 87,486 | 100.0% |
Internet Access in Baton Rouge
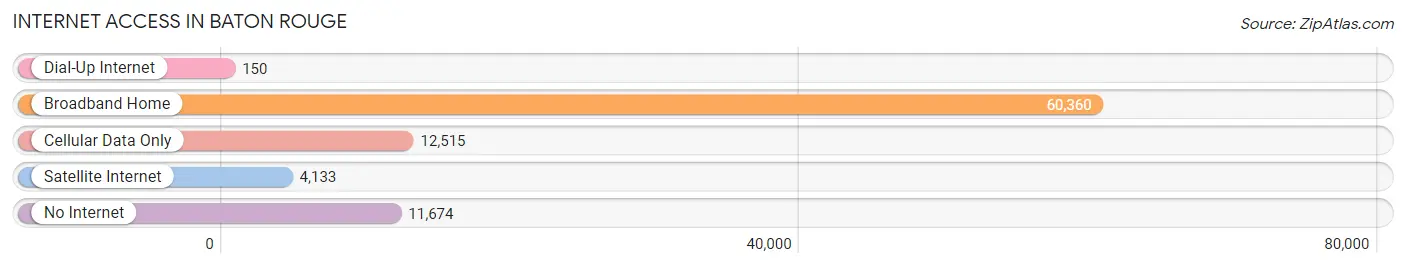
| Internet Type | # Households | % Households |
| Dial-Up Internet | 150 | 0.2% |
| Broadband Home | 60,360 | 69.0% |
| Cellular Data Only | 12,515 | 14.3% |
| Satellite Internet | 4,133 | 4.7% |
| No Internet | 11,674 | 13.3% |
| Total | 87,486 | 100.0% |
Baton Rouge Summary
Baton Rouge is the capital of Louisiana and the second-largest city in the state. It is located on the eastern bank of the Mississippi River, about 80 miles northwest of New Orleans. The city has a population of 229,553 as of the 2019 U.S. Census estimate, making it the third-largest city in Louisiana. Baton Rouge is a major industrial, petrochemical, medical, research, motion picture, and growing technology center of the Gulf Coast region.
Geography
Baton Rouge is located in the southeastern part of Louisiana, in East Baton Rouge Parish. It is situated on the Mississippi River, about 80 miles northwest of New Orleans. The city is bordered by the parishes of East Baton Rouge, West Baton Rouge, Iberville, and Ascension. The city is divided into five districts: Downtown, Mid City, South Baton Rouge, North Baton Rouge, and Central.
The city has a total area of 76.2 square miles, of which 75.2 square miles is land and 1.0 square mile is water. The city is located at an elevation of 33 feet above sea level. The climate is humid subtropical, with hot, humid summers and mild winters.
History
Baton Rouge was founded in 1699 by French explorer Pierre Le Moyne d'Iberville. The city was named after a red pole that marked the boundary between the French and British colonies. The city was incorporated in 1817 and became the capital of Louisiana in 1849.
In the 19th century, Baton Rouge was a major port city and a center of the cotton trade. The city was also a major center of the Confederate States of America during the Civil War. After the war, the city experienced a period of economic growth and development.
In the 20th century, Baton Rouge became a major industrial center, with the construction of petrochemical plants and other industries. The city also became a major center of higher education, with the establishment of Louisiana State University in 1860.
Economy
Baton Rouge is a major industrial, petrochemical, medical, research, motion picture, and growing technology center of the Gulf Coast region. The city is home to several Fortune 500 companies, including ExxonMobil, Dow Chemical, and Shaw Group.
The city's economy is also supported by the tourism industry, with attractions such as the USS Kidd Veterans Memorial, the Louisiana State Capitol, and the Old State Capitol. The city is also home to several universities and colleges, including Louisiana State University, Southern University, and Baton Rouge Community College.
Demographics
As of the 2019 U.S. Census estimate, the population of Baton Rouge was 229,553. The city has a population density of 3,037 people per square mile. The racial makeup of the city is 57.2% African American, 37.2% White, 2.2% Asian, 0.7% Native American, 0.1% Pacific Islander, and 2.6% from other races.
The median household income in Baton Rouge is $45,945, and the median family income is $54,817. The per capita income is $25,945. The city has a poverty rate of 24.3%.
Conclusion
Baton Rouge is the capital of Louisiana and the second-largest city in the state. It is located on the eastern bank of the Mississippi River, about 80 miles northwest of New Orleans. The city has a population of 229,553 as of the 2019 U.S. Census estimate, making it the third-largest city in Louisiana. Baton Rouge is a major industrial, petrochemical, medical, research, motion picture, and growing technology center of the Gulf Coast region. The city has a diverse economy, with major industries such as petrochemicals, tourism, and higher education. The population of Baton Rouge is 57.2% African American, 37.2% White, 2.2% Asian, 0.7% Native American, 0.1% Pacific Islander, and 2.6% from other races. The median household income in Baton Rouge is $45,945, and the median family income is $54,817. The per capita income is $25,945. The city has a poverty rate of 24.3%.
Common Questions
What is Per Capita Income in Baton Rouge?
Per Capita income in Baton Rouge is $33,910.
What is the Median Family Income in Baton Rouge?
Median Family Income in Baton Rouge is $68,228.
What is the Median Household income in Baton Rouge?
Median Household Income in Baton Rouge is $50,155.
What is Income or Wage Gap in Baton Rouge?
Income or Wage Gap in Baton Rouge is 30.7%.
Women in Baton Rouge earn 69.3 cents for every dollar earned by a man.
What is Family Income Deficit in Baton Rouge?
Family Income Deficit in Baton Rouge is $10,881.
Families that are below poverty line in Baton Rouge earn $10,881 less on average than the poverty threshold level.
What is Inequality or Gini Index in Baton Rouge?
Inequality or Gini Index in Baton Rouge is 0.55.
What is the Total Population of Baton Rouge?
Total Population of Baton Rouge is 225,500.
What is the Total Male Population of Baton Rouge?
Total Male Population of Baton Rouge is 107,800.
What is the Total Female Population of Baton Rouge?
Total Female Population of Baton Rouge is 117,700.
What is the Ratio of Males per 100 Females in Baton Rouge?
There are 91.59 Males per 100 Females in Baton Rouge.
What is the Ratio of Females per 100 Males in Baton Rouge?
There are 109.18 Females per 100 Males in Baton Rouge.
What is the Median Population Age in Baton Rouge?
Median Population Age in Baton Rouge is 31.9 Years.
What is the Average Family Size in Baton Rouge
Average Family Size in Baton Rouge is 3.3 People.
What is the Average Household Size in Baton Rouge
Average Household Size in Baton Rouge is 2.5 People.
How Large is the Labor Force in Baton Rouge?
There are 114,813 People in the Labor Forcein in Baton Rouge.
What is the Percentage of People in the Labor Force in Baton Rouge?
62.1% of People are in the Labor Force in Baton Rouge.
What is the Unemployment Rate in Baton Rouge?
Unemployment Rate in Baton Rouge is 8.6%.