Flint, MI Map & Demographics
Flint Map
Flint Overview
$20,559
PER CAPITA INCOME
$43,042
AVG FAMILY INCOME
$35,451
AVG HOUSEHOLD INCOME
10.9%
WAGE / INCOME GAP [ % ]
89.1¢/ $1
WAGE / INCOME GAP [ $ ]
$12,849
FAMILY INCOME DEFICIT
0.49
INEQUALITY / GINI INDEX
81,863
TOTAL POPULATION
40,492
MALE POPULATION
41,371
FEMALE POPULATION
97.88
MALES / 100 FEMALES
102.17
FEMALES / 100 MALES
36.1
MEDIAN AGE
3.2
AVG FAMILY SIZE
2.4
AVG HOUSEHOLD SIZE
35,159
LABOR FORCE [ PEOPLE ]
54.6%
PERCENT IN LABOR FORCE
17.6%
UNEMPLOYMENT RATE
Flint Area Codes
Income in Flint
Income Overview in Flint
Per Capita Income in Flint is $20,559, while median incomes of families and households are $43,042 and $35,451 respectively.
| Characteristic | Number | Measure |
| Per Capita Income | 81,863 | $20,559 |
| Median Family Income | 18,393 | $43,042 |
| Mean Family Income | 18,393 | $54,897 |
| Median Household Income | 33,854 | $35,451 |
| Mean Household Income | 33,854 | $47,221 |
| Income Deficit | 18,393 | $12,849 |
| Wage / Income Gap (%) | 81,863 | 10.92% |
| Wage / Income Gap ($) | 81,863 | 89.08¢ per $1 |
| Gini / Inequality Index | 81,863 | 0.49 |
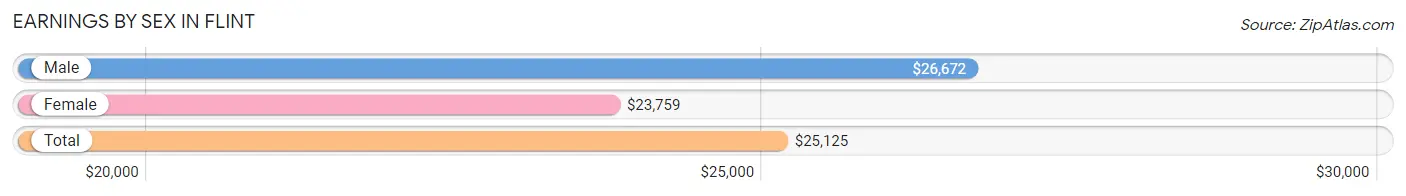
Earnings by Sex in Flint
Average Earnings in Flint are $25,125, $26,672 for men and $23,759 for women, a difference of 10.9%.
| Sex | Number | Average Earnings |
| Male | 16,890 (48.9%) | $26,672 |
| Female | 17,638 (51.1%) | $23,759 |
| Total | 34,528 (100.0%) | $25,125 |
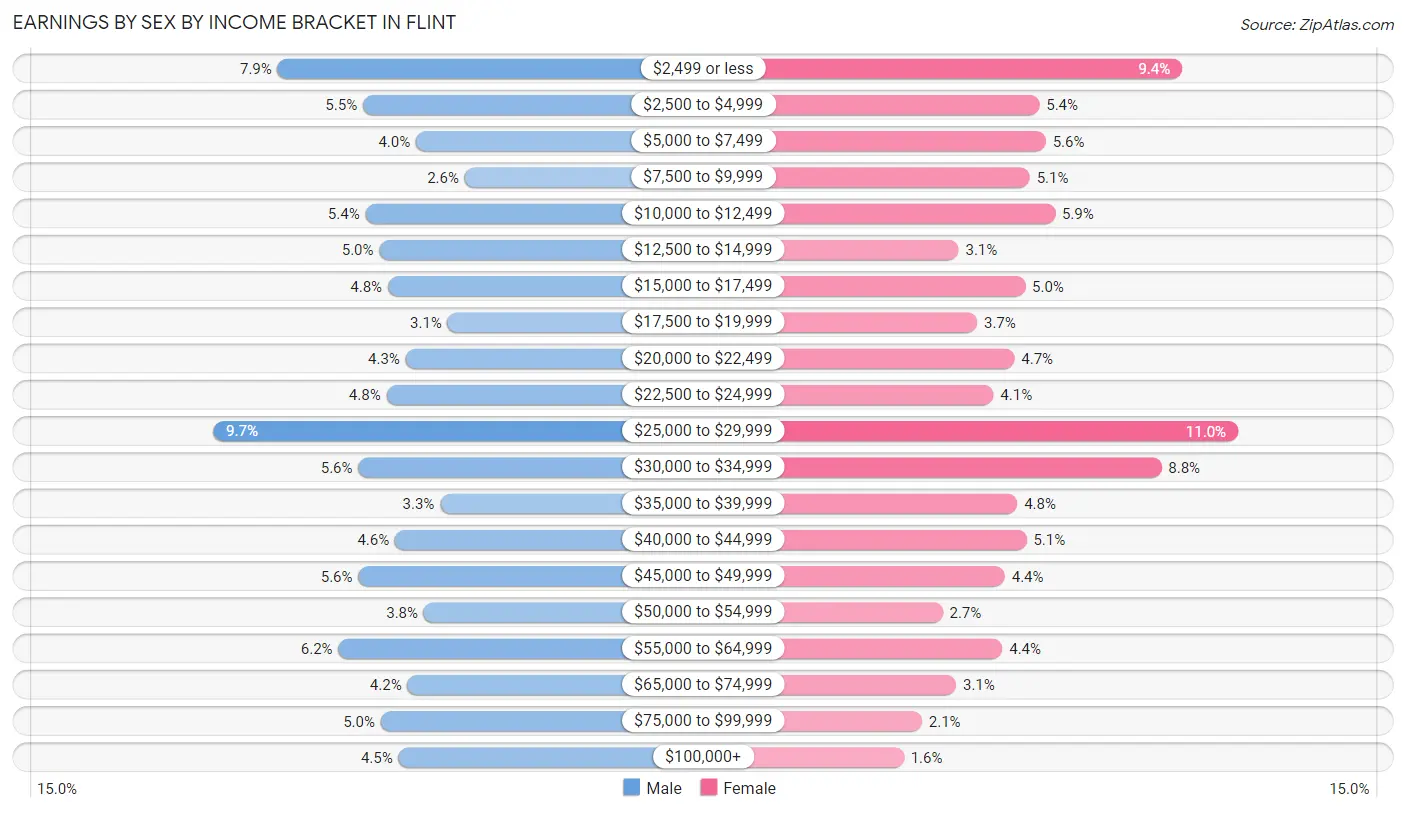
Earnings by Sex by Income Bracket in Flint
The most common earnings brackets in Flint are $25,000 to $29,999 for men (1,638 | 9.7%) and $25,000 to $29,999 for women (1,939 | 11.0%).
| Income | Male | Female |
| $2,499 or less | 1,332 (7.9%) | 1,662 (9.4%) |
| $2,500 to $4,999 | 928 (5.5%) | 954 (5.4%) |
| $5,000 to $7,499 | 676 (4.0%) | 986 (5.6%) |
| $7,500 to $9,999 | 445 (2.6%) | 906 (5.1%) |
| $10,000 to $12,499 | 915 (5.4%) | 1,031 (5.9%) |
| $12,500 to $14,999 | 849 (5.0%) | 554 (3.1%) |
| $15,000 to $17,499 | 809 (4.8%) | 884 (5.0%) |
| $17,500 to $19,999 | 526 (3.1%) | 645 (3.7%) |
| $20,000 to $22,499 | 724 (4.3%) | 831 (4.7%) |
| $22,500 to $24,999 | 815 (4.8%) | 727 (4.1%) |
| $25,000 to $29,999 | 1,638 (9.7%) | 1,939 (11.0%) |
| $30,000 to $34,999 | 949 (5.6%) | 1,560 (8.8%) |
| $35,000 to $39,999 | 560 (3.3%) | 844 (4.8%) |
| $40,000 to $44,999 | 775 (4.6%) | 891 (5.1%) |
| $45,000 to $49,999 | 949 (5.6%) | 784 (4.4%) |
| $50,000 to $54,999 | 639 (3.8%) | 474 (2.7%) |
| $55,000 to $64,999 | 1,044 (6.2%) | 770 (4.4%) |
| $65,000 to $74,999 | 716 (4.2%) | 542 (3.1%) |
| $75,000 to $99,999 | 842 (5.0%) | 372 (2.1%) |
| $100,000+ | 759 (4.5%) | 282 (1.6%) |
| Total | 16,890 (100.0%) | 17,638 (100.0%) |
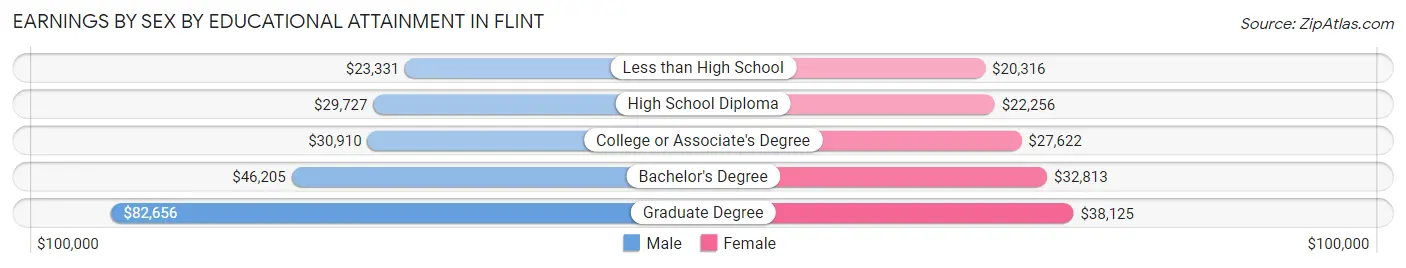
Earnings by Sex by Educational Attainment in Flint
Average earnings in Flint are $30,573 for men and $26,537 for women, a difference of 13.2%. Men with an educational attainment of graduate degree enjoy the highest average annual earnings of $82,656, while those with less than high school education earn the least with $23,331. Women with an educational attainment of graduate degree earn the most with the average annual earnings of $38,125, while those with less than high school education have the smallest earnings of $20,316.
| Educational Attainment | Male Income | Female Income |
| Less than High School | $23,331 | $20,316 |
| High School Diploma | $29,727 | $22,256 |
| College or Associate's Degree | $30,910 | $27,622 |
| Bachelor's Degree | $46,205 | $32,813 |
| Graduate Degree | $82,656 | $38,125 |
| Total | $30,573 | $26,537 |
Family Income in Flint
Family Income Brackets in Flint
According to the Flint family income data, there are 3,771 families falling into the $50,000 to $74,999 income range, which is the most common income bracket and makes up 20.5% of all families. Conversely, the $200,000+ income bracket is the least frequent group with only 349 families (1.9%) belonging to this category.
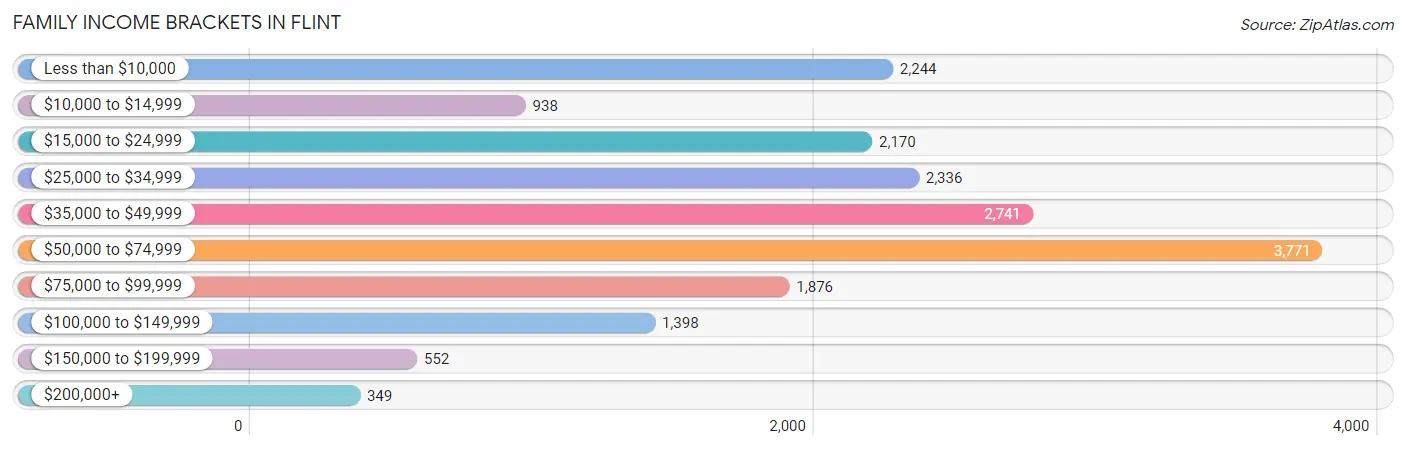
| Income Bracket | # Families | % Families |
| Less than $10,000 | 2,244 | 12.2% |
| $10,000 to $14,999 | 938 | 5.1% |
| $15,000 to $24,999 | 2,170 | 11.8% |
| $25,000 to $34,999 | 2,336 | 12.7% |
| $35,000 to $49,999 | 2,741 | 14.9% |
| $50,000 to $74,999 | 3,771 | 20.5% |
| $75,000 to $99,999 | 1,876 | 10.2% |
| $100,000 to $149,999 | 1,398 | 7.6% |
| $150,000 to $199,999 | 552 | 3.0% |
| $200,000+ | 349 | 1.9% |
Family Income by Famaliy Size in Flint
4-person families (2,889 | 15.7%) account for the highest median family income in Flint with $44,175 per family, while 2-person families (9,202 | 50.0%) have the highest median income of $21,699 per family member.
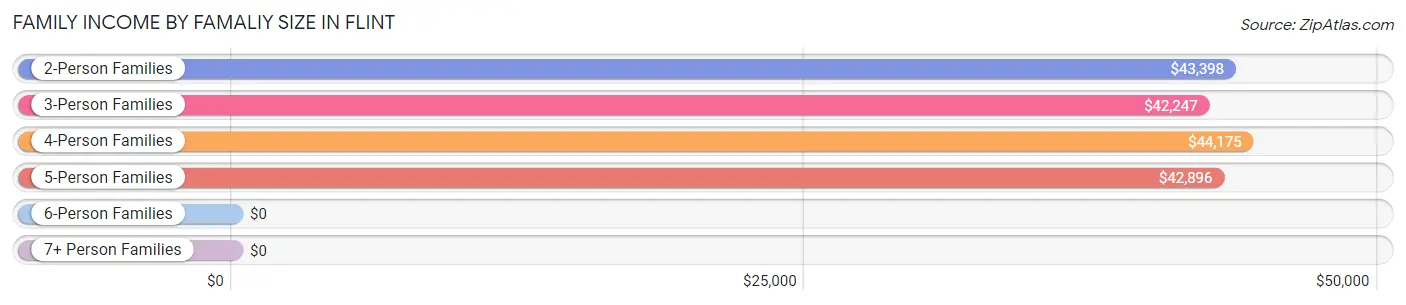
| Income Bracket | # Families | Median Income |
| 2-Person Families | 9,202 (50.0%) | $43,398 |
| 3-Person Families | 4,383 (23.8%) | $42,247 |
| 4-Person Families | 2,889 (15.7%) | $44,175 |
| 5-Person Families | 1,205 (6.6%) | $42,896 |
| 6-Person Families | 565 (3.1%) | $0 |
| 7+ Person Families | 149 (0.8%) | $0 |
| Total | 18,393 (100.0%) | $43,042 |
Family Income by Number of Earners in Flint
The median family income in Flint is $43,042, with families comprising 3+ earners (889) having the highest median family income of $81,023, while families with no earners (4,165) have the lowest median family income of $24,753, accounting for 4.8% and 22.6% of families, respectively.
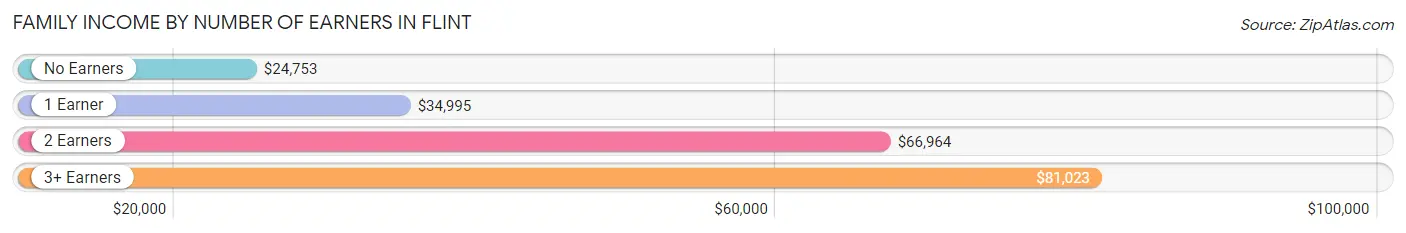
| Number of Earners | # Families | Median Income |
| No Earners | 4,165 (22.6%) | $24,753 |
| 1 Earner | 8,756 (47.6%) | $34,995 |
| 2 Earners | 4,583 (24.9%) | $66,964 |
| 3+ Earners | 889 (4.8%) | $81,023 |
| Total | 18,393 (100.0%) | $43,042 |
Household Income in Flint
Household Income Brackets in Flint
With 5,721 households falling in the category, the $35,000 to $49,999 income range is the most frequent in Flint, accounting for 16.9% of all households. In contrast, only 508 households (1.5%) fall into the $200,000+ income bracket, making it the least populous group.
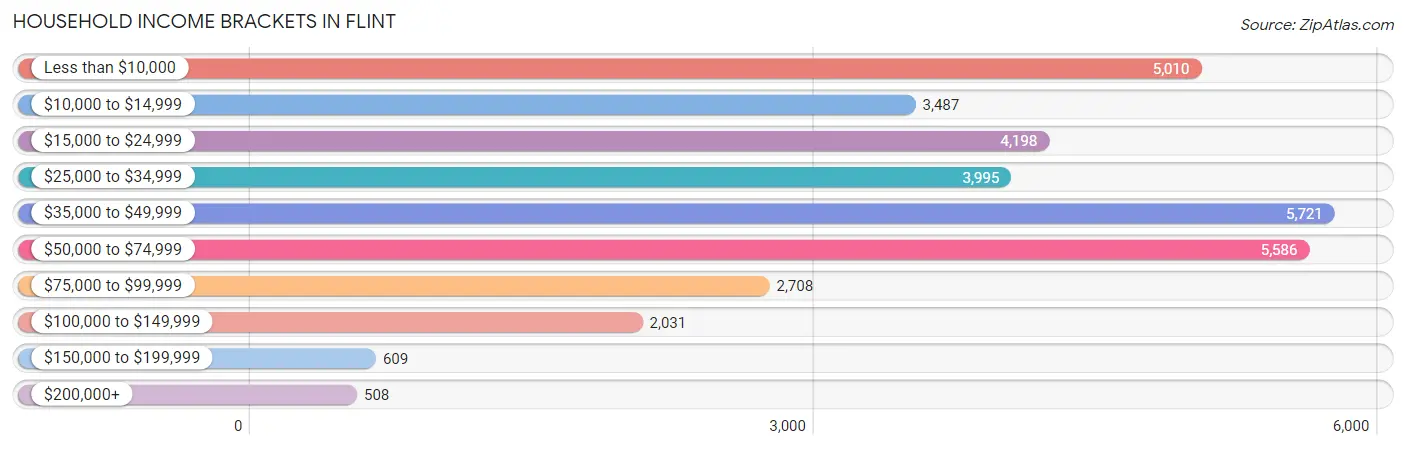
| Income Bracket | # Households | % Households |
| Less than $10,000 | 5,010 | 14.8% |
| $10,000 to $14,999 | 3,487 | 10.3% |
| $15,000 to $24,999 | 4,198 | 12.4% |
| $25,000 to $34,999 | 3,995 | 11.8% |
| $35,000 to $49,999 | 5,721 | 16.9% |
| $50,000 to $74,999 | 5,586 | 16.5% |
| $75,000 to $99,999 | 2,708 | 8.0% |
| $100,000 to $149,999 | 2,031 | 6.0% |
| $150,000 to $199,999 | 609 | 1.8% |
| $200,000+ | 508 | 1.5% |
Household Income by Householder Age in Flint
The median household income in Flint is $35,451, with the highest median household income of $39,558 found in the 45 to 64 years age bracket for the primary householder. A total of 12,703 households (37.5%) fall into this category. Meanwhile, the 15 to 24 years age bracket for the primary householder has the lowest median household income of $21,576, with 1,257 households (3.7%) in this group.
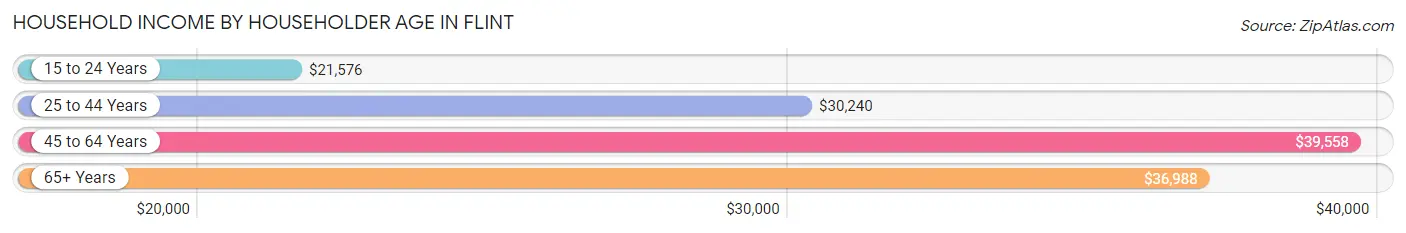
| Income Bracket | # Households | Median Income |
| 15 to 24 Years | 1,257 (3.7%) | $21,576 |
| 25 to 44 Years | 11,892 (35.1%) | $30,240 |
| 45 to 64 Years | 12,703 (37.5%) | $39,558 |
| 65+ Years | 8,002 (23.6%) | $36,988 |
| Total | 33,854 (100.0%) | $35,451 |
Poverty in Flint
Income Below Poverty by Sex and Age in Flint
With 33.1% poverty level for males and 33.5% for females among the residents of Flint, 5 year old males and under 5 year old females are the most vulnerable to poverty, with 230 males (69.3%) and 1,674 females (58.8%) in their respective age groups living below the poverty level.
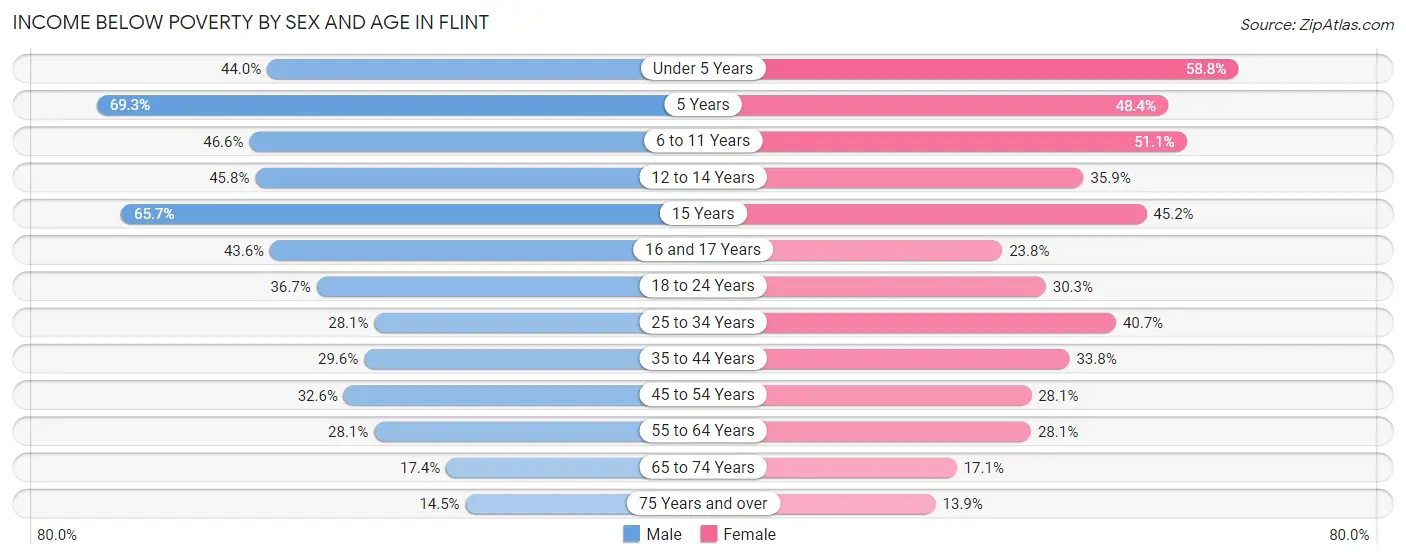
| Age Bracket | Male | Female |
| Under 5 Years | 1,155 (44.0%) | 1,674 (58.8%) |
| 5 Years | 230 (69.3%) | 333 (48.4%) |
| 6 to 11 Years | 1,698 (46.6%) | 1,635 (51.1%) |
| 12 to 14 Years | 629 (45.8%) | 501 (35.9%) |
| 15 Years | 373 (65.7%) | 223 (45.2%) |
| 16 and 17 Years | 512 (43.6%) | 228 (23.8%) |
| 18 to 24 Years | 1,431 (36.7%) | 1,110 (30.3%) |
| 25 to 34 Years | 1,632 (28.1%) | 2,276 (40.7%) |
| 35 to 44 Years | 1,362 (29.6%) | 1,820 (33.8%) |
| 45 to 54 Years | 1,635 (32.6%) | 1,331 (28.1%) |
| 55 to 64 Years | 1,519 (28.1%) | 1,557 (28.1%) |
| 65 to 74 Years | 565 (17.4%) | 621 (17.1%) |
| 75 Years and over | 216 (14.5%) | 373 (13.9%) |
| Total | 12,957 (33.1%) | 13,682 (33.5%) |
Income Above Poverty by Sex and Age in Flint
According to the poverty statistics in Flint, males aged 75 years and over and females aged 75 years and over are the age groups that are most secure financially, with 85.5% of males and 86.1% of females in these age groups living above the poverty line.
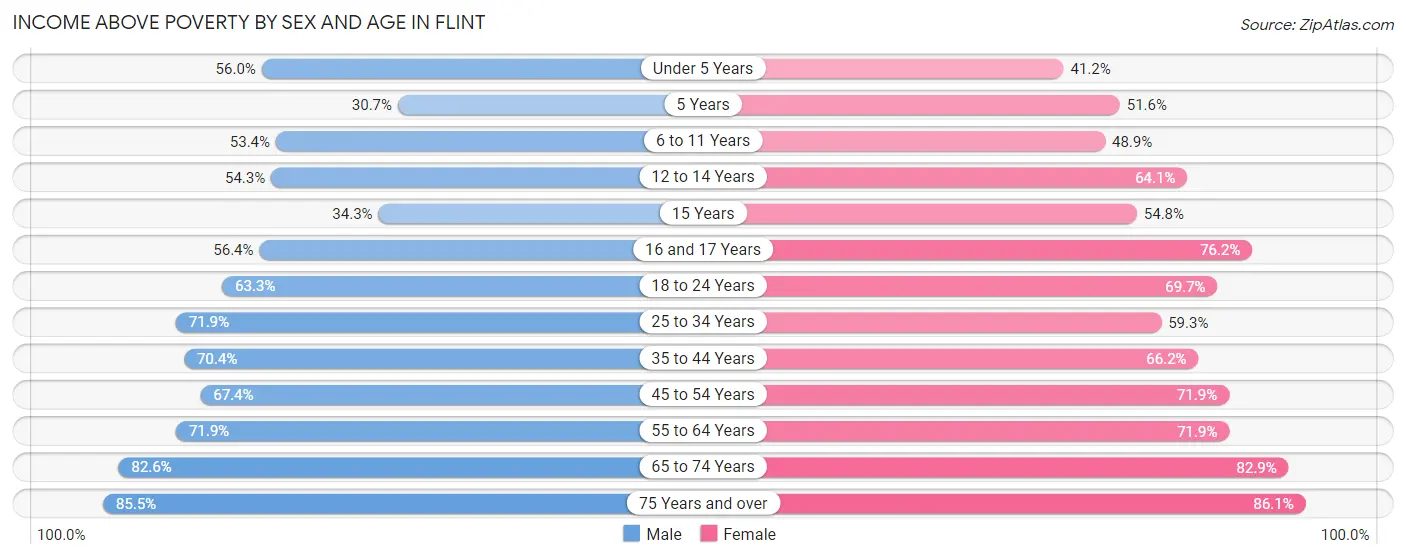
| Age Bracket | Male | Female |
| Under 5 Years | 1,470 (56.0%) | 1,171 (41.2%) |
| 5 Years | 102 (30.7%) | 355 (51.6%) |
| 6 to 11 Years | 1,943 (53.4%) | 1,562 (48.9%) |
| 12 to 14 Years | 746 (54.2%) | 895 (64.1%) |
| 15 Years | 195 (34.3%) | 270 (54.8%) |
| 16 and 17 Years | 663 (56.4%) | 729 (76.2%) |
| 18 to 24 Years | 2,472 (63.3%) | 2,554 (69.7%) |
| 25 to 34 Years | 4,179 (71.9%) | 3,315 (59.3%) |
| 35 to 44 Years | 3,241 (70.4%) | 3,563 (66.2%) |
| 45 to 54 Years | 3,379 (67.4%) | 3,400 (71.9%) |
| 55 to 64 Years | 3,887 (71.9%) | 3,985 (71.9%) |
| 65 to 74 Years | 2,679 (82.6%) | 3,017 (82.9%) |
| 75 Years and over | 1,270 (85.5%) | 2,304 (86.1%) |
| Total | 26,226 (66.9%) | 27,120 (66.5%) |
Income Below Poverty Among Married-Couple Families in Flint
The poverty statistics for married-couple families in Flint show that 9.4% or 670 of the total 7,112 families live below the poverty line. Families with 5 or more children have the highest poverty rate of 37.2%, comprising of 16 families. On the other hand, families with no children have the lowest poverty rate of 6.0%, which includes 267 families.
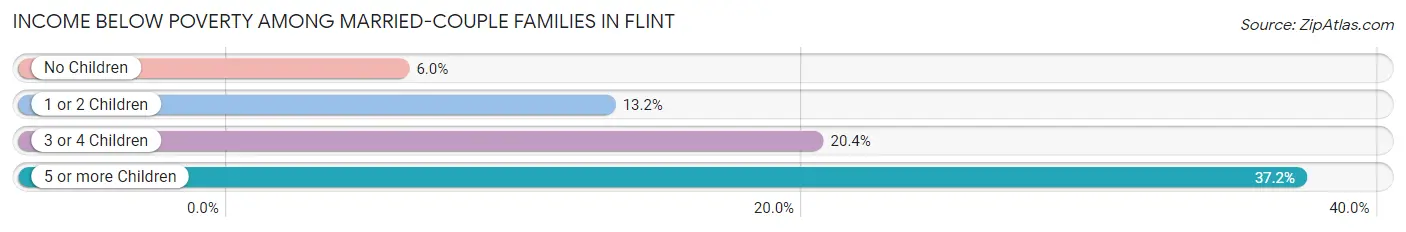
| Children | Above Poverty | Below Poverty |
| No Children | 4,202 (94.0%) | 267 (6.0%) |
| 1 or 2 Children | 1,717 (86.9%) | 260 (13.2%) |
| 3 or 4 Children | 496 (79.6%) | 127 (20.4%) |
| 5 or more Children | 27 (62.8%) | 16 (37.2%) |
| Total | 6,442 (90.6%) | 670 (9.4%) |
Income Below Poverty Among Single-Parent Households in Flint
According to the poverty data in Flint, 22.4% or 577 single-father households and 41.4% or 3,601 single-mother households are living below the poverty line. Among single-father households, those with 5 or more children have the highest poverty rate, with 46 households (100.0%) experiencing poverty. Likewise, among single-mother households, those with 5 or more children have the highest poverty rate, with 100 households (89.3%) falling below the poverty line.
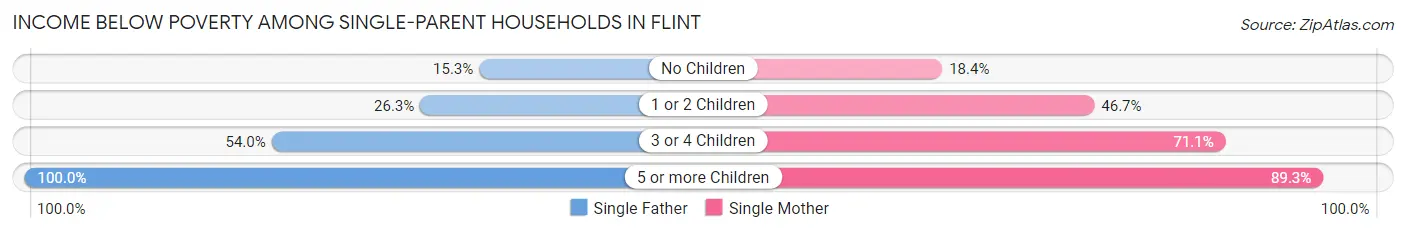
| Children | Single Father | Single Mother |
| No Children | 208 (15.3%) | 554 (18.4%) |
| 1 or 2 Children | 296 (26.3%) | 1,947 (46.7%) |
| 3 or 4 Children | 27 (54.0%) | 1,000 (71.1%) |
| 5 or more Children | 46 (100.0%) | 100 (89.3%) |
| Total | 577 (22.4%) | 3,601 (41.4%) |
Income Below Poverty Among Married-Couple vs Single-Parent Households in Flint
The poverty data for Flint shows that 670 of the married-couple family households (9.4%) and 4,178 of the single-parent households (37.0%) are living below the poverty level. Within the married-couple family households, those with 5 or more children have the highest poverty rate, with 16 households (37.2%) falling below the poverty line. Among the single-parent households, those with 5 or more children have the highest poverty rate, with 146 household (92.4%) living below poverty.
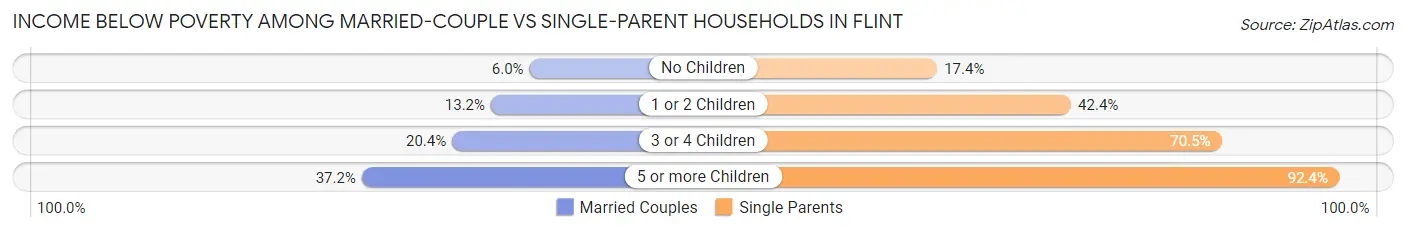
| Children | Married-Couple Families | Single-Parent Households |
| No Children | 267 (6.0%) | 762 (17.4%) |
| 1 or 2 Children | 260 (13.2%) | 2,243 (42.4%) |
| 3 or 4 Children | 127 (20.4%) | 1,027 (70.5%) |
| 5 or more Children | 16 (37.2%) | 146 (92.4%) |
| Total | 670 (9.4%) | 4,178 (37.0%) |
Race in Flint
The most populous races in Flint are Black / African American (46,091 | 56.3%), White / Caucasian (28,859 | 35.2%), and Two or more Races (5,336 | 6.5%).
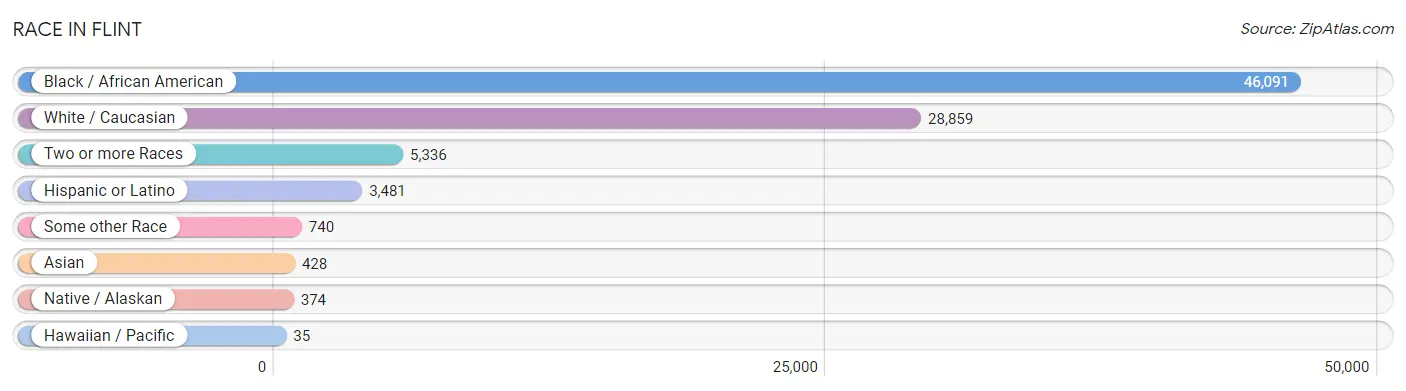
| Race | # Population | % Population |
| Asian | 428 | 0.5% |
| Black / African American | 46,091 | 56.3% |
| Hawaiian / Pacific | 35 | 0.0% |
| Hispanic or Latino | 3,481 | 4.3% |
| Native / Alaskan | 374 | 0.5% |
| White / Caucasian | 28,859 | 35.2% |
| Two or more Races | 5,336 | 6.5% |
| Some other Race | 740 | 0.9% |
| Total | 81,863 | 100.0% |
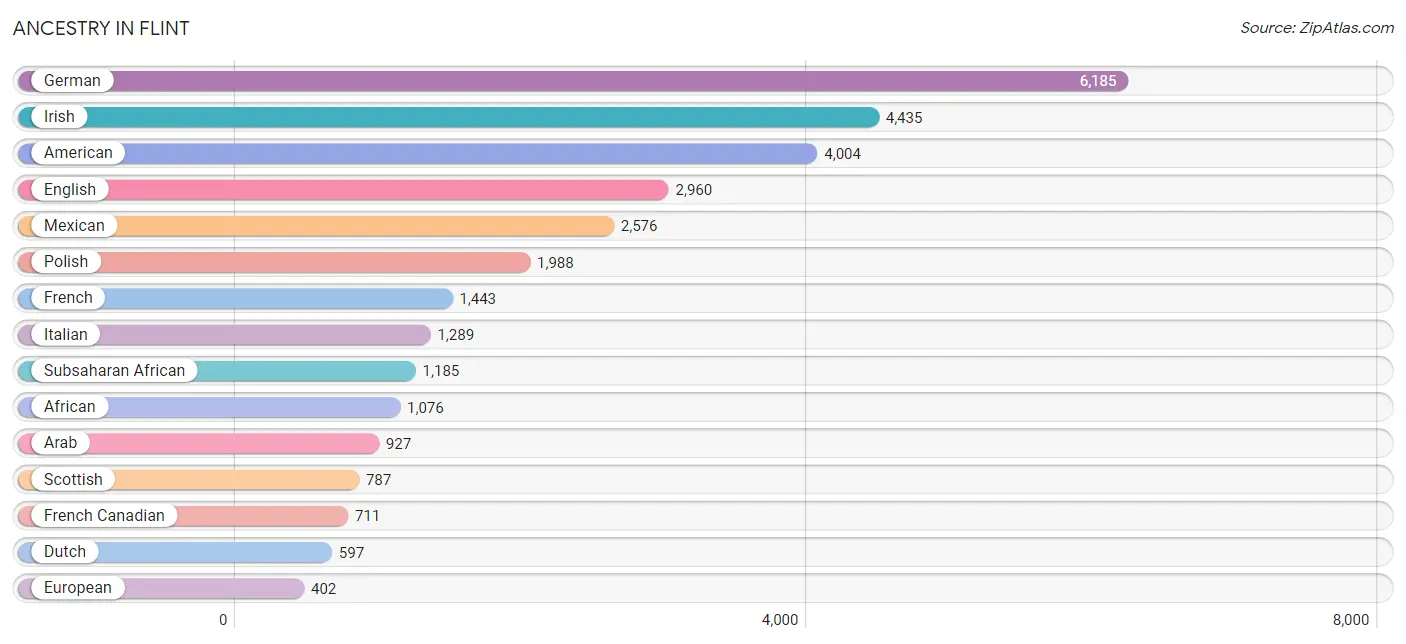
Ancestry in Flint
The most populous ancestries reported in Flint are German (6,185 | 7.6%), Irish (4,435 | 5.4%), American (4,004 | 4.9%), English (2,960 | 3.6%), and Mexican (2,576 | 3.2%), together accounting for 24.6% of all Flint residents.
| Ancestry | # Population | % Population |
| African | 1,076 | 1.3% |
| American | 4,004 | 4.9% |
| Apache | 42 | 0.1% |
| Arab | 927 | 1.1% |
| Assyrian / Chaldean / Syriac | 8 | 0.0% |
| Australian | 8 | 0.0% |
| Austrian | 30 | 0.0% |
| Bangladeshi | 23 | 0.0% |
| Belgian | 96 | 0.1% |
| Bhutanese | 44 | 0.1% |
| Blackfeet | 84 | 0.1% |
| British | 53 | 0.1% |
| Bulgarian | 6 | 0.0% |
| Burmese | 202 | 0.3% |
| Canadian | 235 | 0.3% |
| Central American | 34 | 0.0% |
| Central American Indian | 19 | 0.0% |
| Cherokee | 279 | 0.3% |
| Chickasaw | 8 | 0.0% |
| Chippewa | 284 | 0.4% |
| Choctaw | 19 | 0.0% |
| Colombian | 30 | 0.0% |
| Costa Rican | 7 | 0.0% |
| Cree | 10 | 0.0% |
| Croatian | 23 | 0.0% |
| Cuban | 306 | 0.4% |
| Czech | 112 | 0.1% |
| Czechoslovakian | 142 | 0.2% |
| Danish | 76 | 0.1% |
| Dominican | 29 | 0.0% |
| Dutch | 597 | 0.7% |
| Eastern European | 71 | 0.1% |
| Egyptian | 22 | 0.0% |
| English | 2,960 | 3.6% |
| Estonian | 47 | 0.1% |
| European | 402 | 0.5% |
| Filipino | 7 | 0.0% |
| Finnish | 83 | 0.1% |
| French | 1,443 | 1.8% |
| French American Indian | 44 | 0.1% |
| French Canadian | 711 | 0.9% |
| German | 6,185 | 7.6% |
| German Russian | 25 | 0.0% |
| Greek | 130 | 0.2% |
| Guamanian / Chamorro | 10 | 0.0% |
| Guatemalan | 24 | 0.0% |
| Guyanese | 13 | 0.0% |
| Haitian | 9 | 0.0% |
| Hopi | 51 | 0.1% |
| Hungarian | 298 | 0.4% |
| Icelander | 21 | 0.0% |
| Indian (Asian) | 136 | 0.2% |
| Iranian | 11 | 0.0% |
| Iraqi | 19 | 0.0% |
| Irish | 4,435 | 5.4% |
| Iroquois | 2 | 0.0% |
| Italian | 1,289 | 1.6% |
| Jamaican | 62 | 0.1% |
| Japanese | 8 | 0.0% |
| Korean | 85 | 0.1% |
| Lebanese | 127 | 0.2% |
| Lithuanian | 30 | 0.0% |
| Lumbee | 9 | 0.0% |
| Maltese | 17 | 0.0% |
| Mexican | 2,576 | 3.2% |
| Mexican American Indian | 9 | 0.0% |
| Mongolian | 5 | 0.0% |
| Moroccan | 37 | 0.1% |
| Native Hawaiian | 7 | 0.0% |
| Navajo | 7 | 0.0% |
| Nigerian | 22 | 0.0% |
| Northern European | 8 | 0.0% |
| Norwegian | 185 | 0.2% |
| Ottawa | 32 | 0.0% |
| Pakistani | 59 | 0.1% |
| Palestinian | 34 | 0.0% |
| Panamanian | 3 | 0.0% |
| Pennsylvania German | 59 | 0.1% |
| Polish | 1,988 | 2.4% |
| Portuguese | 41 | 0.1% |
| Pueblo | 9 | 0.0% |
| Puerto Rican | 280 | 0.3% |
| Romanian | 39 | 0.1% |
| Russian | 170 | 0.2% |
| Samoan | 10 | 0.0% |
| Scandinavian | 58 | 0.1% |
| Scotch-Irish | 309 | 0.4% |
| Scottish | 787 | 1.0% |
| Serbian | 102 | 0.1% |
| Sioux | 27 | 0.0% |
| Slovak | 54 | 0.1% |
| South African | 16 | 0.0% |
| South American | 30 | 0.0% |
| Spaniard | 88 | 0.1% |
| Spanish | 26 | 0.0% |
| Sri Lankan | 41 | 0.1% |
| Subsaharan African | 1,185 | 1.5% |
| Sudanese | 27 | 0.0% |
| Swedish | 338 | 0.4% |
| Swiss | 31 | 0.0% |
| Syrian | 133 | 0.2% |
| Thai | 102 | 0.1% |
| Ukrainian | 59 | 0.1% |
| Welsh | 177 | 0.2% |
| West Indian | 11 | 0.0% |
| Yugoslavian | 30 | 0.0% |
| Zimbabwean | 8 | 0.0% | View All 107 Rows |
Immigrants in Flint
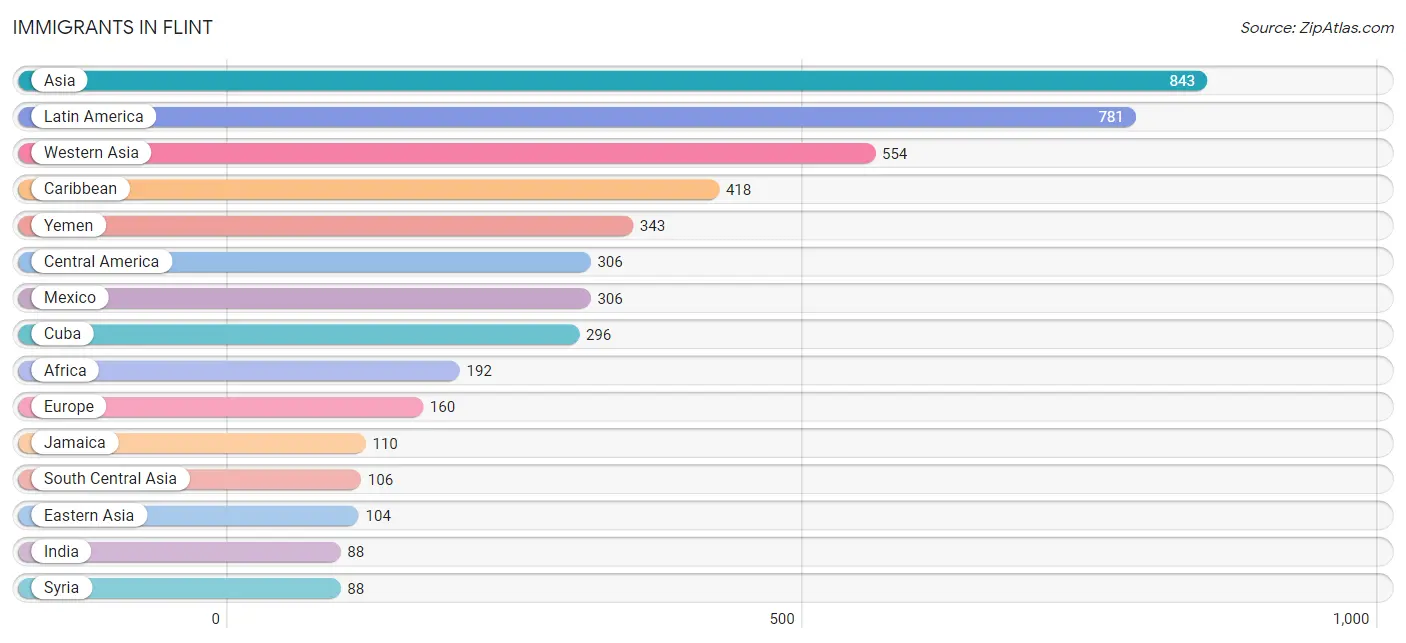
The most numerous immigrant groups reported in Flint came from Asia (843 | 1.0%), Latin America (781 | 0.9%), Western Asia (554 | 0.7%), Caribbean (418 | 0.5%), and Yemen (343 | 0.4%), together accounting for 3.6% of all Flint residents.
| Immigration Origin | # Population | % Population |
| Africa | 192 | 0.2% |
| Asia | 843 | 1.0% |
| Cambodia | 8 | 0.0% |
| Canada | 86 | 0.1% |
| Caribbean | 418 | 0.5% |
| Central America | 306 | 0.4% |
| China | 79 | 0.1% |
| Colombia | 57 | 0.1% |
| Congo | 43 | 0.1% |
| Cuba | 296 | 0.4% |
| Eastern Africa | 31 | 0.0% |
| Eastern Asia | 104 | 0.1% |
| Eastern Europe | 70 | 0.1% |
| England | 32 | 0.0% |
| Europe | 160 | 0.2% |
| Germany | 36 | 0.0% |
| Haiti | 8 | 0.0% |
| India | 88 | 0.1% |
| Indonesia | 8 | 0.0% |
| Iraq | 30 | 0.0% |
| Israel | 9 | 0.0% |
| Italy | 4 | 0.0% |
| Jamaica | 110 | 0.1% |
| Korea | 25 | 0.0% |
| Latin America | 781 | 0.9% |
| Mexico | 306 | 0.4% |
| Middle Africa | 43 | 0.1% |
| Morocco | 21 | 0.0% |
| Netherlands | 18 | 0.0% |
| Nigeria | 81 | 0.1% |
| Northern Africa | 21 | 0.0% |
| Northern Europe | 32 | 0.0% |
| Pakistan | 18 | 0.0% |
| Philippines | 24 | 0.0% |
| Romania | 9 | 0.0% |
| Russia | 11 | 0.0% |
| Saudi Arabia | 84 | 0.1% |
| Somalia | 8 | 0.0% |
| South Africa | 16 | 0.0% |
| South America | 57 | 0.1% |
| South Central Asia | 106 | 0.1% |
| South Eastern Asia | 62 | 0.1% |
| Southern Europe | 4 | 0.0% |
| St. Vincent and the Grenadines | 4 | 0.0% |
| Syria | 88 | 0.1% |
| Taiwan | 7 | 0.0% |
| Thailand | 22 | 0.0% |
| Ukraine | 10 | 0.0% |
| Western Africa | 81 | 0.1% |
| Western Asia | 554 | 0.7% |
| Western Europe | 54 | 0.1% |
| Yemen | 343 | 0.4% |
| Zimbabwe | 8 | 0.0% | View All 53 Rows |
Sex and Age in Flint
Sex and Age in Flint
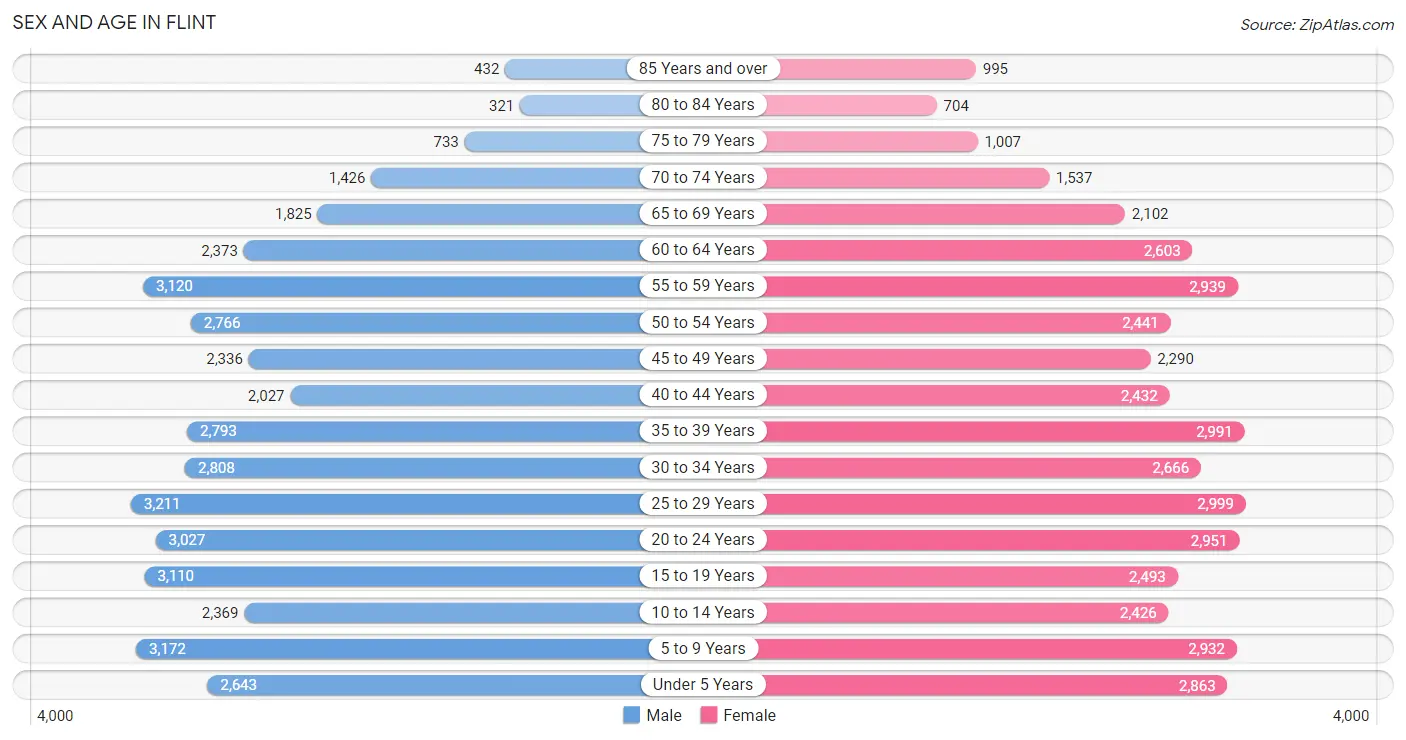
The most populous age groups in Flint are 25 to 29 Years (3,211 | 7.9%) for men and 25 to 29 Years (2,999 | 7.2%) for women.
| Age Bracket | Male | Female |
| Under 5 Years | 2,643 (6.5%) | 2,863 (6.9%) |
| 5 to 9 Years | 3,172 (7.8%) | 2,932 (7.1%) |
| 10 to 14 Years | 2,369 (5.9%) | 2,426 (5.9%) |
| 15 to 19 Years | 3,110 (7.7%) | 2,493 (6.0%) |
| 20 to 24 Years | 3,027 (7.5%) | 2,951 (7.1%) |
| 25 to 29 Years | 3,211 (7.9%) | 2,999 (7.2%) |
| 30 to 34 Years | 2,808 (6.9%) | 2,666 (6.4%) |
| 35 to 39 Years | 2,793 (6.9%) | 2,991 (7.2%) |
| 40 to 44 Years | 2,027 (5.0%) | 2,432 (5.9%) |
| 45 to 49 Years | 2,336 (5.8%) | 2,290 (5.5%) |
| 50 to 54 Years | 2,766 (6.8%) | 2,441 (5.9%) |
| 55 to 59 Years | 3,120 (7.7%) | 2,939 (7.1%) |
| 60 to 64 Years | 2,373 (5.9%) | 2,603 (6.3%) |
| 65 to 69 Years | 1,825 (4.5%) | 2,102 (5.1%) |
| 70 to 74 Years | 1,426 (3.5%) | 1,537 (3.7%) |
| 75 to 79 Years | 733 (1.8%) | 1,007 (2.4%) |
| 80 to 84 Years | 321 (0.8%) | 704 (1.7%) |
| 85 Years and over | 432 (1.1%) | 995 (2.4%) |
| Total | 40,492 (100.0%) | 41,371 (100.0%) |
Families and Households in Flint
Median Family Size in Flint
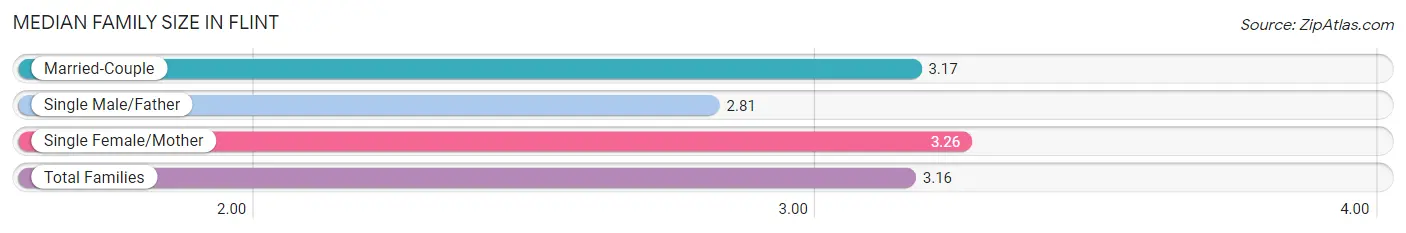
The median family size in Flint is 3.16 persons per family, with single female/mother families (8,705 | 47.3%) accounting for the largest median family size of 3.26 persons per family. On the other hand, single male/father families (2,576 | 14.0%) represent the smallest median family size with 2.81 persons per family.
| Family Type | # Families | Family Size |
| Married-Couple | 7,112 (38.7%) | 3.17 |
| Single Male/Father | 2,576 (14.0%) | 2.81 |
| Single Female/Mother | 8,705 (47.3%) | 3.26 |
| Total Families | 18,393 (100.0%) | 3.16 |
Median Household Size in Flint
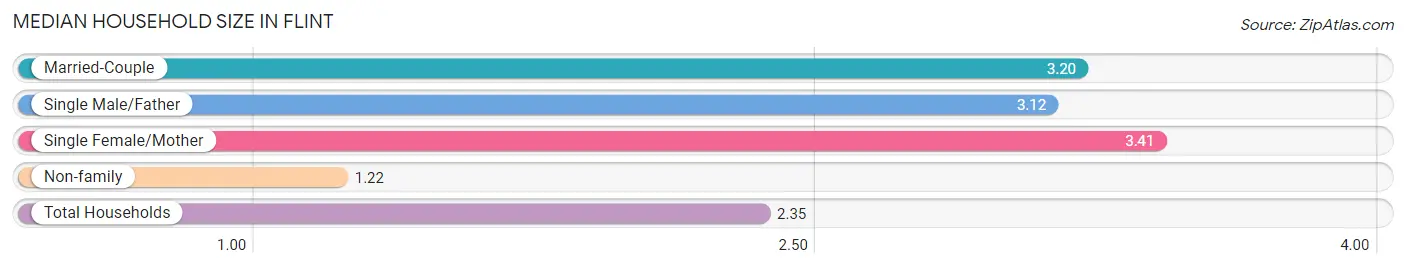
The median household size in Flint is 2.35 persons per household, with single female/mother households (8,705 | 25.7%) accounting for the largest median household size of 3.41 persons per household. non-family households (15,461 | 45.7%) represent the smallest median household size with 1.22 persons per household.
| Household Type | # Households | Household Size |
| Married-Couple | 7,112 (21.0%) | 3.20 |
| Single Male/Father | 2,576 (7.6%) | 3.12 |
| Single Female/Mother | 8,705 (25.7%) | 3.41 |
| Non-family | 15,461 (45.7%) | 1.22 |
| Total Households | 33,854 (100.0%) | 2.35 |
Household Size by Marriage Status in Flint
Out of a total of 33,854 households in Flint, 18,393 (54.3%) are family households, while 15,461 (45.7%) are nonfamily households. The most numerous type of family households are 2-person households, comprising 8,421, and the most common type of nonfamily households are 1-person households, comprising 12,850.
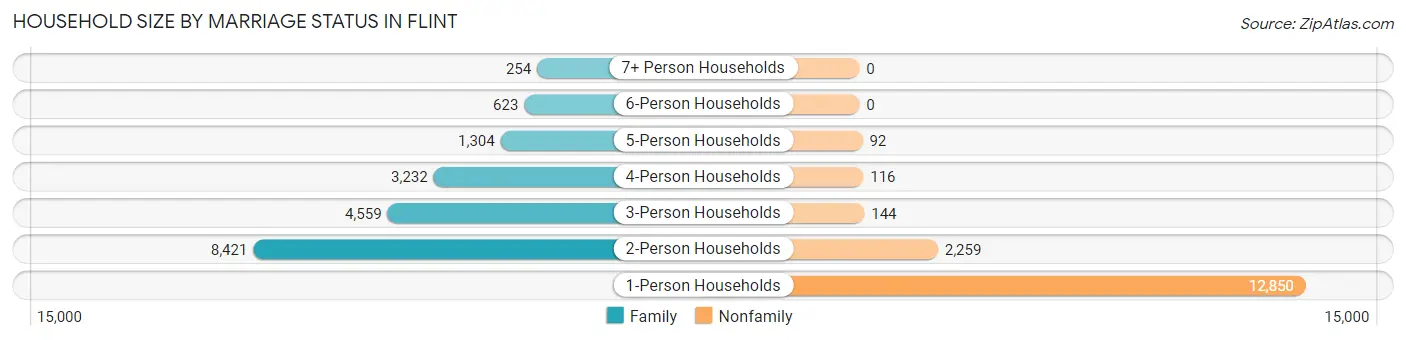
| Household Size | Family Households | Nonfamily Households |
| 1-Person Households | - | 12,850 (38.0%) |
| 2-Person Households | 8,421 (24.9%) | 2,259 (6.7%) |
| 3-Person Households | 4,559 (13.5%) | 144 (0.4%) |
| 4-Person Households | 3,232 (9.6%) | 116 (0.3%) |
| 5-Person Households | 1,304 (3.8%) | 92 (0.3%) |
| 6-Person Households | 623 (1.8%) | 0 (0.0%) |
| 7+ Person Households | 254 (0.7%) | 0 (0.0%) |
| Total | 18,393 (54.3%) | 15,461 (45.7%) |
Female Fertility in Flint
Fertility by Age in Flint
Average fertility rate in Flint is 64.0 births per 1,000 women. Women in the age bracket of 20 to 34 years have the highest fertility rate with 112.0 births per 1,000 women. Women in the age bracket of 20 to 34 years acount for 79.2% of all women with births.
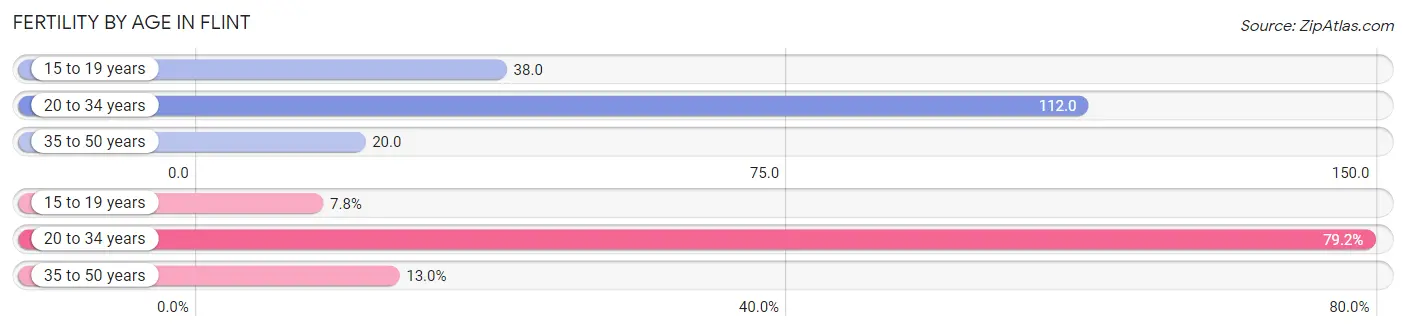
| Age Bracket | Women with Births | Births / 1,000 Women |
| 15 to 19 years | 95 (7.8%) | 38.0 |
| 20 to 34 years | 964 (79.2%) | 112.0 |
| 35 to 50 years | 158 (13.0%) | 20.0 |
| Total | 1,217 (100.0%) | 64.0 |
Fertility by Age by Marriage Status in Flint
13.8% of women with births (1,217) in Flint are married. The highest percentage of unmarried women with births falls into 20 to 34 years age bracket with 87.5% of them unmarried at the time of birth, while the lowest percentage of unmarried women with births belong to 35 to 50 years age bracket with 81.0% of them unmarried.
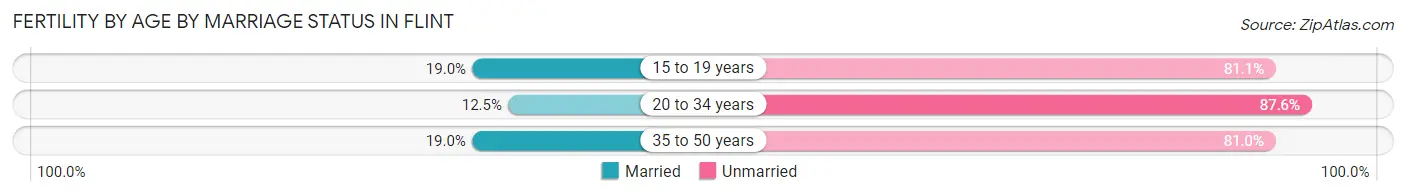
| Age Bracket | Married | Unmarried |
| 15 to 19 years | 18 (19.0%) | 77 (81.0%) |
| 20 to 34 years | 120 (12.4%) | 844 (87.5%) |
| 35 to 50 years | 30 (19.0%) | 128 (81.0%) |
| Total | 168 (13.8%) | 1,049 (86.2%) |
Fertility by Education in Flint
Average fertility rate in Flint is 64.0 births per 1,000 women. Women with the education attainment of less than high school have the highest fertility rate of 78.0 births per 1,000 women, while women with the education attainment of bachelor's degree have the lowest fertility at 23.0 births per 1,000 women. Women with the education attainment of college or associate's degree represent 34.5% of all women with births.
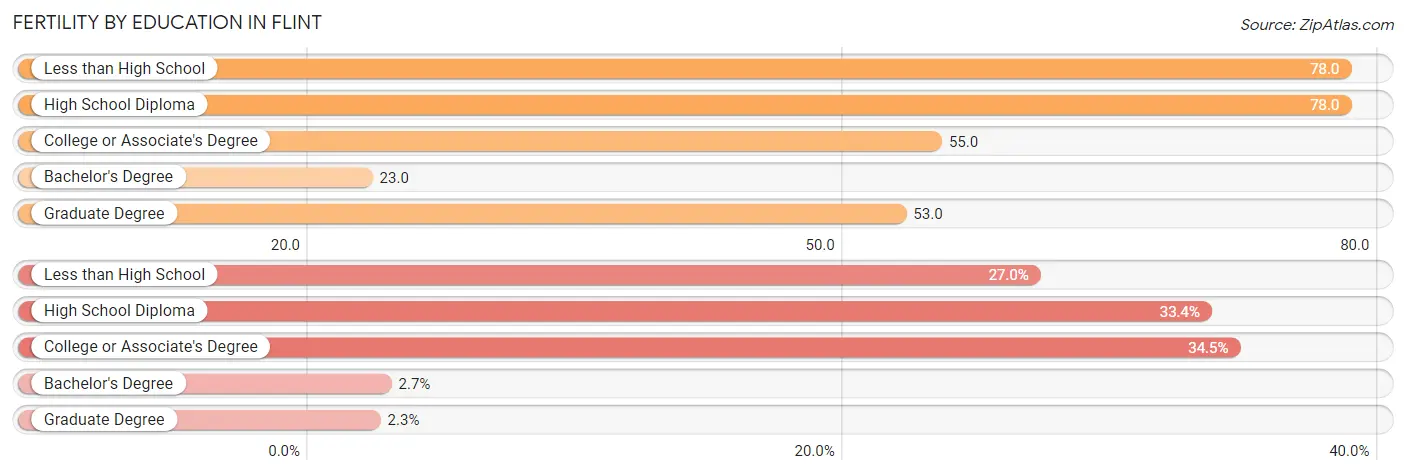
| Educational Attainment | Women with Births | Births / 1,000 Women |
| Less than High School | 329 (27.0%) | 78.0 |
| High School Diploma | 407 (33.4%) | 78.0 |
| College or Associate's Degree | 420 (34.5%) | 55.0 |
| Bachelor's Degree | 33 (2.7%) | 23.0 |
| Graduate Degree | 28 (2.3%) | 53.0 |
| Total | 1,217 (100.0%) | 64.0 |
Fertility by Education by Marriage Status in Flint
86.2% of women with births in Flint are unmarried. Women with the educational attainment of bachelor's degree are most likely to be married with 45.5% of them married at childbirth, while women with the educational attainment of less than high school are least likely to be married with 94.5% of them unmarried at childbirth.
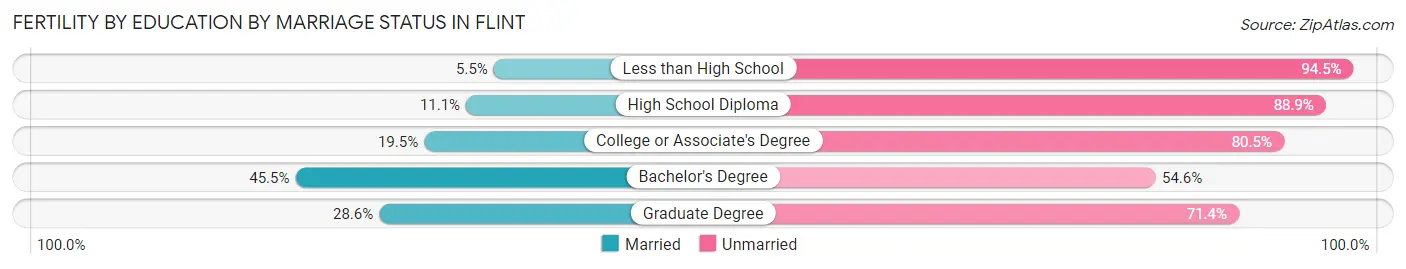
| Educational Attainment | Married | Unmarried |
| Less than High School | 18 (5.5%) | 311 (94.5%) |
| High School Diploma | 45 (11.1%) | 362 (88.9%) |
| College or Associate's Degree | 82 (19.5%) | 338 (80.5%) |
| Bachelor's Degree | 15 (45.5%) | 18 (54.5%) |
| Graduate Degree | 8 (28.6%) | 20 (71.4%) |
| Total | 168 (13.8%) | 1,049 (86.2%) |
Employment Characteristics in Flint
Employment by Class of Employer in Flint
Among the 28,142 employed individuals in Flint, private company employees (20,851 | 74.1%), not-for-profit organizations (2,672 | 9.5%), and self-employed (not incorporated) (1,761 | 6.3%) make up the most common classes of employment.
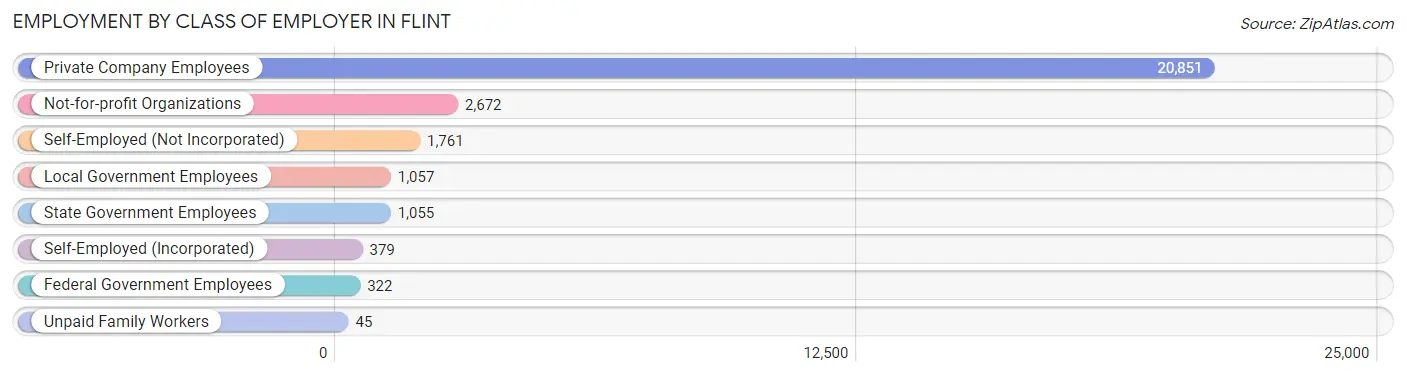
| Employer Class | # Employees | % Employees |
| Private Company Employees | 20,851 | 74.1% |
| Self-Employed (Incorporated) | 379 | 1.3% |
| Self-Employed (Not Incorporated) | 1,761 | 6.3% |
| Not-for-profit Organizations | 2,672 | 9.5% |
| Local Government Employees | 1,057 | 3.8% |
| State Government Employees | 1,055 | 3.7% |
| Federal Government Employees | 322 | 1.1% |
| Unpaid Family Workers | 45 | 0.2% |
| Total | 28,142 | 100.0% |
Employment Status by Age in Flint
According to the labor force statistics for Flint, out of the total population over 16 years of age (64,393), 54.6% or 35,159 individuals are in the labor force, with 17.6% or 6,188 of them unemployed. The age group with the highest labor force participation rate is 20 to 24 years, with 76.4% or 4,567 individuals in the labor force. Within the labor force, the 16 to 19 years age range has the highest percentage of unemployed individuals, with 31.6% or 629 of them being unemployed.
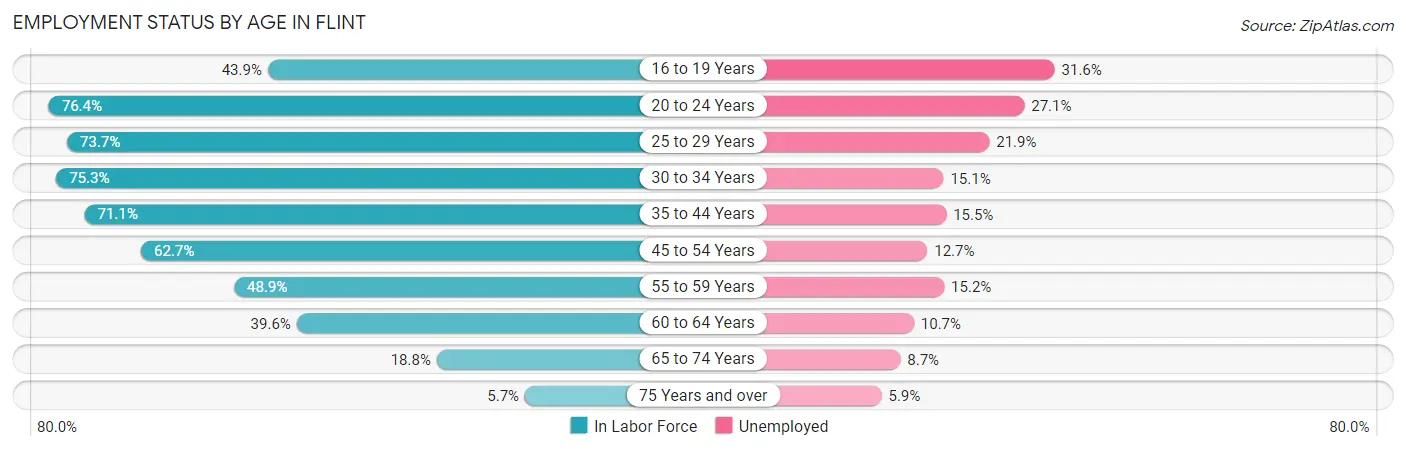
| Age Bracket | In Labor Force | Unemployed |
| 16 to 19 Years | 1,992 (43.9%) | 629 (31.6%) |
| 20 to 24 Years | 4,567 (76.4%) | 1,238 (27.1%) |
| 25 to 29 Years | 4,577 (73.7%) | 1,002 (21.9%) |
| 30 to 34 Years | 4,122 (75.3%) | 622 (15.1%) |
| 35 to 44 Years | 7,283 (71.1%) | 1,129 (15.5%) |
| 45 to 54 Years | 6,165 (62.7%) | 783 (12.7%) |
| 55 to 59 Years | 2,963 (48.9%) | 450 (15.2%) |
| 60 to 64 Years | 1,970 (39.6%) | 211 (10.7%) |
| 65 to 74 Years | 1,295 (18.8%) | 113 (8.7%) |
| 75 Years and over | 239 (5.7%) | 14 (5.9%) |
| Total | 35,159 (54.6%) | 6,188 (17.6%) |
Employment Status by Educational Attainment in Flint
According to labor force statistics for Flint, 63.3% of individuals (27,089) out of the total population between 25 and 64 years of age (42,795) are in the labor force, with 15.5% or 4,199 of them being unemployed. The group with the highest labor force participation rate are those with the educational attainment of bachelor's degree or higher, with 82.0% or 4,152 individuals in the labor force. Within the labor force, individuals with less than high school education have the highest percentage of unemployment, with 23.6% or 656 of them being unemployed.
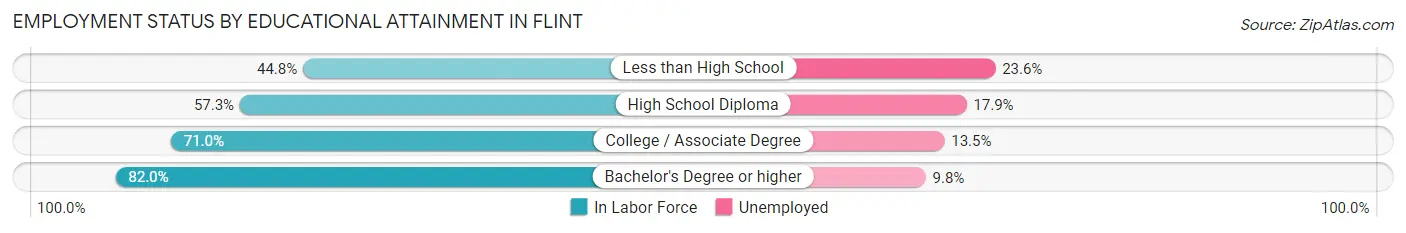
| Educational Attainment | In Labor Force | Unemployed |
| Less than High School | 2,778 (44.8%) | 1,463 (23.6%) |
| High School Diploma | 9,424 (57.3%) | 2,944 (17.9%) |
| College / Associate Degree | 10,710 (71.0%) | 2,036 (13.5%) |
| Bachelor's Degree or higher | 4,152 (82.0%) | 496 (9.8%) |
| Total | 27,089 (63.3%) | 6,633 (15.5%) |
Employment Occupations by Sex in Flint
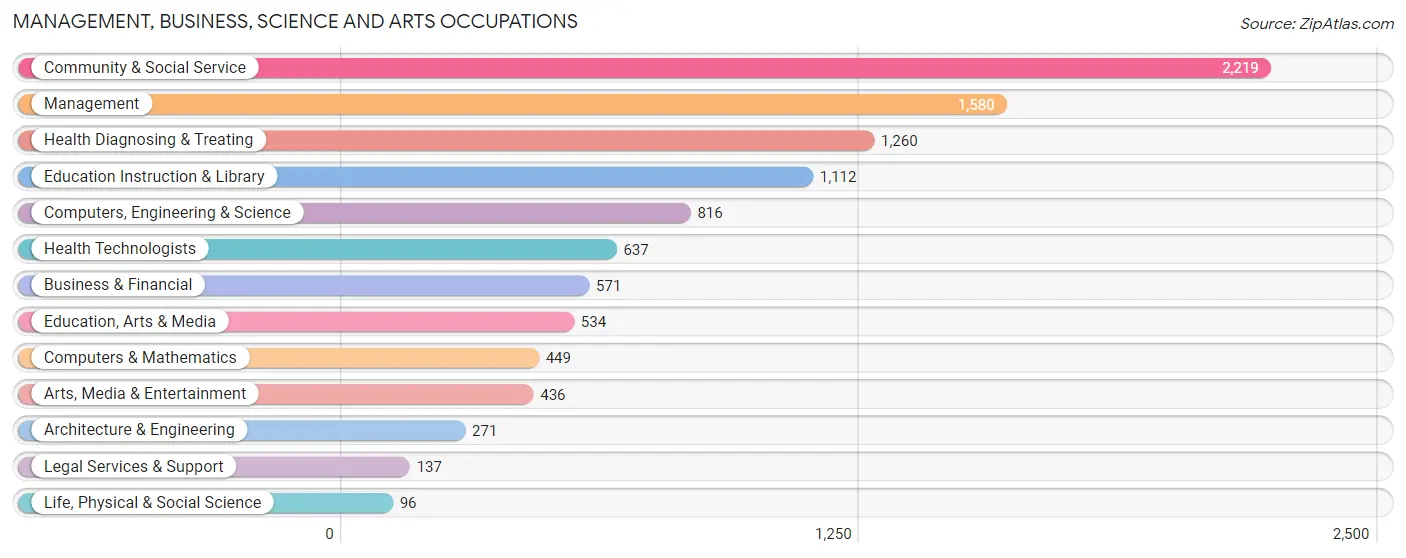
Management, Business, Science and Arts Occupations
The most common Management, Business, Science and Arts occupations in Flint are Community & Social Service (2,219 | 7.7%), Management (1,580 | 5.4%), Health Diagnosing & Treating (1,260 | 4.3%), Education Instruction & Library (1,112 | 3.8%), and Computers, Engineering & Science (816 | 2.8%).
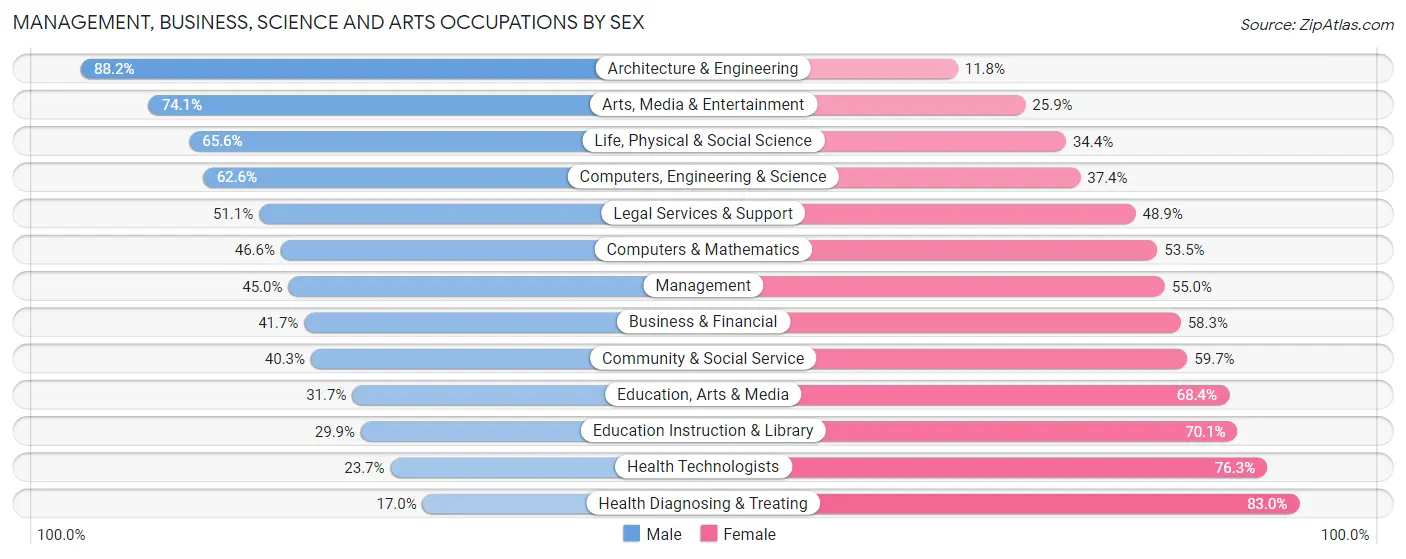
Management, Business, Science and Arts Occupations by Sex
Within the Management, Business, Science and Arts occupations in Flint, the most male-oriented occupations are Architecture & Engineering (88.2%), Arts, Media & Entertainment (74.1%), and Life, Physical & Social Science (65.6%), while the most female-oriented occupations are Health Diagnosing & Treating (83.0%), Health Technologists (76.3%), and Education Instruction & Library (70.1%).
| Occupation | Male | Female |
| Management | 711 (45.0%) | 869 (55.0%) |
| Business & Financial | 238 (41.7%) | 333 (58.3%) |
| Computers, Engineering & Science | 511 (62.6%) | 305 (37.4%) |
| Computers & Mathematics | 209 (46.6%) | 240 (53.4%) |
| Architecture & Engineering | 239 (88.2%) | 32 (11.8%) |
| Life, Physical & Social Science | 63 (65.6%) | 33 (34.4%) |
| Community & Social Service | 894 (40.3%) | 1,325 (59.7%) |
| Education, Arts & Media | 169 (31.7%) | 365 (68.3%) |
| Legal Services & Support | 70 (51.1%) | 67 (48.9%) |
| Education Instruction & Library | 332 (29.9%) | 780 (70.1%) |
| Arts, Media & Entertainment | 323 (74.1%) | 113 (25.9%) |
| Health Diagnosing & Treating | 214 (17.0%) | 1,046 (83.0%) |
| Health Technologists | 151 (23.7%) | 486 (76.3%) |
| Total (Category) | 2,568 (39.8%) | 3,878 (60.2%) |
| Total (Overall) | 14,028 (48.4%) | 14,953 (51.6%) |
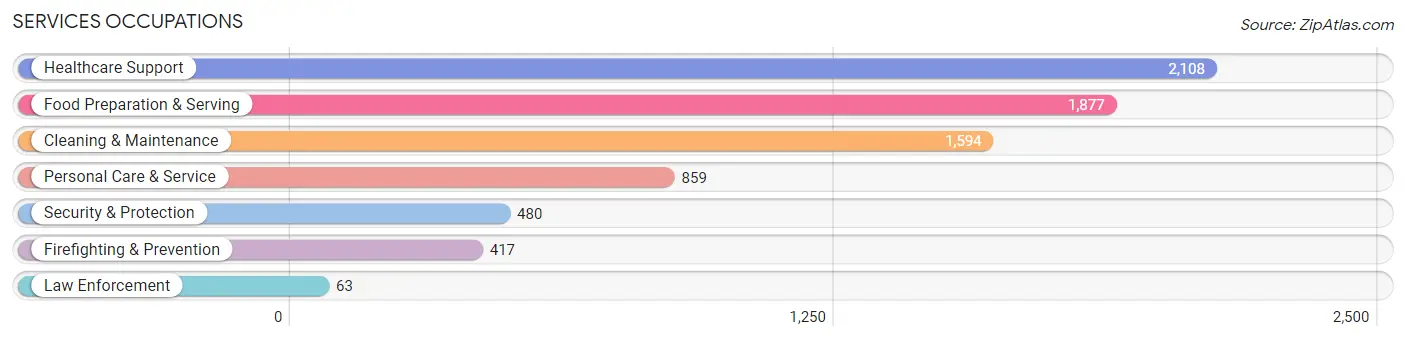
Services Occupations
The most common Services occupations in Flint are Healthcare Support (2,108 | 7.3%), Food Preparation & Serving (1,877 | 6.5%), Cleaning & Maintenance (1,594 | 5.5%), Personal Care & Service (859 | 3.0%), and Security & Protection (480 | 1.7%).
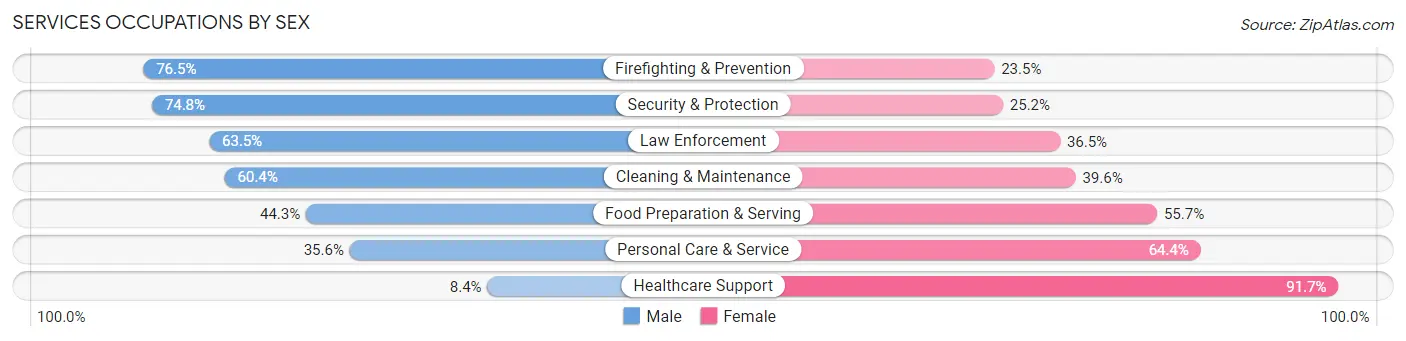
Services Occupations by Sex
Within the Services occupations in Flint, the most male-oriented occupations are Firefighting & Prevention (76.5%), Security & Protection (74.8%), and Law Enforcement (63.5%), while the most female-oriented occupations are Healthcare Support (91.6%), Personal Care & Service (64.4%), and Food Preparation & Serving (55.7%).
| Occupation | Male | Female |
| Healthcare Support | 176 (8.4%) | 1,932 (91.6%) |
| Security & Protection | 359 (74.8%) | 121 (25.2%) |
| Firefighting & Prevention | 319 (76.5%) | 98 (23.5%) |
| Law Enforcement | 40 (63.5%) | 23 (36.5%) |
| Food Preparation & Serving | 831 (44.3%) | 1,046 (55.7%) |
| Cleaning & Maintenance | 963 (60.4%) | 631 (39.6%) |
| Personal Care & Service | 306 (35.6%) | 553 (64.4%) |
| Total (Category) | 2,635 (38.1%) | 4,283 (61.9%) |
| Total (Overall) | 14,028 (48.4%) | 14,953 (51.6%) |
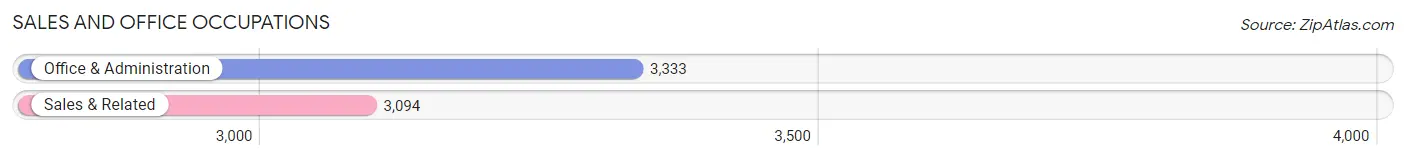
Sales and Office Occupations
The most common Sales and Office occupations in Flint are Office & Administration (3,333 | 11.5%), and Sales & Related (3,094 | 10.7%).
Sales and Office Occupations by Sex
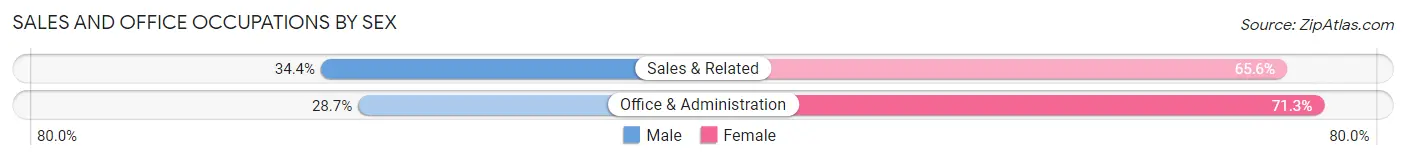
| Occupation | Male | Female |
| Sales & Related | 1,065 (34.4%) | 2,029 (65.6%) |
| Office & Administration | 957 (28.7%) | 2,376 (71.3%) |
| Total (Category) | 2,022 (31.5%) | 4,405 (68.5%) |
| Total (Overall) | 14,028 (48.4%) | 14,953 (51.6%) |
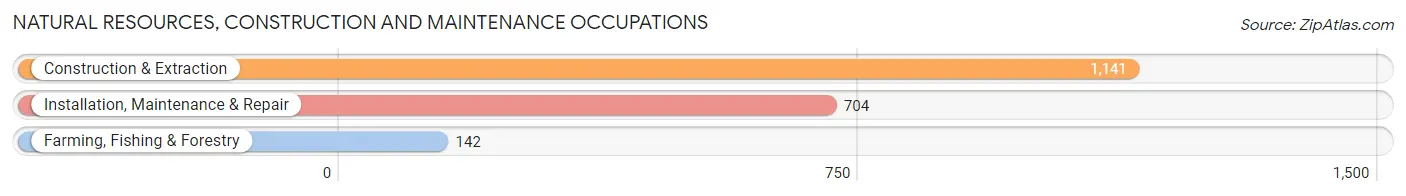
Natural Resources, Construction and Maintenance Occupations
The most common Natural Resources, Construction and Maintenance occupations in Flint are Construction & Extraction (1,141 | 3.9%), Installation, Maintenance & Repair (704 | 2.4%), and Farming, Fishing & Forestry (142 | 0.5%).
Natural Resources, Construction and Maintenance Occupations by Sex
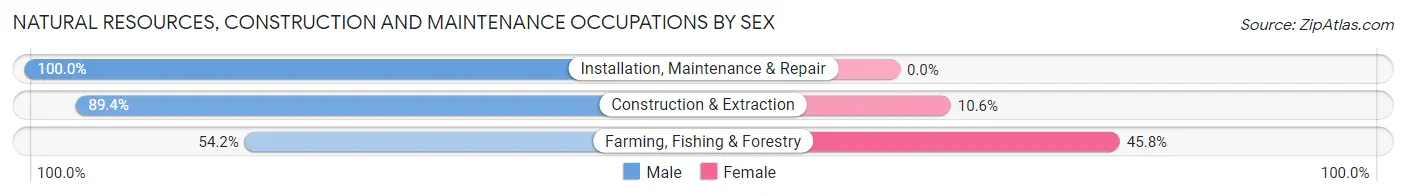
| Occupation | Male | Female |
| Farming, Fishing & Forestry | 77 (54.2%) | 65 (45.8%) |
| Construction & Extraction | 1,020 (89.4%) | 121 (10.6%) |
| Installation, Maintenance & Repair | 704 (100.0%) | 0 (0.0%) |
| Total (Category) | 1,801 (90.6%) | 186 (9.4%) |
| Total (Overall) | 14,028 (48.4%) | 14,953 (51.6%) |
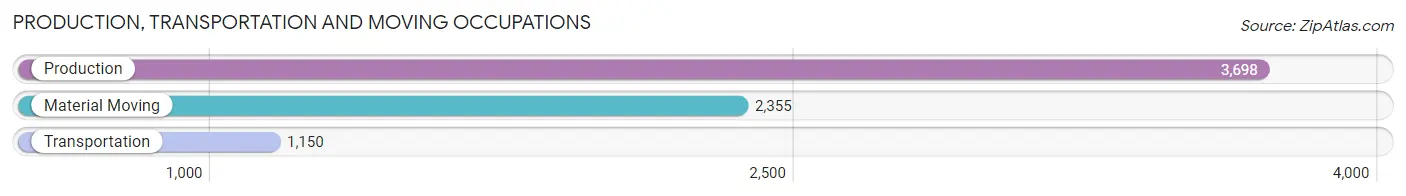
Production, Transportation and Moving Occupations
The most common Production, Transportation and Moving occupations in Flint are Production (3,698 | 12.8%), Material Moving (2,355 | 8.1%), and Transportation (1,150 | 4.0%).
Production, Transportation and Moving Occupations by Sex
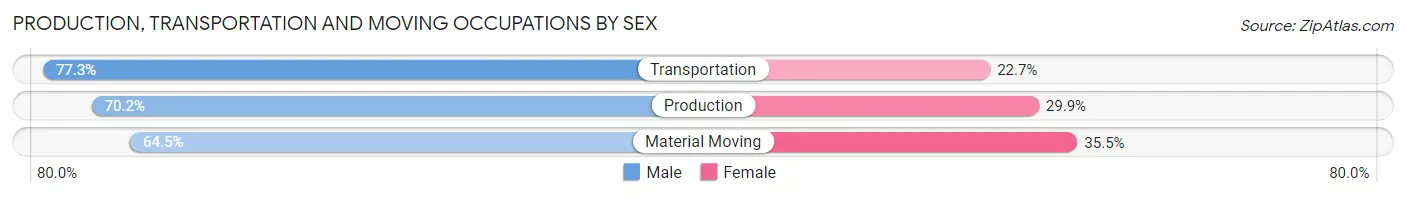
| Occupation | Male | Female |
| Production | 2,594 (70.2%) | 1,104 (29.8%) |
| Transportation | 889 (77.3%) | 261 (22.7%) |
| Material Moving | 1,519 (64.5%) | 836 (35.5%) |
| Total (Category) | 5,002 (69.4%) | 2,201 (30.6%) |
| Total (Overall) | 14,028 (48.4%) | 14,953 (51.6%) |
Employment Industries by Sex in Flint
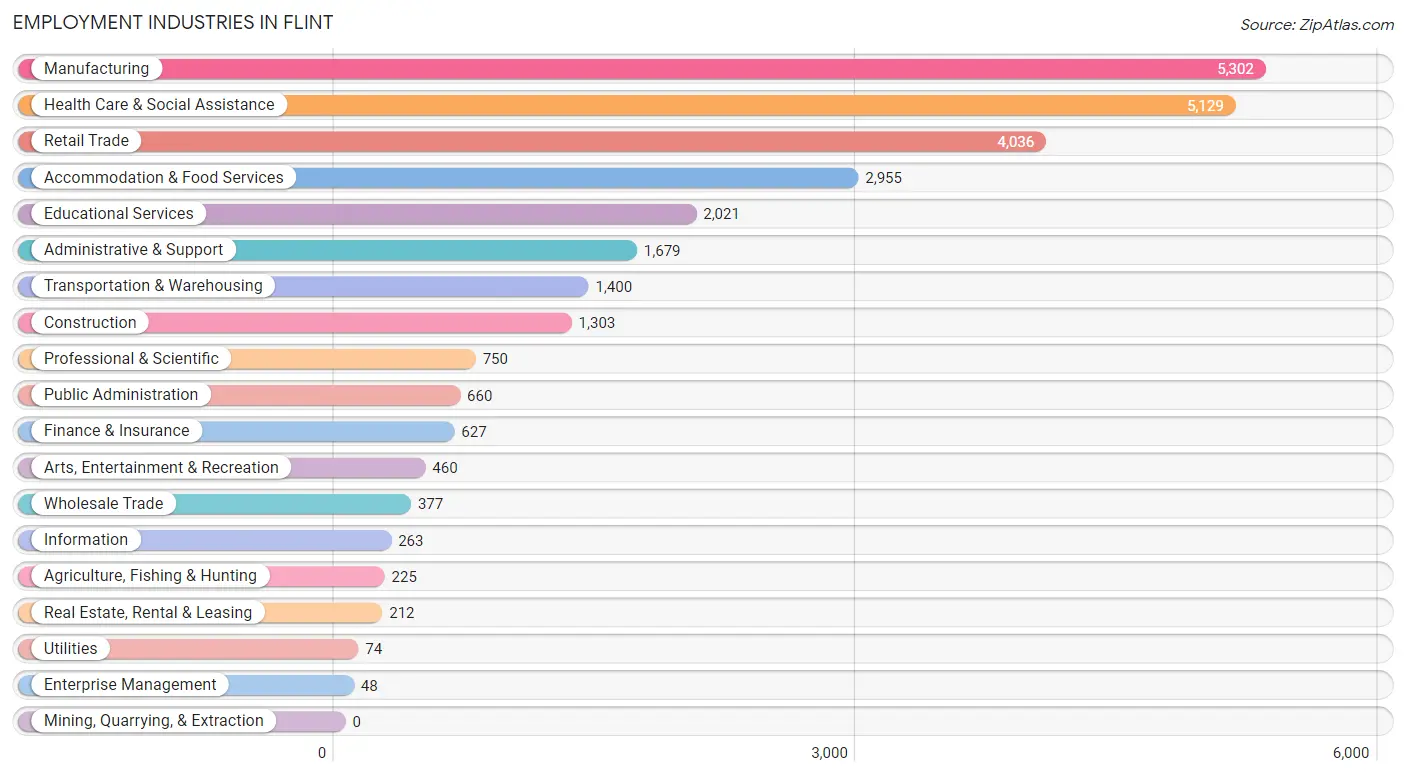
Employment Industries in Flint
The major employment industries in Flint include Manufacturing (5,302 | 18.3%), Health Care & Social Assistance (5,129 | 17.7%), Retail Trade (4,036 | 13.9%), Accommodation & Food Services (2,955 | 10.2%), and Educational Services (2,021 | 7.0%).
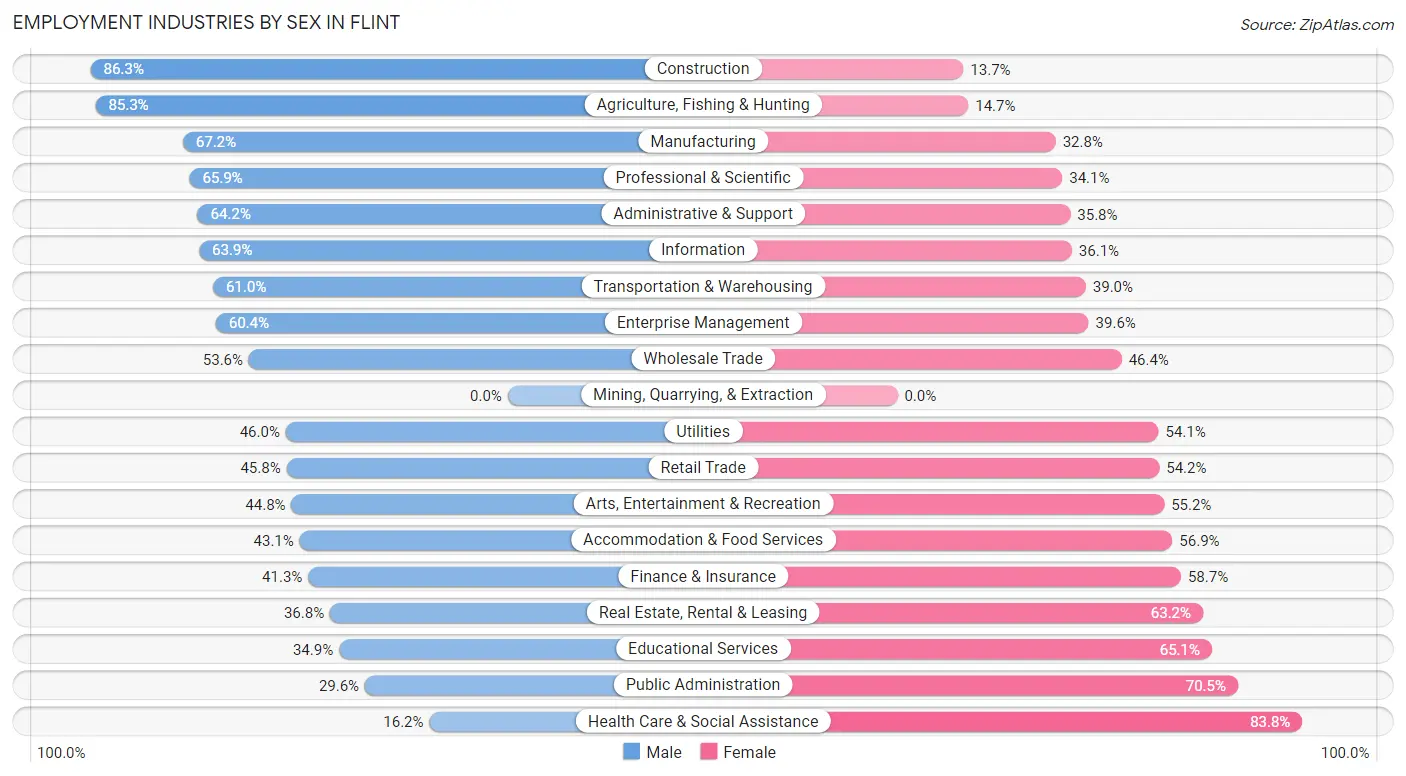
Employment Industries by Sex in Flint
The Flint industries that see more men than women are Construction (86.3%), Agriculture, Fishing & Hunting (85.3%), and Manufacturing (67.2%), whereas the industries that tend to have a higher number of women are Health Care & Social Assistance (83.8%), Public Administration (70.5%), and Educational Services (65.1%).
| Industry | Male | Female |
| Agriculture, Fishing & Hunting | 192 (85.3%) | 33 (14.7%) |
| Mining, Quarrying, & Extraction | 0 (0.0%) | 0 (0.0%) |
| Construction | 1,125 (86.3%) | 178 (13.7%) |
| Manufacturing | 3,565 (67.2%) | 1,737 (32.8%) |
| Wholesale Trade | 202 (53.6%) | 175 (46.4%) |
| Retail Trade | 1,848 (45.8%) | 2,188 (54.2%) |
| Transportation & Warehousing | 854 (61.0%) | 546 (39.0%) |
| Utilities | 34 (46.0%) | 40 (54.0%) |
| Information | 168 (63.9%) | 95 (36.1%) |
| Finance & Insurance | 259 (41.3%) | 368 (58.7%) |
| Real Estate, Rental & Leasing | 78 (36.8%) | 134 (63.2%) |
| Professional & Scientific | 494 (65.9%) | 256 (34.1%) |
| Enterprise Management | 29 (60.4%) | 19 (39.6%) |
| Administrative & Support | 1,078 (64.2%) | 601 (35.8%) |
| Educational Services | 706 (34.9%) | 1,315 (65.1%) |
| Health Care & Social Assistance | 832 (16.2%) | 4,297 (83.8%) |
| Arts, Entertainment & Recreation | 206 (44.8%) | 254 (55.2%) |
| Accommodation & Food Services | 1,273 (43.1%) | 1,682 (56.9%) |
| Public Administration | 195 (29.5%) | 465 (70.5%) |
| Total | 14,028 (48.4%) | 14,953 (51.6%) |
Education in Flint
School Enrollment in Flint
The most common levels of schooling among the 19,642 students in Flint are elementary school (4,770 | 24.3%), high school (4,701 | 23.9%), and middle school (3,975 | 20.2%).
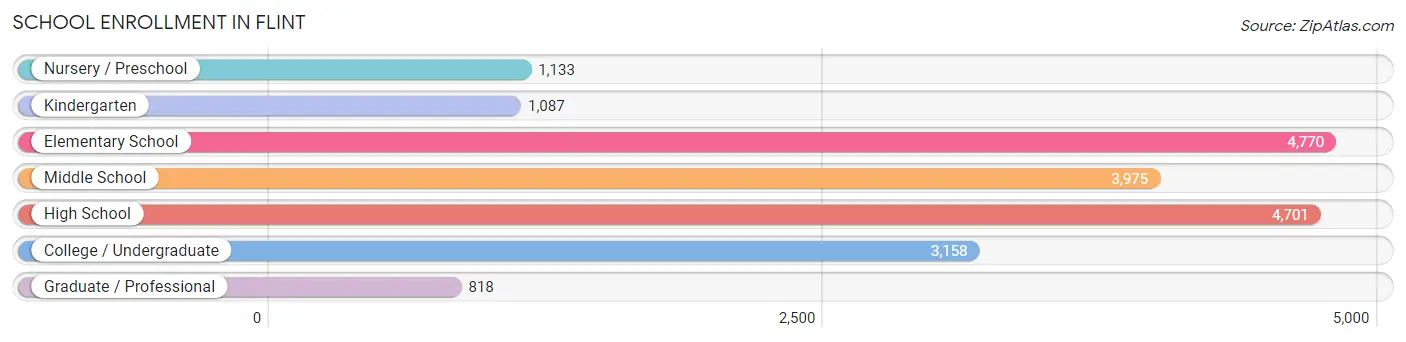
| School Level | # Students | % Students |
| Nursery / Preschool | 1,133 | 5.8% |
| Kindergarten | 1,087 | 5.5% |
| Elementary School | 4,770 | 24.3% |
| Middle School | 3,975 | 20.2% |
| High School | 4,701 | 23.9% |
| College / Undergraduate | 3,158 | 16.1% |
| Graduate / Professional | 818 | 4.2% |
| Total | 19,642 | 100.0% |
School Enrollment by Age by Funding Source in Flint
Out of a total of 19,642 students who are enrolled in schools in Flint, 1,728 (8.8%) attend a private institution, while the remaining 17,914 (91.2%) are enrolled in public schools. The age group of 20 to 24 year olds has the highest likelihood of being enrolled in private schools, with 396 (24.3% in the age bracket) enrolled. Conversely, the age group of 5 to 9 year old has the lowest likelihood of being enrolled in a private school, with 5,445 (96.1% in the age bracket) attending a public institution.
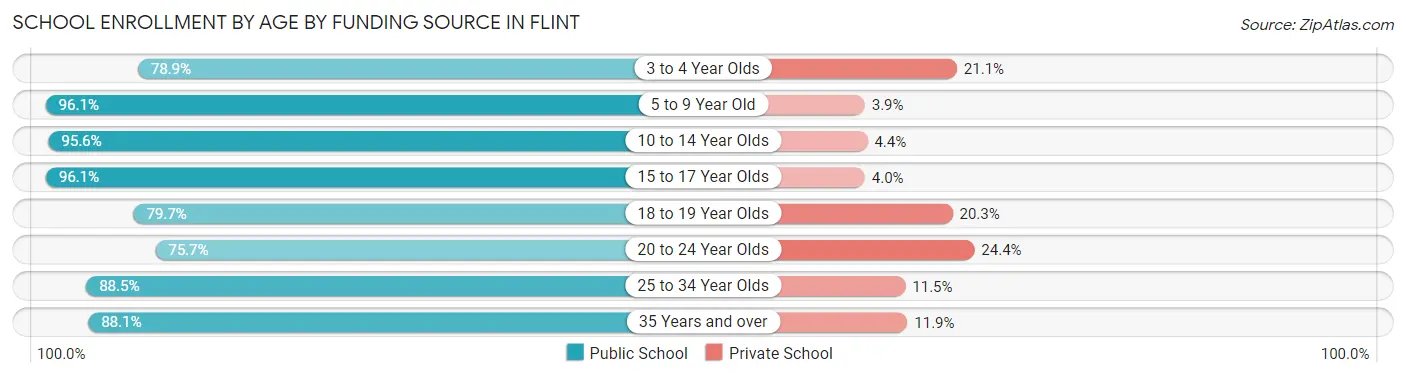
| Age Bracket | Public School | Private School |
| 3 to 4 Year Olds | 793 (78.9%) | 212 (21.1%) |
| 5 to 9 Year Old | 5,445 (96.1%) | 223 (3.9%) |
| 10 to 14 Year Olds | 4,442 (95.6%) | 206 (4.4%) |
| 15 to 17 Year Olds | 2,942 (96.1%) | 121 (4.0%) |
| 18 to 19 Year Olds | 1,325 (79.7%) | 337 (20.3%) |
| 20 to 24 Year Olds | 1,230 (75.6%) | 396 (24.3%) |
| 25 to 34 Year Olds | 1,117 (88.5%) | 145 (11.5%) |
| 35 Years and over | 624 (88.1%) | 84 (11.9%) |
| Total | 17,914 (91.2%) | 1,728 (8.8%) |
Educational Attainment by Field of Study in Flint
Business (1,252 | 17.0%), education (1,055 | 14.3%), science & technology (762 | 10.3%), arts & humanities (712 | 9.6%), and social sciences (606 | 8.2%) are the most common fields of study among 7,383 individuals in Flint who have obtained a bachelor's degree or higher.
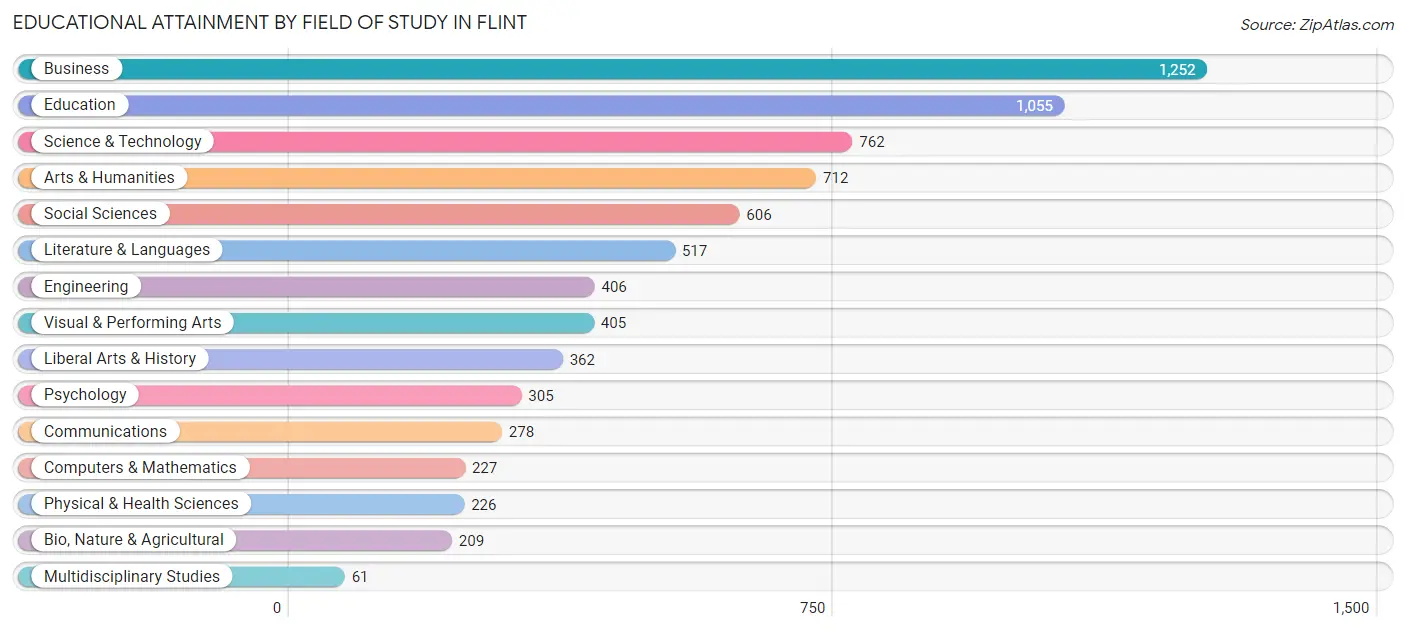
| Field of Study | # Graduates | % Graduates |
| Computers & Mathematics | 227 | 3.1% |
| Bio, Nature & Agricultural | 209 | 2.8% |
| Physical & Health Sciences | 226 | 3.1% |
| Psychology | 305 | 4.1% |
| Social Sciences | 606 | 8.2% |
| Engineering | 406 | 5.5% |
| Multidisciplinary Studies | 61 | 0.8% |
| Science & Technology | 762 | 10.3% |
| Business | 1,252 | 17.0% |
| Education | 1,055 | 14.3% |
| Literature & Languages | 517 | 7.0% |
| Liberal Arts & History | 362 | 4.9% |
| Visual & Performing Arts | 405 | 5.5% |
| Communications | 278 | 3.8% |
| Arts & Humanities | 712 | 9.6% |
| Total | 7,383 | 100.0% |
Transportation & Commute in Flint
Vehicle Availability by Sex in Flint
The most prevalent vehicle ownership categories in Flint are males with 2 vehicles (5,297, accounting for 39.4%) and females with 2 vehicles (4,896, making up 37.2%).
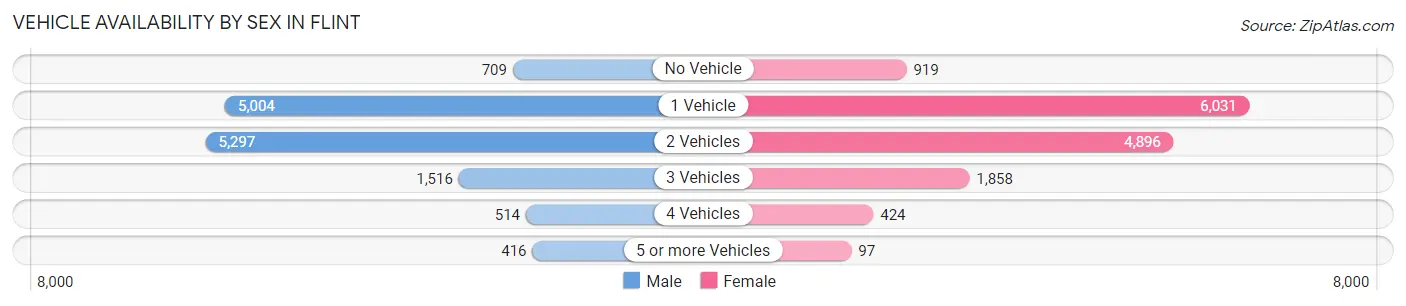
| Vehicles Available | Male | Female |
| No Vehicle | 709 (5.3%) | 919 (6.5%) |
| 1 Vehicle | 5,004 (37.2%) | 6,031 (42.4%) |
| 2 Vehicles | 5,297 (39.4%) | 4,896 (34.4%) |
| 3 Vehicles | 1,516 (11.3%) | 1,858 (13.1%) |
| 4 Vehicles | 514 (3.8%) | 424 (3.0%) |
| 5 or more Vehicles | 416 (3.1%) | 97 (0.7%) |
| Total | 13,456 (100.0%) | 14,225 (100.0%) |
Commute Time in Flint
The most frequently occuring commute durations in Flint are 10 to 14 minutes (5,753 commuters, 21.8%), 15 to 19 minutes (5,000 commuters, 18.9%), and 20 to 24 minutes (3,748 commuters, 14.2%).
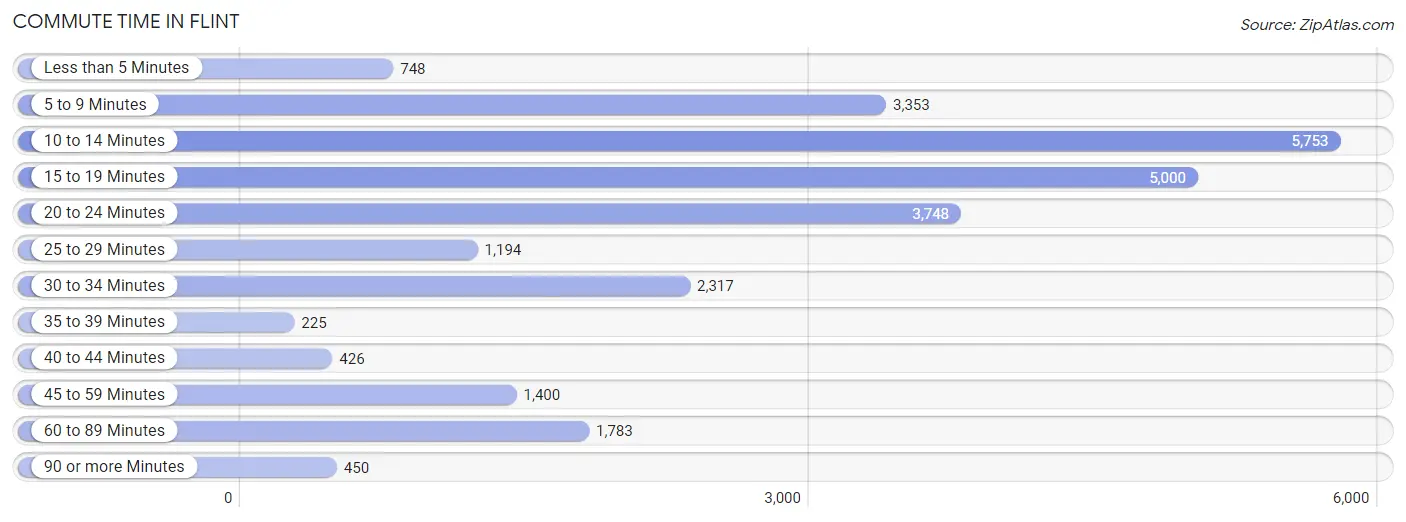
| Commute Time | # Commuters | % Commuters |
| Less than 5 Minutes | 748 | 2.8% |
| 5 to 9 Minutes | 3,353 | 12.7% |
| 10 to 14 Minutes | 5,753 | 21.8% |
| 15 to 19 Minutes | 5,000 | 18.9% |
| 20 to 24 Minutes | 3,748 | 14.2% |
| 25 to 29 Minutes | 1,194 | 4.5% |
| 30 to 34 Minutes | 2,317 | 8.8% |
| 35 to 39 Minutes | 225 | 0.9% |
| 40 to 44 Minutes | 426 | 1.6% |
| 45 to 59 Minutes | 1,400 | 5.3% |
| 60 to 89 Minutes | 1,783 | 6.8% |
| 90 or more Minutes | 450 | 1.7% |
Commute Time by Sex in Flint
The most common commute times in Flint are 10 to 14 minutes (2,725 commuters, 21.2%) for males and 10 to 14 minutes (3,028 commuters, 22.3%) for females.
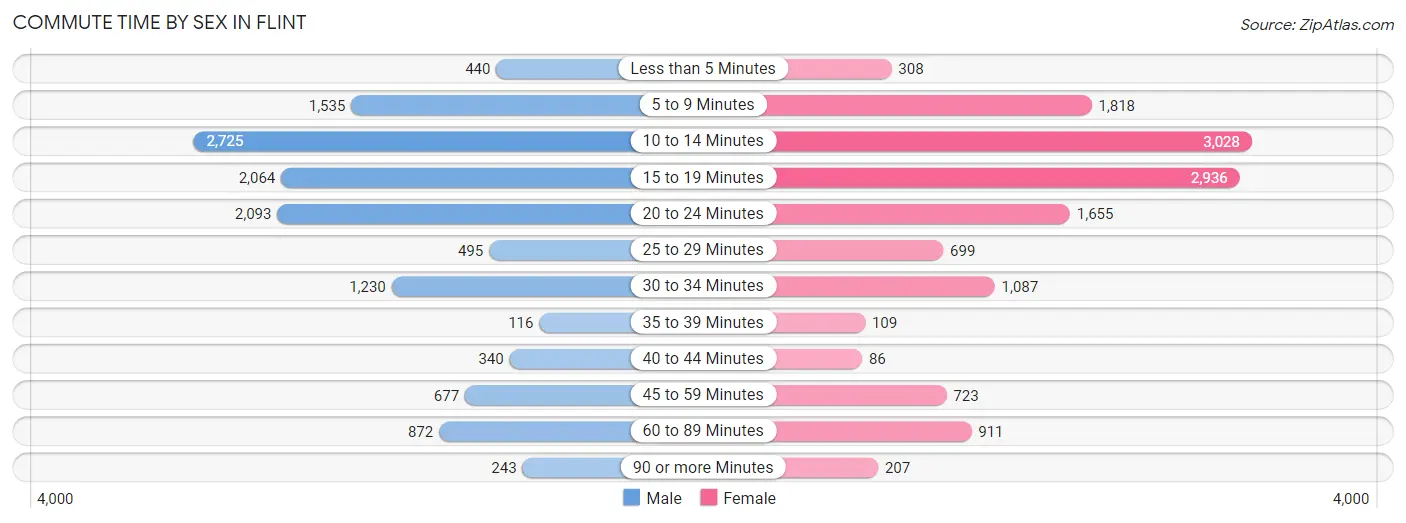
| Commute Time | Male | Female |
| Less than 5 Minutes | 440 (3.4%) | 308 (2.3%) |
| 5 to 9 Minutes | 1,535 (12.0%) | 1,818 (13.4%) |
| 10 to 14 Minutes | 2,725 (21.2%) | 3,028 (22.3%) |
| 15 to 19 Minutes | 2,064 (16.1%) | 2,936 (21.6%) |
| 20 to 24 Minutes | 2,093 (16.3%) | 1,655 (12.2%) |
| 25 to 29 Minutes | 495 (3.9%) | 699 (5.1%) |
| 30 to 34 Minutes | 1,230 (9.6%) | 1,087 (8.0%) |
| 35 to 39 Minutes | 116 (0.9%) | 109 (0.8%) |
| 40 to 44 Minutes | 340 (2.6%) | 86 (0.6%) |
| 45 to 59 Minutes | 677 (5.3%) | 723 (5.3%) |
| 60 to 89 Minutes | 872 (6.8%) | 911 (6.7%) |
| 90 or more Minutes | 243 (1.9%) | 207 (1.5%) |
Time of Departure to Work by Sex in Flint
The most frequent times of departure to work in Flint are 4:00 PM to 11:59 PM (1,733, 13.5%) for males and 12:00 PM to 3:59 PM (2,128, 15.7%) for females.
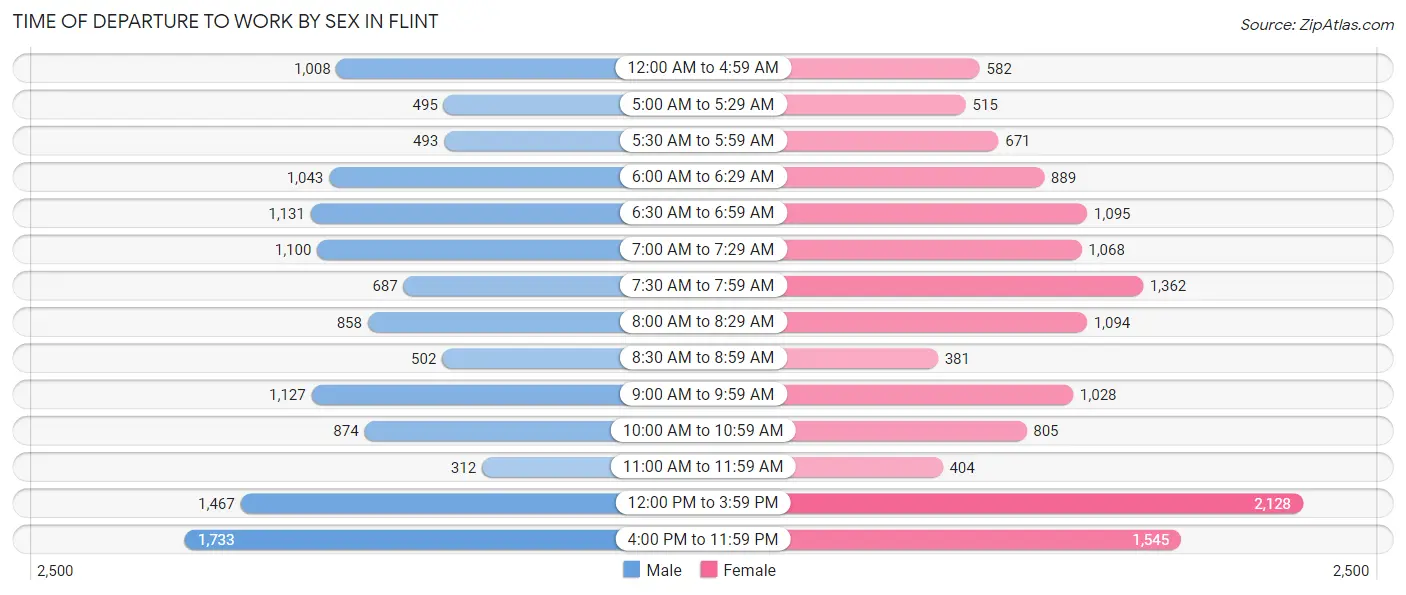
| Time of Departure | Male | Female |
| 12:00 AM to 4:59 AM | 1,008 (7.9%) | 582 (4.3%) |
| 5:00 AM to 5:29 AM | 495 (3.9%) | 515 (3.8%) |
| 5:30 AM to 5:59 AM | 493 (3.8%) | 671 (5.0%) |
| 6:00 AM to 6:29 AM | 1,043 (8.1%) | 889 (6.6%) |
| 6:30 AM to 6:59 AM | 1,131 (8.8%) | 1,095 (8.1%) |
| 7:00 AM to 7:29 AM | 1,100 (8.6%) | 1,068 (7.9%) |
| 7:30 AM to 7:59 AM | 687 (5.3%) | 1,362 (10.0%) |
| 8:00 AM to 8:29 AM | 858 (6.7%) | 1,094 (8.1%) |
| 8:30 AM to 8:59 AM | 502 (3.9%) | 381 (2.8%) |
| 9:00 AM to 9:59 AM | 1,127 (8.8%) | 1,028 (7.6%) |
| 10:00 AM to 10:59 AM | 874 (6.8%) | 805 (5.9%) |
| 11:00 AM to 11:59 AM | 312 (2.4%) | 404 (3.0%) |
| 12:00 PM to 3:59 PM | 1,467 (11.4%) | 2,128 (15.7%) |
| 4:00 PM to 11:59 PM | 1,733 (13.5%) | 1,545 (11.4%) |
| Total | 12,830 (100.0%) | 13,567 (100.0%) |
Housing Occupancy in Flint
Occupancy by Ownership in Flint
Of the total 33,854 dwellings in Flint, owner-occupied units account for 18,389 (54.3%), while renter-occupied units make up 15,465 (45.7%).
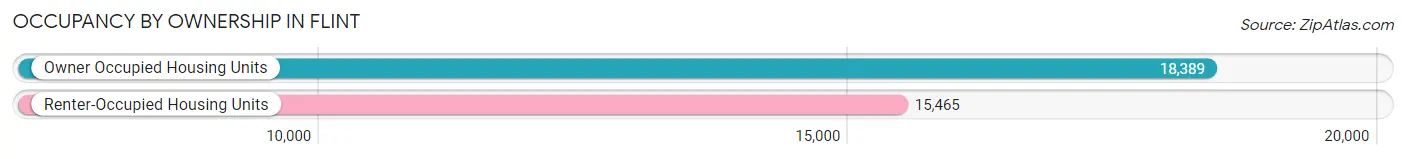
| Occupancy | # Housing Units | % Housing Units |
| Owner Occupied Housing Units | 18,389 | 54.3% |
| Renter-Occupied Housing Units | 15,465 | 45.7% |
| Total Occupied Housing Units | 33,854 | 100.0% |
Occupancy by Household Size in Flint
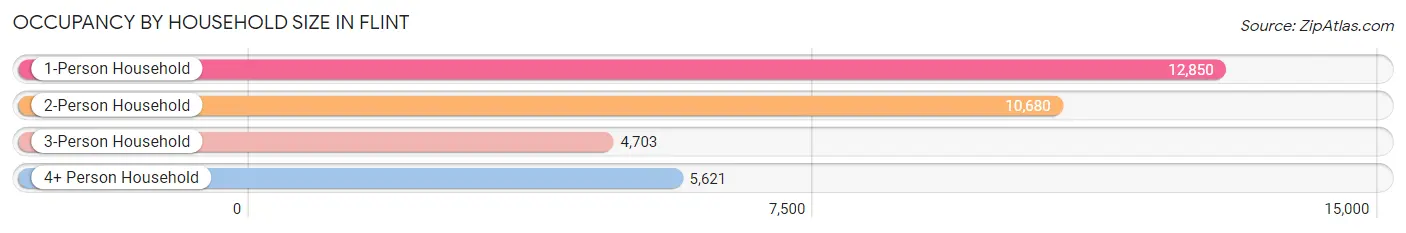
| Household Size | # Housing Units | % Housing Units |
| 1-Person Household | 12,850 | 38.0% |
| 2-Person Household | 10,680 | 31.6% |
| 3-Person Household | 4,703 | 13.9% |
| 4+ Person Household | 5,621 | 16.6% |
| Total Housing Units | 33,854 | 100.0% |
Occupancy by Ownership by Household Size in Flint
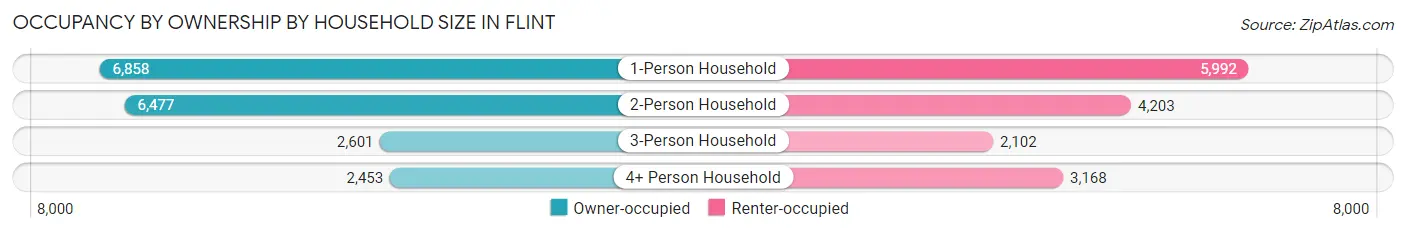
| Household Size | Owner-occupied | Renter-occupied |
| 1-Person Household | 6,858 (53.4%) | 5,992 (46.6%) |
| 2-Person Household | 6,477 (60.7%) | 4,203 (39.4%) |
| 3-Person Household | 2,601 (55.3%) | 2,102 (44.7%) |
| 4+ Person Household | 2,453 (43.6%) | 3,168 (56.4%) |
| Total Housing Units | 18,389 (54.3%) | 15,465 (45.7%) |
Occupancy by Educational Attainment in Flint
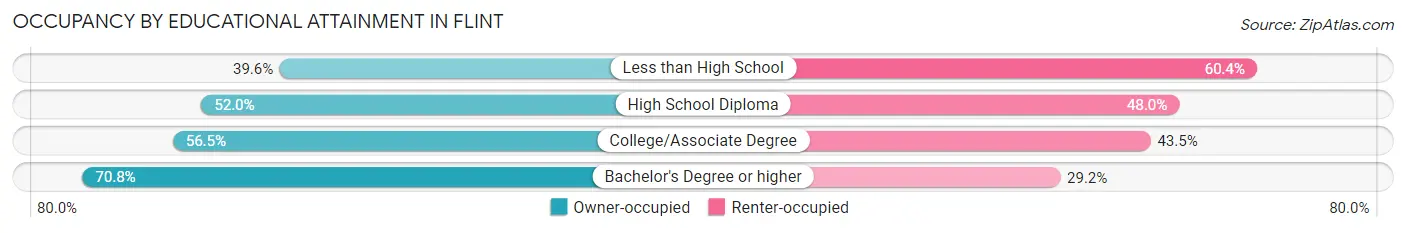
| Household Size | Owner-occupied | Renter-occupied |
| Less than High School | 2,141 (39.6%) | 3,260 (60.4%) |
| High School Diploma | 5,474 (52.0%) | 5,061 (48.0%) |
| College/Associate Degree | 7,554 (56.5%) | 5,818 (43.5%) |
| Bachelor's Degree or higher | 3,220 (70.8%) | 1,326 (29.2%) |
Occupancy by Age of Householder in Flint
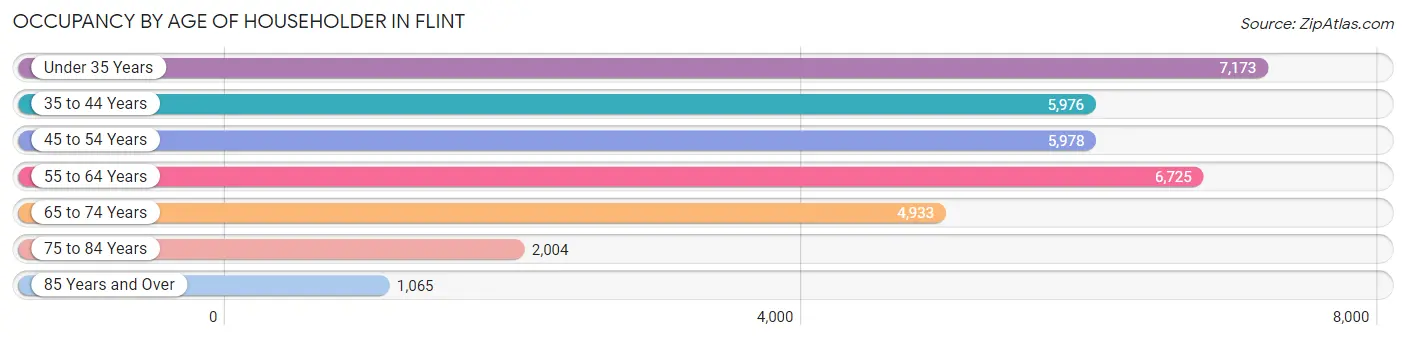
| Age Bracket | # Households | % Households |
| Under 35 Years | 7,173 | 21.2% |
| 35 to 44 Years | 5,976 | 17.6% |
| 45 to 54 Years | 5,978 | 17.7% |
| 55 to 64 Years | 6,725 | 19.9% |
| 65 to 74 Years | 4,933 | 14.6% |
| 75 to 84 Years | 2,004 | 5.9% |
| 85 Years and Over | 1,065 | 3.2% |
| Total | 33,854 | 100.0% |
Housing Finances in Flint
Median Income by Occupancy in Flint
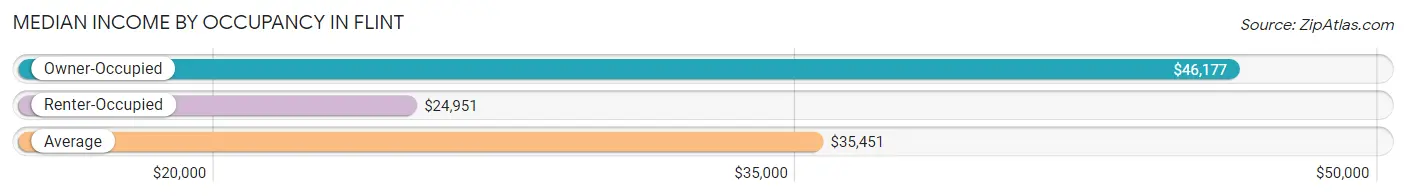
| Occupancy Type | # Households | Median Income |
| Owner-Occupied | 18,389 (54.3%) | $46,177 |
| Renter-Occupied | 15,465 (45.7%) | $24,951 |
| Average | 33,854 (100.0%) | $35,451 |
Occupancy by Householder Income Bracket in Flint
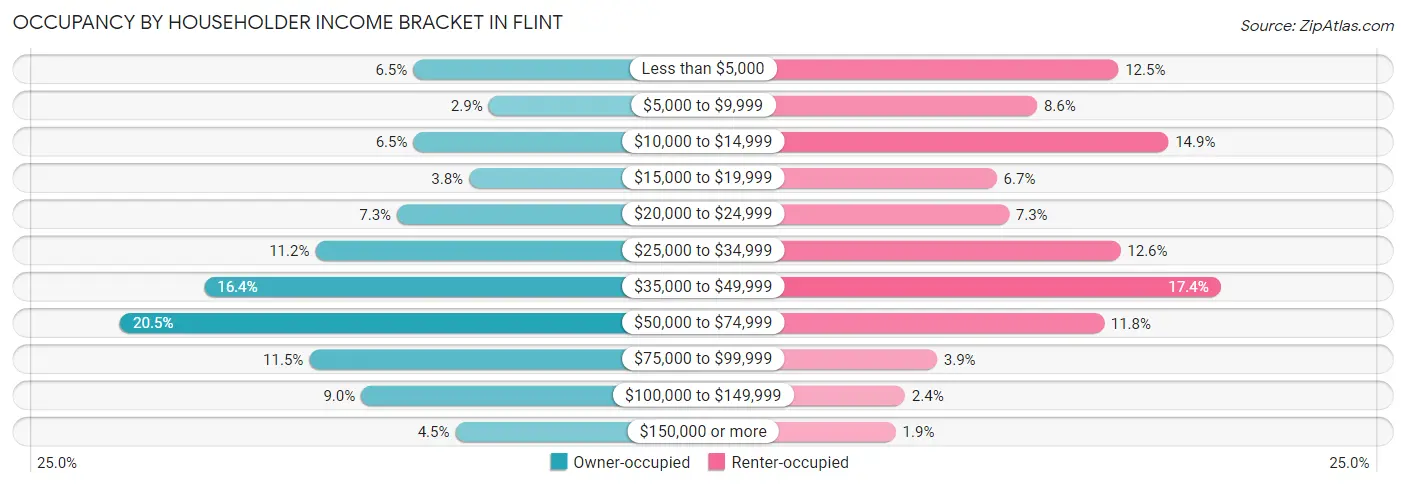
| Income Bracket | Owner-occupied | Renter-occupied |
| Less than $5,000 | 1,195 (6.5%) | 1,934 (12.5%) |
| $5,000 to $9,999 | 536 (2.9%) | 1,336 (8.6%) |
| $10,000 to $14,999 | 1,193 (6.5%) | 2,303 (14.9%) |
| $15,000 to $19,999 | 707 (3.8%) | 1,040 (6.7%) |
| $20,000 to $24,999 | 1,337 (7.3%) | 1,129 (7.3%) |
| $25,000 to $34,999 | 2,052 (11.2%) | 1,950 (12.6%) |
| $35,000 to $49,999 | 3,024 (16.4%) | 2,688 (17.4%) |
| $50,000 to $74,999 | 3,761 (20.4%) | 1,828 (11.8%) |
| $75,000 to $99,999 | 2,106 (11.5%) | 599 (3.9%) |
| $100,000 to $149,999 | 1,652 (9.0%) | 363 (2.4%) |
| $150,000 or more | 826 (4.5%) | 295 (1.9%) |
| Total | 18,389 (100.0%) | 15,465 (100.0%) |
Monthly Housing Cost Tiers in Flint
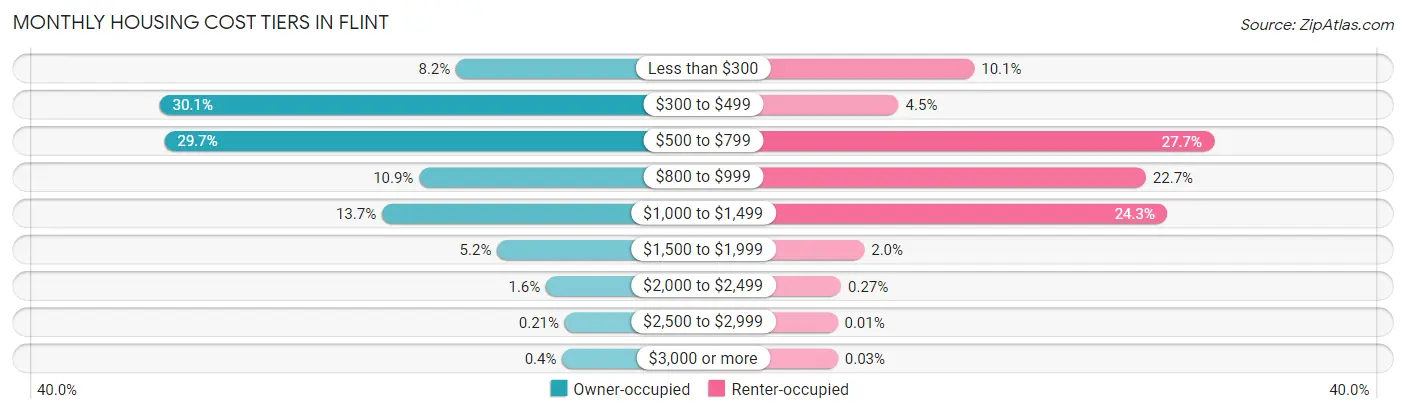
| Monthly Cost | Owner-occupied | Renter-occupied |
| Less than $300 | 1,511 (8.2%) | 1,559 (10.1%) |
| $300 to $499 | 5,528 (30.1%) | 698 (4.5%) |
| $500 to $799 | 5,464 (29.7%) | 4,287 (27.7%) |
| $800 to $999 | 2,012 (10.9%) | 3,514 (22.7%) |
| $1,000 to $1,499 | 2,516 (13.7%) | 3,751 (24.2%) |
| $1,500 to $1,999 | 954 (5.2%) | 306 (2.0%) |
| $2,000 to $2,499 | 292 (1.6%) | 41 (0.3%) |
| $2,500 to $2,999 | 39 (0.2%) | 1 (0.0%) |
| $3,000 or more | 73 (0.4%) | 4 (0.0%) |
| Total | 18,389 (100.0%) | 15,465 (100.0%) |
Physical Housing Characteristics in Flint
Housing Structures in Flint
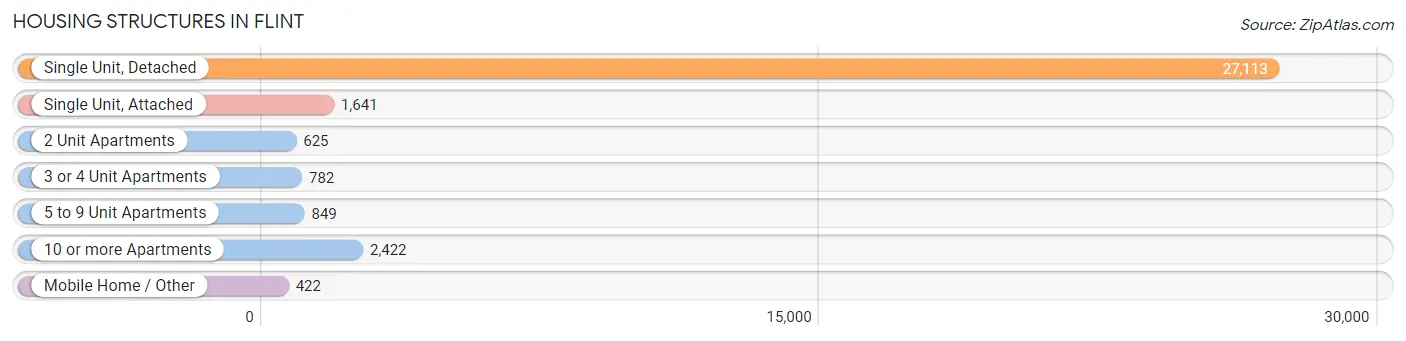
| Structure Type | # Housing Units | % Housing Units |
| Single Unit, Detached | 27,113 | 80.1% |
| Single Unit, Attached | 1,641 | 4.9% |
| 2 Unit Apartments | 625 | 1.8% |
| 3 or 4 Unit Apartments | 782 | 2.3% |
| 5 to 9 Unit Apartments | 849 | 2.5% |
| 10 or more Apartments | 2,422 | 7.1% |
| Mobile Home / Other | 422 | 1.3% |
| Total | 33,854 | 100.0% |
Housing Structures by Occupancy in Flint
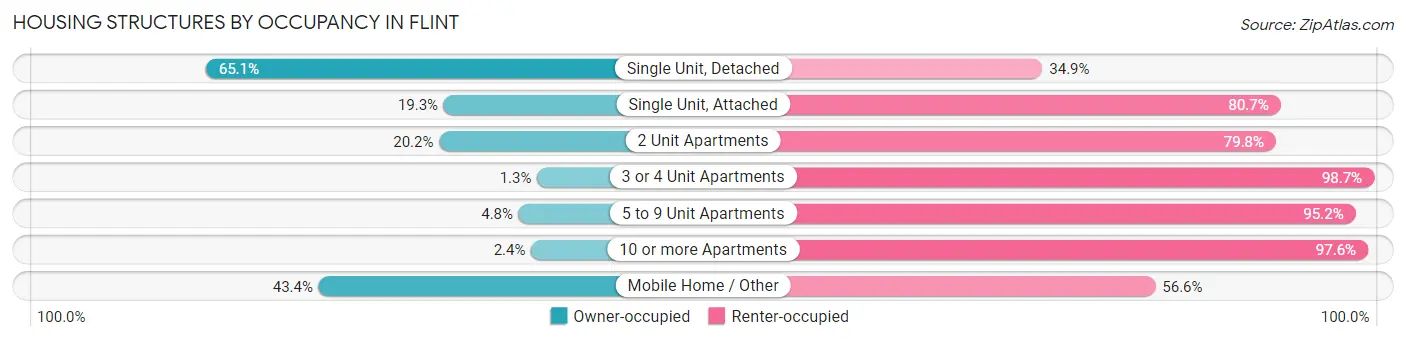
| Structure Type | Owner-occupied | Renter-occupied |
| Single Unit, Detached | 17,654 (65.1%) | 9,459 (34.9%) |
| Single Unit, Attached | 316 (19.3%) | 1,325 (80.7%) |
| 2 Unit Apartments | 126 (20.2%) | 499 (79.8%) |
| 3 or 4 Unit Apartments | 10 (1.3%) | 772 (98.7%) |
| 5 to 9 Unit Apartments | 41 (4.8%) | 808 (95.2%) |
| 10 or more Apartments | 59 (2.4%) | 2,363 (97.6%) |
| Mobile Home / Other | 183 (43.4%) | 239 (56.6%) |
| Total | 18,389 (54.3%) | 15,465 (45.7%) |
Housing Structures by Number of Rooms in Flint
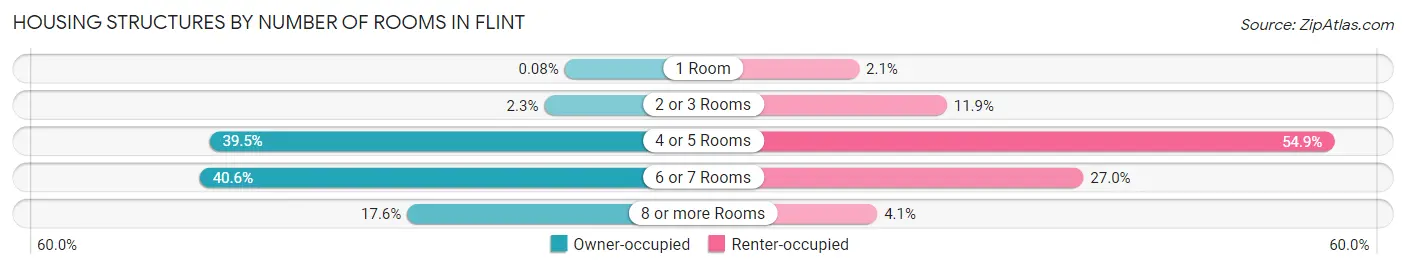
| Number of Rooms | Owner-occupied | Renter-occupied |
| 1 Room | 15 (0.1%) | 330 (2.1%) |
| 2 or 3 Rooms | 428 (2.3%) | 1,834 (11.9%) |
| 4 or 5 Rooms | 7,260 (39.5%) | 8,483 (54.8%) |
| 6 or 7 Rooms | 7,459 (40.6%) | 4,178 (27.0%) |
| 8 or more Rooms | 3,227 (17.5%) | 640 (4.1%) |
| Total | 18,389 (100.0%) | 15,465 (100.0%) |
Housing Structure by Heating Type in Flint
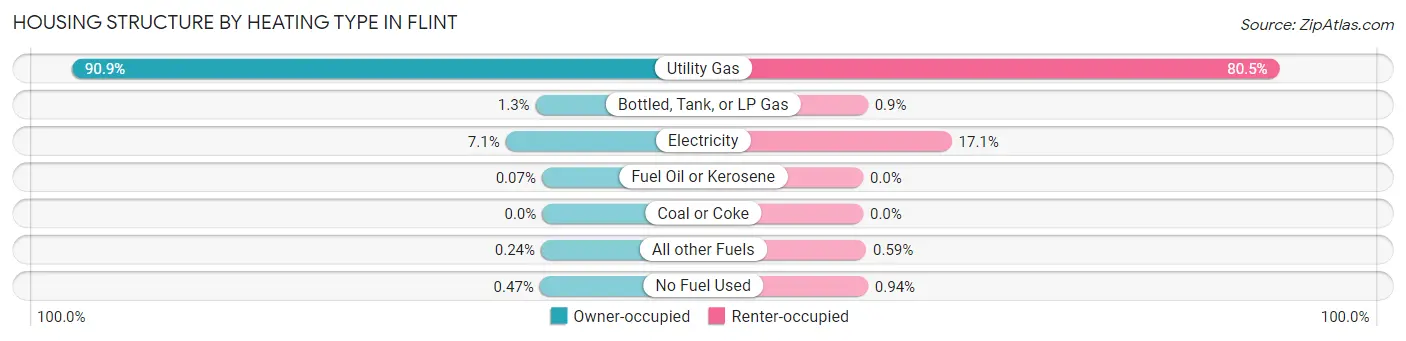
| Heating Type | Owner-occupied | Renter-occupied |
| Utility Gas | 16,707 (90.8%) | 12,442 (80.4%) |
| Bottled, Tank, or LP Gas | 237 (1.3%) | 139 (0.9%) |
| Electricity | 1,300 (7.1%) | 2,646 (17.1%) |
| Fuel Oil or Kerosene | 13 (0.1%) | 0 (0.0%) |
| Coal or Coke | 0 (0.0%) | 0 (0.0%) |
| All other Fuels | 45 (0.2%) | 92 (0.6%) |
| No Fuel Used | 87 (0.5%) | 146 (0.9%) |
| Total | 18,389 (100.0%) | 15,465 (100.0%) |
Household Vehicle Usage in Flint
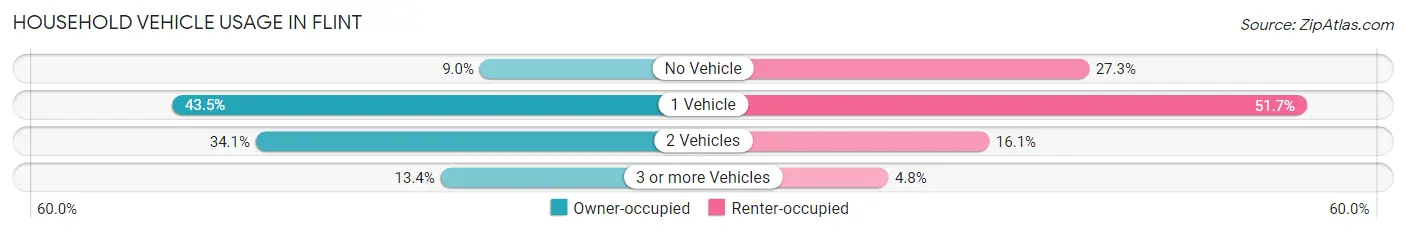
| Vehicles per Household | Owner-occupied | Renter-occupied |
| No Vehicle | 1,656 (9.0%) | 4,224 (27.3%) |
| 1 Vehicle | 7,998 (43.5%) | 8,001 (51.7%) |
| 2 Vehicles | 6,271 (34.1%) | 2,494 (16.1%) |
| 3 or more Vehicles | 2,464 (13.4%) | 746 (4.8%) |
| Total | 18,389 (100.0%) | 15,465 (100.0%) |
Real Estate & Mortgages in Flint
Real Estate and Mortgage Overview in Flint
| Characteristic | Without Mortgage | With Mortgage |
| Housing Units | 11,310 | 7,079 |
| Median Property Value | $31,400 | $62,700 |
| Median Household Income | $38,941 | $372 |
| Monthly Housing Costs | $458 | $65 |
| Real Estate Taxes | $962 | $243 |
Property Value by Mortgage Status in Flint
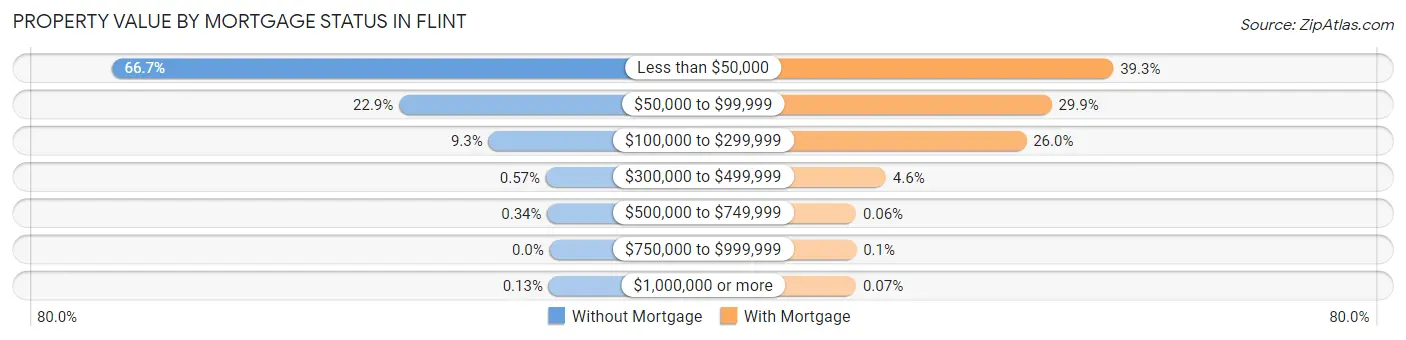
| Property Value | Without Mortgage | With Mortgage |
| Less than $50,000 | 7,547 (66.7%) | 2,780 (39.3%) |
| $50,000 to $99,999 | 2,593 (22.9%) | 2,114 (29.9%) |
| $100,000 to $299,999 | 1,052 (9.3%) | 1,841 (26.0%) |
| $300,000 to $499,999 | 64 (0.6%) | 328 (4.6%) |
| $500,000 to $749,999 | 39 (0.3%) | 4 (0.1%) |
| $750,000 to $999,999 | 0 (0.0%) | 7 (0.1%) |
| $1,000,000 or more | 15 (0.1%) | 5 (0.1%) |
| Total | 11,310 (100.0%) | 7,079 (100.0%) |
Household Income by Mortgage Status in Flint
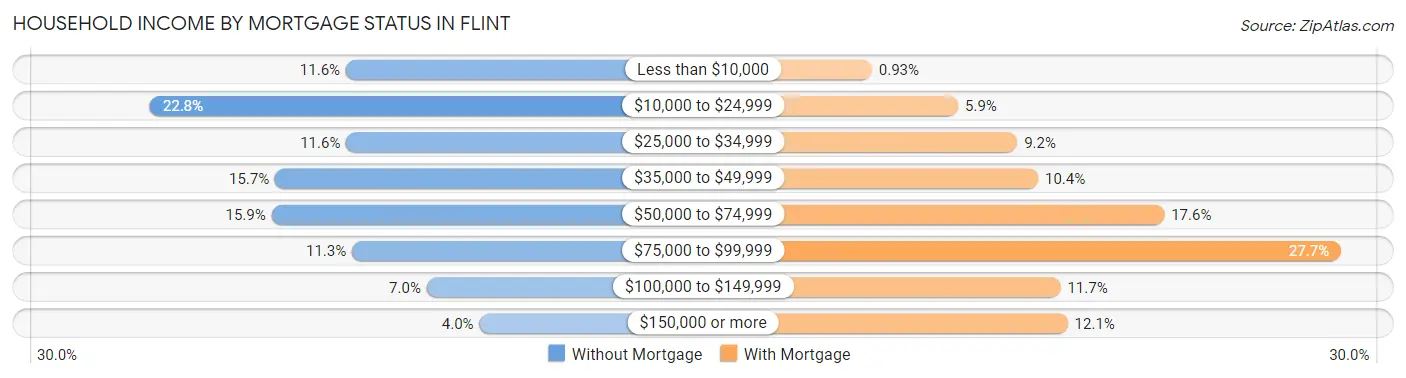
| Household Income | Without Mortgage | With Mortgage |
| Less than $10,000 | 1,316 (11.6%) | 66 (0.9%) |
| $10,000 to $24,999 | 2,583 (22.8%) | 415 (5.9%) |
| $25,000 to $34,999 | 1,314 (11.6%) | 654 (9.2%) |
| $35,000 to $49,999 | 1,775 (15.7%) | 738 (10.4%) |
| $50,000 to $74,999 | 1,797 (15.9%) | 1,249 (17.6%) |
| $75,000 to $99,999 | 1,277 (11.3%) | 1,964 (27.7%) |
| $100,000 to $149,999 | 794 (7.0%) | 829 (11.7%) |
| $150,000 or more | 454 (4.0%) | 858 (12.1%) |
| Total | 11,310 (100.0%) | 7,079 (100.0%) |
Property Value to Household Income Ratio in Flint
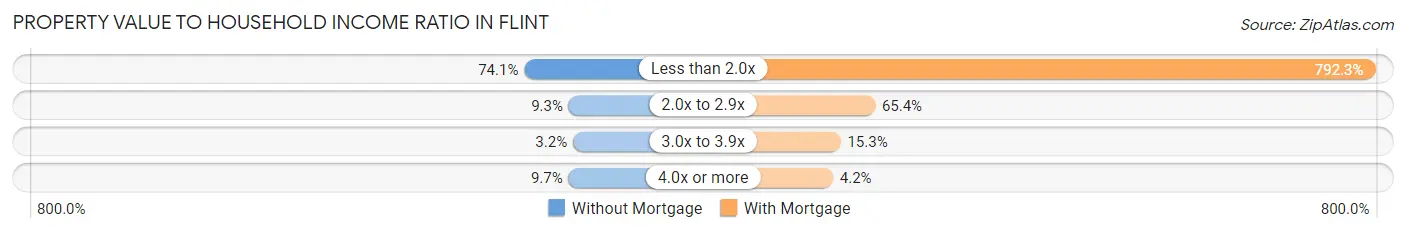
| Value-to-Income Ratio | Without Mortgage | With Mortgage |
| Less than 2.0x | 8,378 (74.1%) | 56,090 (792.3%) |
| 2.0x to 2.9x | 1,050 (9.3%) | 4,630 (65.4%) |
| 3.0x to 3.9x | 365 (3.2%) | 1,086 (15.3%) |
| 4.0x or more | 1,096 (9.7%) | 297 (4.2%) |
| Total | 11,310 (100.0%) | 7,079 (100.0%) |
Real Estate Taxes by Mortgage Status in Flint
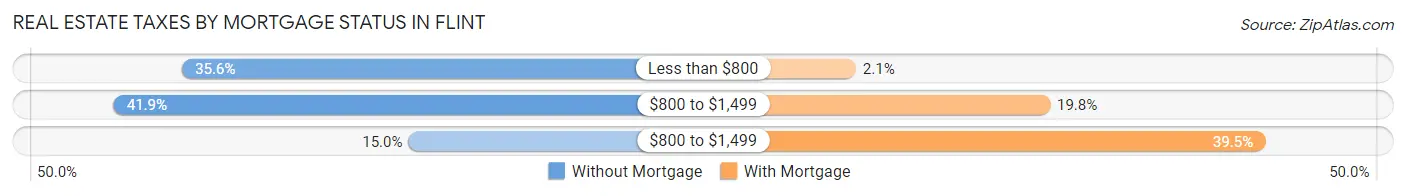
| Property Taxes | Without Mortgage | With Mortgage |
| Less than $800 | 4,027 (35.6%) | 148 (2.1%) |
| $800 to $1,499 | 4,733 (41.8%) | 1,403 (19.8%) |
| $800 to $1,499 | 1,692 (15.0%) | 2,793 (39.5%) |
| Total | 11,310 (100.0%) | 7,079 (100.0%) |
Health & Disability in Flint
Health Insurance Coverage by Age in Flint
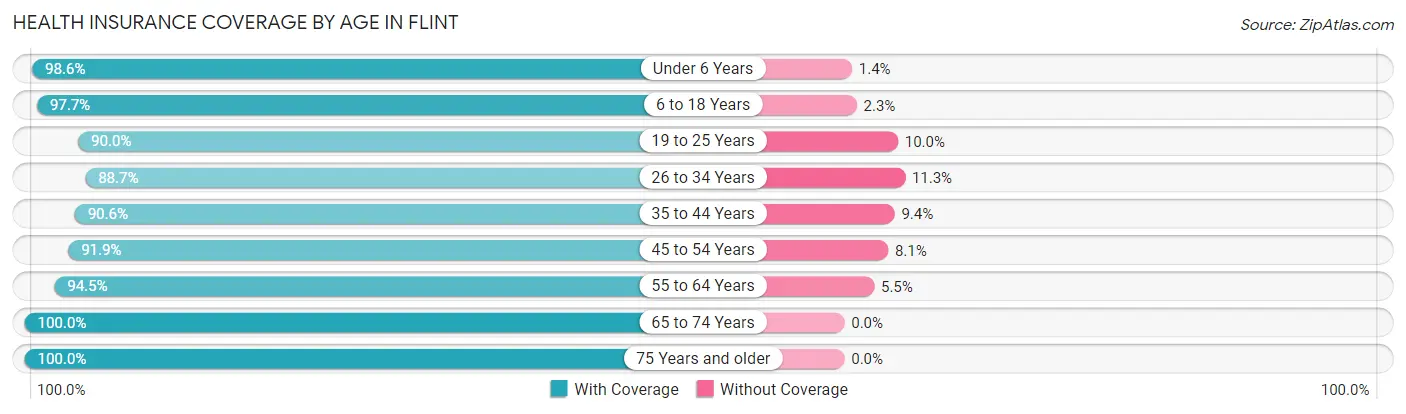
| Age Bracket | With Coverage | Without Coverage |
| Under 6 Years | 6,453 (98.6%) | 92 (1.4%) |
| 6 to 18 Years | 14,131 (97.7%) | 332 (2.3%) |
| 19 to 25 Years | 7,295 (90.0%) | 808 (10.0%) |
| 26 to 34 Years | 9,022 (88.7%) | 1,151 (11.3%) |
| 35 to 44 Years | 9,051 (90.6%) | 935 (9.4%) |
| 45 to 54 Years | 8,952 (91.9%) | 793 (8.1%) |
| 55 to 64 Years | 10,341 (94.5%) | 607 (5.5%) |
| 65 to 74 Years | 6,882 (100.0%) | 0 (0.0%) |
| 75 Years and older | 4,163 (100.0%) | 0 (0.0%) |
| Total | 76,290 (94.2%) | 4,718 (5.8%) |
Health Insurance Coverage by Citizenship Status in Flint
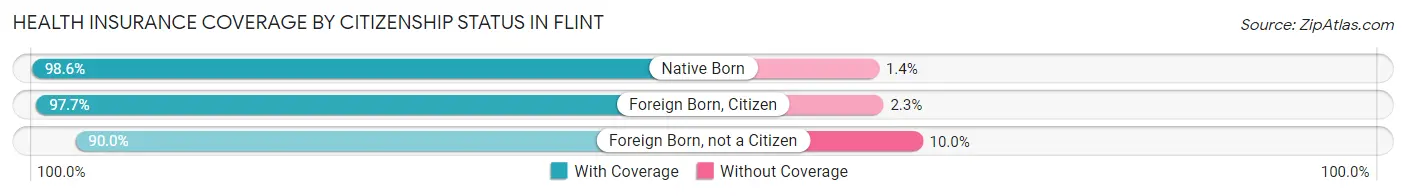
| Citizenship Status | With Coverage | Without Coverage |
| Native Born | 6,453 (98.6%) | 92 (1.4%) |
| Foreign Born, Citizen | 14,131 (97.7%) | 332 (2.3%) |
| Foreign Born, not a Citizen | 7,295 (90.0%) | 808 (10.0%) |
Health Insurance Coverage by Household Income in Flint
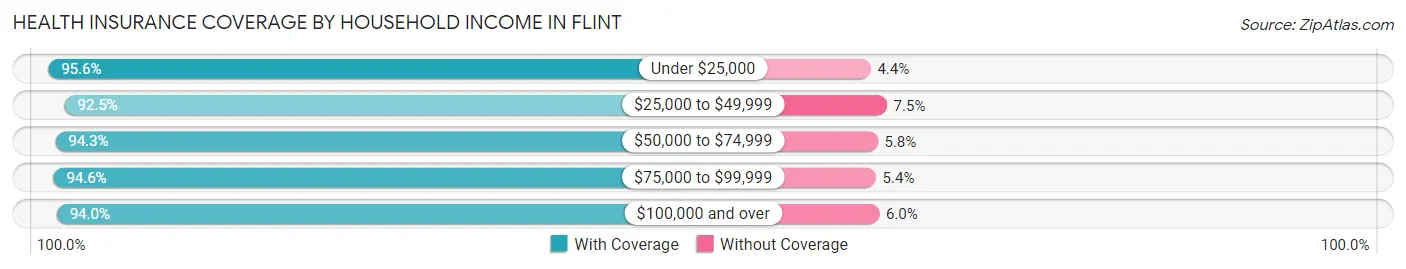
| Household Income | With Coverage | Without Coverage |
| Under $25,000 | 23,760 (95.6%) | 1,101 (4.4%) |
| $25,000 to $49,999 | 20,161 (92.5%) | 1,627 (7.5%) |
| $50,000 to $74,999 | 14,568 (94.3%) | 888 (5.8%) |
| $75,000 to $99,999 | 7,734 (94.6%) | 442 (5.4%) |
| $100,000 and over | 8,565 (94.0%) | 549 (6.0%) |
Public vs Private Health Insurance Coverage by Age in Flint
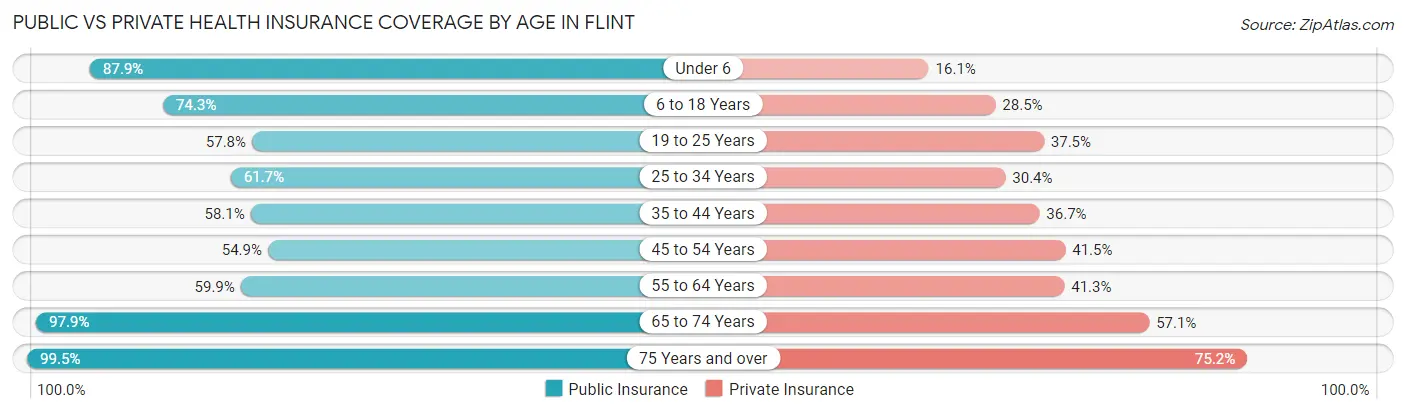
| Age Bracket | Public Insurance | Private Insurance |
| Under 6 | 5,751 (87.9%) | 1,055 (16.1%) |
| 6 to 18 Years | 10,748 (74.3%) | 4,124 (28.5%) |
| 19 to 25 Years | 4,685 (57.8%) | 3,039 (37.5%) |
| 25 to 34 Years | 6,279 (61.7%) | 3,089 (30.4%) |
| 35 to 44 Years | 5,798 (58.1%) | 3,663 (36.7%) |
| 45 to 54 Years | 5,346 (54.9%) | 4,042 (41.5%) |
| 55 to 64 Years | 6,559 (59.9%) | 4,522 (41.3%) |
| 65 to 74 Years | 6,735 (97.9%) | 3,927 (57.1%) |
| 75 Years and over | 4,143 (99.5%) | 3,132 (75.2%) |
| Total | 56,044 (69.2%) | 30,593 (37.8%) |
Disability Status by Sex by Age in Flint
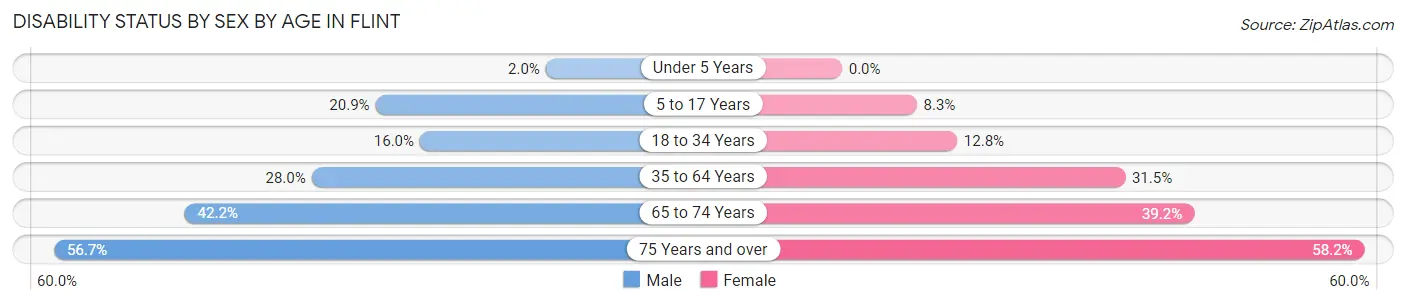
| Age Bracket | Male | Female |
| Under 5 Years | 52 (2.0%) | 0 (0.0%) |
| 5 to 17 Years | 1,520 (20.9%) | 567 (8.3%) |
| 18 to 34 Years | 1,619 (16.0%) | 1,227 (12.8%) |
| 35 to 64 Years | 4,213 (28.0%) | 4,938 (31.5%) |
| 65 to 74 Years | 1,368 (42.2%) | 1,427 (39.2%) |
| 75 Years and over | 843 (56.7%) | 1,558 (58.2%) |
Disability Class by Sex by Age in Flint
Disability Class: Hearing Difficulty
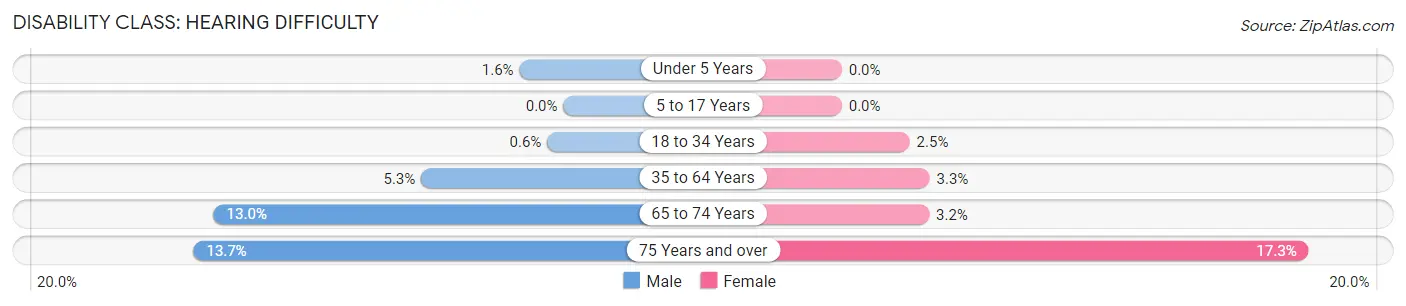
| Age Bracket | Male | Female |
| Under 5 Years | 43 (1.6%) | 0 (0.0%) |
| 5 to 17 Years | 0 (0.0%) | 0 (0.0%) |
| 18 to 34 Years | 61 (0.6%) | 241 (2.5%) |
| 35 to 64 Years | 793 (5.3%) | 510 (3.3%) |
| 65 to 74 Years | 421 (13.0%) | 118 (3.2%) |
| 75 Years and over | 204 (13.7%) | 464 (17.3%) |
Disability Class: Vision Difficulty
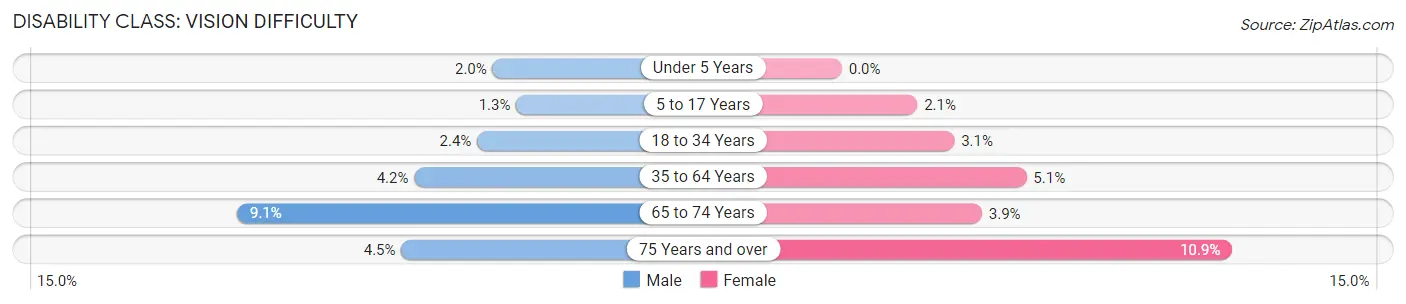
| Age Bracket | Male | Female |
| Under 5 Years | 52 (2.0%) | 0 (0.0%) |
| 5 to 17 Years | 95 (1.3%) | 143 (2.1%) |
| 18 to 34 Years | 243 (2.4%) | 300 (3.1%) |
| 35 to 64 Years | 623 (4.2%) | 804 (5.1%) |
| 65 to 74 Years | 295 (9.1%) | 142 (3.9%) |
| 75 Years and over | 67 (4.5%) | 291 (10.9%) |
Disability Class: Cognitive Difficulty
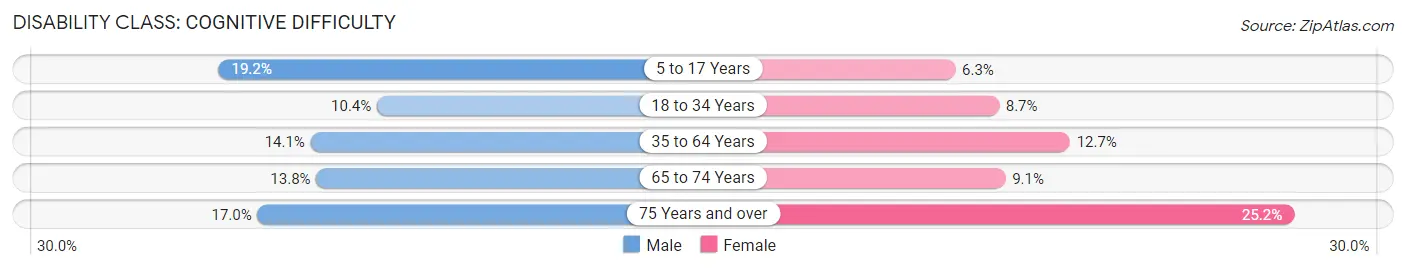
| Age Bracket | Male | Female |
| 5 to 17 Years | 1,395 (19.2%) | 430 (6.3%) |
| 18 to 34 Years | 1,051 (10.4%) | 836 (8.7%) |
| 35 to 64 Years | 2,114 (14.1%) | 1,987 (12.7%) |
| 65 to 74 Years | 446 (13.8%) | 331 (9.1%) |
| 75 Years and over | 253 (17.0%) | 674 (25.2%) |
Disability Class: Ambulatory Difficulty
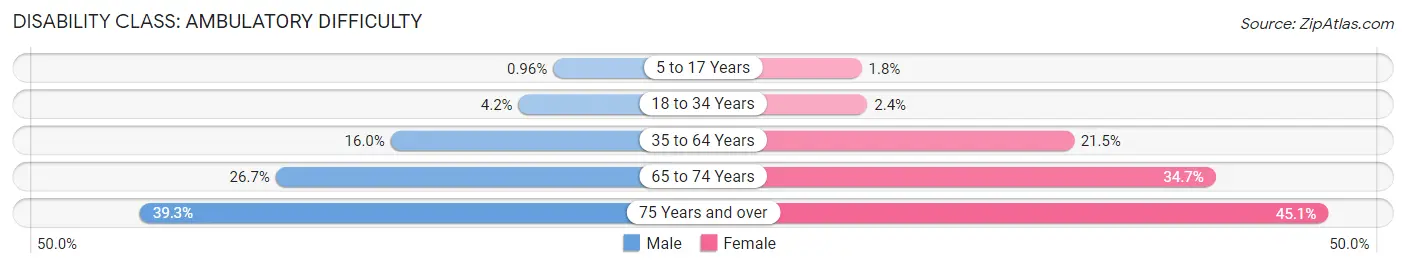
| Age Bracket | Male | Female |
| 5 to 17 Years | 70 (1.0%) | 125 (1.8%) |
| 18 to 34 Years | 423 (4.2%) | 227 (2.4%) |
| 35 to 64 Years | 2,408 (16.0%) | 3,369 (21.5%) |
| 65 to 74 Years | 866 (26.7%) | 1,262 (34.7%) |
| 75 Years and over | 584 (39.3%) | 1,208 (45.1%) |
Disability Class: Self-Care Difficulty
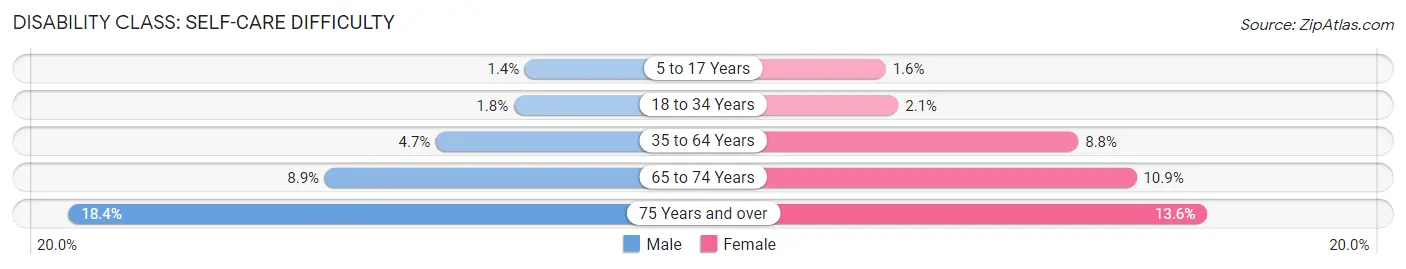
| Age Bracket | Male | Female |
| 5 to 17 Years | 103 (1.4%) | 111 (1.6%) |
| 18 to 34 Years | 185 (1.8%) | 201 (2.1%) |
| 35 to 64 Years | 709 (4.7%) | 1,375 (8.8%) |
| 65 to 74 Years | 287 (8.8%) | 398 (10.9%) |
| 75 Years and over | 273 (18.4%) | 363 (13.6%) |
Technology Access in Flint
Computing Device Access in Flint
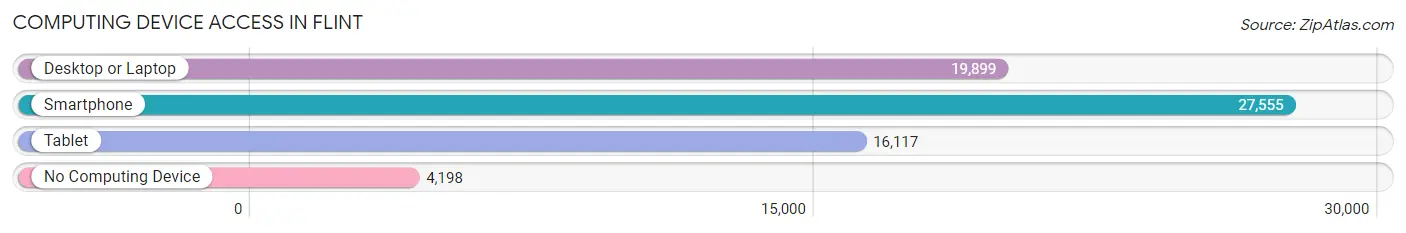
| Device Type | # Households | % Households |
| Desktop or Laptop | 19,899 | 58.8% |
| Smartphone | 27,555 | 81.4% |
| Tablet | 16,117 | 47.6% |
| No Computing Device | 4,198 | 12.4% |
| Total | 33,854 | 100.0% |
Internet Access in Flint
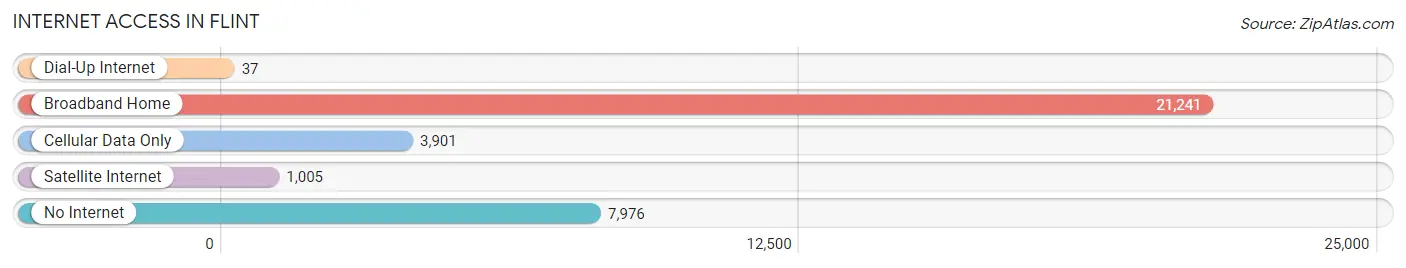
| Internet Type | # Households | % Households |
| Dial-Up Internet | 37 | 0.1% |
| Broadband Home | 21,241 | 62.7% |
| Cellular Data Only | 3,901 | 11.5% |
| Satellite Internet | 1,005 | 3.0% |
| No Internet | 7,976 | 23.6% |
| Total | 33,854 | 100.0% |
Flint Summary
Flint, Michigan is a city located in Genesee County in the southeastern part of the state. It is the largest city in the county and the seventh largest in the state. The city is located along the Flint River, approximately 60 miles northwest of Detroit.
History
The area that is now Flint was originally inhabited by the Ojibwe people. The first European settlers arrived in the area in 1819, led by Jacob Smith. Smith established a trading post and a sawmill, and the settlement was named Flint in 1821. The city was incorporated in 1855 and quickly grew due to its location along the railroad.
In the late 19th century, Flint became a major industrial center due to its proximity to the lumber industry and the abundance of natural resources. The city was home to several automobile manufacturers, including Buick, which was founded in 1903. The city also became a major center for the production of carriages and wagons.
Geography
Flint is located in southeastern Michigan, approximately 60 miles northwest of Detroit. The city is situated along the Flint River, which flows through the city and into Lake Huron. The city is surrounded by several smaller towns and villages, including Burton, Grand Blanc, and Flushing.
The city has a total area of 36.2 square miles, of which 35.7 square miles is land and 0.5 square miles is water. The terrain is mostly flat, with some rolling hills in the northern and western parts of the city.
Economy
Flint has a diverse economy, with a mix of manufacturing, healthcare, education, and retail. The city is home to several major employers, including General Motors, McLaren Health Care, and the University of Michigan-Flint.
The city is also home to several smaller businesses, including restaurants, bars, and shops. The city is also home to several cultural attractions, including the Flint Institute of Arts, the Flint Public Library, and the Flint Cultural Center.
Demographics
As of the 2010 census, Flint had a population of 102,434. The racial makeup of the city was 57.2% African American, 37.3% White, 1.2% Asian, 0.5% Native American, and 3.8% from other races. The median household income was $25,867, and the median family income was $31,945.
The city has a high poverty rate, with 28.2% of the population living below the poverty line. The unemployment rate was 11.2% in 2018.
Conclusion
Flint, Michigan is a city located in Genesee County in the southeastern part of the state. It is the largest city in the county and the seventh largest in the state. The city is located along the Flint River, approximately 60 miles northwest of Detroit. Flint has a diverse economy, with a mix of manufacturing, healthcare, education, and retail. The city has a population of 102,434, with a high poverty rate and an unemployment rate of 11.2%.
Common Questions
What is Per Capita Income in Flint?
Per Capita income in Flint is $20,559.
What is the Median Family Income in Flint?
Median Family Income in Flint is $43,042.
What is the Median Household income in Flint?
Median Household Income in Flint is $35,451.
What is Income or Wage Gap in Flint?
Income or Wage Gap in Flint is 10.9%.
Women in Flint earn 89.1 cents for every dollar earned by a man.
What is Family Income Deficit in Flint?
Family Income Deficit in Flint is $12,849.
Families that are below poverty line in Flint earn $12,849 less on average than the poverty threshold level.
What is Inequality or Gini Index in Flint?
Inequality or Gini Index in Flint is 0.49.
What is the Total Population of Flint?
Total Population of Flint is 81,863.
What is the Total Male Population of Flint?
Total Male Population of Flint is 40,492.
What is the Total Female Population of Flint?
Total Female Population of Flint is 41,371.
What is the Ratio of Males per 100 Females in Flint?
There are 97.88 Males per 100 Females in Flint.
What is the Ratio of Females per 100 Males in Flint?
There are 102.17 Females per 100 Males in Flint.
What is the Median Population Age in Flint?
Median Population Age in Flint is 36.1 Years.
What is the Average Family Size in Flint
Average Family Size in Flint is 3.2 People.
What is the Average Household Size in Flint
Average Household Size in Flint is 2.4 People.
How Large is the Labor Force in Flint?
There are 35,159 People in the Labor Forcein in Flint.
What is the Percentage of People in the Labor Force in Flint?
54.6% of People are in the Labor Force in Flint.
What is the Unemployment Rate in Flint?
Unemployment Rate in Flint is 17.6%.