North Las Vegas, NV Map & Demographics
North Las Vegas Map
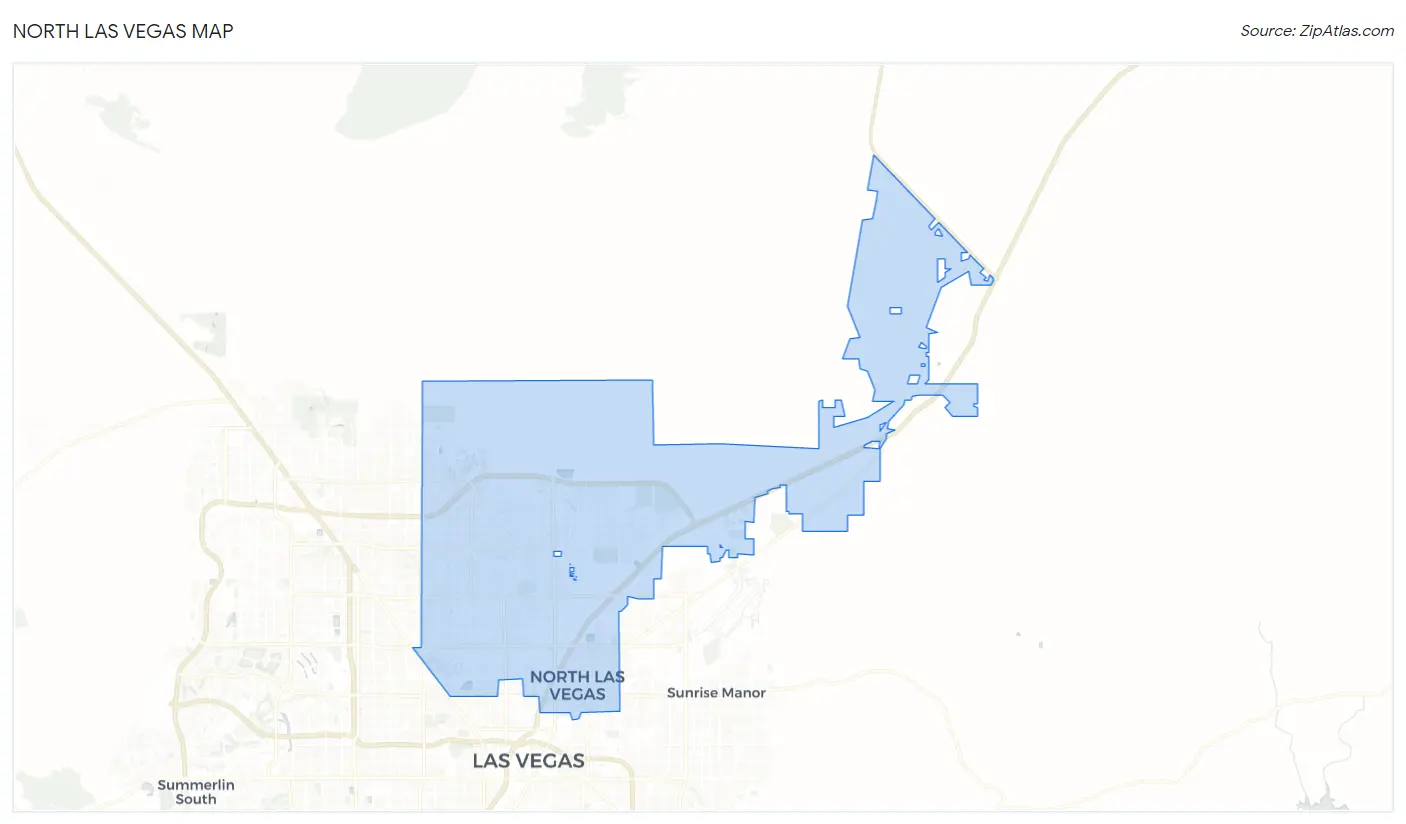
North Las Vegas Overview
$29,460
PER CAPITA INCOME
$79,370
AVG FAMILY INCOME
$71,774
AVG HOUSEHOLD INCOME
18.8%
WAGE / INCOME GAP [ % ]
81.2¢/ $1
WAGE / INCOME GAP [ $ ]
$10,691
FAMILY INCOME DEFICIT
0.41
INEQUALITY / GINI INDEX
264,022
TOTAL POPULATION
128,781
MALE POPULATION
135,241
FEMALE POPULATION
95.22
MALES / 100 FEMALES
105.02
FEMALES / 100 MALES
33.7
MEDIAN AGE
3.7
AVG FAMILY SIZE
3.1
AVG HOUSEHOLD SIZE
131,713
LABOR FORCE [ PEOPLE ]
65.1%
PERCENT IN LABOR FORCE
8.4%
UNEMPLOYMENT RATE
North Las Vegas Area Codes
Income in North Las Vegas
Income Overview in North Las Vegas
Per Capita Income in North Las Vegas is $29,460, while median incomes of families and households are $79,370 and $71,774 respectively.
| Characteristic | Number | Measure |
| Per Capita Income | 264,022 | $29,460 |
| Median Family Income | 60,989 | $79,370 |
| Mean Family Income | 60,989 | $95,095 |
| Median Household Income | 83,188 | $71,774 |
| Mean Household Income | 83,188 | $88,321 |
| Income Deficit | 60,989 | $10,691 |
| Wage / Income Gap (%) | 264,022 | 18.81% |
| Wage / Income Gap ($) | 264,022 | 81.19¢ per $1 |
| Gini / Inequality Index | 264,022 | 0.41 |
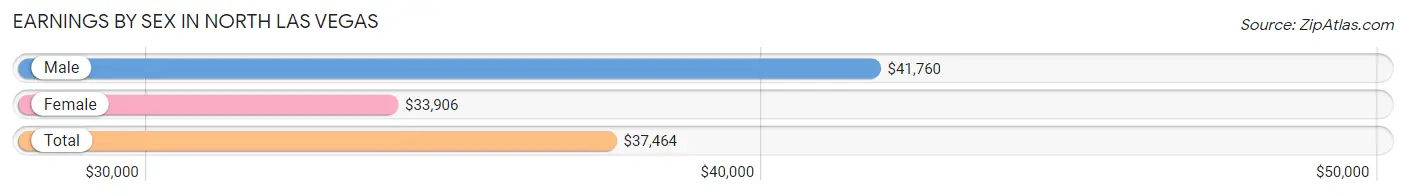
Earnings by Sex in North Las Vegas
Average Earnings in North Las Vegas are $37,464, $41,760 for men and $33,906 for women, a difference of 18.8%.
| Sex | Number | Average Earnings |
| Male | 70,765 (52.5%) | $41,760 |
| Female | 64,103 (47.5%) | $33,906 |
| Total | 134,868 (100.0%) | $37,464 |
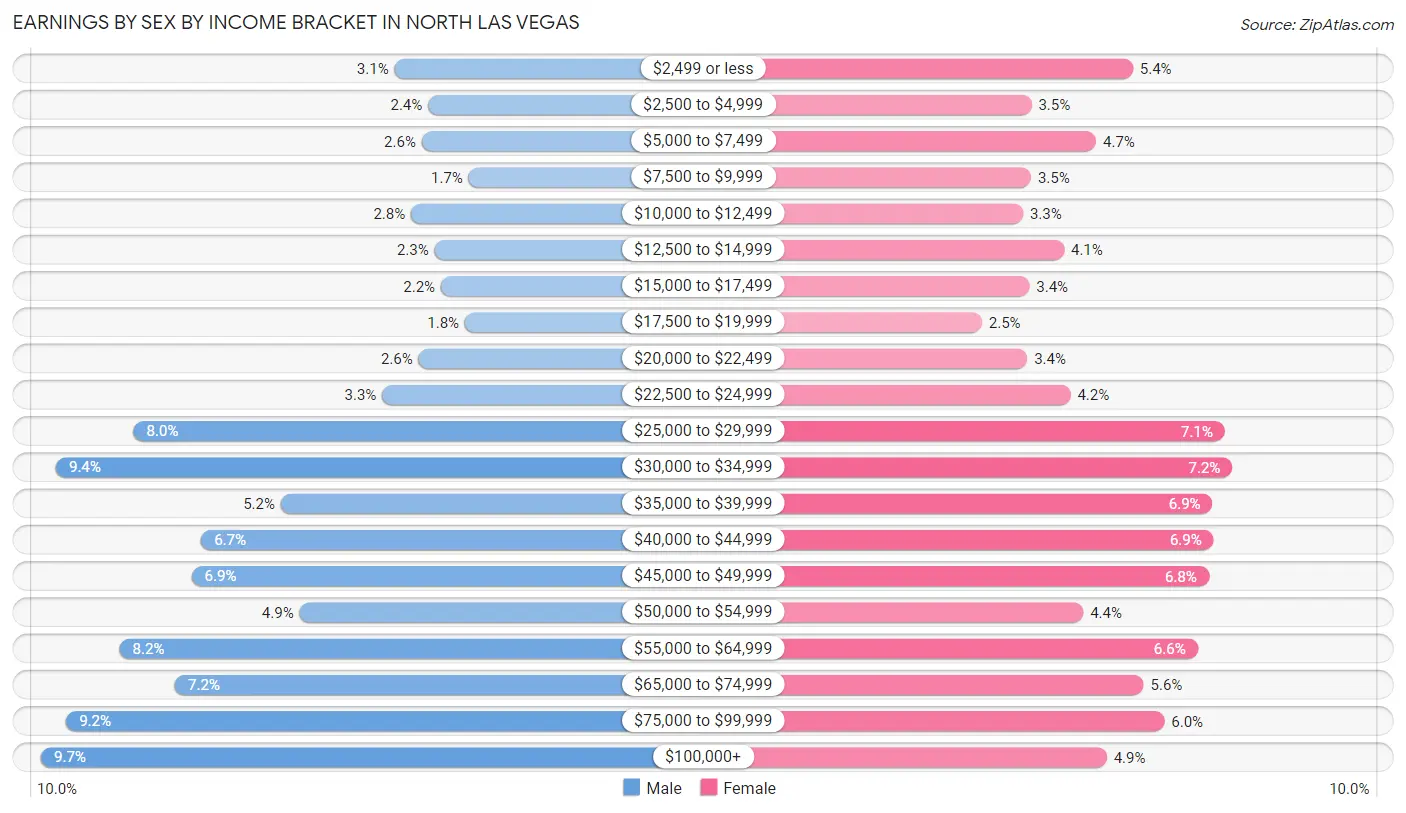
Earnings by Sex by Income Bracket in North Las Vegas
The most common earnings brackets in North Las Vegas are $100,000+ for men (6,859 | 9.7%) and $30,000 to $34,999 for women (4,630 | 7.2%).
| Income | Male | Female |
| $2,499 or less | 2,170 (3.1%) | 3,439 (5.4%) |
| $2,500 to $4,999 | 1,730 (2.4%) | 2,216 (3.5%) |
| $5,000 to $7,499 | 1,814 (2.6%) | 2,991 (4.7%) |
| $7,500 to $9,999 | 1,187 (1.7%) | 2,209 (3.5%) |
| $10,000 to $12,499 | 1,952 (2.8%) | 2,113 (3.3%) |
| $12,500 to $14,999 | 1,644 (2.3%) | 2,612 (4.1%) |
| $15,000 to $17,499 | 1,554 (2.2%) | 2,193 (3.4%) |
| $17,500 to $19,999 | 1,241 (1.8%) | 1,621 (2.5%) |
| $20,000 to $22,499 | 1,854 (2.6%) | 2,167 (3.4%) |
| $22,500 to $24,999 | 2,332 (3.3%) | 2,684 (4.2%) |
| $25,000 to $29,999 | 5,630 (8.0%) | 4,538 (7.1%) |
| $30,000 to $34,999 | 6,658 (9.4%) | 4,630 (7.2%) |
| $35,000 to $39,999 | 3,683 (5.2%) | 4,393 (6.9%) |
| $40,000 to $44,999 | 4,733 (6.7%) | 4,404 (6.9%) |
| $45,000 to $49,999 | 4,865 (6.9%) | 4,349 (6.8%) |
| $50,000 to $54,999 | 3,432 (4.9%) | 2,841 (4.4%) |
| $55,000 to $64,999 | 5,820 (8.2%) | 4,210 (6.6%) |
| $65,000 to $74,999 | 5,081 (7.2%) | 3,561 (5.6%) |
| $75,000 to $99,999 | 6,526 (9.2%) | 3,813 (5.9%) |
| $100,000+ | 6,859 (9.7%) | 3,119 (4.9%) |
| Total | 70,765 (100.0%) | 64,103 (100.0%) |
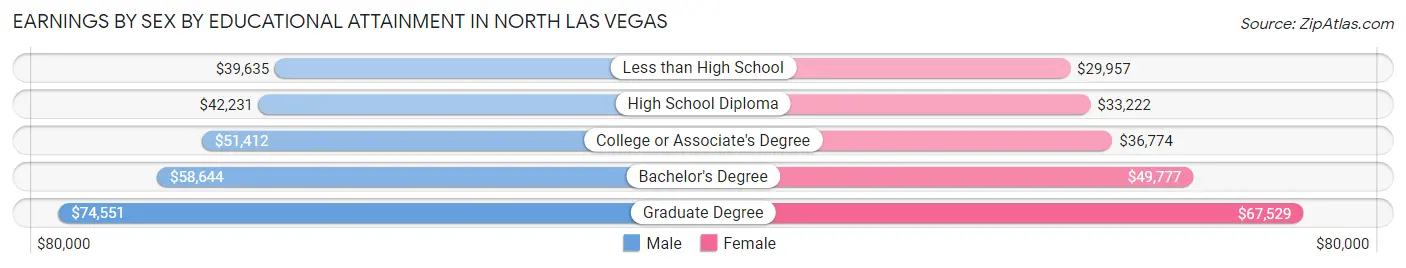
Earnings by Sex by Educational Attainment in North Las Vegas
Average earnings in North Las Vegas are $46,295 for men and $37,284 for women, a difference of 19.5%. Men with an educational attainment of graduate degree enjoy the highest average annual earnings of $74,551, while those with less than high school education earn the least with $39,635. Women with an educational attainment of graduate degree earn the most with the average annual earnings of $67,529, while those with less than high school education have the smallest earnings of $29,957.
| Educational Attainment | Male Income | Female Income |
| Less than High School | $39,635 | $29,957 |
| High School Diploma | $42,231 | $33,222 |
| College or Associate's Degree | $51,412 | $36,774 |
| Bachelor's Degree | $58,644 | $49,777 |
| Graduate Degree | $74,551 | $67,529 |
| Total | $46,295 | $37,284 |
Family Income in North Las Vegas
Family Income Brackets in North Las Vegas
According to the North Las Vegas family income data, there are 13,418 families falling into the $100,000 to $149,999 income range, which is the most common income bracket and makes up 22.0% of all families. Conversely, the $10,000 to $14,999 income bracket is the least frequent group with only 1,220 families (2.0%) belonging to this category.
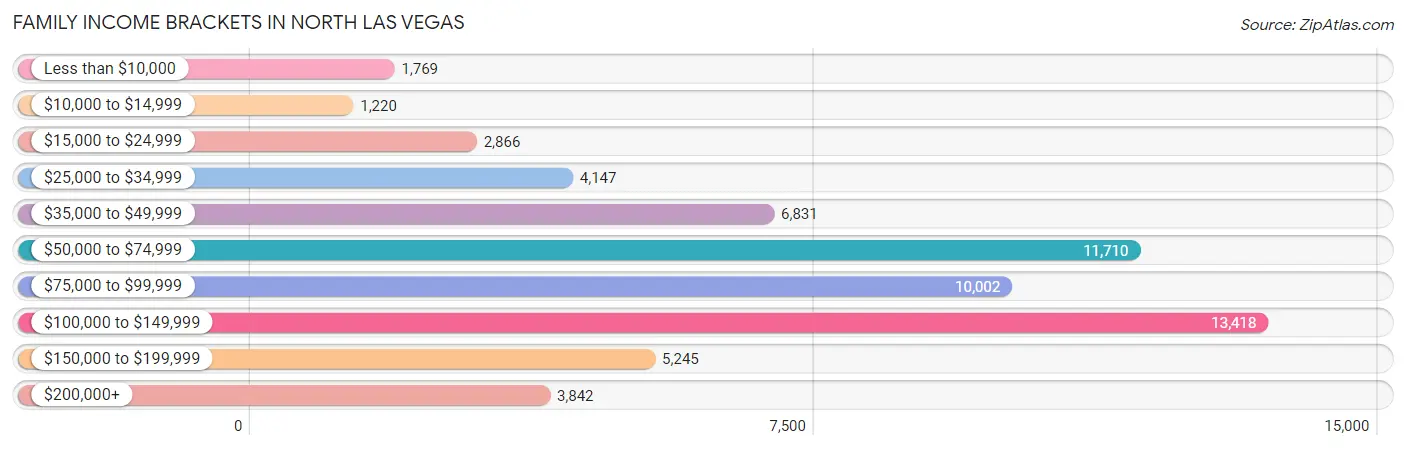
| Income Bracket | # Families | % Families |
| Less than $10,000 | 1,769 | 2.9% |
| $10,000 to $14,999 | 1,220 | 2.0% |
| $15,000 to $24,999 | 2,866 | 4.7% |
| $25,000 to $34,999 | 4,147 | 6.8% |
| $35,000 to $49,999 | 6,831 | 11.2% |
| $50,000 to $74,999 | 11,710 | 19.2% |
| $75,000 to $99,999 | 10,002 | 16.4% |
| $100,000 to $149,999 | 13,418 | 22.0% |
| $150,000 to $199,999 | 5,245 | 8.6% |
| $200,000+ | 3,842 | 6.3% |
Family Income by Famaliy Size in North Las Vegas
6-person families (3,410 | 5.6%) account for the highest median family income in North Las Vegas with $102,893 per family, while 2-person families (22,637 | 37.1%) have the highest median income of $34,535 per family member.
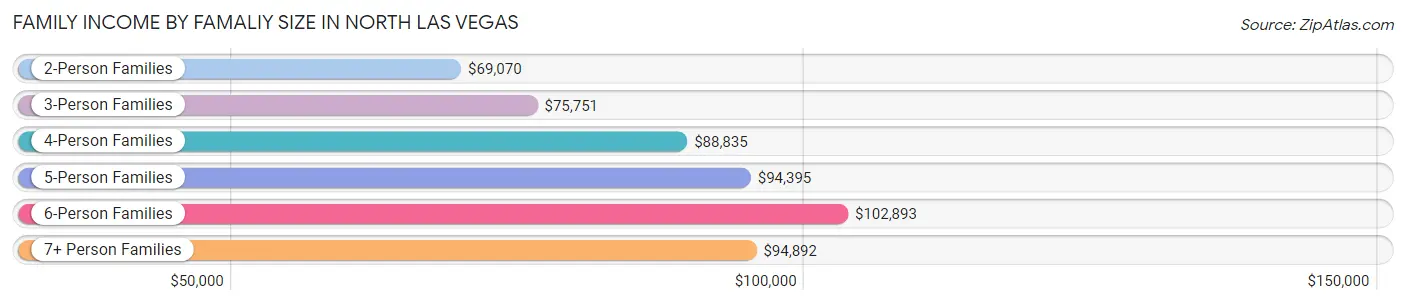
| Income Bracket | # Families | Median Income |
| 2-Person Families | 22,637 (37.1%) | $69,070 |
| 3-Person Families | 14,242 (23.4%) | $75,751 |
| 4-Person Families | 11,036 (18.1%) | $88,835 |
| 5-Person Families | 7,526 (12.3%) | $94,395 |
| 6-Person Families | 3,410 (5.6%) | $102,893 |
| 7+ Person Families | 2,138 (3.5%) | $94,892 |
| Total | 60,989 (100.0%) | $79,370 |
Family Income by Number of Earners in North Las Vegas
The median family income in North Las Vegas is $79,370, with families comprising 3+ earners (9,619) having the highest median family income of $126,230, while families with no earners (7,329) have the lowest median family income of $42,950, accounting for 15.8% and 12.0% of families, respectively.
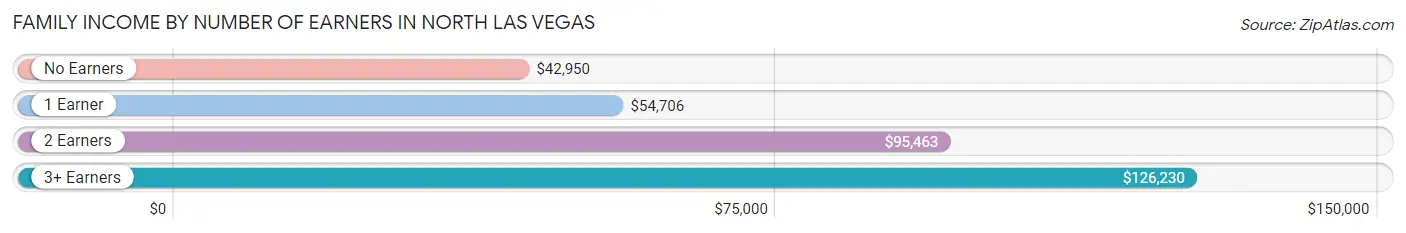
| Number of Earners | # Families | Median Income |
| No Earners | 7,329 (12.0%) | $42,950 |
| 1 Earner | 20,960 (34.4%) | $54,706 |
| 2 Earners | 23,081 (37.8%) | $95,463 |
| 3+ Earners | 9,619 (15.8%) | $126,230 |
| Total | 60,989 (100.0%) | $79,370 |
Household Income in North Las Vegas
Household Income Brackets in North Las Vegas
With 16,388 households falling in the category, the $100,000 to $149,999 income range is the most frequent in North Las Vegas, accounting for 19.7% of all households. In contrast, only 2,412 households (2.9%) fall into the $10,000 to $14,999 income bracket, making it the least populous group.
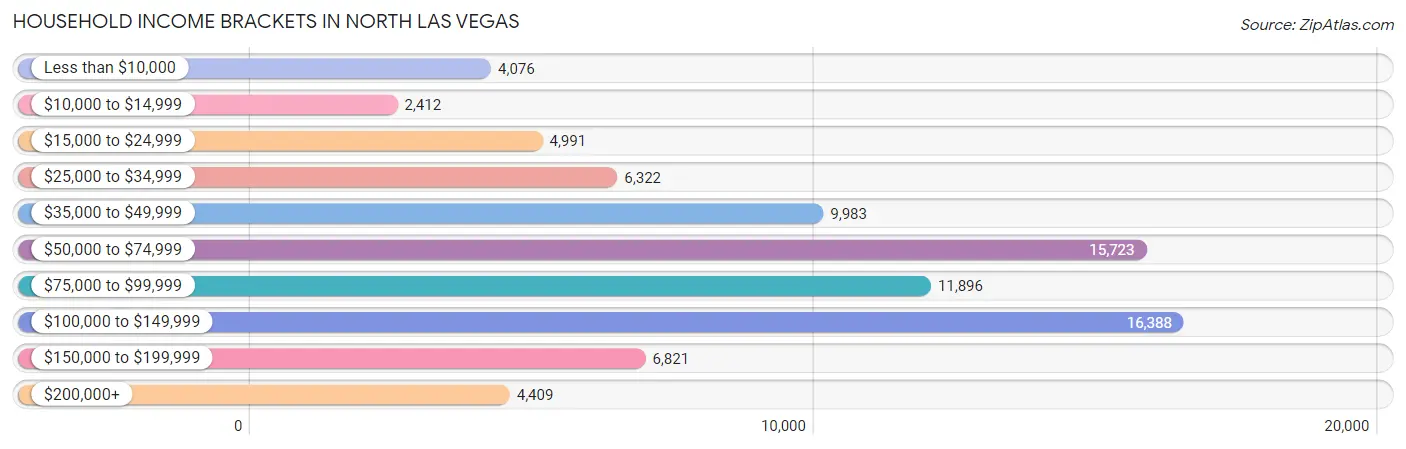
| Income Bracket | # Households | % Households |
| Less than $10,000 | 4,076 | 4.9% |
| $10,000 to $14,999 | 2,412 | 2.9% |
| $15,000 to $24,999 | 4,991 | 6.0% |
| $25,000 to $34,999 | 6,322 | 7.6% |
| $35,000 to $49,999 | 9,983 | 12.0% |
| $50,000 to $74,999 | 15,723 | 18.9% |
| $75,000 to $99,999 | 11,896 | 14.3% |
| $100,000 to $149,999 | 16,388 | 19.7% |
| $150,000 to $199,999 | 6,821 | 8.2% |
| $200,000+ | 4,409 | 5.3% |
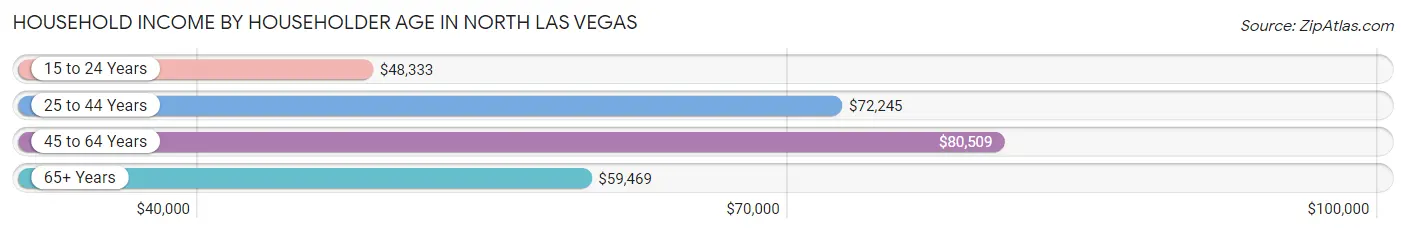
Household Income by Householder Age in North Las Vegas
The median household income in North Las Vegas is $71,774, with the highest median household income of $80,509 found in the 45 to 64 years age bracket for the primary householder. A total of 30,918 households (37.2%) fall into this category. Meanwhile, the 15 to 24 years age bracket for the primary householder has the lowest median household income of $48,333, with 2,960 households (3.6%) in this group.
| Income Bracket | # Households | Median Income |
| 15 to 24 Years | 2,960 (3.6%) | $48,333 |
| 25 to 44 Years | 33,135 (39.8%) | $72,245 |
| 45 to 64 Years | 30,918 (37.2%) | $80,509 |
| 65+ Years | 16,175 (19.4%) | $59,469 |
| Total | 83,188 (100.0%) | $71,774 |
Poverty in North Las Vegas
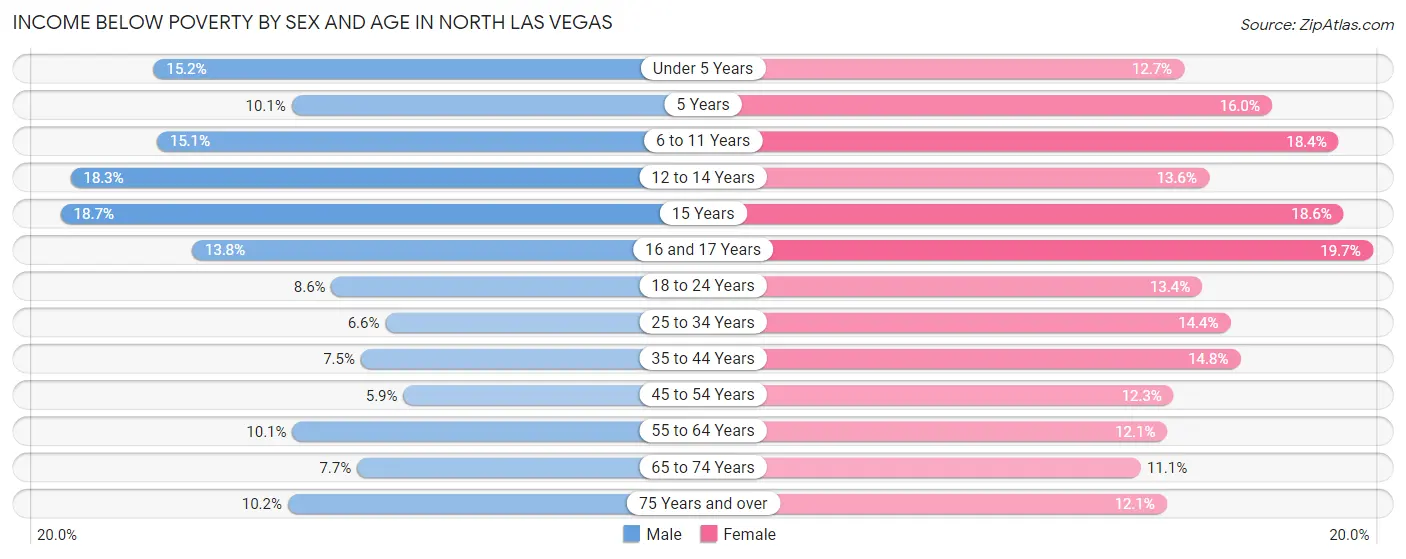
Income Below Poverty by Sex and Age in North Las Vegas
With 9.8% poverty level for males and 14.0% for females among the residents of North Las Vegas, 15 year old males and 16 and 17 year old females are the most vulnerable to poverty, with 402 males (18.7%) and 818 females (19.7%) in their respective age groups living below the poverty level.
| Age Bracket | Male | Female |
| Under 5 Years | 1,234 (15.2%) | 1,121 (12.7%) |
| 5 Years | 177 (10.1%) | 303 (16.0%) |
| 6 to 11 Years | 1,749 (15.1%) | 2,179 (18.4%) |
| 12 to 14 Years | 1,107 (18.3%) | 848 (13.6%) |
| 15 Years | 402 (18.7%) | 435 (18.6%) |
| 16 and 17 Years | 644 (13.8%) | 818 (19.7%) |
| 18 to 24 Years | 1,210 (8.6%) | 1,521 (13.4%) |
| 25 to 34 Years | 1,261 (6.6%) | 2,993 (14.4%) |
| 35 to 44 Years | 1,354 (7.5%) | 2,809 (14.8%) |
| 45 to 54 Years | 948 (5.9%) | 2,133 (12.3%) |
| 55 to 64 Years | 1,262 (10.1%) | 1,662 (12.1%) |
| 65 to 74 Years | 747 (7.7%) | 1,141 (11.1%) |
| 75 Years and over | 434 (10.2%) | 687 (12.1%) |
| Total | 12,529 (9.8%) | 18,650 (14.0%) |
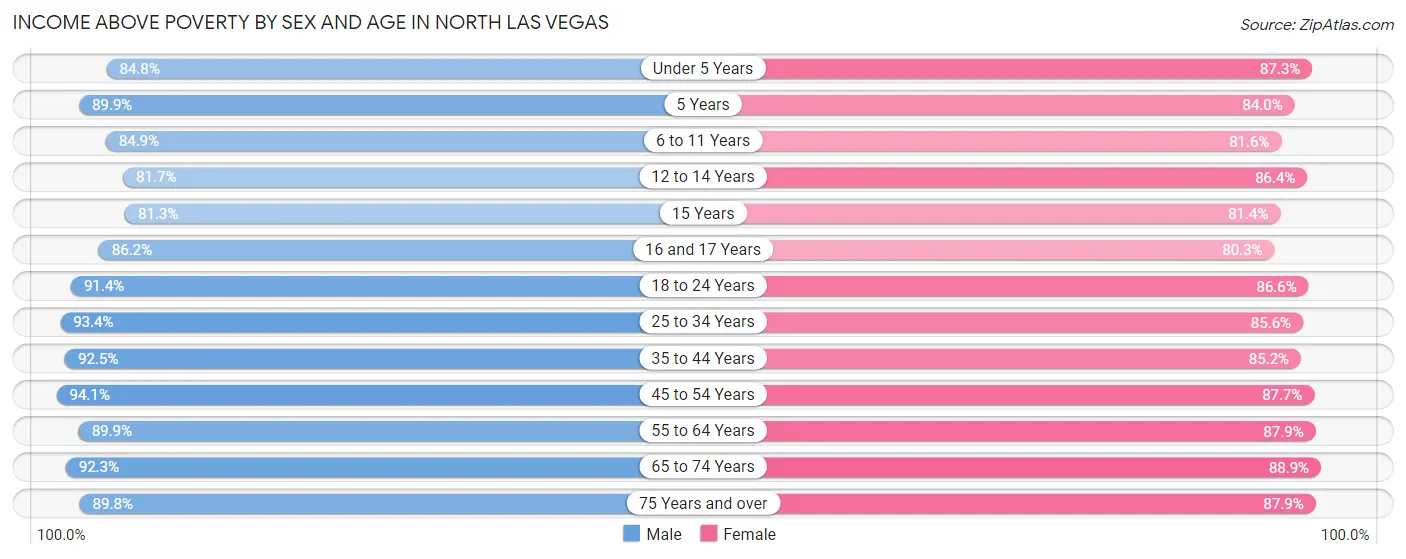
Income Above Poverty by Sex and Age in North Las Vegas
According to the poverty statistics in North Las Vegas, males aged 45 to 54 years and females aged 65 to 74 years are the age groups that are most secure financially, with 94.1% of males and 88.9% of females in these age groups living above the poverty line.
| Age Bracket | Male | Female |
| Under 5 Years | 6,874 (84.8%) | 7,704 (87.3%) |
| 5 Years | 1,578 (89.9%) | 1,596 (84.0%) |
| 6 to 11 Years | 9,841 (84.9%) | 9,638 (81.6%) |
| 12 to 14 Years | 4,941 (81.7%) | 5,379 (86.4%) |
| 15 Years | 1,752 (81.3%) | 1,900 (81.4%) |
| 16 and 17 Years | 4,027 (86.2%) | 3,334 (80.3%) |
| 18 to 24 Years | 12,843 (91.4%) | 9,851 (86.6%) |
| 25 to 34 Years | 17,810 (93.4%) | 17,769 (85.6%) |
| 35 to 44 Years | 16,661 (92.5%) | 16,183 (85.2%) |
| 45 to 54 Years | 14,999 (94.1%) | 15,176 (87.7%) |
| 55 to 64 Years | 11,287 (89.9%) | 12,091 (87.9%) |
| 65 to 74 Years | 9,010 (92.3%) | 9,166 (88.9%) |
| 75 Years and over | 3,808 (89.8%) | 5,010 (87.9%) |
| Total | 115,431 (90.2%) | 114,797 (86.0%) |
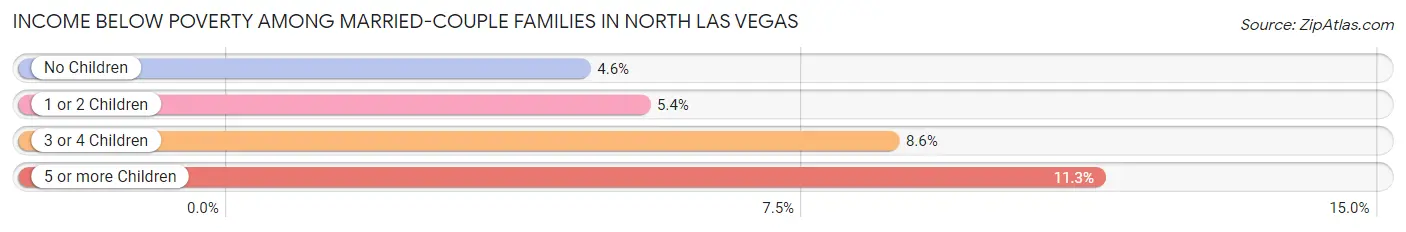
Income Below Poverty Among Married-Couple Families in North Las Vegas
The poverty statistics for married-couple families in North Las Vegas show that 5.4% or 2,167 of the total 39,752 families live below the poverty line. Families with 5 or more children have the highest poverty rate of 11.3%, comprising of 57 families. On the other hand, families with no children have the lowest poverty rate of 4.6%, which includes 968 families.
| Children | Above Poverty | Below Poverty |
| No Children | 20,093 (95.4%) | 968 (4.6%) |
| 1 or 2 Children | 12,463 (94.6%) | 709 (5.4%) |
| 3 or 4 Children | 4,583 (91.4%) | 433 (8.6%) |
| 5 or more Children | 446 (88.7%) | 57 (11.3%) |
| Total | 37,585 (94.6%) | 2,167 (5.4%) |
Income Below Poverty Among Single-Parent Households in North Las Vegas
According to the poverty data in North Las Vegas, 11.1% or 677 single-father households and 20.9% or 3,170 single-mother households are living below the poverty line. Among single-father households, those with 5 or more children have the highest poverty rate, with 20 households (36.4%) experiencing poverty. Likewise, among single-mother households, those with 3 or 4 children have the highest poverty rate, with 851 households (37.8%) falling below the poverty line.
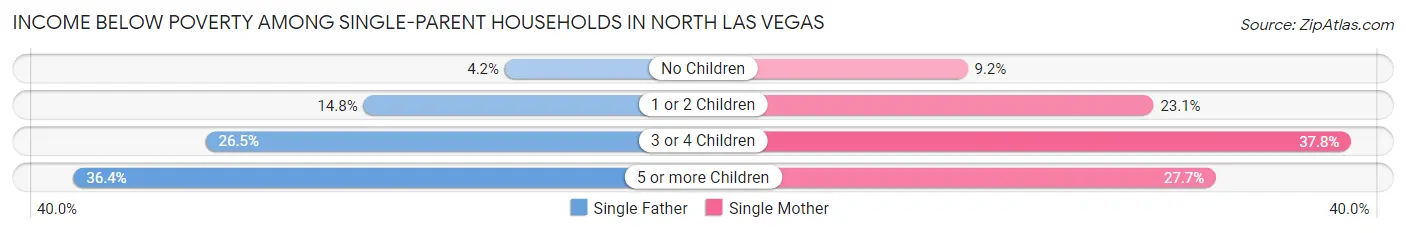
| Children | Single Father | Single Mother |
| No Children | 114 (4.2%) | 441 (9.2%) |
| 1 or 2 Children | 433 (14.7%) | 1,835 (23.1%) |
| 3 or 4 Children | 110 (26.5%) | 851 (37.8%) |
| 5 or more Children | 20 (36.4%) | 43 (27.7%) |
| Total | 677 (11.1%) | 3,170 (20.9%) |
Income Below Poverty Among Married-Couple vs Single-Parent Households in North Las Vegas
The poverty data for North Las Vegas shows that 2,167 of the married-couple family households (5.4%) and 3,847 of the single-parent households (18.1%) are living below the poverty level. Within the married-couple family households, those with 5 or more children have the highest poverty rate, with 57 households (11.3%) falling below the poverty line. Among the single-parent households, those with 3 or 4 children have the highest poverty rate, with 961 household (36.0%) living below poverty.
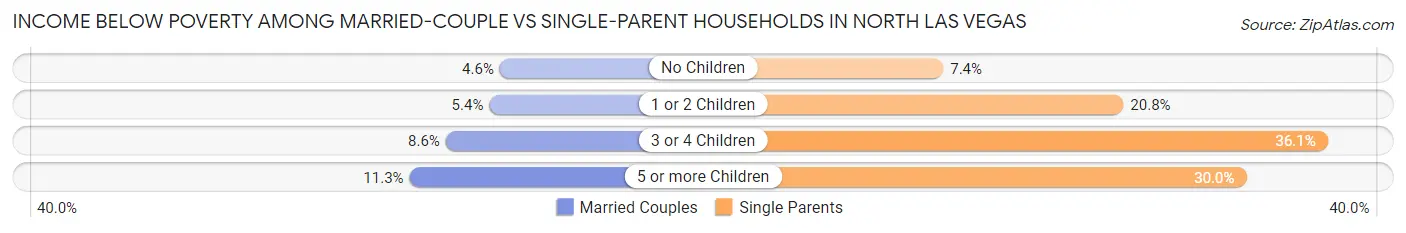
| Children | Married-Couple Families | Single-Parent Households |
| No Children | 968 (4.6%) | 555 (7.4%) |
| 1 or 2 Children | 709 (5.4%) | 2,268 (20.8%) |
| 3 or 4 Children | 433 (8.6%) | 961 (36.0%) |
| 5 or more Children | 57 (11.3%) | 63 (30.0%) |
| Total | 2,167 (5.4%) | 3,847 (18.1%) |
Race in North Las Vegas
The most populous races in North Las Vegas are Hispanic or Latino (111,363 | 42.2%), White / Caucasian (100,575 | 38.1%), and Black / African American (58,228 | 22.1%).
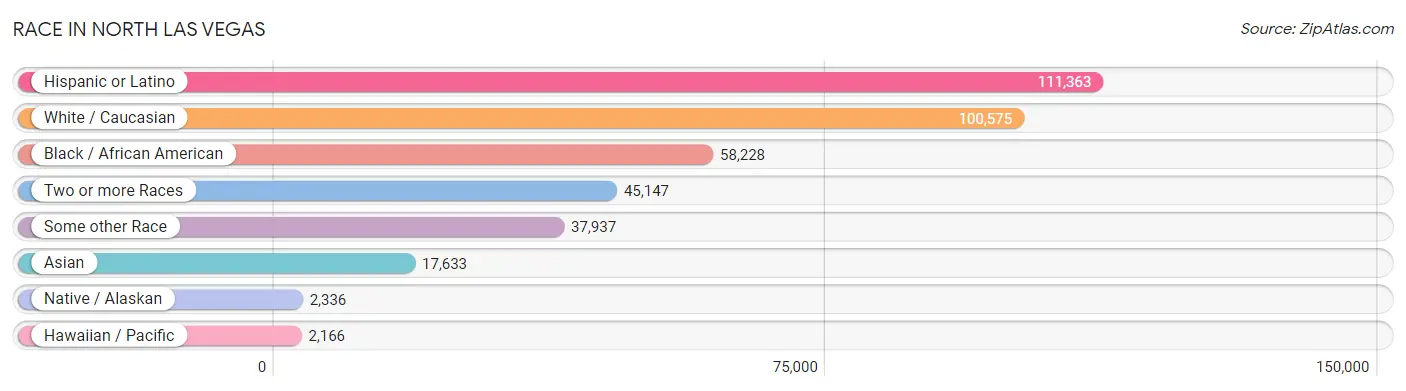
| Race | # Population | % Population |
| Asian | 17,633 | 6.7% |
| Black / African American | 58,228 | 22.1% |
| Hawaiian / Pacific | 2,166 | 0.8% |
| Hispanic or Latino | 111,363 | 42.2% |
| Native / Alaskan | 2,336 | 0.9% |
| White / Caucasian | 100,575 | 38.1% |
| Two or more Races | 45,147 | 17.1% |
| Some other Race | 37,937 | 14.4% |
| Total | 264,022 | 100.0% |
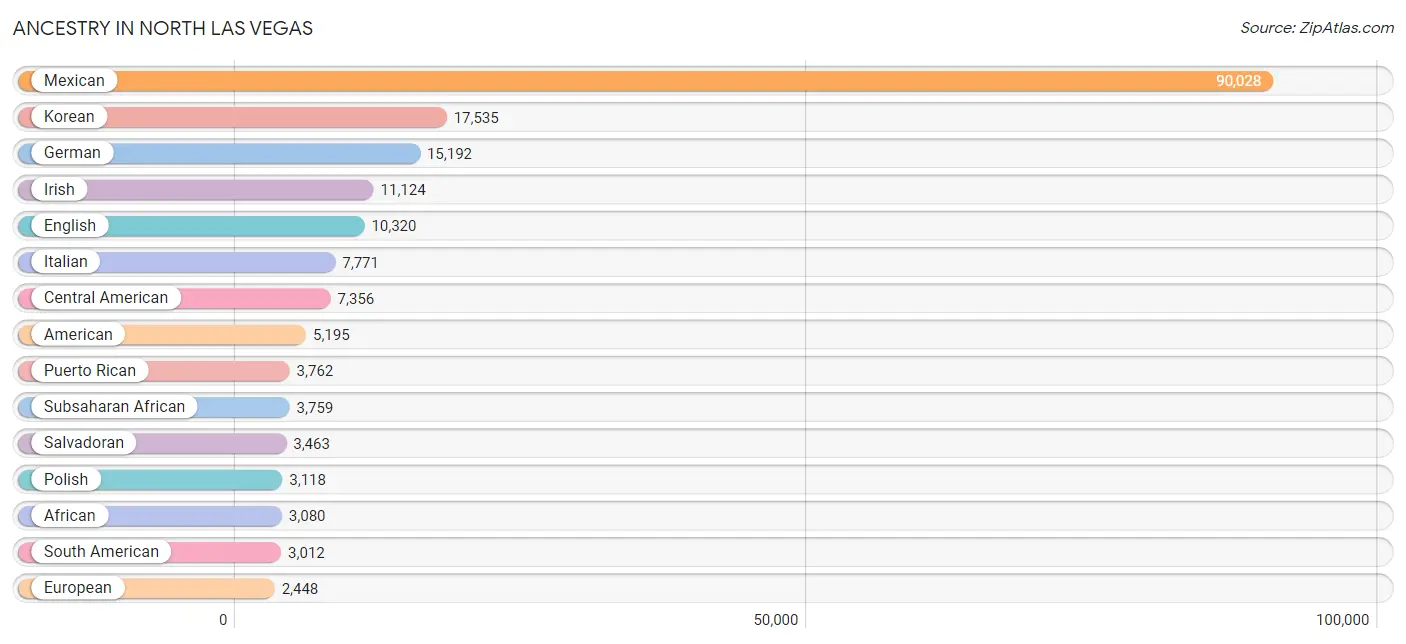
Ancestry in North Las Vegas
The most populous ancestries reported in North Las Vegas are Mexican (90,028 | 34.1%), Korean (17,535 | 6.6%), German (15,192 | 5.8%), Irish (11,124 | 4.2%), and English (10,320 | 3.9%), together accounting for 54.6% of all North Las Vegas residents.
| Ancestry | # Population | % Population |
| Afghan | 81 | 0.0% |
| African | 3,080 | 1.2% |
| Alaska Native | 100 | 0.0% |
| Aleut | 9 | 0.0% |
| American | 5,195 | 2.0% |
| Apache | 334 | 0.1% |
| Arab | 411 | 0.2% |
| Argentinean | 196 | 0.1% |
| Armenian | 84 | 0.0% |
| Assyrian / Chaldean / Syriac | 33 | 0.0% |
| Australian | 90 | 0.0% |
| Austrian | 612 | 0.2% |
| Bahamian | 15 | 0.0% |
| Bangladeshi | 12 | 0.0% |
| Barbadian | 22 | 0.0% |
| Basque | 52 | 0.0% |
| Belgian | 202 | 0.1% |
| Belizean | 208 | 0.1% |
| Bhutanese | 2,447 | 0.9% |
| Blackfeet | 332 | 0.1% |
| Bolivian | 90 | 0.0% |
| Brazilian | 150 | 0.1% |
| British | 879 | 0.3% |
| Burmese | 733 | 0.3% |
| Cajun | 13 | 0.0% |
| Canadian | 366 | 0.1% |
| Cape Verdean | 87 | 0.0% |
| Celtic | 25 | 0.0% |
| Central American | 7,356 | 2.8% |
| Central American Indian | 176 | 0.1% |
| Cherokee | 965 | 0.4% |
| Cheyenne | 3 | 0.0% |
| Chickasaw | 37 | 0.0% |
| Chilean | 93 | 0.0% |
| Chippewa | 55 | 0.0% |
| Choctaw | 468 | 0.2% |
| Colombian | 812 | 0.3% |
| Comanche | 108 | 0.0% |
| Costa Rican | 146 | 0.1% |
| Croatian | 206 | 0.1% |
| Cuban | 1,618 | 0.6% |
| Czech | 399 | 0.2% |
| Czechoslovakian | 33 | 0.0% |
| Danish | 951 | 0.4% |
| Dominican | 514 | 0.2% |
| Dutch | 1,246 | 0.5% |
| Eastern European | 225 | 0.1% |
| Ecuadorian | 474 | 0.2% |
| Egyptian | 21 | 0.0% |
| English | 10,320 | 3.9% |
| Ethiopian | 44 | 0.0% |
| European | 2,448 | 0.9% |
| Filipino | 76 | 0.0% |
| Finnish | 261 | 0.1% |
| French | 2,370 | 0.9% |
| French American Indian | 9 | 0.0% |
| French Canadian | 400 | 0.2% |
| German | 15,192 | 5.8% |
| Ghanaian | 15 | 0.0% |
| Greek | 235 | 0.1% |
| Guamanian / Chamorro | 864 | 0.3% |
| Guatemalan | 2,218 | 0.8% |
| Guyanese | 15 | 0.0% |
| Haitian | 110 | 0.0% |
| Honduran | 594 | 0.2% |
| Hopi | 6 | 0.0% |
| Hungarian | 539 | 0.2% |
| Icelander | 10 | 0.0% |
| Indian (Asian) | 1,927 | 0.7% |
| Inupiat | 16 | 0.0% |
| Iranian | 22 | 0.0% |
| Iraqi | 94 | 0.0% |
| Irish | 11,124 | 4.2% |
| Iroquois | 86 | 0.0% |
| Israeli | 81 | 0.0% |
| Italian | 7,771 | 2.9% |
| Jamaican | 180 | 0.1% |
| Japanese | 11 | 0.0% |
| Kenyan | 22 | 0.0% |
| Kiowa | 88 | 0.0% |
| Korean | 17,535 | 6.6% |
| Laotian | 15 | 0.0% |
| Latvian | 17 | 0.0% |
| Lebanese | 167 | 0.1% |
| Lithuanian | 210 | 0.1% |
| Malaysian | 297 | 0.1% |
| Maltese | 5 | 0.0% |
| Menominee | 4 | 0.0% |
| Mexican | 90,028 | 34.1% |
| Mexican American Indian | 1,034 | 0.4% |
| Mongolian | 7 | 0.0% |
| Moroccan | 10 | 0.0% |
| Native Hawaiian | 2,330 | 0.9% |
| Navajo | 229 | 0.1% |
| New Zealander | 54 | 0.0% |
| Nicaraguan | 448 | 0.2% |
| Nigerian | 328 | 0.1% |
| Northern European | 145 | 0.1% |
| Norwegian | 1,652 | 0.6% |
| Osage | 80 | 0.0% |
| Paiute | 52 | 0.0% |
| Pakistani | 634 | 0.2% |
| Palestinian | 12 | 0.0% |
| Panamanian | 390 | 0.2% |
| Pennsylvania German | 15 | 0.0% |
| Peruvian | 996 | 0.4% |
| Pima | 19 | 0.0% |
| Polish | 3,118 | 1.2% |
| Portuguese | 873 | 0.3% |
| Pueblo | 78 | 0.0% |
| Puerto Rican | 3,762 | 1.4% |
| Romanian | 94 | 0.0% |
| Russian | 818 | 0.3% |
| Salvadoran | 3,463 | 1.3% |
| Samoan | 1,671 | 0.6% |
| Scandinavian | 370 | 0.1% |
| Scotch-Irish | 645 | 0.2% |
| Scottish | 2,189 | 0.8% |
| Seminole | 74 | 0.0% |
| Serbian | 12 | 0.0% |
| Sioux | 33 | 0.0% |
| Slavic | 70 | 0.0% |
| Slovak | 100 | 0.0% |
| Slovene | 60 | 0.0% |
| South African | 13 | 0.0% |
| South American | 3,012 | 1.1% |
| South American Indian | 92 | 0.0% |
| Spaniard | 889 | 0.3% |
| Spanish | 1,102 | 0.4% |
| Sri Lankan | 822 | 0.3% |
| Subsaharan African | 3,759 | 1.4% |
| Sudanese | 75 | 0.0% |
| Swedish | 1,203 | 0.5% |
| Swiss | 621 | 0.2% |
| Thai | 720 | 0.3% |
| Tongan | 136 | 0.1% |
| Trinidadian and Tobagonian | 190 | 0.1% |
| Turkish | 53 | 0.0% |
| Ukrainian | 278 | 0.1% |
| Venezuelan | 351 | 0.1% |
| Welsh | 818 | 0.3% |
| West Indian | 117 | 0.0% |
| Yaqui | 37 | 0.0% |
| Yugoslavian | 7 | 0.0% |
| Zimbabwean | 19 | 0.0% | View All 145 Rows |
Immigrants in North Las Vegas
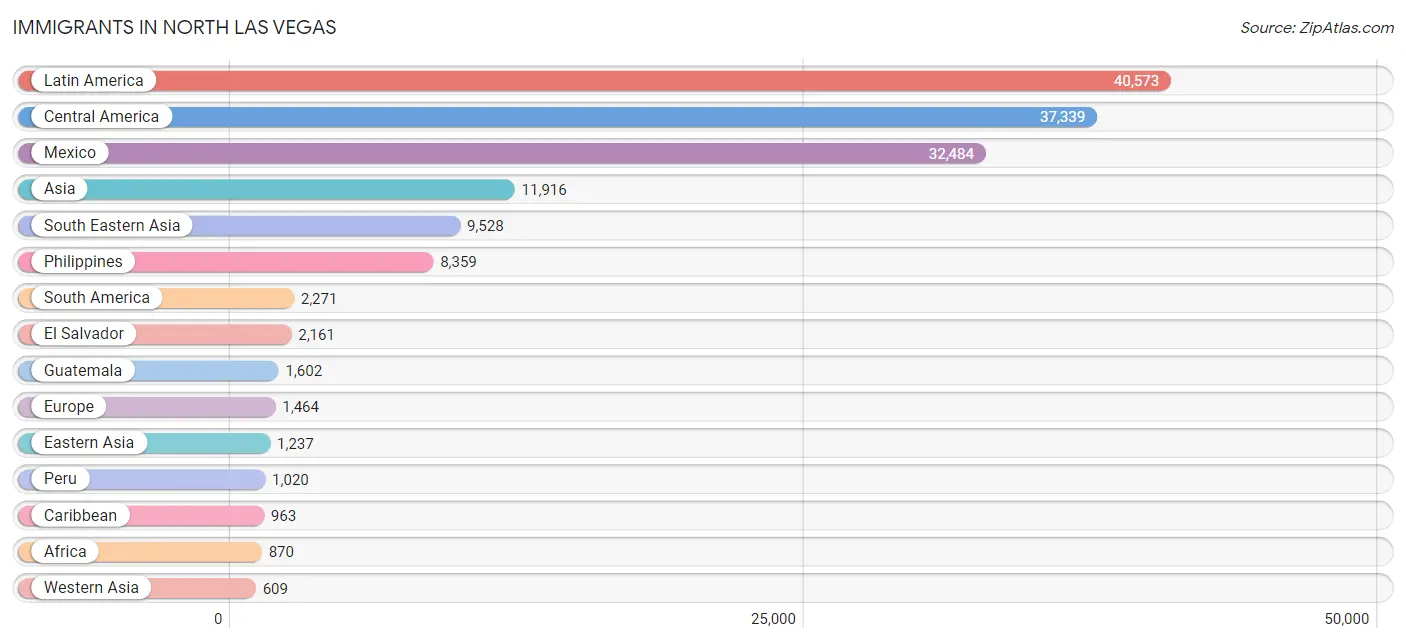
The most numerous immigrant groups reported in North Las Vegas came from Latin America (40,573 | 15.4%), Central America (37,339 | 14.1%), Mexico (32,484 | 12.3%), Asia (11,916 | 4.5%), and South Eastern Asia (9,528 | 3.6%), together accounting for 49.9% of all North Las Vegas residents.
| Immigration Origin | # Population | % Population |
| Afghanistan | 51 | 0.0% |
| Africa | 870 | 0.3% |
| Argentina | 163 | 0.1% |
| Armenia | 25 | 0.0% |
| Asia | 11,916 | 4.5% |
| Australia | 77 | 0.0% |
| Austria | 16 | 0.0% |
| Azores | 26 | 0.0% |
| Bahamas | 15 | 0.0% |
| Belarus | 14 | 0.0% |
| Belize | 196 | 0.1% |
| Bolivia | 44 | 0.0% |
| Brazil | 37 | 0.0% |
| Cambodia | 14 | 0.0% |
| Cameroon | 27 | 0.0% |
| Canada | 423 | 0.2% |
| Caribbean | 963 | 0.4% |
| Central America | 37,339 | 14.1% |
| Chile | 10 | 0.0% |
| China | 512 | 0.2% |
| Colombia | 490 | 0.2% |
| Costa Rica | 94 | 0.0% |
| Croatia | 29 | 0.0% |
| Cuba | 458 | 0.2% |
| Czechoslovakia | 47 | 0.0% |
| Dominica | 15 | 0.0% |
| Dominican Republic | 134 | 0.1% |
| Eastern Africa | 432 | 0.2% |
| Eastern Asia | 1,237 | 0.5% |
| Eastern Europe | 424 | 0.2% |
| Ecuador | 133 | 0.1% |
| Egypt | 17 | 0.0% |
| El Salvador | 2,161 | 0.8% |
| England | 144 | 0.1% |
| Ethiopia | 305 | 0.1% |
| Europe | 1,464 | 0.5% |
| France | 16 | 0.0% |
| Germany | 417 | 0.2% |
| Ghana | 55 | 0.0% |
| Greece | 17 | 0.0% |
| Guatemala | 1,602 | 0.6% |
| Haiti | 40 | 0.0% |
| Honduras | 275 | 0.1% |
| Hong Kong | 69 | 0.0% |
| Hungary | 30 | 0.0% |
| India | 120 | 0.1% |
| Indonesia | 56 | 0.0% |
| Iran | 40 | 0.0% |
| Iraq | 305 | 0.1% |
| Israel | 68 | 0.0% |
| Italy | 159 | 0.1% |
| Jamaica | 173 | 0.1% |
| Japan | 322 | 0.1% |
| Kenya | 31 | 0.0% |
| Korea | 403 | 0.2% |
| Laos | 159 | 0.1% |
| Latin America | 40,573 | 15.4% |
| Lebanon | 7 | 0.0% |
| Malaysia | 8 | 0.0% |
| Mexico | 32,484 | 12.3% |
| Micronesia | 67 | 0.0% |
| Middle Africa | 61 | 0.0% |
| Moldova | 27 | 0.0% |
| Morocco | 8 | 0.0% |
| Nepal | 92 | 0.0% |
| Netherlands | 74 | 0.0% |
| Nicaragua | 370 | 0.1% |
| Nigeria | 85 | 0.0% |
| Northern Africa | 114 | 0.0% |
| Northern Europe | 276 | 0.1% |
| Norway | 1 | 0.0% |
| Oceania | 357 | 0.1% |
| Pakistan | 213 | 0.1% |
| Panama | 157 | 0.1% |
| Peru | 1,020 | 0.4% |
| Philippines | 8,359 | 3.2% |
| Poland | 83 | 0.0% |
| Portugal | 33 | 0.0% |
| Romania | 36 | 0.0% |
| Russia | 47 | 0.0% |
| Saudi Arabia | 37 | 0.0% |
| Scotland | 23 | 0.0% |
| Serbia | 8 | 0.0% |
| Singapore | 18 | 0.0% |
| South Africa | 46 | 0.0% |
| South America | 2,271 | 0.9% |
| South Central Asia | 531 | 0.2% |
| South Eastern Asia | 9,528 | 3.6% |
| Southern Europe | 233 | 0.1% |
| Spain | 24 | 0.0% |
| Sudan | 81 | 0.0% |
| Taiwan | 88 | 0.0% |
| Thailand | 438 | 0.2% |
| Trinidad and Tobago | 26 | 0.0% |
| Turkey | 167 | 0.1% |
| Ukraine | 96 | 0.0% |
| Uruguay | 14 | 0.0% |
| Venezuela | 360 | 0.1% |
| Vietnam | 476 | 0.2% |
| West Indies | 78 | 0.0% |
| Western Africa | 140 | 0.1% |
| Western Asia | 609 | 0.2% |
| Western Europe | 523 | 0.2% |
| Zimbabwe | 96 | 0.0% | View All 104 Rows |
Sex and Age in North Las Vegas
Sex and Age in North Las Vegas
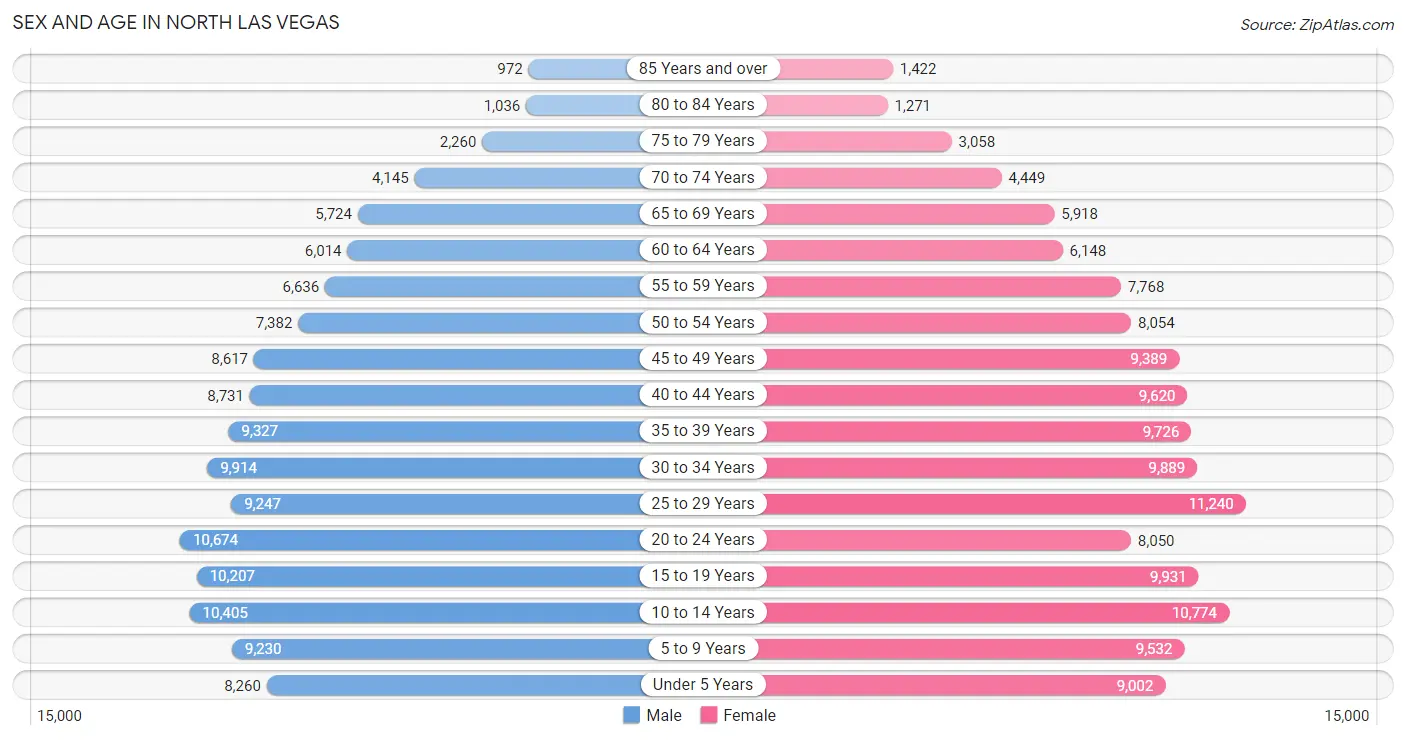
The most populous age groups in North Las Vegas are 20 to 24 Years (10,674 | 8.3%) for men and 25 to 29 Years (11,240 | 8.3%) for women.
| Age Bracket | Male | Female |
| Under 5 Years | 8,260 (6.4%) | 9,002 (6.7%) |
| 5 to 9 Years | 9,230 (7.2%) | 9,532 (7.0%) |
| 10 to 14 Years | 10,405 (8.1%) | 10,774 (8.0%) |
| 15 to 19 Years | 10,207 (7.9%) | 9,931 (7.3%) |
| 20 to 24 Years | 10,674 (8.3%) | 8,050 (5.9%) |
| 25 to 29 Years | 9,247 (7.2%) | 11,240 (8.3%) |
| 30 to 34 Years | 9,914 (7.7%) | 9,889 (7.3%) |
| 35 to 39 Years | 9,327 (7.2%) | 9,726 (7.2%) |
| 40 to 44 Years | 8,731 (6.8%) | 9,620 (7.1%) |
| 45 to 49 Years | 8,617 (6.7%) | 9,389 (6.9%) |
| 50 to 54 Years | 7,382 (5.7%) | 8,054 (6.0%) |
| 55 to 59 Years | 6,636 (5.1%) | 7,768 (5.7%) |
| 60 to 64 Years | 6,014 (4.7%) | 6,148 (4.5%) |
| 65 to 69 Years | 5,724 (4.4%) | 5,918 (4.4%) |
| 70 to 74 Years | 4,145 (3.2%) | 4,449 (3.3%) |
| 75 to 79 Years | 2,260 (1.8%) | 3,058 (2.3%) |
| 80 to 84 Years | 1,036 (0.8%) | 1,271 (0.9%) |
| 85 Years and over | 972 (0.7%) | 1,422 (1.1%) |
| Total | 128,781 (100.0%) | 135,241 (100.0%) |
Families and Households in North Las Vegas
Median Family Size in North Las Vegas
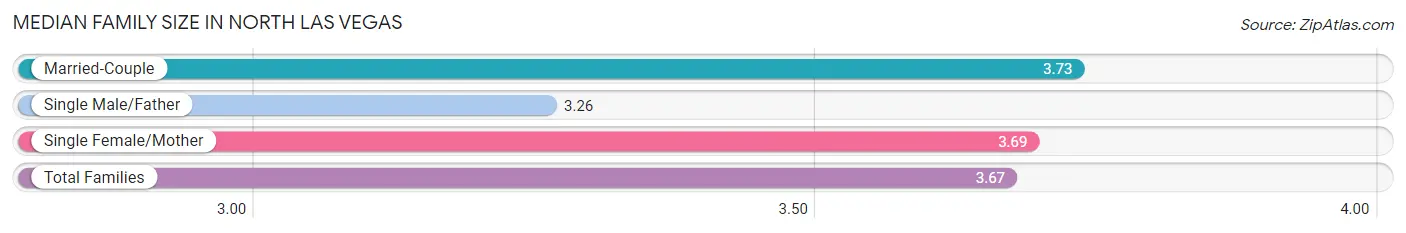
The median family size in North Las Vegas is 3.67 persons per family, with married-couple families (39,752 | 65.2%) accounting for the largest median family size of 3.73 persons per family. On the other hand, single male/father families (6,105 | 10.0%) represent the smallest median family size with 3.26 persons per family.
| Family Type | # Families | Family Size |
| Married-Couple | 39,752 (65.2%) | 3.73 |
| Single Male/Father | 6,105 (10.0%) | 3.26 |
| Single Female/Mother | 15,132 (24.8%) | 3.69 |
| Total Families | 60,989 (100.0%) | 3.67 |
Median Household Size in North Las Vegas
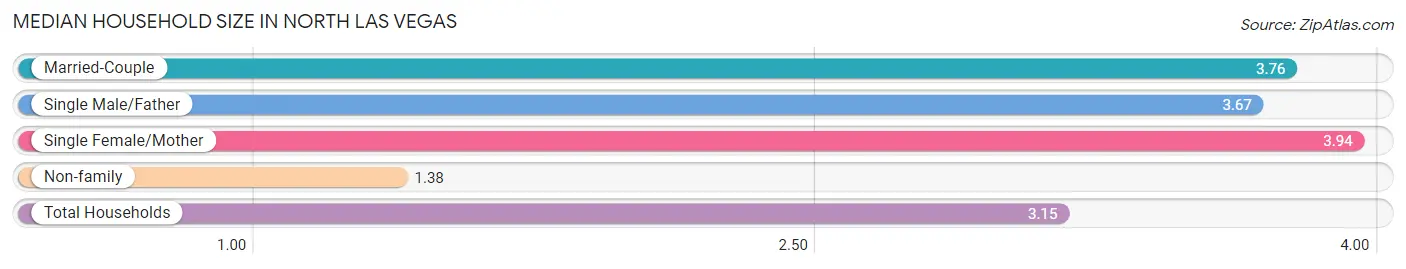
The median household size in North Las Vegas is 3.15 persons per household, with single female/mother households (15,132 | 18.2%) accounting for the largest median household size of 3.94 persons per household. non-family households (22,199 | 26.7%) represent the smallest median household size with 1.38 persons per household.
| Household Type | # Households | Household Size |
| Married-Couple | 39,752 (47.8%) | 3.76 |
| Single Male/Father | 6,105 (7.3%) | 3.67 |
| Single Female/Mother | 15,132 (18.2%) | 3.94 |
| Non-family | 22,199 (26.7%) | 1.38 |
| Total Households | 83,188 (100.0%) | 3.15 |
Household Size by Marriage Status in North Las Vegas
Out of a total of 83,188 households in North Las Vegas, 60,989 (73.3%) are family households, while 22,199 (26.7%) are nonfamily households. The most numerous type of family households are 2-person households, comprising 20,257, and the most common type of nonfamily households are 1-person households, comprising 16,373.

| Household Size | Family Households | Nonfamily Households |
| 1-Person Households | - | 16,373 (19.7%) |
| 2-Person Households | 20,257 (24.3%) | 4,907 (5.9%) |
| 3-Person Households | 14,752 (17.7%) | 647 (0.8%) |
| 4-Person Households | 11,834 (14.2%) | 148 (0.2%) |
| 5-Person Households | 7,802 (9.4%) | 91 (0.1%) |
| 6-Person Households | 3,955 (4.8%) | 33 (0.0%) |
| 7+ Person Households | 2,389 (2.9%) | 0 (0.0%) |
| Total | 60,989 (73.3%) | 22,199 (26.7%) |
Female Fertility in North Las Vegas
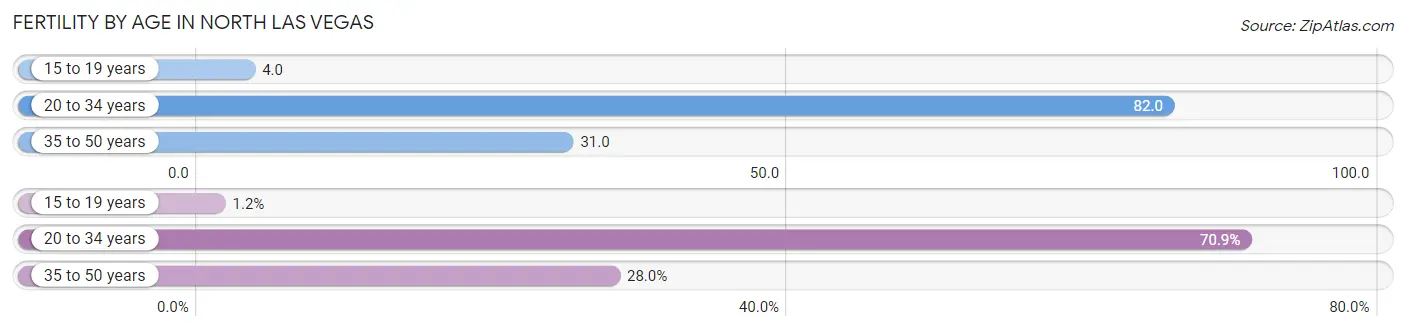
Fertility by Age in North Las Vegas
Average fertility rate in North Las Vegas is 48.0 births per 1,000 women. Women in the age bracket of 20 to 34 years have the highest fertility rate with 82.0 births per 1,000 women. Women in the age bracket of 20 to 34 years acount for 70.9% of all women with births.
| Age Bracket | Women with Births | Births / 1,000 Women |
| 15 to 19 years | 40 (1.2%) | 4.0 |
| 20 to 34 years | 2,382 (70.9%) | 82.0 |
| 35 to 50 years | 940 (28.0%) | 31.0 |
| Total | 3,362 (100.0%) | 48.0 |
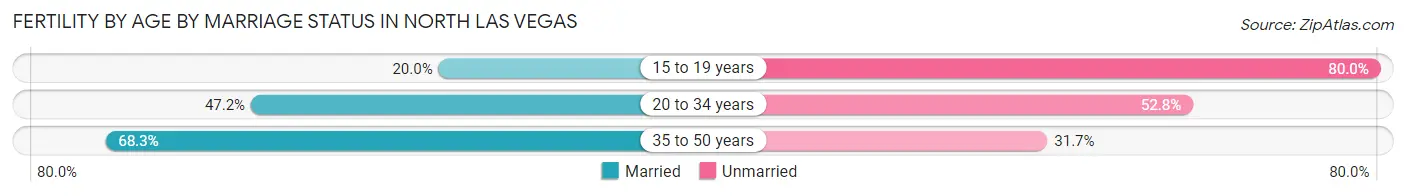
Fertility by Age by Marriage Status in North Las Vegas
52.8% of women with births (3,362) in North Las Vegas are married. The highest percentage of unmarried women with births falls into 15 to 19 years age bracket with 80.0% of them unmarried at the time of birth, while the lowest percentage of unmarried women with births belong to 35 to 50 years age bracket with 31.7% of them unmarried.
| Age Bracket | Married | Unmarried |
| 15 to 19 years | 8 (20.0%) | 32 (80.0%) |
| 20 to 34 years | 1,124 (47.2%) | 1,258 (52.8%) |
| 35 to 50 years | 642 (68.3%) | 298 (31.7%) |
| Total | 1,775 (52.8%) | 1,587 (47.2%) |
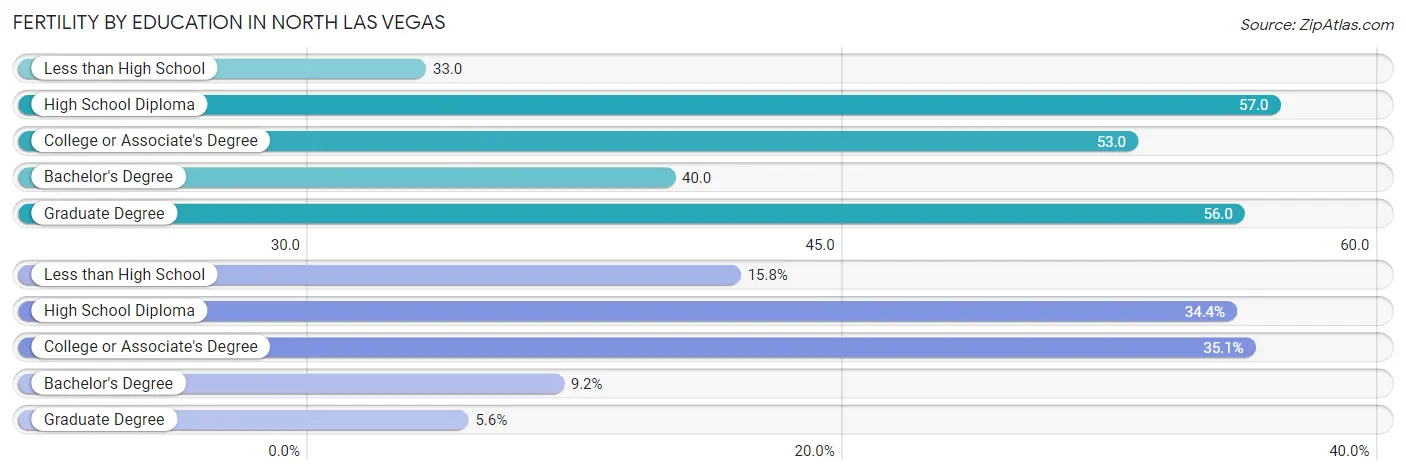
Fertility by Education in North Las Vegas
Average fertility rate in North Las Vegas is 48.0 births per 1,000 women. Women with the education attainment of high school diploma have the highest fertility rate of 57.0 births per 1,000 women, while women with the education attainment of less than high school have the lowest fertility at 33.0 births per 1,000 women. Women with the education attainment of college or associate's degree represent 35.1% of all women with births.
| Educational Attainment | Women with Births | Births / 1,000 Women |
| Less than High School | 531 (15.8%) | 33.0 |
| High School Diploma | 1,156 (34.4%) | 57.0 |
| College or Associate's Degree | 1,179 (35.1%) | 53.0 |
| Bachelor's Degree | 308 (9.2%) | 40.0 |
| Graduate Degree | 188 (5.6%) | 56.0 |
| Total | 3,362 (100.0%) | 48.0 |
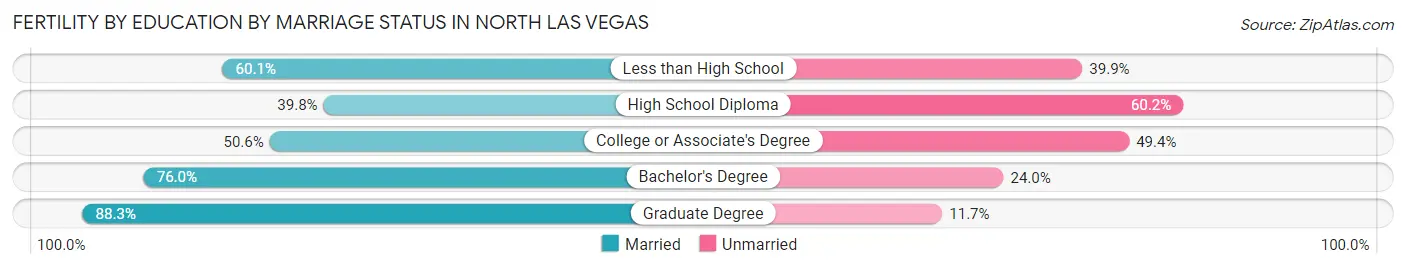
Fertility by Education by Marriage Status in North Las Vegas
47.2% of women with births in North Las Vegas are unmarried. Women with the educational attainment of graduate degree are most likely to be married with 88.3% of them married at childbirth, while women with the educational attainment of high school diploma are least likely to be married with 60.2% of them unmarried at childbirth.
| Educational Attainment | Married | Unmarried |
| Less than High School | 319 (60.1%) | 212 (39.9%) |
| High School Diploma | 460 (39.8%) | 696 (60.2%) |
| College or Associate's Degree | 597 (50.6%) | 582 (49.4%) |
| Bachelor's Degree | 234 (76.0%) | 74 (24.0%) |
| Graduate Degree | 166 (88.3%) | 22 (11.7%) |
| Total | 1,775 (52.8%) | 1,587 (47.2%) |
Employment Characteristics in North Las Vegas
Employment by Class of Employer in North Las Vegas
Among the 118,147 employed individuals in North Las Vegas, private company employees (87,099 | 73.7%), local government employees (8,333 | 7.0%), and federal government employees (7,432 | 6.3%) make up the most common classes of employment.
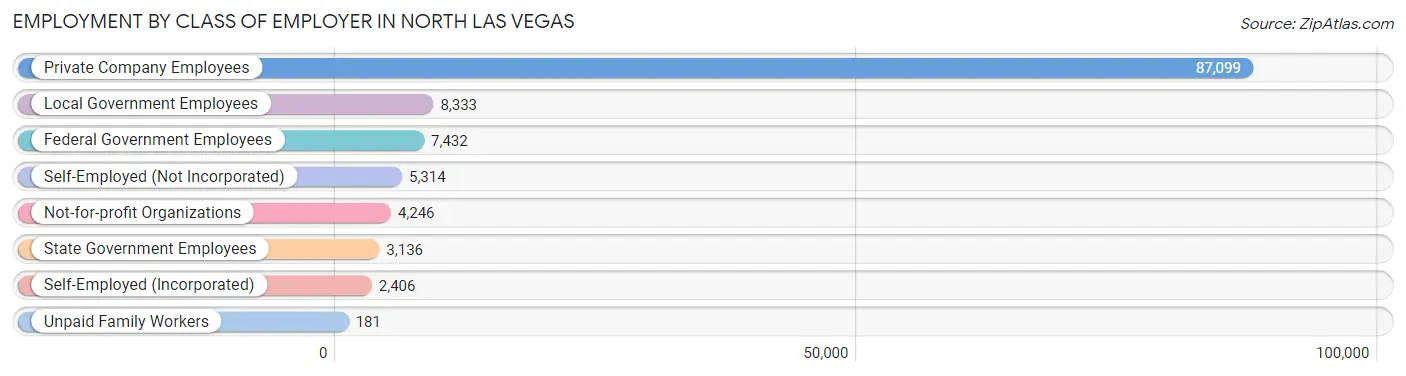
| Employer Class | # Employees | % Employees |
| Private Company Employees | 87,099 | 73.7% |
| Self-Employed (Incorporated) | 2,406 | 2.0% |
| Self-Employed (Not Incorporated) | 5,314 | 4.5% |
| Not-for-profit Organizations | 4,246 | 3.6% |
| Local Government Employees | 8,333 | 7.0% |
| State Government Employees | 3,136 | 2.6% |
| Federal Government Employees | 7,432 | 6.3% |
| Unpaid Family Workers | 181 | 0.2% |
| Total | 118,147 | 100.0% |
Employment Status by Age in North Las Vegas
According to the labor force statistics for North Las Vegas, out of the total population over 16 years of age (202,324), 65.1% or 131,713 individuals are in the labor force, with 8.4% or 11,064 of them unemployed. The age group with the highest labor force participation rate is 35 to 44 years, with 82.8% or 30,971 individuals in the labor force. Within the labor force, the 16 to 19 years age range has the highest percentage of unemployed individuals, with 22.8% or 1,181 of them being unemployed.
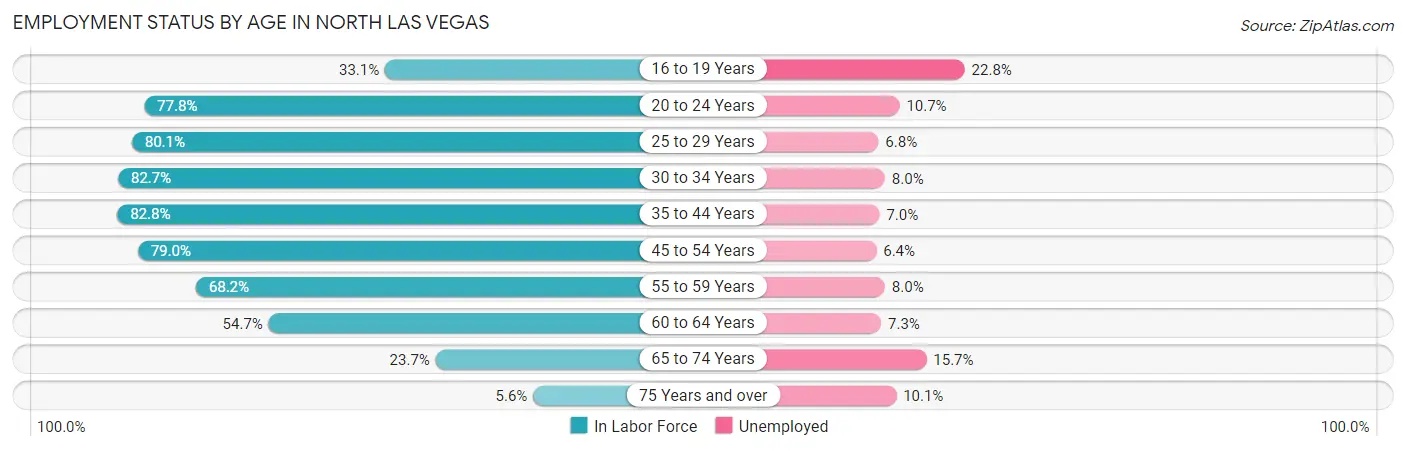
| Age Bracket | In Labor Force | Unemployed |
| 16 to 19 Years | 5,178 (33.1%) | 1,181 (22.8%) |
| 20 to 24 Years | 14,567 (77.8%) | 1,559 (10.7%) |
| 25 to 29 Years | 16,410 (80.1%) | 1,116 (6.8%) |
| 30 to 34 Years | 16,377 (82.7%) | 1,310 (8.0%) |
| 35 to 44 Years | 30,971 (82.8%) | 2,168 (7.0%) |
| 45 to 54 Years | 26,419 (79.0%) | 1,691 (6.4%) |
| 55 to 59 Years | 9,824 (68.2%) | 786 (8.0%) |
| 60 to 64 Years | 6,653 (54.7%) | 486 (7.3%) |
| 65 to 74 Years | 4,796 (23.7%) | 753 (15.7%) |
| 75 Years and over | 561 (5.6%) | 57 (10.1%) |
| Total | 131,713 (65.1%) | 11,064 (8.4%) |
Employment Status by Educational Attainment in North Las Vegas
According to labor force statistics for North Las Vegas, 77.5% of individuals (106,719) out of the total population between 25 and 64 years of age (137,702) are in the labor force, with 7.1% or 7,577 of them being unemployed. The group with the highest labor force participation rate are those with the educational attainment of bachelor's degree or higher, with 85.1% or 20,260 individuals in the labor force. Within the labor force, individuals with high school diploma education have the highest percentage of unemployment, with 8.0% or 2,806 of them being unemployed.
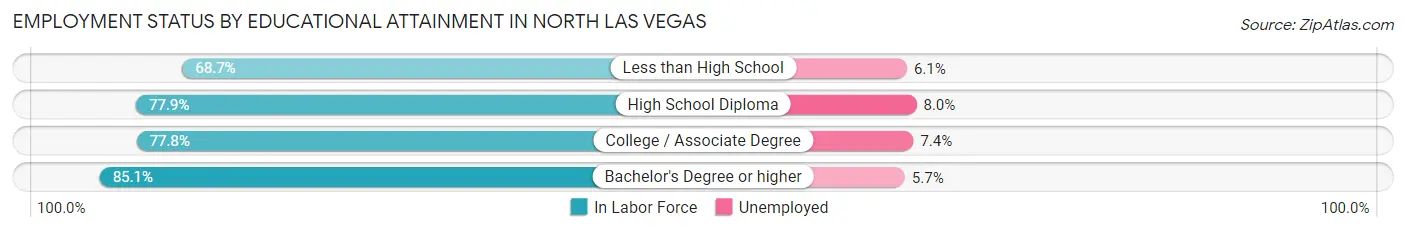
| Educational Attainment | In Labor Force | Unemployed |
| Less than High School | 17,085 (68.7%) | 1,517 (6.1%) |
| High School Diploma | 35,081 (77.9%) | 3,603 (8.0%) |
| College / Associate Degree | 34,227 (77.8%) | 3,255 (7.4%) |
| Bachelor's Degree or higher | 20,260 (85.1%) | 1,357 (5.7%) |
| Total | 106,719 (77.5%) | 9,777 (7.1%) |
Employment Occupations by Sex in North Las Vegas
Management, Business, Science and Arts Occupations
The most common Management, Business, Science and Arts occupations in North Las Vegas are Community & Social Service (9,464 | 8.0%), Management (7,164 | 6.1%), Education Instruction & Library (5,283 | 4.5%), Health Diagnosing & Treating (4,812 | 4.1%), and Business & Financial (4,590 | 3.9%).
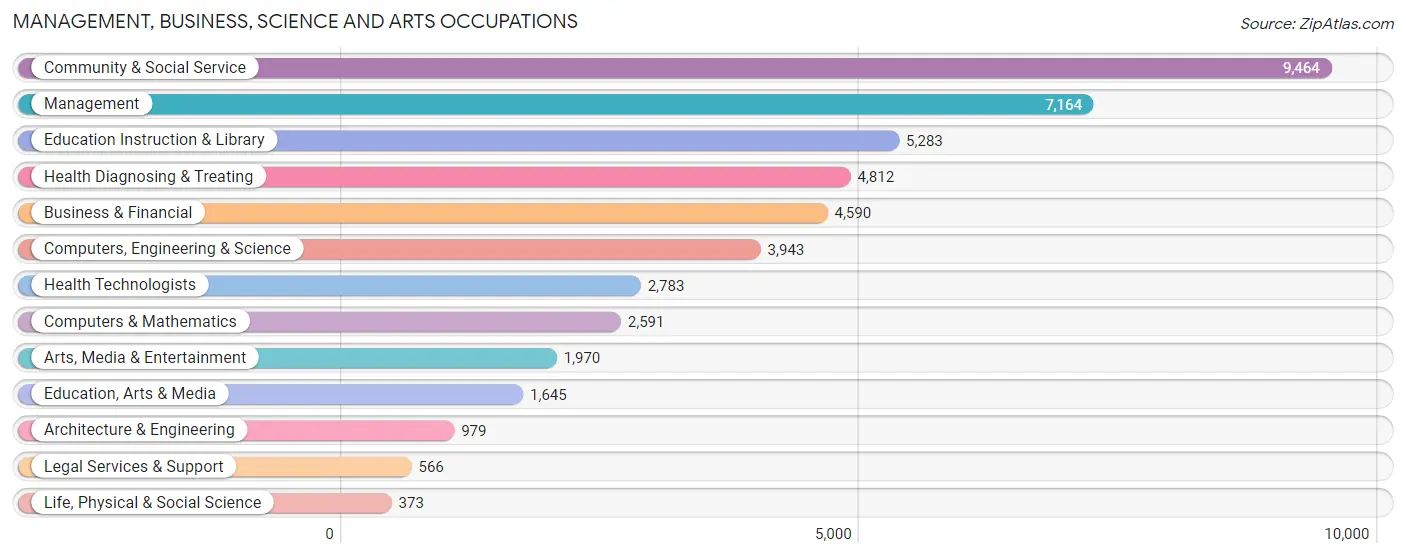
Management, Business, Science and Arts Occupations by Sex
Within the Management, Business, Science and Arts occupations in North Las Vegas, the most male-oriented occupations are Architecture & Engineering (89.8%), Computers & Mathematics (78.3%), and Computers, Engineering & Science (78.1%), while the most female-oriented occupations are Health Technologists (83.4%), Legal Services & Support (80.6%), and Education, Arts & Media (76.3%).
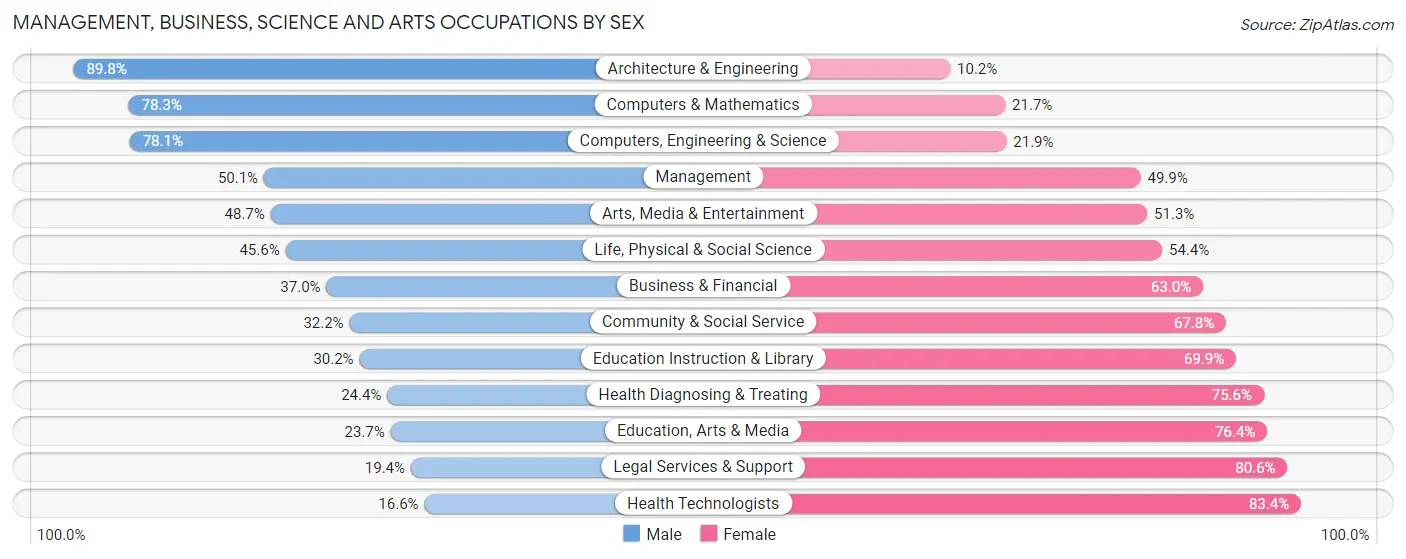
| Occupation | Male | Female |
| Management | 3,587 (50.1%) | 3,577 (49.9%) |
| Business & Financial | 1,700 (37.0%) | 2,890 (63.0%) |
| Computers, Engineering & Science | 3,078 (78.1%) | 865 (21.9%) |
| Computers & Mathematics | 2,029 (78.3%) | 562 (21.7%) |
| Architecture & Engineering | 879 (89.8%) | 100 (10.2%) |
| Life, Physical & Social Science | 170 (45.6%) | 203 (54.4%) |
| Community & Social Service | 3,051 (32.2%) | 6,413 (67.8%) |
| Education, Arts & Media | 389 (23.6%) | 1,256 (76.3%) |
| Legal Services & Support | 110 (19.4%) | 456 (80.6%) |
| Education Instruction & Library | 1,593 (30.1%) | 3,690 (69.9%) |
| Arts, Media & Entertainment | 959 (48.7%) | 1,011 (51.3%) |
| Health Diagnosing & Treating | 1,172 (24.4%) | 3,640 (75.6%) |
| Health Technologists | 462 (16.6%) | 2,321 (83.4%) |
| Total (Category) | 12,588 (42.0%) | 17,385 (58.0%) |
| Total (Overall) | 62,552 (53.0%) | 55,491 (47.0%) |
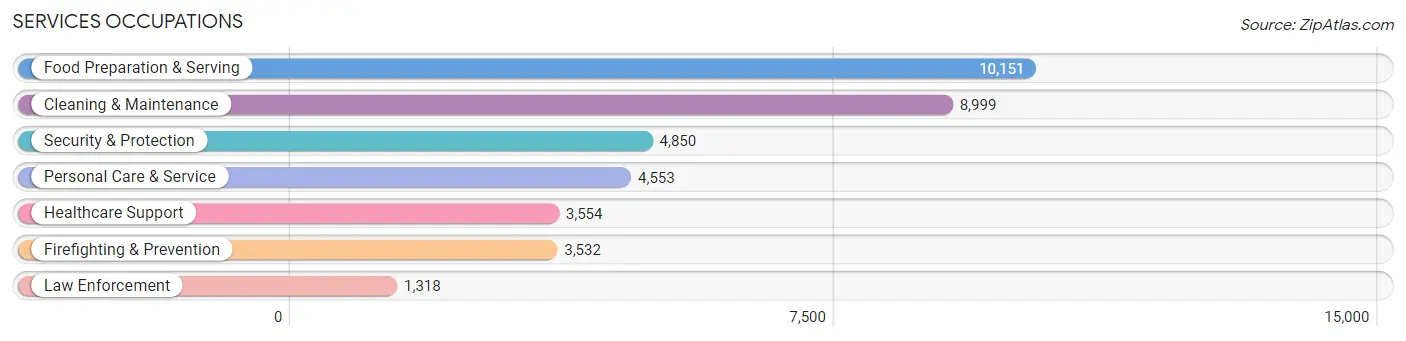
Services Occupations
The most common Services occupations in North Las Vegas are Food Preparation & Serving (10,151 | 8.6%), Cleaning & Maintenance (8,999 | 7.6%), Security & Protection (4,850 | 4.1%), Personal Care & Service (4,553 | 3.9%), and Healthcare Support (3,554 | 3.0%).
Services Occupations by Sex
Within the Services occupations in North Las Vegas, the most male-oriented occupations are Law Enforcement (78.0%), Security & Protection (74.3%), and Firefighting & Prevention (72.9%), while the most female-oriented occupations are Healthcare Support (78.8%), Personal Care & Service (56.7%), and Cleaning & Maintenance (49.3%).
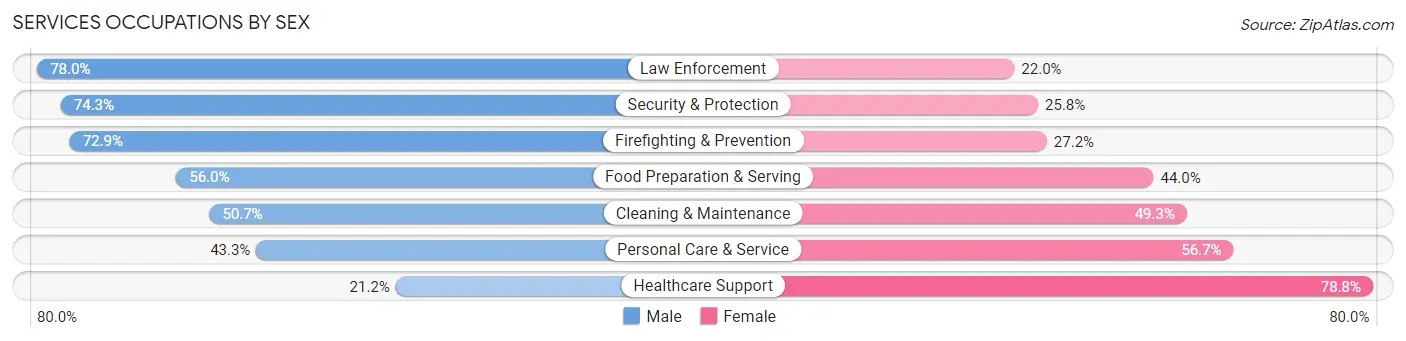
| Occupation | Male | Female |
| Healthcare Support | 754 (21.2%) | 2,800 (78.8%) |
| Security & Protection | 3,601 (74.3%) | 1,249 (25.8%) |
| Firefighting & Prevention | 2,573 (72.9%) | 959 (27.2%) |
| Law Enforcement | 1,028 (78.0%) | 290 (22.0%) |
| Food Preparation & Serving | 5,681 (56.0%) | 4,470 (44.0%) |
| Cleaning & Maintenance | 4,563 (50.7%) | 4,436 (49.3%) |
| Personal Care & Service | 1,972 (43.3%) | 2,581 (56.7%) |
| Total (Category) | 16,571 (51.6%) | 15,536 (48.4%) |
| Total (Overall) | 62,552 (53.0%) | 55,491 (47.0%) |
Sales and Office Occupations
The most common Sales and Office occupations in North Las Vegas are Office & Administration (15,006 | 12.7%), and Sales & Related (10,516 | 8.9%).
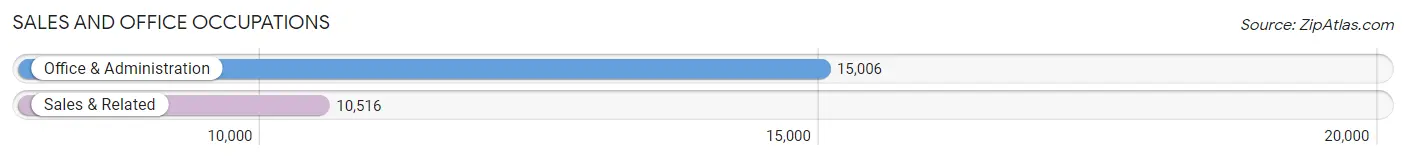
Sales and Office Occupations by Sex
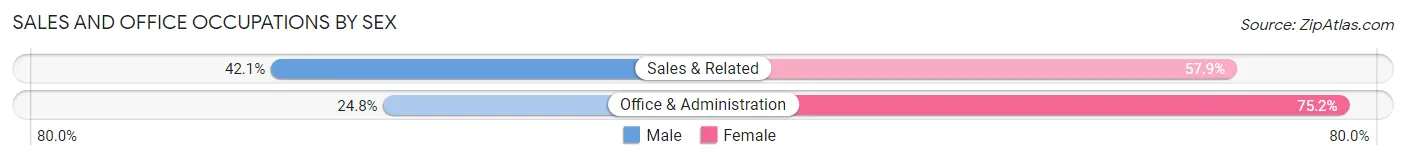
| Occupation | Male | Female |
| Sales & Related | 4,425 (42.1%) | 6,091 (57.9%) |
| Office & Administration | 3,721 (24.8%) | 11,285 (75.2%) |
| Total (Category) | 8,146 (31.9%) | 17,376 (68.1%) |
| Total (Overall) | 62,552 (53.0%) | 55,491 (47.0%) |
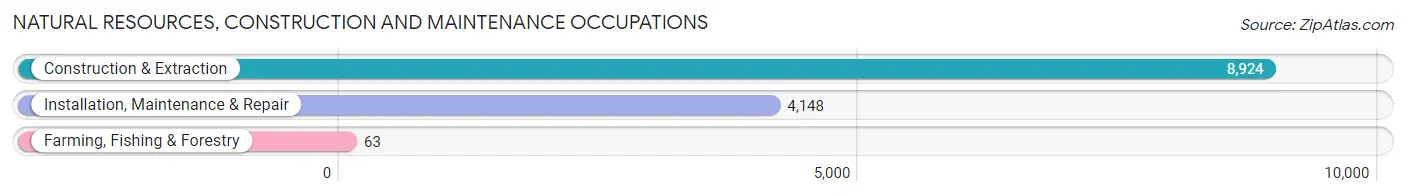
Natural Resources, Construction and Maintenance Occupations
The most common Natural Resources, Construction and Maintenance occupations in North Las Vegas are Construction & Extraction (8,924 | 7.6%), Installation, Maintenance & Repair (4,148 | 3.5%), and Farming, Fishing & Forestry (63 | 0.1%).
Natural Resources, Construction and Maintenance Occupations by Sex
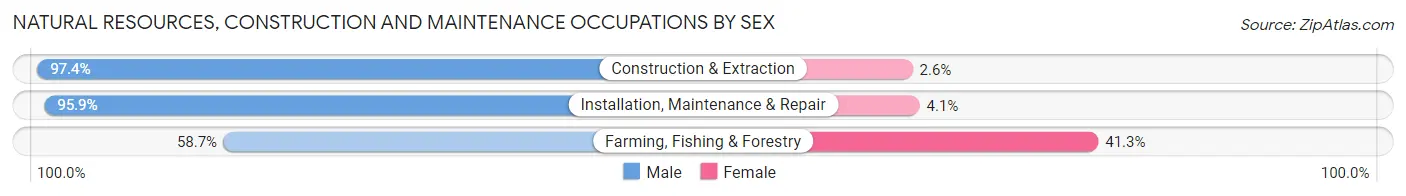
| Occupation | Male | Female |
| Farming, Fishing & Forestry | 37 (58.7%) | 26 (41.3%) |
| Construction & Extraction | 8,688 (97.4%) | 236 (2.6%) |
| Installation, Maintenance & Repair | 3,978 (95.9%) | 170 (4.1%) |
| Total (Category) | 12,703 (96.7%) | 432 (3.3%) |
| Total (Overall) | 62,552 (53.0%) | 55,491 (47.0%) |
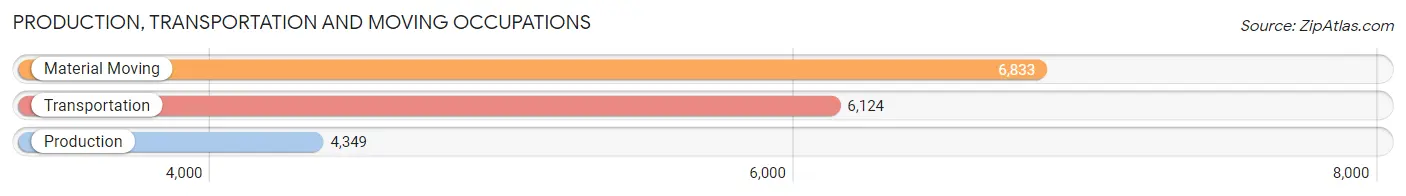
Production, Transportation and Moving Occupations
The most common Production, Transportation and Moving occupations in North Las Vegas are Material Moving (6,833 | 5.8%), Transportation (6,124 | 5.2%), and Production (4,349 | 3.7%).
Production, Transportation and Moving Occupations by Sex
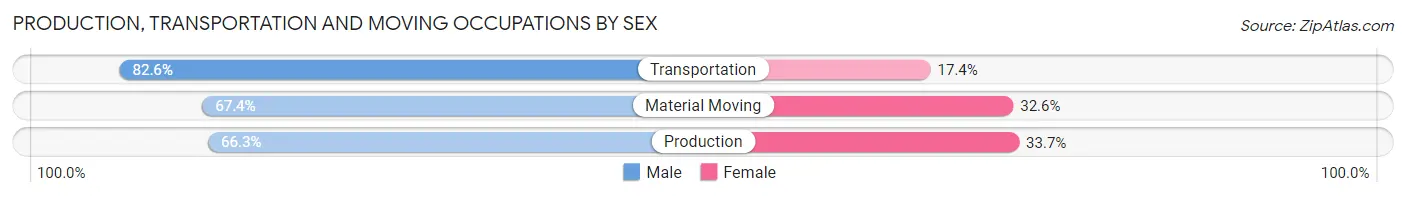
| Occupation | Male | Female |
| Production | 2,884 (66.3%) | 1,465 (33.7%) |
| Transportation | 5,056 (82.6%) | 1,068 (17.4%) |
| Material Moving | 4,604 (67.4%) | 2,229 (32.6%) |
| Total (Category) | 12,544 (72.5%) | 4,762 (27.5%) |
| Total (Overall) | 62,552 (53.0%) | 55,491 (47.0%) |
Employment Industries by Sex in North Las Vegas
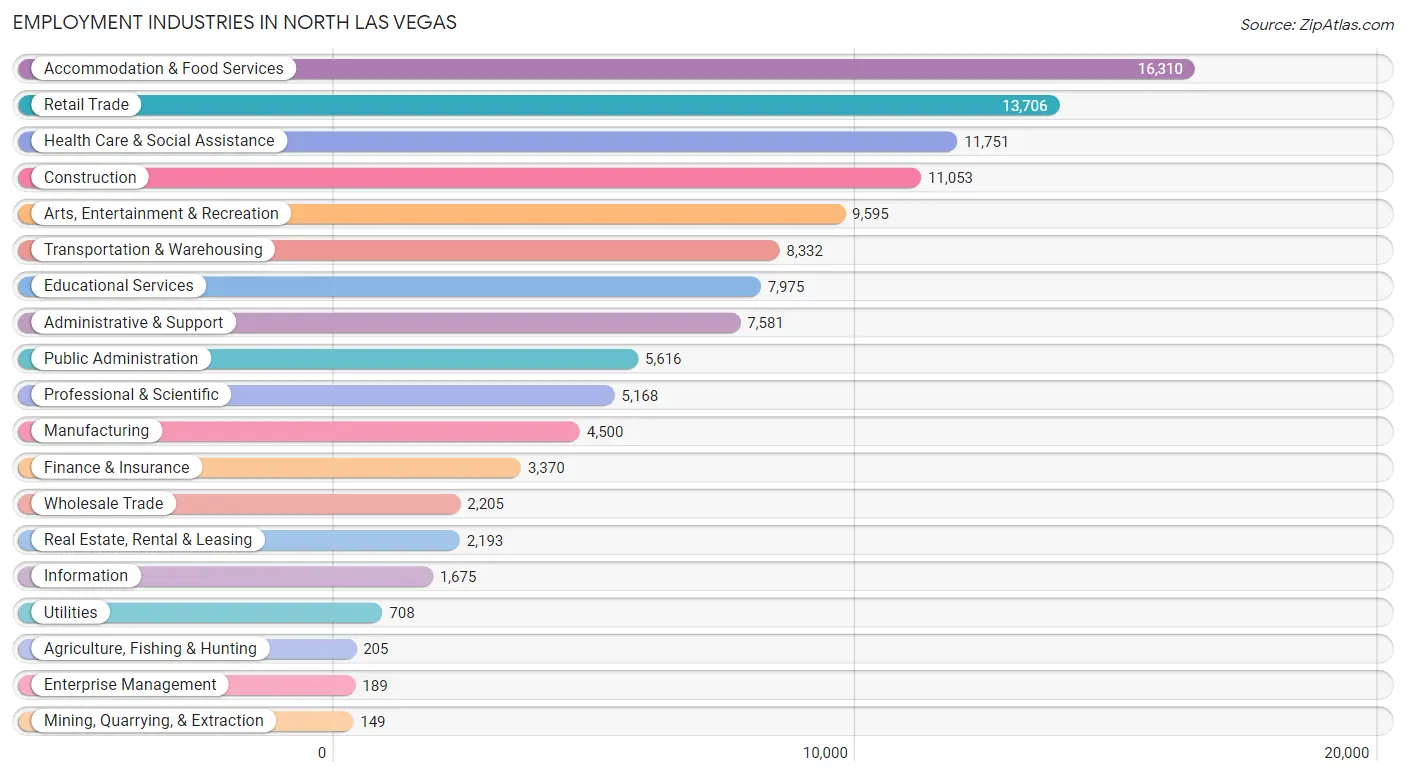
Employment Industries in North Las Vegas
The major employment industries in North Las Vegas include Accommodation & Food Services (16,310 | 13.8%), Retail Trade (13,706 | 11.6%), Health Care & Social Assistance (11,751 | 10.0%), Construction (11,053 | 9.4%), and Arts, Entertainment & Recreation (9,595 | 8.1%).
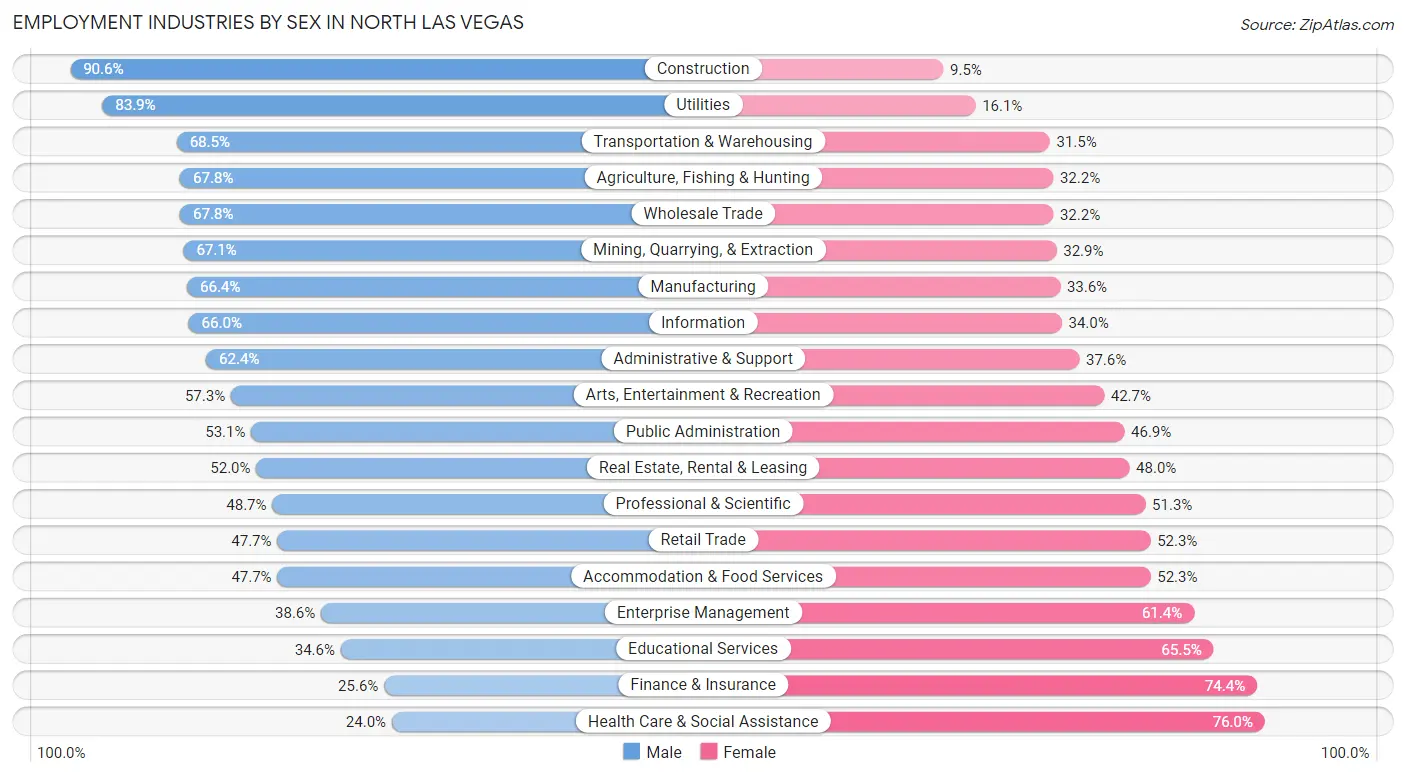
Employment Industries by Sex in North Las Vegas
The North Las Vegas industries that see more men than women are Construction (90.5%), Utilities (83.9%), and Transportation & Warehousing (68.5%), whereas the industries that tend to have a higher number of women are Health Care & Social Assistance (76.0%), Finance & Insurance (74.4%), and Educational Services (65.4%).
| Industry | Male | Female |
| Agriculture, Fishing & Hunting | 139 (67.8%) | 66 (32.2%) |
| Mining, Quarrying, & Extraction | 100 (67.1%) | 49 (32.9%) |
| Construction | 10,009 (90.5%) | 1,044 (9.5%) |
| Manufacturing | 2,986 (66.4%) | 1,514 (33.6%) |
| Wholesale Trade | 1,495 (67.8%) | 710 (32.2%) |
| Retail Trade | 6,535 (47.7%) | 7,171 (52.3%) |
| Transportation & Warehousing | 5,708 (68.5%) | 2,624 (31.5%) |
| Utilities | 594 (83.9%) | 114 (16.1%) |
| Information | 1,106 (66.0%) | 569 (34.0%) |
| Finance & Insurance | 862 (25.6%) | 2,508 (74.4%) |
| Real Estate, Rental & Leasing | 1,141 (52.0%) | 1,052 (48.0%) |
| Professional & Scientific | 2,518 (48.7%) | 2,650 (51.3%) |
| Enterprise Management | 73 (38.6%) | 116 (61.4%) |
| Administrative & Support | 4,731 (62.4%) | 2,850 (37.6%) |
| Educational Services | 2,755 (34.5%) | 5,220 (65.4%) |
| Health Care & Social Assistance | 2,817 (24.0%) | 8,934 (76.0%) |
| Arts, Entertainment & Recreation | 5,496 (57.3%) | 4,099 (42.7%) |
| Accommodation & Food Services | 7,774 (47.7%) | 8,536 (52.3%) |
| Public Administration | 2,981 (53.1%) | 2,635 (46.9%) |
| Total | 62,552 (53.0%) | 55,491 (47.0%) |
Education in North Las Vegas
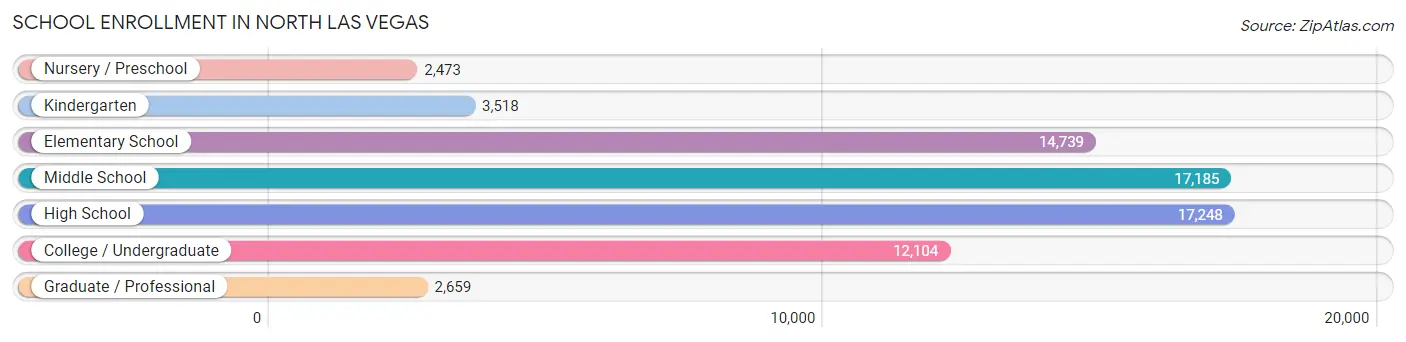
School Enrollment in North Las Vegas
The most common levels of schooling among the 69,926 students in North Las Vegas are high school (17,248 | 24.7%), middle school (17,185 | 24.6%), and elementary school (14,739 | 21.1%).
| School Level | # Students | % Students |
| Nursery / Preschool | 2,473 | 3.5% |
| Kindergarten | 3,518 | 5.0% |
| Elementary School | 14,739 | 21.1% |
| Middle School | 17,185 | 24.6% |
| High School | 17,248 | 24.7% |
| College / Undergraduate | 12,104 | 17.3% |
| Graduate / Professional | 2,659 | 3.8% |
| Total | 69,926 | 100.0% |
School Enrollment by Age by Funding Source in North Las Vegas
Out of a total of 69,926 students who are enrolled in schools in North Las Vegas, 8,461 (12.1%) attend a private institution, while the remaining 61,465 (87.9%) are enrolled in public schools. The age group of 3 to 4 year olds has the highest likelihood of being enrolled in private schools, with 827 (44.4% in the age bracket) enrolled. Conversely, the age group of 15 to 17 year olds has the lowest likelihood of being enrolled in a private school, with 12,128 (96.4% in the age bracket) attending a public institution.
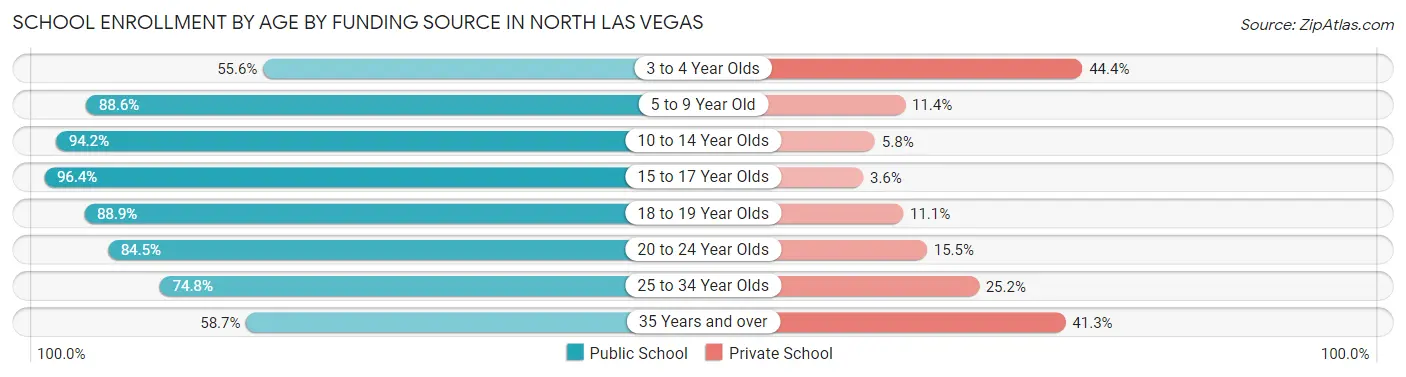
| Age Bracket | Public School | Private School |
| 3 to 4 Year Olds | 1,034 (55.6%) | 827 (44.4%) |
| 5 to 9 Year Old | 15,570 (88.6%) | 2,009 (11.4%) |
| 10 to 14 Year Olds | 19,308 (94.2%) | 1,194 (5.8%) |
| 15 to 17 Year Olds | 12,128 (96.4%) | 454 (3.6%) |
| 18 to 19 Year Olds | 3,586 (88.9%) | 446 (11.1%) |
| 20 to 24 Year Olds | 4,520 (84.5%) | 828 (15.5%) |
| 25 to 34 Year Olds | 2,983 (74.8%) | 1,003 (25.2%) |
| 35 Years and over | 2,369 (58.7%) | 1,667 (41.3%) |
| Total | 61,465 (87.9%) | 8,461 (12.1%) |
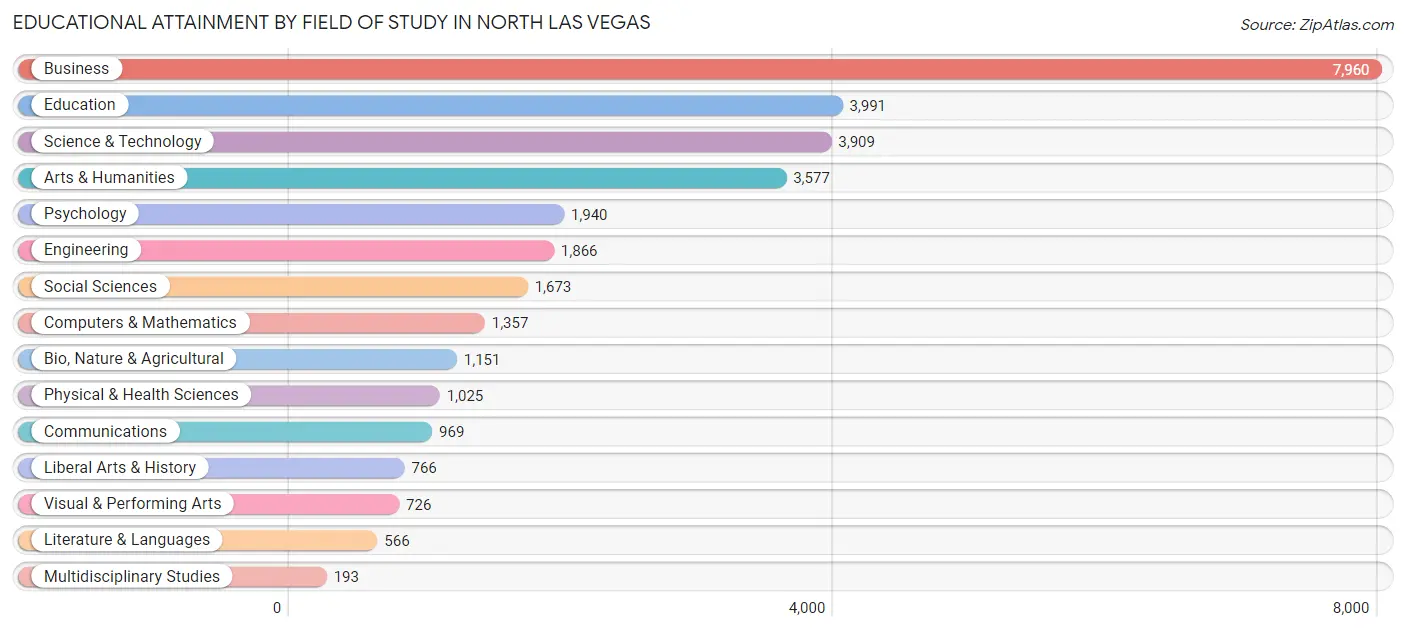
Educational Attainment by Field of Study in North Las Vegas
Business (7,960 | 25.1%), education (3,991 | 12.6%), science & technology (3,909 | 12.3%), arts & humanities (3,577 | 11.3%), and psychology (1,940 | 6.1%) are the most common fields of study among 31,669 individuals in North Las Vegas who have obtained a bachelor's degree or higher.
| Field of Study | # Graduates | % Graduates |
| Computers & Mathematics | 1,357 | 4.3% |
| Bio, Nature & Agricultural | 1,151 | 3.6% |
| Physical & Health Sciences | 1,025 | 3.2% |
| Psychology | 1,940 | 6.1% |
| Social Sciences | 1,673 | 5.3% |
| Engineering | 1,866 | 5.9% |
| Multidisciplinary Studies | 193 | 0.6% |
| Science & Technology | 3,909 | 12.3% |
| Business | 7,960 | 25.1% |
| Education | 3,991 | 12.6% |
| Literature & Languages | 566 | 1.8% |
| Liberal Arts & History | 766 | 2.4% |
| Visual & Performing Arts | 726 | 2.3% |
| Communications | 969 | 3.1% |
| Arts & Humanities | 3,577 | 11.3% |
| Total | 31,669 | 100.0% |
Transportation & Commute in North Las Vegas
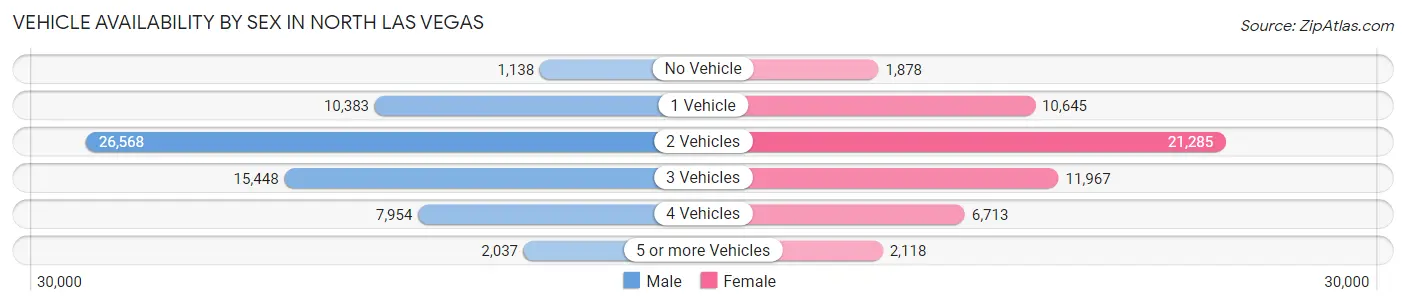
Vehicle Availability by Sex in North Las Vegas
The most prevalent vehicle ownership categories in North Las Vegas are males with 2 vehicles (26,568, accounting for 41.8%) and females with 2 vehicles (21,285, making up 48.6%).
| Vehicles Available | Male | Female |
| No Vehicle | 1,138 (1.8%) | 1,878 (3.4%) |
| 1 Vehicle | 10,383 (16.3%) | 10,645 (19.5%) |
| 2 Vehicles | 26,568 (41.8%) | 21,285 (39.0%) |
| 3 Vehicles | 15,448 (24.3%) | 11,967 (21.9%) |
| 4 Vehicles | 7,954 (12.5%) | 6,713 (12.3%) |
| 5 or more Vehicles | 2,037 (3.2%) | 2,118 (3.9%) |
| Total | 63,528 (100.0%) | 54,606 (100.0%) |
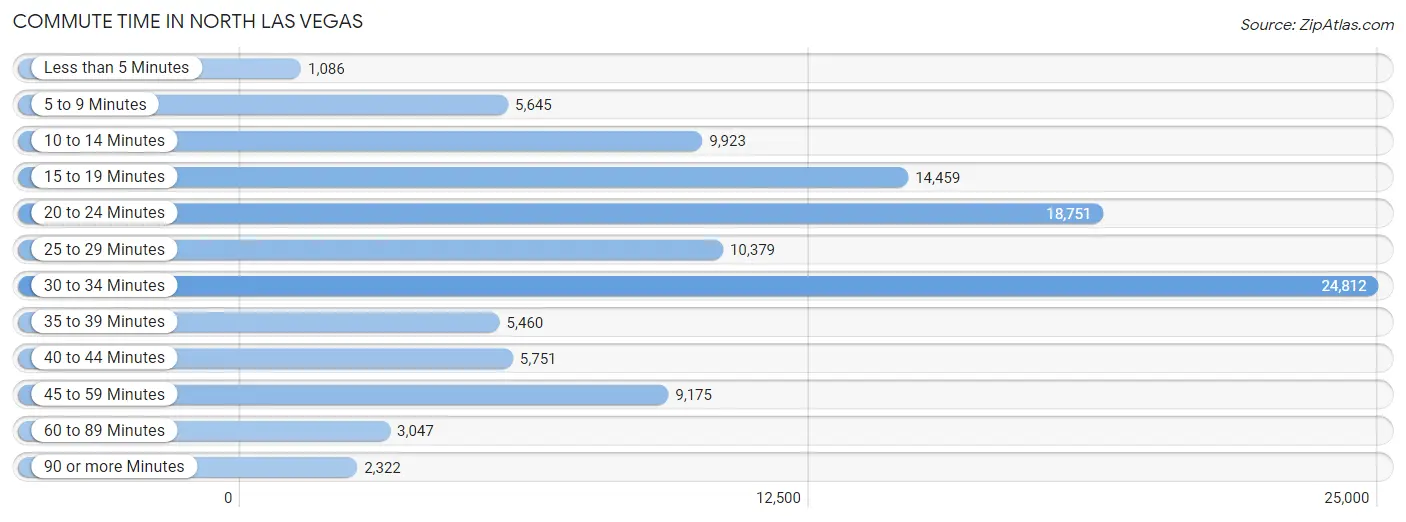
Commute Time in North Las Vegas
The most frequently occuring commute durations in North Las Vegas are 30 to 34 minutes (24,812 commuters, 22.4%), 20 to 24 minutes (18,751 commuters, 16.9%), and 15 to 19 minutes (14,459 commuters, 13.1%).
| Commute Time | # Commuters | % Commuters |
| Less than 5 Minutes | 1,086 | 1.0% |
| 5 to 9 Minutes | 5,645 | 5.1% |
| 10 to 14 Minutes | 9,923 | 8.9% |
| 15 to 19 Minutes | 14,459 | 13.1% |
| 20 to 24 Minutes | 18,751 | 16.9% |
| 25 to 29 Minutes | 10,379 | 9.4% |
| 30 to 34 Minutes | 24,812 | 22.4% |
| 35 to 39 Minutes | 5,460 | 4.9% |
| 40 to 44 Minutes | 5,751 | 5.2% |
| 45 to 59 Minutes | 9,175 | 8.3% |
| 60 to 89 Minutes | 3,047 | 2.8% |
| 90 or more Minutes | 2,322 | 2.1% |
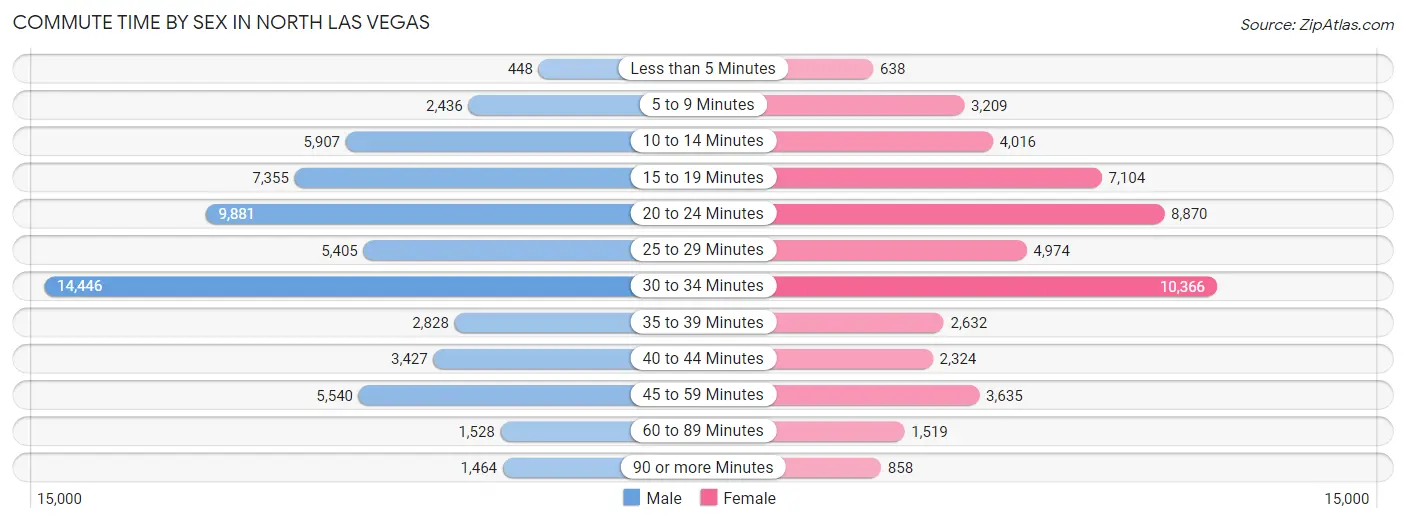
Commute Time by Sex in North Las Vegas
The most common commute times in North Las Vegas are 30 to 34 minutes (14,446 commuters, 23.8%) for males and 30 to 34 minutes (10,366 commuters, 20.7%) for females.
| Commute Time | Male | Female |
| Less than 5 Minutes | 448 (0.7%) | 638 (1.3%) |
| 5 to 9 Minutes | 2,436 (4.0%) | 3,209 (6.4%) |
| 10 to 14 Minutes | 5,907 (9.7%) | 4,016 (8.0%) |
| 15 to 19 Minutes | 7,355 (12.1%) | 7,104 (14.2%) |
| 20 to 24 Minutes | 9,881 (16.3%) | 8,870 (17.7%) |
| 25 to 29 Minutes | 5,405 (8.9%) | 4,974 (9.9%) |
| 30 to 34 Minutes | 14,446 (23.8%) | 10,366 (20.7%) |
| 35 to 39 Minutes | 2,828 (4.7%) | 2,632 (5.2%) |
| 40 to 44 Minutes | 3,427 (5.7%) | 2,324 (4.6%) |
| 45 to 59 Minutes | 5,540 (9.1%) | 3,635 (7.2%) |
| 60 to 89 Minutes | 1,528 (2.5%) | 1,519 (3.0%) |
| 90 or more Minutes | 1,464 (2.4%) | 858 (1.7%) |
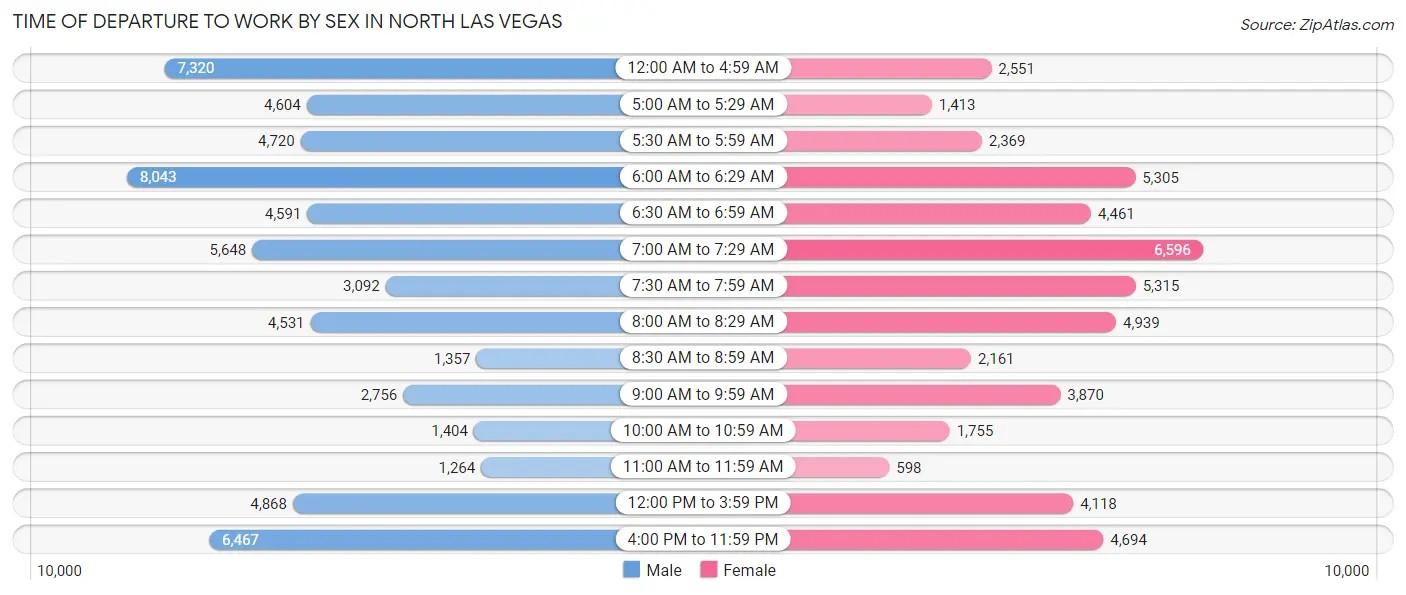
Time of Departure to Work by Sex in North Las Vegas
The most frequent times of departure to work in North Las Vegas are 6:00 AM to 6:29 AM (8,043, 13.3%) for males and 7:00 AM to 7:29 AM (6,596, 13.2%) for females.
| Time of Departure | Male | Female |
| 12:00 AM to 4:59 AM | 7,320 (12.1%) | 2,551 (5.1%) |
| 5:00 AM to 5:29 AM | 4,604 (7.6%) | 1,413 (2.8%) |
| 5:30 AM to 5:59 AM | 4,720 (7.8%) | 2,369 (4.7%) |
| 6:00 AM to 6:29 AM | 8,043 (13.3%) | 5,305 (10.6%) |
| 6:30 AM to 6:59 AM | 4,591 (7.6%) | 4,461 (8.9%) |
| 7:00 AM to 7:29 AM | 5,648 (9.3%) | 6,596 (13.2%) |
| 7:30 AM to 7:59 AM | 3,092 (5.1%) | 5,315 (10.6%) |
| 8:00 AM to 8:29 AM | 4,531 (7.5%) | 4,939 (9.9%) |
| 8:30 AM to 8:59 AM | 1,357 (2.2%) | 2,161 (4.3%) |
| 9:00 AM to 9:59 AM | 2,756 (4.5%) | 3,870 (7.7%) |
| 10:00 AM to 10:59 AM | 1,404 (2.3%) | 1,755 (3.5%) |
| 11:00 AM to 11:59 AM | 1,264 (2.1%) | 598 (1.2%) |
| 12:00 PM to 3:59 PM | 4,868 (8.0%) | 4,118 (8.2%) |
| 4:00 PM to 11:59 PM | 6,467 (10.7%) | 4,694 (9.4%) |
| Total | 60,665 (100.0%) | 50,145 (100.0%) |
Housing Occupancy in North Las Vegas
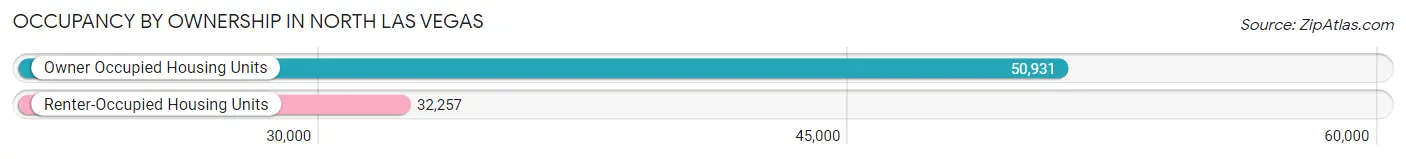
Occupancy by Ownership in North Las Vegas
Of the total 83,188 dwellings in North Las Vegas, owner-occupied units account for 50,931 (61.2%), while renter-occupied units make up 32,257 (38.8%).
| Occupancy | # Housing Units | % Housing Units |
| Owner Occupied Housing Units | 50,931 | 61.2% |
| Renter-Occupied Housing Units | 32,257 | 38.8% |
| Total Occupied Housing Units | 83,188 | 100.0% |
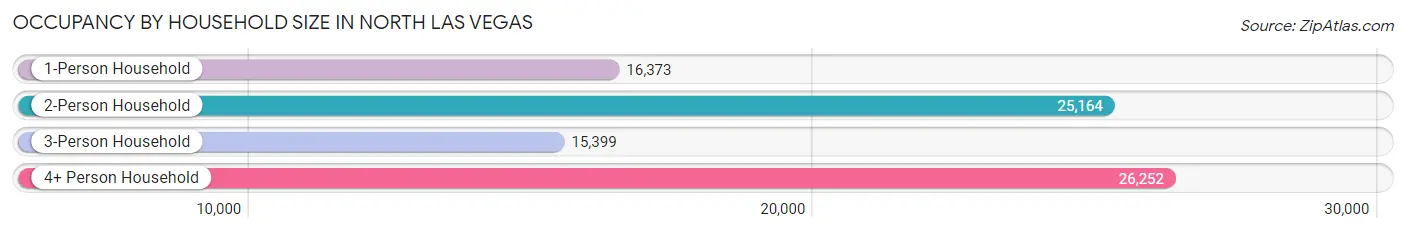
Occupancy by Household Size in North Las Vegas
| Household Size | # Housing Units | % Housing Units |
| 1-Person Household | 16,373 | 19.7% |
| 2-Person Household | 25,164 | 30.2% |
| 3-Person Household | 15,399 | 18.5% |
| 4+ Person Household | 26,252 | 31.6% |
| Total Housing Units | 83,188 | 100.0% |
Occupancy by Ownership by Household Size in North Las Vegas
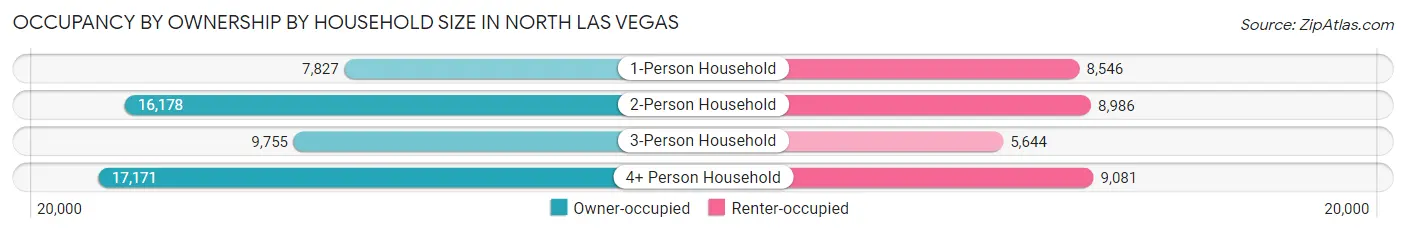
| Household Size | Owner-occupied | Renter-occupied |
| 1-Person Household | 7,827 (47.8%) | 8,546 (52.2%) |
| 2-Person Household | 16,178 (64.3%) | 8,986 (35.7%) |
| 3-Person Household | 9,755 (63.3%) | 5,644 (36.6%) |
| 4+ Person Household | 17,171 (65.4%) | 9,081 (34.6%) |
| Total Housing Units | 50,931 (61.2%) | 32,257 (38.8%) |
Occupancy by Educational Attainment in North Las Vegas
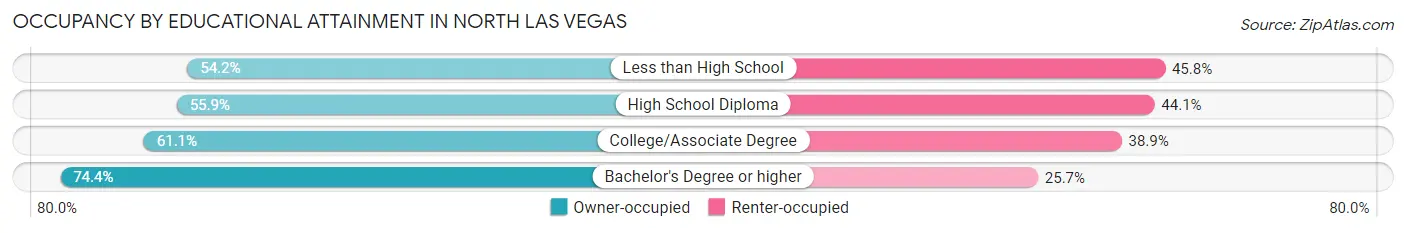
| Household Size | Owner-occupied | Renter-occupied |
| Less than High School | 7,102 (54.2%) | 6,003 (45.8%) |
| High School Diploma | 12,949 (55.9%) | 10,228 (44.1%) |
| College/Associate Degree | 18,379 (61.1%) | 11,713 (38.9%) |
| Bachelor's Degree or higher | 12,501 (74.4%) | 4,313 (25.7%) |
Occupancy by Age of Householder in North Las Vegas
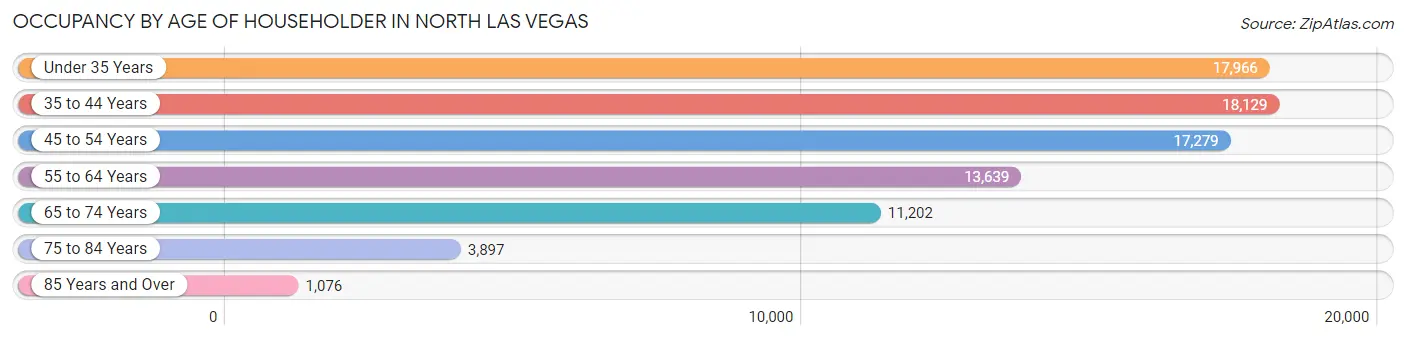
| Age Bracket | # Households | % Households |
| Under 35 Years | 17,966 | 21.6% |
| 35 to 44 Years | 18,129 | 21.8% |
| 45 to 54 Years | 17,279 | 20.8% |
| 55 to 64 Years | 13,639 | 16.4% |
| 65 to 74 Years | 11,202 | 13.5% |
| 75 to 84 Years | 3,897 | 4.7% |
| 85 Years and Over | 1,076 | 1.3% |
| Total | 83,188 | 100.0% |
Housing Finances in North Las Vegas
Median Income by Occupancy in North Las Vegas
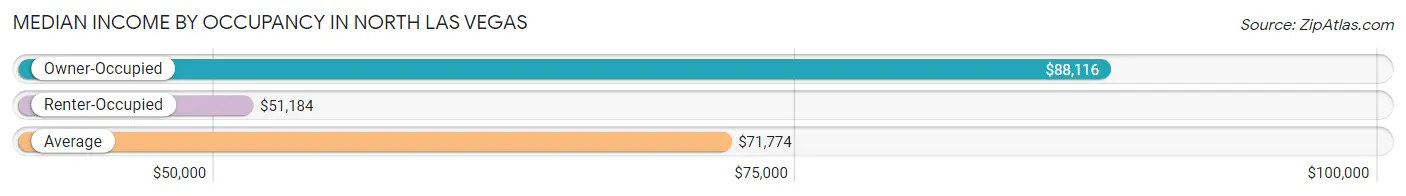
| Occupancy Type | # Households | Median Income |
| Owner-Occupied | 50,931 (61.2%) | $88,116 |
| Renter-Occupied | 32,257 (38.8%) | $51,184 |
| Average | 83,188 (100.0%) | $71,774 |
Occupancy by Householder Income Bracket in North Las Vegas
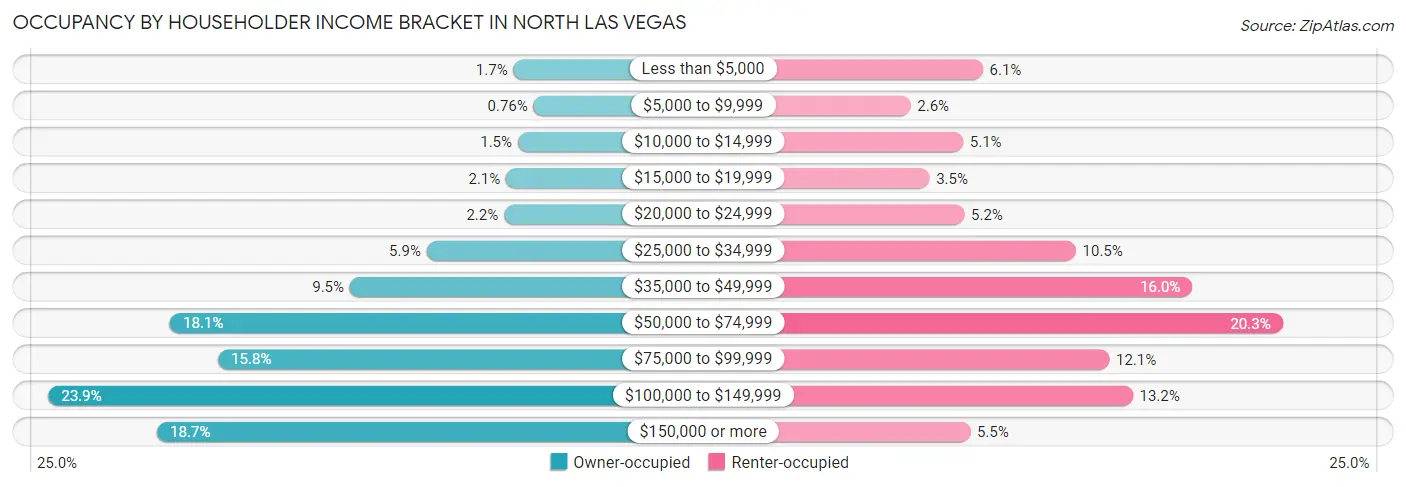
| Income Bracket | Owner-occupied | Renter-occupied |
| Less than $5,000 | 874 (1.7%) | 1,950 (6.0%) |
| $5,000 to $9,999 | 385 (0.8%) | 843 (2.6%) |
| $10,000 to $14,999 | 770 (1.5%) | 1,648 (5.1%) |
| $15,000 to $19,999 | 1,053 (2.1%) | 1,133 (3.5%) |
| $20,000 to $24,999 | 1,107 (2.2%) | 1,667 (5.2%) |
| $25,000 to $34,999 | 2,980 (5.9%) | 3,379 (10.5%) |
| $35,000 to $49,999 | 4,842 (9.5%) | 5,170 (16.0%) |
| $50,000 to $74,999 | 9,203 (18.1%) | 6,559 (20.3%) |
| $75,000 to $99,999 | 8,040 (15.8%) | 3,893 (12.1%) |
| $100,000 to $149,999 | 12,156 (23.9%) | 4,256 (13.2%) |
| $150,000 or more | 9,521 (18.7%) | 1,759 (5.4%) |
| Total | 50,931 (100.0%) | 32,257 (100.0%) |
Monthly Housing Cost Tiers in North Las Vegas
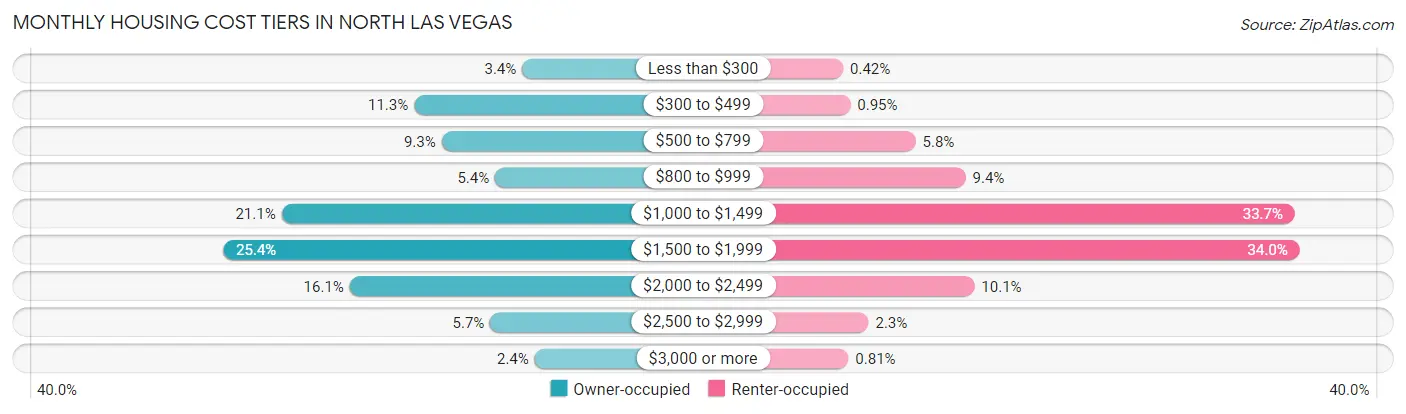
| Monthly Cost | Owner-occupied | Renter-occupied |
| Less than $300 | 1,712 (3.4%) | 134 (0.4%) |
| $300 to $499 | 5,764 (11.3%) | 305 (0.9%) |
| $500 to $799 | 4,729 (9.3%) | 1,859 (5.8%) |
| $800 to $999 | 2,725 (5.3%) | 3,045 (9.4%) |
| $1,000 to $1,499 | 10,735 (21.1%) | 10,864 (33.7%) |
| $1,500 to $1,999 | 12,933 (25.4%) | 10,979 (34.0%) |
| $2,000 to $2,499 | 8,178 (16.1%) | 3,256 (10.1%) |
| $2,500 to $2,999 | 2,910 (5.7%) | 738 (2.3%) |
| $3,000 or more | 1,245 (2.4%) | 261 (0.8%) |
| Total | 50,931 (100.0%) | 32,257 (100.0%) |
Physical Housing Characteristics in North Las Vegas
Housing Structures in North Las Vegas
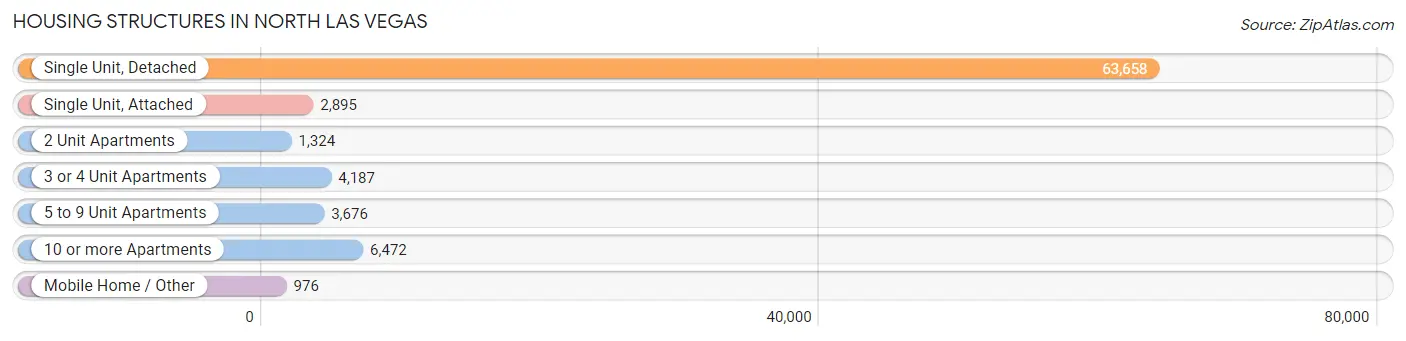
| Structure Type | # Housing Units | % Housing Units |
| Single Unit, Detached | 63,658 | 76.5% |
| Single Unit, Attached | 2,895 | 3.5% |
| 2 Unit Apartments | 1,324 | 1.6% |
| 3 or 4 Unit Apartments | 4,187 | 5.0% |
| 5 to 9 Unit Apartments | 3,676 | 4.4% |
| 10 or more Apartments | 6,472 | 7.8% |
| Mobile Home / Other | 976 | 1.2% |
| Total | 83,188 | 100.0% |
Housing Structures by Occupancy in North Las Vegas
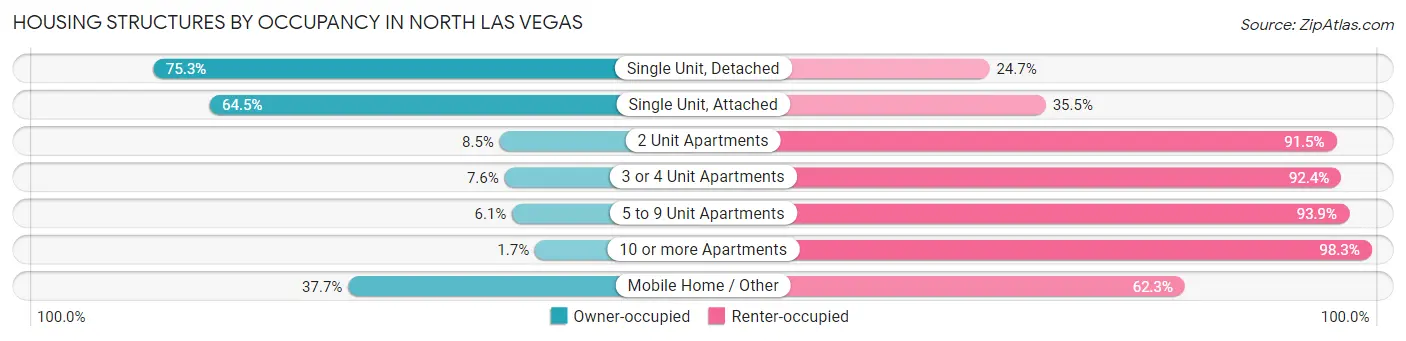
| Structure Type | Owner-occupied | Renter-occupied |
| Single Unit, Detached | 47,929 (75.3%) | 15,729 (24.7%) |
| Single Unit, Attached | 1,866 (64.5%) | 1,029 (35.5%) |
| 2 Unit Apartments | 113 (8.5%) | 1,211 (91.5%) |
| 3 or 4 Unit Apartments | 318 (7.6%) | 3,869 (92.4%) |
| 5 to 9 Unit Apartments | 225 (6.1%) | 3,451 (93.9%) |
| 10 or more Apartments | 112 (1.7%) | 6,360 (98.3%) |
| Mobile Home / Other | 368 (37.7%) | 608 (62.3%) |
| Total | 50,931 (61.2%) | 32,257 (38.8%) |
Housing Structures by Number of Rooms in North Las Vegas
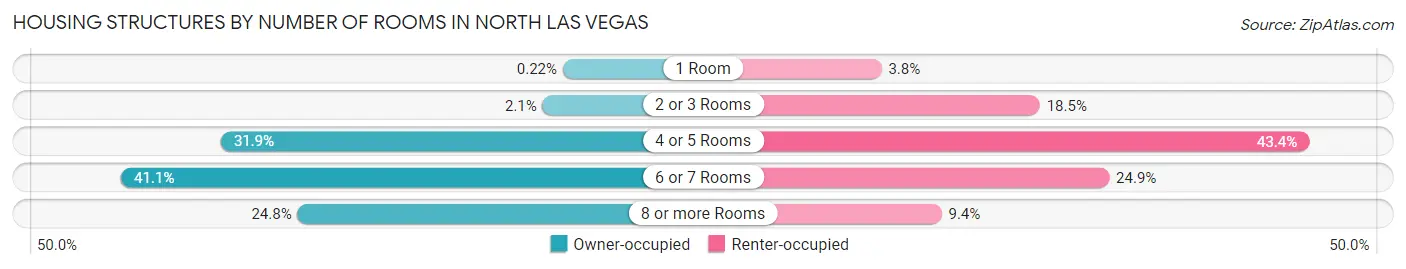
| Number of Rooms | Owner-occupied | Renter-occupied |
| 1 Room | 114 (0.2%) | 1,239 (3.8%) |
| 2 or 3 Rooms | 1,065 (2.1%) | 5,962 (18.5%) |
| 4 or 5 Rooms | 16,222 (31.9%) | 13,993 (43.4%) |
| 6 or 7 Rooms | 20,920 (41.1%) | 8,032 (24.9%) |
| 8 or more Rooms | 12,610 (24.8%) | 3,031 (9.4%) |
| Total | 50,931 (100.0%) | 32,257 (100.0%) |
Housing Structure by Heating Type in North Las Vegas
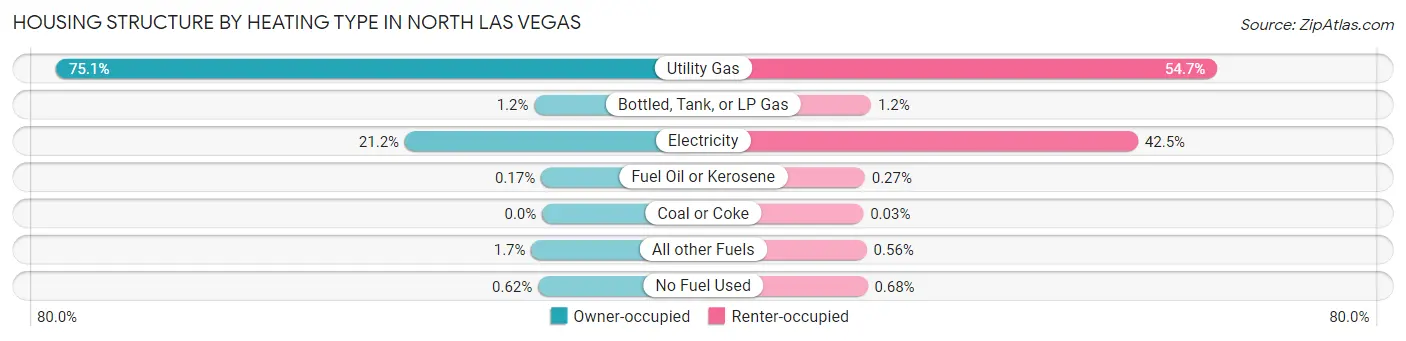
| Heating Type | Owner-occupied | Renter-occupied |
| Utility Gas | 38,271 (75.1%) | 17,658 (54.7%) |
| Bottled, Tank, or LP Gas | 615 (1.2%) | 398 (1.2%) |
| Electricity | 10,801 (21.2%) | 13,706 (42.5%) |
| Fuel Oil or Kerosene | 85 (0.2%) | 87 (0.3%) |
| Coal or Coke | 0 (0.0%) | 9 (0.0%) |
| All other Fuels | 844 (1.7%) | 180 (0.6%) |
| No Fuel Used | 315 (0.6%) | 219 (0.7%) |
| Total | 50,931 (100.0%) | 32,257 (100.0%) |
Household Vehicle Usage in North Las Vegas
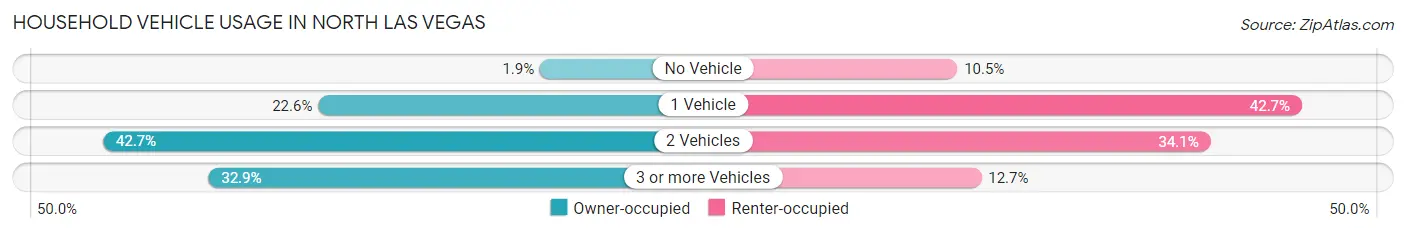
| Vehicles per Household | Owner-occupied | Renter-occupied |
| No Vehicle | 957 (1.9%) | 3,382 (10.5%) |
| 1 Vehicle | 11,505 (22.6%) | 13,759 (42.6%) |
| 2 Vehicles | 21,740 (42.7%) | 11,010 (34.1%) |
| 3 or more Vehicles | 16,729 (32.9%) | 4,106 (12.7%) |
| Total | 50,931 (100.0%) | 32,257 (100.0%) |
Real Estate & Mortgages in North Las Vegas
Real Estate and Mortgage Overview in North Las Vegas
| Characteristic | Without Mortgage | With Mortgage |
| Housing Units | 11,776 | 39,155 |
| Median Property Value | $318,100 | $346,200 |
| Median Household Income | $73,120 | $7,865 |
| Monthly Housing Costs | $453 | $1,245 |
| Real Estate Taxes | $1,527 | $1,357 |
Property Value by Mortgage Status in North Las Vegas
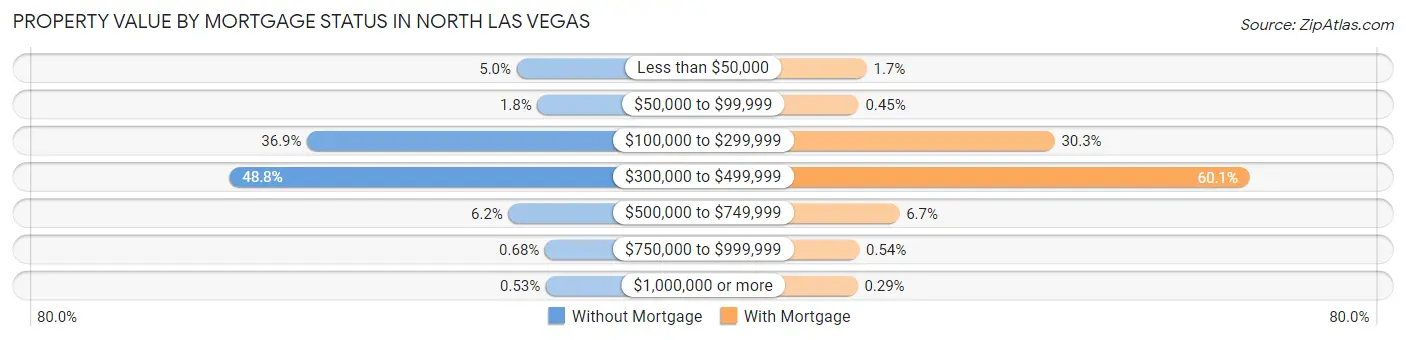
| Property Value | Without Mortgage | With Mortgage |
| Less than $50,000 | 588 (5.0%) | 655 (1.7%) |
| $50,000 to $99,999 | 217 (1.8%) | 178 (0.4%) |
| $100,000 to $299,999 | 4,347 (36.9%) | 11,869 (30.3%) |
| $300,000 to $499,999 | 5,746 (48.8%) | 23,525 (60.1%) |
| $500,000 to $749,999 | 735 (6.2%) | 2,604 (6.7%) |
| $750,000 to $999,999 | 80 (0.7%) | 212 (0.5%) |
| $1,000,000 or more | 63 (0.5%) | 112 (0.3%) |
| Total | 11,776 (100.0%) | 39,155 (100.0%) |
Household Income by Mortgage Status in North Las Vegas
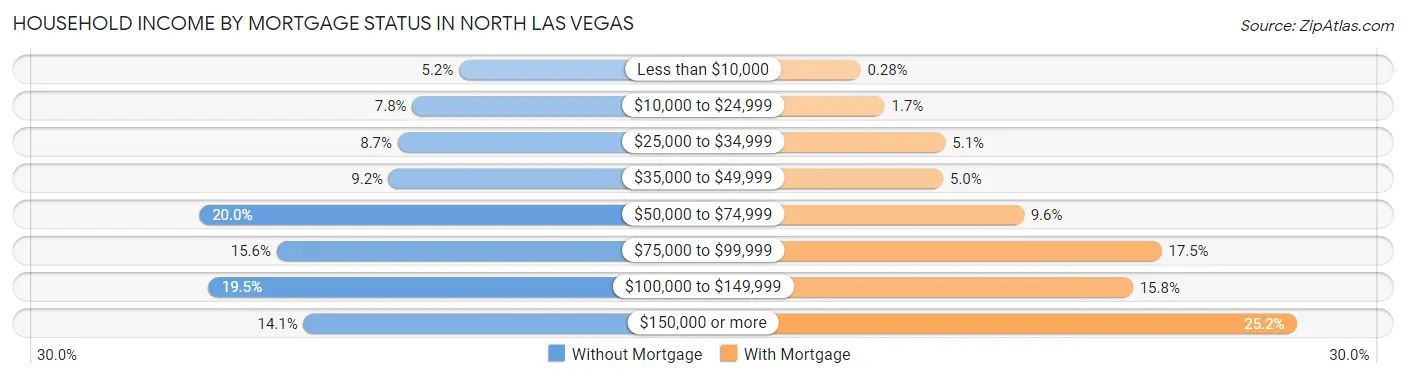
| Household Income | Without Mortgage | With Mortgage |
| Less than $10,000 | 609 (5.2%) | 111 (0.3%) |
| $10,000 to $24,999 | 923 (7.8%) | 650 (1.7%) |
| $25,000 to $34,999 | 1,021 (8.7%) | 2,007 (5.1%) |
| $35,000 to $49,999 | 1,081 (9.2%) | 1,959 (5.0%) |
| $50,000 to $74,999 | 2,357 (20.0%) | 3,761 (9.6%) |
| $75,000 to $99,999 | 1,836 (15.6%) | 6,846 (17.5%) |
| $100,000 to $149,999 | 2,293 (19.5%) | 6,204 (15.8%) |
| $150,000 or more | 1,656 (14.1%) | 9,863 (25.2%) |
| Total | 11,776 (100.0%) | 39,155 (100.0%) |
Property Value to Household Income Ratio in North Las Vegas
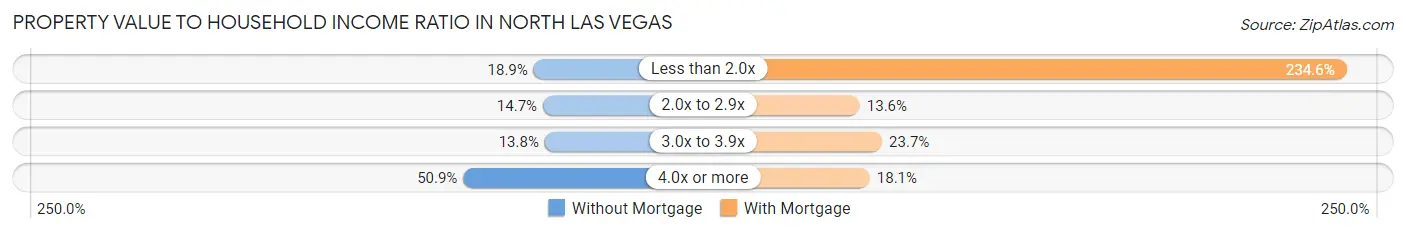
| Value-to-Income Ratio | Without Mortgage | With Mortgage |
| Less than 2.0x | 2,224 (18.9%) | 91,838 (234.5%) |
| 2.0x to 2.9x | 1,727 (14.7%) | 5,321 (13.6%) |
| 3.0x to 3.9x | 1,630 (13.8%) | 9,293 (23.7%) |
| 4.0x or more | 5,989 (50.9%) | 7,101 (18.1%) |
| Total | 11,776 (100.0%) | 39,155 (100.0%) |
Real Estate Taxes by Mortgage Status in North Las Vegas
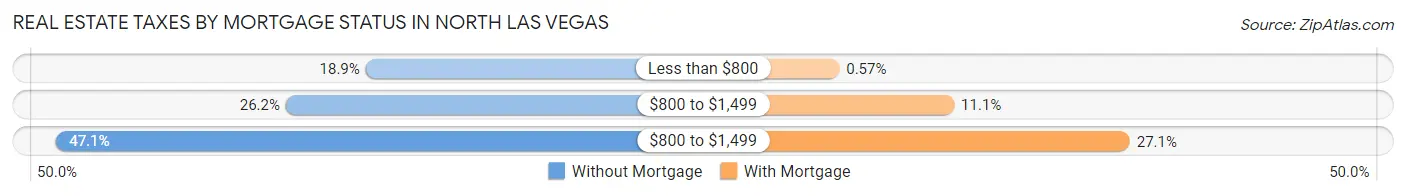
| Property Taxes | Without Mortgage | With Mortgage |
| Less than $800 | 2,221 (18.9%) | 225 (0.6%) |
| $800 to $1,499 | 3,080 (26.2%) | 4,329 (11.1%) |
| $800 to $1,499 | 5,547 (47.1%) | 10,612 (27.1%) |
| Total | 11,776 (100.0%) | 39,155 (100.0%) |
Health & Disability in North Las Vegas
Health Insurance Coverage by Age in North Las Vegas
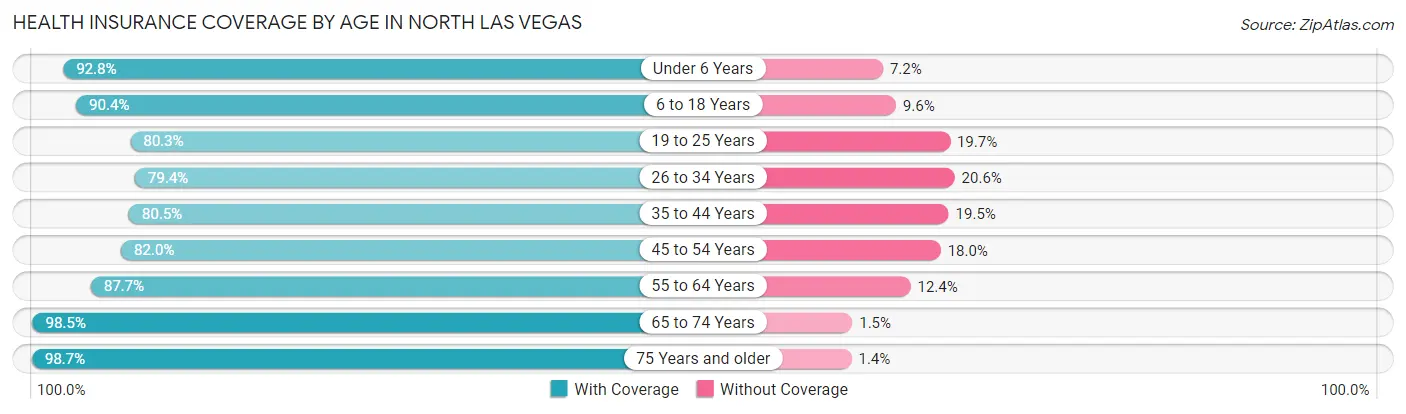
| Age Bracket | With Coverage | Without Coverage |
| Under 6 Years | 19,447 (92.8%) | 1,511 (7.2%) |
| 6 to 18 Years | 47,924 (90.4%) | 5,102 (9.6%) |
| 19 to 25 Years | 19,940 (80.3%) | 4,896 (19.7%) |
| 26 to 34 Years | 27,764 (79.4%) | 7,196 (20.6%) |
| 35 to 44 Years | 29,210 (80.5%) | 7,058 (19.5%) |
| 45 to 54 Years | 27,162 (82.0%) | 5,953 (18.0%) |
| 55 to 64 Years | 23,054 (87.6%) | 3,248 (12.3%) |
| 65 to 74 Years | 19,765 (98.5%) | 299 (1.5%) |
| 75 Years and older | 9,805 (98.7%) | 134 (1.3%) |
| Total | 224,071 (86.4%) | 35,397 (13.6%) |
Health Insurance Coverage by Citizenship Status in North Las Vegas
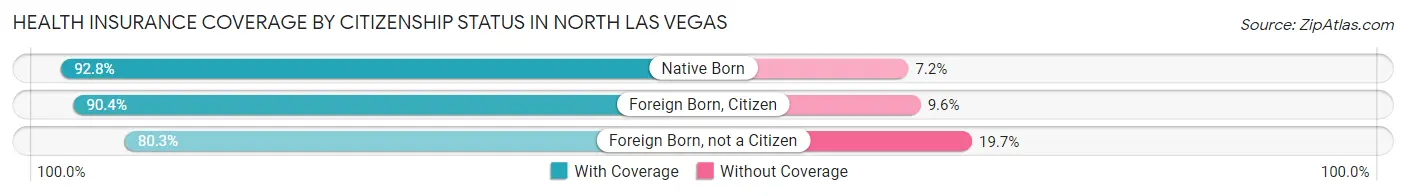
| Citizenship Status | With Coverage | Without Coverage |
| Native Born | 19,447 (92.8%) | 1,511 (7.2%) |
| Foreign Born, Citizen | 47,924 (90.4%) | 5,102 (9.6%) |
| Foreign Born, not a Citizen | 19,940 (80.3%) | 4,896 (19.7%) |
Health Insurance Coverage by Household Income in North Las Vegas
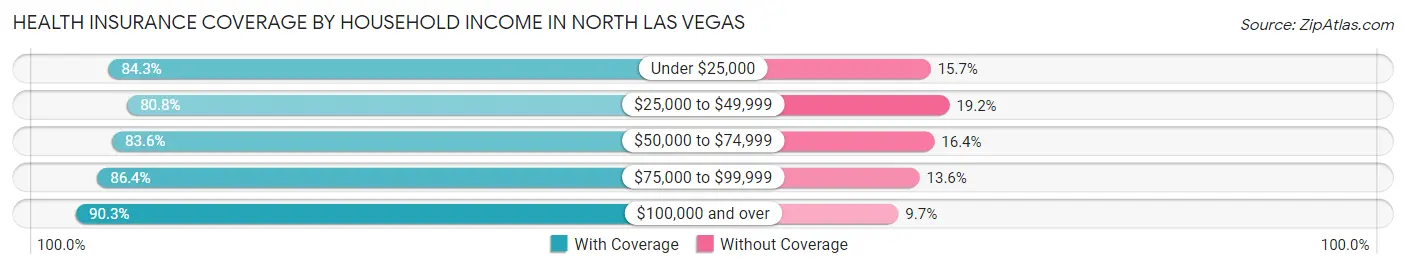
| Household Income | With Coverage | Without Coverage |
| Under $25,000 | 19,308 (84.3%) | 3,600 (15.7%) |
| $25,000 to $49,999 | 34,710 (80.8%) | 8,262 (19.2%) |
| $50,000 to $74,999 | 39,784 (83.6%) | 7,808 (16.4%) |
| $75,000 to $99,999 | 35,261 (86.4%) | 5,571 (13.6%) |
| $100,000 and over | 94,862 (90.3%) | 10,150 (9.7%) |
Public vs Private Health Insurance Coverage by Age in North Las Vegas
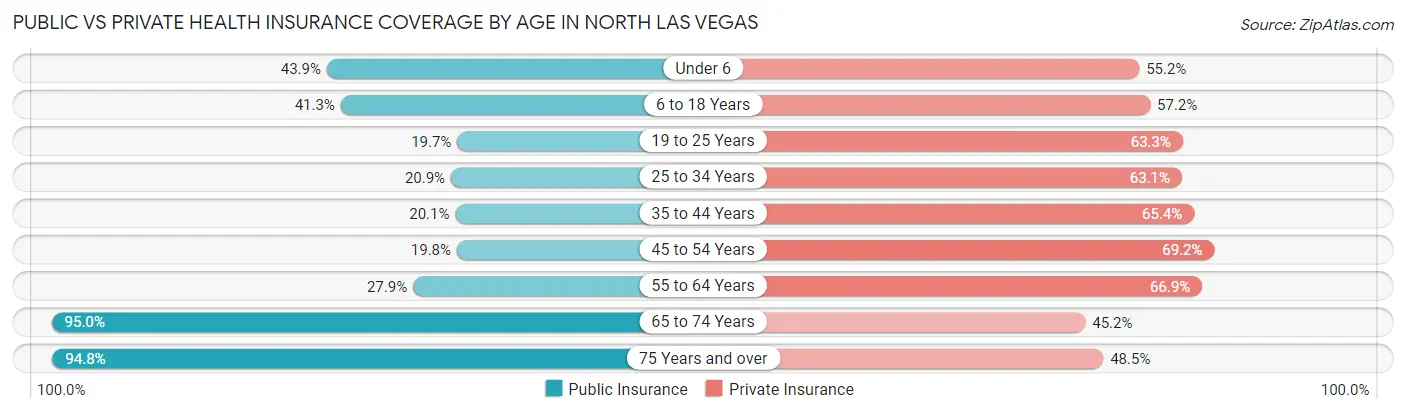
| Age Bracket | Public Insurance | Private Insurance |
| Under 6 | 9,203 (43.9%) | 11,569 (55.2%) |
| 6 to 18 Years | 21,915 (41.3%) | 30,348 (57.2%) |
| 19 to 25 Years | 4,893 (19.7%) | 15,718 (63.3%) |
| 25 to 34 Years | 7,294 (20.9%) | 22,064 (63.1%) |
| 35 to 44 Years | 7,270 (20.1%) | 23,719 (65.4%) |
| 45 to 54 Years | 6,546 (19.8%) | 22,898 (69.2%) |
| 55 to 64 Years | 7,341 (27.9%) | 17,592 (66.9%) |
| 65 to 74 Years | 19,056 (95.0%) | 9,066 (45.2%) |
| 75 Years and over | 9,425 (94.8%) | 4,823 (48.5%) |
| Total | 92,943 (35.8%) | 157,797 (60.8%) |
Disability Status by Sex by Age in North Las Vegas
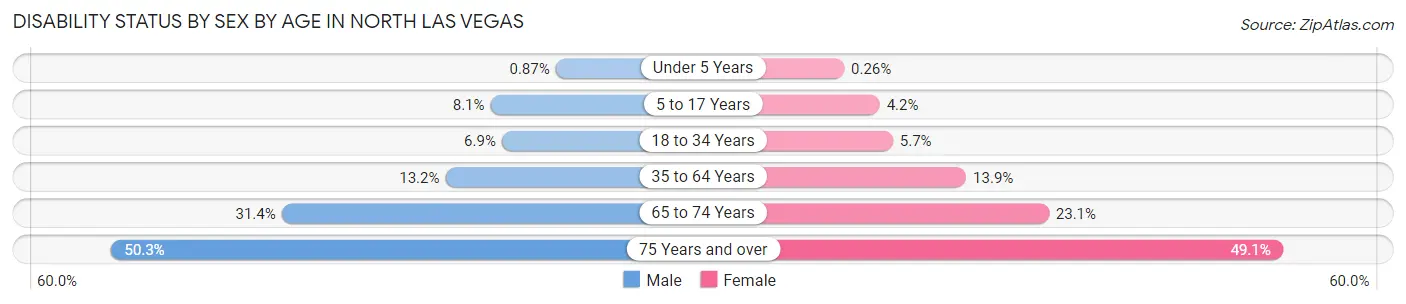
| Age Bracket | Male | Female |
| Under 5 Years | 72 (0.9%) | 23 (0.3%) |
| 5 to 17 Years | 2,151 (8.1%) | 1,132 (4.2%) |
| 18 to 34 Years | 2,169 (6.9%) | 1,800 (5.7%) |
| 35 to 64 Years | 6,020 (13.2%) | 6,912 (13.9%) |
| 65 to 74 Years | 3,062 (31.4%) | 2,377 (23.1%) |
| 75 Years and over | 2,135 (50.3%) | 2,797 (49.1%) |
Disability Class by Sex by Age in North Las Vegas
Disability Class: Hearing Difficulty
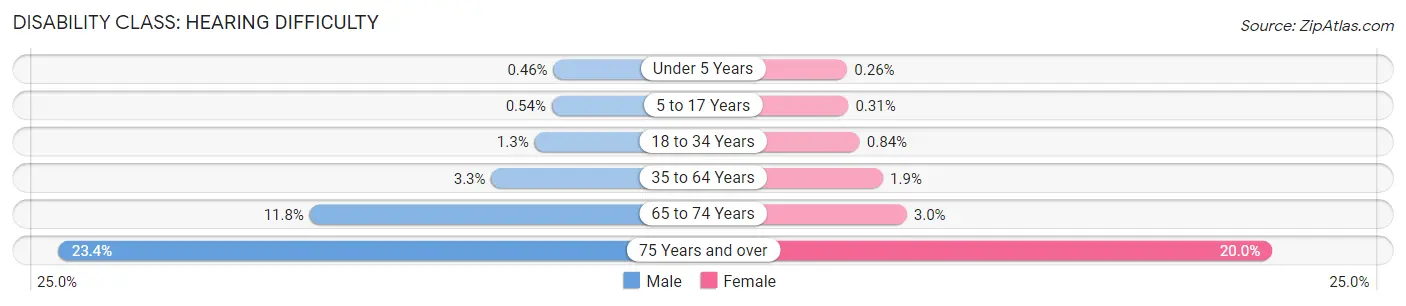
| Age Bracket | Male | Female |
| Under 5 Years | 38 (0.5%) | 23 (0.3%) |
| 5 to 17 Years | 142 (0.5%) | 82 (0.3%) |
| 18 to 34 Years | 424 (1.3%) | 265 (0.8%) |
| 35 to 64 Years | 1,529 (3.3%) | 960 (1.9%) |
| 65 to 74 Years | 1,148 (11.8%) | 311 (3.0%) |
| 75 Years and over | 993 (23.4%) | 1,137 (20.0%) |
Disability Class: Vision Difficulty
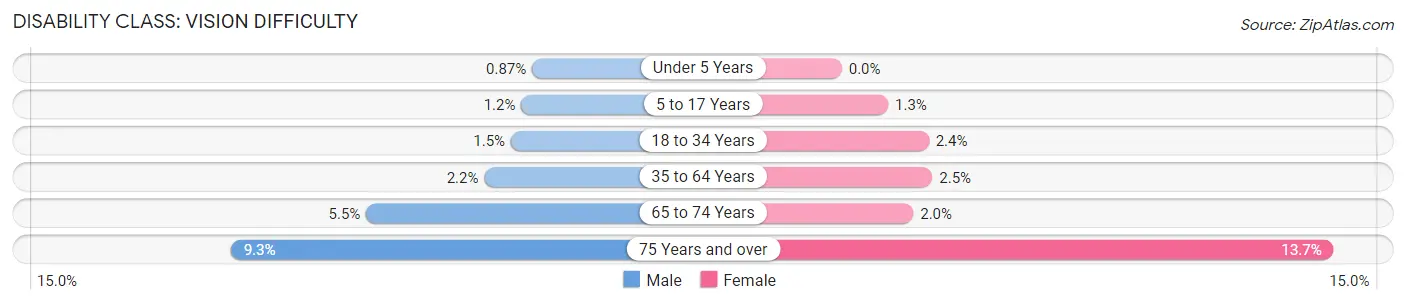
| Age Bracket | Male | Female |
| Under 5 Years | 72 (0.9%) | 0 (0.0%) |
| 5 to 17 Years | 310 (1.2%) | 345 (1.3%) |
| 18 to 34 Years | 462 (1.5%) | 765 (2.4%) |
| 35 to 64 Years | 1,008 (2.2%) | 1,257 (2.5%) |
| 65 to 74 Years | 536 (5.5%) | 205 (2.0%) |
| 75 Years and over | 393 (9.3%) | 780 (13.7%) |
Disability Class: Cognitive Difficulty
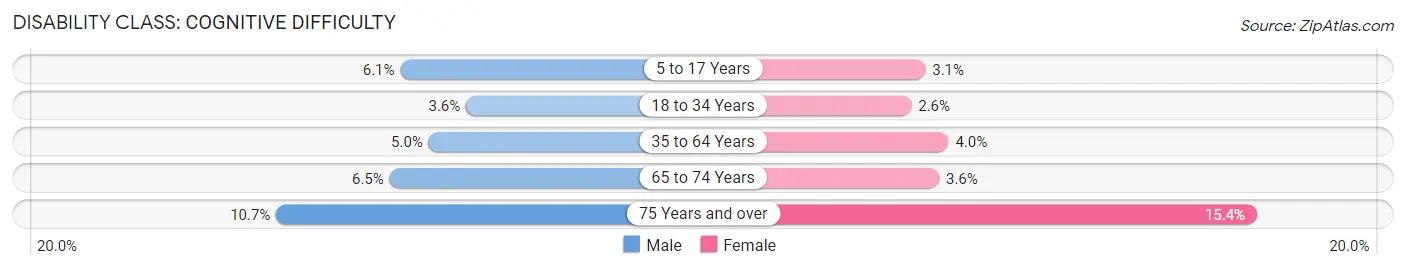
| Age Bracket | Male | Female |
| 5 to 17 Years | 1,600 (6.0%) | 830 (3.1%) |
| 18 to 34 Years | 1,142 (3.6%) | 816 (2.6%) |
| 35 to 64 Years | 2,290 (5.0%) | 1,977 (4.0%) |
| 65 to 74 Years | 629 (6.5%) | 372 (3.6%) |
| 75 Years and over | 452 (10.7%) | 878 (15.4%) |
Disability Class: Ambulatory Difficulty
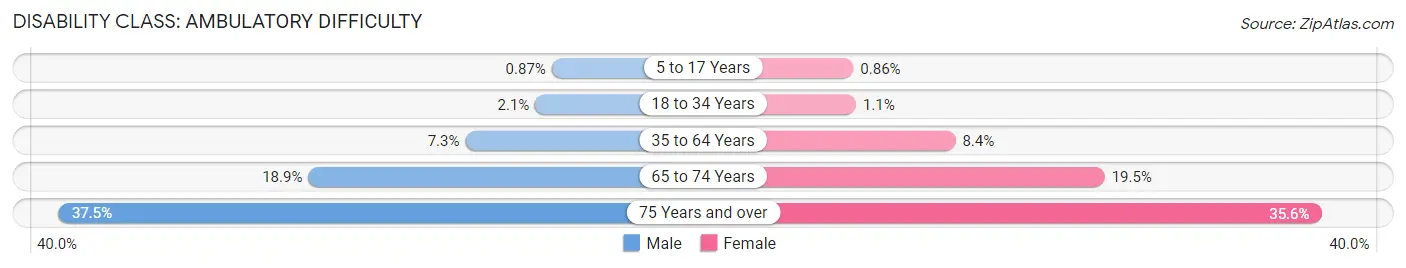
| Age Bracket | Male | Female |
| 5 to 17 Years | 231 (0.9%) | 231 (0.9%) |
| 18 to 34 Years | 660 (2.1%) | 333 (1.1%) |
| 35 to 64 Years | 3,331 (7.3%) | 4,214 (8.4%) |
| 65 to 74 Years | 1,848 (18.9%) | 2,012 (19.5%) |
| 75 Years and over | 1,589 (37.5%) | 2,028 (35.6%) |
Disability Class: Self-Care Difficulty
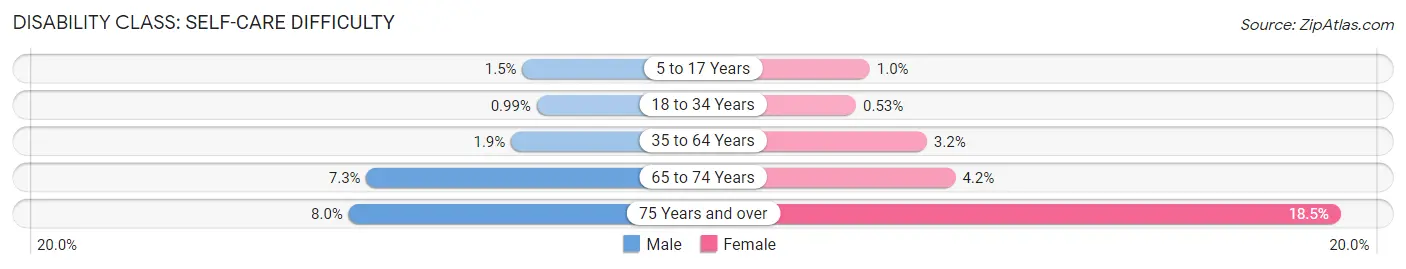
| Age Bracket | Male | Female |
| 5 to 17 Years | 403 (1.5%) | 278 (1.0%) |
| 18 to 34 Years | 312 (1.0%) | 167 (0.5%) |
| 35 to 64 Years | 888 (1.9%) | 1,576 (3.2%) |
| 65 to 74 Years | 713 (7.3%) | 435 (4.2%) |
| 75 Years and over | 338 (8.0%) | 1,055 (18.5%) |
Technology Access in North Las Vegas
Computing Device Access in North Las Vegas
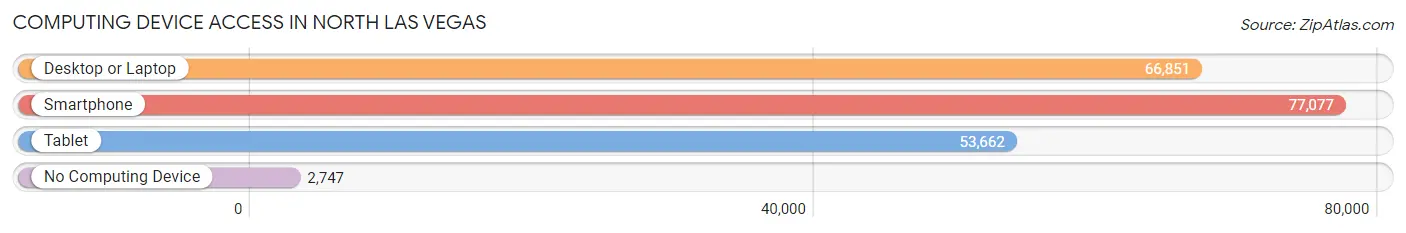
| Device Type | # Households | % Households |
| Desktop or Laptop | 66,851 | 80.4% |
| Smartphone | 77,077 | 92.6% |
| Tablet | 53,662 | 64.5% |
| No Computing Device | 2,747 | 3.3% |
| Total | 83,188 | 100.0% |
Internet Access in North Las Vegas
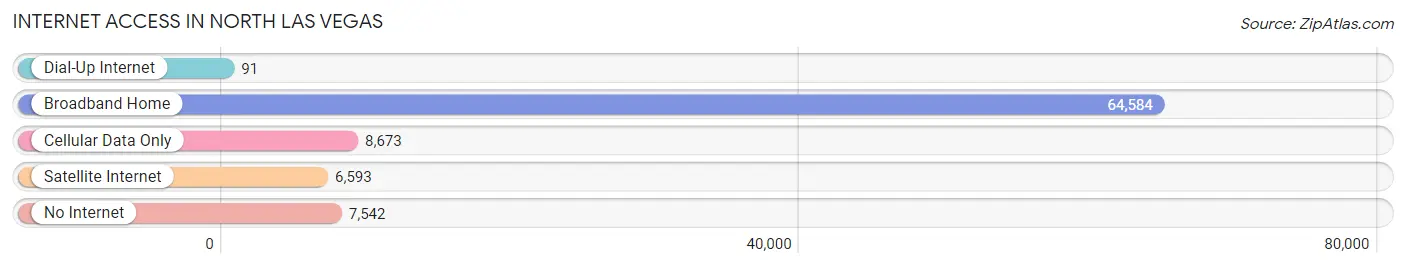
| Internet Type | # Households | % Households |
| Dial-Up Internet | 91 | 0.1% |
| Broadband Home | 64,584 | 77.6% |
| Cellular Data Only | 8,673 | 10.4% |
| Satellite Internet | 6,593 | 7.9% |
| No Internet | 7,542 | 9.1% |
| Total | 83,188 | 100.0% |
North Las Vegas Summary
Las Vegas, Nevada is a city located in the Mojave Desert in the southwestern United States. It is the largest city in the state of Nevada and the county seat of Clark County. Las Vegas is known for its vibrant nightlife, casinos, and entertainment. The city is also home to a variety of cultural attractions, including museums, galleries, and performing arts venues.
Las Vegas is located in the Mojave Desert, which is a large desert region in the southwestern United States. The city is situated in the Las Vegas Valley, which is a basin surrounded by mountain ranges. The city is located in the southeastern corner of the state, near the Arizona border. The city is approximately 4,000 feet above sea level.
The city of Las Vegas has a population of approximately 603,488 people, according to the 2020 United States Census. The city is the 28th most populous city in the United States. The city has a diverse population, with a majority of the population being of Hispanic or Latino origin. The city also has a large population of African Americans, Asians, and Native Americans.
The economy of Las Vegas is largely based on tourism and gaming. The city is home to many of the world’s largest casinos and resorts, which attract millions of visitors each year. The city is also home to a variety of other businesses, including restaurants, retail stores, and entertainment venues.
North Las Vegas is a city located in the Las Vegas Valley in the state of Nevada. The city is located in the northwestern corner of the valley, near the California border. The city has a population of approximately 245,949 people, according to the 2020 United States Census. The city is the 15th most populous city in the state of Nevada.
North Las Vegas is a diverse city, with a majority of the population being of Hispanic or Latino origin. The city also has a large population of African Americans, Asians, and Native Americans. The city is home to a variety of businesses, including restaurants, retail stores, and entertainment venues.
The economy of North Las Vegas is largely based on tourism and gaming. The city is home to many of the world’s largest casinos and resorts, which attract millions of visitors each year. The city is also home to a variety of other businesses, including restaurants, retail stores, and entertainment venues.
Las Vegas and North Las Vegas are two of the most popular cities in the state of Nevada. The cities are known for their vibrant nightlife, casinos, and entertainment. The cities are also home to a variety of cultural attractions, including museums, galleries, and performing arts venues. The cities are also home to a variety of businesses, including restaurants, retail stores, and entertainment venues. The cities are also home to a variety of educational institutions, including universities, colleges, and trade schools. The cities are also home to a variety of parks and recreational areas, including hiking trails, golf courses, and swimming pools.
Common Questions
What is Per Capita Income in North Las Vegas?
Per Capita income in North Las Vegas is $29,460.
What is the Median Family Income in North Las Vegas?
Median Family Income in North Las Vegas is $79,370.
What is the Median Household income in North Las Vegas?
Median Household Income in North Las Vegas is $71,774.
What is Income or Wage Gap in North Las Vegas?
Income or Wage Gap in North Las Vegas is 18.8%.
Women in North Las Vegas earn 81.2 cents for every dollar earned by a man.
What is Family Income Deficit in North Las Vegas?
Family Income Deficit in North Las Vegas is $10,691.
Families that are below poverty line in North Las Vegas earn $10,691 less on average than the poverty threshold level.
What is Inequality or Gini Index in North Las Vegas?
Inequality or Gini Index in North Las Vegas is 0.41.
What is the Total Population of North Las Vegas?
Total Population of North Las Vegas is 264,022.
What is the Total Male Population of North Las Vegas?
Total Male Population of North Las Vegas is 128,781.
What is the Total Female Population of North Las Vegas?
Total Female Population of North Las Vegas is 135,241.
What is the Ratio of Males per 100 Females in North Las Vegas?
There are 95.22 Males per 100 Females in North Las Vegas.
What is the Ratio of Females per 100 Males in North Las Vegas?
There are 105.02 Females per 100 Males in North Las Vegas.
What is the Median Population Age in North Las Vegas?
Median Population Age in North Las Vegas is 33.7 Years.
What is the Average Family Size in North Las Vegas
Average Family Size in North Las Vegas is 3.7 People.
What is the Average Household Size in North Las Vegas
Average Household Size in North Las Vegas is 3.1 People.
How Large is the Labor Force in North Las Vegas?
There are 131,713 People in the Labor Forcein in North Las Vegas.
What is the Percentage of People in the Labor Force in North Las Vegas?
65.1% of People are in the Labor Force in North Las Vegas.
What is the Unemployment Rate in North Las Vegas?
Unemployment Rate in North Las Vegas is 8.4%.