Beaumont, TX Map & Demographics
Beaumont Map
Beaumont Overview
$31,685
PER CAPITA INCOME
$64,683
AVG FAMILY INCOME
$53,745
AVG HOUSEHOLD INCOME
33.5%
WAGE / INCOME GAP [ % ]
66.5¢/ $1
WAGE / INCOME GAP [ $ ]
$12,069
FAMILY INCOME DEFICIT
0.49
INEQUALITY / GINI INDEX
114,573
TOTAL POPULATION
56,633
MALE POPULATION
57,940
FEMALE POPULATION
97.74
MALES / 100 FEMALES
102.31
FEMALES / 100 MALES
35.5
MEDIAN AGE
3.1
AVG FAMILY SIZE
2.5
AVG HOUSEHOLD SIZE
53,067
LABOR FORCE [ PEOPLE ]
59.8%
PERCENT IN LABOR FORCE
5.3%
UNEMPLOYMENT RATE
Beaumont Area Codes
Income in Beaumont
Income Overview in Beaumont
Per Capita Income in Beaumont is $31,685, while median incomes of families and households are $64,683 and $53,745 respectively.
| Characteristic | Number | Measure |
| Per Capita Income | 114,573 | $31,685 |
| Median Family Income | 28,367 | $64,683 |
| Mean Family Income | 28,367 | $89,380 |
| Median Household Income | 45,450 | $53,745 |
| Mean Household Income | 45,450 | $77,970 |
| Income Deficit | 28,367 | $12,069 |
| Wage / Income Gap (%) | 114,573 | 33.54% |
| Wage / Income Gap ($) | 114,573 | 66.46¢ per $1 |
| Gini / Inequality Index | 114,573 | 0.49 |
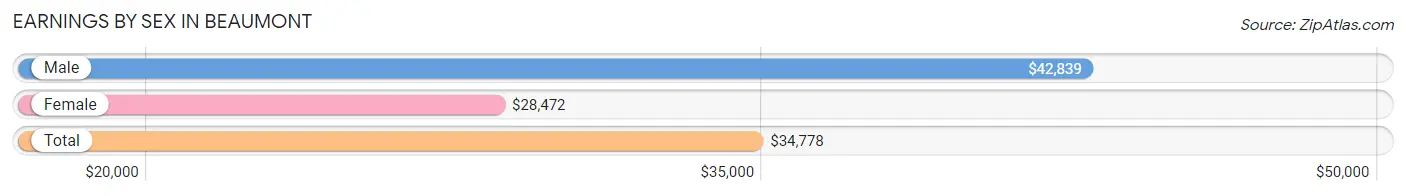
Earnings by Sex in Beaumont
Average Earnings in Beaumont are $34,778, $42,839 for men and $28,472 for women, a difference of 33.5%.
| Sex | Number | Average Earnings |
| Male | 29,430 (52.3%) | $42,839 |
| Female | 26,808 (47.7%) | $28,472 |
| Total | 56,238 (100.0%) | $34,778 |
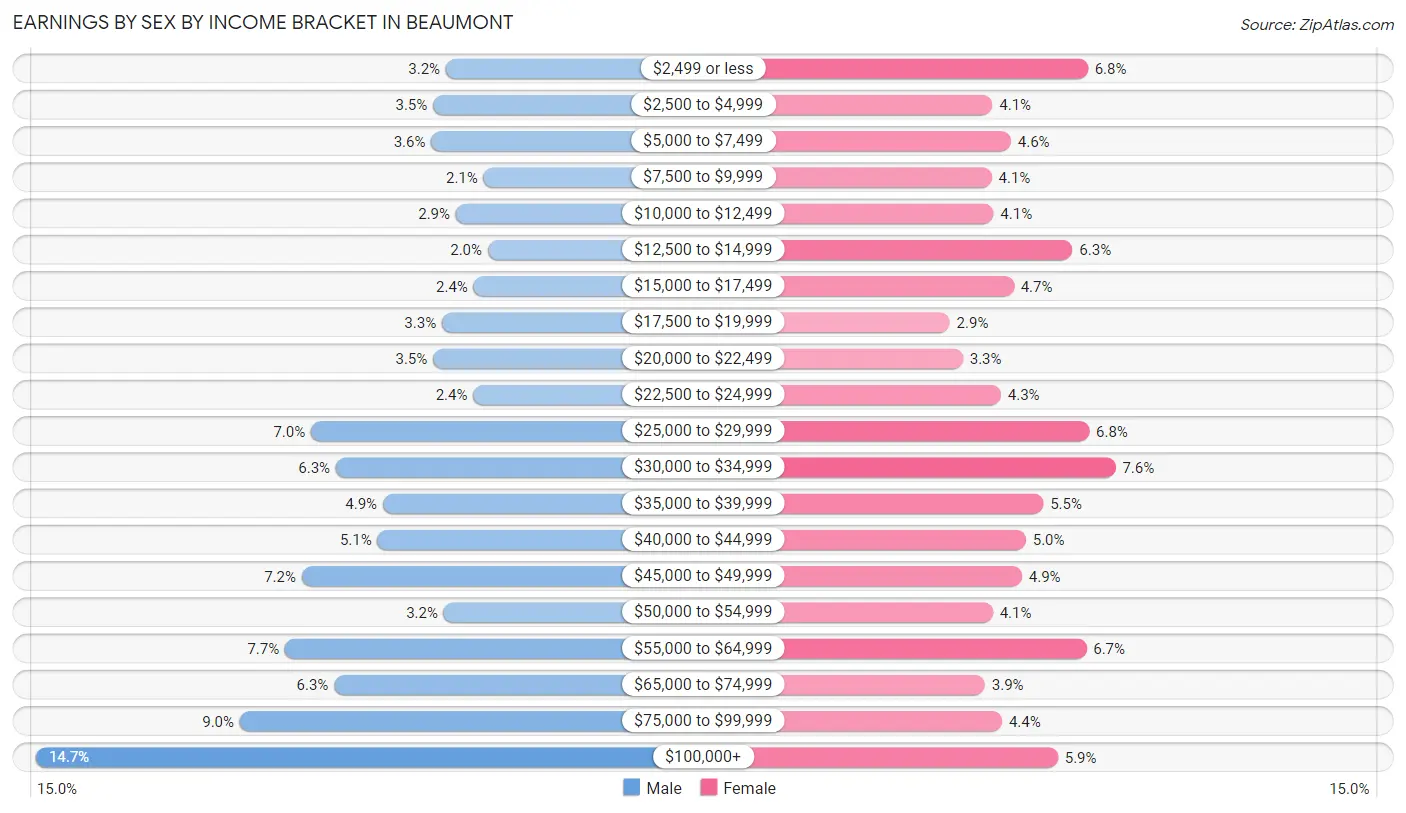
Earnings by Sex by Income Bracket in Beaumont
The most common earnings brackets in Beaumont are $100,000+ for men (4,320 | 14.7%) and $30,000 to $34,999 for women (2,023 | 7.5%).
| Income | Male | Female |
| $2,499 or less | 929 (3.2%) | 1,814 (6.8%) |
| $2,500 to $4,999 | 1,036 (3.5%) | 1,097 (4.1%) |
| $5,000 to $7,499 | 1,052 (3.6%) | 1,237 (4.6%) |
| $7,500 to $9,999 | 617 (2.1%) | 1,092 (4.1%) |
| $10,000 to $12,499 | 848 (2.9%) | 1,104 (4.1%) |
| $12,500 to $14,999 | 584 (2.0%) | 1,699 (6.3%) |
| $15,000 to $17,499 | 699 (2.4%) | 1,258 (4.7%) |
| $17,500 to $19,999 | 961 (3.3%) | 776 (2.9%) |
| $20,000 to $22,499 | 1,035 (3.5%) | 873 (3.3%) |
| $22,500 to $24,999 | 704 (2.4%) | 1,162 (4.3%) |
| $25,000 to $29,999 | 2,045 (7.0%) | 1,825 (6.8%) |
| $30,000 to $34,999 | 1,840 (6.2%) | 2,023 (7.5%) |
| $35,000 to $39,999 | 1,450 (4.9%) | 1,479 (5.5%) |
| $40,000 to $44,999 | 1,495 (5.1%) | 1,348 (5.0%) |
| $45,000 to $49,999 | 2,121 (7.2%) | 1,318 (4.9%) |
| $50,000 to $54,999 | 947 (3.2%) | 1,099 (4.1%) |
| $55,000 to $64,999 | 2,259 (7.7%) | 1,805 (6.7%) |
| $65,000 to $74,999 | 1,853 (6.3%) | 1,040 (3.9%) |
| $75,000 to $99,999 | 2,635 (8.9%) | 1,168 (4.4%) |
| $100,000+ | 4,320 (14.7%) | 1,591 (5.9%) |
| Total | 29,430 (100.0%) | 26,808 (100.0%) |
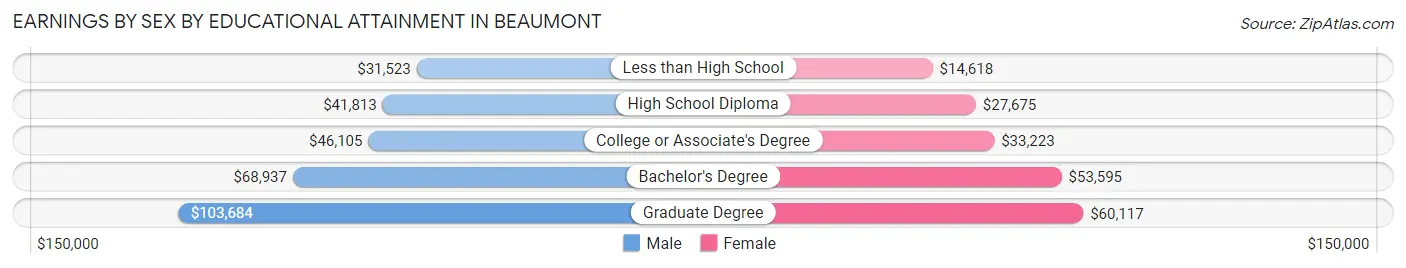
Earnings by Sex by Educational Attainment in Beaumont
Average earnings in Beaumont are $47,164 for men and $33,894 for women, a difference of 28.1%. Men with an educational attainment of graduate degree enjoy the highest average annual earnings of $103,684, while those with less than high school education earn the least with $31,523. Women with an educational attainment of graduate degree earn the most with the average annual earnings of $60,117, while those with less than high school education have the smallest earnings of $14,618.
| Educational Attainment | Male Income | Female Income |
| Less than High School | $31,523 | $14,618 |
| High School Diploma | $41,813 | $27,675 |
| College or Associate's Degree | $46,105 | $33,223 |
| Bachelor's Degree | $68,937 | $53,595 |
| Graduate Degree | $103,684 | $60,117 |
| Total | $47,164 | $33,894 |
Family Income in Beaumont
Family Income Brackets in Beaumont
According to the Beaumont family income data, there are 4,709 families falling into the $100,000 to $149,999 income range, which is the most common income bracket and makes up 16.6% of all families. Conversely, the $10,000 to $14,999 income bracket is the least frequent group with only 1,050 families (3.7%) belonging to this category.
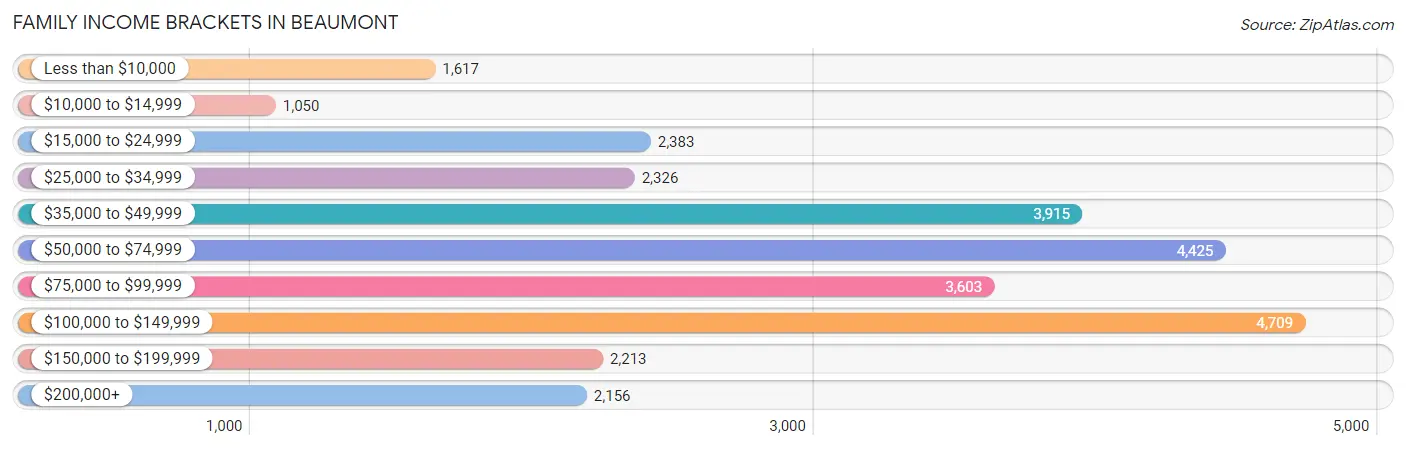
| Income Bracket | # Families | % Families |
| Less than $10,000 | 1,617 | 5.7% |
| $10,000 to $14,999 | 1,050 | 3.7% |
| $15,000 to $24,999 | 2,383 | 8.4% |
| $25,000 to $34,999 | 2,326 | 8.2% |
| $35,000 to $49,999 | 3,915 | 13.8% |
| $50,000 to $74,999 | 4,425 | 15.6% |
| $75,000 to $99,999 | 3,603 | 12.7% |
| $100,000 to $149,999 | 4,709 | 16.6% |
| $150,000 to $199,999 | 2,213 | 7.8% |
| $200,000+ | 2,156 | 7.6% |
Family Income by Famaliy Size in Beaumont
4-person families (4,805 | 16.9%) account for the highest median family income in Beaumont with $79,240 per family, while 2-person families (14,052 | 49.5%) have the highest median income of $30,594 per family member.
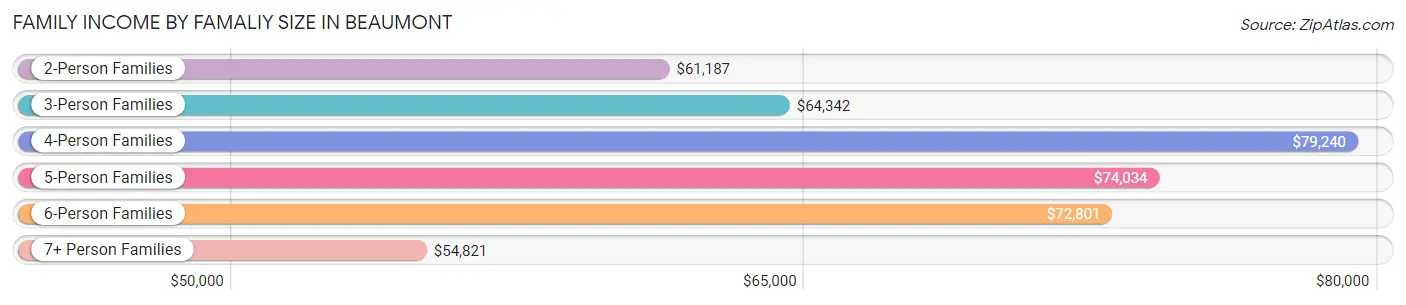
| Income Bracket | # Families | Median Income |
| 2-Person Families | 14,052 (49.5%) | $61,187 |
| 3-Person Families | 6,013 (21.2%) | $64,342 |
| 4-Person Families | 4,805 (16.9%) | $79,240 |
| 5-Person Families | 2,302 (8.1%) | $74,034 |
| 6-Person Families | 908 (3.2%) | $72,801 |
| 7+ Person Families | 287 (1.0%) | $54,821 |
| Total | 28,367 (100.0%) | $64,683 |
Family Income by Number of Earners in Beaumont
The median family income in Beaumont is $64,683, with families comprising 3+ earners (2,576) having the highest median family income of $112,325, while families with no earners (4,563) have the lowest median family income of $36,595, accounting for 9.1% and 16.1% of families, respectively.
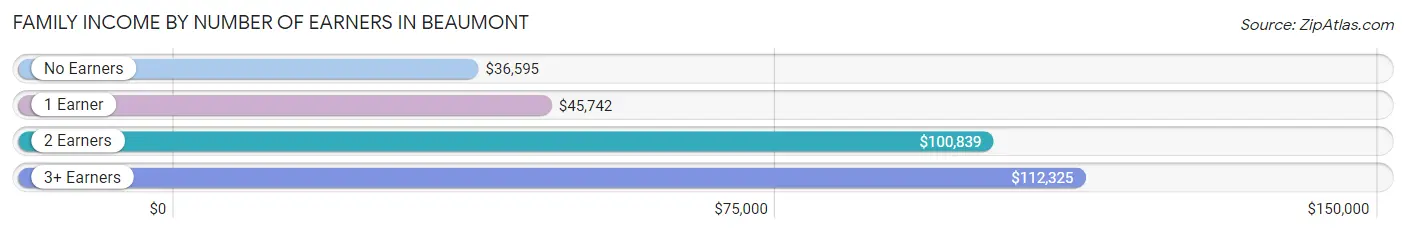
| Number of Earners | # Families | Median Income |
| No Earners | 4,563 (16.1%) | $36,595 |
| 1 Earner | 11,899 (41.9%) | $45,742 |
| 2 Earners | 9,329 (32.9%) | $100,839 |
| 3+ Earners | 2,576 (9.1%) | $112,325 |
| Total | 28,367 (100.0%) | $64,683 |
Household Income in Beaumont
Household Income Brackets in Beaumont
With 7,272 households falling in the category, the $50,000 to $74,999 income range is the most frequent in Beaumont, accounting for 16.0% of all households. In contrast, only 2,591 households (5.7%) fall into the $150,000 to $199,999 income bracket, making it the least populous group.
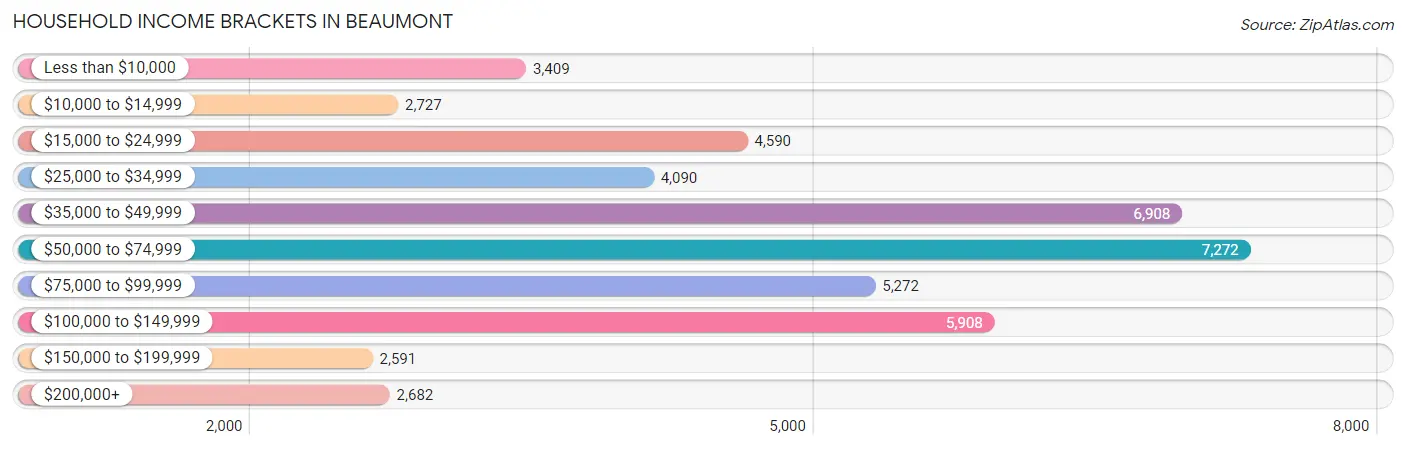
| Income Bracket | # Households | % Households |
| Less than $10,000 | 3,409 | 7.5% |
| $10,000 to $14,999 | 2,727 | 6.0% |
| $15,000 to $24,999 | 4,590 | 10.1% |
| $25,000 to $34,999 | 4,090 | 9.0% |
| $35,000 to $49,999 | 6,908 | 15.2% |
| $50,000 to $74,999 | 7,272 | 16.0% |
| $75,000 to $99,999 | 5,272 | 11.6% |
| $100,000 to $149,999 | 5,908 | 13.0% |
| $150,000 to $199,999 | 2,591 | 5.7% |
| $200,000+ | 2,682 | 5.9% |
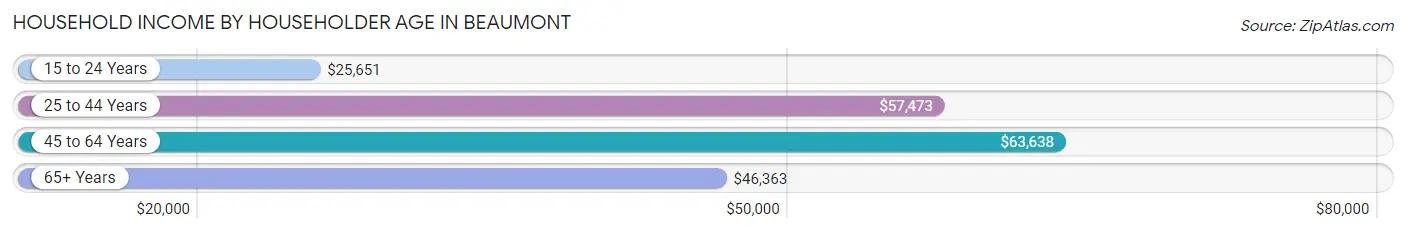
Household Income by Householder Age in Beaumont
The median household income in Beaumont is $53,745, with the highest median household income of $63,638 found in the 45 to 64 years age bracket for the primary householder. A total of 14,728 households (32.4%) fall into this category. Meanwhile, the 15 to 24 years age bracket for the primary householder has the lowest median household income of $25,651, with 2,830 households (6.2%) in this group.
| Income Bracket | # Households | Median Income |
| 15 to 24 Years | 2,830 (6.2%) | $25,651 |
| 25 to 44 Years | 16,188 (35.6%) | $57,473 |
| 45 to 64 Years | 14,728 (32.4%) | $63,638 |
| 65+ Years | 11,704 (25.8%) | $46,363 |
| Total | 45,450 (100.0%) | $53,745 |
Poverty in Beaumont
Income Below Poverty by Sex and Age in Beaumont
With 18.3% poverty level for males and 22.4% for females among the residents of Beaumont, 6 to 11 year old males and 15 year old females are the most vulnerable to poverty, with 1,837 males (38.8%) and 486 females (47.9%) in their respective age groups living below the poverty level.
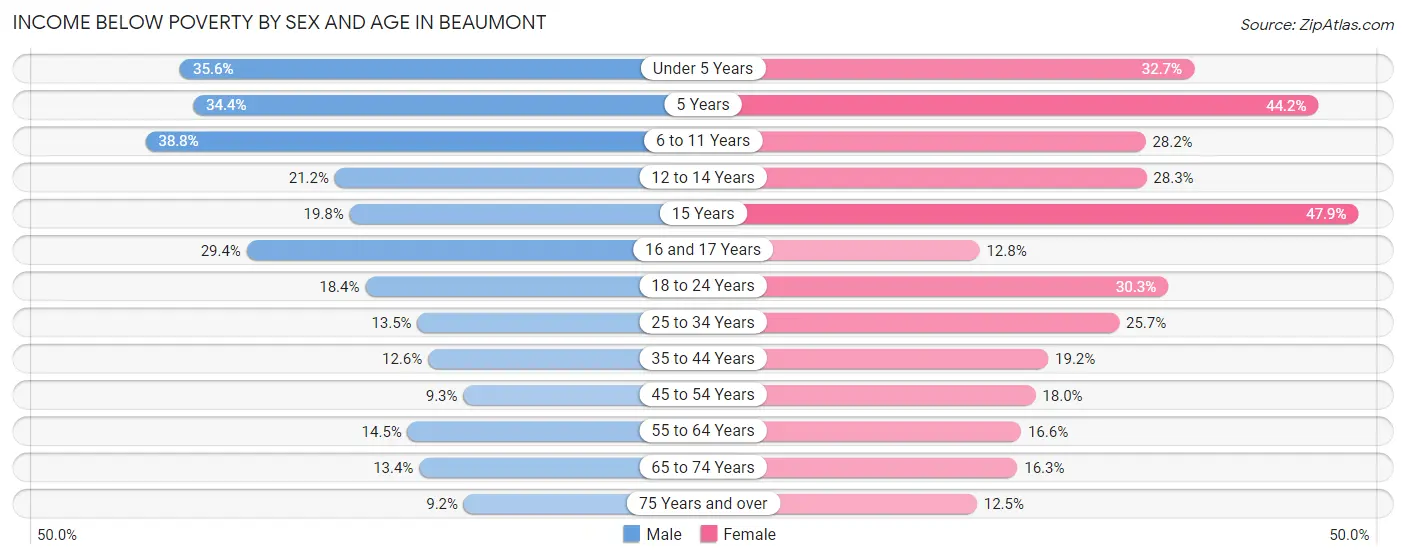
| Age Bracket | Male | Female |
| Under 5 Years | 1,438 (35.6%) | 1,161 (32.7%) |
| 5 Years | 356 (34.4%) | 306 (44.2%) |
| 6 to 11 Years | 1,837 (38.8%) | 1,332 (28.2%) |
| 12 to 14 Years | 568 (21.2%) | 570 (28.3%) |
| 15 Years | 177 (19.8%) | 486 (47.9%) |
| 16 and 17 Years | 360 (29.4%) | 146 (12.8%) |
| 18 to 24 Years | 996 (18.4%) | 1,469 (30.3%) |
| 25 to 34 Years | 1,171 (13.5%) | 2,027 (25.7%) |
| 35 to 44 Years | 847 (12.6%) | 1,398 (19.2%) |
| 45 to 54 Years | 518 (9.3%) | 1,109 (18.0%) |
| 55 to 64 Years | 933 (14.4%) | 1,210 (16.6%) |
| 65 to 74 Years | 656 (13.4%) | 916 (16.3%) |
| 75 Years and over | 271 (9.2%) | 528 (12.5%) |
| Total | 10,128 (18.3%) | 12,658 (22.4%) |
Income Above Poverty by Sex and Age in Beaumont
According to the poverty statistics in Beaumont, males aged 75 years and over and females aged 75 years and over are the age groups that are most secure financially, with 90.8% of males and 87.5% of females in these age groups living above the poverty line.
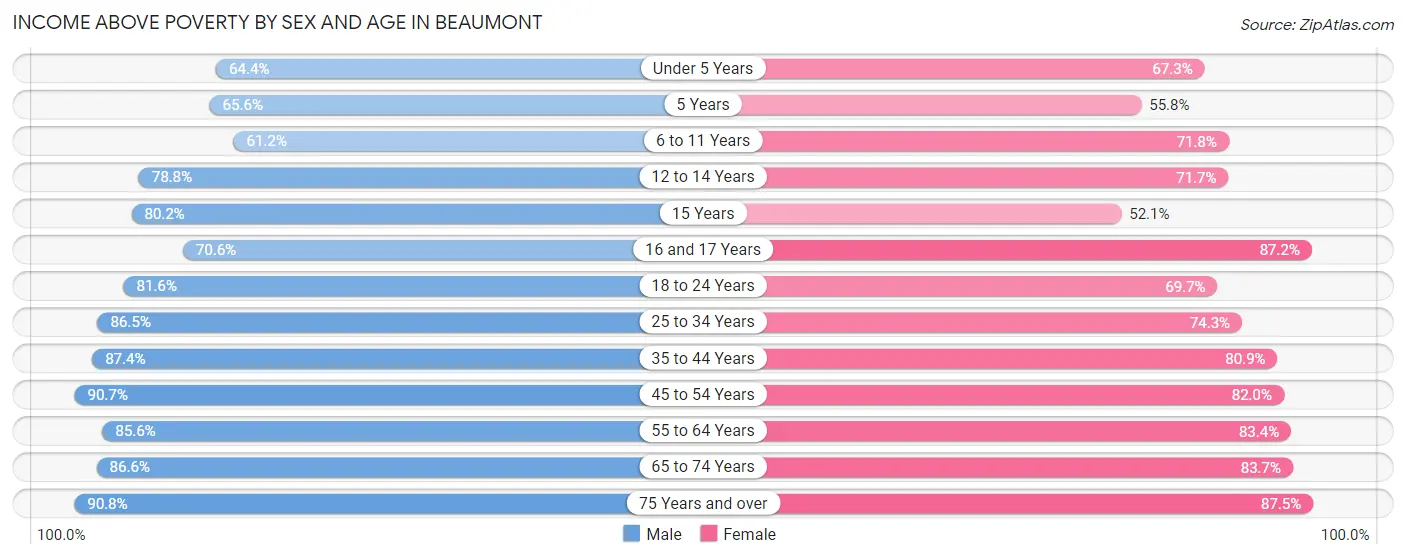
| Age Bracket | Male | Female |
| Under 5 Years | 2,606 (64.4%) | 2,393 (67.3%) |
| 5 Years | 680 (65.6%) | 386 (55.8%) |
| 6 to 11 Years | 2,899 (61.2%) | 3,395 (71.8%) |
| 12 to 14 Years | 2,110 (78.8%) | 1,446 (71.7%) |
| 15 Years | 715 (80.2%) | 528 (52.1%) |
| 16 and 17 Years | 865 (70.6%) | 996 (87.2%) |
| 18 to 24 Years | 4,424 (81.6%) | 3,382 (69.7%) |
| 25 to 34 Years | 7,479 (86.5%) | 5,851 (74.3%) |
| 35 to 44 Years | 5,894 (87.4%) | 5,901 (80.8%) |
| 45 to 54 Years | 5,062 (90.7%) | 5,062 (82.0%) |
| 55 to 64 Years | 5,524 (85.6%) | 6,064 (83.4%) |
| 65 to 74 Years | 4,247 (86.6%) | 4,706 (83.7%) |
| 75 Years and over | 2,666 (90.8%) | 3,685 (87.5%) |
| Total | 45,171 (81.7%) | 43,795 (77.6%) |
Income Below Poverty Among Married-Couple Families in Beaumont
The poverty statistics for married-couple families in Beaumont show that 6.9% or 1,240 of the total 17,971 families live below the poverty line. Families with 5 or more children have the highest poverty rate of 30.5%, comprising of 32 families. On the other hand, families with 1 or 2 children have the lowest poverty rate of 5.3%, which includes 261 families.
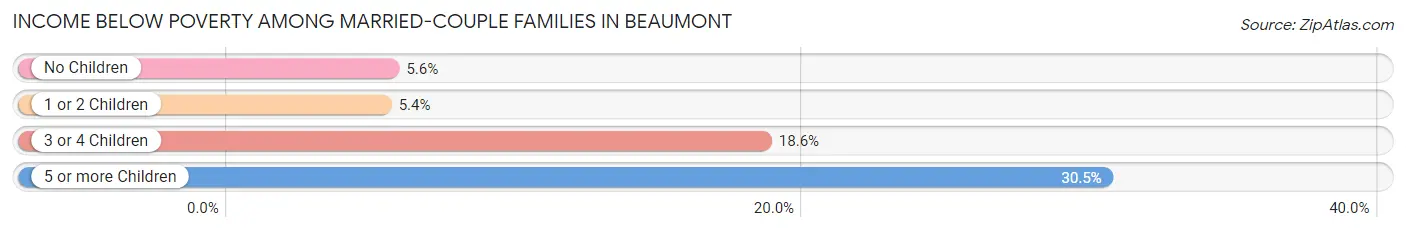
| Children | Above Poverty | Below Poverty |
| No Children | 10,682 (94.4%) | 636 (5.6%) |
| 1 or 2 Children | 4,614 (94.7%) | 261 (5.3%) |
| 3 or 4 Children | 1,362 (81.4%) | 311 (18.6%) |
| 5 or more Children | 73 (69.5%) | 32 (30.5%) |
| Total | 16,731 (93.1%) | 1,240 (6.9%) |
Income Below Poverty Among Single-Parent Households in Beaumont
According to the poverty data in Beaumont, 22.2% or 489 single-father households and 35.4% or 2,897 single-mother households are living below the poverty line. Among single-father households, those with 3 or 4 children have the highest poverty rate, with 168 households (72.4%) experiencing poverty. Likewise, among single-mother households, those with 5 or more children have the highest poverty rate, with 66 households (86.8%) falling below the poverty line.
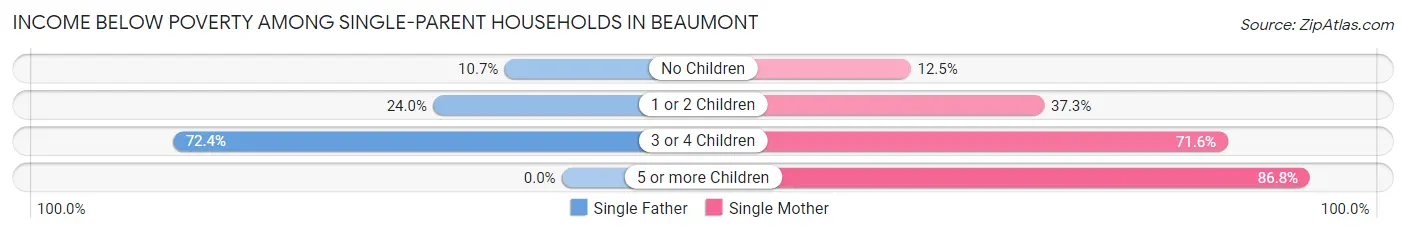
| Children | Single Father | Single Mother |
| No Children | 122 (10.7%) | 278 (12.5%) |
| 1 or 2 Children | 199 (24.0%) | 1,808 (37.3%) |
| 3 or 4 Children | 168 (72.4%) | 745 (71.6%) |
| 5 or more Children | 0 (0.0%) | 66 (86.8%) |
| Total | 489 (22.2%) | 2,897 (35.4%) |
Income Below Poverty Among Married-Couple vs Single-Parent Households in Beaumont
The poverty data for Beaumont shows that 1,240 of the married-couple family households (6.9%) and 3,386 of the single-parent households (32.6%) are living below the poverty level. Within the married-couple family households, those with 5 or more children have the highest poverty rate, with 32 households (30.5%) falling below the poverty line. Among the single-parent households, those with 5 or more children have the highest poverty rate, with 66 household (86.8%) living below poverty.
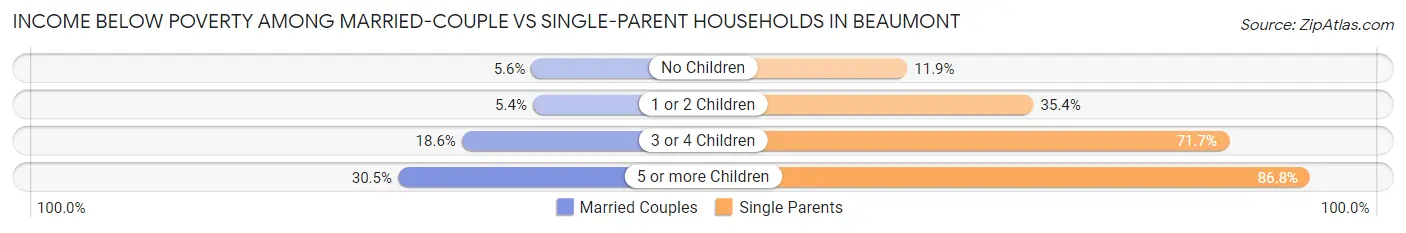
| Children | Married-Couple Families | Single-Parent Households |
| No Children | 636 (5.6%) | 400 (11.9%) |
| 1 or 2 Children | 261 (5.3%) | 2,007 (35.4%) |
| 3 or 4 Children | 311 (18.6%) | 913 (71.7%) |
| 5 or more Children | 32 (30.5%) | 66 (86.8%) |
| Total | 1,240 (6.9%) | 3,386 (32.6%) |
Race in Beaumont
The most populous races in Beaumont are Black / African American (52,240 | 45.6%), White / Caucasian (41,545 | 36.3%), and Hispanic or Latino (23,191 | 20.2%).
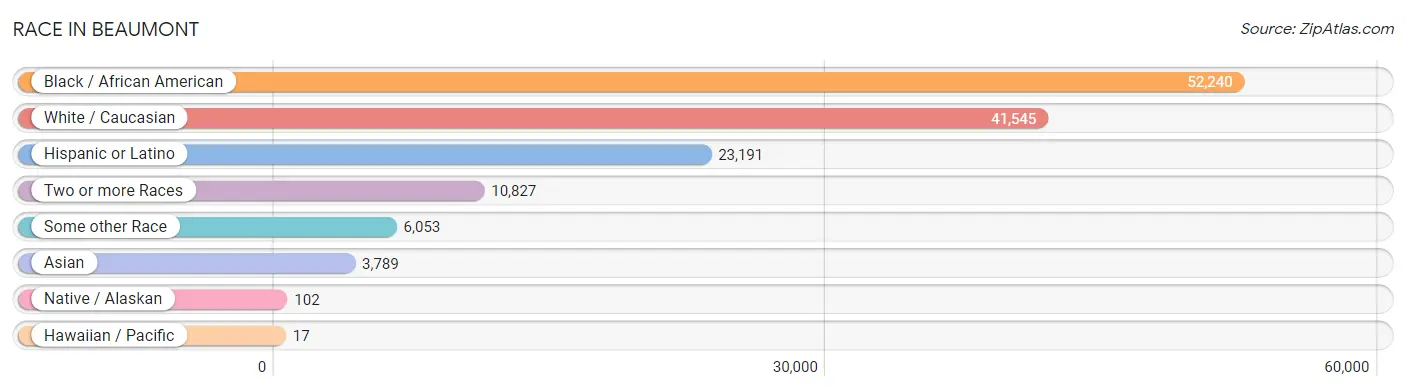
| Race | # Population | % Population |
| Asian | 3,789 | 3.3% |
| Black / African American | 52,240 | 45.6% |
| Hawaiian / Pacific | 17 | 0.0% |
| Hispanic or Latino | 23,191 | 20.2% |
| Native / Alaskan | 102 | 0.1% |
| White / Caucasian | 41,545 | 36.3% |
| Two or more Races | 10,827 | 9.5% |
| Some other Race | 6,053 | 5.3% |
| Total | 114,573 | 100.0% |
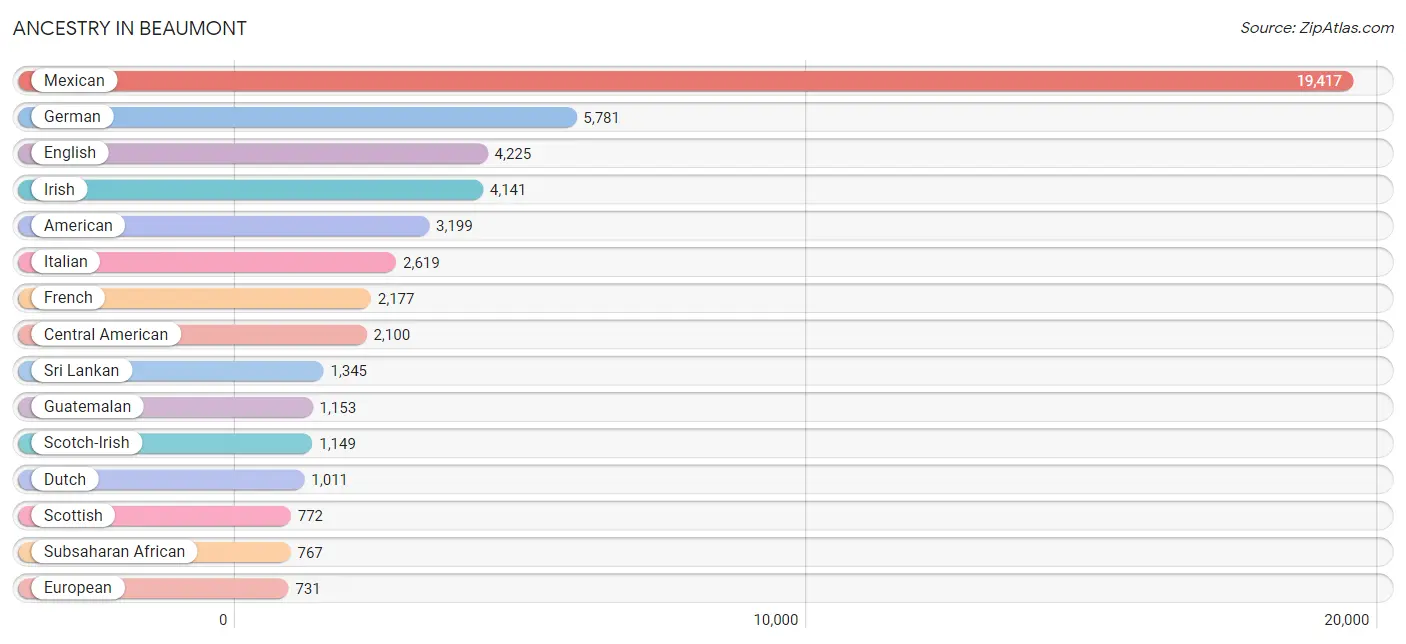
Ancestry in Beaumont
The most populous ancestries reported in Beaumont are Mexican (19,417 | 17.0%), German (5,781 | 5.1%), English (4,225 | 3.7%), Irish (4,141 | 3.6%), and American (3,199 | 2.8%), together accounting for 32.1% of all Beaumont residents.
| Ancestry | # Population | % Population |
| African | 476 | 0.4% |
| Albanian | 11 | 0.0% |
| American | 3,199 | 2.8% |
| Apache | 6 | 0.0% |
| Arab | 295 | 0.3% |
| Armenian | 16 | 0.0% |
| Austrian | 45 | 0.0% |
| Barbadian | 49 | 0.0% |
| Belgian | 34 | 0.0% |
| Bhutanese | 410 | 0.4% |
| Blackfeet | 2 | 0.0% |
| Brazilian | 141 | 0.1% |
| British | 370 | 0.3% |
| British West Indian | 11 | 0.0% |
| Burmese | 69 | 0.1% |
| Cajun | 426 | 0.4% |
| Canadian | 48 | 0.0% |
| Central American | 2,100 | 1.8% |
| Central American Indian | 11 | 0.0% |
| Cherokee | 157 | 0.1% |
| Chilean | 39 | 0.0% |
| Choctaw | 57 | 0.1% |
| Colombian | 46 | 0.0% |
| Costa Rican | 42 | 0.0% |
| Croatian | 60 | 0.1% |
| Cuban | 141 | 0.1% |
| Czech | 400 | 0.4% |
| Czechoslovakian | 12 | 0.0% |
| Danish | 6 | 0.0% |
| Dominican | 85 | 0.1% |
| Dutch | 1,011 | 0.9% |
| Eastern European | 124 | 0.1% |
| Ecuadorian | 10 | 0.0% |
| English | 4,225 | 3.7% |
| Estonian | 7 | 0.0% |
| European | 731 | 0.6% |
| Filipino | 8 | 0.0% |
| Finnish | 32 | 0.0% |
| French | 2,177 | 1.9% |
| French American Indian | 5 | 0.0% |
| French Canadian | 443 | 0.4% |
| German | 5,781 | 5.1% |
| Greek | 69 | 0.1% |
| Guamanian / Chamorro | 4 | 0.0% |
| Guatemalan | 1,153 | 1.0% |
| Guyanese | 4 | 0.0% |
| Haitian | 28 | 0.0% |
| Honduran | 540 | 0.5% |
| Hungarian | 94 | 0.1% |
| Indian (Asian) | 337 | 0.3% |
| Indonesian | 13 | 0.0% |
| Iranian | 16 | 0.0% |
| Iraqi | 23 | 0.0% |
| Irish | 4,141 | 3.6% |
| Italian | 2,619 | 2.3% |
| Jamaican | 42 | 0.0% |
| Kenyan | 6 | 0.0% |
| Korean | 641 | 0.6% |
| Lebanese | 181 | 0.2% |
| Lithuanian | 101 | 0.1% |
| Mexican | 19,417 | 17.0% |
| Mexican American Indian | 21 | 0.0% |
| Mongolian | 107 | 0.1% |
| Native Hawaiian | 4 | 0.0% |
| Navajo | 86 | 0.1% |
| Nicaraguan | 90 | 0.1% |
| Nigerian | 230 | 0.2% |
| Northern European | 118 | 0.1% |
| Norwegian | 229 | 0.2% |
| Osage | 1 | 0.0% |
| Pakistani | 4 | 0.0% |
| Palestinian | 36 | 0.0% |
| Pennsylvania German | 6 | 0.0% |
| Peruvian | 39 | 0.0% |
| Polish | 579 | 0.5% |
| Portuguese | 98 | 0.1% |
| Puerto Rican | 461 | 0.4% |
| Romanian | 35 | 0.0% |
| Russian | 148 | 0.1% |
| Salvadoran | 275 | 0.2% |
| Samoan | 13 | 0.0% |
| Scandinavian | 71 | 0.1% |
| Scotch-Irish | 1,149 | 1.0% |
| Scottish | 772 | 0.7% |
| Seminole | 54 | 0.1% |
| Slovak | 13 | 0.0% |
| Slovene | 51 | 0.0% |
| South American | 214 | 0.2% |
| South American Indian | 17 | 0.0% |
| Spaniard | 206 | 0.2% |
| Spanish | 19 | 0.0% |
| Sri Lankan | 1,345 | 1.2% |
| Subsaharan African | 767 | 0.7% |
| Swedish | 241 | 0.2% |
| Thai | 673 | 0.6% |
| Ukrainian | 12 | 0.0% |
| Venezuelan | 80 | 0.1% |
| Vietnamese | 116 | 0.1% |
| Welsh | 212 | 0.2% |
| Zimbabwean | 13 | 0.0% | View All 100 Rows |
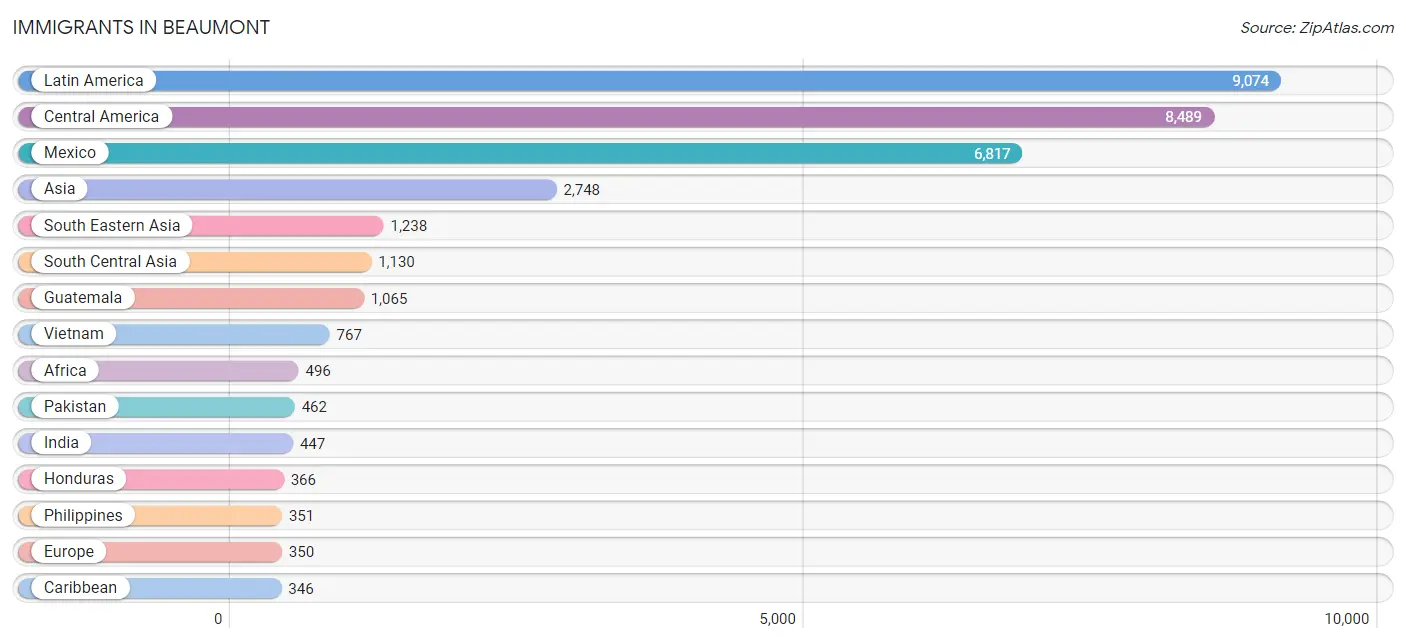
Immigrants in Beaumont
The most numerous immigrant groups reported in Beaumont came from Latin America (9,074 | 7.9%), Central America (8,489 | 7.4%), Mexico (6,817 | 5.9%), Asia (2,748 | 2.4%), and South Eastern Asia (1,238 | 1.1%), together accounting for 24.8% of all Beaumont residents.
| Immigration Origin | # Population | % Population |
| Africa | 496 | 0.4% |
| Albania | 11 | 0.0% |
| Asia | 2,748 | 2.4% |
| Bangladesh | 116 | 0.1% |
| Barbados | 49 | 0.0% |
| Belgium | 22 | 0.0% |
| Brazil | 39 | 0.0% |
| Cameroon | 19 | 0.0% |
| Canada | 201 | 0.2% |
| Caribbean | 346 | 0.3% |
| Central America | 8,489 | 7.4% |
| China | 193 | 0.2% |
| Colombia | 31 | 0.0% |
| Costa Rica | 42 | 0.0% |
| Cuba | 208 | 0.2% |
| Dominican Republic | 7 | 0.0% |
| Eastern Africa | 156 | 0.1% |
| Eastern Asia | 278 | 0.2% |
| Eastern Europe | 11 | 0.0% |
| Ecuador | 7 | 0.0% |
| El Salvador | 180 | 0.2% |
| England | 49 | 0.0% |
| Europe | 350 | 0.3% |
| Germany | 69 | 0.1% |
| Greece | 26 | 0.0% |
| Grenada | 11 | 0.0% |
| Guatemala | 1,065 | 0.9% |
| Guyana | 14 | 0.0% |
| Honduras | 366 | 0.3% |
| Hong Kong | 7 | 0.0% |
| India | 447 | 0.4% |
| Iran | 16 | 0.0% |
| Iraq | 23 | 0.0% |
| Italy | 58 | 0.1% |
| Jamaica | 28 | 0.0% |
| Japan | 32 | 0.0% |
| Kenya | 29 | 0.0% |
| Korea | 53 | 0.1% |
| Latin America | 9,074 | 7.9% |
| Lebanon | 40 | 0.0% |
| Malaysia | 114 | 0.1% |
| Mexico | 6,817 | 5.9% |
| Middle Africa | 19 | 0.0% |
| Nepal | 11 | 0.0% |
| Netherlands | 50 | 0.0% |
| Nicaragua | 19 | 0.0% |
| Nigeria | 96 | 0.1% |
| Northern Europe | 114 | 0.1% |
| Pakistan | 462 | 0.4% |
| Peru | 57 | 0.1% |
| Philippines | 351 | 0.3% |
| Scotland | 4 | 0.0% |
| South Africa | 141 | 0.1% |
| South America | 239 | 0.2% |
| South Central Asia | 1,130 | 1.0% |
| South Eastern Asia | 1,238 | 1.1% |
| Southern Europe | 84 | 0.1% |
| Sri Lanka | 78 | 0.1% |
| Taiwan | 46 | 0.0% |
| Trinidad and Tobago | 12 | 0.0% |
| Venezuela | 91 | 0.1% |
| Vietnam | 767 | 0.7% |
| Western Africa | 96 | 0.1% |
| Western Asia | 63 | 0.1% |
| Western Europe | 141 | 0.1% |
| Zimbabwe | 46 | 0.0% | View All 66 Rows |
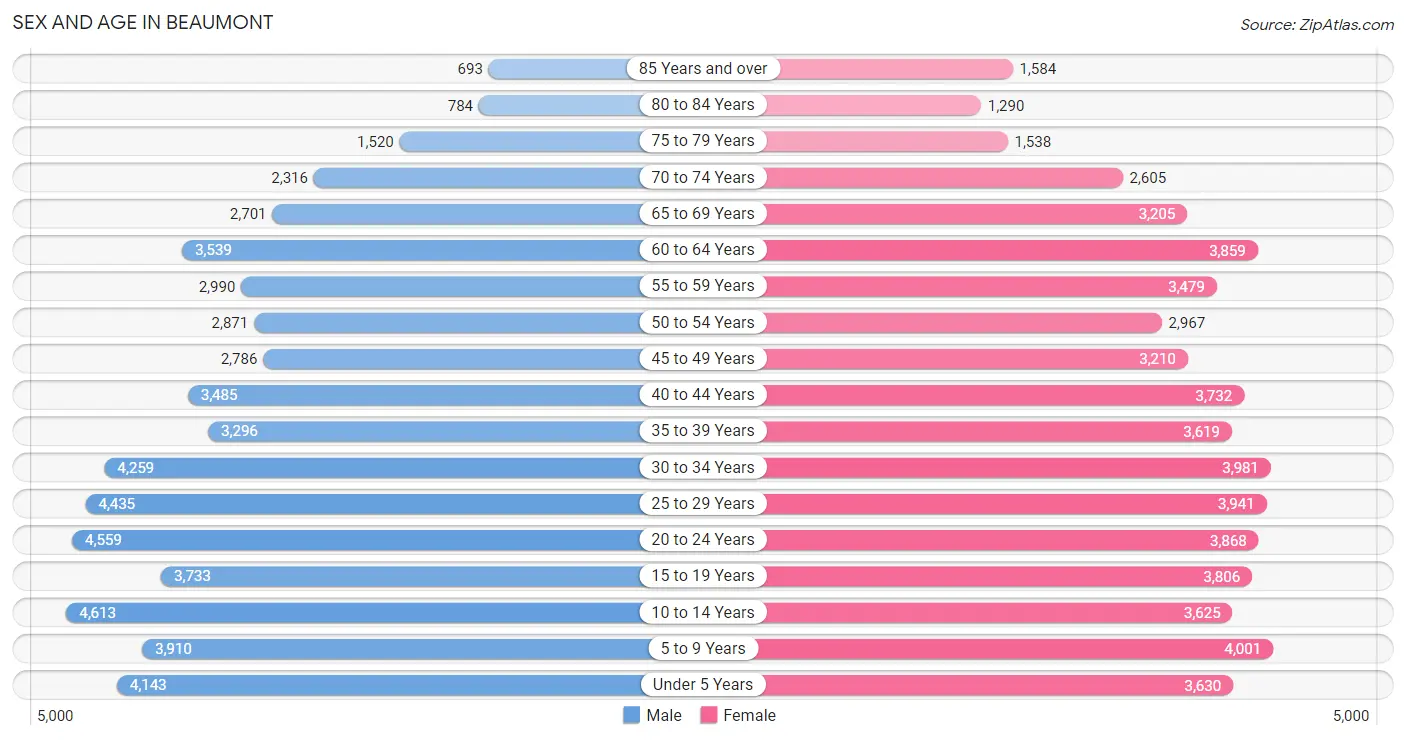
Sex and Age in Beaumont
Sex and Age in Beaumont
The most populous age groups in Beaumont are 10 to 14 Years (4,613 | 8.2%) for men and 5 to 9 Years (4,001 | 6.9%) for women.
| Age Bracket | Male | Female |
| Under 5 Years | 4,143 (7.3%) | 3,630 (6.3%) |
| 5 to 9 Years | 3,910 (6.9%) | 4,001 (6.9%) |
| 10 to 14 Years | 4,613 (8.2%) | 3,625 (6.3%) |
| 15 to 19 Years | 3,733 (6.6%) | 3,806 (6.6%) |
| 20 to 24 Years | 4,559 (8.1%) | 3,868 (6.7%) |
| 25 to 29 Years | 4,435 (7.8%) | 3,941 (6.8%) |
| 30 to 34 Years | 4,259 (7.5%) | 3,981 (6.9%) |
| 35 to 39 Years | 3,296 (5.8%) | 3,619 (6.2%) |
| 40 to 44 Years | 3,485 (6.1%) | 3,732 (6.4%) |
| 45 to 49 Years | 2,786 (4.9%) | 3,210 (5.5%) |
| 50 to 54 Years | 2,871 (5.1%) | 2,967 (5.1%) |
| 55 to 59 Years | 2,990 (5.3%) | 3,479 (6.0%) |
| 60 to 64 Years | 3,539 (6.2%) | 3,859 (6.7%) |
| 65 to 69 Years | 2,701 (4.8%) | 3,205 (5.5%) |
| 70 to 74 Years | 2,316 (4.1%) | 2,605 (4.5%) |
| 75 to 79 Years | 1,520 (2.7%) | 1,538 (2.6%) |
| 80 to 84 Years | 784 (1.4%) | 1,290 (2.2%) |
| 85 Years and over | 693 (1.2%) | 1,584 (2.7%) |
| Total | 56,633 (100.0%) | 57,940 (100.0%) |
Families and Households in Beaumont
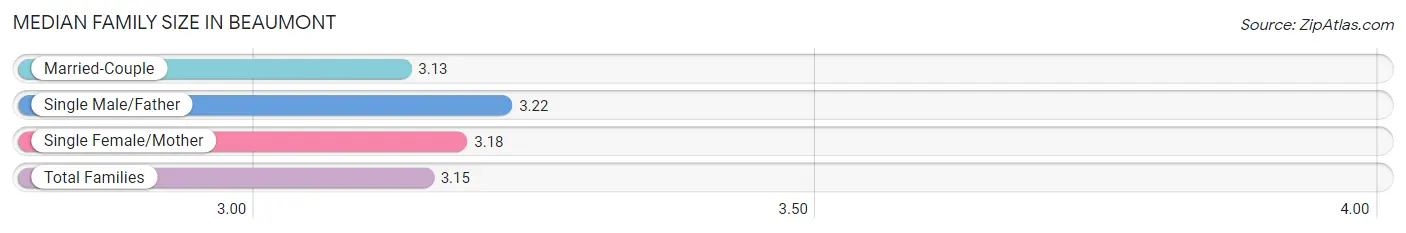
Median Family Size in Beaumont
The median family size in Beaumont is 3.15 persons per family, with single male/father families (2,204 | 7.8%) accounting for the largest median family size of 3.22 persons per family. On the other hand, married-couple families (17,971 | 63.3%) represent the smallest median family size with 3.13 persons per family.
| Family Type | # Families | Family Size |
| Married-Couple | 17,971 (63.3%) | 3.13 |
| Single Male/Father | 2,204 (7.8%) | 3.22 |
| Single Female/Mother | 8,192 (28.9%) | 3.18 |
| Total Families | 28,367 (100.0%) | 3.15 |
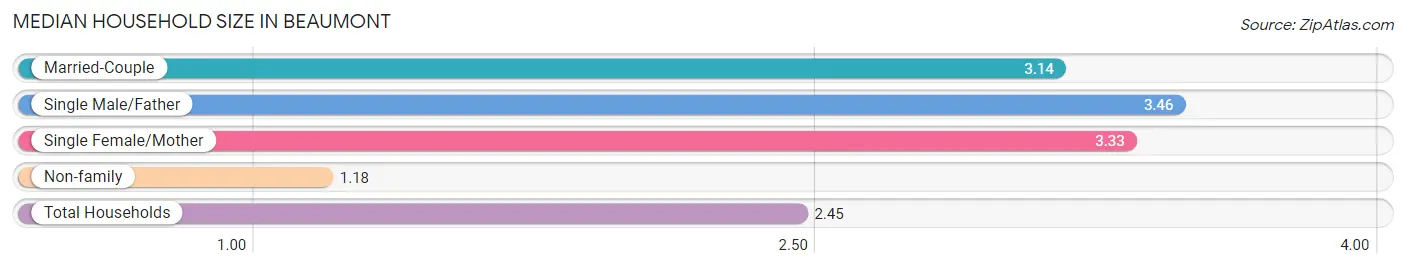
Median Household Size in Beaumont
The median household size in Beaumont is 2.45 persons per household, with single male/father households (2,204 | 4.9%) accounting for the largest median household size of 3.46 persons per household. non-family households (17,083 | 37.6%) represent the smallest median household size with 1.18 persons per household.
| Household Type | # Households | Household Size |
| Married-Couple | 17,971 (39.5%) | 3.14 |
| Single Male/Father | 2,204 (4.9%) | 3.46 |
| Single Female/Mother | 8,192 (18.0%) | 3.33 |
| Non-family | 17,083 (37.6%) | 1.18 |
| Total Households | 45,450 (100.0%) | 2.45 |
Household Size by Marriage Status in Beaumont
Out of a total of 45,450 households in Beaumont, 28,367 (62.4%) are family households, while 17,083 (37.6%) are nonfamily households. The most numerous type of family households are 2-person households, comprising 13,476, and the most common type of nonfamily households are 1-person households, comprising 14,857.
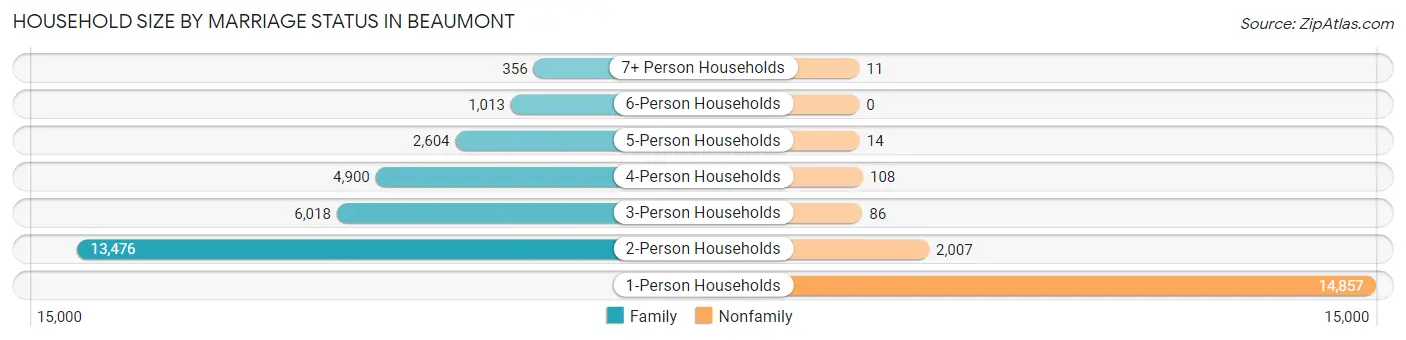
| Household Size | Family Households | Nonfamily Households |
| 1-Person Households | - | 14,857 (32.7%) |
| 2-Person Households | 13,476 (29.6%) | 2,007 (4.4%) |
| 3-Person Households | 6,018 (13.2%) | 86 (0.2%) |
| 4-Person Households | 4,900 (10.8%) | 108 (0.2%) |
| 5-Person Households | 2,604 (5.7%) | 14 (0.0%) |
| 6-Person Households | 1,013 (2.2%) | 0 (0.0%) |
| 7+ Person Households | 356 (0.8%) | 11 (0.0%) |
| Total | 28,367 (62.4%) | 17,083 (37.6%) |
Female Fertility in Beaumont
Fertility by Age in Beaumont
Average fertility rate in Beaumont is 49.0 births per 1,000 women. Women in the age bracket of 20 to 34 years have the highest fertility rate with 80.0 births per 1,000 women. Women in the age bracket of 20 to 34 years acount for 73.1% of all women with births.
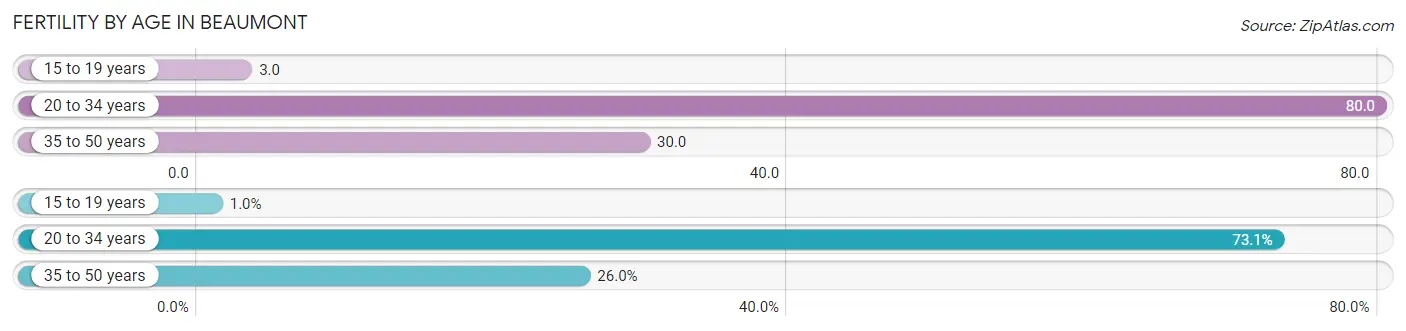
| Age Bracket | Women with Births | Births / 1,000 Women |
| 15 to 19 years | 13 (1.0%) | 3.0 |
| 20 to 34 years | 946 (73.1%) | 80.0 |
| 35 to 50 years | 336 (26.0%) | 30.0 |
| Total | 1,295 (100.0%) | 49.0 |
Fertility by Age by Marriage Status in Beaumont
48.3% of women with births (1,295) in Beaumont are married. The highest percentage of unmarried women with births falls into 15 to 19 years age bracket with 100.0% of them unmarried at the time of birth, while the lowest percentage of unmarried women with births belong to 20 to 34 years age bracket with 50.7% of them unmarried.
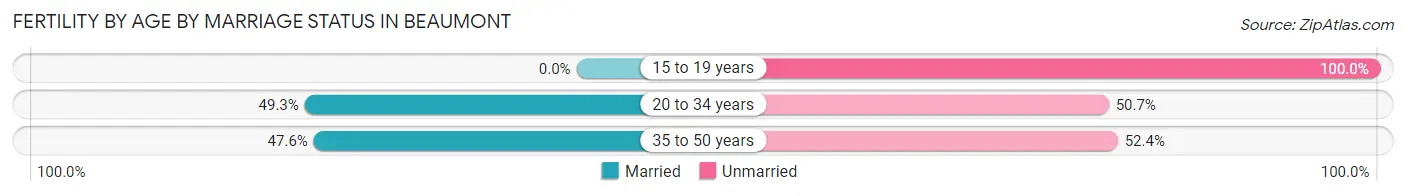
| Age Bracket | Married | Unmarried |
| 15 to 19 years | 0 (0.0%) | 13 (100.0%) |
| 20 to 34 years | 466 (49.3%) | 480 (50.7%) |
| 35 to 50 years | 160 (47.6%) | 176 (52.4%) |
| Total | 625 (48.3%) | 670 (51.7%) |
Fertility by Education in Beaumont
Average fertility rate in Beaumont is 49.0 births per 1,000 women. Women with the education attainment of high school diploma have the highest fertility rate of 71.0 births per 1,000 women, while women with the education attainment of less than high school have the lowest fertility at 26.0 births per 1,000 women. Women with the education attainment of high school diploma represent 36.1% of all women with births.
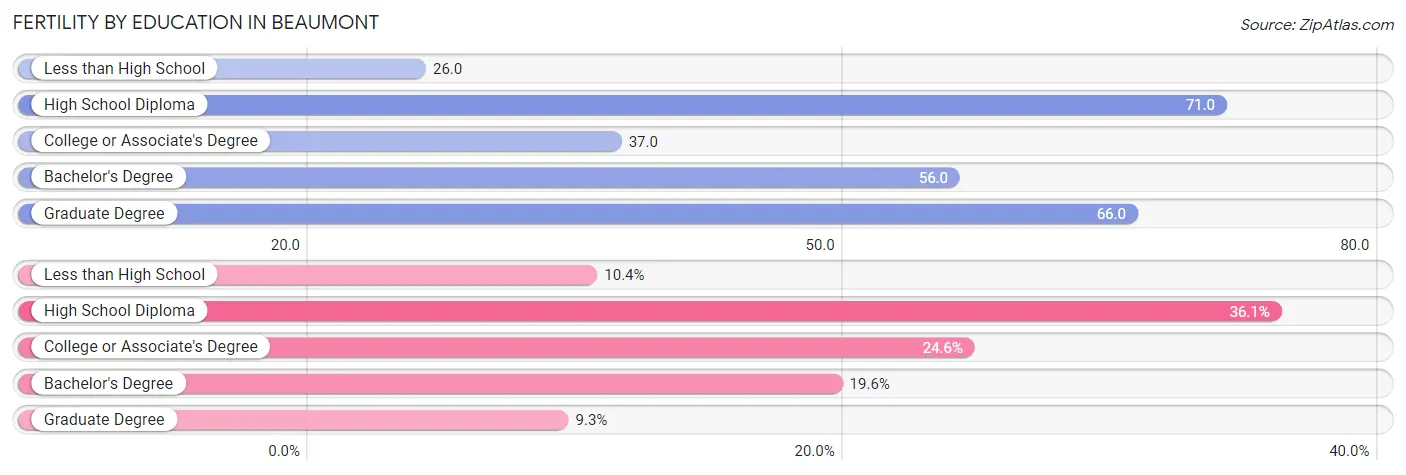
| Educational Attainment | Women with Births | Births / 1,000 Women |
| Less than High School | 135 (10.4%) | 26.0 |
| High School Diploma | 467 (36.1%) | 71.0 |
| College or Associate's Degree | 318 (24.6%) | 37.0 |
| Bachelor's Degree | 254 (19.6%) | 56.0 |
| Graduate Degree | 121 (9.3%) | 66.0 |
| Total | 1,295 (100.0%) | 49.0 |
Fertility by Education by Marriage Status in Beaumont
51.7% of women with births in Beaumont are unmarried. Women with the educational attainment of bachelor's degree are most likely to be married with 100.0% of them married at childbirth, while women with the educational attainment of less than high school are least likely to be married with 83.7% of them unmarried at childbirth.
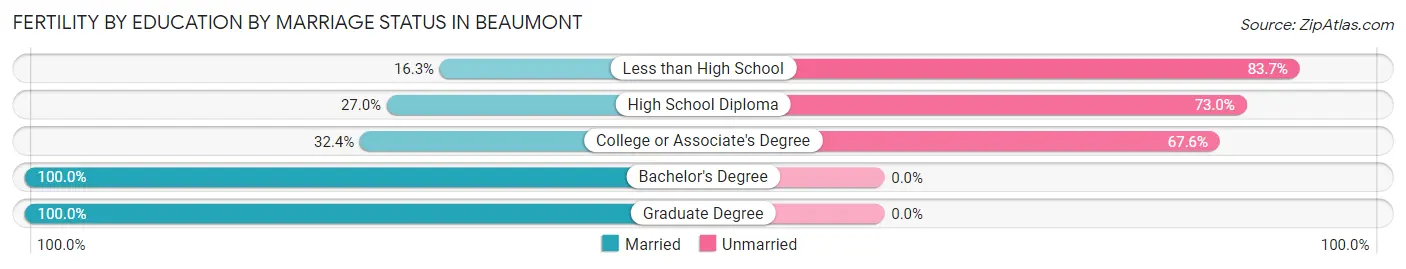
| Educational Attainment | Married | Unmarried |
| Less than High School | 22 (16.3%) | 113 (83.7%) |
| High School Diploma | 126 (27.0%) | 341 (73.0%) |
| College or Associate's Degree | 103 (32.4%) | 215 (67.6%) |
| Bachelor's Degree | 254 (100.0%) | 0 (0.0%) |
| Graduate Degree | 121 (100.0%) | 0 (0.0%) |
| Total | 625 (48.3%) | 670 (51.7%) |
Employment Characteristics in Beaumont
Employment by Class of Employer in Beaumont
Among the 49,295 employed individuals in Beaumont, private company employees (36,689 | 74.4%), state government employees (3,094 | 6.3%), and local government employees (2,622 | 5.3%) make up the most common classes of employment.
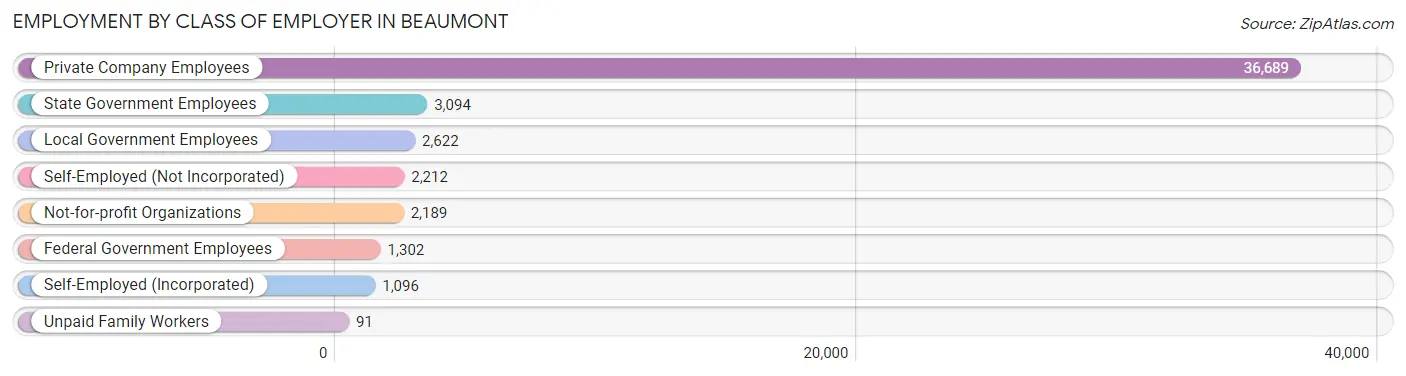
| Employer Class | # Employees | % Employees |
| Private Company Employees | 36,689 | 74.4% |
| Self-Employed (Incorporated) | 1,096 | 2.2% |
| Self-Employed (Not Incorporated) | 2,212 | 4.5% |
| Not-for-profit Organizations | 2,189 | 4.4% |
| Local Government Employees | 2,622 | 5.3% |
| State Government Employees | 3,094 | 6.3% |
| Federal Government Employees | 1,302 | 2.6% |
| Unpaid Family Workers | 91 | 0.2% |
| Total | 49,295 | 100.0% |
Employment Status by Age in Beaumont
According to the labor force statistics for Beaumont, out of the total population over 16 years of age (88,740), 59.8% or 53,067 individuals are in the labor force, with 5.3% or 2,813 of them unemployed. The age group with the highest labor force participation rate is 30 to 34 years, with 81.7% or 6,732 individuals in the labor force. Within the labor force, the 20 to 24 years age range has the highest percentage of unemployed individuals, with 10.8% or 656 of them being unemployed.
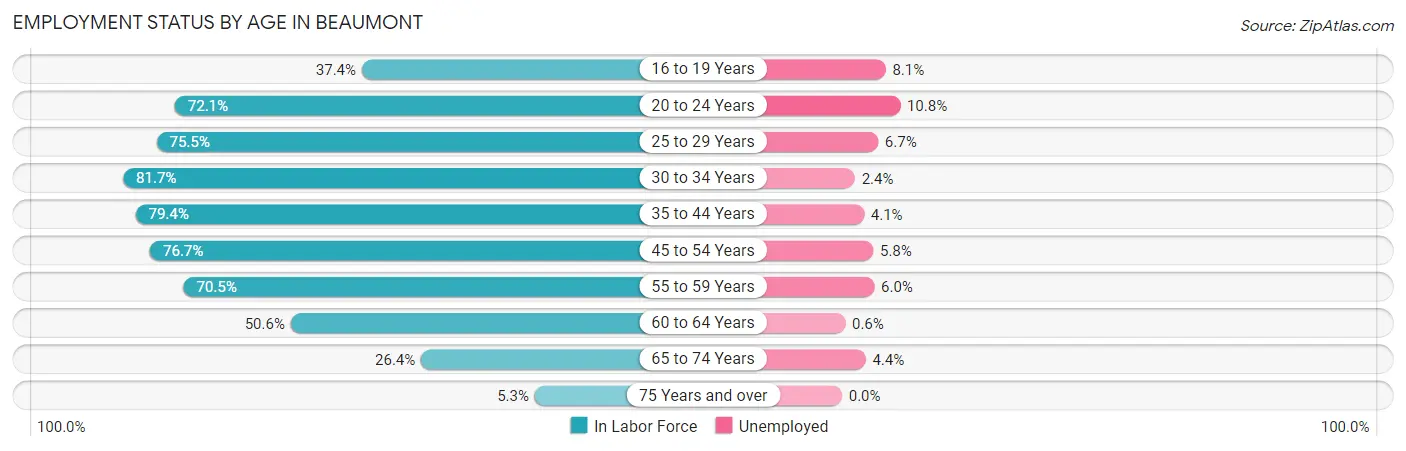
| Age Bracket | In Labor Force | Unemployed |
| 16 to 19 Years | 2,105 (37.4%) | 171 (8.1%) |
| 20 to 24 Years | 6,076 (72.1%) | 656 (10.8%) |
| 25 to 29 Years | 6,324 (75.5%) | 424 (6.7%) |
| 30 to 34 Years | 6,732 (81.7%) | 162 (2.4%) |
| 35 to 44 Years | 11,221 (79.4%) | 460 (4.1%) |
| 45 to 54 Years | 9,077 (76.7%) | 526 (5.8%) |
| 55 to 59 Years | 4,561 (70.5%) | 274 (6.0%) |
| 60 to 64 Years | 3,743 (50.6%) | 22 (0.6%) |
| 65 to 74 Years | 2,858 (26.4%) | 126 (4.4%) |
| 75 Years and over | 393 (5.3%) | 0 (0.0%) |
| Total | 53,067 (59.8%) | 2,813 (5.3%) |
Employment Status by Educational Attainment in Beaumont
According to labor force statistics for Beaumont, 73.8% of individuals (41,659) out of the total population between 25 and 64 years of age (56,449) are in the labor force, with 4.5% or 1,875 of them being unemployed. The group with the highest labor force participation rate are those with the educational attainment of bachelor's degree or higher, with 83.8% or 12,304 individuals in the labor force. Within the labor force, individuals with less than high school education have the highest percentage of unemployment, with 7.4% or 381 of them being unemployed.
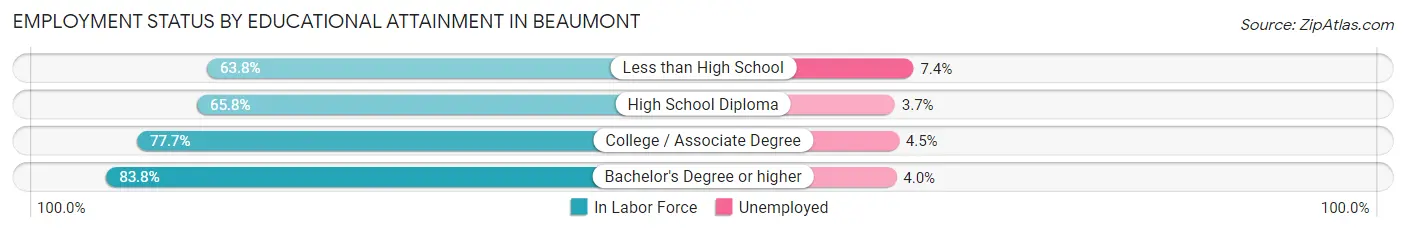
| Educational Attainment | In Labor Force | Unemployed |
| Less than High School | 5,154 (63.8%) | 598 (7.4%) |
| High School Diploma | 10,923 (65.8%) | 614 (3.7%) |
| College / Associate Degree | 13,277 (77.7%) | 769 (4.5%) |
| Bachelor's Degree or higher | 12,304 (83.8%) | 587 (4.0%) |
| Total | 41,659 (73.8%) | 2,540 (4.5%) |
Employment Occupations by Sex in Beaumont
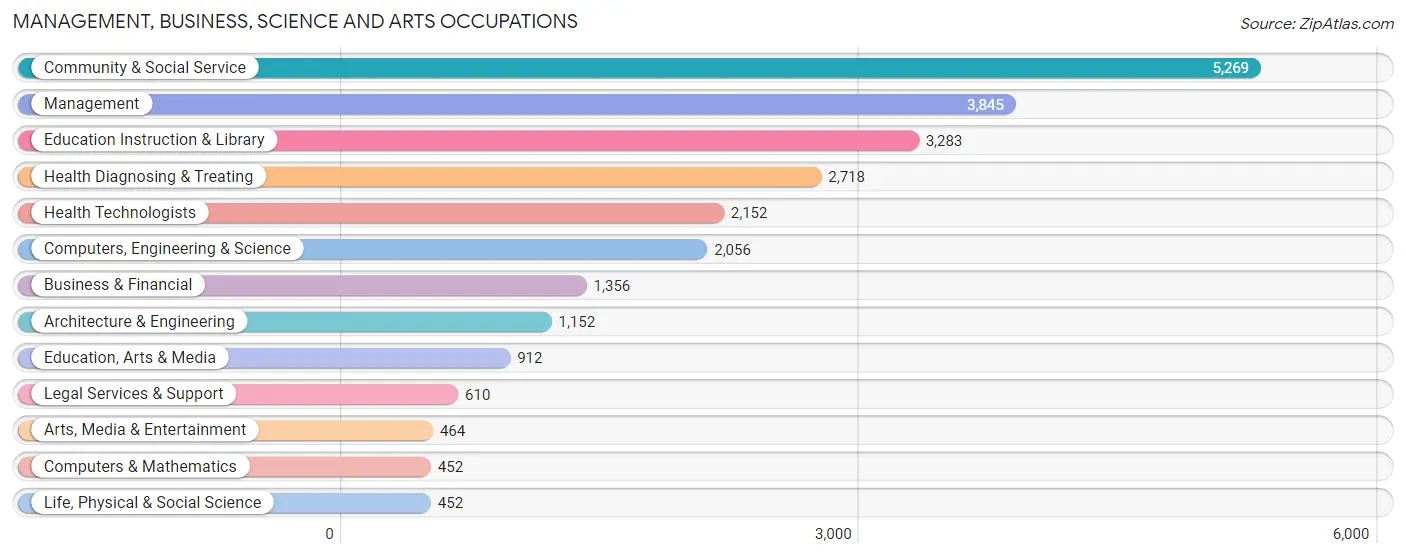
Management, Business, Science and Arts Occupations
The most common Management, Business, Science and Arts occupations in Beaumont are Community & Social Service (5,269 | 10.5%), Management (3,845 | 7.7%), Education Instruction & Library (3,283 | 6.6%), Health Diagnosing & Treating (2,718 | 5.4%), and Health Technologists (2,152 | 4.3%).
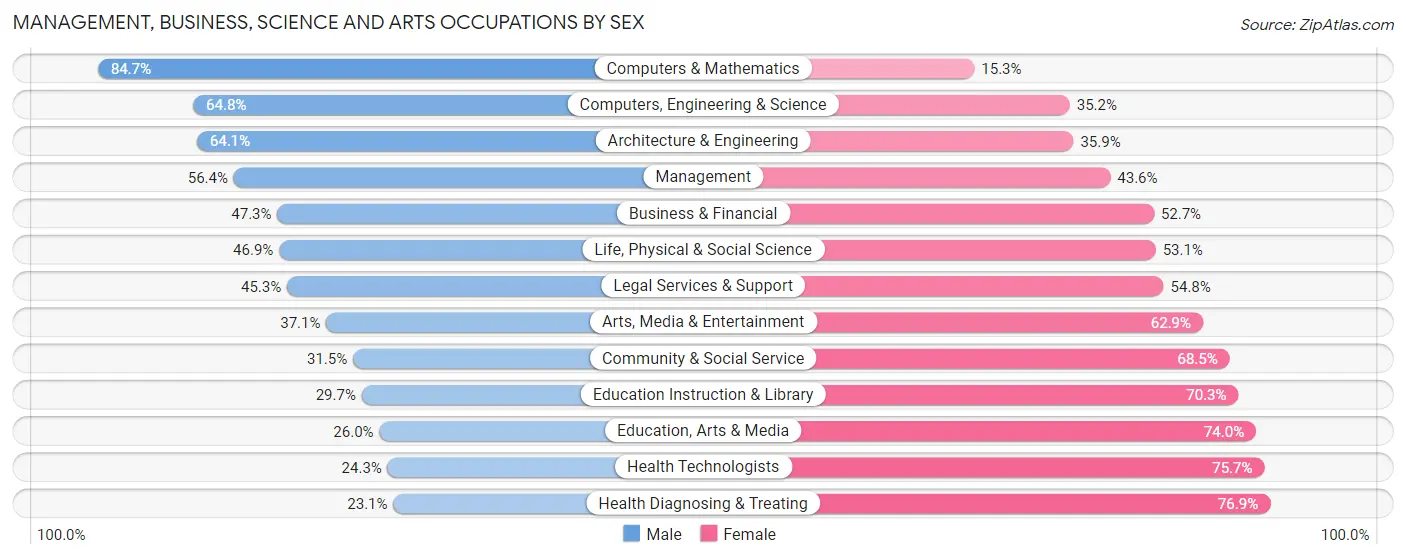
Management, Business, Science and Arts Occupations by Sex
Within the Management, Business, Science and Arts occupations in Beaumont, the most male-oriented occupations are Computers & Mathematics (84.7%), Computers, Engineering & Science (64.8%), and Architecture & Engineering (64.1%), while the most female-oriented occupations are Health Diagnosing & Treating (76.9%), Health Technologists (75.7%), and Education, Arts & Media (74.0%).
| Occupation | Male | Female |
| Management | 2,167 (56.4%) | 1,678 (43.6%) |
| Business & Financial | 641 (47.3%) | 715 (52.7%) |
| Computers, Engineering & Science | 1,333 (64.8%) | 723 (35.2%) |
| Computers & Mathematics | 383 (84.7%) | 69 (15.3%) |
| Architecture & Engineering | 738 (64.1%) | 414 (35.9%) |
| Life, Physical & Social Science | 212 (46.9%) | 240 (53.1%) |
| Community & Social Service | 1,659 (31.5%) | 3,610 (68.5%) |
| Education, Arts & Media | 237 (26.0%) | 675 (74.0%) |
| Legal Services & Support | 276 (45.3%) | 334 (54.7%) |
| Education Instruction & Library | 974 (29.7%) | 2,309 (70.3%) |
| Arts, Media & Entertainment | 172 (37.1%) | 292 (62.9%) |
| Health Diagnosing & Treating | 627 (23.1%) | 2,091 (76.9%) |
| Health Technologists | 522 (24.3%) | 1,630 (75.7%) |
| Total (Category) | 6,427 (42.2%) | 8,817 (57.8%) |
| Total (Overall) | 26,006 (52.0%) | 23,977 (48.0%) |
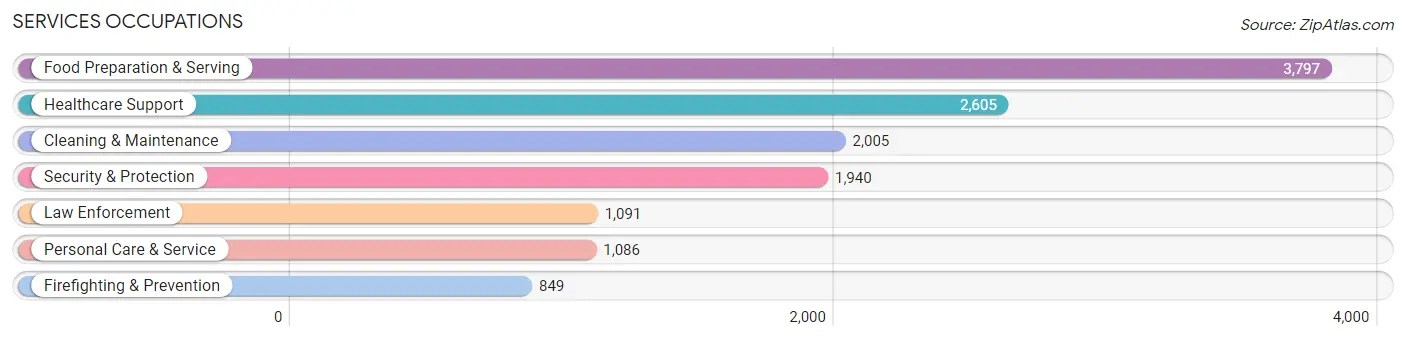
Services Occupations
The most common Services occupations in Beaumont are Food Preparation & Serving (3,797 | 7.6%), Healthcare Support (2,605 | 5.2%), Cleaning & Maintenance (2,005 | 4.0%), Security & Protection (1,940 | 3.9%), and Law Enforcement (1,091 | 2.2%).
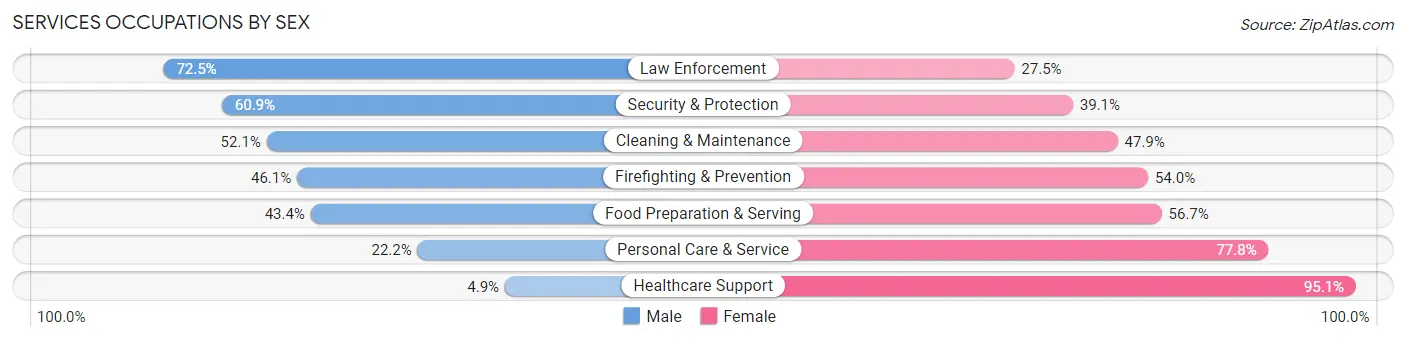
Services Occupations by Sex
Within the Services occupations in Beaumont, the most male-oriented occupations are Law Enforcement (72.5%), Security & Protection (60.9%), and Cleaning & Maintenance (52.1%), while the most female-oriented occupations are Healthcare Support (95.1%), Personal Care & Service (77.8%), and Food Preparation & Serving (56.7%).
| Occupation | Male | Female |
| Healthcare Support | 127 (4.9%) | 2,478 (95.1%) |
| Security & Protection | 1,182 (60.9%) | 758 (39.1%) |
| Firefighting & Prevention | 391 (46.1%) | 458 (53.9%) |
| Law Enforcement | 791 (72.5%) | 300 (27.5%) |
| Food Preparation & Serving | 1,646 (43.3%) | 2,151 (56.7%) |
| Cleaning & Maintenance | 1,044 (52.1%) | 961 (47.9%) |
| Personal Care & Service | 241 (22.2%) | 845 (77.8%) |
| Total (Category) | 4,240 (37.1%) | 7,193 (62.9%) |
| Total (Overall) | 26,006 (52.0%) | 23,977 (48.0%) |
Sales and Office Occupations
The most common Sales and Office occupations in Beaumont are Sales & Related (6,170 | 12.3%), and Office & Administration (4,426 | 8.9%).

Sales and Office Occupations by Sex
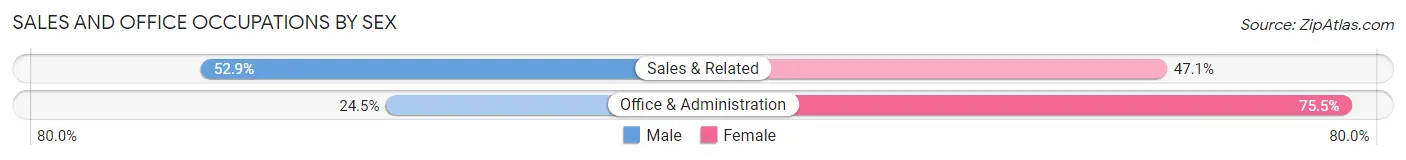
| Occupation | Male | Female |
| Sales & Related | 3,263 (52.9%) | 2,907 (47.1%) |
| Office & Administration | 1,085 (24.5%) | 3,341 (75.5%) |
| Total (Category) | 4,348 (41.0%) | 6,248 (59.0%) |
| Total (Overall) | 26,006 (52.0%) | 23,977 (48.0%) |
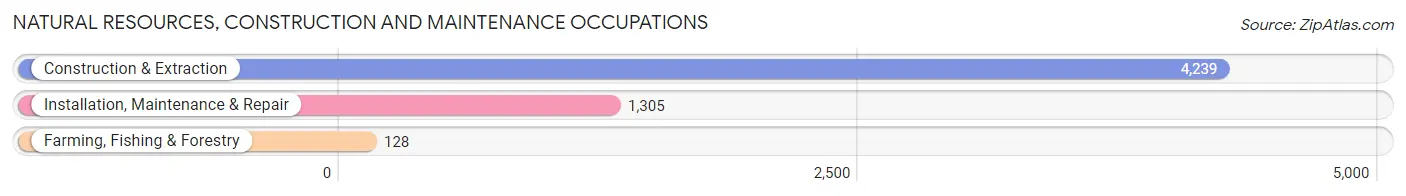
Natural Resources, Construction and Maintenance Occupations
The most common Natural Resources, Construction and Maintenance occupations in Beaumont are Construction & Extraction (4,239 | 8.5%), Installation, Maintenance & Repair (1,305 | 2.6%), and Farming, Fishing & Forestry (128 | 0.3%).
Natural Resources, Construction and Maintenance Occupations by Sex
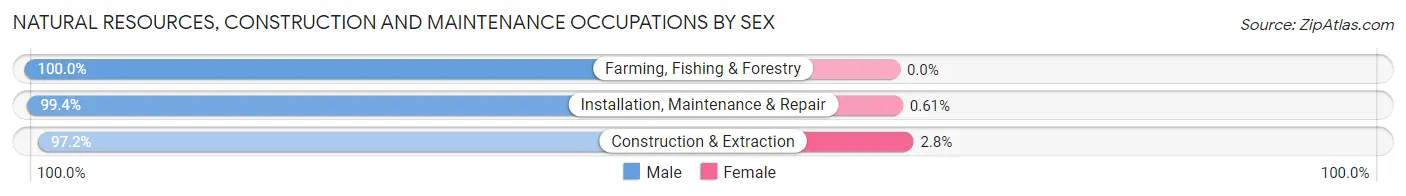
| Occupation | Male | Female |
| Farming, Fishing & Forestry | 128 (100.0%) | 0 (0.0%) |
| Construction & Extraction | 4,119 (97.2%) | 120 (2.8%) |
| Installation, Maintenance & Repair | 1,297 (99.4%) | 8 (0.6%) |
| Total (Category) | 5,544 (97.7%) | 128 (2.3%) |
| Total (Overall) | 26,006 (52.0%) | 23,977 (48.0%) |
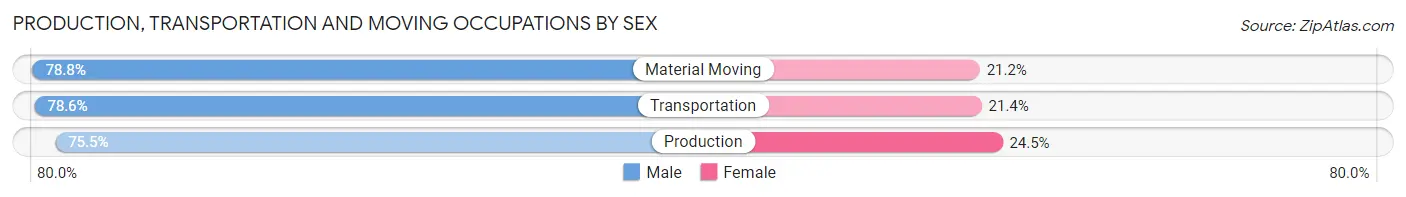
Production, Transportation and Moving Occupations
The most common Production, Transportation and Moving occupations in Beaumont are Production (2,882 | 5.8%), Material Moving (2,202 | 4.4%), and Transportation (1,954 | 3.9%).
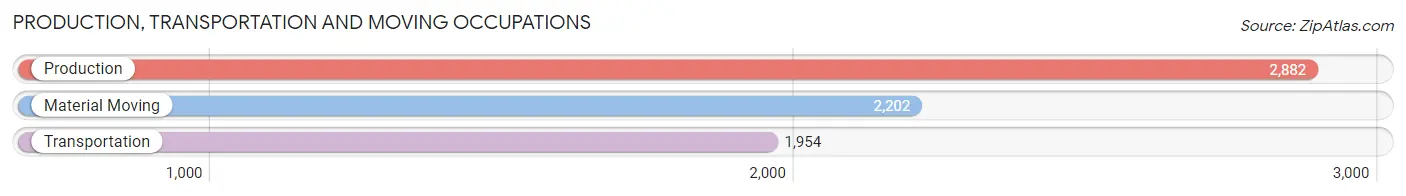
Production, Transportation and Moving Occupations by Sex
| Occupation | Male | Female |
| Production | 2,176 (75.5%) | 706 (24.5%) |
| Transportation | 1,535 (78.6%) | 419 (21.4%) |
| Material Moving | 1,736 (78.8%) | 466 (21.2%) |
| Total (Category) | 5,447 (77.4%) | 1,591 (22.6%) |
| Total (Overall) | 26,006 (52.0%) | 23,977 (48.0%) |
Employment Industries by Sex in Beaumont
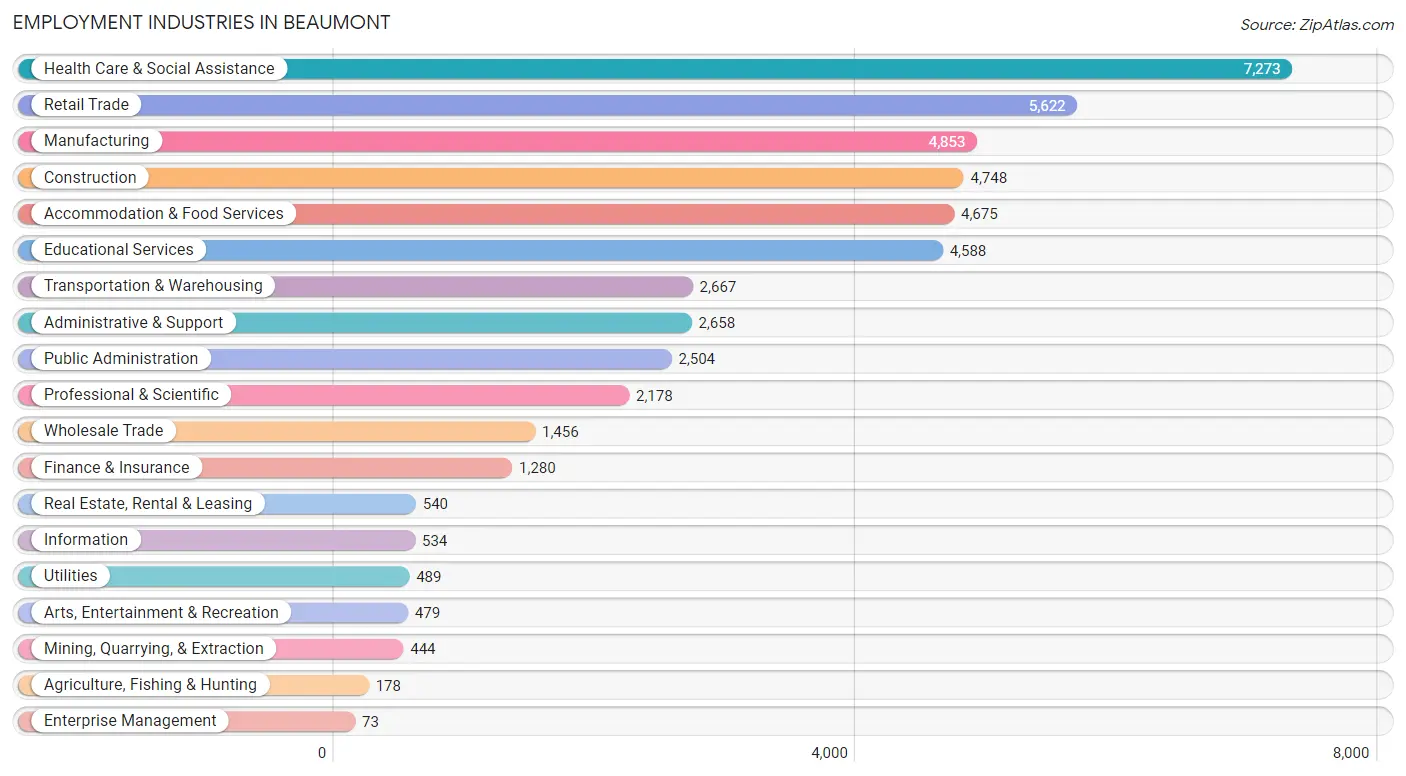
Employment Industries in Beaumont
The major employment industries in Beaumont include Health Care & Social Assistance (7,273 | 14.5%), Retail Trade (5,622 | 11.3%), Manufacturing (4,853 | 9.7%), Construction (4,748 | 9.5%), and Accommodation & Food Services (4,675 | 9.3%).
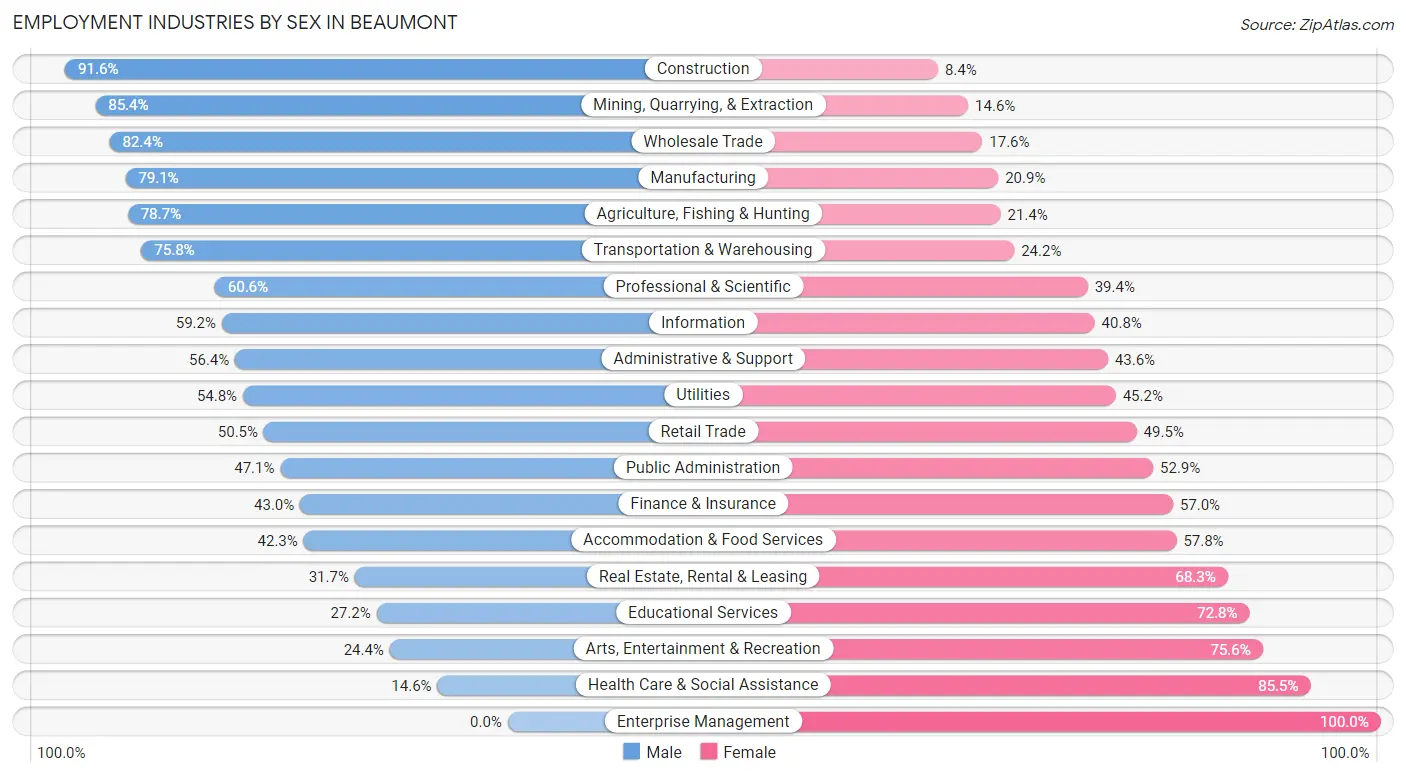
Employment Industries by Sex in Beaumont
The Beaumont industries that see more men than women are Construction (91.6%), Mining, Quarrying, & Extraction (85.4%), and Wholesale Trade (82.4%), whereas the industries that tend to have a higher number of women are Enterprise Management (100.0%), Health Care & Social Assistance (85.5%), and Arts, Entertainment & Recreation (75.6%).
| Industry | Male | Female |
| Agriculture, Fishing & Hunting | 140 (78.6%) | 38 (21.3%) |
| Mining, Quarrying, & Extraction | 379 (85.4%) | 65 (14.6%) |
| Construction | 4,349 (91.6%) | 399 (8.4%) |
| Manufacturing | 3,840 (79.1%) | 1,013 (20.9%) |
| Wholesale Trade | 1,200 (82.4%) | 256 (17.6%) |
| Retail Trade | 2,838 (50.5%) | 2,784 (49.5%) |
| Transportation & Warehousing | 2,022 (75.8%) | 645 (24.2%) |
| Utilities | 268 (54.8%) | 221 (45.2%) |
| Information | 316 (59.2%) | 218 (40.8%) |
| Finance & Insurance | 550 (43.0%) | 730 (57.0%) |
| Real Estate, Rental & Leasing | 171 (31.7%) | 369 (68.3%) |
| Professional & Scientific | 1,320 (60.6%) | 858 (39.4%) |
| Enterprise Management | 0 (0.0%) | 73 (100.0%) |
| Administrative & Support | 1,500 (56.4%) | 1,158 (43.6%) |
| Educational Services | 1,246 (27.2%) | 3,342 (72.8%) |
| Health Care & Social Assistance | 1,058 (14.5%) | 6,215 (85.5%) |
| Arts, Entertainment & Recreation | 117 (24.4%) | 362 (75.6%) |
| Accommodation & Food Services | 1,975 (42.2%) | 2,700 (57.8%) |
| Public Administration | 1,179 (47.1%) | 1,325 (52.9%) |
| Total | 26,006 (52.0%) | 23,977 (48.0%) |
Education in Beaumont
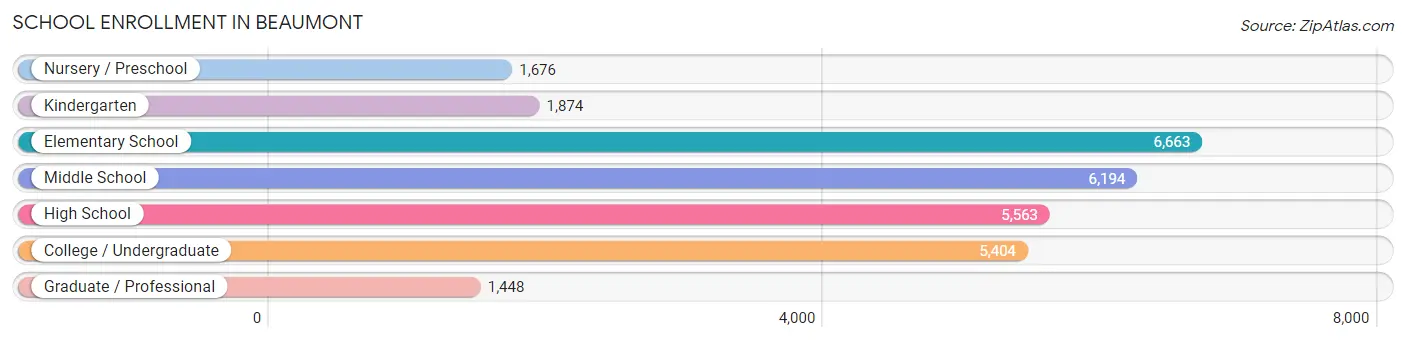
School Enrollment in Beaumont
The most common levels of schooling among the 28,822 students in Beaumont are elementary school (6,663 | 23.1%), middle school (6,194 | 21.5%), and high school (5,563 | 19.3%).
| School Level | # Students | % Students |
| Nursery / Preschool | 1,676 | 5.8% |
| Kindergarten | 1,874 | 6.5% |
| Elementary School | 6,663 | 23.1% |
| Middle School | 6,194 | 21.5% |
| High School | 5,563 | 19.3% |
| College / Undergraduate | 5,404 | 18.8% |
| Graduate / Professional | 1,448 | 5.0% |
| Total | 28,822 | 100.0% |
School Enrollment by Age by Funding Source in Beaumont
Out of a total of 28,822 students who are enrolled in schools in Beaumont, 3,516 (12.2%) attend a private institution, while the remaining 25,306 (87.8%) are enrolled in public schools. The age group of 35 years and over has the highest likelihood of being enrolled in private schools, with 260 (29.5% in the age bracket) enrolled. Conversely, the age group of 20 to 24 year olds has the lowest likelihood of being enrolled in a private school, with 2,831 (94.6% in the age bracket) attending a public institution.
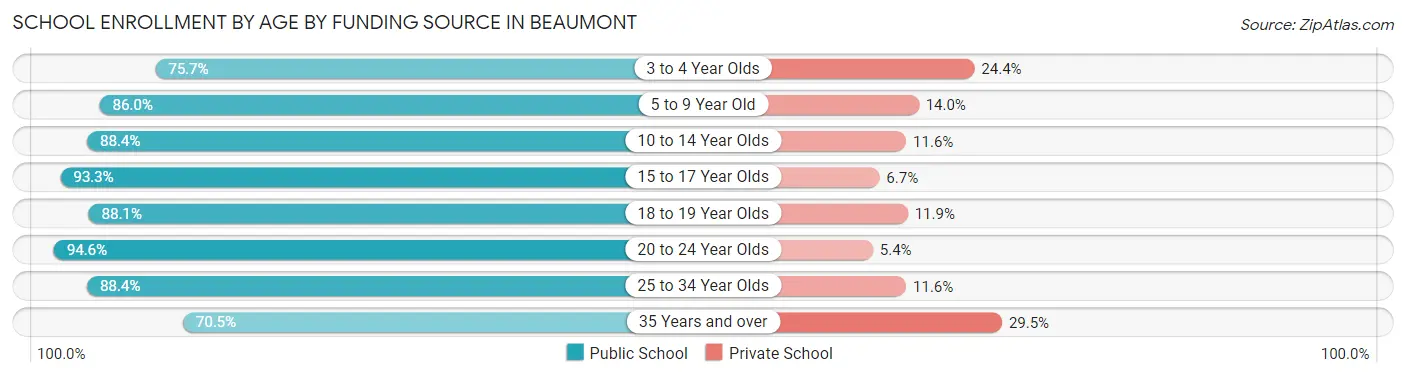
| Age Bracket | Public School | Private School |
| 3 to 4 Year Olds | 1,249 (75.6%) | 402 (24.3%) |
| 5 to 9 Year Old | 6,381 (86.0%) | 1,036 (14.0%) |
| 10 to 14 Year Olds | 7,082 (88.4%) | 933 (11.6%) |
| 15 to 17 Year Olds | 3,755 (93.3%) | 268 (6.7%) |
| 18 to 19 Year Olds | 1,935 (88.1%) | 262 (11.9%) |
| 20 to 24 Year Olds | 2,831 (94.6%) | 163 (5.4%) |
| 25 to 34 Year Olds | 1,452 (88.4%) | 191 (11.6%) |
| 35 Years and over | 622 (70.5%) | 260 (29.5%) |
| Total | 25,306 (87.8%) | 3,516 (12.2%) |
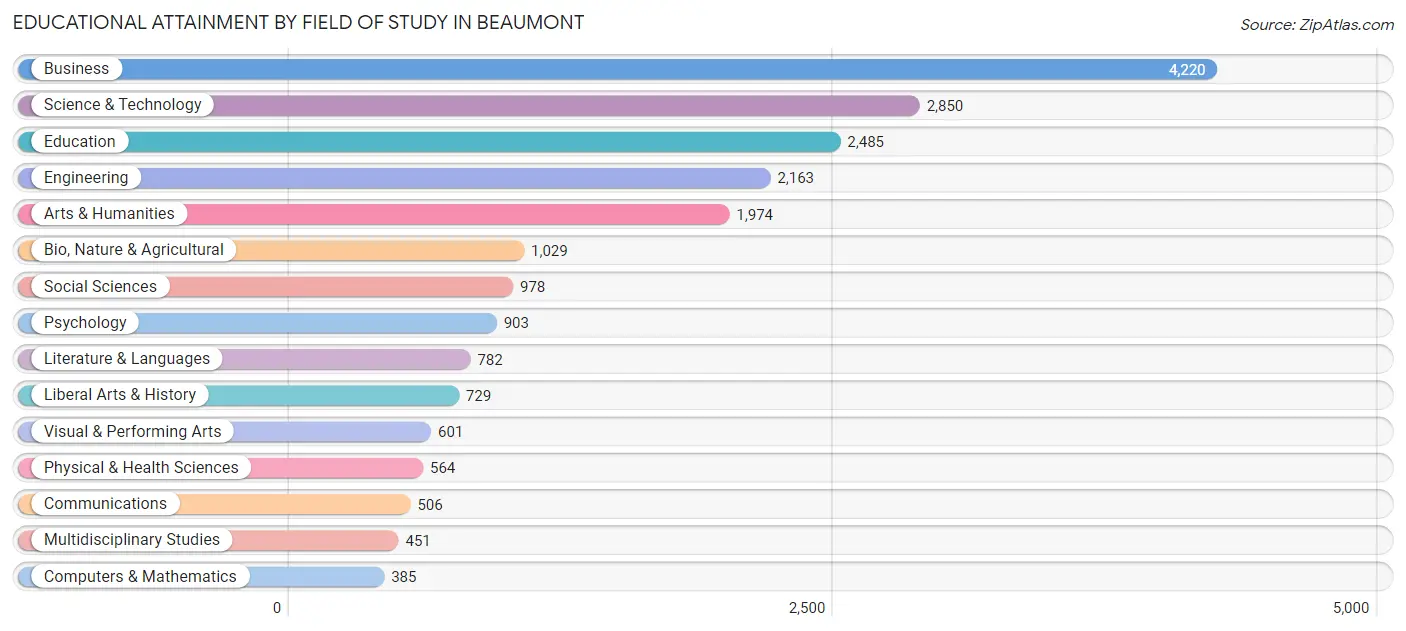
Educational Attainment by Field of Study in Beaumont
Business (4,220 | 20.5%), science & technology (2,850 | 13.8%), education (2,485 | 12.0%), engineering (2,163 | 10.5%), and arts & humanities (1,974 | 9.6%) are the most common fields of study among 20,620 individuals in Beaumont who have obtained a bachelor's degree or higher.
| Field of Study | # Graduates | % Graduates |
| Computers & Mathematics | 385 | 1.9% |
| Bio, Nature & Agricultural | 1,029 | 5.0% |
| Physical & Health Sciences | 564 | 2.7% |
| Psychology | 903 | 4.4% |
| Social Sciences | 978 | 4.7% |
| Engineering | 2,163 | 10.5% |
| Multidisciplinary Studies | 451 | 2.2% |
| Science & Technology | 2,850 | 13.8% |
| Business | 4,220 | 20.5% |
| Education | 2,485 | 12.0% |
| Literature & Languages | 782 | 3.8% |
| Liberal Arts & History | 729 | 3.5% |
| Visual & Performing Arts | 601 | 2.9% |
| Communications | 506 | 2.5% |
| Arts & Humanities | 1,974 | 9.6% |
| Total | 20,620 | 100.0% |
Transportation & Commute in Beaumont
Vehicle Availability by Sex in Beaumont
The most prevalent vehicle ownership categories in Beaumont are males with 2 vehicles (11,472, accounting for 45.2%) and females with 2 vehicles (9,931, making up 49.3%).
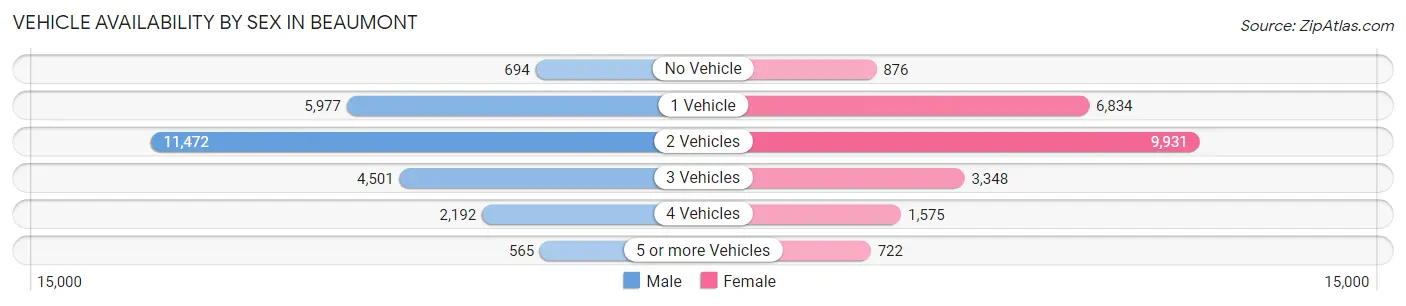
| Vehicles Available | Male | Female |
| No Vehicle | 694 (2.7%) | 876 (3.8%) |
| 1 Vehicle | 5,977 (23.5%) | 6,834 (29.3%) |
| 2 Vehicles | 11,472 (45.2%) | 9,931 (42.6%) |
| 3 Vehicles | 4,501 (17.7%) | 3,348 (14.4%) |
| 4 Vehicles | 2,192 (8.6%) | 1,575 (6.8%) |
| 5 or more Vehicles | 565 (2.2%) | 722 (3.1%) |
| Total | 25,401 (100.0%) | 23,286 (100.0%) |
Commute Time in Beaumont
The most frequently occuring commute durations in Beaumont are 20 to 24 minutes (10,750 commuters, 22.6%), 15 to 19 minutes (10,644 commuters, 22.4%), and 10 to 14 minutes (8,566 commuters, 18.0%).
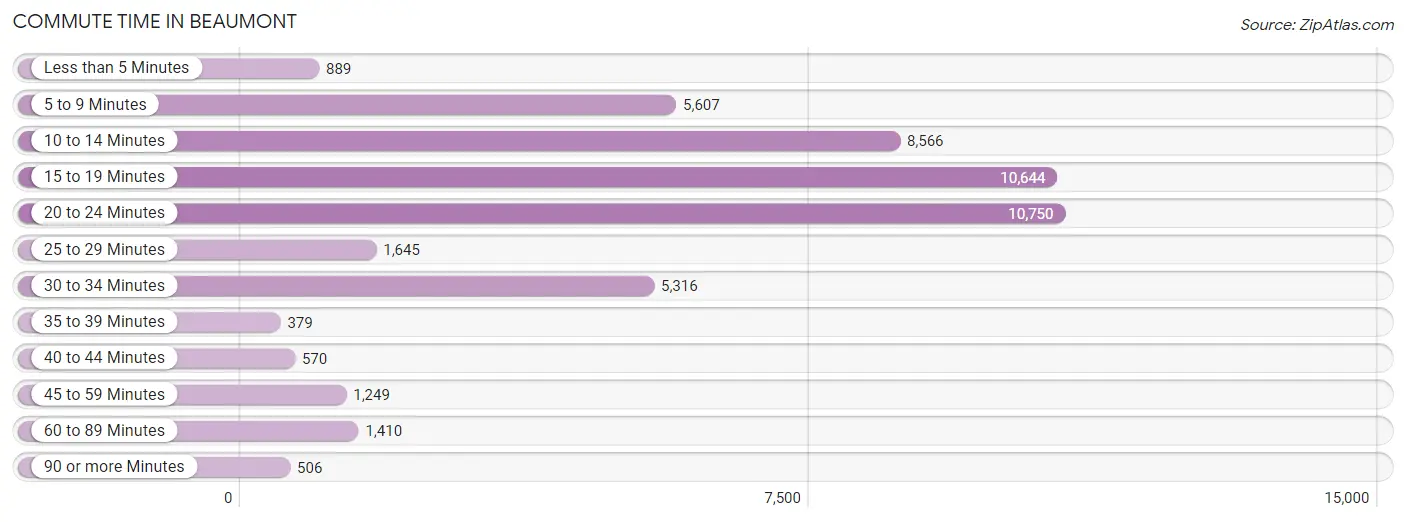
| Commute Time | # Commuters | % Commuters |
| Less than 5 Minutes | 889 | 1.9% |
| 5 to 9 Minutes | 5,607 | 11.8% |
| 10 to 14 Minutes | 8,566 | 18.0% |
| 15 to 19 Minutes | 10,644 | 22.4% |
| 20 to 24 Minutes | 10,750 | 22.6% |
| 25 to 29 Minutes | 1,645 | 3.5% |
| 30 to 34 Minutes | 5,316 | 11.2% |
| 35 to 39 Minutes | 379 | 0.8% |
| 40 to 44 Minutes | 570 | 1.2% |
| 45 to 59 Minutes | 1,249 | 2.6% |
| 60 to 89 Minutes | 1,410 | 3.0% |
| 90 or more Minutes | 506 | 1.1% |
Commute Time by Sex in Beaumont
The most common commute times in Beaumont are 20 to 24 minutes (6,401 commuters, 25.8%) for males and 15 to 19 minutes (5,537 commuters, 24.4%) for females.
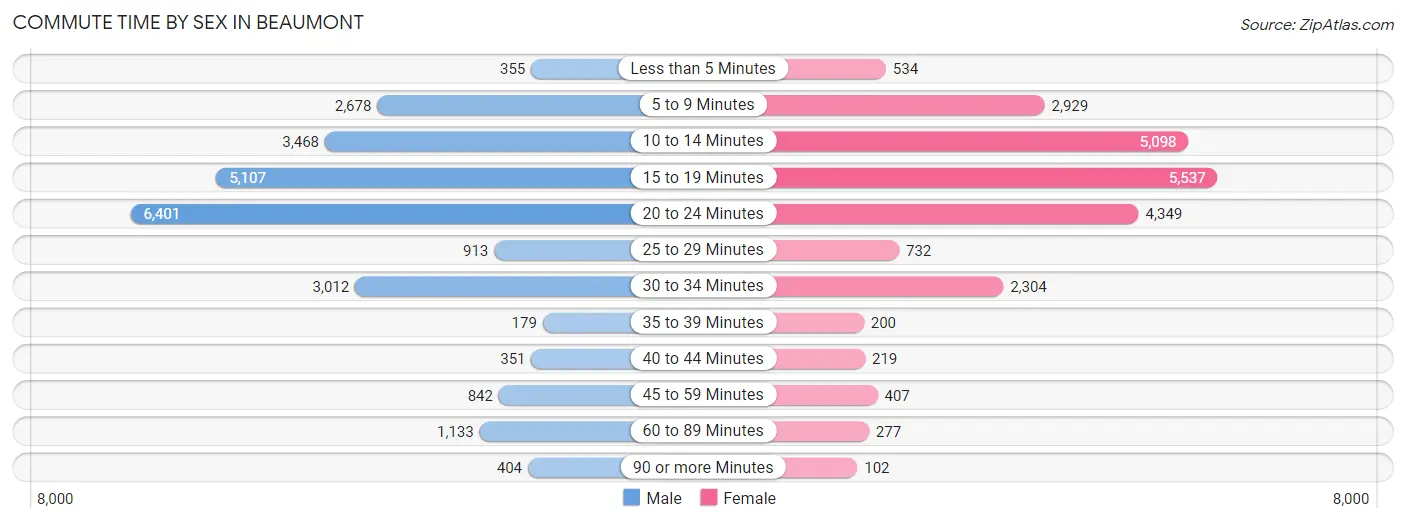
| Commute Time | Male | Female |
| Less than 5 Minutes | 355 (1.4%) | 534 (2.4%) |
| 5 to 9 Minutes | 2,678 (10.8%) | 2,929 (12.9%) |
| 10 to 14 Minutes | 3,468 (14.0%) | 5,098 (22.5%) |
| 15 to 19 Minutes | 5,107 (20.6%) | 5,537 (24.4%) |
| 20 to 24 Minutes | 6,401 (25.8%) | 4,349 (19.2%) |
| 25 to 29 Minutes | 913 (3.7%) | 732 (3.2%) |
| 30 to 34 Minutes | 3,012 (12.1%) | 2,304 (10.2%) |
| 35 to 39 Minutes | 179 (0.7%) | 200 (0.9%) |
| 40 to 44 Minutes | 351 (1.4%) | 219 (1.0%) |
| 45 to 59 Minutes | 842 (3.4%) | 407 (1.8%) |
| 60 to 89 Minutes | 1,133 (4.6%) | 277 (1.2%) |
| 90 or more Minutes | 404 (1.6%) | 102 (0.4%) |
Time of Departure to Work by Sex in Beaumont
The most frequent times of departure to work in Beaumont are 7:00 AM to 7:29 AM (3,390, 13.7%) for males and 8:00 AM to 8:29 AM (3,531, 15.6%) for females.
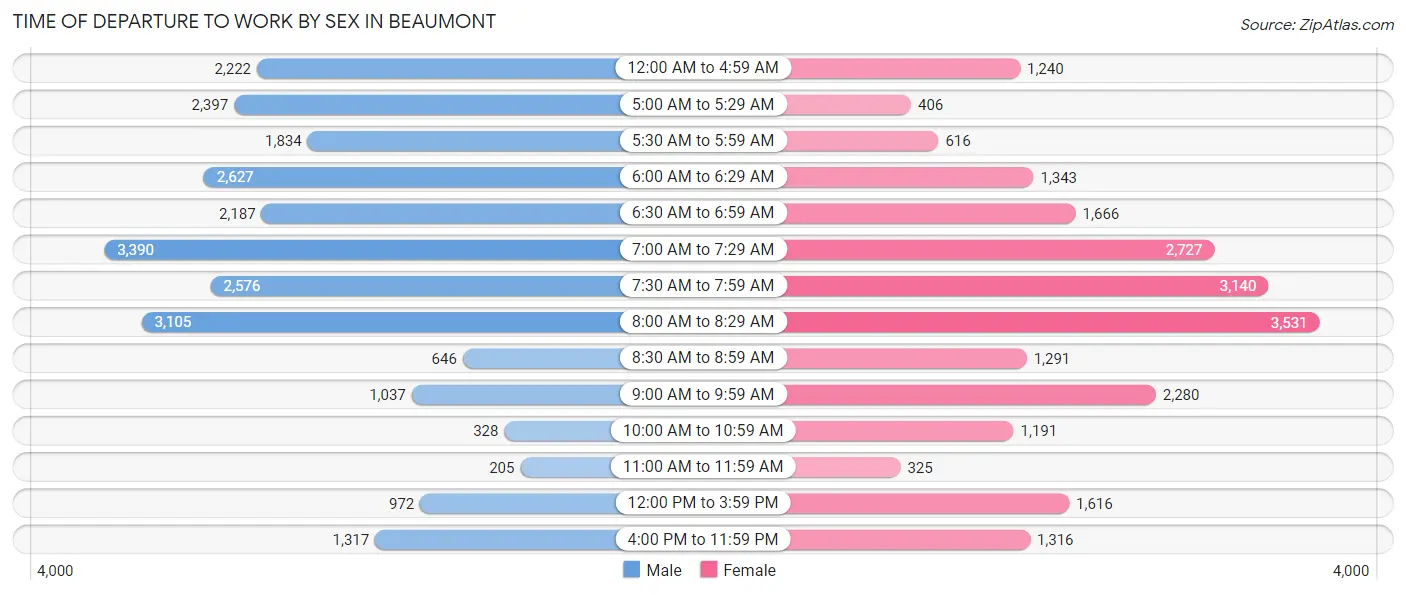
| Time of Departure | Male | Female |
| 12:00 AM to 4:59 AM | 2,222 (8.9%) | 1,240 (5.5%) |
| 5:00 AM to 5:29 AM | 2,397 (9.7%) | 406 (1.8%) |
| 5:30 AM to 5:59 AM | 1,834 (7.4%) | 616 (2.7%) |
| 6:00 AM to 6:29 AM | 2,627 (10.6%) | 1,343 (5.9%) |
| 6:30 AM to 6:59 AM | 2,187 (8.8%) | 1,666 (7.3%) |
| 7:00 AM to 7:29 AM | 3,390 (13.7%) | 2,727 (12.0%) |
| 7:30 AM to 7:59 AM | 2,576 (10.4%) | 3,140 (13.8%) |
| 8:00 AM to 8:29 AM | 3,105 (12.5%) | 3,531 (15.6%) |
| 8:30 AM to 8:59 AM | 646 (2.6%) | 1,291 (5.7%) |
| 9:00 AM to 9:59 AM | 1,037 (4.2%) | 2,280 (10.1%) |
| 10:00 AM to 10:59 AM | 328 (1.3%) | 1,191 (5.2%) |
| 11:00 AM to 11:59 AM | 205 (0.8%) | 325 (1.4%) |
| 12:00 PM to 3:59 PM | 972 (3.9%) | 1,616 (7.1%) |
| 4:00 PM to 11:59 PM | 1,317 (5.3%) | 1,316 (5.8%) |
| Total | 24,843 (100.0%) | 22,688 (100.0%) |
Housing Occupancy in Beaumont
Occupancy by Ownership in Beaumont
Of the total 45,450 dwellings in Beaumont, owner-occupied units account for 24,741 (54.4%), while renter-occupied units make up 20,709 (45.6%).
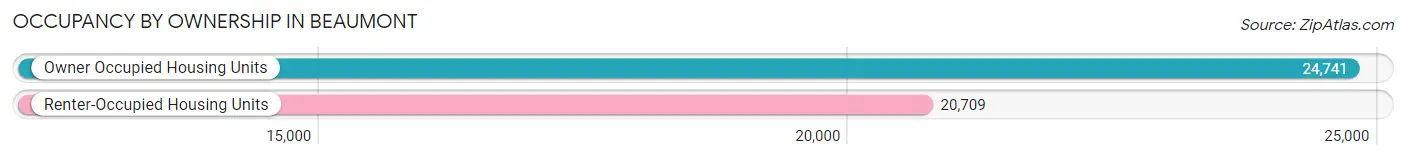
| Occupancy | # Housing Units | % Housing Units |
| Owner Occupied Housing Units | 24,741 | 54.4% |
| Renter-Occupied Housing Units | 20,709 | 45.6% |
| Total Occupied Housing Units | 45,450 | 100.0% |
Occupancy by Household Size in Beaumont
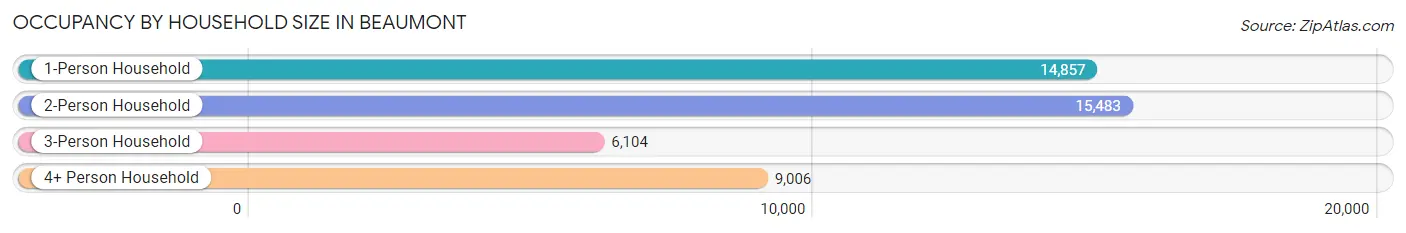
| Household Size | # Housing Units | % Housing Units |
| 1-Person Household | 14,857 | 32.7% |
| 2-Person Household | 15,483 | 34.1% |
| 3-Person Household | 6,104 | 13.4% |
| 4+ Person Household | 9,006 | 19.8% |
| Total Housing Units | 45,450 | 100.0% |
Occupancy by Ownership by Household Size in Beaumont
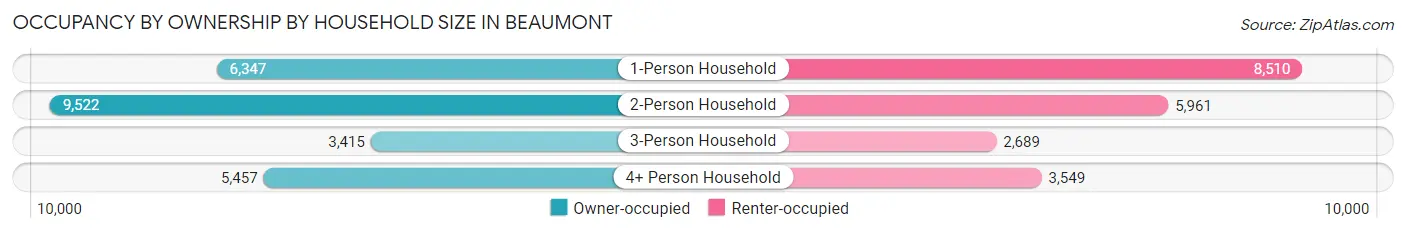
| Household Size | Owner-occupied | Renter-occupied |
| 1-Person Household | 6,347 (42.7%) | 8,510 (57.3%) |
| 2-Person Household | 9,522 (61.5%) | 5,961 (38.5%) |
| 3-Person Household | 3,415 (55.9%) | 2,689 (44.1%) |
| 4+ Person Household | 5,457 (60.6%) | 3,549 (39.4%) |
| Total Housing Units | 24,741 (54.4%) | 20,709 (45.6%) |
Occupancy by Educational Attainment in Beaumont
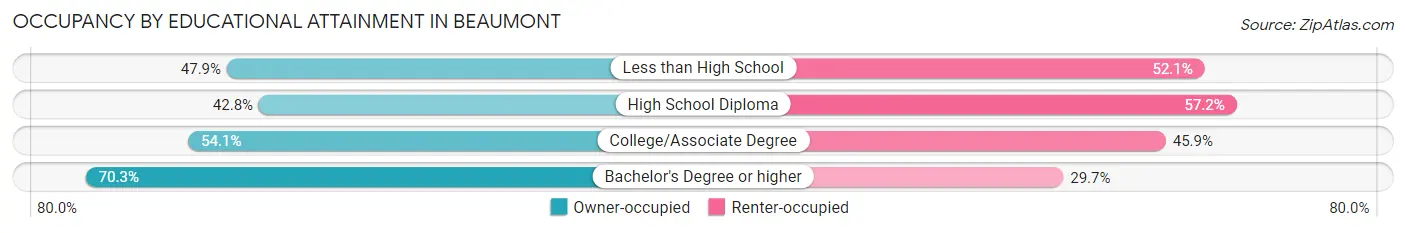
| Household Size | Owner-occupied | Renter-occupied |
| Less than High School | 2,402 (47.9%) | 2,610 (52.1%) |
| High School Diploma | 5,699 (42.8%) | 7,603 (57.2%) |
| College/Associate Degree | 8,121 (54.1%) | 6,901 (45.9%) |
| Bachelor's Degree or higher | 8,519 (70.3%) | 3,595 (29.7%) |
Occupancy by Age of Householder in Beaumont
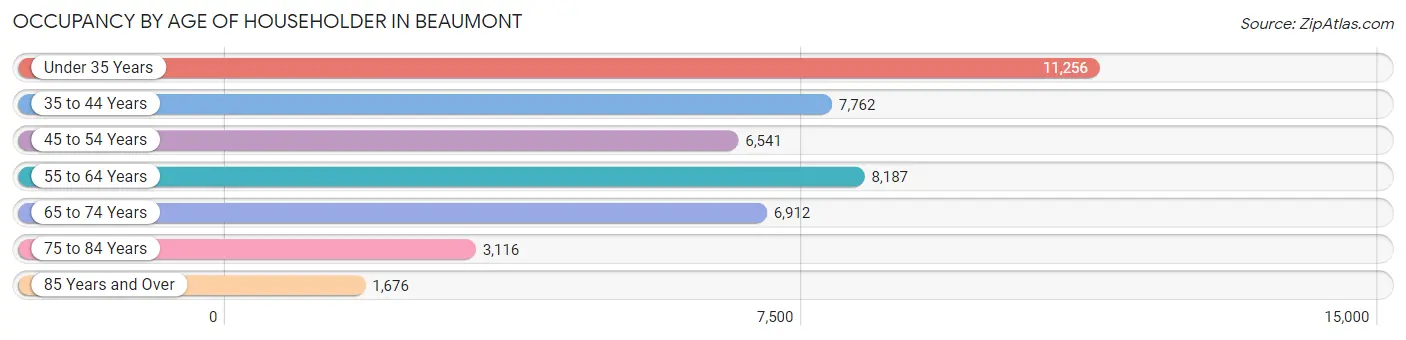
| Age Bracket | # Households | % Households |
| Under 35 Years | 11,256 | 24.8% |
| 35 to 44 Years | 7,762 | 17.1% |
| 45 to 54 Years | 6,541 | 14.4% |
| 55 to 64 Years | 8,187 | 18.0% |
| 65 to 74 Years | 6,912 | 15.2% |
| 75 to 84 Years | 3,116 | 6.9% |
| 85 Years and Over | 1,676 | 3.7% |
| Total | 45,450 | 100.0% |
Housing Finances in Beaumont
Median Income by Occupancy in Beaumont
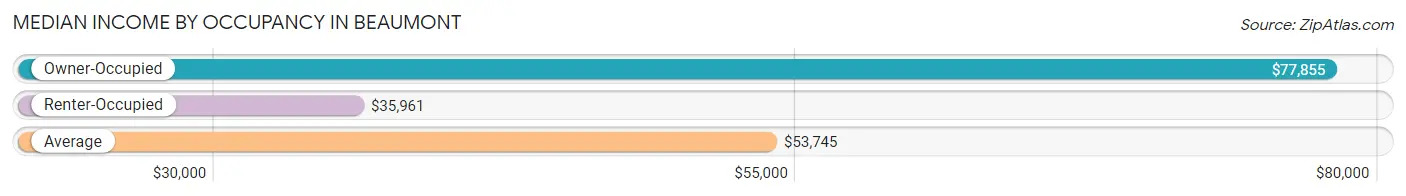
| Occupancy Type | # Households | Median Income |
| Owner-Occupied | 24,741 (54.4%) | $77,855 |
| Renter-Occupied | 20,709 (45.6%) | $35,961 |
| Average | 45,450 (100.0%) | $53,745 |
Occupancy by Householder Income Bracket in Beaumont
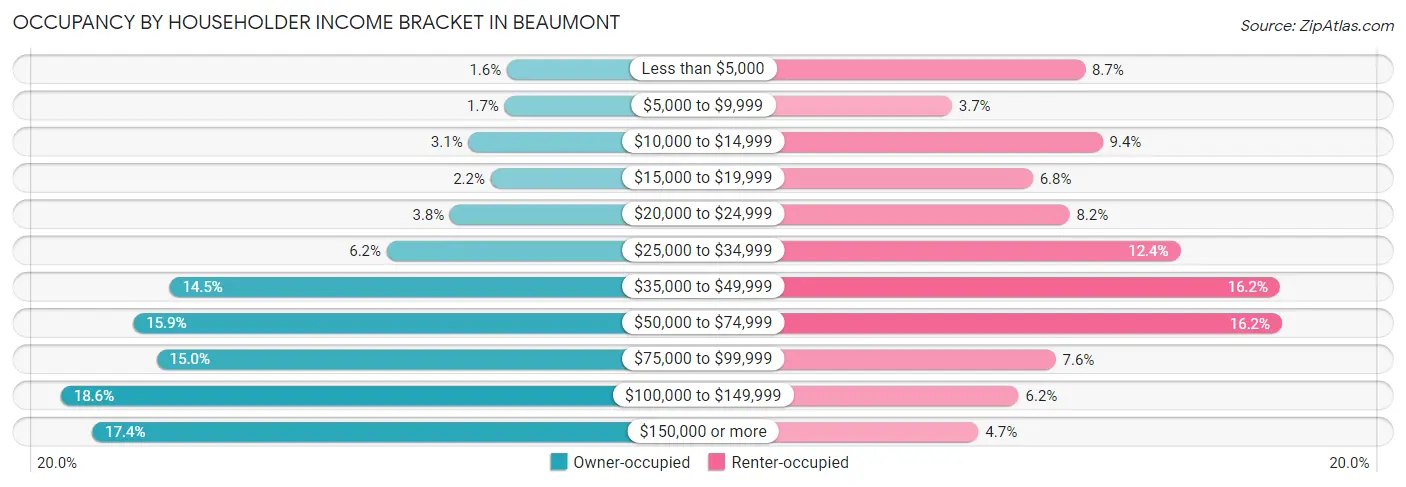
| Income Bracket | Owner-occupied | Renter-occupied |
| Less than $5,000 | 402 (1.6%) | 1,810 (8.7%) |
| $5,000 to $9,999 | 422 (1.7%) | 759 (3.7%) |
| $10,000 to $14,999 | 765 (3.1%) | 1,948 (9.4%) |
| $15,000 to $19,999 | 553 (2.2%) | 1,397 (6.8%) |
| $20,000 to $24,999 | 937 (3.8%) | 1,687 (8.2%) |
| $25,000 to $34,999 | 1,534 (6.2%) | 2,561 (12.4%) |
| $35,000 to $49,999 | 3,582 (14.5%) | 3,347 (16.2%) |
| $50,000 to $74,999 | 3,923 (15.9%) | 3,364 (16.2%) |
| $75,000 to $99,999 | 3,703 (15.0%) | 1,579 (7.6%) |
| $100,000 to $149,999 | 4,608 (18.6%) | 1,287 (6.2%) |
| $150,000 or more | 4,312 (17.4%) | 970 (4.7%) |
| Total | 24,741 (100.0%) | 20,709 (100.0%) |
Monthly Housing Cost Tiers in Beaumont
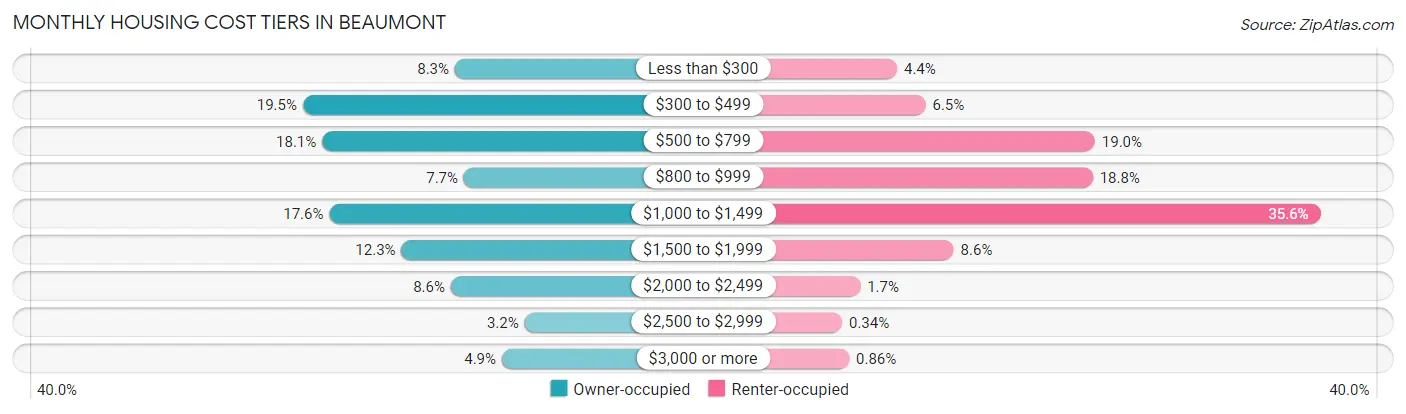
| Monthly Cost | Owner-occupied | Renter-occupied |
| Less than $300 | 2,057 (8.3%) | 909 (4.4%) |
| $300 to $499 | 4,827 (19.5%) | 1,343 (6.5%) |
| $500 to $799 | 4,476 (18.1%) | 3,927 (19.0%) |
| $800 to $999 | 1,892 (7.6%) | 3,894 (18.8%) |
| $1,000 to $1,499 | 4,344 (17.6%) | 7,367 (35.6%) |
| $1,500 to $1,999 | 3,030 (12.2%) | 1,772 (8.6%) |
| $2,000 to $2,499 | 2,129 (8.6%) | 348 (1.7%) |
| $2,500 to $2,999 | 786 (3.2%) | 71 (0.3%) |
| $3,000 or more | 1,200 (4.9%) | 178 (0.9%) |
| Total | 24,741 (100.0%) | 20,709 (100.0%) |
Physical Housing Characteristics in Beaumont
Housing Structures in Beaumont
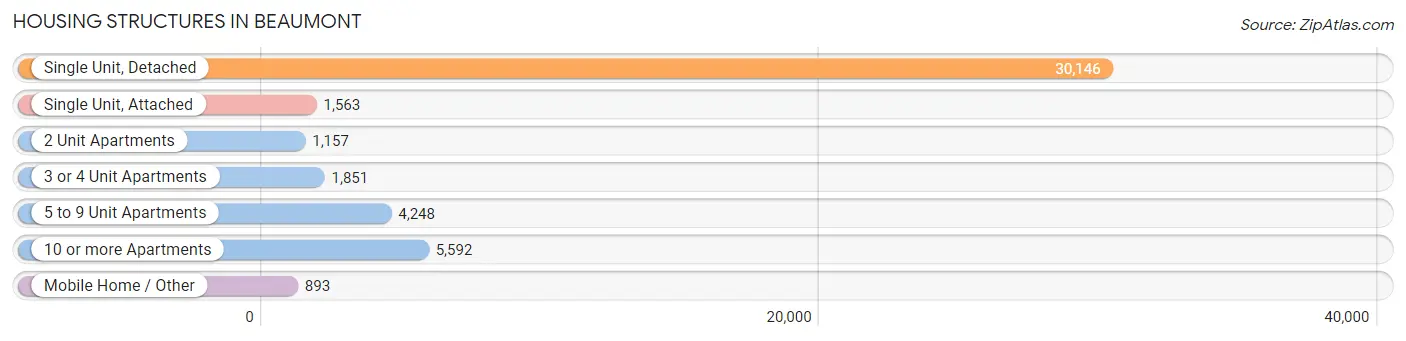
| Structure Type | # Housing Units | % Housing Units |
| Single Unit, Detached | 30,146 | 66.3% |
| Single Unit, Attached | 1,563 | 3.4% |
| 2 Unit Apartments | 1,157 | 2.5% |
| 3 or 4 Unit Apartments | 1,851 | 4.1% |
| 5 to 9 Unit Apartments | 4,248 | 9.3% |
| 10 or more Apartments | 5,592 | 12.3% |
| Mobile Home / Other | 893 | 2.0% |
| Total | 45,450 | 100.0% |
Housing Structures by Occupancy in Beaumont
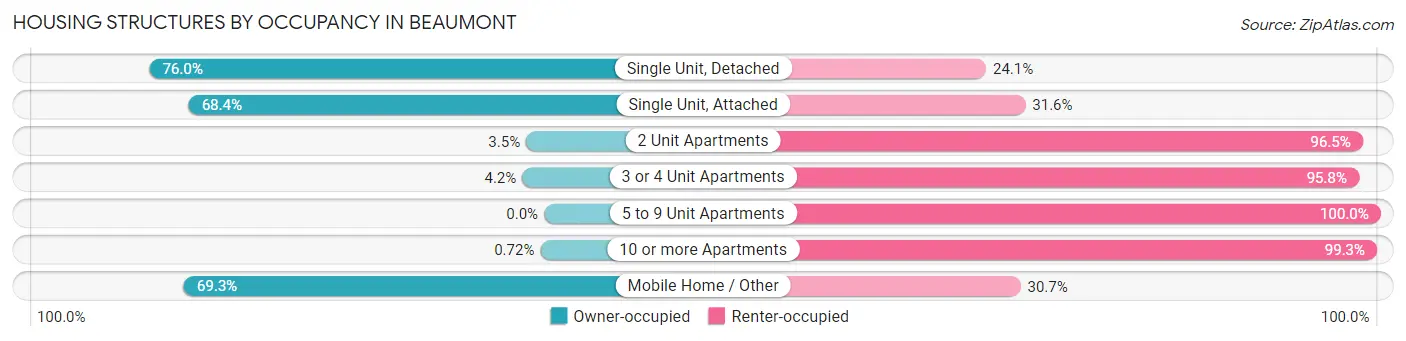
| Structure Type | Owner-occupied | Renter-occupied |
| Single Unit, Detached | 22,895 (75.9%) | 7,251 (24.0%) |
| Single Unit, Attached | 1,069 (68.4%) | 494 (31.6%) |
| 2 Unit Apartments | 40 (3.5%) | 1,117 (96.5%) |
| 3 or 4 Unit Apartments | 78 (4.2%) | 1,773 (95.8%) |
| 5 to 9 Unit Apartments | 0 (0.0%) | 4,248 (100.0%) |
| 10 or more Apartments | 40 (0.7%) | 5,552 (99.3%) |
| Mobile Home / Other | 619 (69.3%) | 274 (30.7%) |
| Total | 24,741 (54.4%) | 20,709 (45.6%) |
Housing Structures by Number of Rooms in Beaumont
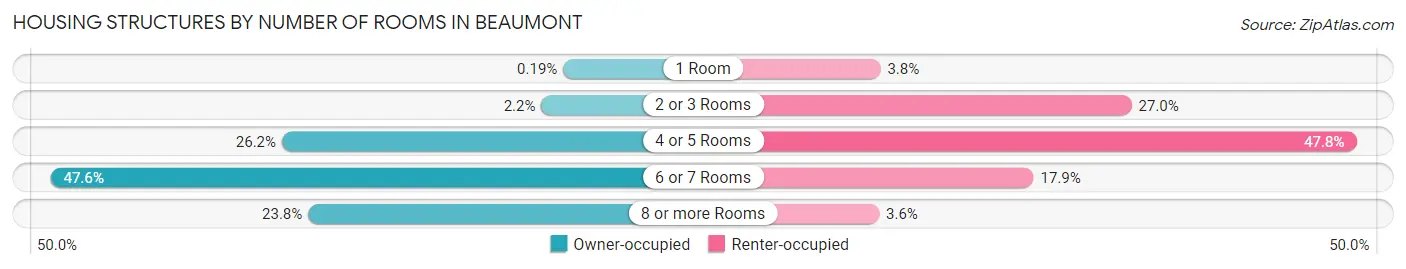
| Number of Rooms | Owner-occupied | Renter-occupied |
| 1 Room | 47 (0.2%) | 776 (3.7%) |
| 2 or 3 Rooms | 548 (2.2%) | 5,585 (27.0%) |
| 4 or 5 Rooms | 6,485 (26.2%) | 9,889 (47.7%) |
| 6 or 7 Rooms | 11,777 (47.6%) | 3,710 (17.9%) |
| 8 or more Rooms | 5,884 (23.8%) | 749 (3.6%) |
| Total | 24,741 (100.0%) | 20,709 (100.0%) |
Housing Structure by Heating Type in Beaumont
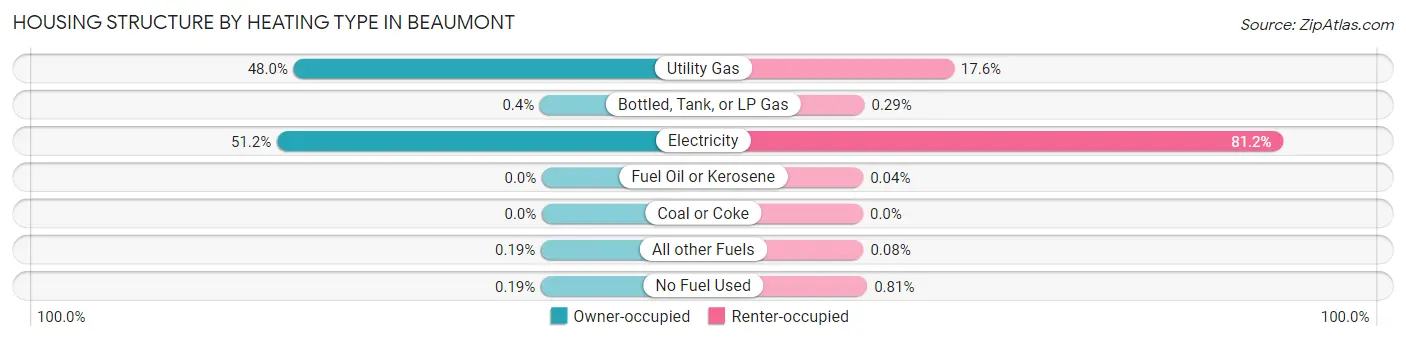
| Heating Type | Owner-occupied | Renter-occupied |
| Utility Gas | 11,872 (48.0%) | 3,637 (17.6%) |
| Bottled, Tank, or LP Gas | 100 (0.4%) | 61 (0.3%) |
| Electricity | 12,673 (51.2%) | 16,818 (81.2%) |
| Fuel Oil or Kerosene | 0 (0.0%) | 9 (0.0%) |
| Coal or Coke | 0 (0.0%) | 0 (0.0%) |
| All other Fuels | 48 (0.2%) | 17 (0.1%) |
| No Fuel Used | 48 (0.2%) | 167 (0.8%) |
| Total | 24,741 (100.0%) | 20,709 (100.0%) |
Household Vehicle Usage in Beaumont
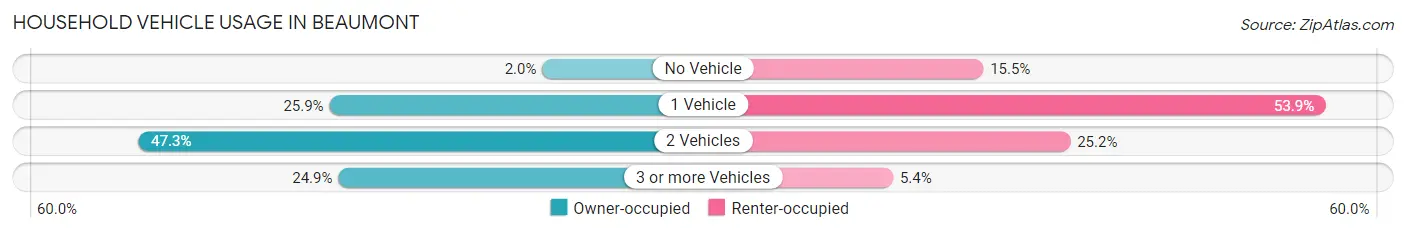
| Vehicles per Household | Owner-occupied | Renter-occupied |
| No Vehicle | 498 (2.0%) | 3,208 (15.5%) |
| 1 Vehicle | 6,395 (25.9%) | 11,160 (53.9%) |
| 2 Vehicles | 11,697 (47.3%) | 5,226 (25.2%) |
| 3 or more Vehicles | 6,151 (24.9%) | 1,115 (5.4%) |
| Total | 24,741 (100.0%) | 20,709 (100.0%) |
Real Estate & Mortgages in Beaumont
Real Estate and Mortgage Overview in Beaumont
| Characteristic | Without Mortgage | With Mortgage |
| Housing Units | 13,383 | 11,358 |
| Median Property Value | $113,800 | $174,600 |
| Median Household Income | $58,356 | $2,793 |
| Monthly Housing Costs | $495 | $1,104 |
| Real Estate Taxes | $1,683 | $450 |
Property Value by Mortgage Status in Beaumont
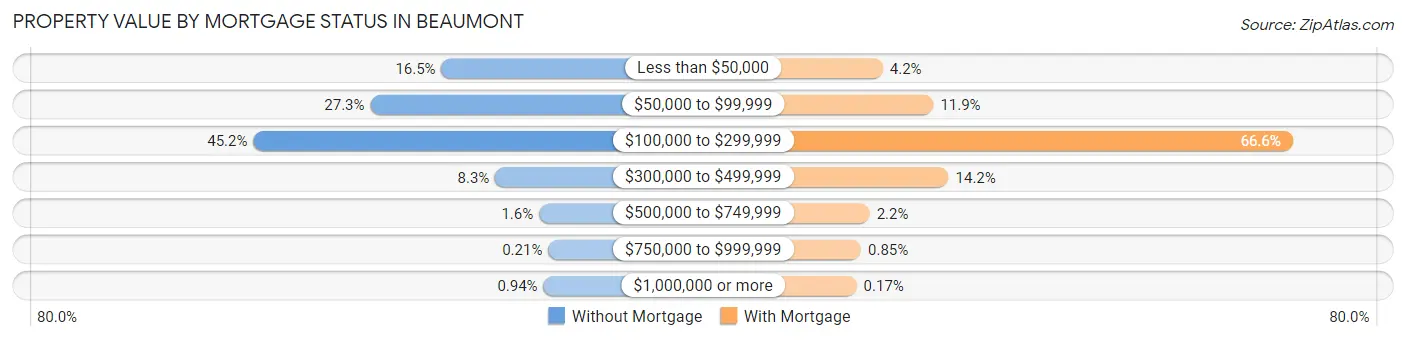
| Property Value | Without Mortgage | With Mortgage |
| Less than $50,000 | 2,205 (16.5%) | 473 (4.2%) |
| $50,000 to $99,999 | 3,655 (27.3%) | 1,348 (11.9%) |
| $100,000 to $299,999 | 6,043 (45.2%) | 7,565 (66.6%) |
| $300,000 to $499,999 | 1,110 (8.3%) | 1,611 (14.2%) |
| $500,000 to $749,999 | 216 (1.6%) | 245 (2.2%) |
| $750,000 to $999,999 | 28 (0.2%) | 97 (0.9%) |
| $1,000,000 or more | 126 (0.9%) | 19 (0.2%) |
| Total | 13,383 (100.0%) | 11,358 (100.0%) |
Household Income by Mortgage Status in Beaumont
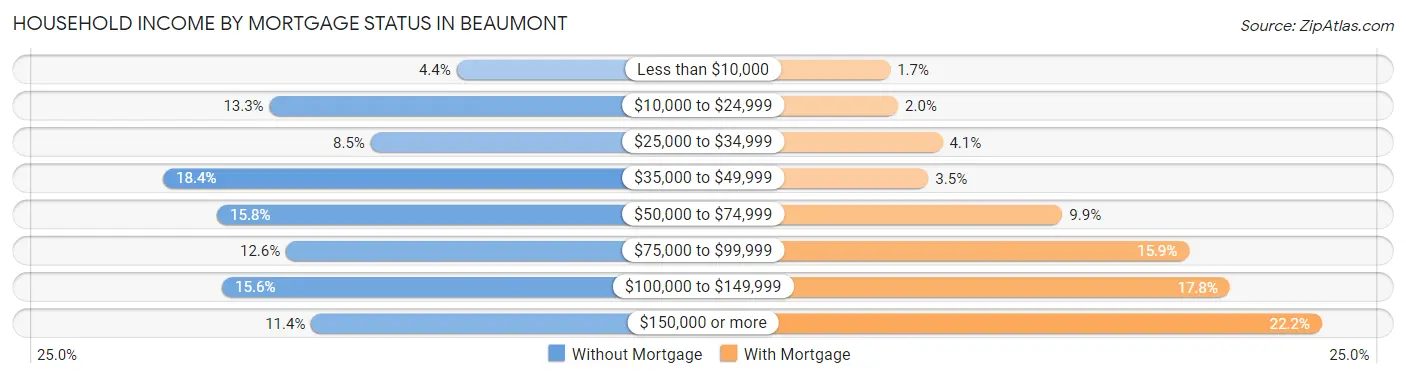
| Household Income | Without Mortgage | With Mortgage |
| Less than $10,000 | 593 (4.4%) | 187 (1.7%) |
| $10,000 to $24,999 | 1,785 (13.3%) | 231 (2.0%) |
| $25,000 to $34,999 | 1,140 (8.5%) | 470 (4.1%) |
| $35,000 to $49,999 | 2,463 (18.4%) | 394 (3.5%) |
| $50,000 to $74,999 | 2,118 (15.8%) | 1,119 (9.9%) |
| $75,000 to $99,999 | 1,679 (12.6%) | 1,805 (15.9%) |
| $100,000 to $149,999 | 2,086 (15.6%) | 2,024 (17.8%) |
| $150,000 or more | 1,519 (11.4%) | 2,522 (22.2%) |
| Total | 13,383 (100.0%) | 11,358 (100.0%) |
Property Value to Household Income Ratio in Beaumont
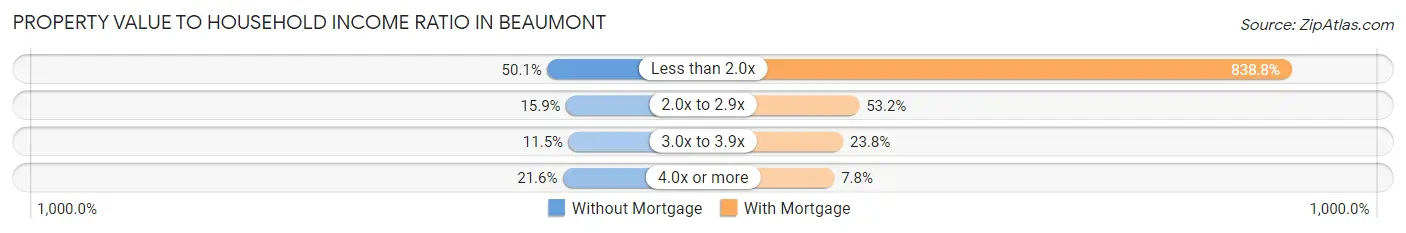
| Value-to-Income Ratio | Without Mortgage | With Mortgage |
| Less than 2.0x | 6,708 (50.1%) | 95,272 (838.8%) |
| 2.0x to 2.9x | 2,132 (15.9%) | 6,043 (53.2%) |
| 3.0x to 3.9x | 1,536 (11.5%) | 2,705 (23.8%) |
| 4.0x or more | 2,895 (21.6%) | 888 (7.8%) |
| Total | 13,383 (100.0%) | 11,358 (100.0%) |
Real Estate Taxes by Mortgage Status in Beaumont
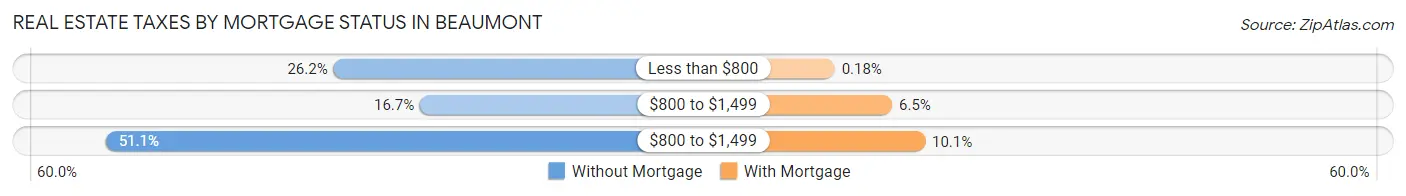
| Property Taxes | Without Mortgage | With Mortgage |
| Less than $800 | 3,500 (26.2%) | 21 (0.2%) |
| $800 to $1,499 | 2,230 (16.7%) | 735 (6.5%) |
| $800 to $1,499 | 6,840 (51.1%) | 1,145 (10.1%) |
| Total | 13,383 (100.0%) | 11,358 (100.0%) |
Health & Disability in Beaumont
Health Insurance Coverage by Age in Beaumont
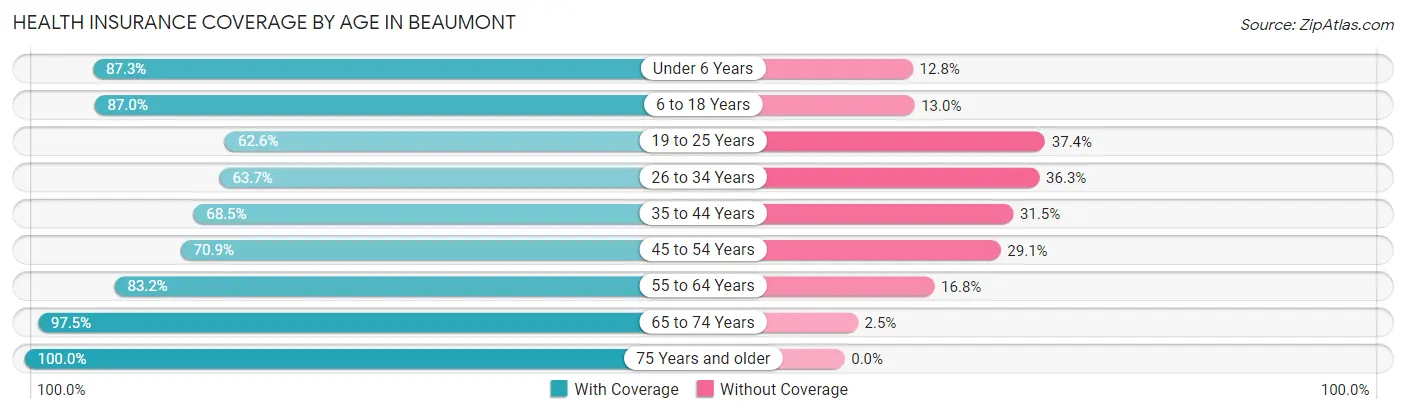
| Age Bracket | With Coverage | Without Coverage |
| Under 6 Years | 8,329 (87.3%) | 1,217 (12.8%) |
| 6 to 18 Years | 17,698 (87.0%) | 2,654 (13.0%) |
| 19 to 25 Years | 7,251 (62.6%) | 4,332 (37.4%) |
| 26 to 34 Years | 9,355 (63.7%) | 5,340 (36.3%) |
| 35 to 44 Years | 9,620 (68.5%) | 4,420 (31.5%) |
| 45 to 54 Years | 8,243 (70.9%) | 3,385 (29.1%) |
| 55 to 64 Years | 11,430 (83.2%) | 2,301 (16.8%) |
| 65 to 74 Years | 10,264 (97.5%) | 261 (2.5%) |
| 75 Years and older | 7,150 (100.0%) | 0 (0.0%) |
| Total | 89,340 (78.9%) | 23,910 (21.1%) |
Health Insurance Coverage by Citizenship Status in Beaumont
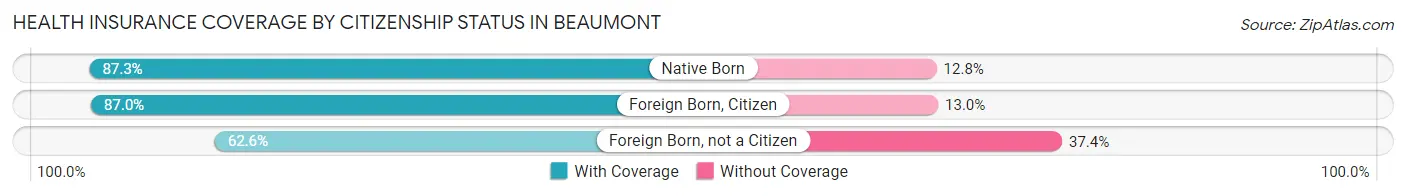
| Citizenship Status | With Coverage | Without Coverage |
| Native Born | 8,329 (87.3%) | 1,217 (12.8%) |
| Foreign Born, Citizen | 17,698 (87.0%) | 2,654 (13.0%) |
| Foreign Born, not a Citizen | 7,251 (62.6%) | 4,332 (37.4%) |
Health Insurance Coverage by Household Income in Beaumont
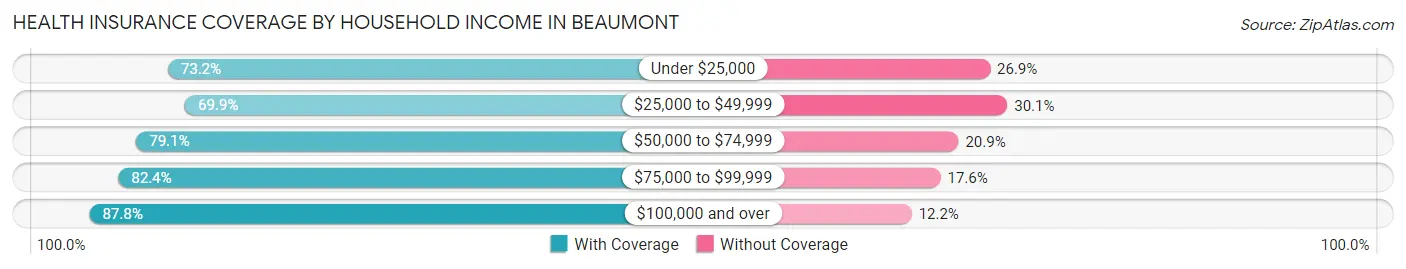
| Household Income | With Coverage | Without Coverage |
| Under $25,000 | 15,777 (73.2%) | 5,790 (26.9%) |
| $25,000 to $49,999 | 17,387 (69.9%) | 7,475 (30.1%) |
| $50,000 to $74,999 | 14,277 (79.1%) | 3,780 (20.9%) |
| $75,000 to $99,999 | 11,099 (82.4%) | 2,365 (17.6%) |
| $100,000 and over | 29,191 (87.8%) | 4,040 (12.2%) |
Public vs Private Health Insurance Coverage by Age in Beaumont
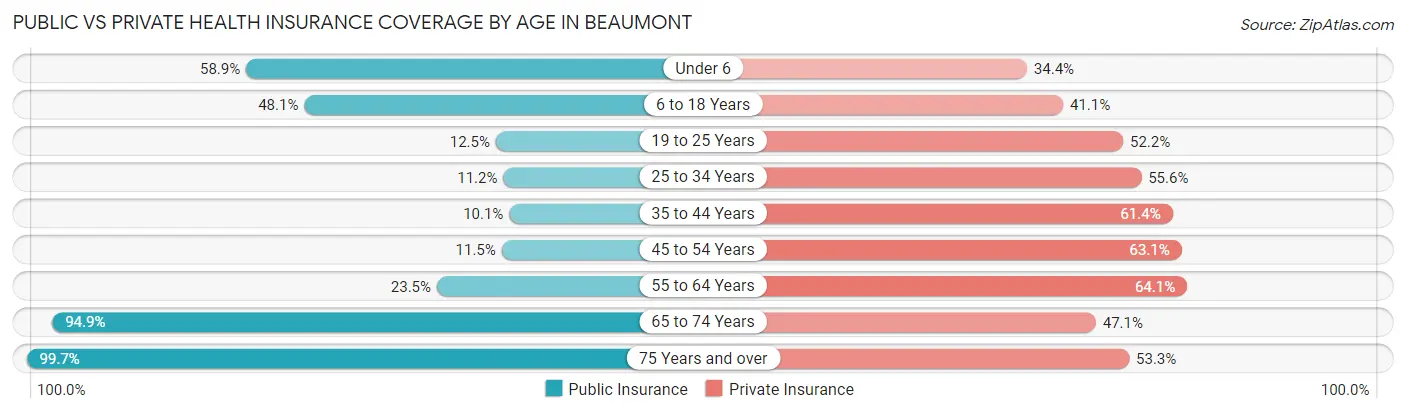
| Age Bracket | Public Insurance | Private Insurance |
| Under 6 | 5,622 (58.9%) | 3,280 (34.4%) |
| 6 to 18 Years | 9,789 (48.1%) | 8,359 (41.1%) |
| 19 to 25 Years | 1,452 (12.5%) | 6,048 (52.2%) |
| 25 to 34 Years | 1,638 (11.2%) | 8,168 (55.6%) |
| 35 to 44 Years | 1,411 (10.1%) | 8,617 (61.4%) |
| 45 to 54 Years | 1,332 (11.5%) | 7,335 (63.1%) |
| 55 to 64 Years | 3,224 (23.5%) | 8,798 (64.1%) |
| 65 to 74 Years | 9,985 (94.9%) | 4,961 (47.1%) |
| 75 Years and over | 7,125 (99.7%) | 3,813 (53.3%) |
| Total | 41,578 (36.7%) | 59,379 (52.4%) |
Disability Status by Sex by Age in Beaumont
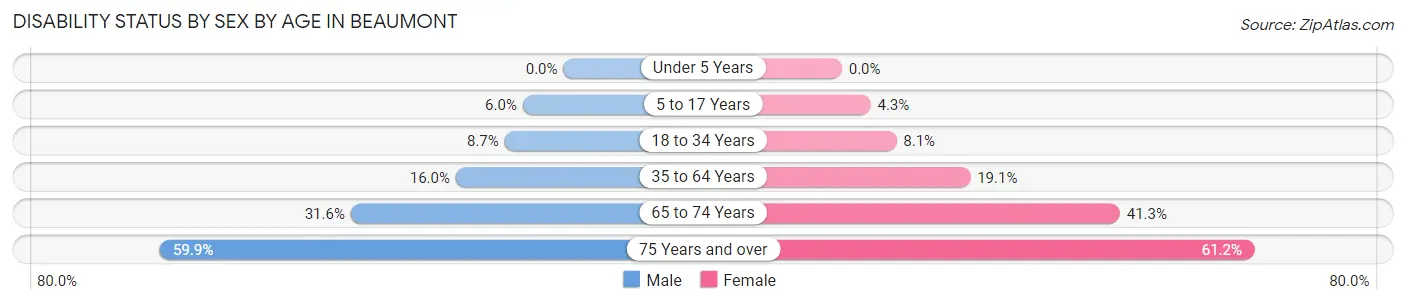
| Age Bracket | Male | Female |
| Under 5 Years | 0 (0.0%) | 0 (0.0%) |
| 5 to 17 Years | 641 (6.0%) | 419 (4.3%) |
| 18 to 34 Years | 1,273 (8.7%) | 1,082 (8.1%) |
| 35 to 64 Years | 2,980 (16.0%) | 3,955 (19.1%) |
| 65 to 74 Years | 1,548 (31.6%) | 2,321 (41.3%) |
| 75 Years and over | 1,759 (59.9%) | 2,577 (61.2%) |
Disability Class by Sex by Age in Beaumont
Disability Class: Hearing Difficulty
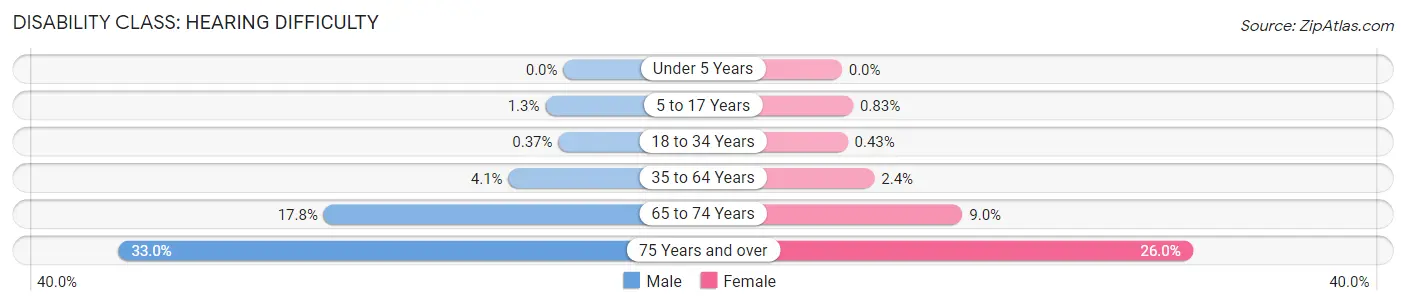
| Age Bracket | Male | Female |
| Under 5 Years | 0 (0.0%) | 0 (0.0%) |
| 5 to 17 Years | 143 (1.3%) | 81 (0.8%) |
| 18 to 34 Years | 54 (0.4%) | 58 (0.4%) |
| 35 to 64 Years | 762 (4.1%) | 501 (2.4%) |
| 65 to 74 Years | 872 (17.8%) | 503 (8.9%) |
| 75 Years and over | 970 (33.0%) | 1,097 (26.0%) |
Disability Class: Vision Difficulty
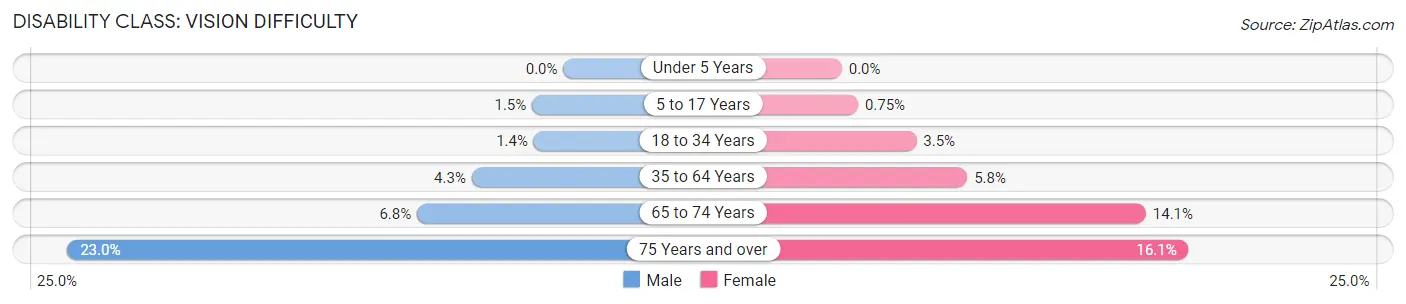
| Age Bracket | Male | Female |
| Under 5 Years | 0 (0.0%) | 0 (0.0%) |
| 5 to 17 Years | 154 (1.5%) | 74 (0.7%) |
| 18 to 34 Years | 200 (1.4%) | 463 (3.5%) |
| 35 to 64 Years | 793 (4.3%) | 1,208 (5.8%) |
| 65 to 74 Years | 333 (6.8%) | 793 (14.1%) |
| 75 Years and over | 676 (23.0%) | 678 (16.1%) |
Disability Class: Cognitive Difficulty
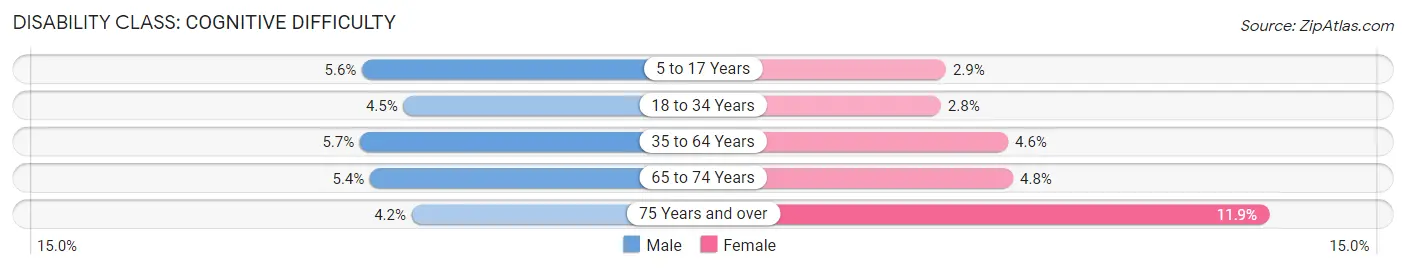
| Age Bracket | Male | Female |
| 5 to 17 Years | 596 (5.6%) | 284 (2.9%) |
| 18 to 34 Years | 649 (4.4%) | 369 (2.8%) |
| 35 to 64 Years | 1,055 (5.7%) | 961 (4.6%) |
| 65 to 74 Years | 264 (5.4%) | 268 (4.8%) |
| 75 Years and over | 124 (4.2%) | 501 (11.9%) |
Disability Class: Ambulatory Difficulty
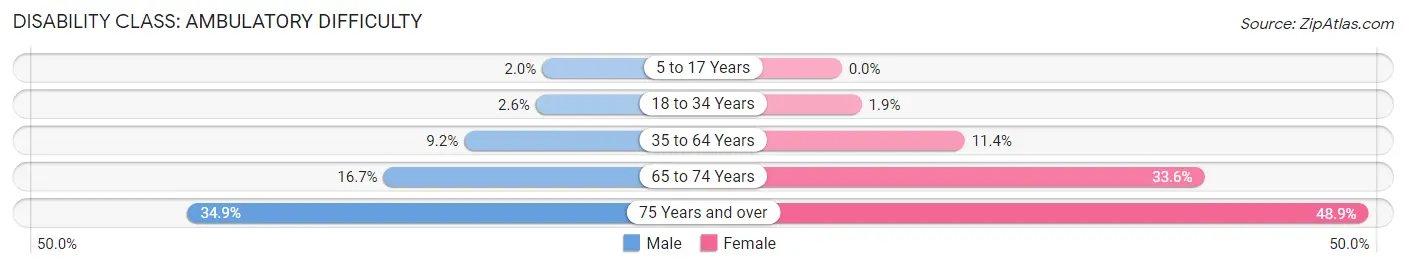
| Age Bracket | Male | Female |
| 5 to 17 Years | 210 (2.0%) | 0 (0.0%) |
| 18 to 34 Years | 375 (2.6%) | 247 (1.8%) |
| 35 to 64 Years | 1,720 (9.2%) | 2,366 (11.4%) |
| 65 to 74 Years | 819 (16.7%) | 1,891 (33.6%) |
| 75 Years and over | 1,024 (34.9%) | 2,059 (48.9%) |
Disability Class: Self-Care Difficulty
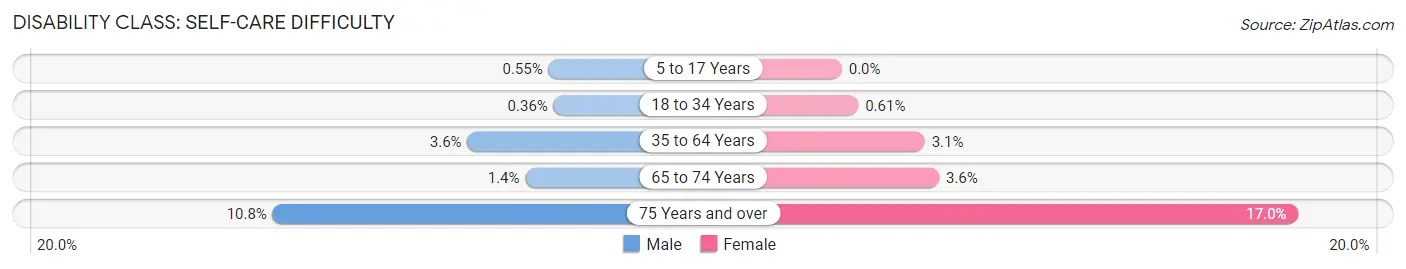
| Age Bracket | Male | Female |
| 5 to 17 Years | 58 (0.5%) | 0 (0.0%) |
| 18 to 34 Years | 52 (0.4%) | 81 (0.6%) |
| 35 to 64 Years | 665 (3.6%) | 638 (3.1%) |
| 65 to 74 Years | 69 (1.4%) | 203 (3.6%) |
| 75 Years and over | 317 (10.8%) | 714 (17.0%) |
Technology Access in Beaumont
Computing Device Access in Beaumont
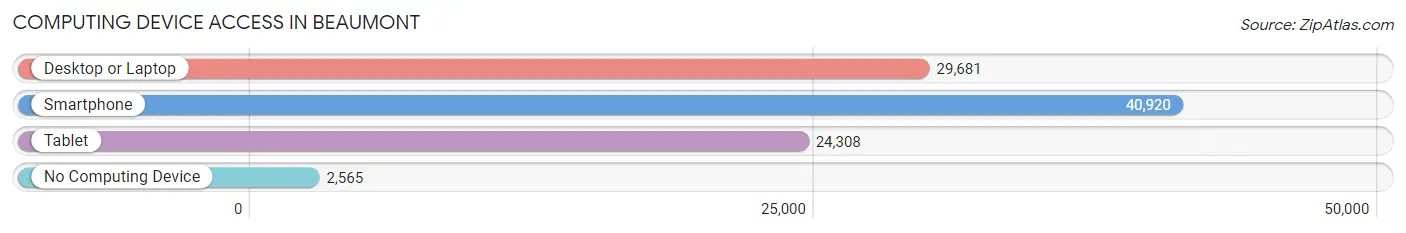
| Device Type | # Households | % Households |
| Desktop or Laptop | 29,681 | 65.3% |
| Smartphone | 40,920 | 90.0% |
| Tablet | 24,308 | 53.5% |
| No Computing Device | 2,565 | 5.6% |
| Total | 45,450 | 100.0% |
Internet Access in Beaumont
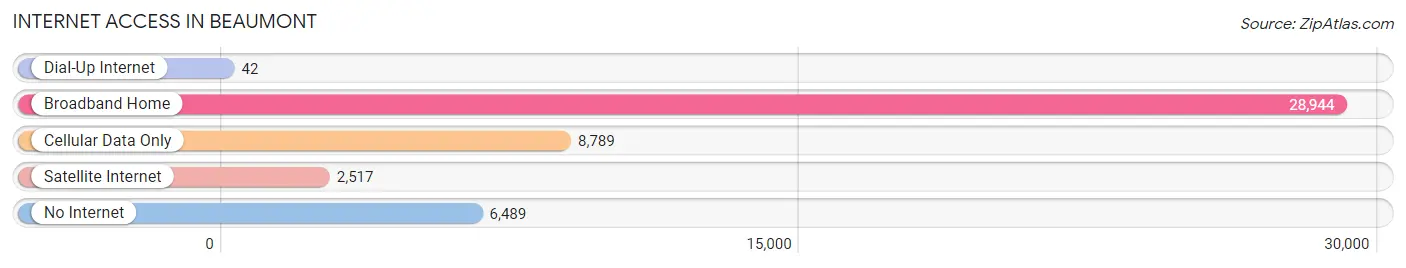
| Internet Type | # Households | % Households |
| Dial-Up Internet | 42 | 0.1% |
| Broadband Home | 28,944 | 63.7% |
| Cellular Data Only | 8,789 | 19.3% |
| Satellite Internet | 2,517 | 5.5% |
| No Internet | 6,489 | 14.3% |
| Total | 45,450 | 100.0% |
Beaumont Summary
Beaumont, Texas is a city located in the southeastern corner of the state, in Jefferson County. It is the county seat and the largest city in the county. Beaumont is situated on the banks of the Neches River, about 90 miles east of Houston. The city is part of the Beaumont-Port Arthur metropolitan area, which is the 12th largest metropolitan area in Texas.
History
Beaumont was founded in 1835 by Henry Millard, a lawyer from Kentucky. He named the city after his wife, Mary Dewburleigh Barlace Warren Beaumont. The city was incorporated in 1838 and quickly became a major port for the lumber industry. The city was also a major center for the oil industry, as it was the site of the first major oil discovery in Texas in 1901.
The city experienced rapid growth in the early 20th century, and by the 1950s, it was the largest city in the region. The city was also a major center for the petrochemical industry, and it was home to several major oil refineries.
Geography
Beaumont is located in the southeastern corner of Texas, in Jefferson County. It is situated on the banks of the Neches River, about 90 miles east of Houston. The city is part of the Beaumont-Port Arthur metropolitan area, which is the 12th largest metropolitan area in Texas.
The city has a total area of 44.3 square miles, of which 43.7 square miles is land and 0.6 square miles is water. The city is located at an elevation of about 30 feet above sea level.
Economy
Beaumont has a diverse economy, with a mix of manufacturing, retail, and service industries. The city is home to several major oil refineries, and it is a major center for the petrochemical industry. Other major industries in the city include healthcare, education, and tourism.
The city is also home to several major employers, including Lamar University, Christus Southeast Texas Health System, and the Port of Beaumont. The city also has a large retail sector, with several major shopping centers and malls.
Demographics
As of the 2010 census, Beaumont had a population of 118,296. The city has a population density of 2,664 people per square mile. The racial makeup of the city was 57.2% White, 33.3% African American, 0.7% Native American, 1.7% Asian, 0.1% Pacific Islander, and 5.9% from other races. Hispanic or Latino of any race were 18.2% of the population.
The median income for a household in the city was $37,845, and the median income for a family was $45,845. The per capita income for the city was $20,845. About 17.2% of the population was below the poverty line.
Common Questions
What is Per Capita Income in Beaumont?
Per Capita income in Beaumont is $31,685.
What is the Median Family Income in Beaumont?
Median Family Income in Beaumont is $64,683.
What is the Median Household income in Beaumont?
Median Household Income in Beaumont is $53,745.
What is Income or Wage Gap in Beaumont?
Income or Wage Gap in Beaumont is 33.5%.
Women in Beaumont earn 66.5 cents for every dollar earned by a man.
What is Family Income Deficit in Beaumont?
Family Income Deficit in Beaumont is $12,069.
Families that are below poverty line in Beaumont earn $12,069 less on average than the poverty threshold level.
What is Inequality or Gini Index in Beaumont?
Inequality or Gini Index in Beaumont is 0.49.
What is the Total Population of Beaumont?
Total Population of Beaumont is 114,573.
What is the Total Male Population of Beaumont?
Total Male Population of Beaumont is 56,633.
What is the Total Female Population of Beaumont?
Total Female Population of Beaumont is 57,940.
What is the Ratio of Males per 100 Females in Beaumont?
There are 97.74 Males per 100 Females in Beaumont.
What is the Ratio of Females per 100 Males in Beaumont?
There are 102.31 Females per 100 Males in Beaumont.
What is the Median Population Age in Beaumont?
Median Population Age in Beaumont is 35.5 Years.
What is the Average Family Size in Beaumont
Average Family Size in Beaumont is 3.1 People.
What is the Average Household Size in Beaumont
Average Household Size in Beaumont is 2.5 People.
How Large is the Labor Force in Beaumont?
There are 53,067 People in the Labor Forcein in Beaumont.
What is the Percentage of People in the Labor Force in Beaumont?
59.8% of People are in the Labor Force in Beaumont.
What is the Unemployment Rate in Beaumont?
Unemployment Rate in Beaumont is 5.3%.