Hampton, VA Map & Demographics
Hampton Map
Hampton Overview
$35,002
PER CAPITA INCOME
$79,580
AVG FAMILY INCOME
$64,430
AVG HOUSEHOLD INCOME
30.2%
WAGE / INCOME GAP [ % ]
69.8¢/ $1
WAGE / INCOME GAP [ $ ]
$11,891
FAMILY INCOME DEFICIT
0.44
INEQUALITY / GINI INDEX
137,217
TOTAL POPULATION
66,248
MALE POPULATION
70,969
FEMALE POPULATION
93.35
MALES / 100 FEMALES
107.13
FEMALES / 100 MALES
36.5
MEDIAN AGE
3.0
AVG FAMILY SIZE
2.3
AVG HOUSEHOLD SIZE
73,157
LABOR FORCE [ PEOPLE ]
65.9%
PERCENT IN LABOR FORCE
6.5%
UNEMPLOYMENT RATE
Hampton Area Codes
Income in Hampton
Income Overview in Hampton
Per Capita Income in Hampton is $35,002, while median incomes of families and households are $79,580 and $64,430 respectively.
| Characteristic | Number | Measure |
| Per Capita Income | 137,217 | $35,002 |
| Median Family Income | 34,488 | $79,580 |
| Mean Family Income | 34,488 | $97,268 |
| Median Household Income | 57,470 | $64,430 |
| Mean Household Income | 57,470 | $81,921 |
| Income Deficit | 34,488 | $11,891 |
| Wage / Income Gap (%) | 137,217 | 30.15% |
| Wage / Income Gap ($) | 137,217 | 69.85¢ per $1 |
| Gini / Inequality Index | 137,217 | 0.44 |
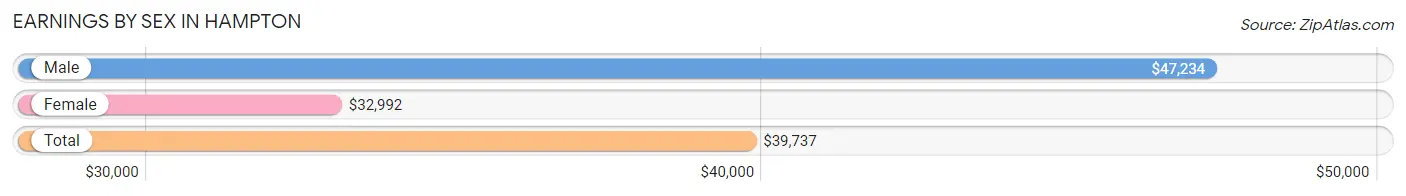
Earnings by Sex in Hampton
Average Earnings in Hampton are $39,737, $47,234 for men and $32,992 for women, a difference of 30.1%.
| Sex | Number | Average Earnings |
| Male | 38,383 (50.9%) | $47,234 |
| Female | 37,083 (49.1%) | $32,992 |
| Total | 75,466 (100.0%) | $39,737 |
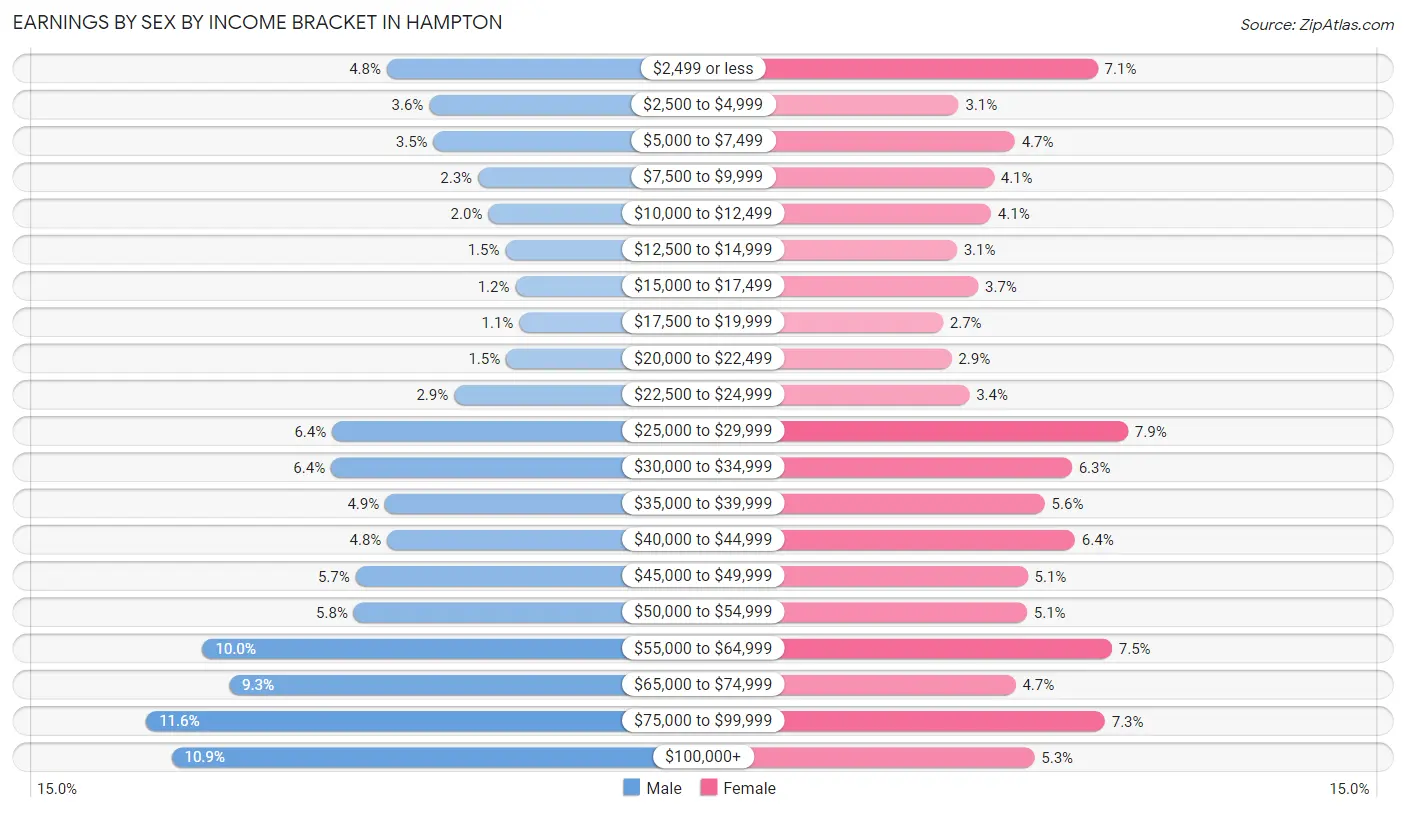
Earnings by Sex by Income Bracket in Hampton
The most common earnings brackets in Hampton are $75,000 to $99,999 for men (4,444 | 11.6%) and $25,000 to $29,999 for women (2,929 | 7.9%).
| Income | Male | Female |
| $2,499 or less | 1,851 (4.8%) | 2,615 (7.0%) |
| $2,500 to $4,999 | 1,393 (3.6%) | 1,166 (3.1%) |
| $5,000 to $7,499 | 1,348 (3.5%) | 1,749 (4.7%) |
| $7,500 to $9,999 | 869 (2.3%) | 1,532 (4.1%) |
| $10,000 to $12,499 | 757 (2.0%) | 1,503 (4.1%) |
| $12,500 to $14,999 | 573 (1.5%) | 1,146 (3.1%) |
| $15,000 to $17,499 | 465 (1.2%) | 1,368 (3.7%) |
| $17,500 to $19,999 | 424 (1.1%) | 1,001 (2.7%) |
| $20,000 to $22,499 | 565 (1.5%) | 1,091 (2.9%) |
| $22,500 to $24,999 | 1,126 (2.9%) | 1,274 (3.4%) |
| $25,000 to $29,999 | 2,443 (6.4%) | 2,929 (7.9%) |
| $30,000 to $34,999 | 2,453 (6.4%) | 2,344 (6.3%) |
| $35,000 to $39,999 | 1,869 (4.9%) | 2,063 (5.6%) |
| $40,000 to $44,999 | 1,848 (4.8%) | 2,378 (6.4%) |
| $45,000 to $49,999 | 2,186 (5.7%) | 1,883 (5.1%) |
| $50,000 to $54,999 | 2,207 (5.8%) | 1,876 (5.1%) |
| $55,000 to $64,999 | 3,839 (10.0%) | 2,764 (7.4%) |
| $65,000 to $74,999 | 3,552 (9.2%) | 1,757 (4.7%) |
| $75,000 to $99,999 | 4,444 (11.6%) | 2,690 (7.2%) |
| $100,000+ | 4,171 (10.9%) | 1,954 (5.3%) |
| Total | 38,383 (100.0%) | 37,083 (100.0%) |
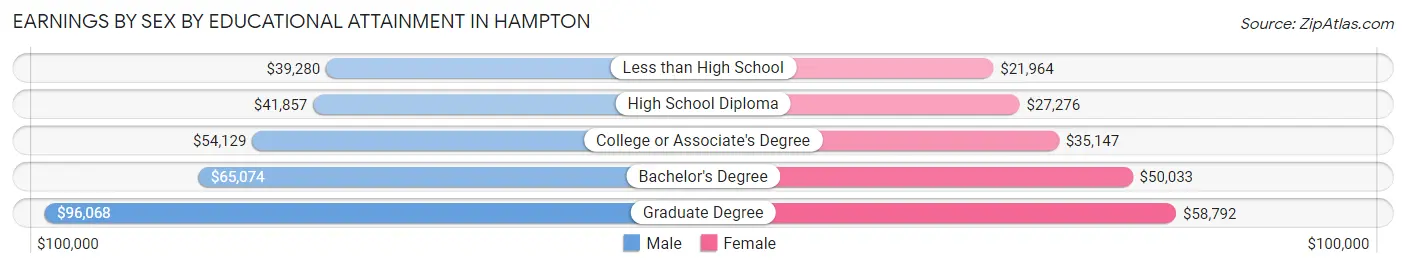
Earnings by Sex by Educational Attainment in Hampton
Average earnings in Hampton are $54,126 for men and $37,825 for women, a difference of 30.1%. Men with an educational attainment of graduate degree enjoy the highest average annual earnings of $96,068, while those with less than high school education earn the least with $39,280. Women with an educational attainment of graduate degree earn the most with the average annual earnings of $58,792, while those with less than high school education have the smallest earnings of $21,964.
| Educational Attainment | Male Income | Female Income |
| Less than High School | $39,280 | $21,964 |
| High School Diploma | $41,857 | $27,276 |
| College or Associate's Degree | $54,129 | $35,147 |
| Bachelor's Degree | $65,074 | $50,033 |
| Graduate Degree | $96,068 | $58,792 |
| Total | $54,126 | $37,825 |
Family Income in Hampton
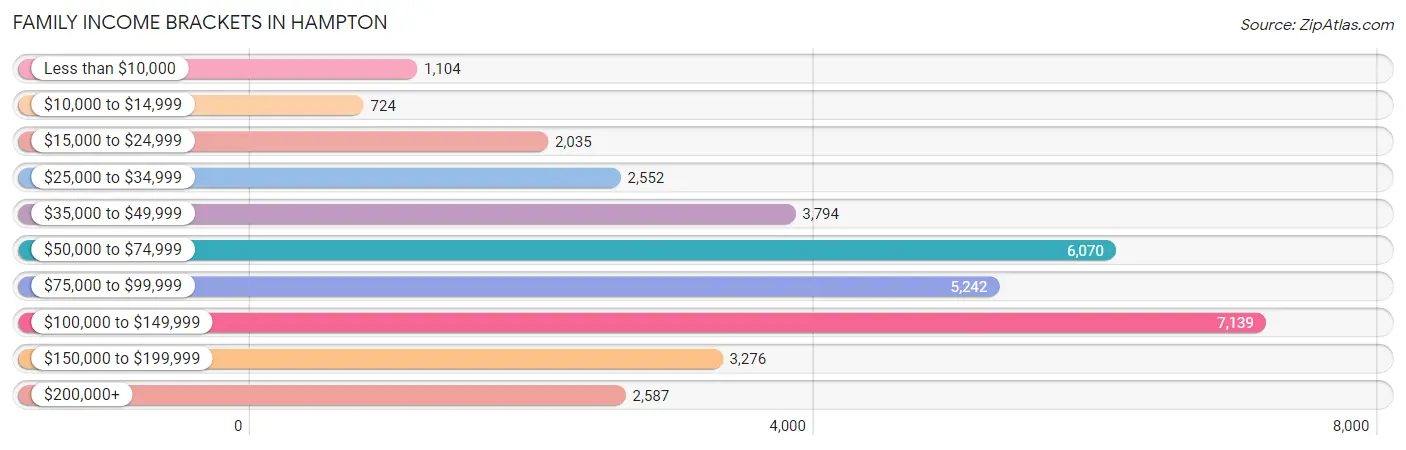
Family Income Brackets in Hampton
According to the Hampton family income data, there are 7,139 families falling into the $100,000 to $149,999 income range, which is the most common income bracket and makes up 20.7% of all families. Conversely, the $10,000 to $14,999 income bracket is the least frequent group with only 724 families (2.1%) belonging to this category.
| Income Bracket | # Families | % Families |
| Less than $10,000 | 1,104 | 3.2% |
| $10,000 to $14,999 | 724 | 2.1% |
| $15,000 to $24,999 | 2,035 | 5.9% |
| $25,000 to $34,999 | 2,552 | 7.4% |
| $35,000 to $49,999 | 3,794 | 11.0% |
| $50,000 to $74,999 | 6,070 | 17.6% |
| $75,000 to $99,999 | 5,242 | 15.2% |
| $100,000 to $149,999 | 7,139 | 20.7% |
| $150,000 to $199,999 | 3,276 | 9.5% |
| $200,000+ | 2,587 | 7.5% |
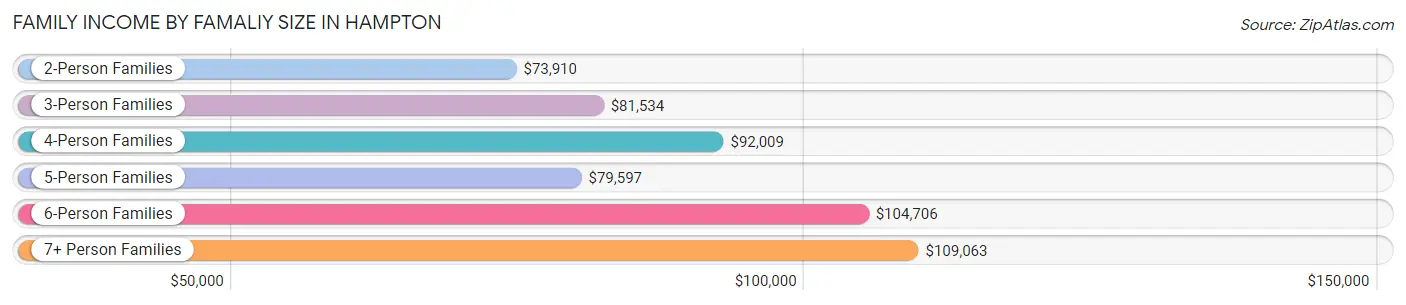
Family Income by Famaliy Size in Hampton
7+ person families (564 | 1.6%) account for the highest median family income in Hampton with $109,063 per family, while 2-person families (16,446 | 47.7%) have the highest median income of $36,955 per family member.
| Income Bracket | # Families | Median Income |
| 2-Person Families | 16,446 (47.7%) | $73,910 |
| 3-Person Families | 8,551 (24.8%) | $81,534 |
| 4-Person Families | 5,642 (16.4%) | $92,009 |
| 5-Person Families | 2,601 (7.5%) | $79,597 |
| 6-Person Families | 684 (2.0%) | $104,706 |
| 7+ Person Families | 564 (1.6%) | $109,063 |
| Total | 34,488 (100.0%) | $79,580 |
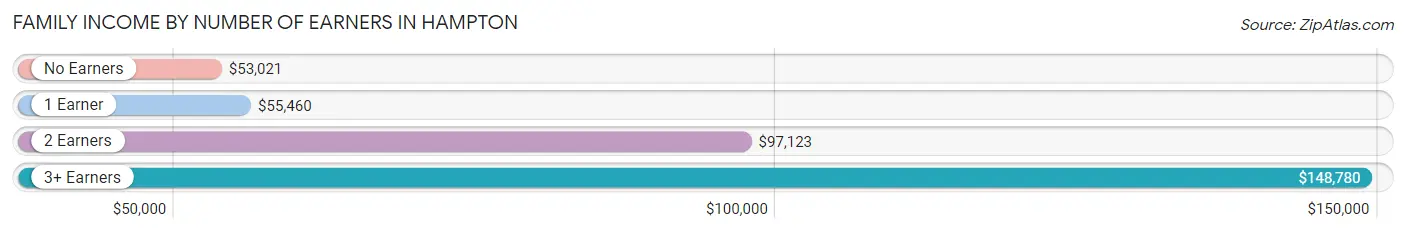
Family Income by Number of Earners in Hampton
The median family income in Hampton is $79,580, with families comprising 3+ earners (3,738) having the highest median family income of $148,780, while families with no earners (4,729) have the lowest median family income of $53,021, accounting for 10.8% and 13.7% of families, respectively.
| Number of Earners | # Families | Median Income |
| No Earners | 4,729 (13.7%) | $53,021 |
| 1 Earner | 12,744 (36.9%) | $55,460 |
| 2 Earners | 13,277 (38.5%) | $97,123 |
| 3+ Earners | 3,738 (10.8%) | $148,780 |
| Total | 34,488 (100.0%) | $79,580 |
Household Income in Hampton
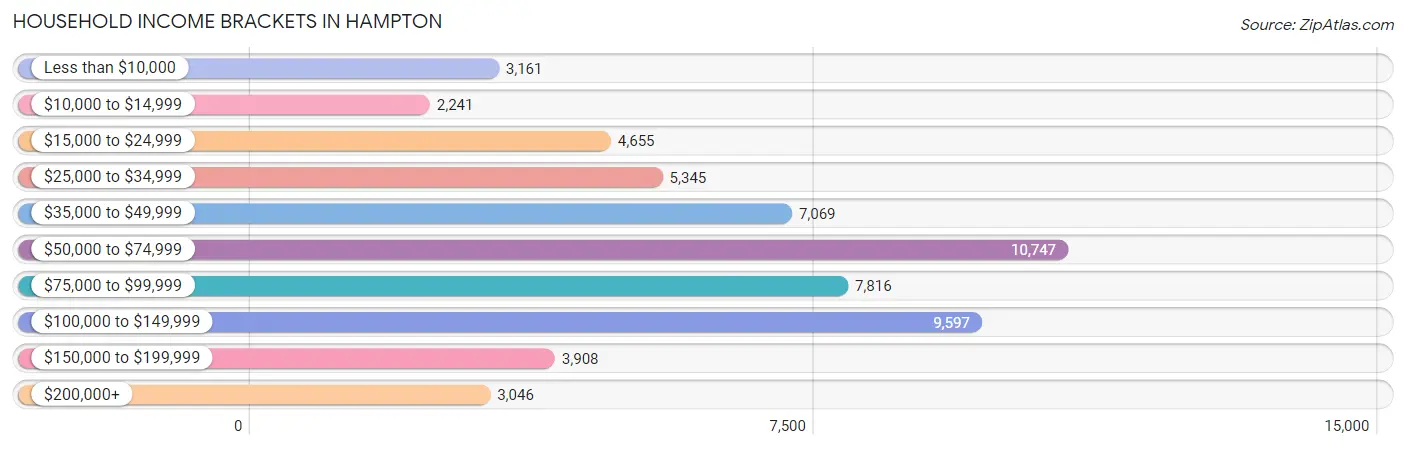
Household Income Brackets in Hampton
With 10,747 households falling in the category, the $50,000 to $74,999 income range is the most frequent in Hampton, accounting for 18.7% of all households. In contrast, only 2,241 households (3.9%) fall into the $10,000 to $14,999 income bracket, making it the least populous group.
| Income Bracket | # Households | % Households |
| Less than $10,000 | 3,161 | 5.5% |
| $10,000 to $14,999 | 2,241 | 3.9% |
| $15,000 to $24,999 | 4,655 | 8.1% |
| $25,000 to $34,999 | 5,345 | 9.3% |
| $35,000 to $49,999 | 7,069 | 12.3% |
| $50,000 to $74,999 | 10,747 | 18.7% |
| $75,000 to $99,999 | 7,816 | 13.6% |
| $100,000 to $149,999 | 9,597 | 16.7% |
| $150,000 to $199,999 | 3,908 | 6.8% |
| $200,000+ | 3,046 | 5.3% |
Household Income by Householder Age in Hampton
The median household income in Hampton is $64,430, with the highest median household income of $78,905 found in the 45 to 64 years age bracket for the primary householder. A total of 19,171 households (33.4%) fall into this category. Meanwhile, the 15 to 24 years age bracket for the primary householder has the lowest median household income of $40,821, with 3,654 households (6.4%) in this group.
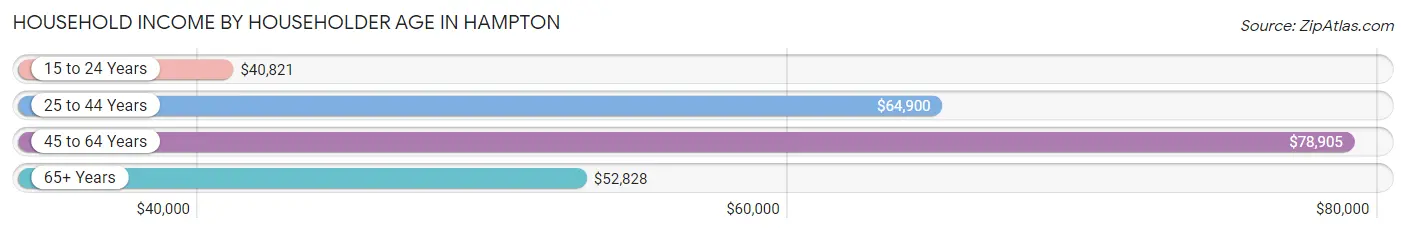
| Income Bracket | # Households | Median Income |
| 15 to 24 Years | 3,654 (6.4%) | $40,821 |
| 25 to 44 Years | 20,330 (35.4%) | $64,900 |
| 45 to 64 Years | 19,171 (33.4%) | $78,905 |
| 65+ Years | 14,315 (24.9%) | $52,828 |
| Total | 57,470 (100.0%) | $64,430 |
Poverty in Hampton
Income Below Poverty by Sex and Age in Hampton
With 11.4% poverty level for males and 15.4% for females among the residents of Hampton, 15 year old males and 5 year old females are the most vulnerable to poverty, with 299 males (29.5%) and 133 females (28.7%) in their respective age groups living below the poverty level.
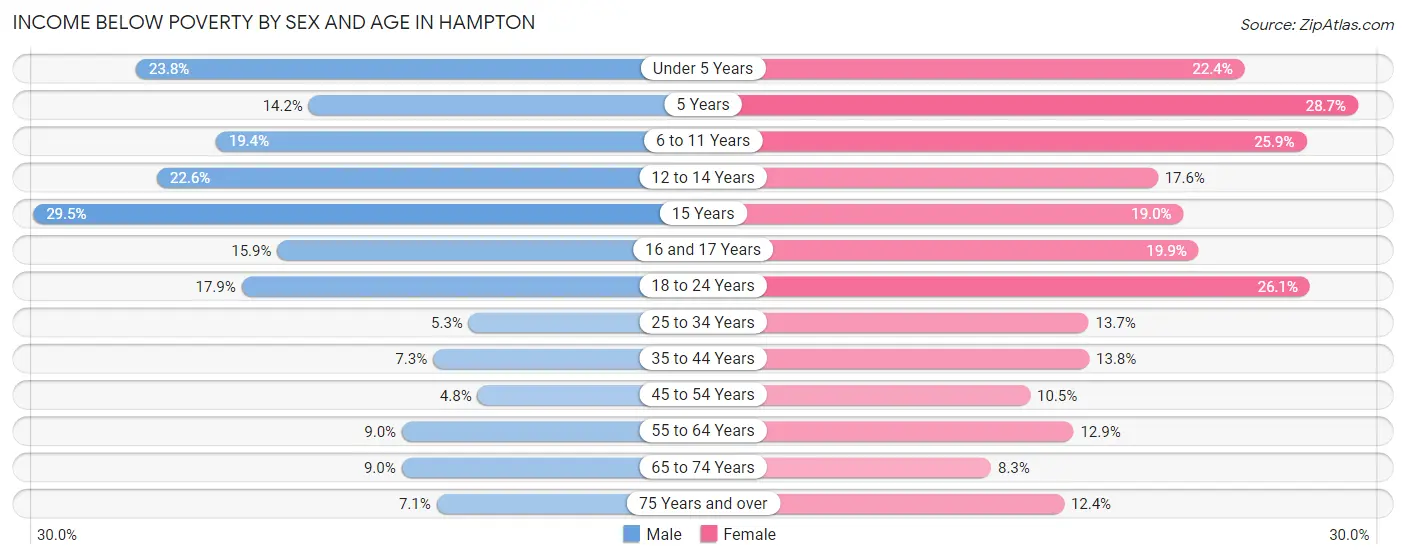
| Age Bracket | Male | Female |
| Under 5 Years | 1,023 (23.8%) | 880 (22.4%) |
| 5 Years | 116 (14.2%) | 133 (28.7%) |
| 6 to 11 Years | 959 (19.4%) | 1,182 (25.9%) |
| 12 to 14 Years | 554 (22.6%) | 458 (17.6%) |
| 15 Years | 299 (29.5%) | 128 (19.0%) |
| 16 and 17 Years | 231 (15.9%) | 316 (19.9%) |
| 18 to 24 Years | 1,181 (17.9%) | 1,527 (26.1%) |
| 25 to 34 Years | 569 (5.3%) | 1,440 (13.7%) |
| 35 to 44 Years | 569 (7.3%) | 1,176 (13.8%) |
| 45 to 54 Years | 307 (4.8%) | 815 (10.5%) |
| 55 to 64 Years | 785 (9.0%) | 1,249 (12.9%) |
| 65 to 74 Years | 510 (9.0%) | 590 (8.3%) |
| 75 Years and over | 231 (7.1%) | 662 (12.4%) |
| Total | 7,334 (11.4%) | 10,556 (15.4%) |
Income Above Poverty by Sex and Age in Hampton
According to the poverty statistics in Hampton, males aged 45 to 54 years and females aged 65 to 74 years are the age groups that are most secure financially, with 95.2% of males and 91.7% of females in these age groups living above the poverty line.
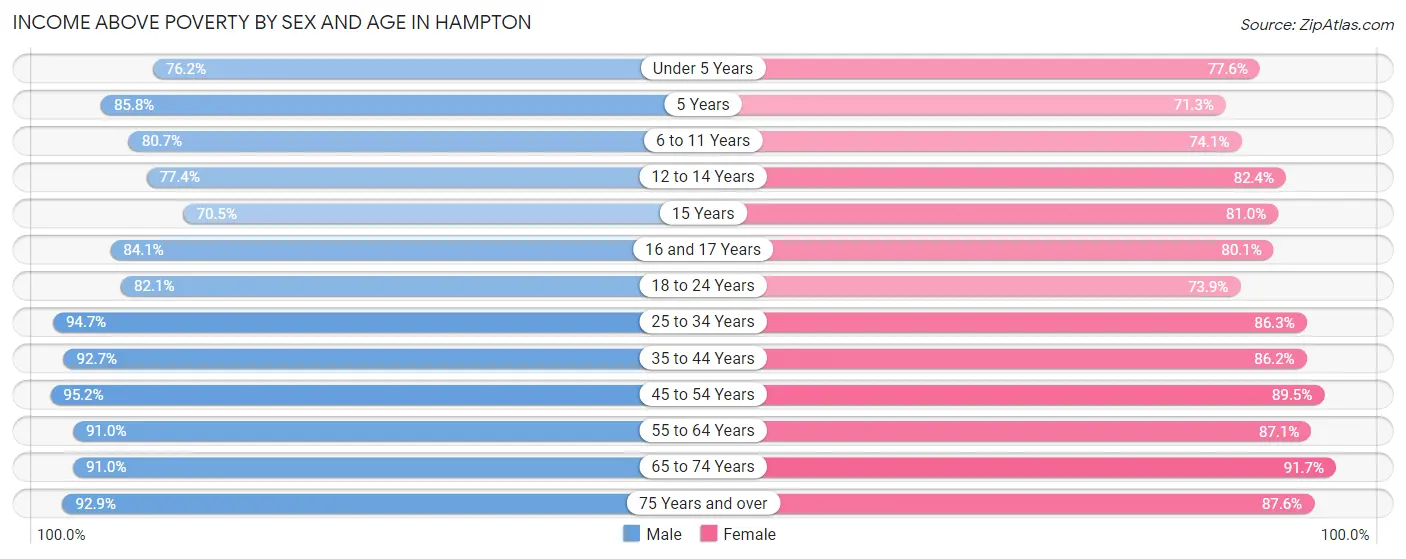
| Age Bracket | Male | Female |
| Under 5 Years | 3,275 (76.2%) | 3,044 (77.6%) |
| 5 Years | 702 (85.8%) | 330 (71.3%) |
| 6 to 11 Years | 3,996 (80.6%) | 3,389 (74.1%) |
| 12 to 14 Years | 1,894 (77.4%) | 2,146 (82.4%) |
| 15 Years | 714 (70.5%) | 545 (81.0%) |
| 16 and 17 Years | 1,219 (84.1%) | 1,274 (80.1%) |
| 18 to 24 Years | 5,408 (82.1%) | 4,332 (73.9%) |
| 25 to 34 Years | 10,229 (94.7%) | 9,041 (86.3%) |
| 35 to 44 Years | 7,268 (92.7%) | 7,362 (86.2%) |
| 45 to 54 Years | 6,117 (95.2%) | 6,964 (89.5%) |
| 55 to 64 Years | 7,946 (91.0%) | 8,434 (87.1%) |
| 65 to 74 Years | 5,153 (91.0%) | 6,512 (91.7%) |
| 75 Years and over | 3,040 (92.9%) | 4,690 (87.6%) |
| Total | 56,961 (88.6%) | 58,063 (84.6%) |
Income Below Poverty Among Married-Couple Families in Hampton
The poverty statistics for married-couple families in Hampton show that 2.5% or 546 of the total 21,686 families live below the poverty line. Families with 5 or more children have the highest poverty rate of 36.4%, comprising of 43 families. On the other hand, families with no children have the lowest poverty rate of 1.5%, which includes 205 families.
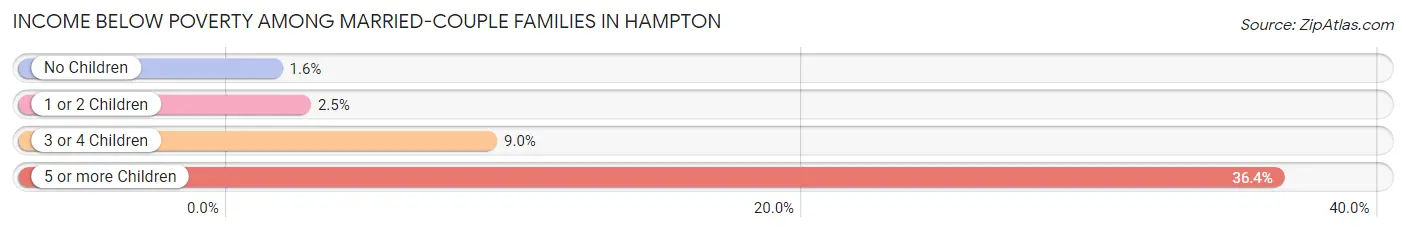
| Children | Above Poverty | Below Poverty |
| No Children | 13,009 (98.5%) | 205 (1.5%) |
| 1 or 2 Children | 6,856 (97.5%) | 179 (2.5%) |
| 3 or 4 Children | 1,200 (91.0%) | 119 (9.0%) |
| 5 or more Children | 75 (63.6%) | 43 (36.4%) |
| Total | 21,140 (97.5%) | 546 (2.5%) |
Income Below Poverty Among Single-Parent Households in Hampton
According to the poverty data in Hampton, 8.6% or 296 single-father households and 26.1% or 2,434 single-mother households are living below the poverty line. Among single-father households, those with 5 or more children have the highest poverty rate, with 13 households (100.0%) experiencing poverty. Likewise, among single-mother households, those with 5 or more children have the highest poverty rate, with 77 households (81.9%) falling below the poverty line.
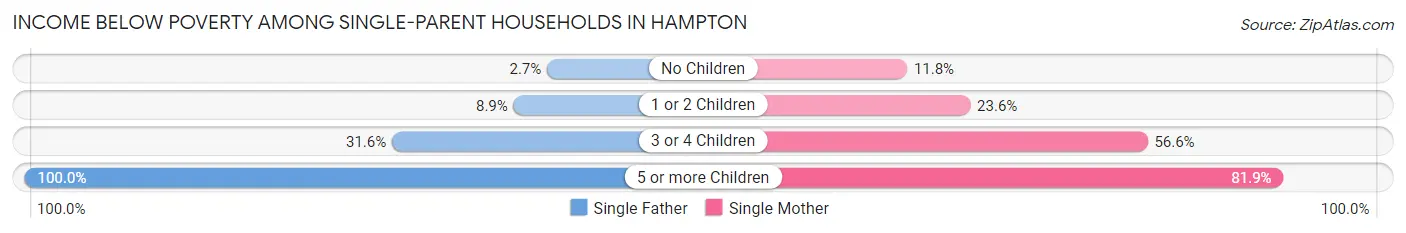
| Children | Single Father | Single Mother |
| No Children | 34 (2.7%) | 372 (11.8%) |
| 1 or 2 Children | 172 (8.9%) | 1,044 (23.6%) |
| 3 or 4 Children | 77 (31.6%) | 941 (56.6%) |
| 5 or more Children | 13 (100.0%) | 77 (81.9%) |
| Total | 296 (8.6%) | 2,434 (26.1%) |
Income Below Poverty Among Married-Couple vs Single-Parent Households in Hampton
The poverty data for Hampton shows that 546 of the married-couple family households (2.5%) and 2,730 of the single-parent households (21.3%) are living below the poverty level. Within the married-couple family households, those with 5 or more children have the highest poverty rate, with 43 households (36.4%) falling below the poverty line. Among the single-parent households, those with 5 or more children have the highest poverty rate, with 90 household (84.1%) living below poverty.
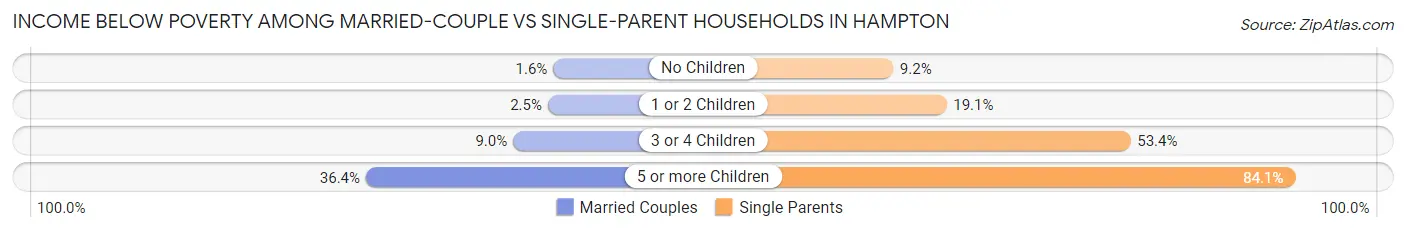
| Children | Married-Couple Families | Single-Parent Households |
| No Children | 205 (1.5%) | 406 (9.2%) |
| 1 or 2 Children | 179 (2.5%) | 1,216 (19.1%) |
| 3 or 4 Children | 119 (9.0%) | 1,018 (53.4%) |
| 5 or more Children | 43 (36.4%) | 90 (84.1%) |
| Total | 546 (2.5%) | 2,730 (21.3%) |
Race in Hampton
The most populous races in Hampton are Black / African American (67,213 | 49.0%), White / Caucasian (53,076 | 38.7%), and Two or more Races (10,833 | 7.9%).
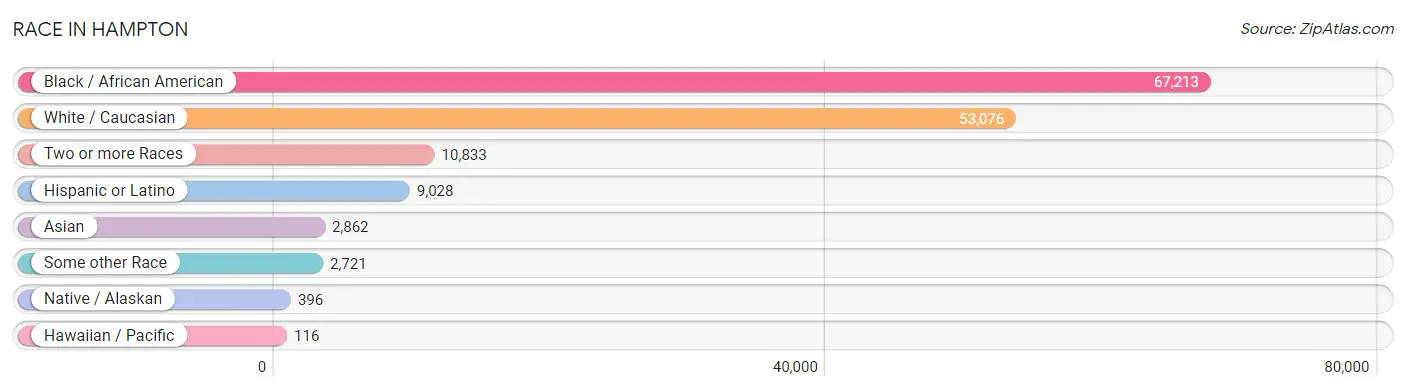
| Race | # Population | % Population |
| Asian | 2,862 | 2.1% |
| Black / African American | 67,213 | 49.0% |
| Hawaiian / Pacific | 116 | 0.1% |
| Hispanic or Latino | 9,028 | 6.6% |
| Native / Alaskan | 396 | 0.3% |
| White / Caucasian | 53,076 | 38.7% |
| Two or more Races | 10,833 | 7.9% |
| Some other Race | 2,721 | 2.0% |
| Total | 137,217 | 100.0% |
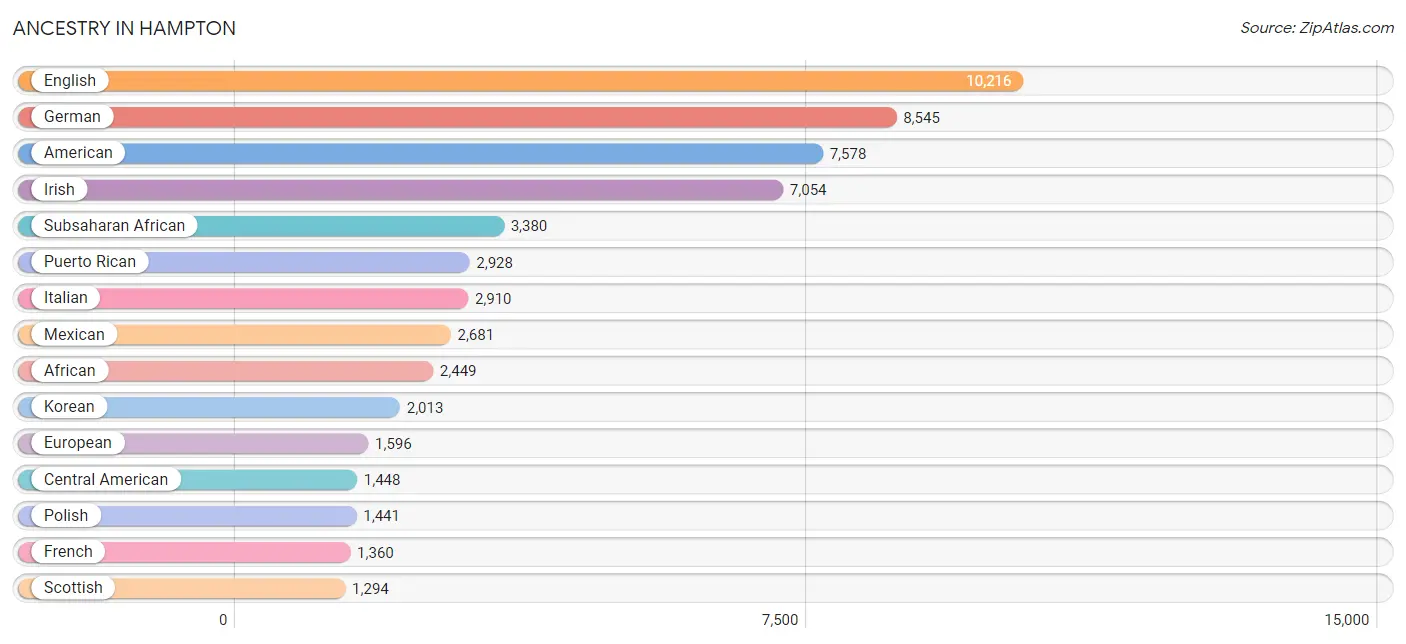
Ancestry in Hampton
The most populous ancestries reported in Hampton are English (10,216 | 7.4%), German (8,545 | 6.2%), American (7,578 | 5.5%), Irish (7,054 | 5.1%), and Subsaharan African (3,380 | 2.5%), together accounting for 26.8% of all Hampton residents.
| Ancestry | # Population | % Population |
| Afghan | 20 | 0.0% |
| African | 2,449 | 1.8% |
| Albanian | 14 | 0.0% |
| Alsatian | 63 | 0.1% |
| American | 7,578 | 5.5% |
| Apache | 38 | 0.0% |
| Arab | 935 | 0.7% |
| Argentinean | 78 | 0.1% |
| Armenian | 9 | 0.0% |
| Australian | 17 | 0.0% |
| Austrian | 77 | 0.1% |
| Barbadian | 57 | 0.0% |
| Belgian | 78 | 0.1% |
| Belizean | 33 | 0.0% |
| Bermudan | 15 | 0.0% |
| Bhutanese | 485 | 0.4% |
| Blackfeet | 190 | 0.1% |
| Brazilian | 7 | 0.0% |
| British | 827 | 0.6% |
| British West Indian | 44 | 0.0% |
| Burmese | 735 | 0.5% |
| Cajun | 12 | 0.0% |
| Canadian | 129 | 0.1% |
| Cape Verdean | 30 | 0.0% |
| Central American | 1,448 | 1.1% |
| Central American Indian | 184 | 0.1% |
| Cherokee | 633 | 0.5% |
| Chilean | 144 | 0.1% |
| Chippewa | 9 | 0.0% |
| Colombian | 149 | 0.1% |
| Comanche | 1 | 0.0% |
| Costa Rican | 23 | 0.0% |
| Creek | 48 | 0.0% |
| Croatian | 26 | 0.0% |
| Cuban | 287 | 0.2% |
| Czech | 80 | 0.1% |
| Czechoslovakian | 116 | 0.1% |
| Danish | 238 | 0.2% |
| Delaware | 56 | 0.0% |
| Dominican | 541 | 0.4% |
| Dutch | 602 | 0.4% |
| Eastern European | 130 | 0.1% |
| Ecuadorian | 147 | 0.1% |
| Egyptian | 228 | 0.2% |
| English | 10,216 | 7.4% |
| Ethiopian | 195 | 0.1% |
| European | 1,596 | 1.2% |
| Filipino | 28 | 0.0% |
| Finnish | 72 | 0.1% |
| French | 1,360 | 1.0% |
| French Canadian | 317 | 0.2% |
| German | 8,545 | 6.2% |
| Ghanaian | 142 | 0.1% |
| Greek | 380 | 0.3% |
| Guamanian / Chamorro | 50 | 0.0% |
| Guatemalan | 26 | 0.0% |
| Guyanese | 106 | 0.1% |
| Haitian | 301 | 0.2% |
| Honduran | 207 | 0.2% |
| Hungarian | 349 | 0.3% |
| Indian (Asian) | 396 | 0.3% |
| Iranian | 93 | 0.1% |
| Iraqi | 119 | 0.1% |
| Irish | 7,054 | 5.1% |
| Iroquois | 164 | 0.1% |
| Israeli | 34 | 0.0% |
| Italian | 2,910 | 2.1% |
| Jamaican | 873 | 0.6% |
| Japanese | 55 | 0.0% |
| Kenyan | 9 | 0.0% |
| Korean | 2,013 | 1.5% |
| Laotian | 83 | 0.1% |
| Lebanese | 110 | 0.1% |
| Lithuanian | 103 | 0.1% |
| Lumbee | 50 | 0.0% |
| Mexican | 2,681 | 1.9% |
| Mexican American Indian | 270 | 0.2% |
| Mongolian | 31 | 0.0% |
| Moroccan | 323 | 0.2% |
| Native Hawaiian | 168 | 0.1% |
| Navajo | 16 | 0.0% |
| Nicaraguan | 111 | 0.1% |
| Nigerian | 353 | 0.3% |
| Northern European | 74 | 0.1% |
| Norwegian | 462 | 0.3% |
| Pakistani | 222 | 0.2% |
| Panamanian | 882 | 0.6% |
| Pennsylvania German | 38 | 0.0% |
| Peruvian | 73 | 0.1% |
| Polish | 1,441 | 1.1% |
| Portuguese | 173 | 0.1% |
| Potawatomi | 12 | 0.0% |
| Pueblo | 8 | 0.0% |
| Puerto Rican | 2,928 | 2.1% |
| Romanian | 49 | 0.0% |
| Russian | 315 | 0.2% |
| Salvadoran | 199 | 0.2% |
| Samoan | 82 | 0.1% |
| Scandinavian | 152 | 0.1% |
| Scotch-Irish | 1,232 | 0.9% |
| Scottish | 1,294 | 0.9% |
| Senegalese | 11 | 0.0% |
| Serbian | 19 | 0.0% |
| Slavic | 19 | 0.0% |
| Slovak | 66 | 0.1% |
| Slovene | 12 | 0.0% |
| Somali | 5 | 0.0% |
| South African | 18 | 0.0% |
| South American | 647 | 0.5% |
| Spaniard | 232 | 0.2% |
| Spanish | 170 | 0.1% |
| Spanish American Indian | 12 | 0.0% |
| Sri Lankan | 674 | 0.5% |
| Subsaharan African | 3,380 | 2.5% |
| Swedish | 428 | 0.3% |
| Swiss | 141 | 0.1% |
| Syrian | 166 | 0.1% |
| Thai | 329 | 0.2% |
| Trinidadian and Tobagonian | 112 | 0.1% |
| Turkish | 4 | 0.0% |
| U.S. Virgin Islander | 27 | 0.0% |
| Ukrainian | 96 | 0.1% |
| Venezuelan | 56 | 0.0% |
| Vietnamese | 7 | 0.0% |
| Welsh | 276 | 0.2% |
| West Indian | 271 | 0.2% |
| Yugoslavian | 43 | 0.0% | View All 127 Rows |
Immigrants in Hampton
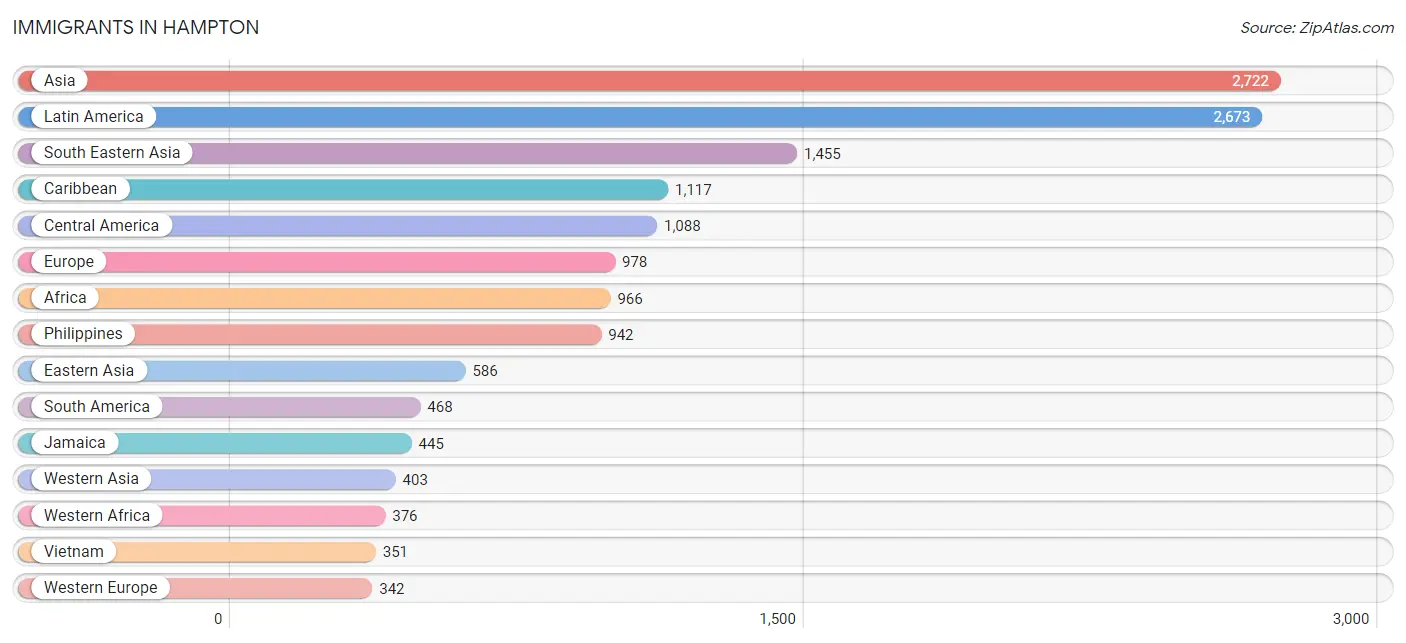
The most numerous immigrant groups reported in Hampton came from Asia (2,722 | 2.0%), Latin America (2,673 | 1.9%), South Eastern Asia (1,455 | 1.1%), Caribbean (1,117 | 0.8%), and Central America (1,088 | 0.8%), together accounting for 6.6% of all Hampton residents.
| Immigration Origin | # Population | % Population |
| Afghanistan | 20 | 0.0% |
| Africa | 966 | 0.7% |
| Argentina | 12 | 0.0% |
| Asia | 2,722 | 2.0% |
| Barbados | 22 | 0.0% |
| Belgium | 6 | 0.0% |
| Belize | 24 | 0.0% |
| Bosnia and Herzegovina | 14 | 0.0% |
| Cambodia | 15 | 0.0% |
| Canada | 182 | 0.1% |
| Caribbean | 1,117 | 0.8% |
| Central America | 1,088 | 0.8% |
| Chile | 100 | 0.1% |
| China | 126 | 0.1% |
| Colombia | 28 | 0.0% |
| Costa Rica | 23 | 0.0% |
| Cuba | 84 | 0.1% |
| Dominica | 12 | 0.0% |
| Dominican Republic | 212 | 0.2% |
| Eastern Africa | 40 | 0.0% |
| Eastern Asia | 586 | 0.4% |
| Eastern Europe | 175 | 0.1% |
| Ecuador | 104 | 0.1% |
| Egypt | 104 | 0.1% |
| El Salvador | 227 | 0.2% |
| England | 154 | 0.1% |
| Ethiopia | 29 | 0.0% |
| Europe | 978 | 0.7% |
| France | 69 | 0.1% |
| Germany | 237 | 0.2% |
| Ghana | 142 | 0.1% |
| Greece | 19 | 0.0% |
| Grenada | 9 | 0.0% |
| Guatemala | 14 | 0.0% |
| Guyana | 41 | 0.0% |
| Haiti | 186 | 0.1% |
| Honduras | 262 | 0.2% |
| Hong Kong | 3 | 0.0% |
| India | 117 | 0.1% |
| Indonesia | 14 | 0.0% |
| Iran | 22 | 0.0% |
| Iraq | 224 | 0.2% |
| Ireland | 29 | 0.0% |
| Italy | 35 | 0.0% |
| Jamaica | 445 | 0.3% |
| Japan | 262 | 0.2% |
| Jordan | 25 | 0.0% |
| Kenya | 9 | 0.0% |
| Korea | 198 | 0.1% |
| Latin America | 2,673 | 1.9% |
| Malaysia | 10 | 0.0% |
| Mexico | 289 | 0.2% |
| Middle Africa | 88 | 0.1% |
| Morocco | 138 | 0.1% |
| Nepal | 28 | 0.0% |
| Netherlands | 30 | 0.0% |
| Nigeria | 108 | 0.1% |
| Northern Africa | 242 | 0.2% |
| Northern Europe | 229 | 0.2% |
| Pakistan | 91 | 0.1% |
| Panama | 249 | 0.2% |
| Peru | 50 | 0.0% |
| Philippines | 942 | 0.7% |
| Poland | 51 | 0.0% |
| Portugal | 8 | 0.0% |
| Romania | 25 | 0.0% |
| Russia | 42 | 0.0% |
| Senegal | 11 | 0.0% |
| Serbia | 19 | 0.0% |
| Sierra Leone | 10 | 0.0% |
| South Africa | 33 | 0.0% |
| South America | 468 | 0.3% |
| South Central Asia | 278 | 0.2% |
| South Eastern Asia | 1,455 | 1.1% |
| Southern Europe | 232 | 0.2% |
| Spain | 170 | 0.1% |
| St. Vincent and the Grenadines | 36 | 0.0% |
| Syria | 154 | 0.1% |
| Taiwan | 33 | 0.0% |
| Thailand | 123 | 0.1% |
| Trinidad and Tobago | 28 | 0.0% |
| Ukraine | 11 | 0.0% |
| Venezuela | 56 | 0.0% |
| Vietnam | 351 | 0.3% |
| Western Africa | 376 | 0.3% |
| Western Asia | 403 | 0.3% |
| Western Europe | 342 | 0.3% |
| Zaire | 88 | 0.1% | View All 88 Rows |
Sex and Age in Hampton
Sex and Age in Hampton
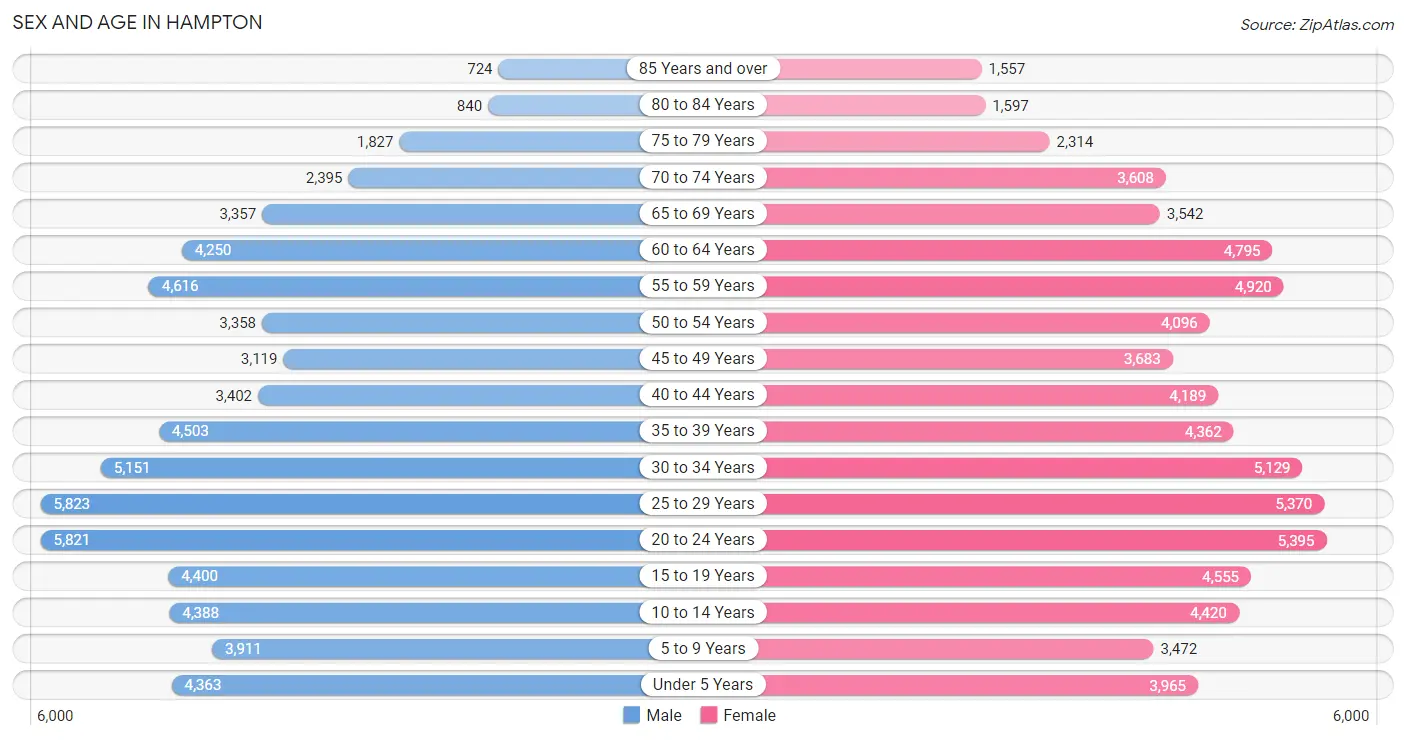
The most populous age groups in Hampton are 25 to 29 Years (5,823 | 8.8%) for men and 20 to 24 Years (5,395 | 7.6%) for women.
| Age Bracket | Male | Female |
| Under 5 Years | 4,363 (6.6%) | 3,965 (5.6%) |
| 5 to 9 Years | 3,911 (5.9%) | 3,472 (4.9%) |
| 10 to 14 Years | 4,388 (6.6%) | 4,420 (6.2%) |
| 15 to 19 Years | 4,400 (6.6%) | 4,555 (6.4%) |
| 20 to 24 Years | 5,821 (8.8%) | 5,395 (7.6%) |
| 25 to 29 Years | 5,823 (8.8%) | 5,370 (7.6%) |
| 30 to 34 Years | 5,151 (7.8%) | 5,129 (7.2%) |
| 35 to 39 Years | 4,503 (6.8%) | 4,362 (6.1%) |
| 40 to 44 Years | 3,402 (5.1%) | 4,189 (5.9%) |
| 45 to 49 Years | 3,119 (4.7%) | 3,683 (5.2%) |
| 50 to 54 Years | 3,358 (5.1%) | 4,096 (5.8%) |
| 55 to 59 Years | 4,616 (7.0%) | 4,920 (6.9%) |
| 60 to 64 Years | 4,250 (6.4%) | 4,795 (6.8%) |
| 65 to 69 Years | 3,357 (5.1%) | 3,542 (5.0%) |
| 70 to 74 Years | 2,395 (3.6%) | 3,608 (5.1%) |
| 75 to 79 Years | 1,827 (2.8%) | 2,314 (3.3%) |
| 80 to 84 Years | 840 (1.3%) | 1,597 (2.2%) |
| 85 Years and over | 724 (1.1%) | 1,557 (2.2%) |
| Total | 66,248 (100.0%) | 70,969 (100.0%) |
Families and Households in Hampton
Median Family Size in Hampton
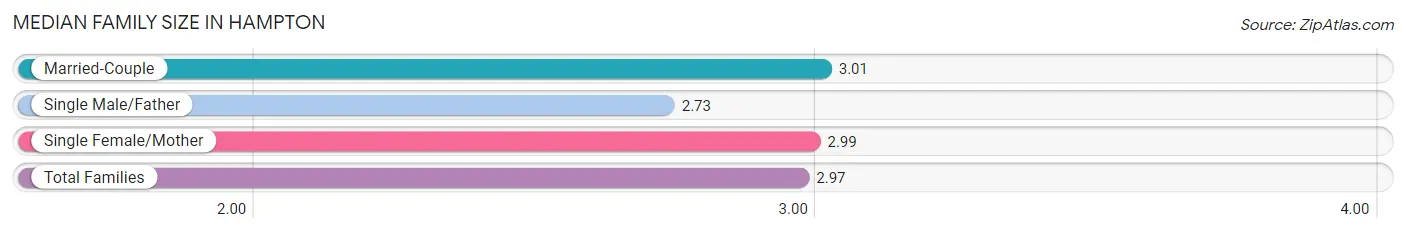
The median family size in Hampton is 2.97 persons per family, with married-couple families (21,686 | 62.9%) accounting for the largest median family size of 3.01 persons per family. On the other hand, single male/father families (3,457 | 10.0%) represent the smallest median family size with 2.73 persons per family.
| Family Type | # Families | Family Size |
| Married-Couple | 21,686 (62.9%) | 3.01 |
| Single Male/Father | 3,457 (10.0%) | 2.73 |
| Single Female/Mother | 9,345 (27.1%) | 2.99 |
| Total Families | 34,488 (100.0%) | 2.97 |
Median Household Size in Hampton
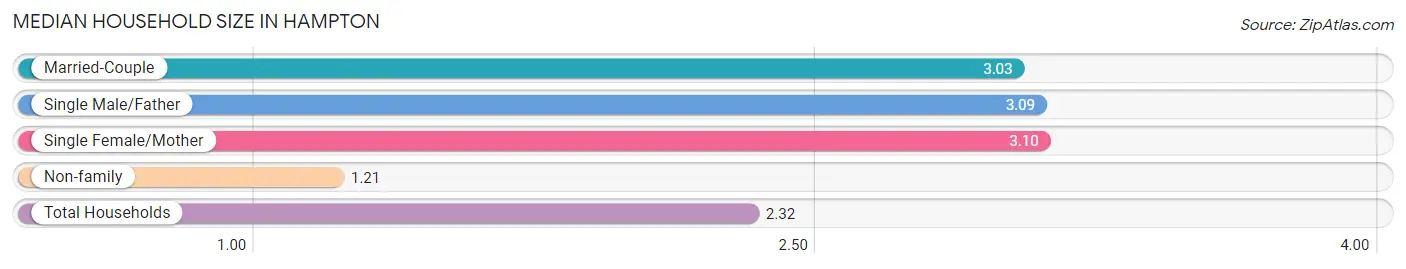
The median household size in Hampton is 2.32 persons per household, with single female/mother households (9,345 | 16.3%) accounting for the largest median household size of 3.1 persons per household. non-family households (22,982 | 40.0%) represent the smallest median household size with 1.21 persons per household.
| Household Type | # Households | Household Size |
| Married-Couple | 21,686 (37.7%) | 3.03 |
| Single Male/Father | 3,457 (6.0%) | 3.09 |
| Single Female/Mother | 9,345 (16.3%) | 3.10 |
| Non-family | 22,982 (40.0%) | 1.21 |
| Total Households | 57,470 (100.0%) | 2.32 |
Household Size by Marriage Status in Hampton
Out of a total of 57,470 households in Hampton, 34,488 (60.0%) are family households, while 22,982 (40.0%) are nonfamily households. The most numerous type of family households are 2-person households, comprising 15,322, and the most common type of nonfamily households are 1-person households, comprising 19,415.
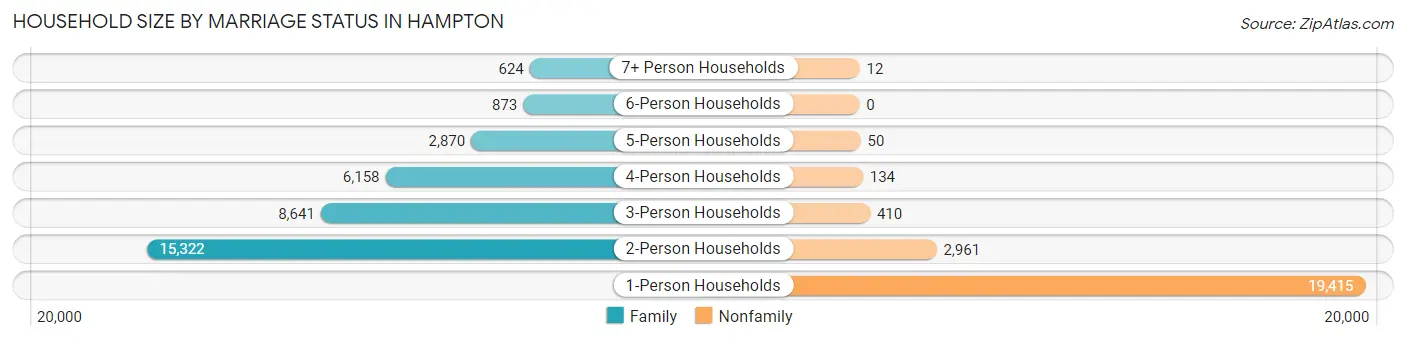
| Household Size | Family Households | Nonfamily Households |
| 1-Person Households | - | 19,415 (33.8%) |
| 2-Person Households | 15,322 (26.7%) | 2,961 (5.1%) |
| 3-Person Households | 8,641 (15.0%) | 410 (0.7%) |
| 4-Person Households | 6,158 (10.7%) | 134 (0.2%) |
| 5-Person Households | 2,870 (5.0%) | 50 (0.1%) |
| 6-Person Households | 873 (1.5%) | 0 (0.0%) |
| 7+ Person Households | 624 (1.1%) | 12 (0.0%) |
| Total | 34,488 (60.0%) | 22,982 (40.0%) |
Female Fertility in Hampton
Fertility by Age in Hampton
Average fertility rate in Hampton is 49.0 births per 1,000 women. Women in the age bracket of 20 to 34 years have the highest fertility rate with 81.0 births per 1,000 women. Women in the age bracket of 20 to 34 years acount for 79.6% of all women with births.
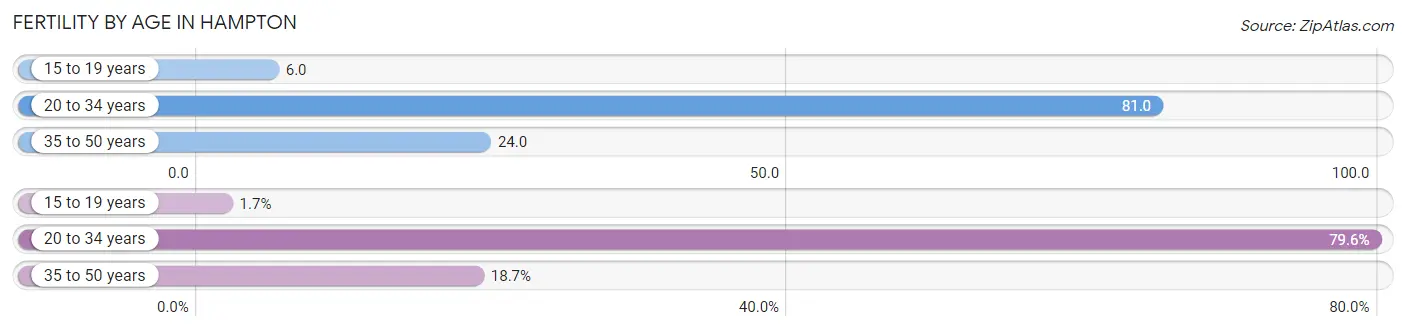
| Age Bracket | Women with Births | Births / 1,000 Women |
| 15 to 19 years | 27 (1.7%) | 6.0 |
| 20 to 34 years | 1,289 (79.6%) | 81.0 |
| 35 to 50 years | 303 (18.7%) | 24.0 |
| Total | 1,619 (100.0%) | 49.0 |
Fertility by Age by Marriage Status in Hampton
51.4% of women with births (1,619) in Hampton are married. The highest percentage of unmarried women with births falls into 15 to 19 years age bracket with 59.3% of them unmarried at the time of birth, while the lowest percentage of unmarried women with births belong to 35 to 50 years age bracket with 23.1% of them unmarried.
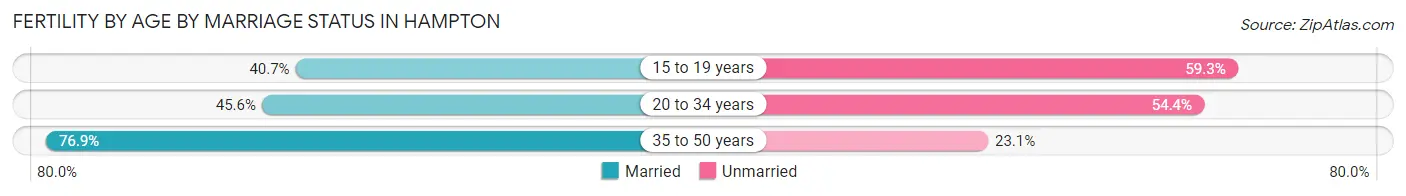
| Age Bracket | Married | Unmarried |
| 15 to 19 years | 11 (40.7%) | 16 (59.3%) |
| 20 to 34 years | 588 (45.6%) | 701 (54.4%) |
| 35 to 50 years | 233 (76.9%) | 70 (23.1%) |
| Total | 832 (51.4%) | 787 (48.6%) |
Fertility by Education in Hampton
Average fertility rate in Hampton is 49.0 births per 1,000 women. Women with the education attainment of high school diploma have the highest fertility rate of 73.0 births per 1,000 women, while women with the education attainment of less than high school have the lowest fertility at 17.0 births per 1,000 women. Women with the education attainment of college or associate's degree represent 39.7% of all women with births.
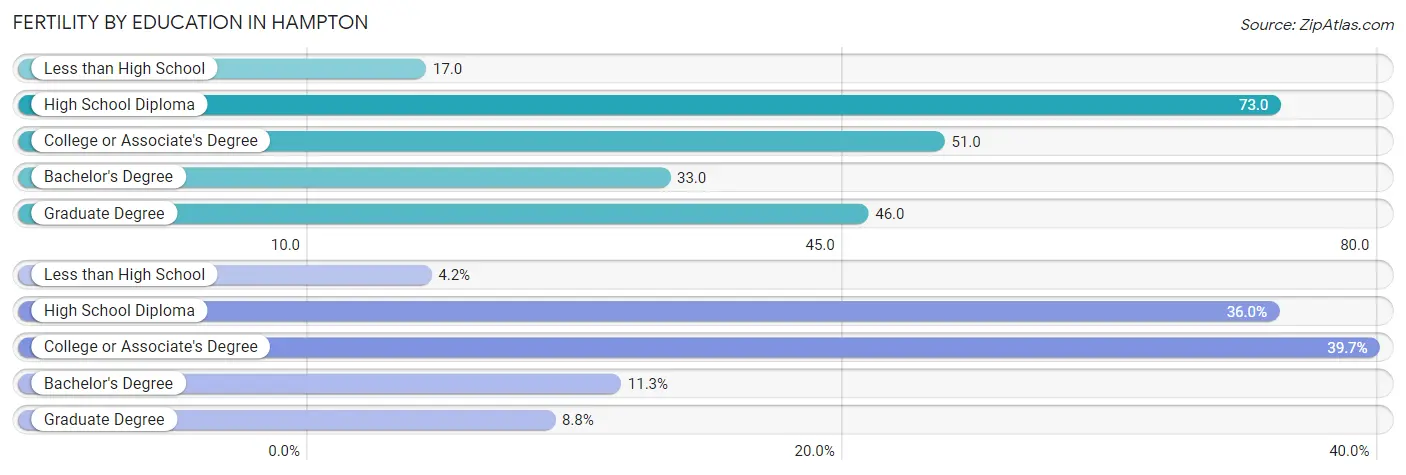
| Educational Attainment | Women with Births | Births / 1,000 Women |
| Less than High School | 68 (4.2%) | 17.0 |
| High School Diploma | 582 (35.9%) | 73.0 |
| College or Associate's Degree | 643 (39.7%) | 51.0 |
| Bachelor's Degree | 183 (11.3%) | 33.0 |
| Graduate Degree | 143 (8.8%) | 46.0 |
| Total | 1,619 (100.0%) | 49.0 |
Fertility by Education by Marriage Status in Hampton
48.6% of women with births in Hampton are unmarried. Women with the educational attainment of graduate degree are most likely to be married with 82.5% of them married at childbirth, while women with the educational attainment of high school diploma are least likely to be married with 65.8% of them unmarried at childbirth.
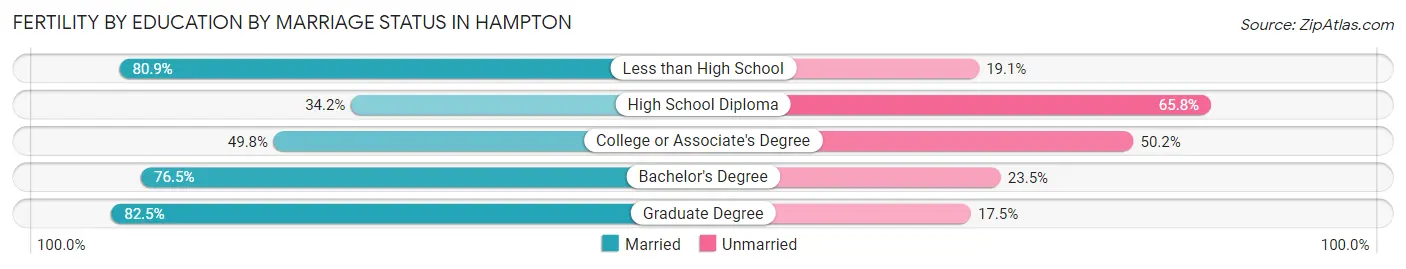
| Educational Attainment | Married | Unmarried |
| Less than High School | 55 (80.9%) | 13 (19.1%) |
| High School Diploma | 199 (34.2%) | 383 (65.8%) |
| College or Associate's Degree | 320 (49.8%) | 323 (50.2%) |
| Bachelor's Degree | 140 (76.5%) | 43 (23.5%) |
| Graduate Degree | 118 (82.5%) | 25 (17.5%) |
| Total | 832 (51.4%) | 787 (48.6%) |
Employment Characteristics in Hampton
Employment by Class of Employer in Hampton
Among the 67,348 employed individuals in Hampton, private company employees (39,127 | 58.1%), federal government employees (13,046 | 19.4%), and local government employees (5,595 | 8.3%) make up the most common classes of employment.
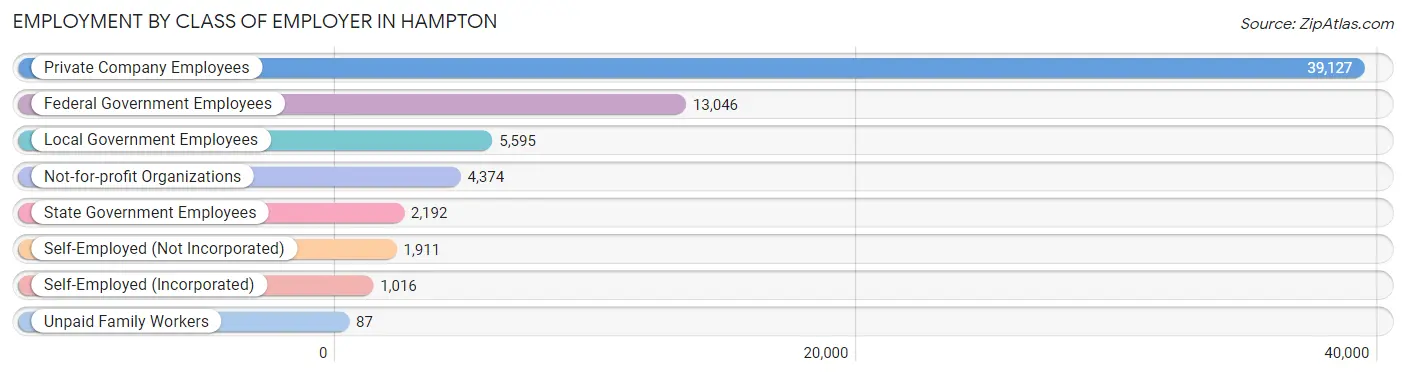
| Employer Class | # Employees | % Employees |
| Private Company Employees | 39,127 | 58.1% |
| Self-Employed (Incorporated) | 1,016 | 1.5% |
| Self-Employed (Not Incorporated) | 1,911 | 2.8% |
| Not-for-profit Organizations | 4,374 | 6.5% |
| Local Government Employees | 5,595 | 8.3% |
| State Government Employees | 2,192 | 3.3% |
| Federal Government Employees | 13,046 | 19.4% |
| Unpaid Family Workers | 87 | 0.1% |
| Total | 67,348 | 100.0% |
Employment Status by Age in Hampton
According to the labor force statistics for Hampton, out of the total population over 16 years of age (111,012), 65.9% or 73,157 individuals are in the labor force, with 6.5% or 4,755 of them unemployed. The age group with the highest labor force participation rate is 25 to 29 years, with 87.6% or 9,805 individuals in the labor force. Within the labor force, the 16 to 19 years age range has the highest percentage of unemployed individuals, with 29.5% or 984 of them being unemployed.
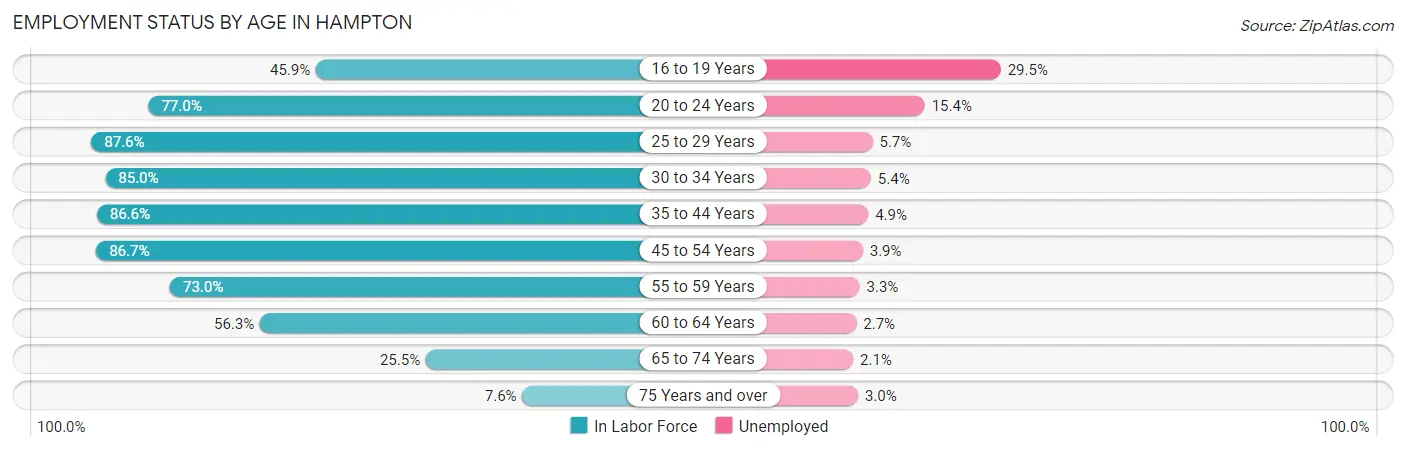
| Age Bracket | In Labor Force | Unemployed |
| 16 to 19 Years | 3,336 (45.9%) | 984 (29.5%) |
| 20 to 24 Years | 8,636 (77.0%) | 1,330 (15.4%) |
| 25 to 29 Years | 9,805 (87.6%) | 559 (5.7%) |
| 30 to 34 Years | 8,738 (85.0%) | 472 (5.4%) |
| 35 to 44 Years | 14,251 (86.6%) | 698 (4.9%) |
| 45 to 54 Years | 12,360 (86.7%) | 482 (3.9%) |
| 55 to 59 Years | 6,961 (73.0%) | 230 (3.3%) |
| 60 to 64 Years | 5,092 (56.3%) | 137 (2.7%) |
| 65 to 74 Years | 3,290 (25.5%) | 69 (2.1%) |
| 75 Years and over | 673 (7.6%) | 20 (3.0%) |
| Total | 73,157 (65.9%) | 4,755 (6.5%) |
Employment Status by Educational Attainment in Hampton
According to labor force statistics for Hampton, 80.8% of individuals (57,179) out of the total population between 25 and 64 years of age (70,766) are in the labor force, with 4.5% or 2,573 of them being unemployed. The group with the highest labor force participation rate are those with the educational attainment of bachelor's degree or higher, with 89.7% or 18,193 individuals in the labor force. Within the labor force, individuals with less than high school education have the highest percentage of unemployment, with 11.5% or 307 of them being unemployed.
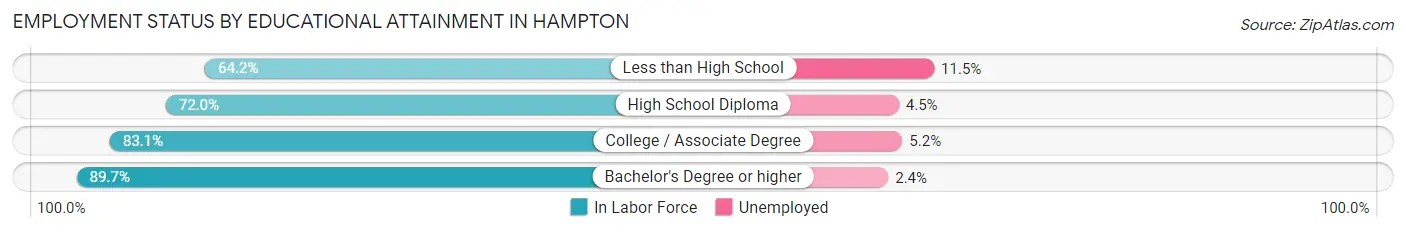
| Educational Attainment | In Labor Force | Unemployed |
| Less than High School | 2,670 (64.2%) | 478 (11.5%) |
| High School Diploma | 13,924 (72.0%) | 870 (4.5%) |
| College / Associate Degree | 22,425 (83.1%) | 1,403 (5.2%) |
| Bachelor's Degree or higher | 18,193 (89.7%) | 487 (2.4%) |
| Total | 57,179 (80.8%) | 3,184 (4.5%) |
Employment Occupations by Sex in Hampton
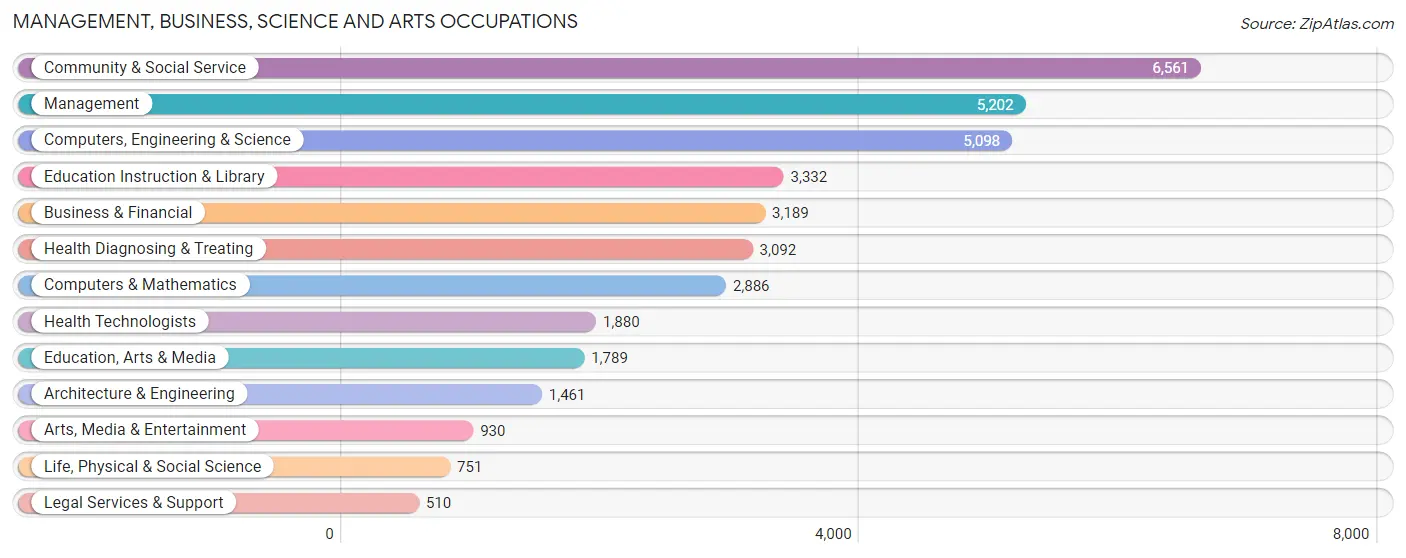
Management, Business, Science and Arts Occupations
The most common Management, Business, Science and Arts occupations in Hampton are Community & Social Service (6,561 | 10.5%), Management (5,202 | 8.3%), Computers, Engineering & Science (5,098 | 8.2%), Education Instruction & Library (3,332 | 5.3%), and Business & Financial (3,189 | 5.1%).
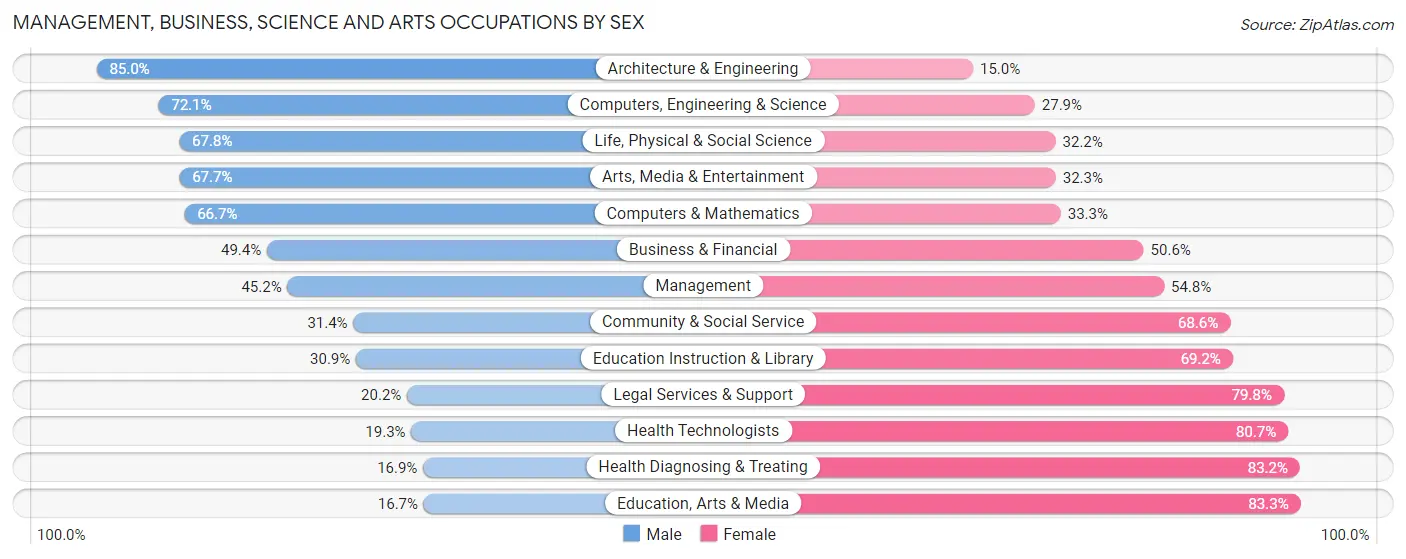
Management, Business, Science and Arts Occupations by Sex
Within the Management, Business, Science and Arts occupations in Hampton, the most male-oriented occupations are Architecture & Engineering (85.0%), Computers, Engineering & Science (72.1%), and Life, Physical & Social Science (67.8%), while the most female-oriented occupations are Education, Arts & Media (83.3%), Health Diagnosing & Treating (83.2%), and Health Technologists (80.7%).
| Occupation | Male | Female |
| Management | 2,349 (45.2%) | 2,853 (54.8%) |
| Business & Financial | 1,576 (49.4%) | 1,613 (50.6%) |
| Computers, Engineering & Science | 3,676 (72.1%) | 1,422 (27.9%) |
| Computers & Mathematics | 1,925 (66.7%) | 961 (33.3%) |
| Architecture & Engineering | 1,242 (85.0%) | 219 (15.0%) |
| Life, Physical & Social Science | 509 (67.8%) | 242 (32.2%) |
| Community & Social Service | 2,060 (31.4%) | 4,501 (68.6%) |
| Education, Arts & Media | 299 (16.7%) | 1,490 (83.3%) |
| Legal Services & Support | 103 (20.2%) | 407 (79.8%) |
| Education Instruction & Library | 1,028 (30.8%) | 2,304 (69.2%) |
| Arts, Media & Entertainment | 630 (67.7%) | 300 (32.3%) |
| Health Diagnosing & Treating | 521 (16.9%) | 2,571 (83.2%) |
| Health Technologists | 363 (19.3%) | 1,517 (80.7%) |
| Total (Category) | 10,182 (44.0%) | 12,960 (56.0%) |
| Total (Overall) | 30,059 (48.1%) | 32,379 (51.9%) |
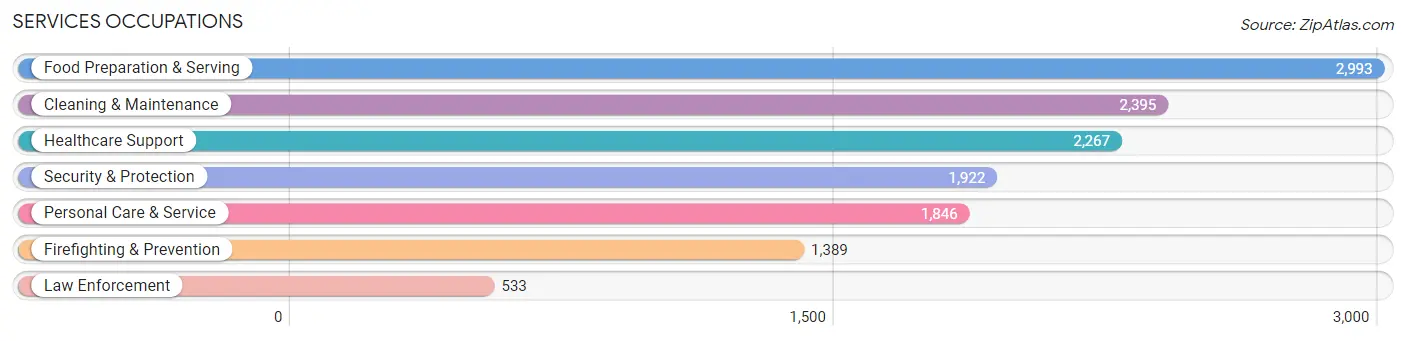
Services Occupations
The most common Services occupations in Hampton are Food Preparation & Serving (2,993 | 4.8%), Cleaning & Maintenance (2,395 | 3.8%), Healthcare Support (2,267 | 3.6%), Security & Protection (1,922 | 3.1%), and Personal Care & Service (1,846 | 3.0%).
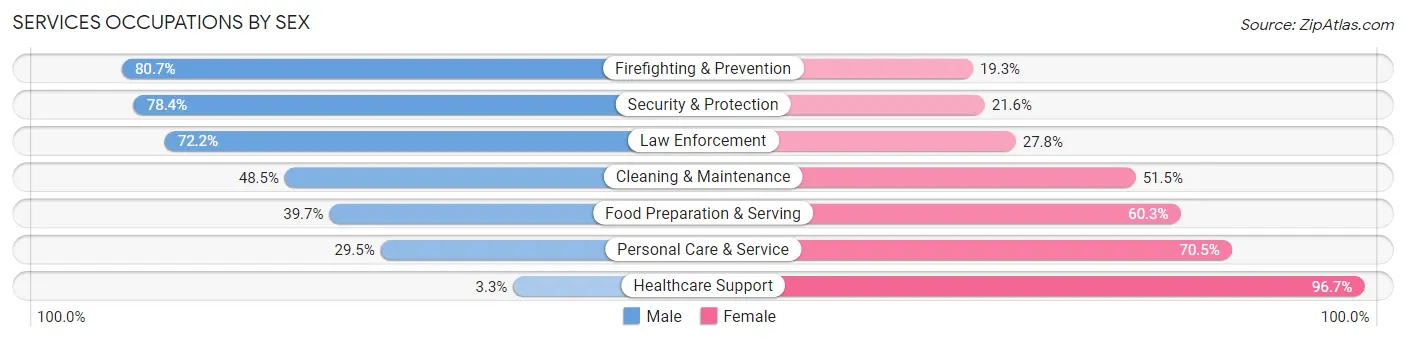
Services Occupations by Sex
Within the Services occupations in Hampton, the most male-oriented occupations are Firefighting & Prevention (80.7%), Security & Protection (78.4%), and Law Enforcement (72.2%), while the most female-oriented occupations are Healthcare Support (96.7%), Personal Care & Service (70.5%), and Food Preparation & Serving (60.3%).
| Occupation | Male | Female |
| Healthcare Support | 74 (3.3%) | 2,193 (96.7%) |
| Security & Protection | 1,506 (78.4%) | 416 (21.6%) |
| Firefighting & Prevention | 1,121 (80.7%) | 268 (19.3%) |
| Law Enforcement | 385 (72.2%) | 148 (27.8%) |
| Food Preparation & Serving | 1,187 (39.7%) | 1,806 (60.3%) |
| Cleaning & Maintenance | 1,161 (48.5%) | 1,234 (51.5%) |
| Personal Care & Service | 545 (29.5%) | 1,301 (70.5%) |
| Total (Category) | 4,473 (39.2%) | 6,950 (60.8%) |
| Total (Overall) | 30,059 (48.1%) | 32,379 (51.9%) |
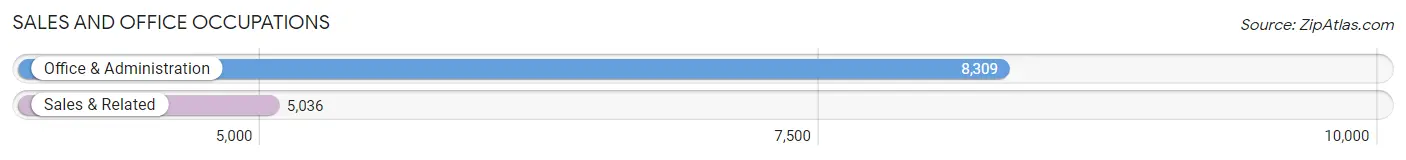
Sales and Office Occupations
The most common Sales and Office occupations in Hampton are Office & Administration (8,309 | 13.3%), and Sales & Related (5,036 | 8.1%).
Sales and Office Occupations by Sex
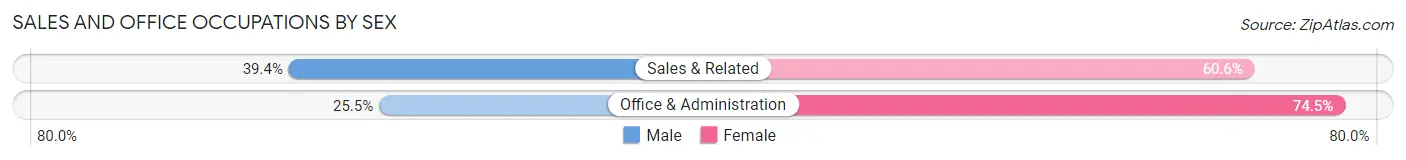
| Occupation | Male | Female |
| Sales & Related | 1,982 (39.4%) | 3,054 (60.6%) |
| Office & Administration | 2,116 (25.5%) | 6,193 (74.5%) |
| Total (Category) | 4,098 (30.7%) | 9,247 (69.3%) |
| Total (Overall) | 30,059 (48.1%) | 32,379 (51.9%) |
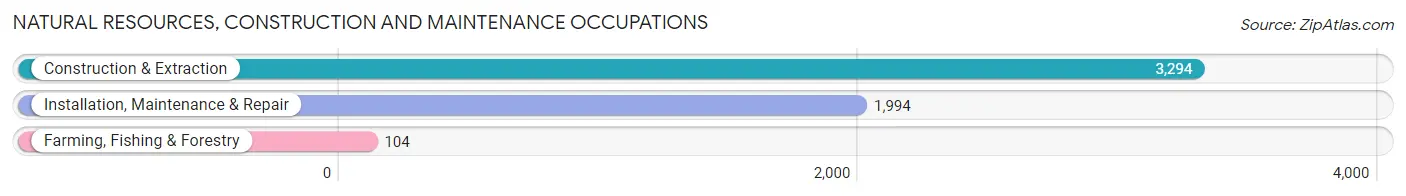
Natural Resources, Construction and Maintenance Occupations
The most common Natural Resources, Construction and Maintenance occupations in Hampton are Construction & Extraction (3,294 | 5.3%), Installation, Maintenance & Repair (1,994 | 3.2%), and Farming, Fishing & Forestry (104 | 0.2%).
Natural Resources, Construction and Maintenance Occupations by Sex
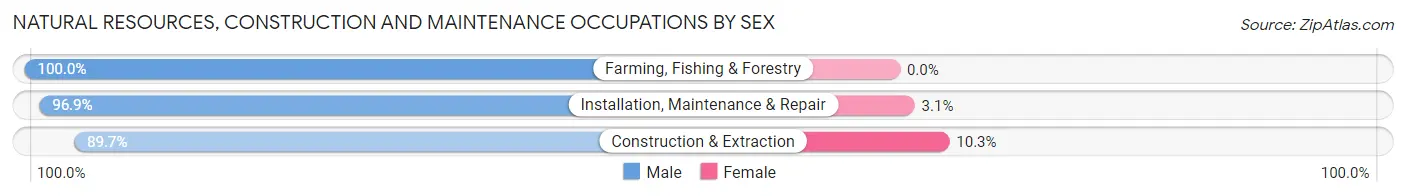
| Occupation | Male | Female |
| Farming, Fishing & Forestry | 104 (100.0%) | 0 (0.0%) |
| Construction & Extraction | 2,955 (89.7%) | 339 (10.3%) |
| Installation, Maintenance & Repair | 1,933 (96.9%) | 61 (3.1%) |
| Total (Category) | 4,992 (92.6%) | 400 (7.4%) |
| Total (Overall) | 30,059 (48.1%) | 32,379 (51.9%) |
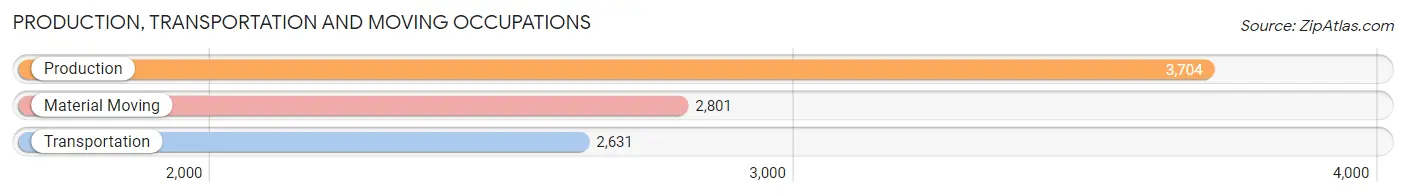
Production, Transportation and Moving Occupations
The most common Production, Transportation and Moving occupations in Hampton are Production (3,704 | 5.9%), Material Moving (2,801 | 4.5%), and Transportation (2,631 | 4.2%).
Production, Transportation and Moving Occupations by Sex
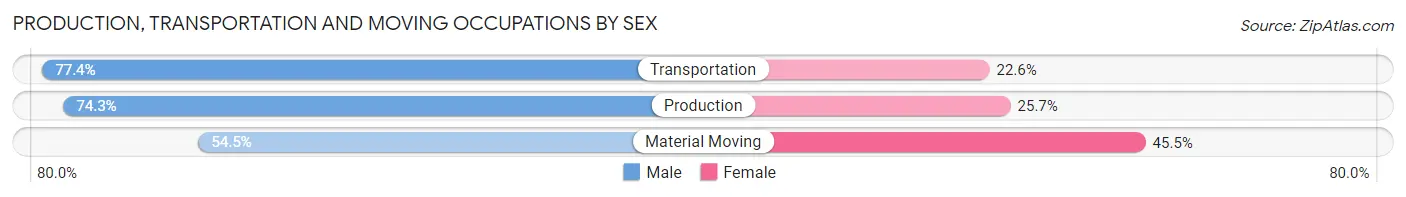
| Occupation | Male | Female |
| Production | 2,752 (74.3%) | 952 (25.7%) |
| Transportation | 2,036 (77.4%) | 595 (22.6%) |
| Material Moving | 1,526 (54.5%) | 1,275 (45.5%) |
| Total (Category) | 6,314 (69.1%) | 2,822 (30.9%) |
| Total (Overall) | 30,059 (48.1%) | 32,379 (51.9%) |
Employment Industries by Sex in Hampton
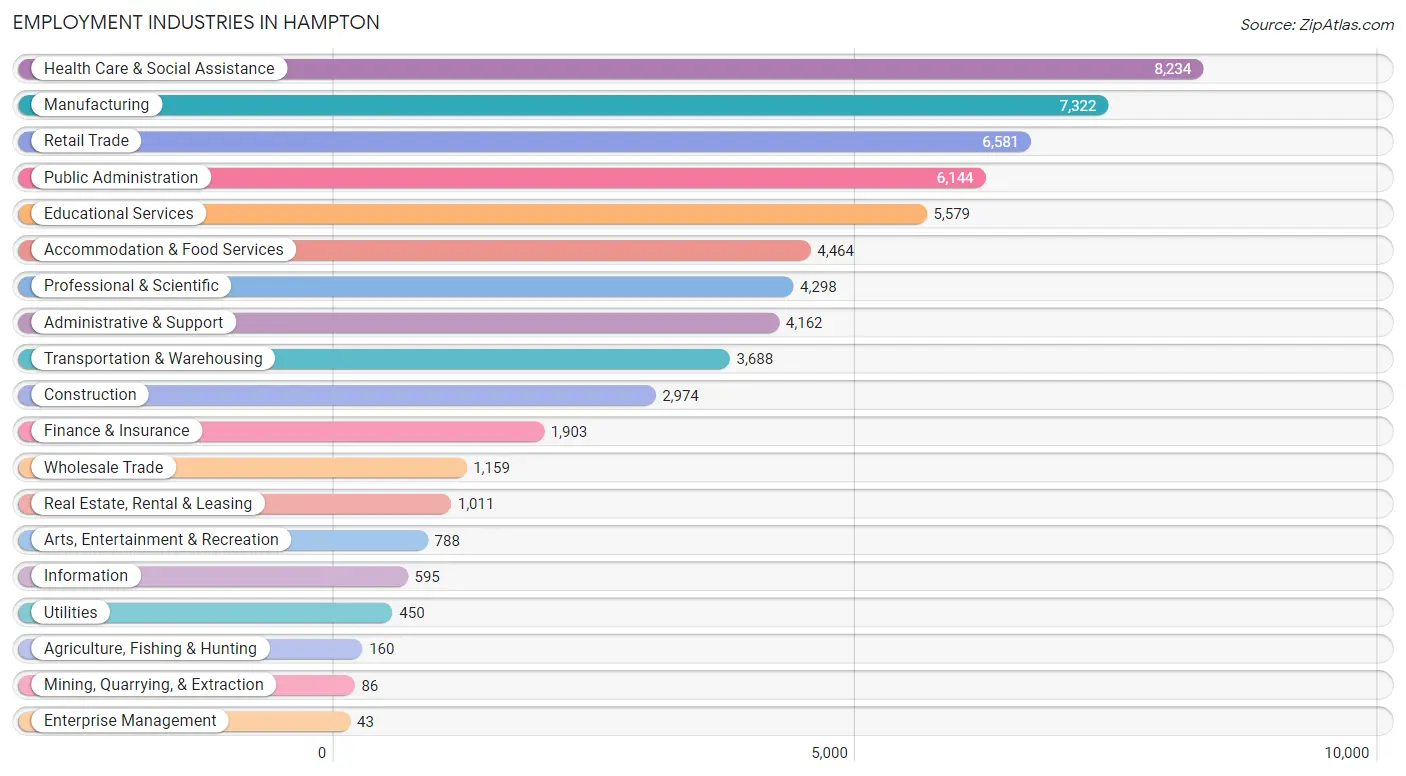
Employment Industries in Hampton
The major employment industries in Hampton include Health Care & Social Assistance (8,234 | 13.2%), Manufacturing (7,322 | 11.7%), Retail Trade (6,581 | 10.5%), Public Administration (6,144 | 9.8%), and Educational Services (5,579 | 8.9%).
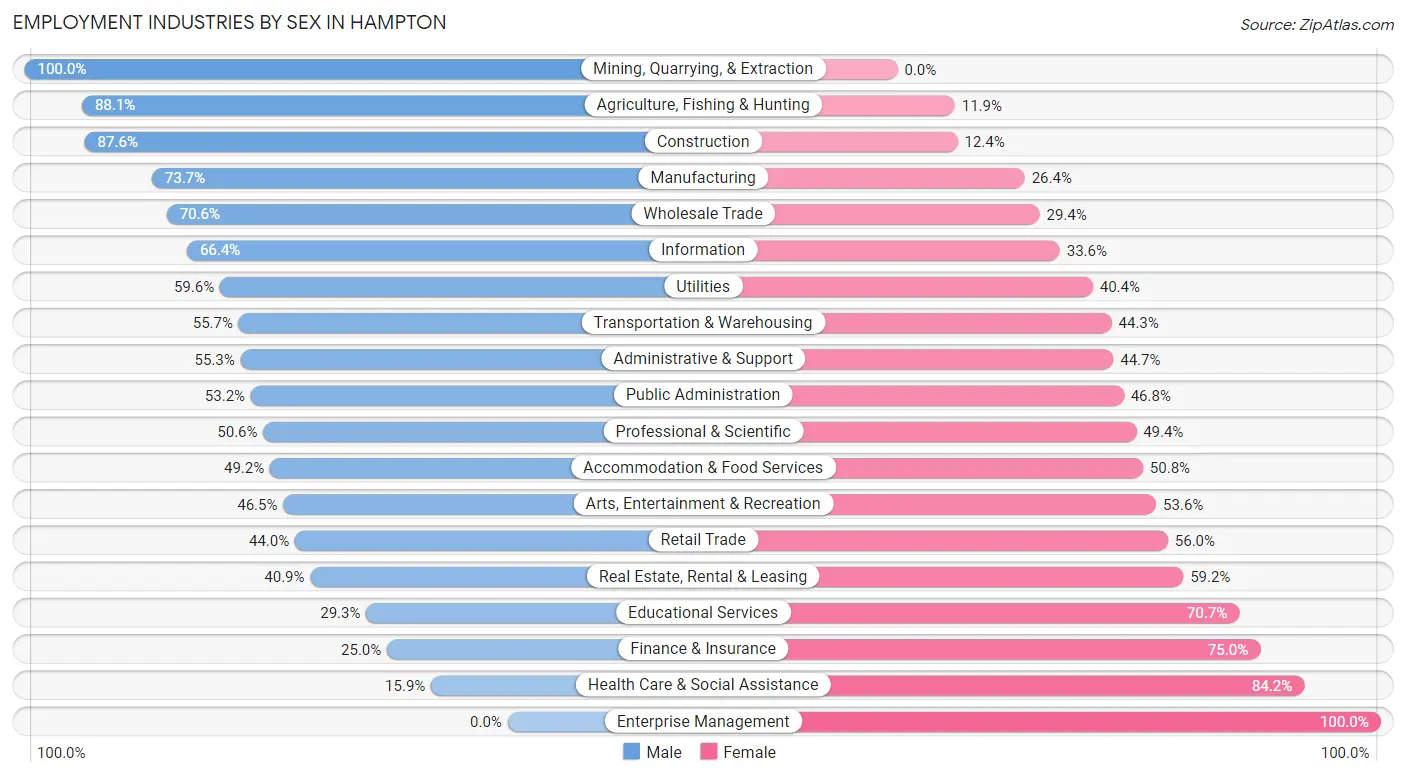
Employment Industries by Sex in Hampton
The Hampton industries that see more men than women are Mining, Quarrying, & Extraction (100.0%), Agriculture, Fishing & Hunting (88.1%), and Construction (87.6%), whereas the industries that tend to have a higher number of women are Enterprise Management (100.0%), Health Care & Social Assistance (84.2%), and Finance & Insurance (75.0%).
| Industry | Male | Female |
| Agriculture, Fishing & Hunting | 141 (88.1%) | 19 (11.9%) |
| Mining, Quarrying, & Extraction | 86 (100.0%) | 0 (0.0%) |
| Construction | 2,604 (87.6%) | 370 (12.4%) |
| Manufacturing | 5,393 (73.7%) | 1,929 (26.4%) |
| Wholesale Trade | 818 (70.6%) | 341 (29.4%) |
| Retail Trade | 2,897 (44.0%) | 3,684 (56.0%) |
| Transportation & Warehousing | 2,053 (55.7%) | 1,635 (44.3%) |
| Utilities | 268 (59.6%) | 182 (40.4%) |
| Information | 395 (66.4%) | 200 (33.6%) |
| Finance & Insurance | 475 (25.0%) | 1,428 (75.0%) |
| Real Estate, Rental & Leasing | 413 (40.8%) | 598 (59.2%) |
| Professional & Scientific | 2,174 (50.6%) | 2,124 (49.4%) |
| Enterprise Management | 0 (0.0%) | 43 (100.0%) |
| Administrative & Support | 2,302 (55.3%) | 1,860 (44.7%) |
| Educational Services | 1,633 (29.3%) | 3,946 (70.7%) |
| Health Care & Social Assistance | 1,305 (15.9%) | 6,929 (84.2%) |
| Arts, Entertainment & Recreation | 366 (46.5%) | 422 (53.5%) |
| Accommodation & Food Services | 2,196 (49.2%) | 2,268 (50.8%) |
| Public Administration | 3,266 (53.2%) | 2,878 (46.8%) |
| Total | 30,059 (48.1%) | 32,379 (51.9%) |
Education in Hampton
School Enrollment in Hampton
The most common levels of schooling among the 32,658 students in Hampton are college / undergraduate (8,629 | 26.4%), middle school (6,789 | 20.8%), and high school (6,377 | 19.5%).
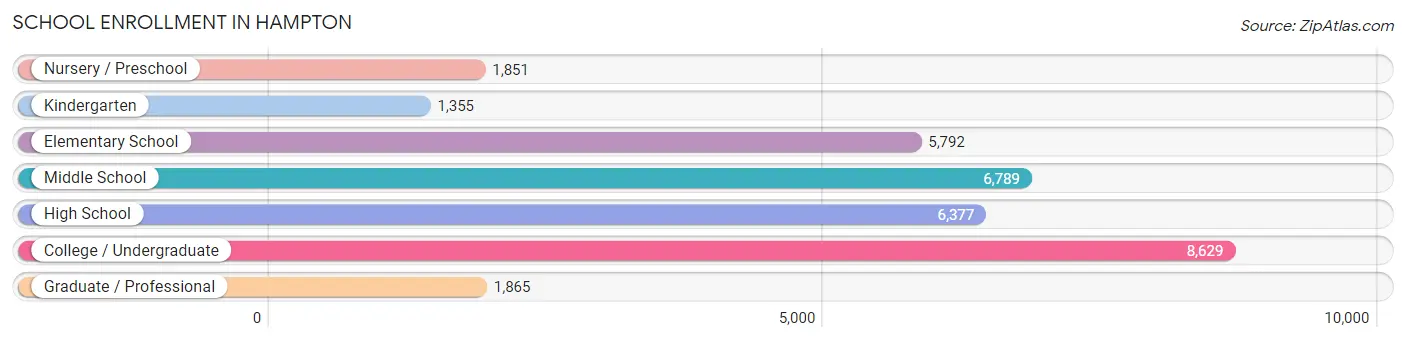
| School Level | # Students | % Students |
| Nursery / Preschool | 1,851 | 5.7% |
| Kindergarten | 1,355 | 4.2% |
| Elementary School | 5,792 | 17.7% |
| Middle School | 6,789 | 20.8% |
| High School | 6,377 | 19.5% |
| College / Undergraduate | 8,629 | 26.4% |
| Graduate / Professional | 1,865 | 5.7% |
| Total | 32,658 | 100.0% |
School Enrollment by Age by Funding Source in Hampton
Out of a total of 32,658 students who are enrolled in schools in Hampton, 6,434 (19.7%) attend a private institution, while the remaining 26,224 (80.3%) are enrolled in public schools. The age group of 18 to 19 year olds has the highest likelihood of being enrolled in private schools, with 1,275 (46.3% in the age bracket) enrolled. Conversely, the age group of 15 to 17 year olds has the lowest likelihood of being enrolled in a private school, with 4,403 (93.6% in the age bracket) attending a public institution.
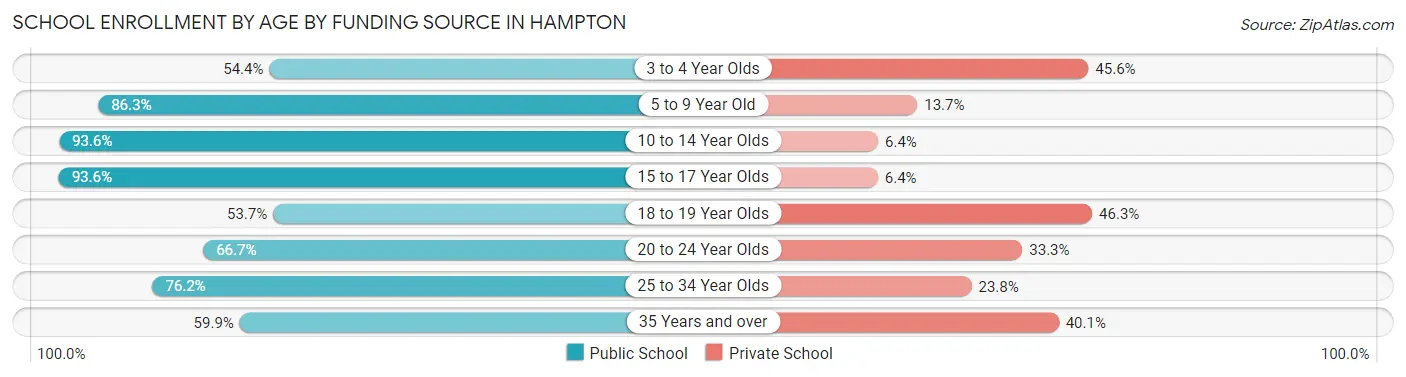
| Age Bracket | Public School | Private School |
| 3 to 4 Year Olds | 831 (54.4%) | 696 (45.6%) |
| 5 to 9 Year Old | 5,924 (86.3%) | 942 (13.7%) |
| 10 to 14 Year Olds | 7,808 (93.6%) | 535 (6.4%) |
| 15 to 17 Year Olds | 4,403 (93.6%) | 299 (6.4%) |
| 18 to 19 Year Olds | 1,480 (53.7%) | 1,275 (46.3%) |
| 20 to 24 Year Olds | 2,514 (66.7%) | 1,254 (33.3%) |
| 25 to 34 Year Olds | 2,076 (76.2%) | 649 (23.8%) |
| 35 Years and over | 1,182 (59.9%) | 790 (40.1%) |
| Total | 26,224 (80.3%) | 6,434 (19.7%) |
Educational Attainment by Field of Study in Hampton
Business (5,200 | 18.9%), arts & humanities (3,332 | 12.1%), education (3,038 | 11.1%), science & technology (2,370 | 8.6%), and social sciences (2,145 | 7.8%) are the most common fields of study among 27,451 individuals in Hampton who have obtained a bachelor's degree or higher.
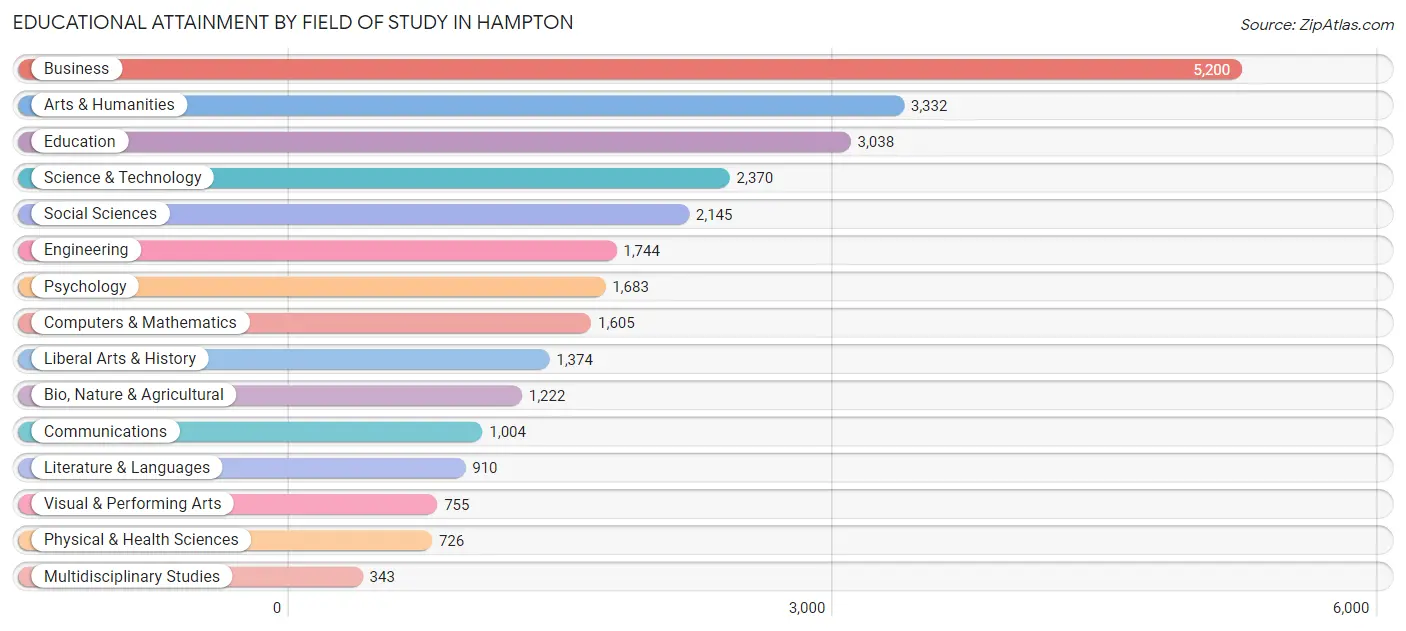
| Field of Study | # Graduates | % Graduates |
| Computers & Mathematics | 1,605 | 5.9% |
| Bio, Nature & Agricultural | 1,222 | 4.4% |
| Physical & Health Sciences | 726 | 2.6% |
| Psychology | 1,683 | 6.1% |
| Social Sciences | 2,145 | 7.8% |
| Engineering | 1,744 | 6.4% |
| Multidisciplinary Studies | 343 | 1.3% |
| Science & Technology | 2,370 | 8.6% |
| Business | 5,200 | 18.9% |
| Education | 3,038 | 11.1% |
| Literature & Languages | 910 | 3.3% |
| Liberal Arts & History | 1,374 | 5.0% |
| Visual & Performing Arts | 755 | 2.8% |
| Communications | 1,004 | 3.7% |
| Arts & Humanities | 3,332 | 12.1% |
| Total | 27,451 | 100.0% |
Transportation & Commute in Hampton
Vehicle Availability by Sex in Hampton
The most prevalent vehicle ownership categories in Hampton are males with 2 vehicles (13,334, accounting for 39.5%) and females with 2 vehicles (11,803, making up 41.4%).
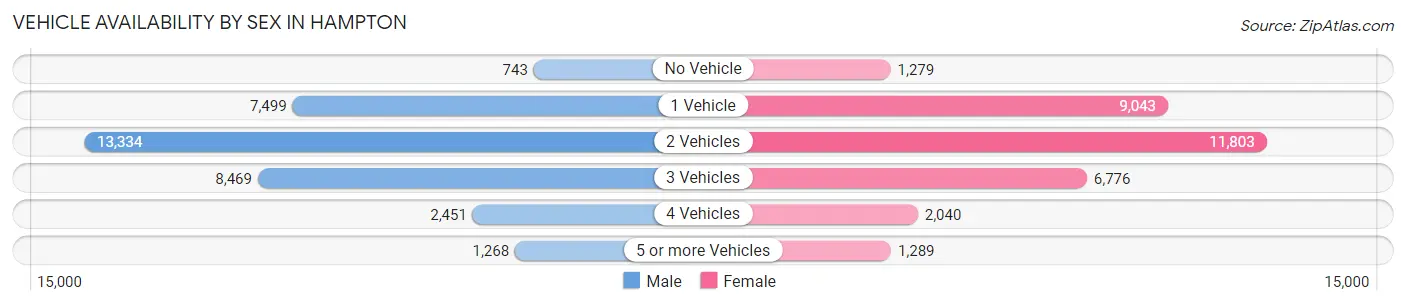
| Vehicles Available | Male | Female |
| No Vehicle | 743 (2.2%) | 1,279 (4.0%) |
| 1 Vehicle | 7,499 (22.2%) | 9,043 (28.1%) |
| 2 Vehicles | 13,334 (39.5%) | 11,803 (36.6%) |
| 3 Vehicles | 8,469 (25.1%) | 6,776 (21.0%) |
| 4 Vehicles | 2,451 (7.3%) | 2,040 (6.3%) |
| 5 or more Vehicles | 1,268 (3.8%) | 1,289 (4.0%) |
| Total | 33,764 (100.0%) | 32,230 (100.0%) |
Commute Time in Hampton
The most frequently occuring commute durations in Hampton are 15 to 19 minutes (13,264 commuters, 21.2%), 10 to 14 minutes (11,932 commuters, 19.1%), and 20 to 24 minutes (9,559 commuters, 15.3%).
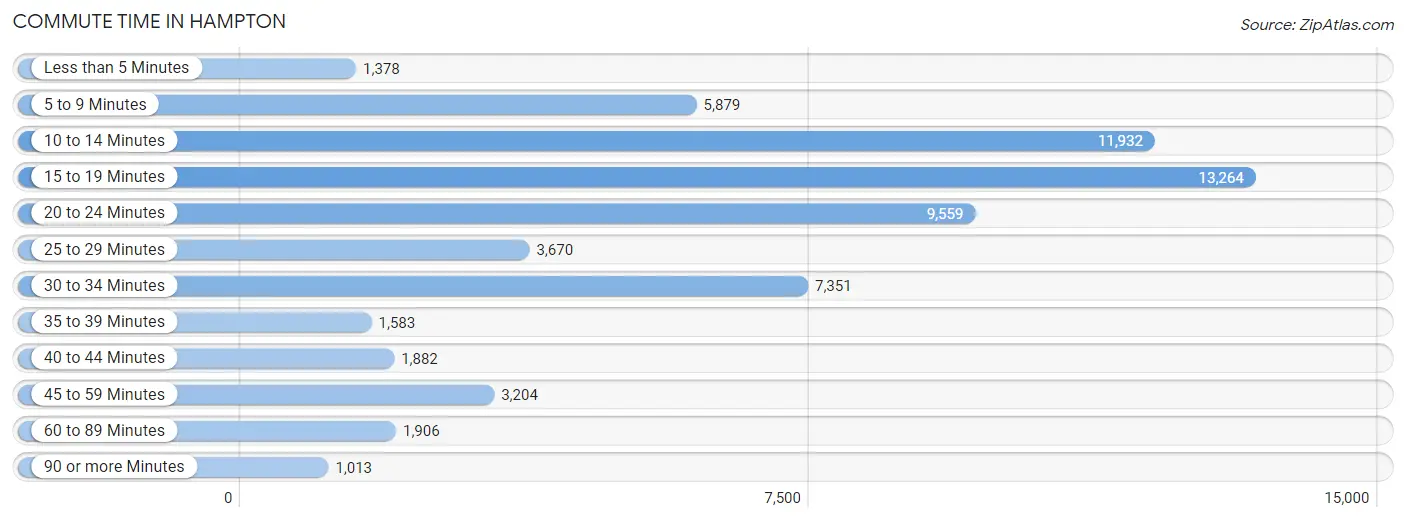
| Commute Time | # Commuters | % Commuters |
| Less than 5 Minutes | 1,378 | 2.2% |
| 5 to 9 Minutes | 5,879 | 9.4% |
| 10 to 14 Minutes | 11,932 | 19.1% |
| 15 to 19 Minutes | 13,264 | 21.2% |
| 20 to 24 Minutes | 9,559 | 15.3% |
| 25 to 29 Minutes | 3,670 | 5.9% |
| 30 to 34 Minutes | 7,351 | 11.7% |
| 35 to 39 Minutes | 1,583 | 2.5% |
| 40 to 44 Minutes | 1,882 | 3.0% |
| 45 to 59 Minutes | 3,204 | 5.1% |
| 60 to 89 Minutes | 1,906 | 3.0% |
| 90 or more Minutes | 1,013 | 1.6% |
Commute Time by Sex in Hampton
The most common commute times in Hampton are 15 to 19 minutes (8,188 commuters, 25.1%) for males and 10 to 14 minutes (7,027 commuters, 23.4%) for females.
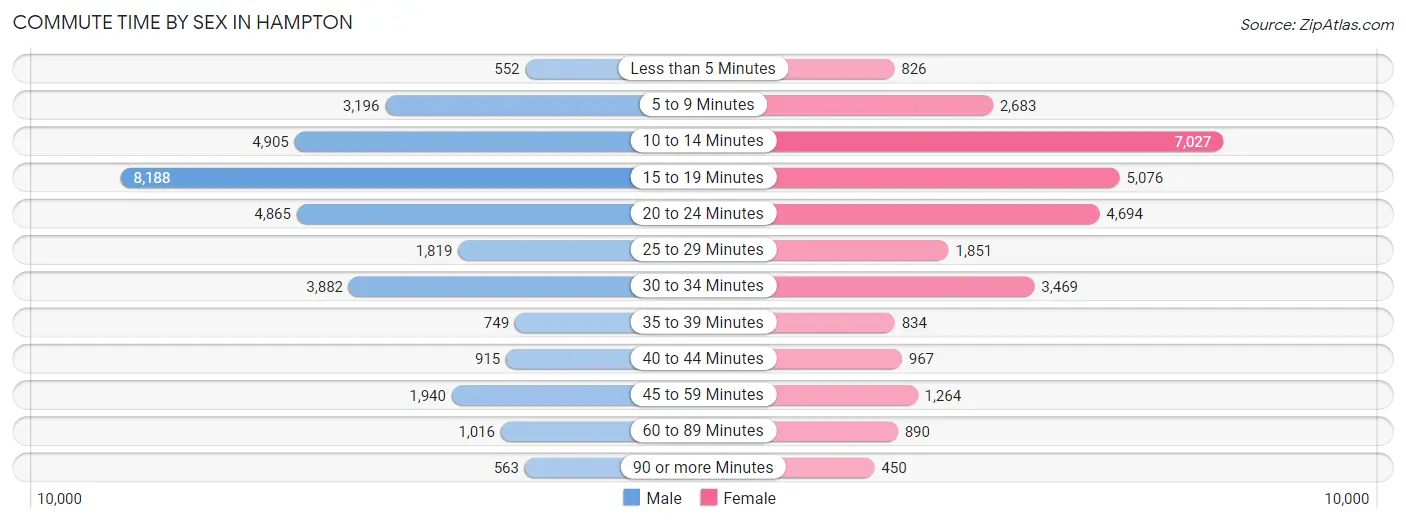
| Commute Time | Male | Female |
| Less than 5 Minutes | 552 (1.7%) | 826 (2.8%) |
| 5 to 9 Minutes | 3,196 (9.8%) | 2,683 (8.9%) |
| 10 to 14 Minutes | 4,905 (15.0%) | 7,027 (23.4%) |
| 15 to 19 Minutes | 8,188 (25.1%) | 5,076 (16.9%) |
| 20 to 24 Minutes | 4,865 (14.9%) | 4,694 (15.6%) |
| 25 to 29 Minutes | 1,819 (5.6%) | 1,851 (6.2%) |
| 30 to 34 Minutes | 3,882 (11.9%) | 3,469 (11.6%) |
| 35 to 39 Minutes | 749 (2.3%) | 834 (2.8%) |
| 40 to 44 Minutes | 915 (2.8%) | 967 (3.2%) |
| 45 to 59 Minutes | 1,940 (5.9%) | 1,264 (4.2%) |
| 60 to 89 Minutes | 1,016 (3.1%) | 890 (3.0%) |
| 90 or more Minutes | 563 (1.7%) | 450 (1.5%) |
Time of Departure to Work by Sex in Hampton
The most frequent times of departure to work in Hampton are 7:00 AM to 7:29 AM (3,991, 12.2%) for males and 7:30 AM to 7:59 AM (4,909, 16.4%) for females.
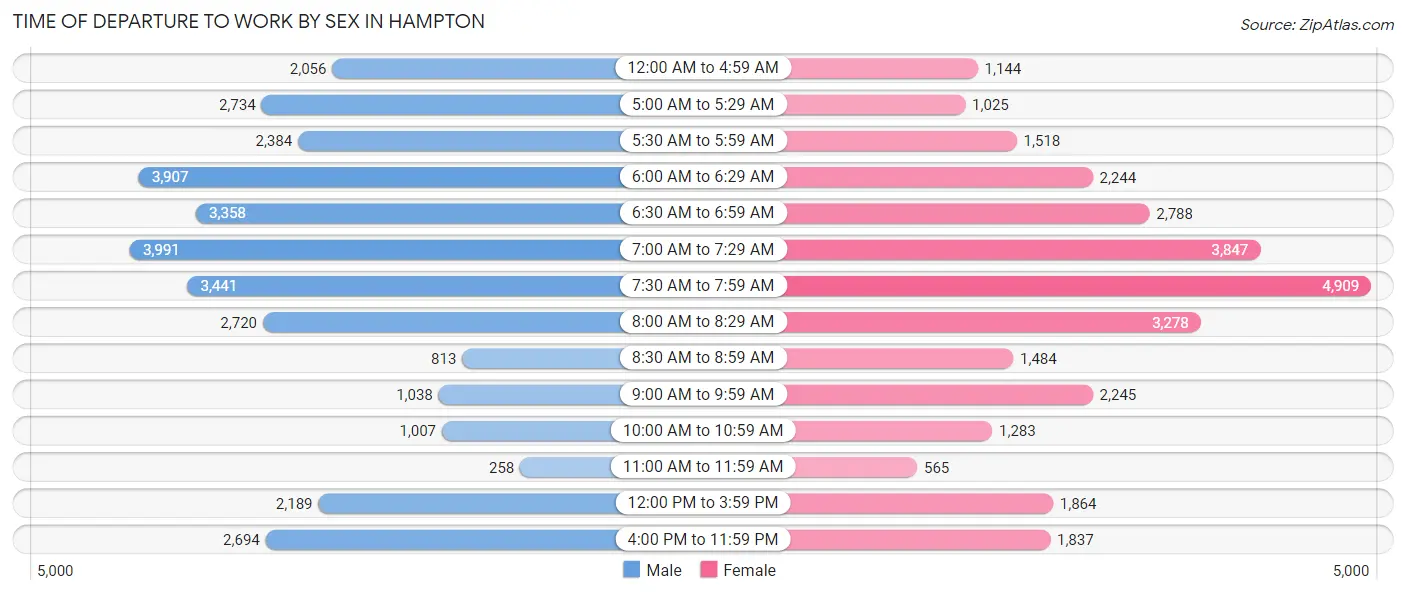
| Time of Departure | Male | Female |
| 12:00 AM to 4:59 AM | 2,056 (6.3%) | 1,144 (3.8%) |
| 5:00 AM to 5:29 AM | 2,734 (8.4%) | 1,025 (3.4%) |
| 5:30 AM to 5:59 AM | 2,384 (7.3%) | 1,518 (5.1%) |
| 6:00 AM to 6:29 AM | 3,907 (12.0%) | 2,244 (7.5%) |
| 6:30 AM to 6:59 AM | 3,358 (10.3%) | 2,788 (9.3%) |
| 7:00 AM to 7:29 AM | 3,991 (12.2%) | 3,847 (12.8%) |
| 7:30 AM to 7:59 AM | 3,441 (10.6%) | 4,909 (16.4%) |
| 8:00 AM to 8:29 AM | 2,720 (8.4%) | 3,278 (10.9%) |
| 8:30 AM to 8:59 AM | 813 (2.5%) | 1,484 (4.9%) |
| 9:00 AM to 9:59 AM | 1,038 (3.2%) | 2,245 (7.5%) |
| 10:00 AM to 10:59 AM | 1,007 (3.1%) | 1,283 (4.3%) |
| 11:00 AM to 11:59 AM | 258 (0.8%) | 565 (1.9%) |
| 12:00 PM to 3:59 PM | 2,189 (6.7%) | 1,864 (6.2%) |
| 4:00 PM to 11:59 PM | 2,694 (8.3%) | 1,837 (6.1%) |
| Total | 32,590 (100.0%) | 30,031 (100.0%) |
Housing Occupancy in Hampton
Occupancy by Ownership in Hampton
Of the total 57,470 dwellings in Hampton, owner-occupied units account for 31,942 (55.6%), while renter-occupied units make up 25,528 (44.4%).
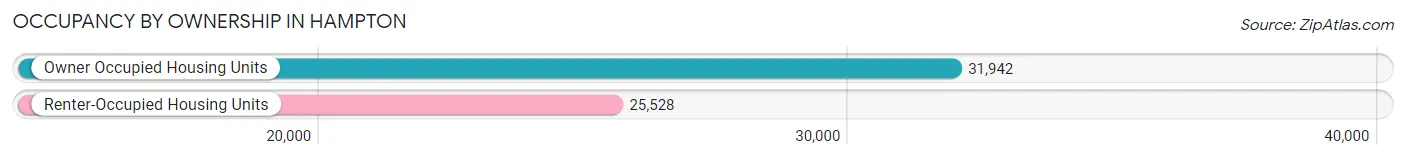
| Occupancy | # Housing Units | % Housing Units |
| Owner Occupied Housing Units | 31,942 | 55.6% |
| Renter-Occupied Housing Units | 25,528 | 44.4% |
| Total Occupied Housing Units | 57,470 | 100.0% |
Occupancy by Household Size in Hampton
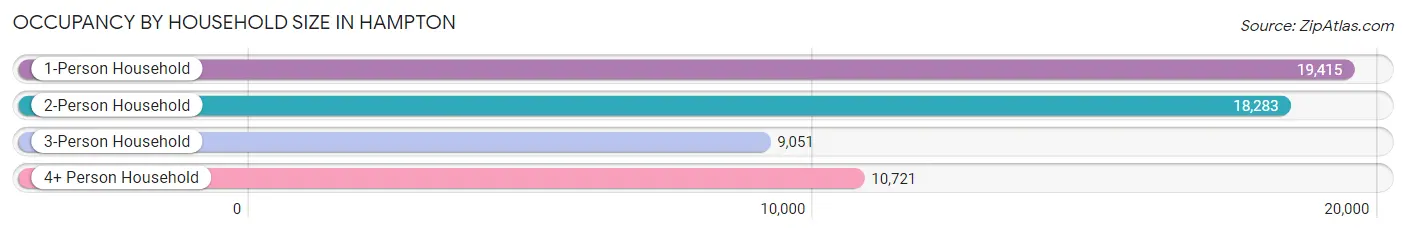
| Household Size | # Housing Units | % Housing Units |
| 1-Person Household | 19,415 | 33.8% |
| 2-Person Household | 18,283 | 31.8% |
| 3-Person Household | 9,051 | 15.8% |
| 4+ Person Household | 10,721 | 18.6% |
| Total Housing Units | 57,470 | 100.0% |
Occupancy by Ownership by Household Size in Hampton
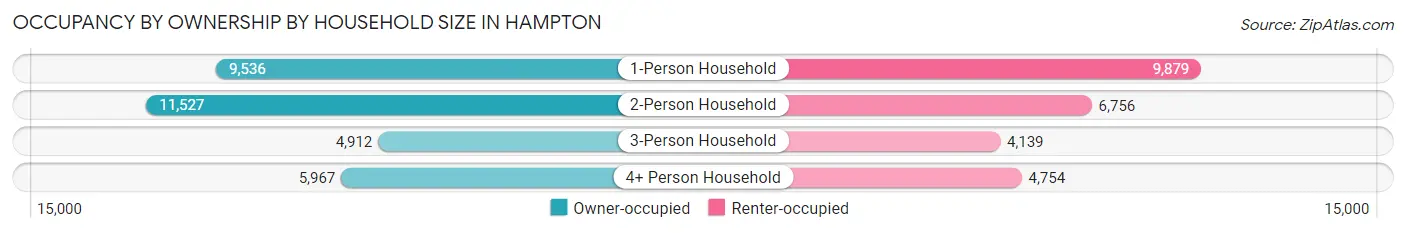
| Household Size | Owner-occupied | Renter-occupied |
| 1-Person Household | 9,536 (49.1%) | 9,879 (50.9%) |
| 2-Person Household | 11,527 (63.0%) | 6,756 (36.9%) |
| 3-Person Household | 4,912 (54.3%) | 4,139 (45.7%) |
| 4+ Person Household | 5,967 (55.7%) | 4,754 (44.3%) |
| Total Housing Units | 31,942 (55.6%) | 25,528 (44.4%) |
Occupancy by Educational Attainment in Hampton
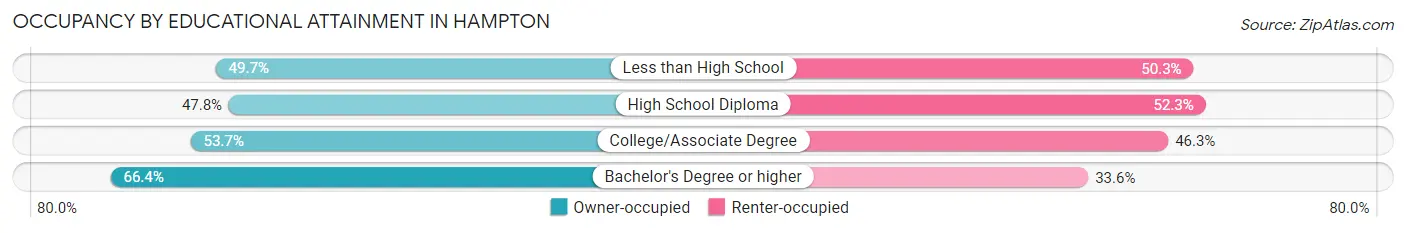
| Household Size | Owner-occupied | Renter-occupied |
| Less than High School | 1,702 (49.7%) | 1,723 (50.3%) |
| High School Diploma | 7,143 (47.7%) | 7,816 (52.2%) |
| College/Associate Degree | 12,027 (53.7%) | 10,378 (46.3%) |
| Bachelor's Degree or higher | 11,070 (66.4%) | 5,611 (33.6%) |
Occupancy by Age of Householder in Hampton
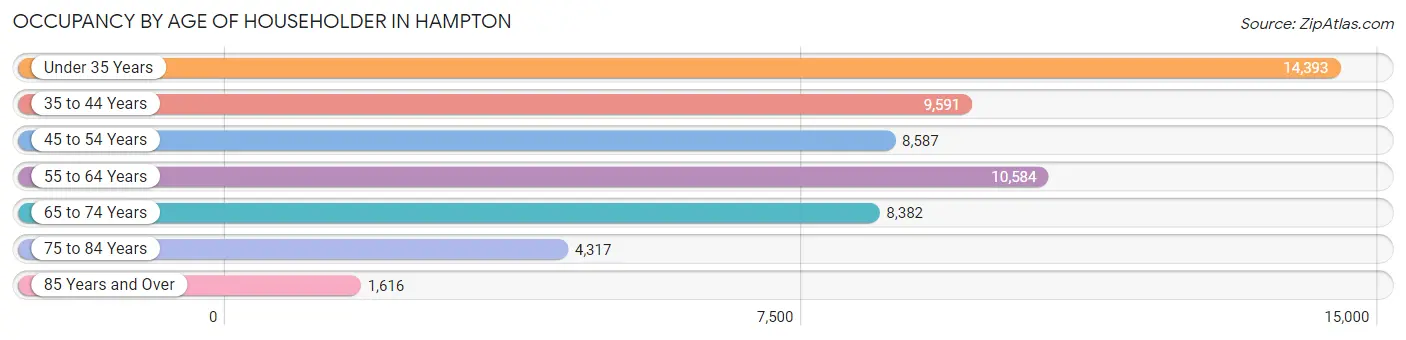
| Age Bracket | # Households | % Households |
| Under 35 Years | 14,393 | 25.0% |
| 35 to 44 Years | 9,591 | 16.7% |
| 45 to 54 Years | 8,587 | 14.9% |
| 55 to 64 Years | 10,584 | 18.4% |
| 65 to 74 Years | 8,382 | 14.6% |
| 75 to 84 Years | 4,317 | 7.5% |
| 85 Years and Over | 1,616 | 2.8% |
| Total | 57,470 | 100.0% |
Housing Finances in Hampton
Median Income by Occupancy in Hampton
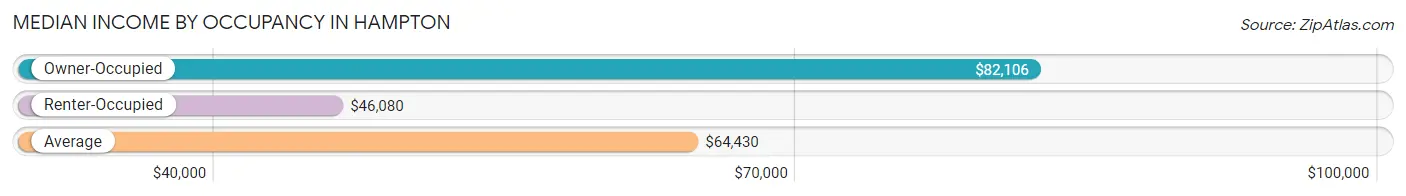
| Occupancy Type | # Households | Median Income |
| Owner-Occupied | 31,942 (55.6%) | $82,106 |
| Renter-Occupied | 25,528 (44.4%) | $46,080 |
| Average | 57,470 (100.0%) | $64,430 |
Occupancy by Householder Income Bracket in Hampton
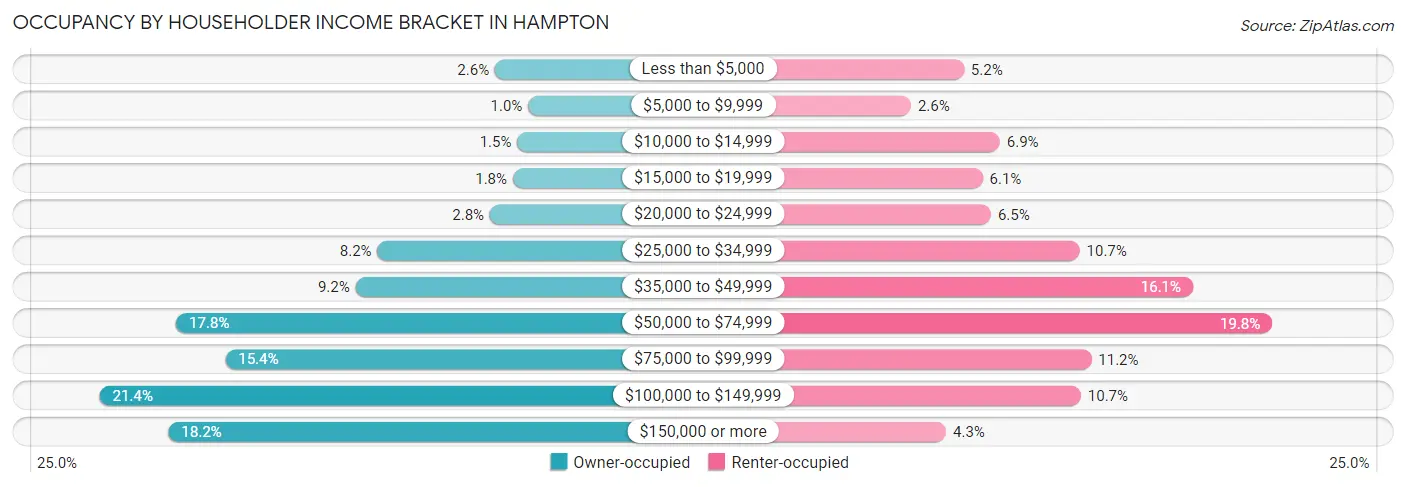
| Income Bracket | Owner-occupied | Renter-occupied |
| Less than $5,000 | 829 (2.6%) | 1,317 (5.2%) |
| $5,000 to $9,999 | 327 (1.0%) | 674 (2.6%) |
| $10,000 to $14,999 | 493 (1.5%) | 1,755 (6.9%) |
| $15,000 to $19,999 | 560 (1.8%) | 1,544 (6.0%) |
| $20,000 to $24,999 | 906 (2.8%) | 1,646 (6.5%) |
| $25,000 to $34,999 | 2,618 (8.2%) | 2,725 (10.7%) |
| $35,000 to $49,999 | 2,952 (9.2%) | 4,101 (16.1%) |
| $50,000 to $74,999 | 5,682 (17.8%) | 5,061 (19.8%) |
| $75,000 to $99,999 | 4,932 (15.4%) | 2,866 (11.2%) |
| $100,000 to $149,999 | 6,845 (21.4%) | 2,738 (10.7%) |
| $150,000 or more | 5,798 (18.1%) | 1,101 (4.3%) |
| Total | 31,942 (100.0%) | 25,528 (100.0%) |
Monthly Housing Cost Tiers in Hampton
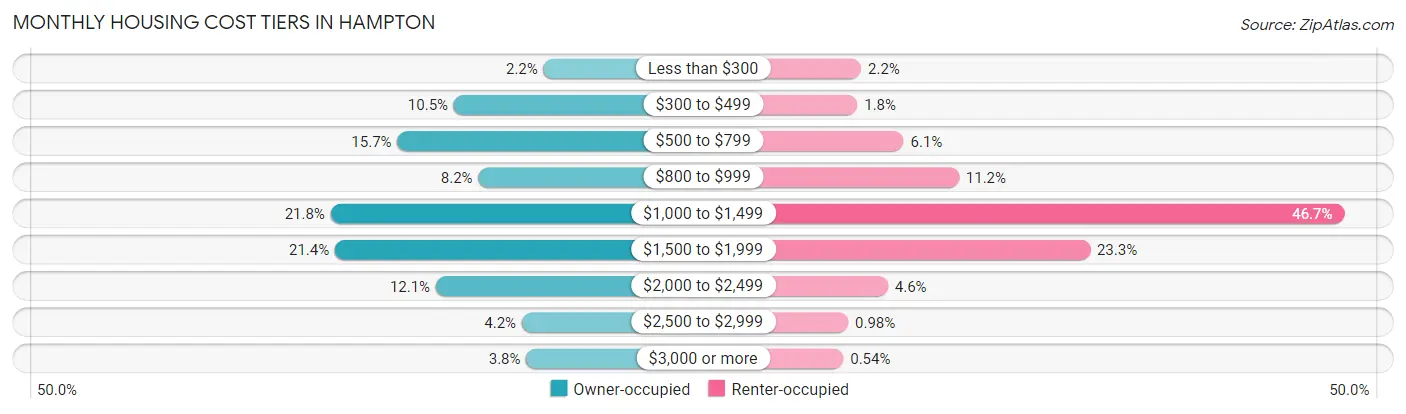
| Monthly Cost | Owner-occupied | Renter-occupied |
| Less than $300 | 709 (2.2%) | 557 (2.2%) |
| $300 to $499 | 3,349 (10.5%) | 466 (1.8%) |
| $500 to $799 | 5,007 (15.7%) | 1,554 (6.1%) |
| $800 to $999 | 2,625 (8.2%) | 2,853 (11.2%) |
| $1,000 to $1,499 | 6,970 (21.8%) | 11,911 (46.7%) |
| $1,500 to $1,999 | 6,843 (21.4%) | 5,935 (23.3%) |
| $2,000 to $2,499 | 3,876 (12.1%) | 1,185 (4.6%) |
| $2,500 to $2,999 | 1,347 (4.2%) | 251 (1.0%) |
| $3,000 or more | 1,216 (3.8%) | 139 (0.5%) |
| Total | 31,942 (100.0%) | 25,528 (100.0%) |
Physical Housing Characteristics in Hampton
Housing Structures in Hampton
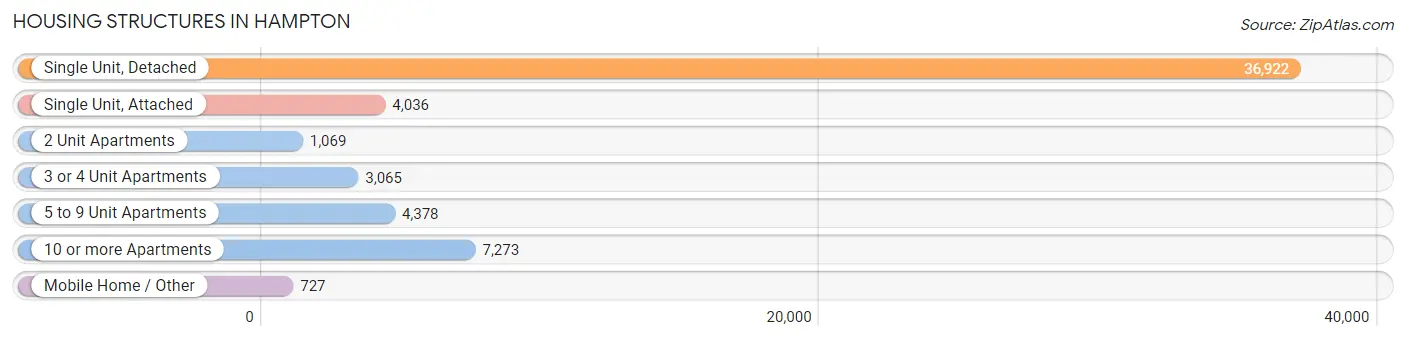
| Structure Type | # Housing Units | % Housing Units |
| Single Unit, Detached | 36,922 | 64.2% |
| Single Unit, Attached | 4,036 | 7.0% |
| 2 Unit Apartments | 1,069 | 1.9% |
| 3 or 4 Unit Apartments | 3,065 | 5.3% |
| 5 to 9 Unit Apartments | 4,378 | 7.6% |
| 10 or more Apartments | 7,273 | 12.7% |
| Mobile Home / Other | 727 | 1.3% |
| Total | 57,470 | 100.0% |
Housing Structures by Occupancy in Hampton
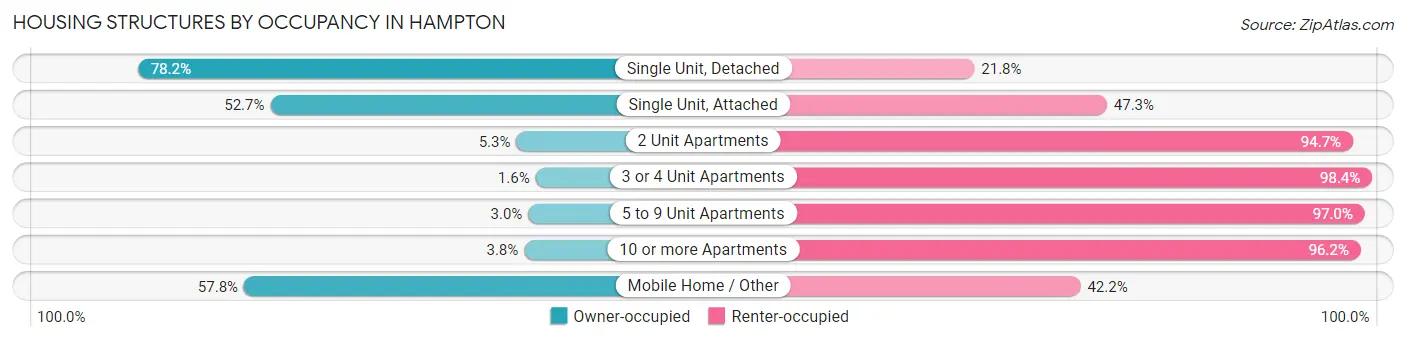
| Structure Type | Owner-occupied | Renter-occupied |
| Single Unit, Detached | 28,877 (78.2%) | 8,045 (21.8%) |
| Single Unit, Attached | 2,127 (52.7%) | 1,909 (47.3%) |
| 2 Unit Apartments | 57 (5.3%) | 1,012 (94.7%) |
| 3 or 4 Unit Apartments | 50 (1.6%) | 3,015 (98.4%) |
| 5 to 9 Unit Apartments | 133 (3.0%) | 4,245 (97.0%) |
| 10 or more Apartments | 278 (3.8%) | 6,995 (96.2%) |
| Mobile Home / Other | 420 (57.8%) | 307 (42.2%) |
| Total | 31,942 (55.6%) | 25,528 (44.4%) |
Housing Structures by Number of Rooms in Hampton
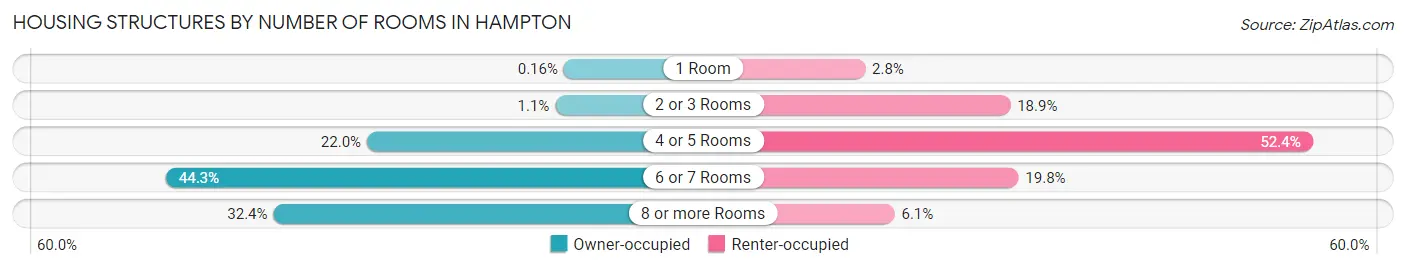
| Number of Rooms | Owner-occupied | Renter-occupied |
| 1 Room | 52 (0.2%) | 713 (2.8%) |
| 2 or 3 Rooms | 354 (1.1%) | 4,825 (18.9%) |
| 4 or 5 Rooms | 7,032 (22.0%) | 13,386 (52.4%) |
| 6 or 7 Rooms | 14,158 (44.3%) | 5,057 (19.8%) |
| 8 or more Rooms | 10,346 (32.4%) | 1,547 (6.1%) |
| Total | 31,942 (100.0%) | 25,528 (100.0%) |
Housing Structure by Heating Type in Hampton
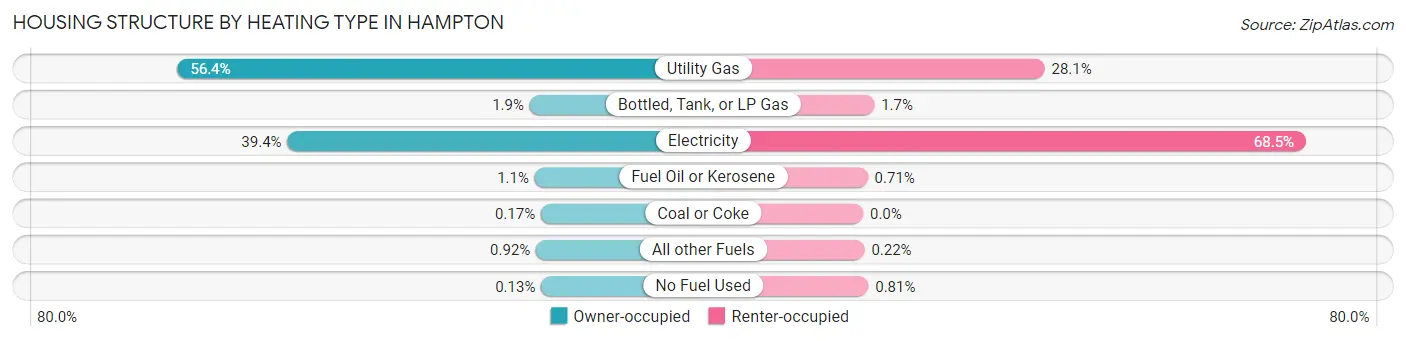
| Heating Type | Owner-occupied | Renter-occupied |
| Utility Gas | 18,008 (56.4%) | 7,164 (28.1%) |
| Bottled, Tank, or LP Gas | 606 (1.9%) | 441 (1.7%) |
| Electricity | 12,576 (39.4%) | 17,477 (68.5%) |
| Fuel Oil or Kerosene | 361 (1.1%) | 182 (0.7%) |
| Coal or Coke | 53 (0.2%) | 0 (0.0%) |
| All other Fuels | 295 (0.9%) | 56 (0.2%) |
| No Fuel Used | 43 (0.1%) | 208 (0.8%) |
| Total | 31,942 (100.0%) | 25,528 (100.0%) |
Household Vehicle Usage in Hampton
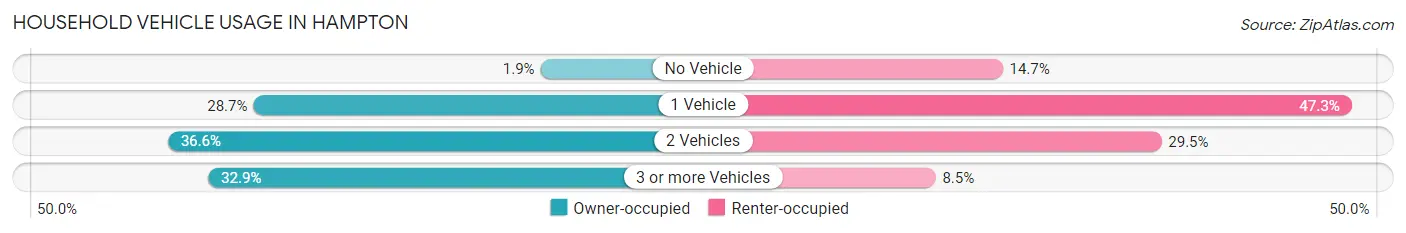
| Vehicles per Household | Owner-occupied | Renter-occupied |
| No Vehicle | 592 (1.8%) | 3,754 (14.7%) |
| 1 Vehicle | 9,152 (28.6%) | 12,075 (47.3%) |
| 2 Vehicles | 11,702 (36.6%) | 7,542 (29.5%) |
| 3 or more Vehicles | 10,496 (32.9%) | 2,157 (8.5%) |
| Total | 31,942 (100.0%) | 25,528 (100.0%) |
Real Estate & Mortgages in Hampton
Real Estate and Mortgage Overview in Hampton
| Characteristic | Without Mortgage | With Mortgage |
| Housing Units | 9,593 | 22,349 |
| Median Property Value | $206,400 | $224,300 |
| Median Household Income | $64,153 | $4,561 |
| Monthly Housing Costs | $559 | $1,205 |
| Real Estate Taxes | $2,098 | $953 |
Property Value by Mortgage Status in Hampton
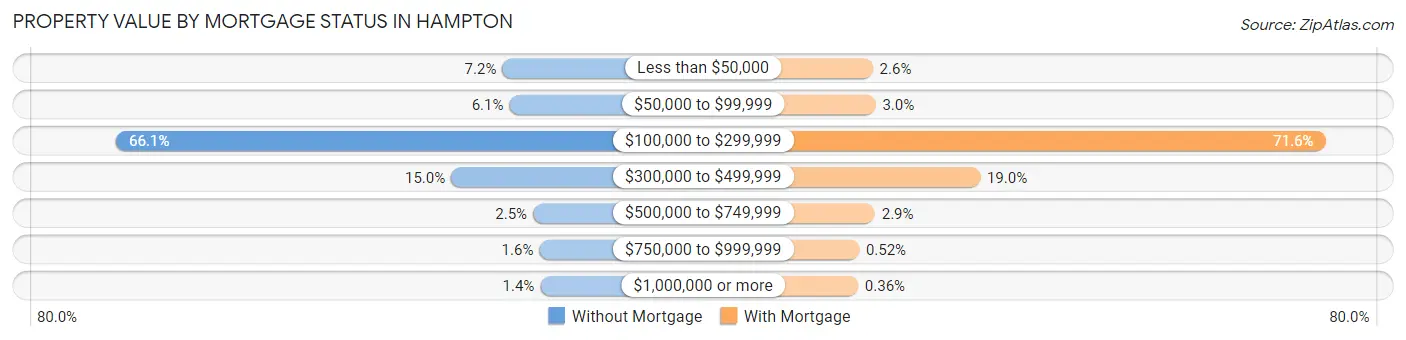
| Property Value | Without Mortgage | With Mortgage |
| Less than $50,000 | 693 (7.2%) | 583 (2.6%) |
| $50,000 to $99,999 | 589 (6.1%) | 680 (3.0%) |
| $100,000 to $299,999 | 6,337 (66.1%) | 15,999 (71.6%) |
| $300,000 to $499,999 | 1,441 (15.0%) | 4,237 (19.0%) |
| $500,000 to $749,999 | 244 (2.5%) | 654 (2.9%) |
| $750,000 to $999,999 | 152 (1.6%) | 116 (0.5%) |
| $1,000,000 or more | 137 (1.4%) | 80 (0.4%) |
| Total | 9,593 (100.0%) | 22,349 (100.0%) |
Household Income by Mortgage Status in Hampton
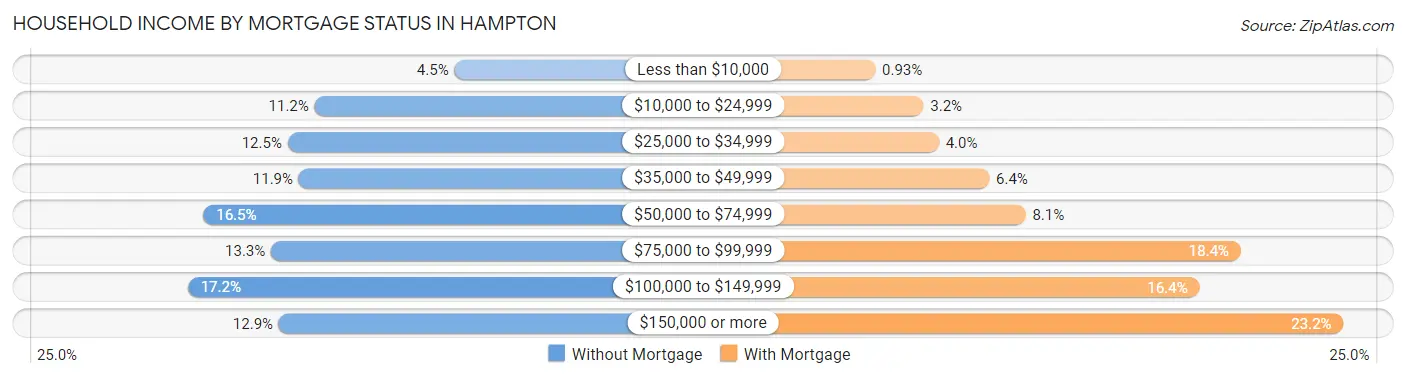
| Household Income | Without Mortgage | With Mortgage |
| Less than $10,000 | 435 (4.5%) | 207 (0.9%) |
| $10,000 to $24,999 | 1,073 (11.2%) | 721 (3.2%) |
| $25,000 to $34,999 | 1,196 (12.5%) | 886 (4.0%) |
| $35,000 to $49,999 | 1,145 (11.9%) | 1,422 (6.4%) |
| $50,000 to $74,999 | 1,582 (16.5%) | 1,807 (8.1%) |
| $75,000 to $99,999 | 1,272 (13.3%) | 4,100 (18.3%) |
| $100,000 to $149,999 | 1,653 (17.2%) | 3,660 (16.4%) |
| $150,000 or more | 1,237 (12.9%) | 5,192 (23.2%) |
| Total | 9,593 (100.0%) | 22,349 (100.0%) |
Property Value to Household Income Ratio in Hampton
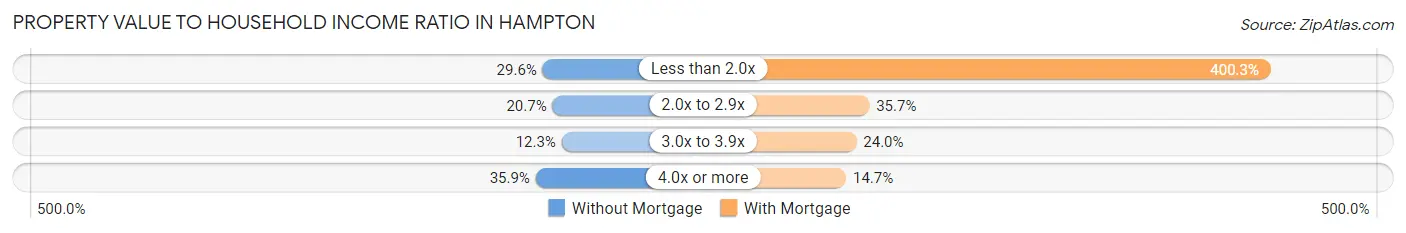
| Value-to-Income Ratio | Without Mortgage | With Mortgage |
| Less than 2.0x | 2,839 (29.6%) | 89,471 (400.3%) |
| 2.0x to 2.9x | 1,982 (20.7%) | 7,979 (35.7%) |
| 3.0x to 3.9x | 1,178 (12.3%) | 5,371 (24.0%) |
| 4.0x or more | 3,444 (35.9%) | 3,281 (14.7%) |
| Total | 9,593 (100.0%) | 22,349 (100.0%) |
Real Estate Taxes by Mortgage Status in Hampton
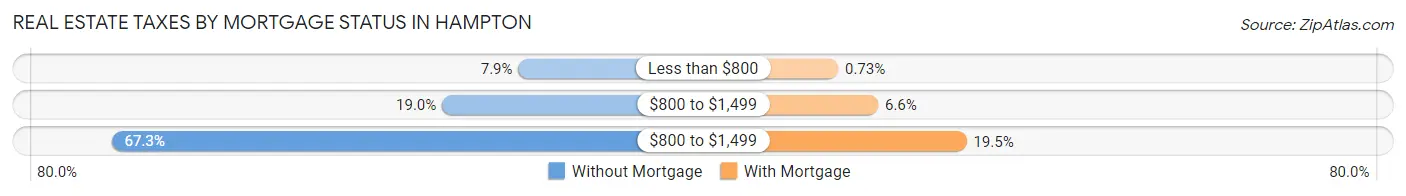
| Property Taxes | Without Mortgage | With Mortgage |
| Less than $800 | 753 (7.9%) | 164 (0.7%) |
| $800 to $1,499 | 1,822 (19.0%) | 1,468 (6.6%) |
| $800 to $1,499 | 6,455 (67.3%) | 4,358 (19.5%) |
| Total | 9,593 (100.0%) | 22,349 (100.0%) |
Health & Disability in Hampton
Health Insurance Coverage by Age in Hampton
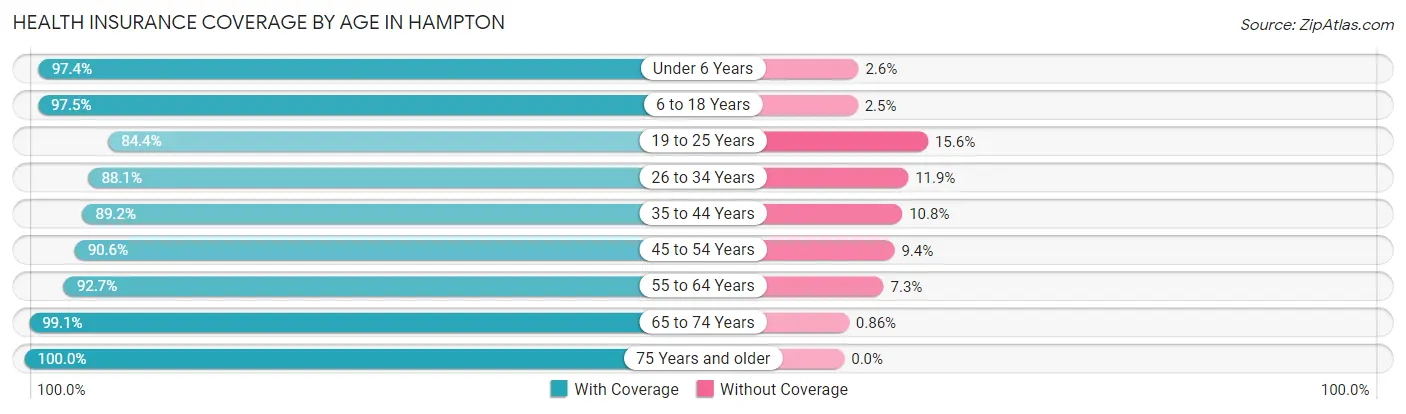
| Age Bracket | With Coverage | Without Coverage |
| Under 6 Years | 9,396 (97.4%) | 255 (2.6%) |
| 6 to 18 Years | 20,999 (97.5%) | 538 (2.5%) |
| 19 to 25 Years | 10,624 (84.4%) | 1,965 (15.6%) |
| 26 to 34 Years | 15,010 (88.1%) | 2,031 (11.9%) |
| 35 to 44 Years | 13,942 (89.2%) | 1,689 (10.8%) |
| 45 to 54 Years | 12,534 (90.6%) | 1,295 (9.4%) |
| 55 to 64 Years | 17,059 (92.7%) | 1,350 (7.3%) |
| 65 to 74 Years | 12,655 (99.1%) | 110 (0.9%) |
| 75 Years and older | 8,623 (100.0%) | 0 (0.0%) |
| Total | 120,842 (92.9%) | 9,233 (7.1%) |
Health Insurance Coverage by Citizenship Status in Hampton
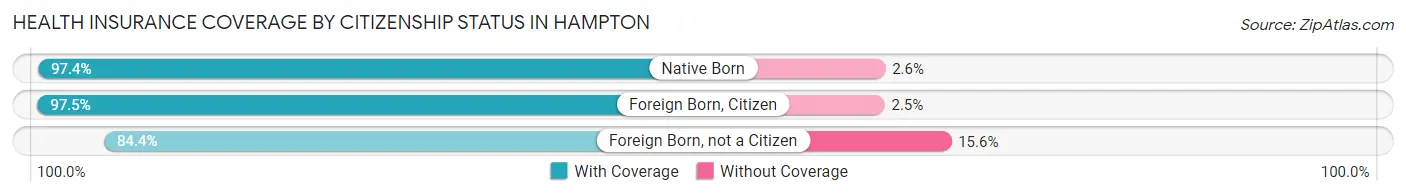
| Citizenship Status | With Coverage | Without Coverage |
| Native Born | 9,396 (97.4%) | 255 (2.6%) |
| Foreign Born, Citizen | 20,999 (97.5%) | 538 (2.5%) |
| Foreign Born, not a Citizen | 10,624 (84.4%) | 1,965 (15.6%) |
Health Insurance Coverage by Household Income in Hampton
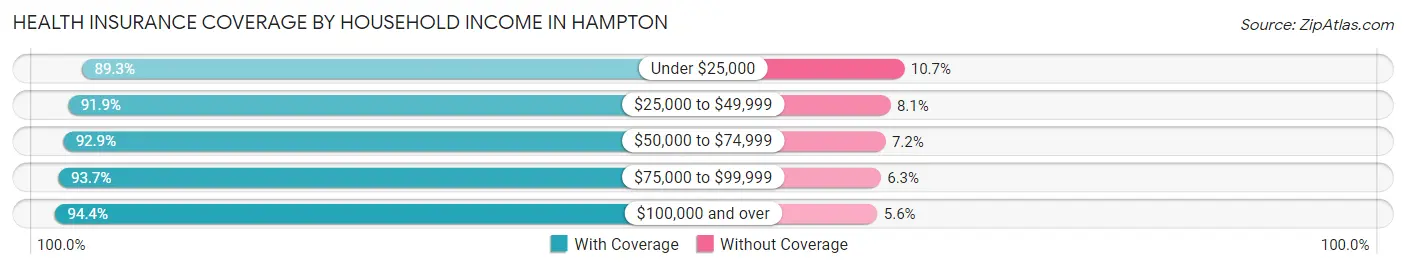
| Household Income | With Coverage | Without Coverage |
| Under $25,000 | 15,833 (89.3%) | 1,894 (10.7%) |
| $25,000 to $49,999 | 20,952 (91.9%) | 1,841 (8.1%) |
| $50,000 to $74,999 | 20,112 (92.8%) | 1,548 (7.1%) |
| $75,000 to $99,999 | 16,784 (93.7%) | 1,122 (6.3%) |
| $100,000 and over | 44,877 (94.4%) | 2,677 (5.6%) |
Public vs Private Health Insurance Coverage by Age in Hampton
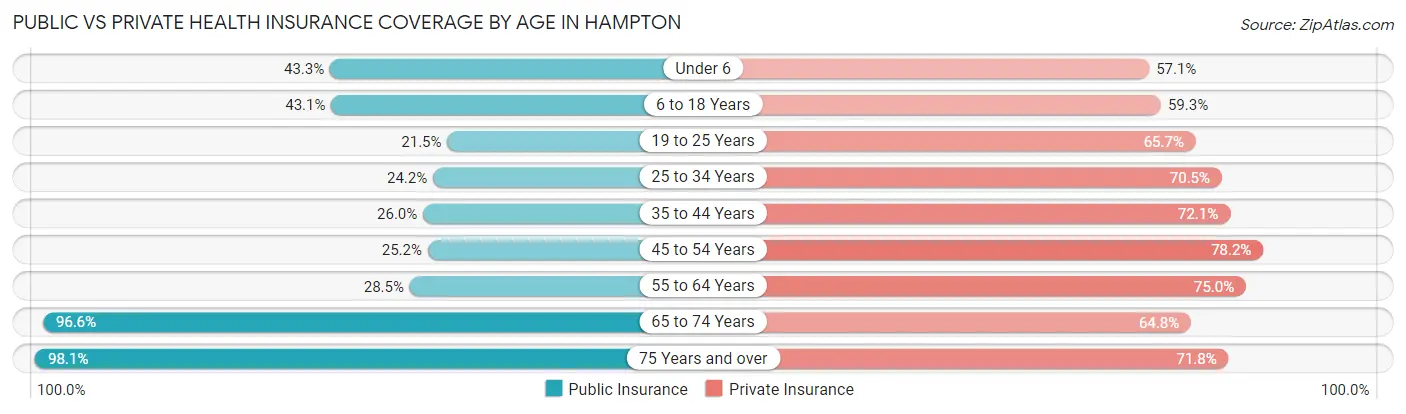
| Age Bracket | Public Insurance | Private Insurance |
| Under 6 | 4,180 (43.3%) | 5,507 (57.1%) |
| 6 to 18 Years | 9,277 (43.1%) | 12,760 (59.3%) |
| 19 to 25 Years | 2,710 (21.5%) | 8,270 (65.7%) |
| 25 to 34 Years | 4,123 (24.2%) | 12,021 (70.5%) |
| 35 to 44 Years | 4,068 (26.0%) | 11,263 (72.1%) |
| 45 to 54 Years | 3,479 (25.2%) | 10,816 (78.2%) |
| 55 to 64 Years | 5,247 (28.5%) | 13,812 (75.0%) |
| 65 to 74 Years | 12,332 (96.6%) | 8,276 (64.8%) |
| 75 Years and over | 8,455 (98.1%) | 6,190 (71.8%) |
| Total | 53,871 (41.4%) | 88,915 (68.4%) |
Disability Status by Sex by Age in Hampton
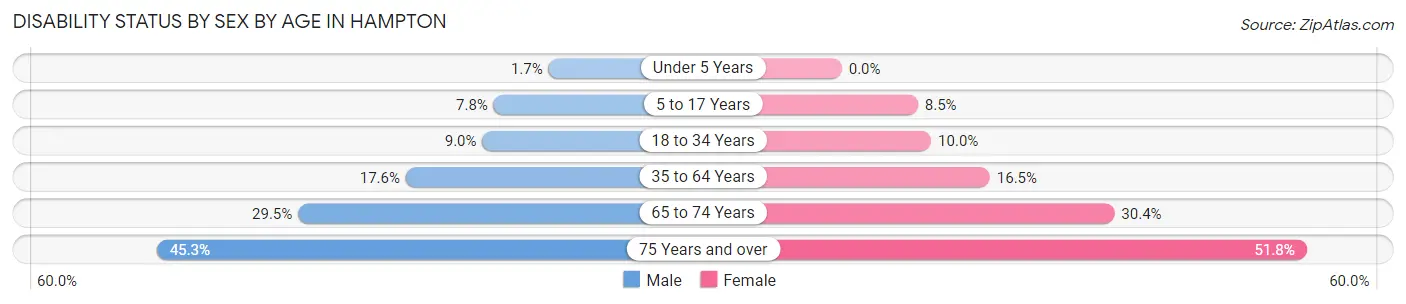
| Age Bracket | Male | Female |
| Under 5 Years | 72 (1.7%) | 0 (0.0%) |
| 5 to 17 Years | 837 (7.8%) | 861 (8.5%) |
| 18 to 34 Years | 1,325 (9.0%) | 1,675 (10.0%) |
| 35 to 64 Years | 3,853 (17.5%) | 4,273 (16.5%) |
| 65 to 74 Years | 1,673 (29.5%) | 2,156 (30.4%) |
| 75 Years and over | 1,481 (45.3%) | 2,770 (51.8%) |
Disability Class by Sex by Age in Hampton
Disability Class: Hearing Difficulty
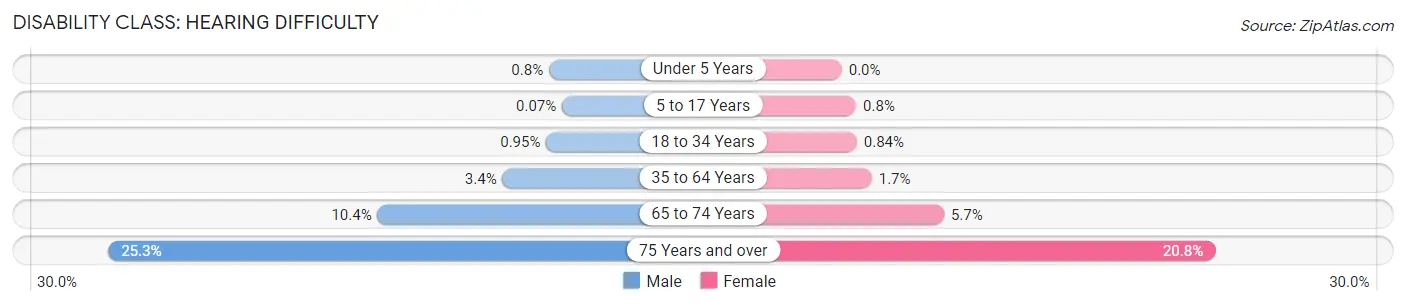
| Age Bracket | Male | Female |
| Under 5 Years | 35 (0.8%) | 0 (0.0%) |
| 5 to 17 Years | 8 (0.1%) | 81 (0.8%) |
| 18 to 34 Years | 140 (0.9%) | 142 (0.8%) |
| 35 to 64 Years | 745 (3.4%) | 434 (1.7%) |
| 65 to 74 Years | 586 (10.3%) | 404 (5.7%) |
| 75 Years and over | 829 (25.3%) | 1,112 (20.8%) |
Disability Class: Vision Difficulty
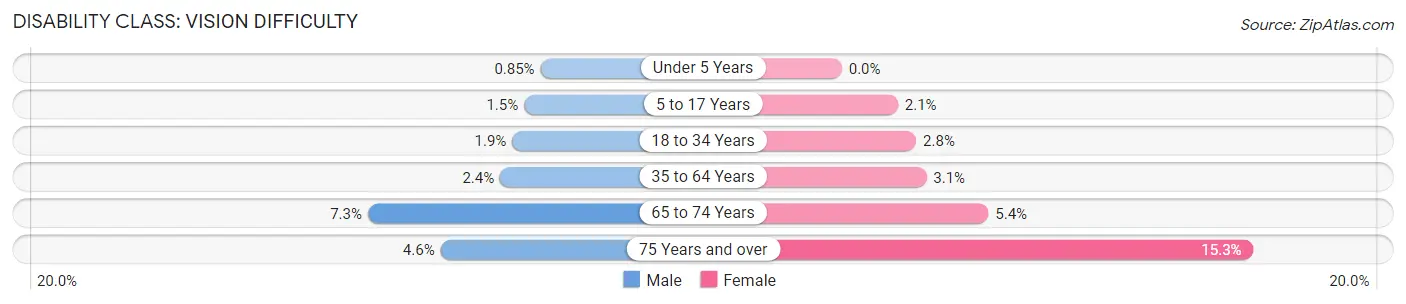
| Age Bracket | Male | Female |
| Under 5 Years | 37 (0.9%) | 0 (0.0%) |
| 5 to 17 Years | 157 (1.5%) | 212 (2.1%) |
| 18 to 34 Years | 279 (1.9%) | 465 (2.8%) |
| 35 to 64 Years | 517 (2.4%) | 813 (3.1%) |
| 65 to 74 Years | 411 (7.3%) | 386 (5.4%) |
| 75 Years and over | 149 (4.6%) | 818 (15.3%) |
Disability Class: Cognitive Difficulty
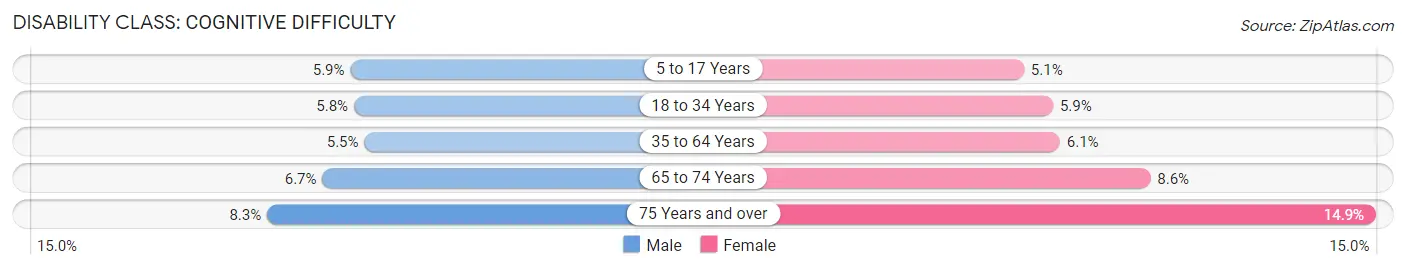
| Age Bracket | Male | Female |
| 5 to 17 Years | 640 (5.9%) | 516 (5.1%) |
| 18 to 34 Years | 857 (5.8%) | 990 (5.9%) |
| 35 to 64 Years | 1,216 (5.5%) | 1,573 (6.1%) |
| 65 to 74 Years | 380 (6.7%) | 610 (8.6%) |
| 75 Years and over | 270 (8.3%) | 796 (14.9%) |
Disability Class: Ambulatory Difficulty
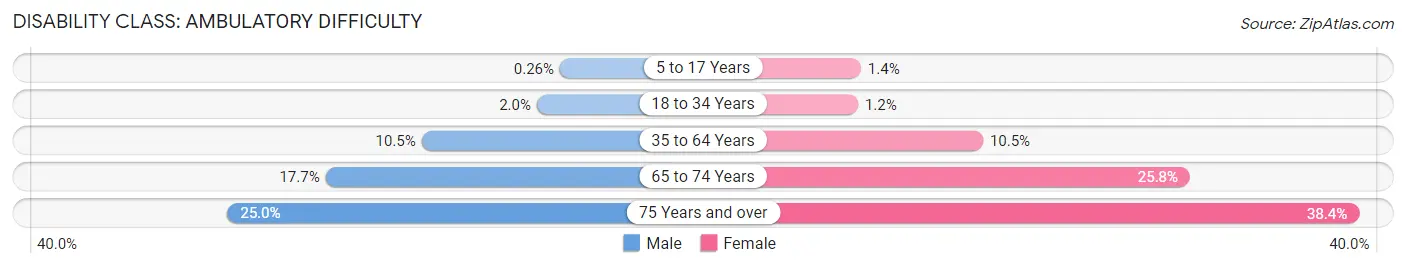
| Age Bracket | Male | Female |
| 5 to 17 Years | 28 (0.3%) | 144 (1.4%) |
| 18 to 34 Years | 289 (2.0%) | 202 (1.2%) |
| 35 to 64 Years | 2,312 (10.5%) | 2,717 (10.5%) |
| 65 to 74 Years | 1,000 (17.7%) | 1,835 (25.8%) |
| 75 Years and over | 816 (24.9%) | 2,055 (38.4%) |
Disability Class: Self-Care Difficulty
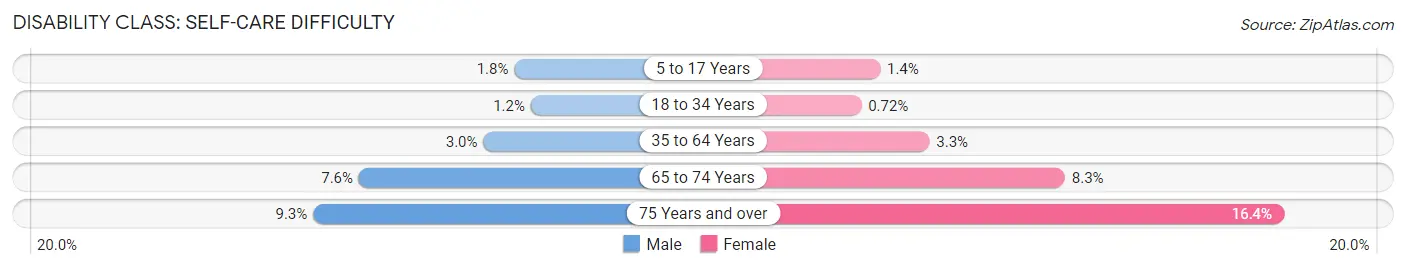
| Age Bracket | Male | Female |
| 5 to 17 Years | 196 (1.8%) | 144 (1.4%) |
| 18 to 34 Years | 178 (1.2%) | 121 (0.7%) |
| 35 to 64 Years | 651 (3.0%) | 843 (3.3%) |
| 65 to 74 Years | 430 (7.6%) | 588 (8.3%) |
| 75 Years and over | 304 (9.3%) | 878 (16.4%) |
Technology Access in Hampton
Computing Device Access in Hampton
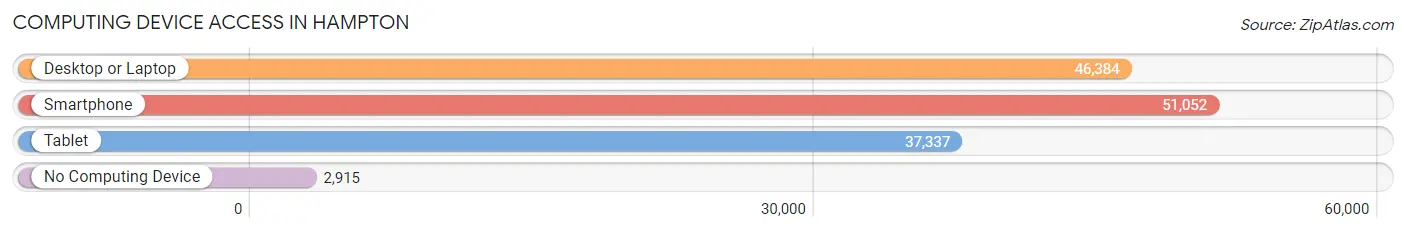
| Device Type | # Households | % Households |
| Desktop or Laptop | 46,384 | 80.7% |
| Smartphone | 51,052 | 88.8% |
| Tablet | 37,337 | 65.0% |
| No Computing Device | 2,915 | 5.1% |
| Total | 57,470 | 100.0% |
Internet Access in Hampton
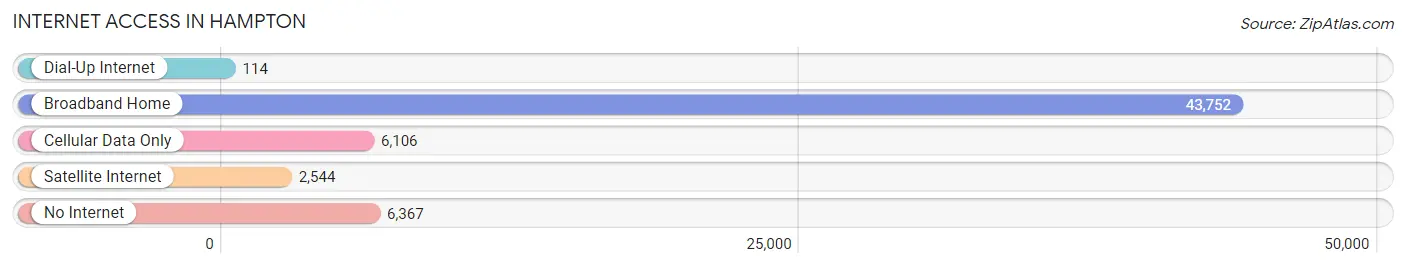
| Internet Type | # Households | % Households |
| Dial-Up Internet | 114 | 0.2% |
| Broadband Home | 43,752 | 76.1% |
| Cellular Data Only | 6,106 | 10.6% |
| Satellite Internet | 2,544 | 4.4% |
| No Internet | 6,367 | 11.1% |
| Total | 57,470 | 100.0% |
Hampton Summary
Hampton, Virginia is a city located in the Hampton Roads region of southeastern Virginia. It is the seventh-largest city in the state and the largest city in the Hampton Roads metropolitan area. The city is situated on the Hampton Roads harbor, which is the largest natural harbor on the East Coast of the United States. Hampton is home to a variety of industries, including military, aerospace, and shipbuilding.
History
Hampton was founded in 1610 by English settlers, making it one of the oldest cities in the United States. The city was named after Henry Wriothesley, the 3rd Earl of Southampton, who was an important figure in the colonization of Virginia. The city was initially a port town, and it was the site of the first English settlement in the New World.
In the 17th century, Hampton was a major port for the slave trade. The city was also a major center for the Confederacy during the Civil War. After the war, the city was rebuilt and became a major center for shipbuilding and the military.
Geography
Hampton is located in the Hampton Roads region of southeastern Virginia. The city is situated on the Hampton Roads harbor, which is the largest natural harbor on the East Coast of the United States. The harbor is connected to the Chesapeake Bay by the Hampton Roads Bridge-Tunnel. The city is bordered by the cities of Newport News, Norfolk, and Virginia Beach.
The city has a total area of 37.3 square miles, of which 35.2 square miles is land and 2.1 square miles is water. The city is located at an elevation of 16 feet above sea level.
Economy
Hampton is home to a variety of industries, including military, aerospace, and shipbuilding. The city is home to several military installations, including Langley Air Force Base, Fort Monroe, and the Norfolk Naval Shipyard. The city is also home to several major aerospace companies, including Northrop Grumman and Boeing.
The city is also home to several major shipbuilding companies, including Newport News Shipbuilding and Drydock Company and BAE Systems. The city is also home to several major universities, including Hampton University, Old Dominion University, and Christopher Newport University.
Demographics
As of the 2010 census, the population of Hampton was 137,436. The city has a population density of 3,717 people per square mile. The racial makeup of the city is 57.3% African American, 33.2% White, 4.2% Hispanic or Latino, 2.3% Asian, and 0.7% Native American.
The median household income in the city is $45,845, and the median family income is $54,845. The per capita income in the city is $25,845. The city has a poverty rate of 17.3%.
Conclusion
Hampton, Virginia is a city located in the Hampton Roads region of southeastern Virginia. It is the seventh-largest city in the state and the largest city in the Hampton Roads metropolitan area. The city is situated on the Hampton Roads harbor, which is the largest natural harbor on the East Coast of the United States. Hampton is home to a variety of industries, including military, aerospace, and shipbuilding. The city has a population of 137,436, and the racial makeup of the city is 57.3% African American, 33.2% White, 4.2% Hispanic or Latino, 2.3% Asian, and 0.7% Native American. The median household income in the city is $45,845, and the median family income is $54,845. The city has a poverty rate of 17.3%.
Common Questions
What is Per Capita Income in Hampton?
Per Capita income in Hampton is $35,002.
What is the Median Family Income in Hampton?
Median Family Income in Hampton is $79,580.
What is the Median Household income in Hampton?
Median Household Income in Hampton is $64,430.
What is Income or Wage Gap in Hampton?
Income or Wage Gap in Hampton is 30.2%.
Women in Hampton earn 69.8 cents for every dollar earned by a man.
What is Family Income Deficit in Hampton?
Family Income Deficit in Hampton is $11,891.
Families that are below poverty line in Hampton earn $11,891 less on average than the poverty threshold level.
What is Inequality or Gini Index in Hampton?
Inequality or Gini Index in Hampton is 0.44.
What is the Total Population of Hampton?
Total Population of Hampton is 137,217.
What is the Total Male Population of Hampton?
Total Male Population of Hampton is 66,248.
What is the Total Female Population of Hampton?
Total Female Population of Hampton is 70,969.
What is the Ratio of Males per 100 Females in Hampton?
There are 93.35 Males per 100 Females in Hampton.
What is the Ratio of Females per 100 Males in Hampton?
There are 107.13 Females per 100 Males in Hampton.
What is the Median Population Age in Hampton?
Median Population Age in Hampton is 36.5 Years.
What is the Average Family Size in Hampton
Average Family Size in Hampton is 3.0 People.
What is the Average Household Size in Hampton
Average Household Size in Hampton is 2.3 People.
How Large is the Labor Force in Hampton?
There are 73,157 People in the Labor Forcein in Hampton.
What is the Percentage of People in the Labor Force in Hampton?
65.9% of People are in the Labor Force in Hampton.
What is the Unemployment Rate in Hampton?
Unemployment Rate in Hampton is 6.5%.