Portsmouth, VA Map & Demographics
Portsmouth Map
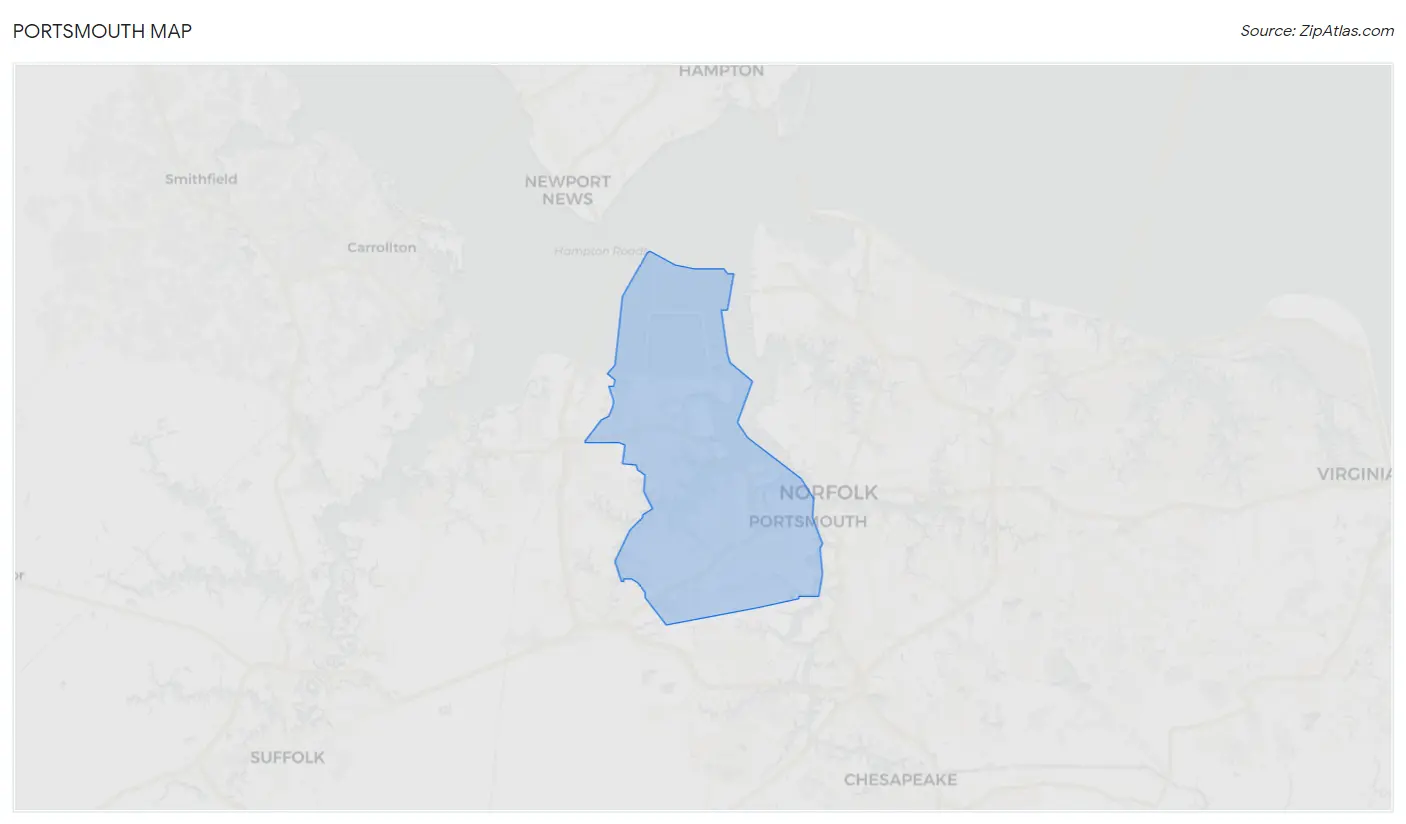
Portsmouth Overview
$31,457
PER CAPITA INCOME
$66,450
AVG FAMILY INCOME
$57,154
AVG HOUSEHOLD INCOME
27.0%
WAGE / INCOME GAP [ % ]
73.0¢/ $1
WAGE / INCOME GAP [ $ ]
$13,729
FAMILY INCOME DEFICIT
0.47
INEQUALITY / GINI INDEX
97,384
TOTAL POPULATION
46,879
MALE POPULATION
50,505
FEMALE POPULATION
92.82
MALES / 100 FEMALES
107.73
FEMALES / 100 MALES
35.6
MEDIAN AGE
3.1
AVG FAMILY SIZE
2.4
AVG HOUSEHOLD SIZE
48,569
LABOR FORCE [ PEOPLE ]
63.1%
PERCENT IN LABOR FORCE
6.6%
UNEMPLOYMENT RATE
Portsmouth Area Codes
Income in Portsmouth
Income Overview in Portsmouth
Per Capita Income in Portsmouth is $31,457, while median incomes of families and households are $66,450 and $57,154 respectively.
| Characteristic | Number | Measure |
| Per Capita Income | 97,384 | $31,457 |
| Median Family Income | 23,316 | $66,450 |
| Mean Family Income | 23,316 | $85,069 |
| Median Household Income | 38,962 | $57,154 |
| Mean Household Income | 38,962 | $74,426 |
| Income Deficit | 23,316 | $13,729 |
| Wage / Income Gap (%) | 97,384 | 27.05% |
| Wage / Income Gap ($) | 97,384 | 72.95¢ per $1 |
| Gini / Inequality Index | 97,384 | 0.47 |
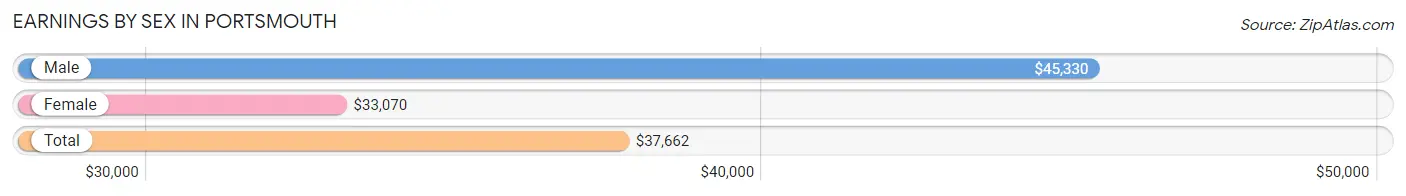
Earnings by Sex in Portsmouth
Average Earnings in Portsmouth are $37,662, $45,330 for men and $33,070 for women, a difference of 27.1%.
| Sex | Number | Average Earnings |
| Male | 25,266 (51.0%) | $45,330 |
| Female | 24,310 (49.0%) | $33,070 |
| Total | 49,576 (100.0%) | $37,662 |
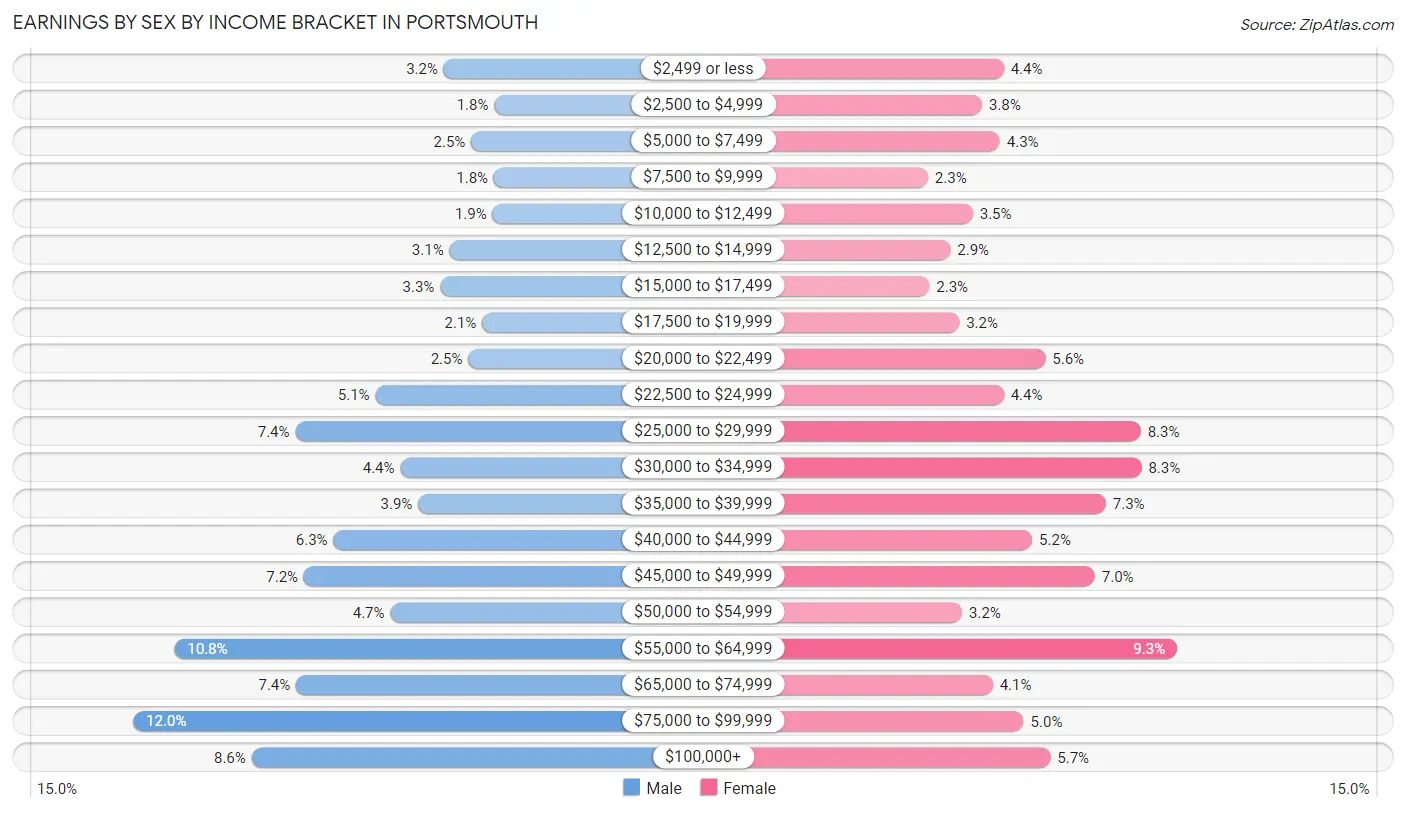
Earnings by Sex by Income Bracket in Portsmouth
The most common earnings brackets in Portsmouth are $75,000 to $99,999 for men (3,020 | 11.9%) and $55,000 to $64,999 for women (2,256 | 9.3%).
| Income | Male | Female |
| $2,499 or less | 814 (3.2%) | 1,072 (4.4%) |
| $2,500 to $4,999 | 456 (1.8%) | 923 (3.8%) |
| $5,000 to $7,499 | 620 (2.5%) | 1,045 (4.3%) |
| $7,500 to $9,999 | 457 (1.8%) | 555 (2.3%) |
| $10,000 to $12,499 | 467 (1.8%) | 860 (3.5%) |
| $12,500 to $14,999 | 772 (3.1%) | 707 (2.9%) |
| $15,000 to $17,499 | 839 (3.3%) | 563 (2.3%) |
| $17,500 to $19,999 | 540 (2.1%) | 768 (3.2%) |
| $20,000 to $22,499 | 638 (2.5%) | 1,357 (5.6%) |
| $22,500 to $24,999 | 1,298 (5.1%) | 1,071 (4.4%) |
| $25,000 to $29,999 | 1,867 (7.4%) | 2,007 (8.3%) |
| $30,000 to $34,999 | 1,123 (4.4%) | 2,012 (8.3%) |
| $35,000 to $39,999 | 996 (3.9%) | 1,770 (7.3%) |
| $40,000 to $44,999 | 1,596 (6.3%) | 1,267 (5.2%) |
| $45,000 to $49,999 | 1,806 (7.1%) | 1,695 (7.0%) |
| $50,000 to $54,999 | 1,193 (4.7%) | 788 (3.2%) |
| $55,000 to $64,999 | 2,726 (10.8%) | 2,256 (9.3%) |
| $65,000 to $74,999 | 1,861 (7.4%) | 996 (4.1%) |
| $75,000 to $99,999 | 3,020 (11.9%) | 1,208 (5.0%) |
| $100,000+ | 2,177 (8.6%) | 1,390 (5.7%) |
| Total | 25,266 (100.0%) | 24,310 (100.0%) |
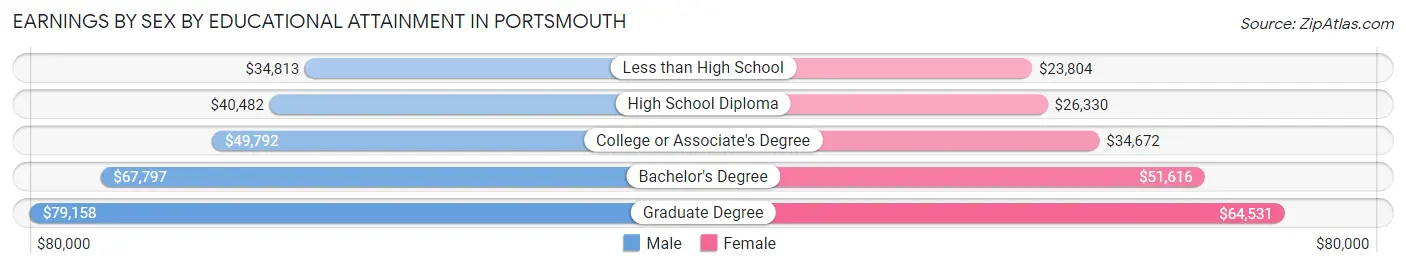
Earnings by Sex by Educational Attainment in Portsmouth
Average earnings in Portsmouth are $50,637 for men and $35,732 for women, a difference of 29.4%. Men with an educational attainment of graduate degree enjoy the highest average annual earnings of $79,158, while those with less than high school education earn the least with $34,813. Women with an educational attainment of graduate degree earn the most with the average annual earnings of $64,531, while those with less than high school education have the smallest earnings of $23,804.
| Educational Attainment | Male Income | Female Income |
| Less than High School | $34,813 | $23,804 |
| High School Diploma | $40,482 | $26,330 |
| College or Associate's Degree | $49,792 | $34,672 |
| Bachelor's Degree | $67,797 | $51,616 |
| Graduate Degree | $79,158 | $64,531 |
| Total | $50,637 | $35,732 |
Family Income in Portsmouth
Family Income Brackets in Portsmouth
According to the Portsmouth family income data, there are 4,803 families falling into the $50,000 to $74,999 income range, which is the most common income bracket and makes up 20.6% of all families. Conversely, the $10,000 to $14,999 income bracket is the least frequent group with only 630 families (2.7%) belonging to this category.
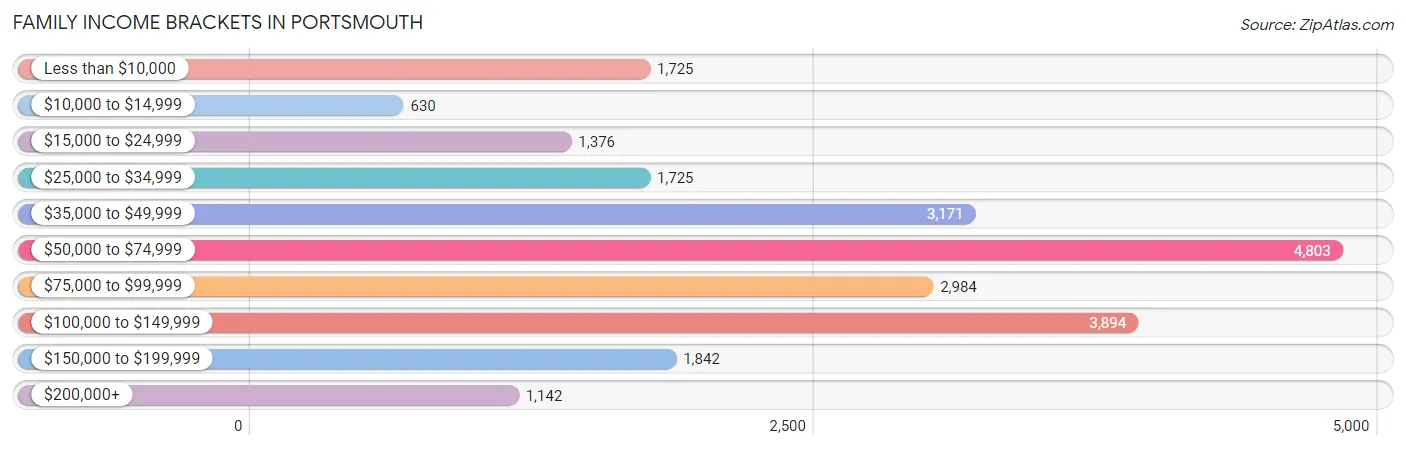
| Income Bracket | # Families | % Families |
| Less than $10,000 | 1,725 | 7.4% |
| $10,000 to $14,999 | 630 | 2.7% |
| $15,000 to $24,999 | 1,376 | 5.9% |
| $25,000 to $34,999 | 1,725 | 7.4% |
| $35,000 to $49,999 | 3,171 | 13.6% |
| $50,000 to $74,999 | 4,803 | 20.6% |
| $75,000 to $99,999 | 2,984 | 12.8% |
| $100,000 to $149,999 | 3,894 | 16.7% |
| $150,000 to $199,999 | 1,842 | 7.9% |
| $200,000+ | 1,142 | 4.9% |
Family Income by Famaliy Size in Portsmouth
7+ person families (184 | 0.8%) account for the highest median family income in Portsmouth with $78,365 per family, while 2-person families (11,353 | 48.7%) have the highest median income of $31,734 per family member.
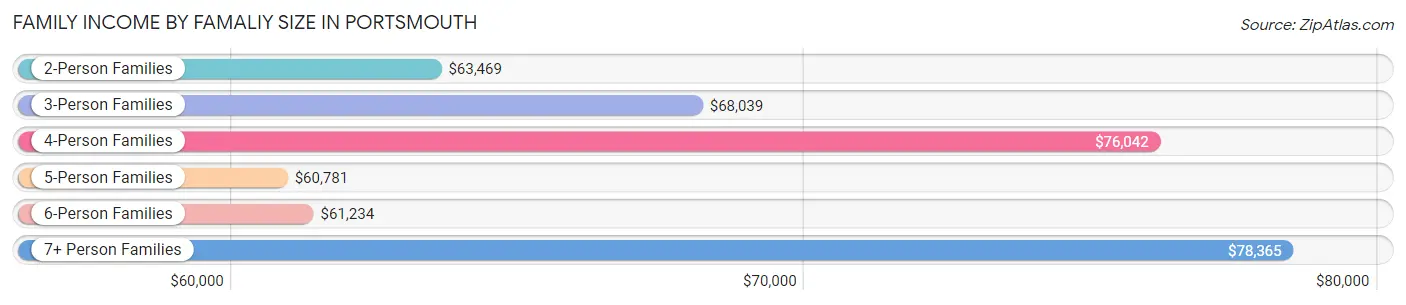
| Income Bracket | # Families | Median Income |
| 2-Person Families | 11,353 (48.7%) | $63,469 |
| 3-Person Families | 6,320 (27.1%) | $68,039 |
| 4-Person Families | 3,369 (14.4%) | $76,042 |
| 5-Person Families | 1,425 (6.1%) | $60,781 |
| 6-Person Families | 665 (2.9%) | $61,234 |
| 7+ Person Families | 184 (0.8%) | $78,365 |
| Total | 23,316 (100.0%) | $66,450 |
Family Income by Number of Earners in Portsmouth
The median family income in Portsmouth is $66,450, with families comprising 3+ earners (1,461) having the highest median family income of $144,135, while families with no earners (4,037) have the lowest median family income of $30,332, accounting for 6.3% and 17.3% of families, respectively.
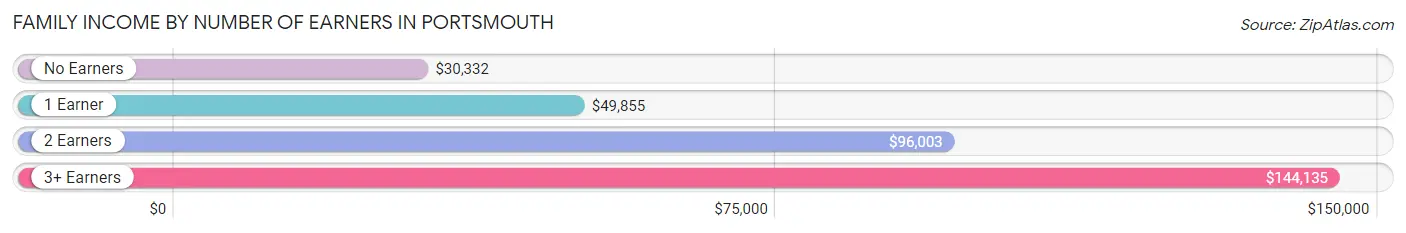
| Number of Earners | # Families | Median Income |
| No Earners | 4,037 (17.3%) | $30,332 |
| 1 Earner | 9,080 (38.9%) | $49,855 |
| 2 Earners | 8,738 (37.5%) | $96,003 |
| 3+ Earners | 1,461 (6.3%) | $144,135 |
| Total | 23,316 (100.0%) | $66,450 |
Household Income in Portsmouth
Household Income Brackets in Portsmouth
With 7,325 households falling in the category, the $50,000 to $74,999 income range is the most frequent in Portsmouth, accounting for 18.8% of all households. In contrast, only 1,558 households (4.0%) fall into the $200,000+ income bracket, making it the least populous group.
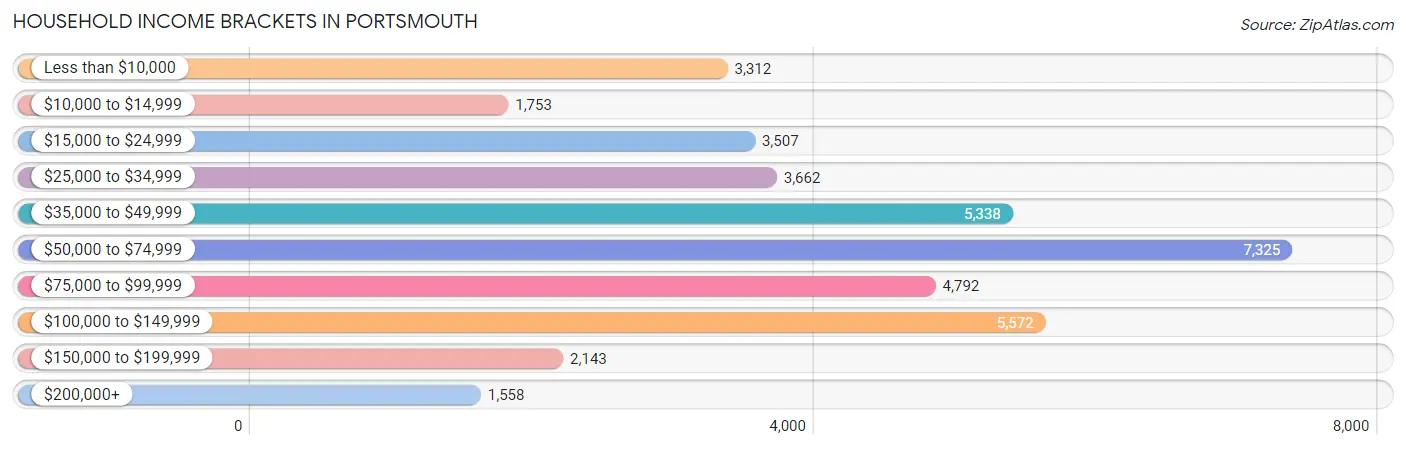
| Income Bracket | # Households | % Households |
| Less than $10,000 | 3,312 | 8.5% |
| $10,000 to $14,999 | 1,753 | 4.5% |
| $15,000 to $24,999 | 3,507 | 9.0% |
| $25,000 to $34,999 | 3,662 | 9.4% |
| $35,000 to $49,999 | 5,338 | 13.7% |
| $50,000 to $74,999 | 7,325 | 18.8% |
| $75,000 to $99,999 | 4,792 | 12.3% |
| $100,000 to $149,999 | 5,572 | 14.3% |
| $150,000 to $199,999 | 2,143 | 5.5% |
| $200,000+ | 1,558 | 4.0% |
Household Income by Householder Age in Portsmouth
The median household income in Portsmouth is $57,154, with the highest median household income of $66,989 found in the 45 to 64 years age bracket for the primary householder. A total of 13,054 households (33.5%) fall into this category. Meanwhile, the 15 to 24 years age bracket for the primary householder has the lowest median household income of $37,184, with 1,799 households (4.6%) in this group.
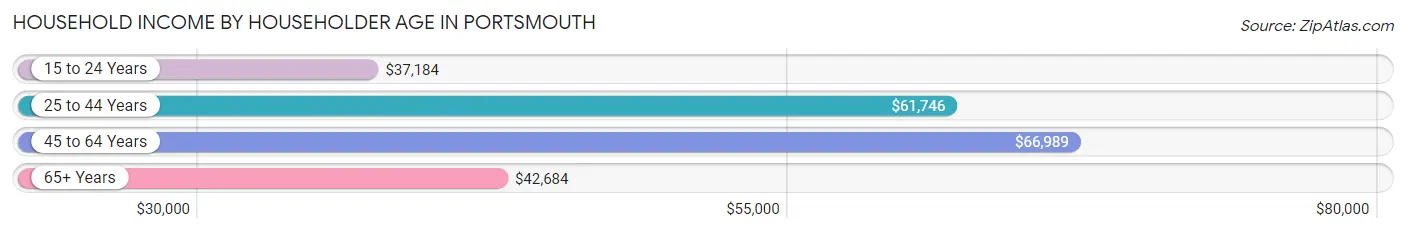
| Income Bracket | # Households | Median Income |
| 15 to 24 Years | 1,799 (4.6%) | $37,184 |
| 25 to 44 Years | 13,967 (35.8%) | $61,746 |
| 45 to 64 Years | 13,054 (33.5%) | $66,989 |
| 65+ Years | 10,142 (26.0%) | $42,684 |
| Total | 38,962 (100.0%) | $57,154 |
Poverty in Portsmouth
Income Below Poverty by Sex and Age in Portsmouth
With 13.5% poverty level for males and 20.8% for females among the residents of Portsmouth, under 5 year old males and 15 year old females are the most vulnerable to poverty, with 1,035 males (29.1%) and 286 females (43.7%) in their respective age groups living below the poverty level.
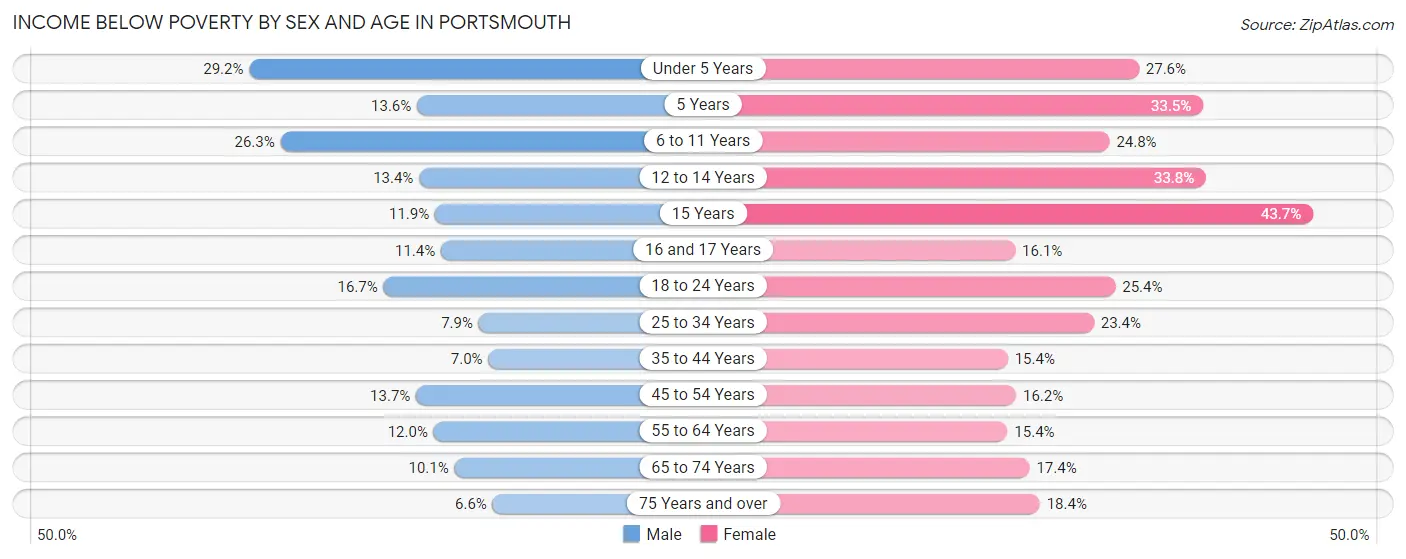
| Age Bracket | Male | Female |
| Under 5 Years | 1,035 (29.1%) | 920 (27.6%) |
| 5 Years | 54 (13.6%) | 224 (33.5%) |
| 6 to 11 Years | 961 (26.3%) | 859 (24.8%) |
| 12 to 14 Years | 270 (13.4%) | 656 (33.8%) |
| 15 Years | 53 (11.9%) | 286 (43.7%) |
| 16 and 17 Years | 127 (11.4%) | 136 (16.1%) |
| 18 to 24 Years | 649 (16.7%) | 1,056 (25.4%) |
| 25 to 34 Years | 594 (7.9%) | 1,880 (23.4%) |
| 35 to 44 Years | 392 (7.0%) | 952 (15.4%) |
| 45 to 54 Years | 660 (13.7%) | 914 (16.2%) |
| 55 to 64 Years | 643 (12.0%) | 976 (15.4%) |
| 65 to 74 Years | 379 (10.1%) | 879 (17.4%) |
| 75 Years and over | 135 (6.6%) | 641 (18.4%) |
| Total | 5,952 (13.5%) | 10,379 (20.8%) |
Income Above Poverty by Sex and Age in Portsmouth
According to the poverty statistics in Portsmouth, males aged 75 years and over and females aged 55 to 64 years are the age groups that are most secure financially, with 93.4% of males and 84.6% of females in these age groups living above the poverty line.
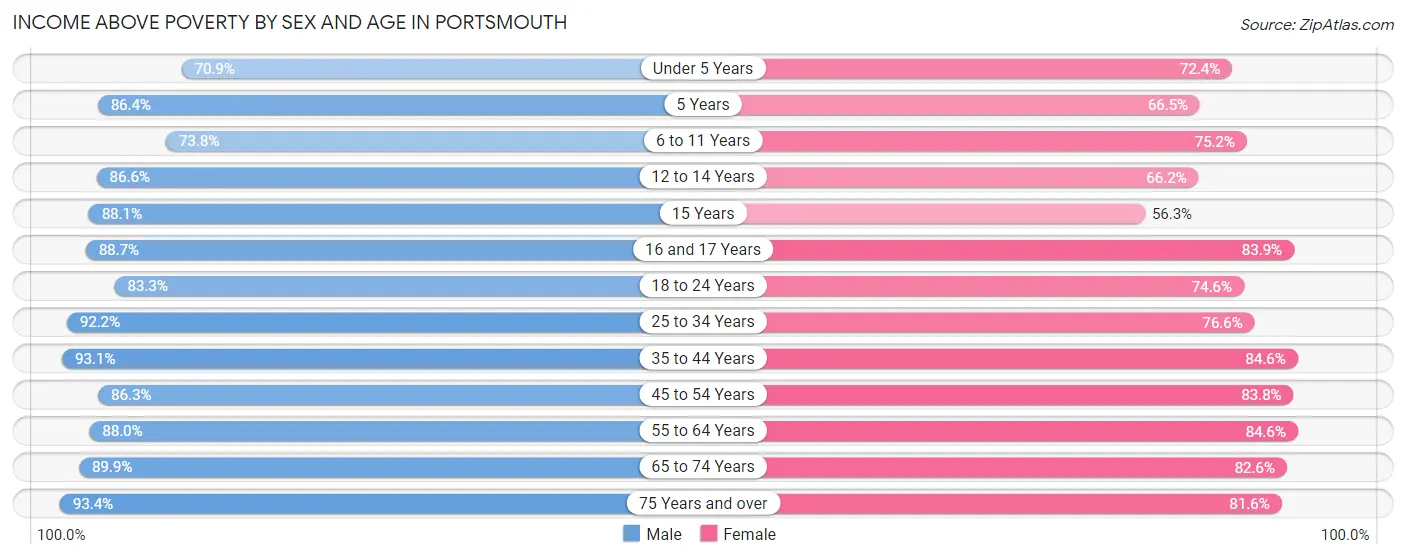
| Age Bracket | Male | Female |
| Under 5 Years | 2,516 (70.9%) | 2,417 (72.4%) |
| 5 Years | 344 (86.4%) | 444 (66.5%) |
| 6 to 11 Years | 2,700 (73.8%) | 2,599 (75.2%) |
| 12 to 14 Years | 1,748 (86.6%) | 1,285 (66.2%) |
| 15 Years | 392 (88.1%) | 368 (56.3%) |
| 16 and 17 Years | 992 (88.6%) | 709 (83.9%) |
| 18 to 24 Years | 3,239 (83.3%) | 3,105 (74.6%) |
| 25 to 34 Years | 6,973 (92.1%) | 6,157 (76.6%) |
| 35 to 44 Years | 5,245 (93.0%) | 5,228 (84.6%) |
| 45 to 54 Years | 4,170 (86.3%) | 4,740 (83.8%) |
| 55 to 64 Years | 4,700 (88.0%) | 5,374 (84.6%) |
| 65 to 74 Years | 3,373 (89.9%) | 4,166 (82.6%) |
| 75 Years and over | 1,923 (93.4%) | 2,849 (81.6%) |
| Total | 38,315 (86.6%) | 39,441 (79.2%) |
Income Below Poverty Among Married-Couple Families in Portsmouth
The poverty statistics for married-couple families in Portsmouth show that 3.9% or 510 of the total 13,094 families live below the poverty line. Families with 3 or 4 children have the highest poverty rate of 20.8%, comprising of 161 families. On the other hand, families with no children have the lowest poverty rate of 2.3%, which includes 181 families.
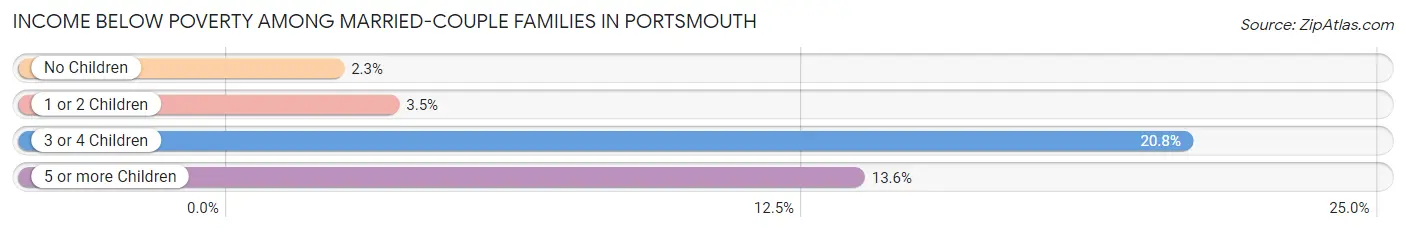
| Children | Above Poverty | Below Poverty |
| No Children | 7,666 (97.7%) | 181 (2.3%) |
| 1 or 2 Children | 4,209 (96.5%) | 153 (3.5%) |
| 3 or 4 Children | 614 (79.2%) | 161 (20.8%) |
| 5 or more Children | 95 (86.4%) | 15 (13.6%) |
| Total | 12,584 (96.1%) | 510 (3.9%) |
Income Below Poverty Among Single-Parent Households in Portsmouth
According to the poverty data in Portsmouth, 10.5% or 213 single-father households and 32.8% or 2,688 single-mother households are living below the poverty line. Among single-father households, those with 1 or 2 children have the highest poverty rate, with 179 households (16.9%) experiencing poverty. Likewise, among single-mother households, those with 3 or 4 children have the highest poverty rate, with 564 households (57.3%) falling below the poverty line.
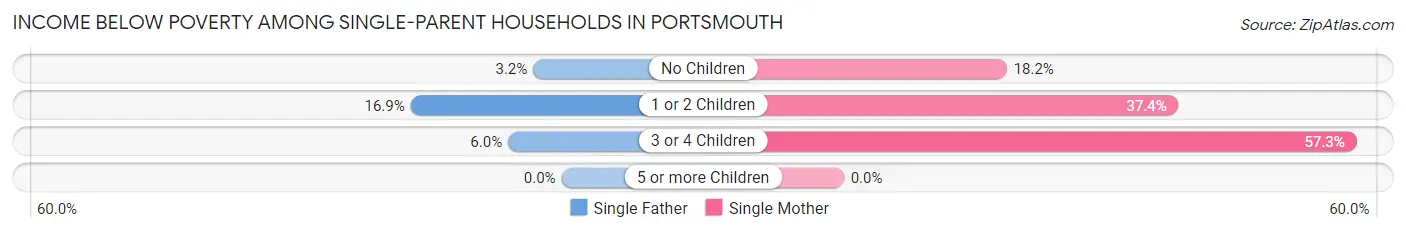
| Children | Single Father | Single Mother |
| No Children | 27 (3.2%) | 519 (18.2%) |
| 1 or 2 Children | 179 (16.9%) | 1,605 (37.4%) |
| 3 or 4 Children | 7 (6.0%) | 564 (57.3%) |
| 5 or more Children | 0 (0.0%) | 0 (0.0%) |
| Total | 213 (10.5%) | 2,688 (32.8%) |
Income Below Poverty Among Married-Couple vs Single-Parent Households in Portsmouth
The poverty data for Portsmouth shows that 510 of the married-couple family households (3.9%) and 2,901 of the single-parent households (28.4%) are living below the poverty level. Within the married-couple family households, those with 3 or 4 children have the highest poverty rate, with 161 households (20.8%) falling below the poverty line. Among the single-parent households, those with 3 or 4 children have the highest poverty rate, with 571 household (51.9%) living below poverty.
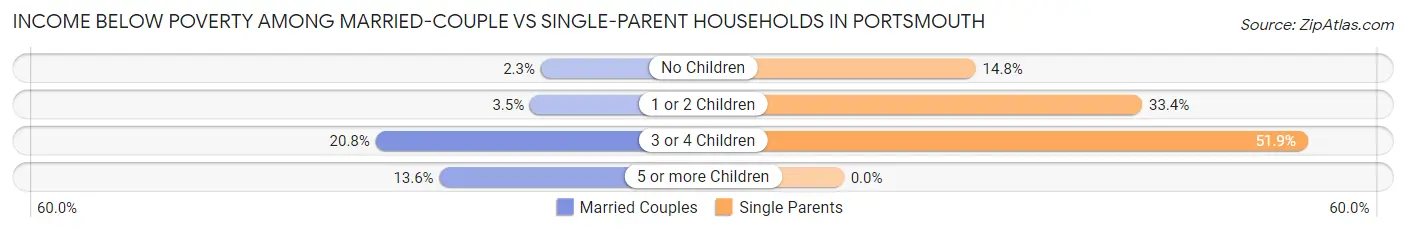
| Children | Married-Couple Families | Single-Parent Households |
| No Children | 181 (2.3%) | 546 (14.7%) |
| 1 or 2 Children | 153 (3.5%) | 1,784 (33.4%) |
| 3 or 4 Children | 161 (20.8%) | 571 (51.9%) |
| 5 or more Children | 15 (13.6%) | 0 (0.0%) |
| Total | 510 (3.9%) | 2,901 (28.4%) |
Race in Portsmouth
The most populous races in Portsmouth are Black / African American (50,091 | 51.4%), White / Caucasian (36,682 | 37.7%), and Two or more Races (6,821 | 7.0%).
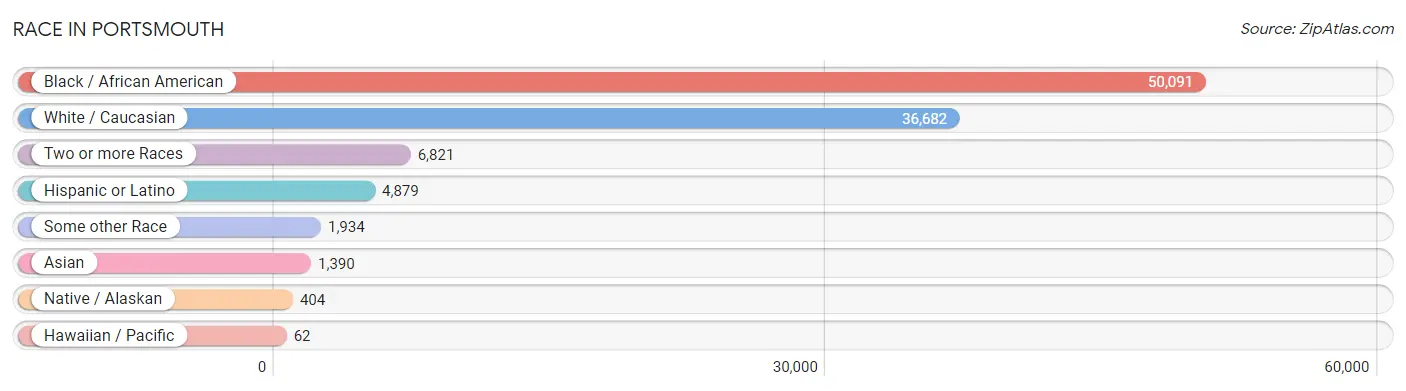
| Race | # Population | % Population |
| Asian | 1,390 | 1.4% |
| Black / African American | 50,091 | 51.4% |
| Hawaiian / Pacific | 62 | 0.1% |
| Hispanic or Latino | 4,879 | 5.0% |
| Native / Alaskan | 404 | 0.4% |
| White / Caucasian | 36,682 | 37.7% |
| Two or more Races | 6,821 | 7.0% |
| Some other Race | 1,934 | 2.0% |
| Total | 97,384 | 100.0% |
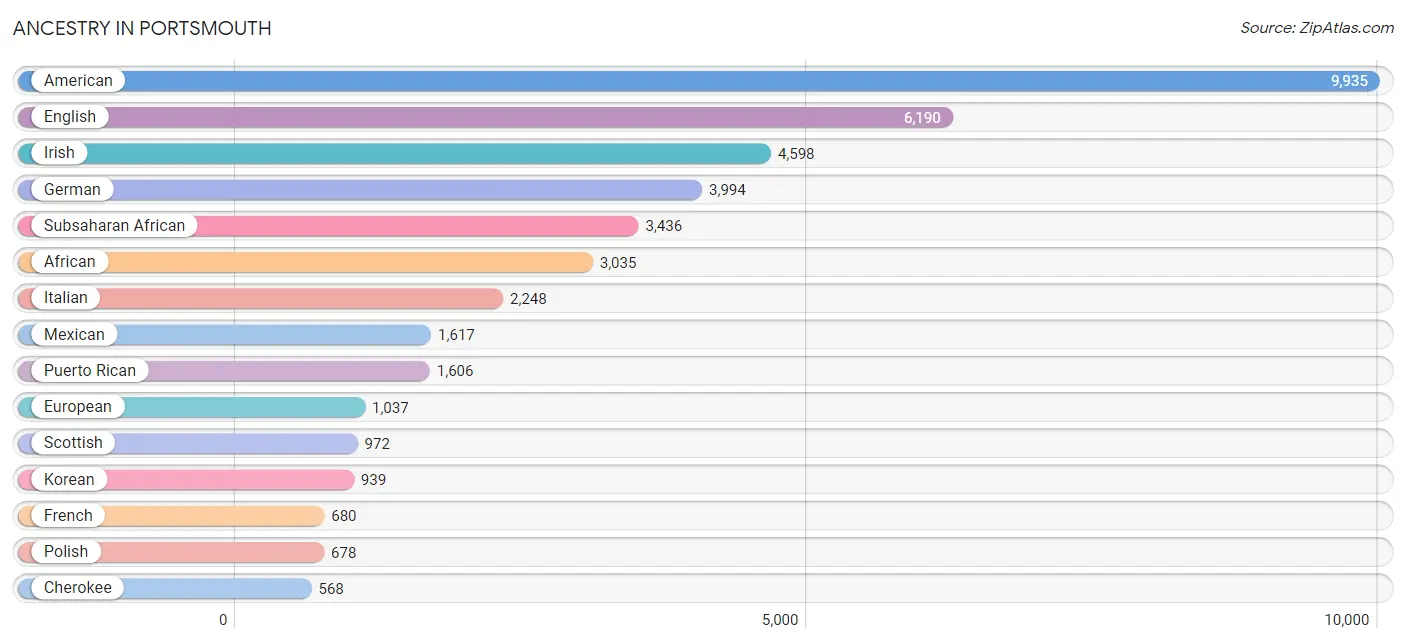
Ancestry in Portsmouth
The most populous ancestries reported in Portsmouth are American (9,935 | 10.2%), English (6,190 | 6.4%), Irish (4,598 | 4.7%), German (3,994 | 4.1%), and Subsaharan African (3,436 | 3.5%), together accounting for 28.9% of all Portsmouth residents.
| Ancestry | # Population | % Population |
| Afghan | 12 | 0.0% |
| African | 3,035 | 3.1% |
| American | 9,935 | 10.2% |
| Arab | 254 | 0.3% |
| Armenian | 13 | 0.0% |
| Australian | 6 | 0.0% |
| Austrian | 32 | 0.0% |
| Belgian | 7 | 0.0% |
| Bhutanese | 434 | 0.4% |
| Blackfeet | 5 | 0.0% |
| Brazilian | 9 | 0.0% |
| British | 485 | 0.5% |
| British West Indian | 64 | 0.1% |
| Burmese | 138 | 0.1% |
| Cajun | 117 | 0.1% |
| Cambodian | 39 | 0.0% |
| Canadian | 70 | 0.1% |
| Cape Verdean | 6 | 0.0% |
| Central American | 291 | 0.3% |
| Central American Indian | 106 | 0.1% |
| Cherokee | 568 | 0.6% |
| Chilean | 14 | 0.0% |
| Choctaw | 41 | 0.0% |
| Colombian | 69 | 0.1% |
| Creek | 6 | 0.0% |
| Croatian | 7 | 0.0% |
| Cuban | 229 | 0.2% |
| Czech | 153 | 0.2% |
| Czechoslovakian | 43 | 0.0% |
| Danish | 44 | 0.1% |
| Dominican | 158 | 0.2% |
| Dutch | 238 | 0.2% |
| Eastern European | 42 | 0.0% |
| Ecuadorian | 22 | 0.0% |
| Egyptian | 79 | 0.1% |
| English | 6,190 | 6.4% |
| Ethiopian | 8 | 0.0% |
| European | 1,037 | 1.1% |
| Filipino | 29 | 0.0% |
| Finnish | 37 | 0.0% |
| French | 680 | 0.7% |
| French Canadian | 338 | 0.4% |
| German | 3,994 | 4.1% |
| Greek | 198 | 0.2% |
| Guamanian / Chamorro | 47 | 0.1% |
| Guatemalan | 116 | 0.1% |
| Guyanese | 21 | 0.0% |
| Haitian | 175 | 0.2% |
| Honduran | 31 | 0.0% |
| Hungarian | 151 | 0.2% |
| Indian (Asian) | 521 | 0.5% |
| Inupiat | 6 | 0.0% |
| Iraqi | 98 | 0.1% |
| Irish | 4,598 | 4.7% |
| Iroquois | 85 | 0.1% |
| Israeli | 61 | 0.1% |
| Italian | 2,248 | 2.3% |
| Jamaican | 553 | 0.6% |
| Japanese | 92 | 0.1% |
| Kenyan | 10 | 0.0% |
| Korean | 939 | 1.0% |
| Lebanese | 70 | 0.1% |
| Liberian | 21 | 0.0% |
| Lithuanian | 27 | 0.0% |
| Malaysian | 126 | 0.1% |
| Mexican | 1,617 | 1.7% |
| Mexican American Indian | 59 | 0.1% |
| Moroccan | 35 | 0.0% |
| Native Hawaiian | 75 | 0.1% |
| New Zealander | 13 | 0.0% |
| Nicaraguan | 67 | 0.1% |
| Nigerian | 321 | 0.3% |
| Northern European | 36 | 0.0% |
| Norwegian | 137 | 0.1% |
| Pakistani | 126 | 0.1% |
| Palestinian | 6 | 0.0% |
| Panamanian | 31 | 0.0% |
| Peruvian | 19 | 0.0% |
| Polish | 678 | 0.7% |
| Portuguese | 90 | 0.1% |
| Puerto Rican | 1,606 | 1.7% |
| Romanian | 62 | 0.1% |
| Russian | 89 | 0.1% |
| Salvadoran | 46 | 0.1% |
| Scandinavian | 66 | 0.1% |
| Scotch-Irish | 494 | 0.5% |
| Scottish | 972 | 1.0% |
| Sioux | 6 | 0.0% |
| Slavic | 5 | 0.0% |
| Slovak | 47 | 0.1% |
| Slovene | 20 | 0.0% |
| South American | 146 | 0.2% |
| Spaniard | 137 | 0.1% |
| Spanish | 505 | 0.5% |
| Sri Lankan | 95 | 0.1% |
| Subsaharan African | 3,436 | 3.5% |
| Swedish | 303 | 0.3% |
| Swiss | 45 | 0.1% |
| Thai | 236 | 0.2% |
| Trinidadian and Tobagonian | 139 | 0.1% |
| U.S. Virgin Islander | 24 | 0.0% |
| Ugandan | 3 | 0.0% |
| Ukrainian | 126 | 0.1% |
| Venezuelan | 22 | 0.0% |
| Vietnamese | 1 | 0.0% |
| Welsh | 433 | 0.4% |
| West Indian | 74 | 0.1% |
| Yaqui | 37 | 0.0% | View All 108 Rows |
Immigrants in Portsmouth
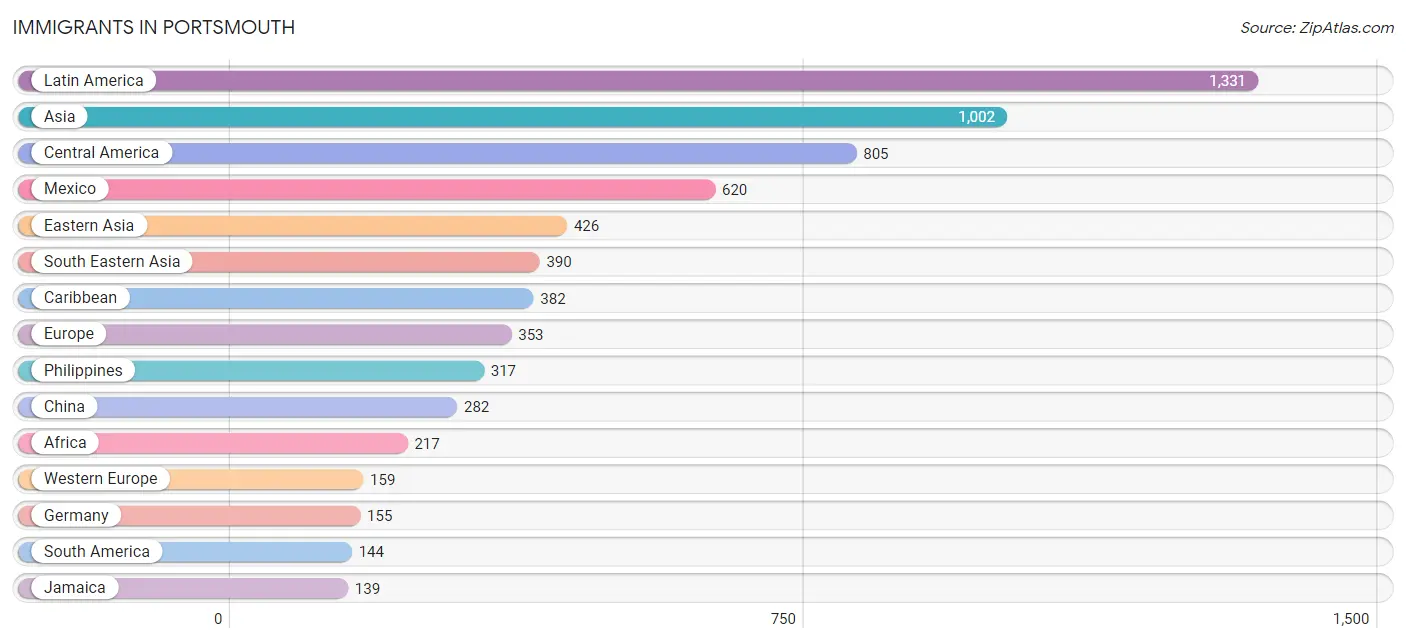
The most numerous immigrant groups reported in Portsmouth came from Latin America (1,331 | 1.4%), Asia (1,002 | 1.0%), Central America (805 | 0.8%), Mexico (620 | 0.6%), and Eastern Asia (426 | 0.4%), together accounting for 4.3% of all Portsmouth residents.
| Immigration Origin | # Population | % Population |
| Afghanistan | 12 | 0.0% |
| Africa | 217 | 0.2% |
| Asia | 1,002 | 1.0% |
| Australia | 19 | 0.0% |
| Bangladesh | 4 | 0.0% |
| Bosnia and Herzegovina | 13 | 0.0% |
| Brazil | 19 | 0.0% |
| Cameroon | 15 | 0.0% |
| Canada | 68 | 0.1% |
| Caribbean | 382 | 0.4% |
| Central America | 805 | 0.8% |
| China | 282 | 0.3% |
| Colombia | 41 | 0.0% |
| Cuba | 13 | 0.0% |
| Dominican Republic | 19 | 0.0% |
| Eastern Africa | 68 | 0.1% |
| Eastern Asia | 426 | 0.4% |
| Eastern Europe | 73 | 0.1% |
| Ecuador | 7 | 0.0% |
| Egypt | 33 | 0.0% |
| El Salvador | 13 | 0.0% |
| England | 36 | 0.0% |
| Ethiopia | 39 | 0.0% |
| Europe | 353 | 0.4% |
| Germany | 155 | 0.2% |
| Guatemala | 75 | 0.1% |
| Haiti | 32 | 0.0% |
| Honduras | 30 | 0.0% |
| India | 44 | 0.1% |
| Iraq | 52 | 0.1% |
| Italy | 46 | 0.1% |
| Jamaica | 139 | 0.1% |
| Japan | 27 | 0.0% |
| Kenya | 28 | 0.0% |
| Korea | 78 | 0.1% |
| Latin America | 1,331 | 1.4% |
| Mexico | 620 | 0.6% |
| Middle Africa | 15 | 0.0% |
| Nicaragua | 67 | 0.1% |
| Nigeria | 73 | 0.1% |
| Northern Africa | 33 | 0.0% |
| Northern Europe | 70 | 0.1% |
| Oceania | 68 | 0.1% |
| Pakistan | 68 | 0.1% |
| Peru | 22 | 0.0% |
| Philippines | 317 | 0.3% |
| Poland | 28 | 0.0% |
| Russia | 2 | 0.0% |
| Scotland | 18 | 0.0% |
| Sierra Leone | 12 | 0.0% |
| South Africa | 8 | 0.0% |
| South America | 144 | 0.2% |
| South Central Asia | 128 | 0.1% |
| South Eastern Asia | 390 | 0.4% |
| Southern Europe | 51 | 0.1% |
| Spain | 5 | 0.0% |
| Switzerland | 4 | 0.0% |
| Taiwan | 51 | 0.1% |
| Thailand | 34 | 0.0% |
| Trinidad and Tobago | 115 | 0.1% |
| Ukraine | 30 | 0.0% |
| Venezuela | 51 | 0.1% |
| Vietnam | 39 | 0.0% |
| Western Africa | 85 | 0.1% |
| Western Asia | 52 | 0.1% |
| Western Europe | 159 | 0.2% | View All 66 Rows |
Sex and Age in Portsmouth
Sex and Age in Portsmouth
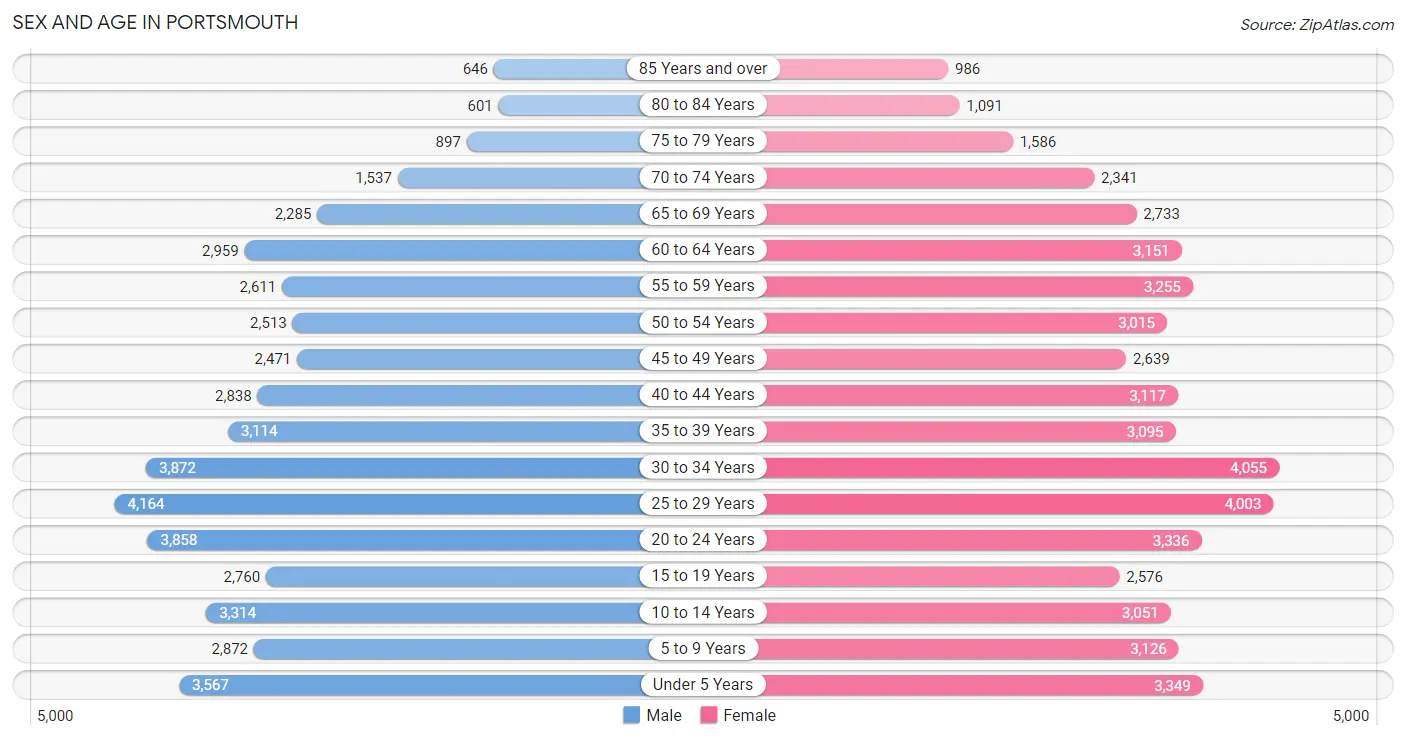
The most populous age groups in Portsmouth are 25 to 29 Years (4,164 | 8.9%) for men and 30 to 34 Years (4,055 | 8.0%) for women.
| Age Bracket | Male | Female |
| Under 5 Years | 3,567 (7.6%) | 3,349 (6.6%) |
| 5 to 9 Years | 2,872 (6.1%) | 3,126 (6.2%) |
| 10 to 14 Years | 3,314 (7.1%) | 3,051 (6.0%) |
| 15 to 19 Years | 2,760 (5.9%) | 2,576 (5.1%) |
| 20 to 24 Years | 3,858 (8.2%) | 3,336 (6.6%) |
| 25 to 29 Years | 4,164 (8.9%) | 4,003 (7.9%) |
| 30 to 34 Years | 3,872 (8.3%) | 4,055 (8.0%) |
| 35 to 39 Years | 3,114 (6.6%) | 3,095 (6.1%) |
| 40 to 44 Years | 2,838 (6.0%) | 3,117 (6.2%) |
| 45 to 49 Years | 2,471 (5.3%) | 2,639 (5.2%) |
| 50 to 54 Years | 2,513 (5.4%) | 3,015 (6.0%) |
| 55 to 59 Years | 2,611 (5.6%) | 3,255 (6.4%) |
| 60 to 64 Years | 2,959 (6.3%) | 3,151 (6.2%) |
| 65 to 69 Years | 2,285 (4.9%) | 2,733 (5.4%) |
| 70 to 74 Years | 1,537 (3.3%) | 2,341 (4.6%) |
| 75 to 79 Years | 897 (1.9%) | 1,586 (3.1%) |
| 80 to 84 Years | 601 (1.3%) | 1,091 (2.2%) |
| 85 Years and over | 646 (1.4%) | 986 (1.9%) |
| Total | 46,879 (100.0%) | 50,505 (100.0%) |
Families and Households in Portsmouth
Median Family Size in Portsmouth
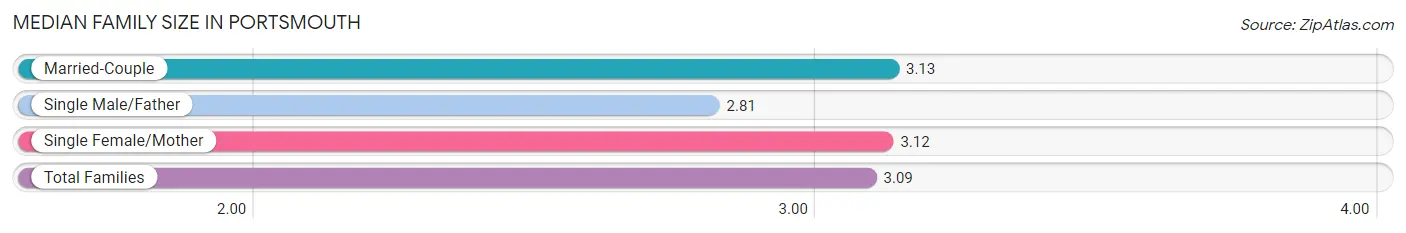
The median family size in Portsmouth is 3.09 persons per family, with married-couple families (13,094 | 56.2%) accounting for the largest median family size of 3.13 persons per family. On the other hand, single male/father families (2,031 | 8.7%) represent the smallest median family size with 2.81 persons per family.
| Family Type | # Families | Family Size |
| Married-Couple | 13,094 (56.2%) | 3.13 |
| Single Male/Father | 2,031 (8.7%) | 2.81 |
| Single Female/Mother | 8,191 (35.1%) | 3.12 |
| Total Families | 23,316 (100.0%) | 3.09 |
Median Household Size in Portsmouth
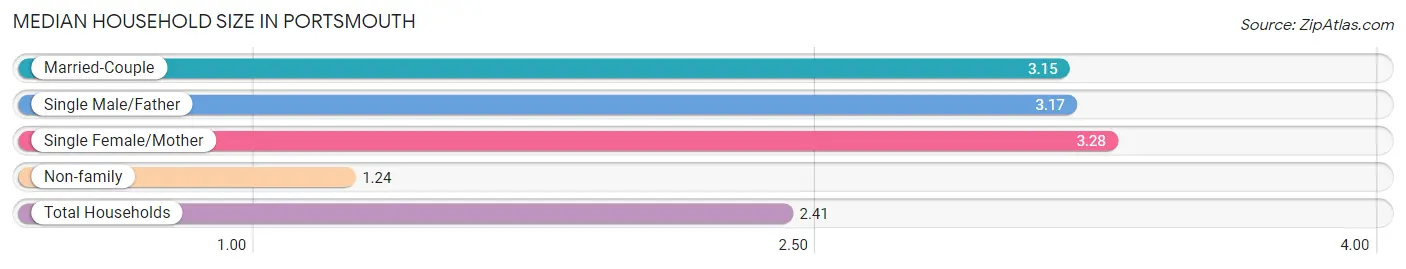
The median household size in Portsmouth is 2.41 persons per household, with single female/mother households (8,191 | 21.0%) accounting for the largest median household size of 3.28 persons per household. non-family households (15,646 | 40.2%) represent the smallest median household size with 1.24 persons per household.
| Household Type | # Households | Household Size |
| Married-Couple | 13,094 (33.6%) | 3.15 |
| Single Male/Father | 2,031 (5.2%) | 3.17 |
| Single Female/Mother | 8,191 (21.0%) | 3.28 |
| Non-family | 15,646 (40.2%) | 1.24 |
| Total Households | 38,962 (100.0%) | 2.41 |
Household Size by Marriage Status in Portsmouth
Out of a total of 38,962 households in Portsmouth, 23,316 (59.8%) are family households, while 15,646 (40.2%) are nonfamily households. The most numerous type of family households are 2-person households, comprising 10,299, and the most common type of nonfamily households are 1-person households, comprising 12,865.
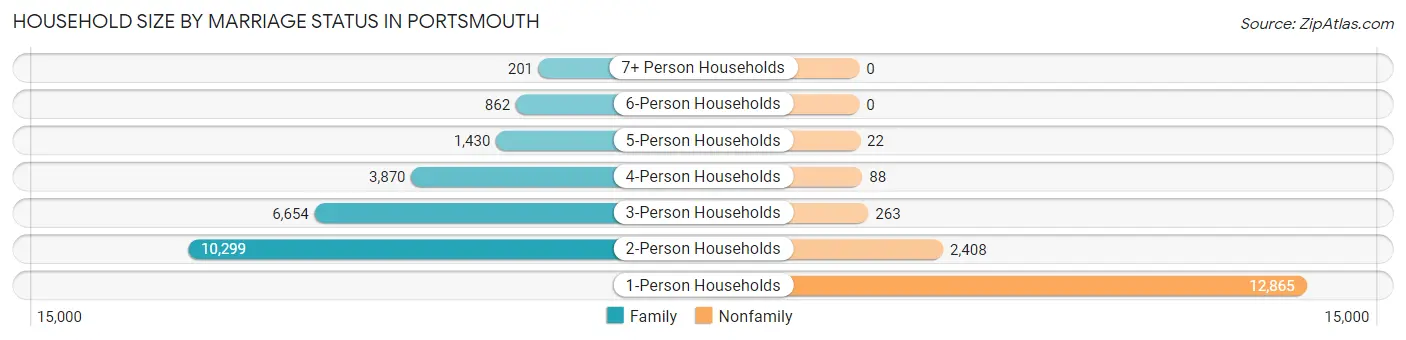
| Household Size | Family Households | Nonfamily Households |
| 1-Person Households | - | 12,865 (33.0%) |
| 2-Person Households | 10,299 (26.4%) | 2,408 (6.2%) |
| 3-Person Households | 6,654 (17.1%) | 263 (0.7%) |
| 4-Person Households | 3,870 (9.9%) | 88 (0.2%) |
| 5-Person Households | 1,430 (3.7%) | 22 (0.1%) |
| 6-Person Households | 862 (2.2%) | 0 (0.0%) |
| 7+ Person Households | 201 (0.5%) | 0 (0.0%) |
| Total | 23,316 (59.8%) | 15,646 (40.2%) |
Female Fertility in Portsmouth
Fertility by Age in Portsmouth
Average fertility rate in Portsmouth is 56.0 births per 1,000 women. Women in the age bracket of 20 to 34 years have the highest fertility rate with 91.0 births per 1,000 women. Women in the age bracket of 20 to 34 years acount for 78.6% of all women with births.
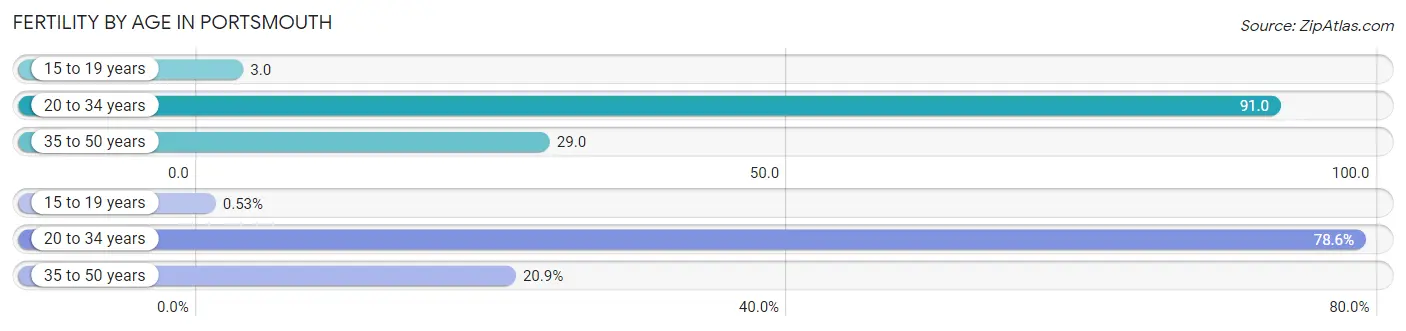
| Age Bracket | Women with Births | Births / 1,000 Women |
| 15 to 19 years | 7 (0.5%) | 3.0 |
| 20 to 34 years | 1,034 (78.6%) | 91.0 |
| 35 to 50 years | 275 (20.9%) | 29.0 |
| Total | 1,316 (100.0%) | 56.0 |
Fertility by Age by Marriage Status in Portsmouth
62.8% of women with births (1,316) in Portsmouth are married. The highest percentage of unmarried women with births falls into 15 to 19 years age bracket with 100.0% of them unmarried at the time of birth, while the lowest percentage of unmarried women with births belong to 20 to 34 years age bracket with 33.4% of them unmarried.
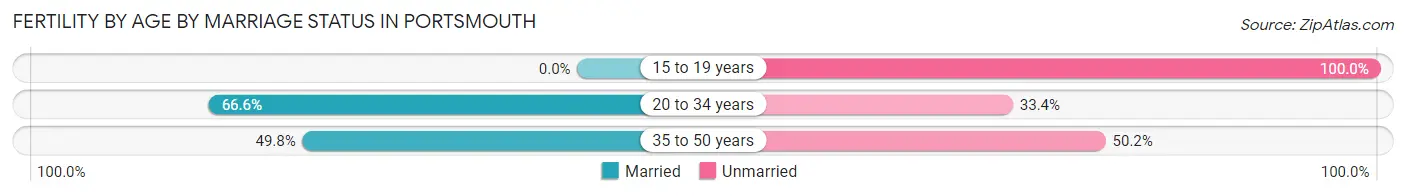
| Age Bracket | Married | Unmarried |
| 15 to 19 years | 0 (0.0%) | 7 (100.0%) |
| 20 to 34 years | 689 (66.6%) | 345 (33.4%) |
| 35 to 50 years | 137 (49.8%) | 138 (50.2%) |
| Total | 826 (62.8%) | 490 (37.2%) |
Fertility by Education in Portsmouth
Average fertility rate in Portsmouth is 56.0 births per 1,000 women. Women with the education attainment of graduate degree have the highest fertility rate of 87.0 births per 1,000 women, while women with the education attainment of bachelor's degree have the lowest fertility at 14.0 births per 1,000 women. Women with the education attainment of college or associate's degree represent 60.6% of all women with births.
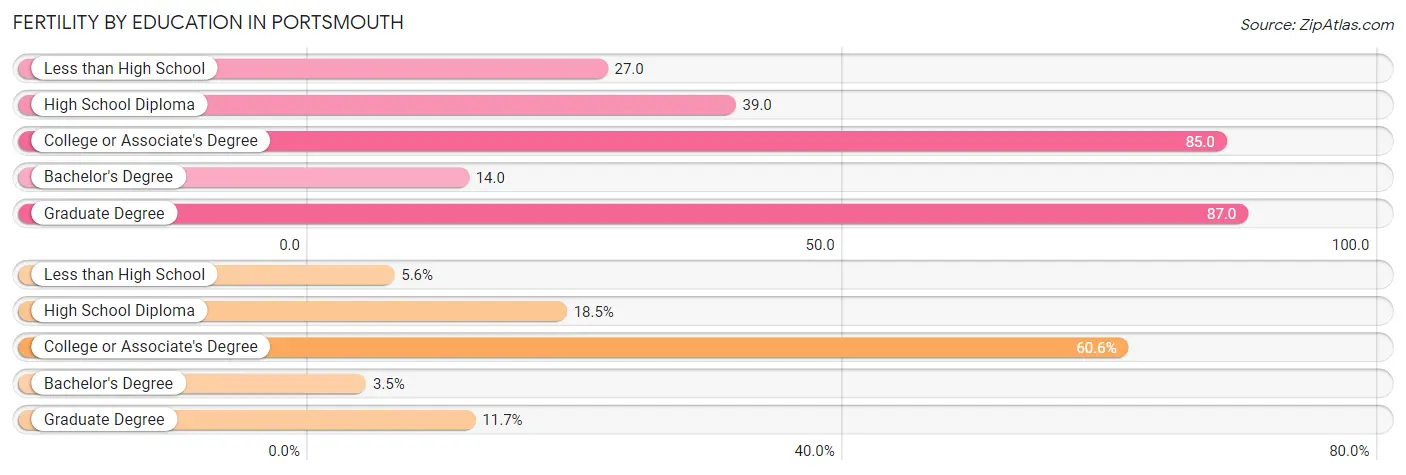
| Educational Attainment | Women with Births | Births / 1,000 Women |
| Less than High School | 74 (5.6%) | 27.0 |
| High School Diploma | 244 (18.5%) | 39.0 |
| College or Associate's Degree | 798 (60.6%) | 85.0 |
| Bachelor's Degree | 46 (3.5%) | 14.0 |
| Graduate Degree | 154 (11.7%) | 87.0 |
| Total | 1,316 (100.0%) | 56.0 |
Fertility by Education by Marriage Status in Portsmouth
37.2% of women with births in Portsmouth are unmarried. Women with the educational attainment of bachelor's degree are most likely to be married with 100.0% of them married at childbirth, while women with the educational attainment of high school diploma are least likely to be married with 51.2% of them unmarried at childbirth.
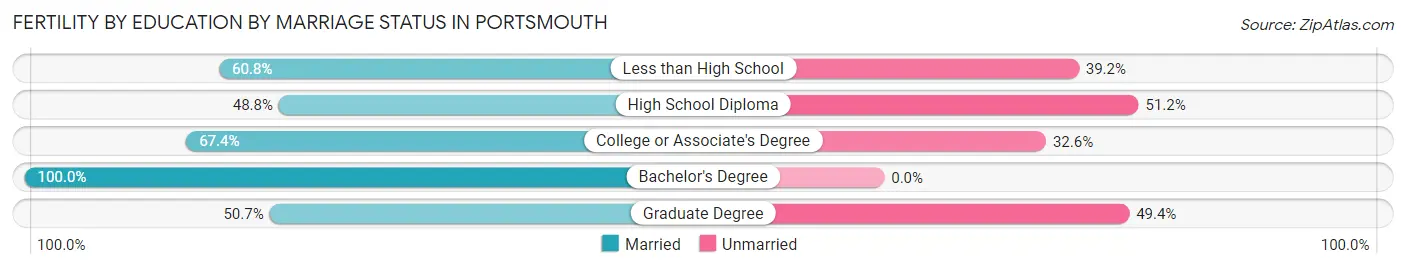
| Educational Attainment | Married | Unmarried |
| Less than High School | 45 (60.8%) | 29 (39.2%) |
| High School Diploma | 119 (48.8%) | 125 (51.2%) |
| College or Associate's Degree | 538 (67.4%) | 260 (32.6%) |
| Bachelor's Degree | 46 (100.0%) | 0 (0.0%) |
| Graduate Degree | 78 (50.6%) | 76 (49.3%) |
| Total | 826 (62.8%) | 490 (37.2%) |
Employment Characteristics in Portsmouth
Employment by Class of Employer in Portsmouth
Among the 45,028 employed individuals in Portsmouth, private company employees (25,710 | 57.1%), federal government employees (8,700 | 19.3%), and local government employees (3,295 | 7.3%) make up the most common classes of employment.
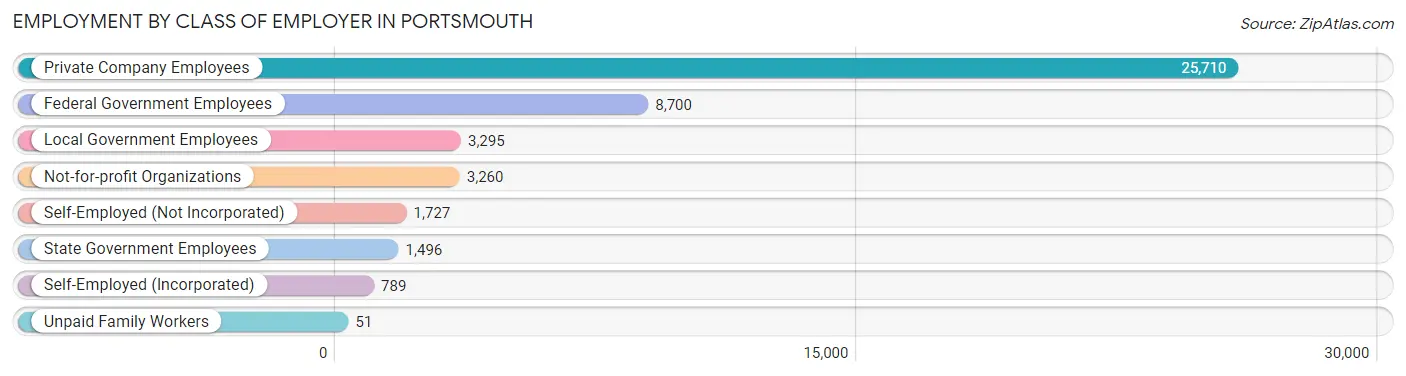
| Employer Class | # Employees | % Employees |
| Private Company Employees | 25,710 | 57.1% |
| Self-Employed (Incorporated) | 789 | 1.8% |
| Self-Employed (Not Incorporated) | 1,727 | 3.8% |
| Not-for-profit Organizations | 3,260 | 7.2% |
| Local Government Employees | 3,295 | 7.3% |
| State Government Employees | 1,496 | 3.3% |
| Federal Government Employees | 8,700 | 19.3% |
| Unpaid Family Workers | 51 | 0.1% |
| Total | 45,028 | 100.0% |
Employment Status by Age in Portsmouth
According to the labor force statistics for Portsmouth, out of the total population over 16 years of age (76,971), 63.1% or 48,569 individuals are in the labor force, with 6.6% or 3,206 of them unemployed. The age group with the highest labor force participation rate is 30 to 34 years, with 83.7% or 6,635 individuals in the labor force. Within the labor force, the 16 to 19 years age range has the highest percentage of unemployed individuals, with 32.0% or 590 of them being unemployed.
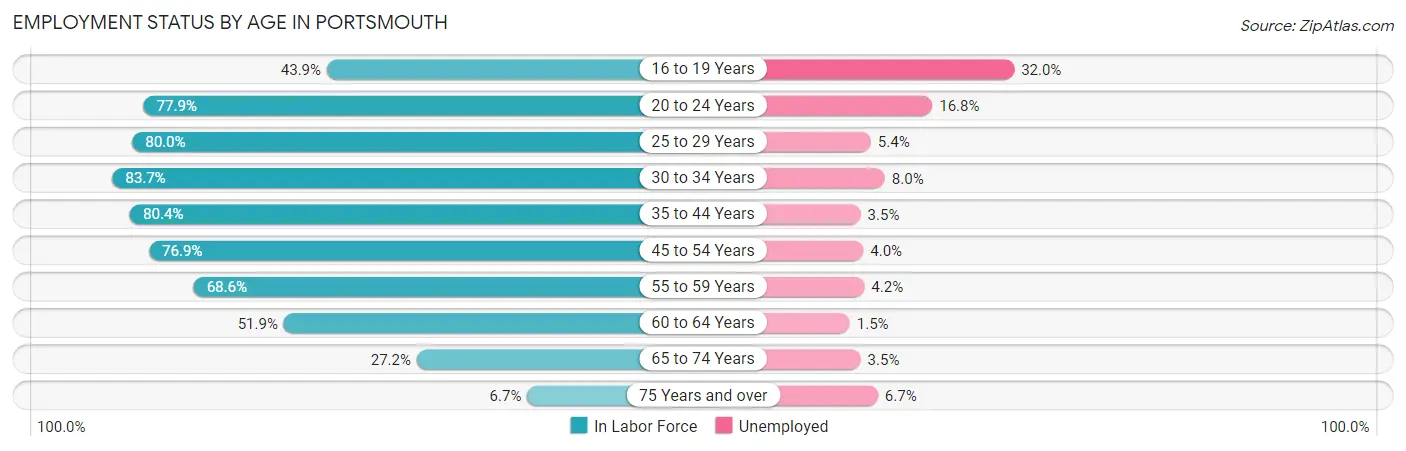
| Age Bracket | In Labor Force | Unemployed |
| 16 to 19 Years | 1,845 (43.9%) | 590 (32.0%) |
| 20 to 24 Years | 5,604 (77.9%) | 941 (16.8%) |
| 25 to 29 Years | 6,534 (80.0%) | 353 (5.4%) |
| 30 to 34 Years | 6,635 (83.7%) | 531 (8.0%) |
| 35 to 44 Years | 9,780 (80.4%) | 342 (3.5%) |
| 45 to 54 Years | 8,181 (76.9%) | 327 (4.0%) |
| 55 to 59 Years | 4,024 (68.6%) | 169 (4.2%) |
| 60 to 64 Years | 3,171 (51.9%) | 48 (1.5%) |
| 65 to 74 Years | 2,420 (27.2%) | 85 (3.5%) |
| 75 Years and over | 389 (6.7%) | 26 (6.7%) |
| Total | 48,569 (63.1%) | 3,206 (6.6%) |
Employment Status by Educational Attainment in Portsmouth
According to labor force statistics for Portsmouth, 75.3% of individuals (38,307) out of the total population between 25 and 64 years of age (50,872) are in the labor force, with 4.6% or 1,762 of them being unemployed. The group with the highest labor force participation rate are those with the educational attainment of bachelor's degree or higher, with 88.4% or 9,700 individuals in the labor force. Within the labor force, individuals with less than high school education have the highest percentage of unemployment, with 8.8% or 195 of them being unemployed.
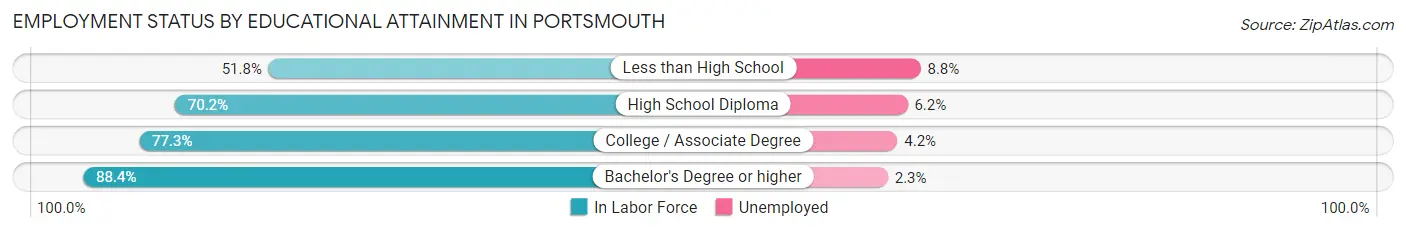
| Educational Attainment | In Labor Force | Unemployed |
| Less than High School | 2,214 (51.8%) | 376 (8.8%) |
| High School Diploma | 11,231 (70.2%) | 992 (6.2%) |
| College / Associate Degree | 15,170 (77.3%) | 824 (4.2%) |
| Bachelor's Degree or higher | 9,700 (88.4%) | 252 (2.3%) |
| Total | 38,307 (75.3%) | 2,340 (4.6%) |
Employment Occupations by Sex in Portsmouth
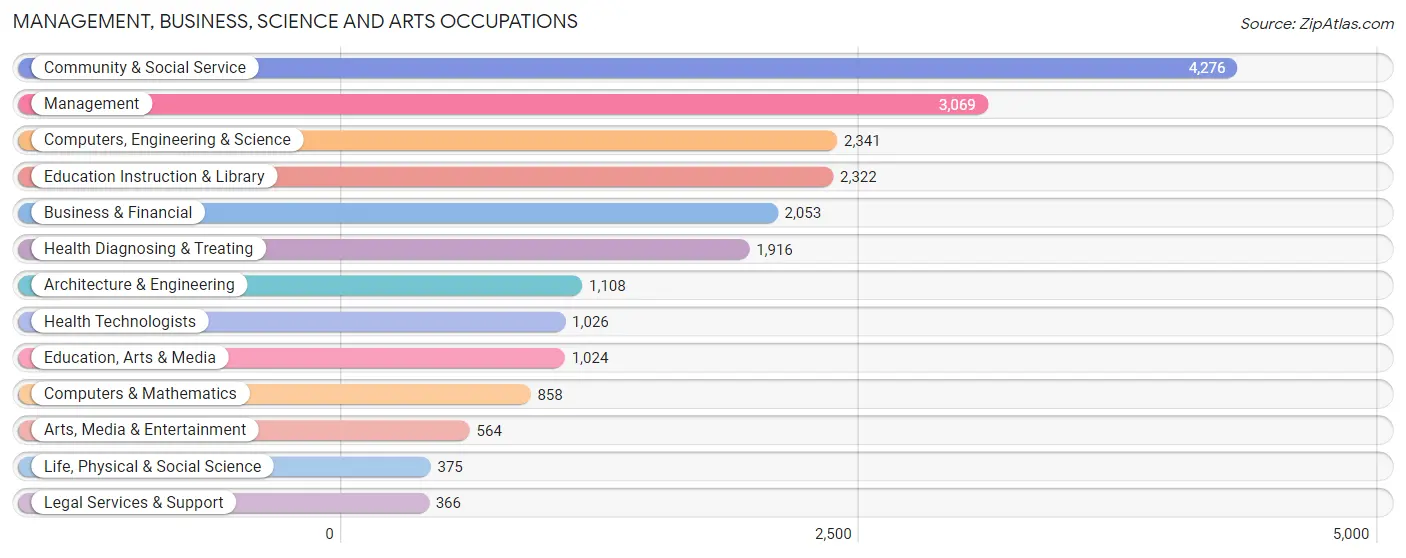
Management, Business, Science and Arts Occupations
The most common Management, Business, Science and Arts occupations in Portsmouth are Community & Social Service (4,276 | 10.2%), Management (3,069 | 7.3%), Computers, Engineering & Science (2,341 | 5.6%), Education Instruction & Library (2,322 | 5.6%), and Business & Financial (2,053 | 4.9%).
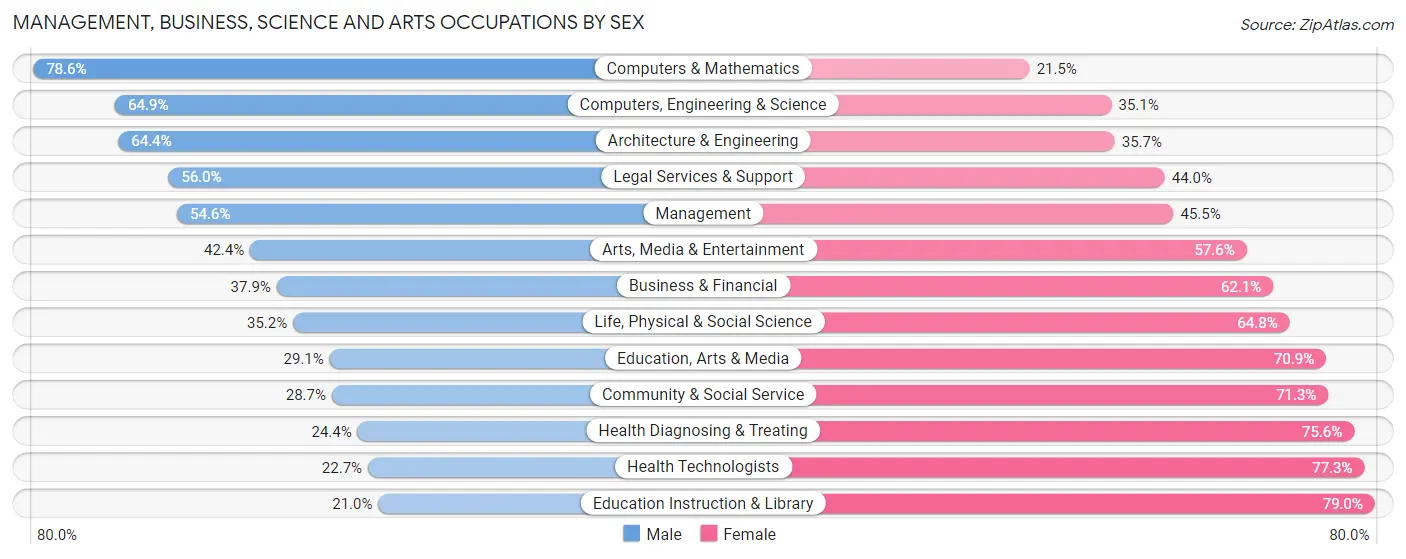
Management, Business, Science and Arts Occupations by Sex
Within the Management, Business, Science and Arts occupations in Portsmouth, the most male-oriented occupations are Computers & Mathematics (78.5%), Computers, Engineering & Science (64.9%), and Architecture & Engineering (64.3%), while the most female-oriented occupations are Education Instruction & Library (79.0%), Health Technologists (77.3%), and Health Diagnosing & Treating (75.6%).
| Occupation | Male | Female |
| Management | 1,674 (54.5%) | 1,395 (45.5%) |
| Business & Financial | 779 (37.9%) | 1,274 (62.1%) |
| Computers, Engineering & Science | 1,519 (64.9%) | 822 (35.1%) |
| Computers & Mathematics | 674 (78.5%) | 184 (21.4%) |
| Architecture & Engineering | 713 (64.3%) | 395 (35.6%) |
| Life, Physical & Social Science | 132 (35.2%) | 243 (64.8%) |
| Community & Social Service | 1,229 (28.7%) | 3,047 (71.3%) |
| Education, Arts & Media | 298 (29.1%) | 726 (70.9%) |
| Legal Services & Support | 205 (56.0%) | 161 (44.0%) |
| Education Instruction & Library | 487 (21.0%) | 1,835 (79.0%) |
| Arts, Media & Entertainment | 239 (42.4%) | 325 (57.6%) |
| Health Diagnosing & Treating | 468 (24.4%) | 1,448 (75.6%) |
| Health Technologists | 233 (22.7%) | 793 (77.3%) |
| Total (Category) | 5,669 (41.5%) | 7,986 (58.5%) |
| Total (Overall) | 20,375 (48.8%) | 21,389 (51.2%) |
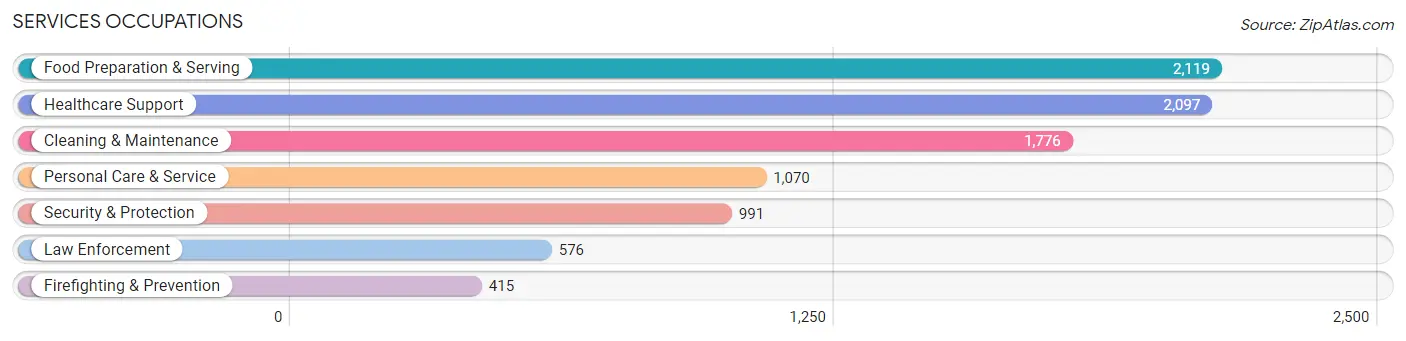
Services Occupations
The most common Services occupations in Portsmouth are Food Preparation & Serving (2,119 | 5.1%), Healthcare Support (2,097 | 5.0%), Cleaning & Maintenance (1,776 | 4.3%), Personal Care & Service (1,070 | 2.6%), and Security & Protection (991 | 2.4%).
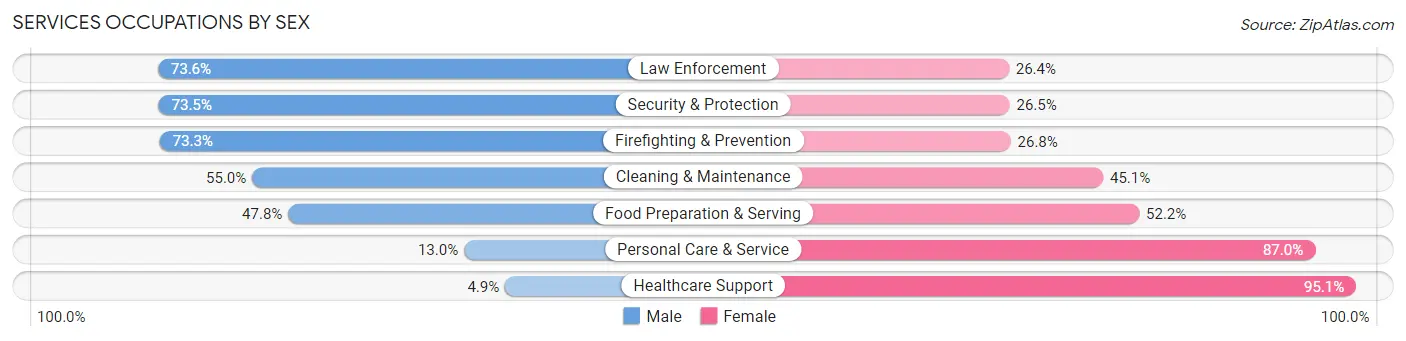
Services Occupations by Sex
Within the Services occupations in Portsmouth, the most male-oriented occupations are Law Enforcement (73.6%), Security & Protection (73.5%), and Firefighting & Prevention (73.3%), while the most female-oriented occupations are Healthcare Support (95.1%), Personal Care & Service (87.0%), and Food Preparation & Serving (52.2%).
| Occupation | Male | Female |
| Healthcare Support | 102 (4.9%) | 1,995 (95.1%) |
| Security & Protection | 728 (73.5%) | 263 (26.5%) |
| Firefighting & Prevention | 304 (73.3%) | 111 (26.8%) |
| Law Enforcement | 424 (73.6%) | 152 (26.4%) |
| Food Preparation & Serving | 1,013 (47.8%) | 1,106 (52.2%) |
| Cleaning & Maintenance | 976 (54.9%) | 800 (45.1%) |
| Personal Care & Service | 139 (13.0%) | 931 (87.0%) |
| Total (Category) | 2,958 (36.7%) | 5,095 (63.3%) |
| Total (Overall) | 20,375 (48.8%) | 21,389 (51.2%) |
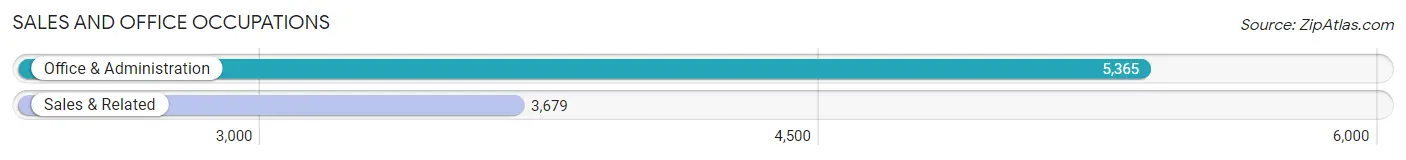
Sales and Office Occupations
The most common Sales and Office occupations in Portsmouth are Office & Administration (5,365 | 12.9%), and Sales & Related (3,679 | 8.8%).
Sales and Office Occupations by Sex
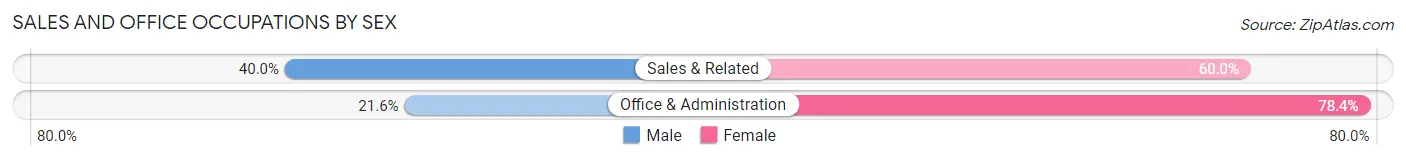
| Occupation | Male | Female |
| Sales & Related | 1,470 (40.0%) | 2,209 (60.0%) |
| Office & Administration | 1,157 (21.6%) | 4,208 (78.4%) |
| Total (Category) | 2,627 (29.0%) | 6,417 (71.0%) |
| Total (Overall) | 20,375 (48.8%) | 21,389 (51.2%) |
Natural Resources, Construction and Maintenance Occupations
The most common Natural Resources, Construction and Maintenance occupations in Portsmouth are Construction & Extraction (2,847 | 6.8%), Installation, Maintenance & Repair (1,528 | 3.7%), and Farming, Fishing & Forestry (13 | 0.0%).

Natural Resources, Construction and Maintenance Occupations by Sex
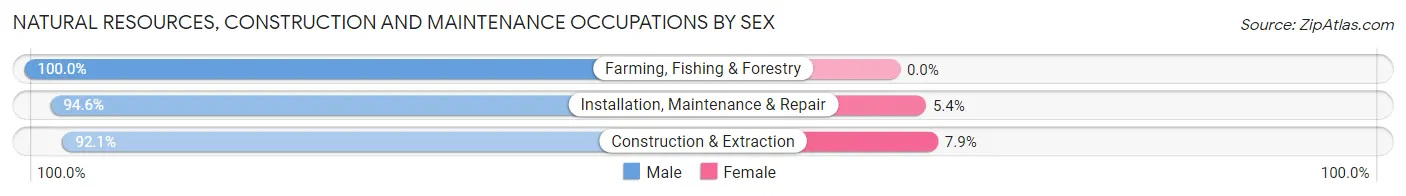
| Occupation | Male | Female |
| Farming, Fishing & Forestry | 13 (100.0%) | 0 (0.0%) |
| Construction & Extraction | 2,622 (92.1%) | 225 (7.9%) |
| Installation, Maintenance & Repair | 1,445 (94.6%) | 83 (5.4%) |
| Total (Category) | 4,080 (93.0%) | 308 (7.0%) |
| Total (Overall) | 20,375 (48.8%) | 21,389 (51.2%) |
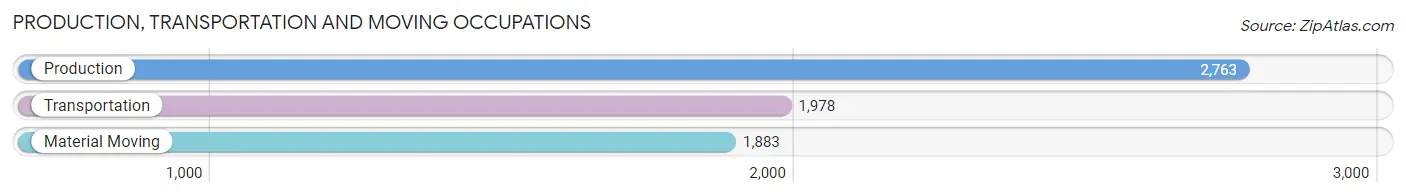
Production, Transportation and Moving Occupations
The most common Production, Transportation and Moving occupations in Portsmouth are Production (2,763 | 6.6%), Transportation (1,978 | 4.7%), and Material Moving (1,883 | 4.5%).
Production, Transportation and Moving Occupations by Sex
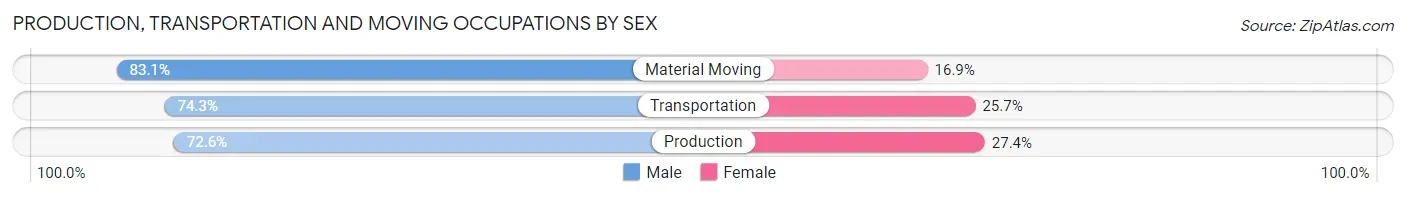
| Occupation | Male | Female |
| Production | 2,006 (72.6%) | 757 (27.4%) |
| Transportation | 1,470 (74.3%) | 508 (25.7%) |
| Material Moving | 1,565 (83.1%) | 318 (16.9%) |
| Total (Category) | 5,041 (76.1%) | 1,583 (23.9%) |
| Total (Overall) | 20,375 (48.8%) | 21,389 (51.2%) |
Employment Industries by Sex in Portsmouth
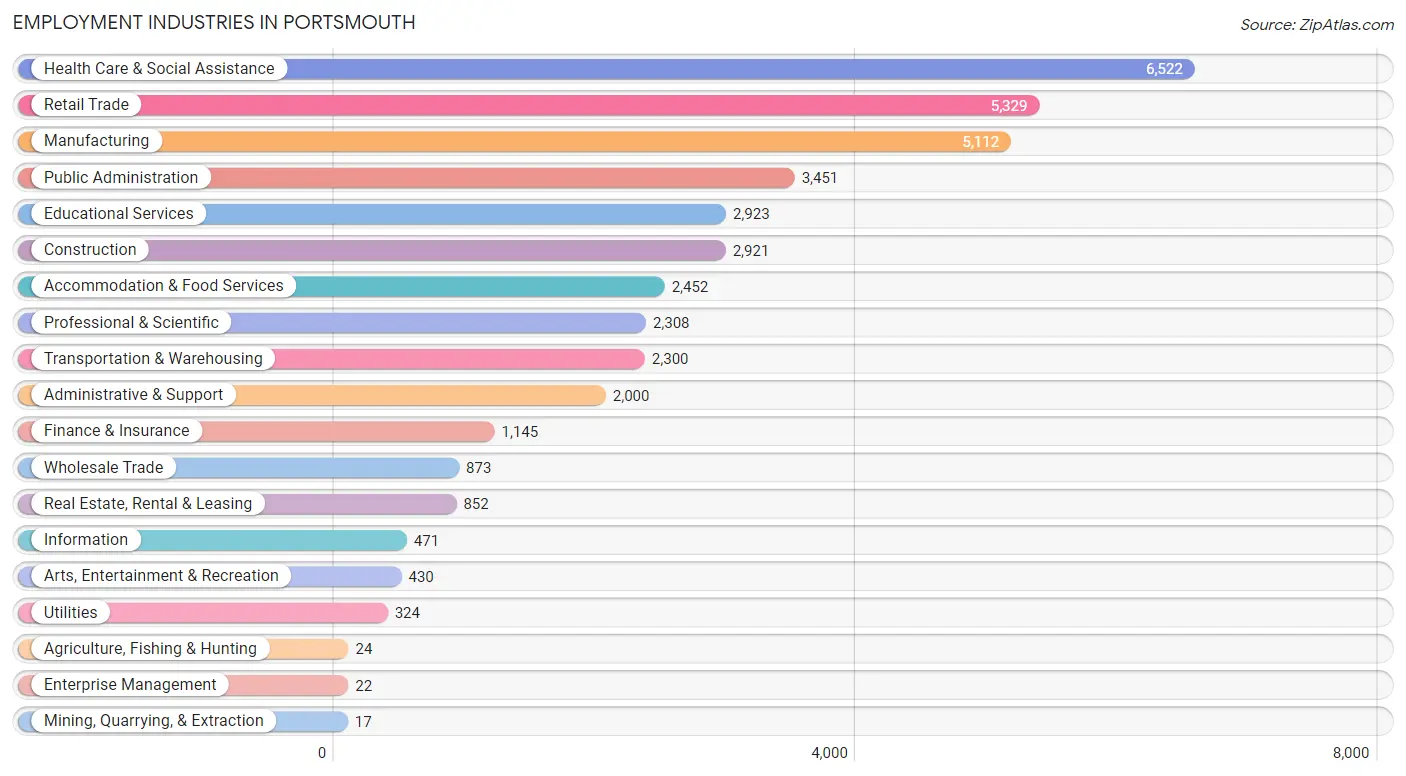
Employment Industries in Portsmouth
The major employment industries in Portsmouth include Health Care & Social Assistance (6,522 | 15.6%), Retail Trade (5,329 | 12.8%), Manufacturing (5,112 | 12.2%), Public Administration (3,451 | 8.3%), and Educational Services (2,923 | 7.0%).
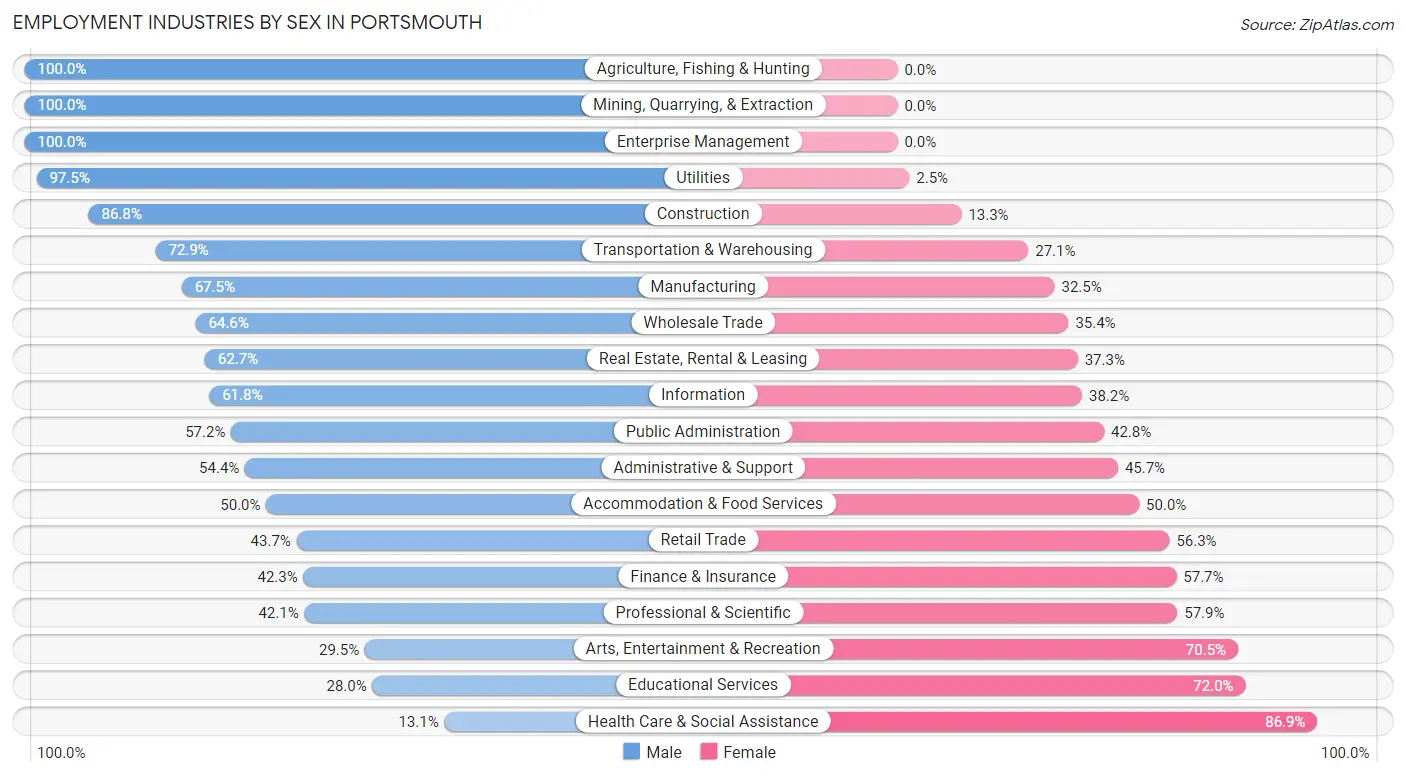
Employment Industries by Sex in Portsmouth
The Portsmouth industries that see more men than women are Agriculture, Fishing & Hunting (100.0%), Mining, Quarrying, & Extraction (100.0%), and Enterprise Management (100.0%), whereas the industries that tend to have a higher number of women are Health Care & Social Assistance (86.9%), Educational Services (72.0%), and Arts, Entertainment & Recreation (70.5%).
| Industry | Male | Female |
| Agriculture, Fishing & Hunting | 24 (100.0%) | 0 (0.0%) |
| Mining, Quarrying, & Extraction | 17 (100.0%) | 0 (0.0%) |
| Construction | 2,534 (86.8%) | 387 (13.3%) |
| Manufacturing | 3,449 (67.5%) | 1,663 (32.5%) |
| Wholesale Trade | 564 (64.6%) | 309 (35.4%) |
| Retail Trade | 2,328 (43.7%) | 3,001 (56.3%) |
| Transportation & Warehousing | 1,677 (72.9%) | 623 (27.1%) |
| Utilities | 316 (97.5%) | 8 (2.5%) |
| Information | 291 (61.8%) | 180 (38.2%) |
| Finance & Insurance | 484 (42.3%) | 661 (57.7%) |
| Real Estate, Rental & Leasing | 534 (62.7%) | 318 (37.3%) |
| Professional & Scientific | 971 (42.1%) | 1,337 (57.9%) |
| Enterprise Management | 22 (100.0%) | 0 (0.0%) |
| Administrative & Support | 1,087 (54.3%) | 913 (45.7%) |
| Educational Services | 818 (28.0%) | 2,105 (72.0%) |
| Health Care & Social Assistance | 854 (13.1%) | 5,668 (86.9%) |
| Arts, Entertainment & Recreation | 127 (29.5%) | 303 (70.5%) |
| Accommodation & Food Services | 1,225 (50.0%) | 1,227 (50.0%) |
| Public Administration | 1,975 (57.2%) | 1,476 (42.8%) |
| Total | 20,375 (48.8%) | 21,389 (51.2%) |
Education in Portsmouth
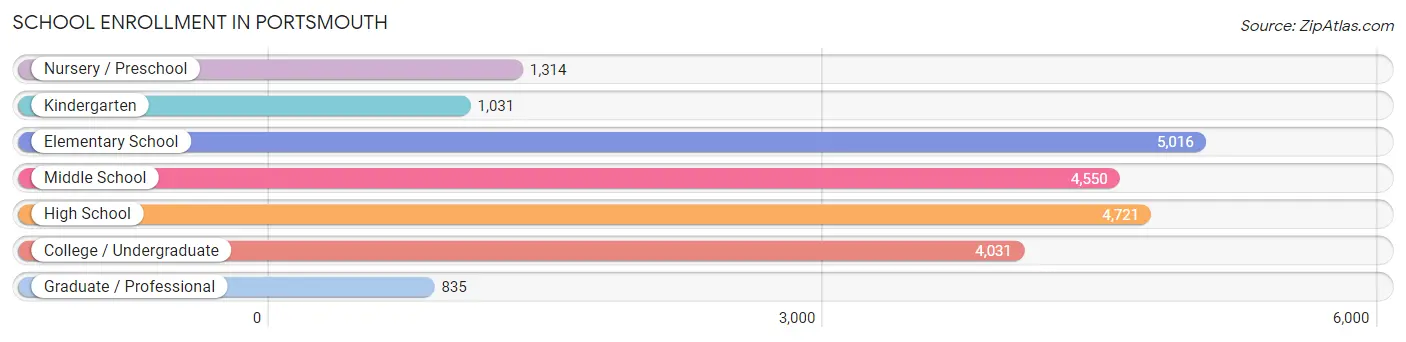
School Enrollment in Portsmouth
The most common levels of schooling among the 21,498 students in Portsmouth are elementary school (5,016 | 23.3%), high school (4,721 | 22.0%), and middle school (4,550 | 21.2%).
| School Level | # Students | % Students |
| Nursery / Preschool | 1,314 | 6.1% |
| Kindergarten | 1,031 | 4.8% |
| Elementary School | 5,016 | 23.3% |
| Middle School | 4,550 | 21.2% |
| High School | 4,721 | 22.0% |
| College / Undergraduate | 4,031 | 18.8% |
| Graduate / Professional | 835 | 3.9% |
| Total | 21,498 | 100.0% |
School Enrollment by Age by Funding Source in Portsmouth
Out of a total of 21,498 students who are enrolled in schools in Portsmouth, 3,397 (15.8%) attend a private institution, while the remaining 18,101 (84.2%) are enrolled in public schools. The age group of 25 to 34 year olds has the highest likelihood of being enrolled in private schools, with 499 (30.4% in the age bracket) enrolled. Conversely, the age group of 10 to 14 year olds has the lowest likelihood of being enrolled in a private school, with 5,707 (91.9% in the age bracket) attending a public institution.
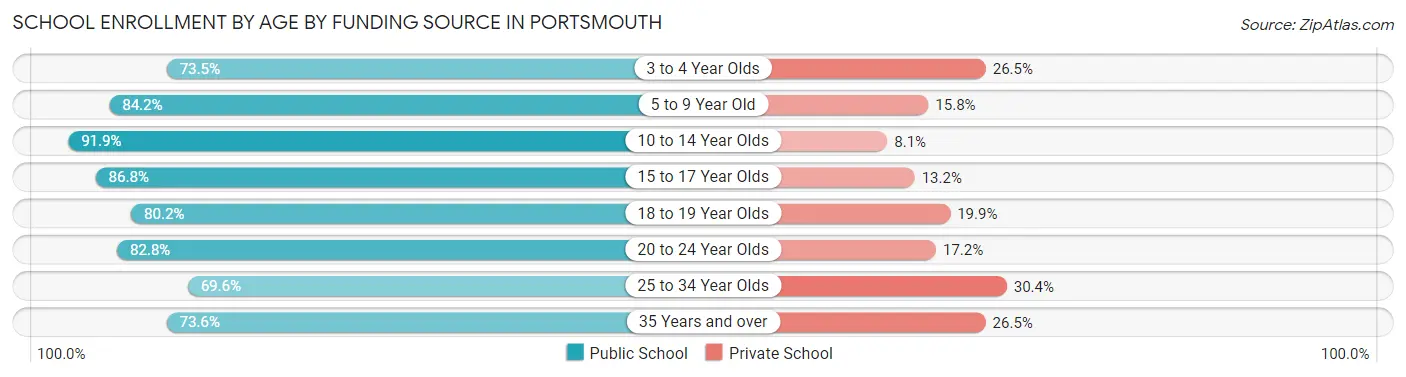
| Age Bracket | Public School | Private School |
| 3 to 4 Year Olds | 755 (73.5%) | 272 (26.5%) |
| 5 to 9 Year Old | 4,711 (84.2%) | 883 (15.8%) |
| 10 to 14 Year Olds | 5,707 (91.9%) | 505 (8.1%) |
| 15 to 17 Year Olds | 2,647 (86.8%) | 404 (13.2%) |
| 18 to 19 Year Olds | 852 (80.1%) | 211 (19.9%) |
| 20 to 24 Year Olds | 1,366 (82.8%) | 284 (17.2%) |
| 25 to 34 Year Olds | 1,143 (69.6%) | 499 (30.4%) |
| 35 Years and over | 926 (73.6%) | 333 (26.5%) |
| Total | 18,101 (84.2%) | 3,397 (15.8%) |
Educational Attainment by Field of Study in Portsmouth
Business (2,253 | 15.1%), education (2,017 | 13.5%), science & technology (1,461 | 9.8%), social sciences (1,241 | 8.3%), and arts & humanities (1,223 | 8.2%) are the most common fields of study among 14,947 individuals in Portsmouth who have obtained a bachelor's degree or higher.
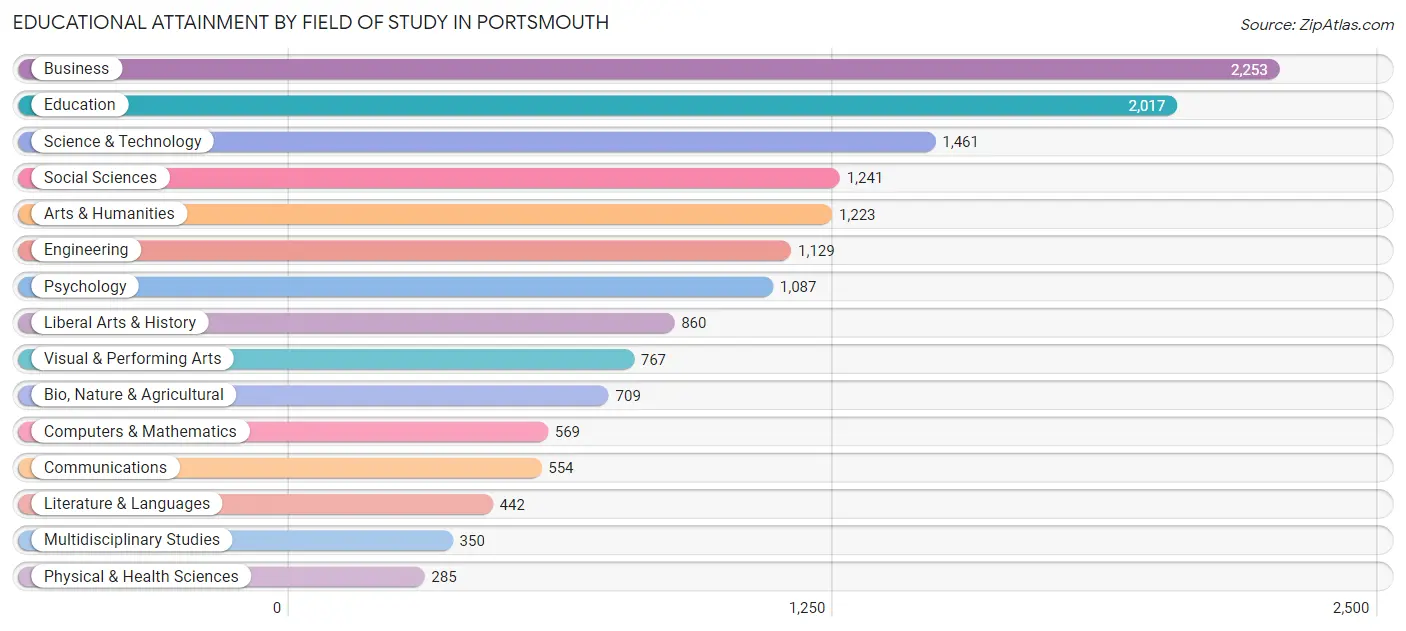
| Field of Study | # Graduates | % Graduates |
| Computers & Mathematics | 569 | 3.8% |
| Bio, Nature & Agricultural | 709 | 4.7% |
| Physical & Health Sciences | 285 | 1.9% |
| Psychology | 1,087 | 7.3% |
| Social Sciences | 1,241 | 8.3% |
| Engineering | 1,129 | 7.5% |
| Multidisciplinary Studies | 350 | 2.3% |
| Science & Technology | 1,461 | 9.8% |
| Business | 2,253 | 15.1% |
| Education | 2,017 | 13.5% |
| Literature & Languages | 442 | 3.0% |
| Liberal Arts & History | 860 | 5.8% |
| Visual & Performing Arts | 767 | 5.1% |
| Communications | 554 | 3.7% |
| Arts & Humanities | 1,223 | 8.2% |
| Total | 14,947 | 100.0% |
Transportation & Commute in Portsmouth
Vehicle Availability by Sex in Portsmouth
The most prevalent vehicle ownership categories in Portsmouth are males with 2 vehicles (9,007, accounting for 40.9%) and females with 2 vehicles (7,945, making up 41.4%).
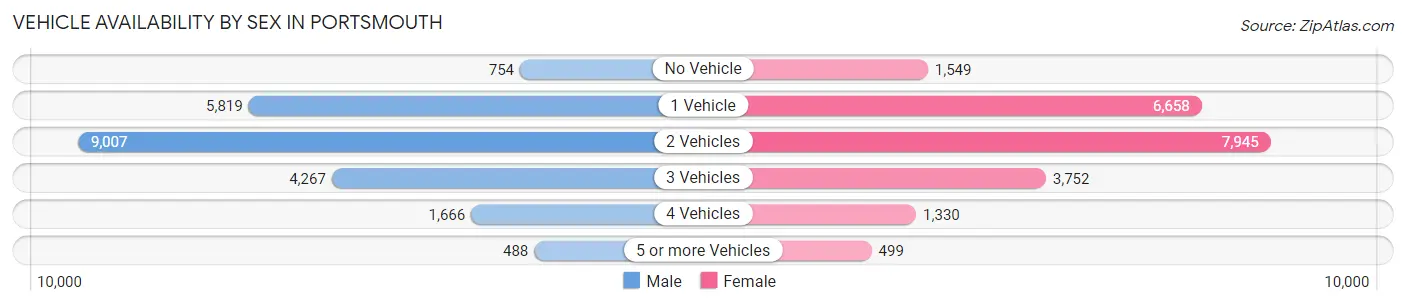
| Vehicles Available | Male | Female |
| No Vehicle | 754 (3.4%) | 1,549 (7.1%) |
| 1 Vehicle | 5,819 (26.5%) | 6,658 (30.6%) |
| 2 Vehicles | 9,007 (40.9%) | 7,945 (36.6%) |
| 3 Vehicles | 4,267 (19.4%) | 3,752 (17.3%) |
| 4 Vehicles | 1,666 (7.6%) | 1,330 (6.1%) |
| 5 or more Vehicles | 488 (2.2%) | 499 (2.3%) |
| Total | 22,001 (100.0%) | 21,733 (100.0%) |
Commute Time in Portsmouth
The most frequently occuring commute durations in Portsmouth are 15 to 19 minutes (7,720 commuters, 18.4%), 30 to 34 minutes (7,632 commuters, 18.1%), and 10 to 14 minutes (6,593 commuters, 15.7%).
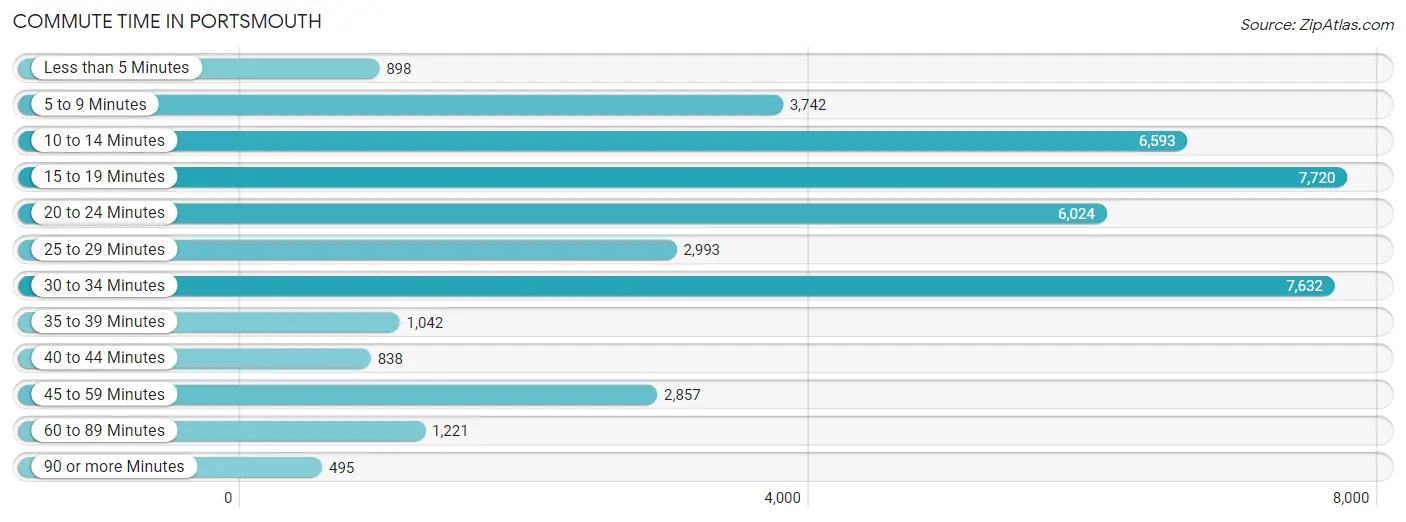
| Commute Time | # Commuters | % Commuters |
| Less than 5 Minutes | 898 | 2.1% |
| 5 to 9 Minutes | 3,742 | 8.9% |
| 10 to 14 Minutes | 6,593 | 15.7% |
| 15 to 19 Minutes | 7,720 | 18.4% |
| 20 to 24 Minutes | 6,024 | 14.3% |
| 25 to 29 Minutes | 2,993 | 7.1% |
| 30 to 34 Minutes | 7,632 | 18.1% |
| 35 to 39 Minutes | 1,042 | 2.5% |
| 40 to 44 Minutes | 838 | 2.0% |
| 45 to 59 Minutes | 2,857 | 6.8% |
| 60 to 89 Minutes | 1,221 | 2.9% |
| 90 or more Minutes | 495 | 1.2% |
Commute Time by Sex in Portsmouth
The most common commute times in Portsmouth are 15 to 19 minutes (4,407 commuters, 20.1%) for males and 30 to 34 minutes (4,018 commuters, 19.9%) for females.
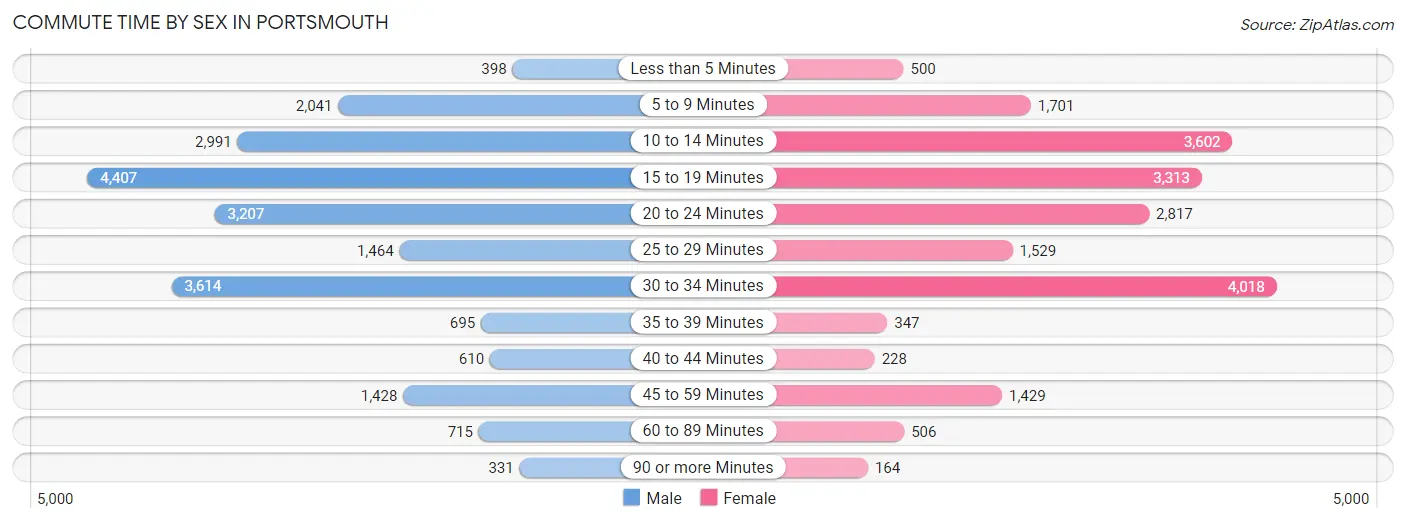
| Commute Time | Male | Female |
| Less than 5 Minutes | 398 (1.8%) | 500 (2.5%) |
| 5 to 9 Minutes | 2,041 (9.3%) | 1,701 (8.4%) |
| 10 to 14 Minutes | 2,991 (13.7%) | 3,602 (17.9%) |
| 15 to 19 Minutes | 4,407 (20.1%) | 3,313 (16.4%) |
| 20 to 24 Minutes | 3,207 (14.6%) | 2,817 (14.0%) |
| 25 to 29 Minutes | 1,464 (6.7%) | 1,529 (7.6%) |
| 30 to 34 Minutes | 3,614 (16.5%) | 4,018 (19.9%) |
| 35 to 39 Minutes | 695 (3.2%) | 347 (1.7%) |
| 40 to 44 Minutes | 610 (2.8%) | 228 (1.1%) |
| 45 to 59 Minutes | 1,428 (6.5%) | 1,429 (7.1%) |
| 60 to 89 Minutes | 715 (3.3%) | 506 (2.5%) |
| 90 or more Minutes | 331 (1.5%) | 164 (0.8%) |
Time of Departure to Work by Sex in Portsmouth
The most frequent times of departure to work in Portsmouth are 6:30 AM to 6:59 AM (3,407, 15.6%) for males and 7:30 AM to 7:59 AM (2,211, 11.0%) for females.
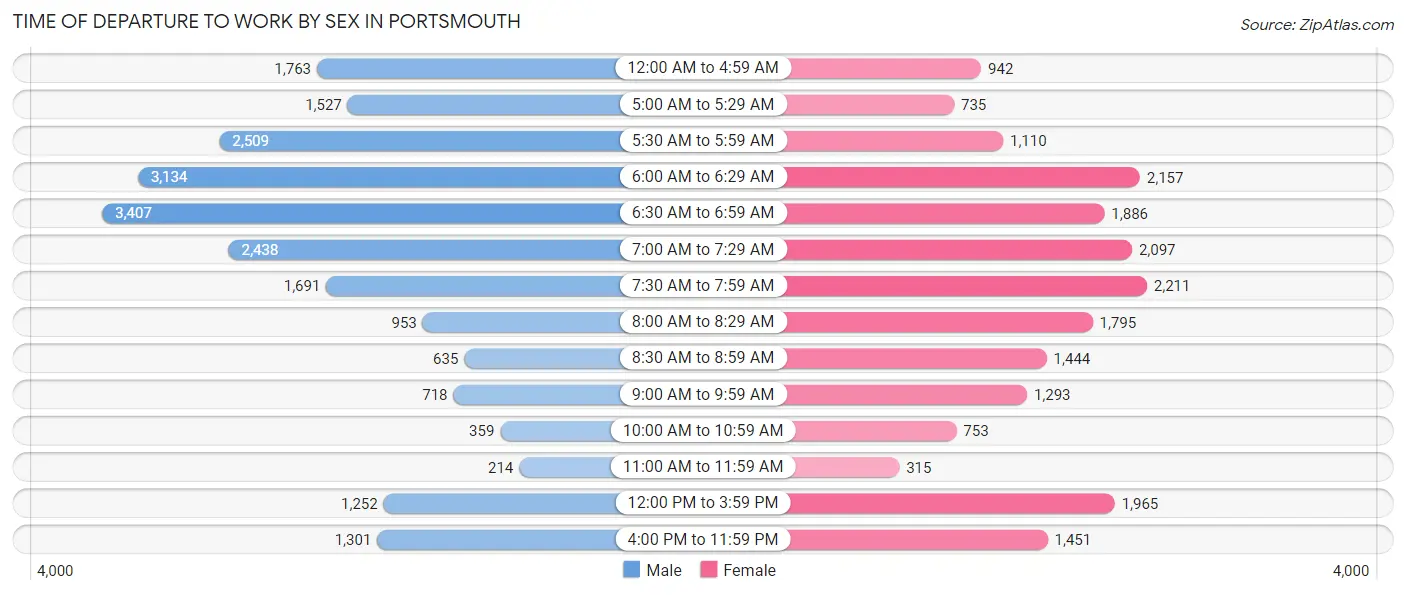
| Time of Departure | Male | Female |
| 12:00 AM to 4:59 AM | 1,763 (8.1%) | 942 (4.7%) |
| 5:00 AM to 5:29 AM | 1,527 (7.0%) | 735 (3.6%) |
| 5:30 AM to 5:59 AM | 2,509 (11.5%) | 1,110 (5.5%) |
| 6:00 AM to 6:29 AM | 3,134 (14.3%) | 2,157 (10.7%) |
| 6:30 AM to 6:59 AM | 3,407 (15.6%) | 1,886 (9.4%) |
| 7:00 AM to 7:29 AM | 2,438 (11.1%) | 2,097 (10.4%) |
| 7:30 AM to 7:59 AM | 1,691 (7.7%) | 2,211 (11.0%) |
| 8:00 AM to 8:29 AM | 953 (4.3%) | 1,795 (8.9%) |
| 8:30 AM to 8:59 AM | 635 (2.9%) | 1,444 (7.2%) |
| 9:00 AM to 9:59 AM | 718 (3.3%) | 1,293 (6.4%) |
| 10:00 AM to 10:59 AM | 359 (1.6%) | 753 (3.7%) |
| 11:00 AM to 11:59 AM | 214 (1.0%) | 315 (1.6%) |
| 12:00 PM to 3:59 PM | 1,252 (5.7%) | 1,965 (9.8%) |
| 4:00 PM to 11:59 PM | 1,301 (5.9%) | 1,451 (7.2%) |
| Total | 21,901 (100.0%) | 20,154 (100.0%) |
Housing Occupancy in Portsmouth
Occupancy by Ownership in Portsmouth
Of the total 38,962 dwellings in Portsmouth, owner-occupied units account for 21,839 (56.0%), while renter-occupied units make up 17,123 (44.0%).
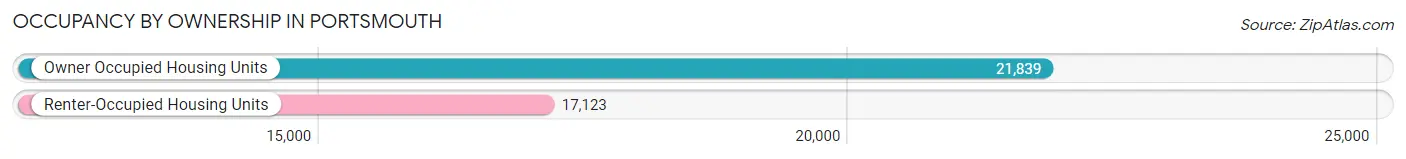
| Occupancy | # Housing Units | % Housing Units |
| Owner Occupied Housing Units | 21,839 | 56.0% |
| Renter-Occupied Housing Units | 17,123 | 44.0% |
| Total Occupied Housing Units | 38,962 | 100.0% |
Occupancy by Household Size in Portsmouth
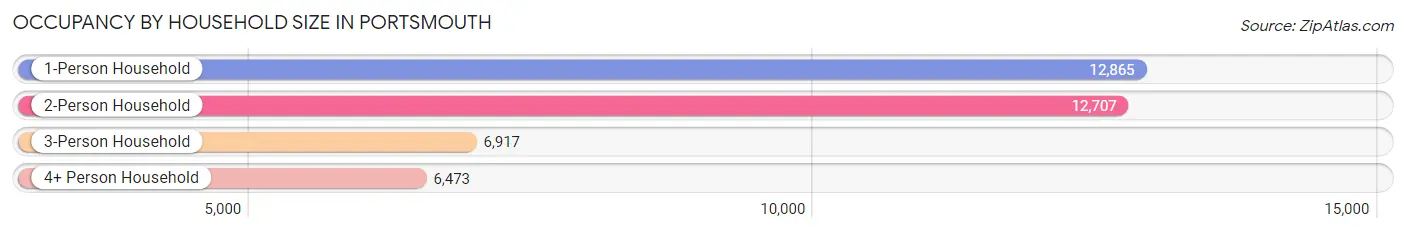
| Household Size | # Housing Units | % Housing Units |
| 1-Person Household | 12,865 | 33.0% |
| 2-Person Household | 12,707 | 32.6% |
| 3-Person Household | 6,917 | 17.7% |
| 4+ Person Household | 6,473 | 16.6% |
| Total Housing Units | 38,962 | 100.0% |
Occupancy by Ownership by Household Size in Portsmouth
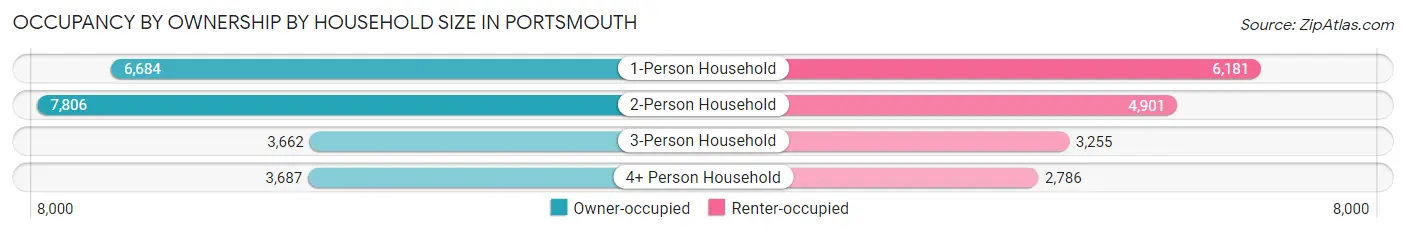
| Household Size | Owner-occupied | Renter-occupied |
| 1-Person Household | 6,684 (51.9%) | 6,181 (48.0%) |
| 2-Person Household | 7,806 (61.4%) | 4,901 (38.6%) |
| 3-Person Household | 3,662 (52.9%) | 3,255 (47.1%) |
| 4+ Person Household | 3,687 (57.0%) | 2,786 (43.0%) |
| Total Housing Units | 21,839 (56.0%) | 17,123 (44.0%) |
Occupancy by Educational Attainment in Portsmouth
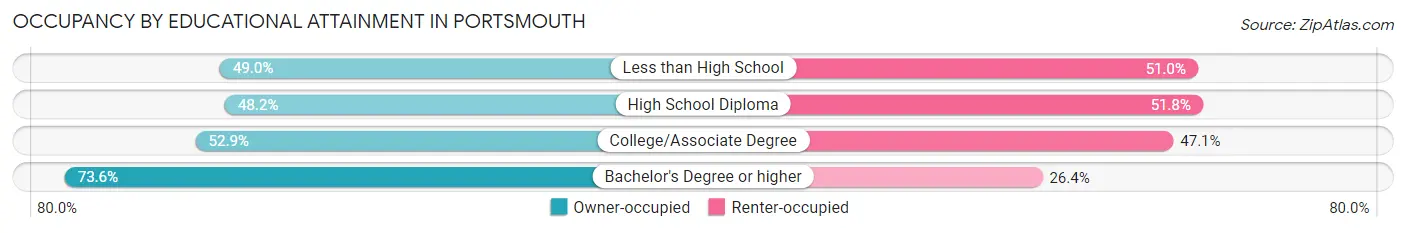
| Household Size | Owner-occupied | Renter-occupied |
| Less than High School | 1,747 (49.0%) | 1,818 (51.0%) |
| High School Diploma | 5,433 (48.2%) | 5,837 (51.8%) |
| College/Associate Degree | 7,904 (52.9%) | 7,048 (47.1%) |
| Bachelor's Degree or higher | 6,755 (73.6%) | 2,420 (26.4%) |
Occupancy by Age of Householder in Portsmouth
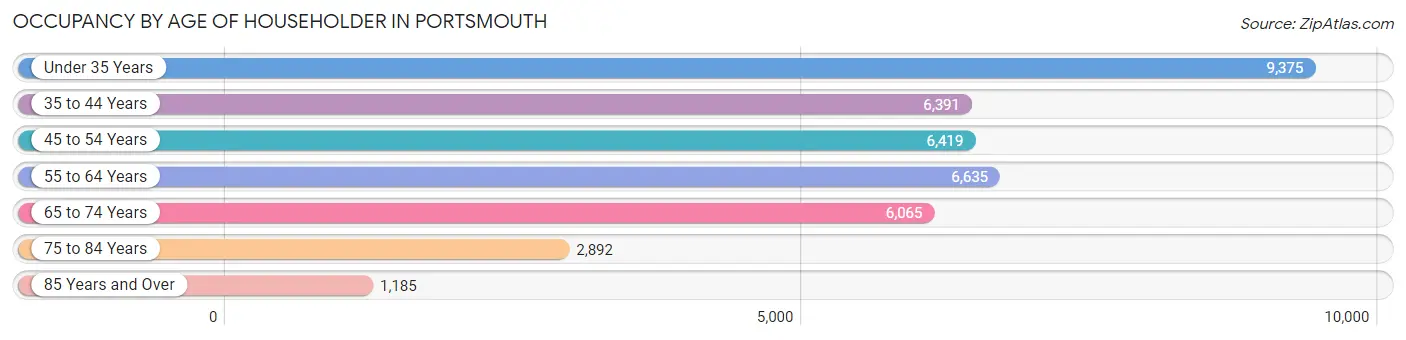
| Age Bracket | # Households | % Households |
| Under 35 Years | 9,375 | 24.1% |
| 35 to 44 Years | 6,391 | 16.4% |
| 45 to 54 Years | 6,419 | 16.5% |
| 55 to 64 Years | 6,635 | 17.0% |
| 65 to 74 Years | 6,065 | 15.6% |
| 75 to 84 Years | 2,892 | 7.4% |
| 85 Years and Over | 1,185 | 3.0% |
| Total | 38,962 | 100.0% |
Housing Finances in Portsmouth
Median Income by Occupancy in Portsmouth
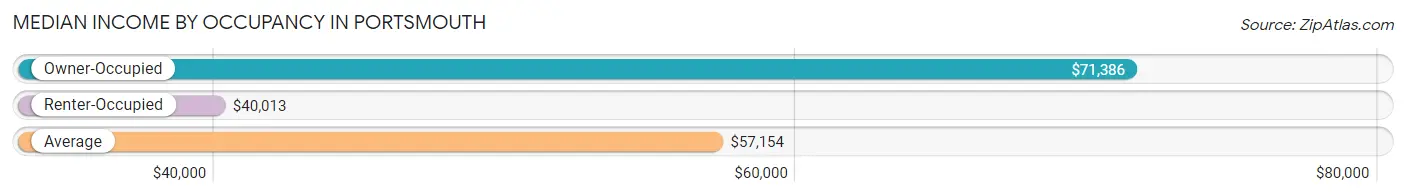
| Occupancy Type | # Households | Median Income |
| Owner-Occupied | 21,839 (56.0%) | $71,386 |
| Renter-Occupied | 17,123 (44.0%) | $40,013 |
| Average | 38,962 (100.0%) | $57,154 |
Occupancy by Householder Income Bracket in Portsmouth
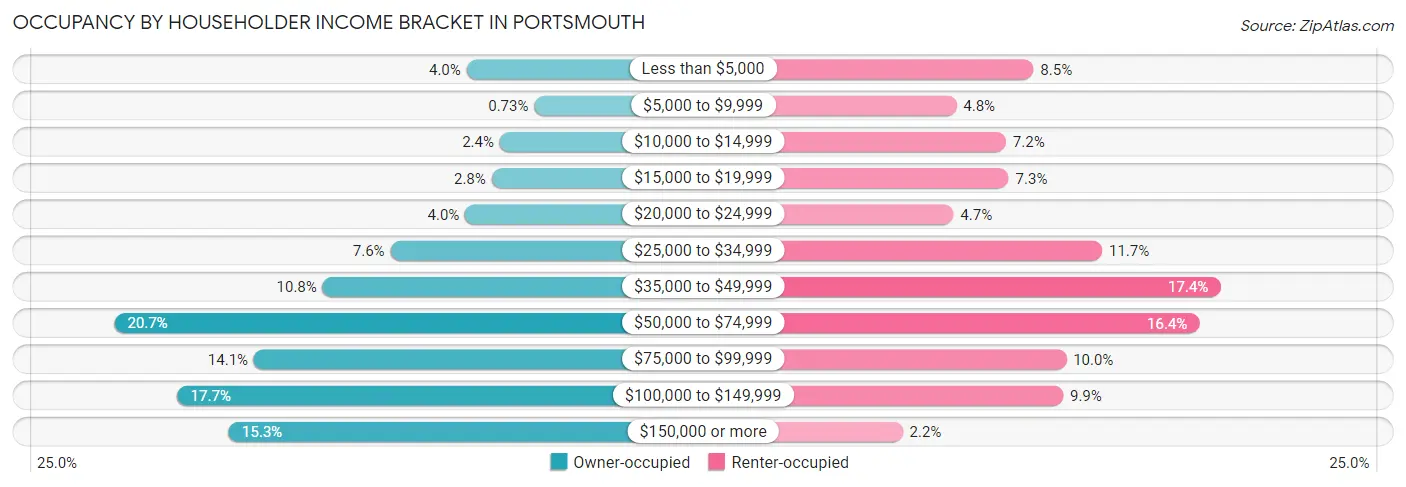
| Income Bracket | Owner-occupied | Renter-occupied |
| Less than $5,000 | 863 (4.0%) | 1,451 (8.5%) |
| $5,000 to $9,999 | 160 (0.7%) | 822 (4.8%) |
| $10,000 to $14,999 | 518 (2.4%) | 1,226 (7.2%) |
| $15,000 to $19,999 | 602 (2.8%) | 1,248 (7.3%) |
| $20,000 to $24,999 | 877 (4.0%) | 798 (4.7%) |
| $25,000 to $34,999 | 1,656 (7.6%) | 2,011 (11.7%) |
| $35,000 to $49,999 | 2,361 (10.8%) | 2,973 (17.4%) |
| $50,000 to $74,999 | 4,526 (20.7%) | 2,801 (16.4%) |
| $75,000 to $99,999 | 3,075 (14.1%) | 1,718 (10.0%) |
| $100,000 to $149,999 | 3,867 (17.7%) | 1,691 (9.9%) |
| $150,000 or more | 3,334 (15.3%) | 384 (2.2%) |
| Total | 21,839 (100.0%) | 17,123 (100.0%) |
Monthly Housing Cost Tiers in Portsmouth
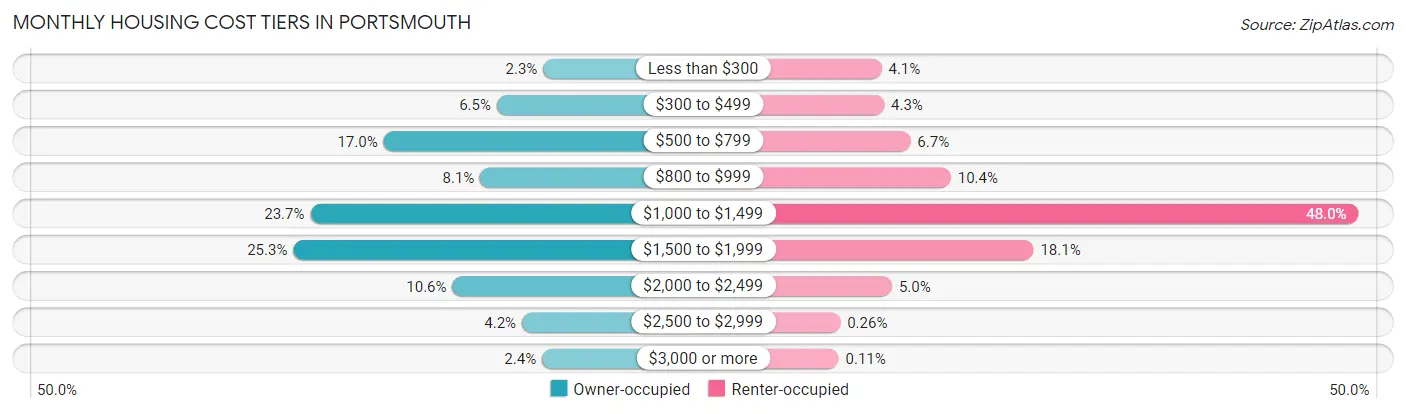
| Monthly Cost | Owner-occupied | Renter-occupied |
| Less than $300 | 494 (2.3%) | 696 (4.1%) |
| $300 to $499 | 1,426 (6.5%) | 736 (4.3%) |
| $500 to $799 | 3,704 (17.0%) | 1,151 (6.7%) |
| $800 to $999 | 1,761 (8.1%) | 1,788 (10.4%) |
| $1,000 to $1,499 | 5,176 (23.7%) | 8,212 (48.0%) |
| $1,500 to $1,999 | 5,519 (25.3%) | 3,090 (18.0%) |
| $2,000 to $2,499 | 2,319 (10.6%) | 859 (5.0%) |
| $2,500 to $2,999 | 922 (4.2%) | 44 (0.3%) |
| $3,000 or more | 518 (2.4%) | 18 (0.1%) |
| Total | 21,839 (100.0%) | 17,123 (100.0%) |
Physical Housing Characteristics in Portsmouth
Housing Structures in Portsmouth
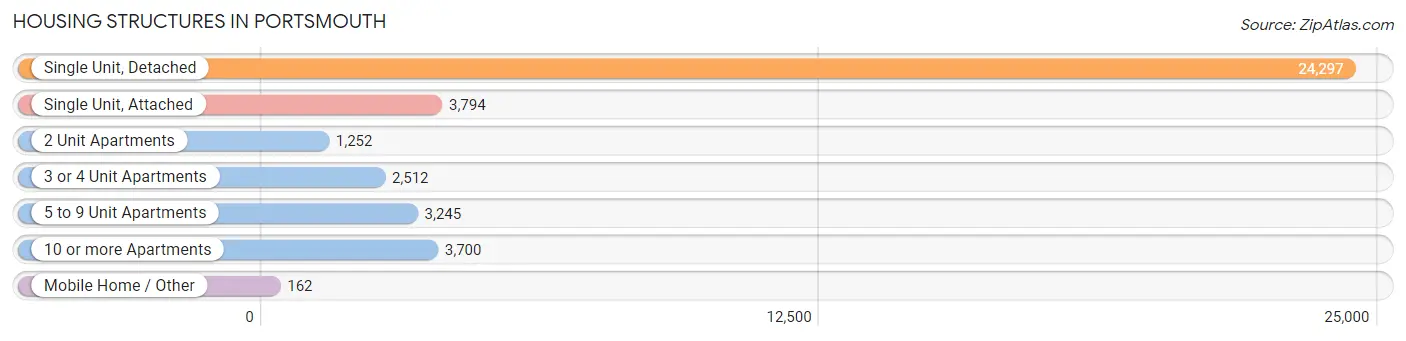
| Structure Type | # Housing Units | % Housing Units |
| Single Unit, Detached | 24,297 | 62.4% |
| Single Unit, Attached | 3,794 | 9.7% |
| 2 Unit Apartments | 1,252 | 3.2% |
| 3 or 4 Unit Apartments | 2,512 | 6.5% |
| 5 to 9 Unit Apartments | 3,245 | 8.3% |
| 10 or more Apartments | 3,700 | 9.5% |
| Mobile Home / Other | 162 | 0.4% |
| Total | 38,962 | 100.0% |
Housing Structures by Occupancy in Portsmouth
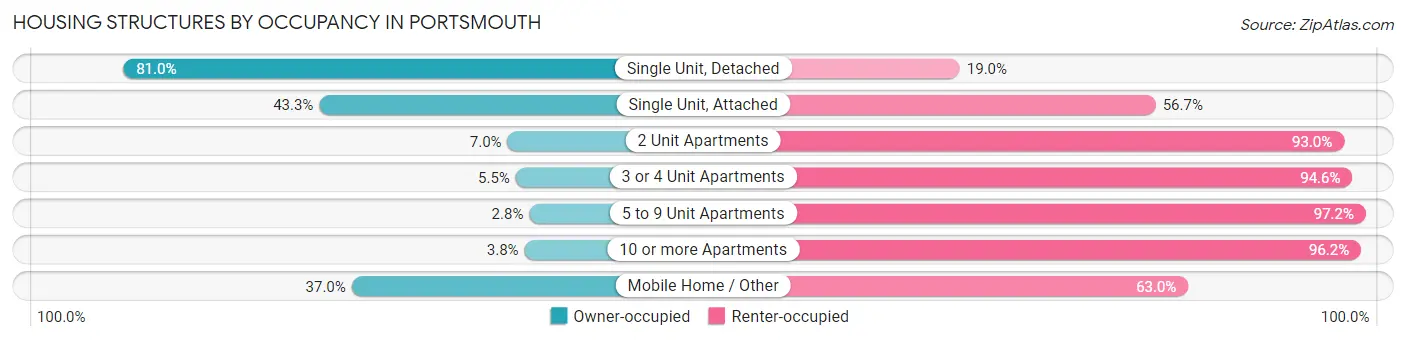
| Structure Type | Owner-occupied | Renter-occupied |
| Single Unit, Detached | 19,681 (81.0%) | 4,616 (19.0%) |
| Single Unit, Attached | 1,642 (43.3%) | 2,152 (56.7%) |
| 2 Unit Apartments | 88 (7.0%) | 1,164 (93.0%) |
| 3 or 4 Unit Apartments | 137 (5.4%) | 2,375 (94.6%) |
| 5 to 9 Unit Apartments | 92 (2.8%) | 3,153 (97.2%) |
| 10 or more Apartments | 139 (3.8%) | 3,561 (96.2%) |
| Mobile Home / Other | 60 (37.0%) | 102 (63.0%) |
| Total | 21,839 (56.0%) | 17,123 (44.0%) |
Housing Structures by Number of Rooms in Portsmouth
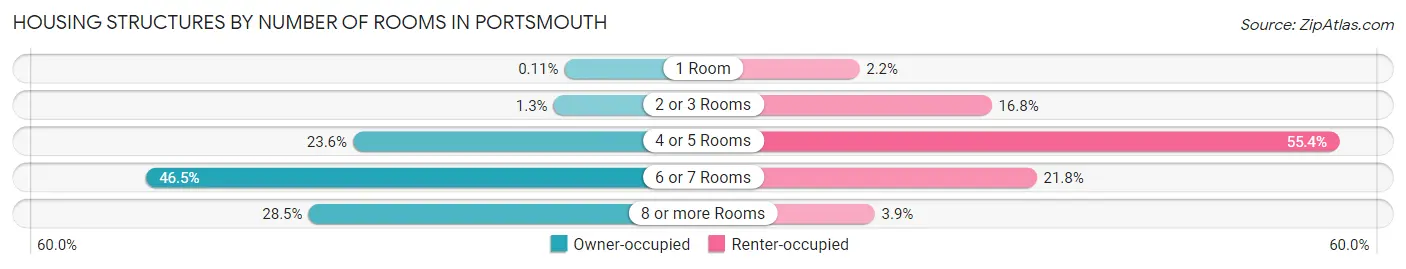
| Number of Rooms | Owner-occupied | Renter-occupied |
| 1 Room | 23 (0.1%) | 368 (2.1%) |
| 2 or 3 Rooms | 286 (1.3%) | 2,880 (16.8%) |
| 4 or 5 Rooms | 5,147 (23.6%) | 9,479 (55.4%) |
| 6 or 7 Rooms | 10,156 (46.5%) | 3,737 (21.8%) |
| 8 or more Rooms | 6,227 (28.5%) | 659 (3.8%) |
| Total | 21,839 (100.0%) | 17,123 (100.0%) |
Housing Structure by Heating Type in Portsmouth
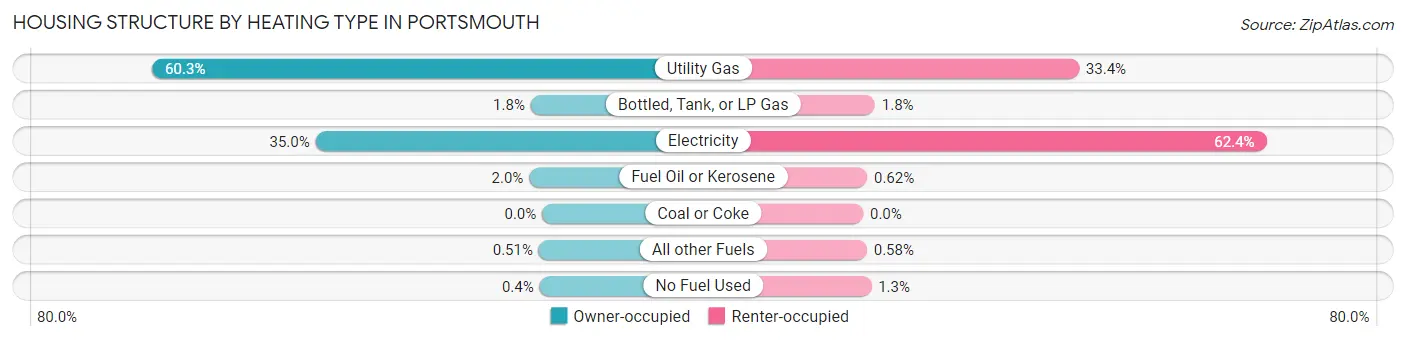
| Heating Type | Owner-occupied | Renter-occupied |
| Utility Gas | 13,169 (60.3%) | 5,714 (33.4%) |
| Bottled, Tank, or LP Gas | 384 (1.8%) | 311 (1.8%) |
| Electricity | 7,651 (35.0%) | 10,676 (62.4%) |
| Fuel Oil or Kerosene | 437 (2.0%) | 107 (0.6%) |
| Coal or Coke | 0 (0.0%) | 0 (0.0%) |
| All other Fuels | 111 (0.5%) | 99 (0.6%) |
| No Fuel Used | 87 (0.4%) | 216 (1.3%) |
| Total | 21,839 (100.0%) | 17,123 (100.0%) |
Household Vehicle Usage in Portsmouth
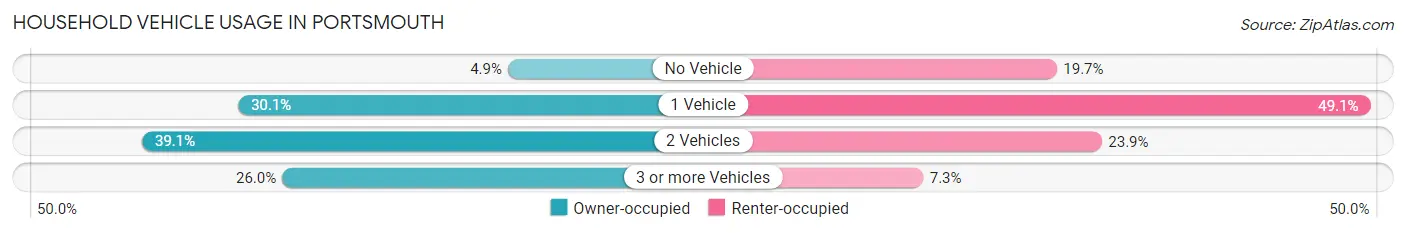
| Vehicles per Household | Owner-occupied | Renter-occupied |
| No Vehicle | 1,068 (4.9%) | 3,380 (19.7%) |
| 1 Vehicle | 6,569 (30.1%) | 8,398 (49.0%) |
| 2 Vehicles | 8,530 (39.1%) | 4,100 (23.9%) |
| 3 or more Vehicles | 5,672 (26.0%) | 1,245 (7.3%) |
| Total | 21,839 (100.0%) | 17,123 (100.0%) |
Real Estate & Mortgages in Portsmouth
Real Estate and Mortgage Overview in Portsmouth
| Characteristic | Without Mortgage | With Mortgage |
| Housing Units | 6,443 | 15,396 |
| Median Property Value | $203,200 | $217,500 |
| Median Household Income | $53,910 | $2,463 |
| Monthly Housing Costs | $625 | $501 |
| Real Estate Taxes | $2,414 | $799 |
Property Value by Mortgage Status in Portsmouth
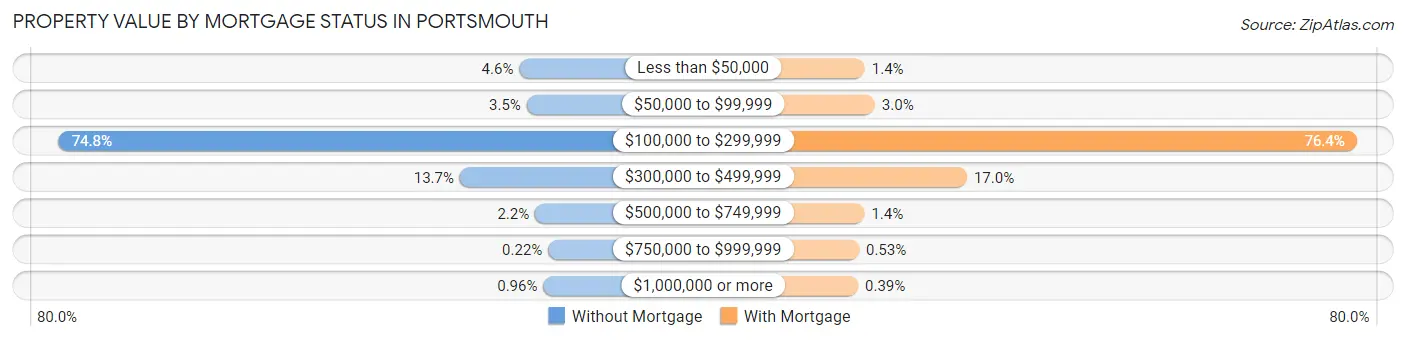
| Property Value | Without Mortgage | With Mortgage |
| Less than $50,000 | 298 (4.6%) | 218 (1.4%) |
| $50,000 to $99,999 | 225 (3.5%) | 454 (2.9%) |
| $100,000 to $299,999 | 4,819 (74.8%) | 11,757 (76.4%) |
| $300,000 to $499,999 | 882 (13.7%) | 2,615 (17.0%) |
| $500,000 to $749,999 | 143 (2.2%) | 210 (1.4%) |
| $750,000 to $999,999 | 14 (0.2%) | 82 (0.5%) |
| $1,000,000 or more | 62 (1.0%) | 60 (0.4%) |
| Total | 6,443 (100.0%) | 15,396 (100.0%) |
Household Income by Mortgage Status in Portsmouth
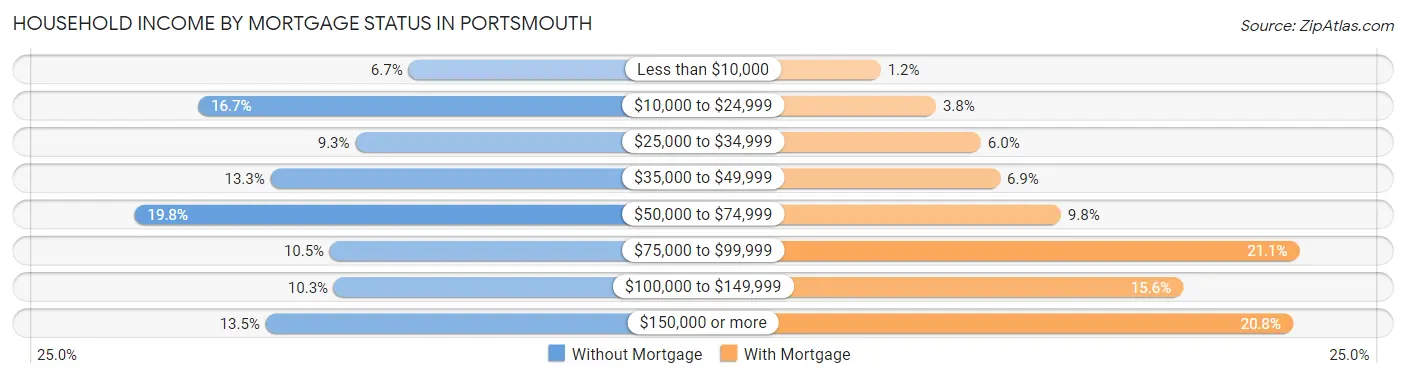
| Household Income | Without Mortgage | With Mortgage |
| Less than $10,000 | 433 (6.7%) | 184 (1.2%) |
| $10,000 to $24,999 | 1,078 (16.7%) | 590 (3.8%) |
| $25,000 to $34,999 | 596 (9.2%) | 919 (6.0%) |
| $35,000 to $49,999 | 856 (13.3%) | 1,060 (6.9%) |
| $50,000 to $74,999 | 1,273 (19.8%) | 1,505 (9.8%) |
| $75,000 to $99,999 | 674 (10.5%) | 3,253 (21.1%) |
| $100,000 to $149,999 | 662 (10.3%) | 2,401 (15.6%) |
| $150,000 or more | 871 (13.5%) | 3,205 (20.8%) |
| Total | 6,443 (100.0%) | 15,396 (100.0%) |
Property Value to Household Income Ratio in Portsmouth
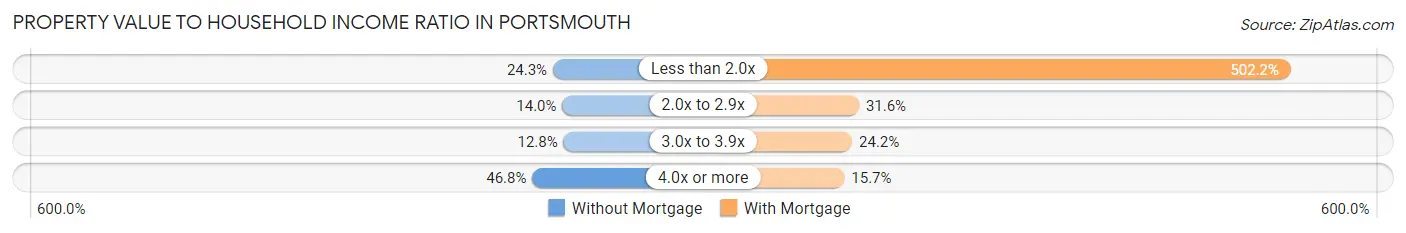
| Value-to-Income Ratio | Without Mortgage | With Mortgage |
| Less than 2.0x | 1,565 (24.3%) | 77,325 (502.2%) |
| 2.0x to 2.9x | 903 (14.0%) | 4,866 (31.6%) |
| 3.0x to 3.9x | 822 (12.8%) | 3,719 (24.2%) |
| 4.0x or more | 3,012 (46.8%) | 2,419 (15.7%) |
| Total | 6,443 (100.0%) | 15,396 (100.0%) |
Real Estate Taxes by Mortgage Status in Portsmouth
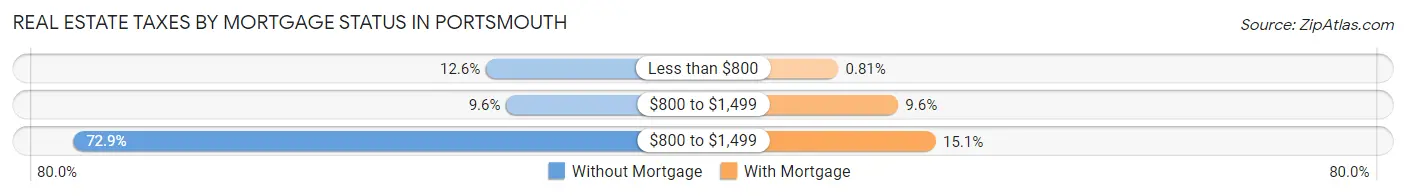
| Property Taxes | Without Mortgage | With Mortgage |
| Less than $800 | 810 (12.6%) | 124 (0.8%) |
| $800 to $1,499 | 619 (9.6%) | 1,471 (9.6%) |
| $800 to $1,499 | 4,696 (72.9%) | 2,317 (15.0%) |
| Total | 6,443 (100.0%) | 15,396 (100.0%) |
Health & Disability in Portsmouth
Health Insurance Coverage by Age in Portsmouth
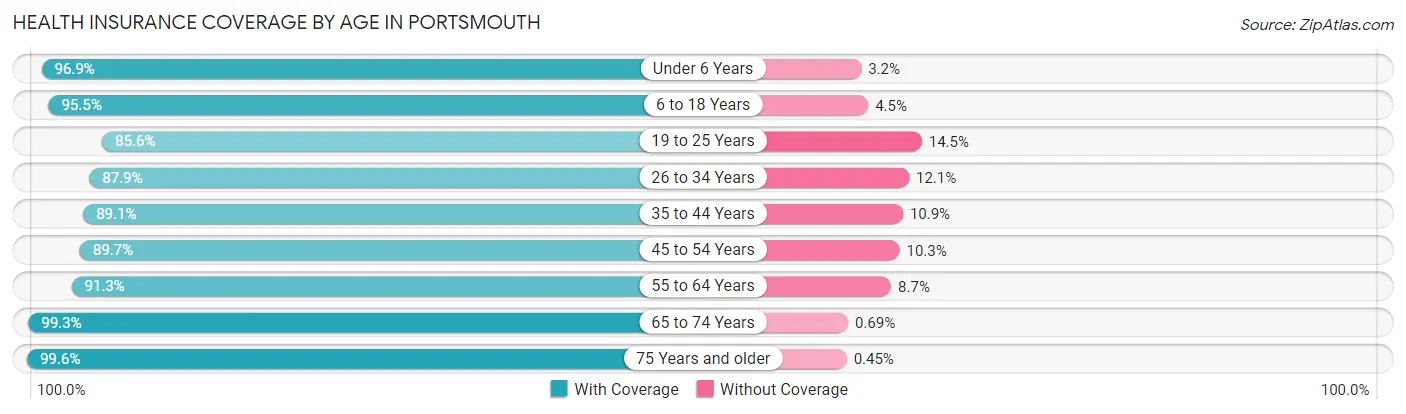
| Age Bracket | With Coverage | Without Coverage |
| Under 6 Years | 7,759 (96.9%) | 252 (3.2%) |
| 6 to 18 Years | 14,599 (95.5%) | 681 (4.5%) |
| 19 to 25 Years | 6,420 (85.6%) | 1,084 (14.4%) |
| 26 to 34 Years | 11,711 (87.9%) | 1,607 (12.1%) |
| 35 to 44 Years | 9,959 (89.1%) | 1,223 (10.9%) |
| 45 to 54 Years | 9,314 (89.7%) | 1,069 (10.3%) |
| 55 to 64 Years | 10,656 (91.3%) | 1,021 (8.7%) |
| 65 to 74 Years | 8,736 (99.3%) | 61 (0.7%) |
| 75 Years and older | 5,523 (99.6%) | 25 (0.4%) |
| Total | 84,677 (92.3%) | 7,023 (7.7%) |
Health Insurance Coverage by Citizenship Status in Portsmouth
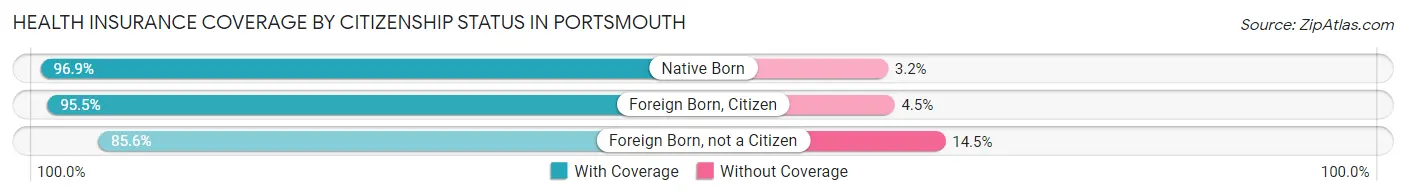
| Citizenship Status | With Coverage | Without Coverage |
| Native Born | 7,759 (96.9%) | 252 (3.2%) |
| Foreign Born, Citizen | 14,599 (95.5%) | 681 (4.5%) |
| Foreign Born, not a Citizen | 6,420 (85.6%) | 1,084 (14.4%) |
Health Insurance Coverage by Household Income in Portsmouth
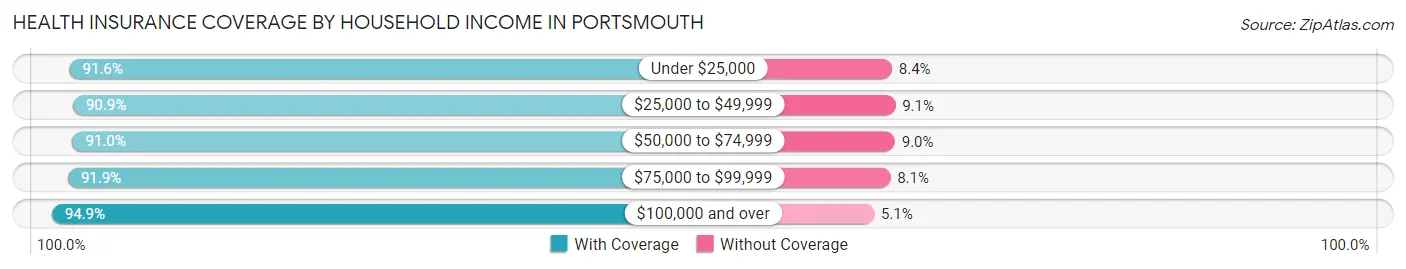
| Household Income | With Coverage | Without Coverage |
| Under $25,000 | 14,330 (91.6%) | 1,321 (8.4%) |
| $25,000 to $49,999 | 17,254 (90.9%) | 1,720 (9.1%) |
| $50,000 to $74,999 | 15,736 (91.0%) | 1,554 (9.0%) |
| $75,000 to $99,999 | 11,300 (91.9%) | 1,000 (8.1%) |
| $100,000 and over | 25,789 (94.9%) | 1,387 (5.1%) |
Public vs Private Health Insurance Coverage by Age in Portsmouth
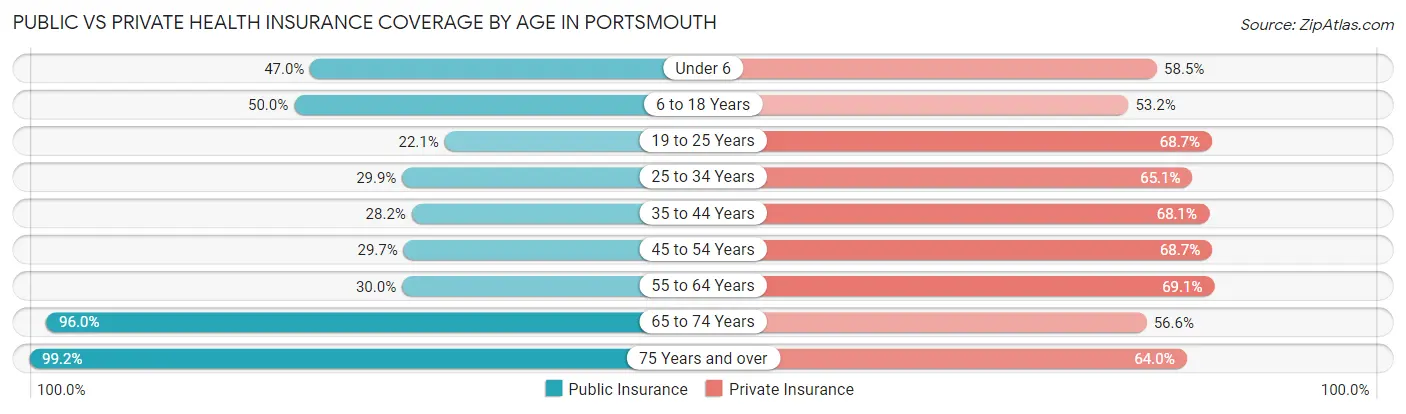
| Age Bracket | Public Insurance | Private Insurance |
| Under 6 | 3,764 (47.0%) | 4,690 (58.5%) |
| 6 to 18 Years | 7,638 (50.0%) | 8,130 (53.2%) |
| 19 to 25 Years | 1,655 (22.1%) | 5,154 (68.7%) |
| 25 to 34 Years | 3,984 (29.9%) | 8,664 (65.0%) |
| 35 to 44 Years | 3,149 (28.2%) | 7,616 (68.1%) |
| 45 to 54 Years | 3,080 (29.7%) | 7,134 (68.7%) |
| 55 to 64 Years | 3,497 (29.9%) | 8,071 (69.1%) |
| 65 to 74 Years | 8,445 (96.0%) | 4,979 (56.6%) |
| 75 Years and over | 5,502 (99.2%) | 3,549 (64.0%) |
| Total | 40,714 (44.4%) | 57,987 (63.2%) |
Disability Status by Sex by Age in Portsmouth
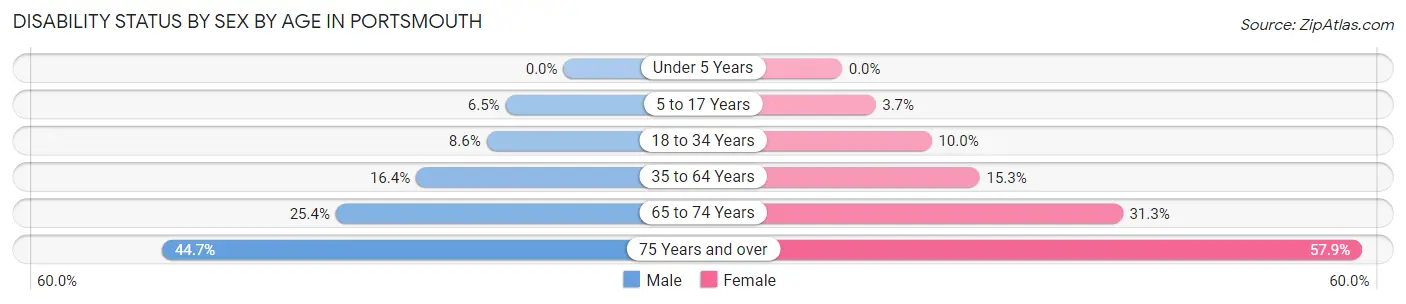
| Age Bracket | Male | Female |
| Under 5 Years | 0 (0.0%) | 0 (0.0%) |
| 5 to 17 Years | 498 (6.5%) | 286 (3.7%) |
| 18 to 34 Years | 862 (8.6%) | 1,172 (10.0%) |
| 35 to 64 Years | 2,498 (16.4%) | 2,764 (15.3%) |
| 65 to 74 Years | 951 (25.4%) | 1,577 (31.3%) |
| 75 Years and over | 920 (44.7%) | 2,022 (57.9%) |
Disability Class by Sex by Age in Portsmouth
Disability Class: Hearing Difficulty
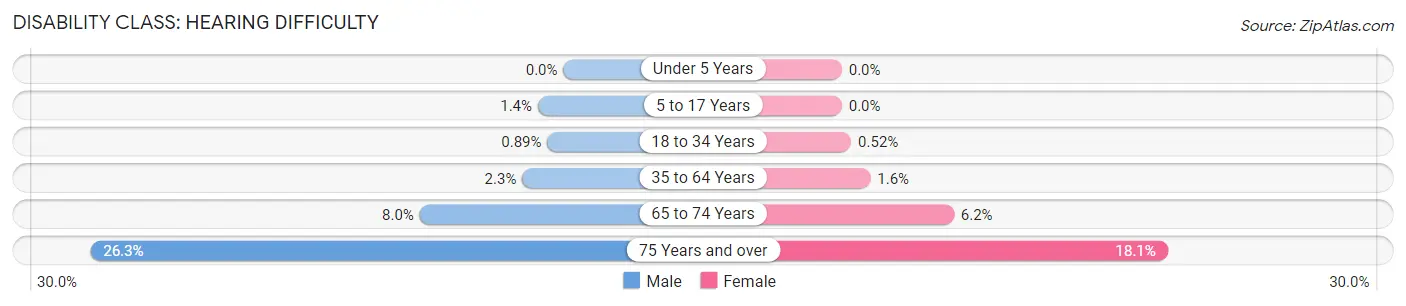
| Age Bracket | Male | Female |
| Under 5 Years | 0 (0.0%) | 0 (0.0%) |
| 5 to 17 Years | 110 (1.4%) | 0 (0.0%) |
| 18 to 34 Years | 90 (0.9%) | 61 (0.5%) |
| 35 to 64 Years | 348 (2.3%) | 286 (1.6%) |
| 65 to 74 Years | 300 (8.0%) | 315 (6.2%) |
| 75 Years and over | 542 (26.3%) | 633 (18.1%) |
Disability Class: Vision Difficulty
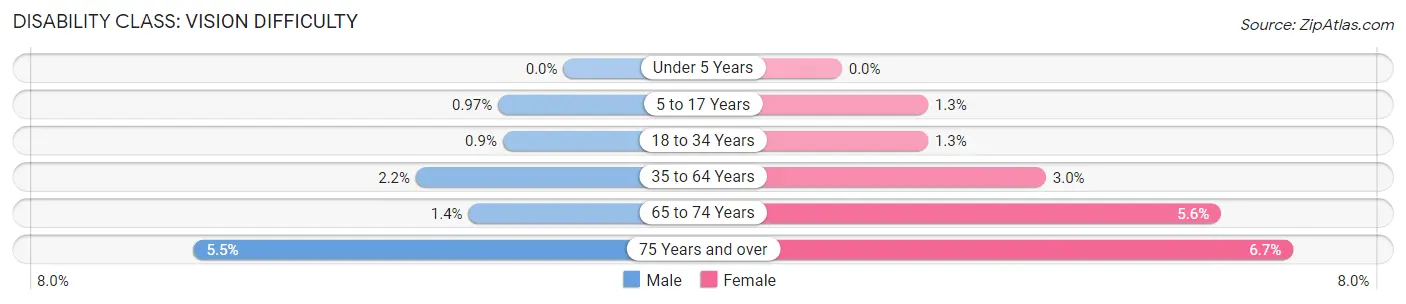
| Age Bracket | Male | Female |
| Under 5 Years | 0 (0.0%) | 0 (0.0%) |
| 5 to 17 Years | 75 (1.0%) | 98 (1.3%) |
| 18 to 34 Years | 91 (0.9%) | 150 (1.3%) |
| 35 to 64 Years | 334 (2.2%) | 546 (3.0%) |
| 65 to 74 Years | 53 (1.4%) | 284 (5.6%) |
| 75 Years and over | 113 (5.5%) | 234 (6.7%) |
Disability Class: Cognitive Difficulty
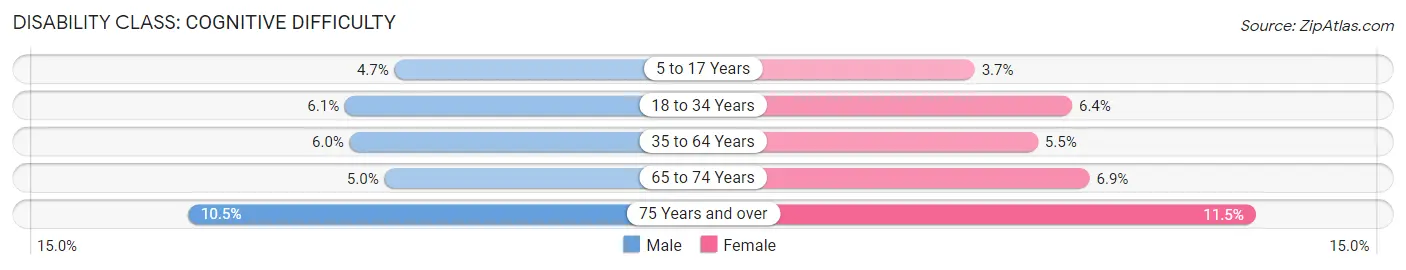
| Age Bracket | Male | Female |
| 5 to 17 Years | 363 (4.7%) | 284 (3.7%) |
| 18 to 34 Years | 612 (6.1%) | 752 (6.4%) |
| 35 to 64 Years | 906 (5.9%) | 984 (5.5%) |
| 65 to 74 Years | 187 (5.0%) | 348 (6.9%) |
| 75 Years and over | 215 (10.4%) | 402 (11.5%) |
Disability Class: Ambulatory Difficulty
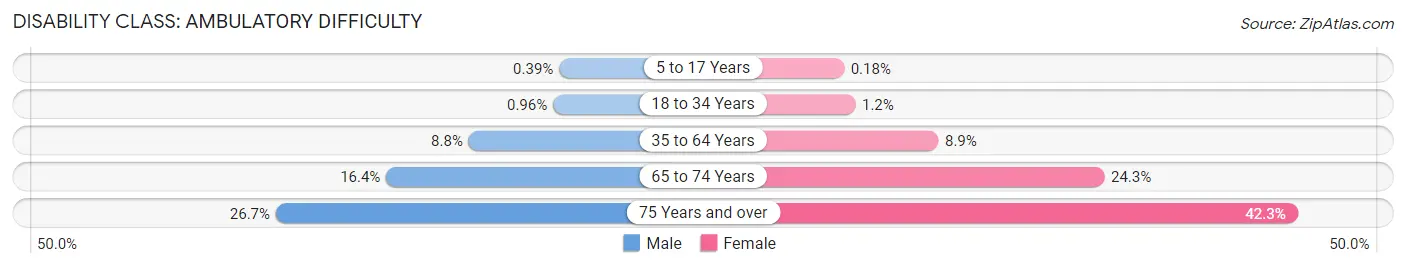
| Age Bracket | Male | Female |
| 5 to 17 Years | 30 (0.4%) | 14 (0.2%) |
| 18 to 34 Years | 97 (1.0%) | 144 (1.2%) |
| 35 to 64 Years | 1,336 (8.8%) | 1,609 (8.9%) |
| 65 to 74 Years | 617 (16.4%) | 1,228 (24.3%) |
| 75 Years and over | 549 (26.7%) | 1,476 (42.3%) |
Disability Class: Self-Care Difficulty
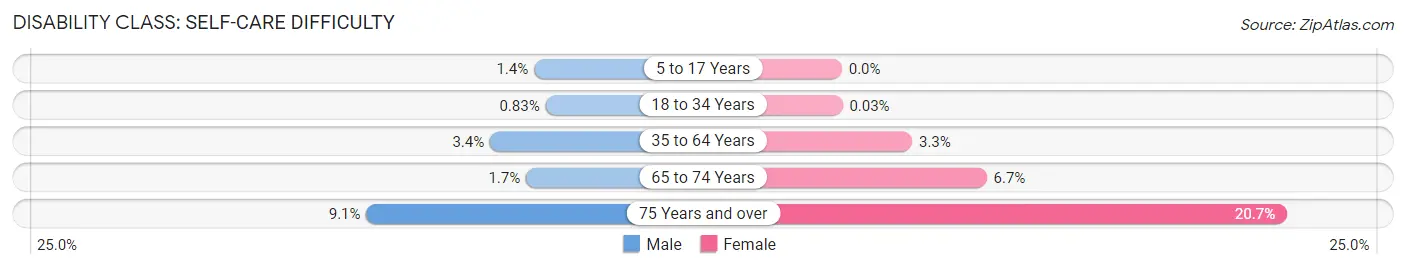
| Age Bracket | Male | Female |
| 5 to 17 Years | 105 (1.4%) | 0 (0.0%) |
| 18 to 34 Years | 84 (0.8%) | 3 (0.0%) |
| 35 to 64 Years | 518 (3.4%) | 588 (3.3%) |
| 65 to 74 Years | 65 (1.7%) | 339 (6.7%) |
| 75 Years and over | 188 (9.1%) | 721 (20.7%) |
Technology Access in Portsmouth
Computing Device Access in Portsmouth
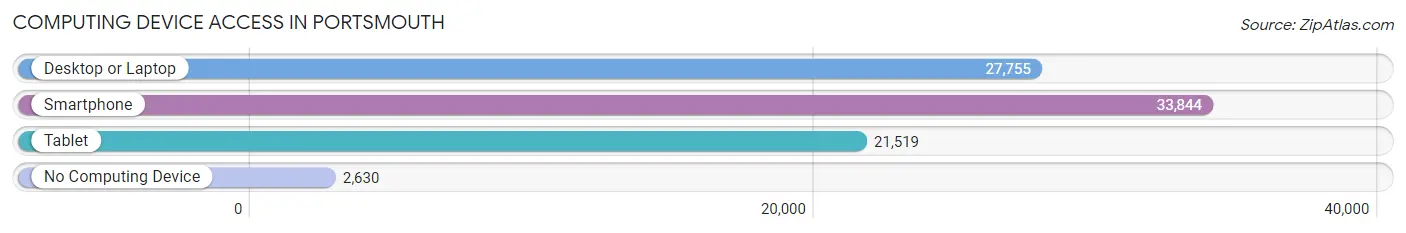
| Device Type | # Households | % Households |
| Desktop or Laptop | 27,755 | 71.2% |
| Smartphone | 33,844 | 86.9% |
| Tablet | 21,519 | 55.2% |
| No Computing Device | 2,630 | 6.8% |
| Total | 38,962 | 100.0% |
Internet Access in Portsmouth
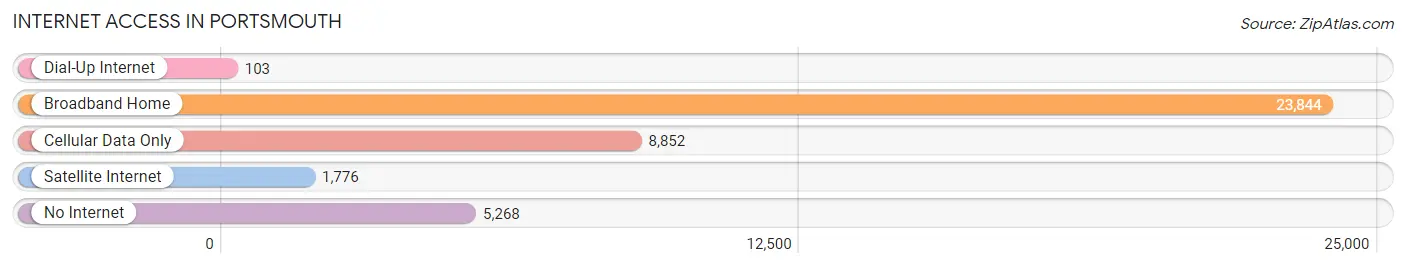
| Internet Type | # Households | % Households |
| Dial-Up Internet | 103 | 0.3% |
| Broadband Home | 23,844 | 61.2% |
| Cellular Data Only | 8,852 | 22.7% |
| Satellite Internet | 1,776 | 4.6% |
| No Internet | 5,268 | 13.5% |
| Total | 38,962 | 100.0% |
Portsmouth Summary
Portsmouth, Virginia is a city located in the Hampton Roads region of southeastern Virginia. It is the second-largest city in the region, after Norfolk, and is part of the larger Virginia Beach-Norfolk-Newport News metropolitan area. Portsmouth is situated on the Elizabeth River, a tributary of the Chesapeake Bay, and is located near the mouth of the James River. The city has a population of approximately 95,000 people, making it the fourth-largest city in Virginia.
History
Portsmouth was founded in 1752 by Colonel William Crawford, a Revolutionary War veteran, and was named after the English port city of Portsmouth. The city was incorporated in 1858 and was a major port of entry for immigrants to the United States. During the Civil War, Portsmouth was the site of the Battle of Craney Island, a Confederate victory. After the war, the city experienced a period of growth and prosperity, becoming a major industrial center. The city was home to several shipbuilding companies, as well as a major naval base.
Geography
Portsmouth is located in the Hampton Roads region of southeastern Virginia, at the mouth of the Elizabeth River. The city is situated on the western shore of the river, and is bordered by Norfolk to the north, Chesapeake to the west, and Suffolk to the south. The city covers an area of approximately 40 square miles, and is located at an elevation of approximately 10 feet above sea level.
Economy
Portsmouth is a major economic center in the Hampton Roads region. The city is home to several major employers, including the Naval Medical Center Portsmouth, the Norfolk Naval Shipyard, and the Portsmouth Naval Shipyard. The city is also home to several major corporations, including Norfolk Southern, Dollar Tree, and the Port of Virginia. Additionally, the city is home to several major universities, including Old Dominion University, Norfolk State University, and Virginia Wesleyan University.
Demographics
As of the 2010 census, Portsmouth had a population of 95,535 people. The racial makeup of the city was 57.2% African American, 33.3% White, 5.2% Hispanic or Latino, 2.2% Asian, and 1.2% Native American. The median household income was $41,945, and the median family income was $50,945. The per capita income was $22,845. The city's poverty rate was 22.3%.
Conclusion
Portsmouth, Virginia is a city located in the Hampton Roads region of southeastern Virginia. It is the second-largest city in the region, after Norfolk, and is part of the larger Virginia Beach-Norfolk-Newport News metropolitan area. Portsmouth has a long and rich history, and is a major economic center in the region. The city has a population of approximately 95,000 people, and is home to several major employers, universities, and corporations. The city has a diverse population, with a median household income of $41,945 and a poverty rate of 22.3%.
Common Questions
What is Per Capita Income in Portsmouth?
Per Capita income in Portsmouth is $31,457.
What is the Median Family Income in Portsmouth?
Median Family Income in Portsmouth is $66,450.
What is the Median Household income in Portsmouth?
Median Household Income in Portsmouth is $57,154.
What is Income or Wage Gap in Portsmouth?
Income or Wage Gap in Portsmouth is 27.0%.
Women in Portsmouth earn 73.0 cents for every dollar earned by a man.
What is Family Income Deficit in Portsmouth?
Family Income Deficit in Portsmouth is $13,729.
Families that are below poverty line in Portsmouth earn $13,729 less on average than the poverty threshold level.
What is Inequality or Gini Index in Portsmouth?
Inequality or Gini Index in Portsmouth is 0.47.
What is the Total Population of Portsmouth?
Total Population of Portsmouth is 97,384.
What is the Total Male Population of Portsmouth?
Total Male Population of Portsmouth is 46,879.
What is the Total Female Population of Portsmouth?
Total Female Population of Portsmouth is 50,505.
What is the Ratio of Males per 100 Females in Portsmouth?
There are 92.82 Males per 100 Females in Portsmouth.
What is the Ratio of Females per 100 Males in Portsmouth?
There are 107.73 Females per 100 Males in Portsmouth.
What is the Median Population Age in Portsmouth?
Median Population Age in Portsmouth is 35.6 Years.
What is the Average Family Size in Portsmouth
Average Family Size in Portsmouth is 3.1 People.
What is the Average Household Size in Portsmouth
Average Household Size in Portsmouth is 2.4 People.
How Large is the Labor Force in Portsmouth?
There are 48,569 People in the Labor Forcein in Portsmouth.
What is the Percentage of People in the Labor Force in Portsmouth?
63.1% of People are in the Labor Force in Portsmouth.
What is the Unemployment Rate in Portsmouth?
Unemployment Rate in Portsmouth is 6.6%.