Dayton, OH Map & Demographics
Dayton Map
Dayton Overview
$25,357
PER CAPITA INCOME
$52,599
AVG FAMILY INCOME
$41,443
AVG HOUSEHOLD INCOME
19.0%
WAGE / INCOME GAP [ % ]
81.0¢/ $1
WAGE / INCOME GAP [ $ ]
$11,732
FAMILY INCOME DEFICIT
0.48
INEQUALITY / GINI INDEX
137,305
TOTAL POPULATION
68,176
MALE POPULATION
69,129
FEMALE POPULATION
98.62
MALES / 100 FEMALES
101.40
FEMALES / 100 MALES
34.0
MEDIAN AGE
3.0
AVG FAMILY SIZE
2.2
AVG HOUSEHOLD SIZE
65,223
LABOR FORCE [ PEOPLE ]
58.6%
PERCENT IN LABOR FORCE
10.0%
UNEMPLOYMENT RATE
Dayton Zip Codes
Dayton Area Codes
Income in Dayton
Income Overview in Dayton
Per Capita Income in Dayton is $25,357, while median incomes of families and households are $52,599 and $41,443 respectively.
| Characteristic | Number | Measure |
| Per Capita Income | 137,305 | $25,357 |
| Median Family Income | 27,709 | $52,599 |
| Mean Family Income | 27,709 | $69,132 |
| Median Household Income | 57,362 | $41,443 |
| Mean Household Income | 57,362 | $57,574 |
| Income Deficit | 27,709 | $11,732 |
| Wage / Income Gap (%) | 137,305 | 18.98% |
| Wage / Income Gap ($) | 137,305 | 81.02¢ per $1 |
| Gini / Inequality Index | 137,305 | 0.48 |
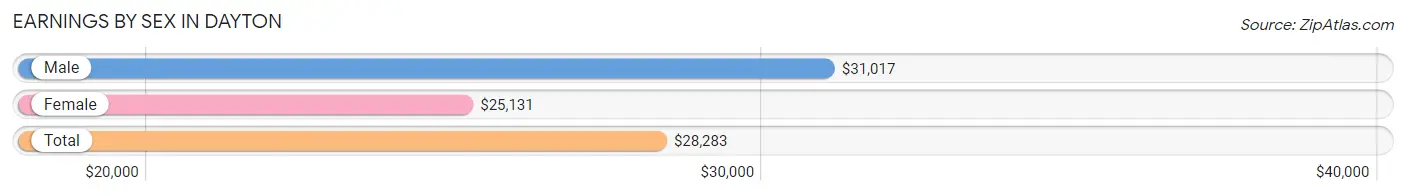
Earnings by Sex in Dayton
Average Earnings in Dayton are $28,283, $31,017 for men and $25,131 for women, a difference of 19.0%.
| Sex | Number | Average Earnings |
| Male | 36,485 (50.6%) | $31,017 |
| Female | 35,626 (49.4%) | $25,131 |
| Total | 72,111 (100.0%) | $28,283 |
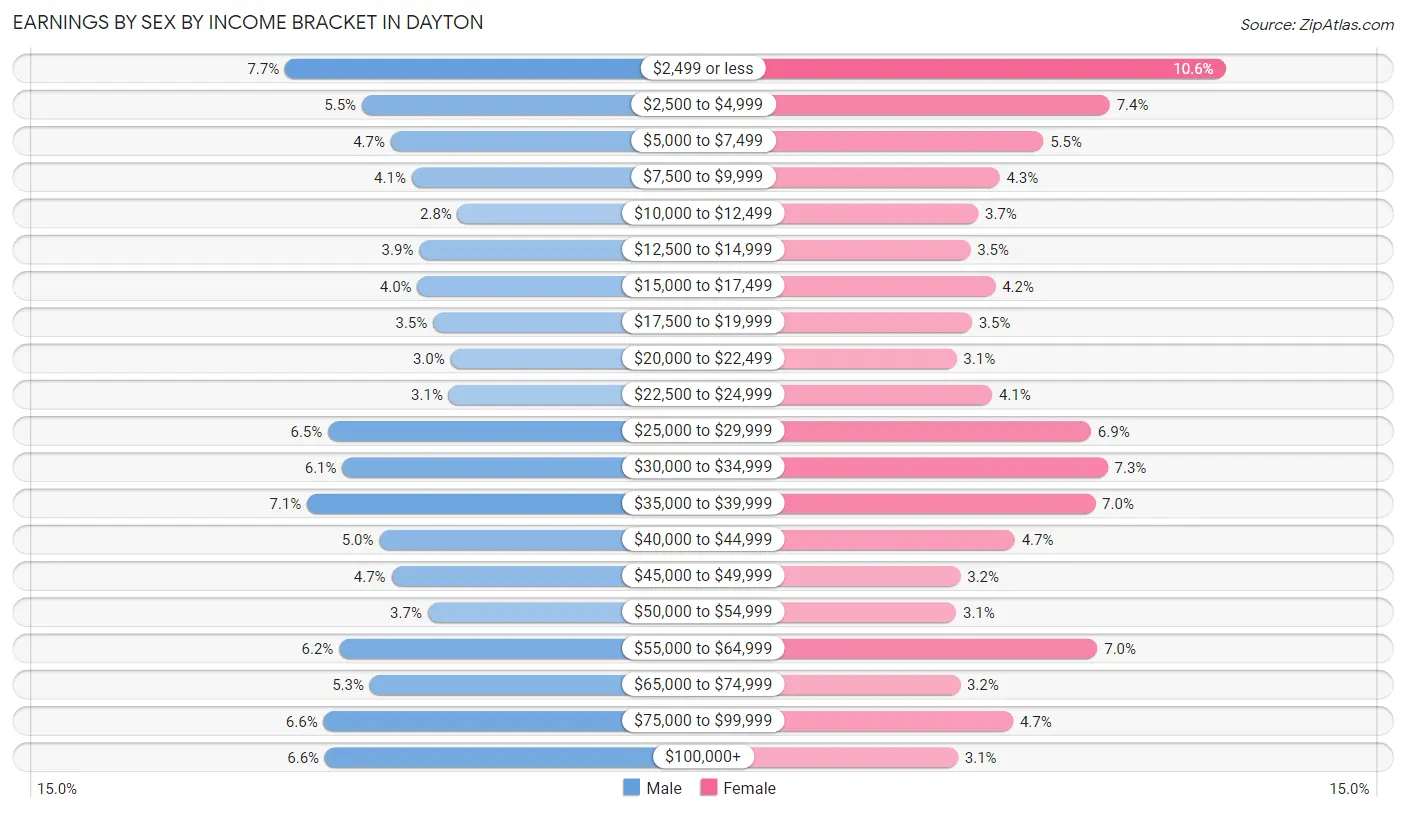
Earnings by Sex by Income Bracket in Dayton
The most common earnings brackets in Dayton are $2,499 or less for men (2,803 | 7.7%) and $2,499 or less for women (3,790 | 10.6%).
| Income | Male | Female |
| $2,499 or less | 2,803 (7.7%) | 3,790 (10.6%) |
| $2,500 to $4,999 | 2,015 (5.5%) | 2,634 (7.4%) |
| $5,000 to $7,499 | 1,718 (4.7%) | 1,967 (5.5%) |
| $7,500 to $9,999 | 1,505 (4.1%) | 1,530 (4.3%) |
| $10,000 to $12,499 | 1,034 (2.8%) | 1,313 (3.7%) |
| $12,500 to $14,999 | 1,427 (3.9%) | 1,237 (3.5%) |
| $15,000 to $17,499 | 1,446 (4.0%) | 1,484 (4.2%) |
| $17,500 to $19,999 | 1,286 (3.5%) | 1,252 (3.5%) |
| $20,000 to $22,499 | 1,107 (3.0%) | 1,098 (3.1%) |
| $22,500 to $24,999 | 1,122 (3.1%) | 1,454 (4.1%) |
| $25,000 to $29,999 | 2,360 (6.5%) | 2,444 (6.9%) |
| $30,000 to $34,999 | 2,216 (6.1%) | 2,610 (7.3%) |
| $35,000 to $39,999 | 2,575 (7.1%) | 2,488 (7.0%) |
| $40,000 to $44,999 | 1,837 (5.0%) | 1,680 (4.7%) |
| $45,000 to $49,999 | 1,710 (4.7%) | 1,135 (3.2%) |
| $50,000 to $54,999 | 1,338 (3.7%) | 1,093 (3.1%) |
| $55,000 to $64,999 | 2,249 (6.2%) | 2,509 (7.0%) |
| $65,000 to $74,999 | 1,934 (5.3%) | 1,132 (3.2%) |
| $75,000 to $99,999 | 2,408 (6.6%) | 1,663 (4.7%) |
| $100,000+ | 2,395 (6.6%) | 1,113 (3.1%) |
| Total | 36,485 (100.0%) | 35,626 (100.0%) |
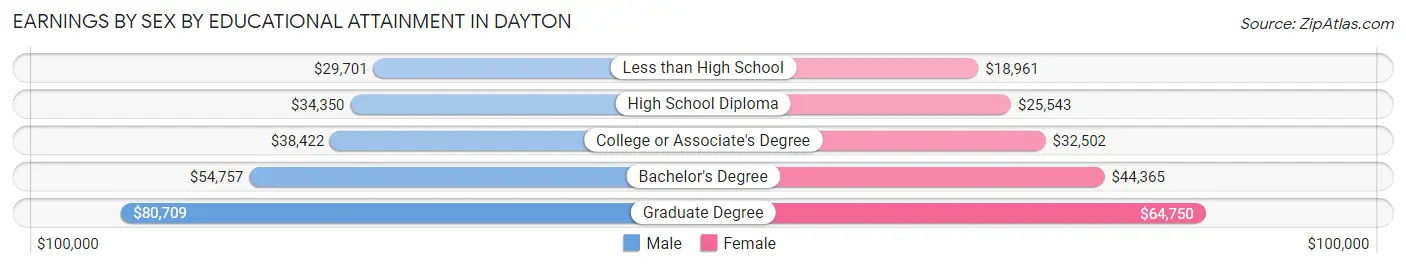
Earnings by Sex by Educational Attainment in Dayton
Average earnings in Dayton are $38,683 for men and $32,895 for women, a difference of 15.0%. Men with an educational attainment of graduate degree enjoy the highest average annual earnings of $80,709, while those with less than high school education earn the least with $29,701. Women with an educational attainment of graduate degree earn the most with the average annual earnings of $64,750, while those with less than high school education have the smallest earnings of $18,961.
| Educational Attainment | Male Income | Female Income |
| Less than High School | $29,701 | $18,961 |
| High School Diploma | $34,350 | $25,543 |
| College or Associate's Degree | $38,422 | $32,502 |
| Bachelor's Degree | $54,757 | $44,365 |
| Graduate Degree | $80,709 | $64,750 |
| Total | $38,683 | $32,895 |
Family Income in Dayton
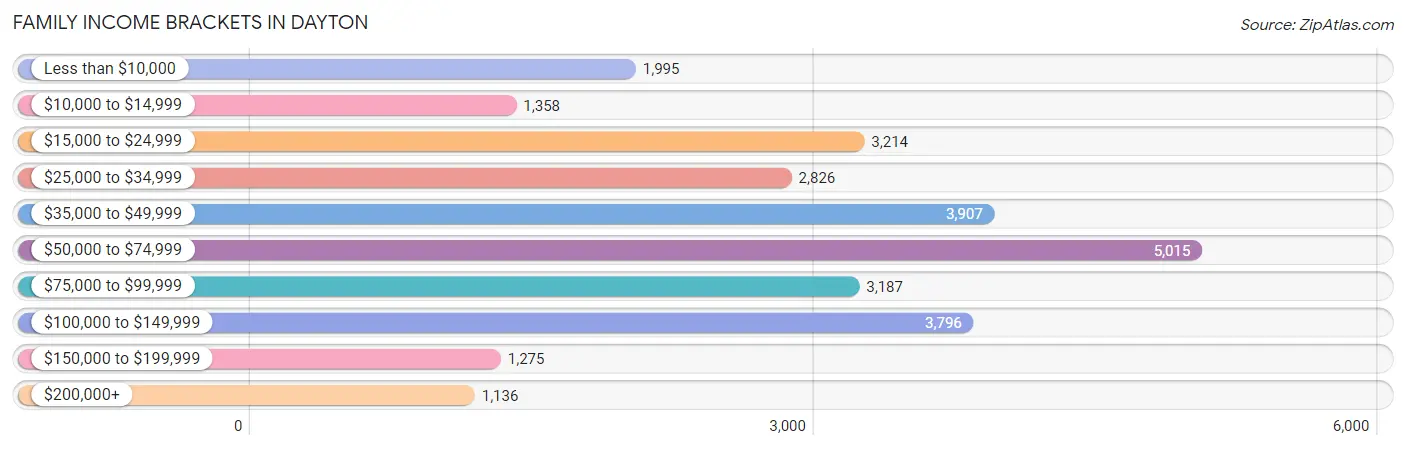
Family Income Brackets in Dayton
According to the Dayton family income data, there are 5,015 families falling into the $50,000 to $74,999 income range, which is the most common income bracket and makes up 18.1% of all families. Conversely, the $200,000+ income bracket is the least frequent group with only 1,136 families (4.1%) belonging to this category.
| Income Bracket | # Families | % Families |
| Less than $10,000 | 1,995 | 7.2% |
| $10,000 to $14,999 | 1,358 | 4.9% |
| $15,000 to $24,999 | 3,214 | 11.6% |
| $25,000 to $34,999 | 2,826 | 10.2% |
| $35,000 to $49,999 | 3,907 | 14.1% |
| $50,000 to $74,999 | 5,015 | 18.1% |
| $75,000 to $99,999 | 3,187 | 11.5% |
| $100,000 to $149,999 | 3,796 | 13.7% |
| $150,000 to $199,999 | 1,275 | 4.6% |
| $200,000+ | 1,136 | 4.1% |
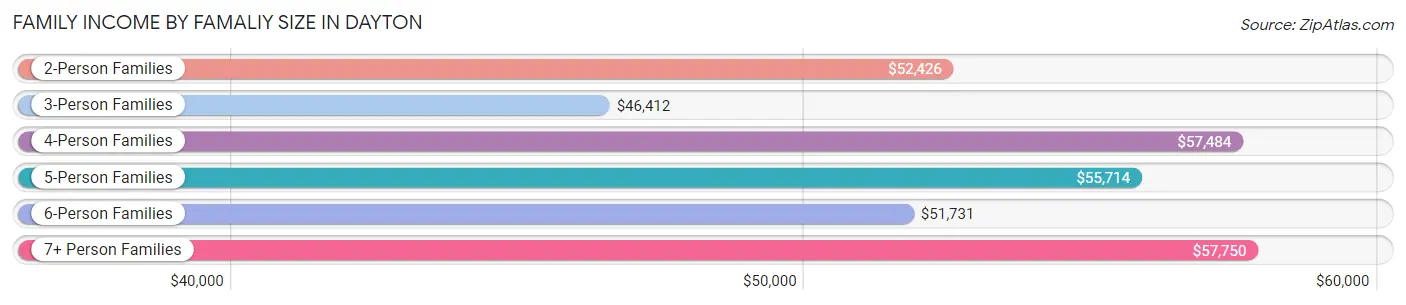
Family Income by Famaliy Size in Dayton
7+ person families (536 | 1.9%) account for the highest median family income in Dayton with $57,750 per family, while 2-person families (14,536 | 52.5%) have the highest median income of $26,213 per family member.
| Income Bracket | # Families | Median Income |
| 2-Person Families | 14,536 (52.5%) | $52,426 |
| 3-Person Families | 6,383 (23.0%) | $46,412 |
| 4-Person Families | 3,632 (13.1%) | $57,484 |
| 5-Person Families | 1,856 (6.7%) | $55,714 |
| 6-Person Families | 766 (2.8%) | $51,731 |
| 7+ Person Families | 536 (1.9%) | $57,750 |
| Total | 27,709 (100.0%) | $52,599 |
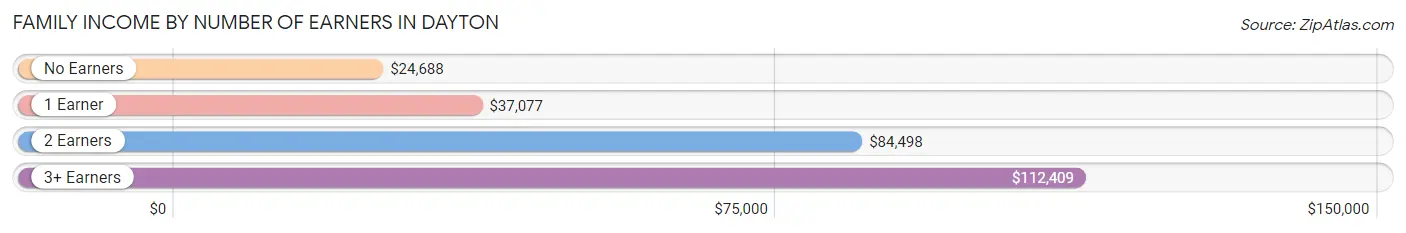
Family Income by Number of Earners in Dayton
The median family income in Dayton is $52,599, with families comprising 3+ earners (1,875) having the highest median family income of $112,409, while families with no earners (4,846) have the lowest median family income of $24,688, accounting for 6.8% and 17.5% of families, respectively.
| Number of Earners | # Families | Median Income |
| No Earners | 4,846 (17.5%) | $24,688 |
| 1 Earner | 11,391 (41.1%) | $37,077 |
| 2 Earners | 9,597 (34.6%) | $84,498 |
| 3+ Earners | 1,875 (6.8%) | $112,409 |
| Total | 27,709 (100.0%) | $52,599 |
Household Income in Dayton
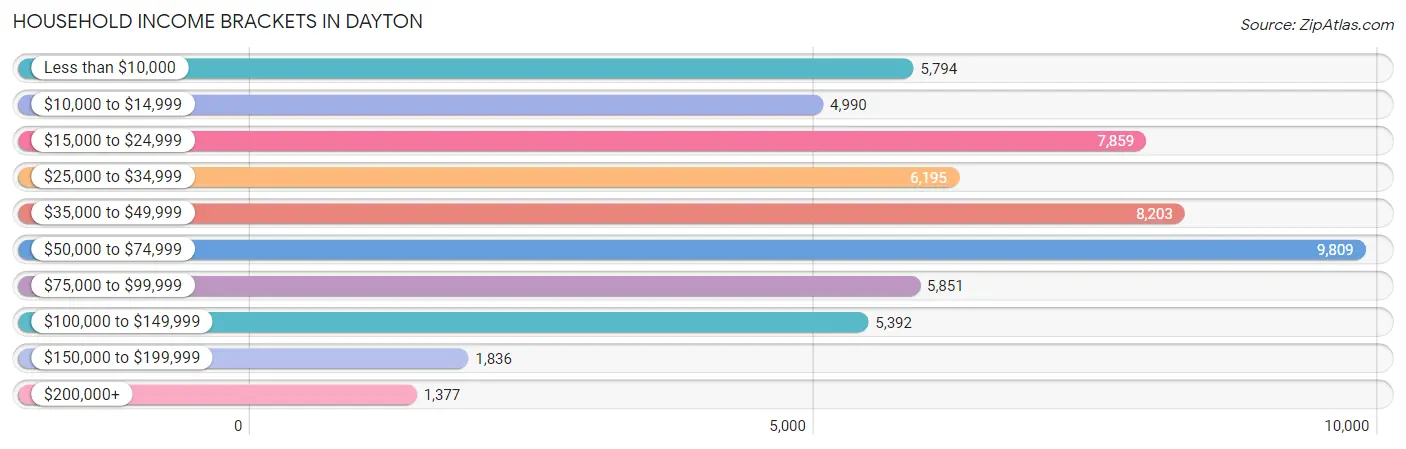
Household Income Brackets in Dayton
With 9,809 households falling in the category, the $50,000 to $74,999 income range is the most frequent in Dayton, accounting for 17.1% of all households. In contrast, only 1,377 households (2.4%) fall into the $200,000+ income bracket, making it the least populous group.
| Income Bracket | # Households | % Households |
| Less than $10,000 | 5,794 | 10.1% |
| $10,000 to $14,999 | 4,990 | 8.7% |
| $15,000 to $24,999 | 7,859 | 13.7% |
| $25,000 to $34,999 | 6,195 | 10.8% |
| $35,000 to $49,999 | 8,203 | 14.3% |
| $50,000 to $74,999 | 9,809 | 17.1% |
| $75,000 to $99,999 | 5,851 | 10.2% |
| $100,000 to $149,999 | 5,392 | 9.4% |
| $150,000 to $199,999 | 1,836 | 3.2% |
| $200,000+ | 1,377 | 2.4% |
Household Income by Householder Age in Dayton
The median household income in Dayton is $41,443, with the highest median household income of $46,454 found in the 25 to 44 years age bracket for the primary householder. A total of 19,577 households (34.1%) fall into this category. Meanwhile, the 15 to 24 years age bracket for the primary householder has the lowest median household income of $26,979, with 3,313 households (5.8%) in this group.
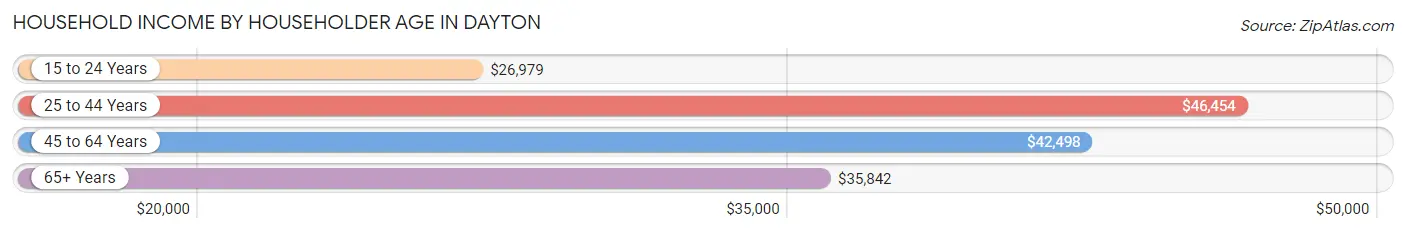
| Income Bracket | # Households | Median Income |
| 15 to 24 Years | 3,313 (5.8%) | $26,979 |
| 25 to 44 Years | 19,577 (34.1%) | $46,454 |
| 45 to 64 Years | 20,955 (36.5%) | $42,498 |
| 65+ Years | 13,517 (23.6%) | $35,842 |
| Total | 57,362 (100.0%) | $41,443 |
Poverty in Dayton
Income Below Poverty by Sex and Age in Dayton
With 26.8% poverty level for males and 28.2% for females among the residents of Dayton, 15 year old males and 5 year old females are the most vulnerable to poverty, with 496 males (54.3%) and 281 females (41.9%) in their respective age groups living below the poverty level.
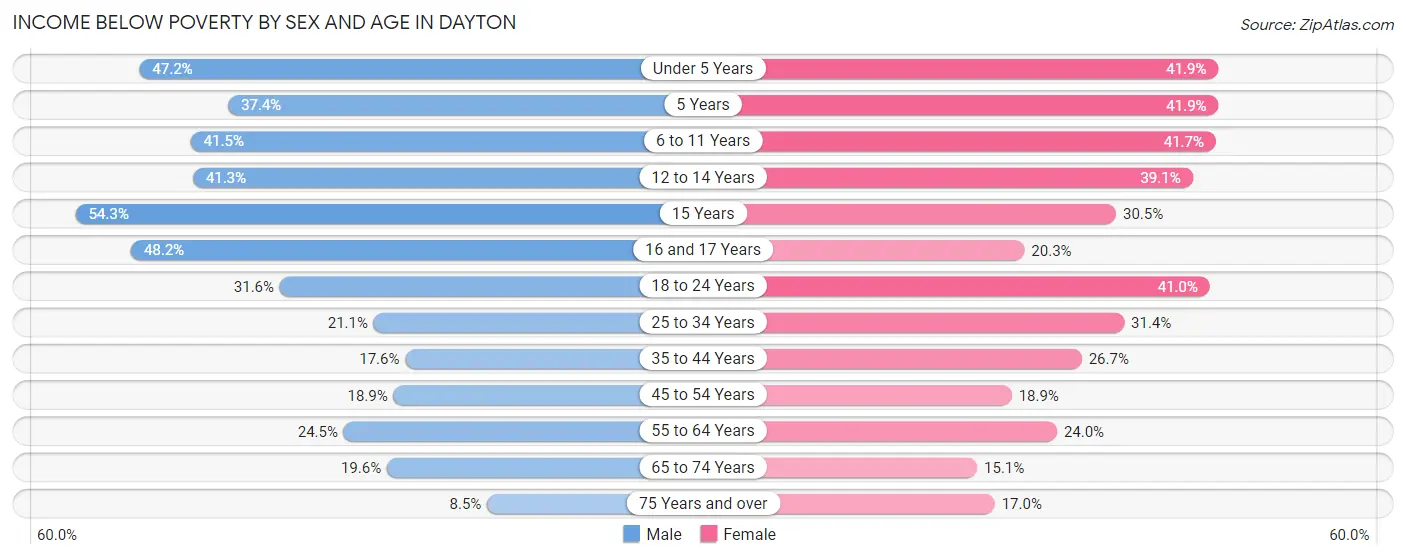
| Age Bracket | Male | Female |
| Under 5 Years | 2,029 (47.2%) | 1,660 (41.9%) |
| 5 Years | 449 (37.3%) | 281 (41.9%) |
| 6 to 11 Years | 1,952 (41.5%) | 1,947 (41.6%) |
| 12 to 14 Years | 866 (41.3%) | 740 (39.1%) |
| 15 Years | 496 (54.3%) | 314 (30.5%) |
| 16 and 17 Years | 715 (48.1%) | 241 (20.3%) |
| 18 to 24 Years | 2,006 (31.6%) | 2,176 (41.0%) |
| 25 to 34 Years | 2,001 (21.1%) | 3,440 (31.4%) |
| 35 to 44 Years | 1,392 (17.6%) | 1,971 (26.7%) |
| 45 to 54 Years | 1,362 (18.9%) | 1,427 (18.9%) |
| 55 to 64 Years | 2,170 (24.4%) | 2,007 (24.0%) |
| 65 to 74 Years | 964 (19.6%) | 933 (15.1%) |
| 75 Years and over | 211 (8.5%) | 719 (17.0%) |
| Total | 16,613 (26.8%) | 17,856 (28.2%) |
Income Above Poverty by Sex and Age in Dayton
According to the poverty statistics in Dayton, males aged 75 years and over and females aged 65 to 74 years are the age groups that are most secure financially, with 91.5% of males and 84.9% of females in these age groups living above the poverty line.
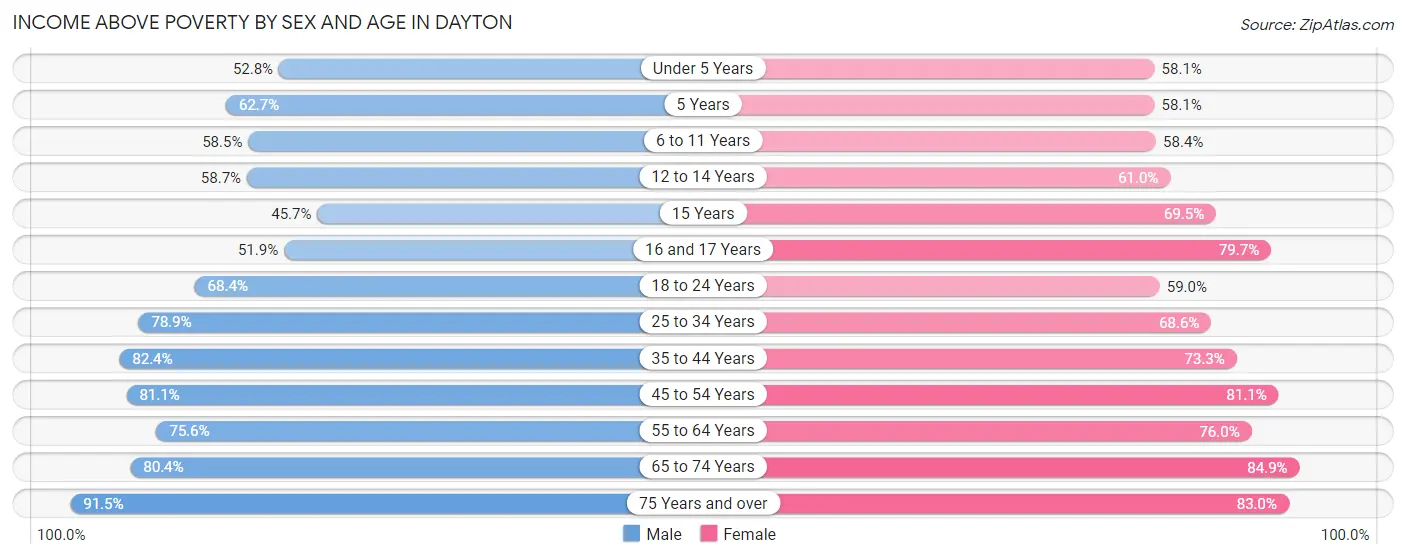
| Age Bracket | Male | Female |
| Under 5 Years | 2,269 (52.8%) | 2,299 (58.1%) |
| 5 Years | 753 (62.6%) | 389 (58.1%) |
| 6 to 11 Years | 2,751 (58.5%) | 2,728 (58.4%) |
| 12 to 14 Years | 1,233 (58.7%) | 1,155 (61.0%) |
| 15 Years | 417 (45.7%) | 714 (69.5%) |
| 16 and 17 Years | 770 (51.8%) | 944 (79.7%) |
| 18 to 24 Years | 4,348 (68.4%) | 3,134 (59.0%) |
| 25 to 34 Years | 7,479 (78.9%) | 7,501 (68.6%) |
| 35 to 44 Years | 6,516 (82.4%) | 5,406 (73.3%) |
| 45 to 54 Years | 5,841 (81.1%) | 6,117 (81.1%) |
| 55 to 64 Years | 6,705 (75.5%) | 6,368 (76.0%) |
| 65 to 74 Years | 3,944 (80.4%) | 5,258 (84.9%) |
| 75 Years and over | 2,277 (91.5%) | 3,504 (83.0%) |
| Total | 45,303 (73.2%) | 45,517 (71.8%) |
Income Below Poverty Among Married-Couple Families in Dayton
The poverty statistics for married-couple families in Dayton show that 6.9% or 886 of the total 12,853 families live below the poverty line. Families with 5 or more children have the highest poverty rate of 42.4%, comprising of 147 families. On the other hand, families with no children have the lowest poverty rate of 3.3%, which includes 276 families.
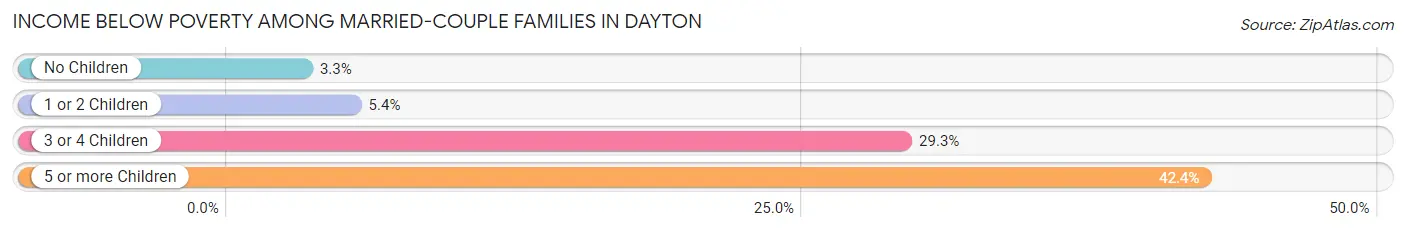
| Children | Above Poverty | Below Poverty |
| No Children | 8,193 (96.7%) | 276 (3.3%) |
| 1 or 2 Children | 2,849 (94.6%) | 162 (5.4%) |
| 3 or 4 Children | 725 (70.7%) | 301 (29.3%) |
| 5 or more Children | 200 (57.6%) | 147 (42.4%) |
| Total | 11,967 (93.1%) | 886 (6.9%) |
Income Below Poverty Among Single-Parent Households in Dayton
According to the poverty data in Dayton, 23.3% or 802 single-father households and 36.6% or 4,179 single-mother households are living below the poverty line. Among single-father households, those with 5 or more children have the highest poverty rate, with 6 households (42.9%) experiencing poverty. Likewise, among single-mother households, those with 5 or more children have the highest poverty rate, with 160 households (80.4%) falling below the poverty line.
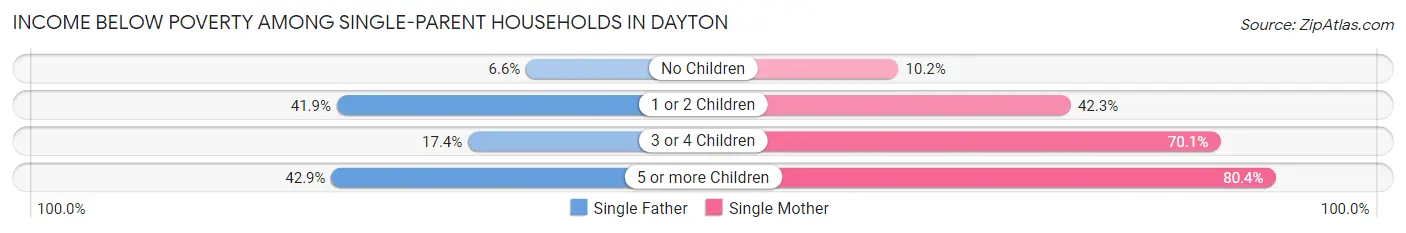
| Children | Single Father | Single Mother |
| No Children | 110 (6.6%) | 367 (10.2%) |
| 1 or 2 Children | 650 (41.8%) | 2,583 (42.3%) |
| 3 or 4 Children | 36 (17.4%) | 1,069 (70.1%) |
| 5 or more Children | 6 (42.9%) | 160 (80.4%) |
| Total | 802 (23.3%) | 4,179 (36.6%) |
Income Below Poverty Among Married-Couple vs Single-Parent Households in Dayton
The poverty data for Dayton shows that 886 of the married-couple family households (6.9%) and 4,981 of the single-parent households (33.5%) are living below the poverty level. Within the married-couple family households, those with 5 or more children have the highest poverty rate, with 147 households (42.4%) falling below the poverty line. Among the single-parent households, those with 5 or more children have the highest poverty rate, with 166 household (77.9%) living below poverty.
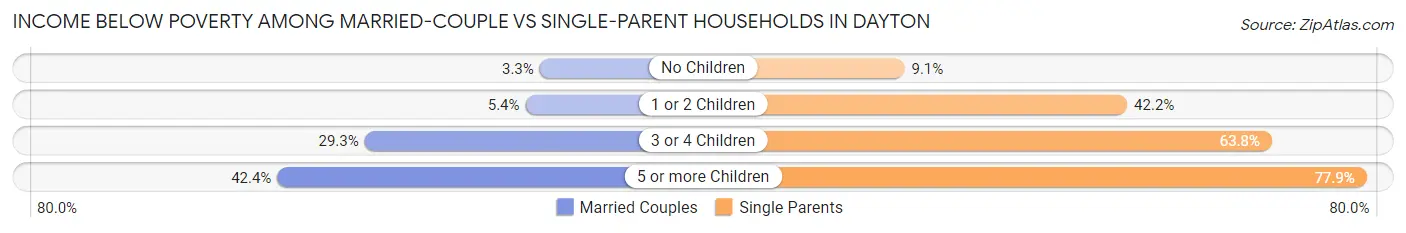
| Children | Married-Couple Families | Single-Parent Households |
| No Children | 276 (3.3%) | 477 (9.1%) |
| 1 or 2 Children | 162 (5.4%) | 3,233 (42.2%) |
| 3 or 4 Children | 301 (29.3%) | 1,105 (63.8%) |
| 5 or more Children | 147 (42.4%) | 166 (77.9%) |
| Total | 886 (6.9%) | 4,981 (33.5%) |
Race in Dayton
The most populous races in Dayton are White / Caucasian (71,326 | 51.9%), Black / African American (52,202 | 38.0%), and Two or more Races (8,258 | 6.0%).
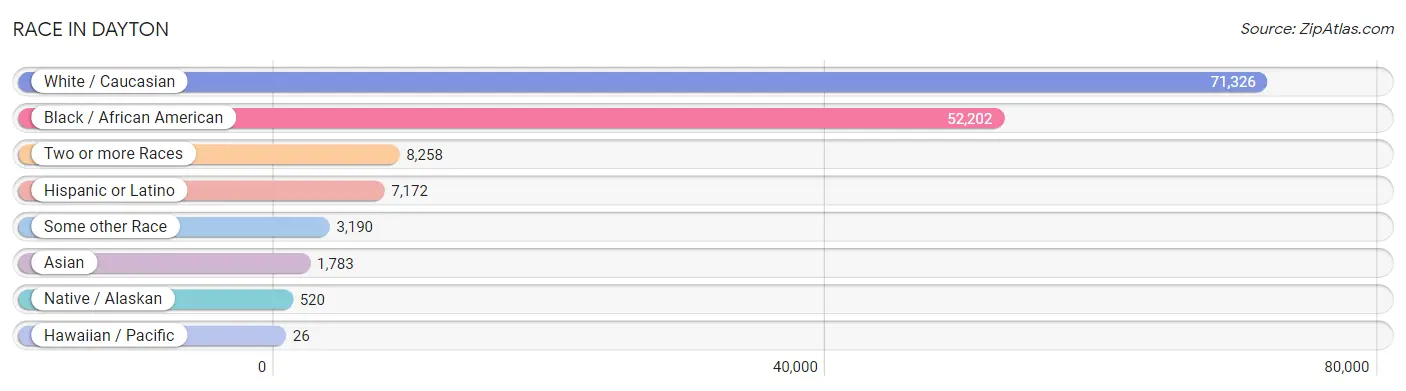
| Race | # Population | % Population |
| Asian | 1,783 | 1.3% |
| Black / African American | 52,202 | 38.0% |
| Hawaiian / Pacific | 26 | 0.0% |
| Hispanic or Latino | 7,172 | 5.2% |
| Native / Alaskan | 520 | 0.4% |
| White / Caucasian | 71,326 | 51.9% |
| Two or more Races | 8,258 | 6.0% |
| Some other Race | 3,190 | 2.3% |
| Total | 137,305 | 100.0% |
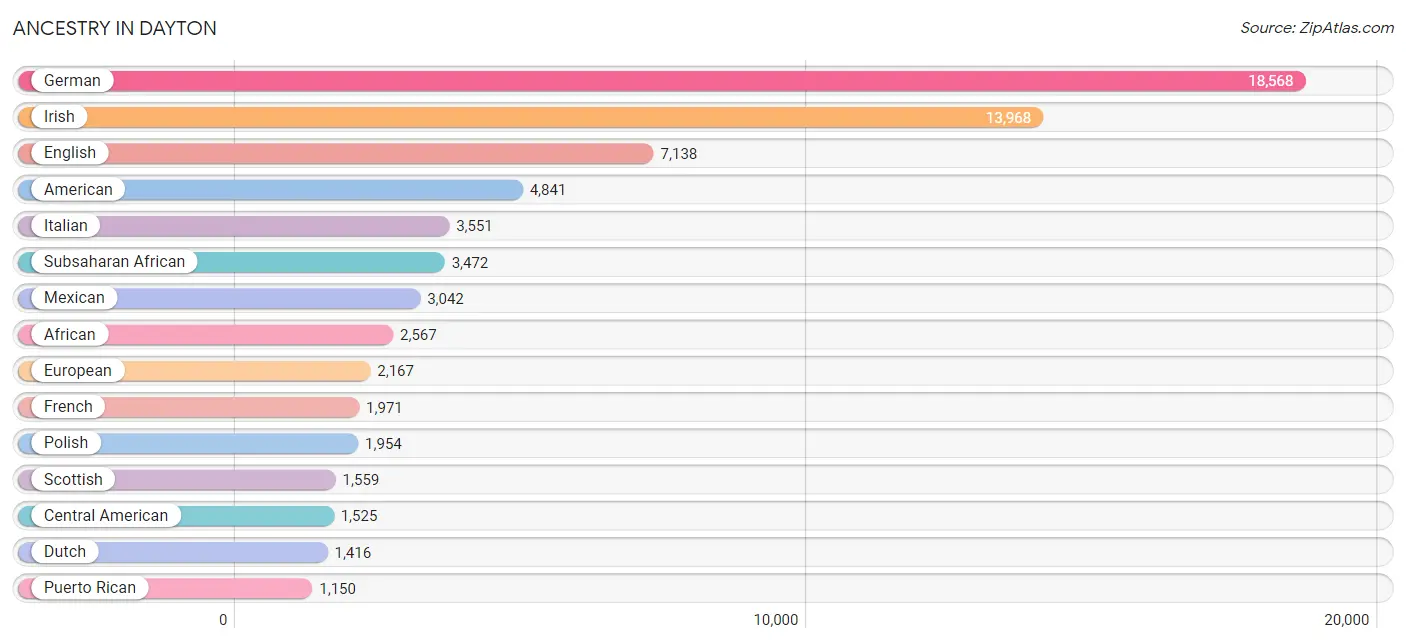
Ancestry in Dayton
The most populous ancestries reported in Dayton are German (18,568 | 13.5%), Irish (13,968 | 10.2%), English (7,138 | 5.2%), American (4,841 | 3.5%), and Italian (3,551 | 2.6%), together accounting for 35.0% of all Dayton residents.
| Ancestry | # Population | % Population |
| Afghan | 48 | 0.0% |
| African | 2,567 | 1.9% |
| Alsatian | 24 | 0.0% |
| American | 4,841 | 3.5% |
| Apache | 12 | 0.0% |
| Arab | 817 | 0.6% |
| Armenian | 28 | 0.0% |
| Austrian | 92 | 0.1% |
| Belgian | 75 | 0.1% |
| Belizean | 1 | 0.0% |
| Bhutanese | 240 | 0.2% |
| Blackfeet | 120 | 0.1% |
| Brazilian | 22 | 0.0% |
| British | 410 | 0.3% |
| Bulgarian | 20 | 0.0% |
| Burmese | 368 | 0.3% |
| Canadian | 27 | 0.0% |
| Cape Verdean | 1 | 0.0% |
| Celtic | 13 | 0.0% |
| Central American | 1,525 | 1.1% |
| Central American Indian | 16 | 0.0% |
| Cherokee | 540 | 0.4% |
| Chilean | 18 | 0.0% |
| Chippewa | 14 | 0.0% |
| Choctaw | 11 | 0.0% |
| Colombian | 154 | 0.1% |
| Costa Rican | 15 | 0.0% |
| Cree | 8 | 0.0% |
| Croatian | 160 | 0.1% |
| Cuban | 48 | 0.0% |
| Czech | 420 | 0.3% |
| Czechoslovakian | 49 | 0.0% |
| Danish | 129 | 0.1% |
| Dominican | 189 | 0.1% |
| Dutch | 1,416 | 1.0% |
| Eastern European | 188 | 0.1% |
| Ecuadorian | 299 | 0.2% |
| English | 7,138 | 5.2% |
| Ethiopian | 68 | 0.1% |
| European | 2,167 | 1.6% |
| Filipino | 28 | 0.0% |
| Finnish | 72 | 0.1% |
| French | 1,971 | 1.4% |
| French Canadian | 131 | 0.1% |
| German | 18,568 | 13.5% |
| Ghanaian | 127 | 0.1% |
| Greek | 205 | 0.2% |
| Guatemalan | 663 | 0.5% |
| Haitian | 41 | 0.0% |
| Honduran | 254 | 0.2% |
| Hungarian | 825 | 0.6% |
| Indian (Asian) | 454 | 0.3% |
| Iranian | 12 | 0.0% |
| Iraqi | 260 | 0.2% |
| Irish | 13,968 | 10.2% |
| Italian | 3,551 | 2.6% |
| Jamaican | 99 | 0.1% |
| Kenyan | 18 | 0.0% |
| Korean | 338 | 0.3% |
| Laotian | 8 | 0.0% |
| Latvian | 6 | 0.0% |
| Lebanese | 192 | 0.1% |
| Liberian | 12 | 0.0% |
| Lithuanian | 473 | 0.3% |
| Macedonian | 55 | 0.0% |
| Mexican | 3,042 | 2.2% |
| Mexican American Indian | 20 | 0.0% |
| Moroccan | 42 | 0.0% |
| Native Hawaiian | 137 | 0.1% |
| Nicaraguan | 46 | 0.0% |
| Nigerian | 176 | 0.1% |
| Northern European | 46 | 0.0% |
| Norwegian | 359 | 0.3% |
| Okinawan | 82 | 0.1% |
| Pakistani | 112 | 0.1% |
| Palestinian | 38 | 0.0% |
| Panamanian | 273 | 0.2% |
| Pennsylvania German | 38 | 0.0% |
| Peruvian | 109 | 0.1% |
| Polish | 1,954 | 1.4% |
| Portuguese | 97 | 0.1% |
| Puerto Rican | 1,150 | 0.8% |
| Romanian | 51 | 0.0% |
| Russian | 393 | 0.3% |
| Salvadoran | 274 | 0.2% |
| Samoan | 26 | 0.0% |
| Scandinavian | 155 | 0.1% |
| Scotch-Irish | 1,033 | 0.7% |
| Scottish | 1,559 | 1.1% |
| Seminole | 17 | 0.0% |
| Senegalese | 117 | 0.1% |
| Serbian | 41 | 0.0% |
| Slavic | 49 | 0.0% |
| Slovak | 382 | 0.3% |
| Slovene | 53 | 0.0% |
| Somali | 2 | 0.0% |
| South African | 14 | 0.0% |
| South American | 584 | 0.4% |
| Spaniard | 215 | 0.2% |
| Spanish | 52 | 0.0% |
| Sri Lankan | 259 | 0.2% |
| Subsaharan African | 3,472 | 2.5% |
| Swedish | 619 | 0.4% |
| Swiss | 336 | 0.2% |
| Syrian | 52 | 0.0% |
| Thai | 477 | 0.4% |
| Trinidadian and Tobagonian | 10 | 0.0% |
| Turkish | 295 | 0.2% |
| Ukrainian | 89 | 0.1% |
| Venezuelan | 4 | 0.0% |
| Welsh | 719 | 0.5% |
| West Indian | 73 | 0.1% |
| Yugoslavian | 34 | 0.0% | View All 113 Rows |
Immigrants in Dayton
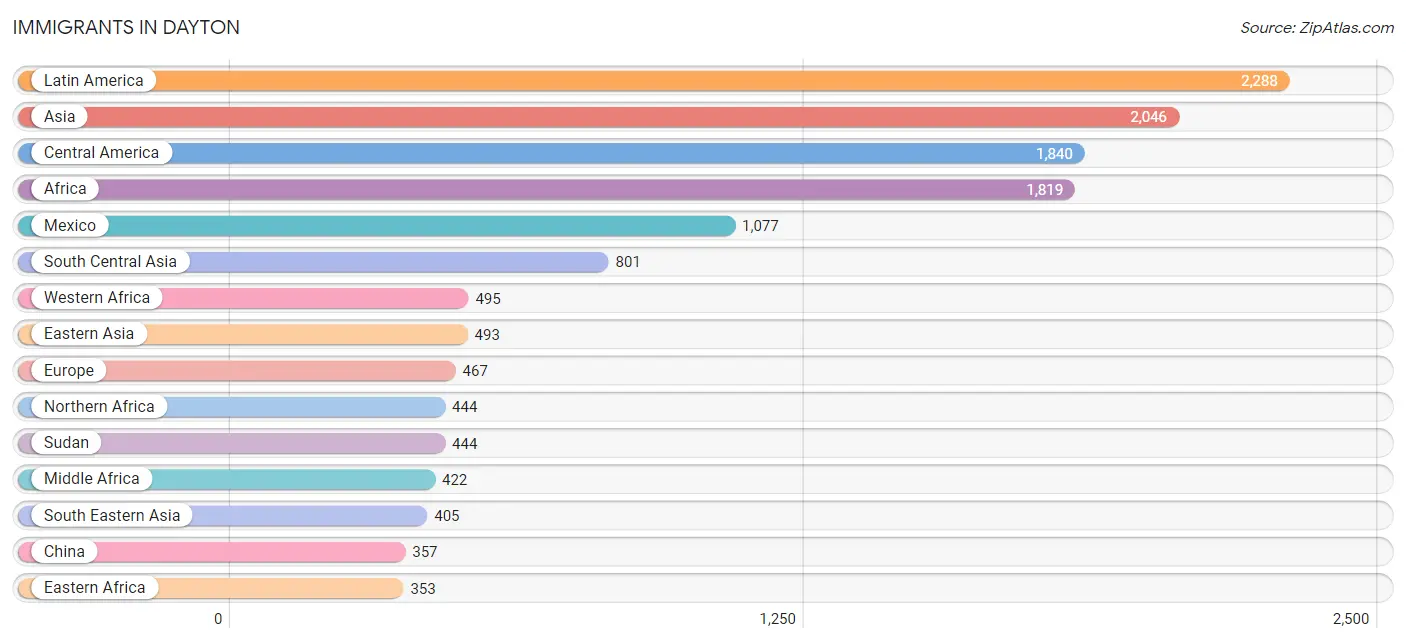
The most numerous immigrant groups reported in Dayton came from Latin America (2,288 | 1.7%), Asia (2,046 | 1.5%), Central America (1,840 | 1.3%), Africa (1,819 | 1.3%), and Mexico (1,077 | 0.8%), together accounting for 6.6% of all Dayton residents.
| Immigration Origin | # Population | % Population |
| Afghanistan | 48 | 0.0% |
| Africa | 1,819 | 1.3% |
| Asia | 2,046 | 1.5% |
| Belize | 1 | 0.0% |
| Brazil | 18 | 0.0% |
| Cameroon | 73 | 0.1% |
| Canada | 45 | 0.0% |
| Caribbean | 268 | 0.2% |
| Central America | 1,840 | 1.3% |
| China | 357 | 0.3% |
| Colombia | 42 | 0.0% |
| Congo | 149 | 0.1% |
| Costa Rica | 34 | 0.0% |
| Cuba | 10 | 0.0% |
| Dominican Republic | 207 | 0.2% |
| Eastern Africa | 353 | 0.3% |
| Eastern Asia | 493 | 0.4% |
| Eastern Europe | 164 | 0.1% |
| Ecuador | 106 | 0.1% |
| El Salvador | 166 | 0.1% |
| England | 61 | 0.0% |
| Ethiopia | 32 | 0.0% |
| Europe | 467 | 0.3% |
| France | 30 | 0.0% |
| Germany | 66 | 0.1% |
| Ghana | 111 | 0.1% |
| Guatemala | 270 | 0.2% |
| Honduras | 213 | 0.2% |
| Hong Kong | 4 | 0.0% |
| India | 345 | 0.3% |
| Iran | 12 | 0.0% |
| Iraq | 256 | 0.2% |
| Ireland | 7 | 0.0% |
| Italy | 24 | 0.0% |
| Jamaica | 51 | 0.0% |
| Japan | 41 | 0.0% |
| Kenya | 32 | 0.0% |
| Korea | 95 | 0.1% |
| Latin America | 2,288 | 1.7% |
| Lebanon | 13 | 0.0% |
| Liberia | 14 | 0.0% |
| Mexico | 1,077 | 0.8% |
| Middle Africa | 422 | 0.3% |
| Netherlands | 6 | 0.0% |
| Nigeria | 117 | 0.1% |
| Northern Africa | 444 | 0.3% |
| Northern Europe | 96 | 0.1% |
| Norway | 6 | 0.0% |
| Pakistan | 51 | 0.0% |
| Panama | 79 | 0.1% |
| Peru | 10 | 0.0% |
| Philippines | 111 | 0.1% |
| Poland | 30 | 0.0% |
| Portugal | 10 | 0.0% |
| Russia | 134 | 0.1% |
| Saudi Arabia | 41 | 0.0% |
| Scotland | 15 | 0.0% |
| Senegal | 118 | 0.1% |
| Singapore | 86 | 0.1% |
| South Africa | 14 | 0.0% |
| South America | 180 | 0.1% |
| South Central Asia | 801 | 0.6% |
| South Eastern Asia | 405 | 0.3% |
| Southern Europe | 105 | 0.1% |
| Spain | 71 | 0.1% |
| Sudan | 444 | 0.3% |
| Taiwan | 64 | 0.1% |
| Uganda | 8 | 0.0% |
| Uzbekistan | 345 | 0.3% |
| Venezuela | 4 | 0.0% |
| Vietnam | 197 | 0.1% |
| Western Africa | 495 | 0.4% |
| Western Asia | 347 | 0.3% |
| Western Europe | 102 | 0.1% |
| Zaire | 200 | 0.2% |
| Zimbabwe | 66 | 0.1% | View All 76 Rows |
Sex and Age in Dayton
Sex and Age in Dayton
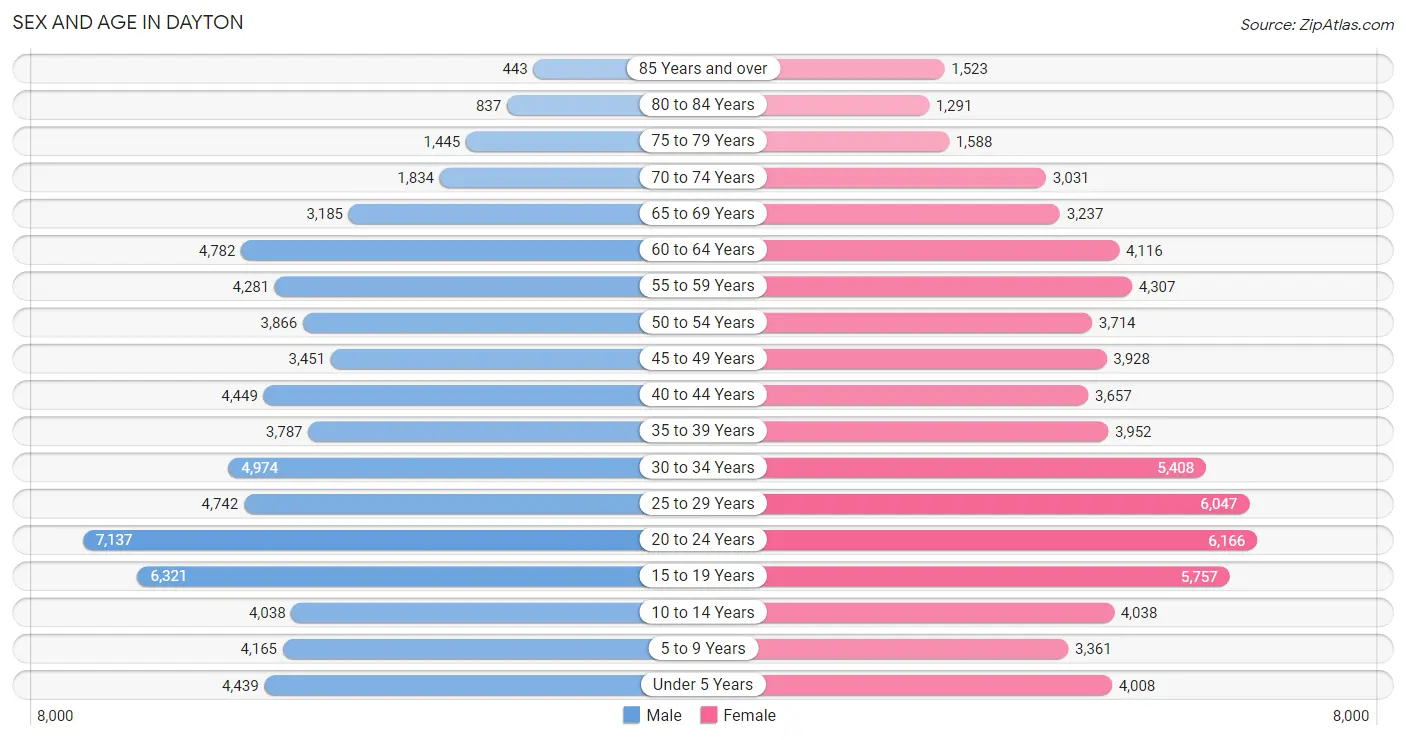
The most populous age groups in Dayton are 20 to 24 Years (7,137 | 10.5%) for men and 20 to 24 Years (6,166 | 8.9%) for women.
| Age Bracket | Male | Female |
| Under 5 Years | 4,439 (6.5%) | 4,008 (5.8%) |
| 5 to 9 Years | 4,165 (6.1%) | 3,361 (4.9%) |
| 10 to 14 Years | 4,038 (5.9%) | 4,038 (5.8%) |
| 15 to 19 Years | 6,321 (9.3%) | 5,757 (8.3%) |
| 20 to 24 Years | 7,137 (10.5%) | 6,166 (8.9%) |
| 25 to 29 Years | 4,742 (7.0%) | 6,047 (8.7%) |
| 30 to 34 Years | 4,974 (7.3%) | 5,408 (7.8%) |
| 35 to 39 Years | 3,787 (5.6%) | 3,952 (5.7%) |
| 40 to 44 Years | 4,449 (6.5%) | 3,657 (5.3%) |
| 45 to 49 Years | 3,451 (5.1%) | 3,928 (5.7%) |
| 50 to 54 Years | 3,866 (5.7%) | 3,714 (5.4%) |
| 55 to 59 Years | 4,281 (6.3%) | 4,307 (6.2%) |
| 60 to 64 Years | 4,782 (7.0%) | 4,116 (5.9%) |
| 65 to 69 Years | 3,185 (4.7%) | 3,237 (4.7%) |
| 70 to 74 Years | 1,834 (2.7%) | 3,031 (4.4%) |
| 75 to 79 Years | 1,445 (2.1%) | 1,588 (2.3%) |
| 80 to 84 Years | 837 (1.2%) | 1,291 (1.9%) |
| 85 Years and over | 443 (0.6%) | 1,523 (2.2%) |
| Total | 68,176 (100.0%) | 69,129 (100.0%) |
Families and Households in Dayton
Median Family Size in Dayton
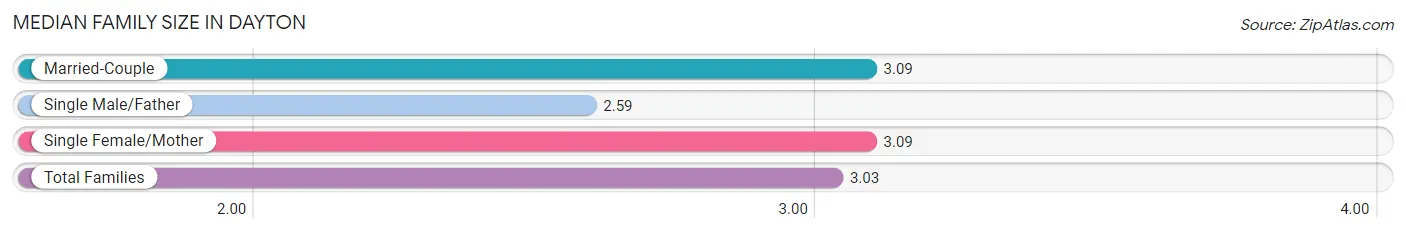
The median family size in Dayton is 3.03 persons per family, with married-couple families (12,853 | 46.4%) accounting for the largest median family size of 3.09 persons per family. On the other hand, single male/father families (3,446 | 12.4%) represent the smallest median family size with 2.59 persons per family.
| Family Type | # Families | Family Size |
| Married-Couple | 12,853 (46.4%) | 3.09 |
| Single Male/Father | 3,446 (12.4%) | 2.59 |
| Single Female/Mother | 11,410 (41.2%) | 3.09 |
| Total Families | 27,709 (100.0%) | 3.03 |
Median Household Size in Dayton
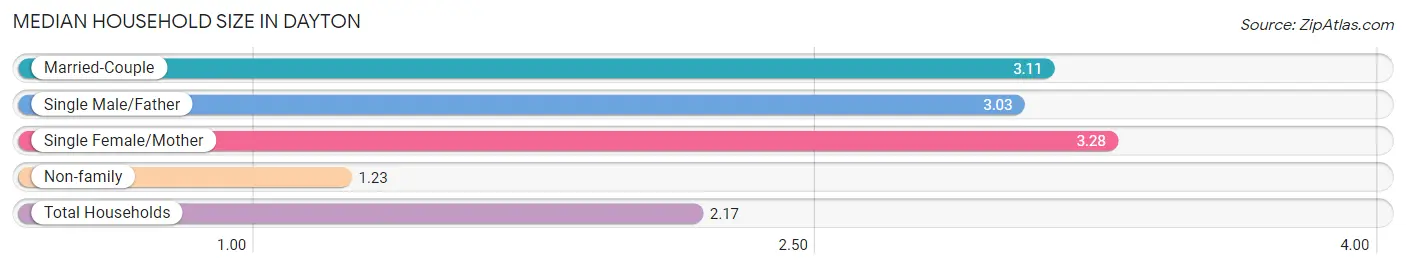
The median household size in Dayton is 2.17 persons per household, with single female/mother households (11,410 | 19.9%) accounting for the largest median household size of 3.28 persons per household. non-family households (29,653 | 51.7%) represent the smallest median household size with 1.23 persons per household.
| Household Type | # Households | Household Size |
| Married-Couple | 12,853 (22.4%) | 3.11 |
| Single Male/Father | 3,446 (6.0%) | 3.03 |
| Single Female/Mother | 11,410 (19.9%) | 3.28 |
| Non-family | 29,653 (51.7%) | 1.23 |
| Total Households | 57,362 (100.0%) | 2.17 |
Household Size by Marriage Status in Dayton
Out of a total of 57,362 households in Dayton, 27,709 (48.3%) are family households, while 29,653 (51.7%) are nonfamily households. The most numerous type of family households are 2-person households, comprising 12,830, and the most common type of nonfamily households are 1-person households, comprising 24,898.
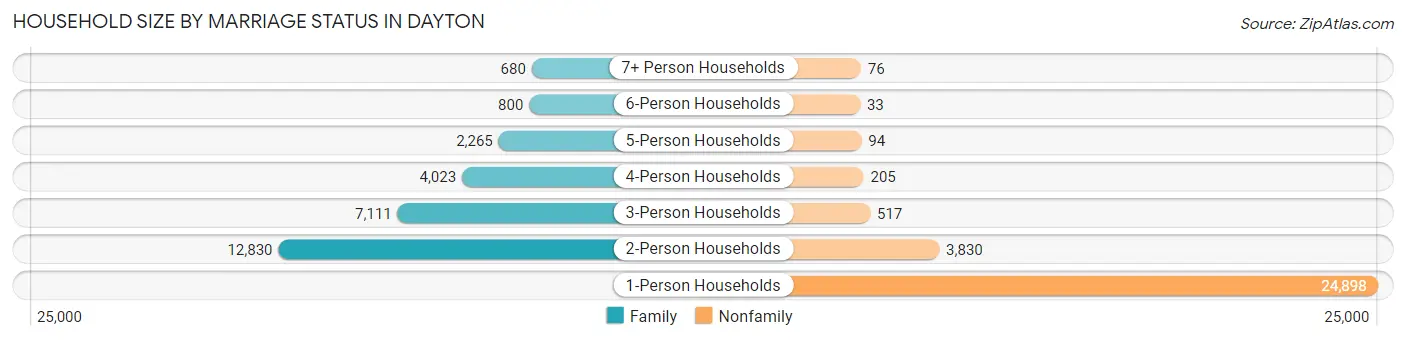
| Household Size | Family Households | Nonfamily Households |
| 1-Person Households | - | 24,898 (43.4%) |
| 2-Person Households | 12,830 (22.4%) | 3,830 (6.7%) |
| 3-Person Households | 7,111 (12.4%) | 517 (0.9%) |
| 4-Person Households | 4,023 (7.0%) | 205 (0.4%) |
| 5-Person Households | 2,265 (4.0%) | 94 (0.2%) |
| 6-Person Households | 800 (1.4%) | 33 (0.1%) |
| 7+ Person Households | 680 (1.2%) | 76 (0.1%) |
| Total | 27,709 (48.3%) | 29,653 (51.7%) |
Female Fertility in Dayton
Fertility by Age in Dayton
Average fertility rate in Dayton is 63.0 births per 1,000 women. Women in the age bracket of 20 to 34 years have the highest fertility rate with 112.0 births per 1,000 women. Women in the age bracket of 20 to 34 years acount for 88.4% of all women with births.
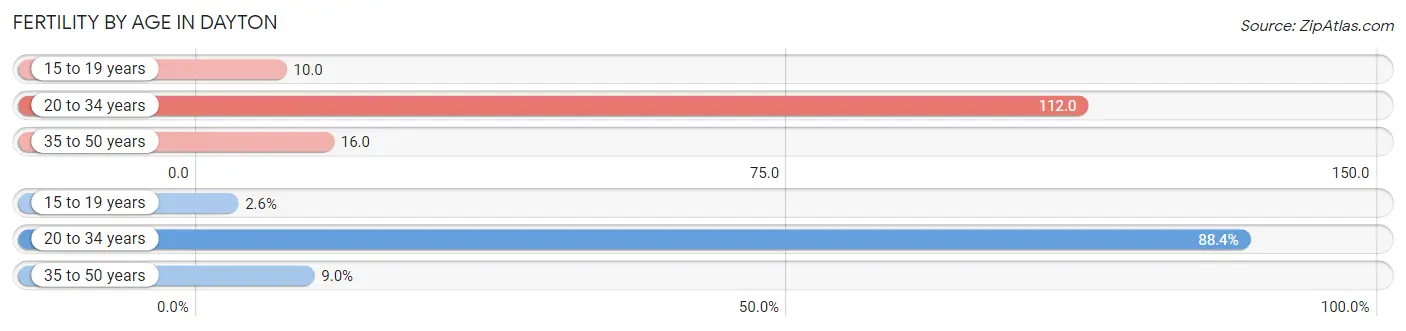
| Age Bracket | Women with Births | Births / 1,000 Women |
| 15 to 19 years | 57 (2.6%) | 10.0 |
| 20 to 34 years | 1,970 (88.4%) | 112.0 |
| 35 to 50 years | 201 (9.0%) | 16.0 |
| Total | 2,228 (100.0%) | 63.0 |
Fertility by Age by Marriage Status in Dayton
27.3% of women with births (2,228) in Dayton are married. The highest percentage of unmarried women with births falls into 15 to 19 years age bracket with 100.0% of them unmarried at the time of birth, while the lowest percentage of unmarried women with births belong to 35 to 50 years age bracket with 70.2% of them unmarried.
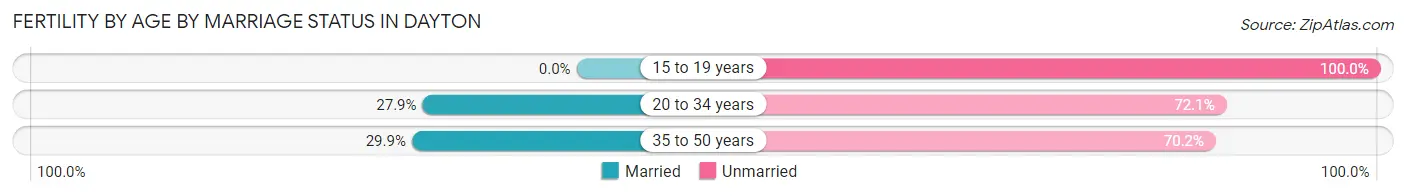
| Age Bracket | Married | Unmarried |
| 15 to 19 years | 0 (0.0%) | 57 (100.0%) |
| 20 to 34 years | 550 (27.9%) | 1,420 (72.1%) |
| 35 to 50 years | 60 (29.8%) | 141 (70.2%) |
| Total | 608 (27.3%) | 1,620 (72.7%) |
Fertility by Education in Dayton
Average fertility rate in Dayton is 63.0 births per 1,000 women. Women with the education attainment of college or associate's degree have the highest fertility rate of 79.0 births per 1,000 women, while women with the education attainment of graduate degree have the lowest fertility at 22.0 births per 1,000 women. Women with the education attainment of college or associate's degree represent 56.0% of all women with births.
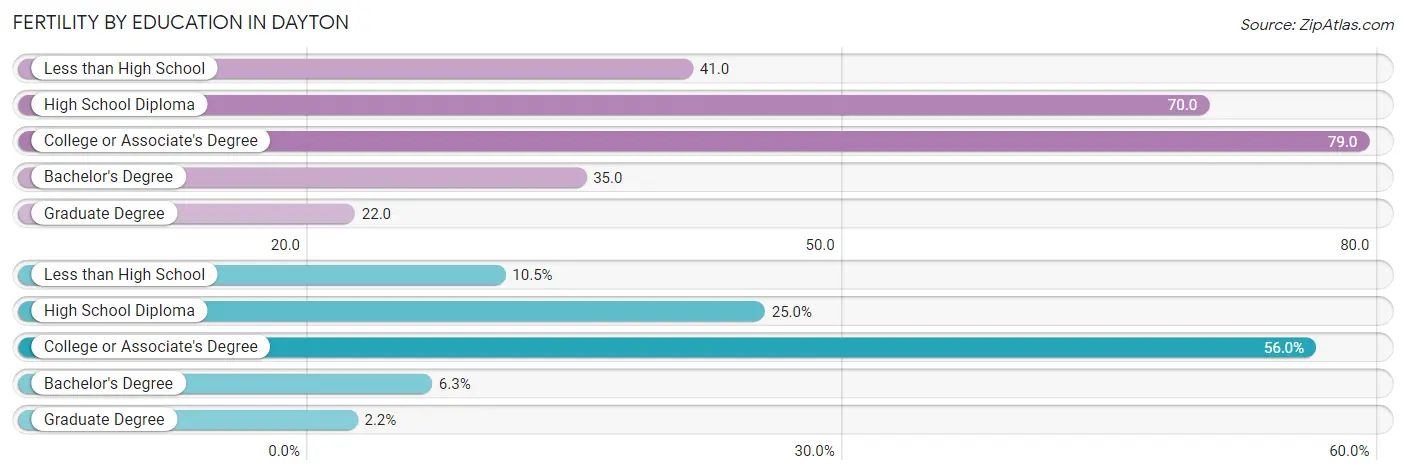
| Educational Attainment | Women with Births | Births / 1,000 Women |
| Less than High School | 233 (10.5%) | 41.0 |
| High School Diploma | 558 (25.0%) | 70.0 |
| College or Associate's Degree | 1,248 (56.0%) | 79.0 |
| Bachelor's Degree | 141 (6.3%) | 35.0 |
| Graduate Degree | 48 (2.1%) | 22.0 |
| Total | 2,228 (100.0%) | 63.0 |
Fertility by Education by Marriage Status in Dayton
72.7% of women with births in Dayton are unmarried. Women with the educational attainment of bachelor's degree are most likely to be married with 85.1% of them married at childbirth, while women with the educational attainment of less than high school are least likely to be married with 86.7% of them unmarried at childbirth.
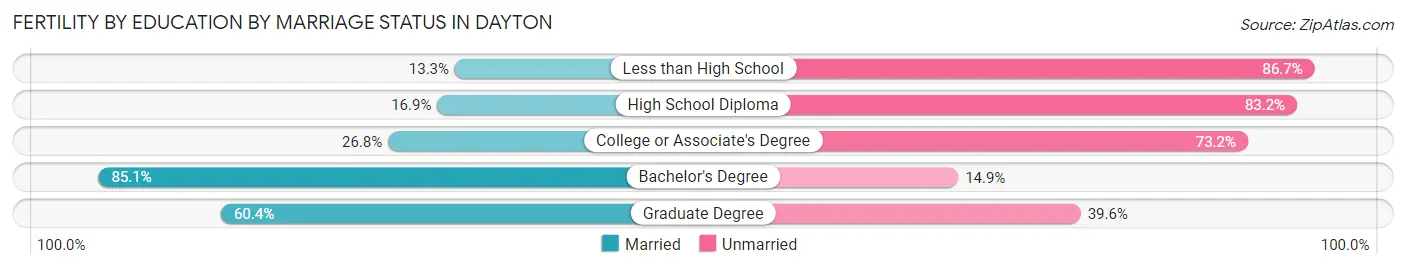
| Educational Attainment | Married | Unmarried |
| Less than High School | 31 (13.3%) | 202 (86.7%) |
| High School Diploma | 94 (16.9%) | 464 (83.2%) |
| College or Associate's Degree | 334 (26.8%) | 914 (73.2%) |
| Bachelor's Degree | 120 (85.1%) | 21 (14.9%) |
| Graduate Degree | 29 (60.4%) | 19 (39.6%) |
| Total | 608 (27.3%) | 1,620 (72.7%) |
Employment Characteristics in Dayton
Employment by Class of Employer in Dayton
Among the 57,239 employed individuals in Dayton, private company employees (40,116 | 70.1%), not-for-profit organizations (6,580 | 11.5%), and local government employees (3,808 | 6.7%) make up the most common classes of employment.
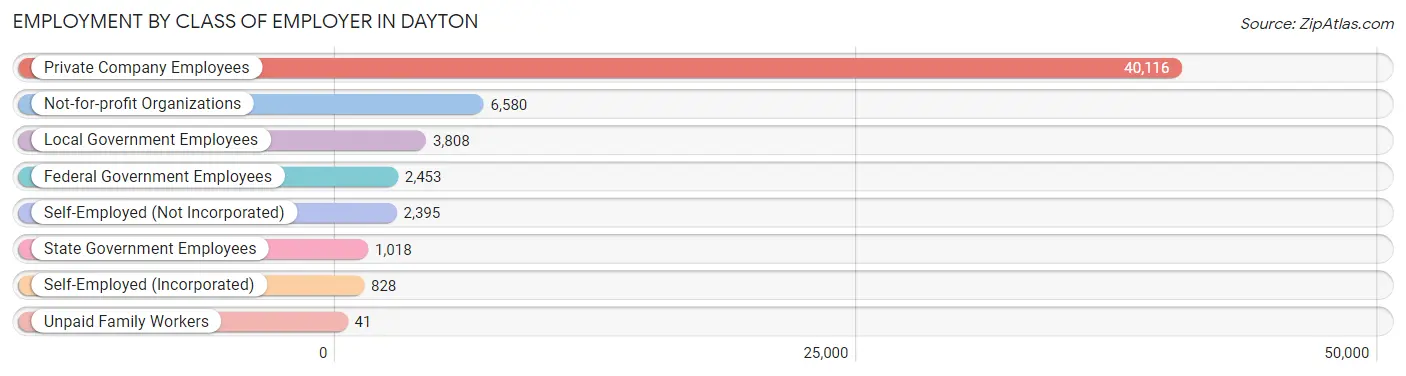
| Employer Class | # Employees | % Employees |
| Private Company Employees | 40,116 | 70.1% |
| Self-Employed (Incorporated) | 828 | 1.5% |
| Self-Employed (Not Incorporated) | 2,395 | 4.2% |
| Not-for-profit Organizations | 6,580 | 11.5% |
| Local Government Employees | 3,808 | 6.7% |
| State Government Employees | 1,018 | 1.8% |
| Federal Government Employees | 2,453 | 4.3% |
| Unpaid Family Workers | 41 | 0.1% |
| Total | 57,239 | 100.0% |
Employment Status by Age in Dayton
According to the labor force statistics for Dayton, out of the total population over 16 years of age (111,302), 58.6% or 65,223 individuals are in the labor force, with 10.0% or 6,522 of them unemployed. The age group with the highest labor force participation rate is 25 to 29 years, with 81.3% or 8,771 individuals in the labor force. Within the labor force, the 16 to 19 years age range has the highest percentage of unemployed individuals, with 32.0% or 1,199 of them being unemployed.
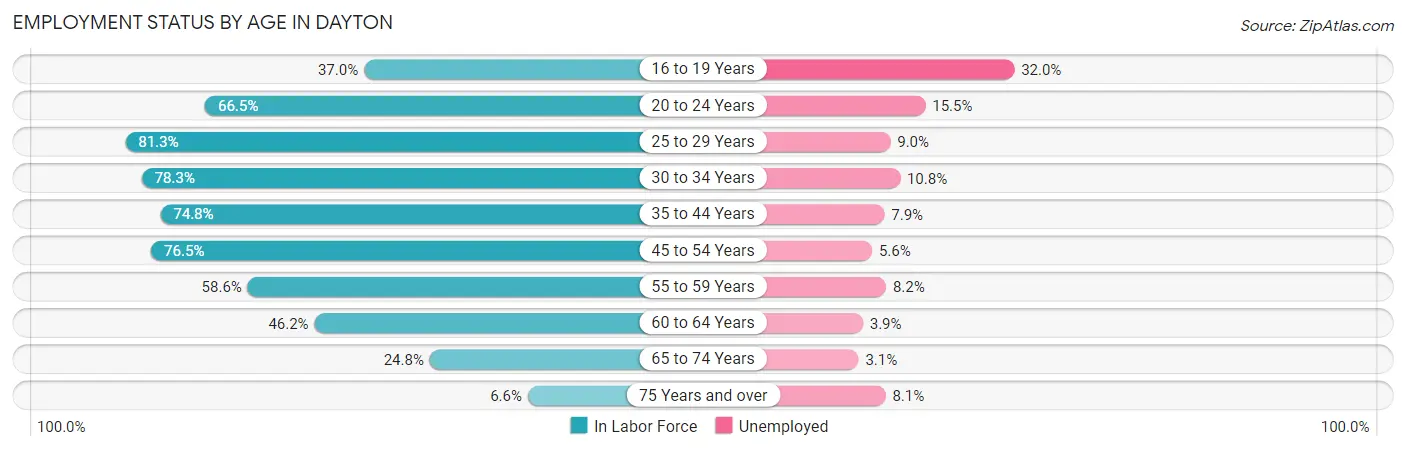
| Age Bracket | In Labor Force | Unemployed |
| 16 to 19 Years | 3,746 (37.0%) | 1,199 (32.0%) |
| 20 to 24 Years | 8,846 (66.5%) | 1,371 (15.5%) |
| 25 to 29 Years | 8,771 (81.3%) | 789 (9.0%) |
| 30 to 34 Years | 8,129 (78.3%) | 878 (10.8%) |
| 35 to 44 Years | 11,852 (74.8%) | 936 (7.9%) |
| 45 to 54 Years | 11,444 (76.5%) | 641 (5.6%) |
| 55 to 59 Years | 5,033 (58.6%) | 413 (8.2%) |
| 60 to 64 Years | 4,111 (46.2%) | 160 (3.9%) |
| 65 to 74 Years | 2,799 (24.8%) | 87 (3.1%) |
| 75 Years and over | 470 (6.6%) | 38 (8.1%) |
| Total | 65,223 (58.6%) | 6,522 (10.0%) |
Employment Status by Educational Attainment in Dayton
According to labor force statistics for Dayton, 71.0% of individuals (49,317) out of the total population between 25 and 64 years of age (69,461) are in the labor force, with 7.7% or 3,797 of them being unemployed. The group with the highest labor force participation rate are those with the educational attainment of bachelor's degree or higher, with 87.1% or 12,060 individuals in the labor force. Within the labor force, individuals with less than high school education have the highest percentage of unemployment, with 13.6% or 571 of them being unemployed.
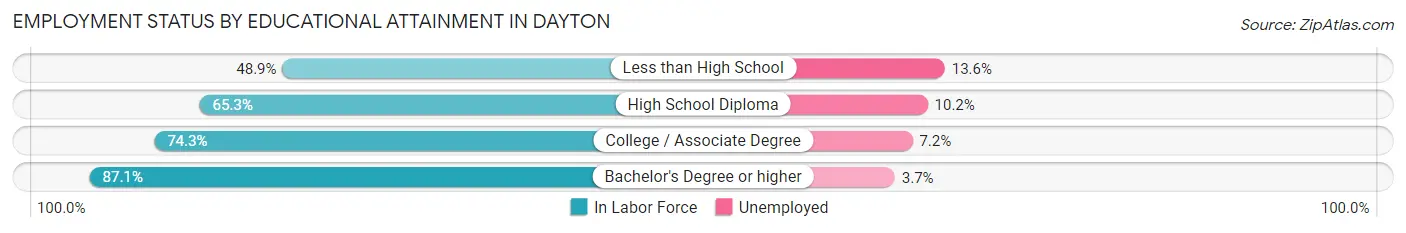
| Educational Attainment | In Labor Force | Unemployed |
| Less than High School | 4,201 (48.9%) | 1,168 (13.6%) |
| High School Diploma | 13,560 (65.3%) | 2,118 (10.2%) |
| College / Associate Degree | 19,510 (74.3%) | 1,891 (7.2%) |
| Bachelor's Degree or higher | 12,060 (87.1%) | 512 (3.7%) |
| Total | 49,317 (71.0%) | 5,348 (7.7%) |
Employment Occupations by Sex in Dayton
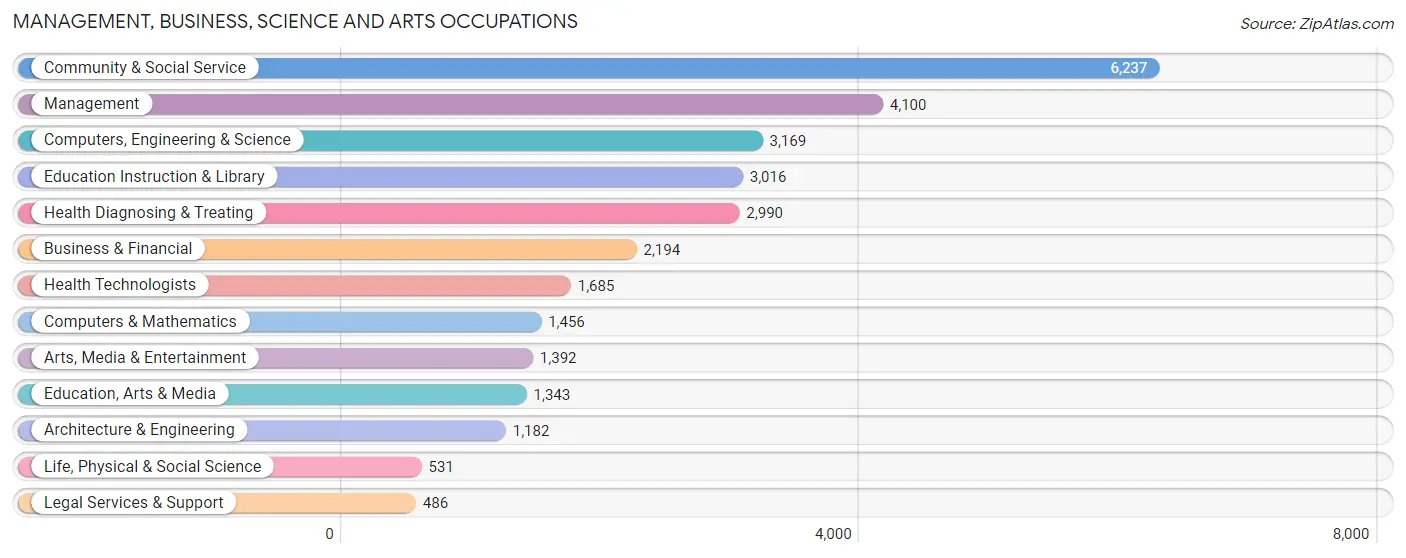
Management, Business, Science and Arts Occupations
The most common Management, Business, Science and Arts occupations in Dayton are Community & Social Service (6,237 | 10.7%), Management (4,100 | 7.0%), Computers, Engineering & Science (3,169 | 5.4%), Education Instruction & Library (3,016 | 5.2%), and Health Diagnosing & Treating (2,990 | 5.1%).
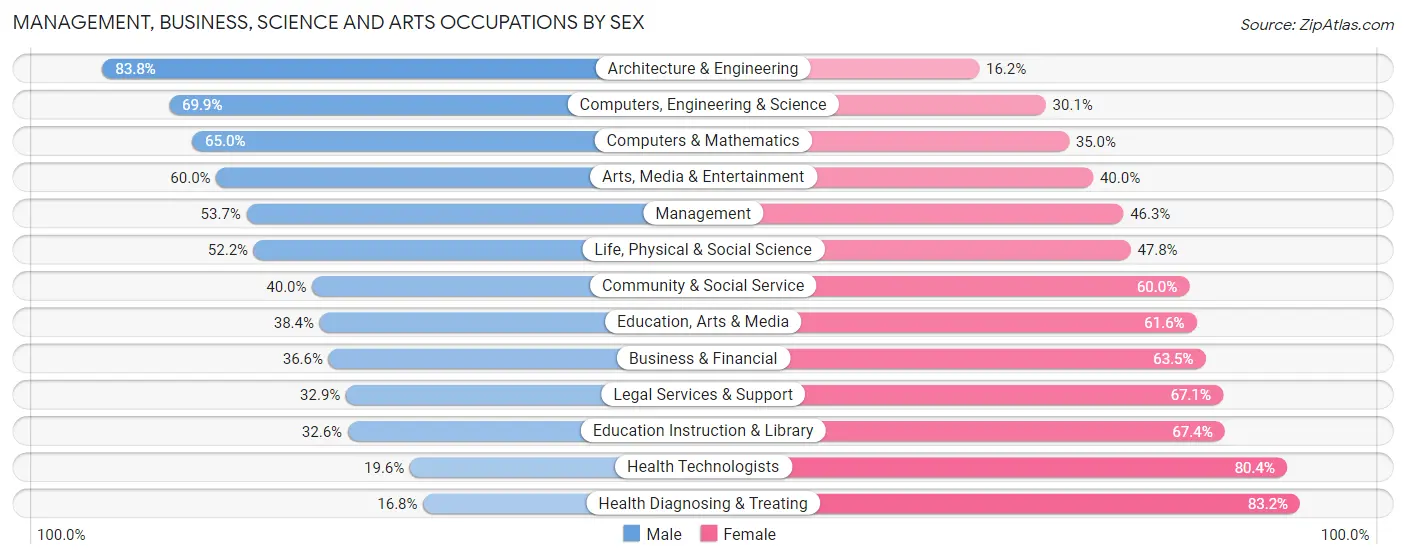
Management, Business, Science and Arts Occupations by Sex
Within the Management, Business, Science and Arts occupations in Dayton, the most male-oriented occupations are Architecture & Engineering (83.8%), Computers, Engineering & Science (69.9%), and Computers & Mathematics (65.0%), while the most female-oriented occupations are Health Diagnosing & Treating (83.2%), Health Technologists (80.4%), and Education Instruction & Library (67.4%).
| Occupation | Male | Female |
| Management | 2,201 (53.7%) | 1,899 (46.3%) |
| Business & Financial | 802 (36.5%) | 1,392 (63.4%) |
| Computers, Engineering & Science | 2,214 (69.9%) | 955 (30.1%) |
| Computers & Mathematics | 947 (65.0%) | 509 (35.0%) |
| Architecture & Engineering | 990 (83.8%) | 192 (16.2%) |
| Life, Physical & Social Science | 277 (52.2%) | 254 (47.8%) |
| Community & Social Service | 2,493 (40.0%) | 3,744 (60.0%) |
| Education, Arts & Media | 516 (38.4%) | 827 (61.6%) |
| Legal Services & Support | 160 (32.9%) | 326 (67.1%) |
| Education Instruction & Library | 982 (32.6%) | 2,034 (67.4%) |
| Arts, Media & Entertainment | 835 (60.0%) | 557 (40.0%) |
| Health Diagnosing & Treating | 503 (16.8%) | 2,487 (83.2%) |
| Health Technologists | 330 (19.6%) | 1,355 (80.4%) |
| Total (Category) | 8,213 (43.9%) | 10,477 (56.1%) |
| Total (Overall) | 29,227 (50.2%) | 29,029 (49.8%) |
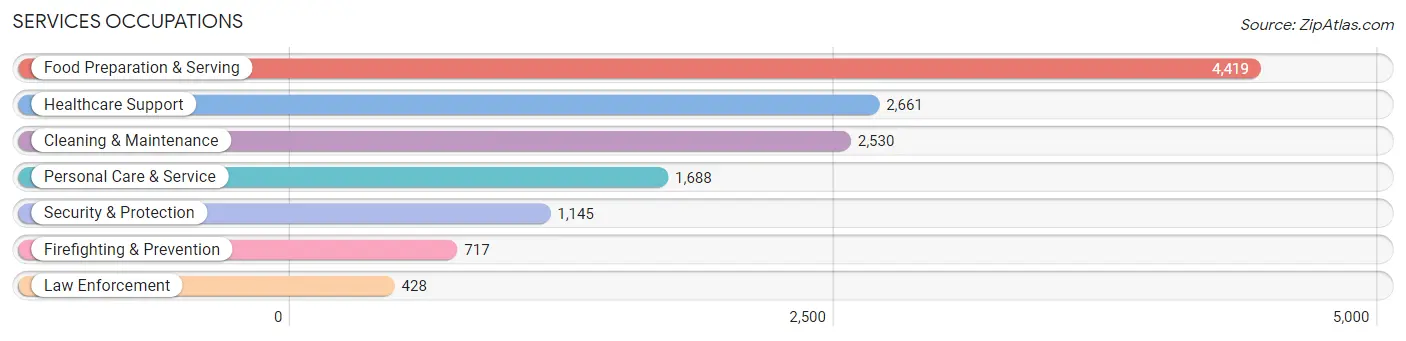
Services Occupations
The most common Services occupations in Dayton are Food Preparation & Serving (4,419 | 7.6%), Healthcare Support (2,661 | 4.6%), Cleaning & Maintenance (2,530 | 4.3%), Personal Care & Service (1,688 | 2.9%), and Security & Protection (1,145 | 2.0%).
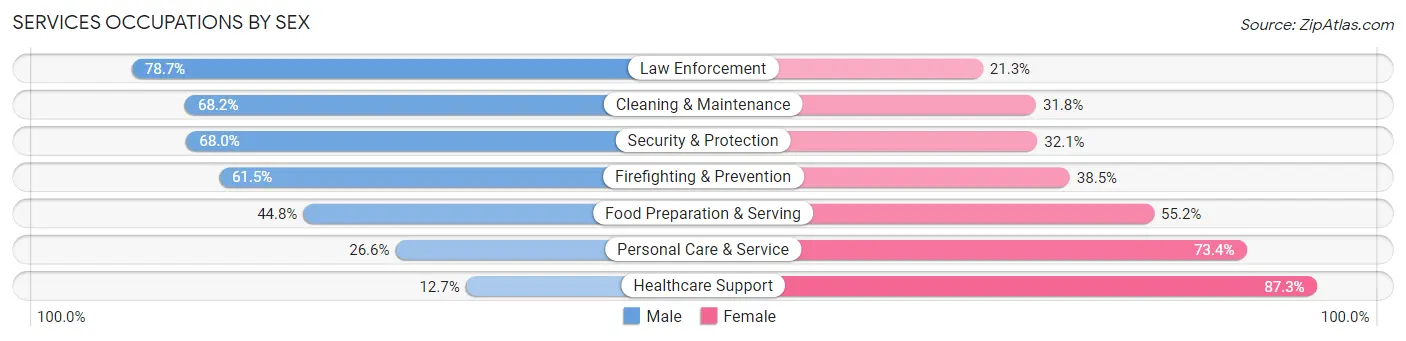
Services Occupations by Sex
Within the Services occupations in Dayton, the most male-oriented occupations are Law Enforcement (78.7%), Cleaning & Maintenance (68.2%), and Security & Protection (67.9%), while the most female-oriented occupations are Healthcare Support (87.3%), Personal Care & Service (73.4%), and Food Preparation & Serving (55.2%).
| Occupation | Male | Female |
| Healthcare Support | 338 (12.7%) | 2,323 (87.3%) |
| Security & Protection | 778 (67.9%) | 367 (32.1%) |
| Firefighting & Prevention | 441 (61.5%) | 276 (38.5%) |
| Law Enforcement | 337 (78.7%) | 91 (21.3%) |
| Food Preparation & Serving | 1,981 (44.8%) | 2,438 (55.2%) |
| Cleaning & Maintenance | 1,726 (68.2%) | 804 (31.8%) |
| Personal Care & Service | 449 (26.6%) | 1,239 (73.4%) |
| Total (Category) | 5,272 (42.4%) | 7,171 (57.6%) |
| Total (Overall) | 29,227 (50.2%) | 29,029 (49.8%) |
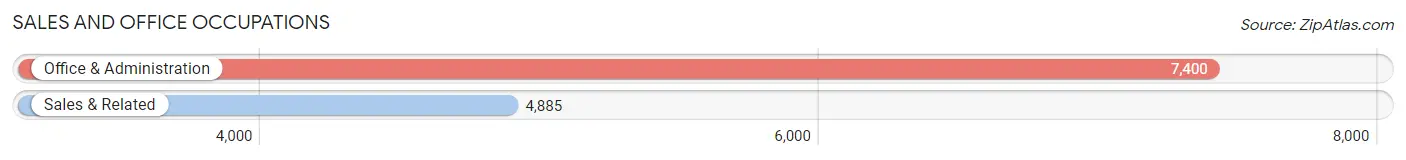
Sales and Office Occupations
The most common Sales and Office occupations in Dayton are Office & Administration (7,400 | 12.7%), and Sales & Related (4,885 | 8.4%).
Sales and Office Occupations by Sex
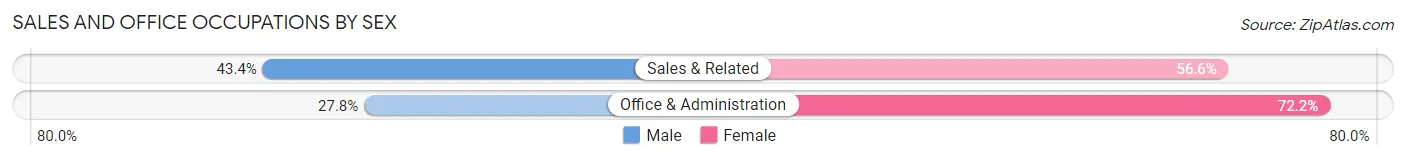
| Occupation | Male | Female |
| Sales & Related | 2,119 (43.4%) | 2,766 (56.6%) |
| Office & Administration | 2,055 (27.8%) | 5,345 (72.2%) |
| Total (Category) | 4,174 (34.0%) | 8,111 (66.0%) |
| Total (Overall) | 29,227 (50.2%) | 29,029 (49.8%) |
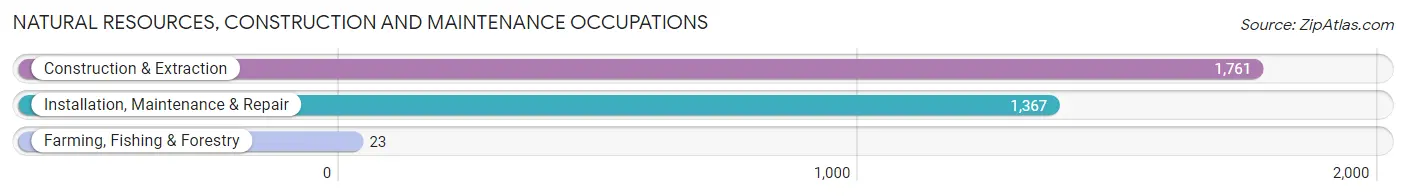
Natural Resources, Construction and Maintenance Occupations
The most common Natural Resources, Construction and Maintenance occupations in Dayton are Construction & Extraction (1,761 | 3.0%), Installation, Maintenance & Repair (1,367 | 2.4%), and Farming, Fishing & Forestry (23 | 0.0%).
Natural Resources, Construction and Maintenance Occupations by Sex
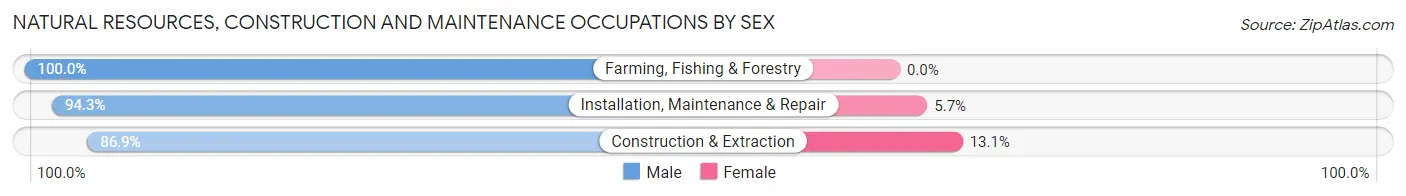
| Occupation | Male | Female |
| Farming, Fishing & Forestry | 23 (100.0%) | 0 (0.0%) |
| Construction & Extraction | 1,531 (86.9%) | 230 (13.1%) |
| Installation, Maintenance & Repair | 1,289 (94.3%) | 78 (5.7%) |
| Total (Category) | 2,843 (90.2%) | 308 (9.8%) |
| Total (Overall) | 29,227 (50.2%) | 29,029 (49.8%) |
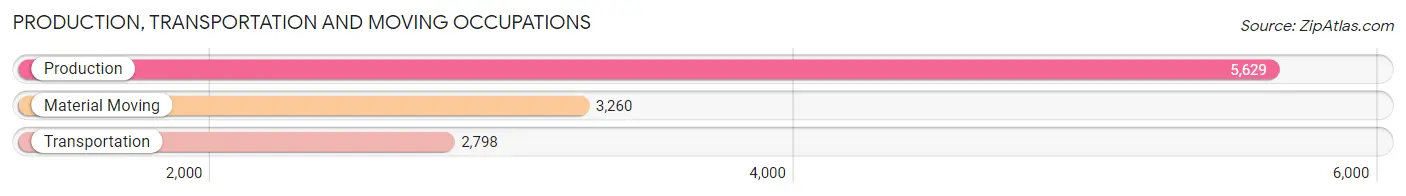
Production, Transportation and Moving Occupations
The most common Production, Transportation and Moving occupations in Dayton are Production (5,629 | 9.7%), Material Moving (3,260 | 5.6%), and Transportation (2,798 | 4.8%).
Production, Transportation and Moving Occupations by Sex
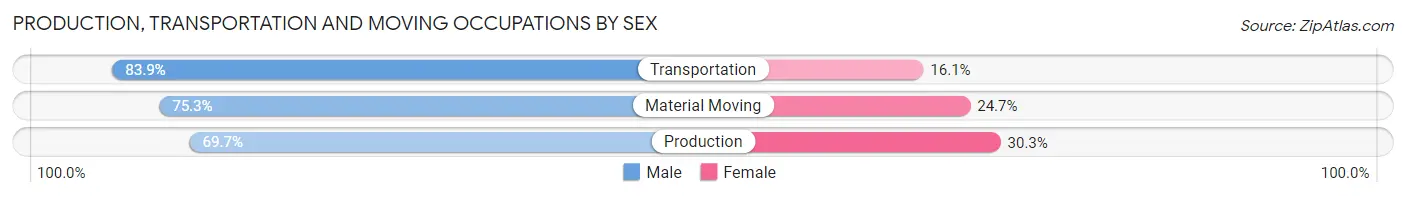
| Occupation | Male | Female |
| Production | 3,924 (69.7%) | 1,705 (30.3%) |
| Transportation | 2,347 (83.9%) | 451 (16.1%) |
| Material Moving | 2,454 (75.3%) | 806 (24.7%) |
| Total (Category) | 8,725 (74.7%) | 2,962 (25.3%) |
| Total (Overall) | 29,227 (50.2%) | 29,029 (49.8%) |
Employment Industries by Sex in Dayton
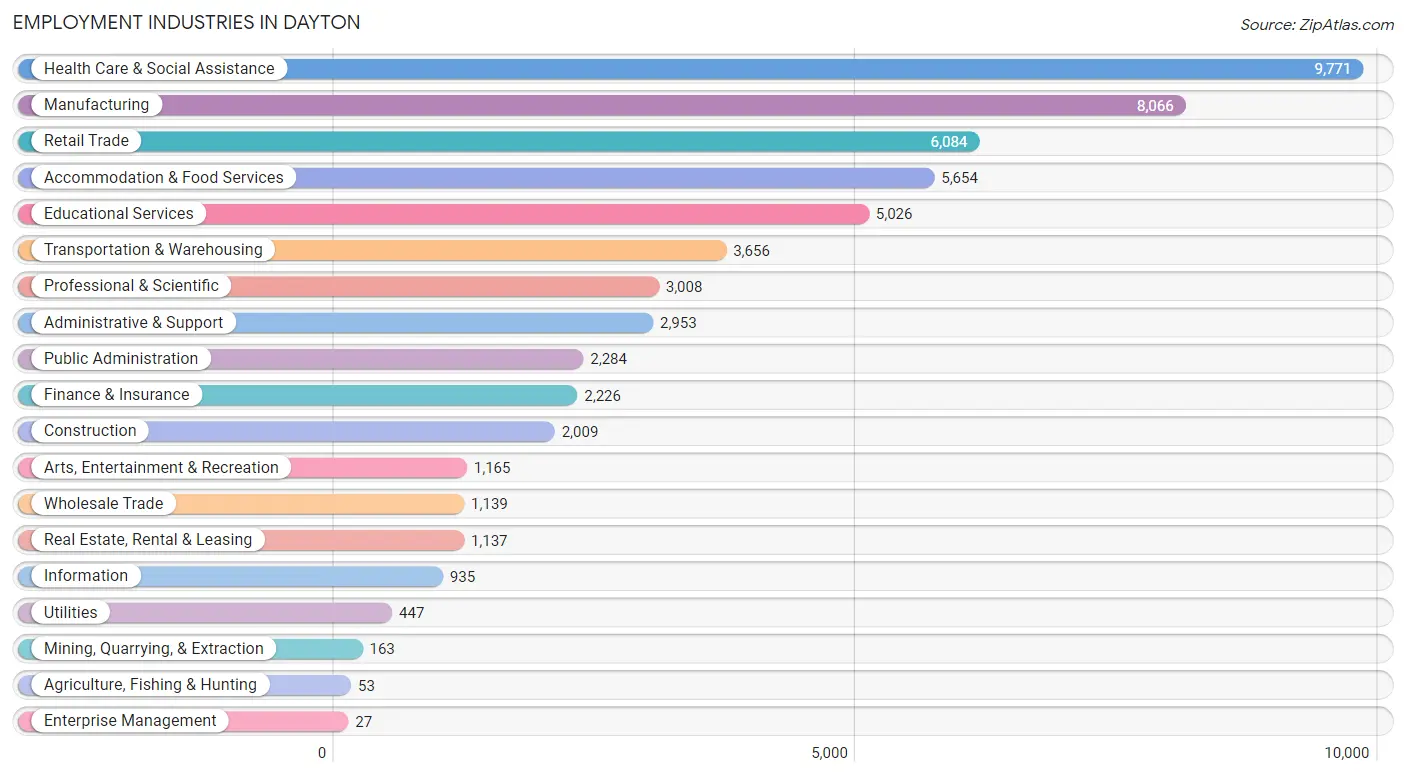
Employment Industries in Dayton
The major employment industries in Dayton include Health Care & Social Assistance (9,771 | 16.8%), Manufacturing (8,066 | 13.9%), Retail Trade (6,084 | 10.4%), Accommodation & Food Services (5,654 | 9.7%), and Educational Services (5,026 | 8.6%).
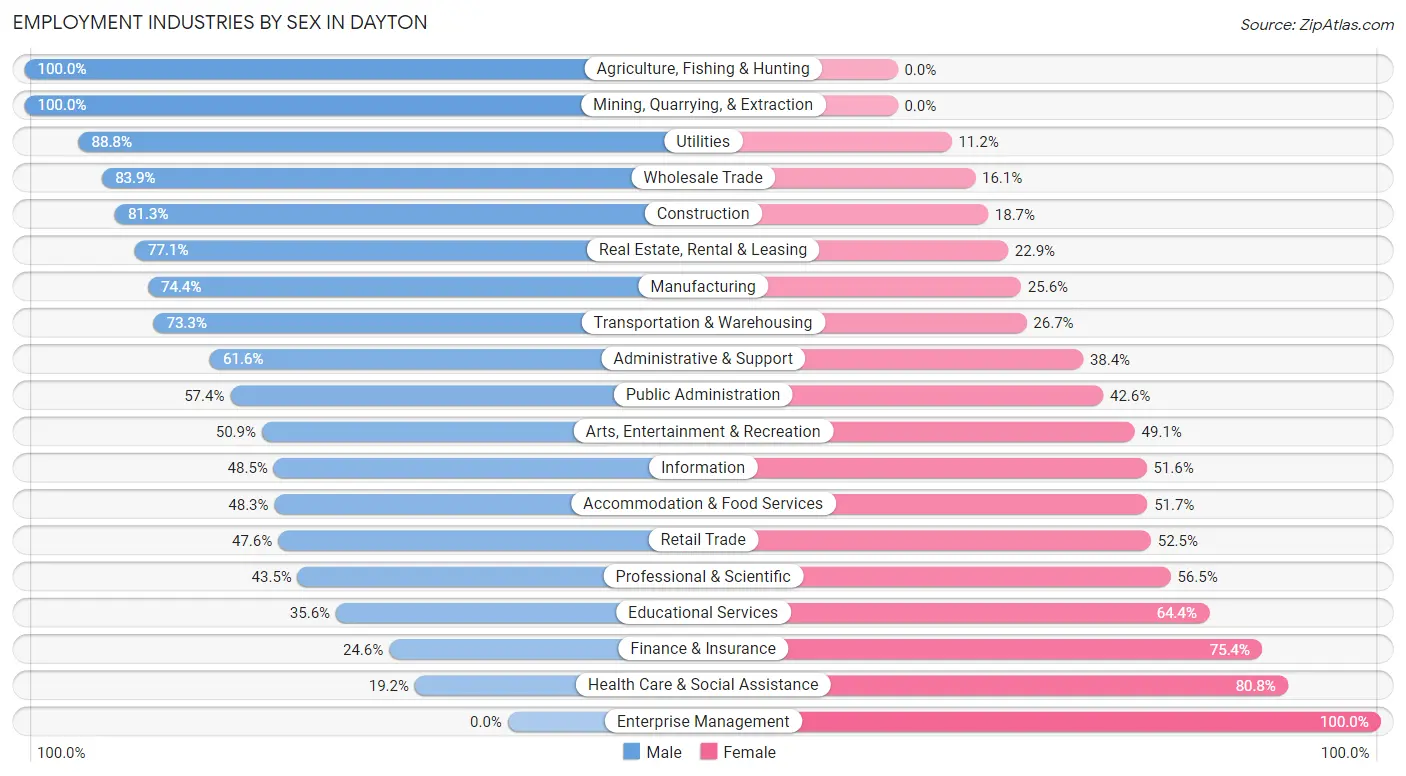
Employment Industries by Sex in Dayton
The Dayton industries that see more men than women are Agriculture, Fishing & Hunting (100.0%), Mining, Quarrying, & Extraction (100.0%), and Utilities (88.8%), whereas the industries that tend to have a higher number of women are Enterprise Management (100.0%), Health Care & Social Assistance (80.8%), and Finance & Insurance (75.4%).
| Industry | Male | Female |
| Agriculture, Fishing & Hunting | 53 (100.0%) | 0 (0.0%) |
| Mining, Quarrying, & Extraction | 163 (100.0%) | 0 (0.0%) |
| Construction | 1,633 (81.3%) | 376 (18.7%) |
| Manufacturing | 6,004 (74.4%) | 2,062 (25.6%) |
| Wholesale Trade | 956 (83.9%) | 183 (16.1%) |
| Retail Trade | 2,893 (47.5%) | 3,191 (52.4%) |
| Transportation & Warehousing | 2,680 (73.3%) | 976 (26.7%) |
| Utilities | 397 (88.8%) | 50 (11.2%) |
| Information | 453 (48.4%) | 482 (51.5%) |
| Finance & Insurance | 547 (24.6%) | 1,679 (75.4%) |
| Real Estate, Rental & Leasing | 877 (77.1%) | 260 (22.9%) |
| Professional & Scientific | 1,308 (43.5%) | 1,700 (56.5%) |
| Enterprise Management | 0 (0.0%) | 27 (100.0%) |
| Administrative & Support | 1,819 (61.6%) | 1,134 (38.4%) |
| Educational Services | 1,787 (35.6%) | 3,239 (64.4%) |
| Health Care & Social Assistance | 1,879 (19.2%) | 7,892 (80.8%) |
| Arts, Entertainment & Recreation | 593 (50.9%) | 572 (49.1%) |
| Accommodation & Food Services | 2,731 (48.3%) | 2,923 (51.7%) |
| Public Administration | 1,312 (57.4%) | 972 (42.6%) |
| Total | 29,227 (50.2%) | 29,029 (49.8%) |
Education in Dayton
School Enrollment in Dayton
The most common levels of schooling among the 38,854 students in Dayton are college / undergraduate (15,101 | 38.9%), high school (6,244 | 16.1%), and middle school (6,108 | 15.7%).
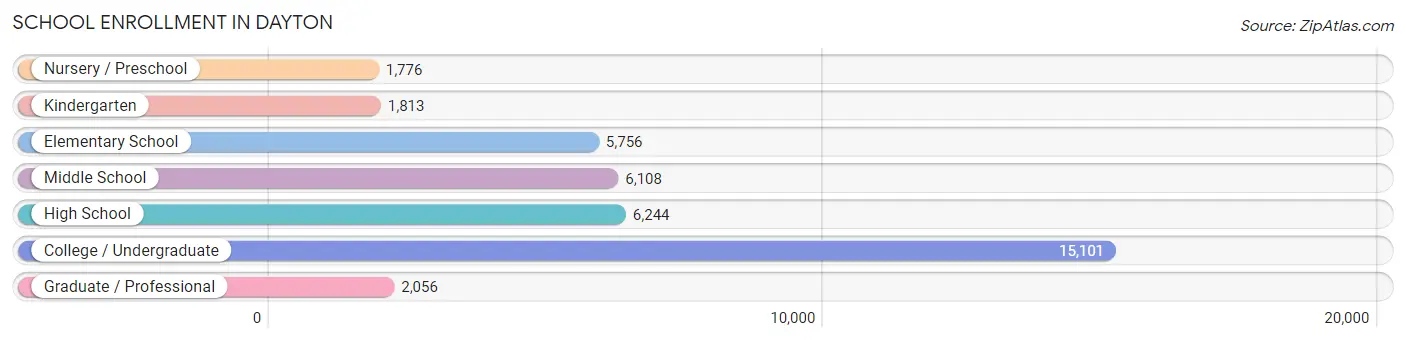
| School Level | # Students | % Students |
| Nursery / Preschool | 1,776 | 4.6% |
| Kindergarten | 1,813 | 4.7% |
| Elementary School | 5,756 | 14.8% |
| Middle School | 6,108 | 15.7% |
| High School | 6,244 | 16.1% |
| College / Undergraduate | 15,101 | 38.9% |
| Graduate / Professional | 2,056 | 5.3% |
| Total | 38,854 | 100.0% |
School Enrollment by Age by Funding Source in Dayton
Out of a total of 38,854 students who are enrolled in schools in Dayton, 15,619 (40.2%) attend a private institution, while the remaining 23,235 (59.8%) are enrolled in public schools. The age group of 20 to 24 year olds has the highest likelihood of being enrolled in private schools, with 5,236 (66.9% in the age bracket) enrolled. Conversely, the age group of 35 years and over has the lowest likelihood of being enrolled in a private school, with 1,655 (79.9% in the age bracket) attending a public institution.
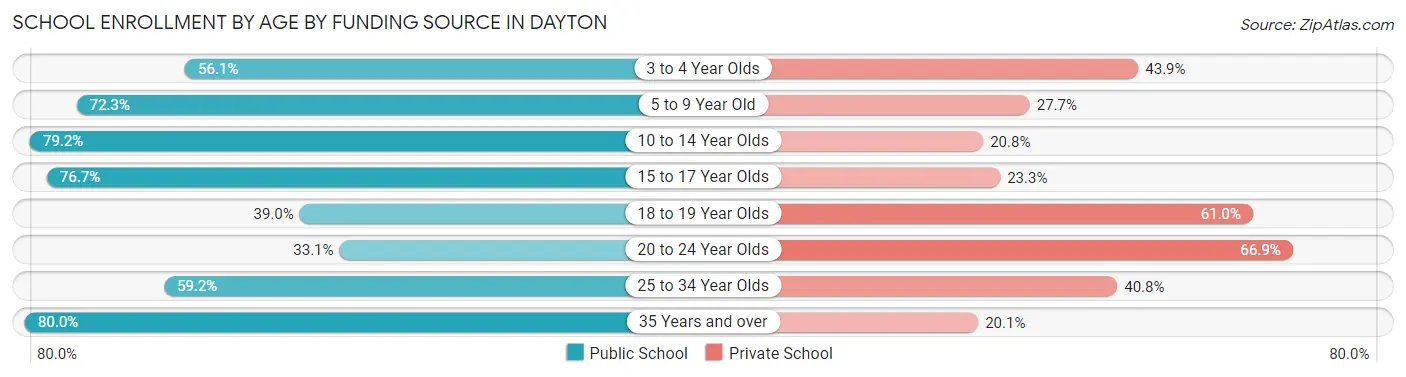
| Age Bracket | Public School | Private School |
| 3 to 4 Year Olds | 843 (56.1%) | 660 (43.9%) |
| 5 to 9 Year Old | 4,712 (72.3%) | 1,809 (27.7%) |
| 10 to 14 Year Olds | 6,070 (79.2%) | 1,594 (20.8%) |
| 15 to 17 Year Olds | 3,445 (76.7%) | 1,048 (23.3%) |
| 18 to 19 Year Olds | 2,507 (39.0%) | 3,917 (61.0%) |
| 20 to 24 Year Olds | 2,591 (33.1%) | 5,236 (66.9%) |
| 25 to 34 Year Olds | 1,393 (59.2%) | 959 (40.8%) |
| 35 Years and over | 1,655 (79.9%) | 415 (20.1%) |
| Total | 23,235 (59.8%) | 15,619 (40.2%) |
Educational Attainment by Field of Study in Dayton
Business (3,806 | 19.8%), education (2,462 | 12.8%), science & technology (1,734 | 9.0%), social sciences (1,604 | 8.4%), and arts & humanities (1,428 | 7.4%) are the most common fields of study among 19,203 individuals in Dayton who have obtained a bachelor's degree or higher.
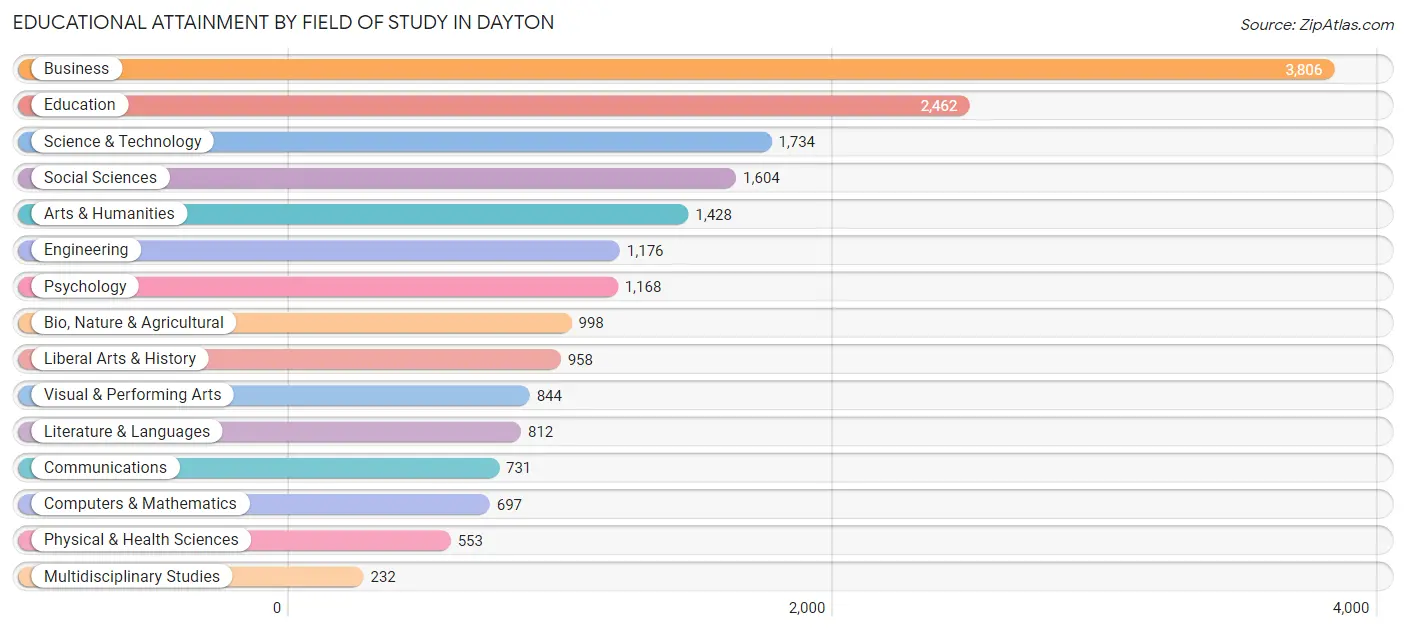
| Field of Study | # Graduates | % Graduates |
| Computers & Mathematics | 697 | 3.6% |
| Bio, Nature & Agricultural | 998 | 5.2% |
| Physical & Health Sciences | 553 | 2.9% |
| Psychology | 1,168 | 6.1% |
| Social Sciences | 1,604 | 8.4% |
| Engineering | 1,176 | 6.1% |
| Multidisciplinary Studies | 232 | 1.2% |
| Science & Technology | 1,734 | 9.0% |
| Business | 3,806 | 19.8% |
| Education | 2,462 | 12.8% |
| Literature & Languages | 812 | 4.2% |
| Liberal Arts & History | 958 | 5.0% |
| Visual & Performing Arts | 844 | 4.4% |
| Communications | 731 | 3.8% |
| Arts & Humanities | 1,428 | 7.4% |
| Total | 19,203 | 100.0% |
Transportation & Commute in Dayton
Vehicle Availability by Sex in Dayton
The most prevalent vehicle ownership categories in Dayton are males with 2 vehicles (10,864, accounting for 39.4%) and females with 2 vehicles (10,018, making up 40.9%).
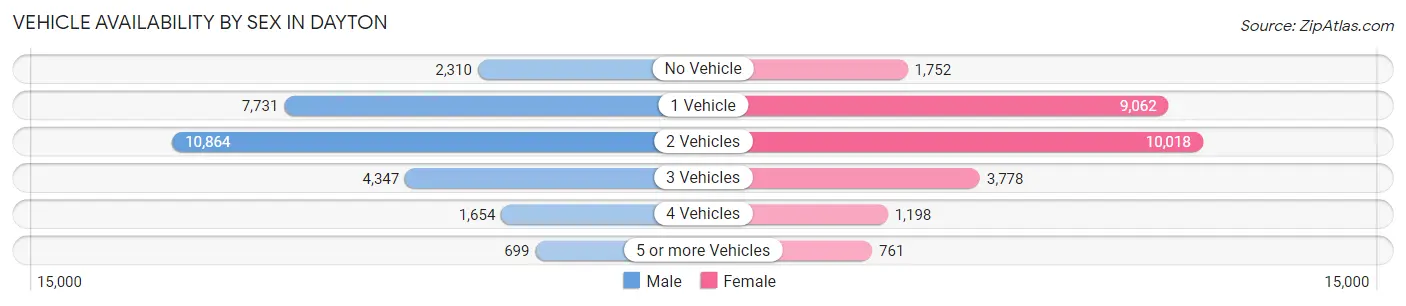
| Vehicles Available | Male | Female |
| No Vehicle | 2,310 (8.4%) | 1,752 (6.6%) |
| 1 Vehicle | 7,731 (28.0%) | 9,062 (34.1%) |
| 2 Vehicles | 10,864 (39.4%) | 10,018 (37.7%) |
| 3 Vehicles | 4,347 (15.8%) | 3,778 (14.2%) |
| 4 Vehicles | 1,654 (6.0%) | 1,198 (4.5%) |
| 5 or more Vehicles | 699 (2.5%) | 761 (2.9%) |
| Total | 27,605 (100.0%) | 26,569 (100.0%) |
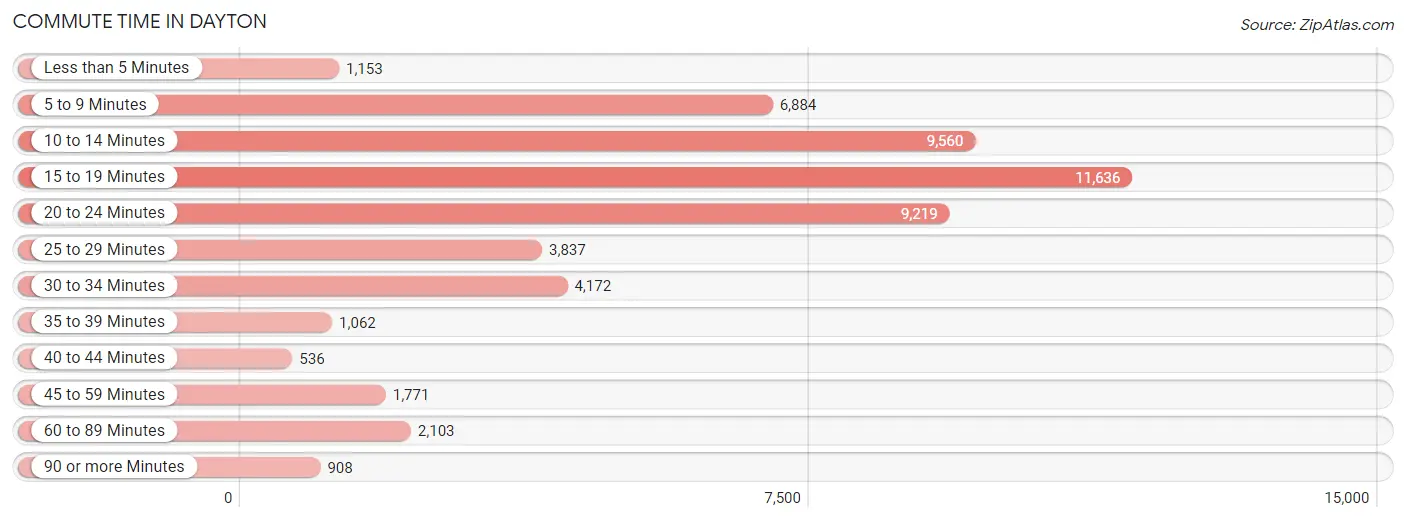
Commute Time in Dayton
The most frequently occuring commute durations in Dayton are 15 to 19 minutes (11,636 commuters, 22.0%), 10 to 14 minutes (9,560 commuters, 18.1%), and 20 to 24 minutes (9,219 commuters, 17.4%).
| Commute Time | # Commuters | % Commuters |
| Less than 5 Minutes | 1,153 | 2.2% |
| 5 to 9 Minutes | 6,884 | 13.0% |
| 10 to 14 Minutes | 9,560 | 18.1% |
| 15 to 19 Minutes | 11,636 | 22.0% |
| 20 to 24 Minutes | 9,219 | 17.4% |
| 25 to 29 Minutes | 3,837 | 7.3% |
| 30 to 34 Minutes | 4,172 | 7.9% |
| 35 to 39 Minutes | 1,062 | 2.0% |
| 40 to 44 Minutes | 536 | 1.0% |
| 45 to 59 Minutes | 1,771 | 3.4% |
| 60 to 89 Minutes | 2,103 | 4.0% |
| 90 or more Minutes | 908 | 1.7% |
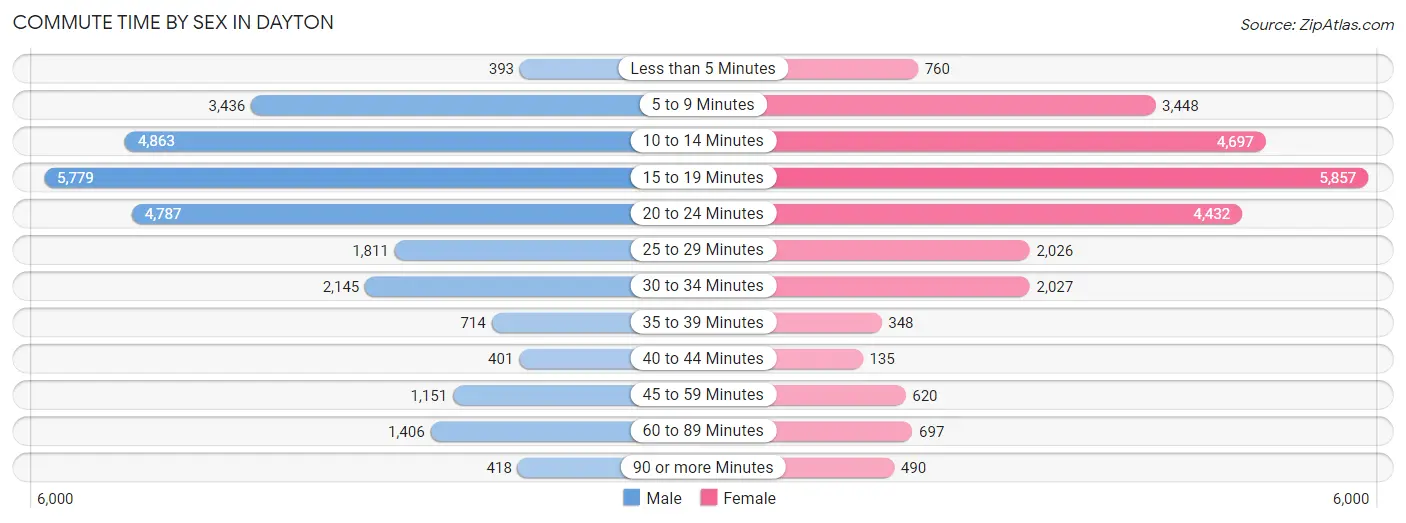
Commute Time by Sex in Dayton
The most common commute times in Dayton are 15 to 19 minutes (5,779 commuters, 21.2%) for males and 15 to 19 minutes (5,857 commuters, 22.9%) for females.
| Commute Time | Male | Female |
| Less than 5 Minutes | 393 (1.4%) | 760 (3.0%) |
| 5 to 9 Minutes | 3,436 (12.6%) | 3,448 (13.5%) |
| 10 to 14 Minutes | 4,863 (17.8%) | 4,697 (18.4%) |
| 15 to 19 Minutes | 5,779 (21.2%) | 5,857 (22.9%) |
| 20 to 24 Minutes | 4,787 (17.5%) | 4,432 (17.4%) |
| 25 to 29 Minutes | 1,811 (6.6%) | 2,026 (7.9%) |
| 30 to 34 Minutes | 2,145 (7.9%) | 2,027 (7.9%) |
| 35 to 39 Minutes | 714 (2.6%) | 348 (1.4%) |
| 40 to 44 Minutes | 401 (1.5%) | 135 (0.5%) |
| 45 to 59 Minutes | 1,151 (4.2%) | 620 (2.4%) |
| 60 to 89 Minutes | 1,406 (5.1%) | 697 (2.7%) |
| 90 or more Minutes | 418 (1.5%) | 490 (1.9%) |
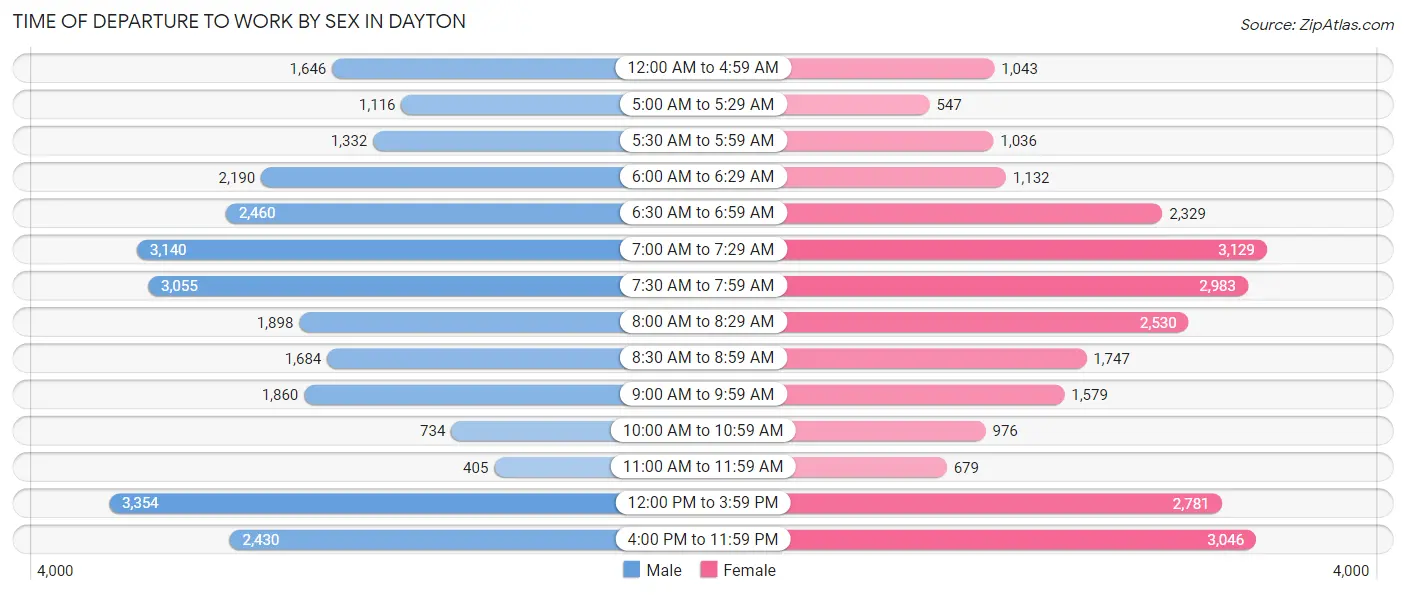
Time of Departure to Work by Sex in Dayton
The most frequent times of departure to work in Dayton are 12:00 PM to 3:59 PM (3,354, 12.3%) for males and 7:00 AM to 7:29 AM (3,129, 12.2%) for females.
| Time of Departure | Male | Female |
| 12:00 AM to 4:59 AM | 1,646 (6.0%) | 1,043 (4.1%) |
| 5:00 AM to 5:29 AM | 1,116 (4.1%) | 547 (2.1%) |
| 5:30 AM to 5:59 AM | 1,332 (4.9%) | 1,036 (4.1%) |
| 6:00 AM to 6:29 AM | 2,190 (8.0%) | 1,132 (4.4%) |
| 6:30 AM to 6:59 AM | 2,460 (9.0%) | 2,329 (9.1%) |
| 7:00 AM to 7:29 AM | 3,140 (11.5%) | 3,129 (12.2%) |
| 7:30 AM to 7:59 AM | 3,055 (11.2%) | 2,983 (11.7%) |
| 8:00 AM to 8:29 AM | 1,898 (7.0%) | 2,530 (9.9%) |
| 8:30 AM to 8:59 AM | 1,684 (6.2%) | 1,747 (6.8%) |
| 9:00 AM to 9:59 AM | 1,860 (6.8%) | 1,579 (6.2%) |
| 10:00 AM to 10:59 AM | 734 (2.7%) | 976 (3.8%) |
| 11:00 AM to 11:59 AM | 405 (1.5%) | 679 (2.7%) |
| 12:00 PM to 3:59 PM | 3,354 (12.3%) | 2,781 (10.9%) |
| 4:00 PM to 11:59 PM | 2,430 (8.9%) | 3,046 (11.9%) |
| Total | 27,304 (100.0%) | 25,537 (100.0%) |
Housing Occupancy in Dayton
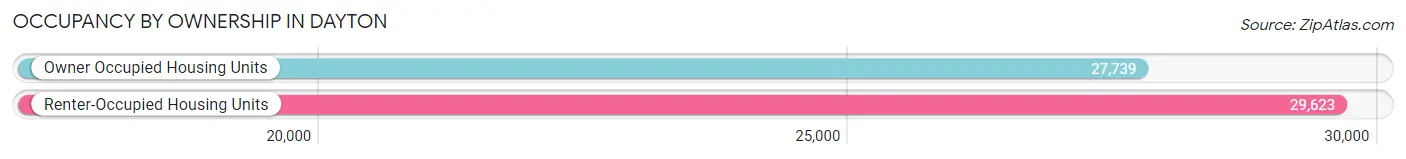
Occupancy by Ownership in Dayton
Of the total 57,362 dwellings in Dayton, owner-occupied units account for 27,739 (48.4%), while renter-occupied units make up 29,623 (51.6%).
| Occupancy | # Housing Units | % Housing Units |
| Owner Occupied Housing Units | 27,739 | 48.4% |
| Renter-Occupied Housing Units | 29,623 | 51.6% |
| Total Occupied Housing Units | 57,362 | 100.0% |
Occupancy by Household Size in Dayton
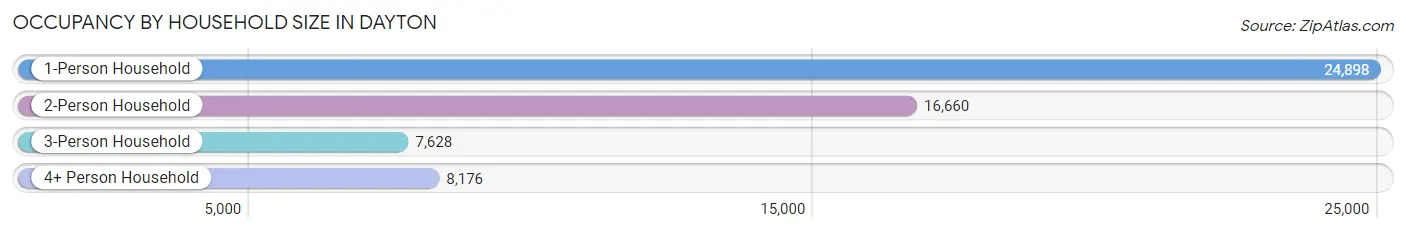
| Household Size | # Housing Units | % Housing Units |
| 1-Person Household | 24,898 | 43.4% |
| 2-Person Household | 16,660 | 29.0% |
| 3-Person Household | 7,628 | 13.3% |
| 4+ Person Household | 8,176 | 14.2% |
| Total Housing Units | 57,362 | 100.0% |
Occupancy by Ownership by Household Size in Dayton
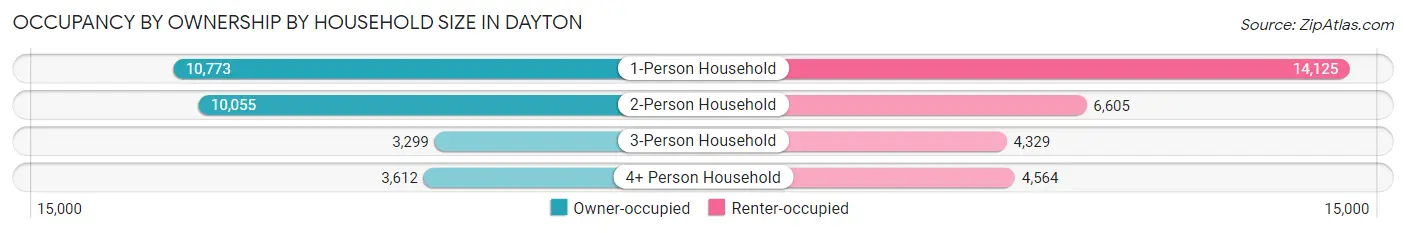
| Household Size | Owner-occupied | Renter-occupied |
| 1-Person Household | 10,773 (43.3%) | 14,125 (56.7%) |
| 2-Person Household | 10,055 (60.4%) | 6,605 (39.7%) |
| 3-Person Household | 3,299 (43.2%) | 4,329 (56.8%) |
| 4+ Person Household | 3,612 (44.2%) | 4,564 (55.8%) |
| Total Housing Units | 27,739 (48.4%) | 29,623 (51.6%) |
Occupancy by Educational Attainment in Dayton
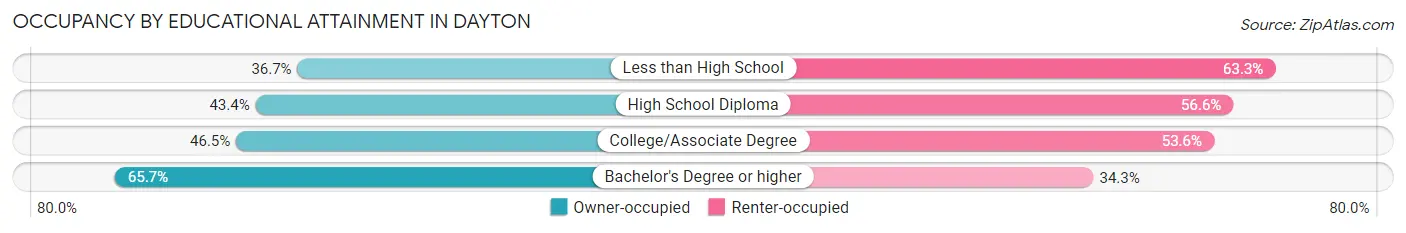
| Household Size | Owner-occupied | Renter-occupied |
| Less than High School | 2,600 (36.7%) | 4,481 (63.3%) |
| High School Diploma | 6,981 (43.4%) | 9,112 (56.6%) |
| College/Associate Degree | 10,378 (46.5%) | 11,964 (53.5%) |
| Bachelor's Degree or higher | 7,780 (65.7%) | 4,066 (34.3%) |
Occupancy by Age of Householder in Dayton
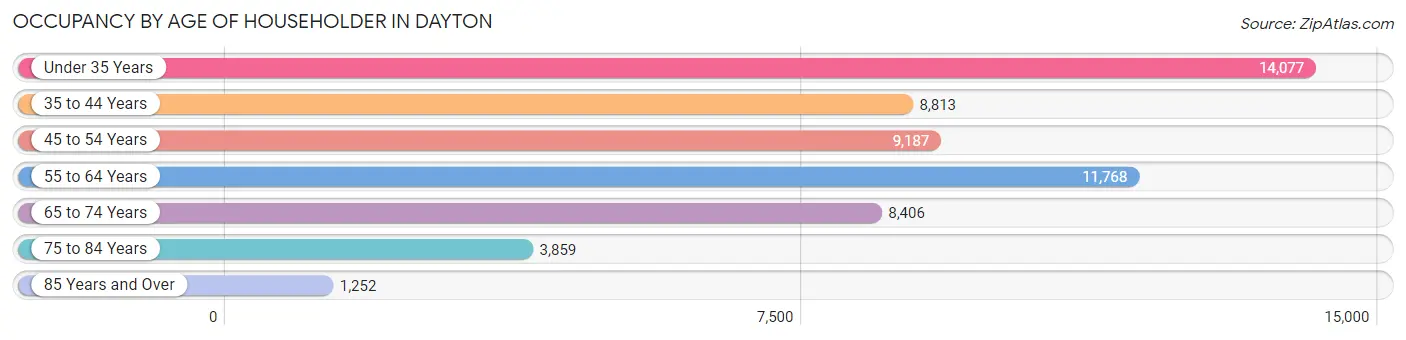
| Age Bracket | # Households | % Households |
| Under 35 Years | 14,077 | 24.5% |
| 35 to 44 Years | 8,813 | 15.4% |
| 45 to 54 Years | 9,187 | 16.0% |
| 55 to 64 Years | 11,768 | 20.5% |
| 65 to 74 Years | 8,406 | 14.6% |
| 75 to 84 Years | 3,859 | 6.7% |
| 85 Years and Over | 1,252 | 2.2% |
| Total | 57,362 | 100.0% |
Housing Finances in Dayton
Median Income by Occupancy in Dayton
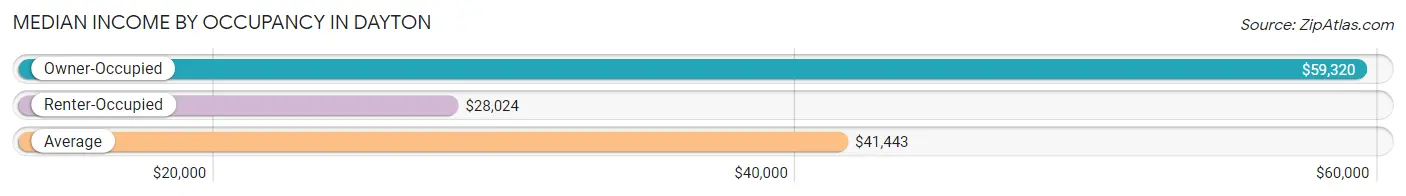
| Occupancy Type | # Households | Median Income |
| Owner-Occupied | 27,739 (48.4%) | $59,320 |
| Renter-Occupied | 29,623 (51.6%) | $28,024 |
| Average | 57,362 (100.0%) | $41,443 |
Occupancy by Householder Income Bracket in Dayton
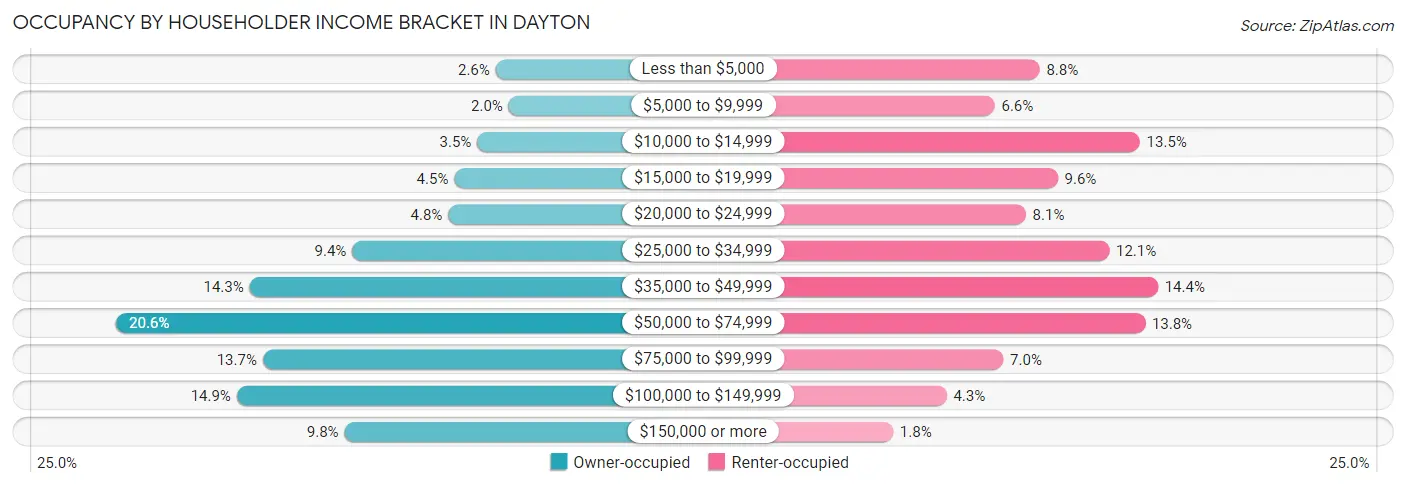
| Income Bracket | Owner-occupied | Renter-occupied |
| Less than $5,000 | 712 (2.6%) | 2,595 (8.8%) |
| $5,000 to $9,999 | 542 (1.9%) | 1,960 (6.6%) |
| $10,000 to $14,999 | 957 (3.5%) | 4,007 (13.5%) |
| $15,000 to $19,999 | 1,259 (4.5%) | 2,850 (9.6%) |
| $20,000 to $24,999 | 1,341 (4.8%) | 2,400 (8.1%) |
| $25,000 to $34,999 | 2,607 (9.4%) | 3,576 (12.1%) |
| $35,000 to $49,999 | 3,964 (14.3%) | 4,262 (14.4%) |
| $50,000 to $74,999 | 5,724 (20.6%) | 4,081 (13.8%) |
| $75,000 to $99,999 | 3,790 (13.7%) | 2,082 (7.0%) |
| $100,000 to $149,999 | 4,134 (14.9%) | 1,283 (4.3%) |
| $150,000 or more | 2,709 (9.8%) | 527 (1.8%) |
| Total | 27,739 (100.0%) | 29,623 (100.0%) |
Monthly Housing Cost Tiers in Dayton
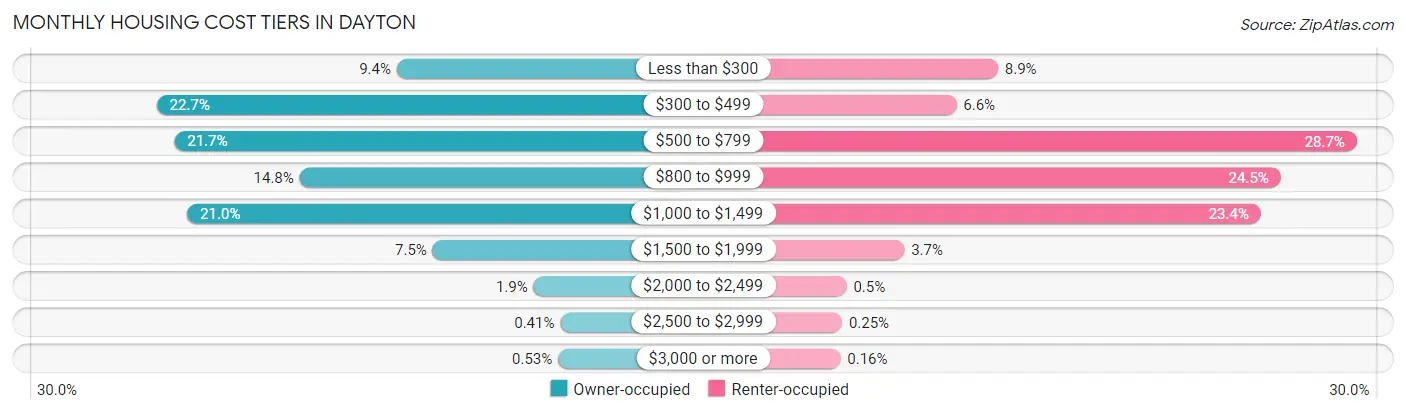
| Monthly Cost | Owner-occupied | Renter-occupied |
| Less than $300 | 2,619 (9.4%) | 2,626 (8.9%) |
| $300 to $499 | 6,300 (22.7%) | 1,947 (6.6%) |
| $500 to $799 | 6,027 (21.7%) | 8,495 (28.7%) |
| $800 to $999 | 4,109 (14.8%) | 7,252 (24.5%) |
| $1,000 to $1,499 | 5,832 (21.0%) | 6,927 (23.4%) |
| $1,500 to $1,999 | 2,068 (7.5%) | 1,092 (3.7%) |
| $2,000 to $2,499 | 524 (1.9%) | 149 (0.5%) |
| $2,500 to $2,999 | 113 (0.4%) | 73 (0.3%) |
| $3,000 or more | 147 (0.5%) | 46 (0.2%) |
| Total | 27,739 (100.0%) | 29,623 (100.0%) |
Physical Housing Characteristics in Dayton
Housing Structures in Dayton
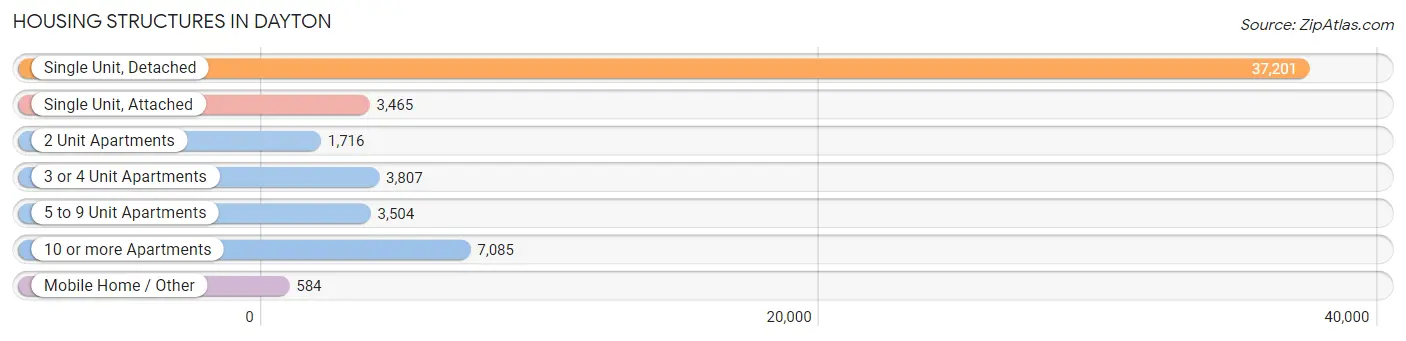
| Structure Type | # Housing Units | % Housing Units |
| Single Unit, Detached | 37,201 | 64.8% |
| Single Unit, Attached | 3,465 | 6.0% |
| 2 Unit Apartments | 1,716 | 3.0% |
| 3 or 4 Unit Apartments | 3,807 | 6.6% |
| 5 to 9 Unit Apartments | 3,504 | 6.1% |
| 10 or more Apartments | 7,085 | 12.3% |
| Mobile Home / Other | 584 | 1.0% |
| Total | 57,362 | 100.0% |
Housing Structures by Occupancy in Dayton
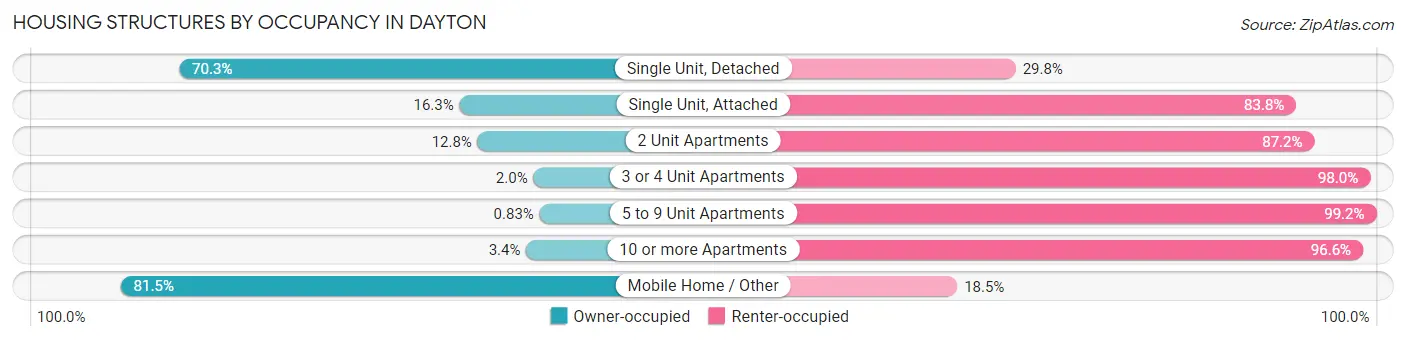
| Structure Type | Owner-occupied | Renter-occupied |
| Single Unit, Detached | 26,134 (70.3%) | 11,067 (29.7%) |
| Single Unit, Attached | 563 (16.3%) | 2,902 (83.8%) |
| 2 Unit Apartments | 219 (12.8%) | 1,497 (87.2%) |
| 3 or 4 Unit Apartments | 77 (2.0%) | 3,730 (98.0%) |
| 5 to 9 Unit Apartments | 29 (0.8%) | 3,475 (99.2%) |
| 10 or more Apartments | 241 (3.4%) | 6,844 (96.6%) |
| Mobile Home / Other | 476 (81.5%) | 108 (18.5%) |
| Total | 27,739 (48.4%) | 29,623 (51.6%) |
Housing Structures by Number of Rooms in Dayton
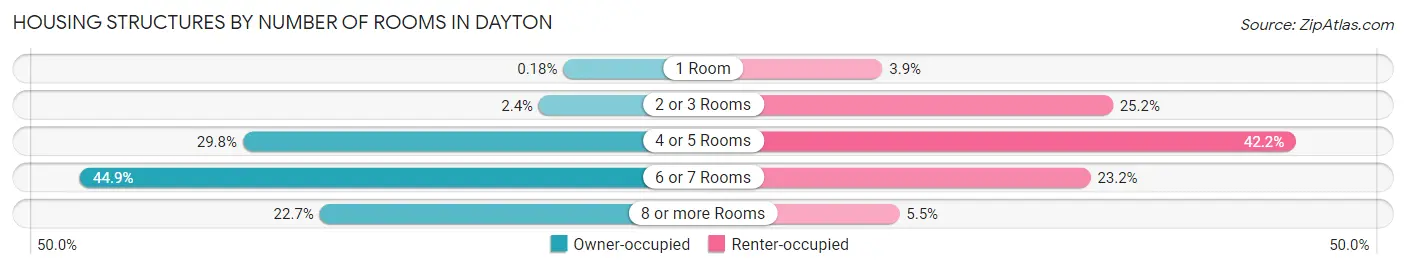
| Number of Rooms | Owner-occupied | Renter-occupied |
| 1 Room | 50 (0.2%) | 1,162 (3.9%) |
| 2 or 3 Rooms | 674 (2.4%) | 7,475 (25.2%) |
| 4 or 5 Rooms | 8,273 (29.8%) | 12,495 (42.2%) |
| 6 or 7 Rooms | 12,443 (44.9%) | 6,863 (23.2%) |
| 8 or more Rooms | 6,299 (22.7%) | 1,628 (5.5%) |
| Total | 27,739 (100.0%) | 29,623 (100.0%) |
Housing Structure by Heating Type in Dayton
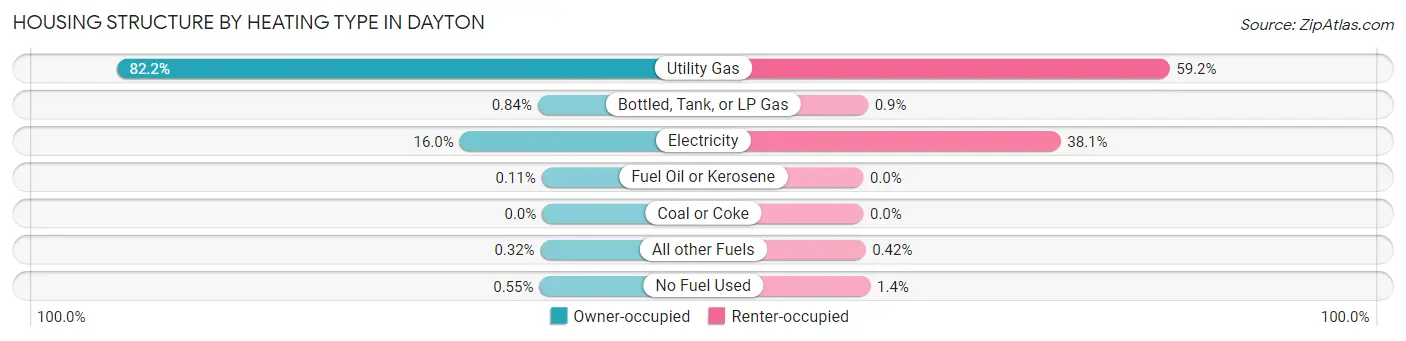
| Heating Type | Owner-occupied | Renter-occupied |
| Utility Gas | 22,811 (82.2%) | 17,532 (59.2%) |
| Bottled, Tank, or LP Gas | 233 (0.8%) | 268 (0.9%) |
| Electricity | 4,424 (16.0%) | 11,295 (38.1%) |
| Fuel Oil or Kerosene | 31 (0.1%) | 0 (0.0%) |
| Coal or Coke | 0 (0.0%) | 0 (0.0%) |
| All other Fuels | 88 (0.3%) | 123 (0.4%) |
| No Fuel Used | 152 (0.5%) | 405 (1.4%) |
| Total | 27,739 (100.0%) | 29,623 (100.0%) |
Household Vehicle Usage in Dayton
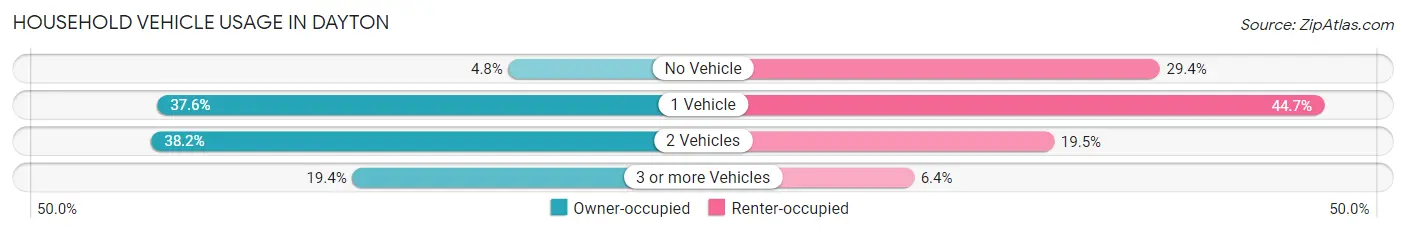
| Vehicles per Household | Owner-occupied | Renter-occupied |
| No Vehicle | 1,336 (4.8%) | 8,700 (29.4%) |
| 1 Vehicle | 10,436 (37.6%) | 13,242 (44.7%) |
| 2 Vehicles | 10,589 (38.2%) | 5,778 (19.5%) |
| 3 or more Vehicles | 5,378 (19.4%) | 1,903 (6.4%) |
| Total | 27,739 (100.0%) | 29,623 (100.0%) |
Real Estate & Mortgages in Dayton
Real Estate and Mortgage Overview in Dayton
| Characteristic | Without Mortgage | With Mortgage |
| Housing Units | 12,527 | 15,212 |
| Median Property Value | $64,600 | $102,800 |
| Median Household Income | $46,493 | $1,863 |
| Monthly Housing Costs | $414 | $127 |
| Real Estate Taxes | $1,291 | $412 |
Property Value by Mortgage Status in Dayton
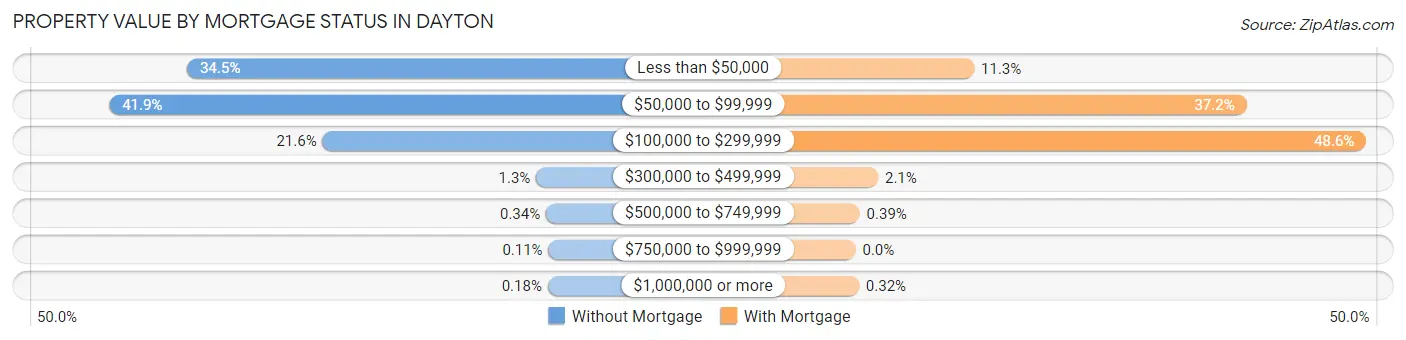
| Property Value | Without Mortgage | With Mortgage |
| Less than $50,000 | 4,325 (34.5%) | 1,717 (11.3%) |
| $50,000 to $99,999 | 5,254 (41.9%) | 5,663 (37.2%) |
| $100,000 to $299,999 | 2,710 (21.6%) | 7,397 (48.6%) |
| $300,000 to $499,999 | 160 (1.3%) | 326 (2.1%) |
| $500,000 to $749,999 | 42 (0.3%) | 60 (0.4%) |
| $750,000 to $999,999 | 14 (0.1%) | 0 (0.0%) |
| $1,000,000 or more | 22 (0.2%) | 49 (0.3%) |
| Total | 12,527 (100.0%) | 15,212 (100.0%) |
Household Income by Mortgage Status in Dayton
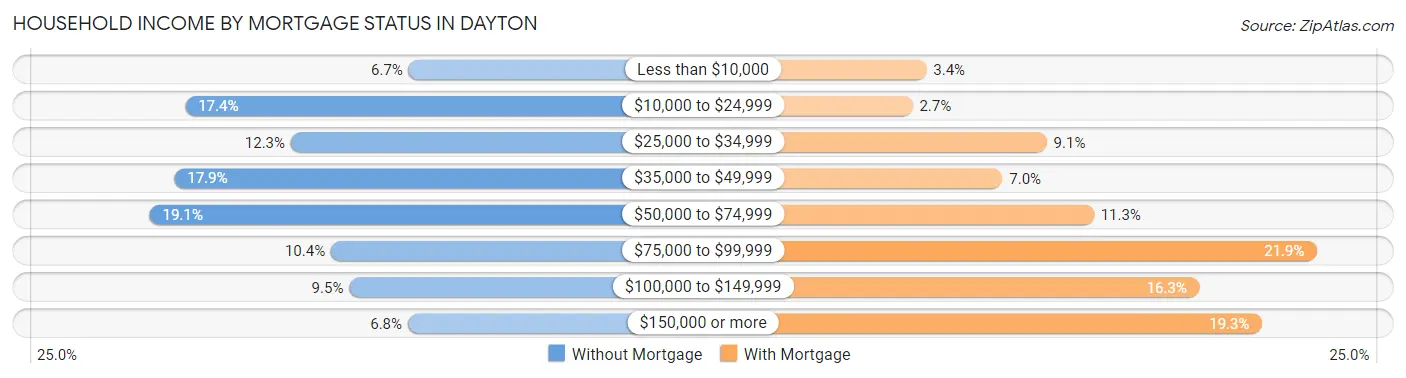
| Household Income | Without Mortgage | With Mortgage |
| Less than $10,000 | 841 (6.7%) | 513 (3.4%) |
| $10,000 to $24,999 | 2,173 (17.3%) | 413 (2.7%) |
| $25,000 to $34,999 | 1,543 (12.3%) | 1,384 (9.1%) |
| $35,000 to $49,999 | 2,239 (17.9%) | 1,064 (7.0%) |
| $50,000 to $74,999 | 2,386 (19.1%) | 1,725 (11.3%) |
| $75,000 to $99,999 | 1,304 (10.4%) | 3,338 (21.9%) |
| $100,000 to $149,999 | 1,195 (9.5%) | 2,486 (16.3%) |
| $150,000 or more | 846 (6.8%) | 2,939 (19.3%) |
| Total | 12,527 (100.0%) | 15,212 (100.0%) |
Property Value to Household Income Ratio in Dayton
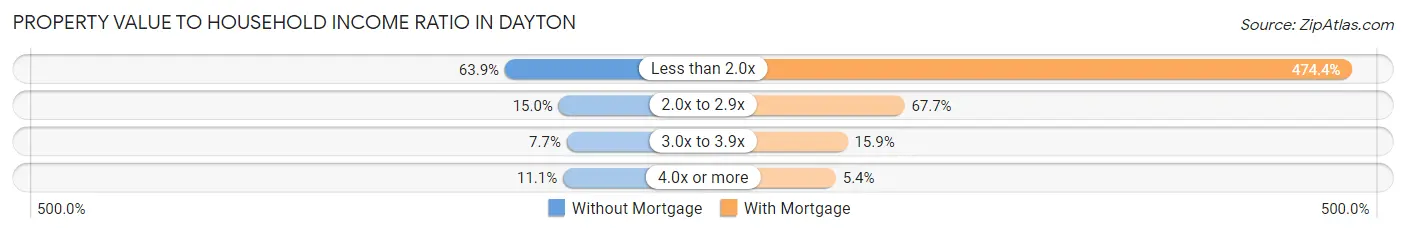
| Value-to-Income Ratio | Without Mortgage | With Mortgage |
| Less than 2.0x | 8,000 (63.9%) | 72,170 (474.4%) |
| 2.0x to 2.9x | 1,879 (15.0%) | 10,294 (67.7%) |
| 3.0x to 3.9x | 966 (7.7%) | 2,423 (15.9%) |
| 4.0x or more | 1,391 (11.1%) | 814 (5.3%) |
| Total | 12,527 (100.0%) | 15,212 (100.0%) |
Real Estate Taxes by Mortgage Status in Dayton
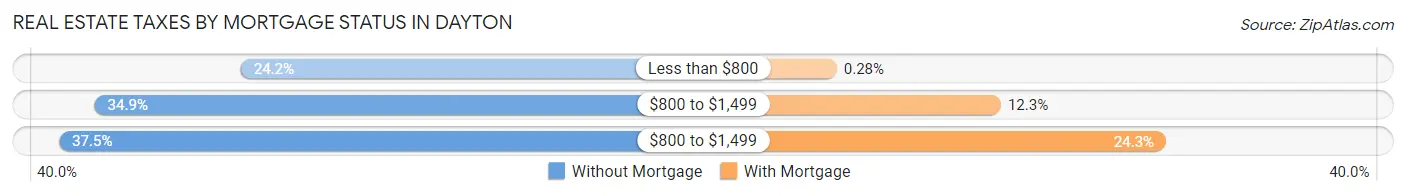
| Property Taxes | Without Mortgage | With Mortgage |
| Less than $800 | 3,031 (24.2%) | 43 (0.3%) |
| $800 to $1,499 | 4,370 (34.9%) | 1,866 (12.3%) |
| $800 to $1,499 | 4,695 (37.5%) | 3,699 (24.3%) |
| Total | 12,527 (100.0%) | 15,212 (100.0%) |
Health & Disability in Dayton
Health Insurance Coverage by Age in Dayton
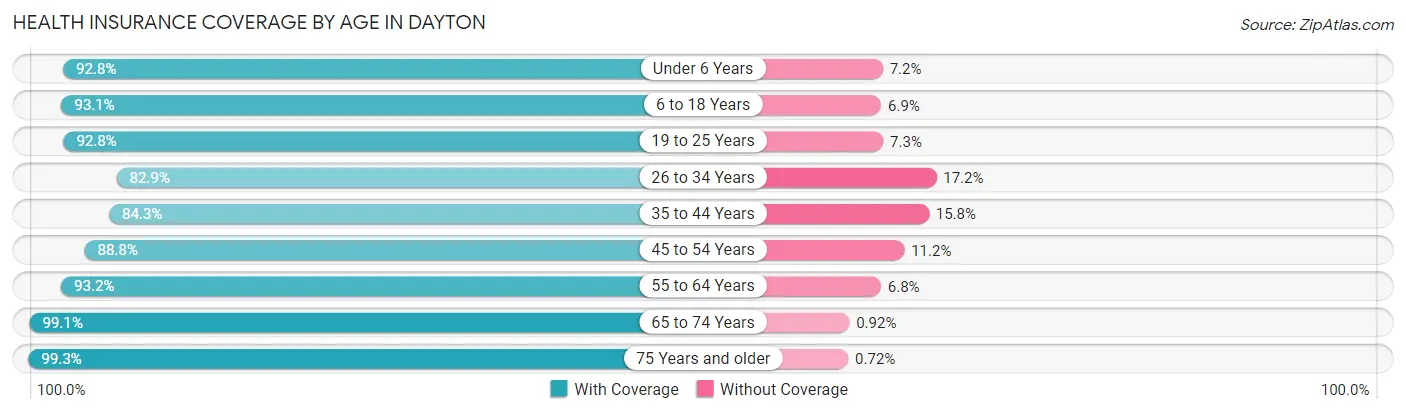
| Age Bracket | With Coverage | Without Coverage |
| Under 6 Years | 9,579 (92.8%) | 740 (7.2%) |
| 6 to 18 Years | 20,389 (93.1%) | 1,501 (6.9%) |
| 19 to 25 Years | 18,046 (92.7%) | 1,410 (7.2%) |
| 26 to 34 Years | 14,677 (82.9%) | 3,038 (17.2%) |
| 35 to 44 Years | 12,806 (84.3%) | 2,394 (15.8%) |
| 45 to 54 Years | 13,049 (88.8%) | 1,642 (11.2%) |
| 55 to 64 Years | 16,060 (93.2%) | 1,175 (6.8%) |
| 65 to 74 Years | 10,997 (99.1%) | 102 (0.9%) |
| 75 Years and older | 6,663 (99.3%) | 48 (0.7%) |
| Total | 122,266 (91.0%) | 12,050 (9.0%) |
Health Insurance Coverage by Citizenship Status in Dayton
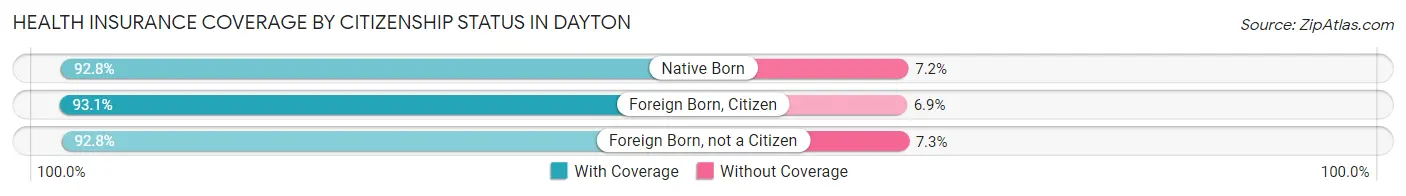
| Citizenship Status | With Coverage | Without Coverage |
| Native Born | 9,579 (92.8%) | 740 (7.2%) |
| Foreign Born, Citizen | 20,389 (93.1%) | 1,501 (6.9%) |
| Foreign Born, not a Citizen | 18,046 (92.7%) | 1,410 (7.2%) |
Health Insurance Coverage by Household Income in Dayton
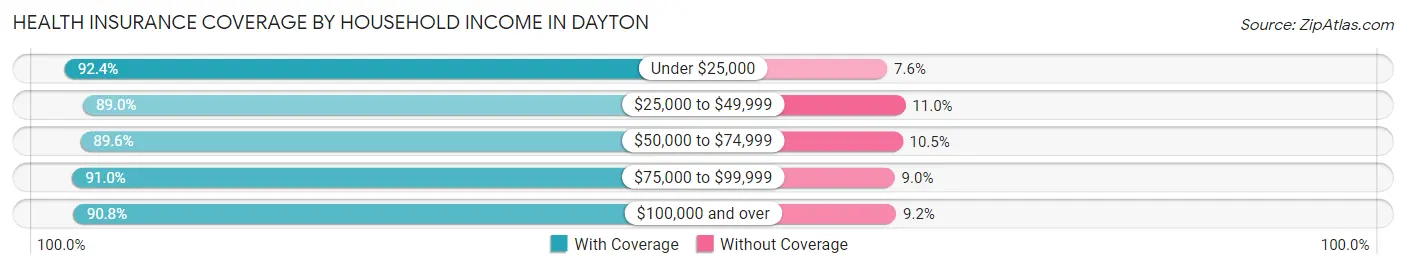
| Household Income | With Coverage | Without Coverage |
| Under $25,000 | 29,922 (92.4%) | 2,448 (7.6%) |
| $25,000 to $49,999 | 26,438 (89.0%) | 3,262 (11.0%) |
| $50,000 to $74,999 | 19,494 (89.5%) | 2,275 (10.4%) |
| $75,000 to $99,999 | 13,759 (91.0%) | 1,356 (9.0%) |
| $100,000 and over | 22,525 (90.8%) | 2,290 (9.2%) |
Public vs Private Health Insurance Coverage by Age in Dayton
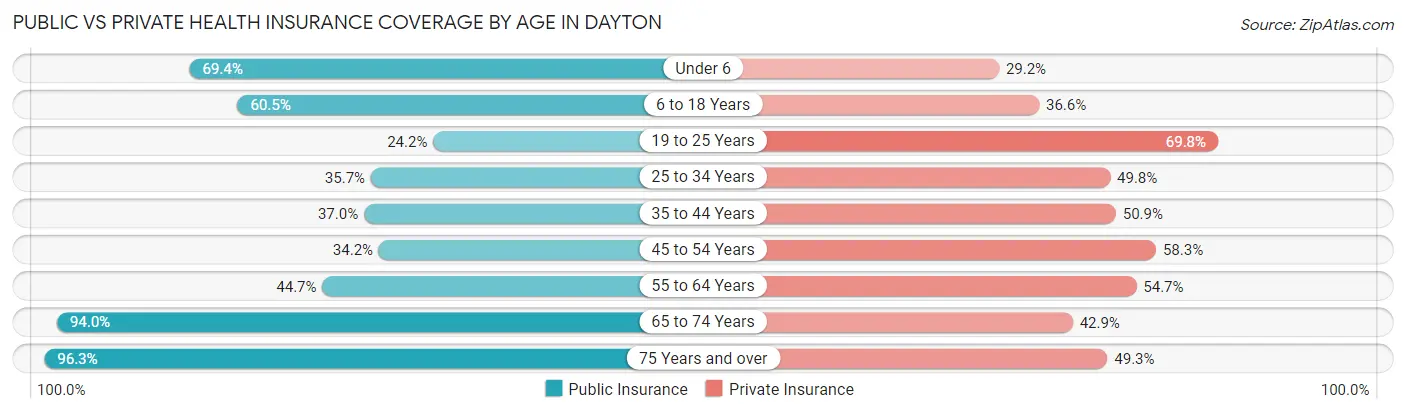
| Age Bracket | Public Insurance | Private Insurance |
| Under 6 | 7,160 (69.4%) | 3,010 (29.2%) |
| 6 to 18 Years | 13,239 (60.5%) | 8,014 (36.6%) |
| 19 to 25 Years | 4,699 (24.1%) | 13,580 (69.8%) |
| 25 to 34 Years | 6,327 (35.7%) | 8,822 (49.8%) |
| 35 to 44 Years | 5,626 (37.0%) | 7,731 (50.9%) |
| 45 to 54 Years | 5,028 (34.2%) | 8,568 (58.3%) |
| 55 to 64 Years | 7,709 (44.7%) | 9,422 (54.7%) |
| 65 to 74 Years | 10,433 (94.0%) | 4,757 (42.9%) |
| 75 Years and over | 6,465 (96.3%) | 3,308 (49.3%) |
| Total | 66,686 (49.6%) | 67,212 (50.0%) |
Disability Status by Sex by Age in Dayton
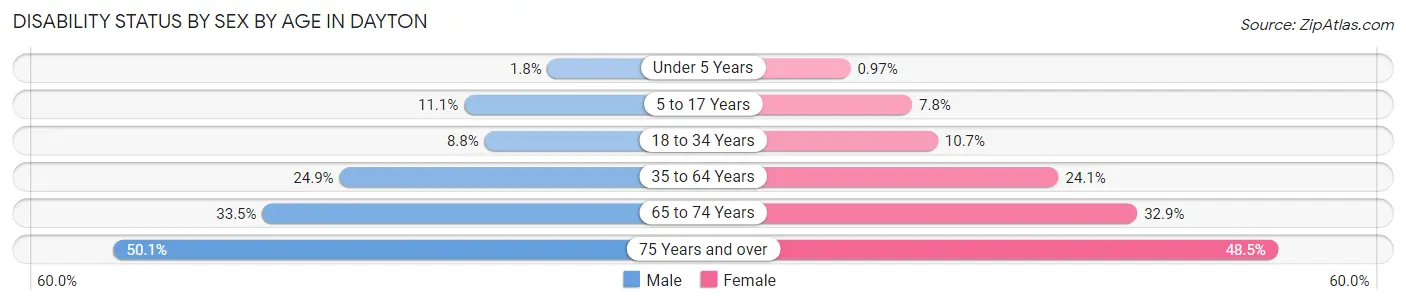
| Age Bracket | Male | Female |
| Under 5 Years | 78 (1.8%) | 39 (1.0%) |
| 5 to 17 Years | 1,172 (11.1%) | 752 (7.8%) |
| 18 to 34 Years | 1,773 (8.8%) | 2,199 (10.7%) |
| 35 to 64 Years | 5,958 (24.9%) | 5,609 (24.1%) |
| 65 to 74 Years | 1,645 (33.5%) | 2,037 (32.9%) |
| 75 Years and over | 1,246 (50.1%) | 2,050 (48.5%) |
Disability Class by Sex by Age in Dayton
Disability Class: Hearing Difficulty
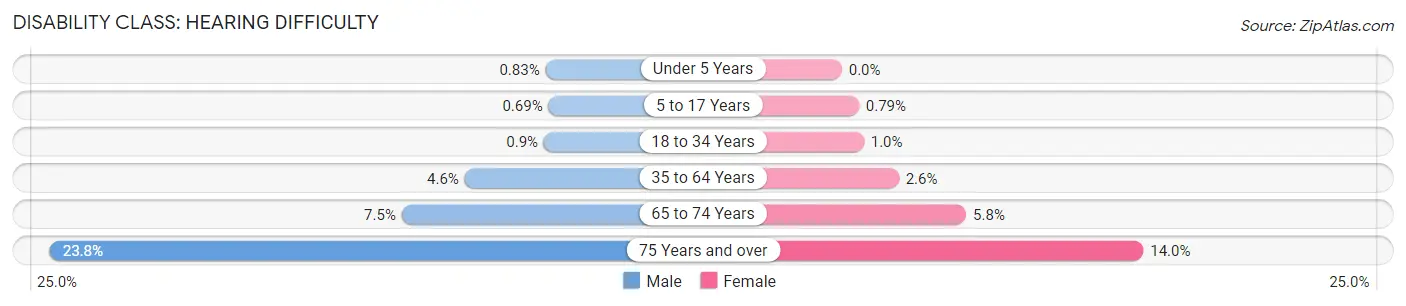
| Age Bracket | Male | Female |
| Under 5 Years | 37 (0.8%) | 0 (0.0%) |
| 5 to 17 Years | 73 (0.7%) | 76 (0.8%) |
| 18 to 34 Years | 182 (0.9%) | 210 (1.0%) |
| 35 to 64 Years | 1,094 (4.6%) | 613 (2.6%) |
| 65 to 74 Years | 368 (7.5%) | 357 (5.8%) |
| 75 Years and over | 593 (23.8%) | 591 (14.0%) |
Disability Class: Vision Difficulty
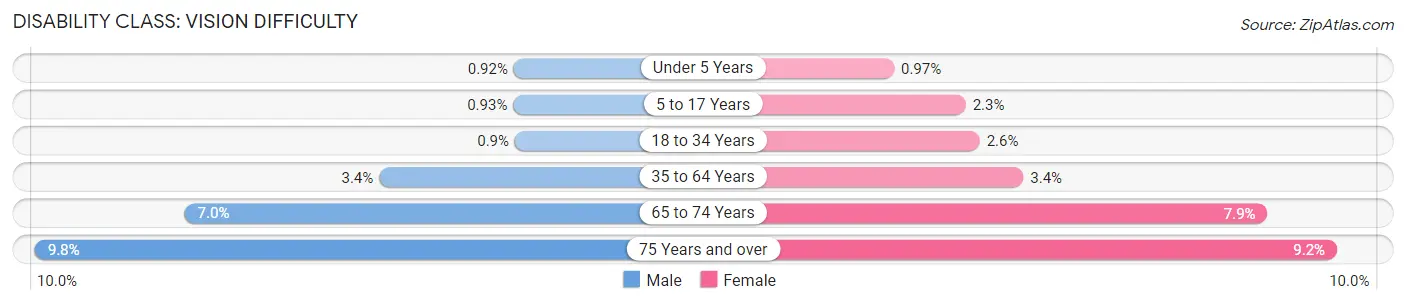
| Age Bracket | Male | Female |
| Under 5 Years | 41 (0.9%) | 39 (1.0%) |
| 5 to 17 Years | 98 (0.9%) | 221 (2.3%) |
| 18 to 34 Years | 181 (0.9%) | 526 (2.6%) |
| 35 to 64 Years | 816 (3.4%) | 784 (3.4%) |
| 65 to 74 Years | 345 (7.0%) | 489 (7.9%) |
| 75 Years and over | 244 (9.8%) | 388 (9.2%) |
Disability Class: Cognitive Difficulty
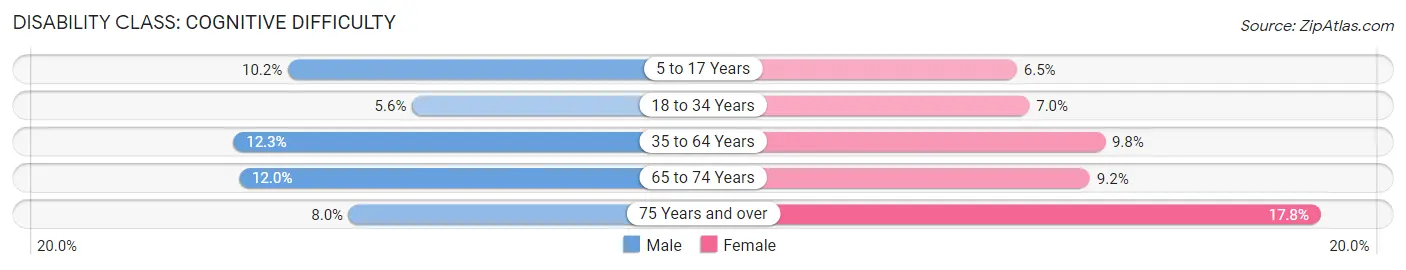
| Age Bracket | Male | Female |
| 5 to 17 Years | 1,083 (10.2%) | 625 (6.5%) |
| 18 to 34 Years | 1,133 (5.6%) | 1,431 (7.0%) |
| 35 to 64 Years | 2,926 (12.2%) | 2,269 (9.8%) |
| 65 to 74 Years | 591 (12.0%) | 570 (9.2%) |
| 75 Years and over | 198 (8.0%) | 751 (17.8%) |
Disability Class: Ambulatory Difficulty
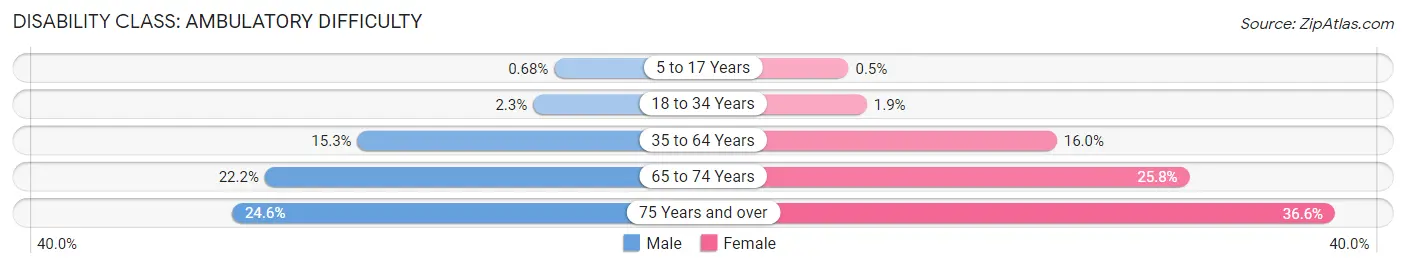
| Age Bracket | Male | Female |
| 5 to 17 Years | 72 (0.7%) | 48 (0.5%) |
| 18 to 34 Years | 455 (2.2%) | 383 (1.9%) |
| 35 to 64 Years | 3,652 (15.3%) | 3,709 (16.0%) |
| 65 to 74 Years | 1,088 (22.2%) | 1,598 (25.8%) |
| 75 Years and over | 612 (24.6%) | 1,546 (36.6%) |
Disability Class: Self-Care Difficulty
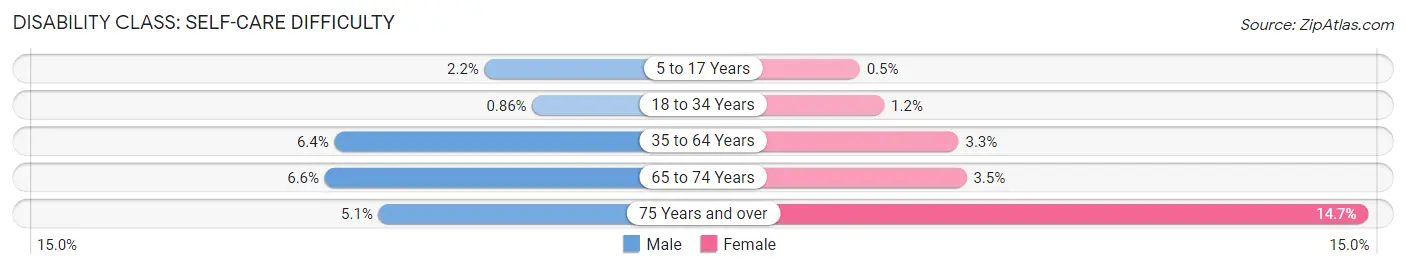
| Age Bracket | Male | Female |
| 5 to 17 Years | 232 (2.2%) | 48 (0.5%) |
| 18 to 34 Years | 174 (0.9%) | 243 (1.2%) |
| 35 to 64 Years | 1,523 (6.4%) | 756 (3.3%) |
| 65 to 74 Years | 326 (6.6%) | 215 (3.5%) |
| 75 Years and over | 128 (5.1%) | 619 (14.7%) |
Technology Access in Dayton
Computing Device Access in Dayton
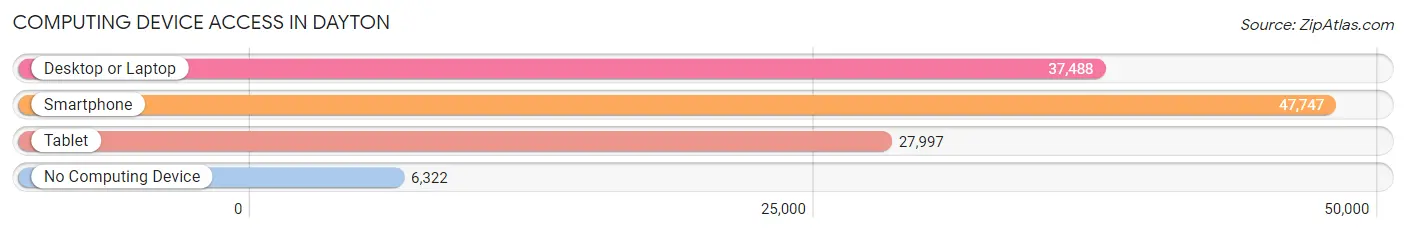
| Device Type | # Households | % Households |
| Desktop or Laptop | 37,488 | 65.3% |
| Smartphone | 47,747 | 83.2% |
| Tablet | 27,997 | 48.8% |
| No Computing Device | 6,322 | 11.0% |
| Total | 57,362 | 100.0% |
Internet Access in Dayton
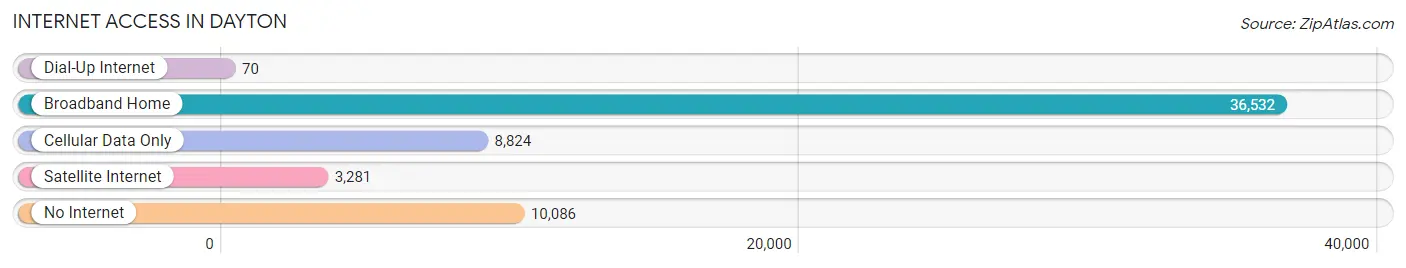
| Internet Type | # Households | % Households |
| Dial-Up Internet | 70 | 0.1% |
| Broadband Home | 36,532 | 63.7% |
| Cellular Data Only | 8,824 | 15.4% |
| Satellite Internet | 3,281 | 5.7% |
| No Internet | 10,086 | 17.6% |
| Total | 57,362 | 100.0% |
Dayton Summary
Dayton, Ohio is a city located in Montgomery County in the southwestern part of the state. It is the county seat and the sixth-largest city in Ohio. Dayton is situated within the Miami Valley region of Ohio and is part of the Dayton-Springfield-Greenville Combined Statistical Area. The city has a population of 140,640 as of the 2019 U.S. Census estimate.
History
Dayton was founded in 1796 by a group of settlers from Kentucky and Virginia. The city was named after Jonathan Dayton, a Revolutionary War hero and signer of the U.S. Constitution. Dayton was incorporated as a city in 1805 and quickly became an important center for manufacturing and industry. The city was home to the Wright Brothers, who developed the first successful airplane in 1903. Dayton was also the birthplace of the National Cash Register Company, which was founded in 1884.
Dayton experienced significant growth during the 20th century, becoming a major center for the automotive and aerospace industries. The city was also home to several major universities, including the University of Dayton, Wright State University, and Central State University.
Geography
Dayton is located in southwestern Ohio, approximately 40 miles north of Cincinnati and 60 miles west of Columbus. The city is situated along the Great Miami River and is surrounded by several smaller cities and towns, including Kettering, Beavercreek, and Huber Heights. Dayton covers an area of approximately 97 square miles and has an elevation of 845 feet.
Climate
Dayton has a humid continental climate, with hot, humid summers and cold, snowy winters. The average high temperature in July is 85°F, while the average low temperature in January is 22°F. The city receives an average of 39 inches of precipitation per year, with the most occurring in May and June.
Economy
Dayton’s economy is largely based on manufacturing and technology. The city is home to several major companies, including NCR Corporation, Reynolds and Reynolds, and LexisNexis. The city is also home to several universities and colleges, which provide a significant number of jobs.
The city’s largest employers include Wright-Patterson Air Force Base, the University of Dayton, and Premier Health. Other major employers include Kettering Health Network, CareSource, and the Dayton Public Schools.
Demographics
As of the 2019 U.S. Census estimate, Dayton had a population of 140,640. The city has a population density of 1,444 people per square mile. The median age in Dayton is 35.7 years, and the median household income is $37,845.
The racial makeup of Dayton is 63.2% White, 28.2% African American, 2.2% Asian, and 4.3% Hispanic or Latino. The city has a large foreign-born population, with approximately 11.3% of the population born outside of the United States.
Dayton is a diverse city with a rich history and a vibrant economy. The city is home to several major employers and universities, and is a popular destination for tourists and business travelers alike.
Common Questions
What is Per Capita Income in Dayton?
Per Capita income in Dayton is $25,357.
What is the Median Family Income in Dayton?
Median Family Income in Dayton is $52,599.
What is the Median Household income in Dayton?
Median Household Income in Dayton is $41,443.
What is Income or Wage Gap in Dayton?
Income or Wage Gap in Dayton is 19.0%.
Women in Dayton earn 81.0 cents for every dollar earned by a man.
What is Family Income Deficit in Dayton?
Family Income Deficit in Dayton is $11,732.
Families that are below poverty line in Dayton earn $11,732 less on average than the poverty threshold level.
What is Inequality or Gini Index in Dayton?
Inequality or Gini Index in Dayton is 0.48.
What is the Total Population of Dayton?
Total Population of Dayton is 137,305.
What is the Total Male Population of Dayton?
Total Male Population of Dayton is 68,176.
What is the Total Female Population of Dayton?
Total Female Population of Dayton is 69,129.
What is the Ratio of Males per 100 Females in Dayton?
There are 98.62 Males per 100 Females in Dayton.
What is the Ratio of Females per 100 Males in Dayton?
There are 101.40 Females per 100 Males in Dayton.
What is the Median Population Age in Dayton?
Median Population Age in Dayton is 34.0 Years.
What is the Average Family Size in Dayton
Average Family Size in Dayton is 3.0 People.
What is the Average Household Size in Dayton
Average Household Size in Dayton is 2.2 People.
How Large is the Labor Force in Dayton?
There are 65,223 People in the Labor Forcein in Dayton.
What is the Percentage of People in the Labor Force in Dayton?
58.6% of People are in the Labor Force in Dayton.
What is the Unemployment Rate in Dayton?
Unemployment Rate in Dayton is 10.0%.