Southfield, MI Map & Demographics
Southfield Map
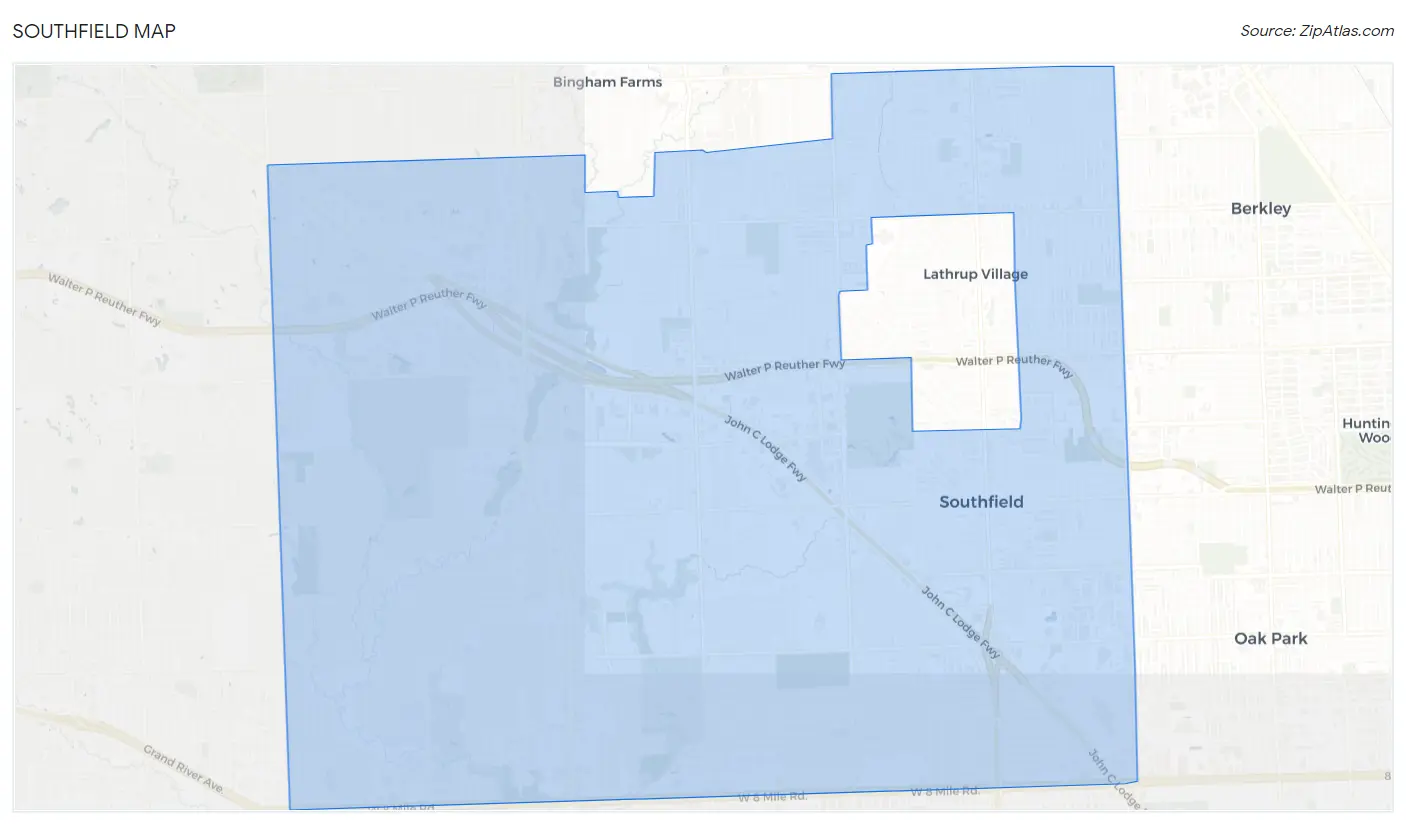
Southfield Overview
$37,722
PER CAPITA INCOME
$84,049
AVG FAMILY INCOME
$63,980
AVG HOUSEHOLD INCOME
9.5%
WAGE / INCOME GAP [ % ]
90.5¢/ $1
WAGE / INCOME GAP [ $ ]
0.44
INEQUALITY / GINI INDEX
76,107
TOTAL POPULATION
35,344
MALE POPULATION
40,763
FEMALE POPULATION
86.71
MALES / 100 FEMALES
115.33
FEMALES / 100 MALES
42.1
MEDIAN AGE
3.0
AVG FAMILY SIZE
2.2
AVG HOUSEHOLD SIZE
38,821
LABOR FORCE [ PEOPLE ]
61.4%
PERCENT IN LABOR FORCE
6.5%
UNEMPLOYMENT RATE
Income in Southfield
Income Overview in Southfield
Per Capita Income in Southfield is $37,722, while median incomes of families and households are $84,049 and $63,980 respectively.
| Characteristic | Number | Measure |
| Per Capita Income | 76,107 | $37,722 |
| Median Family Income | 18,130 | $84,049 |
| Mean Family Income | 18,130 | $103,022 |
| Median Household Income | 34,404 | $63,980 |
| Mean Household Income | 34,404 | $80,510 |
| Income Deficit | 18,130 | $0 |
| Wage / Income Gap (%) | 76,107 | 9.48% |
| Wage / Income Gap ($) | 76,107 | 90.52¢ per $1 |
| Gini / Inequality Index | 76,107 | 0.44 |
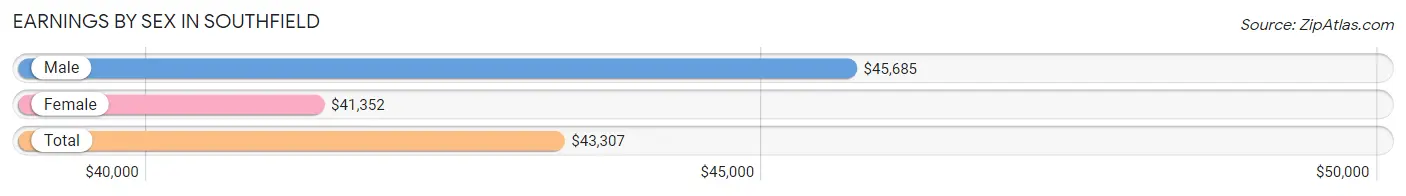
Earnings by Sex in Southfield
Average Earnings in Southfield are $43,307, $45,685 for men and $41,352 for women, a difference of 9.5%.
| Sex | Number | Average Earnings |
| Male | 19,011 (47.3%) | $45,685 |
| Female | 21,207 (52.7%) | $41,352 |
| Total | 40,218 (100.0%) | $43,307 |
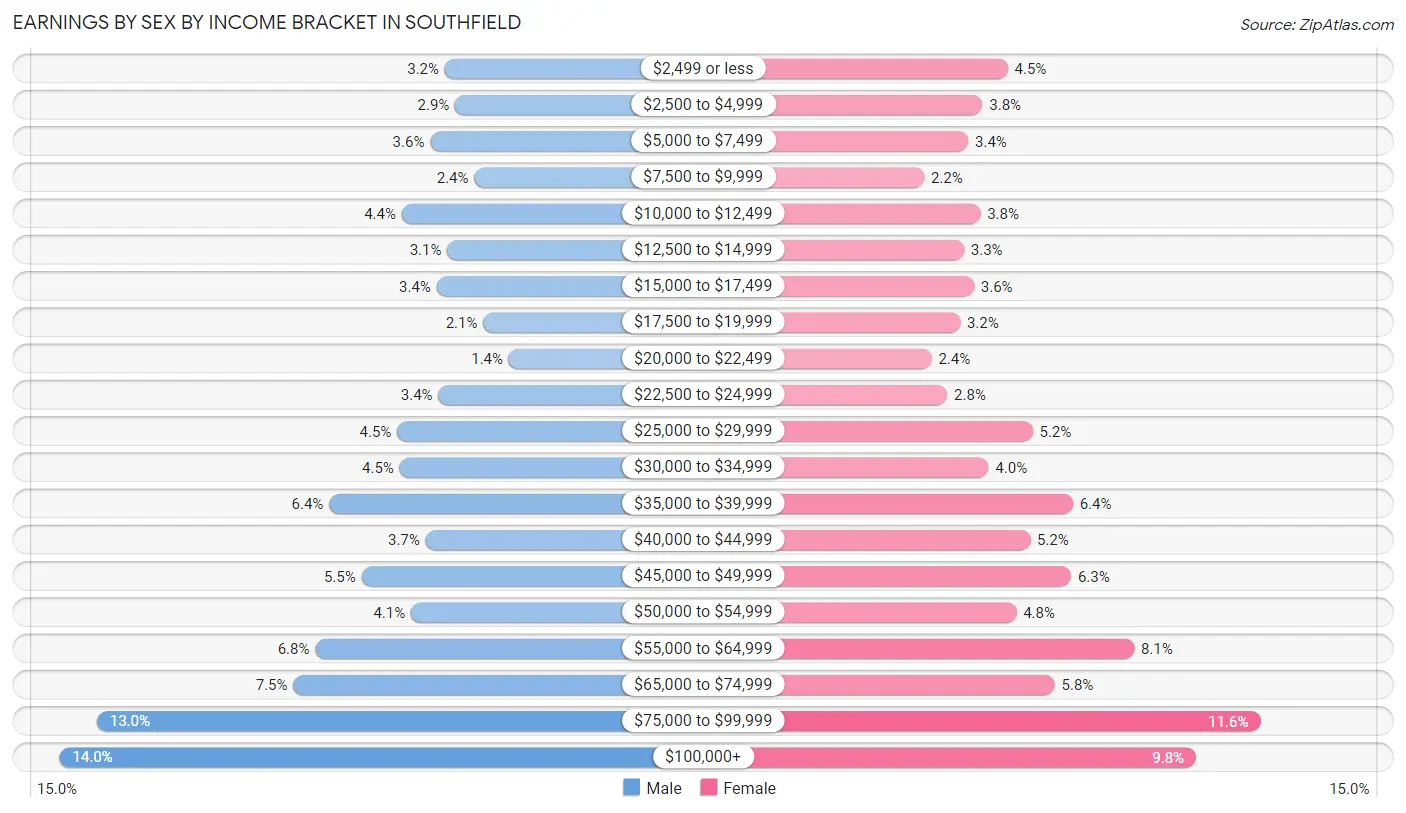
Earnings by Sex by Income Bracket in Southfield
The most common earnings brackets in Southfield are $100,000+ for men (2,665 | 14.0%) and $75,000 to $99,999 for women (2,464 | 11.6%).
| Income | Male | Female |
| $2,499 or less | 606 (3.2%) | 958 (4.5%) |
| $2,500 to $4,999 | 552 (2.9%) | 808 (3.8%) |
| $5,000 to $7,499 | 685 (3.6%) | 723 (3.4%) |
| $7,500 to $9,999 | 449 (2.4%) | 460 (2.2%) |
| $10,000 to $12,499 | 836 (4.4%) | 795 (3.7%) |
| $12,500 to $14,999 | 594 (3.1%) | 698 (3.3%) |
| $15,000 to $17,499 | 651 (3.4%) | 758 (3.6%) |
| $17,500 to $19,999 | 402 (2.1%) | 675 (3.2%) |
| $20,000 to $22,499 | 265 (1.4%) | 504 (2.4%) |
| $22,500 to $24,999 | 641 (3.4%) | 597 (2.8%) |
| $25,000 to $29,999 | 861 (4.5%) | 1,108 (5.2%) |
| $30,000 to $34,999 | 848 (4.5%) | 843 (4.0%) |
| $35,000 to $39,999 | 1,225 (6.4%) | 1,346 (6.4%) |
| $40,000 to $44,999 | 709 (3.7%) | 1,093 (5.1%) |
| $45,000 to $49,999 | 1,052 (5.5%) | 1,336 (6.3%) |
| $50,000 to $54,999 | 788 (4.1%) | 1,010 (4.8%) |
| $55,000 to $64,999 | 1,299 (6.8%) | 1,712 (8.1%) |
| $65,000 to $74,999 | 1,417 (7.4%) | 1,238 (5.8%) |
| $75,000 to $99,999 | 2,466 (13.0%) | 2,464 (11.6%) |
| $100,000+ | 2,665 (14.0%) | 2,081 (9.8%) |
| Total | 19,011 (100.0%) | 21,207 (100.0%) |
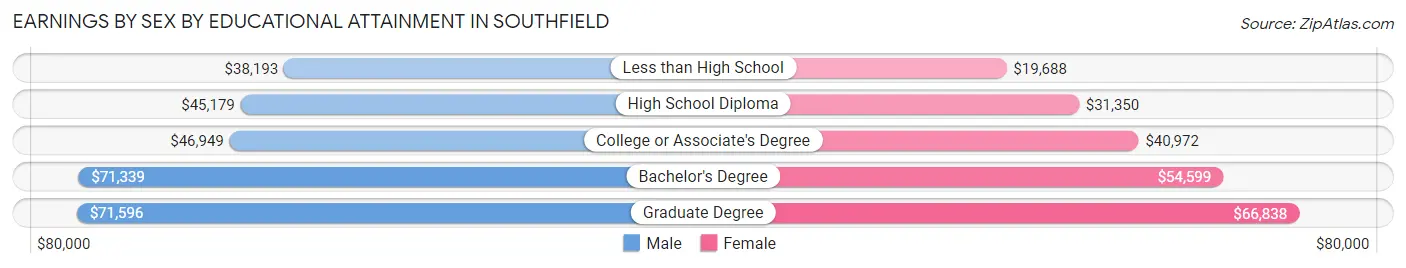
Earnings by Sex by Educational Attainment in Southfield
Average earnings in Southfield are $51,347 for men and $46,543 for women, a difference of 9.4%. Men with an educational attainment of graduate degree enjoy the highest average annual earnings of $71,596, while those with less than high school education earn the least with $38,193. Women with an educational attainment of graduate degree earn the most with the average annual earnings of $66,838, while those with less than high school education have the smallest earnings of $19,688.
| Educational Attainment | Male Income | Female Income |
| Less than High School | $38,193 | $19,688 |
| High School Diploma | $45,179 | $31,350 |
| College or Associate's Degree | $46,949 | $40,972 |
| Bachelor's Degree | $71,339 | $54,599 |
| Graduate Degree | $71,596 | $66,838 |
| Total | $51,347 | $46,543 |
Family Income in Southfield
Family Income Brackets in Southfield
According to the Southfield family income data, there are 4,007 families falling into the $100,000 to $149,999 income range, which is the most common income bracket and makes up 22.1% of all families. Conversely, the $10,000 to $14,999 income bracket is the least frequent group with only 199 families (1.1%) belonging to this category.
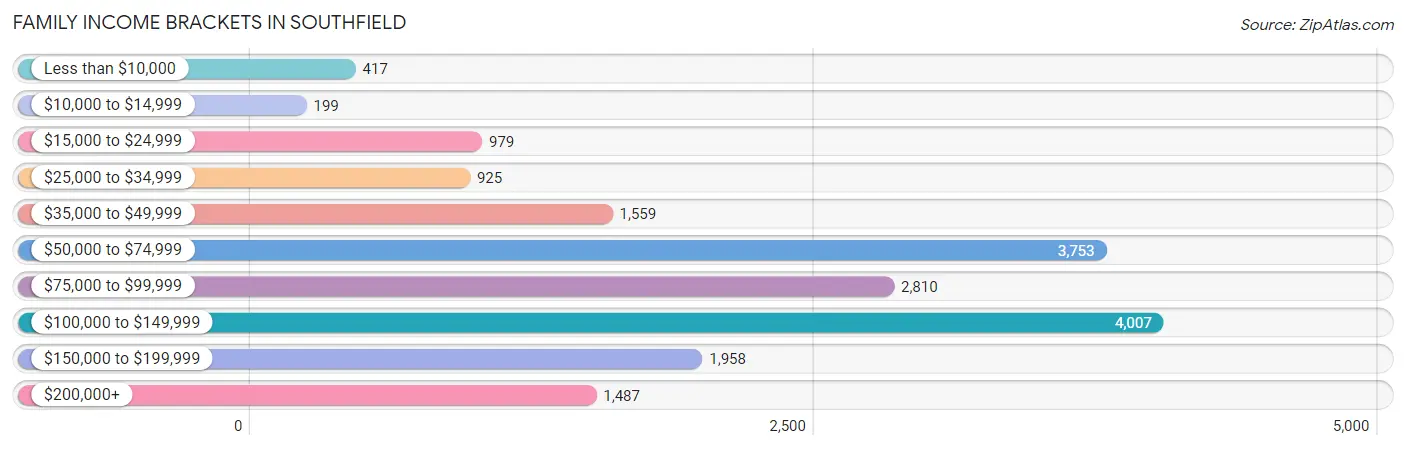
| Income Bracket | # Families | % Families |
| Less than $10,000 | 417 | 2.3% |
| $10,000 to $14,999 | 199 | 1.1% |
| $15,000 to $24,999 | 979 | 5.4% |
| $25,000 to $34,999 | 925 | 5.1% |
| $35,000 to $49,999 | 1,559 | 8.6% |
| $50,000 to $74,999 | 3,753 | 20.7% |
| $75,000 to $99,999 | 2,810 | 15.5% |
| $100,000 to $149,999 | 4,007 | 22.1% |
| $150,000 to $199,999 | 1,958 | 10.8% |
| $200,000+ | 1,487 | 8.2% |
Family Income by Famaliy Size in Southfield
5-person families (926 | 5.1%) account for the highest median family income in Southfield with $119,392 per family, while 2-person families (9,644 | 53.2%) have the highest median income of $37,069 per family member.
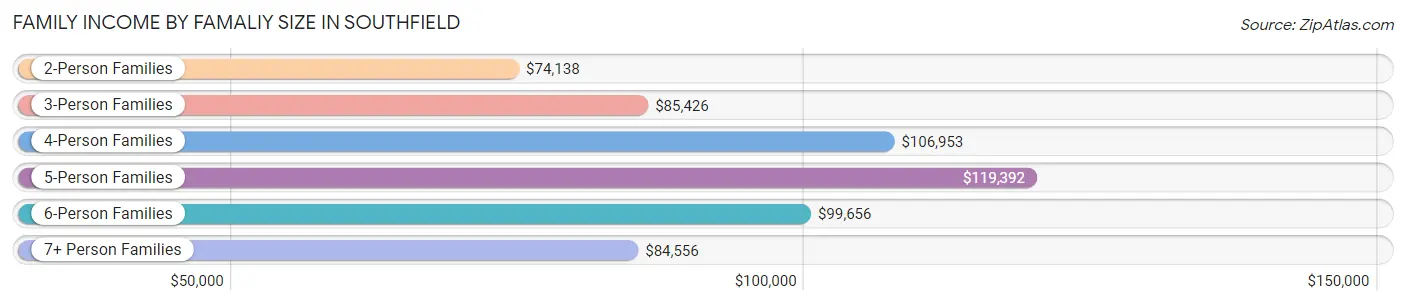
| Income Bracket | # Families | Median Income |
| 2-Person Families | 9,644 (53.2%) | $74,138 |
| 3-Person Families | 4,593 (25.3%) | $85,426 |
| 4-Person Families | 2,193 (12.1%) | $106,953 |
| 5-Person Families | 926 (5.1%) | $119,392 |
| 6-Person Families | 507 (2.8%) | $99,656 |
| 7+ Person Families | 267 (1.5%) | $84,556 |
| Total | 18,130 (100.0%) | $84,049 |
Family Income by Number of Earners in Southfield
The median family income in Southfield is $84,049, with families comprising 3+ earners (1,702) having the highest median family income of $163,771, while families with no earners (2,554) have the lowest median family income of $48,165, accounting for 9.4% and 14.1% of families, respectively.
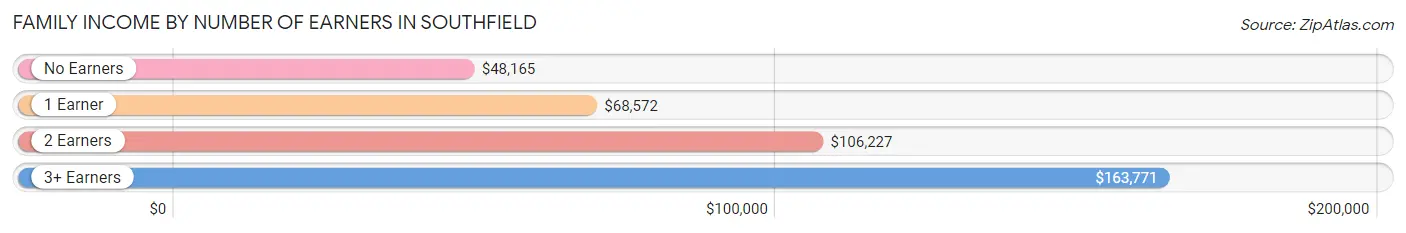
| Number of Earners | # Families | Median Income |
| No Earners | 2,554 (14.1%) | $48,165 |
| 1 Earner | 6,487 (35.8%) | $68,572 |
| 2 Earners | 7,387 (40.7%) | $106,227 |
| 3+ Earners | 1,702 (9.4%) | $163,771 |
| Total | 18,130 (100.0%) | $84,049 |
Household Income in Southfield
Household Income Brackets in Southfield
With 6,778 households falling in the category, the $50,000 to $74,999 income range is the most frequent in Southfield, accounting for 19.7% of all households. In contrast, only 1,789 households (5.2%) fall into the $200,000+ income bracket, making it the least populous group.
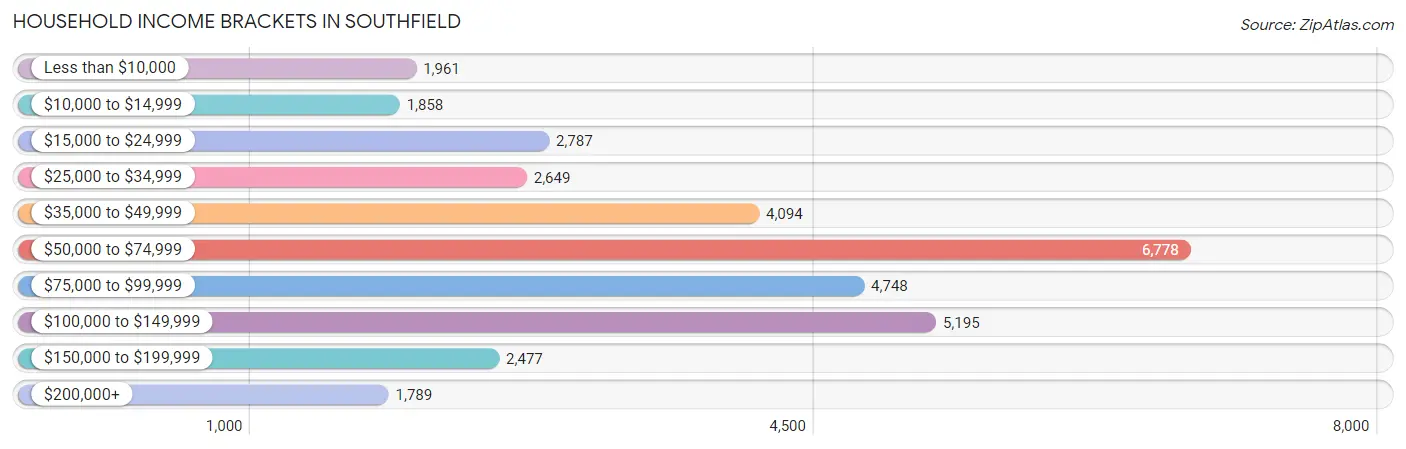
| Income Bracket | # Households | % Households |
| Less than $10,000 | 1,961 | 5.7% |
| $10,000 to $14,999 | 1,858 | 5.4% |
| $15,000 to $24,999 | 2,787 | 8.1% |
| $25,000 to $34,999 | 2,649 | 7.7% |
| $35,000 to $49,999 | 4,094 | 11.9% |
| $50,000 to $74,999 | 6,778 | 19.7% |
| $75,000 to $99,999 | 4,748 | 13.8% |
| $100,000 to $149,999 | 5,195 | 15.1% |
| $150,000 to $199,999 | 2,477 | 7.2% |
| $200,000+ | 1,789 | 5.2% |
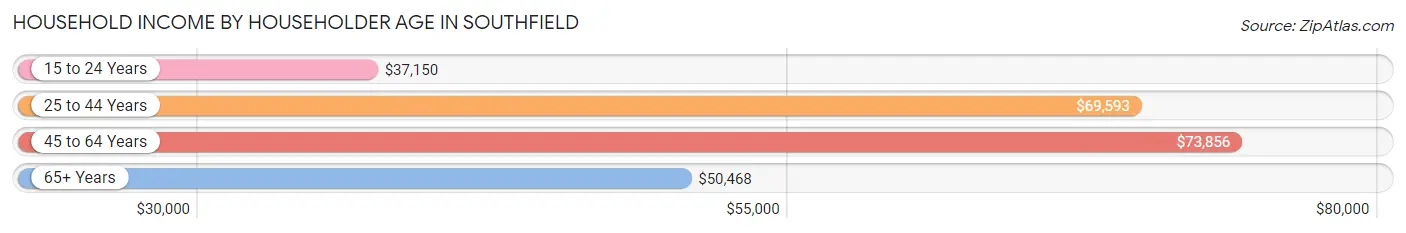
Household Income by Householder Age in Southfield
The median household income in Southfield is $63,980, with the highest median household income of $73,856 found in the 45 to 64 years age bracket for the primary householder. A total of 12,314 households (35.8%) fall into this category. Meanwhile, the 15 to 24 years age bracket for the primary householder has the lowest median household income of $37,150, with 1,011 households (2.9%) in this group.
| Income Bracket | # Households | Median Income |
| 15 to 24 Years | 1,011 (2.9%) | $37,150 |
| 25 to 44 Years | 9,972 (29.0%) | $69,593 |
| 45 to 64 Years | 12,314 (35.8%) | $73,856 |
| 65+ Years | 11,107 (32.3%) | $50,468 |
| Total | 34,404 (100.0%) | $63,980 |
Poverty in Southfield
Income Below Poverty by Sex and Age in Southfield
With 10.5% poverty level for males and 12.1% for females among the residents of Southfield, under 5 year old males and 5 year old females are the most vulnerable to poverty, with 323 males (14.4%) and 70 females (26.2%) in their respective age groups living below the poverty level.
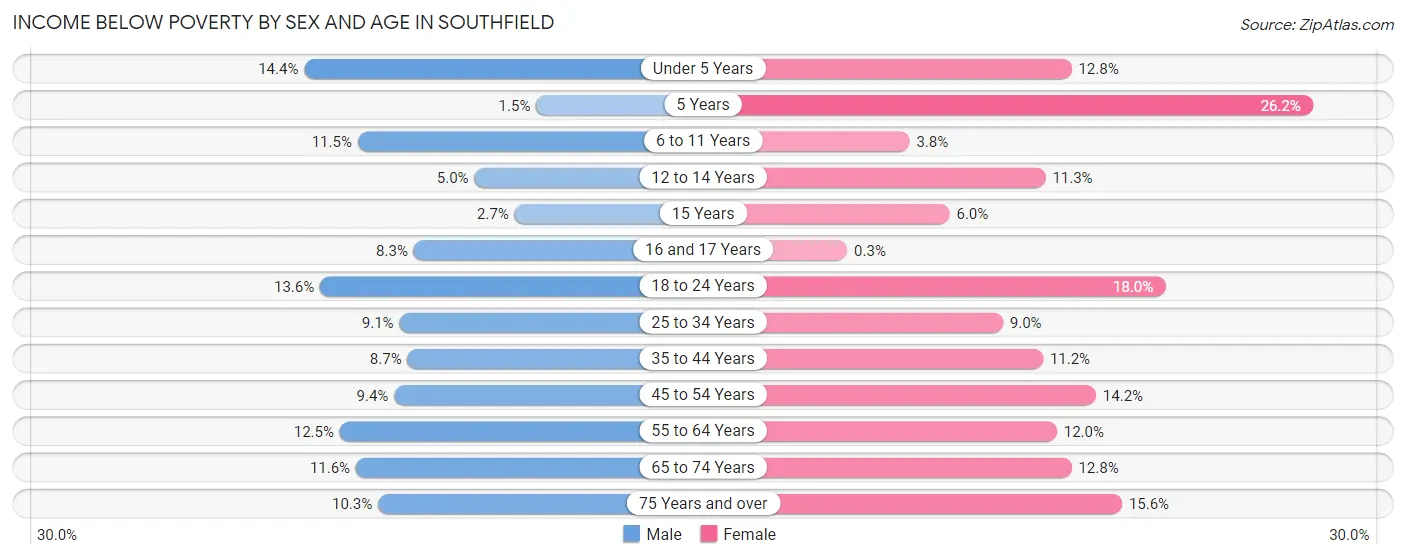
| Age Bracket | Male | Female |
| Under 5 Years | 323 (14.4%) | 244 (12.8%) |
| 5 Years | 8 (1.5%) | 70 (26.2%) |
| 6 to 11 Years | 268 (11.5%) | 87 (3.8%) |
| 12 to 14 Years | 36 (5.0%) | 146 (11.3%) |
| 15 Years | 15 (2.7%) | 32 (6.0%) |
| 16 and 17 Years | 88 (8.3%) | 2 (0.3%) |
| 18 to 24 Years | 414 (13.6%) | 572 (18.0%) |
| 25 to 34 Years | 530 (9.1%) | 438 (9.0%) |
| 35 to 44 Years | 311 (8.7%) | 520 (11.2%) |
| 45 to 54 Years | 362 (9.4%) | 748 (14.1%) |
| 55 to 64 Years | 570 (12.4%) | 700 (12.0%) |
| 65 to 74 Years | 463 (11.6%) | 690 (12.8%) |
| 75 Years and over | 240 (10.3%) | 603 (15.6%) |
| Total | 3,628 (10.5%) | 4,852 (12.1%) |
Income Above Poverty by Sex and Age in Southfield
According to the poverty statistics in Southfield, males aged 5 years and females aged 16 and 17 years are the age groups that are most secure financially, with 98.5% of males and 99.7% of females in these age groups living above the poverty line.
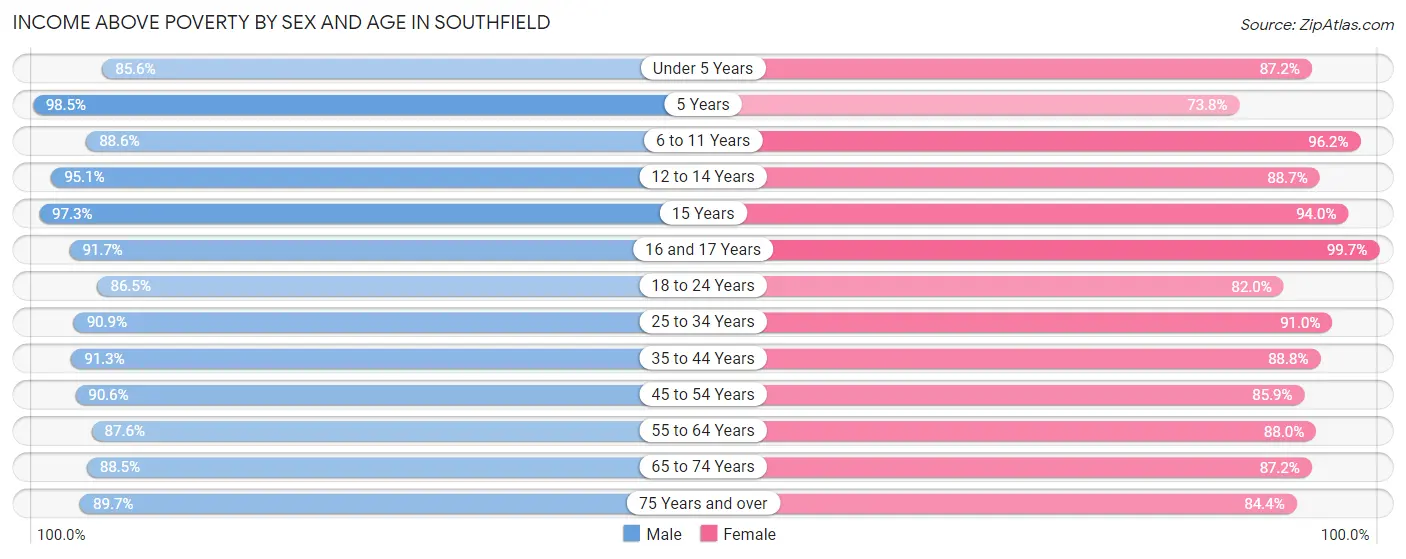
| Age Bracket | Male | Female |
| Under 5 Years | 1,915 (85.6%) | 1,664 (87.2%) |
| 5 Years | 523 (98.5%) | 197 (73.8%) |
| 6 to 11 Years | 2,072 (88.5%) | 2,222 (96.2%) |
| 12 to 14 Years | 691 (95.1%) | 1,141 (88.7%) |
| 15 Years | 538 (97.3%) | 501 (94.0%) |
| 16 and 17 Years | 969 (91.7%) | 665 (99.7%) |
| 18 to 24 Years | 2,642 (86.5%) | 2,606 (82.0%) |
| 25 to 34 Years | 5,278 (90.9%) | 4,445 (91.0%) |
| 35 to 44 Years | 3,271 (91.3%) | 4,122 (88.8%) |
| 45 to 54 Years | 3,481 (90.6%) | 4,537 (85.9%) |
| 55 to 64 Years | 4,007 (87.5%) | 5,149 (88.0%) |
| 65 to 74 Years | 3,546 (88.4%) | 4,704 (87.2%) |
| 75 Years and over | 2,085 (89.7%) | 3,263 (84.4%) |
| Total | 31,018 (89.5%) | 35,216 (87.9%) |
Income Below Poverty Among Married-Couple Families in Southfield
The poverty statistics for married-couple families in Southfield show that 4.5% or 491 of the total 10,964 families live below the poverty line. Families with 5 or more children have the highest poverty rate of 30.6%, comprising of 57 families. On the other hand, families with 1 or 2 children have the lowest poverty rate of 1.2%, which includes 37 families.
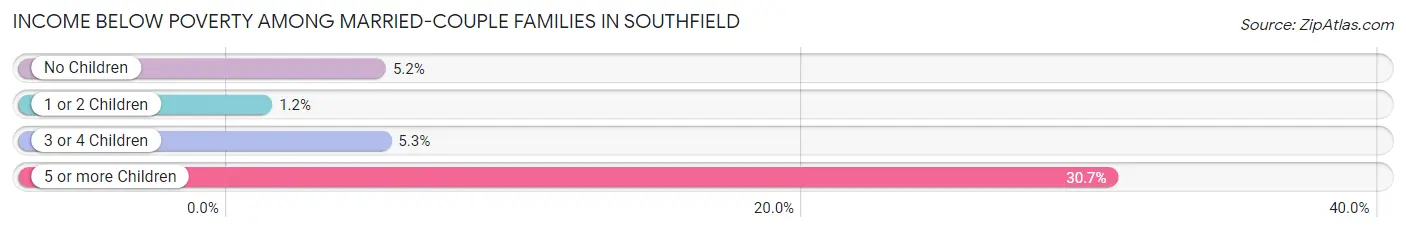
| Children | Above Poverty | Below Poverty |
| No Children | 6,497 (94.9%) | 353 (5.1%) |
| 1 or 2 Children | 3,067 (98.8%) | 37 (1.2%) |
| 3 or 4 Children | 780 (94.7%) | 44 (5.3%) |
| 5 or more Children | 129 (69.4%) | 57 (30.6%) |
| Total | 10,473 (95.5%) | 491 (4.5%) |
Income Below Poverty Among Single-Parent Households in Southfield
According to the poverty data in Southfield, 2.1% or 24 single-father households and 10.5% or 629 single-mother households are living below the poverty line. Among single-father households, those with 1 or 2 children have the highest poverty rate, with 16 households (3.9%) experiencing poverty. Likewise, among single-mother households, those with 3 or 4 children have the highest poverty rate, with 68 households (26.5%) falling below the poverty line.
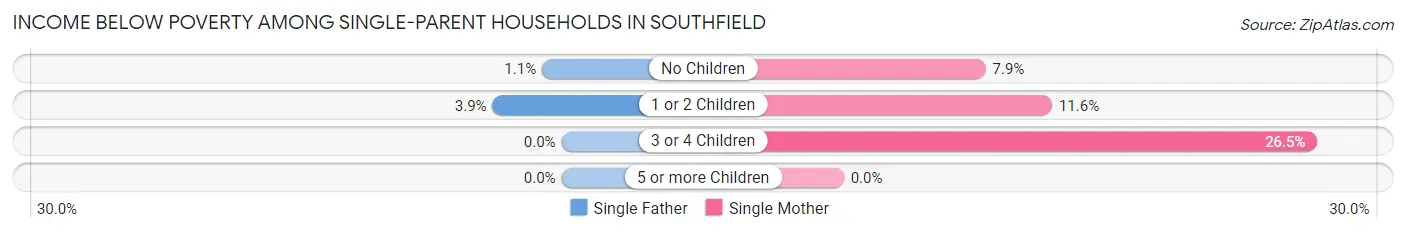
| Children | Single Father | Single Mother |
| No Children | 8 (1.1%) | 230 (7.9%) |
| 1 or 2 Children | 16 (3.9%) | 331 (11.6%) |
| 3 or 4 Children | 0 (0.0%) | 68 (26.5%) |
| 5 or more Children | 0 (0.0%) | 0 (0.0%) |
| Total | 24 (2.1%) | 629 (10.5%) |
Income Below Poverty Among Married-Couple vs Single-Parent Households in Southfield
The poverty data for Southfield shows that 491 of the married-couple family households (4.5%) and 653 of the single-parent households (9.1%) are living below the poverty level. Within the married-couple family households, those with 5 or more children have the highest poverty rate, with 57 households (30.6%) falling below the poverty line. Among the single-parent households, those with 3 or 4 children have the highest poverty rate, with 68 household (24.7%) living below poverty.
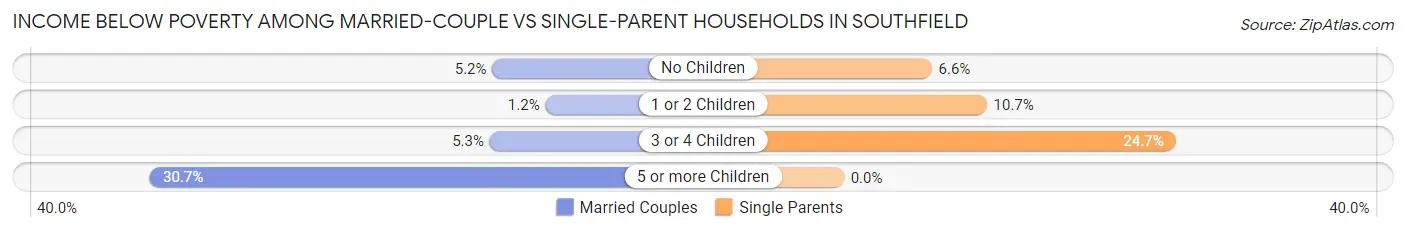
| Children | Married-Couple Families | Single-Parent Households |
| No Children | 353 (5.1%) | 238 (6.6%) |
| 1 or 2 Children | 37 (1.2%) | 347 (10.6%) |
| 3 or 4 Children | 44 (5.3%) | 68 (24.7%) |
| 5 or more Children | 57 (30.6%) | 0 (0.0%) |
| Total | 491 (4.5%) | 653 (9.1%) |
Race in Southfield
The most populous races in Southfield are Black / African American (49,680 | 65.3%), White / Caucasian (19,380 | 25.5%), and Two or more Races (5,206 | 6.8%).
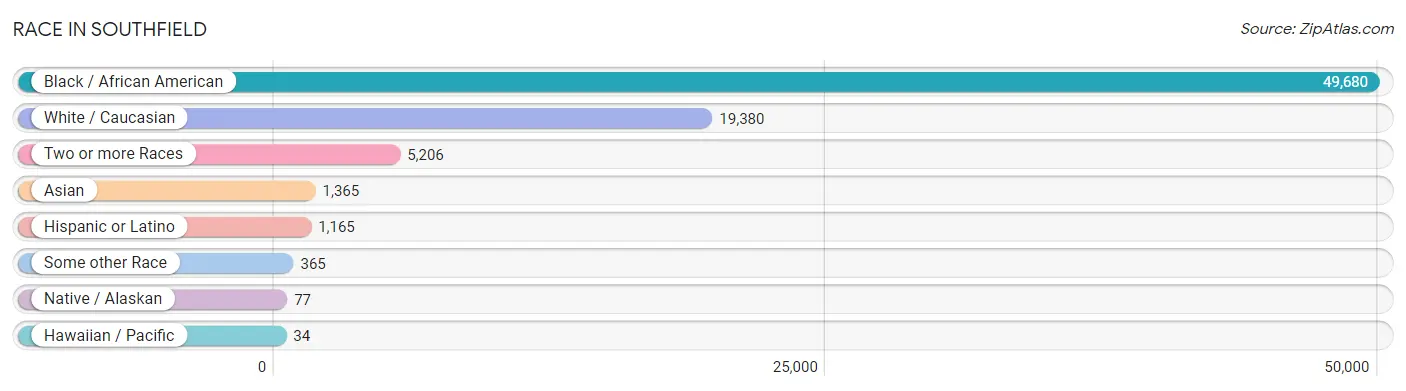
| Race | # Population | % Population |
| Asian | 1,365 | 1.8% |
| Black / African American | 49,680 | 65.3% |
| Hawaiian / Pacific | 34 | 0.0% |
| Hispanic or Latino | 1,165 | 1.5% |
| Native / Alaskan | 77 | 0.1% |
| White / Caucasian | 19,380 | 25.5% |
| Two or more Races | 5,206 | 6.8% |
| Some other Race | 365 | 0.5% |
| Total | 76,107 | 100.0% |
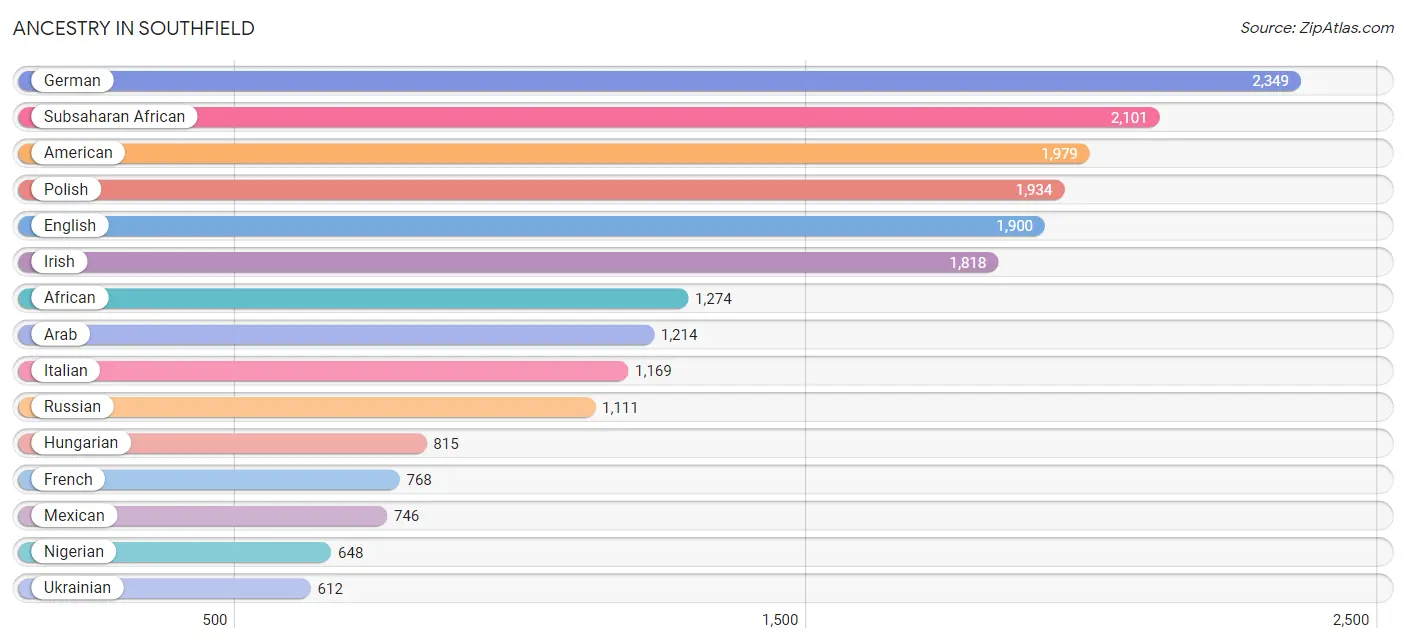
Ancestry in Southfield
The most populous ancestries reported in Southfield are German (2,349 | 3.1%), Subsaharan African (2,101 | 2.8%), American (1,979 | 2.6%), Polish (1,934 | 2.5%), and English (1,900 | 2.5%), together accounting for 13.5% of all Southfield residents.
| Ancestry | # Population | % Population |
| African | 1,274 | 1.7% |
| Albanian | 231 | 0.3% |
| American | 1,979 | 2.6% |
| Apache | 6 | 0.0% |
| Arab | 1,214 | 1.6% |
| Arapaho | 27 | 0.0% |
| Argentinean | 1 | 0.0% |
| Armenian | 114 | 0.2% |
| Assyrian / Chaldean / Syriac | 473 | 0.6% |
| Australian | 10 | 0.0% |
| Austrian | 137 | 0.2% |
| Barbadian | 11 | 0.0% |
| Belgian | 60 | 0.1% |
| Bermudan | 34 | 0.0% |
| Bhutanese | 126 | 0.2% |
| Blackfeet | 271 | 0.4% |
| Brazilian | 118 | 0.2% |
| British | 201 | 0.3% |
| Bulgarian | 12 | 0.0% |
| Burmese | 8 | 0.0% |
| Canadian | 237 | 0.3% |
| Carpatho Rusyn | 10 | 0.0% |
| Central American | 39 | 0.1% |
| Cherokee | 515 | 0.7% |
| Chippewa | 12 | 0.0% |
| Choctaw | 66 | 0.1% |
| Colombian | 13 | 0.0% |
| Croatian | 43 | 0.1% |
| Cuban | 54 | 0.1% |
| Czech | 34 | 0.0% |
| Czechoslovakian | 49 | 0.1% |
| Danish | 231 | 0.3% |
| Dominican | 31 | 0.0% |
| Dutch | 240 | 0.3% |
| Eastern European | 363 | 0.5% |
| English | 1,900 | 2.5% |
| Estonian | 110 | 0.1% |
| Ethiopian | 49 | 0.1% |
| European | 299 | 0.4% |
| Finnish | 110 | 0.1% |
| French | 768 | 1.0% |
| French American Indian | 5 | 0.0% |
| French Canadian | 228 | 0.3% |
| German | 2,349 | 3.1% |
| Ghanaian | 26 | 0.0% |
| Greek | 73 | 0.1% |
| Haitian | 45 | 0.1% |
| Hungarian | 815 | 1.1% |
| Indian (Asian) | 267 | 0.4% |
| Iraqi | 551 | 0.7% |
| Irish | 1,818 | 2.4% |
| Iroquois | 5 | 0.0% |
| Israeli | 453 | 0.6% |
| Italian | 1,169 | 1.5% |
| Jamaican | 533 | 0.7% |
| Japanese | 1 | 0.0% |
| Korean | 444 | 0.6% |
| Latvian | 23 | 0.0% |
| Lebanese | 133 | 0.2% |
| Liberian | 10 | 0.0% |
| Lithuanian | 70 | 0.1% |
| Lumbee | 1 | 0.0% |
| Macedonian | 38 | 0.1% |
| Maltese | 62 | 0.1% |
| Mexican | 746 | 1.0% |
| Moroccan | 35 | 0.1% |
| Native Hawaiian | 52 | 0.1% |
| Nigerian | 648 | 0.9% |
| Northern European | 16 | 0.0% |
| Norwegian | 203 | 0.3% |
| Pakistani | 2 | 0.0% |
| Palestinian | 61 | 0.1% |
| Peruvian | 13 | 0.0% |
| Polish | 1,934 | 2.5% |
| Portuguese | 70 | 0.1% |
| Puerto Rican | 64 | 0.1% |
| Romanian | 136 | 0.2% |
| Russian | 1,111 | 1.5% |
| Salvadoran | 39 | 0.1% |
| Scandinavian | 39 | 0.1% |
| Scotch-Irish | 145 | 0.2% |
| Scottish | 521 | 0.7% |
| Senegalese | 53 | 0.1% |
| Serbian | 11 | 0.0% |
| Slovak | 44 | 0.1% |
| Slovene | 8 | 0.0% |
| South African | 33 | 0.0% |
| South American | 119 | 0.2% |
| Spaniard | 8 | 0.0% |
| Spanish | 83 | 0.1% |
| Sri Lankan | 155 | 0.2% |
| Subsaharan African | 2,101 | 2.8% |
| Swedish | 54 | 0.1% |
| Swiss | 40 | 0.1% |
| Syrian | 46 | 0.1% |
| Thai | 589 | 0.8% |
| Trinidadian and Tobagonian | 32 | 0.0% |
| Ukrainian | 612 | 0.8% |
| Venezuelan | 55 | 0.1% |
| Welsh | 263 | 0.4% |
| West Indian | 1 | 0.0% |
| Yugoslavian | 27 | 0.0% | View All 102 Rows |
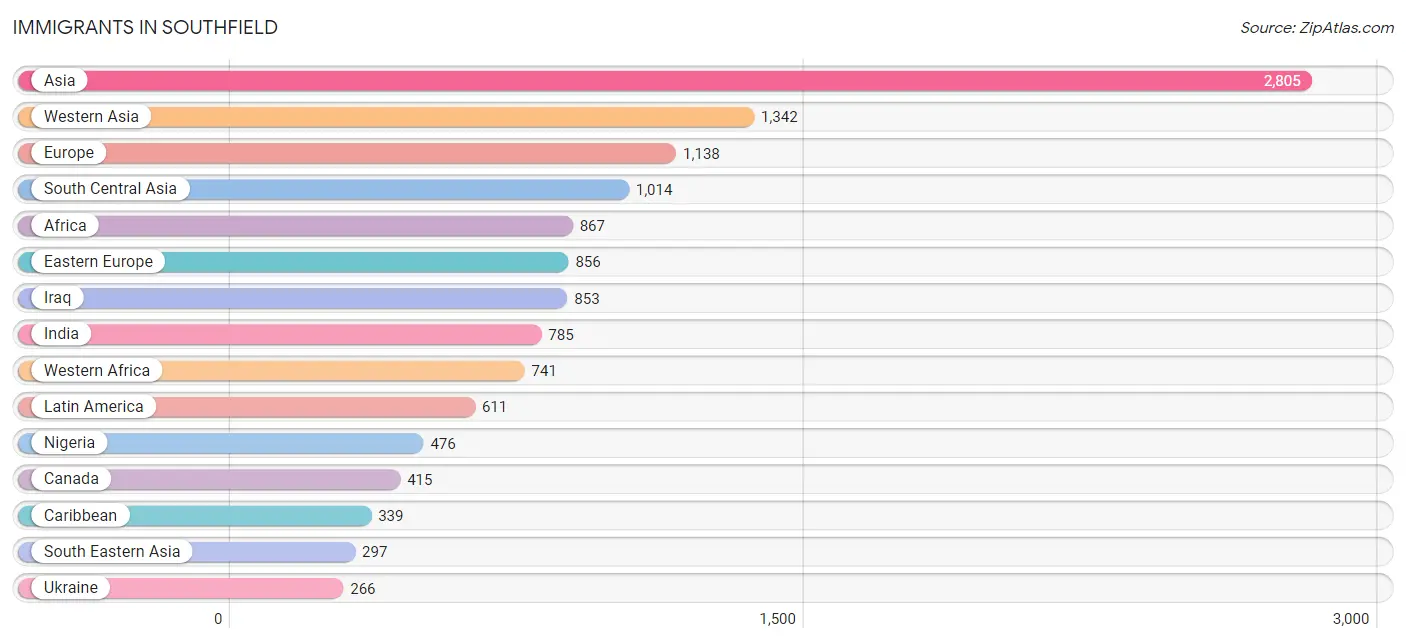
Immigrants in Southfield
The most numerous immigrant groups reported in Southfield came from Asia (2,805 | 3.7%), Western Asia (1,342 | 1.8%), Europe (1,138 | 1.5%), South Central Asia (1,014 | 1.3%), and Africa (867 | 1.1%), together accounting for 9.4% of all Southfield residents.
| Immigration Origin | # Population | % Population |
| Africa | 867 | 1.1% |
| Albania | 1 | 0.0% |
| Argentina | 1 | 0.0% |
| Armenia | 89 | 0.1% |
| Asia | 2,805 | 3.7% |
| Australia | 16 | 0.0% |
| Bahamas | 41 | 0.1% |
| Bangladesh | 50 | 0.1% |
| Belgium | 10 | 0.0% |
| Bulgaria | 12 | 0.0% |
| Cambodia | 1 | 0.0% |
| Cameroon | 11 | 0.0% |
| Canada | 415 | 0.5% |
| Caribbean | 339 | 0.4% |
| Central America | 180 | 0.2% |
| China | 134 | 0.2% |
| Colombia | 8 | 0.0% |
| Congo | 8 | 0.0% |
| Cuba | 21 | 0.0% |
| Czechoslovakia | 12 | 0.0% |
| Denmark | 8 | 0.0% |
| Dominican Republic | 9 | 0.0% |
| Eastern Africa | 40 | 0.1% |
| Eastern Asia | 148 | 0.2% |
| Eastern Europe | 856 | 1.1% |
| Egypt | 34 | 0.0% |
| England | 76 | 0.1% |
| Ethiopia | 29 | 0.0% |
| Europe | 1,138 | 1.5% |
| France | 25 | 0.0% |
| Germany | 36 | 0.1% |
| Ghana | 200 | 0.3% |
| Guyana | 9 | 0.0% |
| Haiti | 8 | 0.0% |
| Hungary | 9 | 0.0% |
| India | 785 | 1.0% |
| Iraq | 853 | 1.1% |
| Ireland | 3 | 0.0% |
| Israel | 33 | 0.0% |
| Jamaica | 259 | 0.3% |
| Japan | 14 | 0.0% |
| Jordan | 16 | 0.0% |
| Kazakhstan | 44 | 0.1% |
| Latin America | 611 | 0.8% |
| Lebanon | 78 | 0.1% |
| Lithuania | 3 | 0.0% |
| Mexico | 132 | 0.2% |
| Middle Africa | 19 | 0.0% |
| Nicaragua | 45 | 0.1% |
| Nigeria | 476 | 0.6% |
| North Macedonia | 38 | 0.1% |
| Northern Africa | 34 | 0.0% |
| Northern Europe | 174 | 0.2% |
| Oceania | 16 | 0.0% |
| Pakistan | 72 | 0.1% |
| Panama | 3 | 0.0% |
| Philippines | 216 | 0.3% |
| Poland | 59 | 0.1% |
| Romania | 28 | 0.0% |
| Russia | 192 | 0.3% |
| Saudi Arabia | 14 | 0.0% |
| Scotland | 17 | 0.0% |
| Senegal | 53 | 0.1% |
| Serbia | 7 | 0.0% |
| South Africa | 33 | 0.0% |
| South America | 92 | 0.1% |
| South Central Asia | 1,014 | 1.3% |
| South Eastern Asia | 297 | 0.4% |
| Southern Europe | 15 | 0.0% |
| Spain | 15 | 0.0% |
| Sri Lanka | 17 | 0.0% |
| Switzerland | 22 | 0.0% |
| Thailand | 2 | 0.0% |
| Trinidad and Tobago | 1 | 0.0% |
| Uganda | 11 | 0.0% |
| Ukraine | 266 | 0.4% |
| Uzbekistan | 46 | 0.1% |
| Venezuela | 74 | 0.1% |
| Vietnam | 78 | 0.1% |
| Western Africa | 741 | 1.0% |
| Western Asia | 1,342 | 1.8% |
| Western Europe | 93 | 0.1% |
| Yemen | 35 | 0.1% | View All 83 Rows |
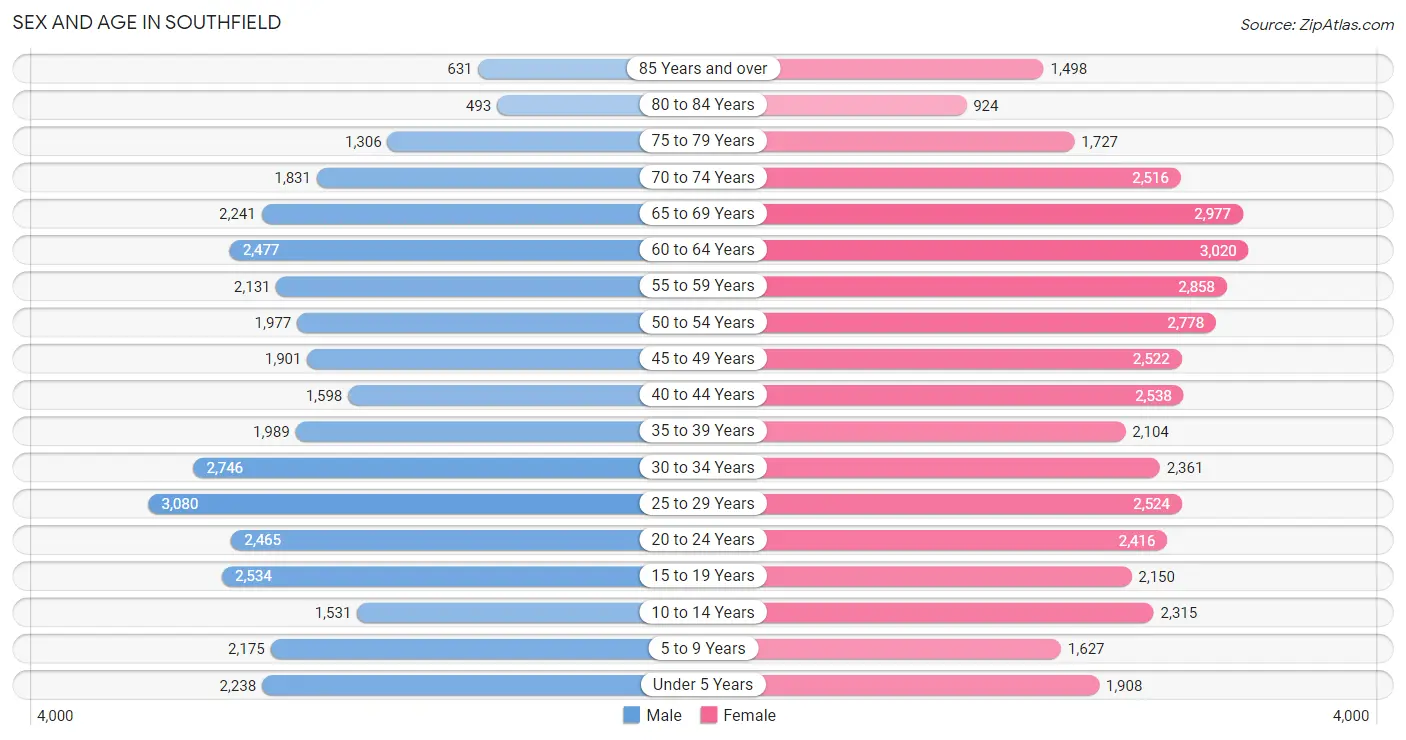
Sex and Age in Southfield
Sex and Age in Southfield
The most populous age groups in Southfield are 25 to 29 Years (3,080 | 8.7%) for men and 60 to 64 Years (3,020 | 7.4%) for women.
| Age Bracket | Male | Female |
| Under 5 Years | 2,238 (6.3%) | 1,908 (4.7%) |
| 5 to 9 Years | 2,175 (6.1%) | 1,627 (4.0%) |
| 10 to 14 Years | 1,531 (4.3%) | 2,315 (5.7%) |
| 15 to 19 Years | 2,534 (7.2%) | 2,150 (5.3%) |
| 20 to 24 Years | 2,465 (7.0%) | 2,416 (5.9%) |
| 25 to 29 Years | 3,080 (8.7%) | 2,524 (6.2%) |
| 30 to 34 Years | 2,746 (7.8%) | 2,361 (5.8%) |
| 35 to 39 Years | 1,989 (5.6%) | 2,104 (5.2%) |
| 40 to 44 Years | 1,598 (4.5%) | 2,538 (6.2%) |
| 45 to 49 Years | 1,901 (5.4%) | 2,522 (6.2%) |
| 50 to 54 Years | 1,977 (5.6%) | 2,778 (6.8%) |
| 55 to 59 Years | 2,131 (6.0%) | 2,858 (7.0%) |
| 60 to 64 Years | 2,477 (7.0%) | 3,020 (7.4%) |
| 65 to 69 Years | 2,241 (6.3%) | 2,977 (7.3%) |
| 70 to 74 Years | 1,831 (5.2%) | 2,516 (6.2%) |
| 75 to 79 Years | 1,306 (3.7%) | 1,727 (4.2%) |
| 80 to 84 Years | 493 (1.4%) | 924 (2.3%) |
| 85 Years and over | 631 (1.8%) | 1,498 (3.7%) |
| Total | 35,344 (100.0%) | 40,763 (100.0%) |
Families and Households in Southfield
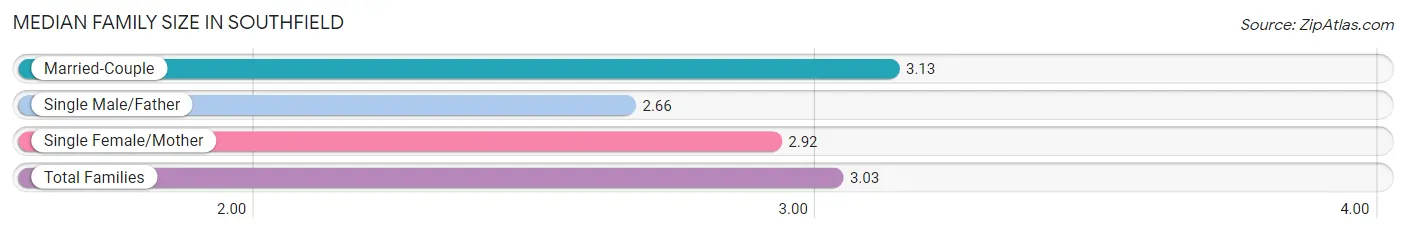
Median Family Size in Southfield
The median family size in Southfield is 3.03 persons per family, with married-couple families (10,964 | 60.5%) accounting for the largest median family size of 3.13 persons per family. On the other hand, single male/father families (1,166 | 6.4%) represent the smallest median family size with 2.66 persons per family.
| Family Type | # Families | Family Size |
| Married-Couple | 10,964 (60.5%) | 3.13 |
| Single Male/Father | 1,166 (6.4%) | 2.66 |
| Single Female/Mother | 6,000 (33.1%) | 2.92 |
| Total Families | 18,130 (100.0%) | 3.03 |
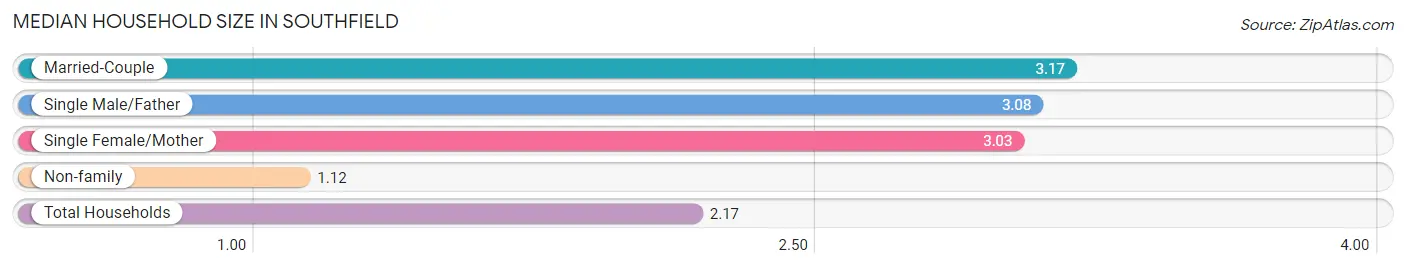
Median Household Size in Southfield
The median household size in Southfield is 2.17 persons per household, with married-couple households (10,964 | 31.9%) accounting for the largest median household size of 3.17 persons per household. non-family households (16,274 | 47.3%) represent the smallest median household size with 1.12 persons per household.
| Household Type | # Households | Household Size |
| Married-Couple | 10,964 (31.9%) | 3.17 |
| Single Male/Father | 1,166 (3.4%) | 3.08 |
| Single Female/Mother | 6,000 (17.4%) | 3.03 |
| Non-family | 16,274 (47.3%) | 1.12 |
| Total Households | 34,404 (100.0%) | 2.17 |
Household Size by Marriage Status in Southfield
Out of a total of 34,404 households in Southfield, 18,130 (52.7%) are family households, while 16,274 (47.3%) are nonfamily households. The most numerous type of family households are 2-person households, comprising 9,020, and the most common type of nonfamily households are 1-person households, comprising 14,723.
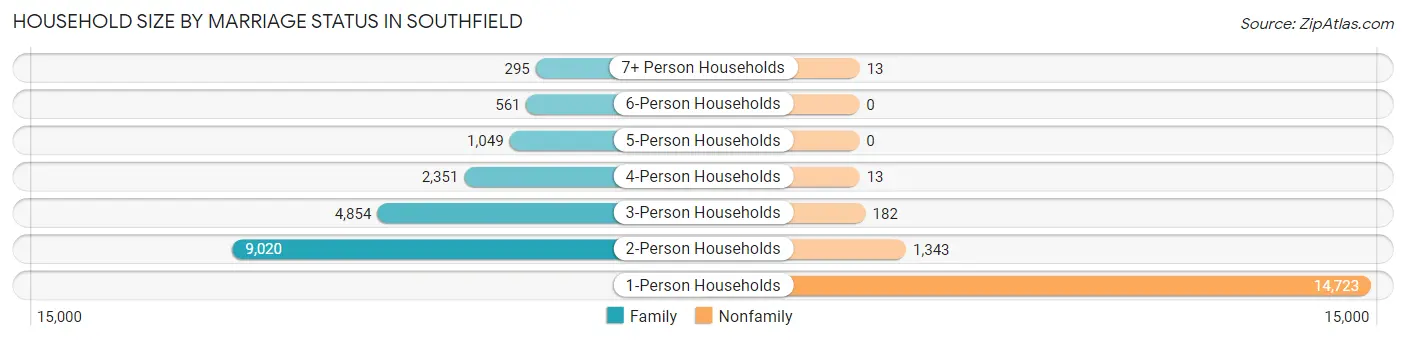
| Household Size | Family Households | Nonfamily Households |
| 1-Person Households | - | 14,723 (42.8%) |
| 2-Person Households | 9,020 (26.2%) | 1,343 (3.9%) |
| 3-Person Households | 4,854 (14.1%) | 182 (0.5%) |
| 4-Person Households | 2,351 (6.8%) | 13 (0.0%) |
| 5-Person Households | 1,049 (3.0%) | 0 (0.0%) |
| 6-Person Households | 561 (1.6%) | 0 (0.0%) |
| 7+ Person Households | 295 (0.9%) | 13 (0.0%) |
| Total | 18,130 (52.7%) | 16,274 (47.3%) |
Female Fertility in Southfield
Fertility by Age in Southfield
Average fertility rate in Southfield is 40.0 births per 1,000 women. Women in the age bracket of 20 to 34 years have the highest fertility rate with 70.0 births per 1,000 women. Women in the age bracket of 20 to 34 years acount for 73.5% of all women with births.
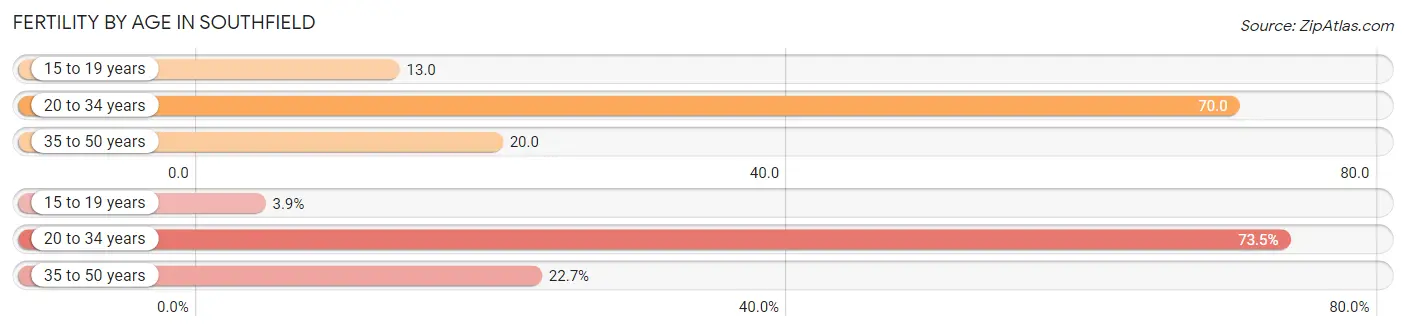
| Age Bracket | Women with Births | Births / 1,000 Women |
| 15 to 19 years | 27 (3.9%) | 13.0 |
| 20 to 34 years | 509 (73.5%) | 70.0 |
| 35 to 50 years | 157 (22.7%) | 20.0 |
| Total | 693 (100.0%) | 40.0 |
Fertility by Age by Marriage Status in Southfield
47.6% of women with births (693) in Southfield are married. The highest percentage of unmarried women with births falls into 15 to 19 years age bracket with 100.0% of them unmarried at the time of birth, while the lowest percentage of unmarried women with births belong to 35 to 50 years age bracket with 50.3% of them unmarried.
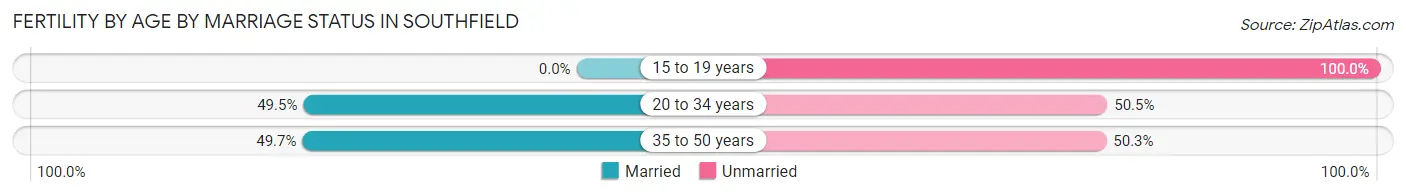
| Age Bracket | Married | Unmarried |
| 15 to 19 years | 0 (0.0%) | 27 (100.0%) |
| 20 to 34 years | 252 (49.5%) | 257 (50.5%) |
| 35 to 50 years | 78 (49.7%) | 79 (50.3%) |
| Total | 330 (47.6%) | 363 (52.4%) |
Fertility by Education in Southfield
Average fertility rate in Southfield is 40.0 births per 1,000 women. Women with the education attainment of high school diploma have the highest fertility rate of 50.0 births per 1,000 women, while women with the education attainment of less than high school have the lowest fertility at 9.0 births per 1,000 women. Women with the education attainment of college or associate's degree represent 43.3% of all women with births.
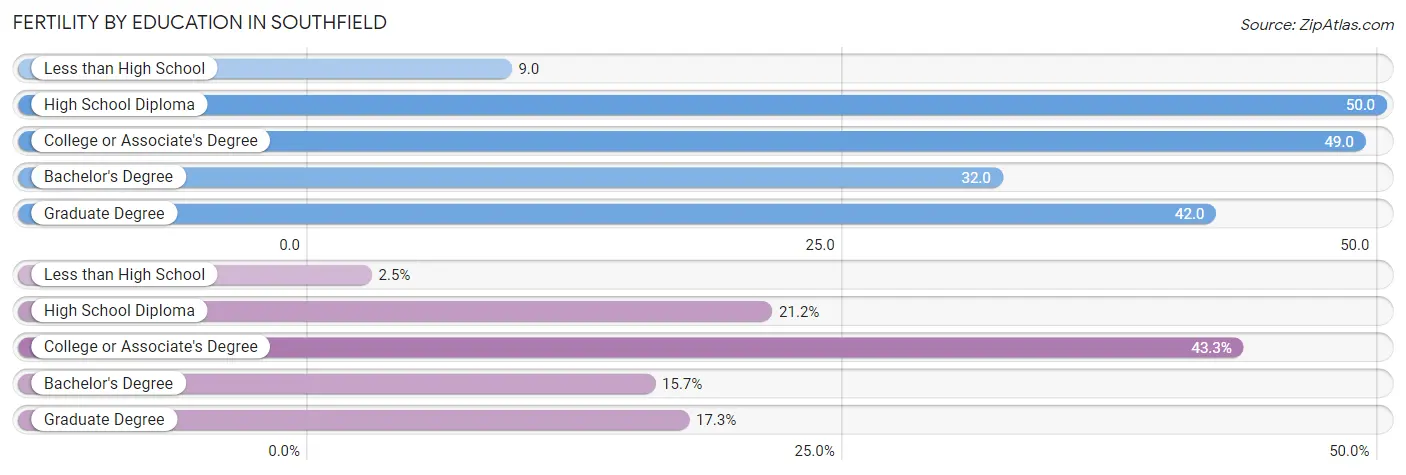
| Educational Attainment | Women with Births | Births / 1,000 Women |
| Less than High School | 17 (2.5%) | 9.0 |
| High School Diploma | 147 (21.2%) | 50.0 |
| College or Associate's Degree | 300 (43.3%) | 49.0 |
| Bachelor's Degree | 109 (15.7%) | 32.0 |
| Graduate Degree | 120 (17.3%) | 42.0 |
| Total | 693 (100.0%) | 40.0 |
Fertility by Education by Marriage Status in Southfield
52.4% of women with births in Southfield are unmarried. Women with the educational attainment of bachelor's degree are most likely to be married with 56.0% of them married at childbirth, while women with the educational attainment of less than high school are least likely to be married with 100.0% of them unmarried at childbirth.
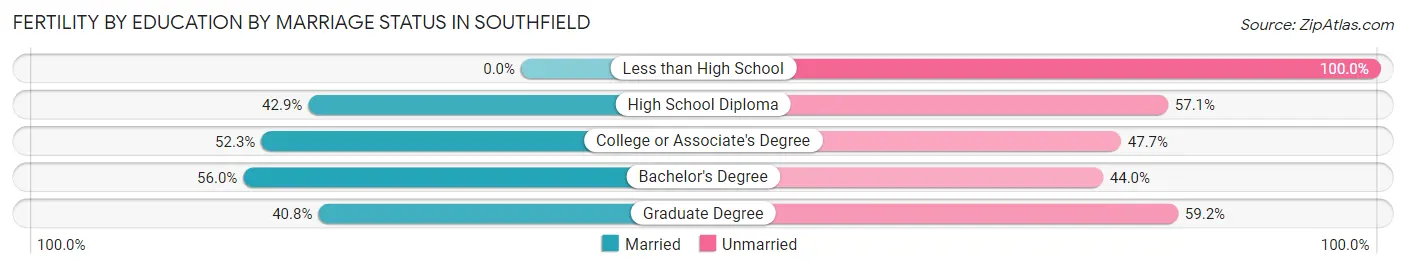
| Educational Attainment | Married | Unmarried |
| Less than High School | 0 (0.0%) | 17 (100.0%) |
| High School Diploma | 63 (42.9%) | 84 (57.1%) |
| College or Associate's Degree | 157 (52.3%) | 143 (47.7%) |
| Bachelor's Degree | 61 (56.0%) | 48 (44.0%) |
| Graduate Degree | 49 (40.8%) | 71 (59.2%) |
| Total | 330 (47.6%) | 363 (52.4%) |
Employment Characteristics in Southfield
Employment by Class of Employer in Southfield
Among the 35,191 employed individuals in Southfield, private company employees (24,305 | 69.1%), not-for-profit organizations (3,966 | 11.3%), and local government employees (2,208 | 6.3%) make up the most common classes of employment.
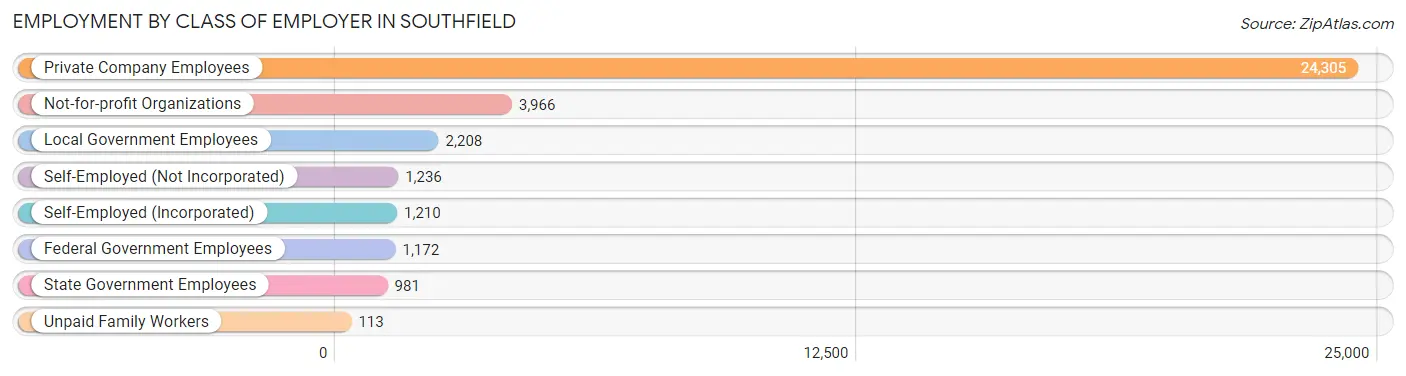
| Employer Class | # Employees | % Employees |
| Private Company Employees | 24,305 | 69.1% |
| Self-Employed (Incorporated) | 1,210 | 3.4% |
| Self-Employed (Not Incorporated) | 1,236 | 3.5% |
| Not-for-profit Organizations | 3,966 | 11.3% |
| Local Government Employees | 2,208 | 6.3% |
| State Government Employees | 981 | 2.8% |
| Federal Government Employees | 1,172 | 3.3% |
| Unpaid Family Workers | 113 | 0.3% |
| Total | 35,191 | 100.0% |
Employment Status by Age in Southfield
According to the labor force statistics for Southfield, out of the total population over 16 years of age (63,227), 61.4% or 38,821 individuals are in the labor force, with 6.5% or 2,523 of them unemployed. The age group with the highest labor force participation rate is 25 to 29 years, with 88.6% or 4,965 individuals in the labor force. Within the labor force, the 75 years and over age range has the highest percentage of unemployed individuals, with 19.0% or 81 of them being unemployed.
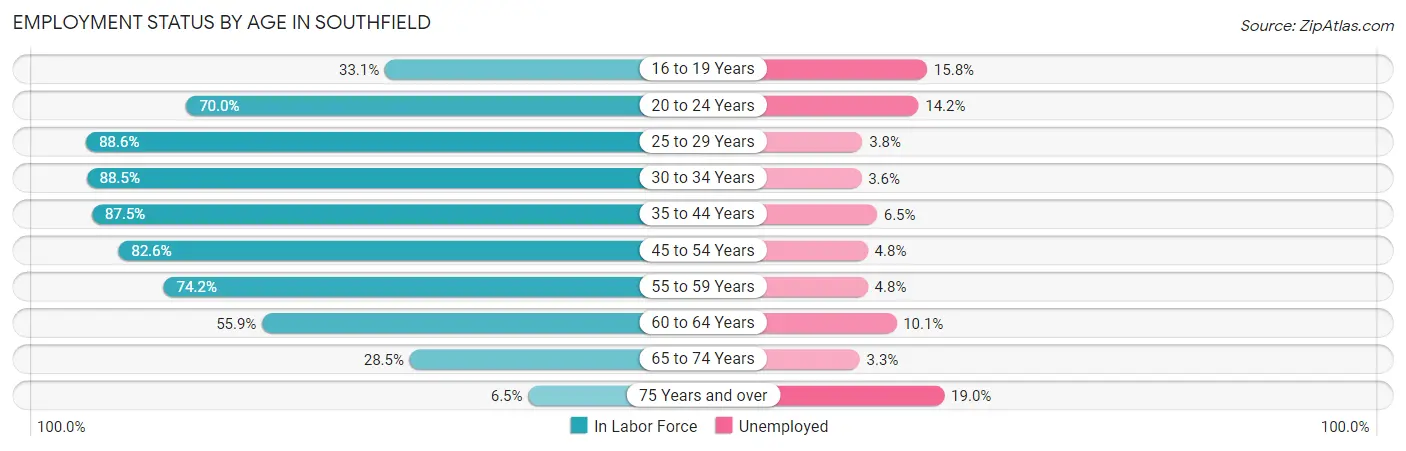
| Age Bracket | In Labor Force | Unemployed |
| 16 to 19 Years | 1,191 (33.1%) | 188 (15.8%) |
| 20 to 24 Years | 3,417 (70.0%) | 485 (14.2%) |
| 25 to 29 Years | 4,965 (88.6%) | 189 (3.8%) |
| 30 to 34 Years | 4,520 (88.5%) | 163 (3.6%) |
| 35 to 44 Years | 7,200 (87.5%) | 468 (6.5%) |
| 45 to 54 Years | 7,581 (82.6%) | 364 (4.8%) |
| 55 to 59 Years | 3,702 (74.2%) | 178 (4.8%) |
| 60 to 64 Years | 3,073 (55.9%) | 310 (10.1%) |
| 65 to 74 Years | 2,726 (28.5%) | 90 (3.3%) |
| 75 Years and over | 428 (6.5%) | 81 (19.0%) |
| Total | 38,821 (61.4%) | 2,523 (6.5%) |
Employment Status by Educational Attainment in Southfield
According to labor force statistics for Southfield, 80.4% of individuals (31,038) out of the total population between 25 and 64 years of age (38,604) are in the labor force, with 5.4% or 1,676 of them being unemployed. The group with the highest labor force participation rate are those with the educational attainment of bachelor's degree or higher, with 88.5% or 13,156 individuals in the labor force. Within the labor force, individuals with high school diploma education have the highest percentage of unemployment, with 11.4% or 609 of them being unemployed.
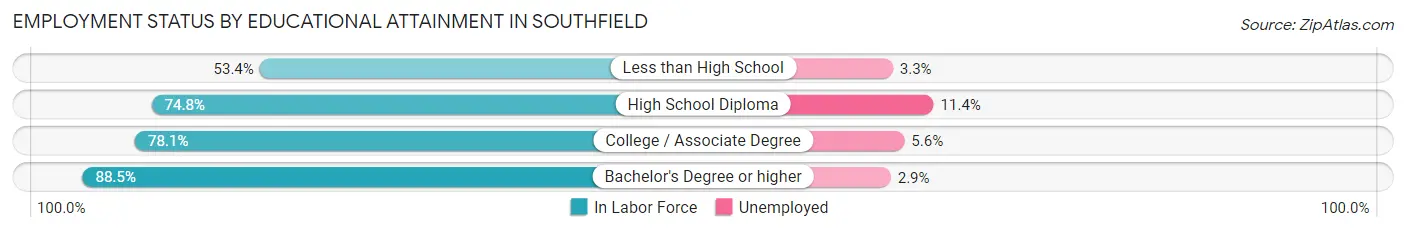
| Educational Attainment | In Labor Force | Unemployed |
| Less than High School | 889 (53.4%) | 55 (3.3%) |
| High School Diploma | 5,341 (74.8%) | 814 (11.4%) |
| College / Associate Degree | 11,662 (78.1%) | 836 (5.6%) |
| Bachelor's Degree or higher | 13,156 (88.5%) | 431 (2.9%) |
| Total | 31,038 (80.4%) | 2,085 (5.4%) |
Employment Occupations by Sex in Southfield
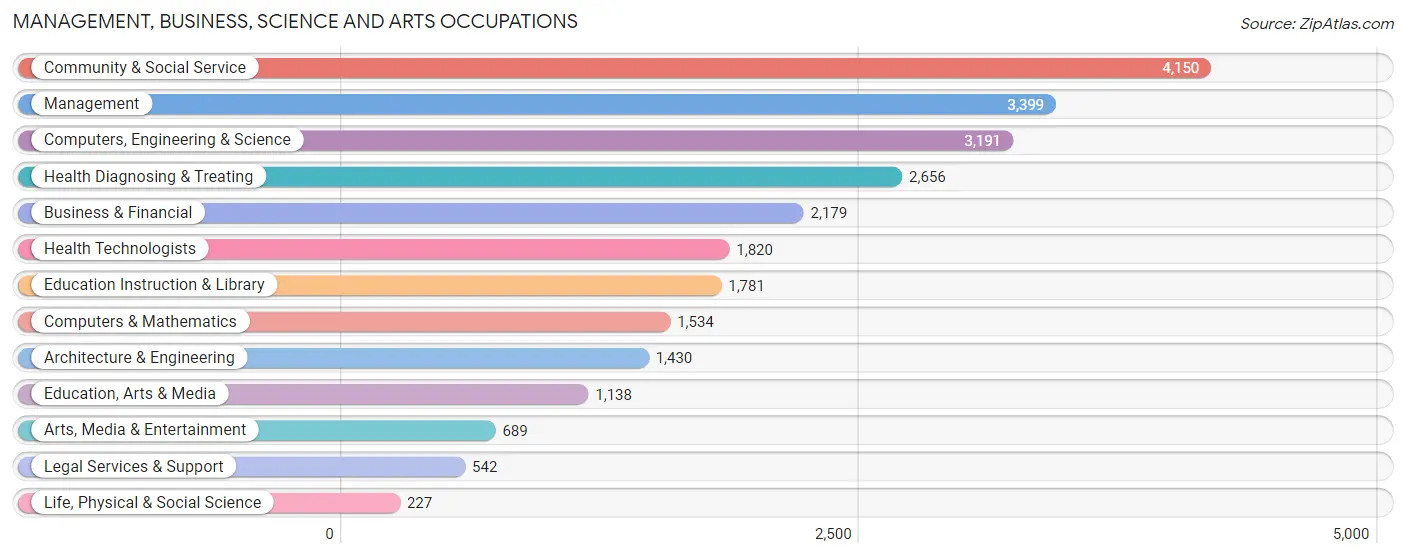
Management, Business, Science and Arts Occupations
The most common Management, Business, Science and Arts occupations in Southfield are Community & Social Service (4,150 | 11.4%), Management (3,399 | 9.4%), Computers, Engineering & Science (3,191 | 8.8%), Health Diagnosing & Treating (2,656 | 7.3%), and Business & Financial (2,179 | 6.0%).
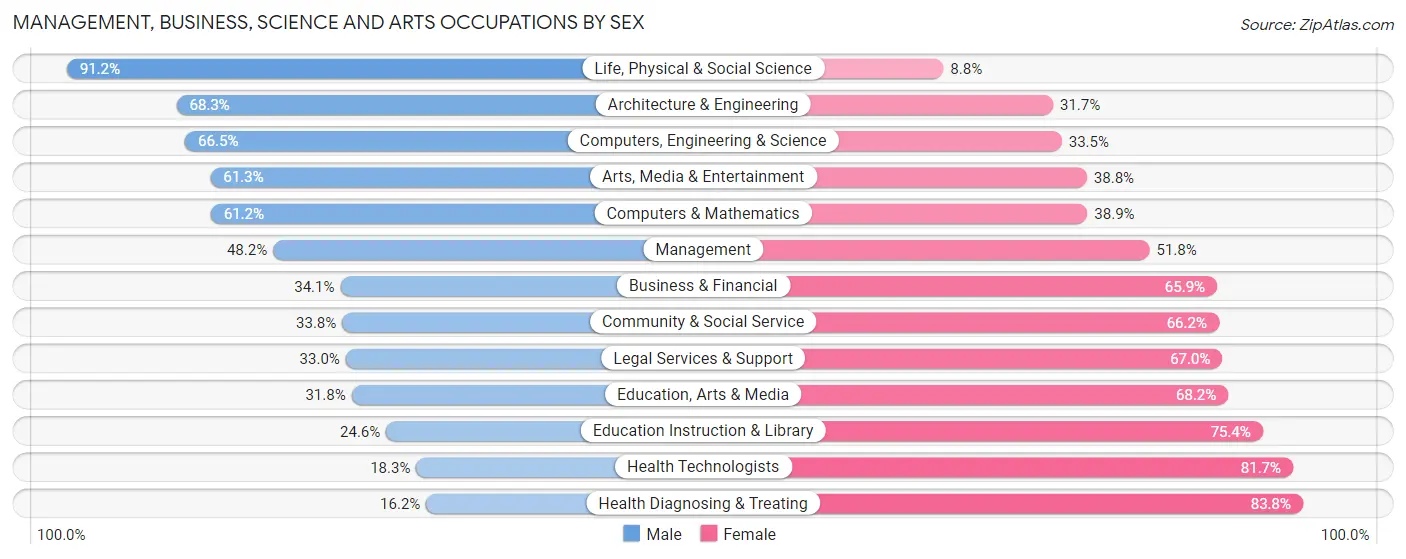
Management, Business, Science and Arts Occupations by Sex
Within the Management, Business, Science and Arts occupations in Southfield, the most male-oriented occupations are Life, Physical & Social Science (91.2%), Architecture & Engineering (68.3%), and Computers, Engineering & Science (66.5%), while the most female-oriented occupations are Health Diagnosing & Treating (83.8%), Health Technologists (81.7%), and Education Instruction & Library (75.4%).
| Occupation | Male | Female |
| Management | 1,638 (48.2%) | 1,761 (51.8%) |
| Business & Financial | 744 (34.1%) | 1,435 (65.9%) |
| Computers, Engineering & Science | 2,122 (66.5%) | 1,069 (33.5%) |
| Computers & Mathematics | 938 (61.2%) | 596 (38.9%) |
| Architecture & Engineering | 977 (68.3%) | 453 (31.7%) |
| Life, Physical & Social Science | 207 (91.2%) | 20 (8.8%) |
| Community & Social Service | 1,401 (33.8%) | 2,749 (66.2%) |
| Education, Arts & Media | 362 (31.8%) | 776 (68.2%) |
| Legal Services & Support | 179 (33.0%) | 363 (67.0%) |
| Education Instruction & Library | 438 (24.6%) | 1,343 (75.4%) |
| Arts, Media & Entertainment | 422 (61.3%) | 267 (38.8%) |
| Health Diagnosing & Treating | 431 (16.2%) | 2,225 (83.8%) |
| Health Technologists | 333 (18.3%) | 1,487 (81.7%) |
| Total (Category) | 6,336 (40.7%) | 9,239 (59.3%) |
| Total (Overall) | 16,902 (46.6%) | 19,361 (53.4%) |
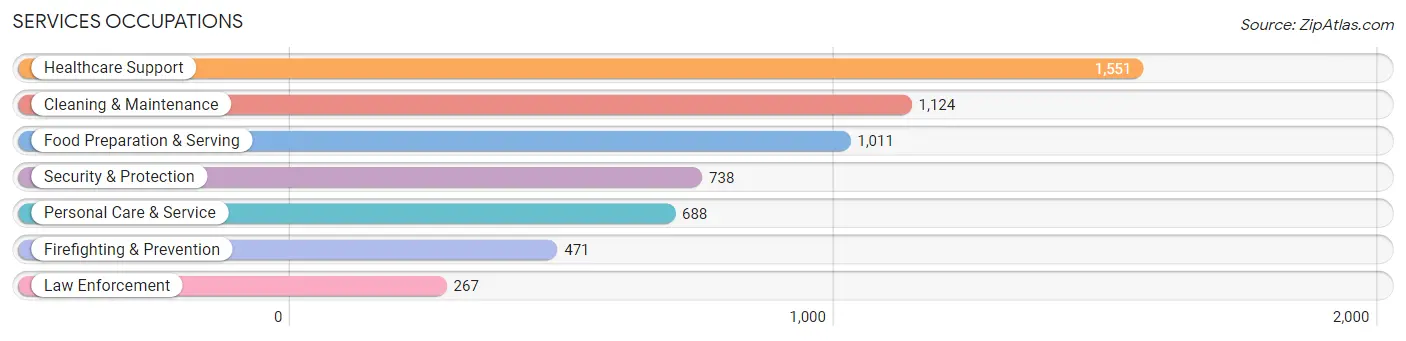
Services Occupations
The most common Services occupations in Southfield are Healthcare Support (1,551 | 4.3%), Cleaning & Maintenance (1,124 | 3.1%), Food Preparation & Serving (1,011 | 2.8%), Security & Protection (738 | 2.0%), and Personal Care & Service (688 | 1.9%).
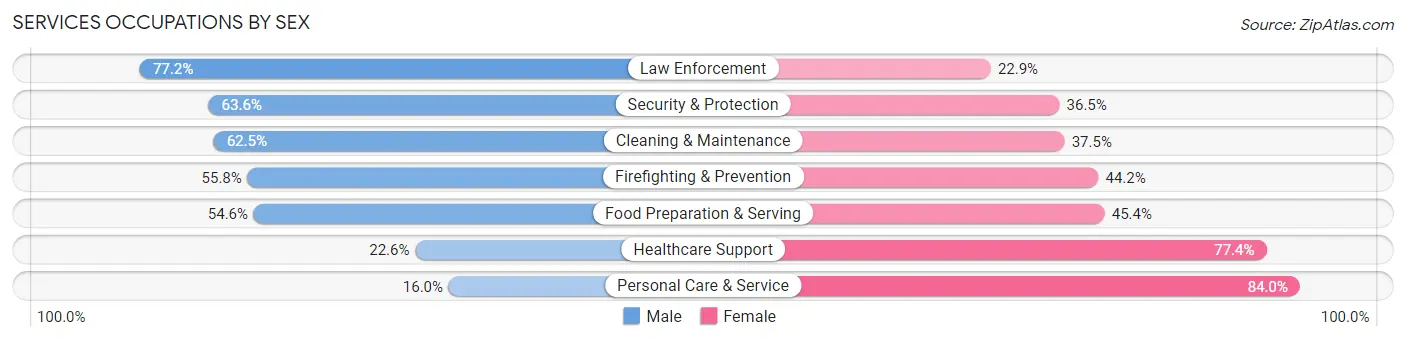
Services Occupations by Sex
Within the Services occupations in Southfield, the most male-oriented occupations are Law Enforcement (77.1%), Security & Protection (63.5%), and Cleaning & Maintenance (62.5%), while the most female-oriented occupations are Personal Care & Service (84.0%), Healthcare Support (77.4%), and Food Preparation & Serving (45.4%).
| Occupation | Male | Female |
| Healthcare Support | 351 (22.6%) | 1,200 (77.4%) |
| Security & Protection | 469 (63.5%) | 269 (36.4%) |
| Firefighting & Prevention | 263 (55.8%) | 208 (44.2%) |
| Law Enforcement | 206 (77.1%) | 61 (22.9%) |
| Food Preparation & Serving | 552 (54.6%) | 459 (45.4%) |
| Cleaning & Maintenance | 703 (62.5%) | 421 (37.5%) |
| Personal Care & Service | 110 (16.0%) | 578 (84.0%) |
| Total (Category) | 2,185 (42.7%) | 2,927 (57.3%) |
| Total (Overall) | 16,902 (46.6%) | 19,361 (53.4%) |
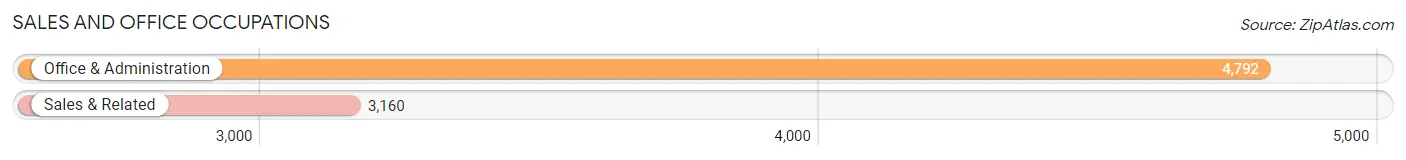
Sales and Office Occupations
The most common Sales and Office occupations in Southfield are Office & Administration (4,792 | 13.2%), and Sales & Related (3,160 | 8.7%).
Sales and Office Occupations by Sex
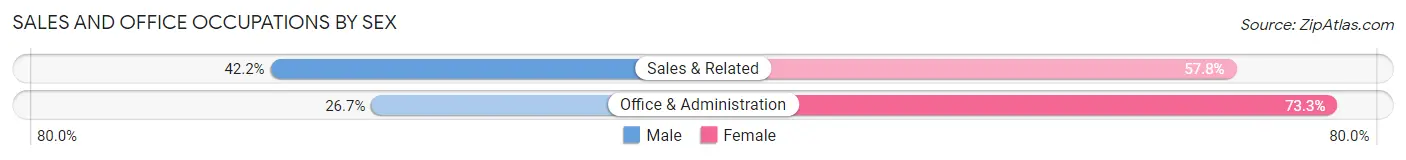
| Occupation | Male | Female |
| Sales & Related | 1,333 (42.2%) | 1,827 (57.8%) |
| Office & Administration | 1,278 (26.7%) | 3,514 (73.3%) |
| Total (Category) | 2,611 (32.8%) | 5,341 (67.2%) |
| Total (Overall) | 16,902 (46.6%) | 19,361 (53.4%) |
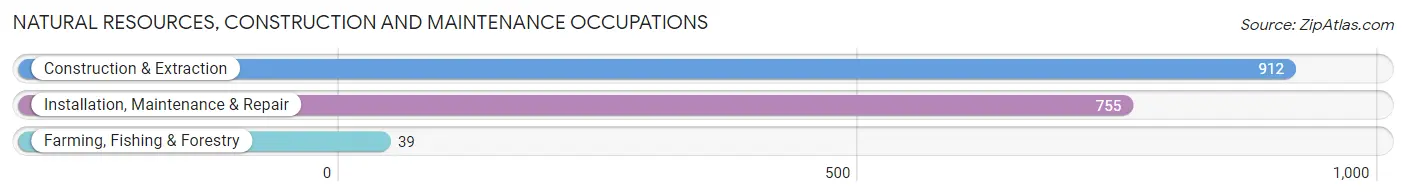
Natural Resources, Construction and Maintenance Occupations
The most common Natural Resources, Construction and Maintenance occupations in Southfield are Construction & Extraction (912 | 2.5%), Installation, Maintenance & Repair (755 | 2.1%), and Farming, Fishing & Forestry (39 | 0.1%).
Natural Resources, Construction and Maintenance Occupations by Sex
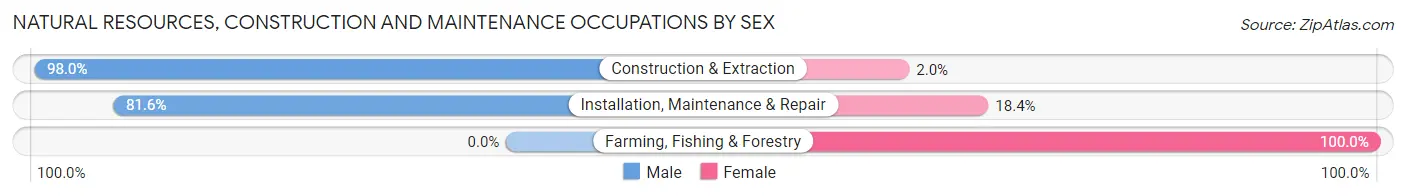
| Occupation | Male | Female |
| Farming, Fishing & Forestry | 0 (0.0%) | 39 (100.0%) |
| Construction & Extraction | 894 (98.0%) | 18 (2.0%) |
| Installation, Maintenance & Repair | 616 (81.6%) | 139 (18.4%) |
| Total (Category) | 1,510 (88.5%) | 196 (11.5%) |
| Total (Overall) | 16,902 (46.6%) | 19,361 (53.4%) |
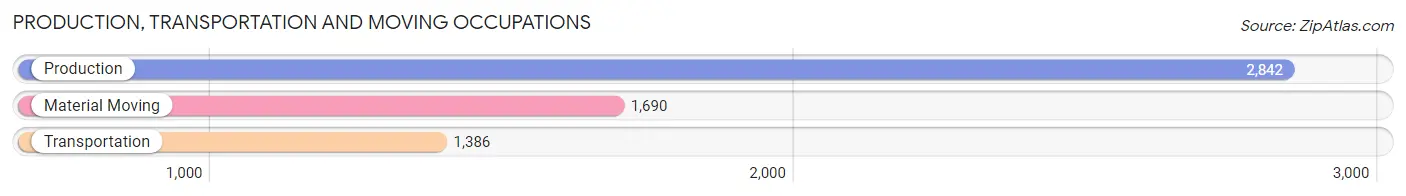
Production, Transportation and Moving Occupations
The most common Production, Transportation and Moving occupations in Southfield are Production (2,842 | 7.8%), Material Moving (1,690 | 4.7%), and Transportation (1,386 | 3.8%).
Production, Transportation and Moving Occupations by Sex
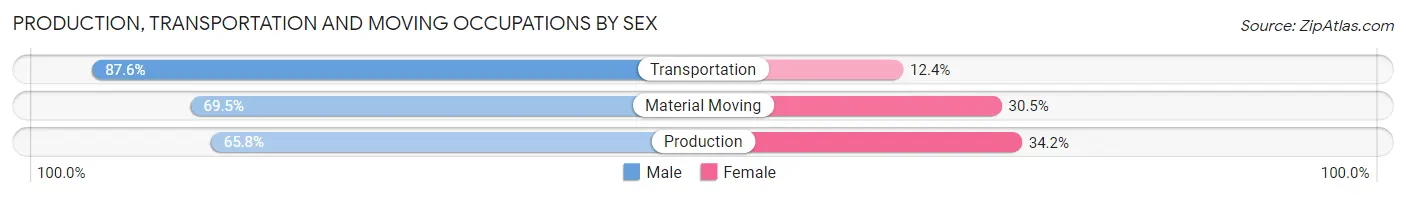
| Occupation | Male | Female |
| Production | 1,871 (65.8%) | 971 (34.2%) |
| Transportation | 1,214 (87.6%) | 172 (12.4%) |
| Material Moving | 1,175 (69.5%) | 515 (30.5%) |
| Total (Category) | 4,260 (72.0%) | 1,658 (28.0%) |
| Total (Overall) | 16,902 (46.6%) | 19,361 (53.4%) |
Employment Industries by Sex in Southfield
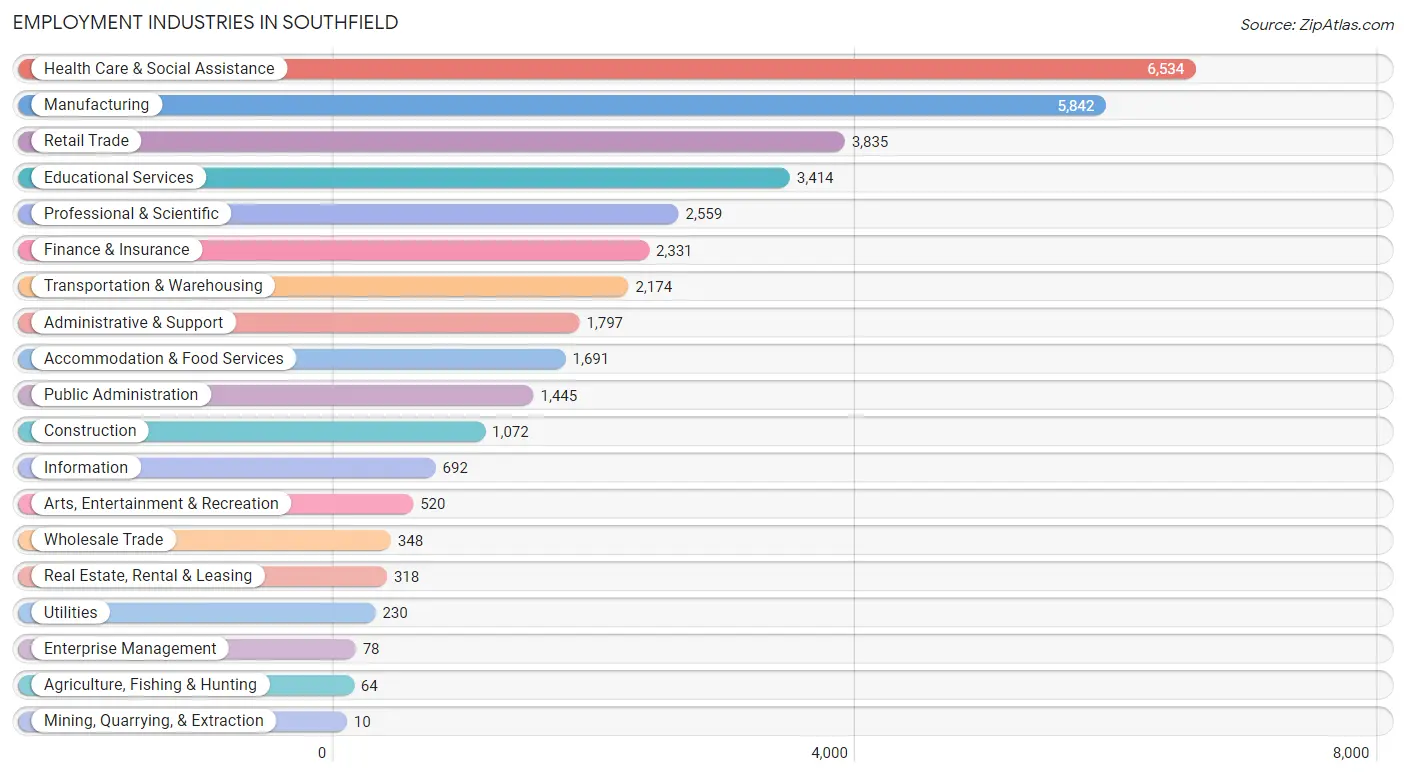
Employment Industries in Southfield
The major employment industries in Southfield include Health Care & Social Assistance (6,534 | 18.0%), Manufacturing (5,842 | 16.1%), Retail Trade (3,835 | 10.6%), Educational Services (3,414 | 9.4%), and Professional & Scientific (2,559 | 7.1%).
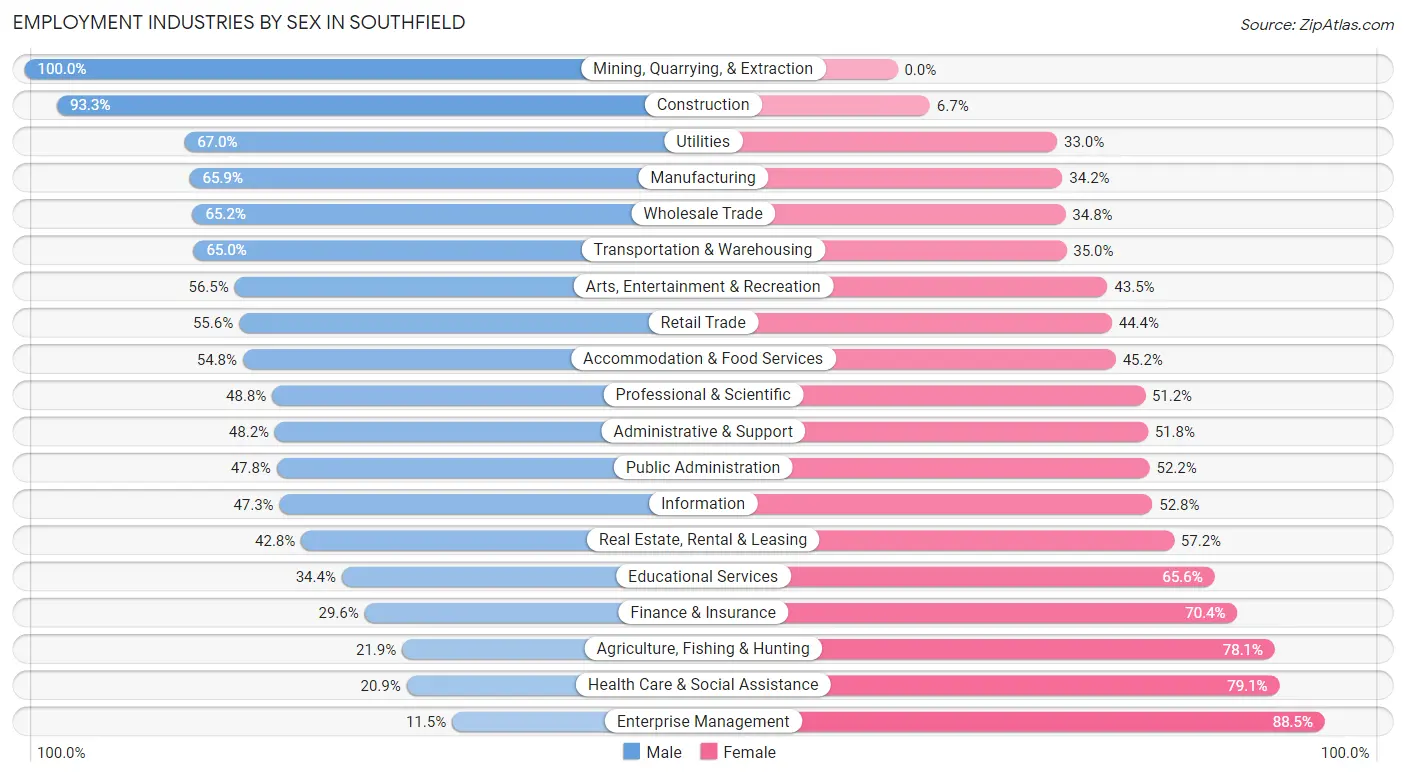
Employment Industries by Sex in Southfield
The Southfield industries that see more men than women are Mining, Quarrying, & Extraction (100.0%), Construction (93.3%), and Utilities (67.0%), whereas the industries that tend to have a higher number of women are Enterprise Management (88.5%), Health Care & Social Assistance (79.1%), and Agriculture, Fishing & Hunting (78.1%).
| Industry | Male | Female |
| Agriculture, Fishing & Hunting | 14 (21.9%) | 50 (78.1%) |
| Mining, Quarrying, & Extraction | 10 (100.0%) | 0 (0.0%) |
| Construction | 1,000 (93.3%) | 72 (6.7%) |
| Manufacturing | 3,847 (65.8%) | 1,995 (34.2%) |
| Wholesale Trade | 227 (65.2%) | 121 (34.8%) |
| Retail Trade | 2,133 (55.6%) | 1,702 (44.4%) |
| Transportation & Warehousing | 1,414 (65.0%) | 760 (35.0%) |
| Utilities | 154 (67.0%) | 76 (33.0%) |
| Information | 327 (47.2%) | 365 (52.7%) |
| Finance & Insurance | 691 (29.6%) | 1,640 (70.4%) |
| Real Estate, Rental & Leasing | 136 (42.8%) | 182 (57.2%) |
| Professional & Scientific | 1,248 (48.8%) | 1,311 (51.2%) |
| Enterprise Management | 9 (11.5%) | 69 (88.5%) |
| Administrative & Support | 866 (48.2%) | 931 (51.8%) |
| Educational Services | 1,173 (34.4%) | 2,241 (65.6%) |
| Health Care & Social Assistance | 1,368 (20.9%) | 5,166 (79.1%) |
| Arts, Entertainment & Recreation | 294 (56.5%) | 226 (43.5%) |
| Accommodation & Food Services | 927 (54.8%) | 764 (45.2%) |
| Public Administration | 691 (47.8%) | 754 (52.2%) |
| Total | 16,902 (46.6%) | 19,361 (53.4%) |
Education in Southfield
School Enrollment in Southfield
The most common levels of schooling among the 16,459 students in Southfield are college / undergraduate (3,604 | 21.9%), high school (3,518 | 21.4%), and middle school (3,192 | 19.4%).
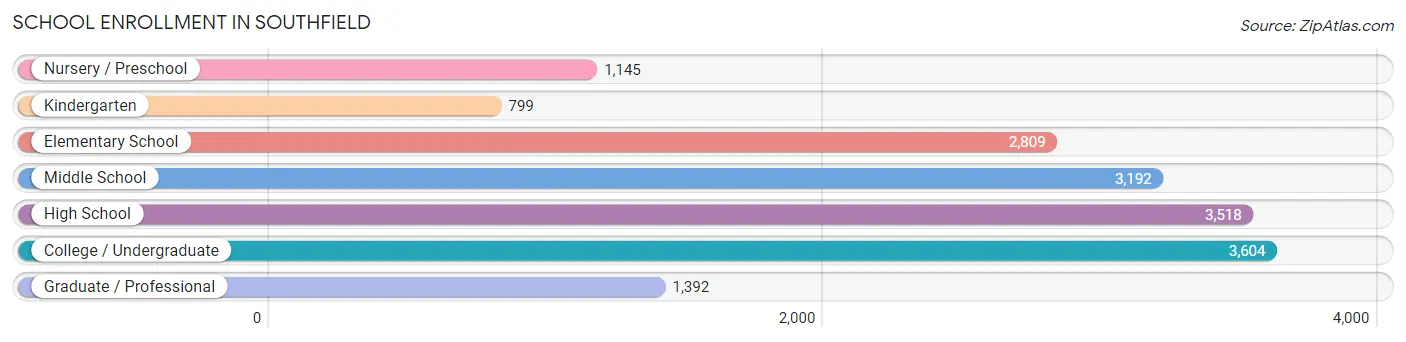
| School Level | # Students | % Students |
| Nursery / Preschool | 1,145 | 7.0% |
| Kindergarten | 799 | 4.9% |
| Elementary School | 2,809 | 17.1% |
| Middle School | 3,192 | 19.4% |
| High School | 3,518 | 21.4% |
| College / Undergraduate | 3,604 | 21.9% |
| Graduate / Professional | 1,392 | 8.5% |
| Total | 16,459 | 100.0% |
School Enrollment by Age by Funding Source in Southfield
Out of a total of 16,459 students who are enrolled in schools in Southfield, 4,065 (24.7%) attend a private institution, while the remaining 12,394 (75.3%) are enrolled in public schools. The age group of 3 to 4 year olds has the highest likelihood of being enrolled in private schools, with 470 (49.1% in the age bracket) enrolled. Conversely, the age group of 15 to 17 year olds has the lowest likelihood of being enrolled in a private school, with 2,132 (81.7% in the age bracket) attending a public institution.
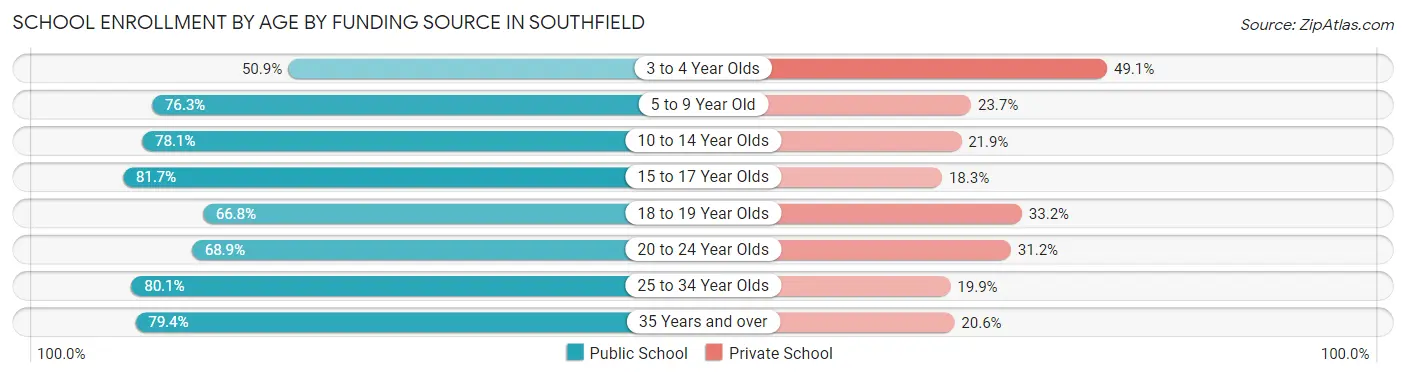
| Age Bracket | Public School | Private School |
| 3 to 4 Year Olds | 488 (50.9%) | 470 (49.1%) |
| 5 to 9 Year Old | 2,765 (76.3%) | 860 (23.7%) |
| 10 to 14 Year Olds | 2,955 (78.1%) | 828 (21.9%) |
| 15 to 17 Year Olds | 2,132 (81.7%) | 478 (18.3%) |
| 18 to 19 Year Olds | 807 (66.8%) | 401 (33.2%) |
| 20 to 24 Year Olds | 1,063 (68.9%) | 481 (31.1%) |
| 25 to 34 Year Olds | 899 (80.1%) | 223 (19.9%) |
| 35 Years and over | 1,277 (79.4%) | 332 (20.6%) |
| Total | 12,394 (75.3%) | 4,065 (24.7%) |
Educational Attainment by Field of Study in Southfield
Business (4,175 | 18.9%), education (2,739 | 12.4%), science & technology (2,387 | 10.8%), engineering (2,365 | 10.7%), and arts & humanities (1,747 | 7.9%) are the most common fields of study among 22,054 individuals in Southfield who have obtained a bachelor's degree or higher.
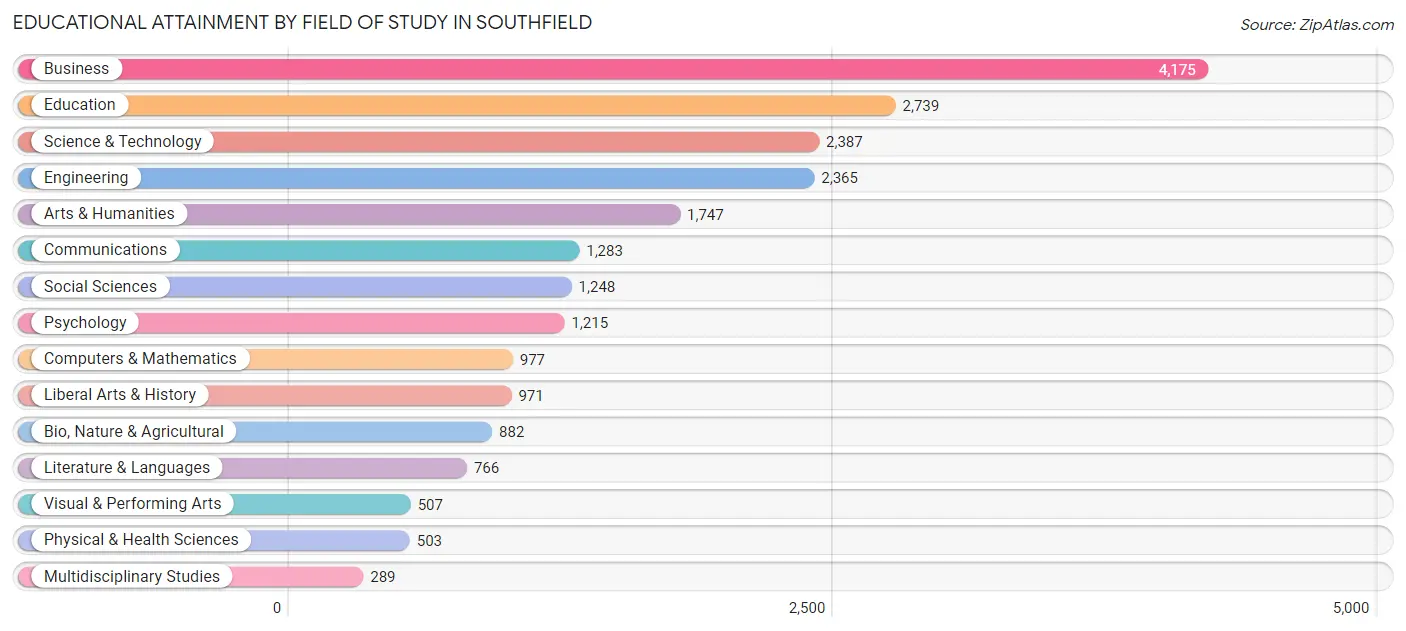
| Field of Study | # Graduates | % Graduates |
| Computers & Mathematics | 977 | 4.4% |
| Bio, Nature & Agricultural | 882 | 4.0% |
| Physical & Health Sciences | 503 | 2.3% |
| Psychology | 1,215 | 5.5% |
| Social Sciences | 1,248 | 5.7% |
| Engineering | 2,365 | 10.7% |
| Multidisciplinary Studies | 289 | 1.3% |
| Science & Technology | 2,387 | 10.8% |
| Business | 4,175 | 18.9% |
| Education | 2,739 | 12.4% |
| Literature & Languages | 766 | 3.5% |
| Liberal Arts & History | 971 | 4.4% |
| Visual & Performing Arts | 507 | 2.3% |
| Communications | 1,283 | 5.8% |
| Arts & Humanities | 1,747 | 7.9% |
| Total | 22,054 | 100.0% |
Transportation & Commute in Southfield
Vehicle Availability by Sex in Southfield
The most prevalent vehicle ownership categories in Southfield are males with 2 vehicles (6,930, accounting for 42.1%) and females with 2 vehicles (7,314, making up 37.6%).
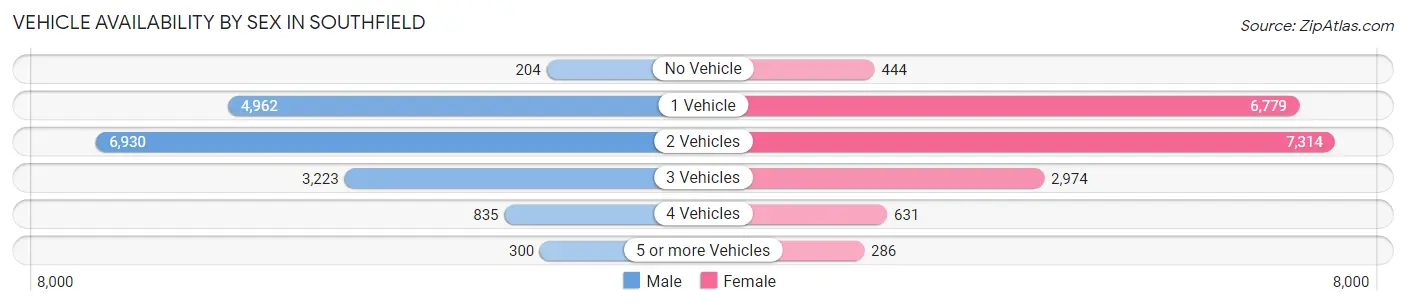
| Vehicles Available | Male | Female |
| No Vehicle | 204 (1.2%) | 444 (2.4%) |
| 1 Vehicle | 4,962 (30.2%) | 6,779 (36.8%) |
| 2 Vehicles | 6,930 (42.1%) | 7,314 (39.7%) |
| 3 Vehicles | 3,223 (19.6%) | 2,974 (16.1%) |
| 4 Vehicles | 835 (5.1%) | 631 (3.4%) |
| 5 or more Vehicles | 300 (1.8%) | 286 (1.5%) |
| Total | 16,454 (100.0%) | 18,428 (100.0%) |
Commute Time in Southfield
The most frequently occuring commute durations in Southfield are 30 to 34 minutes (6,259 commuters, 20.5%), 15 to 19 minutes (5,248 commuters, 17.2%), and 20 to 24 minutes (5,198 commuters, 17.0%).
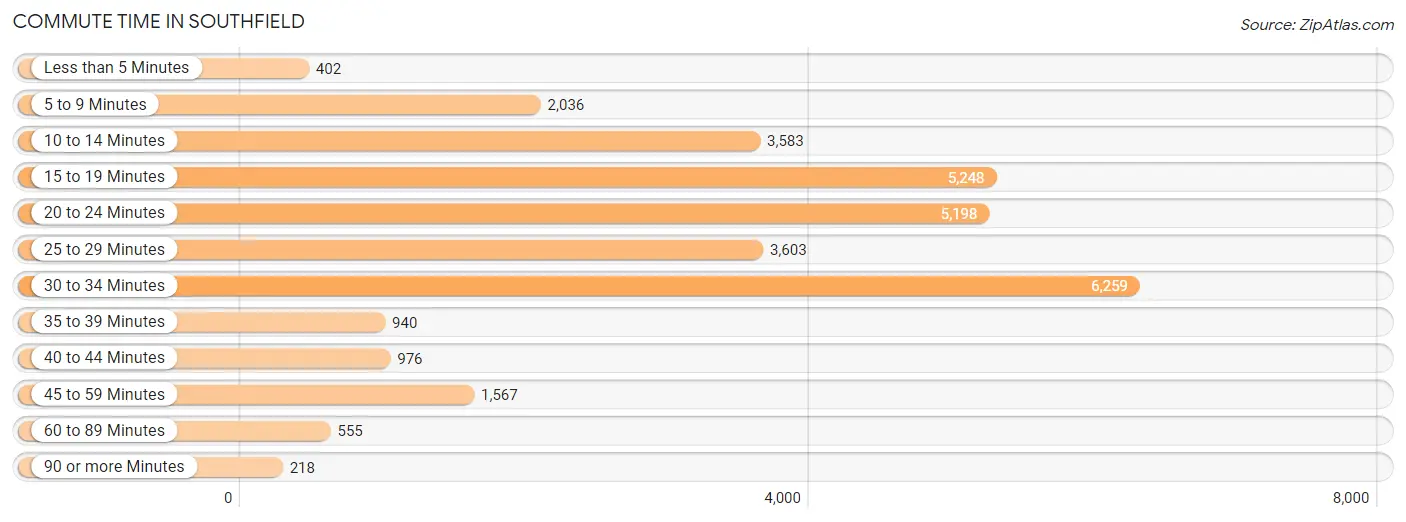
| Commute Time | # Commuters | % Commuters |
| Less than 5 Minutes | 402 | 1.3% |
| 5 to 9 Minutes | 2,036 | 6.7% |
| 10 to 14 Minutes | 3,583 | 11.7% |
| 15 to 19 Minutes | 5,248 | 17.2% |
| 20 to 24 Minutes | 5,198 | 17.0% |
| 25 to 29 Minutes | 3,603 | 11.8% |
| 30 to 34 Minutes | 6,259 | 20.5% |
| 35 to 39 Minutes | 940 | 3.1% |
| 40 to 44 Minutes | 976 | 3.2% |
| 45 to 59 Minutes | 1,567 | 5.1% |
| 60 to 89 Minutes | 555 | 1.8% |
| 90 or more Minutes | 218 | 0.7% |
Commute Time by Sex in Southfield
The most common commute times in Southfield are 30 to 34 minutes (3,468 commuters, 23.4%) for males and 15 to 19 minutes (3,067 commuters, 19.4%) for females.
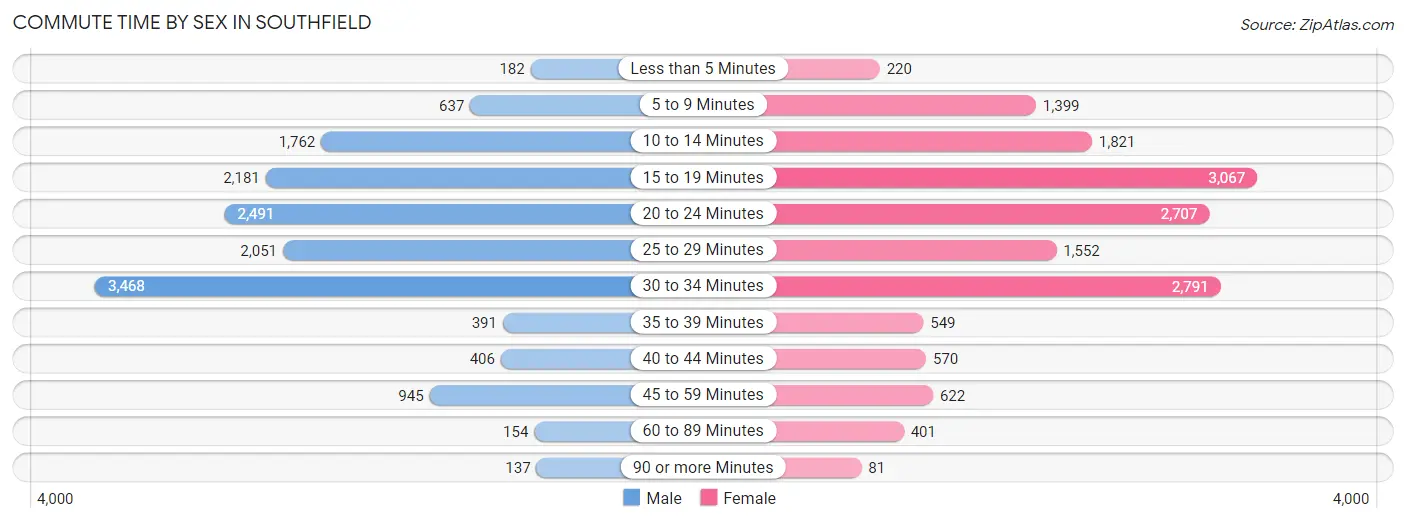
| Commute Time | Male | Female |
| Less than 5 Minutes | 182 (1.2%) | 220 (1.4%) |
| 5 to 9 Minutes | 637 (4.3%) | 1,399 (8.9%) |
| 10 to 14 Minutes | 1,762 (11.9%) | 1,821 (11.5%) |
| 15 to 19 Minutes | 2,181 (14.7%) | 3,067 (19.4%) |
| 20 to 24 Minutes | 2,491 (16.8%) | 2,707 (17.2%) |
| 25 to 29 Minutes | 2,051 (13.9%) | 1,552 (9.8%) |
| 30 to 34 Minutes | 3,468 (23.4%) | 2,791 (17.7%) |
| 35 to 39 Minutes | 391 (2.6%) | 549 (3.5%) |
| 40 to 44 Minutes | 406 (2.7%) | 570 (3.6%) |
| 45 to 59 Minutes | 945 (6.4%) | 622 (3.9%) |
| 60 to 89 Minutes | 154 (1.0%) | 401 (2.5%) |
| 90 or more Minutes | 137 (0.9%) | 81 (0.5%) |
Time of Departure to Work by Sex in Southfield
The most frequent times of departure to work in Southfield are 7:00 AM to 7:29 AM (2,303, 15.6%) for males and 7:00 AM to 7:29 AM (2,517, 16.0%) for females.
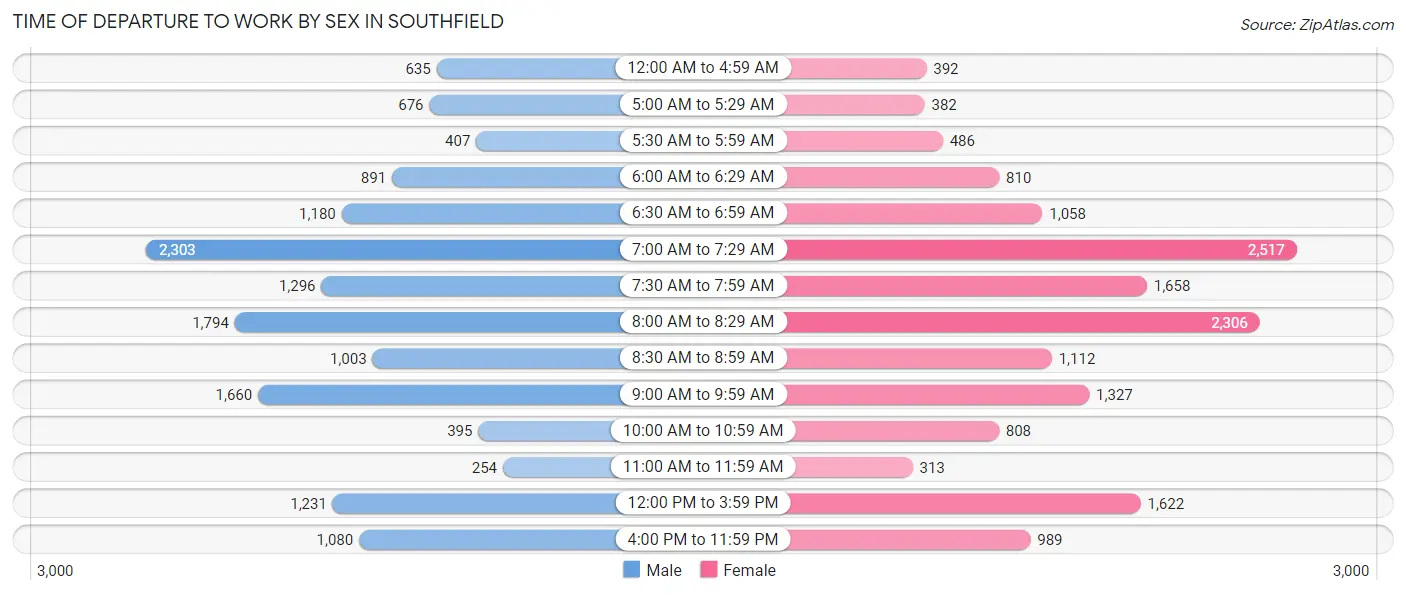
| Time of Departure | Male | Female |
| 12:00 AM to 4:59 AM | 635 (4.3%) | 392 (2.5%) |
| 5:00 AM to 5:29 AM | 676 (4.6%) | 382 (2.4%) |
| 5:30 AM to 5:59 AM | 407 (2.8%) | 486 (3.1%) |
| 6:00 AM to 6:29 AM | 891 (6.0%) | 810 (5.1%) |
| 6:30 AM to 6:59 AM | 1,180 (8.0%) | 1,058 (6.7%) |
| 7:00 AM to 7:29 AM | 2,303 (15.6%) | 2,517 (16.0%) |
| 7:30 AM to 7:59 AM | 1,296 (8.7%) | 1,658 (10.5%) |
| 8:00 AM to 8:29 AM | 1,794 (12.1%) | 2,306 (14.6%) |
| 8:30 AM to 8:59 AM | 1,003 (6.8%) | 1,112 (7.0%) |
| 9:00 AM to 9:59 AM | 1,660 (11.2%) | 1,327 (8.4%) |
| 10:00 AM to 10:59 AM | 395 (2.7%) | 808 (5.1%) |
| 11:00 AM to 11:59 AM | 254 (1.7%) | 313 (2.0%) |
| 12:00 PM to 3:59 PM | 1,231 (8.3%) | 1,622 (10.3%) |
| 4:00 PM to 11:59 PM | 1,080 (7.3%) | 989 (6.3%) |
| Total | 14,805 (100.0%) | 15,780 (100.0%) |
Housing Occupancy in Southfield
Occupancy by Ownership in Southfield
Of the total 34,404 dwellings in Southfield, owner-occupied units account for 17,596 (51.1%), while renter-occupied units make up 16,808 (48.8%).
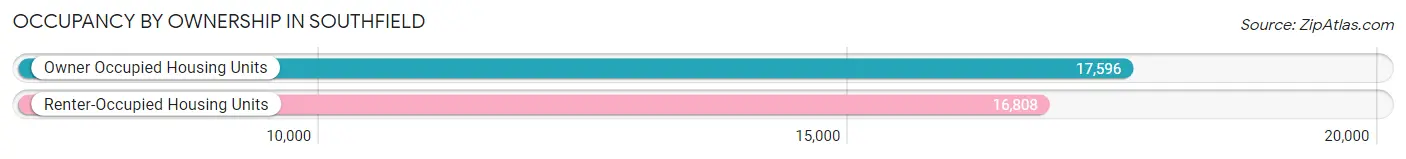
| Occupancy | # Housing Units | % Housing Units |
| Owner Occupied Housing Units | 17,596 | 51.1% |
| Renter-Occupied Housing Units | 16,808 | 48.8% |
| Total Occupied Housing Units | 34,404 | 100.0% |
Occupancy by Household Size in Southfield
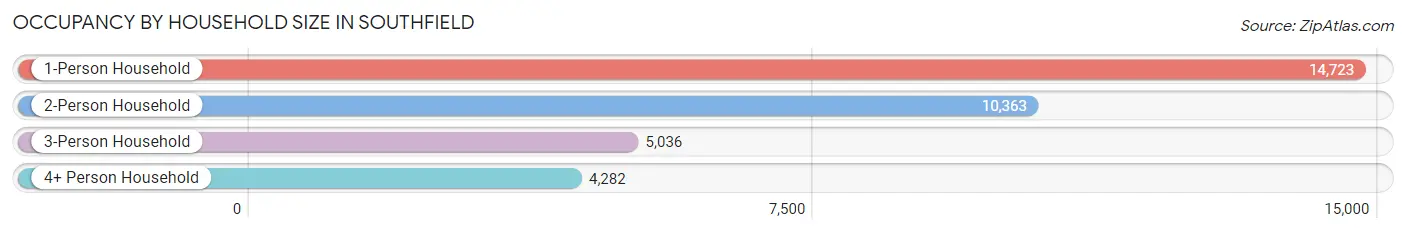
| Household Size | # Housing Units | % Housing Units |
| 1-Person Household | 14,723 | 42.8% |
| 2-Person Household | 10,363 | 30.1% |
| 3-Person Household | 5,036 | 14.6% |
| 4+ Person Household | 4,282 | 12.4% |
| Total Housing Units | 34,404 | 100.0% |
Occupancy by Ownership by Household Size in Southfield
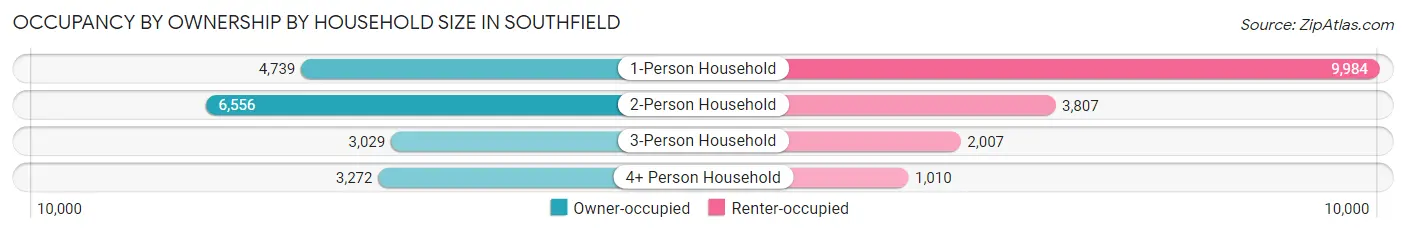
| Household Size | Owner-occupied | Renter-occupied |
| 1-Person Household | 4,739 (32.2%) | 9,984 (67.8%) |
| 2-Person Household | 6,556 (63.3%) | 3,807 (36.7%) |
| 3-Person Household | 3,029 (60.2%) | 2,007 (39.9%) |
| 4+ Person Household | 3,272 (76.4%) | 1,010 (23.6%) |
| Total Housing Units | 17,596 (51.1%) | 16,808 (48.8%) |
Occupancy by Educational Attainment in Southfield
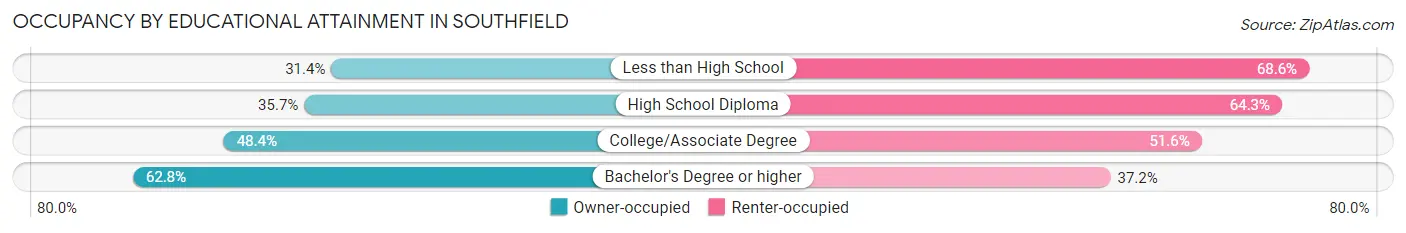
| Household Size | Owner-occupied | Renter-occupied |
| Less than High School | 555 (31.4%) | 1,215 (68.6%) |
| High School Diploma | 2,145 (35.7%) | 3,870 (64.3%) |
| College/Associate Degree | 6,135 (48.4%) | 6,537 (51.6%) |
| Bachelor's Degree or higher | 8,761 (62.8%) | 5,186 (37.2%) |
Occupancy by Age of Householder in Southfield
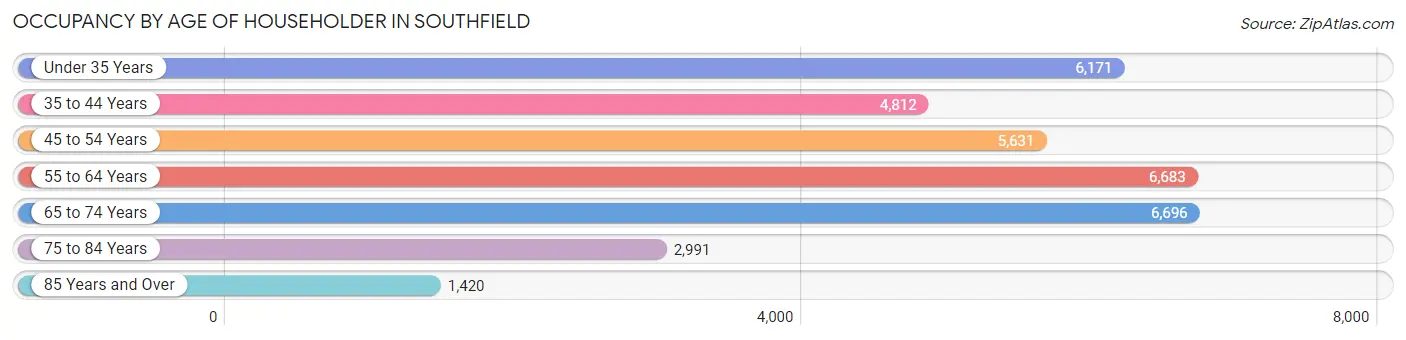
| Age Bracket | # Households | % Households |
| Under 35 Years | 6,171 | 17.9% |
| 35 to 44 Years | 4,812 | 14.0% |
| 45 to 54 Years | 5,631 | 16.4% |
| 55 to 64 Years | 6,683 | 19.4% |
| 65 to 74 Years | 6,696 | 19.5% |
| 75 to 84 Years | 2,991 | 8.7% |
| 85 Years and Over | 1,420 | 4.1% |
| Total | 34,404 | 100.0% |
Housing Finances in Southfield
Median Income by Occupancy in Southfield
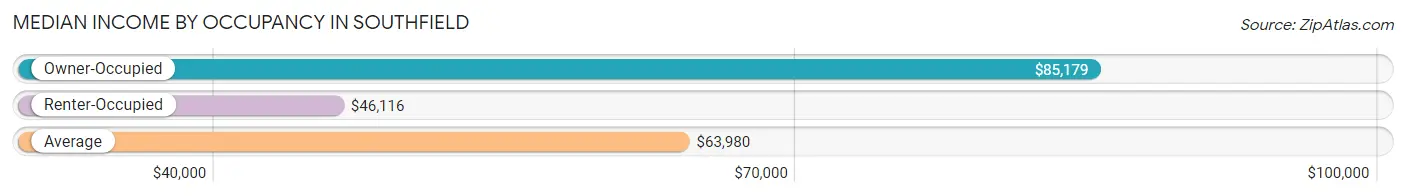
| Occupancy Type | # Households | Median Income |
| Owner-Occupied | 17,596 (51.1%) | $85,179 |
| Renter-Occupied | 16,808 (48.8%) | $46,116 |
| Average | 34,404 (100.0%) | $63,980 |
Occupancy by Householder Income Bracket in Southfield
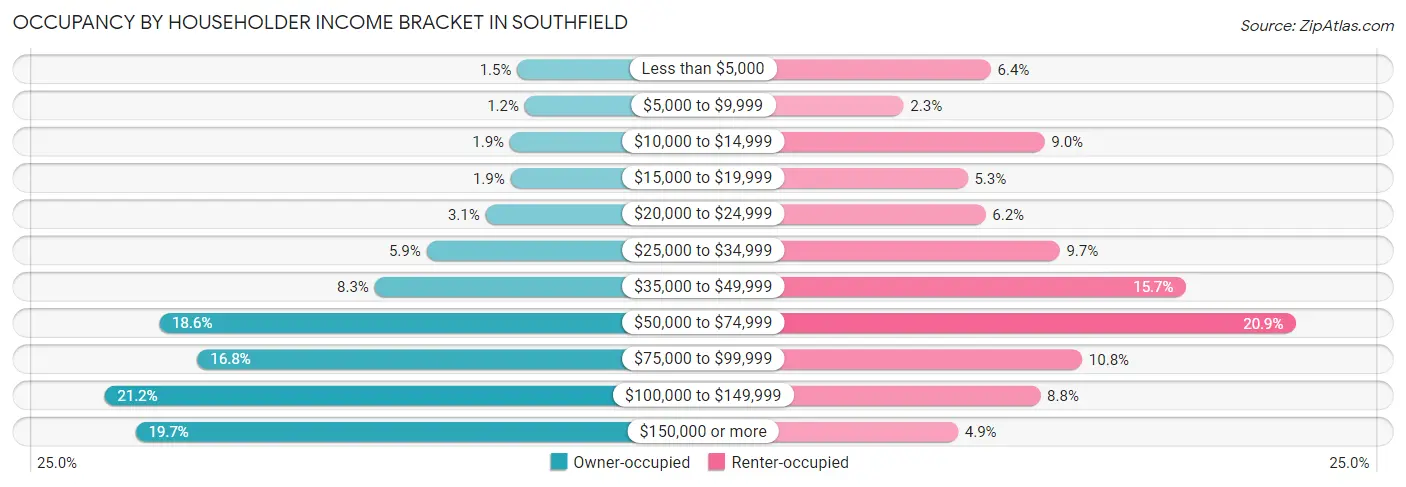
| Income Bracket | Owner-occupied | Renter-occupied |
| Less than $5,000 | 271 (1.5%) | 1,081 (6.4%) |
| $5,000 to $9,999 | 208 (1.2%) | 384 (2.3%) |
| $10,000 to $14,999 | 332 (1.9%) | 1,511 (9.0%) |
| $15,000 to $19,999 | 328 (1.9%) | 896 (5.3%) |
| $20,000 to $24,999 | 536 (3.0%) | 1,038 (6.2%) |
| $25,000 to $34,999 | 1,032 (5.9%) | 1,632 (9.7%) |
| $35,000 to $49,999 | 1,465 (8.3%) | 2,639 (15.7%) |
| $50,000 to $74,999 | 3,273 (18.6%) | 3,519 (20.9%) |
| $75,000 to $99,999 | 2,950 (16.8%) | 1,812 (10.8%) |
| $100,000 to $149,999 | 3,731 (21.2%) | 1,477 (8.8%) |
| $150,000 or more | 3,470 (19.7%) | 819 (4.9%) |
| Total | 17,596 (100.0%) | 16,808 (100.0%) |
Monthly Housing Cost Tiers in Southfield
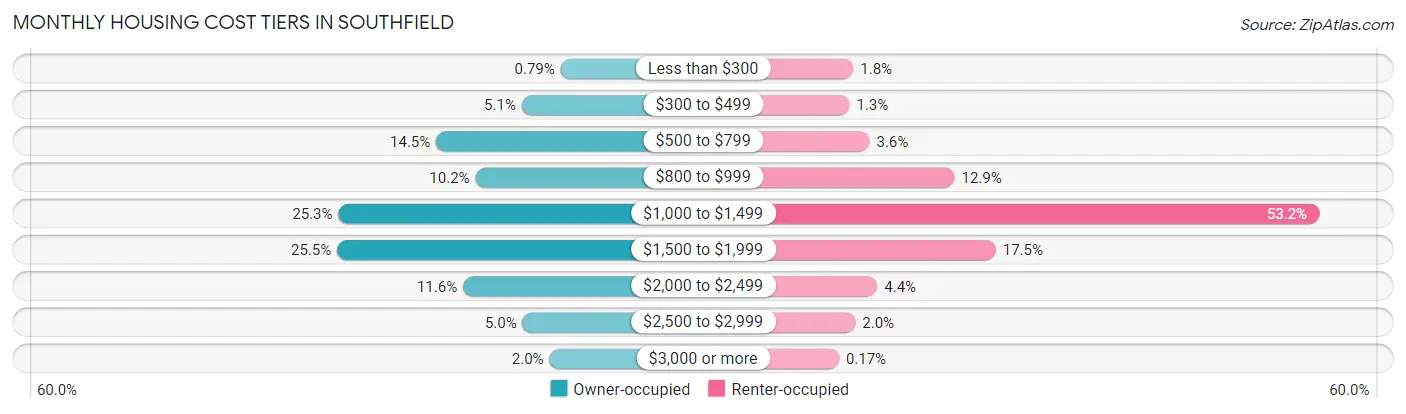
| Monthly Cost | Owner-occupied | Renter-occupied |
| Less than $300 | 139 (0.8%) | 296 (1.8%) |
| $300 to $499 | 893 (5.1%) | 226 (1.3%) |
| $500 to $799 | 2,558 (14.5%) | 596 (3.5%) |
| $800 to $999 | 1,794 (10.2%) | 2,175 (12.9%) |
| $1,000 to $1,499 | 4,459 (25.3%) | 8,941 (53.2%) |
| $1,500 to $1,999 | 4,483 (25.5%) | 2,942 (17.5%) |
| $2,000 to $2,499 | 2,036 (11.6%) | 742 (4.4%) |
| $2,500 to $2,999 | 878 (5.0%) | 333 (2.0%) |
| $3,000 or more | 356 (2.0%) | 29 (0.2%) |
| Total | 17,596 (100.0%) | 16,808 (100.0%) |
Physical Housing Characteristics in Southfield
Housing Structures in Southfield
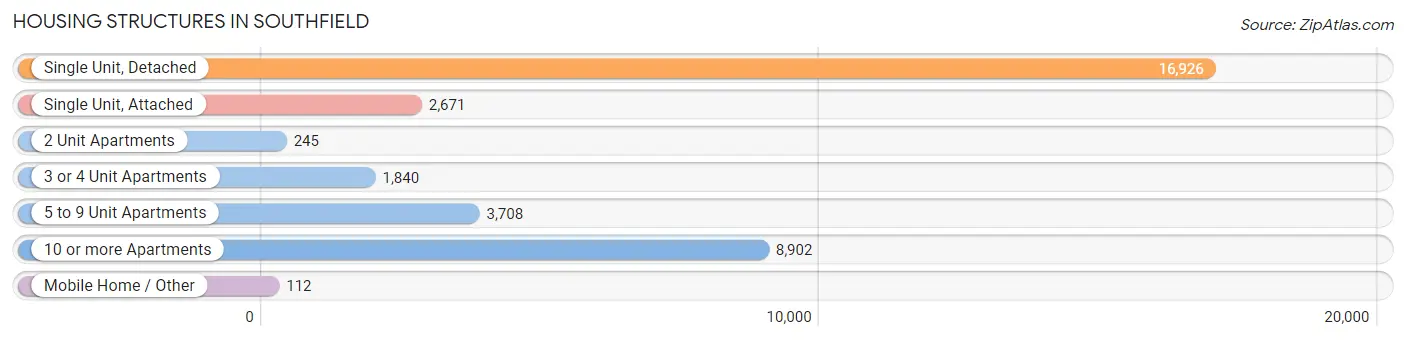
| Structure Type | # Housing Units | % Housing Units |
| Single Unit, Detached | 16,926 | 49.2% |
| Single Unit, Attached | 2,671 | 7.8% |
| 2 Unit Apartments | 245 | 0.7% |
| 3 or 4 Unit Apartments | 1,840 | 5.3% |
| 5 to 9 Unit Apartments | 3,708 | 10.8% |
| 10 or more Apartments | 8,902 | 25.9% |
| Mobile Home / Other | 112 | 0.3% |
| Total | 34,404 | 100.0% |
Housing Structures by Occupancy in Southfield
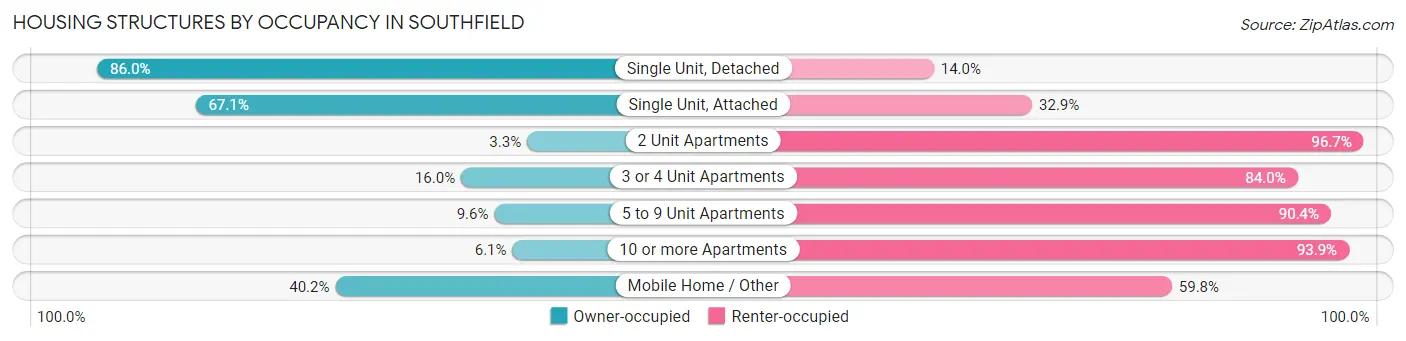
| Structure Type | Owner-occupied | Renter-occupied |
| Single Unit, Detached | 14,560 (86.0%) | 2,366 (14.0%) |
| Single Unit, Attached | 1,792 (67.1%) | 879 (32.9%) |
| 2 Unit Apartments | 8 (3.3%) | 237 (96.7%) |
| 3 or 4 Unit Apartments | 294 (16.0%) | 1,546 (84.0%) |
| 5 to 9 Unit Apartments | 355 (9.6%) | 3,353 (90.4%) |
| 10 or more Apartments | 542 (6.1%) | 8,360 (93.9%) |
| Mobile Home / Other | 45 (40.2%) | 67 (59.8%) |
| Total | 17,596 (51.1%) | 16,808 (48.8%) |
Housing Structures by Number of Rooms in Southfield
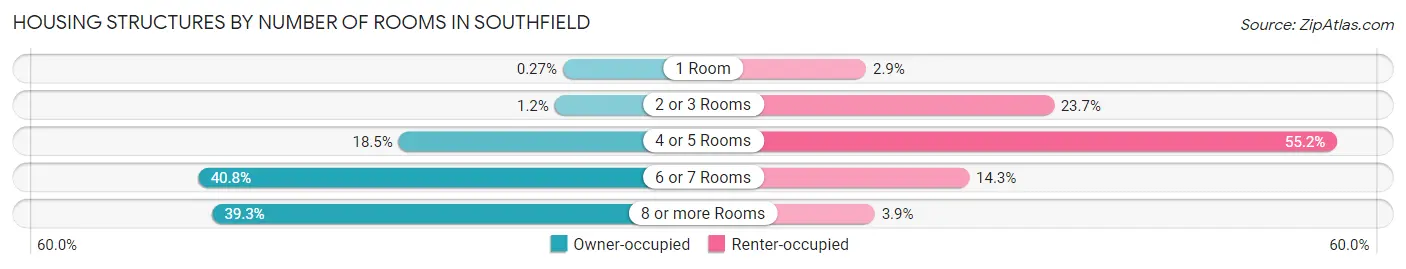
| Number of Rooms | Owner-occupied | Renter-occupied |
| 1 Room | 48 (0.3%) | 487 (2.9%) |
| 2 or 3 Rooms | 208 (1.2%) | 3,989 (23.7%) |
| 4 or 5 Rooms | 3,256 (18.5%) | 9,274 (55.2%) |
| 6 or 7 Rooms | 7,176 (40.8%) | 2,410 (14.3%) |
| 8 or more Rooms | 6,908 (39.3%) | 648 (3.9%) |
| Total | 17,596 (100.0%) | 16,808 (100.0%) |
Housing Structure by Heating Type in Southfield
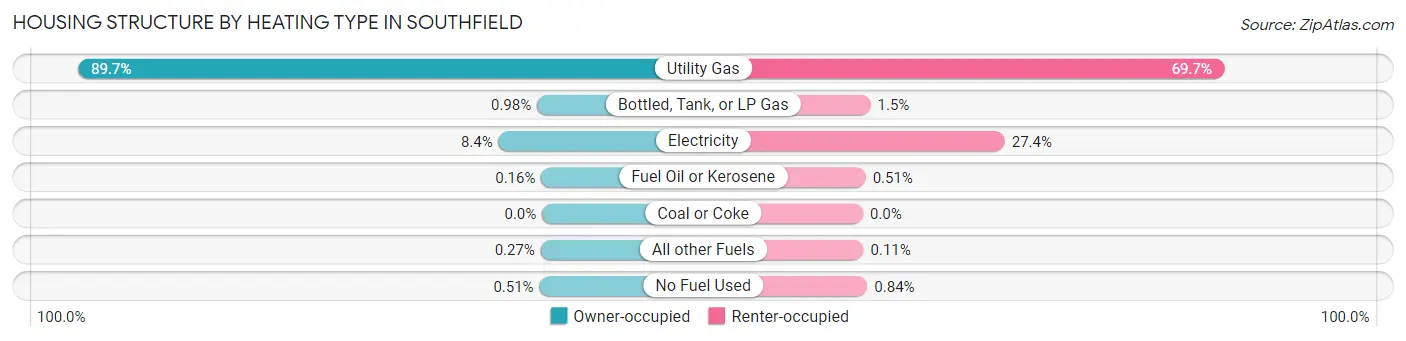
| Heating Type | Owner-occupied | Renter-occupied |
| Utility Gas | 15,777 (89.7%) | 11,714 (69.7%) |
| Bottled, Tank, or LP Gas | 172 (1.0%) | 245 (1.5%) |
| Electricity | 1,480 (8.4%) | 4,604 (27.4%) |
| Fuel Oil or Kerosene | 29 (0.2%) | 85 (0.5%) |
| Coal or Coke | 0 (0.0%) | 0 (0.0%) |
| All other Fuels | 48 (0.3%) | 18 (0.1%) |
| No Fuel Used | 90 (0.5%) | 142 (0.8%) |
| Total | 17,596 (100.0%) | 16,808 (100.0%) |
Household Vehicle Usage in Southfield
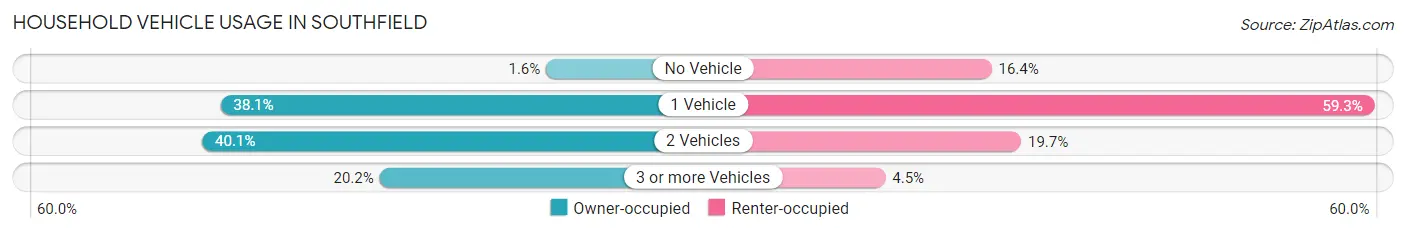
| Vehicles per Household | Owner-occupied | Renter-occupied |
| No Vehicle | 278 (1.6%) | 2,760 (16.4%) |
| 1 Vehicle | 6,699 (38.1%) | 9,970 (59.3%) |
| 2 Vehicles | 7,058 (40.1%) | 3,316 (19.7%) |
| 3 or more Vehicles | 3,561 (20.2%) | 762 (4.5%) |
| Total | 17,596 (100.0%) | 16,808 (100.0%) |
Real Estate & Mortgages in Southfield
Real Estate and Mortgage Overview in Southfield
| Characteristic | Without Mortgage | With Mortgage |
| Housing Units | 5,588 | 12,008 |
| Median Property Value | $192,000 | $222,200 |
| Median Household Income | $78,608 | $2,433 |
| Monthly Housing Costs | $741 | $350 |
| Real Estate Taxes | $3,484 | $268 |
Property Value by Mortgage Status in Southfield
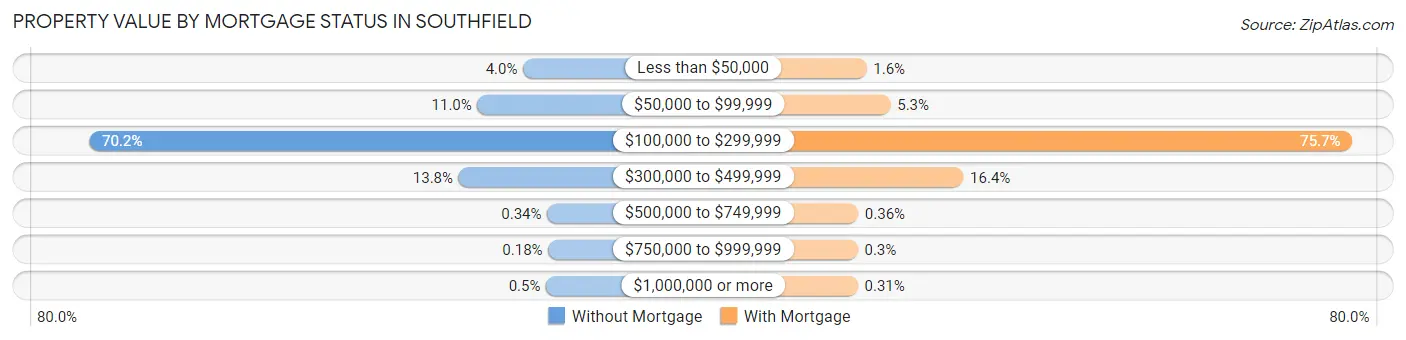
| Property Value | Without Mortgage | With Mortgage |
| Less than $50,000 | 224 (4.0%) | 197 (1.6%) |
| $50,000 to $99,999 | 613 (11.0%) | 635 (5.3%) |
| $100,000 to $299,999 | 3,921 (70.2%) | 9,091 (75.7%) |
| $300,000 to $499,999 | 773 (13.8%) | 1,969 (16.4%) |
| $500,000 to $749,999 | 19 (0.3%) | 43 (0.4%) |
| $750,000 to $999,999 | 10 (0.2%) | 36 (0.3%) |
| $1,000,000 or more | 28 (0.5%) | 37 (0.3%) |
| Total | 5,588 (100.0%) | 12,008 (100.0%) |
Household Income by Mortgage Status in Southfield
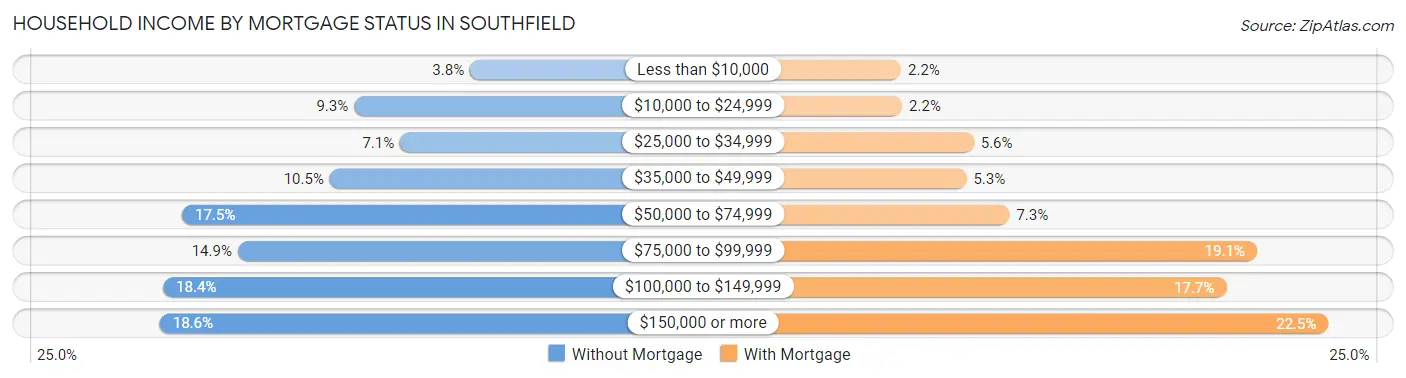
| Household Income | Without Mortgage | With Mortgage |
| Less than $10,000 | 212 (3.8%) | 261 (2.2%) |
| $10,000 to $24,999 | 520 (9.3%) | 267 (2.2%) |
| $25,000 to $34,999 | 398 (7.1%) | 676 (5.6%) |
| $35,000 to $49,999 | 585 (10.5%) | 634 (5.3%) |
| $50,000 to $74,999 | 978 (17.5%) | 880 (7.3%) |
| $75,000 to $99,999 | 830 (14.8%) | 2,295 (19.1%) |
| $100,000 to $149,999 | 1,028 (18.4%) | 2,120 (17.6%) |
| $150,000 or more | 1,037 (18.6%) | 2,703 (22.5%) |
| Total | 5,588 (100.0%) | 12,008 (100.0%) |
Property Value to Household Income Ratio in Southfield
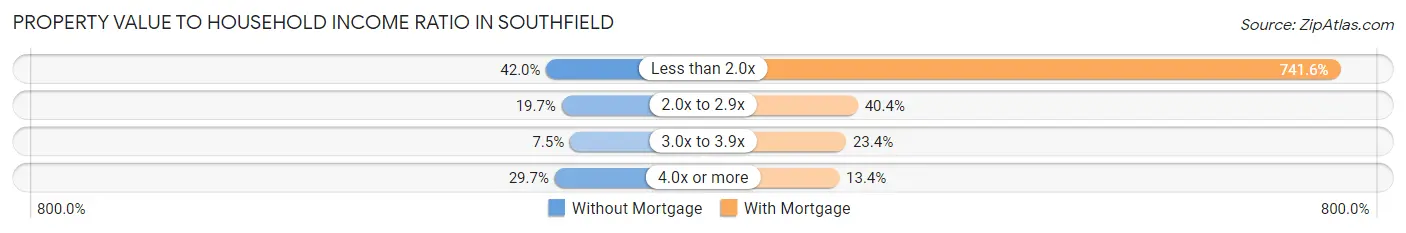
| Value-to-Income Ratio | Without Mortgage | With Mortgage |
| Less than 2.0x | 2,345 (42.0%) | 89,053 (741.6%) |
| 2.0x to 2.9x | 1,100 (19.7%) | 4,855 (40.4%) |
| 3.0x to 3.9x | 419 (7.5%) | 2,804 (23.4%) |
| 4.0x or more | 1,662 (29.7%) | 1,605 (13.4%) |
| Total | 5,588 (100.0%) | 12,008 (100.0%) |
Real Estate Taxes by Mortgage Status in Southfield
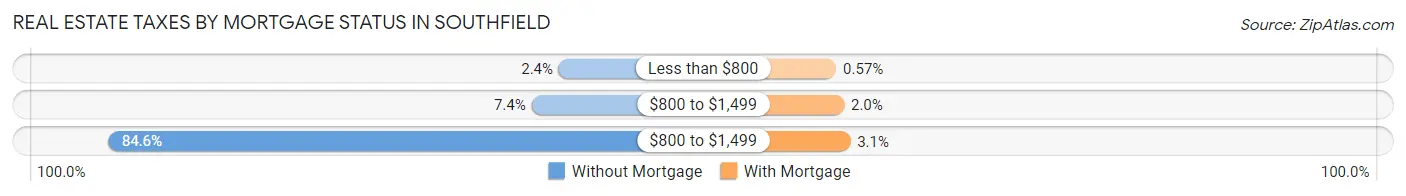
| Property Taxes | Without Mortgage | With Mortgage |
| Less than $800 | 135 (2.4%) | 69 (0.6%) |
| $800 to $1,499 | 414 (7.4%) | 241 (2.0%) |
| $800 to $1,499 | 4,728 (84.6%) | 376 (3.1%) |
| Total | 5,588 (100.0%) | 12,008 (100.0%) |
Health & Disability in Southfield
Health Insurance Coverage by Age in Southfield
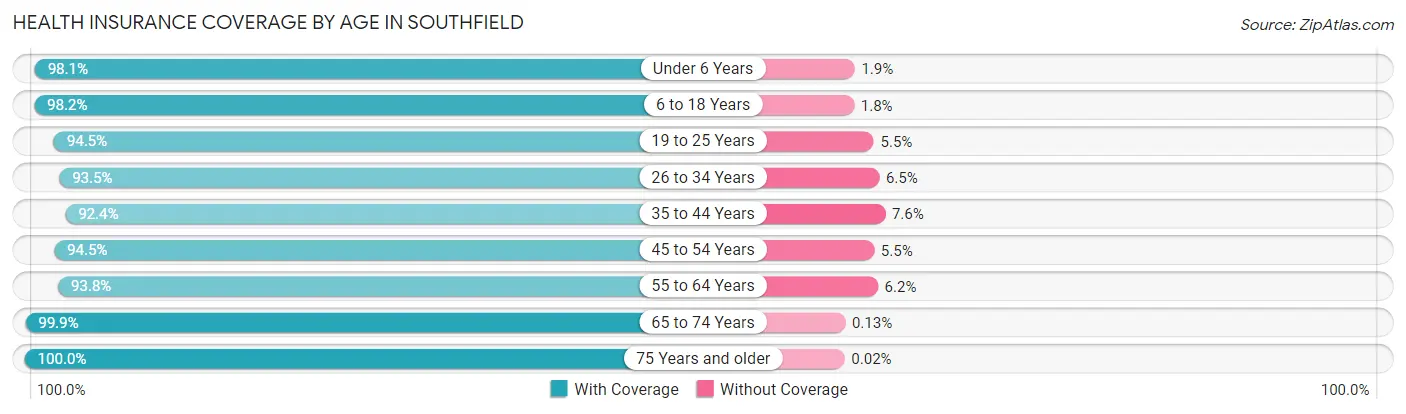
| Age Bracket | With Coverage | Without Coverage |
| Under 6 Years | 4,850 (98.1%) | 94 (1.9%) |
| 6 to 18 Years | 10,395 (98.2%) | 188 (1.8%) |
| 19 to 25 Years | 6,291 (94.5%) | 363 (5.5%) |
| 26 to 34 Years | 9,237 (93.5%) | 638 (6.5%) |
| 35 to 44 Years | 7,596 (92.4%) | 623 (7.6%) |
| 45 to 54 Years | 8,607 (94.5%) | 503 (5.5%) |
| 55 to 64 Years | 9,778 (93.8%) | 648 (6.2%) |
| 65 to 74 Years | 9,391 (99.9%) | 12 (0.1%) |
| 75 Years and older | 6,190 (100.0%) | 1 (0.0%) |
| Total | 72,335 (95.9%) | 3,070 (4.1%) |
Health Insurance Coverage by Citizenship Status in Southfield
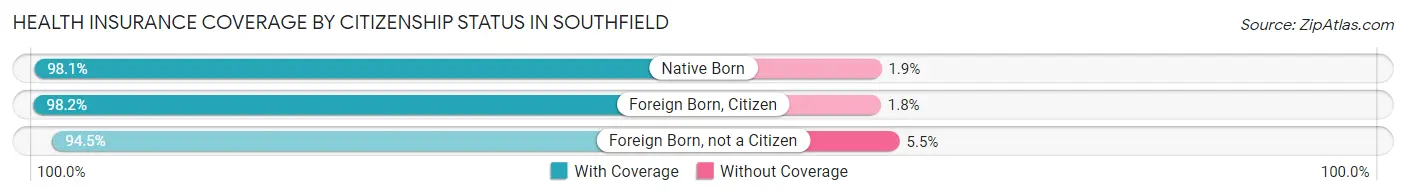
| Citizenship Status | With Coverage | Without Coverage |
| Native Born | 4,850 (98.1%) | 94 (1.9%) |
| Foreign Born, Citizen | 10,395 (98.2%) | 188 (1.8%) |
| Foreign Born, not a Citizen | 6,291 (94.5%) | 363 (5.5%) |
Health Insurance Coverage by Household Income in Southfield
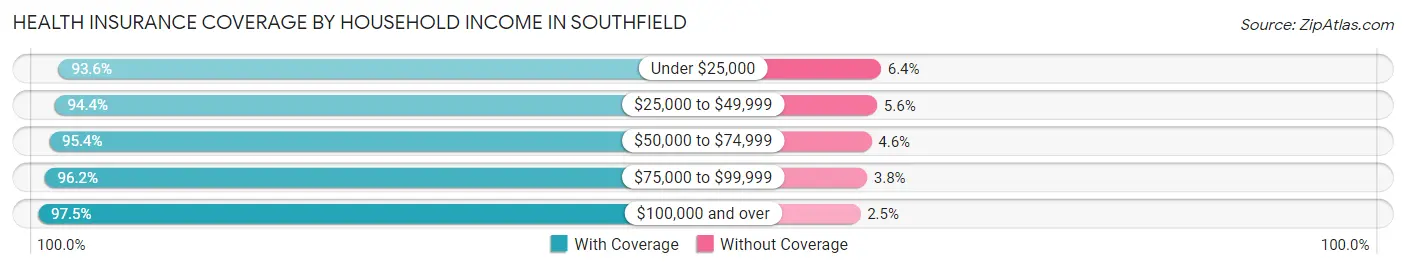
| Household Income | With Coverage | Without Coverage |
| Under $25,000 | 8,731 (93.6%) | 594 (6.4%) |
| $25,000 to $49,999 | 10,873 (94.4%) | 650 (5.6%) |
| $50,000 to $74,999 | 13,147 (95.4%) | 634 (4.6%) |
| $75,000 to $99,999 | 11,072 (96.2%) | 432 (3.8%) |
| $100,000 and over | 27,801 (97.5%) | 720 (2.5%) |
Public vs Private Health Insurance Coverage by Age in Southfield
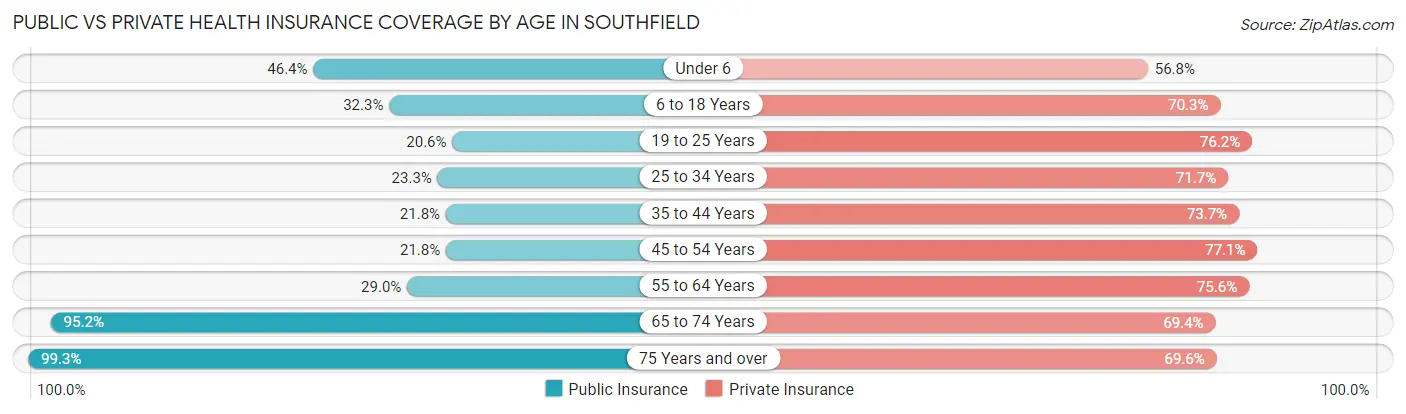
| Age Bracket | Public Insurance | Private Insurance |
| Under 6 | 2,294 (46.4%) | 2,808 (56.8%) |
| 6 to 18 Years | 3,420 (32.3%) | 7,435 (70.3%) |
| 19 to 25 Years | 1,371 (20.6%) | 5,068 (76.2%) |
| 25 to 34 Years | 2,304 (23.3%) | 7,079 (71.7%) |
| 35 to 44 Years | 1,792 (21.8%) | 6,058 (73.7%) |
| 45 to 54 Years | 1,983 (21.8%) | 7,025 (77.1%) |
| 55 to 64 Years | 3,022 (29.0%) | 7,879 (75.6%) |
| 65 to 74 Years | 8,948 (95.2%) | 6,521 (69.4%) |
| 75 Years and over | 6,150 (99.3%) | 4,307 (69.6%) |
| Total | 31,284 (41.5%) | 54,180 (71.9%) |
Disability Status by Sex by Age in Southfield
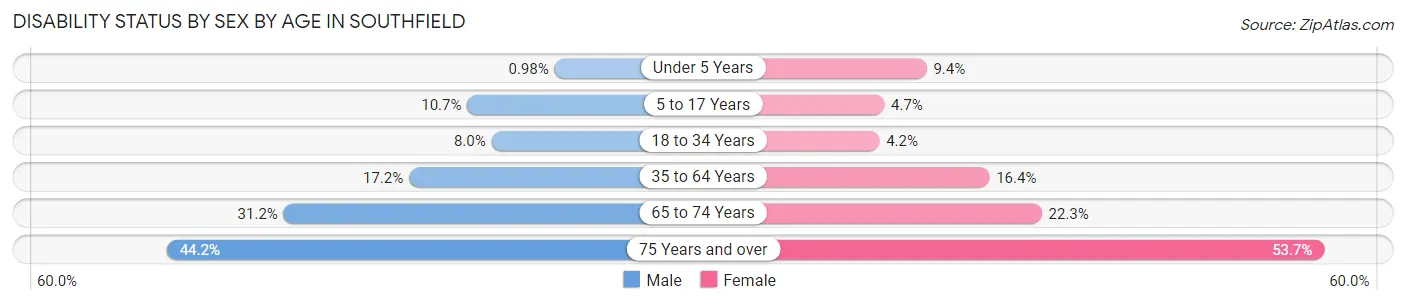
| Age Bracket | Male | Female |
| Under 5 Years | 22 (1.0%) | 180 (9.4%) |
| 5 to 17 Years | 569 (10.7%) | 242 (4.7%) |
| 18 to 34 Years | 737 (8.0%) | 344 (4.2%) |
| 35 to 64 Years | 2,058 (17.2%) | 2,591 (16.4%) |
| 65 to 74 Years | 1,249 (31.1%) | 1,200 (22.3%) |
| 75 Years and over | 1,027 (44.2%) | 2,077 (53.7%) |
Disability Class by Sex by Age in Southfield
Disability Class: Hearing Difficulty
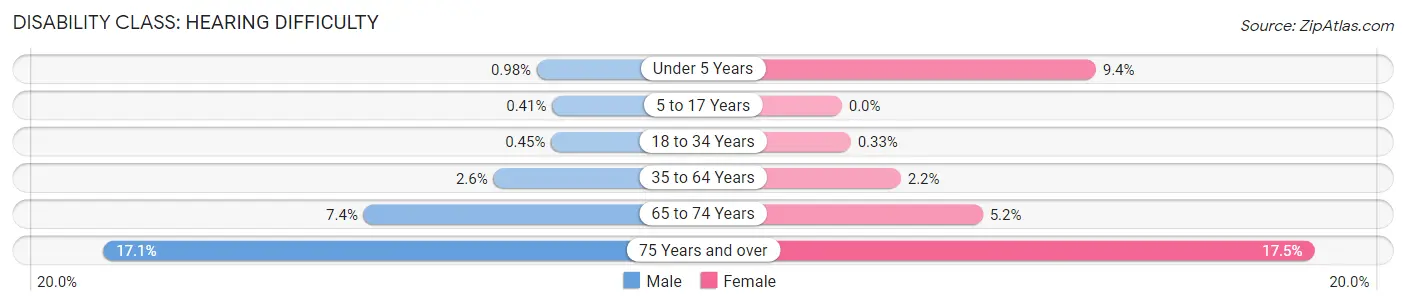
| Age Bracket | Male | Female |
| Under 5 Years | 22 (1.0%) | 180 (9.4%) |
| 5 to 17 Years | 22 (0.4%) | 0 (0.0%) |
| 18 to 34 Years | 41 (0.4%) | 27 (0.3%) |
| 35 to 64 Years | 310 (2.6%) | 345 (2.2%) |
| 65 to 74 Years | 297 (7.4%) | 282 (5.2%) |
| 75 Years and over | 397 (17.1%) | 678 (17.5%) |
Disability Class: Vision Difficulty
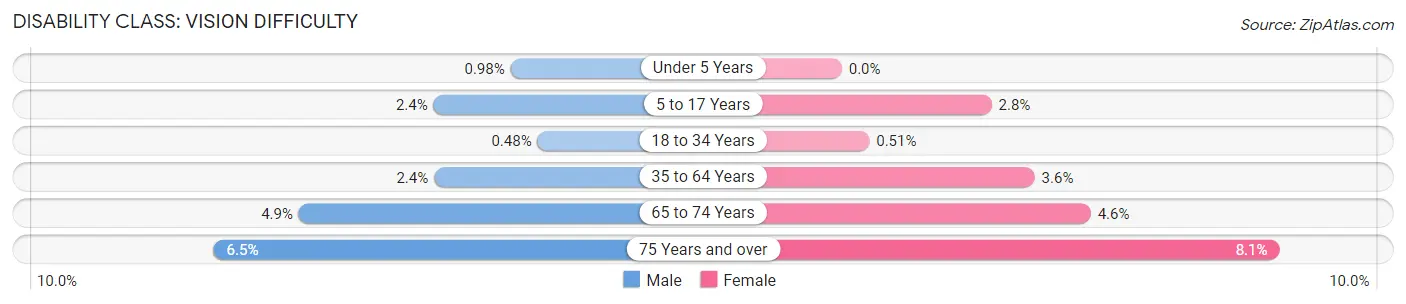
| Age Bracket | Male | Female |
| Under 5 Years | 22 (1.0%) | 0 (0.0%) |
| 5 to 17 Years | 128 (2.4%) | 143 (2.8%) |
| 18 to 34 Years | 44 (0.5%) | 42 (0.5%) |
| 35 to 64 Years | 287 (2.4%) | 564 (3.6%) |
| 65 to 74 Years | 197 (4.9%) | 249 (4.6%) |
| 75 Years and over | 151 (6.5%) | 314 (8.1%) |
Disability Class: Cognitive Difficulty
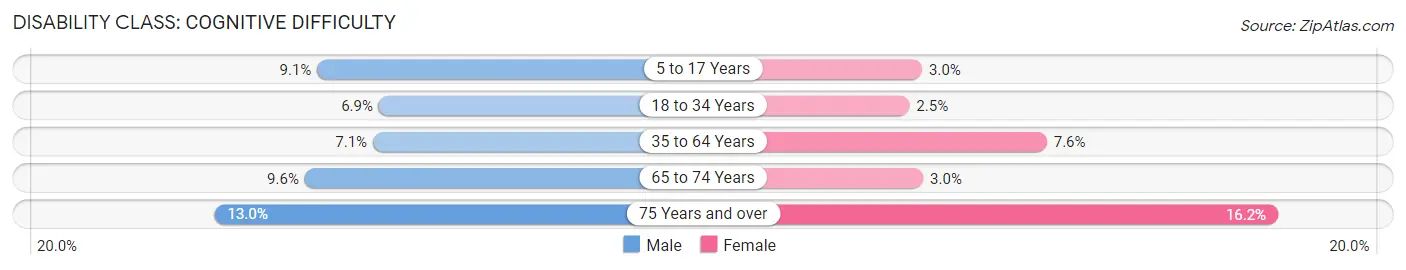
| Age Bracket | Male | Female |
| 5 to 17 Years | 486 (9.1%) | 153 (3.0%) |
| 18 to 34 Years | 631 (6.9%) | 207 (2.5%) |
| 35 to 64 Years | 847 (7.1%) | 1,201 (7.6%) |
| 65 to 74 Years | 385 (9.6%) | 163 (3.0%) |
| 75 Years and over | 301 (13.0%) | 626 (16.2%) |
Disability Class: Ambulatory Difficulty
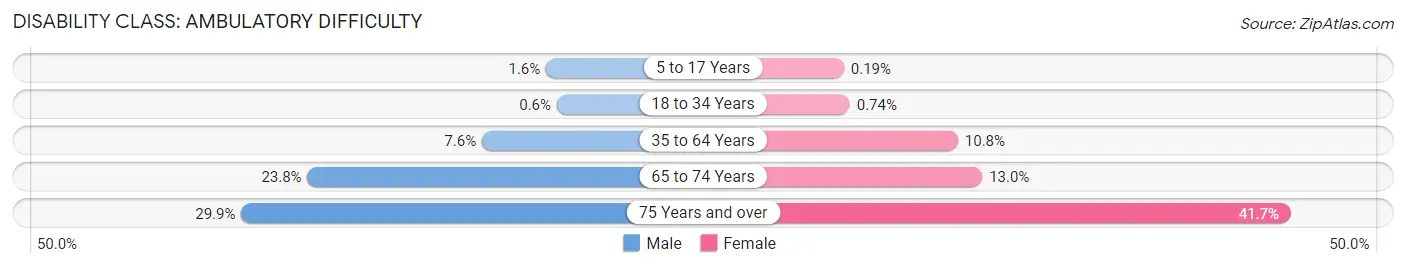
| Age Bracket | Male | Female |
| 5 to 17 Years | 85 (1.6%) | 10 (0.2%) |
| 18 to 34 Years | 55 (0.6%) | 61 (0.7%) |
| 35 to 64 Years | 904 (7.5%) | 1,699 (10.8%) |
| 65 to 74 Years | 952 (23.7%) | 703 (13.0%) |
| 75 Years and over | 695 (29.9%) | 1,611 (41.7%) |
Disability Class: Self-Care Difficulty
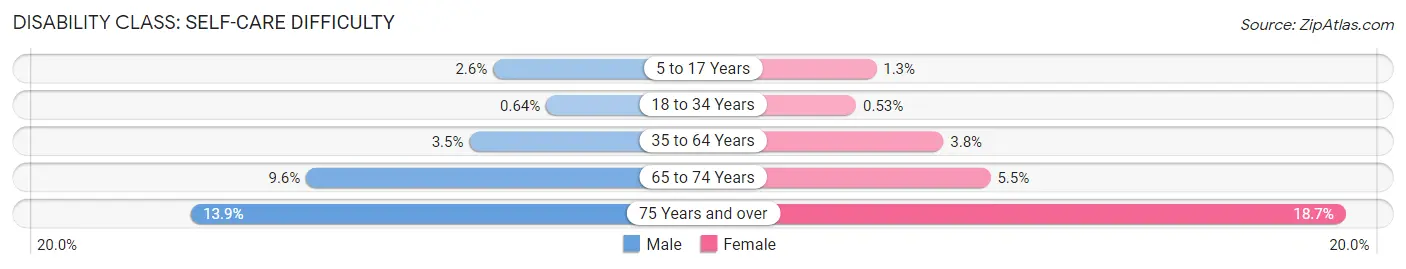
| Age Bracket | Male | Female |
| 5 to 17 Years | 139 (2.6%) | 66 (1.3%) |
| 18 to 34 Years | 59 (0.6%) | 44 (0.5%) |
| 35 to 64 Years | 418 (3.5%) | 594 (3.8%) |
| 65 to 74 Years | 383 (9.6%) | 298 (5.5%) |
| 75 Years and over | 322 (13.9%) | 723 (18.7%) |
Technology Access in Southfield
Computing Device Access in Southfield
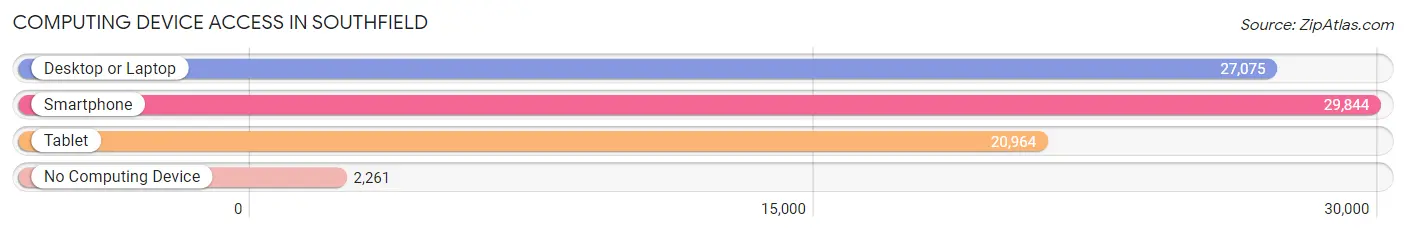
| Device Type | # Households | % Households |
| Desktop or Laptop | 27,075 | 78.7% |
| Smartphone | 29,844 | 86.8% |
| Tablet | 20,964 | 60.9% |
| No Computing Device | 2,261 | 6.6% |
| Total | 34,404 | 100.0% |
Internet Access in Southfield
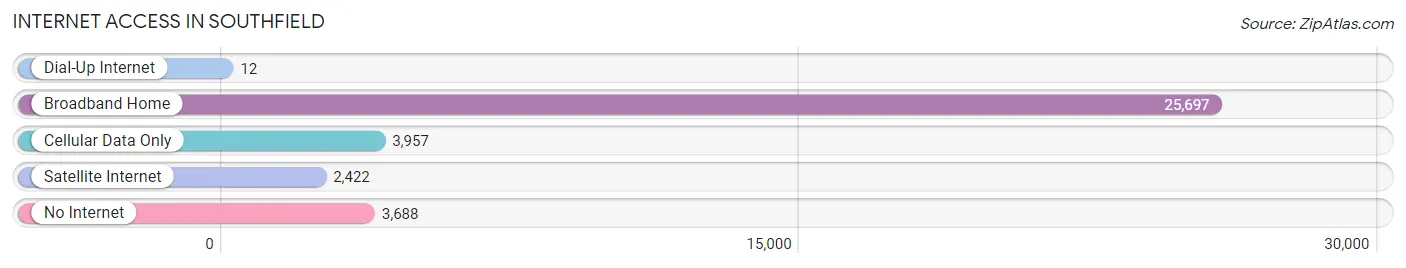
| Internet Type | # Households | % Households |
| Dial-Up Internet | 12 | 0.0% |
| Broadband Home | 25,697 | 74.7% |
| Cellular Data Only | 3,957 | 11.5% |
| Satellite Internet | 2,422 | 7.0% |
| No Internet | 3,688 | 10.7% |
| Total | 34,404 | 100.0% |
Southfield Summary
History
The city of Southfield, Michigan is located in Oakland County and is a northern suburb of Detroit. The city was first settled in 1823 by John Daniels, who purchased land from the government and began farming. The area was known as Ossewa Township until it was incorporated as the city of Southfield in 1958.
The city of Southfield has a rich history of industry and commerce. In the late 19th century, the city was home to several factories, including a paper mill, a sawmill, and a brickyard. The city also had a thriving agricultural industry, with many farmers growing crops such as wheat, corn, and potatoes.
In the early 20th century, the city began to experience a period of growth and development. The city was home to several large companies, including the Ford Motor Company, which opened a plant in Southfield in the 1920s. The city also became home to several large shopping centers, including the Southfield Mall, which opened in the 1950s.
The city of Southfield has continued to experience growth and development in the 21st century. The city is home to several large corporations, including Lear Corporation, which is headquartered in Southfield. The city is also home to several large shopping centers, including the Twelve Oaks Mall, which opened in the early 2000s.
Geography
Southfield is located in Oakland County, Michigan, and is a northern suburb of Detroit. The city is situated on the Rouge River, which flows through the city and into Lake St. Clair. The city is bordered by the cities of Farmington Hills, Lathrup Village, and Oak Park.
The city of Southfield covers an area of approximately 24 square miles and has a population of over 73,000 people. The city is divided into several neighborhoods, including the Southfield Town Center, which is the city’s downtown area. The city also has several parks, including the Southfield Municipal Park, which is located in the city’s center.
Economy
The city of Southfield has a strong and diverse economy. The city is home to several large corporations, including Lear Corporation, which is headquartered in Southfield. The city is also home to several large shopping centers, including the Twelve Oaks Mall, which opened in the early 2000s.
The city of Southfield is also home to several educational institutions, including Lawrence Technological University and the Southfield Campus of Oakland Community College. The city is also home to several hospitals, including Beaumont Hospital and Providence Hospital.
The city of Southfield has a strong manufacturing sector, with several factories located in the city. The city is also home to several automotive suppliers, including the Lear Corporation and the Ford Motor Company.
Demographics
As of the 2010 census, the city of Southfield had a population of 73,208 people. The city has a population that is predominantly African American, with approximately 70% of the population identifying as African American. The city also has a large population of Asian Americans, with approximately 10% of the population identifying as Asian American.
The city of Southfield has a median household income of $50,845, which is slightly higher than the national median household income of $50,046. The city also has a poverty rate of 17.3%, which is slightly higher than the national poverty rate of 15.1%.
Conclusion
The city of Southfield, Michigan is a northern suburb of Detroit and is located in Oakland County. The city has a rich history of industry and commerce and has experienced growth and development in the 21st century. The city has a strong and diverse economy and is home to several large corporations and shopping centers. The city also has a predominantly African American population, with a median household income of $50,845 and a poverty rate of 17.3%.
Common Questions
What is Per Capita Income in Southfield?
Per Capita income in Southfield is $37,722.
What is the Median Family Income in Southfield?
Median Family Income in Southfield is $84,049.
What is the Median Household income in Southfield?
Median Household Income in Southfield is $63,980.
What is Income or Wage Gap in Southfield?
Income or Wage Gap in Southfield is 9.5%.
Women in Southfield earn 90.5 cents for every dollar earned by a man.
What is Inequality or Gini Index in Southfield?
Inequality or Gini Index in Southfield is 0.44.
What is the Total Population of Southfield?
Total Population of Southfield is 76,107.
What is the Total Male Population of Southfield?
Total Male Population of Southfield is 35,344.
What is the Total Female Population of Southfield?
Total Female Population of Southfield is 40,763.
What is the Ratio of Males per 100 Females in Southfield?
There are 86.71 Males per 100 Females in Southfield.
What is the Ratio of Females per 100 Males in Southfield?
There are 115.33 Females per 100 Males in Southfield.
What is the Median Population Age in Southfield?
Median Population Age in Southfield is 42.1 Years.
What is the Average Family Size in Southfield
Average Family Size in Southfield is 3.0 People.
What is the Average Household Size in Southfield
Average Household Size in Southfield is 2.2 People.
How Large is the Labor Force in Southfield?
There are 38,821 People in the Labor Forcein in Southfield.
What is the Percentage of People in the Labor Force in Southfield?
61.4% of People are in the Labor Force in Southfield.
What is the Unemployment Rate in Southfield?
Unemployment Rate in Southfield is 6.5%.