Montgomery, AL Map & Demographics
Montgomery Map
Montgomery Overview
$31,549
PER CAPITA INCOME
$65,774
AVG FAMILY INCOME
$54,166
AVG HOUSEHOLD INCOME
20.7%
WAGE / INCOME GAP [ % ]
79.3¢/ $1
WAGE / INCOME GAP [ $ ]
$11,697
FAMILY INCOME DEFICIT
0.50
INEQUALITY / GINI INDEX
199,819
TOTAL POPULATION
93,601
MALE POPULATION
106,218
FEMALE POPULATION
88.12
MALES / 100 FEMALES
113.48
FEMALES / 100 MALES
36.1
MEDIAN AGE
3.2
AVG FAMILY SIZE
2.4
AVG HOUSEHOLD SIZE
94,353
LABOR FORCE [ PEOPLE ]
59.7%
PERCENT IN LABOR FORCE
7.2%
UNEMPLOYMENT RATE
Montgomery Zip Codes
Montgomery Area Codes
Income in Montgomery
Income Overview in Montgomery
Per Capita Income in Montgomery is $31,549, while median incomes of families and households are $65,774 and $54,166 respectively.
| Characteristic | Number | Measure |
| Per Capita Income | 199,819 | $31,549 |
| Median Family Income | 46,507 | $65,774 |
| Mean Family Income | 46,507 | $91,164 |
| Median Household Income | 79,489 | $54,166 |
| Mean Household Income | 79,489 | $75,844 |
| Income Deficit | 46,507 | $11,697 |
| Wage / Income Gap (%) | 199,819 | 20.68% |
| Wage / Income Gap ($) | 199,819 | 79.32¢ per $1 |
| Gini / Inequality Index | 199,819 | 0.50 |
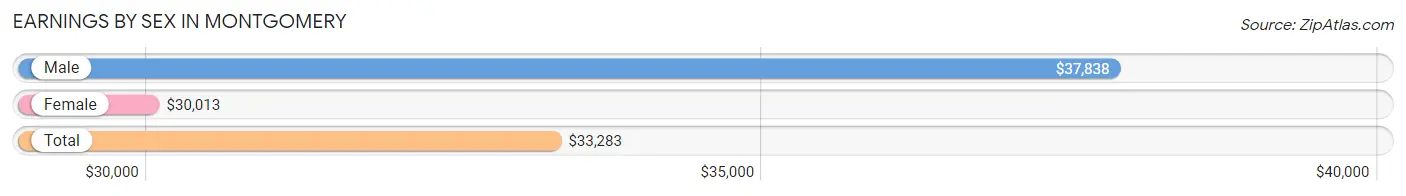
Earnings by Sex in Montgomery
Average Earnings in Montgomery are $33,283, $37,838 for men and $30,013 for women, a difference of 20.7%.
| Sex | Number | Average Earnings |
| Male | 47,850 (48.1%) | $37,838 |
| Female | 51,565 (51.9%) | $30,013 |
| Total | 99,415 (100.0%) | $33,283 |
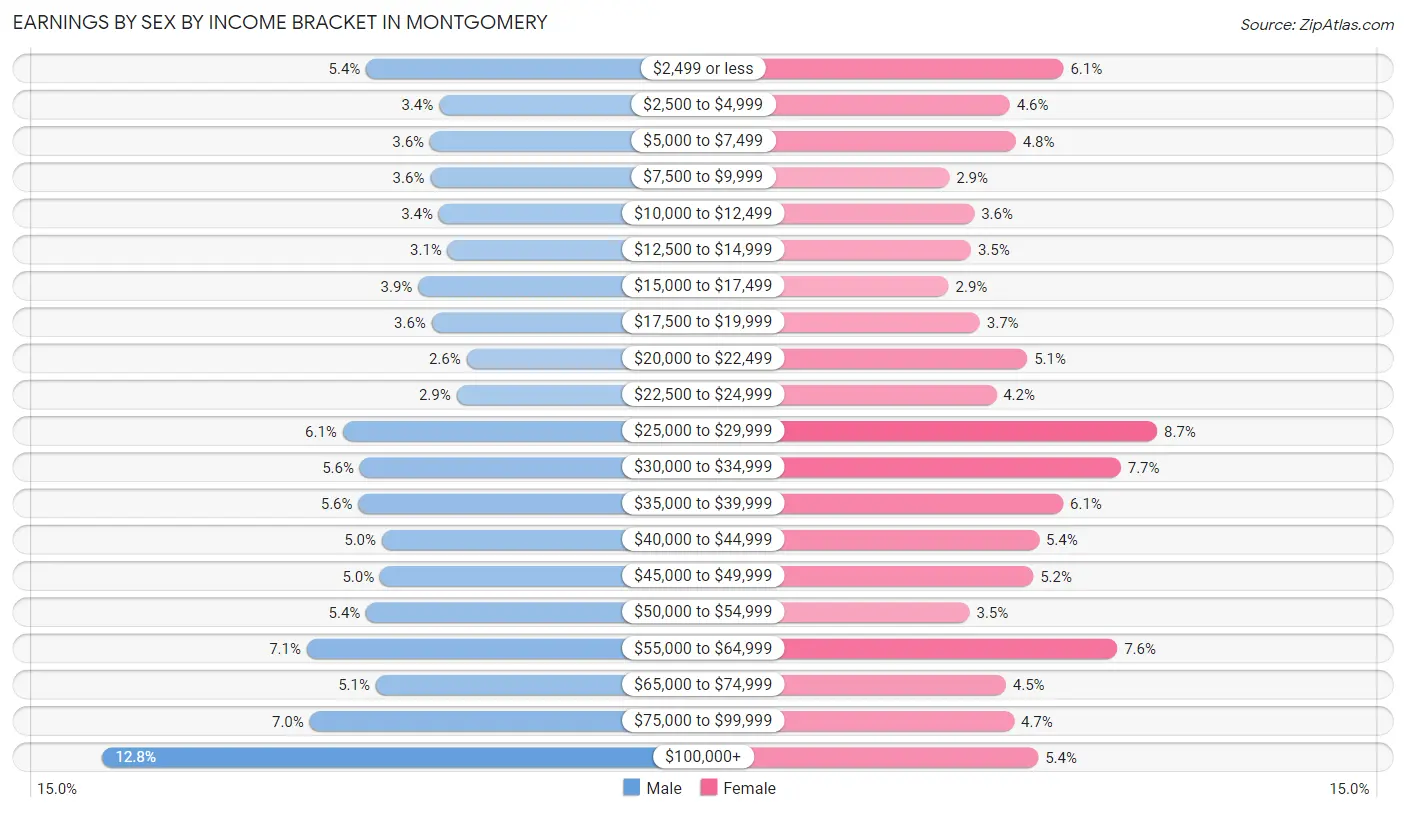
Earnings by Sex by Income Bracket in Montgomery
The most common earnings brackets in Montgomery are $100,000+ for men (6,130 | 12.8%) and $25,000 to $29,999 for women (4,498 | 8.7%).
| Income | Male | Female |
| $2,499 or less | 2,583 (5.4%) | 3,140 (6.1%) |
| $2,500 to $4,999 | 1,603 (3.4%) | 2,362 (4.6%) |
| $5,000 to $7,499 | 1,729 (3.6%) | 2,447 (4.8%) |
| $7,500 to $9,999 | 1,722 (3.6%) | 1,485 (2.9%) |
| $10,000 to $12,499 | 1,607 (3.4%) | 1,848 (3.6%) |
| $12,500 to $14,999 | 1,489 (3.1%) | 1,800 (3.5%) |
| $15,000 to $17,499 | 1,887 (3.9%) | 1,477 (2.9%) |
| $17,500 to $19,999 | 1,703 (3.6%) | 1,931 (3.7%) |
| $20,000 to $22,499 | 1,233 (2.6%) | 2,616 (5.1%) |
| $22,500 to $24,999 | 1,368 (2.9%) | 2,168 (4.2%) |
| $25,000 to $29,999 | 2,901 (6.1%) | 4,498 (8.7%) |
| $30,000 to $34,999 | 2,669 (5.6%) | 3,973 (7.7%) |
| $35,000 to $39,999 | 2,690 (5.6%) | 3,135 (6.1%) |
| $40,000 to $44,999 | 2,372 (5.0%) | 2,782 (5.4%) |
| $45,000 to $49,999 | 2,397 (5.0%) | 2,704 (5.2%) |
| $50,000 to $54,999 | 2,585 (5.4%) | 1,779 (3.5%) |
| $55,000 to $64,999 | 3,382 (7.1%) | 3,921 (7.6%) |
| $65,000 to $74,999 | 2,454 (5.1%) | 2,306 (4.5%) |
| $75,000 to $99,999 | 3,346 (7.0%) | 2,421 (4.7%) |
| $100,000+ | 6,130 (12.8%) | 2,772 (5.4%) |
| Total | 47,850 (100.0%) | 51,565 (100.0%) |
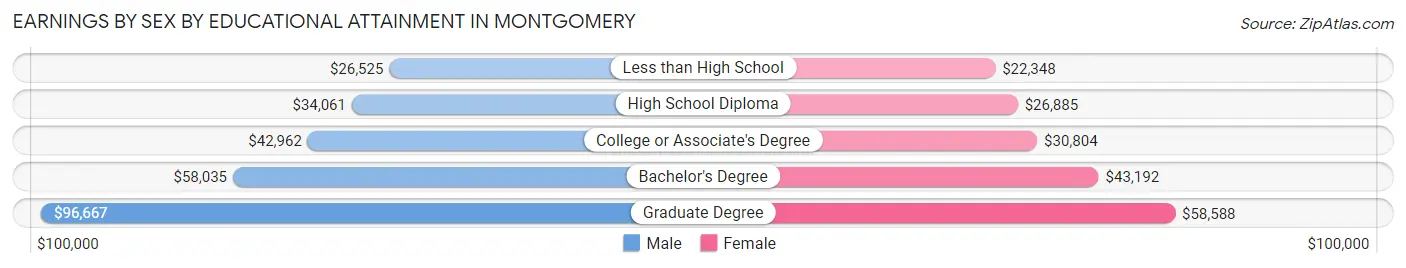
Earnings by Sex by Educational Attainment in Montgomery
Average earnings in Montgomery are $45,219 for men and $34,469 for women, a difference of 23.8%. Men with an educational attainment of graduate degree enjoy the highest average annual earnings of $96,667, while those with less than high school education earn the least with $26,525. Women with an educational attainment of graduate degree earn the most with the average annual earnings of $58,588, while those with less than high school education have the smallest earnings of $22,348.
| Educational Attainment | Male Income | Female Income |
| Less than High School | $26,525 | $22,348 |
| High School Diploma | $34,061 | $26,885 |
| College or Associate's Degree | $42,962 | $30,804 |
| Bachelor's Degree | $58,035 | $43,192 |
| Graduate Degree | $96,667 | $58,588 |
| Total | $45,219 | $34,469 |
Family Income in Montgomery
Family Income Brackets in Montgomery
According to the Montgomery family income data, there are 8,418 families falling into the $100,000 to $149,999 income range, which is the most common income bracket and makes up 18.1% of all families. Conversely, the $10,000 to $14,999 income bracket is the least frequent group with only 1,674 families (3.6%) belonging to this category.
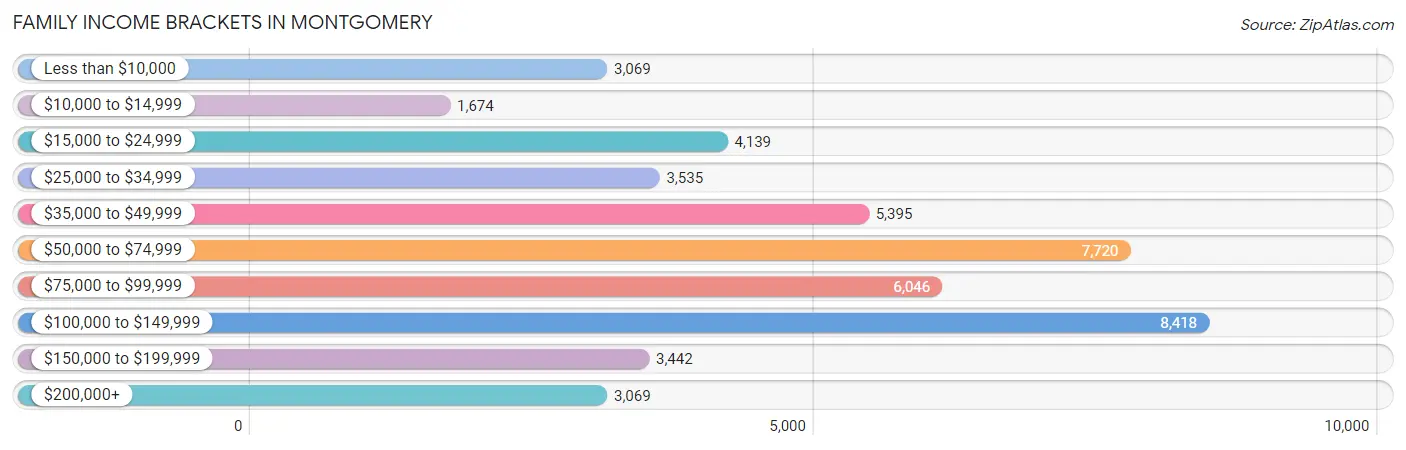
| Income Bracket | # Families | % Families |
| Less than $10,000 | 3,069 | 6.6% |
| $10,000 to $14,999 | 1,674 | 3.6% |
| $15,000 to $24,999 | 4,139 | 8.9% |
| $25,000 to $34,999 | 3,535 | 7.6% |
| $35,000 to $49,999 | 5,395 | 11.6% |
| $50,000 to $74,999 | 7,720 | 16.6% |
| $75,000 to $99,999 | 6,046 | 13.0% |
| $100,000 to $149,999 | 8,418 | 18.1% |
| $150,000 to $199,999 | 3,442 | 7.4% |
| $200,000+ | 3,069 | 6.6% |
Family Income by Famaliy Size in Montgomery
7+ person families (761 | 1.6%) account for the highest median family income in Montgomery with $125,878 per family, while 2-person families (22,290 | 47.9%) have the highest median income of $30,582 per family member.
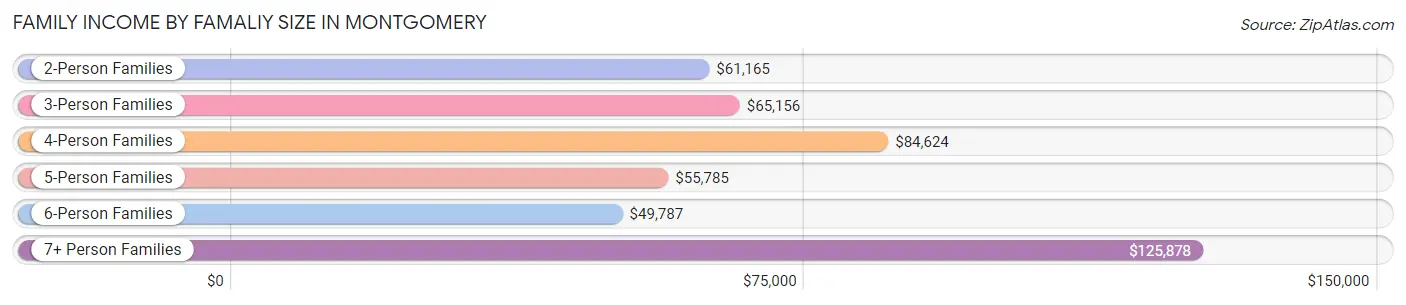
| Income Bracket | # Families | Median Income |
| 2-Person Families | 22,290 (47.9%) | $61,165 |
| 3-Person Families | 10,534 (22.7%) | $65,156 |
| 4-Person Families | 7,635 (16.4%) | $84,624 |
| 5-Person Families | 4,165 (9.0%) | $55,785 |
| 6-Person Families | 1,122 (2.4%) | $49,787 |
| 7+ Person Families | 761 (1.6%) | $125,878 |
| Total | 46,507 (100.0%) | $65,774 |
Family Income by Number of Earners in Montgomery
The median family income in Montgomery is $65,774, with families comprising 3+ earners (3,864) having the highest median family income of $116,628, while families with no earners (7,179) have the lowest median family income of $30,653, accounting for 8.3% and 15.4% of families, respectively.
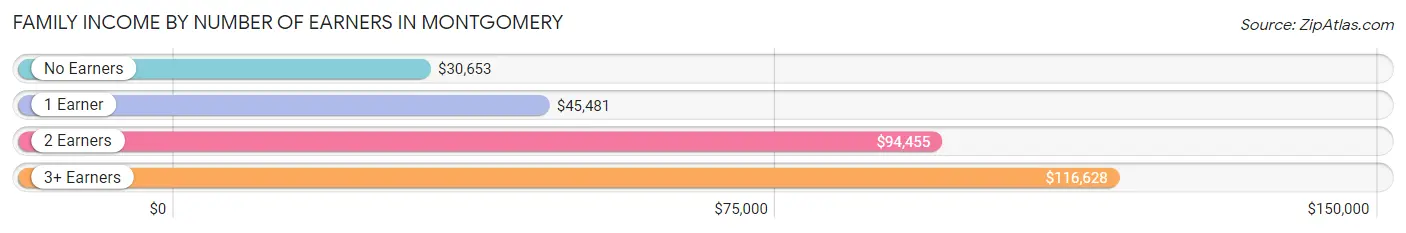
| Number of Earners | # Families | Median Income |
| No Earners | 7,179 (15.4%) | $30,653 |
| 1 Earner | 19,252 (41.4%) | $45,481 |
| 2 Earners | 16,212 (34.9%) | $94,455 |
| 3+ Earners | 3,864 (8.3%) | $116,628 |
| Total | 46,507 (100.0%) | $65,774 |
Household Income in Montgomery
Household Income Brackets in Montgomery
With 14,626 households falling in the category, the $50,000 to $74,999 income range is the most frequent in Montgomery, accounting for 18.4% of all households. In contrast, only 3,815 households (4.8%) fall into the $200,000+ income bracket, making it the least populous group.
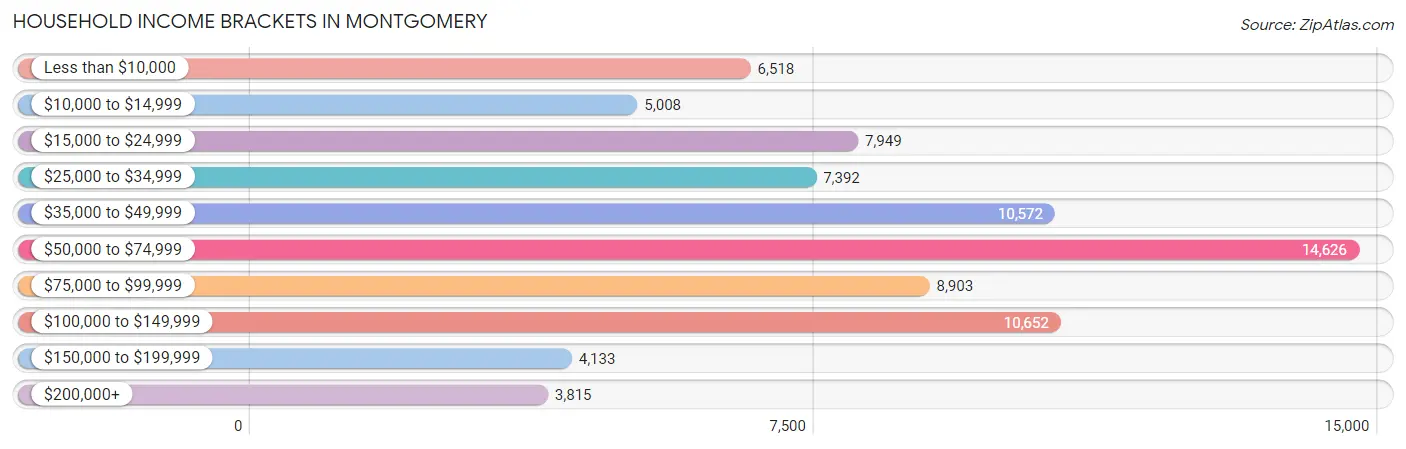
| Income Bracket | # Households | % Households |
| Less than $10,000 | 6,518 | 8.2% |
| $10,000 to $14,999 | 5,008 | 6.3% |
| $15,000 to $24,999 | 7,949 | 10.0% |
| $25,000 to $34,999 | 7,392 | 9.3% |
| $35,000 to $49,999 | 10,572 | 13.3% |
| $50,000 to $74,999 | 14,626 | 18.4% |
| $75,000 to $99,999 | 8,903 | 11.2% |
| $100,000 to $149,999 | 10,652 | 13.4% |
| $150,000 to $199,999 | 4,133 | 5.2% |
| $200,000+ | 3,815 | 4.8% |
Household Income by Householder Age in Montgomery
The median household income in Montgomery is $54,166, with the highest median household income of $61,735 found in the 45 to 64 years age bracket for the primary householder. A total of 27,860 households (35.0%) fall into this category. Meanwhile, the 15 to 24 years age bracket for the primary householder has the lowest median household income of $28,500, with 2,880 households (3.6%) in this group.
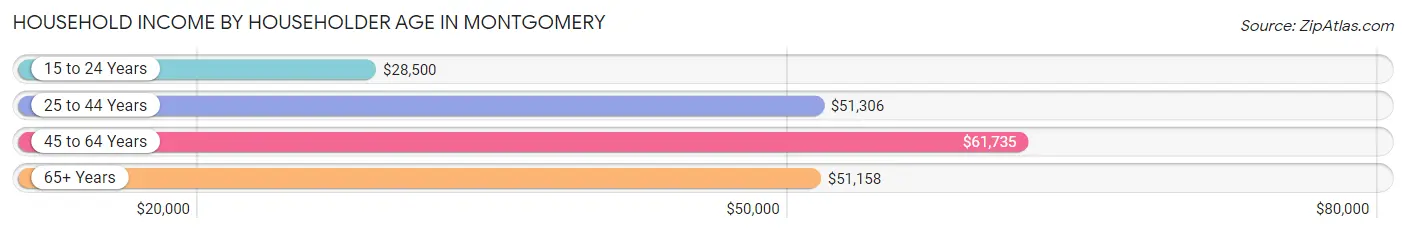
| Income Bracket | # Households | Median Income |
| 15 to 24 Years | 2,880 (3.6%) | $28,500 |
| 25 to 44 Years | 28,001 (35.2%) | $51,306 |
| 45 to 64 Years | 27,860 (35.0%) | $61,735 |
| 65+ Years | 20,748 (26.1%) | $51,158 |
| Total | 79,489 (100.0%) | $54,166 |
Poverty in Montgomery
Income Below Poverty by Sex and Age in Montgomery
With 19.4% poverty level for males and 22.6% for females among the residents of Montgomery, 6 to 11 year old males and 5 year old females are the most vulnerable to poverty, with 2,968 males (35.2%) and 564 females (49.7%) in their respective age groups living below the poverty level.
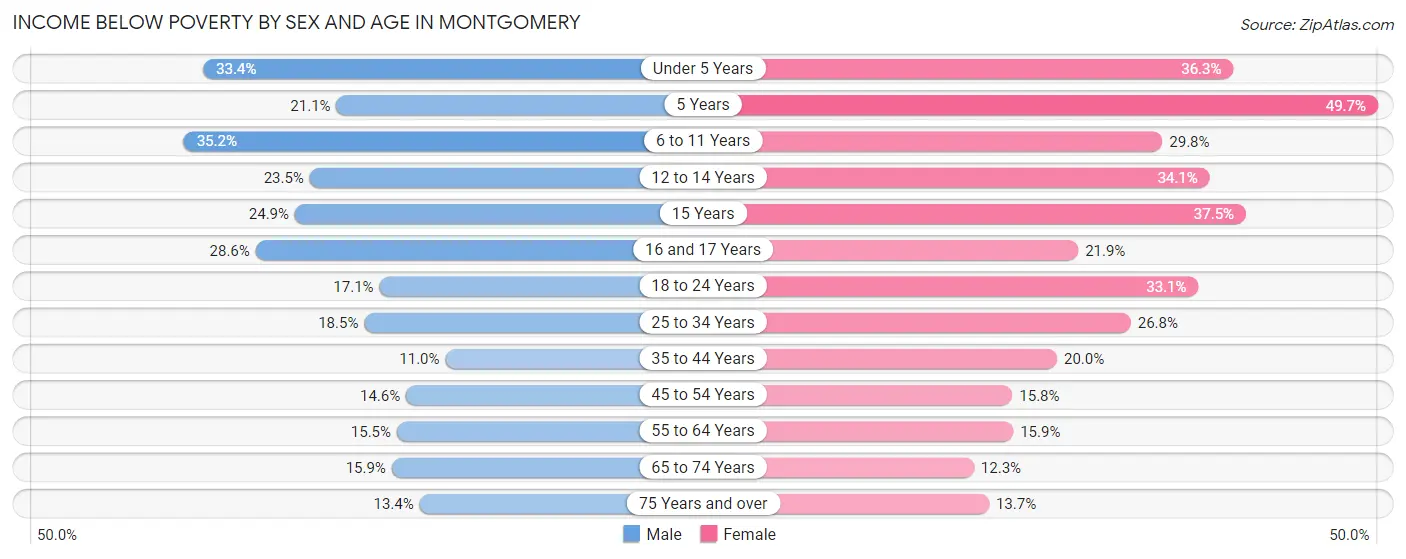
| Age Bracket | Male | Female |
| Under 5 Years | 2,173 (33.4%) | 2,292 (36.3%) |
| 5 Years | 250 (21.1%) | 564 (49.7%) |
| 6 to 11 Years | 2,968 (35.2%) | 2,323 (29.7%) |
| 12 to 14 Years | 868 (23.5%) | 1,203 (34.1%) |
| 15 Years | 242 (24.9%) | 405 (37.5%) |
| 16 and 17 Years | 772 (28.6%) | 612 (21.9%) |
| 18 to 24 Years | 1,414 (17.1%) | 2,911 (33.1%) |
| 25 to 34 Years | 2,468 (18.5%) | 3,990 (26.8%) |
| 35 to 44 Years | 1,205 (11.0%) | 2,712 (20.0%) |
| 45 to 54 Years | 1,488 (14.6%) | 1,986 (15.8%) |
| 55 to 64 Years | 1,645 (15.4%) | 2,081 (15.9%) |
| 65 to 74 Years | 1,205 (15.9%) | 1,262 (12.3%) |
| 75 Years and over | 588 (13.4%) | 998 (13.7%) |
| Total | 17,286 (19.4%) | 23,339 (22.6%) |
Income Above Poverty by Sex and Age in Montgomery
According to the poverty statistics in Montgomery, males aged 35 to 44 years and females aged 65 to 74 years are the age groups that are most secure financially, with 89.0% of males and 87.7% of females in these age groups living above the poverty line.
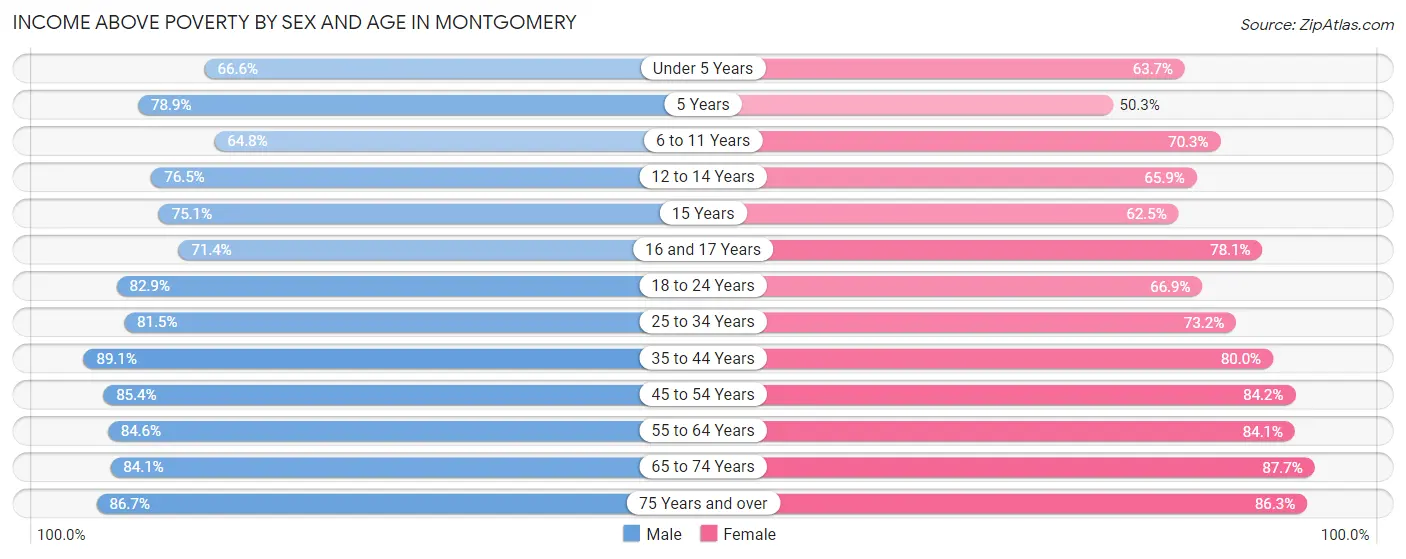
| Age Bracket | Male | Female |
| Under 5 Years | 4,327 (66.6%) | 4,017 (63.7%) |
| 5 Years | 937 (78.9%) | 570 (50.3%) |
| 6 to 11 Years | 5,457 (64.8%) | 5,486 (70.3%) |
| 12 to 14 Years | 2,819 (76.5%) | 2,321 (65.9%) |
| 15 Years | 729 (75.1%) | 675 (62.5%) |
| 16 and 17 Years | 1,931 (71.4%) | 2,177 (78.1%) |
| 18 to 24 Years | 6,868 (82.9%) | 5,885 (66.9%) |
| 25 to 34 Years | 10,889 (81.5%) | 10,885 (73.2%) |
| 35 to 44 Years | 9,802 (89.0%) | 10,861 (80.0%) |
| 45 to 54 Years | 8,701 (85.4%) | 10,561 (84.2%) |
| 55 to 64 Years | 9,002 (84.6%) | 10,995 (84.1%) |
| 65 to 74 Years | 6,358 (84.1%) | 9,034 (87.7%) |
| 75 Years and over | 3,817 (86.7%) | 6,308 (86.3%) |
| Total | 71,637 (80.6%) | 79,775 (77.4%) |
Income Below Poverty Among Married-Couple Families in Montgomery
The poverty statistics for married-couple families in Montgomery show that 4.8% or 1,206 of the total 25,197 families live below the poverty line. Families with 3 or 4 children have the highest poverty rate of 15.1%, comprising of 297 families. On the other hand, families with 1 or 2 children have the lowest poverty rate of 3.7%, which includes 285 families.
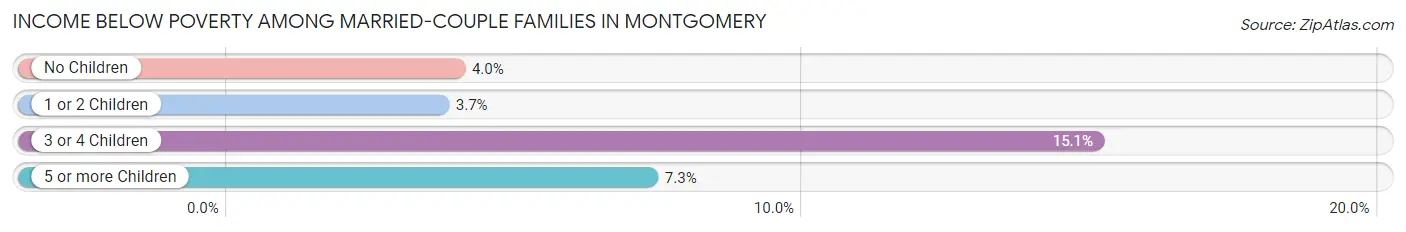
| Children | Above Poverty | Below Poverty |
| No Children | 14,487 (96.1%) | 596 (4.0%) |
| 1 or 2 Children | 7,478 (96.3%) | 285 (3.7%) |
| 3 or 4 Children | 1,671 (84.9%) | 297 (15.1%) |
| 5 or more Children | 355 (92.7%) | 28 (7.3%) |
| Total | 23,991 (95.2%) | 1,206 (4.8%) |
Income Below Poverty Among Single-Parent Households in Montgomery
According to the poverty data in Montgomery, 25.3% or 923 single-father households and 35.5% or 6,262 single-mother households are living below the poverty line. Among single-father households, those with 3 or 4 children have the highest poverty rate, with 181 households (64.0%) experiencing poverty. Likewise, among single-mother households, those with 5 or more children have the highest poverty rate, with 219 households (100.0%) falling below the poverty line.
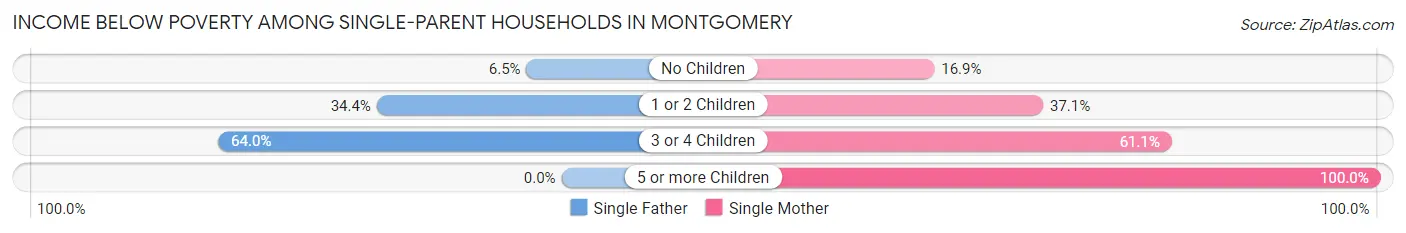
| Children | Single Father | Single Mother |
| No Children | 98 (6.5%) | 927 (16.9%) |
| 1 or 2 Children | 644 (34.4%) | 3,379 (37.1%) |
| 3 or 4 Children | 181 (64.0%) | 1,737 (61.1%) |
| 5 or more Children | 0 (0.0%) | 219 (100.0%) |
| Total | 923 (25.3%) | 6,262 (35.5%) |
Income Below Poverty Among Married-Couple vs Single-Parent Households in Montgomery
The poverty data for Montgomery shows that 1,206 of the married-couple family households (4.8%) and 7,185 of the single-parent households (33.7%) are living below the poverty level. Within the married-couple family households, those with 3 or 4 children have the highest poverty rate, with 297 households (15.1%) falling below the poverty line. Among the single-parent households, those with 5 or more children have the highest poverty rate, with 219 household (100.0%) living below poverty.

| Children | Married-Couple Families | Single-Parent Households |
| No Children | 596 (4.0%) | 1,025 (14.7%) |
| 1 or 2 Children | 285 (3.7%) | 4,023 (36.7%) |
| 3 or 4 Children | 297 (15.1%) | 1,918 (61.4%) |
| 5 or more Children | 28 (7.3%) | 219 (100.0%) |
| Total | 1,206 (4.8%) | 7,185 (33.7%) |
Race in Montgomery
The most populous races in Montgomery are Black / African American (125,354 | 62.7%), White / Caucasian (57,865 | 29.0%), and Hispanic or Latino (7,695 | 3.8%).
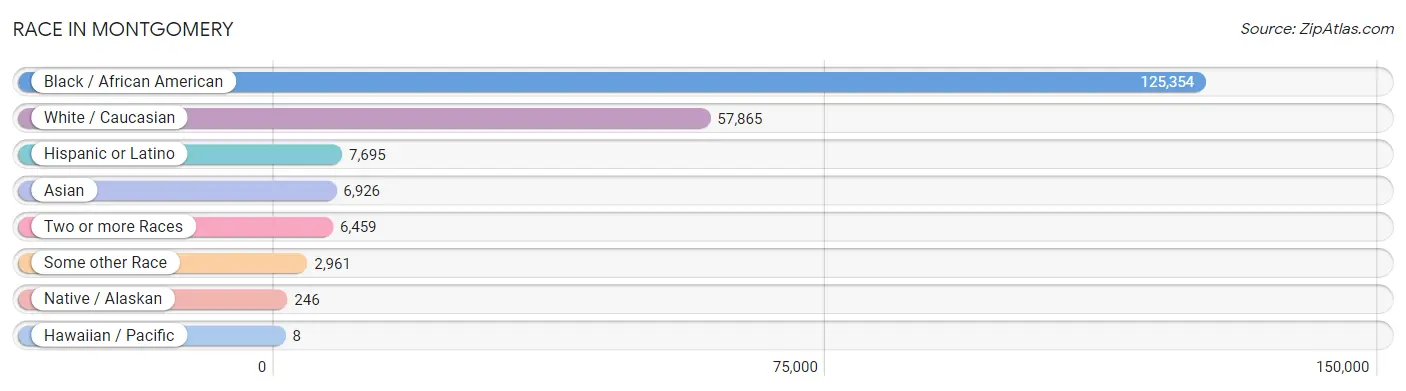
| Race | # Population | % Population |
| Asian | 6,926 | 3.5% |
| Black / African American | 125,354 | 62.7% |
| Hawaiian / Pacific | 8 | 0.0% |
| Hispanic or Latino | 7,695 | 3.8% |
| Native / Alaskan | 246 | 0.1% |
| White / Caucasian | 57,865 | 29.0% |
| Two or more Races | 6,459 | 3.2% |
| Some other Race | 2,961 | 1.5% |
| Total | 199,819 | 100.0% |
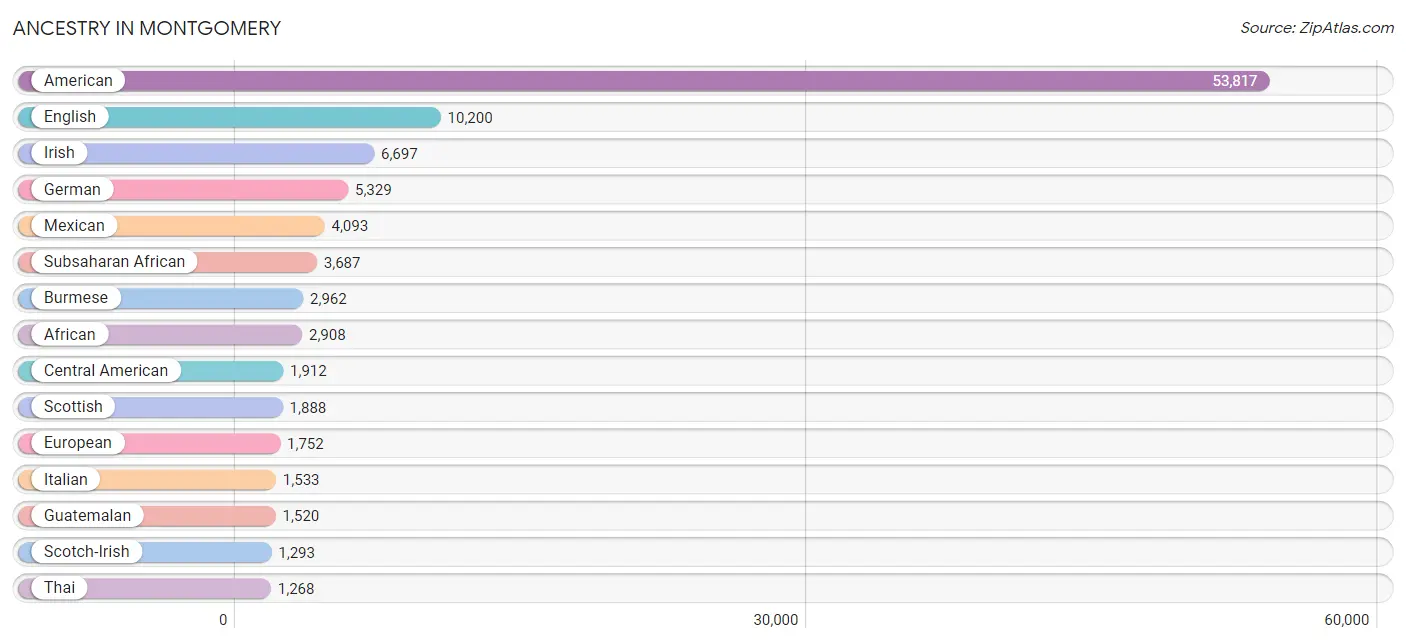
Ancestry in Montgomery
The most populous ancestries reported in Montgomery are American (53,817 | 26.9%), English (10,200 | 5.1%), Irish (6,697 | 3.4%), German (5,329 | 2.7%), and Mexican (4,093 | 2.1%), together accounting for 40.1% of all Montgomery residents.
| Ancestry | # Population | % Population |
| African | 2,908 | 1.5% |
| Albanian | 7 | 0.0% |
| American | 53,817 | 26.9% |
| Apache | 17 | 0.0% |
| Arab | 373 | 0.2% |
| Argentinean | 26 | 0.0% |
| Armenian | 38 | 0.0% |
| Austrian | 34 | 0.0% |
| Barbadian | 13 | 0.0% |
| Belgian | 46 | 0.0% |
| Belizean | 12 | 0.0% |
| Bhutanese | 243 | 0.1% |
| Blackfeet | 48 | 0.0% |
| Bolivian | 9 | 0.0% |
| Brazilian | 29 | 0.0% |
| British | 726 | 0.4% |
| Burmese | 2,962 | 1.5% |
| Cajun | 9 | 0.0% |
| Canadian | 338 | 0.2% |
| Celtic | 35 | 0.0% |
| Central American | 1,912 | 1.0% |
| Central American Indian | 112 | 0.1% |
| Cherokee | 286 | 0.1% |
| Chickasaw | 4 | 0.0% |
| Chilean | 15 | 0.0% |
| Chippewa | 19 | 0.0% |
| Choctaw | 24 | 0.0% |
| Colombian | 29 | 0.0% |
| Creek | 150 | 0.1% |
| Croatian | 5 | 0.0% |
| Cuban | 192 | 0.1% |
| Czech | 53 | 0.0% |
| Danish | 83 | 0.0% |
| Dominican | 82 | 0.0% |
| Dutch | 437 | 0.2% |
| Eastern European | 97 | 0.1% |
| Ecuadorian | 44 | 0.0% |
| Egyptian | 12 | 0.0% |
| English | 10,200 | 5.1% |
| Ethiopian | 23 | 0.0% |
| European | 1,752 | 0.9% |
| Filipino | 136 | 0.1% |
| Finnish | 21 | 0.0% |
| French | 1,198 | 0.6% |
| French Canadian | 203 | 0.1% |
| German | 5,329 | 2.7% |
| Greek | 104 | 0.1% |
| Guatemalan | 1,520 | 0.8% |
| Guyanese | 7 | 0.0% |
| Haitian | 328 | 0.2% |
| Honduran | 231 | 0.1% |
| Hungarian | 223 | 0.1% |
| Indian (Asian) | 1,033 | 0.5% |
| Indonesian | 12 | 0.0% |
| Iranian | 14 | 0.0% |
| Irish | 6,697 | 3.4% |
| Italian | 1,533 | 0.8% |
| Jamaican | 296 | 0.2% |
| Kenyan | 162 | 0.1% |
| Korean | 546 | 0.3% |
| Laotian | 7 | 0.0% |
| Latvian | 59 | 0.0% |
| Lebanese | 224 | 0.1% |
| Liberian | 100 | 0.1% |
| Lithuanian | 66 | 0.0% |
| Malaysian | 195 | 0.1% |
| Mexican | 4,093 | 2.1% |
| Moroccan | 28 | 0.0% |
| Native Hawaiian | 19 | 0.0% |
| Navajo | 1 | 0.0% |
| Nicaraguan | 4 | 0.0% |
| Nigerian | 502 | 0.3% |
| Northern European | 81 | 0.0% |
| Norwegian | 339 | 0.2% |
| Pakistani | 100 | 0.1% |
| Palestinian | 6 | 0.0% |
| Panamanian | 77 | 0.0% |
| Pennsylvania German | 10 | 0.0% |
| Peruvian | 25 | 0.0% |
| Polish | 1,038 | 0.5% |
| Portuguese | 192 | 0.1% |
| Puerto Rican | 627 | 0.3% |
| Romanian | 13 | 0.0% |
| Russian | 214 | 0.1% |
| Salvadoran | 80 | 0.0% |
| Samoan | 18 | 0.0% |
| Scandinavian | 154 | 0.1% |
| Scotch-Irish | 1,293 | 0.6% |
| Scottish | 1,888 | 0.9% |
| Seminole | 6 | 0.0% |
| Serbian | 14 | 0.0% |
| Slovak | 72 | 0.0% |
| Slovene | 43 | 0.0% |
| South American | 227 | 0.1% |
| South American Indian | 50 | 0.0% |
| Spaniard | 280 | 0.1% |
| Spanish | 123 | 0.1% |
| Sri Lankan | 713 | 0.4% |
| Subsaharan African | 3,687 | 1.8% |
| Swedish | 230 | 0.1% |
| Swiss | 158 | 0.1% |
| Syrian | 16 | 0.0% |
| Thai | 1,268 | 0.6% |
| Trinidadian and Tobagonian | 38 | 0.0% |
| Turkish | 74 | 0.0% |
| U.S. Virgin Islander | 8 | 0.0% |
| Ugandan | 12 | 0.0% |
| Ukrainian | 126 | 0.1% |
| Uruguayan | 16 | 0.0% |
| Venezuelan | 63 | 0.0% |
| Vietnamese | 218 | 0.1% |
| Welsh | 207 | 0.1% |
| West Indian | 67 | 0.0% |
| Yugoslavian | 25 | 0.0% | View All 114 Rows |
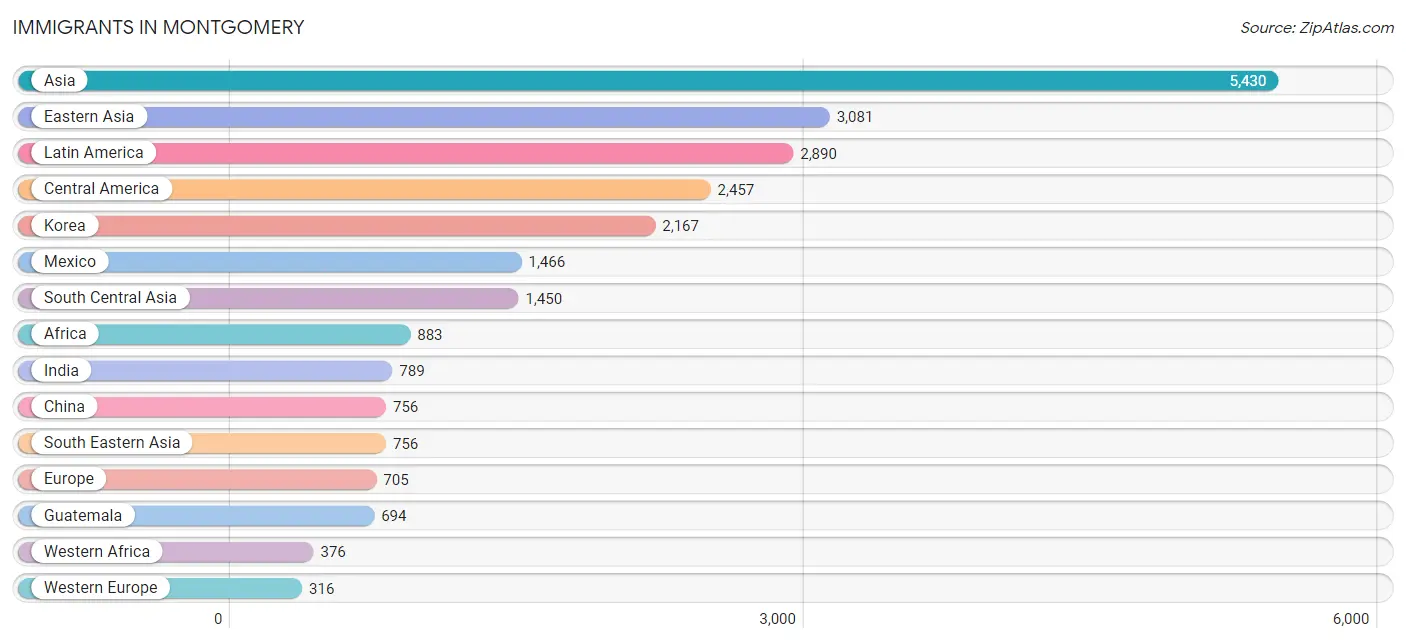
Immigrants in Montgomery
The most numerous immigrant groups reported in Montgomery came from Asia (5,430 | 2.7%), Eastern Asia (3,081 | 1.5%), Latin America (2,890 | 1.5%), Central America (2,457 | 1.2%), and Korea (2,167 | 1.1%), together accounting for 8.0% of all Montgomery residents.
| Immigration Origin | # Population | % Population |
| Africa | 883 | 0.4% |
| Argentina | 14 | 0.0% |
| Asia | 5,430 | 2.7% |
| Bangladesh | 183 | 0.1% |
| Barbados | 13 | 0.0% |
| Belgium | 12 | 0.0% |
| Bolivia | 9 | 0.0% |
| Bosnia and Herzegovina | 9 | 0.0% |
| Brazil | 23 | 0.0% |
| Canada | 215 | 0.1% |
| Caribbean | 220 | 0.1% |
| Central America | 2,457 | 1.2% |
| China | 756 | 0.4% |
| Colombia | 39 | 0.0% |
| Congo | 2 | 0.0% |
| Cuba | 60 | 0.0% |
| Denmark | 18 | 0.0% |
| Dominican Republic | 9 | 0.0% |
| Eastern Africa | 81 | 0.0% |
| Eastern Asia | 3,081 | 1.5% |
| Eastern Europe | 152 | 0.1% |
| Ecuador | 27 | 0.0% |
| El Salvador | 31 | 0.0% |
| England | 114 | 0.1% |
| Ethiopia | 21 | 0.0% |
| Europe | 705 | 0.4% |
| France | 10 | 0.0% |
| Germany | 288 | 0.1% |
| Ghana | 15 | 0.0% |
| Guatemala | 694 | 0.4% |
| Haiti | 45 | 0.0% |
| Honduras | 214 | 0.1% |
| India | 789 | 0.4% |
| Indonesia | 8 | 0.0% |
| Iran | 14 | 0.0% |
| Italy | 1 | 0.0% |
| Jamaica | 52 | 0.0% |
| Japan | 158 | 0.1% |
| Korea | 2,167 | 1.1% |
| Laos | 103 | 0.1% |
| Latin America | 2,890 | 1.5% |
| Latvia | 29 | 0.0% |
| Lebanon | 109 | 0.1% |
| Liberia | 100 | 0.1% |
| Mexico | 1,466 | 0.7% |
| Middle Africa | 2 | 0.0% |
| Nepal | 269 | 0.1% |
| Netherlands | 6 | 0.0% |
| Nigeria | 253 | 0.1% |
| Northern Africa | 124 | 0.1% |
| Northern Europe | 235 | 0.1% |
| Norway | 12 | 0.0% |
| Oceania | 11 | 0.0% |
| Pakistan | 195 | 0.1% |
| Panama | 52 | 0.0% |
| Peru | 1 | 0.0% |
| Philippines | 276 | 0.1% |
| Romania | 13 | 0.0% |
| Russia | 67 | 0.0% |
| Saudi Arabia | 9 | 0.0% |
| Scotland | 18 | 0.0% |
| South Africa | 37 | 0.0% |
| South America | 213 | 0.1% |
| South Central Asia | 1,450 | 0.7% |
| South Eastern Asia | 756 | 0.4% |
| Southern Europe | 2 | 0.0% |
| Spain | 1 | 0.0% |
| Sudan | 114 | 0.1% |
| Sweden | 13 | 0.0% |
| Taiwan | 149 | 0.1% |
| Thailand | 66 | 0.0% |
| Trinidad and Tobago | 27 | 0.0% |
| Turkey | 25 | 0.0% |
| Uganda | 12 | 0.0% |
| Ukraine | 1 | 0.0% |
| Uruguay | 16 | 0.0% |
| Venezuela | 84 | 0.0% |
| Vietnam | 303 | 0.2% |
| West Indies | 7 | 0.0% |
| Western Africa | 376 | 0.2% |
| Western Asia | 143 | 0.1% |
| Western Europe | 316 | 0.2% |
| Zimbabwe | 33 | 0.0% | View All 83 Rows |
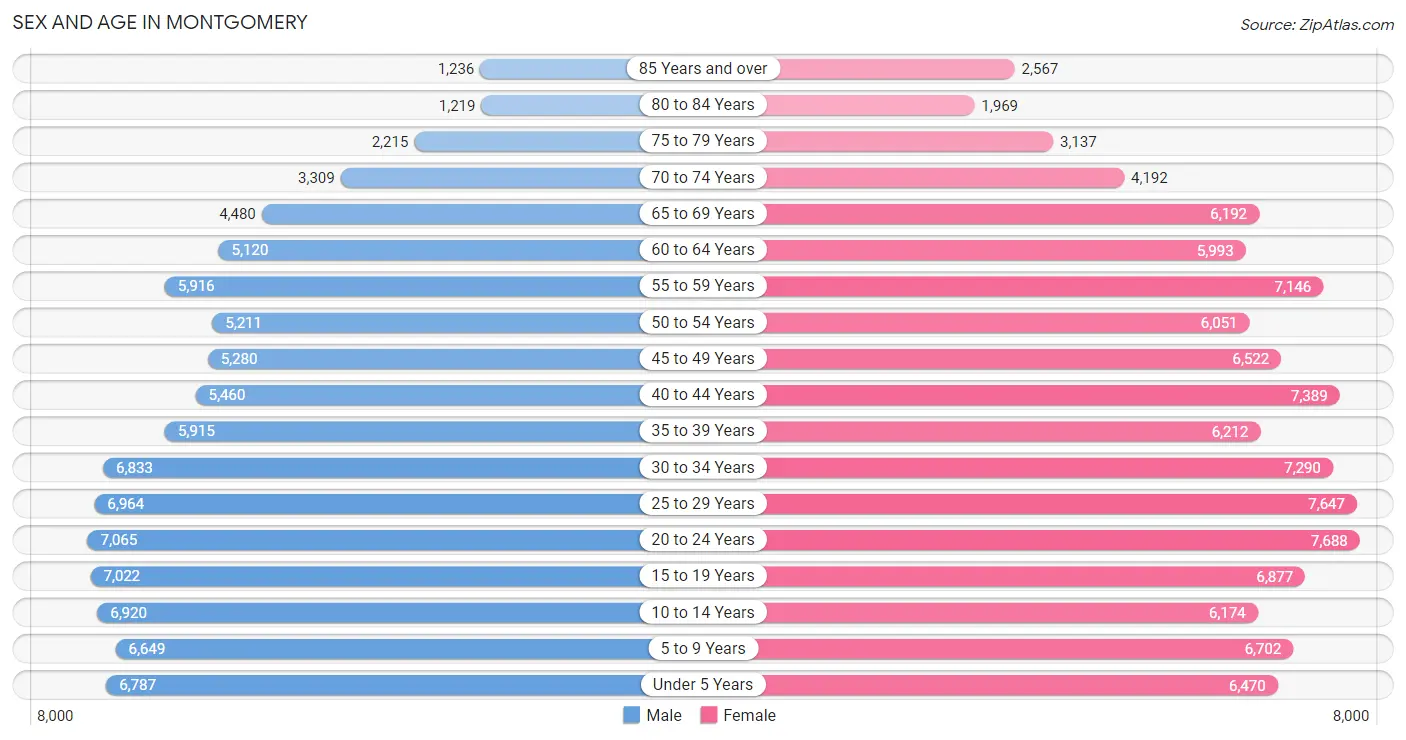
Sex and Age in Montgomery
Sex and Age in Montgomery
The most populous age groups in Montgomery are 20 to 24 Years (7,065 | 7.5%) for men and 20 to 24 Years (7,688 | 7.2%) for women.
| Age Bracket | Male | Female |
| Under 5 Years | 6,787 (7.2%) | 6,470 (6.1%) |
| 5 to 9 Years | 6,649 (7.1%) | 6,702 (6.3%) |
| 10 to 14 Years | 6,920 (7.4%) | 6,174 (5.8%) |
| 15 to 19 Years | 7,022 (7.5%) | 6,877 (6.5%) |
| 20 to 24 Years | 7,065 (7.5%) | 7,688 (7.2%) |
| 25 to 29 Years | 6,964 (7.4%) | 7,647 (7.2%) |
| 30 to 34 Years | 6,833 (7.3%) | 7,290 (6.9%) |
| 35 to 39 Years | 5,915 (6.3%) | 6,212 (5.9%) |
| 40 to 44 Years | 5,460 (5.8%) | 7,389 (7.0%) |
| 45 to 49 Years | 5,280 (5.6%) | 6,522 (6.1%) |
| 50 to 54 Years | 5,211 (5.6%) | 6,051 (5.7%) |
| 55 to 59 Years | 5,916 (6.3%) | 7,146 (6.7%) |
| 60 to 64 Years | 5,120 (5.5%) | 5,993 (5.6%) |
| 65 to 69 Years | 4,480 (4.8%) | 6,192 (5.8%) |
| 70 to 74 Years | 3,309 (3.5%) | 4,192 (4.0%) |
| 75 to 79 Years | 2,215 (2.4%) | 3,137 (2.9%) |
| 80 to 84 Years | 1,219 (1.3%) | 1,969 (1.8%) |
| 85 Years and over | 1,236 (1.3%) | 2,567 (2.4%) |
| Total | 93,601 (100.0%) | 106,218 (100.0%) |
Families and Households in Montgomery
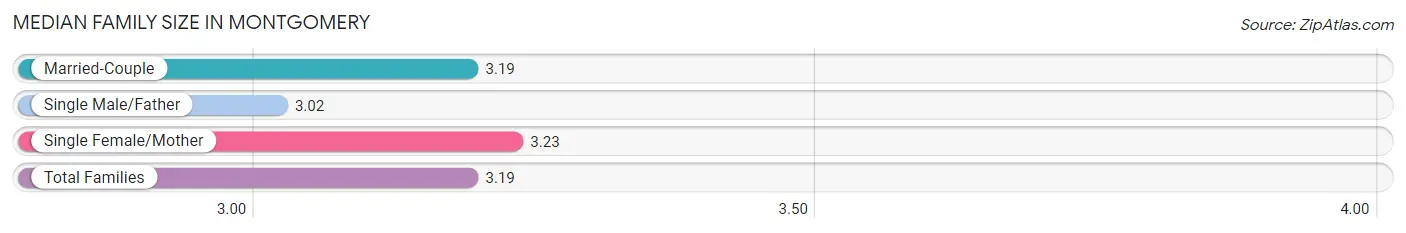
Median Family Size in Montgomery
The median family size in Montgomery is 3.19 persons per family, with single female/mother families (17,656 | 38.0%) accounting for the largest median family size of 3.23 persons per family. On the other hand, single male/father families (3,654 | 7.9%) represent the smallest median family size with 3.02 persons per family.
| Family Type | # Families | Family Size |
| Married-Couple | 25,197 (54.2%) | 3.19 |
| Single Male/Father | 3,654 (7.9%) | 3.02 |
| Single Female/Mother | 17,656 (38.0%) | 3.23 |
| Total Families | 46,507 (100.0%) | 3.19 |
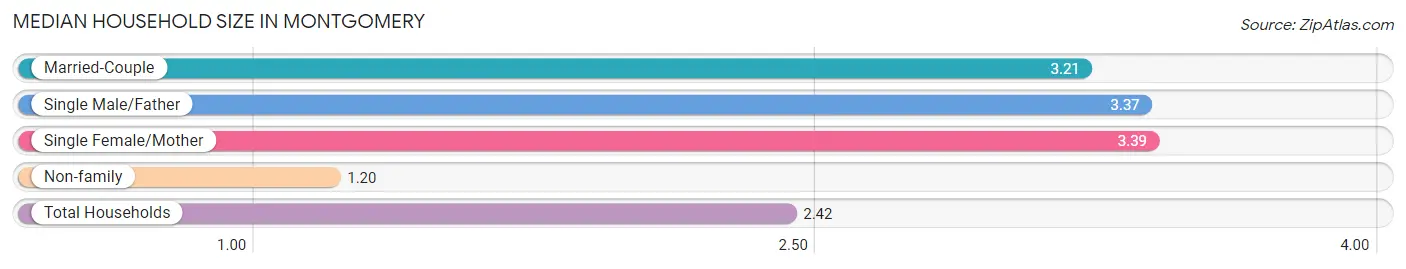
Median Household Size in Montgomery
The median household size in Montgomery is 2.42 persons per household, with single female/mother households (17,656 | 22.2%) accounting for the largest median household size of 3.39 persons per household. non-family households (32,982 | 41.5%) represent the smallest median household size with 1.20 persons per household.
| Household Type | # Households | Household Size |
| Married-Couple | 25,197 (31.7%) | 3.21 |
| Single Male/Father | 3,654 (4.6%) | 3.37 |
| Single Female/Mother | 17,656 (22.2%) | 3.39 |
| Non-family | 32,982 (41.5%) | 1.20 |
| Total Households | 79,489 (100.0%) | 2.42 |
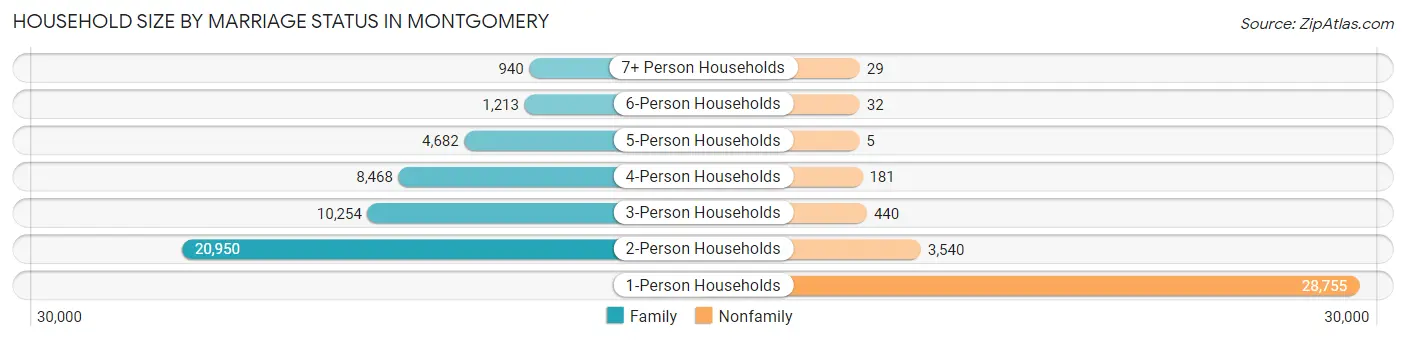
Household Size by Marriage Status in Montgomery
Out of a total of 79,489 households in Montgomery, 46,507 (58.5%) are family households, while 32,982 (41.5%) are nonfamily households. The most numerous type of family households are 2-person households, comprising 20,950, and the most common type of nonfamily households are 1-person households, comprising 28,755.
| Household Size | Family Households | Nonfamily Households |
| 1-Person Households | - | 28,755 (36.2%) |
| 2-Person Households | 20,950 (26.4%) | 3,540 (4.4%) |
| 3-Person Households | 10,254 (12.9%) | 440 (0.5%) |
| 4-Person Households | 8,468 (10.6%) | 181 (0.2%) |
| 5-Person Households | 4,682 (5.9%) | 5 (0.0%) |
| 6-Person Households | 1,213 (1.5%) | 32 (0.0%) |
| 7+ Person Households | 940 (1.2%) | 29 (0.0%) |
| Total | 46,507 (58.5%) | 32,982 (41.5%) |
Female Fertility in Montgomery
Fertility by Age in Montgomery
Average fertility rate in Montgomery is 55.0 births per 1,000 women. Women in the age bracket of 20 to 34 years have the highest fertility rate with 94.0 births per 1,000 women. Women in the age bracket of 20 to 34 years acount for 76.5% of all women with births.
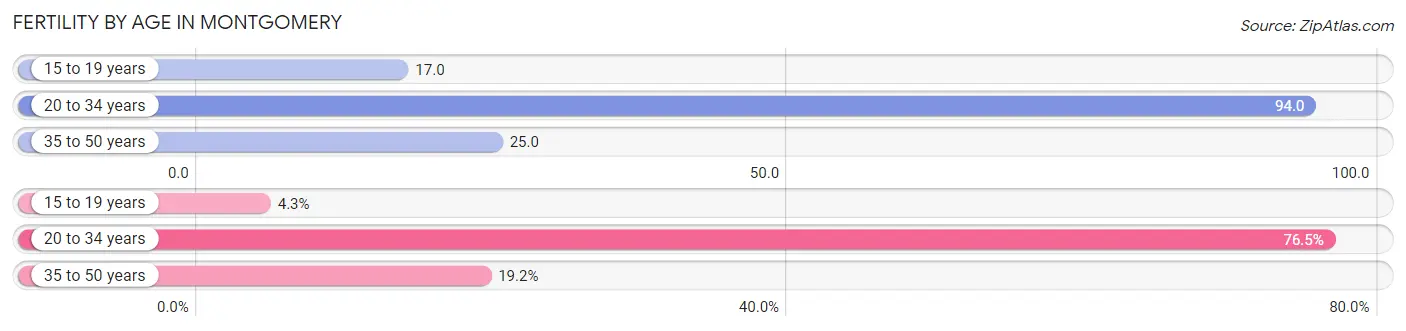
| Age Bracket | Women with Births | Births / 1,000 Women |
| 15 to 19 years | 118 (4.3%) | 17.0 |
| 20 to 34 years | 2,118 (76.5%) | 94.0 |
| 35 to 50 years | 532 (19.2%) | 25.0 |
| Total | 2,768 (100.0%) | 55.0 |
Fertility by Age by Marriage Status in Montgomery
39.9% of women with births (2,768) in Montgomery are married. The highest percentage of unmarried women with births falls into 15 to 19 years age bracket with 91.5% of them unmarried at the time of birth, while the lowest percentage of unmarried women with births belong to 35 to 50 years age bracket with 53.0% of them unmarried.
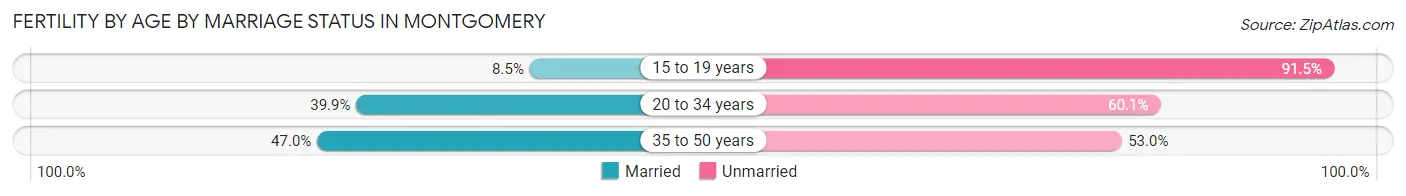
| Age Bracket | Married | Unmarried |
| 15 to 19 years | 10 (8.5%) | 108 (91.5%) |
| 20 to 34 years | 845 (39.9%) | 1,273 (60.1%) |
| 35 to 50 years | 250 (47.0%) | 282 (53.0%) |
| Total | 1,104 (39.9%) | 1,664 (60.1%) |
Fertility by Education in Montgomery
Average fertility rate in Montgomery is 55.0 births per 1,000 women. Women with the education attainment of college or associate's degree have the highest fertility rate of 73.0 births per 1,000 women, while women with the education attainment of graduate degree have the lowest fertility at 23.0 births per 1,000 women. Women with the education attainment of college or associate's degree represent 45.1% of all women with births.
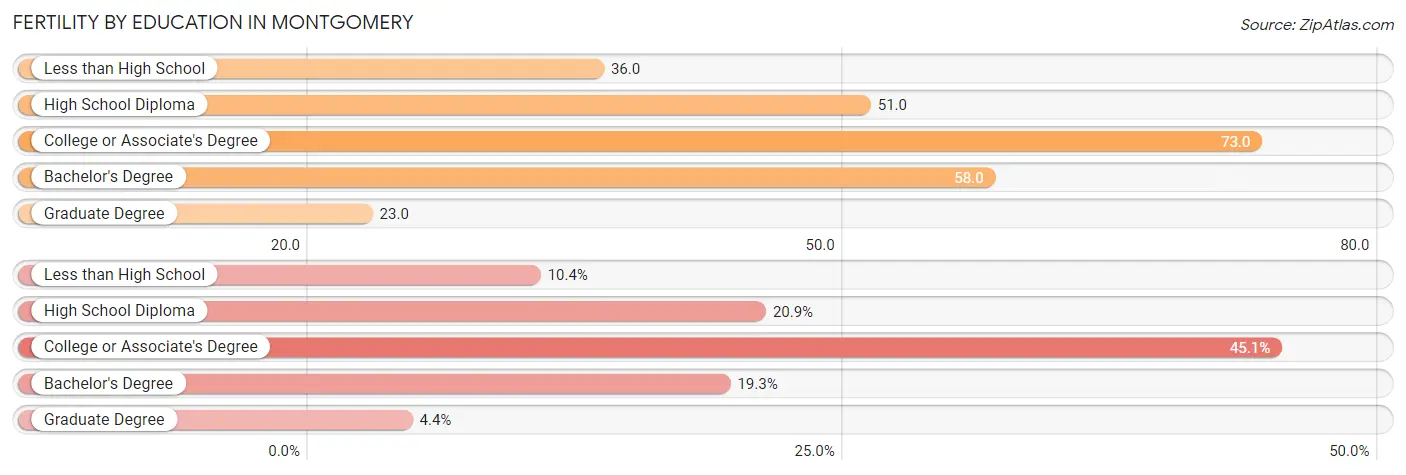
| Educational Attainment | Women with Births | Births / 1,000 Women |
| Less than High School | 287 (10.4%) | 36.0 |
| High School Diploma | 579 (20.9%) | 51.0 |
| College or Associate's Degree | 1,248 (45.1%) | 73.0 |
| Bachelor's Degree | 533 (19.3%) | 58.0 |
| Graduate Degree | 121 (4.4%) | 23.0 |
| Total | 2,768 (100.0%) | 55.0 |
Fertility by Education by Marriage Status in Montgomery
60.1% of women with births in Montgomery are unmarried. Women with the educational attainment of bachelor's degree are most likely to be married with 63.8% of them married at childbirth, while women with the educational attainment of graduate degree are least likely to be married with 78.5% of them unmarried at childbirth.
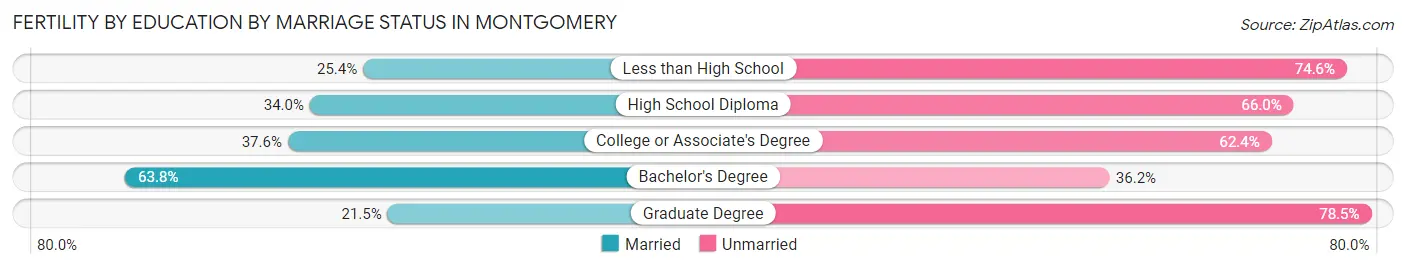
| Educational Attainment | Married | Unmarried |
| Less than High School | 73 (25.4%) | 214 (74.6%) |
| High School Diploma | 197 (34.0%) | 382 (66.0%) |
| College or Associate's Degree | 469 (37.6%) | 779 (62.4%) |
| Bachelor's Degree | 340 (63.8%) | 193 (36.2%) |
| Graduate Degree | 26 (21.5%) | 95 (78.5%) |
| Total | 1,104 (39.9%) | 1,664 (60.1%) |
Employment Characteristics in Montgomery
Employment by Class of Employer in Montgomery
Among the 85,387 employed individuals in Montgomery, private company employees (52,242 | 61.2%), state government employees (8,342 | 9.8%), and not-for-profit organizations (7,194 | 8.4%) make up the most common classes of employment.
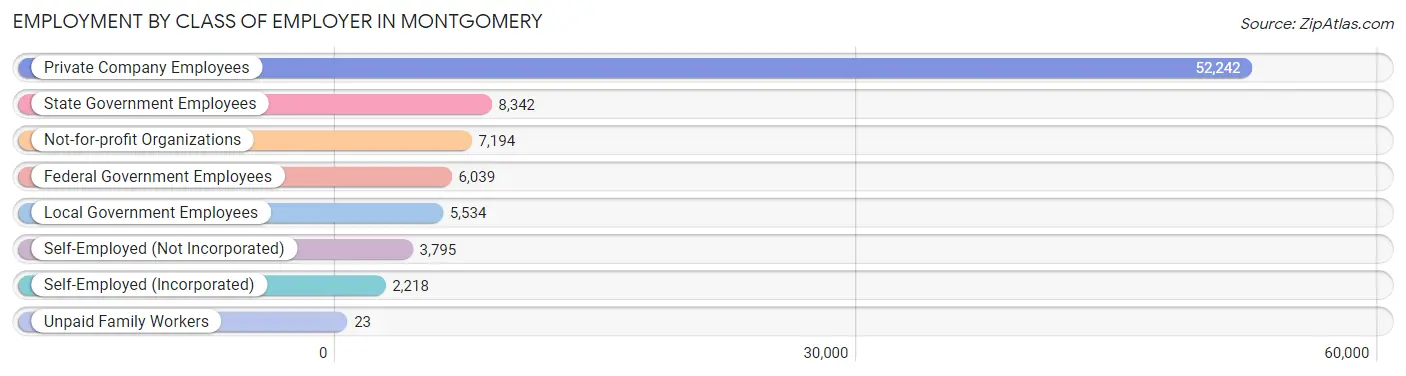
| Employer Class | # Employees | % Employees |
| Private Company Employees | 52,242 | 61.2% |
| Self-Employed (Incorporated) | 2,218 | 2.6% |
| Self-Employed (Not Incorporated) | 3,795 | 4.4% |
| Not-for-profit Organizations | 7,194 | 8.4% |
| Local Government Employees | 5,534 | 6.5% |
| State Government Employees | 8,342 | 9.8% |
| Federal Government Employees | 6,039 | 7.1% |
| Unpaid Family Workers | 23 | 0.0% |
| Total | 85,387 | 100.0% |
Employment Status by Age in Montgomery
According to the labor force statistics for Montgomery, out of the total population over 16 years of age (158,045), 59.7% or 94,353 individuals are in the labor force, with 7.2% or 6,793 of them unemployed. The age group with the highest labor force participation rate is 25 to 29 years, with 85.9% or 12,551 individuals in the labor force. Within the labor force, the 20 to 24 years age range has the highest percentage of unemployed individuals, with 13.7% or 1,376 of them being unemployed.
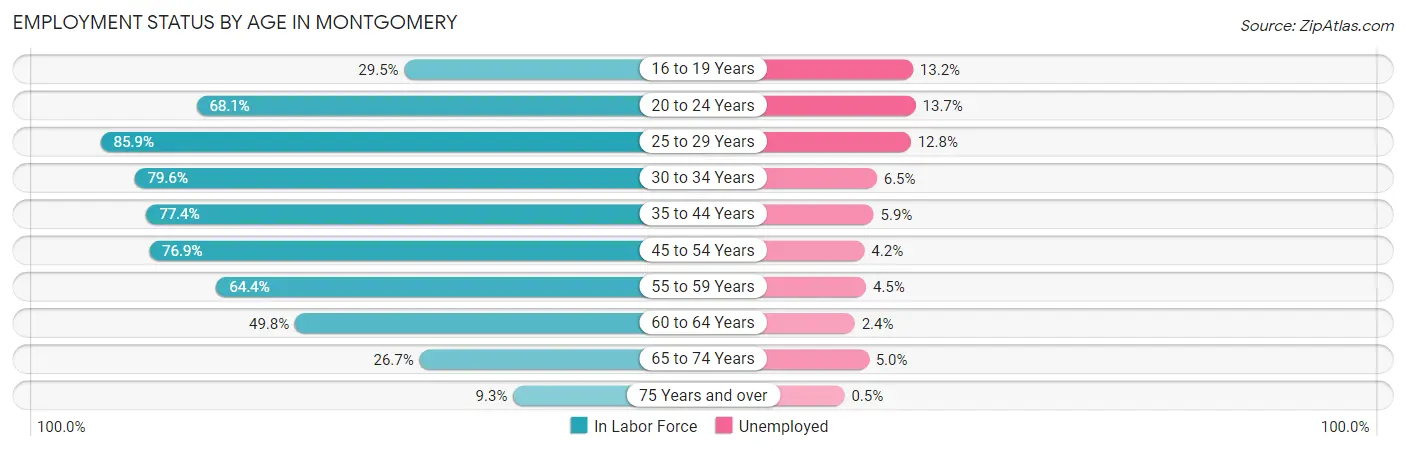
| Age Bracket | In Labor Force | Unemployed |
| 16 to 19 Years | 3,489 (29.5%) | 461 (13.2%) |
| 20 to 24 Years | 10,047 (68.1%) | 1,376 (13.7%) |
| 25 to 29 Years | 12,551 (85.9%) | 1,607 (12.8%) |
| 30 to 34 Years | 11,242 (79.6%) | 731 (6.5%) |
| 35 to 44 Years | 19,331 (77.4%) | 1,141 (5.9%) |
| 45 to 54 Years | 17,736 (76.9%) | 745 (4.2%) |
| 55 to 59 Years | 8,412 (64.4%) | 379 (4.5%) |
| 60 to 64 Years | 5,534 (49.8%) | 133 (2.4%) |
| 65 to 74 Years | 4,852 (26.7%) | 243 (5.0%) |
| 75 Years and over | 1,148 (9.3%) | 6 (0.5%) |
| Total | 94,353 (59.7%) | 6,793 (7.2%) |
Employment Status by Educational Attainment in Montgomery
According to labor force statistics for Montgomery, 74.1% of individuals (74,803) out of the total population between 25 and 64 years of age (100,949) are in the labor force, with 6.3% or 4,713 of them being unemployed. The group with the highest labor force participation rate are those with the educational attainment of bachelor's degree or higher, with 83.6% or 28,140 individuals in the labor force. Within the labor force, individuals with less than high school education have the highest percentage of unemployment, with 11.3% or 603 of them being unemployed.
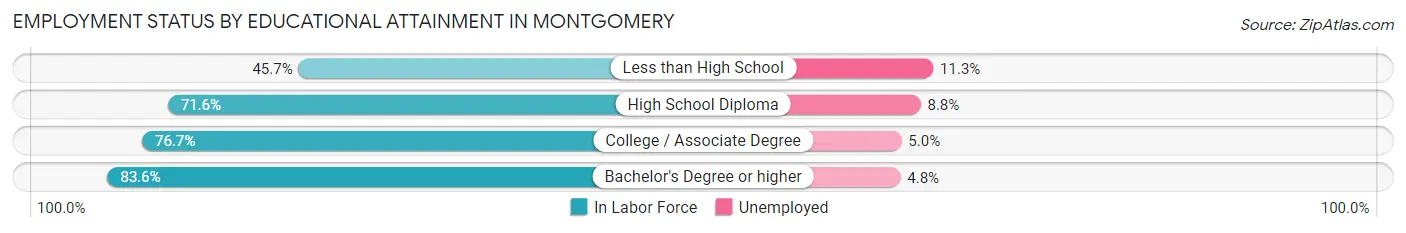
| Educational Attainment | In Labor Force | Unemployed |
| Less than High School | 5,337 (45.7%) | 1,320 (11.3%) |
| High School Diploma | 18,209 (71.6%) | 2,238 (8.8%) |
| College / Associate Degree | 23,148 (76.7%) | 1,509 (5.0%) |
| Bachelor's Degree or higher | 28,140 (83.6%) | 1,616 (4.8%) |
| Total | 74,803 (74.1%) | 6,360 (6.3%) |
Employment Occupations by Sex in Montgomery
Management, Business, Science and Arts Occupations
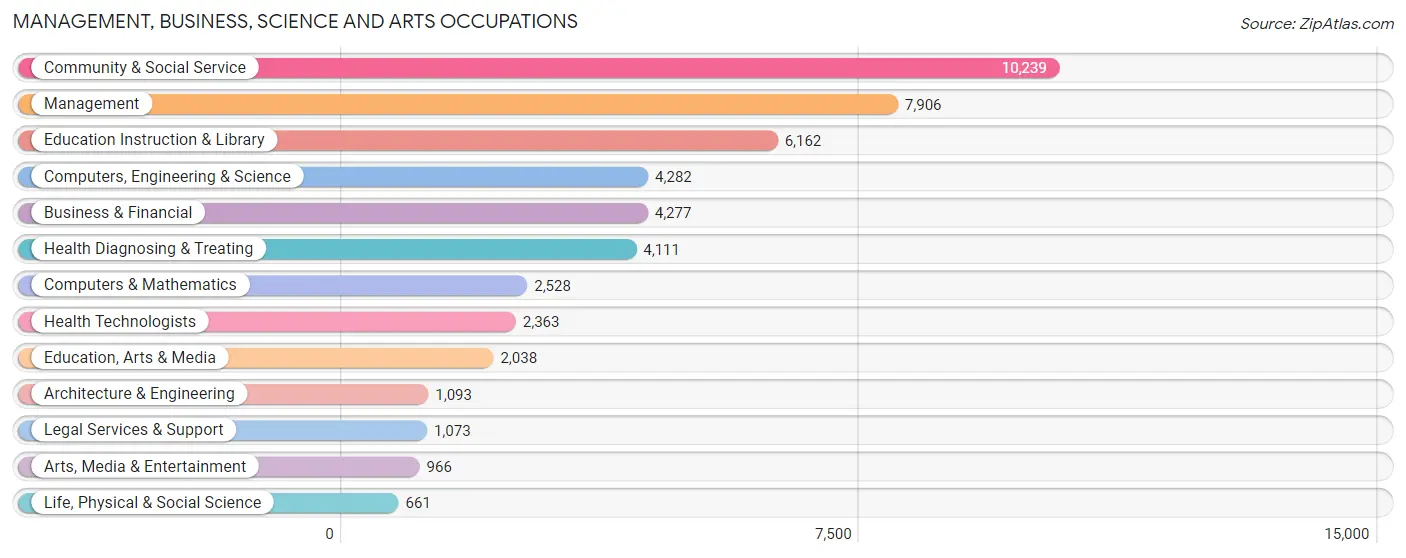
The most common Management, Business, Science and Arts occupations in Montgomery are Community & Social Service (10,239 | 12.0%), Management (7,906 | 9.2%), Education Instruction & Library (6,162 | 7.2%), Computers, Engineering & Science (4,282 | 5.0%), and Business & Financial (4,277 | 5.0%).
Management, Business, Science and Arts Occupations by Sex
Within the Management, Business, Science and Arts occupations in Montgomery, the most male-oriented occupations are Architecture & Engineering (83.9%), Computers, Engineering & Science (61.7%), and Legal Services & Support (59.1%), while the most female-oriented occupations are Health Diagnosing & Treating (80.7%), Education Instruction & Library (74.9%), and Health Technologists (72.1%).
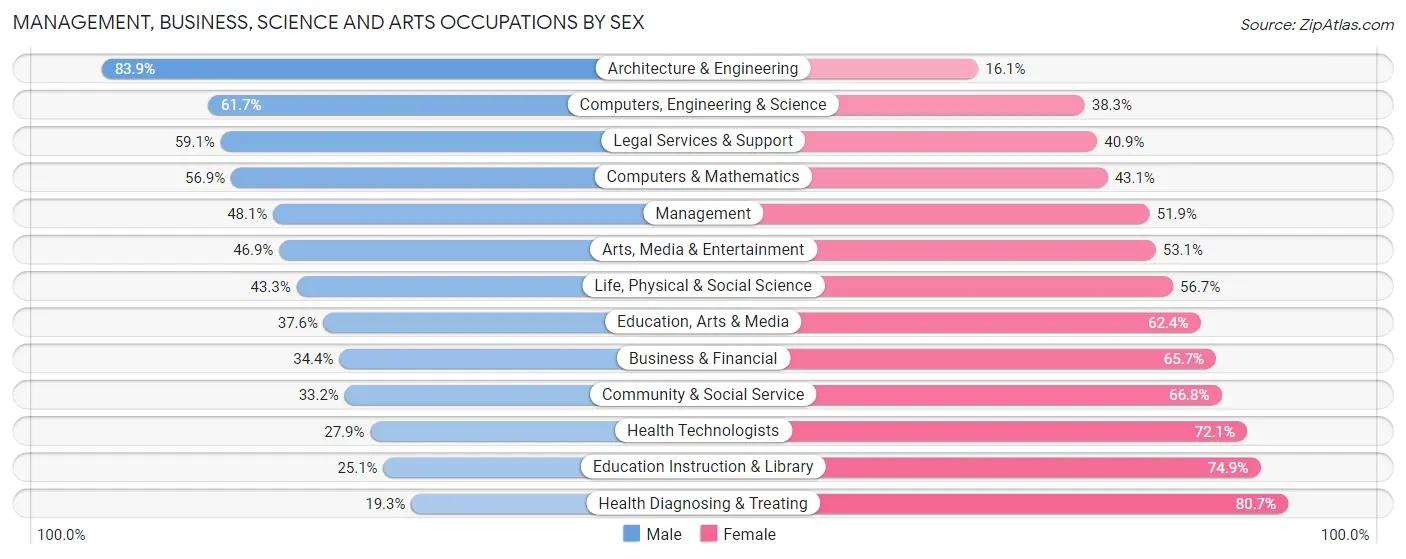
| Occupation | Male | Female |
| Management | 3,806 (48.1%) | 4,100 (51.9%) |
| Business & Financial | 1,469 (34.4%) | 2,808 (65.6%) |
| Computers, Engineering & Science | 2,642 (61.7%) | 1,640 (38.3%) |
| Computers & Mathematics | 1,439 (56.9%) | 1,089 (43.1%) |
| Architecture & Engineering | 917 (83.9%) | 176 (16.1%) |
| Life, Physical & Social Science | 286 (43.3%) | 375 (56.7%) |
| Community & Social Service | 3,402 (33.2%) | 6,837 (66.8%) |
| Education, Arts & Media | 766 (37.6%) | 1,272 (62.4%) |
| Legal Services & Support | 634 (59.1%) | 439 (40.9%) |
| Education Instruction & Library | 1,549 (25.1%) | 4,613 (74.9%) |
| Arts, Media & Entertainment | 453 (46.9%) | 513 (53.1%) |
| Health Diagnosing & Treating | 795 (19.3%) | 3,316 (80.7%) |
| Health Technologists | 659 (27.9%) | 1,704 (72.1%) |
| Total (Category) | 12,114 (39.3%) | 18,701 (60.7%) |
| Total (Overall) | 40,783 (47.6%) | 44,838 (52.4%) |
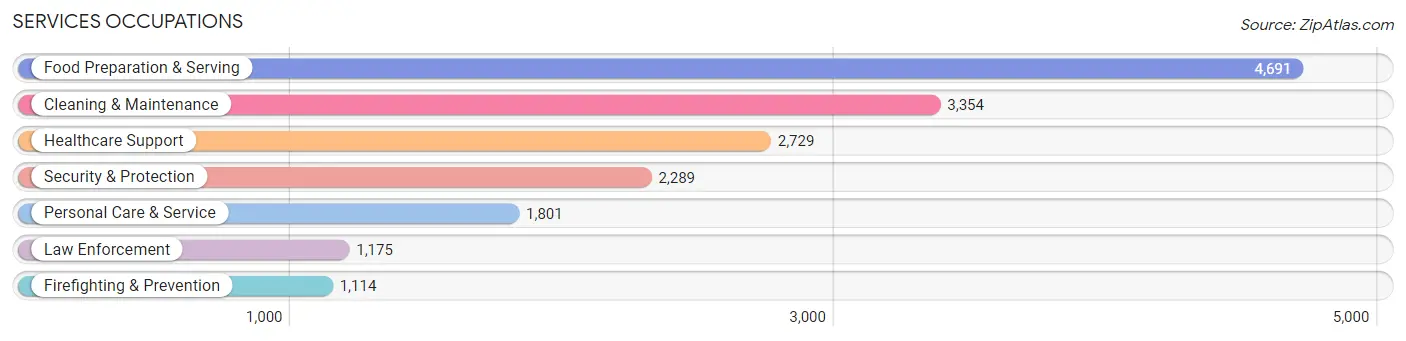
Services Occupations
The most common Services occupations in Montgomery are Food Preparation & Serving (4,691 | 5.5%), Cleaning & Maintenance (3,354 | 3.9%), Healthcare Support (2,729 | 3.2%), Security & Protection (2,289 | 2.7%), and Personal Care & Service (1,801 | 2.1%).
Services Occupations by Sex
Within the Services occupations in Montgomery, the most male-oriented occupations are Law Enforcement (74.6%), Security & Protection (69.3%), and Cleaning & Maintenance (66.7%), while the most female-oriented occupations are Healthcare Support (87.1%), Personal Care & Service (66.3%), and Food Preparation & Serving (55.8%).
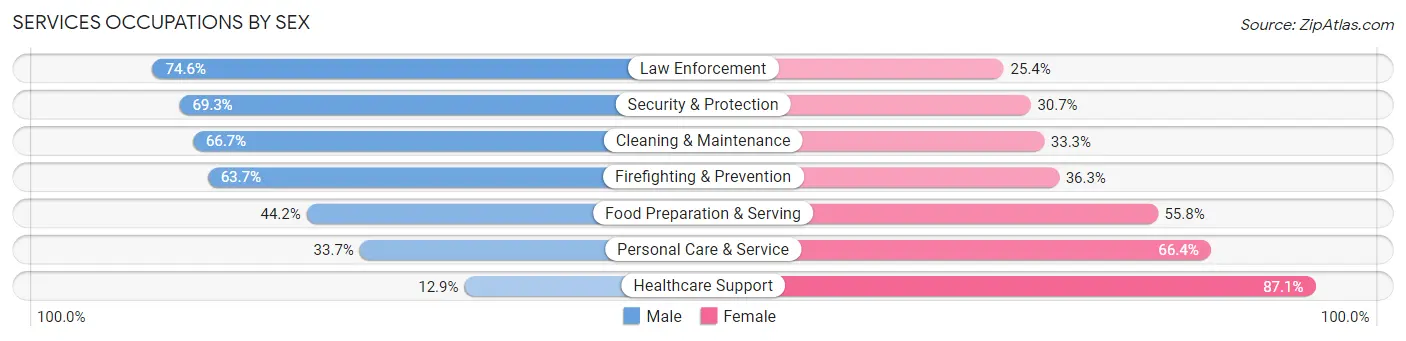
| Occupation | Male | Female |
| Healthcare Support | 353 (12.9%) | 2,376 (87.1%) |
| Security & Protection | 1,587 (69.3%) | 702 (30.7%) |
| Firefighting & Prevention | 710 (63.7%) | 404 (36.3%) |
| Law Enforcement | 877 (74.6%) | 298 (25.4%) |
| Food Preparation & Serving | 2,072 (44.2%) | 2,619 (55.8%) |
| Cleaning & Maintenance | 2,236 (66.7%) | 1,118 (33.3%) |
| Personal Care & Service | 606 (33.7%) | 1,195 (66.3%) |
| Total (Category) | 6,854 (46.1%) | 8,010 (53.9%) |
| Total (Overall) | 40,783 (47.6%) | 44,838 (52.4%) |
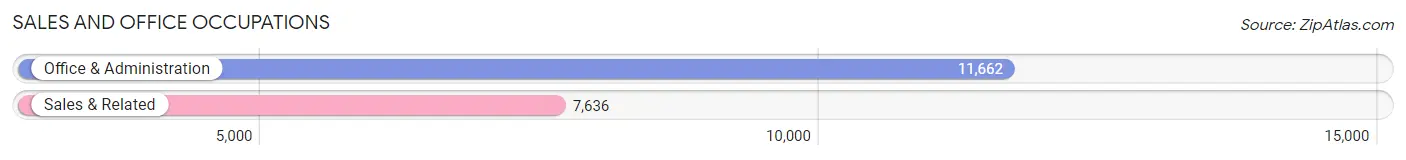
Sales and Office Occupations
The most common Sales and Office occupations in Montgomery are Office & Administration (11,662 | 13.6%), and Sales & Related (7,636 | 8.9%).
Sales and Office Occupations by Sex
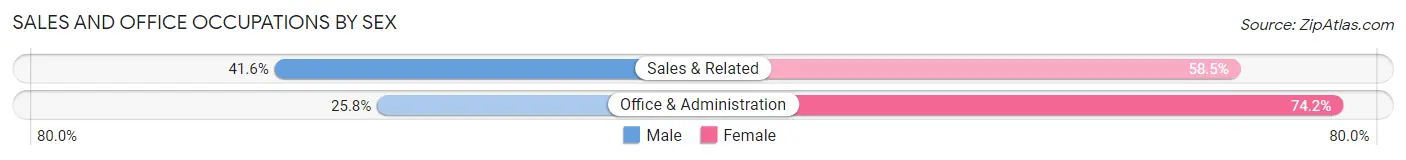
| Occupation | Male | Female |
| Sales & Related | 3,173 (41.5%) | 4,463 (58.5%) |
| Office & Administration | 3,005 (25.8%) | 8,657 (74.2%) |
| Total (Category) | 6,178 (32.0%) | 13,120 (68.0%) |
| Total (Overall) | 40,783 (47.6%) | 44,838 (52.4%) |
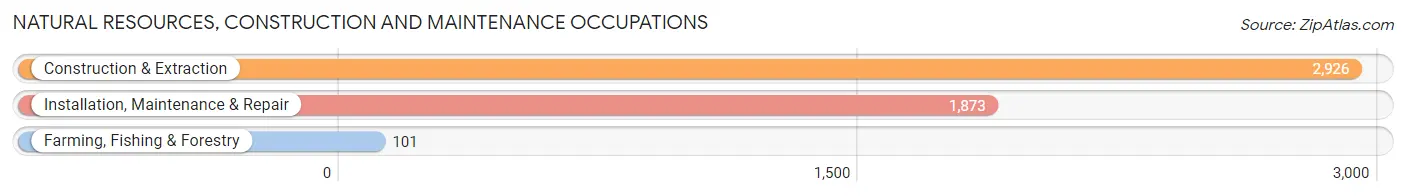
Natural Resources, Construction and Maintenance Occupations
The most common Natural Resources, Construction and Maintenance occupations in Montgomery are Construction & Extraction (2,926 | 3.4%), Installation, Maintenance & Repair (1,873 | 2.2%), and Farming, Fishing & Forestry (101 | 0.1%).
Natural Resources, Construction and Maintenance Occupations by Sex
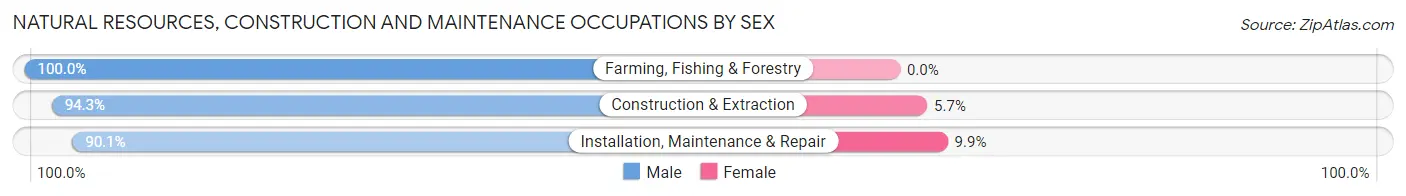
| Occupation | Male | Female |
| Farming, Fishing & Forestry | 101 (100.0%) | 0 (0.0%) |
| Construction & Extraction | 2,760 (94.3%) | 166 (5.7%) |
| Installation, Maintenance & Repair | 1,687 (90.1%) | 186 (9.9%) |
| Total (Category) | 4,548 (92.8%) | 352 (7.2%) |
| Total (Overall) | 40,783 (47.6%) | 44,838 (52.4%) |
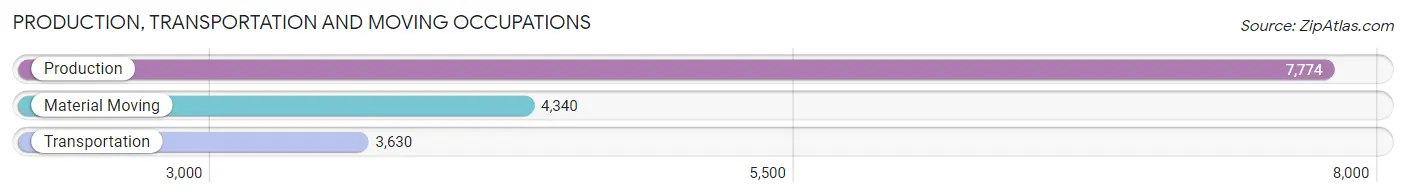
Production, Transportation and Moving Occupations
The most common Production, Transportation and Moving occupations in Montgomery are Production (7,774 | 9.1%), Material Moving (4,340 | 5.1%), and Transportation (3,630 | 4.2%).
Production, Transportation and Moving Occupations by Sex
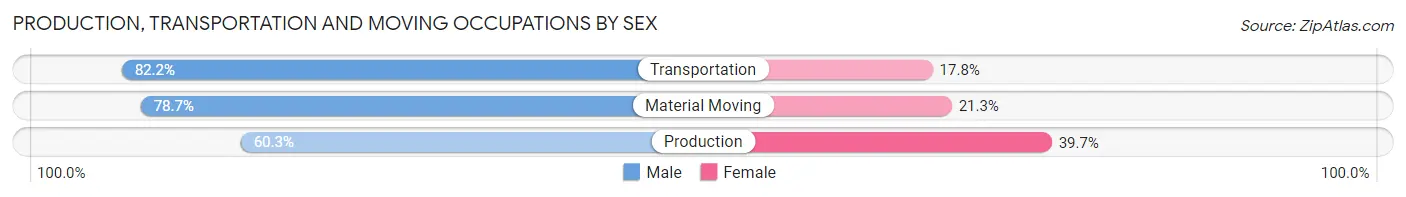
| Occupation | Male | Female |
| Production | 4,691 (60.3%) | 3,083 (39.7%) |
| Transportation | 2,983 (82.2%) | 647 (17.8%) |
| Material Moving | 3,415 (78.7%) | 925 (21.3%) |
| Total (Category) | 11,089 (70.4%) | 4,655 (29.6%) |
| Total (Overall) | 40,783 (47.6%) | 44,838 (52.4%) |
Employment Industries by Sex in Montgomery
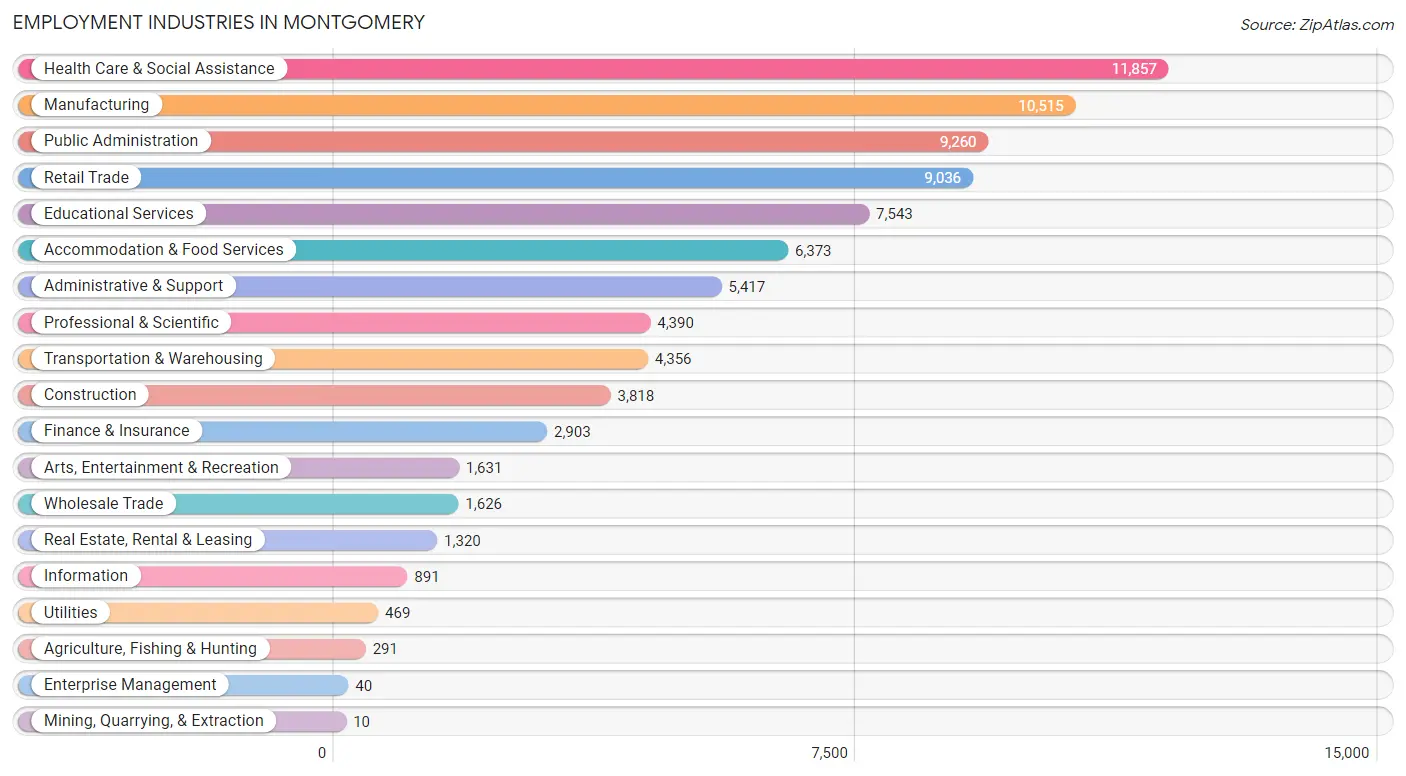
Employment Industries in Montgomery
The major employment industries in Montgomery include Health Care & Social Assistance (11,857 | 13.9%), Manufacturing (10,515 | 12.3%), Public Administration (9,260 | 10.8%), Retail Trade (9,036 | 10.5%), and Educational Services (7,543 | 8.8%).
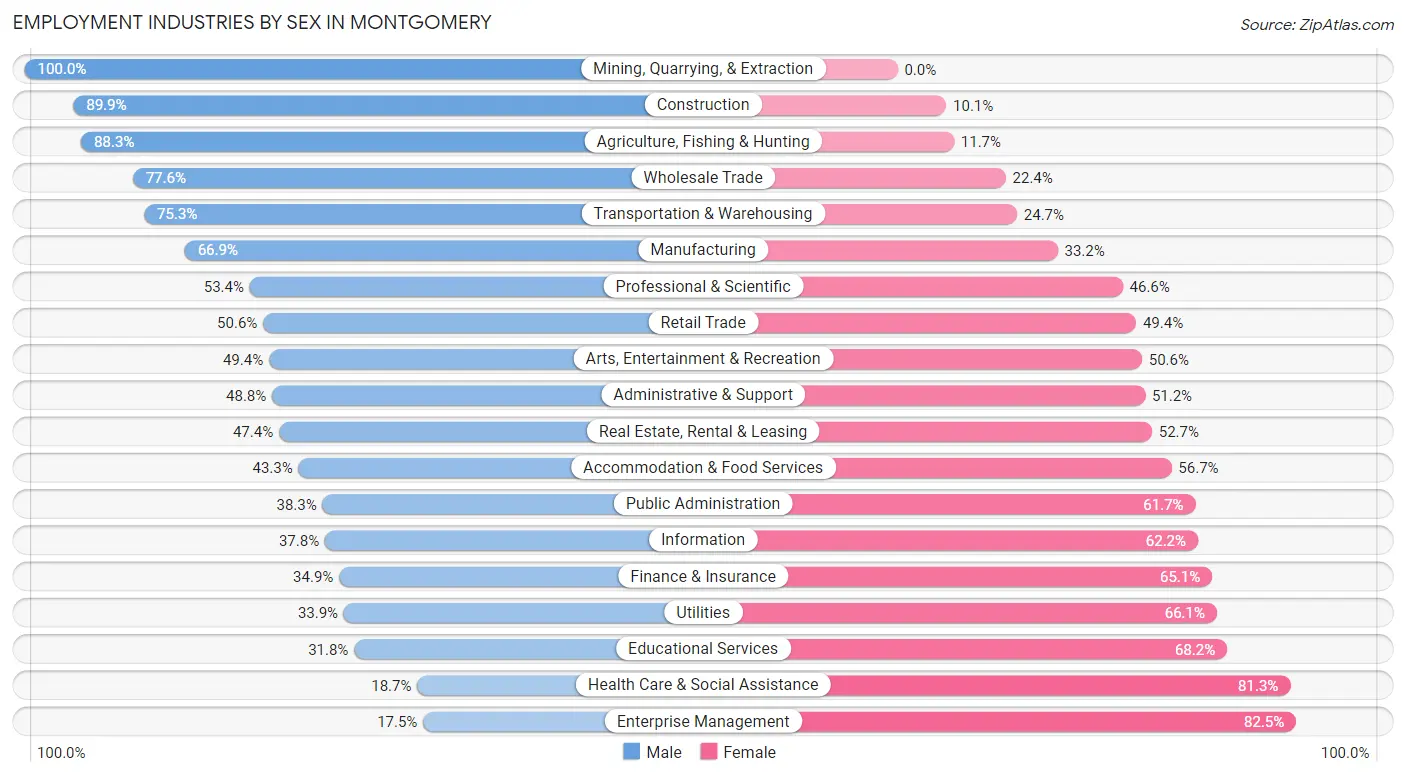
Employment Industries by Sex in Montgomery
The Montgomery industries that see more men than women are Mining, Quarrying, & Extraction (100.0%), Construction (89.9%), and Agriculture, Fishing & Hunting (88.3%), whereas the industries that tend to have a higher number of women are Enterprise Management (82.5%), Health Care & Social Assistance (81.3%), and Educational Services (68.2%).
| Industry | Male | Female |
| Agriculture, Fishing & Hunting | 257 (88.3%) | 34 (11.7%) |
| Mining, Quarrying, & Extraction | 10 (100.0%) | 0 (0.0%) |
| Construction | 3,433 (89.9%) | 385 (10.1%) |
| Manufacturing | 7,029 (66.8%) | 3,486 (33.2%) |
| Wholesale Trade | 1,262 (77.6%) | 364 (22.4%) |
| Retail Trade | 4,574 (50.6%) | 4,462 (49.4%) |
| Transportation & Warehousing | 3,279 (75.3%) | 1,077 (24.7%) |
| Utilities | 159 (33.9%) | 310 (66.1%) |
| Information | 337 (37.8%) | 554 (62.2%) |
| Finance & Insurance | 1,013 (34.9%) | 1,890 (65.1%) |
| Real Estate, Rental & Leasing | 625 (47.3%) | 695 (52.6%) |
| Professional & Scientific | 2,344 (53.4%) | 2,046 (46.6%) |
| Enterprise Management | 7 (17.5%) | 33 (82.5%) |
| Administrative & Support | 2,642 (48.8%) | 2,775 (51.2%) |
| Educational Services | 2,397 (31.8%) | 5,146 (68.2%) |
| Health Care & Social Assistance | 2,220 (18.7%) | 9,637 (81.3%) |
| Arts, Entertainment & Recreation | 806 (49.4%) | 825 (50.6%) |
| Accommodation & Food Services | 2,759 (43.3%) | 3,614 (56.7%) |
| Public Administration | 3,549 (38.3%) | 5,711 (61.7%) |
| Total | 40,783 (47.6%) | 44,838 (52.4%) |
Education in Montgomery
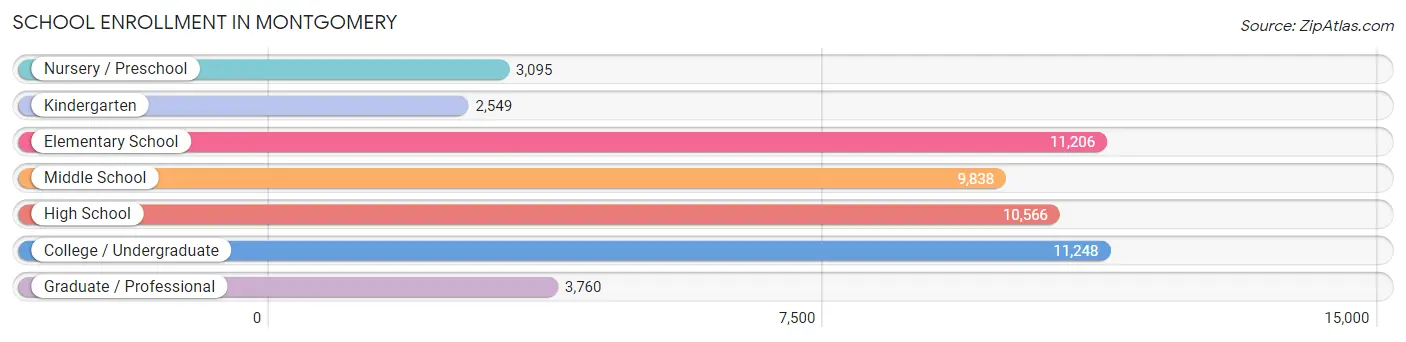
School Enrollment in Montgomery
The most common levels of schooling among the 52,262 students in Montgomery are college / undergraduate (11,248 | 21.5%), elementary school (11,206 | 21.4%), and high school (10,566 | 20.2%).
| School Level | # Students | % Students |
| Nursery / Preschool | 3,095 | 5.9% |
| Kindergarten | 2,549 | 4.9% |
| Elementary School | 11,206 | 21.4% |
| Middle School | 9,838 | 18.8% |
| High School | 10,566 | 20.2% |
| College / Undergraduate | 11,248 | 21.5% |
| Graduate / Professional | 3,760 | 7.2% |
| Total | 52,262 | 100.0% |
School Enrollment by Age by Funding Source in Montgomery
Out of a total of 52,262 students who are enrolled in schools in Montgomery, 11,863 (22.7%) attend a private institution, while the remaining 40,399 (77.3%) are enrolled in public schools. The age group of 3 to 4 year olds has the highest likelihood of being enrolled in private schools, with 1,209 (44.7% in the age bracket) enrolled. Conversely, the age group of 15 to 17 year olds has the lowest likelihood of being enrolled in a private school, with 6,020 (81.2% in the age bracket) attending a public institution.
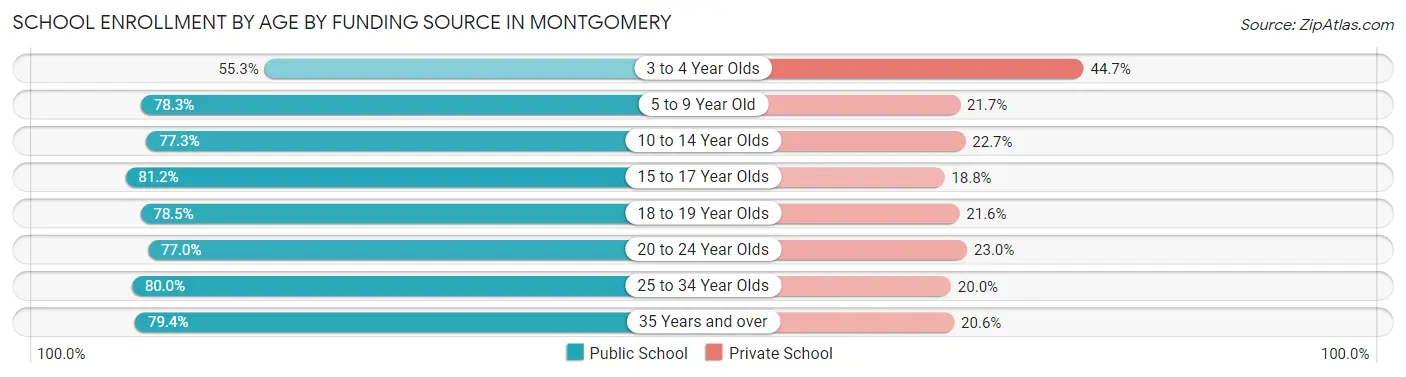
| Age Bracket | Public School | Private School |
| 3 to 4 Year Olds | 1,497 (55.3%) | 1,209 (44.7%) |
| 5 to 9 Year Old | 9,861 (78.3%) | 2,729 (21.7%) |
| 10 to 14 Year Olds | 9,968 (77.3%) | 2,922 (22.7%) |
| 15 to 17 Year Olds | 6,020 (81.2%) | 1,391 (18.8%) |
| 18 to 19 Year Olds | 3,600 (78.4%) | 989 (21.5%) |
| 20 to 24 Year Olds | 4,378 (77.0%) | 1,307 (23.0%) |
| 25 to 34 Year Olds | 2,762 (80.0%) | 689 (20.0%) |
| 35 Years and over | 2,335 (79.4%) | 605 (20.6%) |
| Total | 40,399 (77.3%) | 11,863 (22.7%) |
Educational Attainment by Field of Study in Montgomery
Business (10,465 | 22.7%), education (6,164 | 13.4%), arts & humanities (4,584 | 9.9%), science & technology (3,857 | 8.4%), and computers & mathematics (2,925 | 6.3%) are the most common fields of study among 46,123 individuals in Montgomery who have obtained a bachelor's degree or higher.
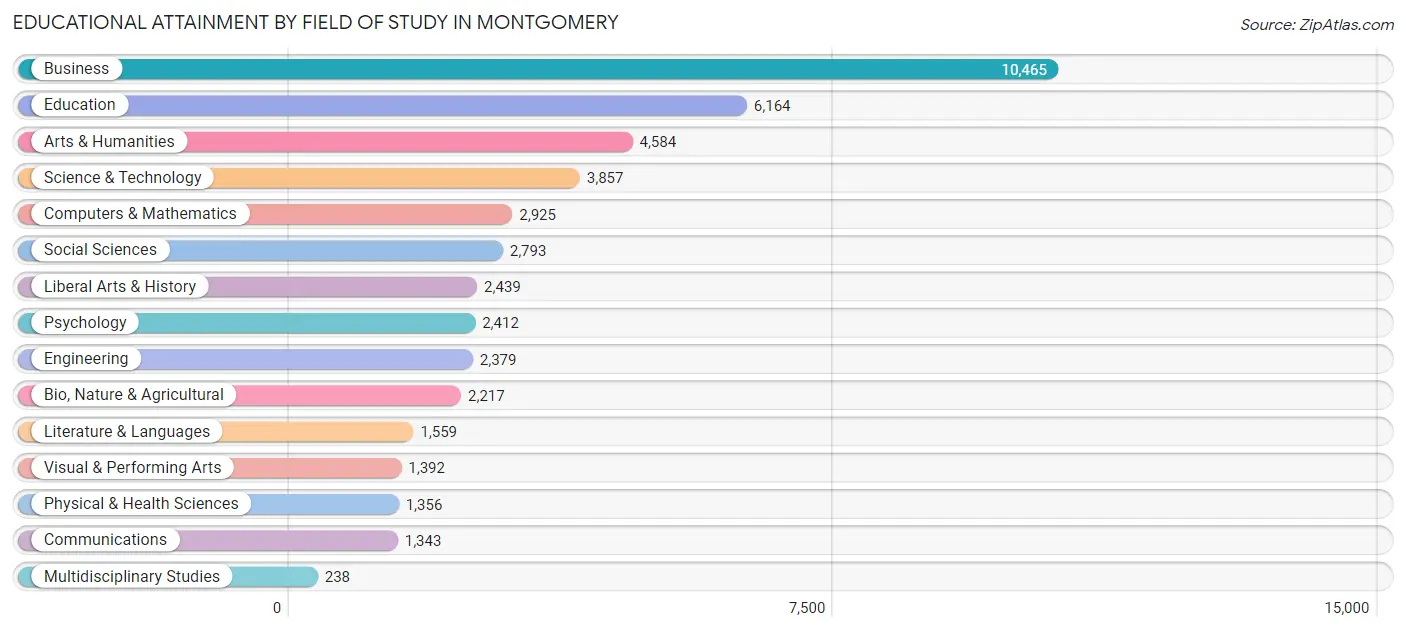
| Field of Study | # Graduates | % Graduates |
| Computers & Mathematics | 2,925 | 6.3% |
| Bio, Nature & Agricultural | 2,217 | 4.8% |
| Physical & Health Sciences | 1,356 | 2.9% |
| Psychology | 2,412 | 5.2% |
| Social Sciences | 2,793 | 6.1% |
| Engineering | 2,379 | 5.2% |
| Multidisciplinary Studies | 238 | 0.5% |
| Science & Technology | 3,857 | 8.4% |
| Business | 10,465 | 22.7% |
| Education | 6,164 | 13.4% |
| Literature & Languages | 1,559 | 3.4% |
| Liberal Arts & History | 2,439 | 5.3% |
| Visual & Performing Arts | 1,392 | 3.0% |
| Communications | 1,343 | 2.9% |
| Arts & Humanities | 4,584 | 9.9% |
| Total | 46,123 | 100.0% |
Transportation & Commute in Montgomery
Vehicle Availability by Sex in Montgomery
The most prevalent vehicle ownership categories in Montgomery are males with 2 vehicles (15,760, accounting for 38.6%) and females with 2 vehicles (16,344, making up 36.3%).
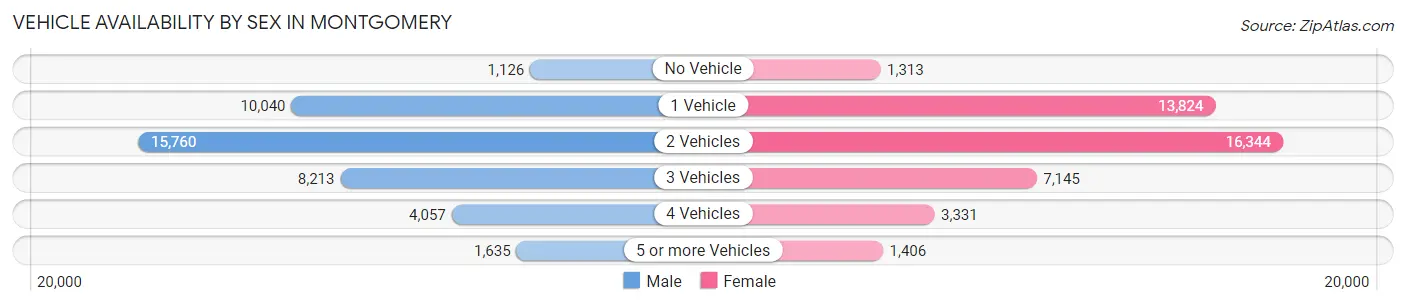
| Vehicles Available | Male | Female |
| No Vehicle | 1,126 (2.8%) | 1,313 (3.0%) |
| 1 Vehicle | 10,040 (24.6%) | 13,824 (31.9%) |
| 2 Vehicles | 15,760 (38.6%) | 16,344 (37.7%) |
| 3 Vehicles | 8,213 (20.1%) | 7,145 (16.5%) |
| 4 Vehicles | 4,057 (9.9%) | 3,331 (7.7%) |
| 5 or more Vehicles | 1,635 (4.0%) | 1,406 (3.2%) |
| Total | 40,831 (100.0%) | 43,363 (100.0%) |
Commute Time in Montgomery
The most frequently occuring commute durations in Montgomery are 15 to 19 minutes (20,052 commuters, 25.1%), 20 to 24 minutes (16,259 commuters, 20.3%), and 10 to 14 minutes (15,548 commuters, 19.4%).
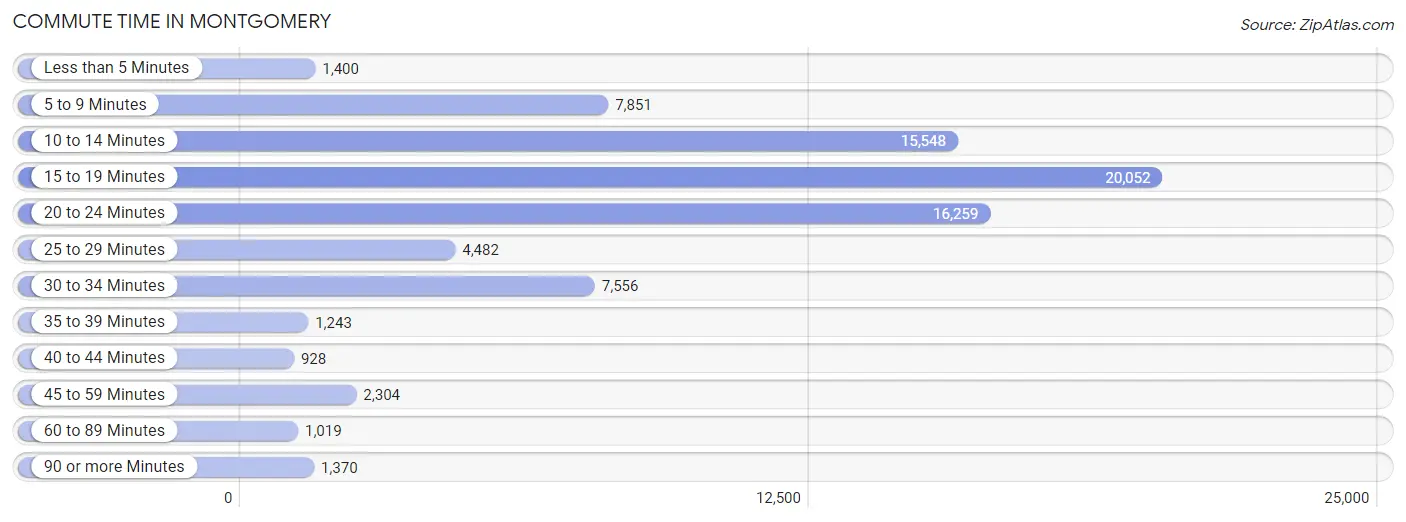
| Commute Time | # Commuters | % Commuters |
| Less than 5 Minutes | 1,400 | 1.8% |
| 5 to 9 Minutes | 7,851 | 9.8% |
| 10 to 14 Minutes | 15,548 | 19.4% |
| 15 to 19 Minutes | 20,052 | 25.1% |
| 20 to 24 Minutes | 16,259 | 20.3% |
| 25 to 29 Minutes | 4,482 | 5.6% |
| 30 to 34 Minutes | 7,556 | 9.4% |
| 35 to 39 Minutes | 1,243 | 1.5% |
| 40 to 44 Minutes | 928 | 1.2% |
| 45 to 59 Minutes | 2,304 | 2.9% |
| 60 to 89 Minutes | 1,019 | 1.3% |
| 90 or more Minutes | 1,370 | 1.7% |
Commute Time by Sex in Montgomery
The most common commute times in Montgomery are 15 to 19 minutes (9,757 commuters, 24.8%) for males and 15 to 19 minutes (10,295 commuters, 25.3%) for females.
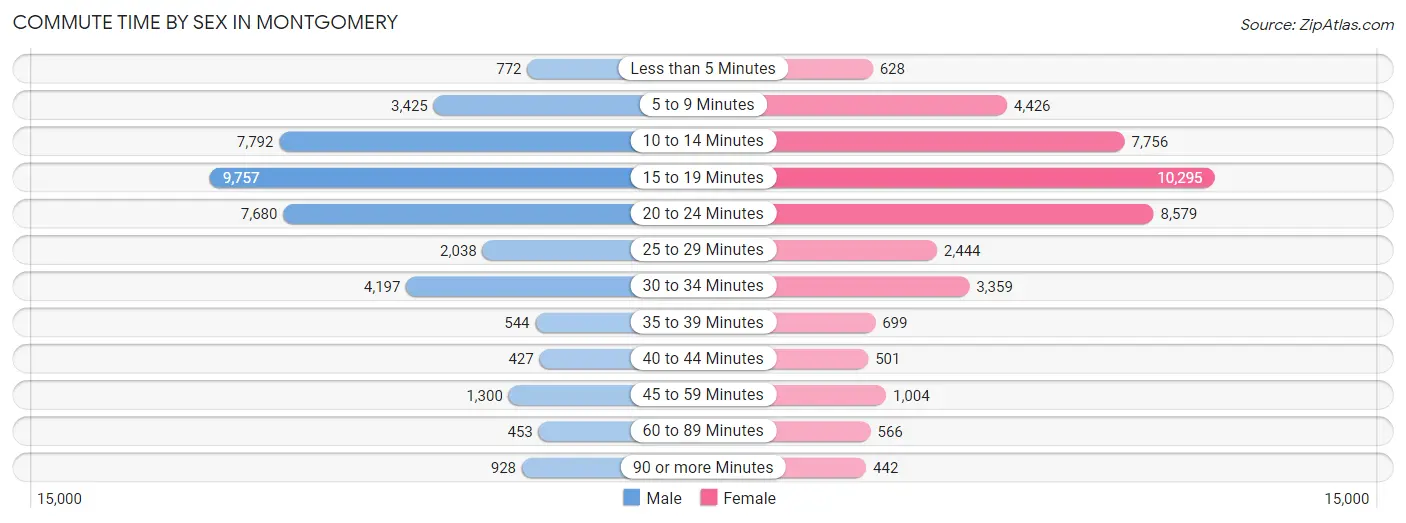
| Commute Time | Male | Female |
| Less than 5 Minutes | 772 (2.0%) | 628 (1.5%) |
| 5 to 9 Minutes | 3,425 (8.7%) | 4,426 (10.9%) |
| 10 to 14 Minutes | 7,792 (19.8%) | 7,756 (19.1%) |
| 15 to 19 Minutes | 9,757 (24.8%) | 10,295 (25.3%) |
| 20 to 24 Minutes | 7,680 (19.5%) | 8,579 (21.1%) |
| 25 to 29 Minutes | 2,038 (5.2%) | 2,444 (6.0%) |
| 30 to 34 Minutes | 4,197 (10.7%) | 3,359 (8.3%) |
| 35 to 39 Minutes | 544 (1.4%) | 699 (1.7%) |
| 40 to 44 Minutes | 427 (1.1%) | 501 (1.2%) |
| 45 to 59 Minutes | 1,300 (3.3%) | 1,004 (2.5%) |
| 60 to 89 Minutes | 453 (1.1%) | 566 (1.4%) |
| 90 or more Minutes | 928 (2.4%) | 442 (1.1%) |
Time of Departure to Work by Sex in Montgomery
The most frequent times of departure to work in Montgomery are 7:30 AM to 7:59 AM (4,785, 12.2%) for males and 7:00 AM to 7:29 AM (7,103, 17.4%) for females.
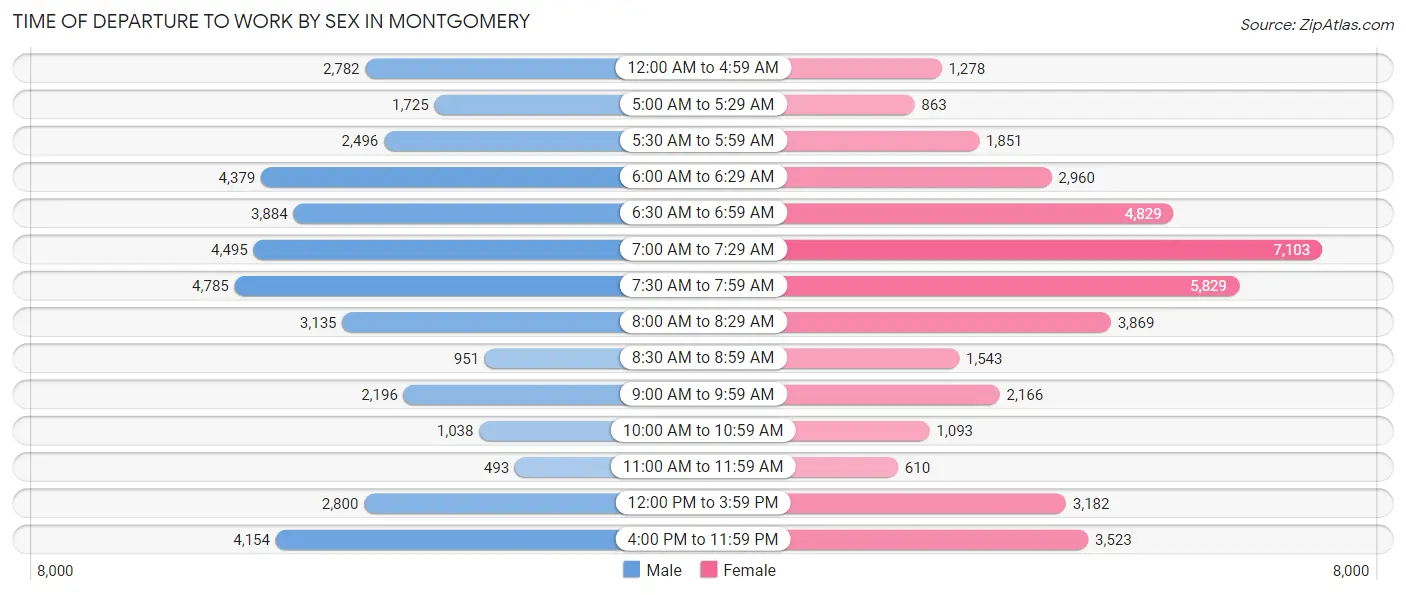
| Time of Departure | Male | Female |
| 12:00 AM to 4:59 AM | 2,782 (7.1%) | 1,278 (3.1%) |
| 5:00 AM to 5:29 AM | 1,725 (4.4%) | 863 (2.1%) |
| 5:30 AM to 5:59 AM | 2,496 (6.4%) | 1,851 (4.5%) |
| 6:00 AM to 6:29 AM | 4,379 (11.1%) | 2,960 (7.3%) |
| 6:30 AM to 6:59 AM | 3,884 (9.9%) | 4,829 (11.9%) |
| 7:00 AM to 7:29 AM | 4,495 (11.4%) | 7,103 (17.4%) |
| 7:30 AM to 7:59 AM | 4,785 (12.2%) | 5,829 (14.3%) |
| 8:00 AM to 8:29 AM | 3,135 (8.0%) | 3,869 (9.5%) |
| 8:30 AM to 8:59 AM | 951 (2.4%) | 1,543 (3.8%) |
| 9:00 AM to 9:59 AM | 2,196 (5.6%) | 2,166 (5.3%) |
| 10:00 AM to 10:59 AM | 1,038 (2.6%) | 1,093 (2.7%) |
| 11:00 AM to 11:59 AM | 493 (1.3%) | 610 (1.5%) |
| 12:00 PM to 3:59 PM | 2,800 (7.1%) | 3,182 (7.8%) |
| 4:00 PM to 11:59 PM | 4,154 (10.6%) | 3,523 (8.7%) |
| Total | 39,313 (100.0%) | 40,699 (100.0%) |
Housing Occupancy in Montgomery
Occupancy by Ownership in Montgomery
Of the total 79,489 dwellings in Montgomery, owner-occupied units account for 42,542 (53.5%), while renter-occupied units make up 36,947 (46.5%).
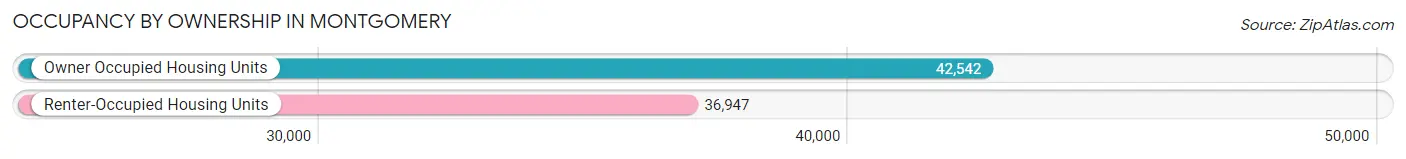
| Occupancy | # Housing Units | % Housing Units |
| Owner Occupied Housing Units | 42,542 | 53.5% |
| Renter-Occupied Housing Units | 36,947 | 46.5% |
| Total Occupied Housing Units | 79,489 | 100.0% |
Occupancy by Household Size in Montgomery
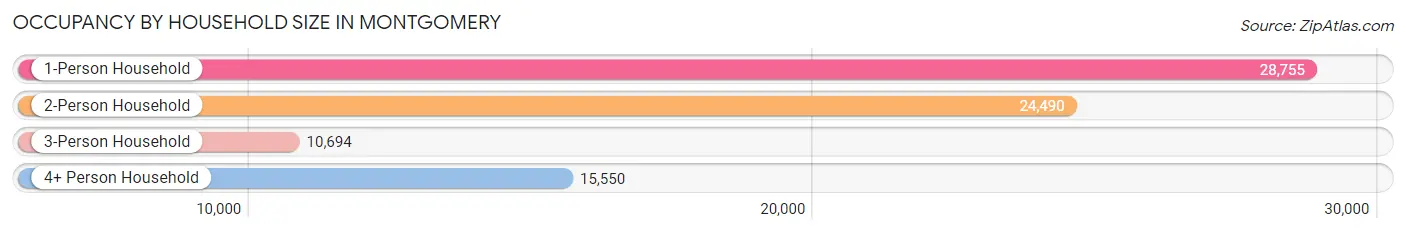
| Household Size | # Housing Units | % Housing Units |
| 1-Person Household | 28,755 | 36.2% |
| 2-Person Household | 24,490 | 30.8% |
| 3-Person Household | 10,694 | 13.5% |
| 4+ Person Household | 15,550 | 19.6% |
| Total Housing Units | 79,489 | 100.0% |
Occupancy by Ownership by Household Size in Montgomery
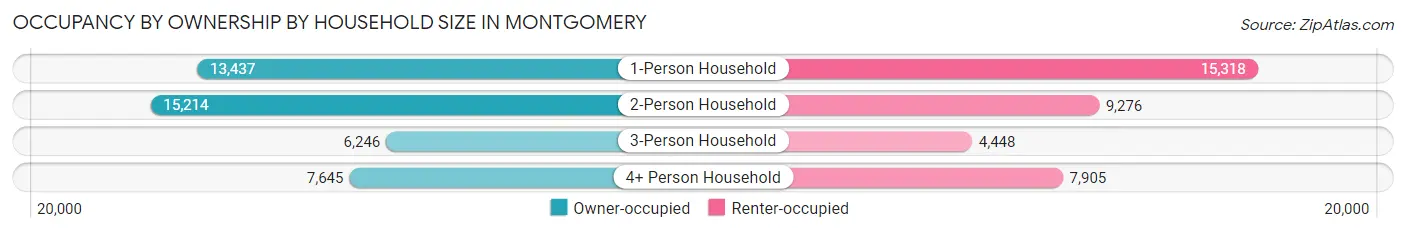
| Household Size | Owner-occupied | Renter-occupied |
| 1-Person Household | 13,437 (46.7%) | 15,318 (53.3%) |
| 2-Person Household | 15,214 (62.1%) | 9,276 (37.9%) |
| 3-Person Household | 6,246 (58.4%) | 4,448 (41.6%) |
| 4+ Person Household | 7,645 (49.2%) | 7,905 (50.8%) |
| Total Housing Units | 42,542 (53.5%) | 36,947 (46.5%) |
Occupancy by Educational Attainment in Montgomery
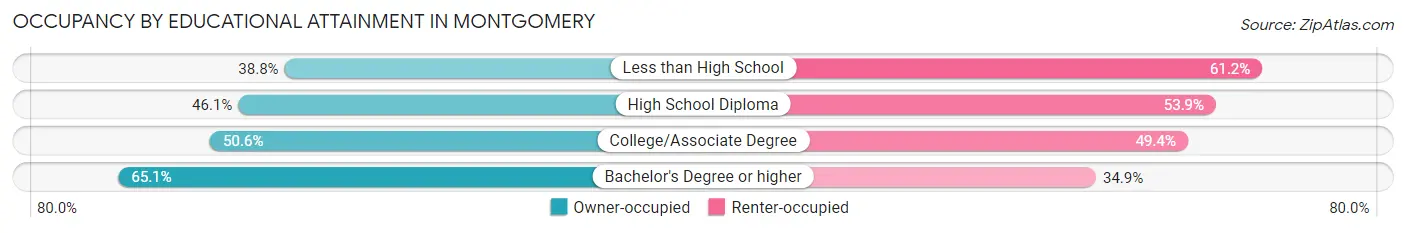
| Household Size | Owner-occupied | Renter-occupied |
| Less than High School | 3,205 (38.8%) | 5,057 (61.2%) |
| High School Diploma | 8,474 (46.1%) | 9,894 (53.9%) |
| College/Associate Degree | 12,392 (50.6%) | 12,103 (49.4%) |
| Bachelor's Degree or higher | 18,471 (65.1%) | 9,893 (34.9%) |
Occupancy by Age of Householder in Montgomery
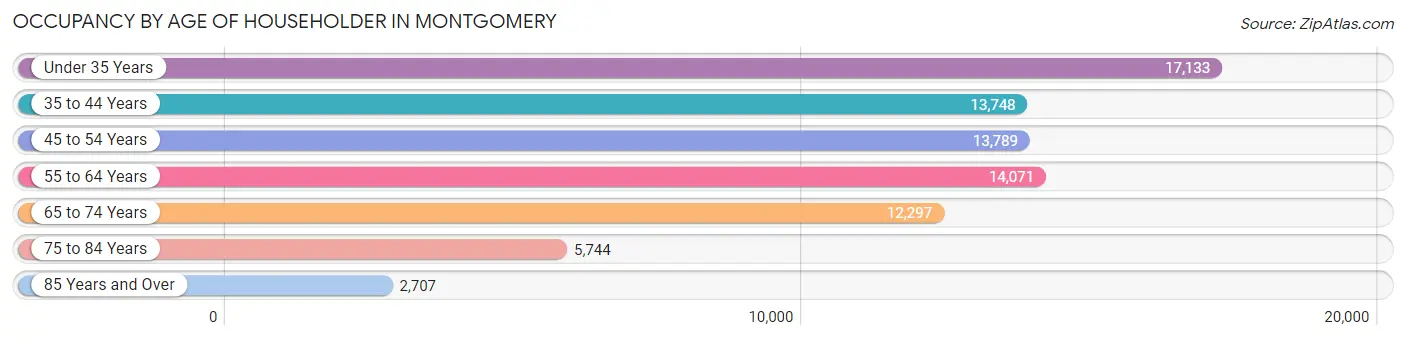
| Age Bracket | # Households | % Households |
| Under 35 Years | 17,133 | 21.5% |
| 35 to 44 Years | 13,748 | 17.3% |
| 45 to 54 Years | 13,789 | 17.3% |
| 55 to 64 Years | 14,071 | 17.7% |
| 65 to 74 Years | 12,297 | 15.5% |
| 75 to 84 Years | 5,744 | 7.2% |
| 85 Years and Over | 2,707 | 3.4% |
| Total | 79,489 | 100.0% |
Housing Finances in Montgomery
Median Income by Occupancy in Montgomery
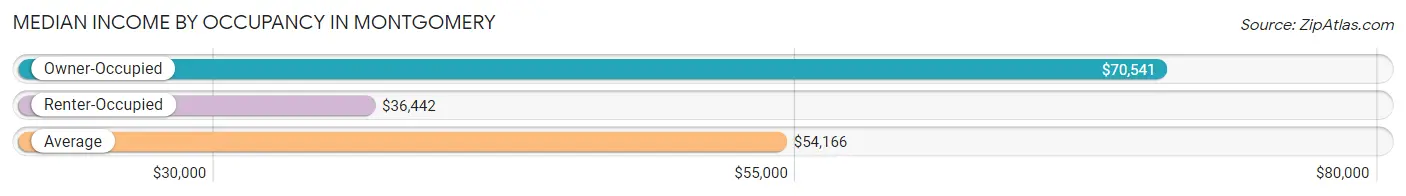
| Occupancy Type | # Households | Median Income |
| Owner-Occupied | 42,542 (53.5%) | $70,541 |
| Renter-Occupied | 36,947 (46.5%) | $36,442 |
| Average | 79,489 (100.0%) | $54,166 |
Occupancy by Householder Income Bracket in Montgomery
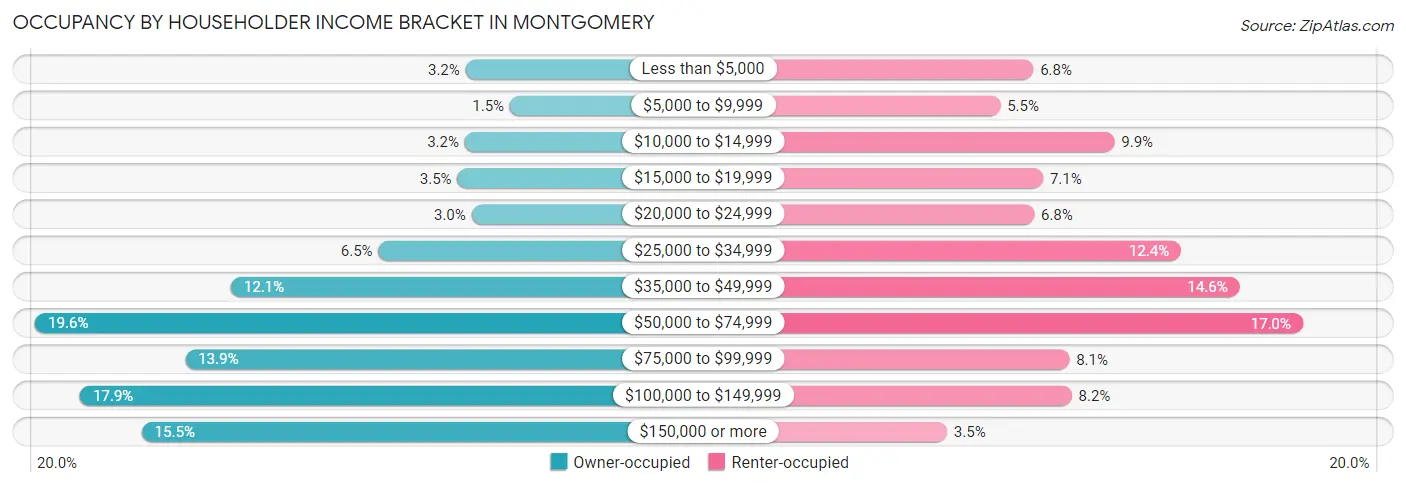
| Income Bracket | Owner-occupied | Renter-occupied |
| Less than $5,000 | 1,363 (3.2%) | 2,501 (6.8%) |
| $5,000 to $9,999 | 642 (1.5%) | 2,036 (5.5%) |
| $10,000 to $14,999 | 1,375 (3.2%) | 3,642 (9.9%) |
| $15,000 to $19,999 | 1,495 (3.5%) | 2,638 (7.1%) |
| $20,000 to $24,999 | 1,264 (3.0%) | 2,513 (6.8%) |
| $25,000 to $34,999 | 2,773 (6.5%) | 4,583 (12.4%) |
| $35,000 to $49,999 | 5,164 (12.1%) | 5,405 (14.6%) |
| $50,000 to $74,999 | 8,340 (19.6%) | 6,296 (17.0%) |
| $75,000 to $99,999 | 5,906 (13.9%) | 3,006 (8.1%) |
| $100,000 to $149,999 | 7,611 (17.9%) | 3,041 (8.2%) |
| $150,000 or more | 6,609 (15.5%) | 1,286 (3.5%) |
| Total | 42,542 (100.0%) | 36,947 (100.0%) |
Monthly Housing Cost Tiers in Montgomery
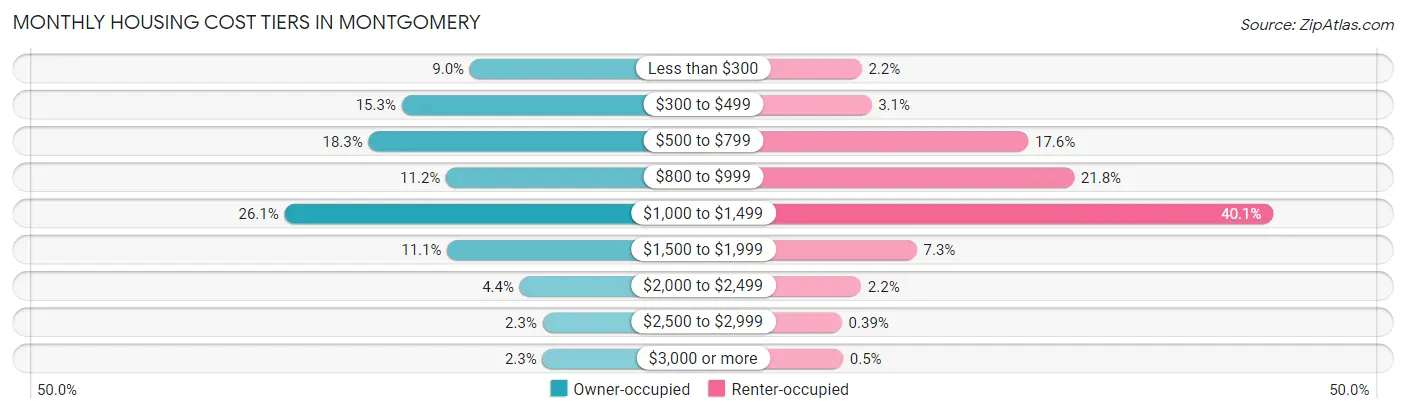
| Monthly Cost | Owner-occupied | Renter-occupied |
| Less than $300 | 3,830 (9.0%) | 818 (2.2%) |
| $300 to $499 | 6,502 (15.3%) | 1,149 (3.1%) |
| $500 to $799 | 7,803 (18.3%) | 6,486 (17.5%) |
| $800 to $999 | 4,760 (11.2%) | 8,043 (21.8%) |
| $1,000 to $1,499 | 11,089 (26.1%) | 14,823 (40.1%) |
| $1,500 to $1,999 | 4,716 (11.1%) | 2,692 (7.3%) |
| $2,000 to $2,499 | 1,878 (4.4%) | 798 (2.2%) |
| $2,500 to $2,999 | 979 (2.3%) | 143 (0.4%) |
| $3,000 or more | 985 (2.3%) | 185 (0.5%) |
| Total | 42,542 (100.0%) | 36,947 (100.0%) |
Physical Housing Characteristics in Montgomery
Housing Structures in Montgomery
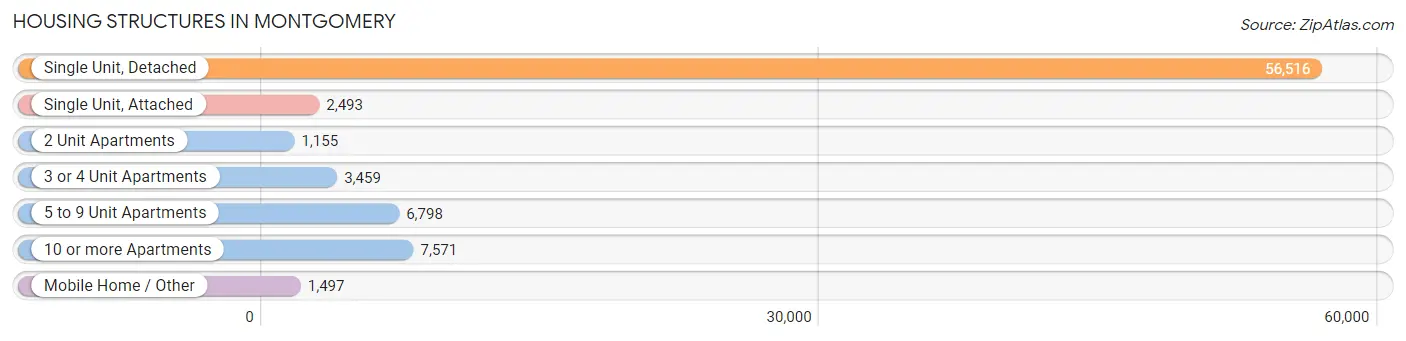
| Structure Type | # Housing Units | % Housing Units |
| Single Unit, Detached | 56,516 | 71.1% |
| Single Unit, Attached | 2,493 | 3.1% |
| 2 Unit Apartments | 1,155 | 1.5% |
| 3 or 4 Unit Apartments | 3,459 | 4.3% |
| 5 to 9 Unit Apartments | 6,798 | 8.6% |
| 10 or more Apartments | 7,571 | 9.5% |
| Mobile Home / Other | 1,497 | 1.9% |
| Total | 79,489 | 100.0% |
Housing Structures by Occupancy in Montgomery
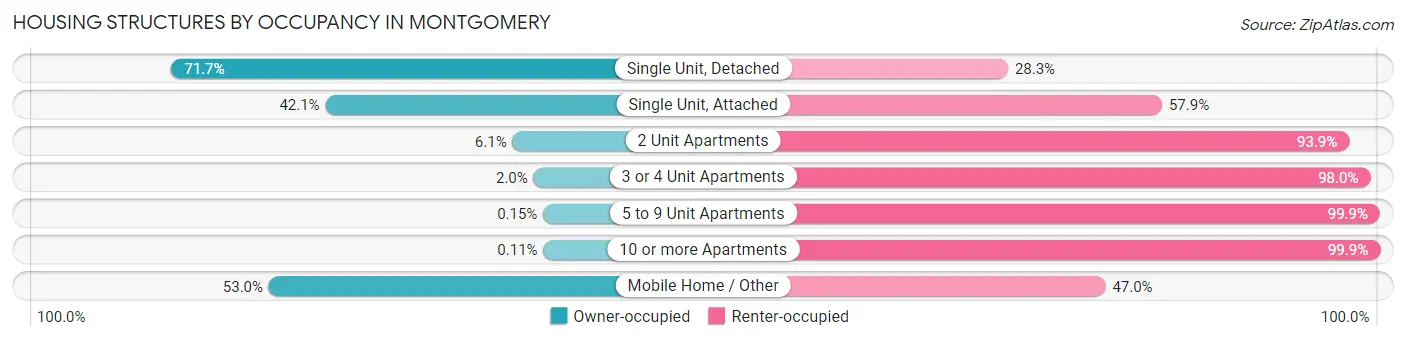
| Structure Type | Owner-occupied | Renter-occupied |
| Single Unit, Detached | 40,543 (71.7%) | 15,973 (28.3%) |
| Single Unit, Attached | 1,049 (42.1%) | 1,444 (57.9%) |
| 2 Unit Apartments | 70 (6.1%) | 1,085 (93.9%) |
| 3 or 4 Unit Apartments | 69 (2.0%) | 3,390 (98.0%) |
| 5 to 9 Unit Apartments | 10 (0.2%) | 6,788 (99.9%) |
| 10 or more Apartments | 8 (0.1%) | 7,563 (99.9%) |
| Mobile Home / Other | 793 (53.0%) | 704 (47.0%) |
| Total | 42,542 (53.5%) | 36,947 (46.5%) |
Housing Structures by Number of Rooms in Montgomery
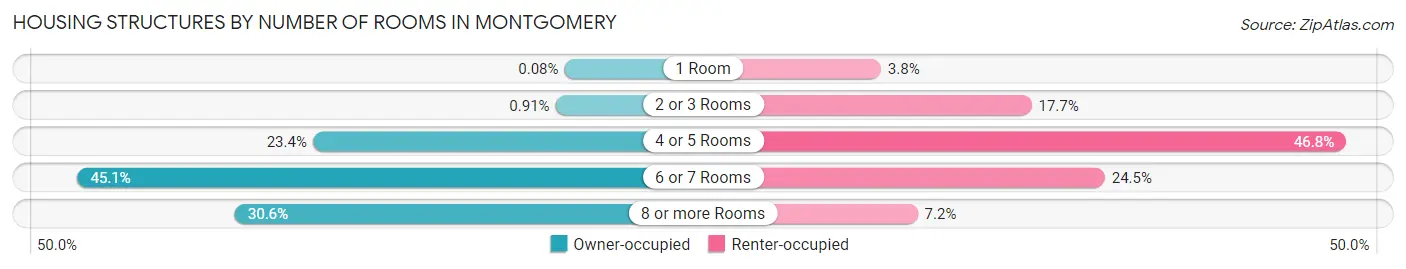
| Number of Rooms | Owner-occupied | Renter-occupied |
| 1 Room | 34 (0.1%) | 1,400 (3.8%) |
| 2 or 3 Rooms | 388 (0.9%) | 6,548 (17.7%) |
| 4 or 5 Rooms | 9,935 (23.4%) | 17,290 (46.8%) |
| 6 or 7 Rooms | 19,189 (45.1%) | 9,053 (24.5%) |
| 8 or more Rooms | 12,996 (30.5%) | 2,656 (7.2%) |
| Total | 42,542 (100.0%) | 36,947 (100.0%) |
Housing Structure by Heating Type in Montgomery
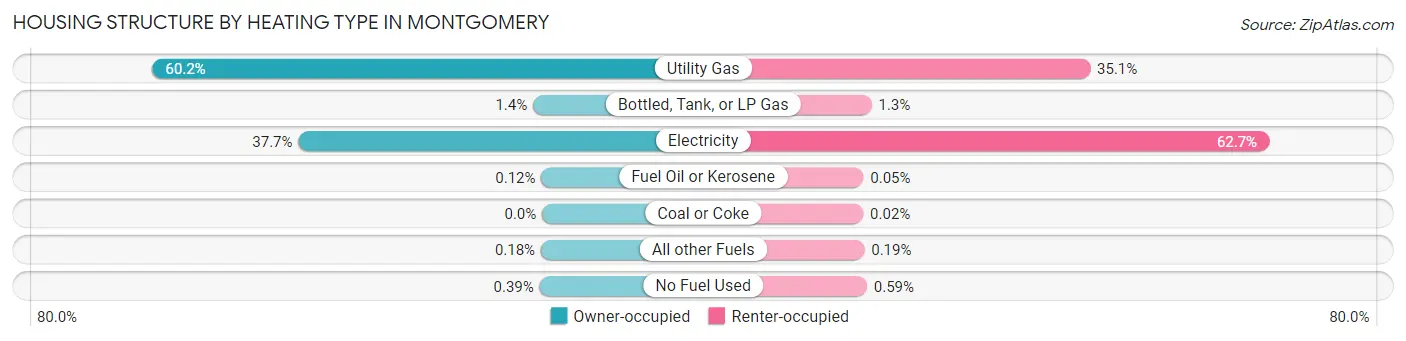
| Heating Type | Owner-occupied | Renter-occupied |
| Utility Gas | 25,626 (60.2%) | 12,968 (35.1%) |
| Bottled, Tank, or LP Gas | 595 (1.4%) | 483 (1.3%) |
| Electricity | 16,030 (37.7%) | 23,179 (62.7%) |
| Fuel Oil or Kerosene | 49 (0.1%) | 20 (0.1%) |
| Coal or Coke | 0 (0.0%) | 8 (0.0%) |
| All other Fuels | 75 (0.2%) | 72 (0.2%) |
| No Fuel Used | 167 (0.4%) | 217 (0.6%) |
| Total | 42,542 (100.0%) | 36,947 (100.0%) |
Household Vehicle Usage in Montgomery
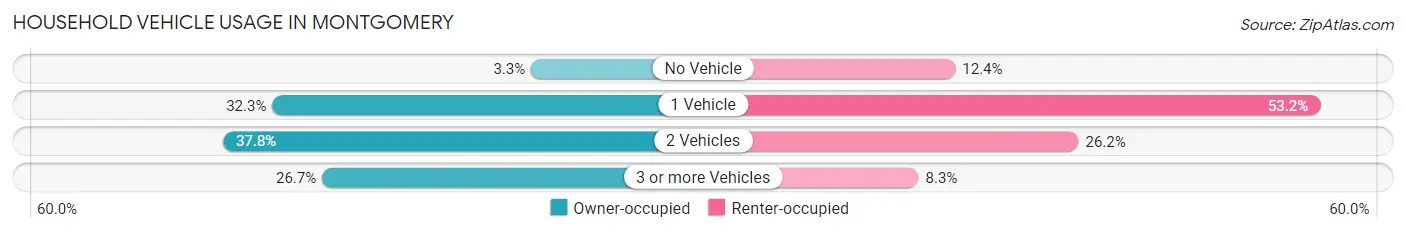
| Vehicles per Household | Owner-occupied | Renter-occupied |
| No Vehicle | 1,390 (3.3%) | 4,569 (12.4%) |
| 1 Vehicle | 13,726 (32.3%) | 19,661 (53.2%) |
| 2 Vehicles | 16,074 (37.8%) | 9,668 (26.2%) |
| 3 or more Vehicles | 11,352 (26.7%) | 3,049 (8.3%) |
| Total | 42,542 (100.0%) | 36,947 (100.0%) |
Real Estate & Mortgages in Montgomery
Real Estate and Mortgage Overview in Montgomery
| Characteristic | Without Mortgage | With Mortgage |
| Housing Units | 15,423 | 27,119 |
| Median Property Value | $116,700 | $152,800 |
| Median Household Income | $56,750 | $4,907 |
| Monthly Housing Costs | $425 | $970 |
| Real Estate Taxes | $462 | $3,073 |
Property Value by Mortgage Status in Montgomery
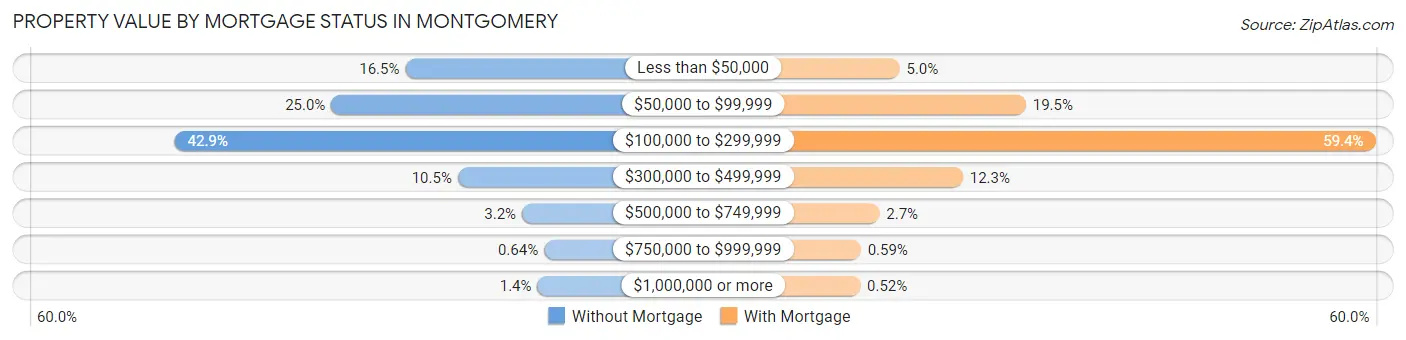
| Property Value | Without Mortgage | With Mortgage |
| Less than $50,000 | 2,543 (16.5%) | 1,364 (5.0%) |
| $50,000 to $99,999 | 3,850 (25.0%) | 5,278 (19.5%) |
| $100,000 to $299,999 | 6,609 (42.8%) | 16,112 (59.4%) |
| $300,000 to $499,999 | 1,619 (10.5%) | 3,325 (12.3%) |
| $500,000 to $749,999 | 488 (3.2%) | 738 (2.7%) |
| $750,000 to $999,999 | 98 (0.6%) | 160 (0.6%) |
| $1,000,000 or more | 216 (1.4%) | 142 (0.5%) |
| Total | 15,423 (100.0%) | 27,119 (100.0%) |
Household Income by Mortgage Status in Montgomery
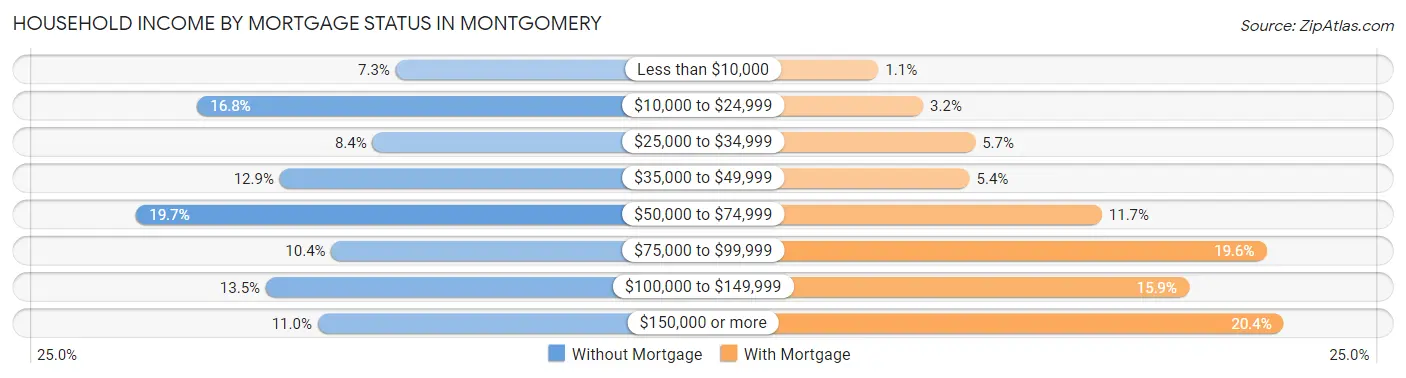
| Household Income | Without Mortgage | With Mortgage |
| Less than $10,000 | 1,131 (7.3%) | 296 (1.1%) |
| $10,000 to $24,999 | 2,587 (16.8%) | 874 (3.2%) |
| $25,000 to $34,999 | 1,300 (8.4%) | 1,547 (5.7%) |
| $35,000 to $49,999 | 1,982 (12.9%) | 1,473 (5.4%) |
| $50,000 to $74,999 | 3,036 (19.7%) | 3,182 (11.7%) |
| $75,000 to $99,999 | 1,602 (10.4%) | 5,304 (19.6%) |
| $100,000 to $149,999 | 2,083 (13.5%) | 4,304 (15.9%) |
| $150,000 or more | 1,702 (11.0%) | 5,528 (20.4%) |
| Total | 15,423 (100.0%) | 27,119 (100.0%) |
Property Value to Household Income Ratio in Montgomery
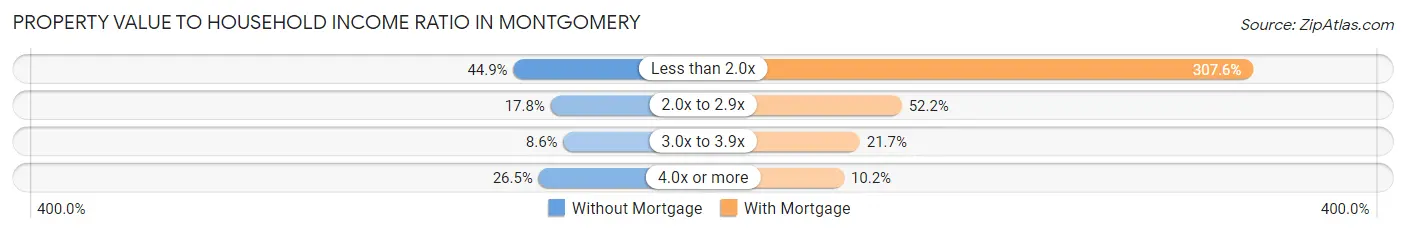
| Value-to-Income Ratio | Without Mortgage | With Mortgage |
| Less than 2.0x | 6,921 (44.9%) | 83,412 (307.6%) |
| 2.0x to 2.9x | 2,748 (17.8%) | 14,142 (52.1%) |
| 3.0x to 3.9x | 1,321 (8.6%) | 5,881 (21.7%) |
| 4.0x or more | 4,090 (26.5%) | 2,767 (10.2%) |
| Total | 15,423 (100.0%) | 27,119 (100.0%) |
Real Estate Taxes by Mortgage Status in Montgomery
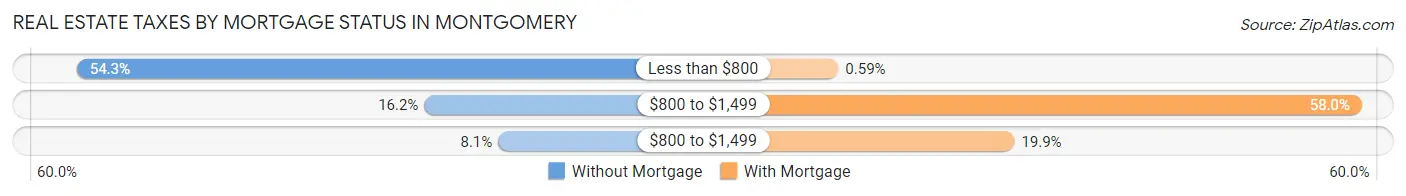
| Property Taxes | Without Mortgage | With Mortgage |
| Less than $800 | 8,372 (54.3%) | 160 (0.6%) |
| $800 to $1,499 | 2,500 (16.2%) | 15,716 (58.0%) |
| $800 to $1,499 | 1,251 (8.1%) | 5,390 (19.9%) |
| Total | 15,423 (100.0%) | 27,119 (100.0%) |
Health & Disability in Montgomery
Health Insurance Coverage by Age in Montgomery
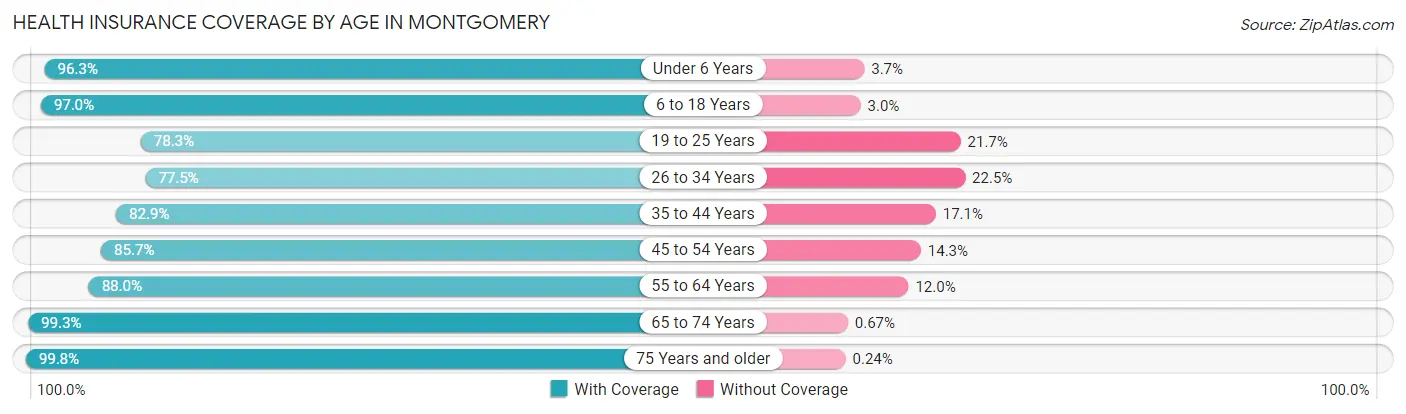
| Age Bracket | With Coverage | Without Coverage |
| Under 6 Years | 15,133 (96.3%) | 587 (3.7%) |
| 6 to 18 Years | 33,776 (97.0%) | 1,059 (3.0%) |
| 19 to 25 Years | 15,810 (78.3%) | 4,380 (21.7%) |
| 26 to 34 Years | 19,040 (77.5%) | 5,542 (22.5%) |
| 35 to 44 Years | 19,754 (82.9%) | 4,067 (17.1%) |
| 45 to 54 Years | 19,305 (85.7%) | 3,215 (14.3%) |
| 55 to 64 Years | 20,882 (88.0%) | 2,839 (12.0%) |
| 65 to 74 Years | 17,739 (99.3%) | 120 (0.7%) |
| 75 Years and older | 11,683 (99.8%) | 28 (0.2%) |
| Total | 173,122 (88.8%) | 21,837 (11.2%) |
Health Insurance Coverage by Citizenship Status in Montgomery
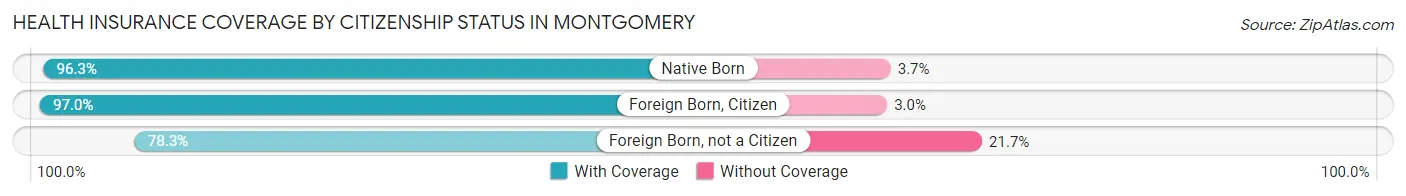
| Citizenship Status | With Coverage | Without Coverage |
| Native Born | 15,133 (96.3%) | 587 (3.7%) |
| Foreign Born, Citizen | 33,776 (97.0%) | 1,059 (3.0%) |
| Foreign Born, not a Citizen | 15,810 (78.3%) | 4,380 (21.7%) |
Health Insurance Coverage by Household Income in Montgomery
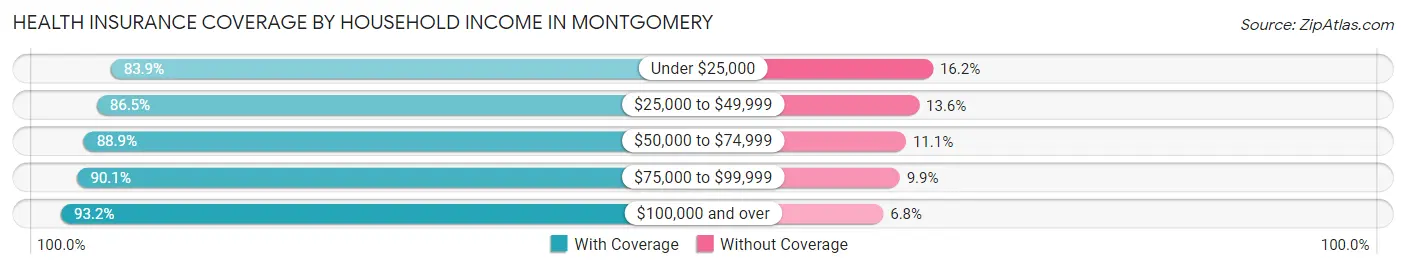
| Household Income | With Coverage | Without Coverage |
| Under $25,000 | 30,340 (83.9%) | 5,843 (16.2%) |
| $25,000 to $49,999 | 35,936 (86.5%) | 5,634 (13.6%) |
| $50,000 to $74,999 | 29,349 (88.9%) | 3,661 (11.1%) |
| $75,000 to $99,999 | 21,892 (90.1%) | 2,407 (9.9%) |
| $100,000 and over | 52,124 (93.2%) | 3,830 (6.8%) |
Public vs Private Health Insurance Coverage by Age in Montgomery
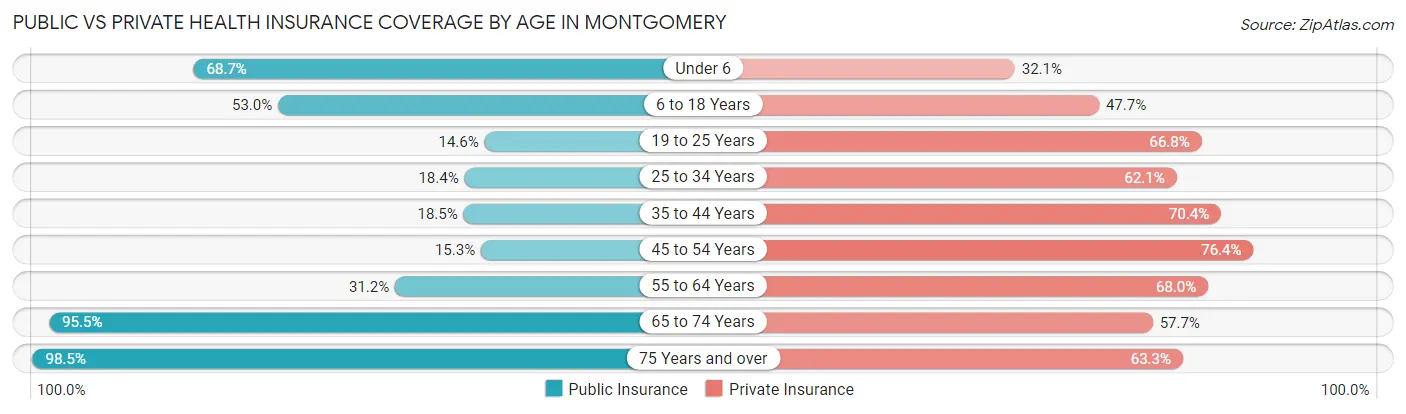
| Age Bracket | Public Insurance | Private Insurance |
| Under 6 | 10,791 (68.6%) | 5,048 (32.1%) |
| 6 to 18 Years | 18,447 (53.0%) | 16,629 (47.7%) |
| 19 to 25 Years | 2,954 (14.6%) | 13,480 (66.8%) |
| 25 to 34 Years | 4,511 (18.3%) | 15,272 (62.1%) |
| 35 to 44 Years | 4,412 (18.5%) | 16,769 (70.4%) |
| 45 to 54 Years | 3,443 (15.3%) | 17,202 (76.4%) |
| 55 to 64 Years | 7,410 (31.2%) | 16,124 (68.0%) |
| 65 to 74 Years | 17,047 (95.5%) | 10,306 (57.7%) |
| 75 Years and over | 11,537 (98.5%) | 7,411 (63.3%) |
| Total | 80,552 (41.3%) | 118,241 (60.7%) |
Disability Status by Sex by Age in Montgomery
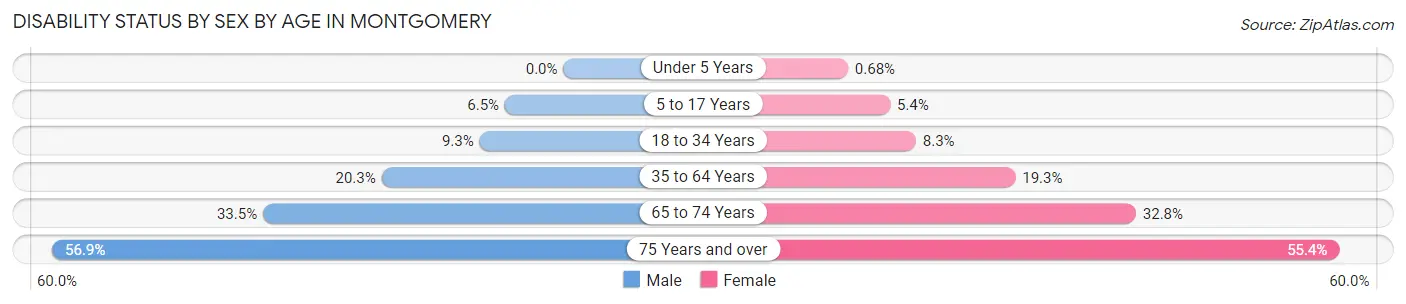
| Age Bracket | Male | Female |
| Under 5 Years | 0 (0.0%) | 44 (0.7%) |
| 5 to 17 Years | 1,122 (6.5%) | 900 (5.4%) |
| 18 to 34 Years | 2,136 (9.3%) | 2,076 (8.3%) |
| 35 to 64 Years | 6,285 (20.3%) | 7,539 (19.3%) |
| 65 to 74 Years | 2,530 (33.5%) | 3,372 (32.8%) |
| 75 Years and over | 2,508 (56.9%) | 4,047 (55.4%) |
Disability Class by Sex by Age in Montgomery
Disability Class: Hearing Difficulty
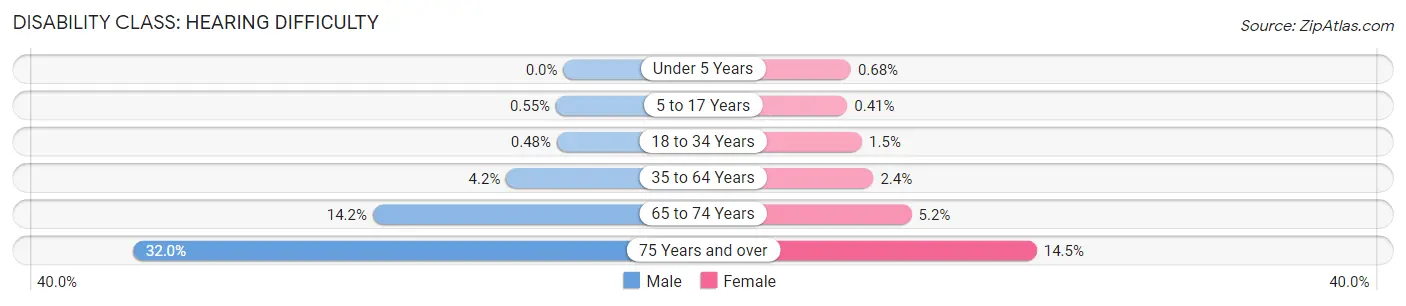
| Age Bracket | Male | Female |
| Under 5 Years | 0 (0.0%) | 44 (0.7%) |
| 5 to 17 Years | 94 (0.5%) | 69 (0.4%) |
| 18 to 34 Years | 110 (0.5%) | 380 (1.5%) |
| 35 to 64 Years | 1,316 (4.2%) | 917 (2.4%) |
| 65 to 74 Years | 1,070 (14.1%) | 533 (5.2%) |
| 75 Years and over | 1,408 (32.0%) | 1,058 (14.5%) |
Disability Class: Vision Difficulty
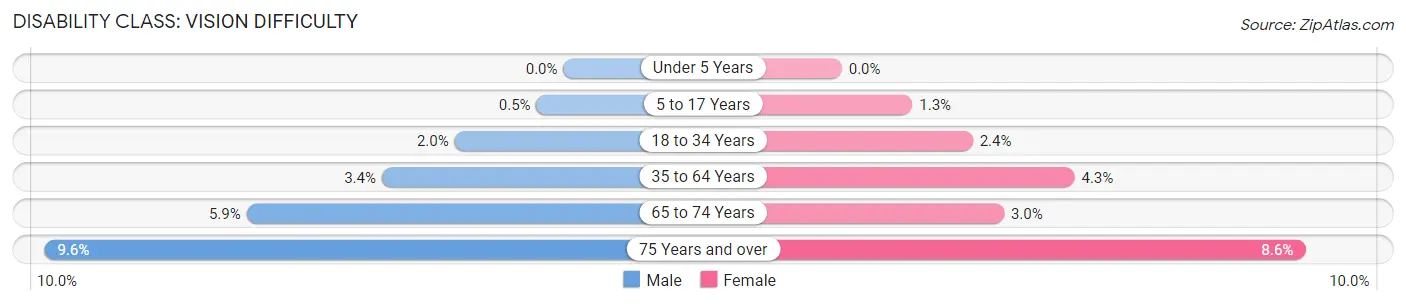
| Age Bracket | Male | Female |
| Under 5 Years | 0 (0.0%) | 0 (0.0%) |
| 5 to 17 Years | 87 (0.5%) | 220 (1.3%) |
| 18 to 34 Years | 463 (2.0%) | 612 (2.4%) |
| 35 to 64 Years | 1,047 (3.4%) | 1,685 (4.3%) |
| 65 to 74 Years | 445 (5.9%) | 310 (3.0%) |
| 75 Years and over | 424 (9.6%) | 628 (8.6%) |
Disability Class: Cognitive Difficulty
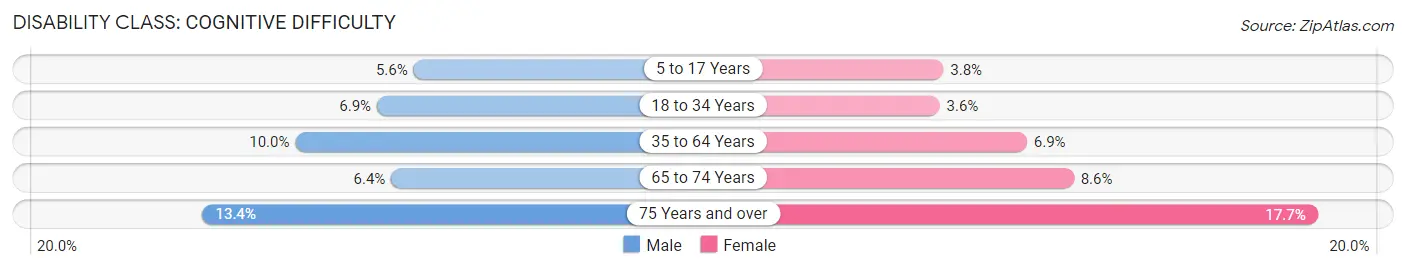
| Age Bracket | Male | Female |
| 5 to 17 Years | 959 (5.6%) | 632 (3.8%) |
| 18 to 34 Years | 1,585 (6.9%) | 915 (3.6%) |
| 35 to 64 Years | 3,089 (10.0%) | 2,680 (6.9%) |
| 65 to 74 Years | 483 (6.4%) | 886 (8.6%) |
| 75 Years and over | 590 (13.4%) | 1,290 (17.7%) |
Disability Class: Ambulatory Difficulty
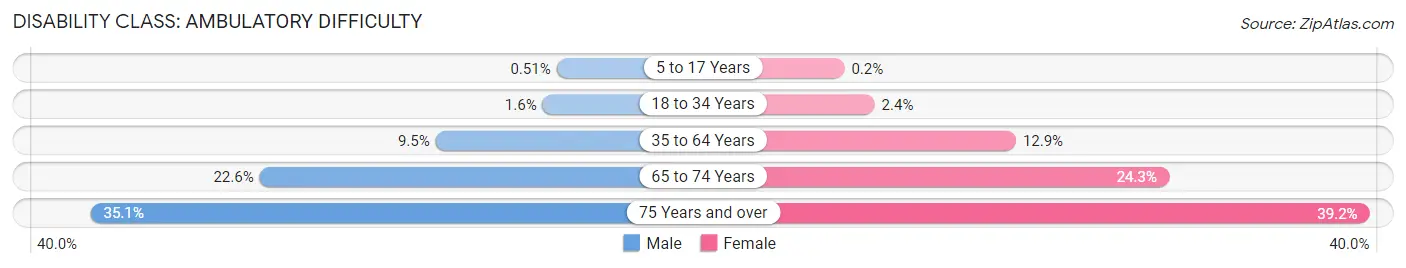
| Age Bracket | Male | Female |
| 5 to 17 Years | 88 (0.5%) | 33 (0.2%) |
| 18 to 34 Years | 355 (1.5%) | 613 (2.4%) |
| 35 to 64 Years | 2,945 (9.5%) | 5,045 (12.9%) |
| 65 to 74 Years | 1,706 (22.6%) | 2,499 (24.3%) |
| 75 Years and over | 1,546 (35.1%) | 2,862 (39.2%) |
Disability Class: Self-Care Difficulty
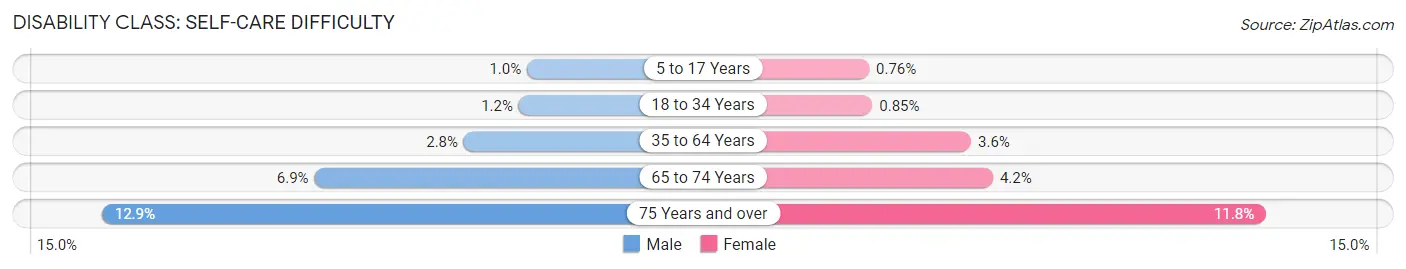
| Age Bracket | Male | Female |
| 5 to 17 Years | 175 (1.0%) | 127 (0.8%) |
| 18 to 34 Years | 283 (1.2%) | 214 (0.9%) |
| 35 to 64 Years | 859 (2.8%) | 1,407 (3.6%) |
| 65 to 74 Years | 524 (6.9%) | 433 (4.2%) |
| 75 Years and over | 566 (12.9%) | 863 (11.8%) |
Technology Access in Montgomery
Computing Device Access in Montgomery
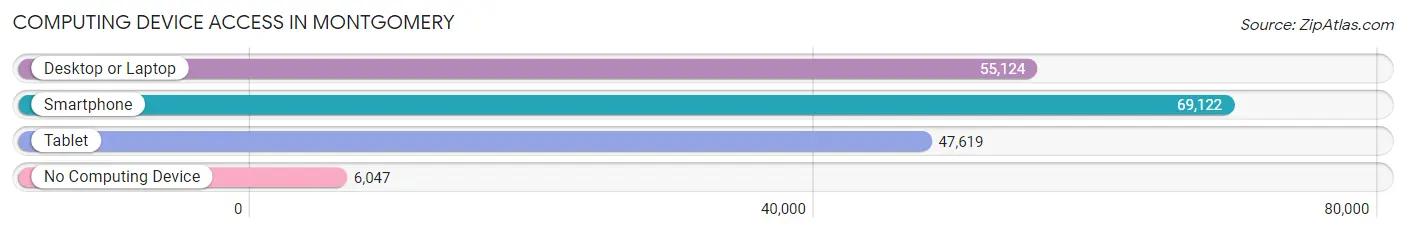
| Device Type | # Households | % Households |
| Desktop or Laptop | 55,124 | 69.4% |
| Smartphone | 69,122 | 87.0% |
| Tablet | 47,619 | 59.9% |
| No Computing Device | 6,047 | 7.6% |
| Total | 79,489 | 100.0% |
Internet Access in Montgomery
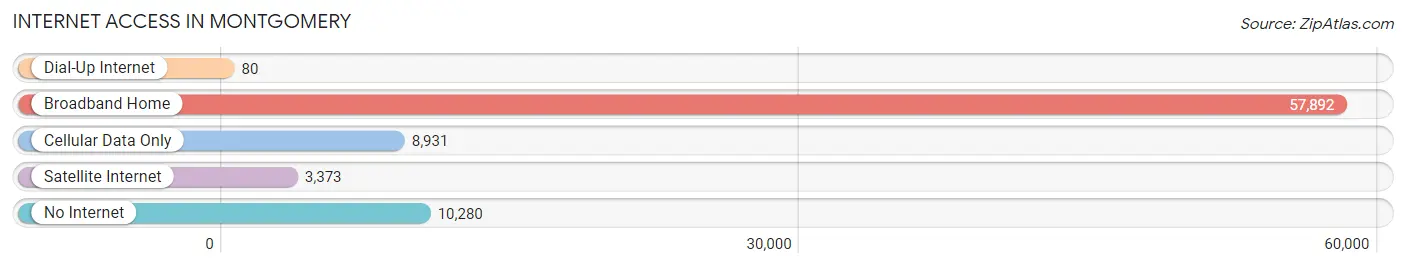
| Internet Type | # Households | % Households |
| Dial-Up Internet | 80 | 0.1% |
| Broadband Home | 57,892 | 72.8% |
| Cellular Data Only | 8,931 | 11.2% |
| Satellite Internet | 3,373 | 4.2% |
| No Internet | 10,280 | 12.9% |
| Total | 79,489 | 100.0% |
Montgomery Summary
Montgomery, Alabama is the capital of the state and the second-largest city in the state. It is located in the southeastern part of the state, along the Alabama River. Montgomery is the county seat of Montgomery County and is part of the Montgomery Metropolitan Statistical Area. The city has a population of 205,764 as of the 2019 U.S. Census.
History
Montgomery was founded in 1819 by Andrew Dexter and John Scott. It was named after Richard Montgomery, an American Revolutionary War hero. The city was incorporated in 1822 and became the state capital in 1846. Montgomery was a major center of the Confederacy during the Civil War and was the site of the signing of the Confederate Constitution in 1861.
Montgomery was a major center of the civil rights movement in the 1950s and 1960s. The city was the site of the Montgomery Bus Boycott, which began in 1955 and lasted for 381 days. The boycott was a protest against the segregation of public buses and was led by Martin Luther King Jr. and other civil rights activists.
Geography
Montgomery is located in the southeastern part of the state, along the Alabama River. The city has a total area of 156.2 square miles, of which 154.2 square miles is land and 2.0 square miles is water. The city is located in the Black Belt region of the state and is part of the Gulf Coastal Plain.
The climate in Montgomery is humid subtropical, with hot, humid summers and mild winters. The average annual temperature is 64.3°F, with an average high of 87.2°F in July and an average low of 41.2°F in January. The average annual precipitation is 56.2 inches.
Economy
Montgomery is a major economic center in the state. The city’s economy is driven by government, education, healthcare, and manufacturing. The city is home to Maxwell Air Force Base, which is the largest employer in the city. Other major employers include Hyundai Motor Manufacturing Alabama, Alabama State University, and Baptist Health.
The city’s unemployment rate was 4.2% in 2019, which is lower than the national average of 3.7%. The median household income in Montgomery is $45,837, which is lower than the national average of $61,937. The cost of living in Montgomery is lower than the national average.
Demographics
As of the 2019 U.S. Census, Montgomery has a population of 205,764. The city has a population density of 1,323 people per square mile. The racial makeup of the city is 54.2% African American, 37.3% White, 2.2% Asian, 0.3% Native American, 0.1% Pacific Islander, and 5.9% from other races.
The median age in Montgomery is 33.7 years, and the city has a gender ratio of 49.3% male and 50.7% female. The city has a poverty rate of 24.2%, which is higher than the national average of 11.8%. The largest religious group in the city is Christianity, with 57.3% of the population identifying as Christian.
Common Questions
What is Per Capita Income in Montgomery?
Per Capita income in Montgomery is $31,549.
What is the Median Family Income in Montgomery?
Median Family Income in Montgomery is $65,774.
What is the Median Household income in Montgomery?
Median Household Income in Montgomery is $54,166.
What is Income or Wage Gap in Montgomery?
Income or Wage Gap in Montgomery is 20.7%.
Women in Montgomery earn 79.3 cents for every dollar earned by a man.
What is Family Income Deficit in Montgomery?
Family Income Deficit in Montgomery is $11,697.
Families that are below poverty line in Montgomery earn $11,697 less on average than the poverty threshold level.
What is Inequality or Gini Index in Montgomery?
Inequality or Gini Index in Montgomery is 0.50.
What is the Total Population of Montgomery?
Total Population of Montgomery is 199,819.
What is the Total Male Population of Montgomery?
Total Male Population of Montgomery is 93,601.
What is the Total Female Population of Montgomery?
Total Female Population of Montgomery is 106,218.
What is the Ratio of Males per 100 Females in Montgomery?
There are 88.12 Males per 100 Females in Montgomery.
What is the Ratio of Females per 100 Males in Montgomery?
There are 113.48 Females per 100 Males in Montgomery.
What is the Median Population Age in Montgomery?
Median Population Age in Montgomery is 36.1 Years.
What is the Average Family Size in Montgomery
Average Family Size in Montgomery is 3.2 People.
What is the Average Household Size in Montgomery
Average Household Size in Montgomery is 2.4 People.
How Large is the Labor Force in Montgomery?
There are 94,353 People in the Labor Forcein in Montgomery.
What is the Percentage of People in the Labor Force in Montgomery?
59.7% of People are in the Labor Force in Montgomery.
What is the Unemployment Rate in Montgomery?
Unemployment Rate in Montgomery is 7.2%.