Cincinnati, OH Map & Demographics
Cincinnati Map
Cincinnati Overview
$37,280
PER CAPITA INCOME
$69,044
AVG FAMILY INCOME
$49,191
AVG HOUSEHOLD INCOME
17.9%
WAGE / INCOME GAP [ % ]
82.1¢/ $1
WAGE / INCOME GAP [ $ ]
$12,182
FAMILY INCOME DEFICIT
0.54
INEQUALITY / GINI INDEX
308,870
TOTAL POPULATION
149,090
MALE POPULATION
159,780
FEMALE POPULATION
93.31
MALES / 100 FEMALES
107.17
FEMALES / 100 MALES
32.9
MEDIAN AGE
3.0
AVG FAMILY SIZE
2.1
AVG HOUSEHOLD SIZE
166,226
LABOR FORCE [ PEOPLE ]
66.1%
PERCENT IN LABOR FORCE
6.9%
UNEMPLOYMENT RATE
Cincinnati Zip Codes
Cincinnati Area Codes
Income in Cincinnati
Income Overview in Cincinnati
Per Capita Income in Cincinnati is $37,280, while median incomes of families and households are $69,044 and $49,191 respectively.
| Characteristic | Number | Measure |
| Per Capita Income | 308,870 | $37,280 |
| Median Family Income | 62,615 | $69,044 |
| Mean Family Income | 62,615 | $105,880 |
| Median Household Income | 141,033 | $49,191 |
| Mean Household Income | 141,033 | $79,960 |
| Income Deficit | 62,615 | $12,182 |
| Wage / Income Gap (%) | 308,870 | 17.93% |
| Wage / Income Gap ($) | 308,870 | 82.07¢ per $1 |
| Gini / Inequality Index | 308,870 | 0.54 |
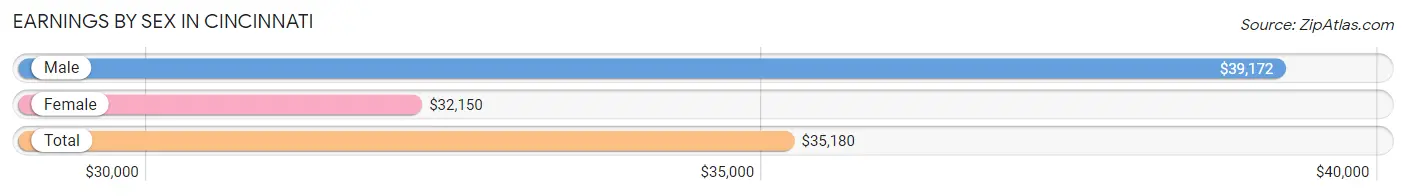
Earnings by Sex in Cincinnati
Average Earnings in Cincinnati are $35,180, $39,172 for men and $32,150 for women, a difference of 17.9%.
| Sex | Number | Average Earnings |
| Male | 88,280 (50.0%) | $39,172 |
| Female | 88,153 (50.0%) | $32,150 |
| Total | 176,433 (100.0%) | $35,180 |
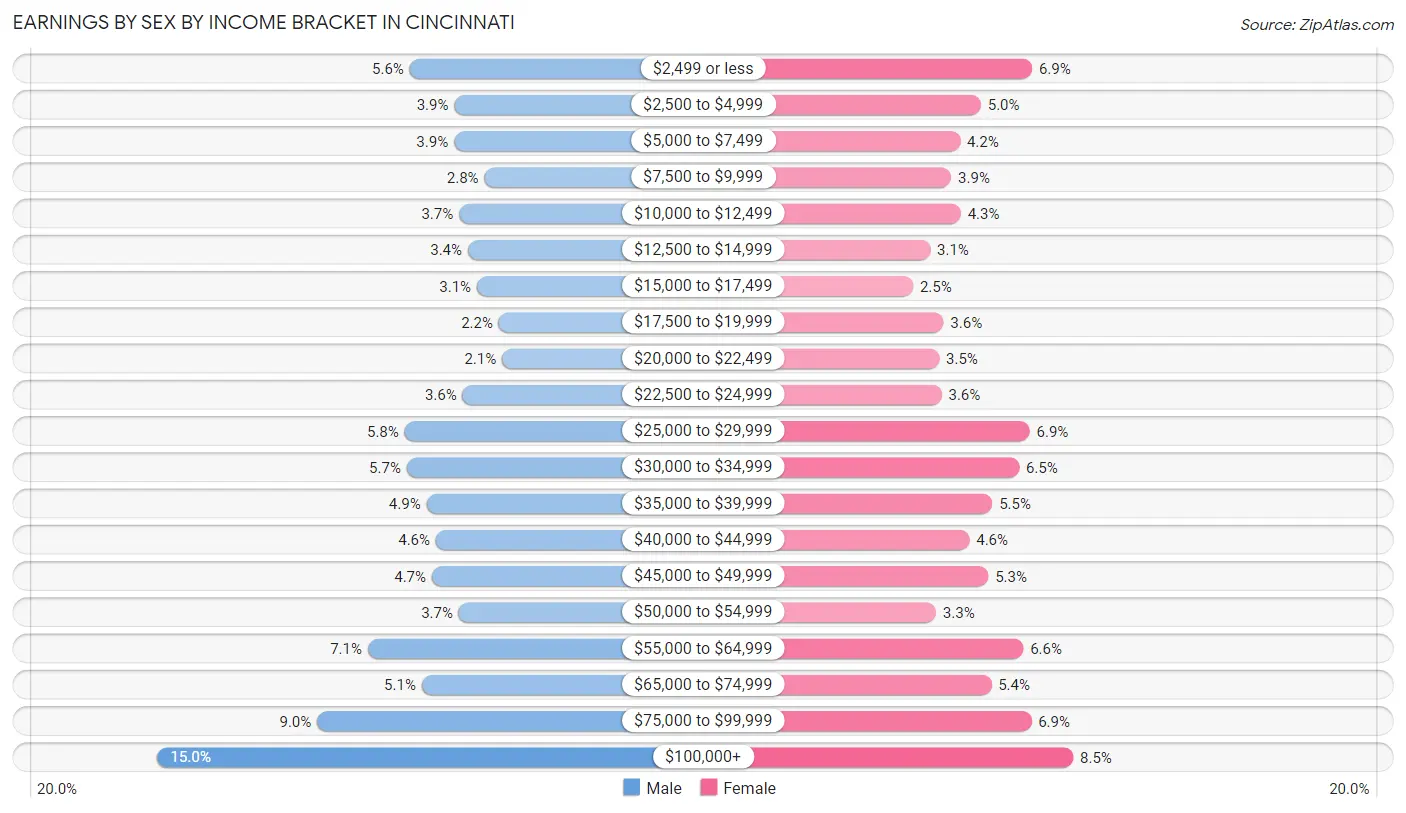
Earnings by Sex by Income Bracket in Cincinnati
The most common earnings brackets in Cincinnati are $100,000+ for men (13,263 | 15.0%) and $100,000+ for women (7,475 | 8.5%).
| Income | Male | Female |
| $2,499 or less | 4,918 (5.6%) | 6,120 (6.9%) |
| $2,500 to $4,999 | 3,447 (3.9%) | 4,422 (5.0%) |
| $5,000 to $7,499 | 3,452 (3.9%) | 3,740 (4.2%) |
| $7,500 to $9,999 | 2,443 (2.8%) | 3,447 (3.9%) |
| $10,000 to $12,499 | 3,280 (3.7%) | 3,768 (4.3%) |
| $12,500 to $14,999 | 2,990 (3.4%) | 2,749 (3.1%) |
| $15,000 to $17,499 | 2,690 (3.0%) | 2,183 (2.5%) |
| $17,500 to $19,999 | 1,973 (2.2%) | 3,187 (3.6%) |
| $20,000 to $22,499 | 1,861 (2.1%) | 3,051 (3.5%) |
| $22,500 to $24,999 | 3,171 (3.6%) | 3,126 (3.5%) |
| $25,000 to $29,999 | 5,082 (5.8%) | 6,039 (6.9%) |
| $30,000 to $34,999 | 5,018 (5.7%) | 5,687 (6.5%) |
| $35,000 to $39,999 | 4,359 (4.9%) | 4,807 (5.4%) |
| $40,000 to $44,999 | 4,050 (4.6%) | 4,044 (4.6%) |
| $45,000 to $49,999 | 4,184 (4.7%) | 4,673 (5.3%) |
| $50,000 to $54,999 | 3,296 (3.7%) | 2,942 (3.3%) |
| $55,000 to $64,999 | 6,305 (7.1%) | 5,831 (6.6%) |
| $65,000 to $74,999 | 4,521 (5.1%) | 4,771 (5.4%) |
| $75,000 to $99,999 | 7,977 (9.0%) | 6,091 (6.9%) |
| $100,000+ | 13,263 (15.0%) | 7,475 (8.5%) |
| Total | 88,280 (100.0%) | 88,153 (100.0%) |
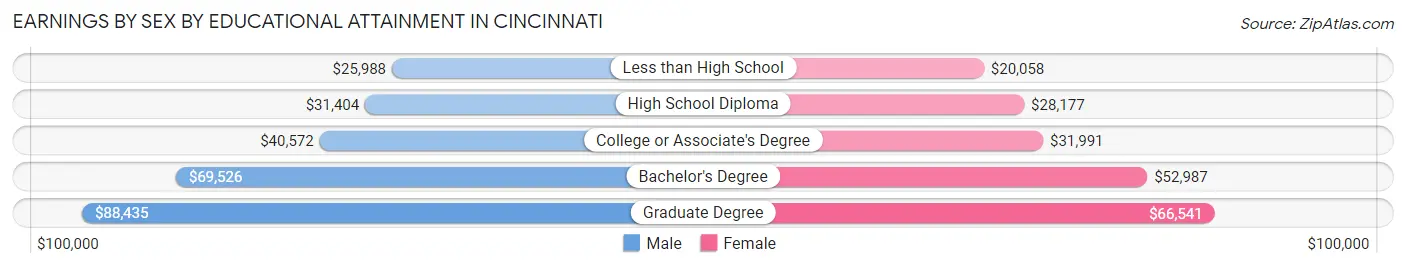
Earnings by Sex by Educational Attainment in Cincinnati
Average earnings in Cincinnati are $48,076 for men and $39,677 for women, a difference of 17.5%. Men with an educational attainment of graduate degree enjoy the highest average annual earnings of $88,435, while those with less than high school education earn the least with $25,988. Women with an educational attainment of graduate degree earn the most with the average annual earnings of $66,541, while those with less than high school education have the smallest earnings of $20,058.
| Educational Attainment | Male Income | Female Income |
| Less than High School | $25,988 | $20,058 |
| High School Diploma | $31,404 | $28,177 |
| College or Associate's Degree | $40,572 | $31,991 |
| Bachelor's Degree | $69,526 | $52,987 |
| Graduate Degree | $88,435 | $66,541 |
| Total | $48,076 | $39,677 |
Family Income in Cincinnati
Family Income Brackets in Cincinnati
According to the Cincinnati family income data, there are 9,330 families falling into the $50,000 to $74,999 income range, which is the most common income bracket and makes up 14.9% of all families. Conversely, the $10,000 to $14,999 income bracket is the least frequent group with only 2,880 families (4.6%) belonging to this category.
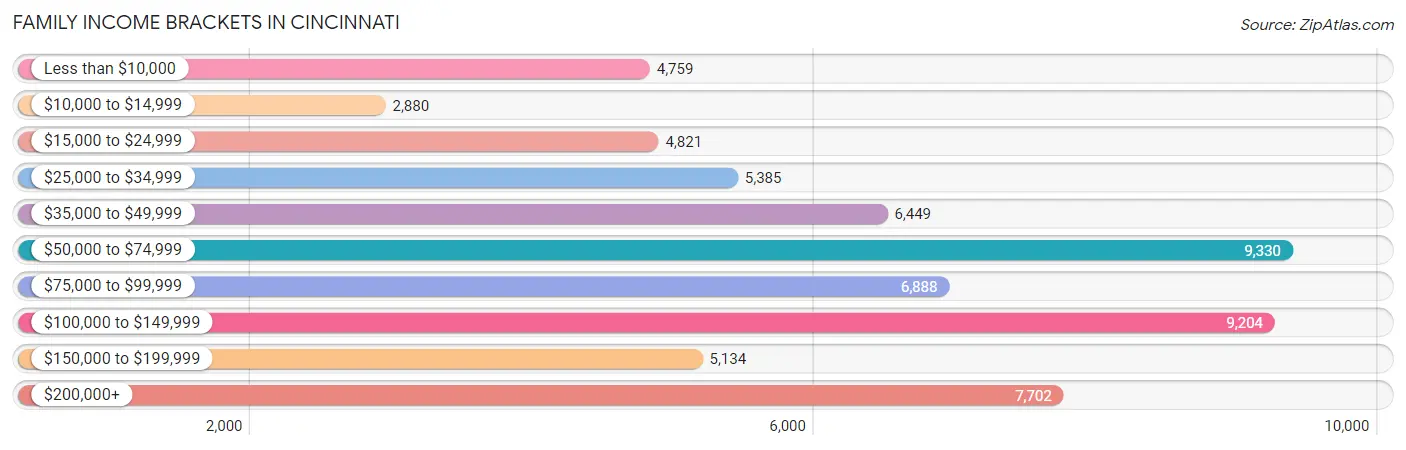
| Income Bracket | # Families | % Families |
| Less than $10,000 | 4,759 | 7.6% |
| $10,000 to $14,999 | 2,880 | 4.6% |
| $15,000 to $24,999 | 4,821 | 7.7% |
| $25,000 to $34,999 | 5,385 | 8.6% |
| $35,000 to $49,999 | 6,449 | 10.3% |
| $50,000 to $74,999 | 9,330 | 14.9% |
| $75,000 to $99,999 | 6,888 | 11.0% |
| $100,000 to $149,999 | 9,204 | 14.7% |
| $150,000 to $199,999 | 5,134 | 8.2% |
| $200,000+ | 7,702 | 12.3% |
Family Income by Famaliy Size in Cincinnati
4-person families (9,932 | 15.9%) account for the highest median family income in Cincinnati with $81,106 per family, while 2-person families (32,880 | 52.5%) have the highest median income of $33,314 per family member.
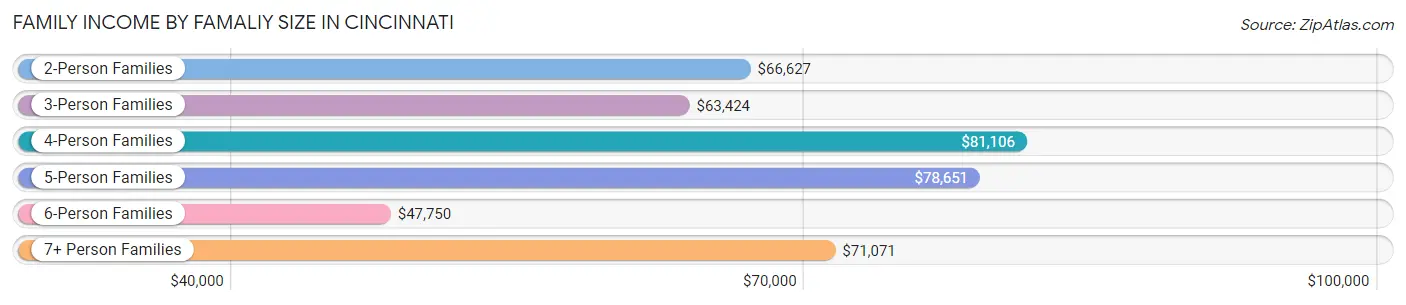
| Income Bracket | # Families | Median Income |
| 2-Person Families | 32,880 (52.5%) | $66,627 |
| 3-Person Families | 13,674 (21.8%) | $63,424 |
| 4-Person Families | 9,932 (15.9%) | $81,106 |
| 5-Person Families | 3,755 (6.0%) | $78,651 |
| 6-Person Families | 1,432 (2.3%) | $47,750 |
| 7+ Person Families | 942 (1.5%) | $71,071 |
| Total | 62,615 (100.0%) | $69,044 |
Family Income by Number of Earners in Cincinnati
The median family income in Cincinnati is $69,044, with families comprising 3+ earners (4,396) having the highest median family income of $142,708, while families with no earners (9,131) have the lowest median family income of $27,874, accounting for 7.0% and 14.6% of families, respectively.
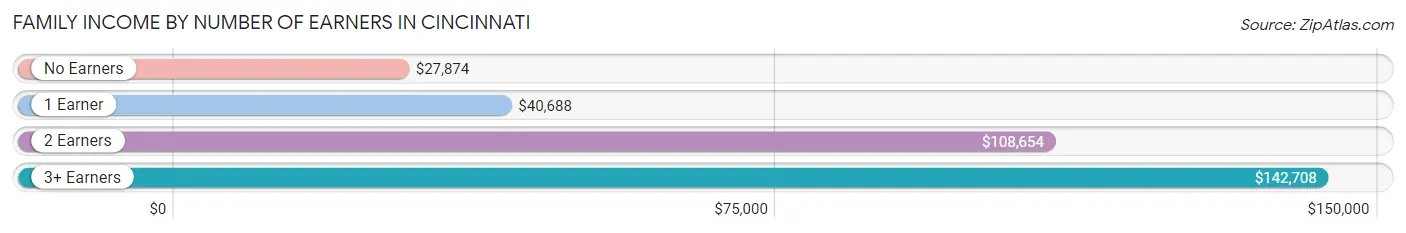
| Number of Earners | # Families | Median Income |
| No Earners | 9,131 (14.6%) | $27,874 |
| 1 Earner | 23,769 (38.0%) | $40,688 |
| 2 Earners | 25,319 (40.4%) | $108,654 |
| 3+ Earners | 4,396 (7.0%) | $142,708 |
| Total | 62,615 (100.0%) | $69,044 |
Household Income in Cincinnati
Household Income Brackets in Cincinnati
With 20,732 households falling in the category, the $50,000 to $74,999 income range is the most frequent in Cincinnati, accounting for 14.7% of all households. In contrast, only 7,898 households (5.6%) fall into the $150,000 to $199,999 income bracket, making it the least populous group.
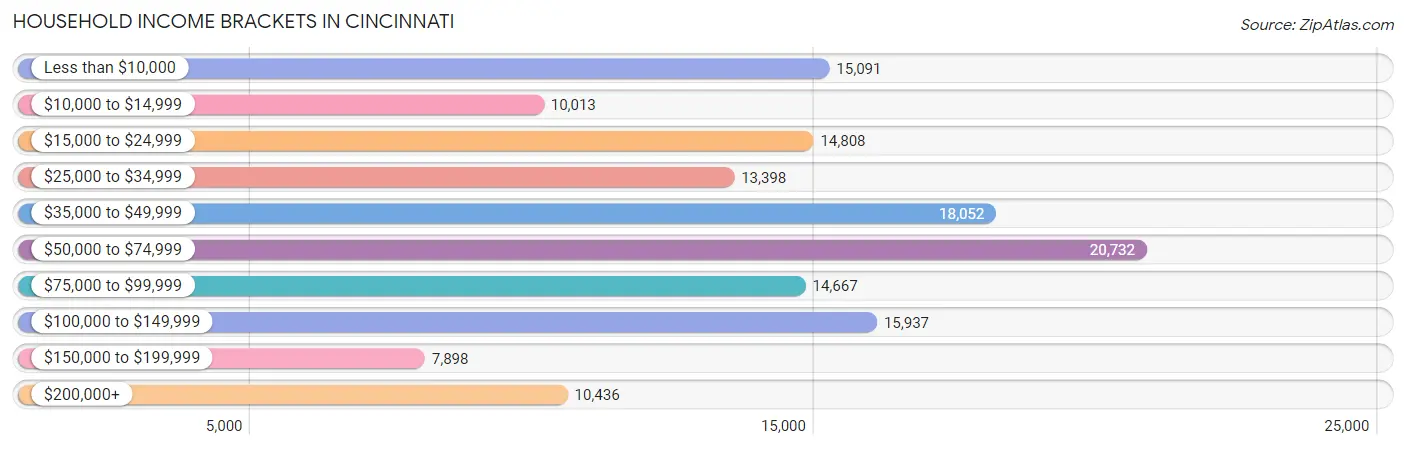
| Income Bracket | # Households | % Households |
| Less than $10,000 | 15,091 | 10.7% |
| $10,000 to $14,999 | 10,013 | 7.1% |
| $15,000 to $24,999 | 14,808 | 10.5% |
| $25,000 to $34,999 | 13,398 | 9.5% |
| $35,000 to $49,999 | 18,052 | 12.8% |
| $50,000 to $74,999 | 20,732 | 14.7% |
| $75,000 to $99,999 | 14,667 | 10.4% |
| $100,000 to $149,999 | 15,937 | 11.3% |
| $150,000 to $199,999 | 7,898 | 5.6% |
| $200,000+ | 10,436 | 7.4% |
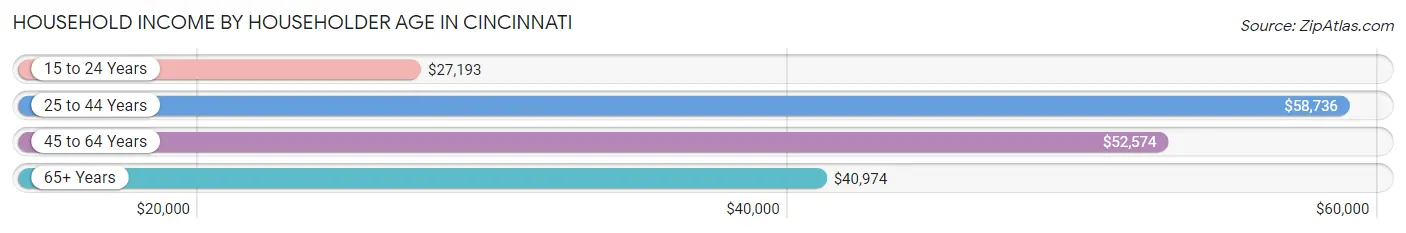
Household Income by Householder Age in Cincinnati
The median household income in Cincinnati is $49,191, with the highest median household income of $58,736 found in the 25 to 44 years age bracket for the primary householder. A total of 56,286 households (39.9%) fall into this category. Meanwhile, the 15 to 24 years age bracket for the primary householder has the lowest median household income of $27,193, with 13,278 households (9.4%) in this group.
| Income Bracket | # Households | Median Income |
| 15 to 24 Years | 13,278 (9.4%) | $27,193 |
| 25 to 44 Years | 56,286 (39.9%) | $58,736 |
| 45 to 64 Years | 43,619 (30.9%) | $52,574 |
| 65+ Years | 27,850 (19.8%) | $40,974 |
| Total | 141,033 (100.0%) | $49,191 |
Poverty in Cincinnati
Income Below Poverty by Sex and Age in Cincinnati
With 22.5% poverty level for males and 27.0% for females among the residents of Cincinnati, under 5 year old males and 18 to 24 year old females are the most vulnerable to poverty, with 4,089 males (41.3%) and 8,592 females (45.2%) in their respective age groups living below the poverty level.
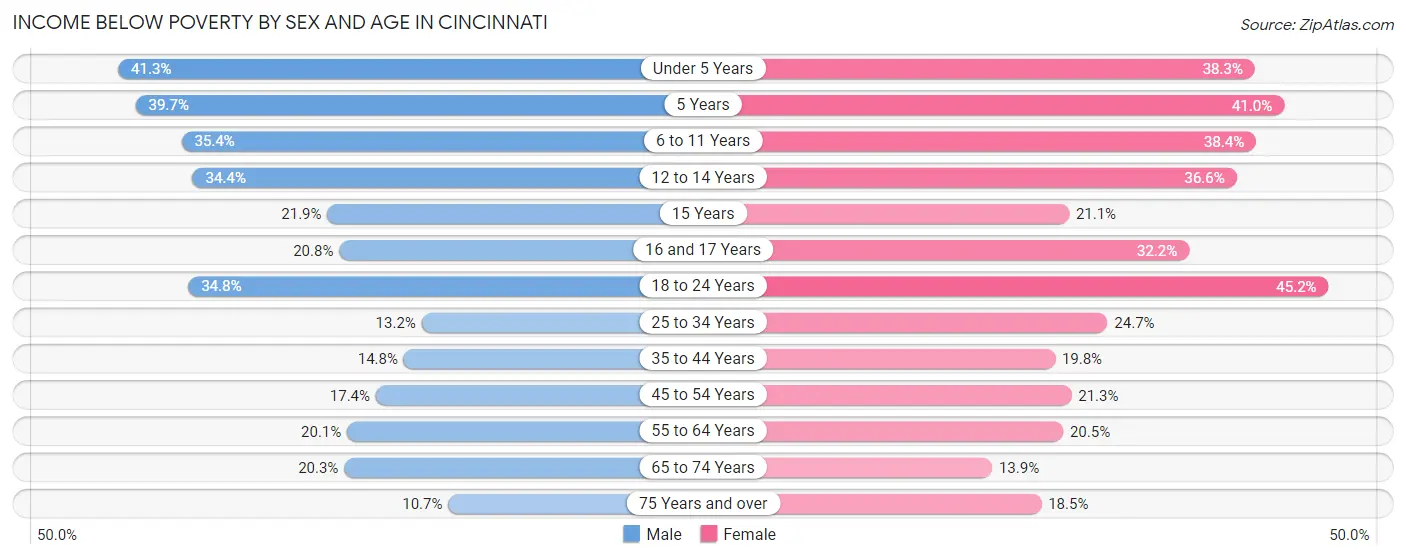
| Age Bracket | Male | Female |
| Under 5 Years | 4,089 (41.3%) | 3,866 (38.3%) |
| 5 Years | 609 (39.7%) | 685 (41.0%) |
| 6 to 11 Years | 3,407 (35.4%) | 3,617 (38.4%) |
| 12 to 14 Years | 1,829 (34.4%) | 2,089 (36.6%) |
| 15 Years | 395 (21.9%) | 290 (21.1%) |
| 16 and 17 Years | 790 (20.8%) | 1,102 (32.2%) |
| 18 to 24 Years | 6,019 (34.8%) | 8,592 (45.2%) |
| 25 to 34 Years | 3,730 (13.2%) | 7,154 (24.6%) |
| 35 to 44 Years | 2,625 (14.8%) | 3,759 (19.8%) |
| 45 to 54 Years | 2,568 (17.4%) | 3,377 (21.3%) |
| 55 to 64 Years | 3,403 (20.1%) | 3,773 (20.5%) |
| 65 to 74 Years | 2,218 (20.3%) | 1,794 (13.9%) |
| 75 Years and over | 570 (10.7%) | 1,548 (18.5%) |
| Total | 32,252 (22.5%) | 41,646 (27.0%) |
Income Above Poverty by Sex and Age in Cincinnati
According to the poverty statistics in Cincinnati, males aged 75 years and over and females aged 65 to 74 years are the age groups that are most secure financially, with 89.3% of males and 86.1% of females in these age groups living above the poverty line.
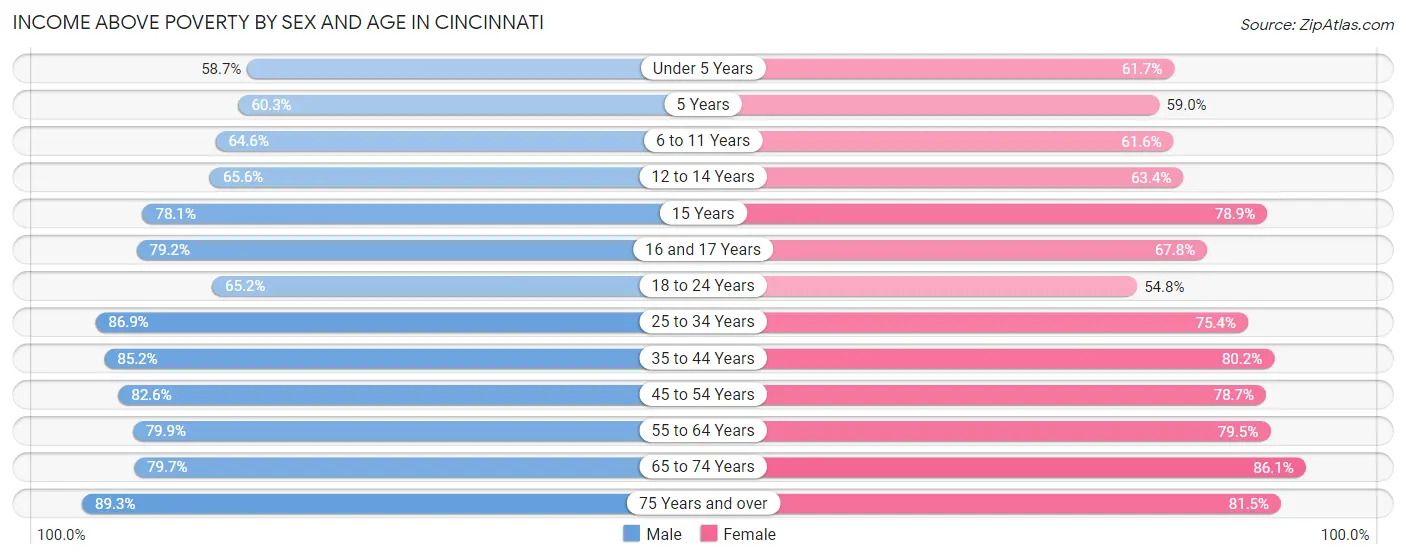
| Age Bracket | Male | Female |
| Under 5 Years | 5,808 (58.7%) | 6,223 (61.7%) |
| 5 Years | 925 (60.3%) | 984 (59.0%) |
| 6 to 11 Years | 6,207 (64.6%) | 5,793 (61.6%) |
| 12 to 14 Years | 3,486 (65.6%) | 3,614 (63.4%) |
| 15 Years | 1,409 (78.1%) | 1,086 (78.9%) |
| 16 and 17 Years | 3,008 (79.2%) | 2,318 (67.8%) |
| 18 to 24 Years | 11,273 (65.2%) | 10,432 (54.8%) |
| 25 to 34 Years | 24,634 (86.9%) | 21,867 (75.3%) |
| 35 to 44 Years | 15,103 (85.2%) | 15,247 (80.2%) |
| 45 to 54 Years | 12,188 (82.6%) | 12,478 (78.7%) |
| 55 to 64 Years | 13,555 (79.9%) | 14,602 (79.5%) |
| 65 to 74 Years | 8,688 (79.7%) | 11,072 (86.1%) |
| 75 Years and over | 4,765 (89.3%) | 6,814 (81.5%) |
| Total | 111,049 (77.5%) | 112,530 (73.0%) |
Income Below Poverty Among Married-Couple Families in Cincinnati
The poverty statistics for married-couple families in Cincinnati show that 4.3% or 1,465 of the total 34,261 families live below the poverty line. Families with 5 or more children have the highest poverty rate of 45.0%, comprising of 77 families. On the other hand, families with no children have the lowest poverty rate of 2.6%, which includes 546 families.
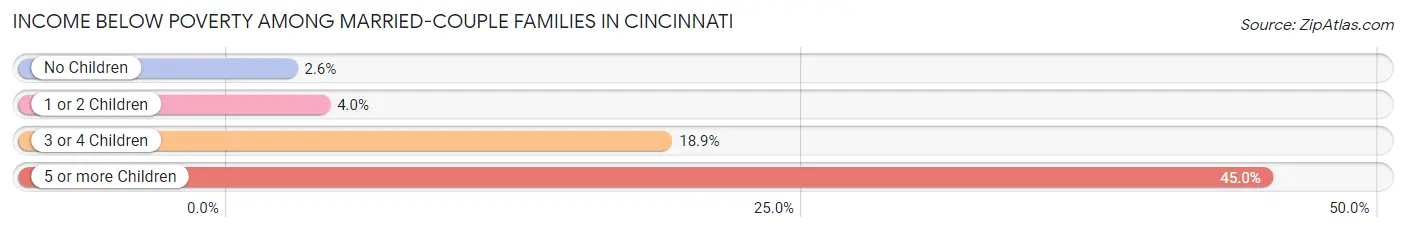
| Children | Above Poverty | Below Poverty |
| No Children | 20,562 (97.4%) | 546 (2.6%) |
| 1 or 2 Children | 10,389 (96.0%) | 434 (4.0%) |
| 3 or 4 Children | 1,751 (81.1%) | 408 (18.9%) |
| 5 or more Children | 94 (55.0%) | 77 (45.0%) |
| Total | 32,796 (95.7%) | 1,465 (4.3%) |
Income Below Poverty Among Single-Parent Households in Cincinnati
According to the poverty data in Cincinnati, 20.6% or 1,155 single-father households and 40.5% or 9,214 single-mother households are living below the poverty line. Among single-father households, those with 5 or more children have the highest poverty rate, with 83 households (89.2%) experiencing poverty. Likewise, among single-mother households, those with 5 or more children have the highest poverty rate, with 362 households (72.1%) falling below the poverty line.
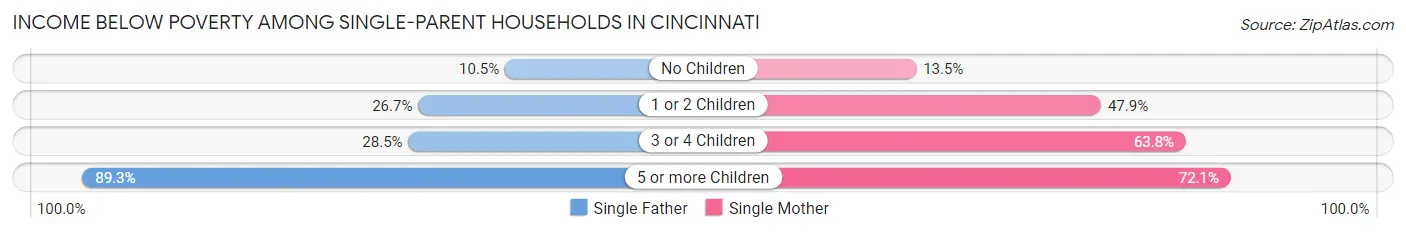
| Children | Single Father | Single Mother |
| No Children | 265 (10.5%) | 922 (13.5%) |
| 1 or 2 Children | 663 (26.7%) | 5,762 (47.9%) |
| 3 or 4 Children | 144 (28.5%) | 2,168 (63.7%) |
| 5 or more Children | 83 (89.2%) | 362 (72.1%) |
| Total | 1,155 (20.6%) | 9,214 (40.5%) |
Income Below Poverty Among Married-Couple vs Single-Parent Households in Cincinnati
The poverty data for Cincinnati shows that 1,465 of the married-couple family households (4.3%) and 10,369 of the single-parent households (36.6%) are living below the poverty level. Within the married-couple family households, those with 5 or more children have the highest poverty rate, with 77 households (45.0%) falling below the poverty line. Among the single-parent households, those with 5 or more children have the highest poverty rate, with 445 household (74.8%) living below poverty.
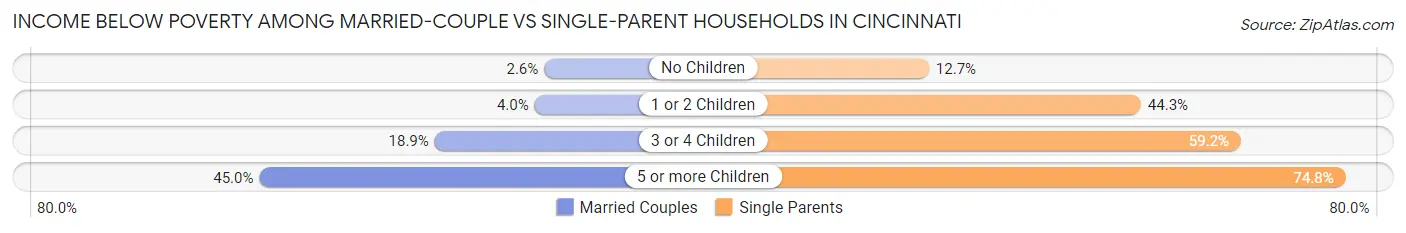
| Children | Married-Couple Families | Single-Parent Households |
| No Children | 546 (2.6%) | 1,187 (12.7%) |
| 1 or 2 Children | 434 (4.0%) | 6,425 (44.3%) |
| 3 or 4 Children | 408 (18.9%) | 2,312 (59.2%) |
| 5 or more Children | 77 (45.0%) | 445 (74.8%) |
| Total | 1,465 (4.3%) | 10,369 (36.6%) |
Race in Cincinnati
The most populous races in Cincinnati are White / Caucasian (155,699 | 50.4%), Black / African American (122,384 | 39.6%), and Two or more Races (17,419 | 5.6%).
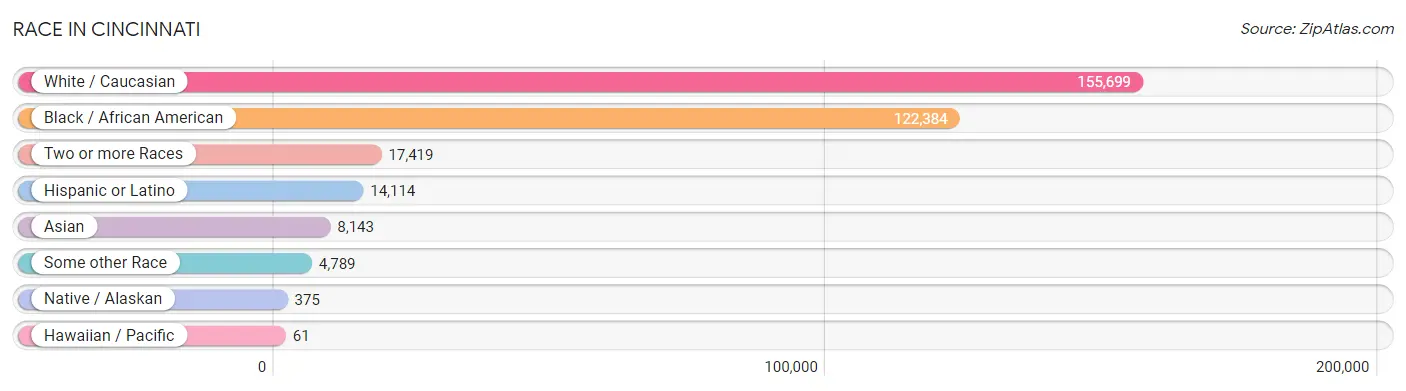
| Race | # Population | % Population |
| Asian | 8,143 | 2.6% |
| Black / African American | 122,384 | 39.6% |
| Hawaiian / Pacific | 61 | 0.0% |
| Hispanic or Latino | 14,114 | 4.6% |
| Native / Alaskan | 375 | 0.1% |
| White / Caucasian | 155,699 | 50.4% |
| Two or more Races | 17,419 | 5.6% |
| Some other Race | 4,789 | 1.5% |
| Total | 308,870 | 100.0% |
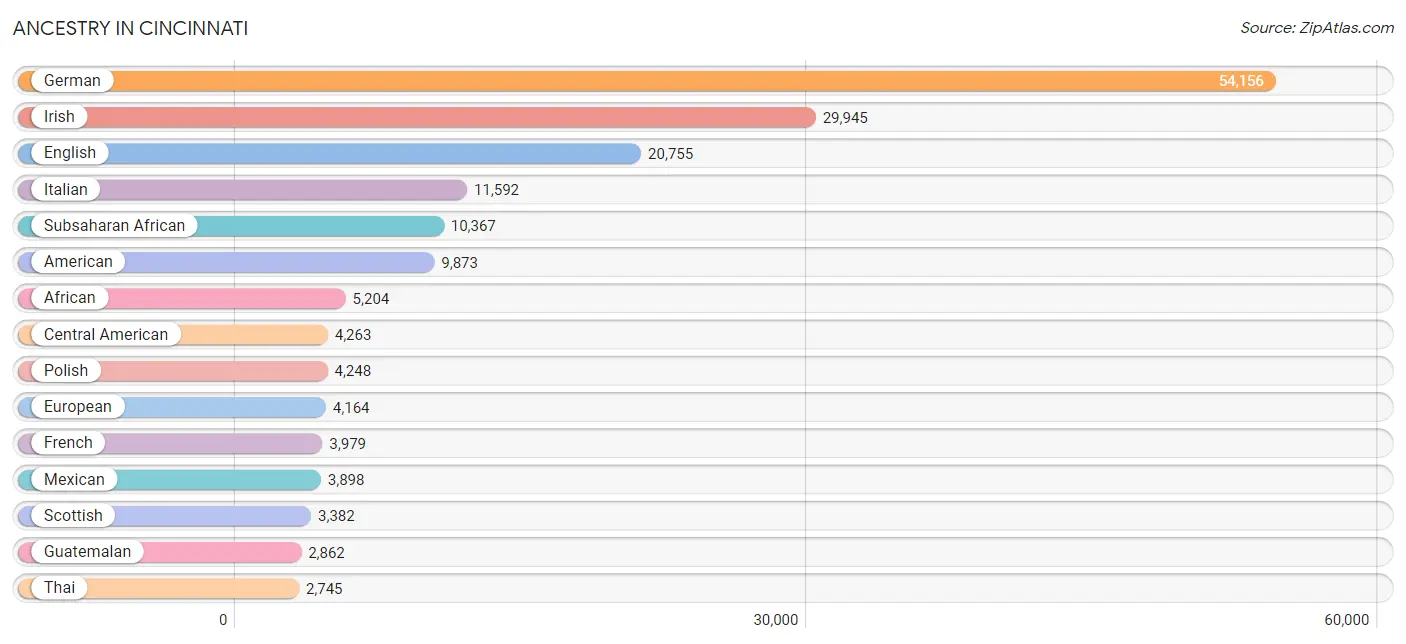
Ancestry in Cincinnati
The most populous ancestries reported in Cincinnati are German (54,156 | 17.5%), Irish (29,945 | 9.7%), English (20,755 | 6.7%), Italian (11,592 | 3.7%), and Subsaharan African (10,367 | 3.4%), together accounting for 41.1% of all Cincinnati residents.
| Ancestry | # Population | % Population |
| Afghan | 59 | 0.0% |
| African | 5,204 | 1.7% |
| Albanian | 87 | 0.0% |
| Alsatian | 21 | 0.0% |
| American | 9,873 | 3.2% |
| Apache | 32 | 0.0% |
| Arab | 1,832 | 0.6% |
| Argentinean | 178 | 0.1% |
| Armenian | 419 | 0.1% |
| Australian | 60 | 0.0% |
| Austrian | 384 | 0.1% |
| Barbadian | 30 | 0.0% |
| Basque | 1 | 0.0% |
| Belgian | 164 | 0.1% |
| Bhutanese | 486 | 0.2% |
| Blackfeet | 372 | 0.1% |
| Bolivian | 118 | 0.0% |
| Brazilian | 201 | 0.1% |
| British | 1,918 | 0.6% |
| Bulgarian | 97 | 0.0% |
| Burmese | 979 | 0.3% |
| Cajun | 19 | 0.0% |
| Canadian | 294 | 0.1% |
| Cape Verdean | 14 | 0.0% |
| Carpatho Rusyn | 90 | 0.0% |
| Celtic | 101 | 0.0% |
| Central American | 4,263 | 1.4% |
| Central American Indian | 180 | 0.1% |
| Cherokee | 971 | 0.3% |
| Cheyenne | 66 | 0.0% |
| Chickasaw | 20 | 0.0% |
| Chilean | 54 | 0.0% |
| Chippewa | 43 | 0.0% |
| Choctaw | 40 | 0.0% |
| Colombian | 381 | 0.1% |
| Comanche | 4 | 0.0% |
| Costa Rican | 109 | 0.0% |
| Cree | 11 | 0.0% |
| Creek | 1 | 0.0% |
| Croatian | 281 | 0.1% |
| Cuban | 552 | 0.2% |
| Czech | 878 | 0.3% |
| Czechoslovakian | 75 | 0.0% |
| Danish | 467 | 0.2% |
| Dominican | 164 | 0.1% |
| Dutch | 2,244 | 0.7% |
| Eastern European | 905 | 0.3% |
| Ecuadorian | 40 | 0.0% |
| Egyptian | 200 | 0.1% |
| English | 20,755 | 6.7% |
| Ethiopian | 1,248 | 0.4% |
| European | 4,164 | 1.3% |
| Filipino | 384 | 0.1% |
| Finnish | 307 | 0.1% |
| French | 3,979 | 1.3% |
| French American Indian | 4 | 0.0% |
| French Canadian | 517 | 0.2% |
| German | 54,156 | 17.5% |
| German Russian | 98 | 0.0% |
| Ghanaian | 246 | 0.1% |
| Greek | 1,142 | 0.4% |
| Guamanian / Chamorro | 9 | 0.0% |
| Guatemalan | 2,862 | 0.9% |
| Guyanese | 28 | 0.0% |
| Haitian | 264 | 0.1% |
| Honduran | 732 | 0.2% |
| Hungarian | 1,378 | 0.4% |
| Icelander | 26 | 0.0% |
| Indian (Asian) | 2,267 | 0.7% |
| Indonesian | 26 | 0.0% |
| Inupiat | 12 | 0.0% |
| Iranian | 197 | 0.1% |
| Iraqi | 49 | 0.0% |
| Irish | 29,945 | 9.7% |
| Iroquois | 67 | 0.0% |
| Israeli | 33 | 0.0% |
| Italian | 11,592 | 3.7% |
| Jamaican | 812 | 0.3% |
| Japanese | 404 | 0.1% |
| Jordanian | 74 | 0.0% |
| Kenyan | 63 | 0.0% |
| Korean | 1,124 | 0.4% |
| Laotian | 61 | 0.0% |
| Latvian | 41 | 0.0% |
| Lebanese | 482 | 0.2% |
| Lithuanian | 450 | 0.2% |
| Luxembourger | 14 | 0.0% |
| Macedonian | 54 | 0.0% |
| Malaysian | 120 | 0.0% |
| Maltese | 6 | 0.0% |
| Mexican | 3,898 | 1.3% |
| Mexican American Indian | 10 | 0.0% |
| Mongolian | 33 | 0.0% |
| Moroccan | 168 | 0.1% |
| Native Hawaiian | 109 | 0.0% |
| Navajo | 51 | 0.0% |
| New Zealander | 14 | 0.0% |
| Nicaraguan | 203 | 0.1% |
| Nigerian | 1,124 | 0.4% |
| Northern European | 300 | 0.1% |
| Norwegian | 997 | 0.3% |
| Okinawan | 34 | 0.0% |
| Pakistani | 222 | 0.1% |
| Palestinian | 45 | 0.0% |
| Panamanian | 284 | 0.1% |
| Paraguayan | 13 | 0.0% |
| Pennsylvania German | 7 | 0.0% |
| Peruvian | 96 | 0.0% |
| Polish | 4,248 | 1.4% |
| Portuguese | 264 | 0.1% |
| Puerto Rican | 2,219 | 0.7% |
| Romanian | 455 | 0.2% |
| Russian | 1,486 | 0.5% |
| Salvadoran | 66 | 0.0% |
| Samoan | 47 | 0.0% |
| Scandinavian | 336 | 0.1% |
| Scotch-Irish | 1,929 | 0.6% |
| Scottish | 3,382 | 1.1% |
| Seminole | 56 | 0.0% |
| Senegalese | 393 | 0.1% |
| Serbian | 142 | 0.1% |
| Shoshone | 17 | 0.0% |
| Sierra Leonean | 26 | 0.0% |
| Sioux | 29 | 0.0% |
| Slavic | 126 | 0.0% |
| Slovak | 541 | 0.2% |
| Slovene | 372 | 0.1% |
| South African | 79 | 0.0% |
| South American | 970 | 0.3% |
| South American Indian | 3 | 0.0% |
| Spaniard | 513 | 0.2% |
| Spanish | 329 | 0.1% |
| Spanish American | 95 | 0.0% |
| Sri Lankan | 711 | 0.2% |
| Subsaharan African | 10,367 | 3.4% |
| Sudanese | 48 | 0.0% |
| Swedish | 1,262 | 0.4% |
| Swiss | 595 | 0.2% |
| Syrian | 104 | 0.0% |
| Thai | 2,745 | 0.9% |
| Tongan | 43 | 0.0% |
| Trinidadian and Tobagonian | 61 | 0.0% |
| Turkish | 145 | 0.1% |
| Ugandan | 135 | 0.0% |
| Ukrainian | 566 | 0.2% |
| Uruguayan | 12 | 0.0% |
| Venezuelan | 78 | 0.0% |
| Vietnamese | 61 | 0.0% |
| Welsh | 1,553 | 0.5% |
| West Indian | 24 | 0.0% |
| Yugoslavian | 132 | 0.0% |
| Zimbabwean | 42 | 0.0% | View All 152 Rows |
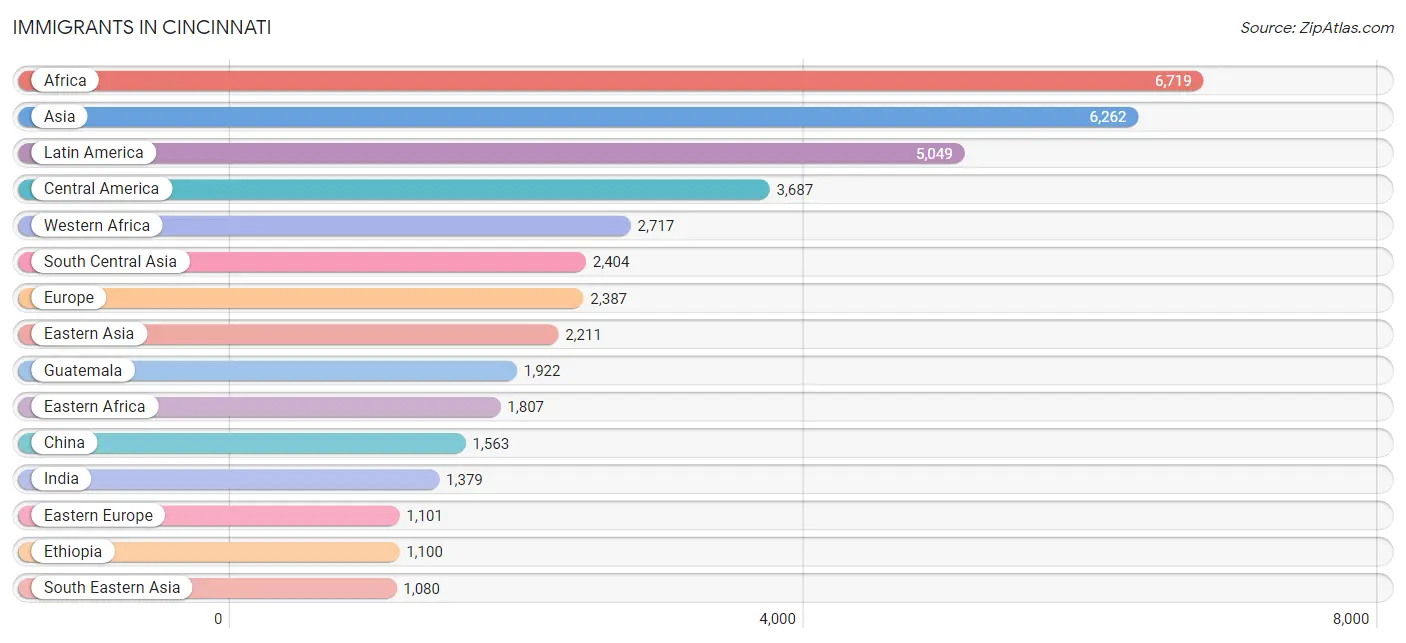
Immigrants in Cincinnati
The most numerous immigrant groups reported in Cincinnati came from Africa (6,719 | 2.2%), Asia (6,262 | 2.0%), Latin America (5,049 | 1.6%), Central America (3,687 | 1.2%), and Western Africa (2,717 | 0.9%), together accounting for 7.9% of all Cincinnati residents.
| Immigration Origin | # Population | % Population |
| Afghanistan | 75 | 0.0% |
| Africa | 6,719 | 2.2% |
| Albania | 36 | 0.0% |
| Argentina | 146 | 0.1% |
| Asia | 6,262 | 2.0% |
| Australia | 87 | 0.0% |
| Austria | 12 | 0.0% |
| Bahamas | 67 | 0.0% |
| Bangladesh | 152 | 0.1% |
| Belarus | 10 | 0.0% |
| Belgium | 28 | 0.0% |
| Bosnia and Herzegovina | 27 | 0.0% |
| Brazil | 105 | 0.0% |
| Bulgaria | 77 | 0.0% |
| Cambodia | 97 | 0.0% |
| Canada | 390 | 0.1% |
| Caribbean | 689 | 0.2% |
| Central America | 3,687 | 1.2% |
| Chile | 99 | 0.0% |
| China | 1,563 | 0.5% |
| Colombia | 179 | 0.1% |
| Congo | 448 | 0.2% |
| Costa Rica | 57 | 0.0% |
| Croatia | 34 | 0.0% |
| Cuba | 56 | 0.0% |
| Czechoslovakia | 63 | 0.0% |
| Dominica | 9 | 0.0% |
| Dominican Republic | 50 | 0.0% |
| Eastern Africa | 1,807 | 0.6% |
| Eastern Asia | 2,211 | 0.7% |
| Eastern Europe | 1,101 | 0.4% |
| Ecuador | 12 | 0.0% |
| Egypt | 126 | 0.0% |
| El Salvador | 10 | 0.0% |
| England | 150 | 0.1% |
| Eritrea | 178 | 0.1% |
| Ethiopia | 1,100 | 0.4% |
| Europe | 2,387 | 0.8% |
| France | 187 | 0.1% |
| Germany | 267 | 0.1% |
| Ghana | 231 | 0.1% |
| Greece | 40 | 0.0% |
| Guatemala | 1,922 | 0.6% |
| Guyana | 8 | 0.0% |
| Haiti | 22 | 0.0% |
| Honduras | 499 | 0.2% |
| Hong Kong | 66 | 0.0% |
| Hungary | 73 | 0.0% |
| India | 1,379 | 0.4% |
| Indonesia | 64 | 0.0% |
| Iran | 78 | 0.0% |
| Iraq | 89 | 0.0% |
| Ireland | 17 | 0.0% |
| Israel | 17 | 0.0% |
| Italy | 64 | 0.0% |
| Jamaica | 442 | 0.1% |
| Japan | 128 | 0.0% |
| Jordan | 83 | 0.0% |
| Kazakhstan | 58 | 0.0% |
| Kenya | 96 | 0.0% |
| Korea | 520 | 0.2% |
| Laos | 41 | 0.0% |
| Latin America | 5,049 | 1.6% |
| Lebanon | 36 | 0.0% |
| Liberia | 9 | 0.0% |
| Lithuania | 57 | 0.0% |
| Malaysia | 22 | 0.0% |
| Mexico | 912 | 0.3% |
| Middle Africa | 529 | 0.2% |
| Moldova | 9 | 0.0% |
| Morocco | 159 | 0.1% |
| Nepal | 211 | 0.1% |
| Netherlands | 31 | 0.0% |
| Nicaragua | 138 | 0.0% |
| Nigeria | 470 | 0.2% |
| North Macedonia | 77 | 0.0% |
| Northern Africa | 758 | 0.3% |
| Northern Europe | 435 | 0.1% |
| Norway | 28 | 0.0% |
| Oceania | 94 | 0.0% |
| Pakistan | 120 | 0.0% |
| Panama | 69 | 0.0% |
| Peru | 54 | 0.0% |
| Philippines | 380 | 0.1% |
| Poland | 76 | 0.0% |
| Romania | 270 | 0.1% |
| Russia | 56 | 0.0% |
| Saudi Arabia | 68 | 0.0% |
| Scotland | 12 | 0.0% |
| Senegal | 509 | 0.2% |
| Sierra Leone | 26 | 0.0% |
| Singapore | 34 | 0.0% |
| South Africa | 79 | 0.0% |
| South America | 673 | 0.2% |
| South Central Asia | 2,404 | 0.8% |
| South Eastern Asia | 1,080 | 0.4% |
| Southern Europe | 296 | 0.1% |
| Spain | 192 | 0.1% |
| Sri Lanka | 91 | 0.0% |
| Sudan | 48 | 0.0% |
| Sweden | 27 | 0.0% |
| Switzerland | 30 | 0.0% |
| Syria | 23 | 0.0% |
| Taiwan | 185 | 0.1% |
| Thailand | 26 | 0.0% |
| Trinidad and Tobago | 43 | 0.0% |
| Turkey | 131 | 0.0% |
| Uganda | 103 | 0.0% |
| Ukraine | 112 | 0.0% |
| Uruguay | 12 | 0.0% |
| Venezuela | 45 | 0.0% |
| Vietnam | 390 | 0.1% |
| Western Africa | 2,717 | 0.9% |
| Western Asia | 546 | 0.2% |
| Western Europe | 555 | 0.2% |
| Zimbabwe | 24 | 0.0% | View All 116 Rows |
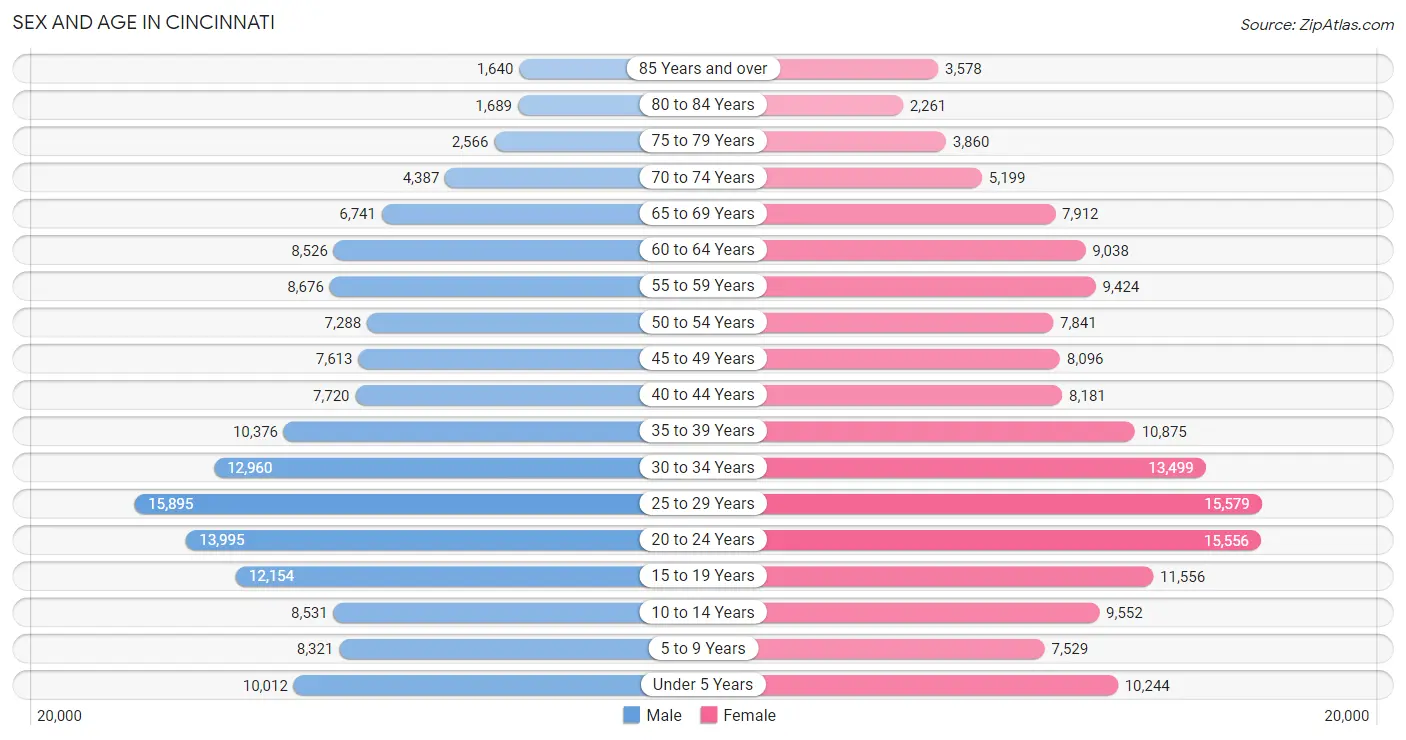
Sex and Age in Cincinnati
Sex and Age in Cincinnati
The most populous age groups in Cincinnati are 25 to 29 Years (15,895 | 10.7%) for men and 25 to 29 Years (15,579 | 9.8%) for women.
| Age Bracket | Male | Female |
| Under 5 Years | 10,012 (6.7%) | 10,244 (6.4%) |
| 5 to 9 Years | 8,321 (5.6%) | 7,529 (4.7%) |
| 10 to 14 Years | 8,531 (5.7%) | 9,552 (6.0%) |
| 15 to 19 Years | 12,154 (8.2%) | 11,556 (7.2%) |
| 20 to 24 Years | 13,995 (9.4%) | 15,556 (9.7%) |
| 25 to 29 Years | 15,895 (10.7%) | 15,579 (9.8%) |
| 30 to 34 Years | 12,960 (8.7%) | 13,499 (8.5%) |
| 35 to 39 Years | 10,376 (7.0%) | 10,875 (6.8%) |
| 40 to 44 Years | 7,720 (5.2%) | 8,181 (5.1%) |
| 45 to 49 Years | 7,613 (5.1%) | 8,096 (5.1%) |
| 50 to 54 Years | 7,288 (4.9%) | 7,841 (4.9%) |
| 55 to 59 Years | 8,676 (5.8%) | 9,424 (5.9%) |
| 60 to 64 Years | 8,526 (5.7%) | 9,038 (5.7%) |
| 65 to 69 Years | 6,741 (4.5%) | 7,912 (5.0%) |
| 70 to 74 Years | 4,387 (2.9%) | 5,199 (3.3%) |
| 75 to 79 Years | 2,566 (1.7%) | 3,860 (2.4%) |
| 80 to 84 Years | 1,689 (1.1%) | 2,261 (1.4%) |
| 85 Years and over | 1,640 (1.1%) | 3,578 (2.2%) |
| Total | 149,090 (100.0%) | 159,780 (100.0%) |
Families and Households in Cincinnati
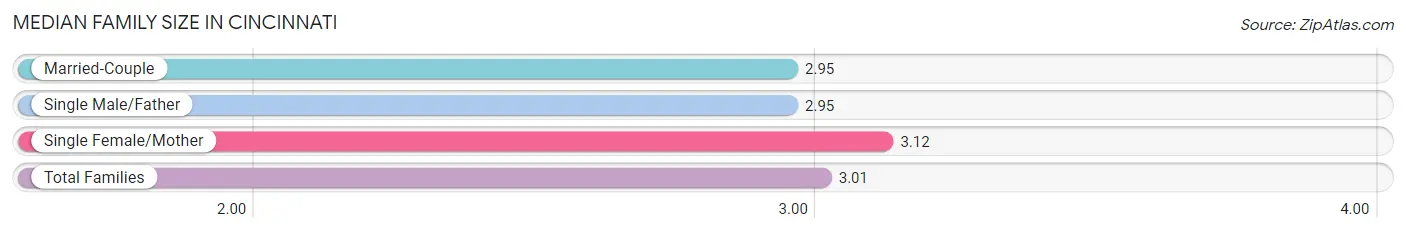
Median Family Size in Cincinnati
The median family size in Cincinnati is 3.01 persons per family, with single female/mother families (22,748 | 36.3%) accounting for the largest median family size of 3.12 persons per family. On the other hand, married-couple families (34,261 | 54.7%) represent the smallest median family size with 2.95 persons per family.
| Family Type | # Families | Family Size |
| Married-Couple | 34,261 (54.7%) | 2.95 |
| Single Male/Father | 5,606 (8.9%) | 2.95 |
| Single Female/Mother | 22,748 (36.3%) | 3.12 |
| Total Families | 62,615 (100.0%) | 3.01 |
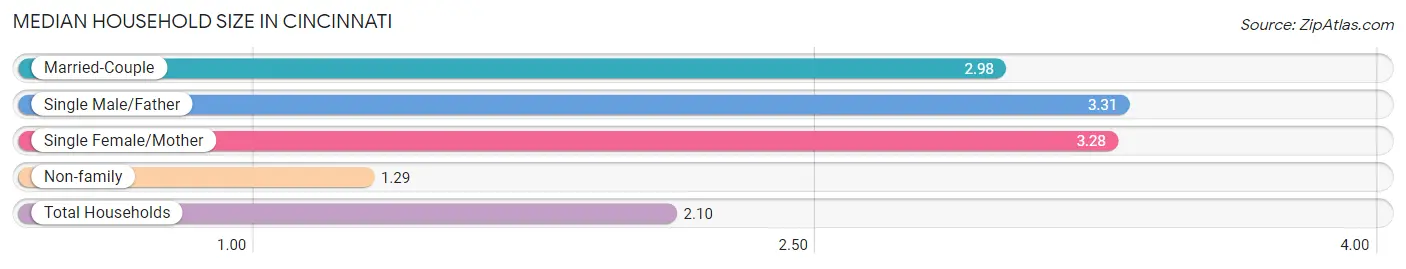
Median Household Size in Cincinnati
The median household size in Cincinnati is 2.10 persons per household, with single male/father households (5,606 | 4.0%) accounting for the largest median household size of 3.31 persons per household. non-family households (78,418 | 55.6%) represent the smallest median household size with 1.29 persons per household.
| Household Type | # Households | Household Size |
| Married-Couple | 34,261 (24.3%) | 2.98 |
| Single Male/Father | 5,606 (4.0%) | 3.31 |
| Single Female/Mother | 22,748 (16.1%) | 3.28 |
| Non-family | 78,418 (55.6%) | 1.29 |
| Total Households | 141,033 (100.0%) | 2.10 |
Household Size by Marriage Status in Cincinnati
Out of a total of 141,033 households in Cincinnati, 62,615 (44.4%) are family households, while 78,418 (55.6%) are nonfamily households. The most numerous type of family households are 2-person households, comprising 30,512, and the most common type of nonfamily households are 1-person households, comprising 63,142.
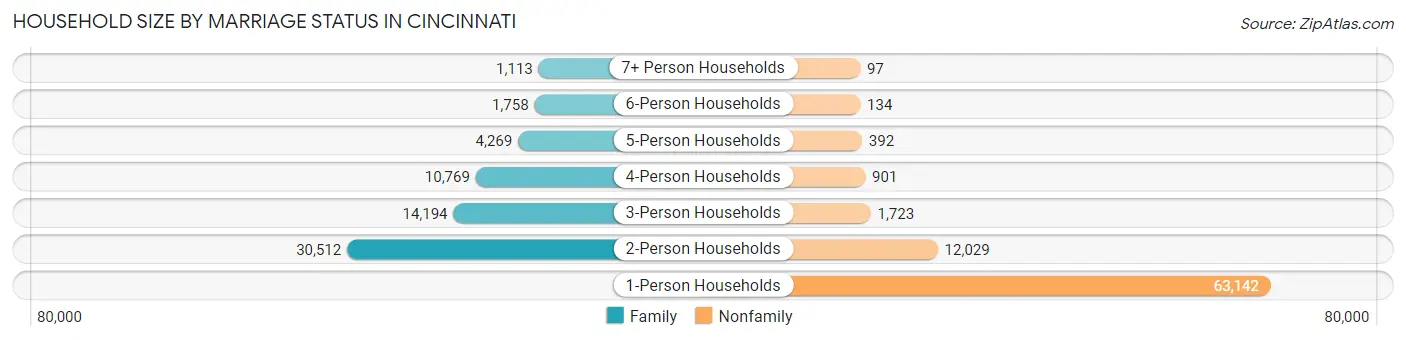
| Household Size | Family Households | Nonfamily Households |
| 1-Person Households | - | 63,142 (44.8%) |
| 2-Person Households | 30,512 (21.6%) | 12,029 (8.5%) |
| 3-Person Households | 14,194 (10.1%) | 1,723 (1.2%) |
| 4-Person Households | 10,769 (7.6%) | 901 (0.6%) |
| 5-Person Households | 4,269 (3.0%) | 392 (0.3%) |
| 6-Person Households | 1,758 (1.3%) | 134 (0.1%) |
| 7+ Person Households | 1,113 (0.8%) | 97 (0.1%) |
| Total | 62,615 (44.4%) | 78,418 (55.6%) |
Female Fertility in Cincinnati
Fertility by Age in Cincinnati
Average fertility rate in Cincinnati is 58.0 births per 1,000 women. Women in the age bracket of 20 to 34 years have the highest fertility rate with 79.0 births per 1,000 women. Women in the age bracket of 20 to 34 years acount for 72.0% of all women with births.
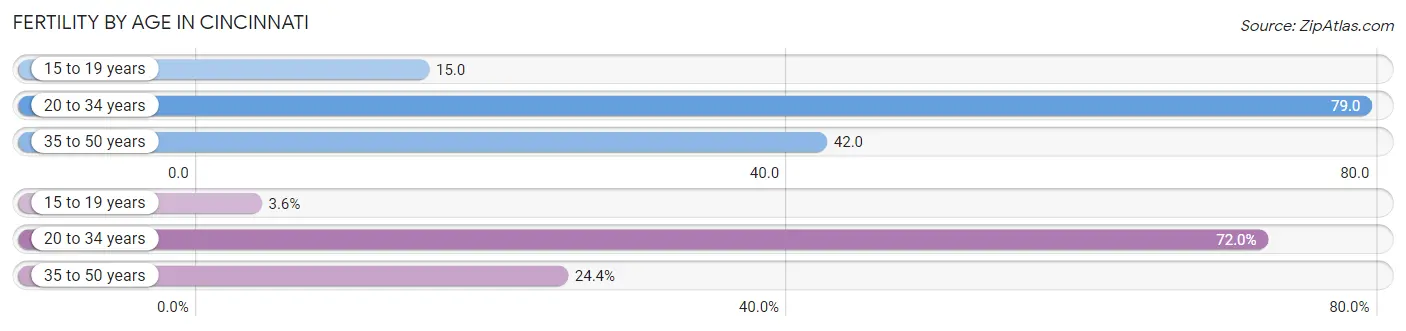
| Age Bracket | Women with Births | Births / 1,000 Women |
| 15 to 19 years | 177 (3.6%) | 15.0 |
| 20 to 34 years | 3,513 (72.0%) | 79.0 |
| 35 to 50 years | 1,192 (24.4%) | 42.0 |
| Total | 4,882 (100.0%) | 58.0 |
Fertility by Age by Marriage Status in Cincinnati
41.0% of women with births (4,882) in Cincinnati are married. The highest percentage of unmarried women with births falls into 15 to 19 years age bracket with 95.5% of them unmarried at the time of birth, while the lowest percentage of unmarried women with births belong to 35 to 50 years age bracket with 36.5% of them unmarried.
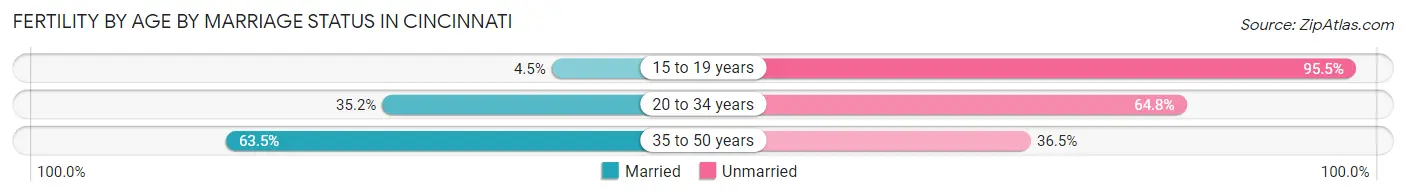
| Age Bracket | Married | Unmarried |
| 15 to 19 years | 8 (4.5%) | 169 (95.5%) |
| 20 to 34 years | 1,237 (35.2%) | 2,276 (64.8%) |
| 35 to 50 years | 757 (63.5%) | 435 (36.5%) |
| Total | 2,002 (41.0%) | 2,880 (59.0%) |
Fertility by Education in Cincinnati
Average fertility rate in Cincinnati is 58.0 births per 1,000 women. Women with the education attainment of less than high school have the highest fertility rate of 85.0 births per 1,000 women, while women with the education attainment of college or associate's degree have the lowest fertility at 32.0 births per 1,000 women. Women with the education attainment of high school diploma represent 32.0% of all women with births.
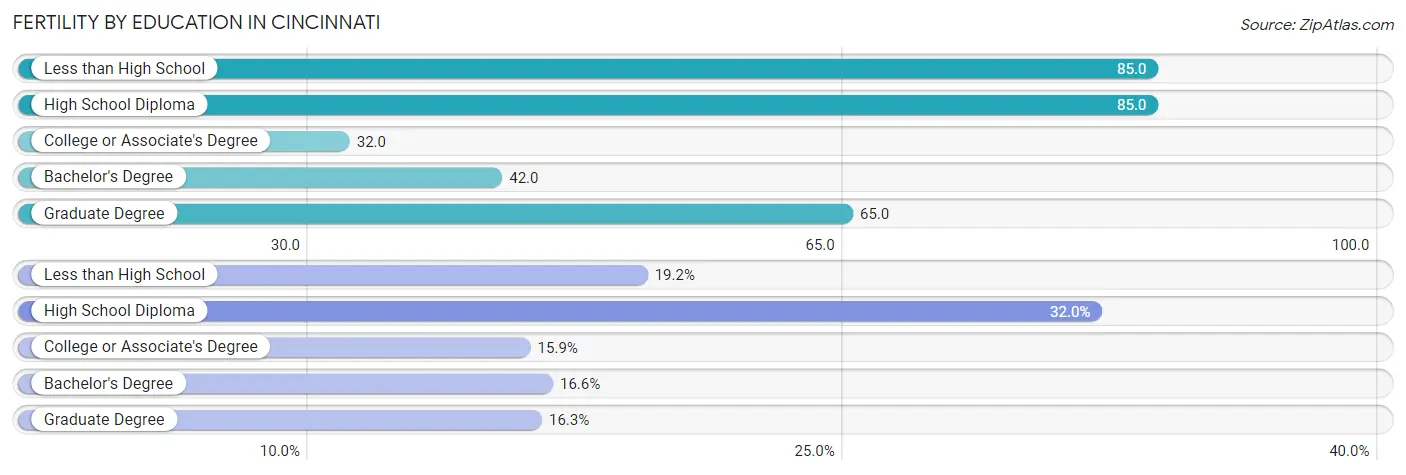
| Educational Attainment | Women with Births | Births / 1,000 Women |
| Less than High School | 939 (19.2%) | 85.0 |
| High School Diploma | 1,562 (32.0%) | 85.0 |
| College or Associate's Degree | 778 (15.9%) | 32.0 |
| Bachelor's Degree | 809 (16.6%) | 42.0 |
| Graduate Degree | 794 (16.3%) | 65.0 |
| Total | 4,882 (100.0%) | 58.0 |
Fertility by Education by Marriage Status in Cincinnati
59.0% of women with births in Cincinnati are unmarried. Women with the educational attainment of graduate degree are most likely to be married with 87.0% of them married at childbirth, while women with the educational attainment of high school diploma are least likely to be married with 77.7% of them unmarried at childbirth.
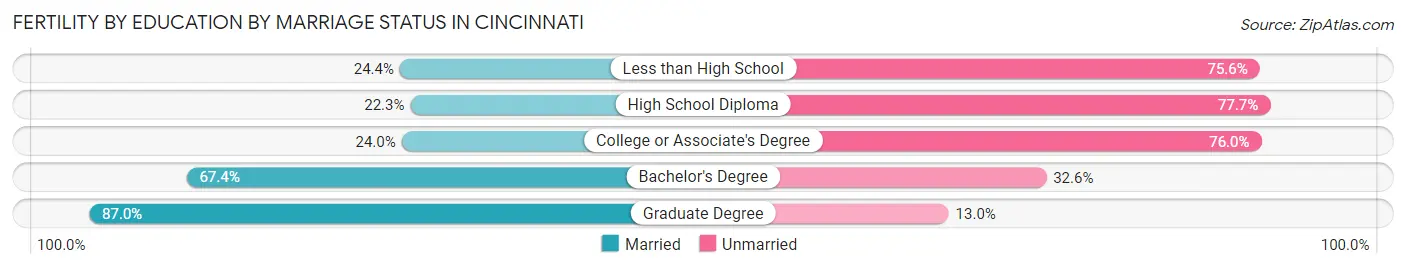
| Educational Attainment | Married | Unmarried |
| Less than High School | 229 (24.4%) | 710 (75.6%) |
| High School Diploma | 348 (22.3%) | 1,214 (77.7%) |
| College or Associate's Degree | 187 (24.0%) | 591 (76.0%) |
| Bachelor's Degree | 545 (67.4%) | 264 (32.6%) |
| Graduate Degree | 691 (87.0%) | 103 (13.0%) |
| Total | 2,002 (41.0%) | 2,880 (59.0%) |
Employment Characteristics in Cincinnati
Employment by Class of Employer in Cincinnati
Among the 151,332 employed individuals in Cincinnati, private company employees (103,419 | 68.3%), not-for-profit organizations (20,633 | 13.6%), and local government employees (8,548 | 5.7%) make up the most common classes of employment.
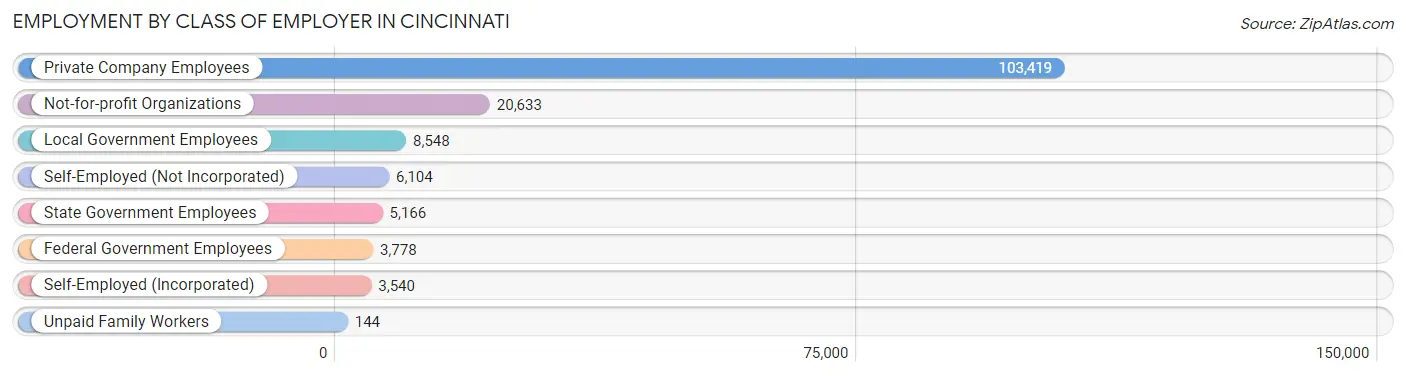
| Employer Class | # Employees | % Employees |
| Private Company Employees | 103,419 | 68.3% |
| Self-Employed (Incorporated) | 3,540 | 2.3% |
| Self-Employed (Not Incorporated) | 6,104 | 4.0% |
| Not-for-profit Organizations | 20,633 | 13.6% |
| Local Government Employees | 8,548 | 5.7% |
| State Government Employees | 5,166 | 3.4% |
| Federal Government Employees | 3,778 | 2.5% |
| Unpaid Family Workers | 144 | 0.1% |
| Total | 151,332 | 100.0% |
Employment Status by Age in Cincinnati
According to the labor force statistics for Cincinnati, out of the total population over 16 years of age (251,477), 66.1% or 166,226 individuals are in the labor force, with 6.9% or 11,470 of them unemployed. The age group with the highest labor force participation rate is 30 to 34 years, with 85.8% or 22,702 individuals in the labor force. Within the labor force, the 16 to 19 years age range has the highest percentage of unemployed individuals, with 16.5% or 1,452 of them being unemployed.
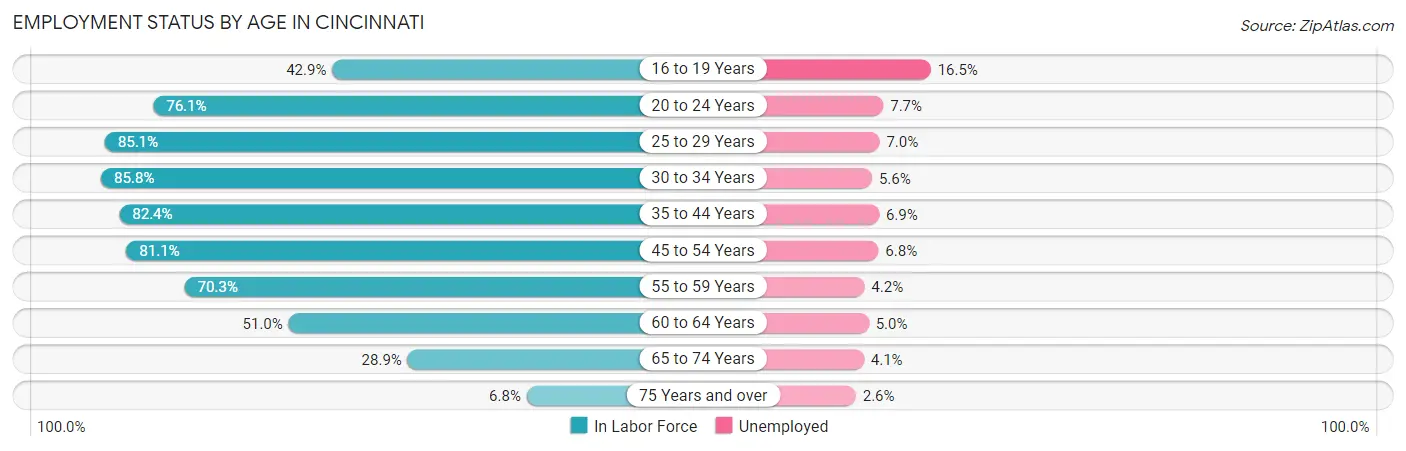
| Age Bracket | In Labor Force | Unemployed |
| 16 to 19 Years | 8,797 (42.9%) | 1,452 (16.5%) |
| 20 to 24 Years | 22,488 (76.1%) | 1,732 (7.7%) |
| 25 to 29 Years | 26,784 (85.1%) | 1,875 (7.0%) |
| 30 to 34 Years | 22,702 (85.8%) | 1,271 (5.6%) |
| 35 to 44 Years | 30,613 (82.4%) | 2,112 (6.9%) |
| 45 to 54 Years | 25,010 (81.1%) | 1,701 (6.8%) |
| 55 to 59 Years | 12,724 (70.3%) | 534 (4.2%) |
| 60 to 64 Years | 8,958 (51.0%) | 448 (5.0%) |
| 65 to 74 Years | 7,005 (28.9%) | 287 (4.1%) |
| 75 Years and over | 1,060 (6.8%) | 28 (2.6%) |
| Total | 166,226 (66.1%) | 11,470 (6.9%) |
Employment Status by Educational Attainment in Cincinnati
According to labor force statistics for Cincinnati, 78.4% of individuals (126,684) out of the total population between 25 and 64 years of age (161,587) are in the labor force, with 6.3% or 7,981 of them being unemployed. The group with the highest labor force participation rate are those with the educational attainment of bachelor's degree or higher, with 88.8% or 60,346 individuals in the labor force. Within the labor force, individuals with less than high school education have the highest percentage of unemployment, with 20.4% or 1,686 of them being unemployed.
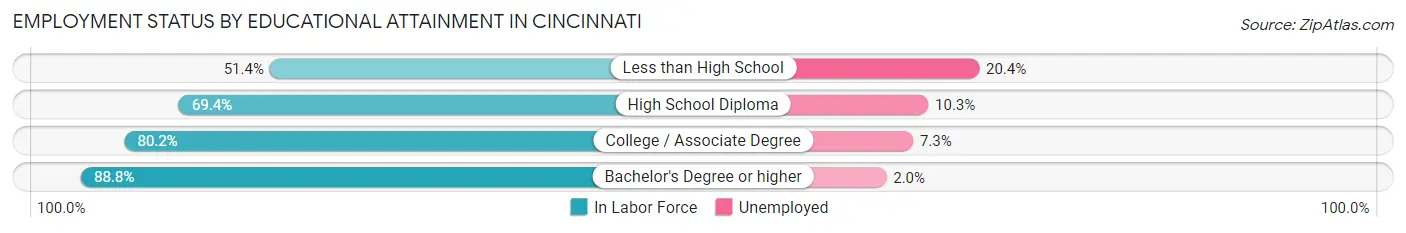
| Educational Attainment | In Labor Force | Unemployed |
| Less than High School | 8,263 (51.4%) | 3,280 (20.4%) |
| High School Diploma | 25,927 (69.4%) | 3,848 (10.3%) |
| College / Associate Degree | 32,236 (80.2%) | 2,934 (7.3%) |
| Bachelor's Degree or higher | 60,346 (88.8%) | 1,359 (2.0%) |
| Total | 126,684 (78.4%) | 10,180 (6.3%) |
Employment Occupations by Sex in Cincinnati
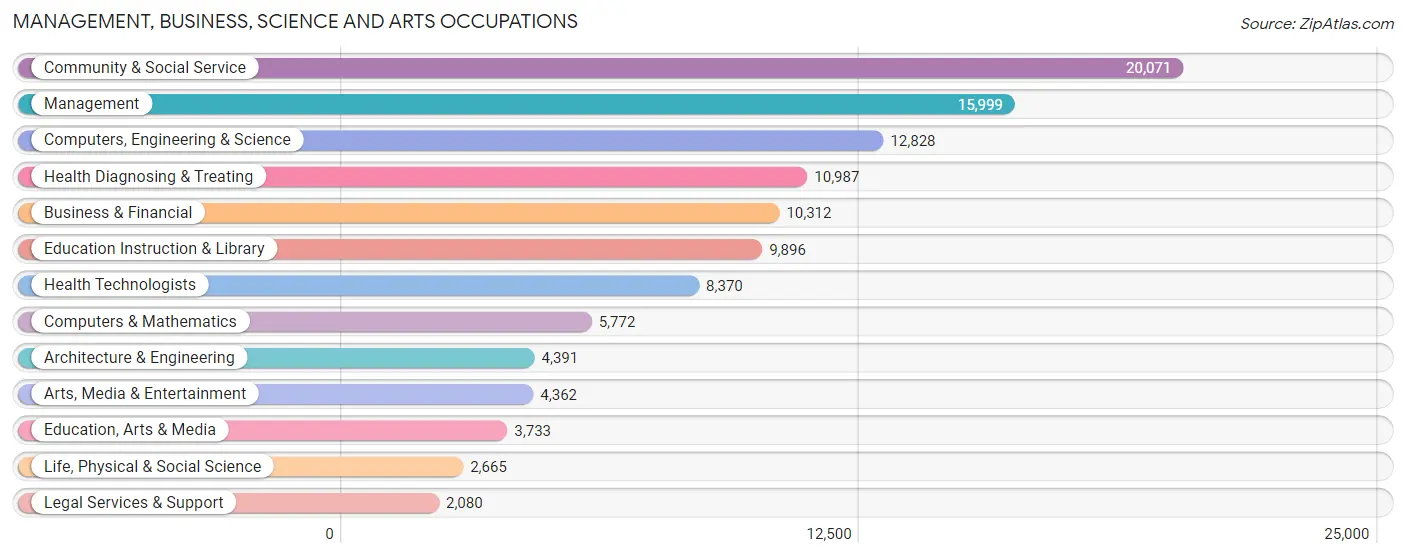
Management, Business, Science and Arts Occupations
The most common Management, Business, Science and Arts occupations in Cincinnati are Community & Social Service (20,071 | 13.0%), Management (15,999 | 10.3%), Computers, Engineering & Science (12,828 | 8.3%), Health Diagnosing & Treating (10,987 | 7.1%), and Business & Financial (10,312 | 6.7%).
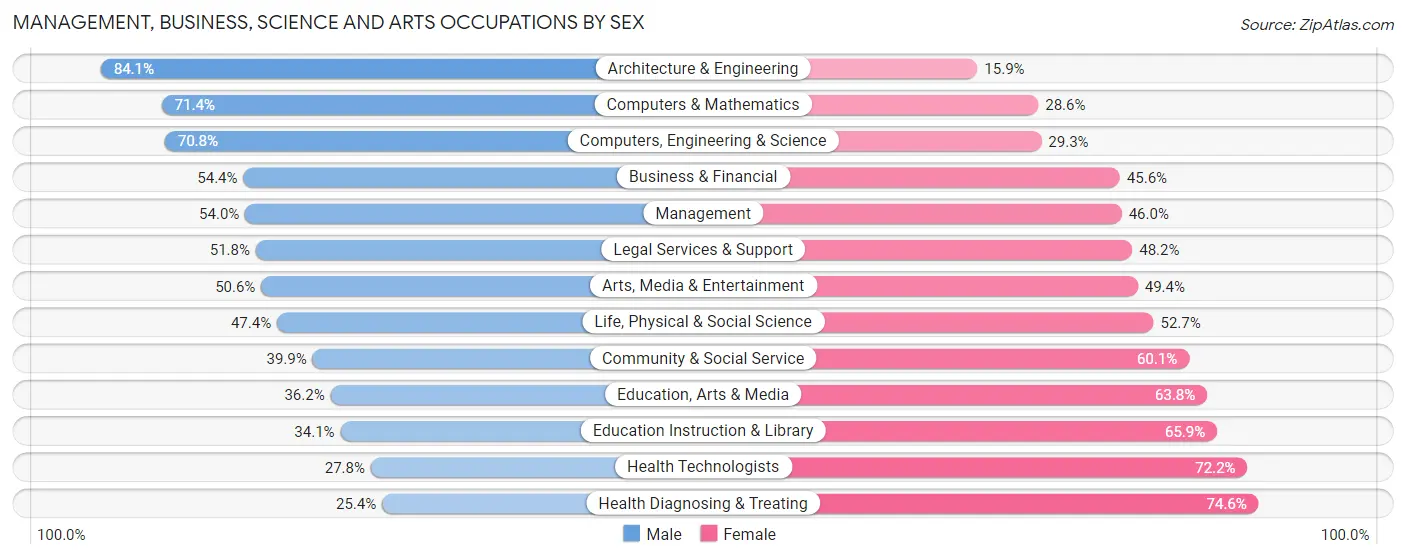
Management, Business, Science and Arts Occupations by Sex
Within the Management, Business, Science and Arts occupations in Cincinnati, the most male-oriented occupations are Architecture & Engineering (84.1%), Computers & Mathematics (71.4%), and Computers, Engineering & Science (70.8%), while the most female-oriented occupations are Health Diagnosing & Treating (74.6%), Health Technologists (72.2%), and Education Instruction & Library (65.9%).
| Occupation | Male | Female |
| Management | 8,638 (54.0%) | 7,361 (46.0%) |
| Business & Financial | 5,607 (54.4%) | 4,705 (45.6%) |
| Computers, Engineering & Science | 9,076 (70.8%) | 3,752 (29.2%) |
| Computers & Mathematics | 4,121 (71.4%) | 1,651 (28.6%) |
| Architecture & Engineering | 3,693 (84.1%) | 698 (15.9%) |
| Life, Physical & Social Science | 1,262 (47.3%) | 1,403 (52.6%) |
| Community & Social Service | 8,014 (39.9%) | 12,057 (60.1%) |
| Education, Arts & Media | 1,351 (36.2%) | 2,382 (63.8%) |
| Legal Services & Support | 1,077 (51.8%) | 1,003 (48.2%) |
| Education Instruction & Library | 3,377 (34.1%) | 6,519 (65.9%) |
| Arts, Media & Entertainment | 2,209 (50.6%) | 2,153 (49.4%) |
| Health Diagnosing & Treating | 2,794 (25.4%) | 8,193 (74.6%) |
| Health Technologists | 2,325 (27.8%) | 6,045 (72.2%) |
| Total (Category) | 34,129 (48.6%) | 36,068 (51.4%) |
| Total (Overall) | 76,971 (49.8%) | 77,558 (50.2%) |
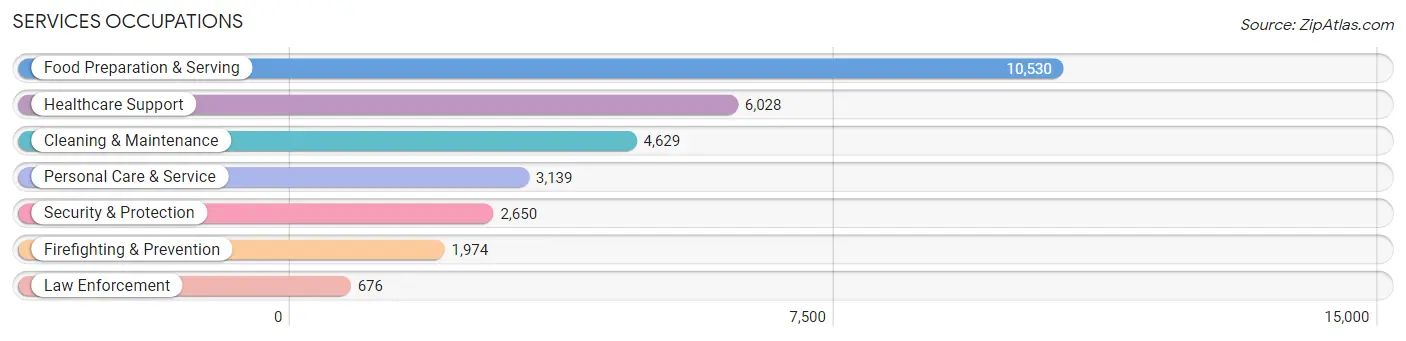
Services Occupations
The most common Services occupations in Cincinnati are Food Preparation & Serving (10,530 | 6.8%), Healthcare Support (6,028 | 3.9%), Cleaning & Maintenance (4,629 | 3.0%), Personal Care & Service (3,139 | 2.0%), and Security & Protection (2,650 | 1.7%).
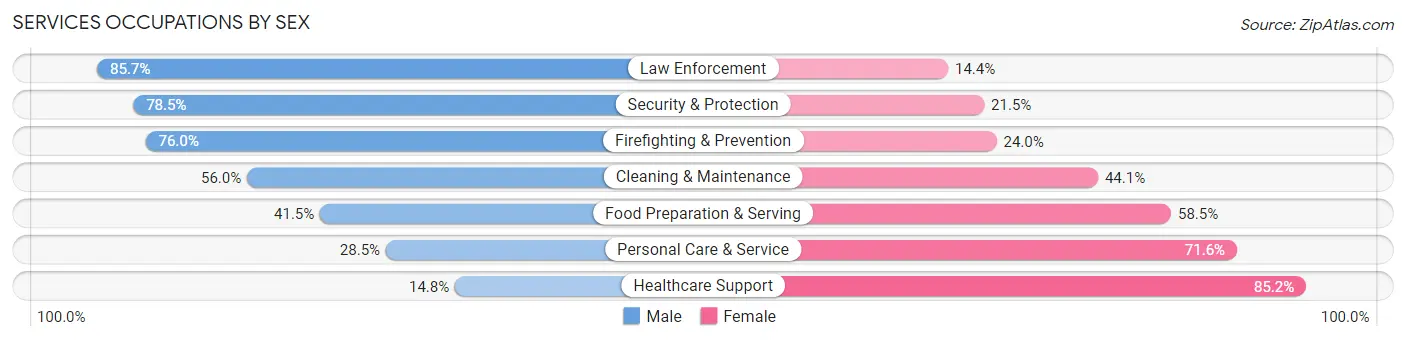
Services Occupations by Sex
Within the Services occupations in Cincinnati, the most male-oriented occupations are Law Enforcement (85.7%), Security & Protection (78.5%), and Firefighting & Prevention (76.0%), while the most female-oriented occupations are Healthcare Support (85.2%), Personal Care & Service (71.6%), and Food Preparation & Serving (58.5%).
| Occupation | Male | Female |
| Healthcare Support | 890 (14.8%) | 5,138 (85.2%) |
| Security & Protection | 2,080 (78.5%) | 570 (21.5%) |
| Firefighting & Prevention | 1,501 (76.0%) | 473 (24.0%) |
| Law Enforcement | 579 (85.7%) | 97 (14.3%) |
| Food Preparation & Serving | 4,368 (41.5%) | 6,162 (58.5%) |
| Cleaning & Maintenance | 2,590 (55.9%) | 2,039 (44.1%) |
| Personal Care & Service | 893 (28.4%) | 2,246 (71.6%) |
| Total (Category) | 10,821 (40.1%) | 16,155 (59.9%) |
| Total (Overall) | 76,971 (49.8%) | 77,558 (50.2%) |
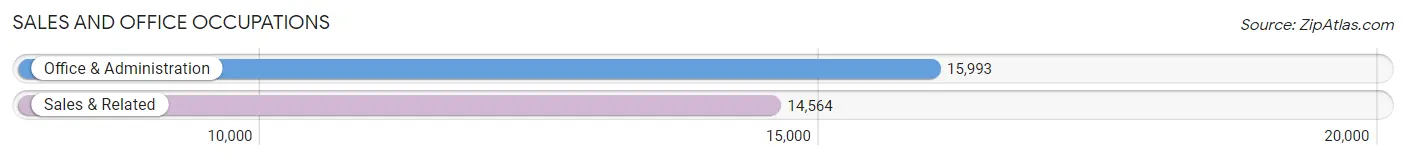
Sales and Office Occupations
The most common Sales and Office occupations in Cincinnati are Office & Administration (15,993 | 10.3%), and Sales & Related (14,564 | 9.4%).
Sales and Office Occupations by Sex
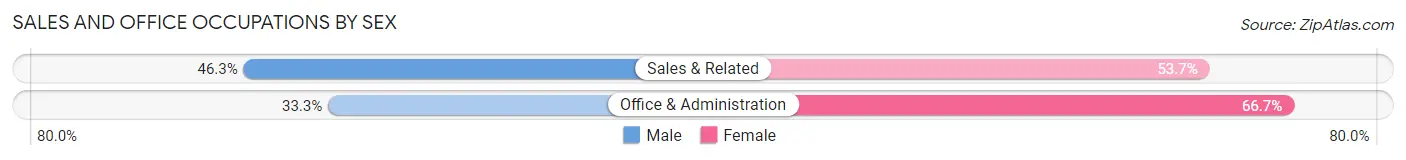
| Occupation | Male | Female |
| Sales & Related | 6,746 (46.3%) | 7,818 (53.7%) |
| Office & Administration | 5,329 (33.3%) | 10,664 (66.7%) |
| Total (Category) | 12,075 (39.5%) | 18,482 (60.5%) |
| Total (Overall) | 76,971 (49.8%) | 77,558 (50.2%) |
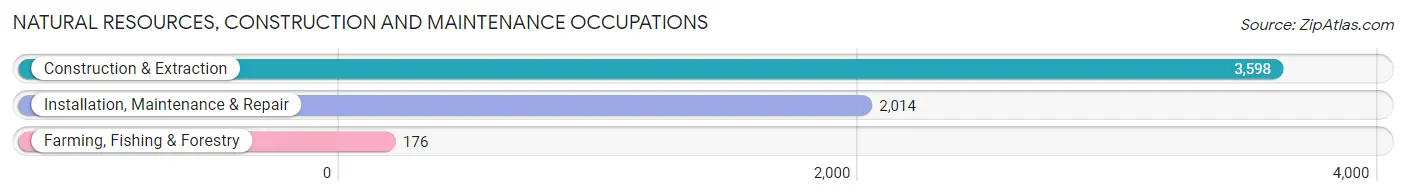
Natural Resources, Construction and Maintenance Occupations
The most common Natural Resources, Construction and Maintenance occupations in Cincinnati are Construction & Extraction (3,598 | 2.3%), Installation, Maintenance & Repair (2,014 | 1.3%), and Farming, Fishing & Forestry (176 | 0.1%).
Natural Resources, Construction and Maintenance Occupations by Sex
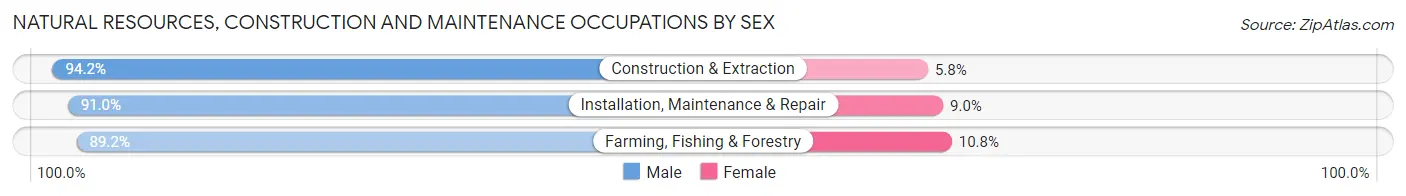
| Occupation | Male | Female |
| Farming, Fishing & Forestry | 157 (89.2%) | 19 (10.8%) |
| Construction & Extraction | 3,388 (94.2%) | 210 (5.8%) |
| Installation, Maintenance & Repair | 1,833 (91.0%) | 181 (9.0%) |
| Total (Category) | 5,378 (92.9%) | 410 (7.1%) |
| Total (Overall) | 76,971 (49.8%) | 77,558 (50.2%) |
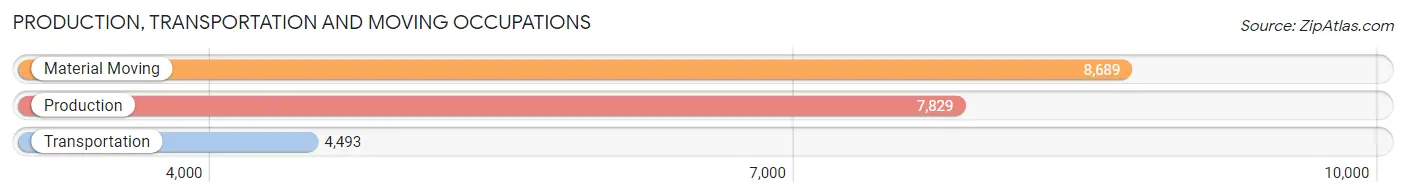
Production, Transportation and Moving Occupations
The most common Production, Transportation and Moving occupations in Cincinnati are Material Moving (8,689 | 5.6%), Production (7,829 | 5.1%), and Transportation (4,493 | 2.9%).
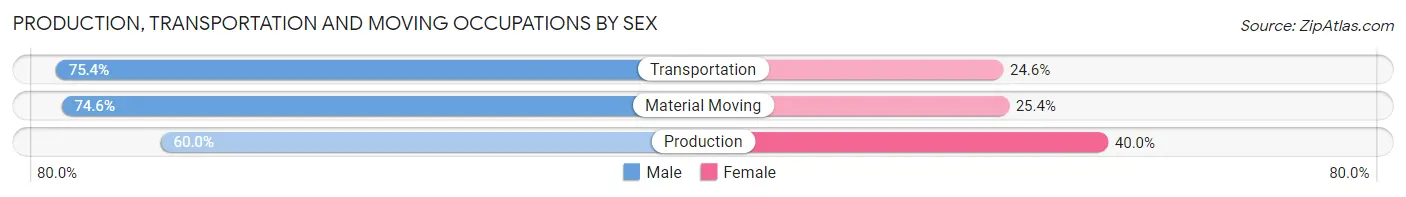
Production, Transportation and Moving Occupations by Sex
| Occupation | Male | Female |
| Production | 4,700 (60.0%) | 3,129 (40.0%) |
| Transportation | 3,388 (75.4%) | 1,105 (24.6%) |
| Material Moving | 6,480 (74.6%) | 2,209 (25.4%) |
| Total (Category) | 14,568 (69.3%) | 6,443 (30.7%) |
| Total (Overall) | 76,971 (49.8%) | 77,558 (50.2%) |
Employment Industries by Sex in Cincinnati
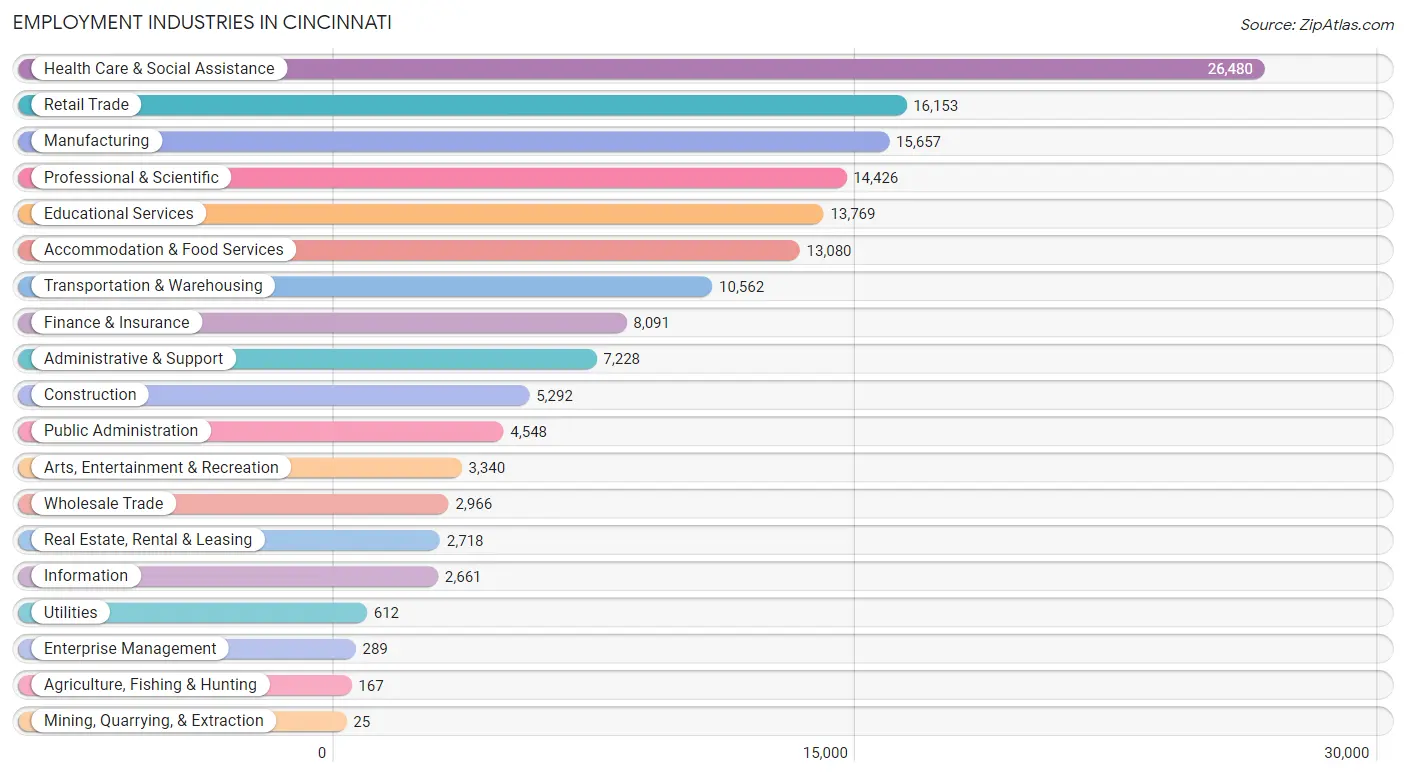
Employment Industries in Cincinnati
The major employment industries in Cincinnati include Health Care & Social Assistance (26,480 | 17.1%), Retail Trade (16,153 | 10.4%), Manufacturing (15,657 | 10.1%), Professional & Scientific (14,426 | 9.3%), and Educational Services (13,769 | 8.9%).
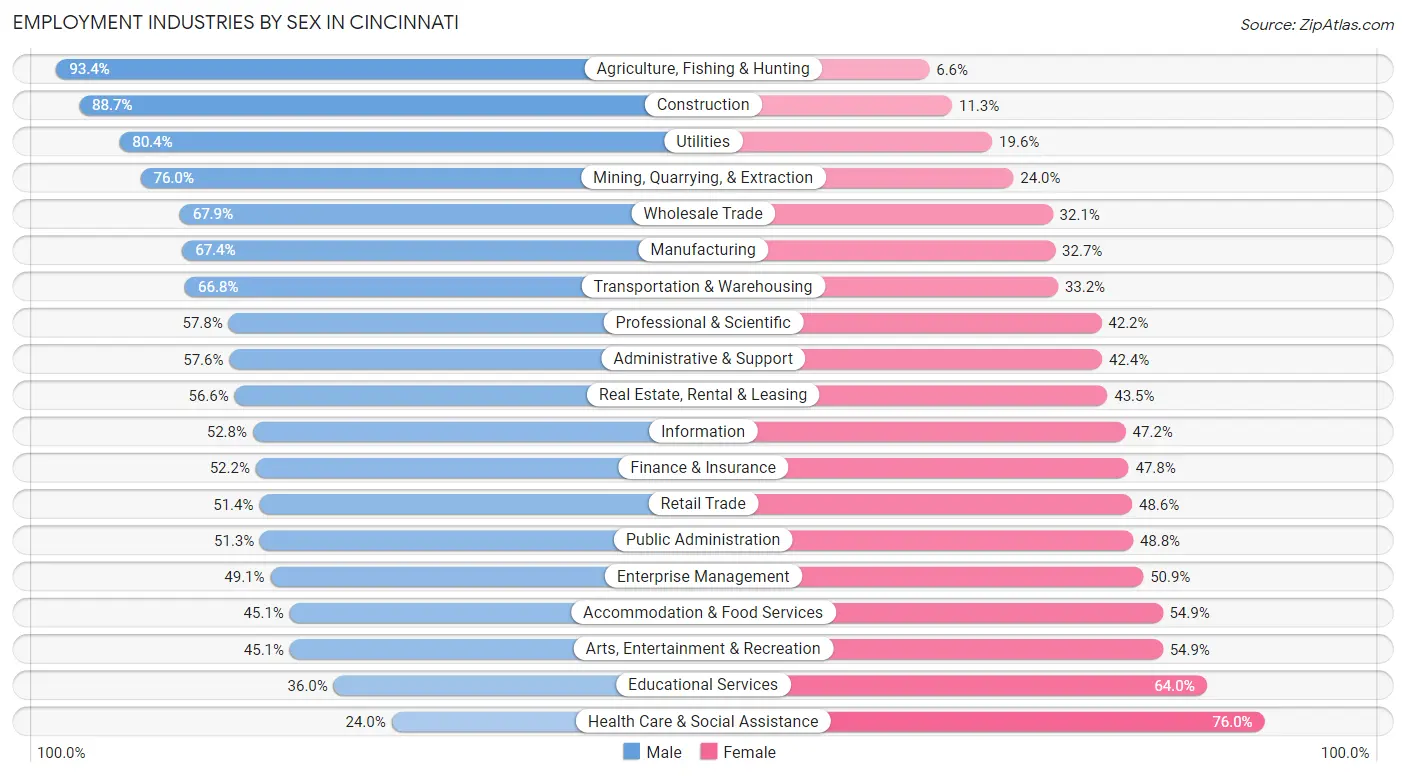
Employment Industries by Sex in Cincinnati
The Cincinnati industries that see more men than women are Agriculture, Fishing & Hunting (93.4%), Construction (88.7%), and Utilities (80.4%), whereas the industries that tend to have a higher number of women are Health Care & Social Assistance (76.0%), Educational Services (64.0%), and Arts, Entertainment & Recreation (54.9%).
| Industry | Male | Female |
| Agriculture, Fishing & Hunting | 156 (93.4%) | 11 (6.6%) |
| Mining, Quarrying, & Extraction | 19 (76.0%) | 6 (24.0%) |
| Construction | 4,694 (88.7%) | 598 (11.3%) |
| Manufacturing | 10,545 (67.3%) | 5,112 (32.7%) |
| Wholesale Trade | 2,013 (67.9%) | 953 (32.1%) |
| Retail Trade | 8,307 (51.4%) | 7,846 (48.6%) |
| Transportation & Warehousing | 7,052 (66.8%) | 3,510 (33.2%) |
| Utilities | 492 (80.4%) | 120 (19.6%) |
| Information | 1,404 (52.8%) | 1,257 (47.2%) |
| Finance & Insurance | 4,220 (52.2%) | 3,871 (47.8%) |
| Real Estate, Rental & Leasing | 1,537 (56.6%) | 1,181 (43.4%) |
| Professional & Scientific | 8,337 (57.8%) | 6,089 (42.2%) |
| Enterprise Management | 142 (49.1%) | 147 (50.9%) |
| Administrative & Support | 4,166 (57.6%) | 3,062 (42.4%) |
| Educational Services | 4,963 (36.0%) | 8,806 (64.0%) |
| Health Care & Social Assistance | 6,365 (24.0%) | 20,115 (76.0%) |
| Arts, Entertainment & Recreation | 1,506 (45.1%) | 1,834 (54.9%) |
| Accommodation & Food Services | 5,904 (45.1%) | 7,176 (54.9%) |
| Public Administration | 2,331 (51.2%) | 2,217 (48.7%) |
| Total | 76,971 (49.8%) | 77,558 (50.2%) |
Education in Cincinnati
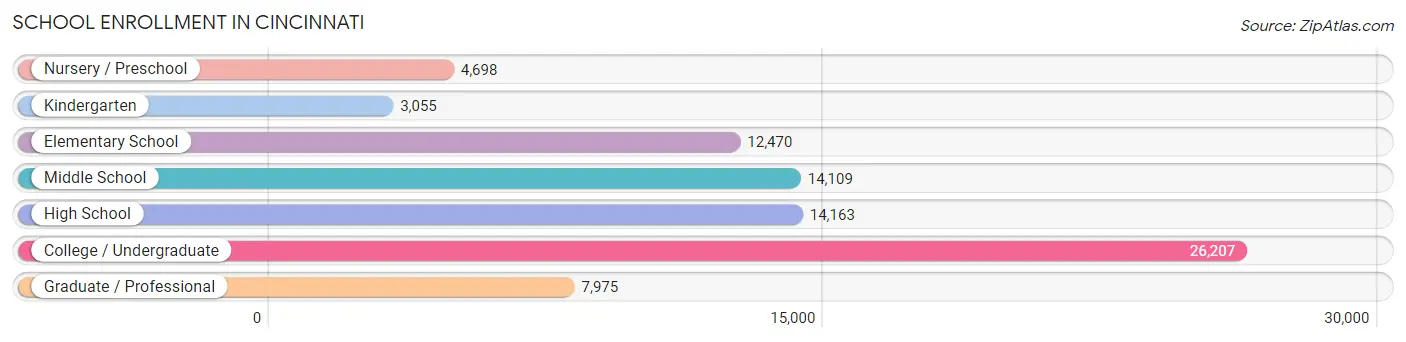
School Enrollment in Cincinnati
The most common levels of schooling among the 82,677 students in Cincinnati are college / undergraduate (26,207 | 31.7%), high school (14,163 | 17.1%), and middle school (14,109 | 17.1%).
| School Level | # Students | % Students |
| Nursery / Preschool | 4,698 | 5.7% |
| Kindergarten | 3,055 | 3.7% |
| Elementary School | 12,470 | 15.1% |
| Middle School | 14,109 | 17.1% |
| High School | 14,163 | 17.1% |
| College / Undergraduate | 26,207 | 31.7% |
| Graduate / Professional | 7,975 | 9.7% |
| Total | 82,677 | 100.0% |
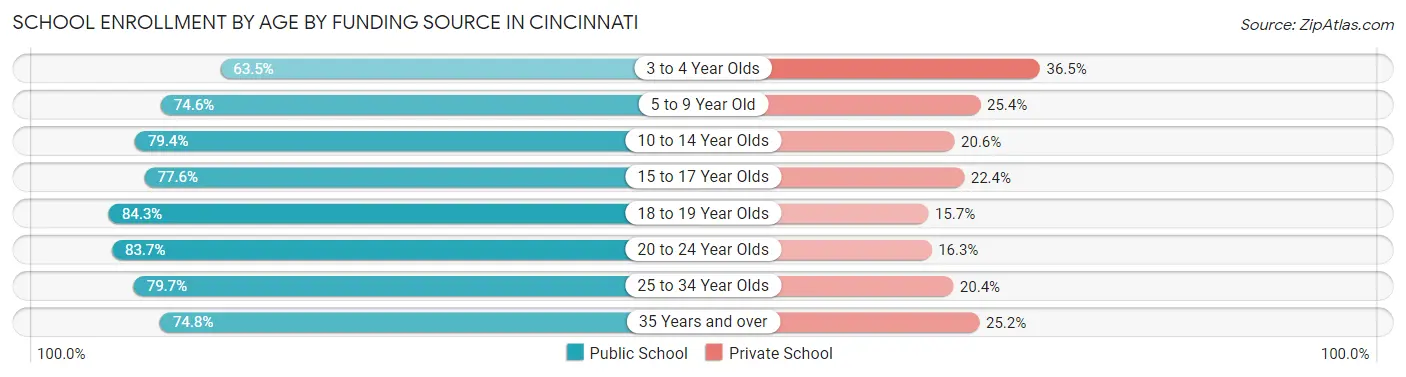
School Enrollment by Age by Funding Source in Cincinnati
Out of a total of 82,677 students who are enrolled in schools in Cincinnati, 17,528 (21.2%) attend a private institution, while the remaining 65,149 (78.8%) are enrolled in public schools. The age group of 3 to 4 year olds has the highest likelihood of being enrolled in private schools, with 1,480 (36.5% in the age bracket) enrolled. Conversely, the age group of 18 to 19 year olds has the lowest likelihood of being enrolled in a private school, with 8,807 (84.3% in the age bracket) attending a public institution.
| Age Bracket | Public School | Private School |
| 3 to 4 Year Olds | 2,577 (63.5%) | 1,480 (36.5%) |
| 5 to 9 Year Old | 10,721 (74.6%) | 3,651 (25.4%) |
| 10 to 14 Year Olds | 13,776 (79.4%) | 3,567 (20.6%) |
| 15 to 17 Year Olds | 7,600 (77.6%) | 2,190 (22.4%) |
| 18 to 19 Year Olds | 8,807 (84.3%) | 1,641 (15.7%) |
| 20 to 24 Year Olds | 12,276 (83.7%) | 2,391 (16.3%) |
| 25 to 34 Year Olds | 6,448 (79.6%) | 1,647 (20.3%) |
| 35 Years and over | 2,920 (74.8%) | 985 (25.2%) |
| Total | 65,149 (78.8%) | 17,528 (21.2%) |
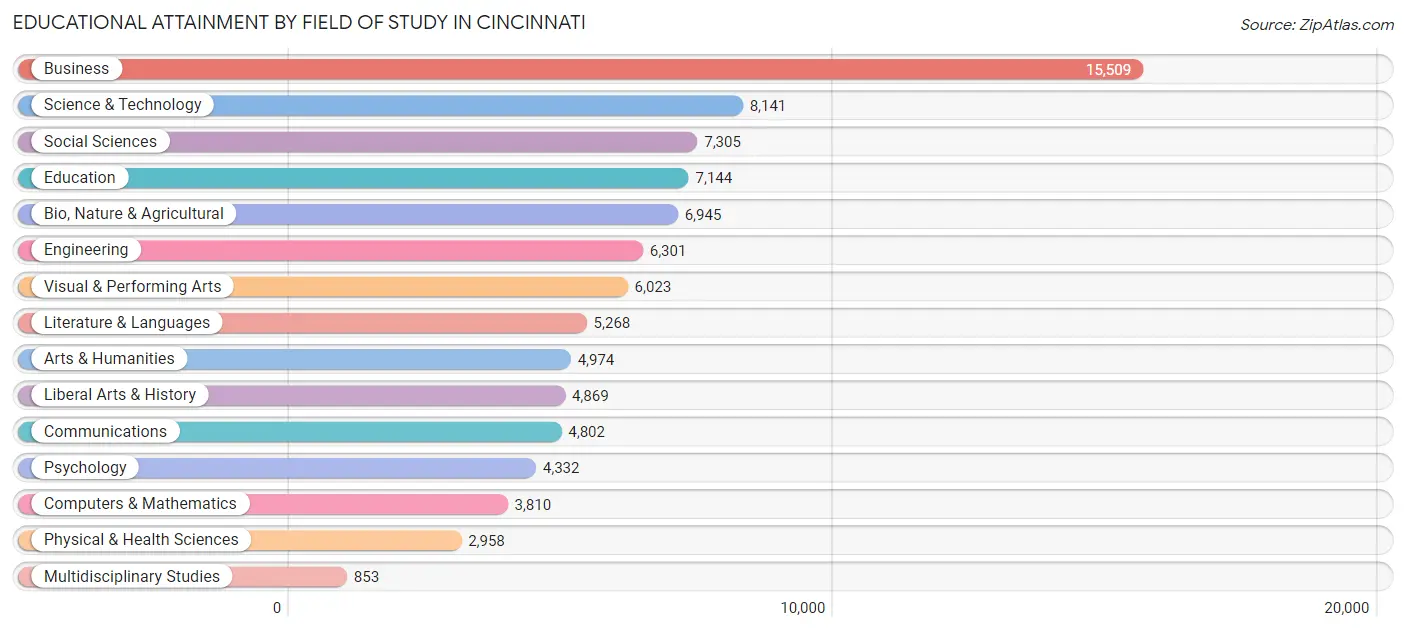
Educational Attainment by Field of Study in Cincinnati
Business (15,509 | 17.4%), science & technology (8,141 | 9.1%), social sciences (7,305 | 8.2%), education (7,144 | 8.0%), and bio, nature & agricultural (6,945 | 7.8%) are the most common fields of study among 89,234 individuals in Cincinnati who have obtained a bachelor's degree or higher.
| Field of Study | # Graduates | % Graduates |
| Computers & Mathematics | 3,810 | 4.3% |
| Bio, Nature & Agricultural | 6,945 | 7.8% |
| Physical & Health Sciences | 2,958 | 3.3% |
| Psychology | 4,332 | 4.9% |
| Social Sciences | 7,305 | 8.2% |
| Engineering | 6,301 | 7.1% |
| Multidisciplinary Studies | 853 | 1.0% |
| Science & Technology | 8,141 | 9.1% |
| Business | 15,509 | 17.4% |
| Education | 7,144 | 8.0% |
| Literature & Languages | 5,268 | 5.9% |
| Liberal Arts & History | 4,869 | 5.5% |
| Visual & Performing Arts | 6,023 | 6.8% |
| Communications | 4,802 | 5.4% |
| Arts & Humanities | 4,974 | 5.6% |
| Total | 89,234 | 100.0% |
Transportation & Commute in Cincinnati
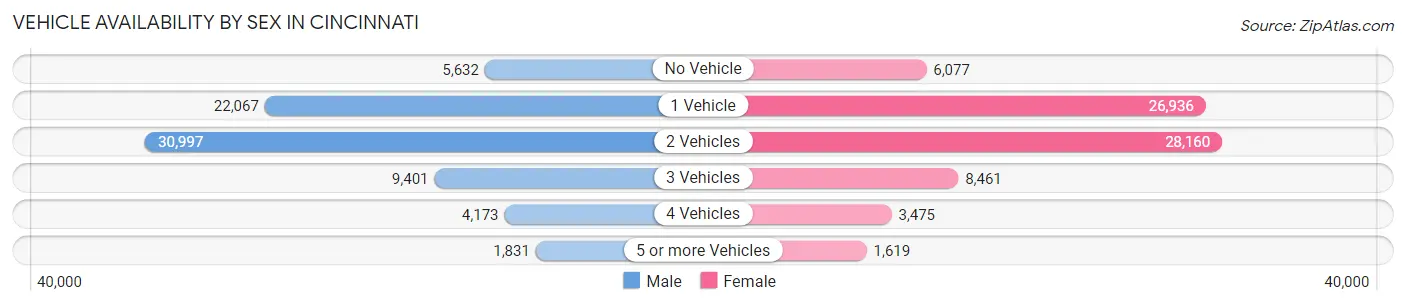
Vehicle Availability by Sex in Cincinnati
The most prevalent vehicle ownership categories in Cincinnati are males with 2 vehicles (30,997, accounting for 41.8%) and females with 2 vehicles (28,160, making up 41.5%).
| Vehicles Available | Male | Female |
| No Vehicle | 5,632 (7.6%) | 6,077 (8.1%) |
| 1 Vehicle | 22,067 (29.8%) | 26,936 (36.0%) |
| 2 Vehicles | 30,997 (41.8%) | 28,160 (37.7%) |
| 3 Vehicles | 9,401 (12.7%) | 8,461 (11.3%) |
| 4 Vehicles | 4,173 (5.6%) | 3,475 (4.6%) |
| 5 or more Vehicles | 1,831 (2.5%) | 1,619 (2.2%) |
| Total | 74,101 (100.0%) | 74,728 (100.0%) |
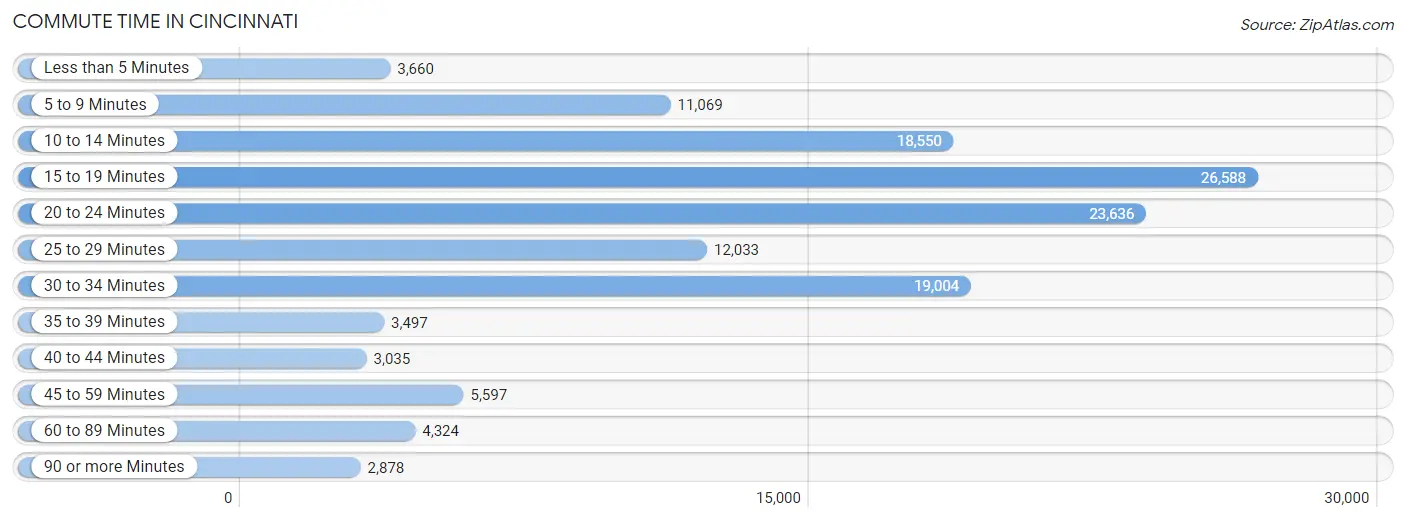
Commute Time in Cincinnati
The most frequently occuring commute durations in Cincinnati are 15 to 19 minutes (26,588 commuters, 19.9%), 20 to 24 minutes (23,636 commuters, 17.7%), and 30 to 34 minutes (19,004 commuters, 14.2%).
| Commute Time | # Commuters | % Commuters |
| Less than 5 Minutes | 3,660 | 2.7% |
| 5 to 9 Minutes | 11,069 | 8.3% |
| 10 to 14 Minutes | 18,550 | 13.9% |
| 15 to 19 Minutes | 26,588 | 19.9% |
| 20 to 24 Minutes | 23,636 | 17.7% |
| 25 to 29 Minutes | 12,033 | 9.0% |
| 30 to 34 Minutes | 19,004 | 14.2% |
| 35 to 39 Minutes | 3,497 | 2.6% |
| 40 to 44 Minutes | 3,035 | 2.3% |
| 45 to 59 Minutes | 5,597 | 4.2% |
| 60 to 89 Minutes | 4,324 | 3.2% |
| 90 or more Minutes | 2,878 | 2.1% |
Commute Time by Sex in Cincinnati
The most common commute times in Cincinnati are 15 to 19 minutes (13,370 commuters, 20.1%) for males and 15 to 19 minutes (13,218 commuters, 19.6%) for females.
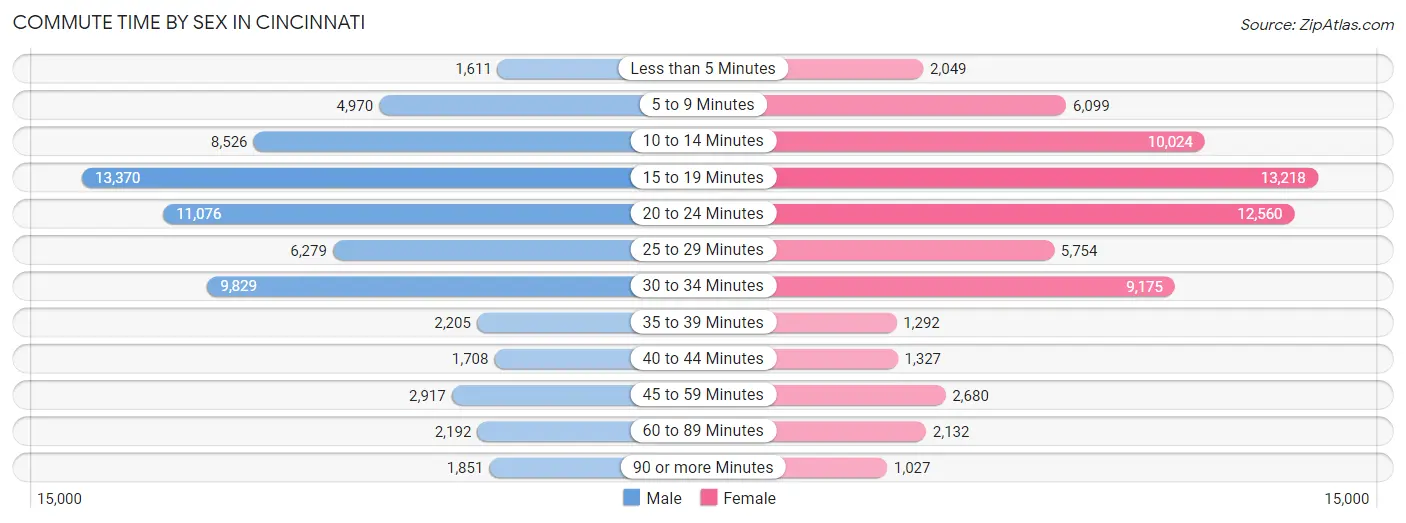
| Commute Time | Male | Female |
| Less than 5 Minutes | 1,611 (2.4%) | 2,049 (3.0%) |
| 5 to 9 Minutes | 4,970 (7.5%) | 6,099 (9.1%) |
| 10 to 14 Minutes | 8,526 (12.8%) | 10,024 (14.9%) |
| 15 to 19 Minutes | 13,370 (20.1%) | 13,218 (19.6%) |
| 20 to 24 Minutes | 11,076 (16.7%) | 12,560 (18.6%) |
| 25 to 29 Minutes | 6,279 (9.4%) | 5,754 (8.6%) |
| 30 to 34 Minutes | 9,829 (14.8%) | 9,175 (13.6%) |
| 35 to 39 Minutes | 2,205 (3.3%) | 1,292 (1.9%) |
| 40 to 44 Minutes | 1,708 (2.6%) | 1,327 (2.0%) |
| 45 to 59 Minutes | 2,917 (4.4%) | 2,680 (4.0%) |
| 60 to 89 Minutes | 2,192 (3.3%) | 2,132 (3.2%) |
| 90 or more Minutes | 1,851 (2.8%) | 1,027 (1.5%) |
Time of Departure to Work by Sex in Cincinnati
The most frequent times of departure to work in Cincinnati are 7:30 AM to 7:59 AM (8,417, 12.7%) for males and 7:00 AM to 7:29 AM (9,305, 13.8%) for females.
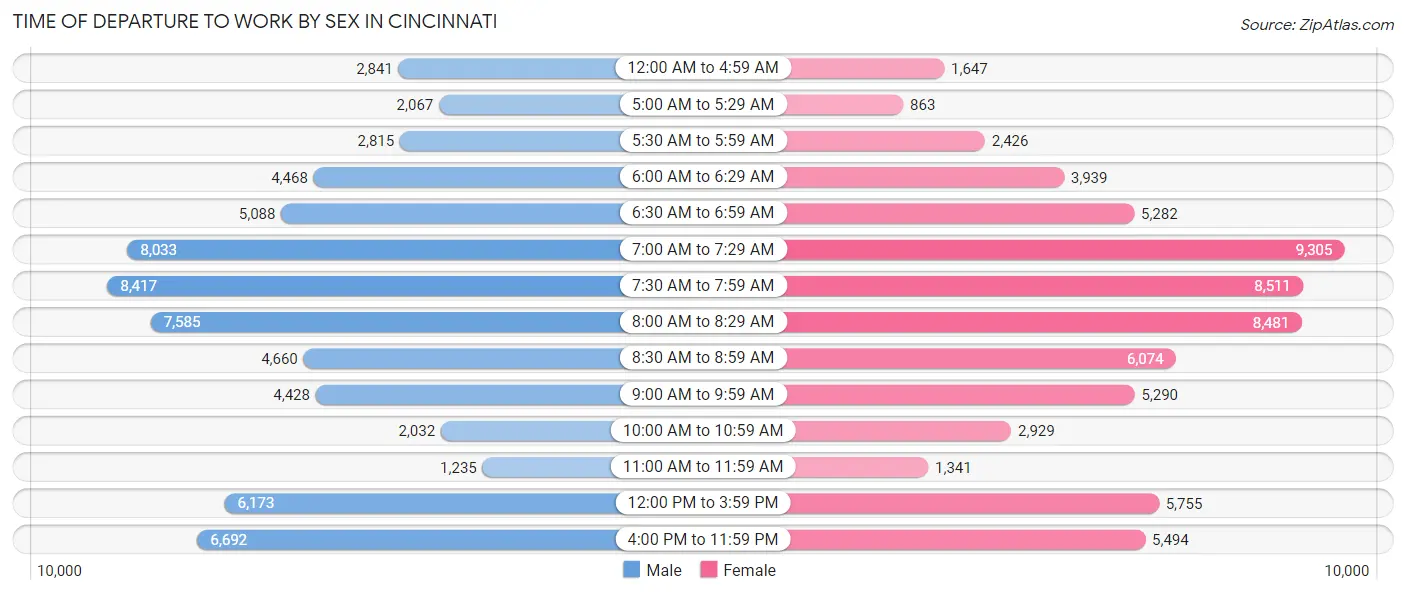
| Time of Departure | Male | Female |
| 12:00 AM to 4:59 AM | 2,841 (4.3%) | 1,647 (2.5%) |
| 5:00 AM to 5:29 AM | 2,067 (3.1%) | 863 (1.3%) |
| 5:30 AM to 5:59 AM | 2,815 (4.2%) | 2,426 (3.6%) |
| 6:00 AM to 6:29 AM | 4,468 (6.7%) | 3,939 (5.9%) |
| 6:30 AM to 6:59 AM | 5,088 (7.6%) | 5,282 (7.8%) |
| 7:00 AM to 7:29 AM | 8,033 (12.1%) | 9,305 (13.8%) |
| 7:30 AM to 7:59 AM | 8,417 (12.7%) | 8,511 (12.6%) |
| 8:00 AM to 8:29 AM | 7,585 (11.4%) | 8,481 (12.6%) |
| 8:30 AM to 8:59 AM | 4,660 (7.0%) | 6,074 (9.0%) |
| 9:00 AM to 9:59 AM | 4,428 (6.7%) | 5,290 (7.9%) |
| 10:00 AM to 10:59 AM | 2,032 (3.0%) | 2,929 (4.3%) |
| 11:00 AM to 11:59 AM | 1,235 (1.9%) | 1,341 (2.0%) |
| 12:00 PM to 3:59 PM | 6,173 (9.3%) | 5,755 (8.6%) |
| 4:00 PM to 11:59 PM | 6,692 (10.1%) | 5,494 (8.2%) |
| Total | 66,534 (100.0%) | 67,337 (100.0%) |
Housing Occupancy in Cincinnati
Occupancy by Ownership in Cincinnati
Of the total 141,033 dwellings in Cincinnati, owner-occupied units account for 55,455 (39.3%), while renter-occupied units make up 85,578 (60.7%).
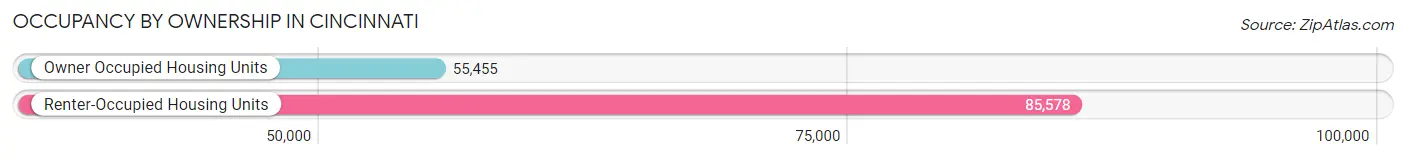
| Occupancy | # Housing Units | % Housing Units |
| Owner Occupied Housing Units | 55,455 | 39.3% |
| Renter-Occupied Housing Units | 85,578 | 60.7% |
| Total Occupied Housing Units | 141,033 | 100.0% |
Occupancy by Household Size in Cincinnati
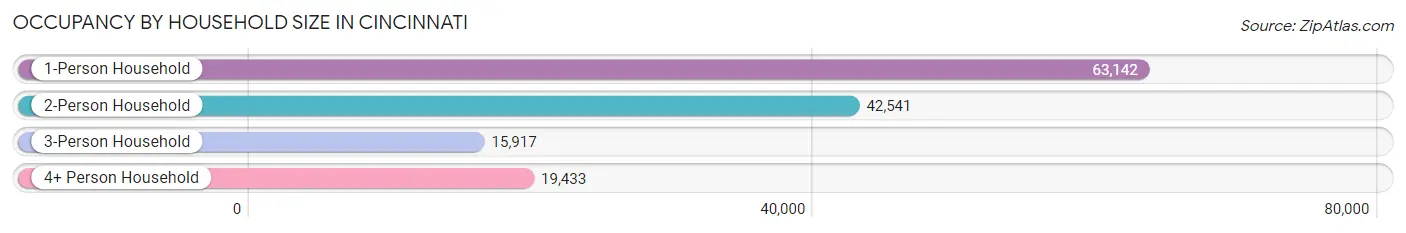
| Household Size | # Housing Units | % Housing Units |
| 1-Person Household | 63,142 | 44.8% |
| 2-Person Household | 42,541 | 30.2% |
| 3-Person Household | 15,917 | 11.3% |
| 4+ Person Household | 19,433 | 13.8% |
| Total Housing Units | 141,033 | 100.0% |
Occupancy by Ownership by Household Size in Cincinnati
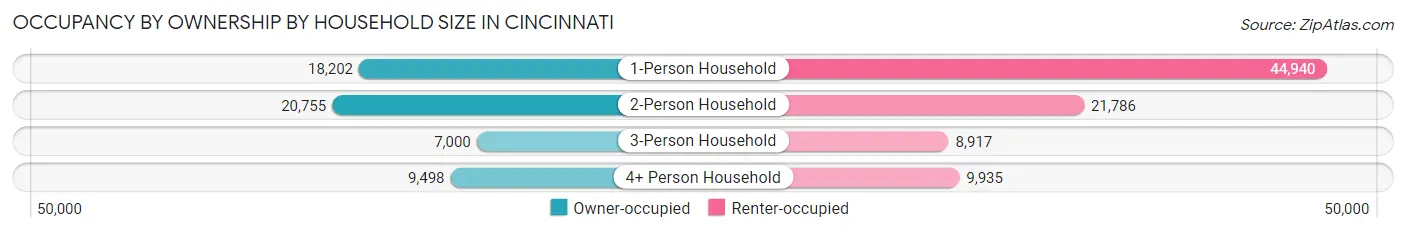
| Household Size | Owner-occupied | Renter-occupied |
| 1-Person Household | 18,202 (28.8%) | 44,940 (71.2%) |
| 2-Person Household | 20,755 (48.8%) | 21,786 (51.2%) |
| 3-Person Household | 7,000 (44.0%) | 8,917 (56.0%) |
| 4+ Person Household | 9,498 (48.9%) | 9,935 (51.1%) |
| Total Housing Units | 55,455 (39.3%) | 85,578 (60.7%) |
Occupancy by Educational Attainment in Cincinnati
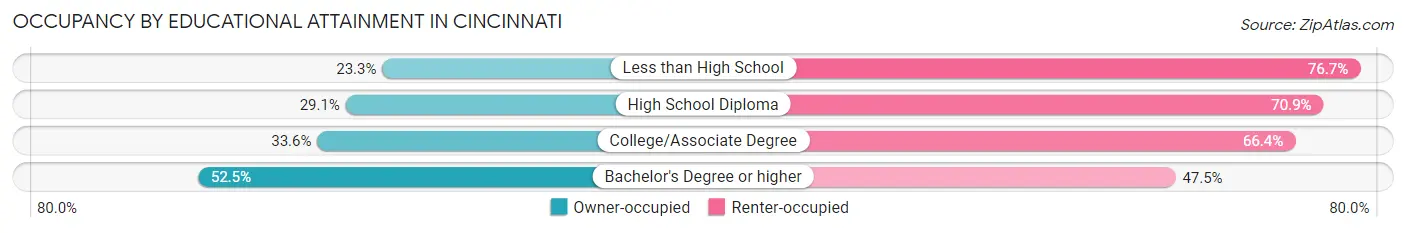
| Household Size | Owner-occupied | Renter-occupied |
| Less than High School | 3,333 (23.3%) | 10,995 (76.7%) |
| High School Diploma | 8,908 (29.1%) | 21,740 (70.9%) |
| College/Associate Degree | 12,830 (33.6%) | 25,384 (66.4%) |
| Bachelor's Degree or higher | 30,384 (52.5%) | 27,459 (47.5%) |
Occupancy by Age of Householder in Cincinnati
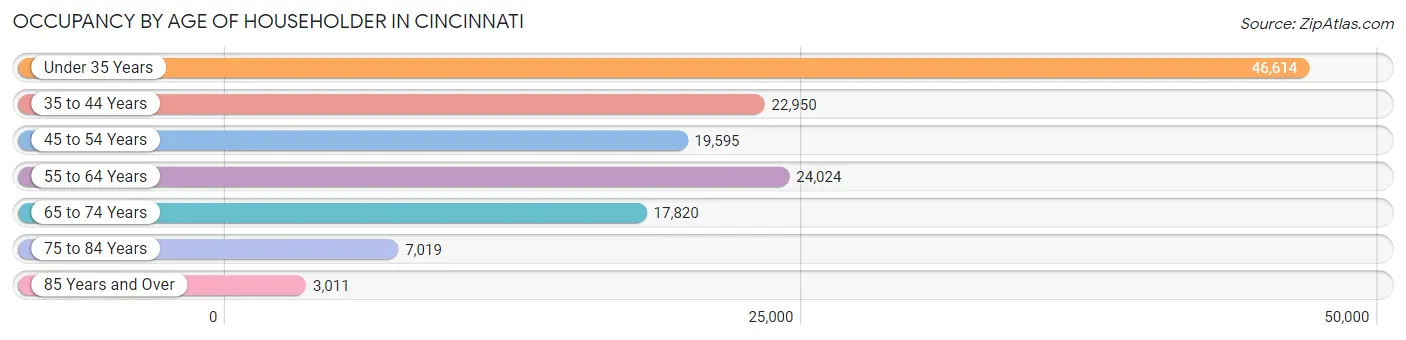
| Age Bracket | # Households | % Households |
| Under 35 Years | 46,614 | 33.1% |
| 35 to 44 Years | 22,950 | 16.3% |
| 45 to 54 Years | 19,595 | 13.9% |
| 55 to 64 Years | 24,024 | 17.0% |
| 65 to 74 Years | 17,820 | 12.6% |
| 75 to 84 Years | 7,019 | 5.0% |
| 85 Years and Over | 3,011 | 2.1% |
| Total | 141,033 | 100.0% |
Housing Finances in Cincinnati
Median Income by Occupancy in Cincinnati
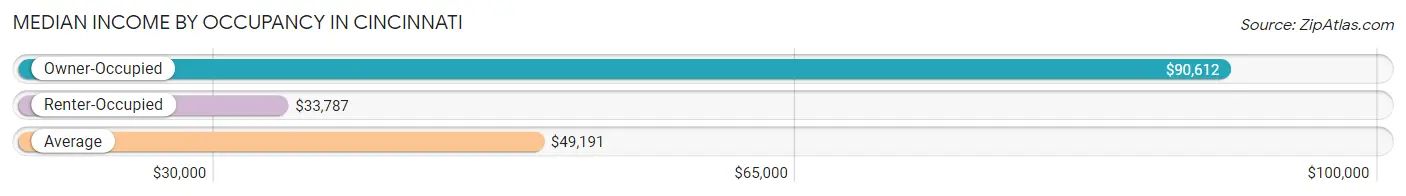
| Occupancy Type | # Households | Median Income |
| Owner-Occupied | 55,455 (39.3%) | $90,612 |
| Renter-Occupied | 85,578 (60.7%) | $33,787 |
| Average | 141,033 (100.0%) | $49,191 |
Occupancy by Householder Income Bracket in Cincinnati
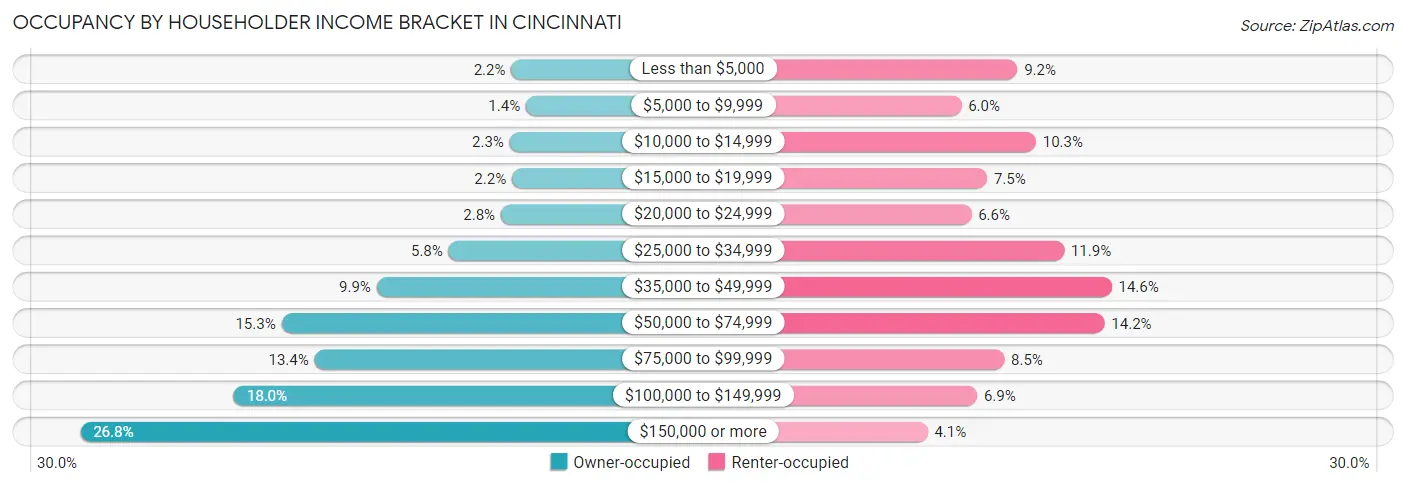
| Income Bracket | Owner-occupied | Renter-occupied |
| Less than $5,000 | 1,216 (2.2%) | 7,910 (9.2%) |
| $5,000 to $9,999 | 748 (1.3%) | 5,167 (6.0%) |
| $10,000 to $14,999 | 1,262 (2.3%) | 8,818 (10.3%) |
| $15,000 to $19,999 | 1,191 (2.1%) | 6,429 (7.5%) |
| $20,000 to $24,999 | 1,541 (2.8%) | 5,660 (6.6%) |
| $25,000 to $34,999 | 3,199 (5.8%) | 10,189 (11.9%) |
| $35,000 to $49,999 | 5,479 (9.9%) | 12,519 (14.6%) |
| $50,000 to $74,999 | 8,495 (15.3%) | 12,168 (14.2%) |
| $75,000 to $99,999 | 7,448 (13.4%) | 7,267 (8.5%) |
| $100,000 to $149,999 | 10,004 (18.0%) | 5,938 (6.9%) |
| $150,000 or more | 14,872 (26.8%) | 3,513 (4.1%) |
| Total | 55,455 (100.0%) | 85,578 (100.0%) |
Monthly Housing Cost Tiers in Cincinnati
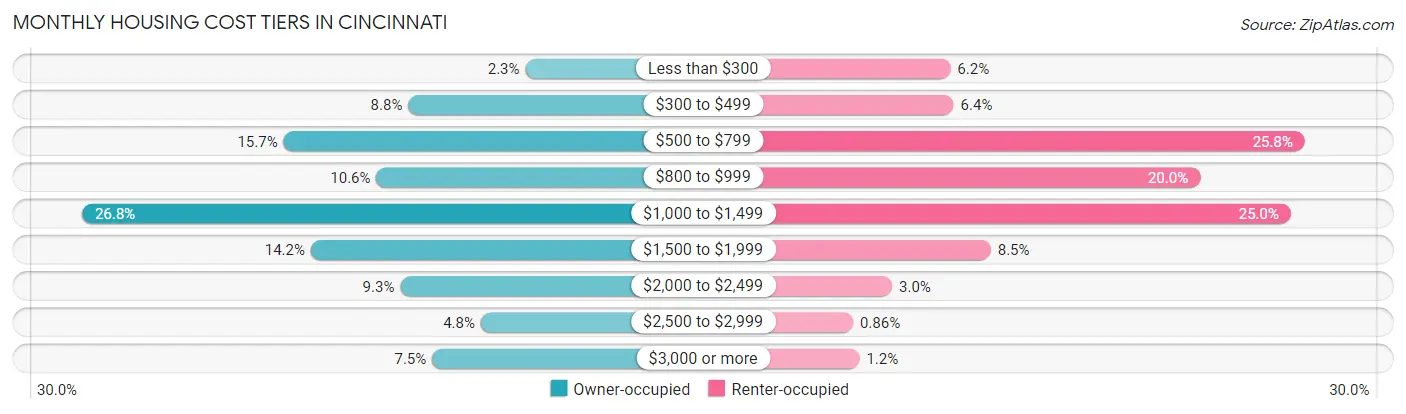
| Monthly Cost | Owner-occupied | Renter-occupied |
| Less than $300 | 1,298 (2.3%) | 5,343 (6.2%) |
| $300 to $499 | 4,888 (8.8%) | 5,492 (6.4%) |
| $500 to $799 | 8,708 (15.7%) | 22,088 (25.8%) |
| $800 to $999 | 5,863 (10.6%) | 17,137 (20.0%) |
| $1,000 to $1,499 | 14,879 (26.8%) | 21,426 (25.0%) |
| $1,500 to $1,999 | 7,869 (14.2%) | 7,250 (8.5%) |
| $2,000 to $2,499 | 5,132 (9.2%) | 2,587 (3.0%) |
| $2,500 to $2,999 | 2,664 (4.8%) | 736 (0.9%) |
| $3,000 or more | 4,154 (7.5%) | 1,048 (1.2%) |
| Total | 55,455 (100.0%) | 85,578 (100.0%) |
Physical Housing Characteristics in Cincinnati
Housing Structures in Cincinnati
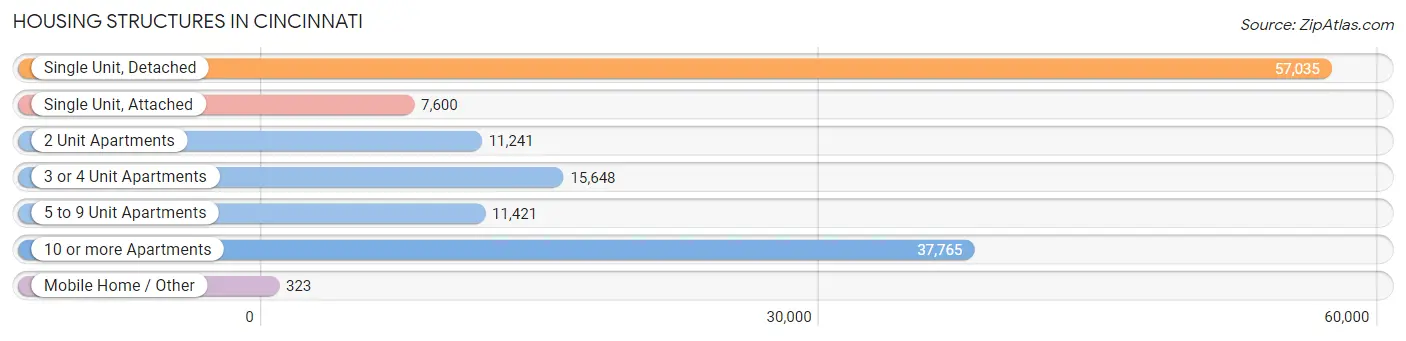
| Structure Type | # Housing Units | % Housing Units |
| Single Unit, Detached | 57,035 | 40.4% |
| Single Unit, Attached | 7,600 | 5.4% |
| 2 Unit Apartments | 11,241 | 8.0% |
| 3 or 4 Unit Apartments | 15,648 | 11.1% |
| 5 to 9 Unit Apartments | 11,421 | 8.1% |
| 10 or more Apartments | 37,765 | 26.8% |
| Mobile Home / Other | 323 | 0.2% |
| Total | 141,033 | 100.0% |
Housing Structures by Occupancy in Cincinnati
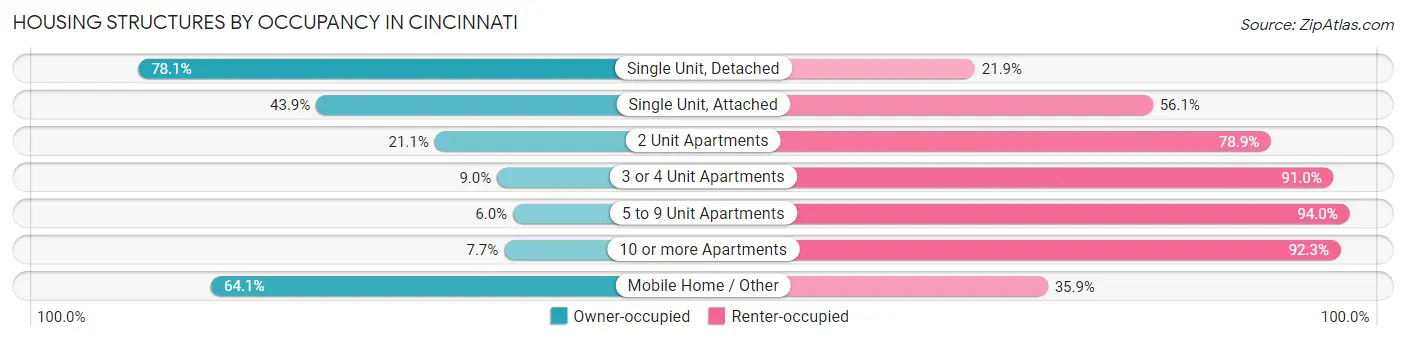
| Structure Type | Owner-occupied | Renter-occupied |
| Single Unit, Detached | 44,550 (78.1%) | 12,485 (21.9%) |
| Single Unit, Attached | 3,334 (43.9%) | 4,266 (56.1%) |
| 2 Unit Apartments | 2,369 (21.1%) | 8,872 (78.9%) |
| 3 or 4 Unit Apartments | 1,415 (9.0%) | 14,233 (91.0%) |
| 5 to 9 Unit Apartments | 683 (6.0%) | 10,738 (94.0%) |
| 10 or more Apartments | 2,897 (7.7%) | 34,868 (92.3%) |
| Mobile Home / Other | 207 (64.1%) | 116 (35.9%) |
| Total | 55,455 (39.3%) | 85,578 (60.7%) |
Housing Structures by Number of Rooms in Cincinnati
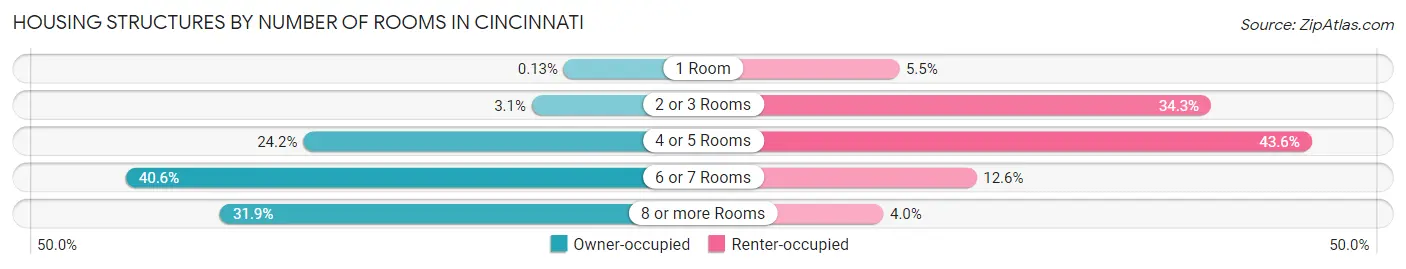
| Number of Rooms | Owner-occupied | Renter-occupied |
| 1 Room | 74 (0.1%) | 4,675 (5.5%) |
| 2 or 3 Rooms | 1,712 (3.1%) | 29,365 (34.3%) |
| 4 or 5 Rooms | 13,435 (24.2%) | 37,329 (43.6%) |
| 6 or 7 Rooms | 22,530 (40.6%) | 10,793 (12.6%) |
| 8 or more Rooms | 17,704 (31.9%) | 3,416 (4.0%) |
| Total | 55,455 (100.0%) | 85,578 (100.0%) |
Housing Structure by Heating Type in Cincinnati
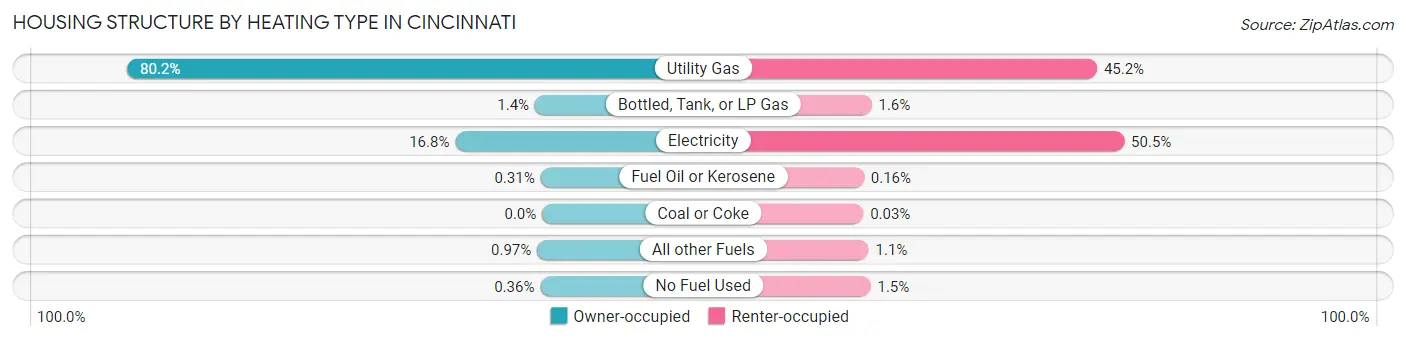
| Heating Type | Owner-occupied | Renter-occupied |
| Utility Gas | 44,473 (80.2%) | 38,681 (45.2%) |
| Bottled, Tank, or LP Gas | 764 (1.4%) | 1,404 (1.6%) |
| Electricity | 9,311 (16.8%) | 43,182 (50.5%) |
| Fuel Oil or Kerosene | 171 (0.3%) | 137 (0.2%) |
| Coal or Coke | 0 (0.0%) | 22 (0.0%) |
| All other Fuels | 536 (1.0%) | 913 (1.1%) |
| No Fuel Used | 200 (0.4%) | 1,239 (1.5%) |
| Total | 55,455 (100.0%) | 85,578 (100.0%) |
Household Vehicle Usage in Cincinnati
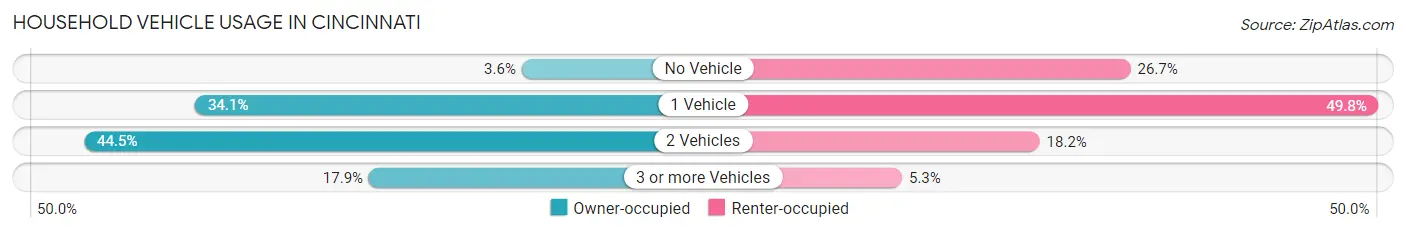
| Vehicles per Household | Owner-occupied | Renter-occupied |
| No Vehicle | 1,993 (3.6%) | 22,824 (26.7%) |
| 1 Vehicle | 18,906 (34.1%) | 42,631 (49.8%) |
| 2 Vehicles | 24,651 (44.5%) | 15,558 (18.2%) |
| 3 or more Vehicles | 9,905 (17.9%) | 4,565 (5.3%) |
| Total | 55,455 (100.0%) | 85,578 (100.0%) |
Real Estate & Mortgages in Cincinnati
Real Estate and Mortgage Overview in Cincinnati
| Characteristic | Without Mortgage | With Mortgage |
| Housing Units | 18,584 | 36,871 |
| Median Property Value | $155,500 | $208,100 |
| Median Household Income | $63,148 | $11,261 |
| Monthly Housing Costs | $622 | $3,932 |
| Real Estate Taxes | $2,457 | $994 |
Property Value by Mortgage Status in Cincinnati
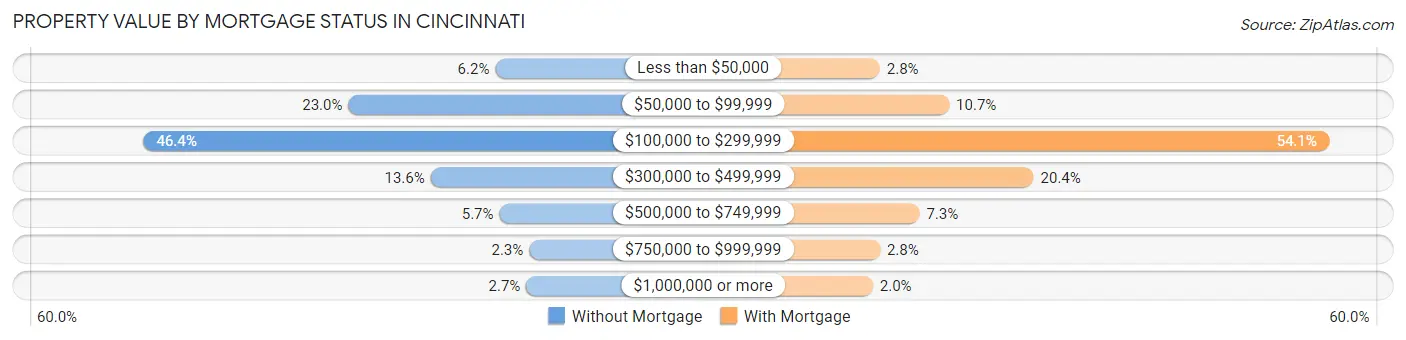
| Property Value | Without Mortgage | With Mortgage |
| Less than $50,000 | 1,154 (6.2%) | 1,026 (2.8%) |
| $50,000 to $99,999 | 4,276 (23.0%) | 3,947 (10.7%) |
| $100,000 to $299,999 | 8,625 (46.4%) | 19,938 (54.1%) |
| $300,000 to $499,999 | 2,529 (13.6%) | 7,505 (20.3%) |
| $500,000 to $749,999 | 1,067 (5.7%) | 2,695 (7.3%) |
| $750,000 to $999,999 | 435 (2.3%) | 1,030 (2.8%) |
| $1,000,000 or more | 498 (2.7%) | 730 (2.0%) |
| Total | 18,584 (100.0%) | 36,871 (100.0%) |
Household Income by Mortgage Status in Cincinnati
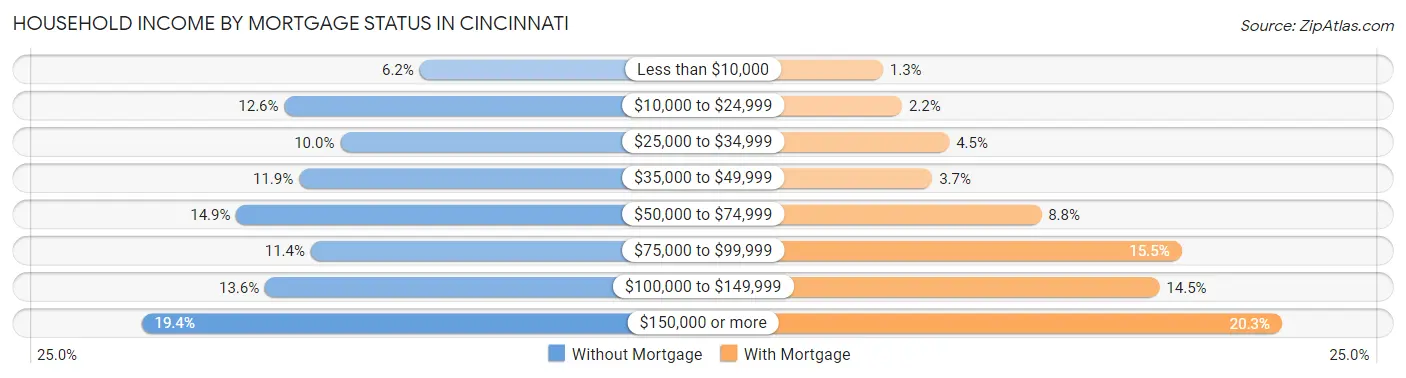
| Household Income | Without Mortgage | With Mortgage |
| Less than $10,000 | 1,150 (6.2%) | 481 (1.3%) |
| $10,000 to $24,999 | 2,348 (12.6%) | 814 (2.2%) |
| $25,000 to $34,999 | 1,852 (10.0%) | 1,646 (4.5%) |
| $35,000 to $49,999 | 2,218 (11.9%) | 1,347 (3.6%) |
| $50,000 to $74,999 | 2,773 (14.9%) | 3,261 (8.8%) |
| $75,000 to $99,999 | 2,113 (11.4%) | 5,722 (15.5%) |
| $100,000 to $149,999 | 2,519 (13.6%) | 5,335 (14.5%) |
| $150,000 or more | 3,611 (19.4%) | 7,485 (20.3%) |
| Total | 18,584 (100.0%) | 36,871 (100.0%) |
Property Value to Household Income Ratio in Cincinnati
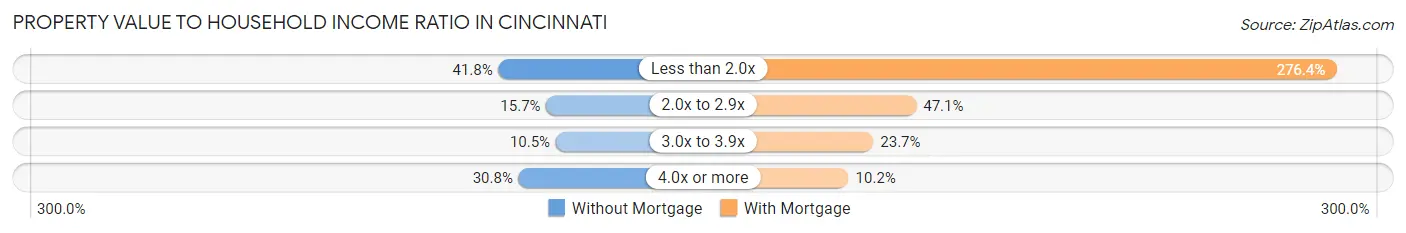
| Value-to-Income Ratio | Without Mortgage | With Mortgage |
| Less than 2.0x | 7,766 (41.8%) | 101,907 (276.4%) |
| 2.0x to 2.9x | 2,917 (15.7%) | 17,346 (47.0%) |
| 3.0x to 3.9x | 1,953 (10.5%) | 8,722 (23.7%) |
| 4.0x or more | 5,721 (30.8%) | 3,761 (10.2%) |
| Total | 18,584 (100.0%) | 36,871 (100.0%) |
Real Estate Taxes by Mortgage Status in Cincinnati
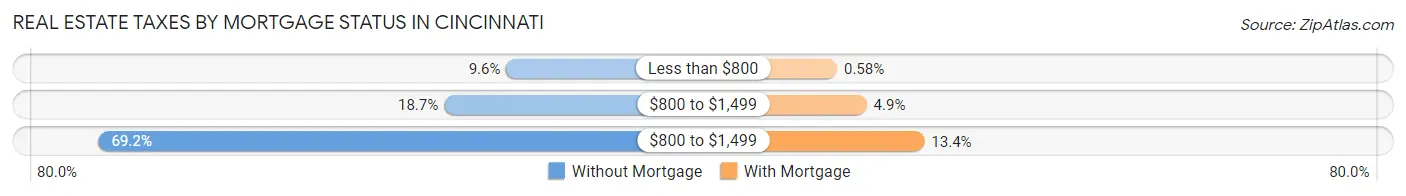
| Property Taxes | Without Mortgage | With Mortgage |
| Less than $800 | 1,788 (9.6%) | 213 (0.6%) |
| $800 to $1,499 | 3,477 (18.7%) | 1,811 (4.9%) |
| $800 to $1,499 | 12,860 (69.2%) | 4,923 (13.4%) |
| Total | 18,584 (100.0%) | 36,871 (100.0%) |
Health & Disability in Cincinnati
Health Insurance Coverage by Age in Cincinnati
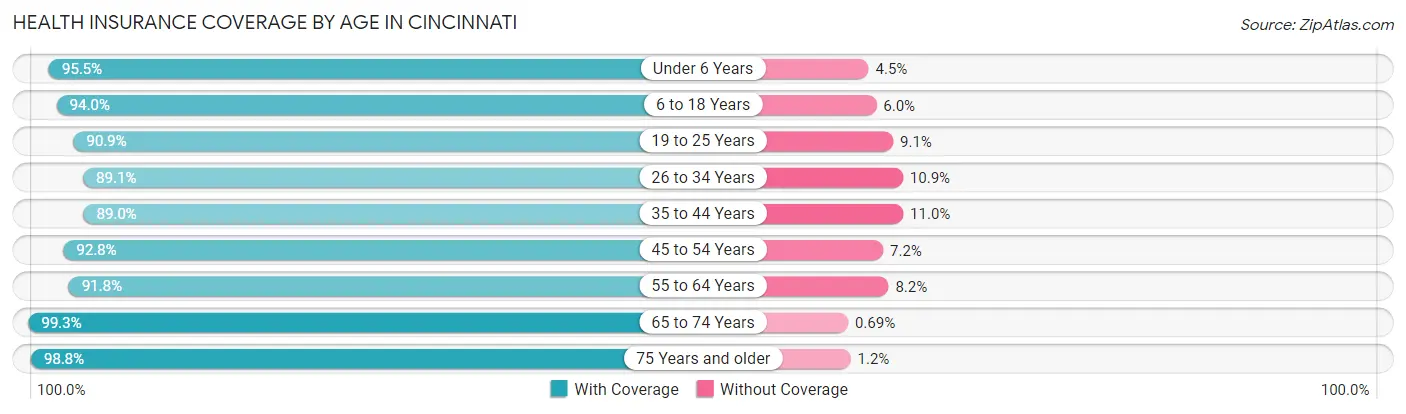
| Age Bracket | With Coverage | Without Coverage |
| Under 6 Years | 22,450 (95.5%) | 1,065 (4.5%) |
| 6 to 18 Years | 44,153 (94.0%) | 2,803 (6.0%) |
| 19 to 25 Years | 39,107 (90.9%) | 3,914 (9.1%) |
| 26 to 34 Years | 45,500 (89.1%) | 5,584 (10.9%) |
| 35 to 44 Years | 32,699 (89.0%) | 4,032 (11.0%) |
| 45 to 54 Years | 28,408 (92.8%) | 2,213 (7.2%) |
| 55 to 64 Years | 32,423 (91.8%) | 2,910 (8.2%) |
| 65 to 74 Years | 23,609 (99.3%) | 163 (0.7%) |
| 75 Years and older | 13,535 (98.8%) | 162 (1.2%) |
| Total | 281,884 (92.5%) | 22,846 (7.5%) |
Health Insurance Coverage by Citizenship Status in Cincinnati
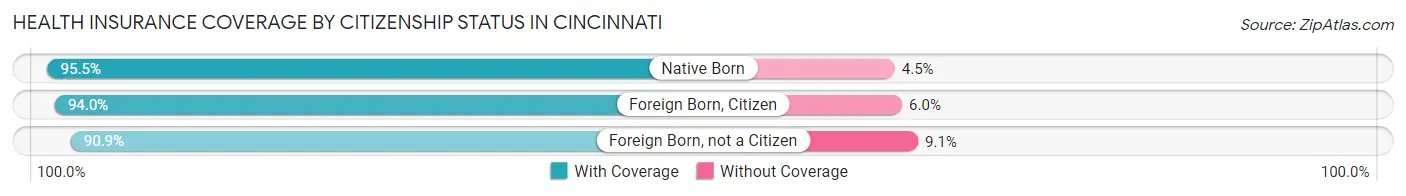
| Citizenship Status | With Coverage | Without Coverage |
| Native Born | 22,450 (95.5%) | 1,065 (4.5%) |
| Foreign Born, Citizen | 44,153 (94.0%) | 2,803 (6.0%) |
| Foreign Born, not a Citizen | 39,107 (90.9%) | 3,914 (9.1%) |
Health Insurance Coverage by Household Income in Cincinnati
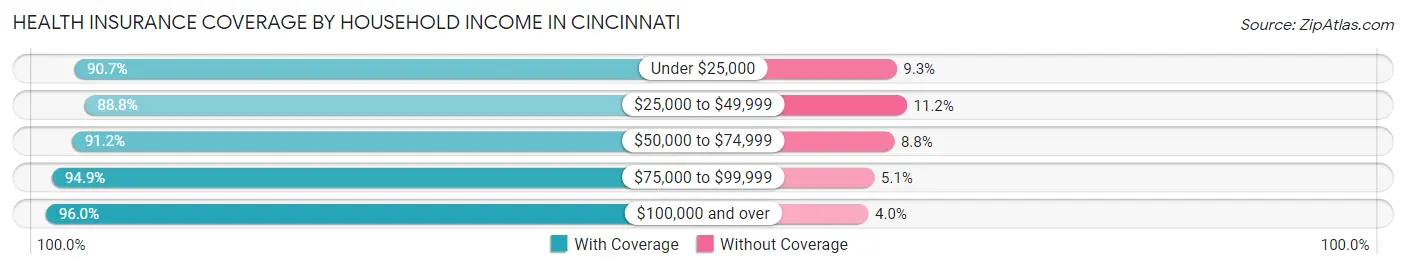
| Household Income | With Coverage | Without Coverage |
| Under $25,000 | 61,239 (90.7%) | 6,272 (9.3%) |
| $25,000 to $49,999 | 54,484 (88.8%) | 6,862 (11.2%) |
| $50,000 to $74,999 | 39,916 (91.2%) | 3,865 (8.8%) |
| $75,000 to $99,999 | 32,053 (94.9%) | 1,730 (5.1%) |
| $100,000 and over | 85,902 (96.0%) | 3,567 (4.0%) |
Public vs Private Health Insurance Coverage by Age in Cincinnati
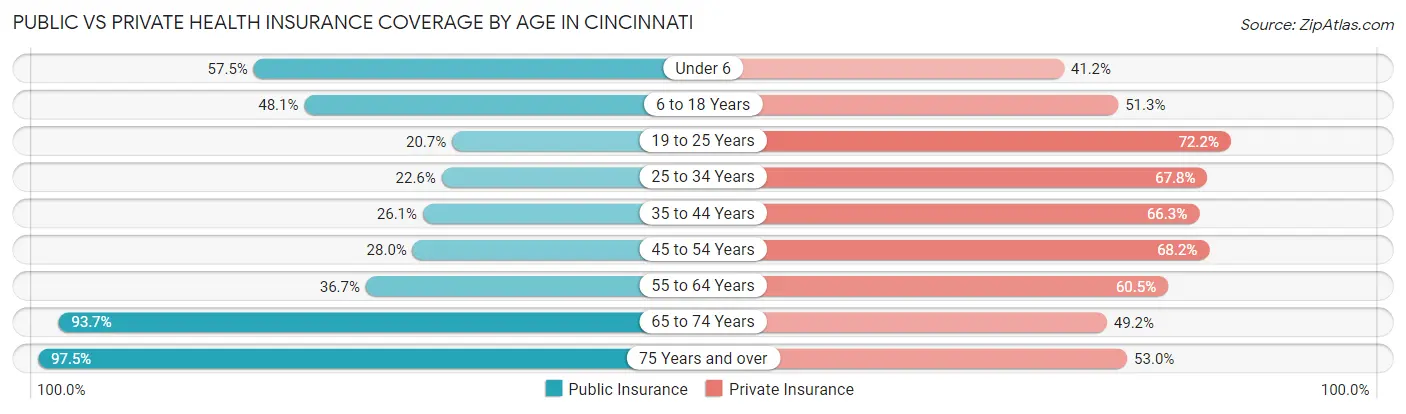
| Age Bracket | Public Insurance | Private Insurance |
| Under 6 | 13,517 (57.5%) | 9,693 (41.2%) |
| 6 to 18 Years | 22,576 (48.1%) | 24,091 (51.3%) |
| 19 to 25 Years | 8,887 (20.7%) | 31,058 (72.2%) |
| 25 to 34 Years | 11,547 (22.6%) | 34,657 (67.8%) |
| 35 to 44 Years | 9,578 (26.1%) | 24,348 (66.3%) |
| 45 to 54 Years | 8,564 (28.0%) | 20,879 (68.2%) |
| 55 to 64 Years | 12,956 (36.7%) | 21,392 (60.5%) |
| 65 to 74 Years | 22,282 (93.7%) | 11,697 (49.2%) |
| 75 Years and over | 13,357 (97.5%) | 7,255 (53.0%) |
| Total | 123,264 (40.5%) | 185,070 (60.7%) |
Disability Status by Sex by Age in Cincinnati
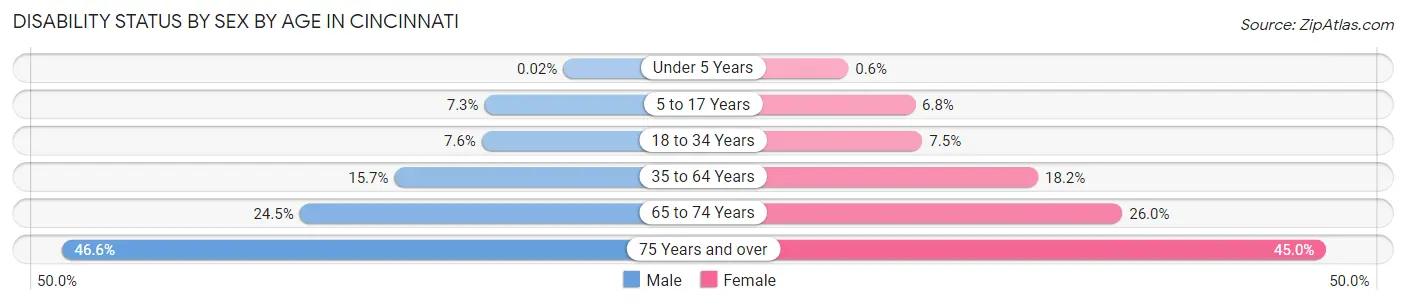
| Age Bracket | Male | Female |
| Under 5 Years | 2 (0.0%) | 61 (0.6%) |
| 5 to 17 Years | 1,647 (7.3%) | 1,489 (6.8%) |
| 18 to 34 Years | 3,692 (7.6%) | 3,837 (7.5%) |
| 35 to 64 Years | 7,758 (15.7%) | 9,704 (18.2%) |
| 65 to 74 Years | 2,671 (24.5%) | 3,349 (26.0%) |
| 75 Years and over | 2,484 (46.6%) | 3,759 (45.0%) |
Disability Class by Sex by Age in Cincinnati
Disability Class: Hearing Difficulty
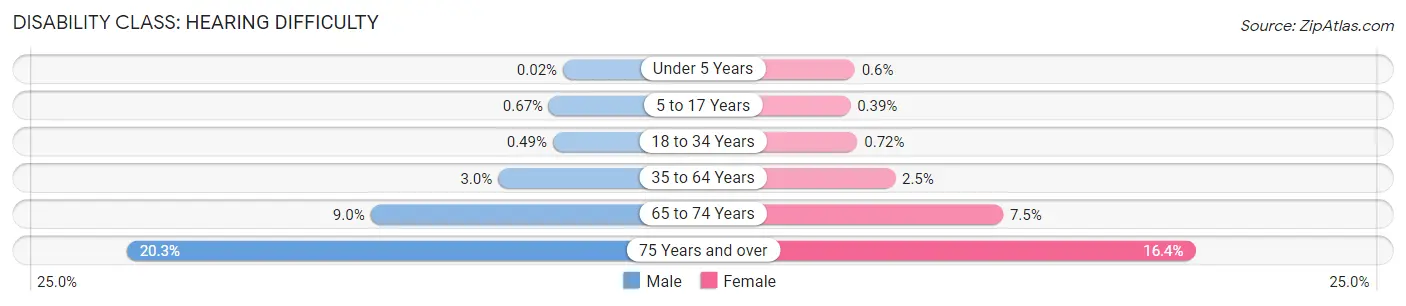
| Age Bracket | Male | Female |
| Under 5 Years | 2 (0.0%) | 61 (0.6%) |
| 5 to 17 Years | 151 (0.7%) | 86 (0.4%) |
| 18 to 34 Years | 239 (0.5%) | 367 (0.7%) |
| 35 to 64 Years | 1,499 (3.0%) | 1,315 (2.5%) |
| 65 to 74 Years | 976 (8.9%) | 963 (7.5%) |
| 75 Years and over | 1,081 (20.3%) | 1,371 (16.4%) |
Disability Class: Vision Difficulty
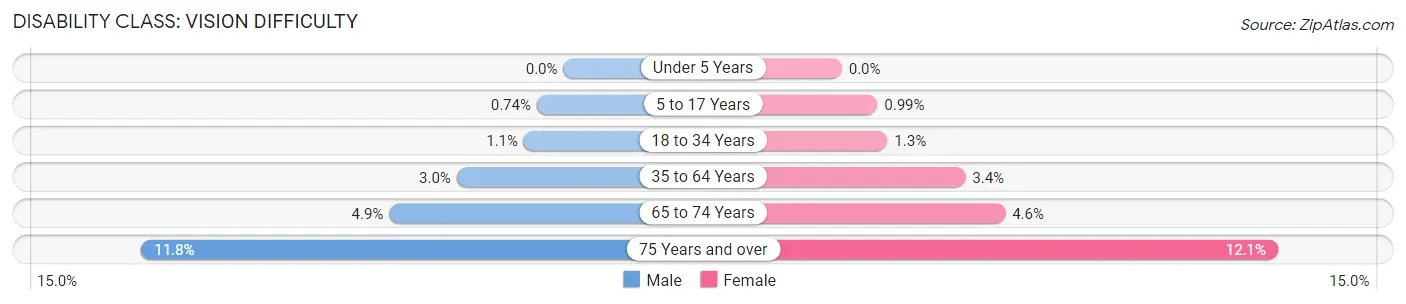
| Age Bracket | Male | Female |
| Under 5 Years | 0 (0.0%) | 0 (0.0%) |
| 5 to 17 Years | 167 (0.7%) | 216 (1.0%) |
| 18 to 34 Years | 535 (1.1%) | 652 (1.3%) |
| 35 to 64 Years | 1,470 (3.0%) | 1,832 (3.4%) |
| 65 to 74 Years | 529 (4.9%) | 586 (4.5%) |
| 75 Years and over | 627 (11.7%) | 1,015 (12.1%) |
Disability Class: Cognitive Difficulty
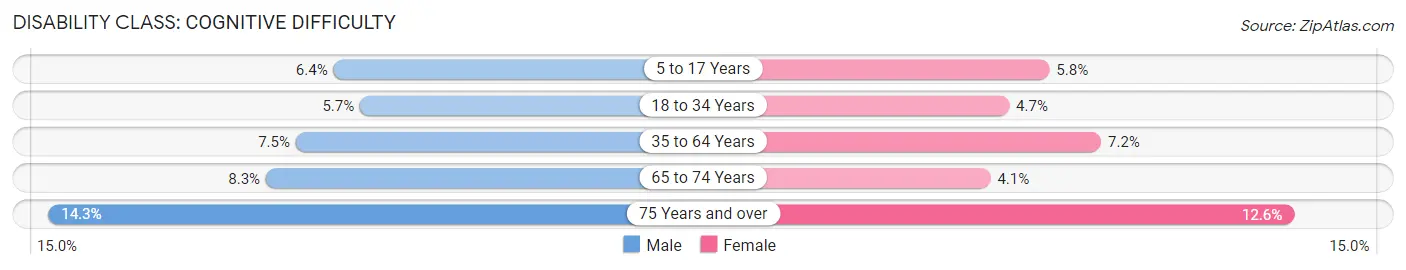
| Age Bracket | Male | Female |
| 5 to 17 Years | 1,436 (6.4%) | 1,265 (5.8%) |
| 18 to 34 Years | 2,757 (5.7%) | 2,389 (4.7%) |
| 35 to 64 Years | 3,682 (7.4%) | 3,842 (7.2%) |
| 65 to 74 Years | 903 (8.3%) | 533 (4.1%) |
| 75 Years and over | 765 (14.3%) | 1,053 (12.6%) |
Disability Class: Ambulatory Difficulty
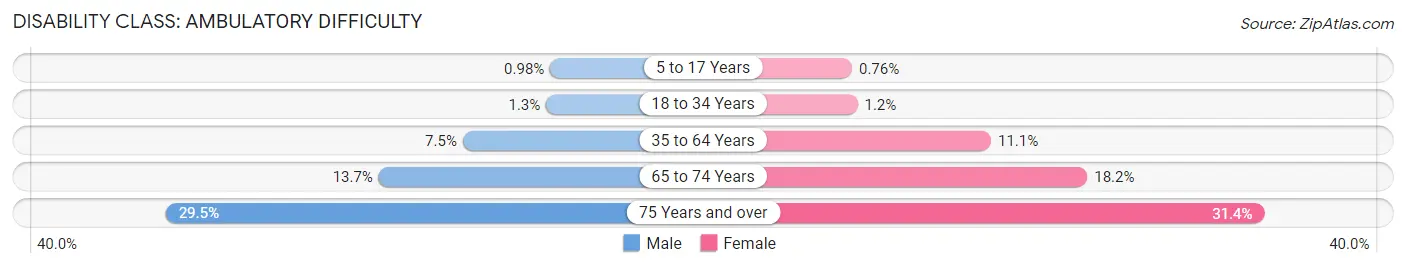
| Age Bracket | Male | Female |
| 5 to 17 Years | 220 (1.0%) | 166 (0.8%) |
| 18 to 34 Years | 622 (1.3%) | 598 (1.2%) |
| 35 to 64 Years | 3,694 (7.5%) | 5,902 (11.1%) |
| 65 to 74 Years | 1,495 (13.7%) | 2,346 (18.2%) |
| 75 Years and over | 1,575 (29.5%) | 2,623 (31.4%) |
Disability Class: Self-Care Difficulty
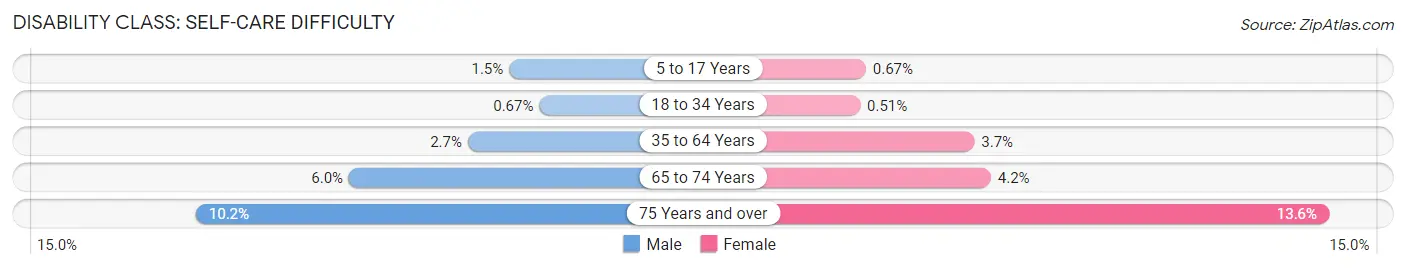
| Age Bracket | Male | Female |
| 5 to 17 Years | 340 (1.5%) | 146 (0.7%) |
| 18 to 34 Years | 325 (0.7%) | 263 (0.5%) |
| 35 to 64 Years | 1,316 (2.7%) | 1,964 (3.7%) |
| 65 to 74 Years | 651 (6.0%) | 534 (4.2%) |
| 75 Years and over | 546 (10.2%) | 1,134 (13.6%) |
Technology Access in Cincinnati
Computing Device Access in Cincinnati
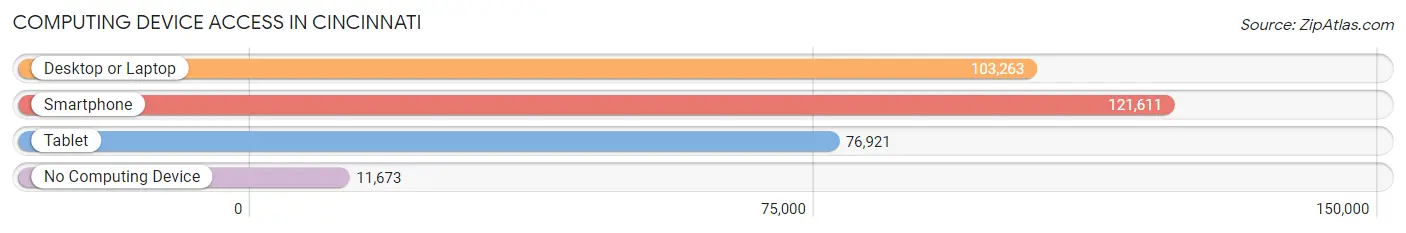
| Device Type | # Households | % Households |
| Desktop or Laptop | 103,263 | 73.2% |
| Smartphone | 121,611 | 86.2% |
| Tablet | 76,921 | 54.5% |
| No Computing Device | 11,673 | 8.3% |
| Total | 141,033 | 100.0% |
Internet Access in Cincinnati
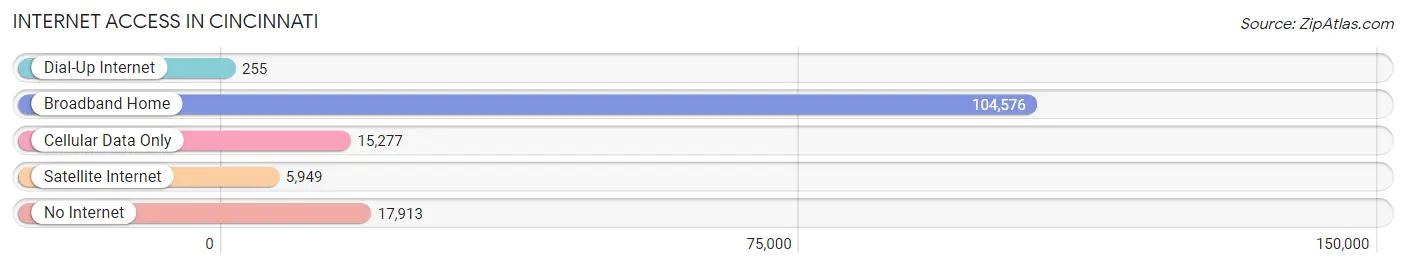
| Internet Type | # Households | % Households |
| Dial-Up Internet | 255 | 0.2% |
| Broadband Home | 104,576 | 74.2% |
| Cellular Data Only | 15,277 | 10.8% |
| Satellite Internet | 5,949 | 4.2% |
| No Internet | 17,913 | 12.7% |
| Total | 141,033 | 100.0% |
Cincinnati Summary
Cincinnati, Ohio is a city located in the southwestern corner of the state, along the Ohio River. It is the third-largest city in Ohio and the 65th-largest city in the United States. Cincinnati is known for its rich history, diverse culture, and vibrant economy.
History
Cincinnati was founded in 1788 by Mathias Denman, Colonel Robert Patterson, and Israel Ludlow. The city was named after the Roman statesman, Cincinnatus, and was originally part of the Northwest Territory. In 1802, Cincinnati was incorporated as a city and quickly became a major hub for trade and transportation. The city was a major stop on the Underground Railroad, and was home to many abolitionists.
In the mid-1800s, Cincinnati was a major center for manufacturing and industry. The city was home to many of the nation’s first factories, and was a major producer of pork, beef, and whiskey. The city was also a major center for the arts, and was home to many of the nation’s first professional theater companies.
In the late 1800s, Cincinnati was a major center for immigration. The city was home to many German, Irish, and Italian immigrants, and was a major center for the labor movement. The city was also a major center for the civil rights movement, and was home to many of the nation’s first African-American churches.
Geography
Cincinnati is located in the southwestern corner of Ohio, along the Ohio River. The city is situated on a series of hills and valleys, and is surrounded by rolling hills and forests. The city is divided into five distinct neighborhoods: Downtown, Over-the-Rhine, West End, Northside, and East End.
The city has a humid continental climate, with hot, humid summers and cold, snowy winters. The average annual temperature is 54°F (12°C), and the average annual precipitation is 40 inches (101 cm).
Economy
Cincinnati is a major center for industry and manufacturing. The city is home to many Fortune 500 companies, including Procter & Gamble, Kroger, and Macy’s. The city is also a major center for healthcare, with many hospitals and medical centers.
The city is also a major center for tourism and entertainment. The city is home to many museums, theaters, and sports teams, including the Cincinnati Reds and the Cincinnati Bengals. The city is also home to many festivals and events, including the Cincinnati Music Festival and the Cincinnati International Wine Festival.
Demographics
As of the 2010 census, the population of Cincinnati was 296,943. The city is racially and ethnically diverse, with a population that is 54.2% white, 37.2% African American, 4.2% Asian, and 4.4% Hispanic or Latino. The median household income is $35,977, and the median home value is $117,400.
Cincinnati is a major center for education, with many universities and colleges, including the University of Cincinnati, Xavier University, and Cincinnati State Technical and Community College. The city is also home to many public and private schools, including the Cincinnati Public Schools and the Archdiocese of Cincinnati.
Common Questions
What is Per Capita Income in Cincinnati?
Per Capita income in Cincinnati is $37,280.
What is the Median Family Income in Cincinnati?
Median Family Income in Cincinnati is $69,044.
What is the Median Household income in Cincinnati?
Median Household Income in Cincinnati is $49,191.
What is Income or Wage Gap in Cincinnati?
Income or Wage Gap in Cincinnati is 17.9%.
Women in Cincinnati earn 82.1 cents for every dollar earned by a man.
What is Family Income Deficit in Cincinnati?
Family Income Deficit in Cincinnati is $12,182.
Families that are below poverty line in Cincinnati earn $12,182 less on average than the poverty threshold level.
What is Inequality or Gini Index in Cincinnati?
Inequality or Gini Index in Cincinnati is 0.54.
What is the Total Population of Cincinnati?
Total Population of Cincinnati is 308,870.
What is the Total Male Population of Cincinnati?
Total Male Population of Cincinnati is 149,090.
What is the Total Female Population of Cincinnati?
Total Female Population of Cincinnati is 159,780.
What is the Ratio of Males per 100 Females in Cincinnati?
There are 93.31 Males per 100 Females in Cincinnati.
What is the Ratio of Females per 100 Males in Cincinnati?
There are 107.17 Females per 100 Males in Cincinnati.
What is the Median Population Age in Cincinnati?
Median Population Age in Cincinnati is 32.9 Years.
What is the Average Family Size in Cincinnati
Average Family Size in Cincinnati is 3.0 People.
What is the Average Household Size in Cincinnati
Average Household Size in Cincinnati is 2.1 People.
How Large is the Labor Force in Cincinnati?
There are 166,226 People in the Labor Forcein in Cincinnati.
What is the Percentage of People in the Labor Force in Cincinnati?
66.1% of People are in the Labor Force in Cincinnati.
What is the Unemployment Rate in Cincinnati?
Unemployment Rate in Cincinnati is 6.9%.