Tallahassee, FL Map & Demographics
Tallahassee Map
Tallahassee Overview
$33,803
PER CAPITA INCOME
$80,462
AVG FAMILY INCOME
$52,899
AVG HOUSEHOLD INCOME
15.1%
WAGE / INCOME GAP [ % ]
84.9¢/ $1
WAGE / INCOME GAP [ $ ]
$10,703
FAMILY INCOME DEFICIT
0.52
INEQUALITY / GINI INDEX
198,259
TOTAL POPULATION
93,308
MALE POPULATION
104,951
FEMALE POPULATION
88.91
MALES / 100 FEMALES
112.48
FEMALES / 100 MALES
27.6
MEDIAN AGE
3.0
AVG FAMILY SIZE
2.2
AVG HOUSEHOLD SIZE
111,121
LABOR FORCE [ PEOPLE ]
65.9%
PERCENT IN LABOR FORCE
6.5%
UNEMPLOYMENT RATE
Tallahassee Zip Codes
Tallahassee Area Codes
Income in Tallahassee
Income Overview in Tallahassee
Per Capita Income in Tallahassee is $33,803, while median incomes of families and households are $80,462 and $52,899 respectively.
| Characteristic | Number | Measure |
| Per Capita Income | 198,259 | $33,803 |
| Median Family Income | 36,350 | $80,462 |
| Mean Family Income | 36,350 | $113,649 |
| Median Household Income | 81,846 | $52,899 |
| Mean Household Income | 81,846 | $79,696 |
| Income Deficit | 36,350 | $10,703 |
| Wage / Income Gap (%) | 198,259 | 15.13% |
| Wage / Income Gap ($) | 198,259 | 84.87¢ per $1 |
| Gini / Inequality Index | 198,259 | 0.52 |
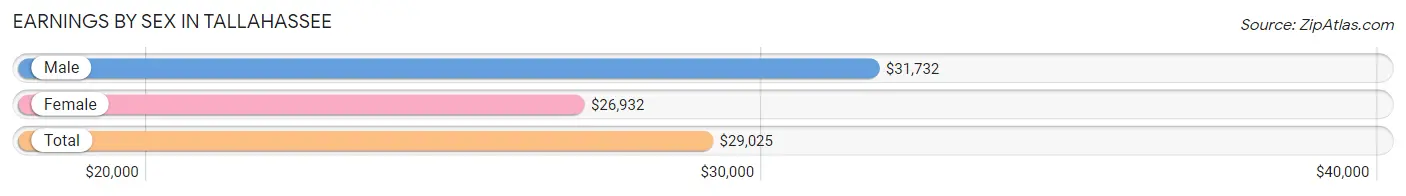
Earnings by Sex in Tallahassee
Average Earnings in Tallahassee are $29,025, $31,732 for men and $26,932 for women, a difference of 15.1%.
| Sex | Number | Average Earnings |
| Male | 56,214 (47.1%) | $31,732 |
| Female | 63,068 (52.9%) | $26,932 |
| Total | 119,282 (100.0%) | $29,025 |
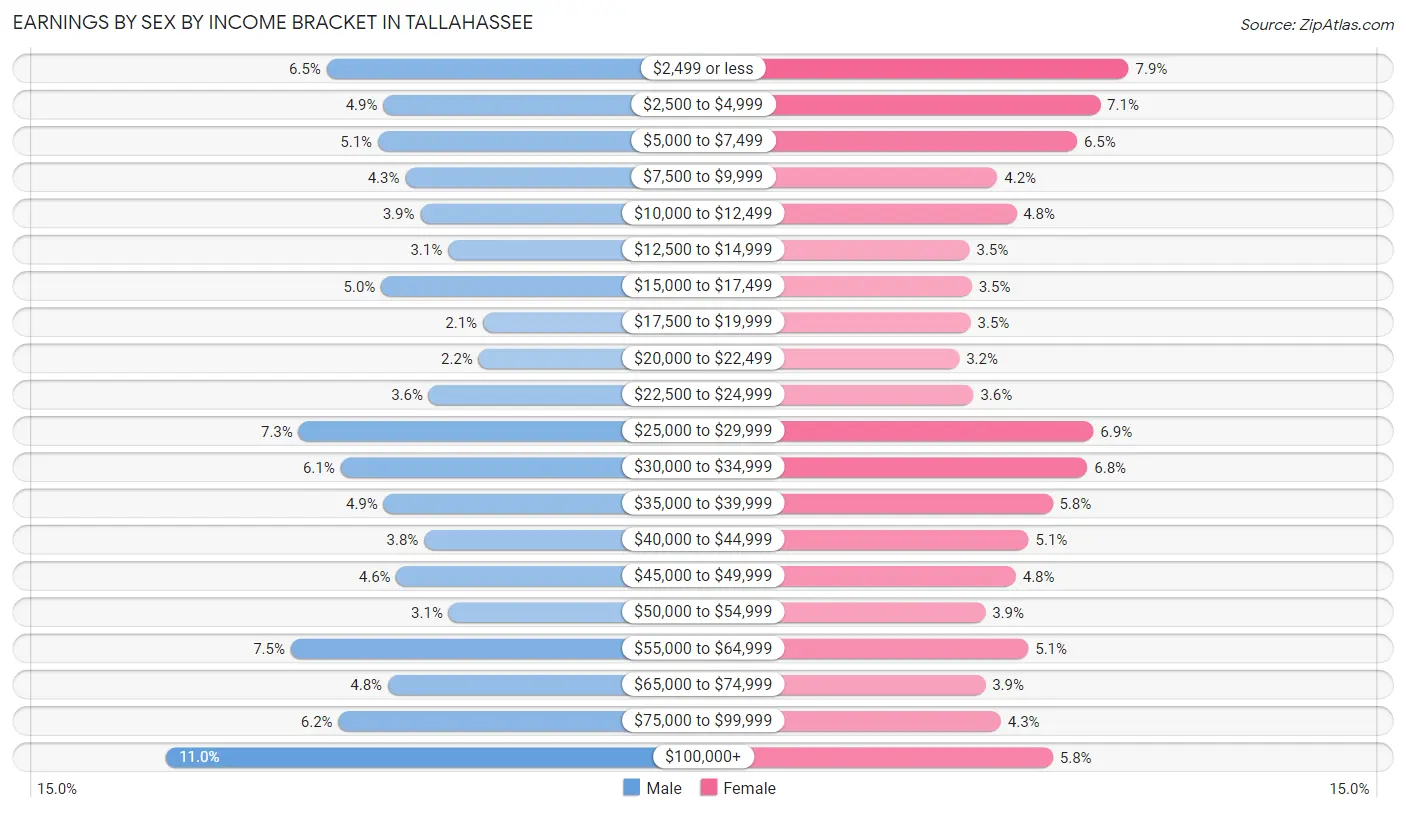
Earnings by Sex by Income Bracket in Tallahassee
The most common earnings brackets in Tallahassee are $100,000+ for men (6,195 | 11.0%) and $2,499 or less for women (4,993 | 7.9%).
| Income | Male | Female |
| $2,499 or less | 3,658 (6.5%) | 4,993 (7.9%) |
| $2,500 to $4,999 | 2,766 (4.9%) | 4,492 (7.1%) |
| $5,000 to $7,499 | 2,849 (5.1%) | 4,079 (6.5%) |
| $7,500 to $9,999 | 2,418 (4.3%) | 2,667 (4.2%) |
| $10,000 to $12,499 | 2,183 (3.9%) | 3,000 (4.8%) |
| $12,500 to $14,999 | 1,743 (3.1%) | 2,177 (3.5%) |
| $15,000 to $17,499 | 2,797 (5.0%) | 2,216 (3.5%) |
| $17,500 to $19,999 | 1,191 (2.1%) | 2,194 (3.5%) |
| $20,000 to $22,499 | 1,258 (2.2%) | 1,995 (3.2%) |
| $22,500 to $24,999 | 2,044 (3.6%) | 2,244 (3.6%) |
| $25,000 to $29,999 | 4,106 (7.3%) | 4,370 (6.9%) |
| $30,000 to $34,999 | 3,440 (6.1%) | 4,262 (6.8%) |
| $35,000 to $39,999 | 2,760 (4.9%) | 3,646 (5.8%) |
| $40,000 to $44,999 | 2,121 (3.8%) | 3,224 (5.1%) |
| $45,000 to $49,999 | 2,557 (4.5%) | 2,995 (4.8%) |
| $50,000 to $54,999 | 1,733 (3.1%) | 2,453 (3.9%) |
| $55,000 to $64,999 | 4,229 (7.5%) | 3,219 (5.1%) |
| $65,000 to $74,999 | 2,691 (4.8%) | 2,455 (3.9%) |
| $75,000 to $99,999 | 3,475 (6.2%) | 2,733 (4.3%) |
| $100,000+ | 6,195 (11.0%) | 3,654 (5.8%) |
| Total | 56,214 (100.0%) | 63,068 (100.0%) |
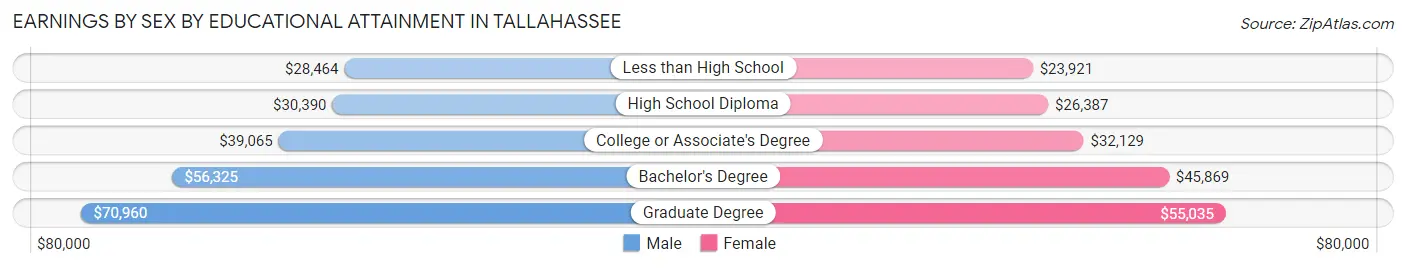
Earnings by Sex by Educational Attainment in Tallahassee
Average earnings in Tallahassee are $46,632 for men and $39,732 for women, a difference of 14.8%. Men with an educational attainment of graduate degree enjoy the highest average annual earnings of $70,960, while those with less than high school education earn the least with $28,464. Women with an educational attainment of graduate degree earn the most with the average annual earnings of $55,035, while those with less than high school education have the smallest earnings of $23,921.
| Educational Attainment | Male Income | Female Income |
| Less than High School | $28,464 | $23,921 |
| High School Diploma | $30,390 | $26,387 |
| College or Associate's Degree | $39,065 | $32,129 |
| Bachelor's Degree | $56,325 | $45,869 |
| Graduate Degree | $70,960 | $55,035 |
| Total | $46,632 | $39,732 |
Family Income in Tallahassee
Family Income Brackets in Tallahassee
According to the Tallahassee family income data, there are 6,289 families falling into the $100,000 to $149,999 income range, which is the most common income bracket and makes up 17.3% of all families. Conversely, the $10,000 to $14,999 income bracket is the least frequent group with only 763 families (2.1%) belonging to this category.
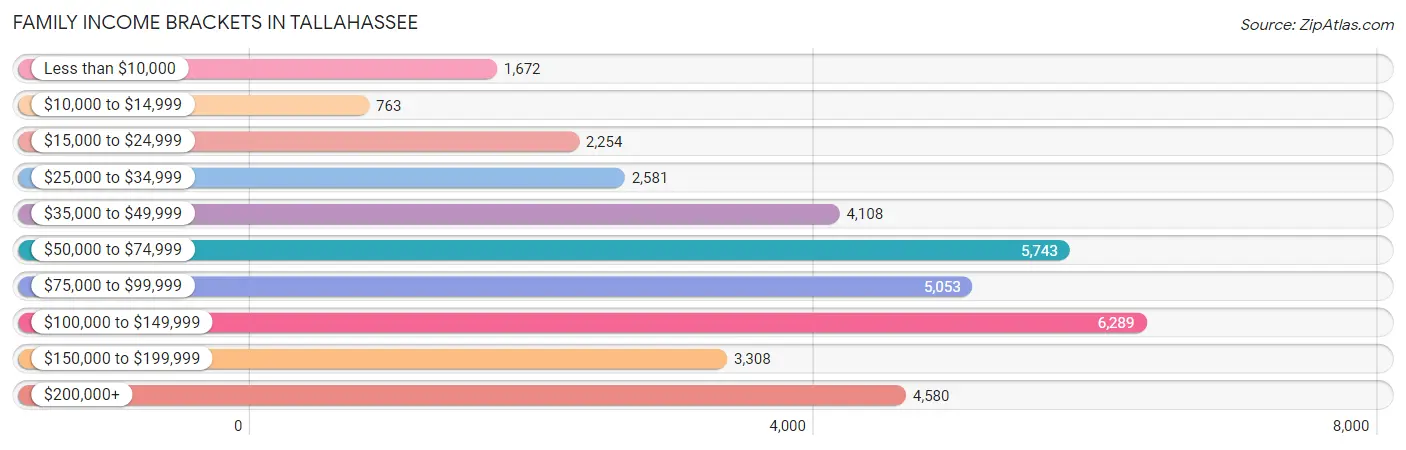
| Income Bracket | # Families | % Families |
| Less than $10,000 | 1,672 | 4.6% |
| $10,000 to $14,999 | 763 | 2.1% |
| $15,000 to $24,999 | 2,254 | 6.2% |
| $25,000 to $34,999 | 2,581 | 7.1% |
| $35,000 to $49,999 | 4,108 | 11.3% |
| $50,000 to $74,999 | 5,743 | 15.8% |
| $75,000 to $99,999 | 5,053 | 13.9% |
| $100,000 to $149,999 | 6,289 | 17.3% |
| $150,000 to $199,999 | 3,308 | 9.1% |
| $200,000+ | 4,580 | 12.6% |
Family Income by Famaliy Size in Tallahassee
4-person families (5,767 | 15.9%) account for the highest median family income in Tallahassee with $102,753 per family, while 2-person families (19,506 | 53.7%) have the highest median income of $37,076 per family member.
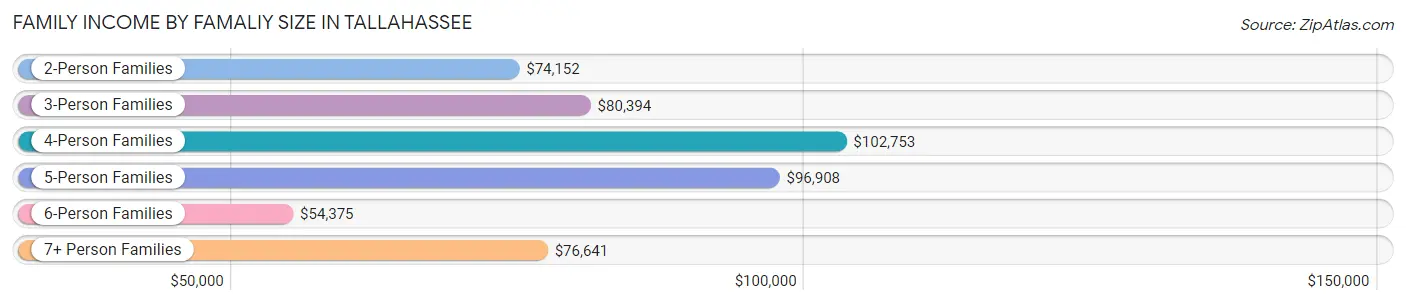
| Income Bracket | # Families | Median Income |
| 2-Person Families | 19,506 (53.7%) | $74,152 |
| 3-Person Families | 7,942 (21.8%) | $80,394 |
| 4-Person Families | 5,767 (15.9%) | $102,753 |
| 5-Person Families | 2,064 (5.7%) | $96,908 |
| 6-Person Families | 832 (2.3%) | $54,375 |
| 7+ Person Families | 239 (0.7%) | $76,641 |
| Total | 36,350 (100.0%) | $80,462 |
Family Income by Number of Earners in Tallahassee
The median family income in Tallahassee is $80,462, with families comprising 3+ earners (2,188) having the highest median family income of $140,326, while families with no earners (4,465) have the lowest median family income of $49,340, accounting for 6.0% and 12.3% of families, respectively.
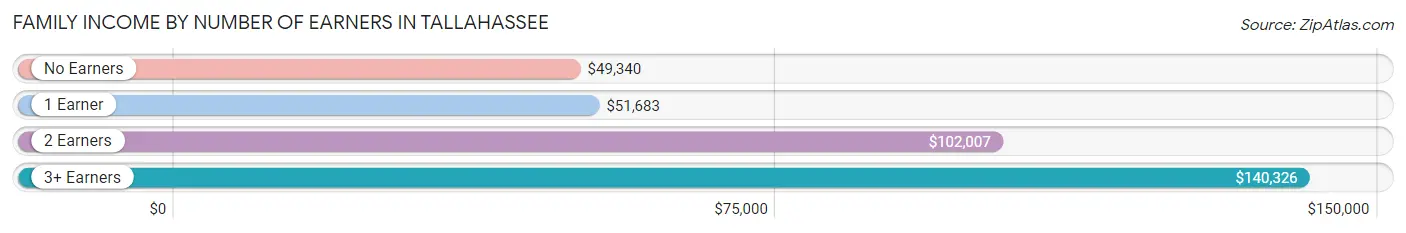
| Number of Earners | # Families | Median Income |
| No Earners | 4,465 (12.3%) | $49,340 |
| 1 Earner | 13,313 (36.6%) | $51,683 |
| 2 Earners | 16,384 (45.1%) | $102,007 |
| 3+ Earners | 2,188 (6.0%) | $140,326 |
| Total | 36,350 (100.0%) | $80,462 |
Household Income in Tallahassee
Household Income Brackets in Tallahassee
With 13,914 households falling in the category, the $50,000 to $74,999 income range is the most frequent in Tallahassee, accounting for 17.0% of all households. In contrast, only 4,010 households (4.9%) fall into the $150,000 to $199,999 income bracket, making it the least populous group.
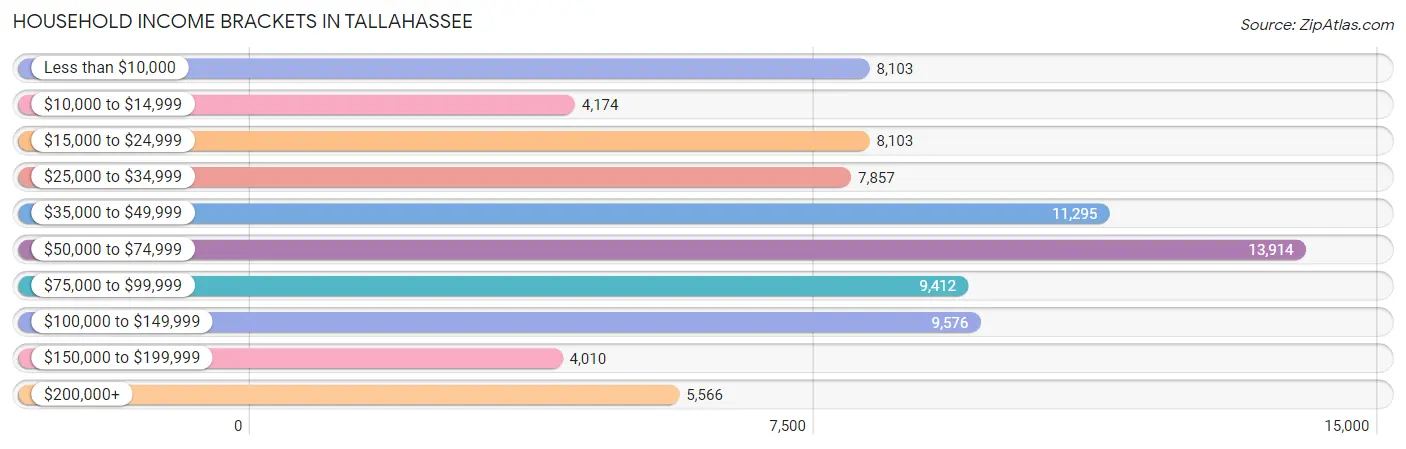
| Income Bracket | # Households | % Households |
| Less than $10,000 | 8,103 | 9.9% |
| $10,000 to $14,999 | 4,174 | 5.1% |
| $15,000 to $24,999 | 8,103 | 9.9% |
| $25,000 to $34,999 | 7,857 | 9.6% |
| $35,000 to $49,999 | 11,295 | 13.8% |
| $50,000 to $74,999 | 13,914 | 17.0% |
| $75,000 to $99,999 | 9,412 | 11.5% |
| $100,000 to $149,999 | 9,576 | 11.7% |
| $150,000 to $199,999 | 4,010 | 4.9% |
| $200,000+ | 5,566 | 6.8% |
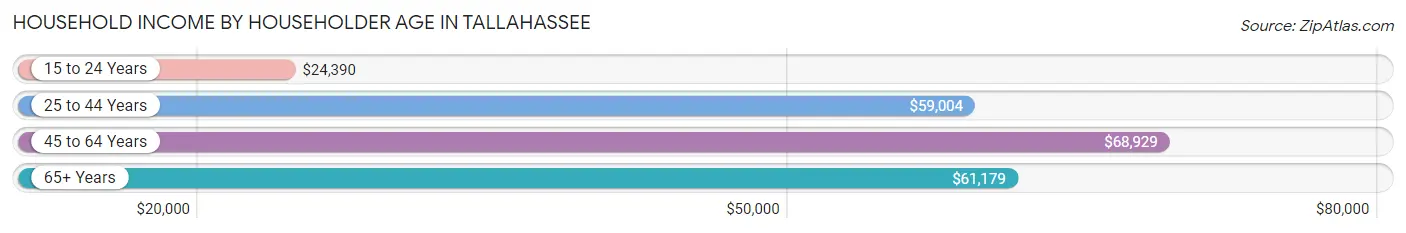
Household Income by Householder Age in Tallahassee
The median household income in Tallahassee is $52,899, with the highest median household income of $68,929 found in the 45 to 64 years age bracket for the primary householder. A total of 21,152 households (25.8%) fall into this category. Meanwhile, the 15 to 24 years age bracket for the primary householder has the lowest median household income of $24,390, with 16,861 households (20.6%) in this group.
| Income Bracket | # Households | Median Income |
| 15 to 24 Years | 16,861 (20.6%) | $24,390 |
| 25 to 44 Years | 29,441 (36.0%) | $59,004 |
| 45 to 64 Years | 21,152 (25.8%) | $68,929 |
| 65+ Years | 14,392 (17.6%) | $61,179 |
| Total | 81,846 (100.0%) | $52,899 |
Poverty in Tallahassee
Income Below Poverty by Sex and Age in Tallahassee
With 23.0% poverty level for males and 25.5% for females among the residents of Tallahassee, 18 to 24 year old males and 18 to 24 year old females are the most vulnerable to poverty, with 10,494 males (50.6%) and 11,941 females (51.6%) in their respective age groups living below the poverty level.
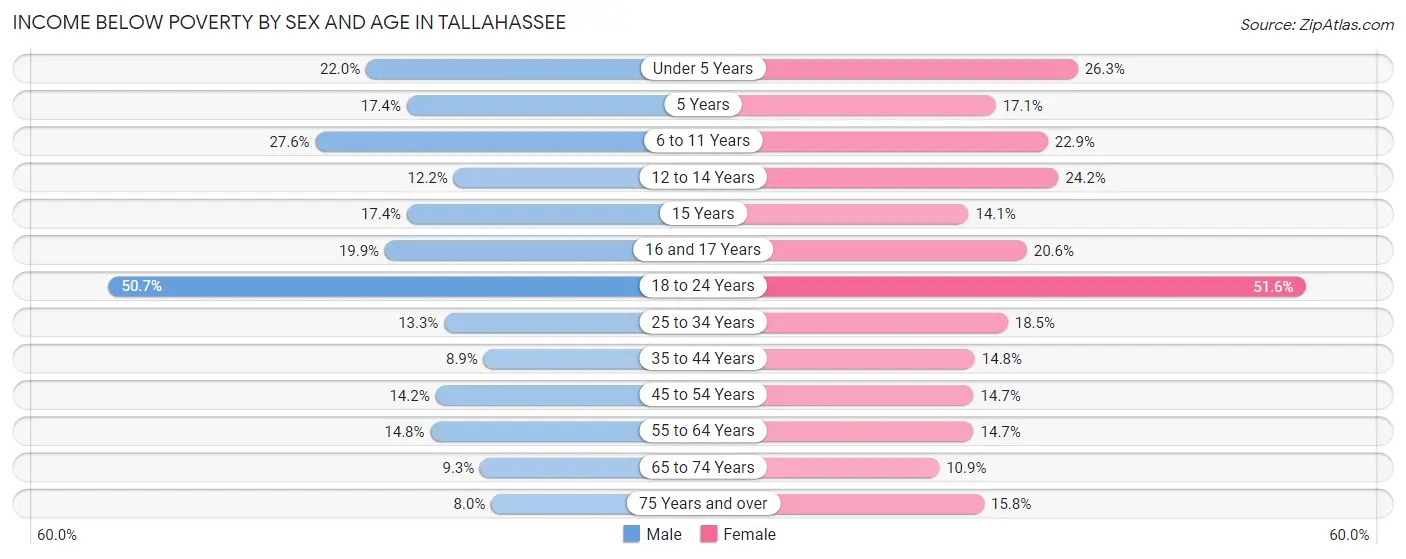
| Age Bracket | Male | Female |
| Under 5 Years | 1,051 (22.0%) | 1,101 (26.3%) |
| 5 Years | 185 (17.4%) | 85 (17.1%) |
| 6 to 11 Years | 1,630 (27.6%) | 1,216 (22.9%) |
| 12 to 14 Years | 345 (12.2%) | 611 (24.1%) |
| 15 Years | 161 (17.4%) | 144 (14.1%) |
| 16 and 17 Years | 336 (19.9%) | 337 (20.6%) |
| 18 to 24 Years | 10,494 (50.6%) | 11,941 (51.6%) |
| 25 to 34 Years | 1,995 (13.3%) | 2,890 (18.5%) |
| 35 to 44 Years | 884 (8.9%) | 1,620 (14.8%) |
| 45 to 54 Years | 1,207 (14.2%) | 1,285 (14.7%) |
| 55 to 64 Years | 1,078 (14.8%) | 1,286 (14.7%) |
| 65 to 74 Years | 553 (9.3%) | 791 (10.8%) |
| 75 Years and over | 255 (8.0%) | 774 (15.8%) |
| Total | 20,174 (23.0%) | 24,081 (25.5%) |
Income Above Poverty by Sex and Age in Tallahassee
According to the poverty statistics in Tallahassee, males aged 75 years and over and females aged 65 to 74 years are the age groups that are most secure financially, with 92.0% of males and 89.1% of females in these age groups living above the poverty line.
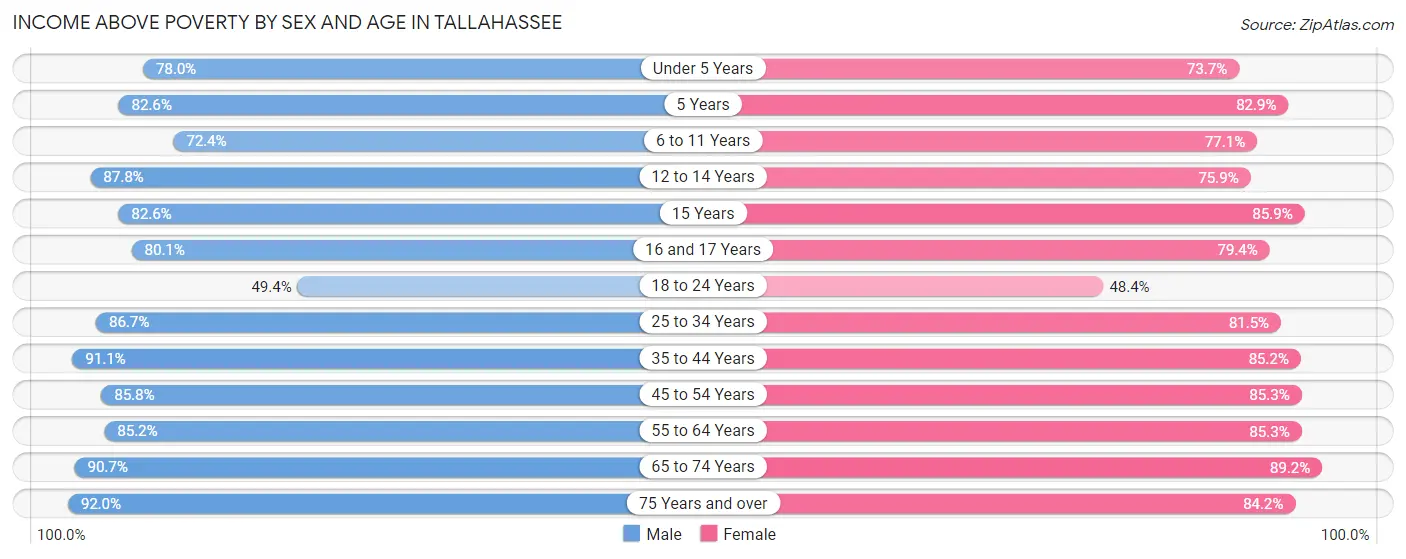
| Age Bracket | Male | Female |
| Under 5 Years | 3,733 (78.0%) | 3,090 (73.7%) |
| 5 Years | 876 (82.6%) | 411 (82.9%) |
| 6 to 11 Years | 4,274 (72.4%) | 4,084 (77.1%) |
| 12 to 14 Years | 2,479 (87.8%) | 1,919 (75.8%) |
| 15 Years | 763 (82.6%) | 876 (85.9%) |
| 16 and 17 Years | 1,355 (80.1%) | 1,299 (79.4%) |
| 18 to 24 Years | 10,224 (49.3%) | 11,192 (48.4%) |
| 25 to 34 Years | 13,041 (86.7%) | 12,742 (81.5%) |
| 35 to 44 Years | 9,076 (91.1%) | 9,313 (85.2%) |
| 45 to 54 Years | 7,268 (85.8%) | 7,469 (85.3%) |
| 55 to 64 Years | 6,200 (85.2%) | 7,472 (85.3%) |
| 65 to 74 Years | 5,413 (90.7%) | 6,502 (89.1%) |
| 75 Years and over | 2,920 (92.0%) | 4,112 (84.2%) |
| Total | 67,622 (77.0%) | 70,481 (74.5%) |
Income Below Poverty Among Married-Couple Families in Tallahassee
The poverty statistics for married-couple families in Tallahassee show that 3.6% or 788 of the total 21,783 families live below the poverty line. Families with 5 or more children have the highest poverty rate of 47.8%, comprising of 54 families. On the other hand, families with no children have the lowest poverty rate of 2.2%, which includes 289 families.
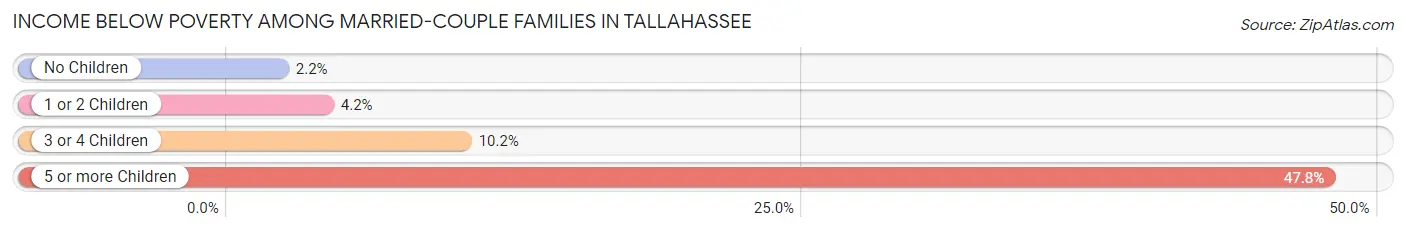
| Children | Above Poverty | Below Poverty |
| No Children | 12,785 (97.8%) | 289 (2.2%) |
| 1 or 2 Children | 6,852 (95.8%) | 298 (4.2%) |
| 3 or 4 Children | 1,299 (89.8%) | 147 (10.2%) |
| 5 or more Children | 59 (52.2%) | 54 (47.8%) |
| Total | 20,995 (96.4%) | 788 (3.6%) |
Income Below Poverty Among Single-Parent Households in Tallahassee
According to the poverty data in Tallahassee, 18.6% or 651 single-father households and 27.8% or 3,077 single-mother households are living below the poverty line. Among single-father households, those with 3 or 4 children have the highest poverty rate, with 71 households (29.0%) experiencing poverty. Likewise, among single-mother households, those with 5 or more children have the highest poverty rate, with 204 households (95.8%) falling below the poverty line.
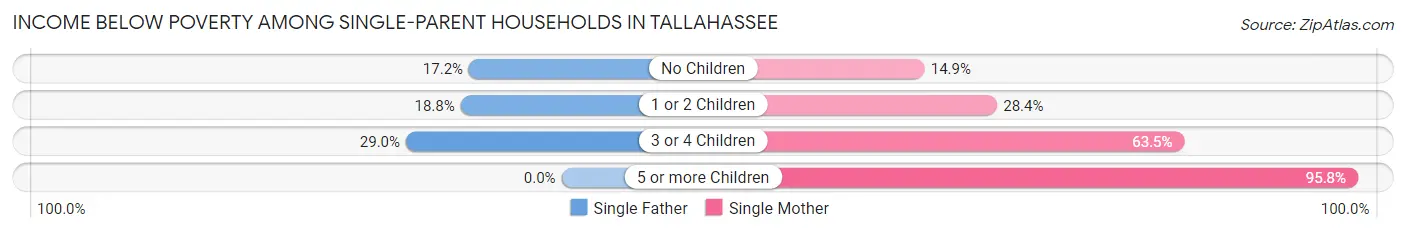
| Children | Single Father | Single Mother |
| No Children | 333 (17.2%) | 583 (14.9%) |
| 1 or 2 Children | 247 (18.8%) | 1,724 (28.4%) |
| 3 or 4 Children | 71 (29.0%) | 566 (63.4%) |
| 5 or more Children | 0 (0.0%) | 204 (95.8%) |
| Total | 651 (18.6%) | 3,077 (27.8%) |
Income Below Poverty Among Married-Couple vs Single-Parent Households in Tallahassee
The poverty data for Tallahassee shows that 788 of the married-couple family households (3.6%) and 3,728 of the single-parent households (25.6%) are living below the poverty level. Within the married-couple family households, those with 5 or more children have the highest poverty rate, with 54 households (47.8%) falling below the poverty line. Among the single-parent households, those with 5 or more children have the highest poverty rate, with 204 household (95.8%) living below poverty.
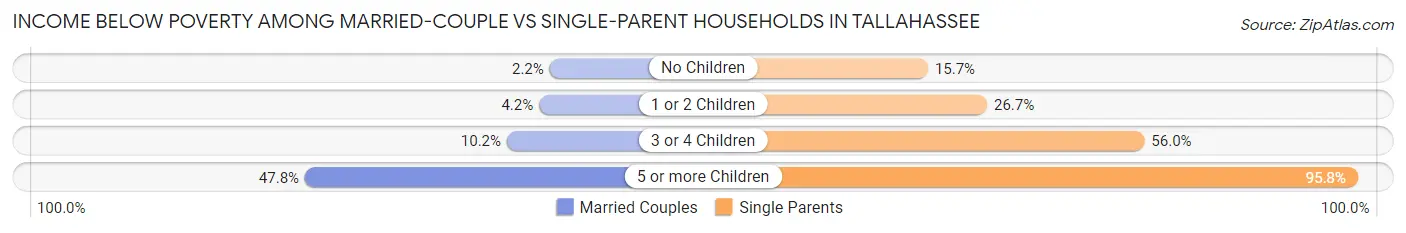
| Children | Married-Couple Families | Single-Parent Households |
| No Children | 289 (2.2%) | 916 (15.7%) |
| 1 or 2 Children | 298 (4.2%) | 1,971 (26.7%) |
| 3 or 4 Children | 147 (10.2%) | 637 (56.0%) |
| 5 or more Children | 54 (47.8%) | 204 (95.8%) |
| Total | 788 (3.6%) | 3,728 (25.6%) |
Race in Tallahassee
The most populous races in Tallahassee are White / Caucasian (104,303 | 52.6%), Black / African American (70,450 | 35.5%), and Hispanic or Latino (14,580 | 7.3%).
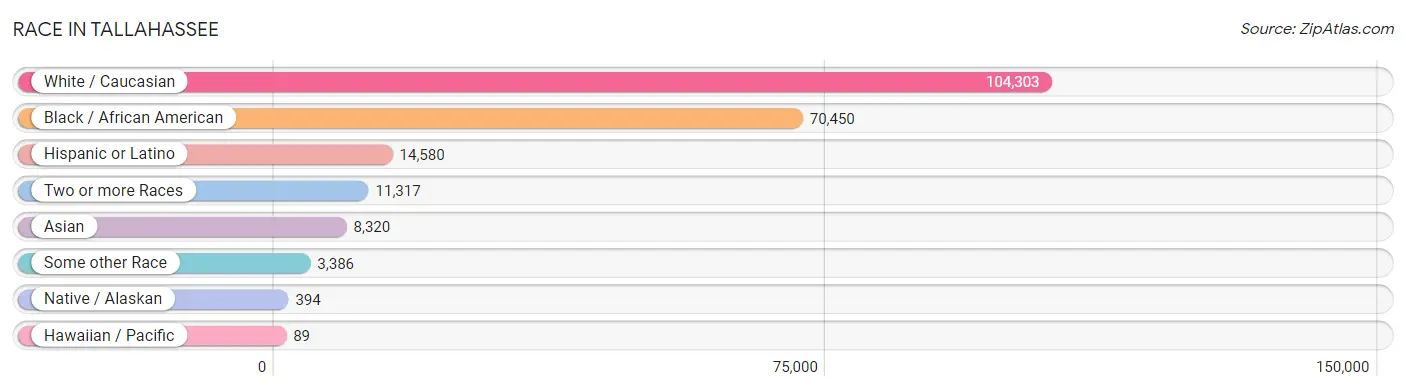
| Race | # Population | % Population |
| Asian | 8,320 | 4.2% |
| Black / African American | 70,450 | 35.5% |
| Hawaiian / Pacific | 89 | 0.0% |
| Hispanic or Latino | 14,580 | 7.3% |
| Native / Alaskan | 394 | 0.2% |
| White / Caucasian | 104,303 | 52.6% |
| Two or more Races | 11,317 | 5.7% |
| Some other Race | 3,386 | 1.7% |
| Total | 198,259 | 100.0% |
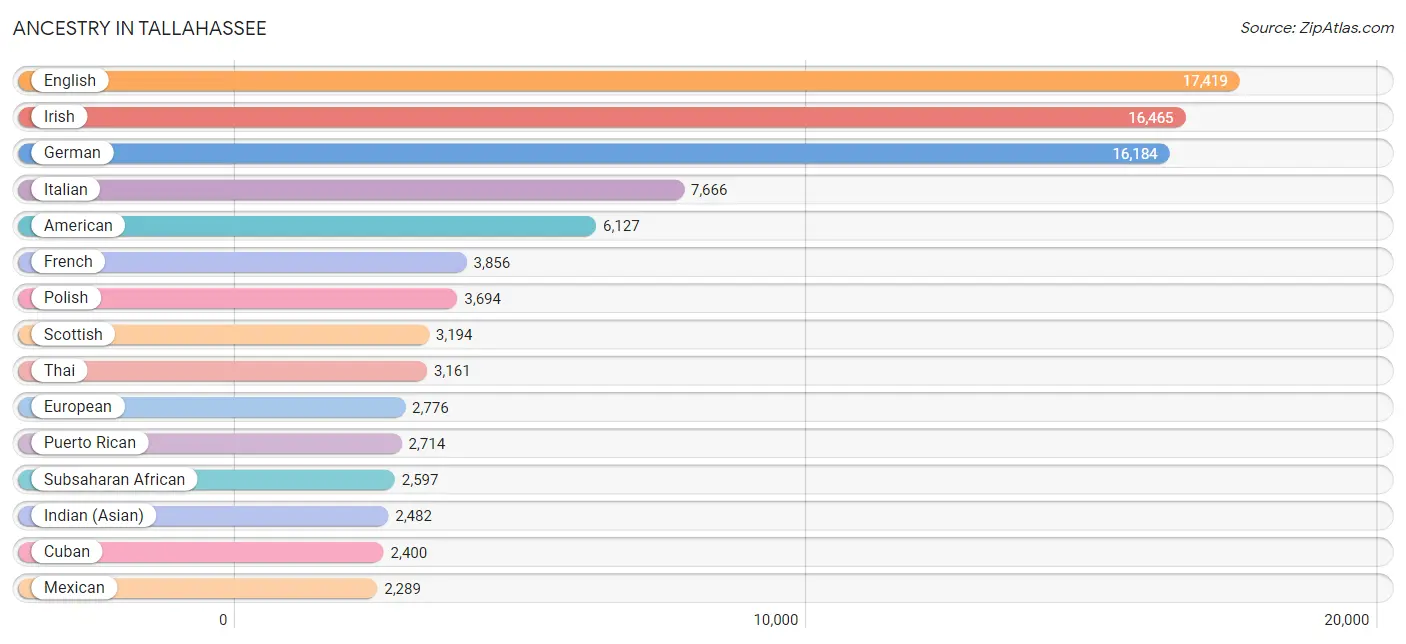
Ancestry in Tallahassee
The most populous ancestries reported in Tallahassee are English (17,419 | 8.8%), Irish (16,465 | 8.3%), German (16,184 | 8.2%), Italian (7,666 | 3.9%), and American (6,127 | 3.1%), together accounting for 32.2% of all Tallahassee residents.
| Ancestry | # Population | % Population |
| African | 1,693 | 0.9% |
| Albanian | 24 | 0.0% |
| American | 6,127 | 3.1% |
| Arab | 761 | 0.4% |
| Argentinean | 150 | 0.1% |
| Armenian | 129 | 0.1% |
| Australian | 88 | 0.0% |
| Austrian | 329 | 0.2% |
| Bahamian | 395 | 0.2% |
| Barbadian | 18 | 0.0% |
| Basque | 86 | 0.0% |
| Belgian | 101 | 0.1% |
| Belizean | 14 | 0.0% |
| Bhutanese | 722 | 0.4% |
| Blackfeet | 42 | 0.0% |
| Brazilian | 288 | 0.2% |
| British | 1,431 | 0.7% |
| British West Indian | 39 | 0.0% |
| Burmese | 696 | 0.4% |
| Cajun | 7 | 0.0% |
| Canadian | 323 | 0.2% |
| Carpatho Rusyn | 6 | 0.0% |
| Celtic | 82 | 0.0% |
| Central American | 1,571 | 0.8% |
| Central American Indian | 100 | 0.1% |
| Cherokee | 585 | 0.3% |
| Chickasaw | 6 | 0.0% |
| Chilean | 198 | 0.1% |
| Chippewa | 16 | 0.0% |
| Choctaw | 10 | 0.0% |
| Colombian | 769 | 0.4% |
| Costa Rican | 149 | 0.1% |
| Creek | 72 | 0.0% |
| Croatian | 125 | 0.1% |
| Cuban | 2,400 | 1.2% |
| Czech | 387 | 0.2% |
| Czechoslovakian | 59 | 0.0% |
| Danish | 560 | 0.3% |
| Delaware | 12 | 0.0% |
| Dominican | 706 | 0.4% |
| Dutch | 1,094 | 0.5% |
| Eastern European | 438 | 0.2% |
| Ecuadorian | 139 | 0.1% |
| Egyptian | 158 | 0.1% |
| English | 17,419 | 8.8% |
| Ethiopian | 1 | 0.0% |
| European | 2,776 | 1.4% |
| Filipino | 113 | 0.1% |
| Finnish | 191 | 0.1% |
| French | 3,856 | 1.9% |
| French Canadian | 666 | 0.3% |
| German | 16,184 | 8.2% |
| German Russian | 6 | 0.0% |
| Ghanaian | 51 | 0.0% |
| Greek | 895 | 0.4% |
| Guamanian / Chamorro | 43 | 0.0% |
| Guatemalan | 173 | 0.1% |
| Guyanese | 54 | 0.0% |
| Haitian | 1,550 | 0.8% |
| Honduran | 240 | 0.1% |
| Hungarian | 551 | 0.3% |
| Icelander | 22 | 0.0% |
| Indian (Asian) | 2,482 | 1.3% |
| Indonesian | 42 | 0.0% |
| Iranian | 144 | 0.1% |
| Irish | 16,465 | 8.3% |
| Iroquois | 39 | 0.0% |
| Israeli | 99 | 0.1% |
| Italian | 7,666 | 3.9% |
| Jamaican | 1,408 | 0.7% |
| Japanese | 67 | 0.0% |
| Jordanian | 41 | 0.0% |
| Korean | 1,419 | 0.7% |
| Laotian | 9 | 0.0% |
| Latvian | 56 | 0.0% |
| Lebanese | 189 | 0.1% |
| Liberian | 19 | 0.0% |
| Lithuanian | 260 | 0.1% |
| Lumbee | 33 | 0.0% |
| Macedonian | 21 | 0.0% |
| Malaysian | 10 | 0.0% |
| Maltese | 12 | 0.0% |
| Mexican | 2,289 | 1.1% |
| Mexican American Indian | 221 | 0.1% |
| Mongolian | 41 | 0.0% |
| Moroccan | 17 | 0.0% |
| Native Hawaiian | 17 | 0.0% |
| Navajo | 10 | 0.0% |
| Nicaraguan | 446 | 0.2% |
| Nigerian | 638 | 0.3% |
| Northern European | 344 | 0.2% |
| Norwegian | 1,202 | 0.6% |
| Osage | 6 | 0.0% |
| Pakistani | 390 | 0.2% |
| Palestinian | 36 | 0.0% |
| Panamanian | 424 | 0.2% |
| Paraguayan | 100 | 0.1% |
| Pennsylvania German | 8 | 0.0% |
| Peruvian | 194 | 0.1% |
| Polish | 3,694 | 1.9% |
| Portuguese | 357 | 0.2% |
| Puerto Rican | 2,714 | 1.4% |
| Romanian | 115 | 0.1% |
| Russian | 1,415 | 0.7% |
| Salvadoran | 139 | 0.1% |
| Samoan | 99 | 0.1% |
| Scandinavian | 310 | 0.2% |
| Scotch-Irish | 2,207 | 1.1% |
| Scottish | 3,194 | 1.6% |
| Seminole | 18 | 0.0% |
| Serbian | 127 | 0.1% |
| Sierra Leonean | 8 | 0.0% |
| Sioux | 20 | 0.0% |
| Slavic | 102 | 0.1% |
| Slovak | 148 | 0.1% |
| Slovene | 79 | 0.0% |
| Somali | 9 | 0.0% |
| South American | 2,174 | 1.1% |
| Spaniard | 848 | 0.4% |
| Spanish | 416 | 0.2% |
| Sri Lankan | 674 | 0.3% |
| Subsaharan African | 2,597 | 1.3% |
| Sudanese | 27 | 0.0% |
| Swedish | 742 | 0.4% |
| Swiss | 444 | 0.2% |
| Syrian | 113 | 0.1% |
| Thai | 3,161 | 1.6% |
| Trinidadian and Tobagonian | 81 | 0.0% |
| Turkish | 149 | 0.1% |
| U.S. Virgin Islander | 74 | 0.0% |
| Ugandan | 18 | 0.0% |
| Ukrainian | 338 | 0.2% |
| Uruguayan | 8 | 0.0% |
| Venezuelan | 616 | 0.3% |
| Vietnamese | 150 | 0.1% |
| Welsh | 1,344 | 0.7% |
| West Indian | 663 | 0.3% |
| Yugoslavian | 30 | 0.0% |
| Zimbabwean | 5 | 0.0% | View All 139 Rows |
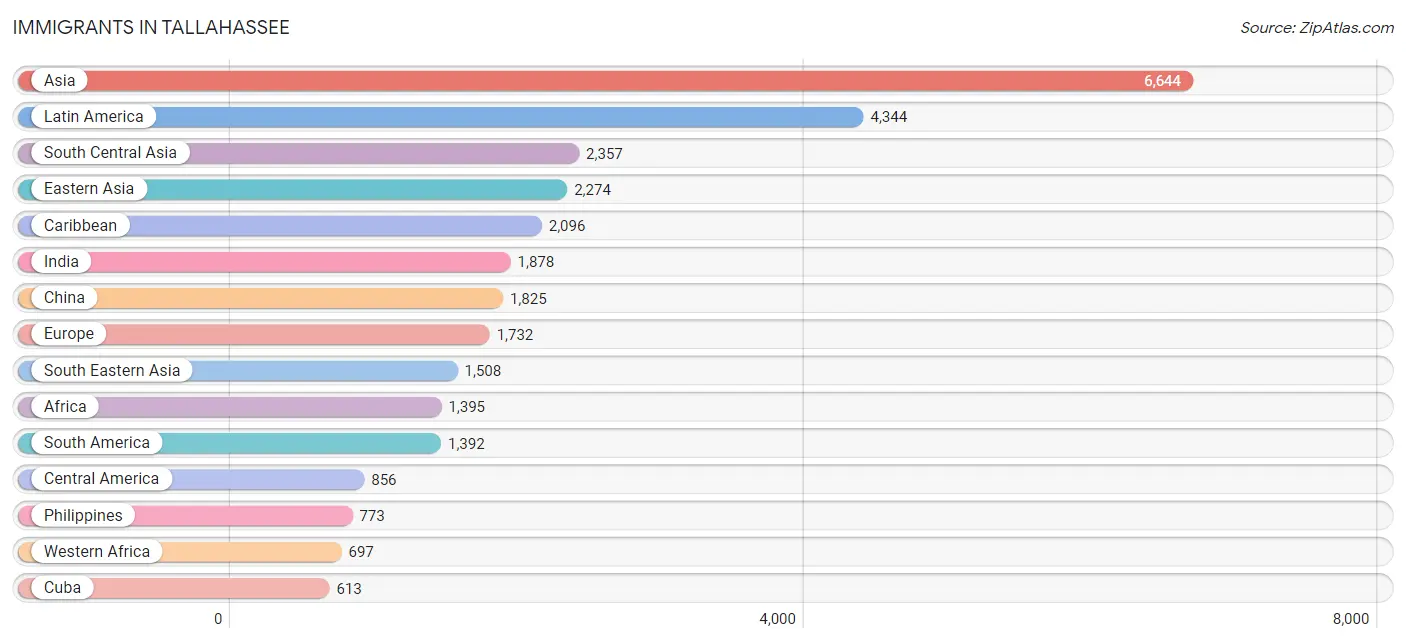
Immigrants in Tallahassee
The most numerous immigrant groups reported in Tallahassee came from Asia (6,644 | 3.4%), Latin America (4,344 | 2.2%), South Central Asia (2,357 | 1.2%), Eastern Asia (2,274 | 1.1%), and Caribbean (2,096 | 1.1%), together accounting for 8.9% of all Tallahassee residents.
| Immigration Origin | # Population | % Population |
| Africa | 1,395 | 0.7% |
| Albania | 35 | 0.0% |
| Argentina | 41 | 0.0% |
| Asia | 6,644 | 3.4% |
| Australia | 27 | 0.0% |
| Austria | 5 | 0.0% |
| Bahamas | 131 | 0.1% |
| Bangladesh | 130 | 0.1% |
| Belize | 6 | 0.0% |
| Bosnia and Herzegovina | 32 | 0.0% |
| Brazil | 367 | 0.2% |
| Cameroon | 19 | 0.0% |
| Canada | 492 | 0.3% |
| Caribbean | 2,096 | 1.1% |
| Central America | 856 | 0.4% |
| Chile | 8 | 0.0% |
| China | 1,825 | 0.9% |
| Colombia | 236 | 0.1% |
| Costa Rica | 14 | 0.0% |
| Croatia | 10 | 0.0% |
| Cuba | 613 | 0.3% |
| Dominican Republic | 144 | 0.1% |
| Eastern Africa | 333 | 0.2% |
| Eastern Asia | 2,274 | 1.1% |
| Eastern Europe | 593 | 0.3% |
| Ecuador | 47 | 0.0% |
| Egypt | 134 | 0.1% |
| El Salvador | 9 | 0.0% |
| England | 142 | 0.1% |
| Ethiopia | 9 | 0.0% |
| Europe | 1,732 | 0.9% |
| France | 94 | 0.1% |
| Germany | 369 | 0.2% |
| Ghana | 83 | 0.0% |
| Greece | 17 | 0.0% |
| Guatemala | 75 | 0.0% |
| Guyana | 50 | 0.0% |
| Haiti | 450 | 0.2% |
| Honduras | 88 | 0.0% |
| Hong Kong | 50 | 0.0% |
| Hungary | 39 | 0.0% |
| India | 1,878 | 0.9% |
| Indonesia | 9 | 0.0% |
| Iran | 179 | 0.1% |
| Iraq | 16 | 0.0% |
| Israel | 170 | 0.1% |
| Italy | 35 | 0.0% |
| Jamaica | 501 | 0.3% |
| Japan | 182 | 0.1% |
| Jordan | 30 | 0.0% |
| Kazakhstan | 16 | 0.0% |
| Kenya | 157 | 0.1% |
| Korea | 267 | 0.1% |
| Kuwait | 6 | 0.0% |
| Latin America | 4,344 | 2.2% |
| Lebanon | 15 | 0.0% |
| Liberia | 19 | 0.0% |
| Lithuania | 13 | 0.0% |
| Malaysia | 43 | 0.0% |
| Mexico | 489 | 0.3% |
| Middle Africa | 92 | 0.1% |
| Nepal | 59 | 0.0% |
| Netherlands | 22 | 0.0% |
| Nicaragua | 15 | 0.0% |
| Nigeria | 448 | 0.2% |
| Northern Africa | 161 | 0.1% |
| Northern Europe | 447 | 0.2% |
| Oceania | 49 | 0.0% |
| Pakistan | 60 | 0.0% |
| Panama | 160 | 0.1% |
| Peru | 27 | 0.0% |
| Philippines | 773 | 0.4% |
| Poland | 8 | 0.0% |
| Portugal | 6 | 0.0% |
| Romania | 38 | 0.0% |
| Russia | 296 | 0.2% |
| Saudi Arabia | 56 | 0.0% |
| Scotland | 8 | 0.0% |
| Serbia | 77 | 0.0% |
| Sierra Leone | 48 | 0.0% |
| South Africa | 90 | 0.1% |
| South America | 1,392 | 0.7% |
| South Central Asia | 2,357 | 1.2% |
| South Eastern Asia | 1,508 | 0.8% |
| Southern Europe | 202 | 0.1% |
| Spain | 144 | 0.1% |
| Sri Lanka | 10 | 0.0% |
| St. Vincent and the Grenadines | 10 | 0.0% |
| Sudan | 12 | 0.0% |
| Sweden | 49 | 0.0% |
| Syria | 82 | 0.0% |
| Taiwan | 233 | 0.1% |
| Thailand | 184 | 0.1% |
| Trinidad and Tobago | 67 | 0.0% |
| Turkey | 80 | 0.0% |
| Ukraine | 14 | 0.0% |
| Uruguay | 8 | 0.0% |
| Uzbekistan | 25 | 0.0% |
| Venezuela | 564 | 0.3% |
| Vietnam | 450 | 0.2% |
| Western Africa | 697 | 0.4% |
| Western Asia | 479 | 0.2% |
| Western Europe | 490 | 0.3% |
| Zaire | 73 | 0.0% |
| Zimbabwe | 30 | 0.0% | View All 105 Rows |
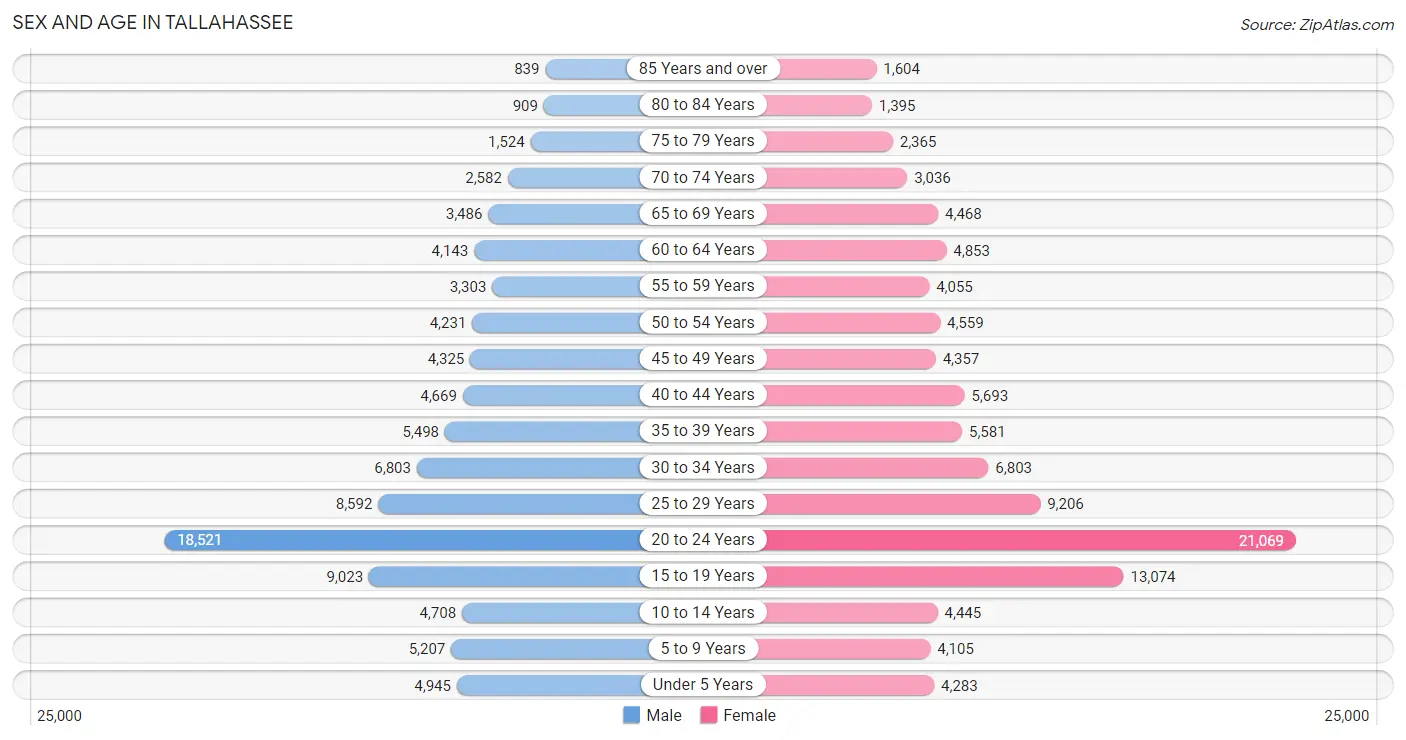
Sex and Age in Tallahassee
Sex and Age in Tallahassee
The most populous age groups in Tallahassee are 20 to 24 Years (18,521 | 19.9%) for men and 20 to 24 Years (21,069 | 20.1%) for women.
| Age Bracket | Male | Female |
| Under 5 Years | 4,945 (5.3%) | 4,283 (4.1%) |
| 5 to 9 Years | 5,207 (5.6%) | 4,105 (3.9%) |
| 10 to 14 Years | 4,708 (5.1%) | 4,445 (4.2%) |
| 15 to 19 Years | 9,023 (9.7%) | 13,074 (12.5%) |
| 20 to 24 Years | 18,521 (19.9%) | 21,069 (20.1%) |
| 25 to 29 Years | 8,592 (9.2%) | 9,206 (8.8%) |
| 30 to 34 Years | 6,803 (7.3%) | 6,803 (6.5%) |
| 35 to 39 Years | 5,498 (5.9%) | 5,581 (5.3%) |
| 40 to 44 Years | 4,669 (5.0%) | 5,693 (5.4%) |
| 45 to 49 Years | 4,325 (4.6%) | 4,357 (4.2%) |
| 50 to 54 Years | 4,231 (4.5%) | 4,559 (4.3%) |
| 55 to 59 Years | 3,303 (3.5%) | 4,055 (3.9%) |
| 60 to 64 Years | 4,143 (4.4%) | 4,853 (4.6%) |
| 65 to 69 Years | 3,486 (3.7%) | 4,468 (4.3%) |
| 70 to 74 Years | 2,582 (2.8%) | 3,036 (2.9%) |
| 75 to 79 Years | 1,524 (1.6%) | 2,365 (2.2%) |
| 80 to 84 Years | 909 (1.0%) | 1,395 (1.3%) |
| 85 Years and over | 839 (0.9%) | 1,604 (1.5%) |
| Total | 93,308 (100.0%) | 104,951 (100.0%) |
Families and Households in Tallahassee
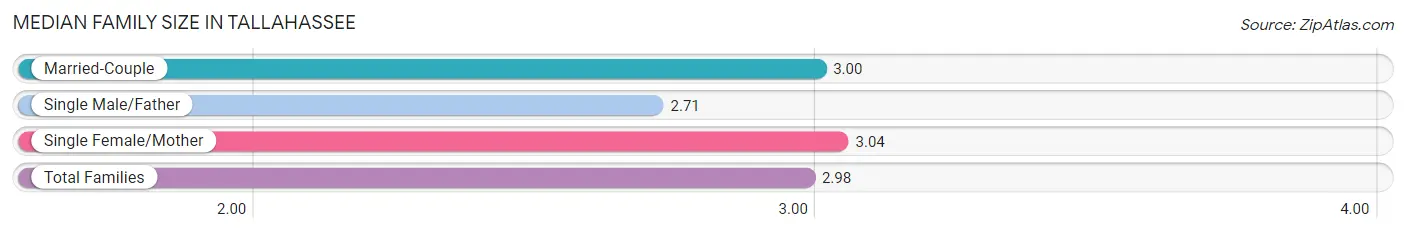
Median Family Size in Tallahassee
The median family size in Tallahassee is 2.98 persons per family, with single female/mother families (11,076 | 30.5%) accounting for the largest median family size of 3.04 persons per family. On the other hand, single male/father families (3,491 | 9.6%) represent the smallest median family size with 2.71 persons per family.
| Family Type | # Families | Family Size |
| Married-Couple | 21,783 (59.9%) | 3.00 |
| Single Male/Father | 3,491 (9.6%) | 2.71 |
| Single Female/Mother | 11,076 (30.5%) | 3.04 |
| Total Families | 36,350 (100.0%) | 2.98 |
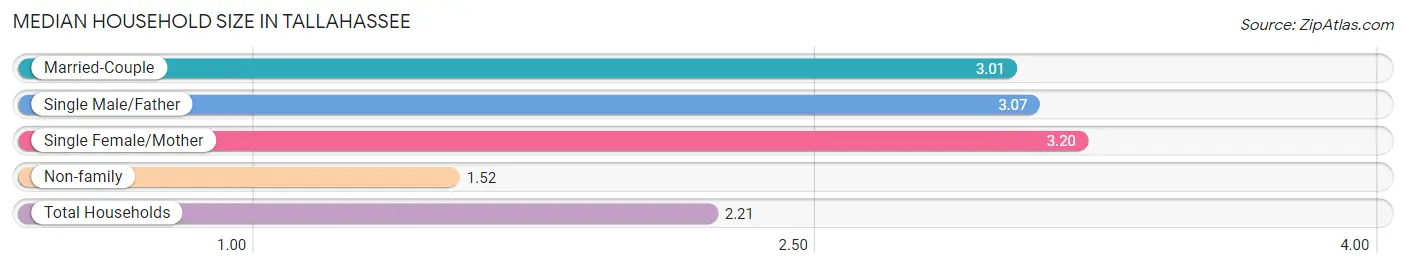
Median Household Size in Tallahassee
The median household size in Tallahassee is 2.21 persons per household, with single female/mother households (11,076 | 13.5%) accounting for the largest median household size of 3.2 persons per household. non-family households (45,496 | 55.6%) represent the smallest median household size with 1.52 persons per household.
| Household Type | # Households | Household Size |
| Married-Couple | 21,783 (26.6%) | 3.01 |
| Single Male/Father | 3,491 (4.3%) | 3.07 |
| Single Female/Mother | 11,076 (13.5%) | 3.20 |
| Non-family | 45,496 (55.6%) | 1.52 |
| Total Households | 81,846 (100.0%) | 2.21 |
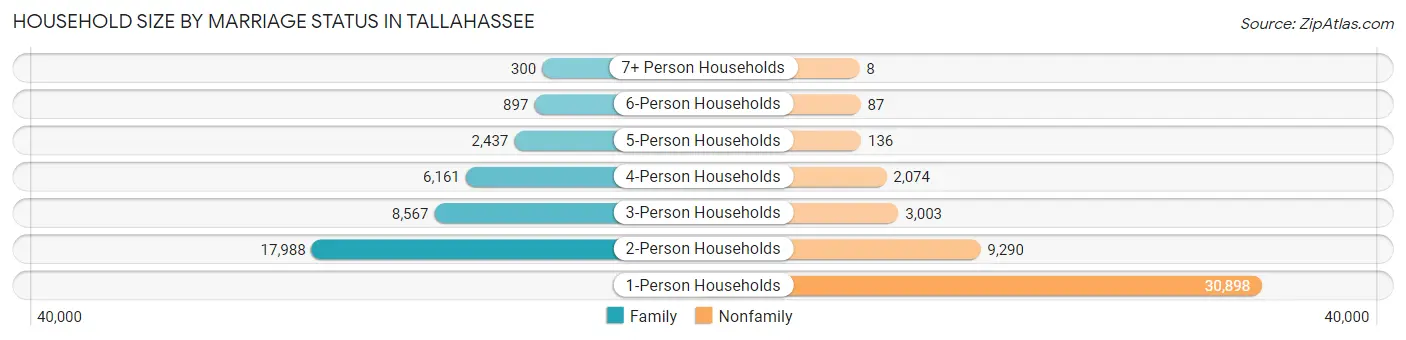
Household Size by Marriage Status in Tallahassee
Out of a total of 81,846 households in Tallahassee, 36,350 (44.4%) are family households, while 45,496 (55.6%) are nonfamily households. The most numerous type of family households are 2-person households, comprising 17,988, and the most common type of nonfamily households are 1-person households, comprising 30,898.
| Household Size | Family Households | Nonfamily Households |
| 1-Person Households | - | 30,898 (37.8%) |
| 2-Person Households | 17,988 (22.0%) | 9,290 (11.4%) |
| 3-Person Households | 8,567 (10.5%) | 3,003 (3.7%) |
| 4-Person Households | 6,161 (7.5%) | 2,074 (2.5%) |
| 5-Person Households | 2,437 (3.0%) | 136 (0.2%) |
| 6-Person Households | 897 (1.1%) | 87 (0.1%) |
| 7+ Person Households | 300 (0.4%) | 8 (0.0%) |
| Total | 36,350 (44.4%) | 45,496 (55.6%) |
Female Fertility in Tallahassee
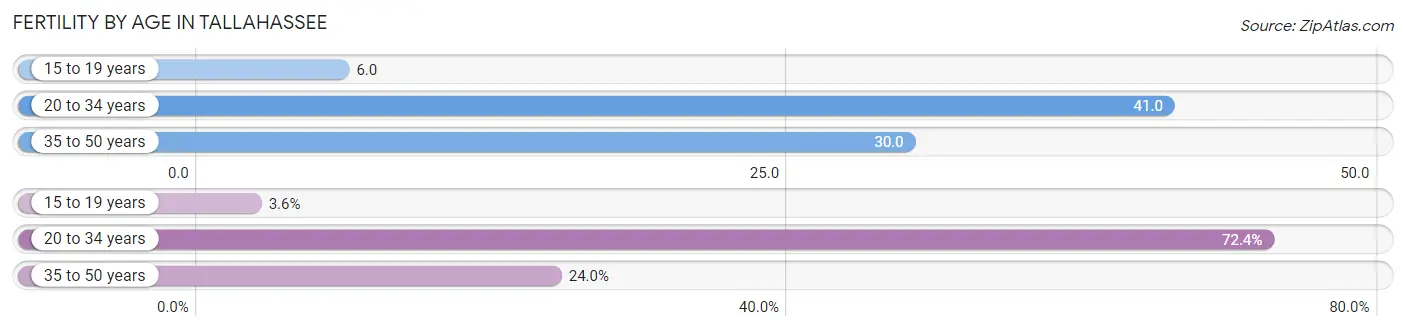
Fertility by Age in Tallahassee
Average fertility rate in Tallahassee is 32.0 births per 1,000 women. Women in the age bracket of 20 to 34 years have the highest fertility rate with 41.0 births per 1,000 women. Women in the age bracket of 20 to 34 years acount for 72.4% of all women with births.
| Age Bracket | Women with Births | Births / 1,000 Women |
| 15 to 19 years | 77 (3.6%) | 6.0 |
| 20 to 34 years | 1,531 (72.4%) | 41.0 |
| 35 to 50 years | 508 (24.0%) | 30.0 |
| Total | 2,116 (100.0%) | 32.0 |
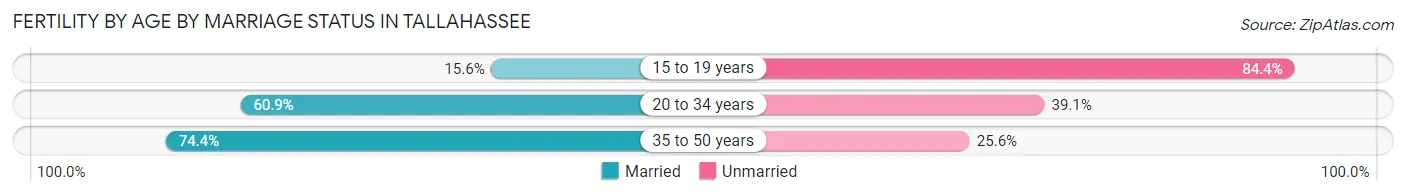
Fertility by Age by Marriage Status in Tallahassee
62.5% of women with births (2,116) in Tallahassee are married. The highest percentage of unmarried women with births falls into 15 to 19 years age bracket with 84.4% of them unmarried at the time of birth, while the lowest percentage of unmarried women with births belong to 35 to 50 years age bracket with 25.6% of them unmarried.
| Age Bracket | Married | Unmarried |
| 15 to 19 years | 12 (15.6%) | 65 (84.4%) |
| 20 to 34 years | 932 (60.9%) | 599 (39.1%) |
| 35 to 50 years | 378 (74.4%) | 130 (25.6%) |
| Total | 1,322 (62.5%) | 794 (37.5%) |
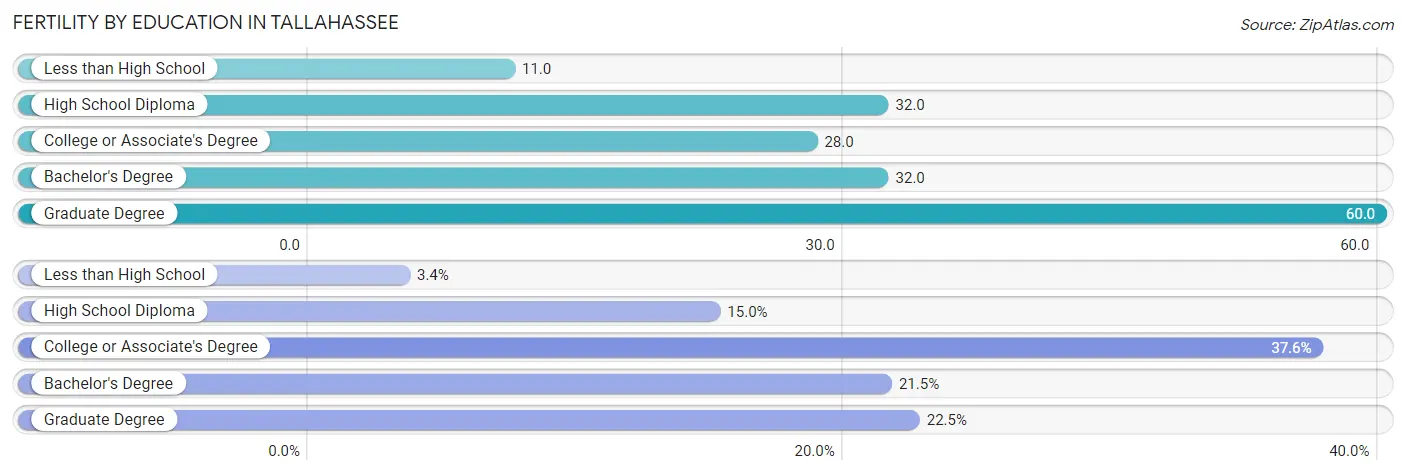
Fertility by Education in Tallahassee
Average fertility rate in Tallahassee is 32.0 births per 1,000 women. Women with the education attainment of graduate degree have the highest fertility rate of 60.0 births per 1,000 women, while women with the education attainment of less than high school have the lowest fertility at 11.0 births per 1,000 women. Women with the education attainment of college or associate's degree represent 37.6% of all women with births.
| Educational Attainment | Women with Births | Births / 1,000 Women |
| Less than High School | 72 (3.4%) | 11.0 |
| High School Diploma | 318 (15.0%) | 32.0 |
| College or Associate's Degree | 796 (37.6%) | 28.0 |
| Bachelor's Degree | 454 (21.5%) | 32.0 |
| Graduate Degree | 476 (22.5%) | 60.0 |
| Total | 2,116 (100.0%) | 32.0 |
Fertility by Education by Marriage Status in Tallahassee
37.5% of women with births in Tallahassee are unmarried. Women with the educational attainment of graduate degree are most likely to be married with 94.8% of them married at childbirth, while women with the educational attainment of college or associate's degree are least likely to be married with 67.0% of them unmarried at childbirth.
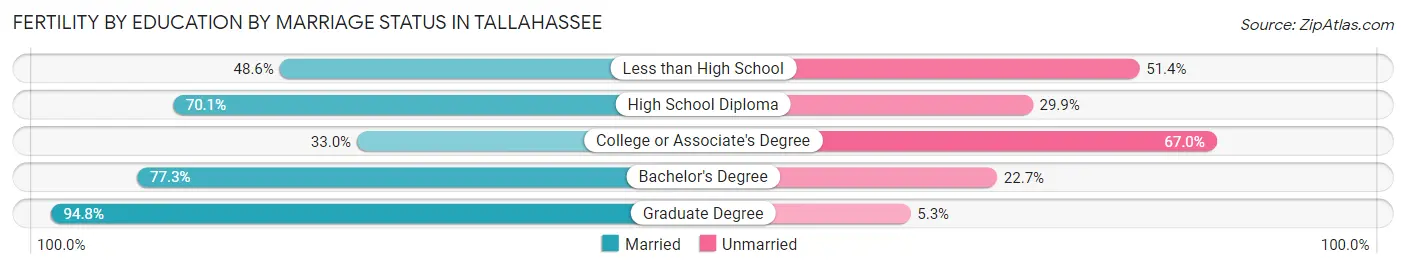
| Educational Attainment | Married | Unmarried |
| Less than High School | 35 (48.6%) | 37 (51.4%) |
| High School Diploma | 223 (70.1%) | 95 (29.9%) |
| College or Associate's Degree | 263 (33.0%) | 533 (67.0%) |
| Bachelor's Degree | 351 (77.3%) | 103 (22.7%) |
| Graduate Degree | 451 (94.8%) | 25 (5.2%) |
| Total | 1,322 (62.5%) | 794 (37.5%) |
Employment Characteristics in Tallahassee
Employment by Class of Employer in Tallahassee
Among the 101,139 employed individuals in Tallahassee, private company employees (56,018 | 55.4%), state government employees (21,669 | 21.4%), and not-for-profit organizations (8,667 | 8.6%) make up the most common classes of employment.
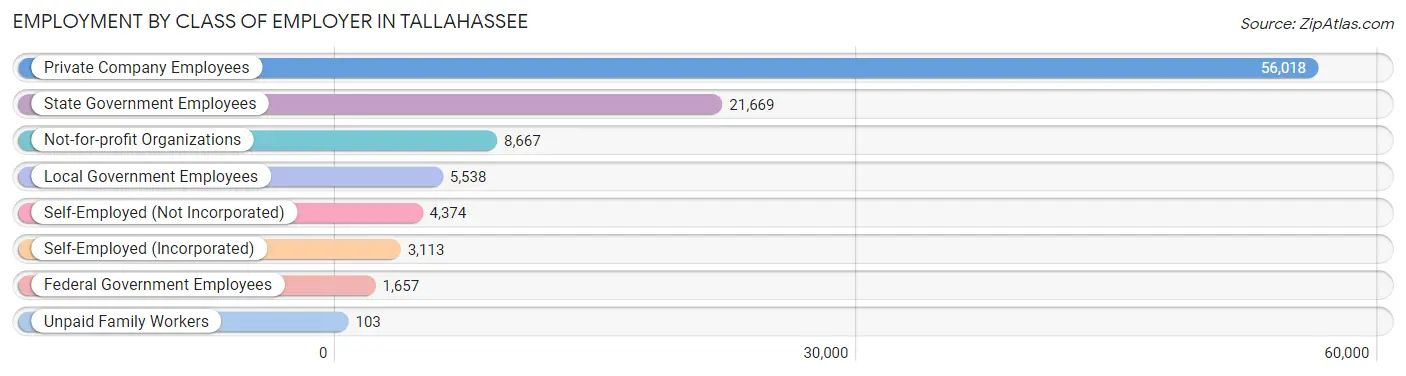
| Employer Class | # Employees | % Employees |
| Private Company Employees | 56,018 | 55.4% |
| Self-Employed (Incorporated) | 3,113 | 3.1% |
| Self-Employed (Not Incorporated) | 4,374 | 4.3% |
| Not-for-profit Organizations | 8,667 | 8.6% |
| Local Government Employees | 5,538 | 5.5% |
| State Government Employees | 21,669 | 21.4% |
| Federal Government Employees | 1,657 | 1.6% |
| Unpaid Family Workers | 103 | 0.1% |
| Total | 101,139 | 100.0% |
Employment Status by Age in Tallahassee
According to the labor force statistics for Tallahassee, out of the total population over 16 years of age (168,620), 65.9% or 111,121 individuals are in the labor force, with 6.5% or 7,223 of them unemployed. The age group with the highest labor force participation rate is 30 to 34 years, with 86.6% or 11,783 individuals in the labor force. Within the labor force, the 16 to 19 years age range has the highest percentage of unemployed individuals, with 25.3% or 1,810 of them being unemployed.
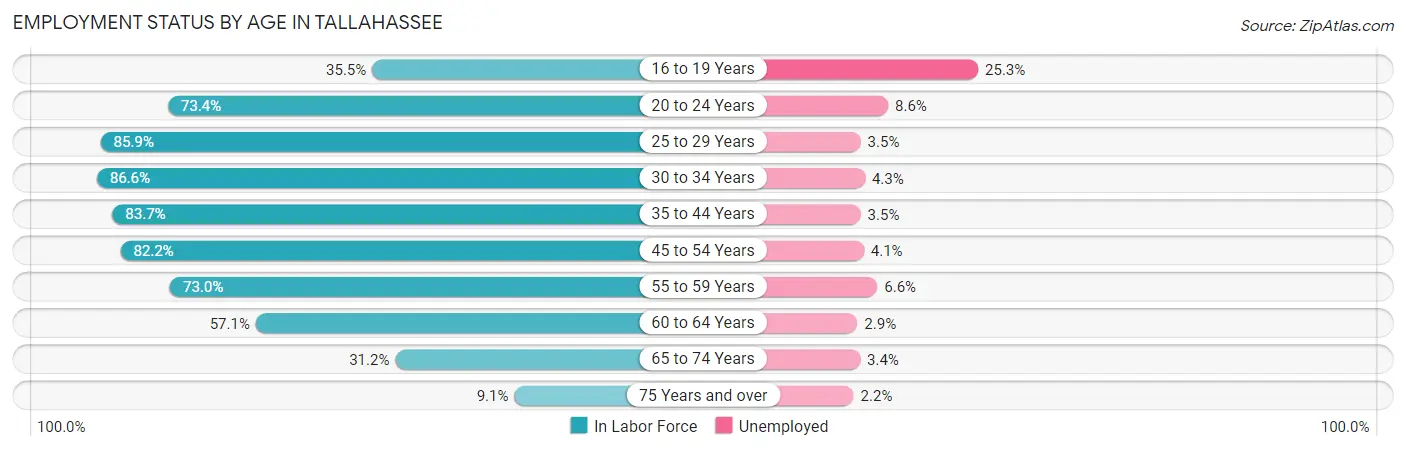
| Age Bracket | In Labor Force | Unemployed |
| 16 to 19 Years | 7,154 (35.5%) | 1,810 (25.3%) |
| 20 to 24 Years | 29,059 (73.4%) | 2,499 (8.6%) |
| 25 to 29 Years | 15,288 (85.9%) | 535 (3.5%) |
| 30 to 34 Years | 11,783 (86.6%) | 507 (4.3%) |
| 35 to 44 Years | 17,946 (83.7%) | 628 (3.5%) |
| 45 to 54 Years | 14,362 (82.2%) | 589 (4.1%) |
| 55 to 59 Years | 5,371 (73.0%) | 354 (6.6%) |
| 60 to 64 Years | 5,137 (57.1%) | 149 (2.9%) |
| 65 to 74 Years | 4,234 (31.2%) | 144 (3.4%) |
| 75 Years and over | 786 (9.1%) | 17 (2.2%) |
| Total | 111,121 (65.9%) | 7,223 (6.5%) |
Employment Status by Educational Attainment in Tallahassee
According to labor force statistics for Tallahassee, 80.6% of individuals (69,857) out of the total population between 25 and 64 years of age (86,671) are in the labor force, with 3.9% or 2,724 of them being unemployed. The group with the highest labor force participation rate are those with the educational attainment of bachelor's degree or higher, with 88.1% or 38,259 individuals in the labor force. Within the labor force, individuals with less than high school education have the highest percentage of unemployment, with 11.3% or 369 of them being unemployed.
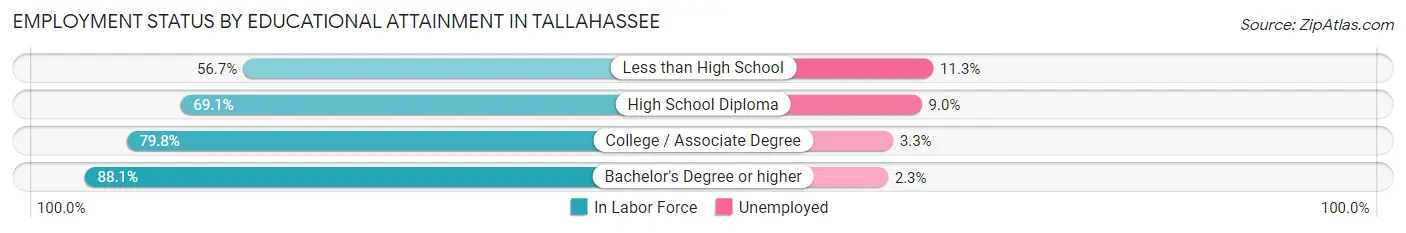
| Educational Attainment | In Labor Force | Unemployed |
| Less than High School | 3,268 (56.7%) | 651 (11.3%) |
| High School Diploma | 9,919 (69.1%) | 1,292 (9.0%) |
| College / Associate Degree | 18,455 (79.8%) | 763 (3.3%) |
| Bachelor's Degree or higher | 38,259 (88.1%) | 999 (2.3%) |
| Total | 69,857 (80.6%) | 3,380 (3.9%) |
Employment Occupations by Sex in Tallahassee
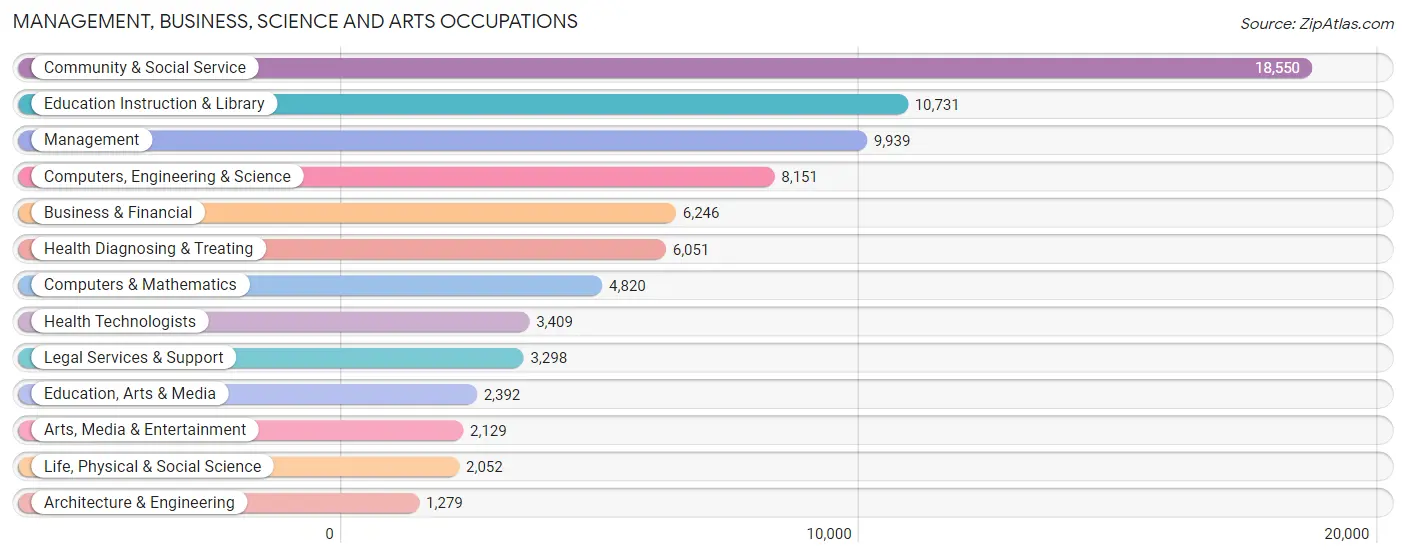
Management, Business, Science and Arts Occupations
The most common Management, Business, Science and Arts occupations in Tallahassee are Community & Social Service (18,550 | 17.9%), Education Instruction & Library (10,731 | 10.3%), Management (9,939 | 9.6%), Computers, Engineering & Science (8,151 | 7.9%), and Business & Financial (6,246 | 6.0%).
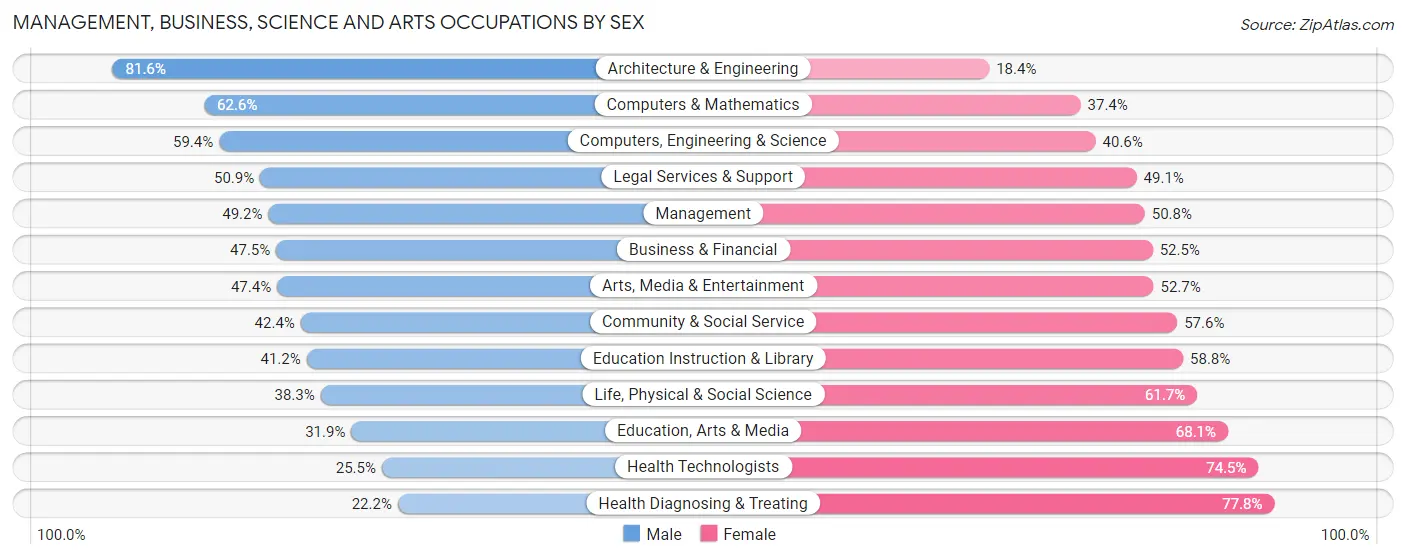
Management, Business, Science and Arts Occupations by Sex
Within the Management, Business, Science and Arts occupations in Tallahassee, the most male-oriented occupations are Architecture & Engineering (81.6%), Computers & Mathematics (62.6%), and Computers, Engineering & Science (59.4%), while the most female-oriented occupations are Health Diagnosing & Treating (77.8%), Health Technologists (74.5%), and Education, Arts & Media (68.1%).
| Occupation | Male | Female |
| Management | 4,887 (49.2%) | 5,052 (50.8%) |
| Business & Financial | 2,969 (47.5%) | 3,277 (52.5%) |
| Computers, Engineering & Science | 4,845 (59.4%) | 3,306 (40.6%) |
| Computers & Mathematics | 3,016 (62.6%) | 1,804 (37.4%) |
| Architecture & Engineering | 1,044 (81.6%) | 235 (18.4%) |
| Life, Physical & Social Science | 785 (38.3%) | 1,267 (61.7%) |
| Community & Social Service | 7,867 (42.4%) | 10,683 (57.6%) |
| Education, Arts & Media | 762 (31.9%) | 1,630 (68.1%) |
| Legal Services & Support | 1,678 (50.9%) | 1,620 (49.1%) |
| Education Instruction & Library | 4,419 (41.2%) | 6,312 (58.8%) |
| Arts, Media & Entertainment | 1,008 (47.3%) | 1,121 (52.6%) |
| Health Diagnosing & Treating | 1,341 (22.2%) | 4,710 (77.8%) |
| Health Technologists | 869 (25.5%) | 2,540 (74.5%) |
| Total (Category) | 21,909 (44.8%) | 27,028 (55.2%) |
| Total (Overall) | 49,219 (47.5%) | 54,453 (52.5%) |
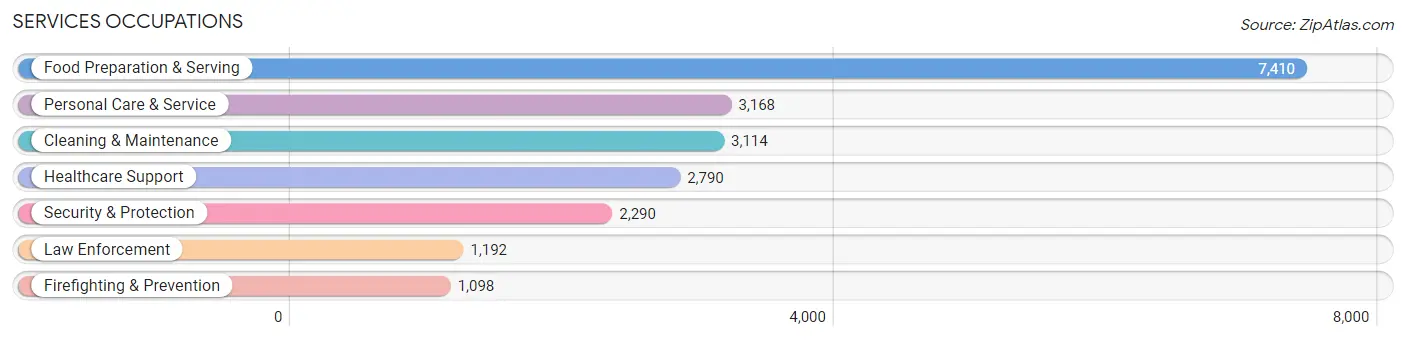
Services Occupations
The most common Services occupations in Tallahassee are Food Preparation & Serving (7,410 | 7.1%), Personal Care & Service (3,168 | 3.1%), Cleaning & Maintenance (3,114 | 3.0%), Healthcare Support (2,790 | 2.7%), and Security & Protection (2,290 | 2.2%).
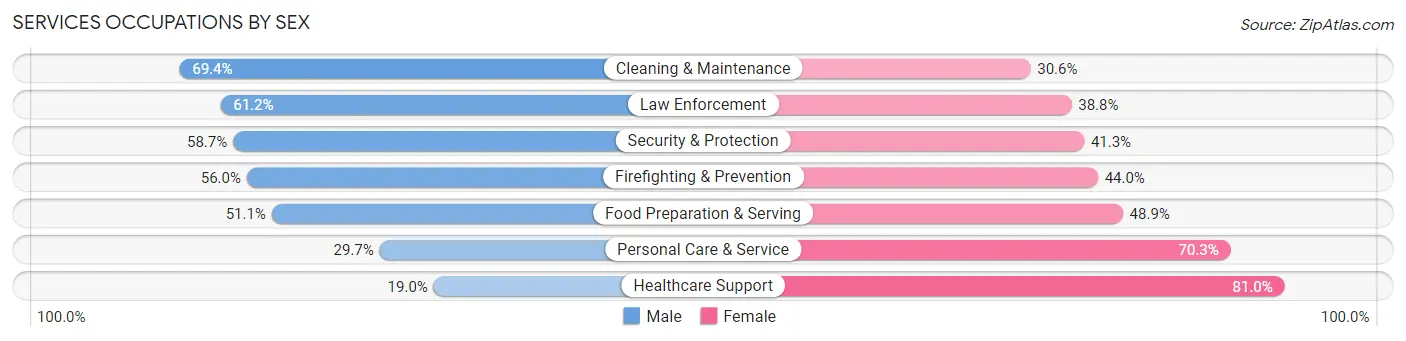
Services Occupations by Sex
Within the Services occupations in Tallahassee, the most male-oriented occupations are Cleaning & Maintenance (69.4%), Law Enforcement (61.2%), and Security & Protection (58.7%), while the most female-oriented occupations are Healthcare Support (81.0%), Personal Care & Service (70.3%), and Food Preparation & Serving (48.9%).
| Occupation | Male | Female |
| Healthcare Support | 530 (19.0%) | 2,260 (81.0%) |
| Security & Protection | 1,345 (58.7%) | 945 (41.3%) |
| Firefighting & Prevention | 615 (56.0%) | 483 (44.0%) |
| Law Enforcement | 730 (61.2%) | 462 (38.8%) |
| Food Preparation & Serving | 3,784 (51.1%) | 3,626 (48.9%) |
| Cleaning & Maintenance | 2,160 (69.4%) | 954 (30.6%) |
| Personal Care & Service | 941 (29.7%) | 2,227 (70.3%) |
| Total (Category) | 8,760 (46.7%) | 10,012 (53.3%) |
| Total (Overall) | 49,219 (47.5%) | 54,453 (52.5%) |
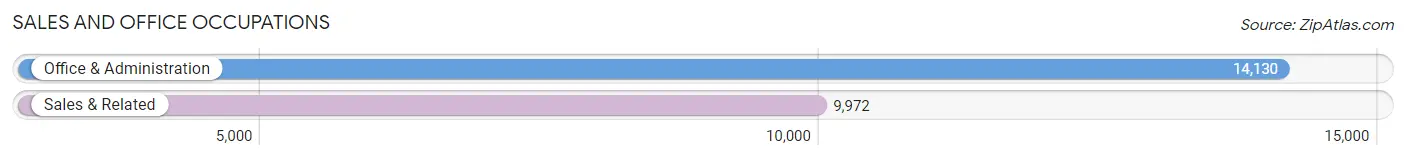
Sales and Office Occupations
The most common Sales and Office occupations in Tallahassee are Office & Administration (14,130 | 13.6%), and Sales & Related (9,972 | 9.6%).
Sales and Office Occupations by Sex
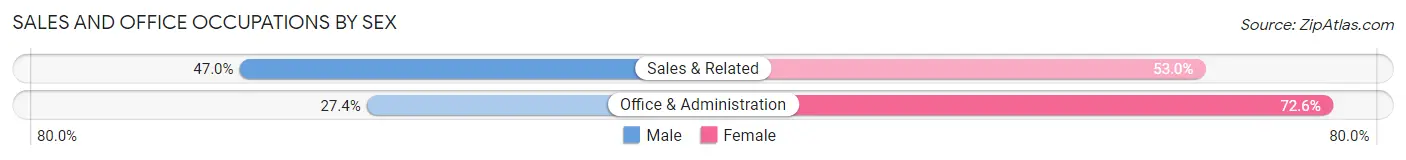
| Occupation | Male | Female |
| Sales & Related | 4,683 (47.0%) | 5,289 (53.0%) |
| Office & Administration | 3,872 (27.4%) | 10,258 (72.6%) |
| Total (Category) | 8,555 (35.5%) | 15,547 (64.5%) |
| Total (Overall) | 49,219 (47.5%) | 54,453 (52.5%) |
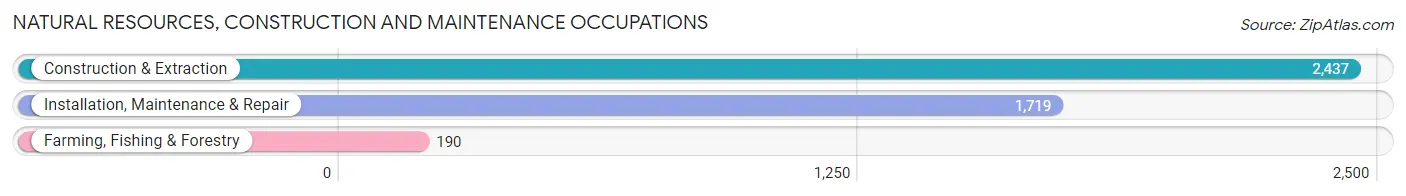
Natural Resources, Construction and Maintenance Occupations
The most common Natural Resources, Construction and Maintenance occupations in Tallahassee are Construction & Extraction (2,437 | 2.4%), Installation, Maintenance & Repair (1,719 | 1.7%), and Farming, Fishing & Forestry (190 | 0.2%).
Natural Resources, Construction and Maintenance Occupations by Sex
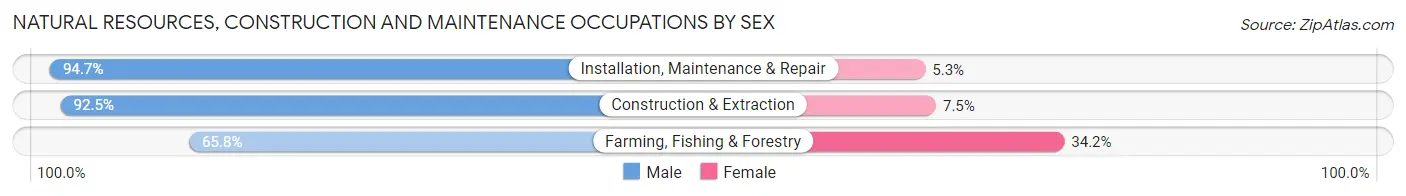
| Occupation | Male | Female |
| Farming, Fishing & Forestry | 125 (65.8%) | 65 (34.2%) |
| Construction & Extraction | 2,254 (92.5%) | 183 (7.5%) |
| Installation, Maintenance & Repair | 1,628 (94.7%) | 91 (5.3%) |
| Total (Category) | 4,007 (92.2%) | 339 (7.8%) |
| Total (Overall) | 49,219 (47.5%) | 54,453 (52.5%) |
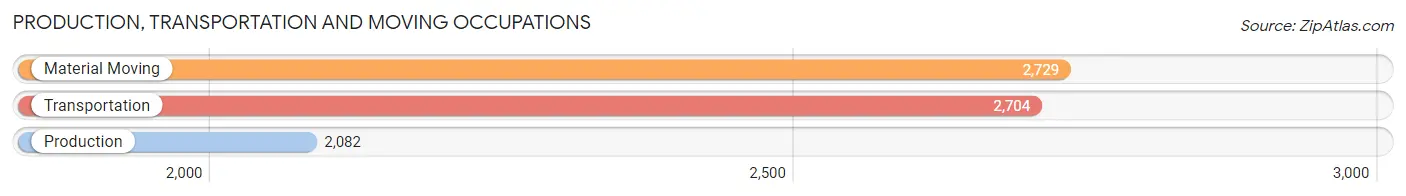
Production, Transportation and Moving Occupations
The most common Production, Transportation and Moving occupations in Tallahassee are Material Moving (2,729 | 2.6%), Transportation (2,704 | 2.6%), and Production (2,082 | 2.0%).
Production, Transportation and Moving Occupations by Sex
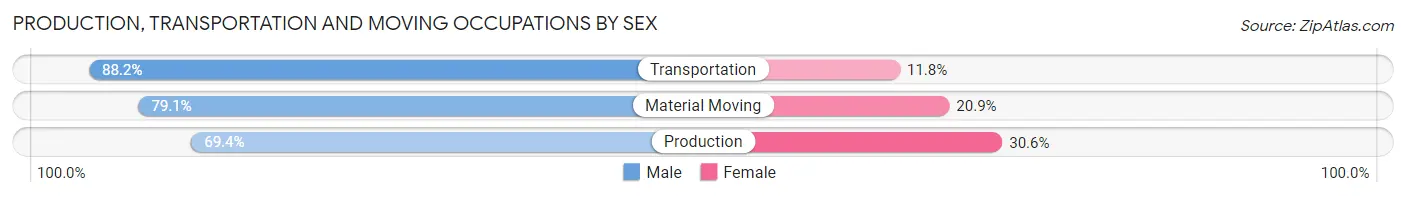
| Occupation | Male | Female |
| Production | 1,445 (69.4%) | 637 (30.6%) |
| Transportation | 2,384 (88.2%) | 320 (11.8%) |
| Material Moving | 2,159 (79.1%) | 570 (20.9%) |
| Total (Category) | 5,988 (79.7%) | 1,527 (20.3%) |
| Total (Overall) | 49,219 (47.5%) | 54,453 (52.5%) |
Employment Industries by Sex in Tallahassee
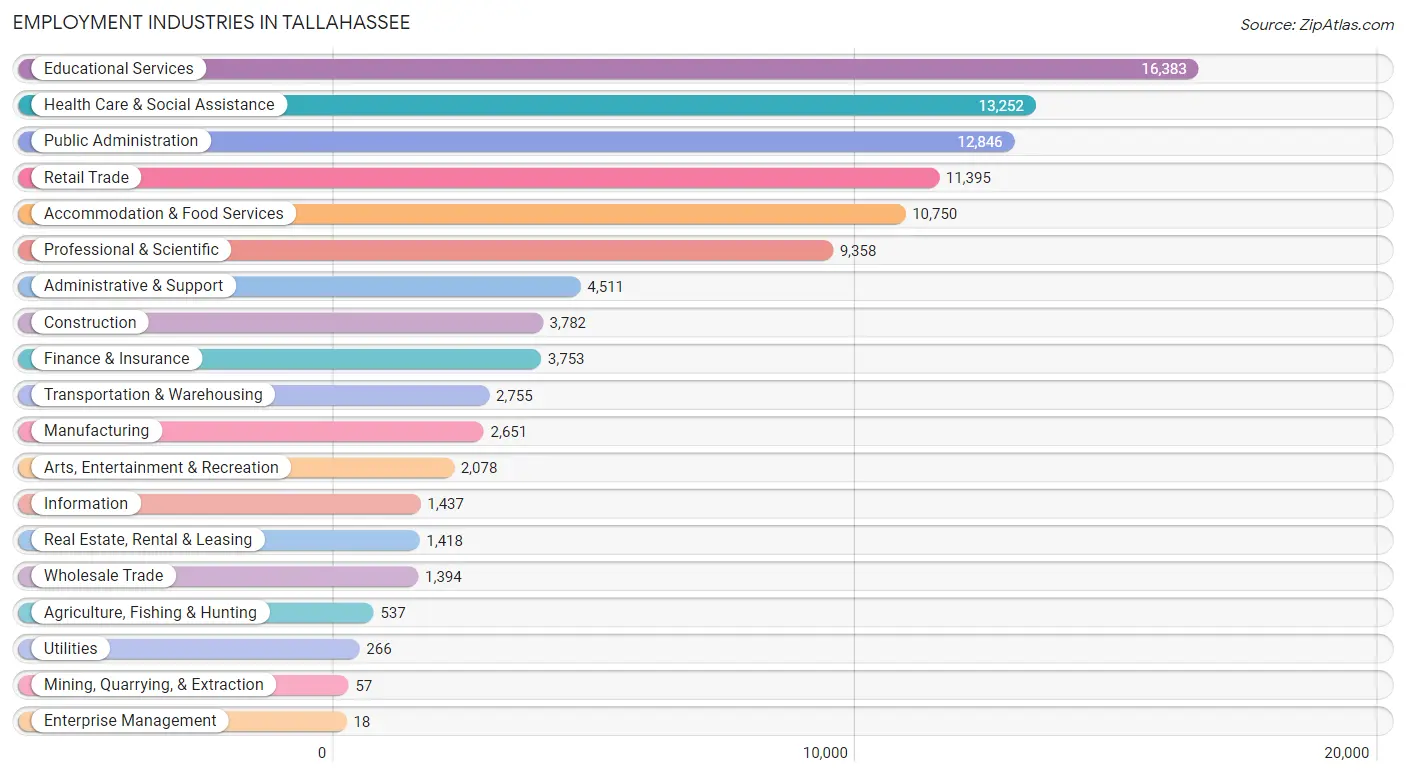
Employment Industries in Tallahassee
The major employment industries in Tallahassee include Educational Services (16,383 | 15.8%), Health Care & Social Assistance (13,252 | 12.8%), Public Administration (12,846 | 12.4%), Retail Trade (11,395 | 11.0%), and Accommodation & Food Services (10,750 | 10.4%).
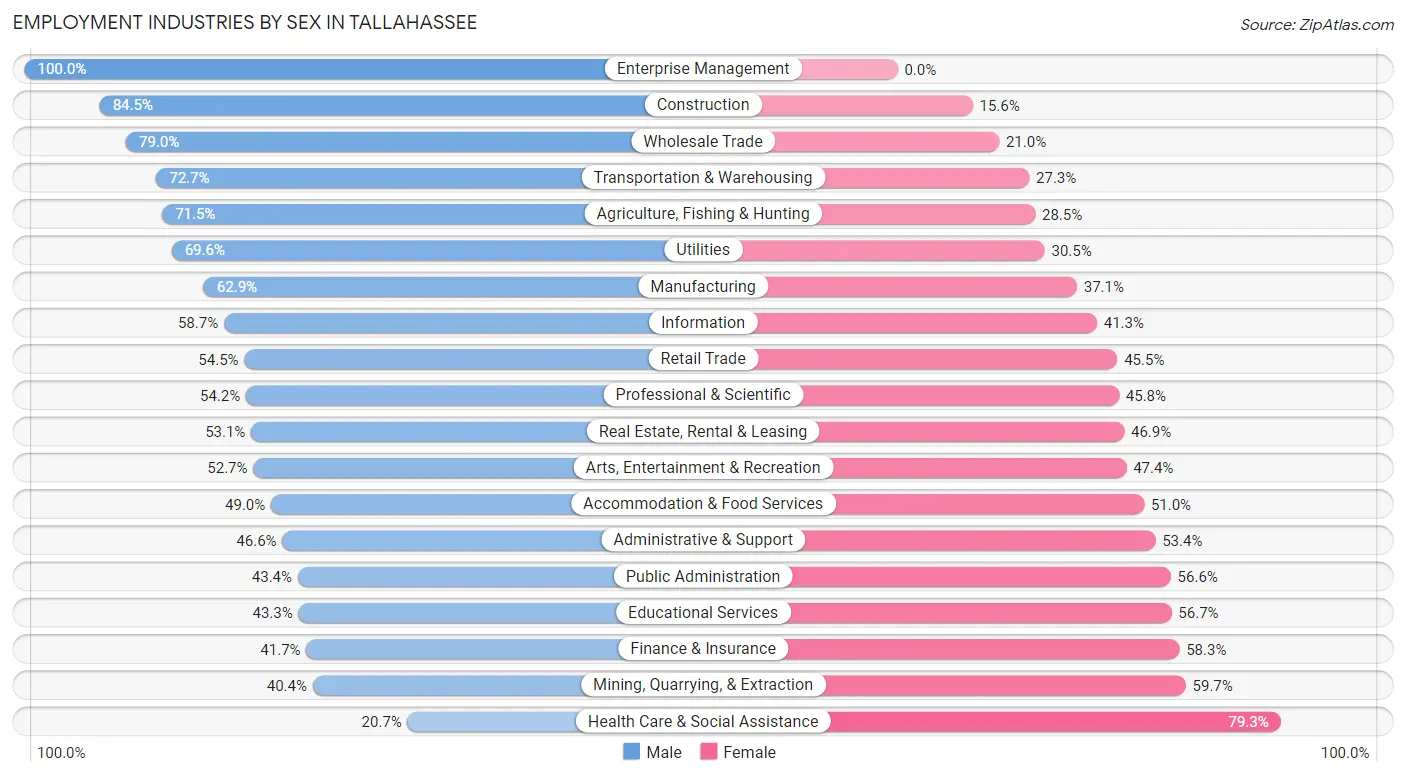
Employment Industries by Sex in Tallahassee
The Tallahassee industries that see more men than women are Enterprise Management (100.0%), Construction (84.5%), and Wholesale Trade (79.0%), whereas the industries that tend to have a higher number of women are Health Care & Social Assistance (79.3%), Mining, Quarrying, & Extraction (59.7%), and Finance & Insurance (58.3%).
| Industry | Male | Female |
| Agriculture, Fishing & Hunting | 384 (71.5%) | 153 (28.5%) |
| Mining, Quarrying, & Extraction | 23 (40.4%) | 34 (59.7%) |
| Construction | 3,194 (84.5%) | 588 (15.5%) |
| Manufacturing | 1,667 (62.9%) | 984 (37.1%) |
| Wholesale Trade | 1,101 (79.0%) | 293 (21.0%) |
| Retail Trade | 6,210 (54.5%) | 5,185 (45.5%) |
| Transportation & Warehousing | 2,004 (72.7%) | 751 (27.3%) |
| Utilities | 185 (69.6%) | 81 (30.4%) |
| Information | 844 (58.7%) | 593 (41.3%) |
| Finance & Insurance | 1,564 (41.7%) | 2,189 (58.3%) |
| Real Estate, Rental & Leasing | 753 (53.1%) | 665 (46.9%) |
| Professional & Scientific | 5,069 (54.2%) | 4,289 (45.8%) |
| Enterprise Management | 18 (100.0%) | 0 (0.0%) |
| Administrative & Support | 2,104 (46.6%) | 2,407 (53.4%) |
| Educational Services | 7,093 (43.3%) | 9,290 (56.7%) |
| Health Care & Social Assistance | 2,745 (20.7%) | 10,507 (79.3%) |
| Arts, Entertainment & Recreation | 1,094 (52.6%) | 984 (47.3%) |
| Accommodation & Food Services | 5,264 (49.0%) | 5,486 (51.0%) |
| Public Administration | 5,580 (43.4%) | 7,266 (56.6%) |
| Total | 49,219 (47.5%) | 54,453 (52.5%) |
Education in Tallahassee
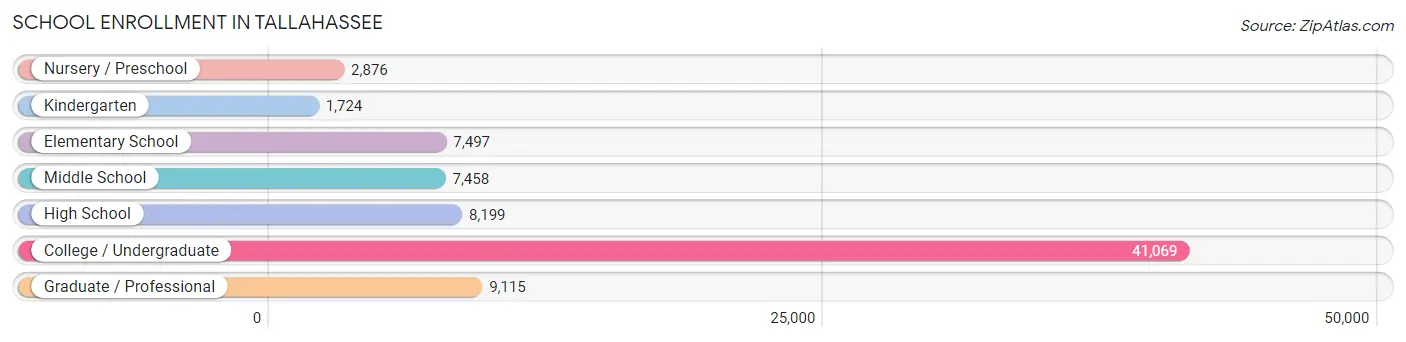
School Enrollment in Tallahassee
The most common levels of schooling among the 77,938 students in Tallahassee are college / undergraduate (41,069 | 52.7%), graduate / professional (9,115 | 11.7%), and high school (8,199 | 10.5%).
| School Level | # Students | % Students |
| Nursery / Preschool | 2,876 | 3.7% |
| Kindergarten | 1,724 | 2.2% |
| Elementary School | 7,497 | 9.6% |
| Middle School | 7,458 | 9.6% |
| High School | 8,199 | 10.5% |
| College / Undergraduate | 41,069 | 52.7% |
| Graduate / Professional | 9,115 | 11.7% |
| Total | 77,938 | 100.0% |
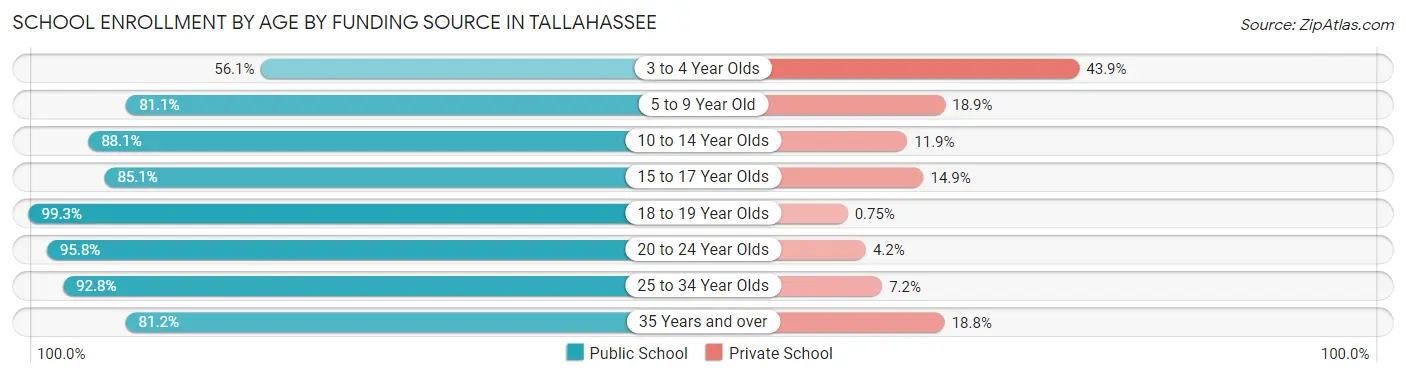
School Enrollment by Age by Funding Source in Tallahassee
Out of a total of 77,938 students who are enrolled in schools in Tallahassee, 6,781 (8.7%) attend a private institution, while the remaining 71,157 (91.3%) are enrolled in public schools. The age group of 3 to 4 year olds has the highest likelihood of being enrolled in private schools, with 996 (43.9% in the age bracket) enrolled. Conversely, the age group of 18 to 19 year olds has the lowest likelihood of being enrolled in a private school, with 15,706 (99.3% in the age bracket) attending a public institution.
| Age Bracket | Public School | Private School |
| 3 to 4 Year Olds | 1,273 (56.1%) | 996 (43.9%) |
| 5 to 9 Year Old | 7,235 (81.1%) | 1,689 (18.9%) |
| 10 to 14 Year Olds | 7,867 (88.1%) | 1,059 (11.9%) |
| 15 to 17 Year Olds | 4,462 (85.1%) | 780 (14.9%) |
| 18 to 19 Year Olds | 15,706 (99.3%) | 118 (0.7%) |
| 20 to 24 Year Olds | 25,569 (95.8%) | 1,110 (4.2%) |
| 25 to 34 Year Olds | 7,122 (92.8%) | 551 (7.2%) |
| 35 Years and over | 1,949 (81.2%) | 452 (18.8%) |
| Total | 71,157 (91.3%) | 6,781 (8.7%) |
Educational Attainment by Field of Study in Tallahassee
Business (9,699 | 16.4%), social sciences (8,177 | 13.8%), science & technology (5,165 | 8.7%), education (5,134 | 8.6%), and arts & humanities (4,791 | 8.1%) are the most common fields of study among 59,335 individuals in Tallahassee who have obtained a bachelor's degree or higher.
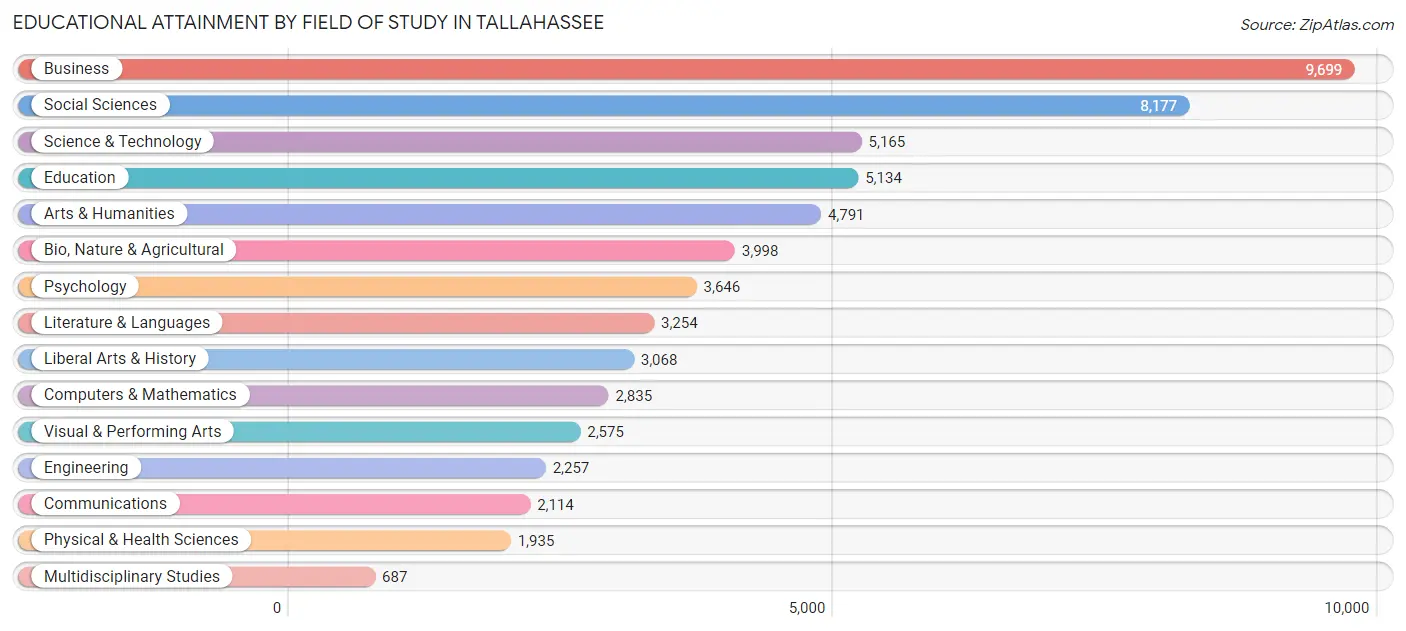
| Field of Study | # Graduates | % Graduates |
| Computers & Mathematics | 2,835 | 4.8% |
| Bio, Nature & Agricultural | 3,998 | 6.7% |
| Physical & Health Sciences | 1,935 | 3.3% |
| Psychology | 3,646 | 6.1% |
| Social Sciences | 8,177 | 13.8% |
| Engineering | 2,257 | 3.8% |
| Multidisciplinary Studies | 687 | 1.2% |
| Science & Technology | 5,165 | 8.7% |
| Business | 9,699 | 16.4% |
| Education | 5,134 | 8.6% |
| Literature & Languages | 3,254 | 5.5% |
| Liberal Arts & History | 3,068 | 5.2% |
| Visual & Performing Arts | 2,575 | 4.3% |
| Communications | 2,114 | 3.6% |
| Arts & Humanities | 4,791 | 8.1% |
| Total | 59,335 | 100.0% |
Transportation & Commute in Tallahassee
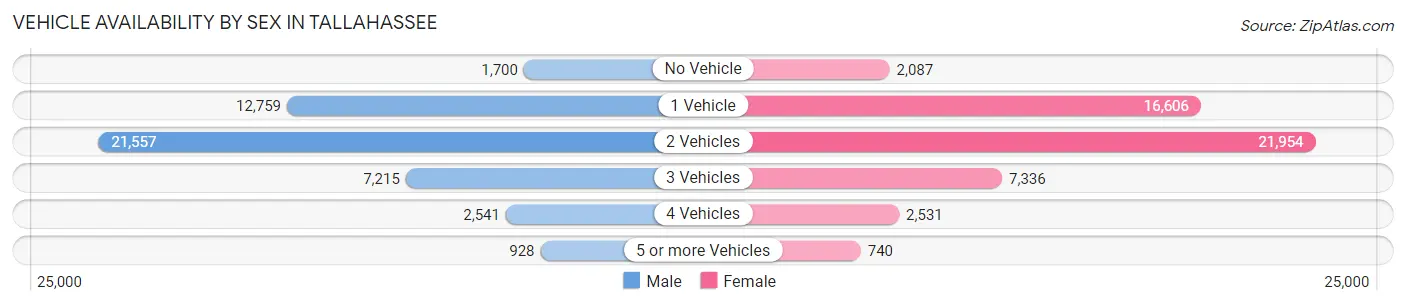
Vehicle Availability by Sex in Tallahassee
The most prevalent vehicle ownership categories in Tallahassee are males with 2 vehicles (21,557, accounting for 46.2%) and females with 2 vehicles (21,954, making up 42.1%).
| Vehicles Available | Male | Female |
| No Vehicle | 1,700 (3.6%) | 2,087 (4.1%) |
| 1 Vehicle | 12,759 (27.3%) | 16,606 (32.4%) |
| 2 Vehicles | 21,557 (46.2%) | 21,954 (42.8%) |
| 3 Vehicles | 7,215 (15.4%) | 7,336 (14.3%) |
| 4 Vehicles | 2,541 (5.4%) | 2,531 (4.9%) |
| 5 or more Vehicles | 928 (2.0%) | 740 (1.4%) |
| Total | 46,700 (100.0%) | 51,254 (100.0%) |
Commute Time in Tallahassee
The most frequently occuring commute durations in Tallahassee are 15 to 19 minutes (22,680 commuters, 25.2%), 10 to 14 minutes (18,542 commuters, 20.6%), and 20 to 24 minutes (14,751 commuters, 16.4%).
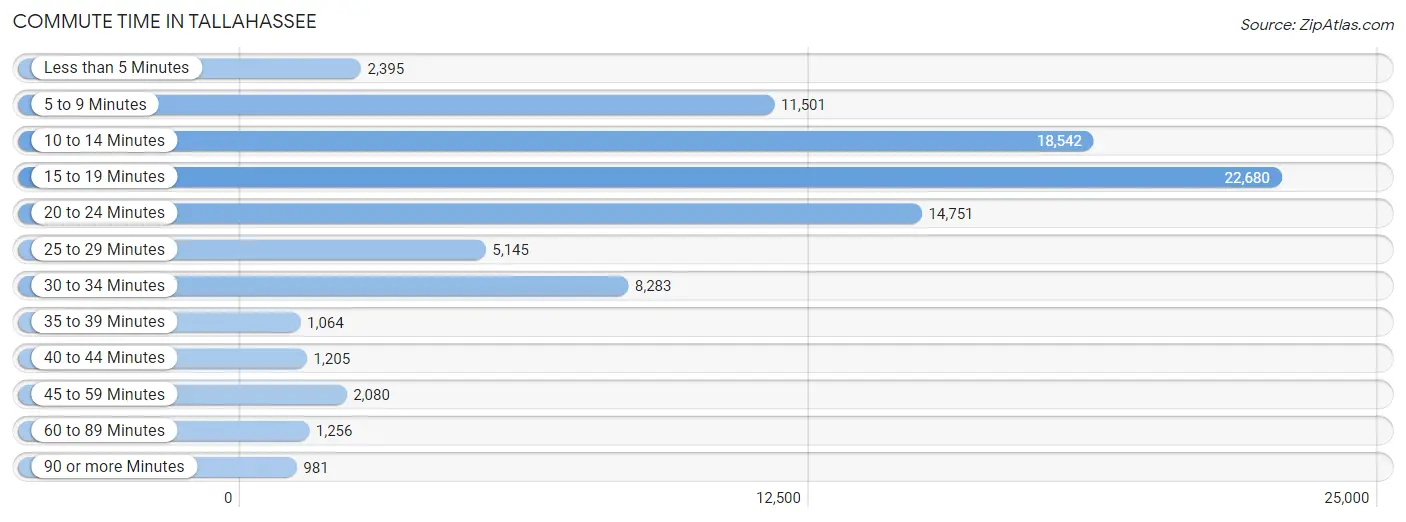
| Commute Time | # Commuters | % Commuters |
| Less than 5 Minutes | 2,395 | 2.7% |
| 5 to 9 Minutes | 11,501 | 12.8% |
| 10 to 14 Minutes | 18,542 | 20.6% |
| 15 to 19 Minutes | 22,680 | 25.2% |
| 20 to 24 Minutes | 14,751 | 16.4% |
| 25 to 29 Minutes | 5,145 | 5.7% |
| 30 to 34 Minutes | 8,283 | 9.2% |
| 35 to 39 Minutes | 1,064 | 1.2% |
| 40 to 44 Minutes | 1,205 | 1.3% |
| 45 to 59 Minutes | 2,080 | 2.3% |
| 60 to 89 Minutes | 1,256 | 1.4% |
| 90 or more Minutes | 981 | 1.1% |
Commute Time by Sex in Tallahassee
The most common commute times in Tallahassee are 15 to 19 minutes (11,086 commuters, 26.0%) for males and 15 to 19 minutes (11,594 commuters, 24.6%) for females.
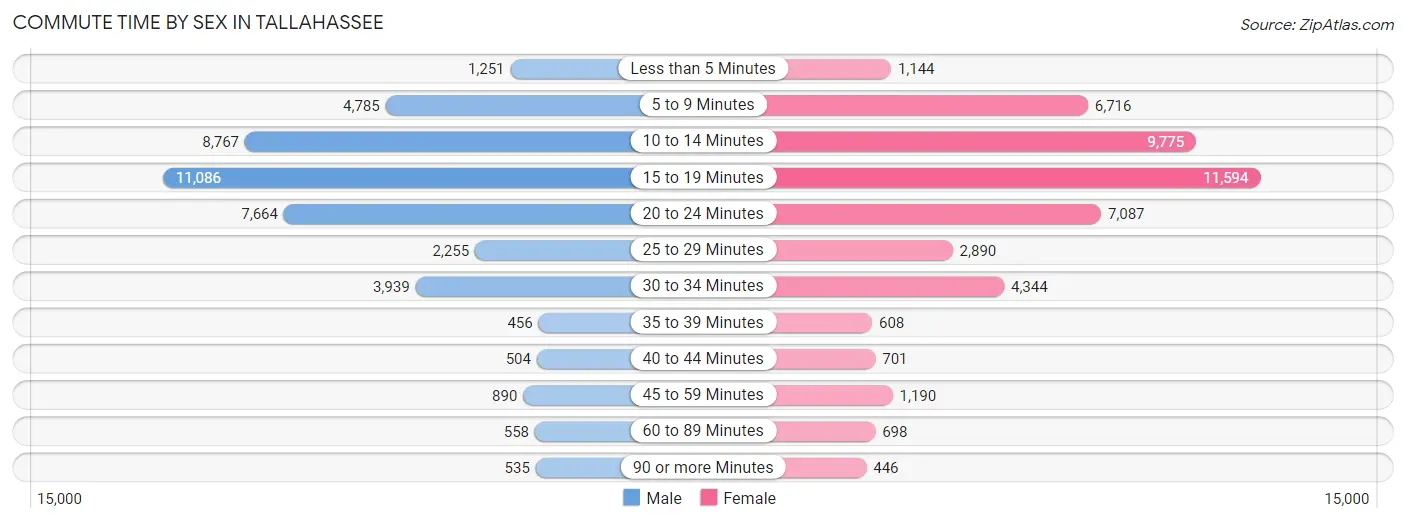
| Commute Time | Male | Female |
| Less than 5 Minutes | 1,251 (2.9%) | 1,144 (2.4%) |
| 5 to 9 Minutes | 4,785 (11.2%) | 6,716 (14.2%) |
| 10 to 14 Minutes | 8,767 (20.5%) | 9,775 (20.7%) |
| 15 to 19 Minutes | 11,086 (26.0%) | 11,594 (24.6%) |
| 20 to 24 Minutes | 7,664 (17.9%) | 7,087 (15.0%) |
| 25 to 29 Minutes | 2,255 (5.3%) | 2,890 (6.1%) |
| 30 to 34 Minutes | 3,939 (9.2%) | 4,344 (9.2%) |
| 35 to 39 Minutes | 456 (1.1%) | 608 (1.3%) |
| 40 to 44 Minutes | 504 (1.2%) | 701 (1.5%) |
| 45 to 59 Minutes | 890 (2.1%) | 1,190 (2.5%) |
| 60 to 89 Minutes | 558 (1.3%) | 698 (1.5%) |
| 90 or more Minutes | 535 (1.3%) | 446 (0.9%) |
Time of Departure to Work by Sex in Tallahassee
The most frequent times of departure to work in Tallahassee are 7:30 AM to 7:59 AM (6,200, 14.5%) for males and 7:30 AM to 7:59 AM (8,900, 18.9%) for females.
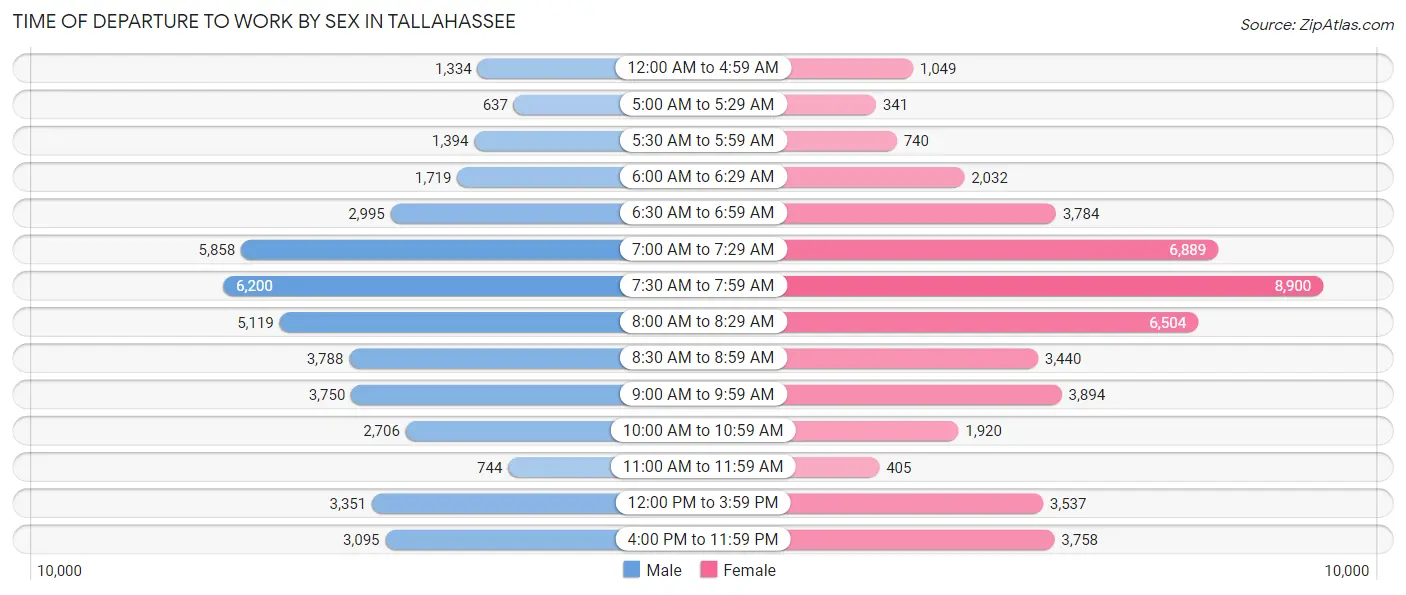
| Time of Departure | Male | Female |
| 12:00 AM to 4:59 AM | 1,334 (3.1%) | 1,049 (2.2%) |
| 5:00 AM to 5:29 AM | 637 (1.5%) | 341 (0.7%) |
| 5:30 AM to 5:59 AM | 1,394 (3.3%) | 740 (1.6%) |
| 6:00 AM to 6:29 AM | 1,719 (4.0%) | 2,032 (4.3%) |
| 6:30 AM to 6:59 AM | 2,995 (7.0%) | 3,784 (8.0%) |
| 7:00 AM to 7:29 AM | 5,858 (13.7%) | 6,889 (14.6%) |
| 7:30 AM to 7:59 AM | 6,200 (14.5%) | 8,900 (18.9%) |
| 8:00 AM to 8:29 AM | 5,119 (12.0%) | 6,504 (13.8%) |
| 8:30 AM to 8:59 AM | 3,788 (8.9%) | 3,440 (7.3%) |
| 9:00 AM to 9:59 AM | 3,750 (8.8%) | 3,894 (8.3%) |
| 10:00 AM to 10:59 AM | 2,706 (6.3%) | 1,920 (4.1%) |
| 11:00 AM to 11:59 AM | 744 (1.7%) | 405 (0.9%) |
| 12:00 PM to 3:59 PM | 3,351 (7.9%) | 3,537 (7.5%) |
| 4:00 PM to 11:59 PM | 3,095 (7.2%) | 3,758 (8.0%) |
| Total | 42,690 (100.0%) | 47,193 (100.0%) |
Housing Occupancy in Tallahassee
Occupancy by Ownership in Tallahassee
Of the total 81,846 dwellings in Tallahassee, owner-occupied units account for 32,606 (39.8%), while renter-occupied units make up 49,240 (60.2%).
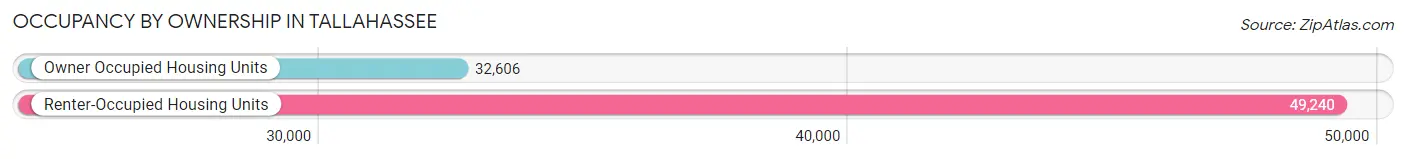
| Occupancy | # Housing Units | % Housing Units |
| Owner Occupied Housing Units | 32,606 | 39.8% |
| Renter-Occupied Housing Units | 49,240 | 60.2% |
| Total Occupied Housing Units | 81,846 | 100.0% |
Occupancy by Household Size in Tallahassee
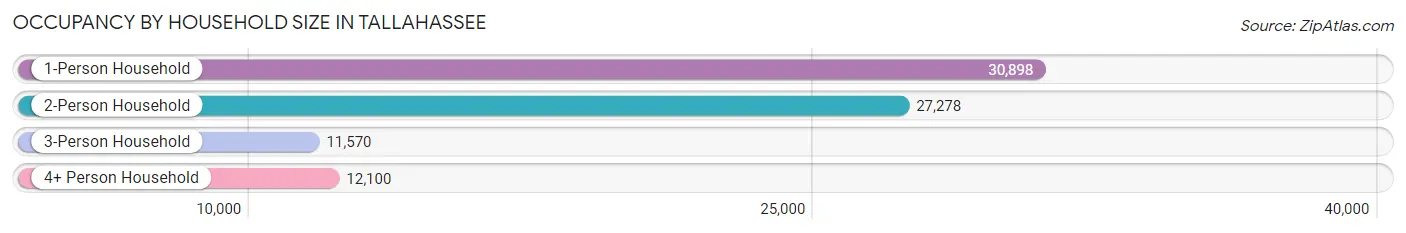
| Household Size | # Housing Units | % Housing Units |
| 1-Person Household | 30,898 | 37.8% |
| 2-Person Household | 27,278 | 33.3% |
| 3-Person Household | 11,570 | 14.1% |
| 4+ Person Household | 12,100 | 14.8% |
| Total Housing Units | 81,846 | 100.0% |
Occupancy by Ownership by Household Size in Tallahassee
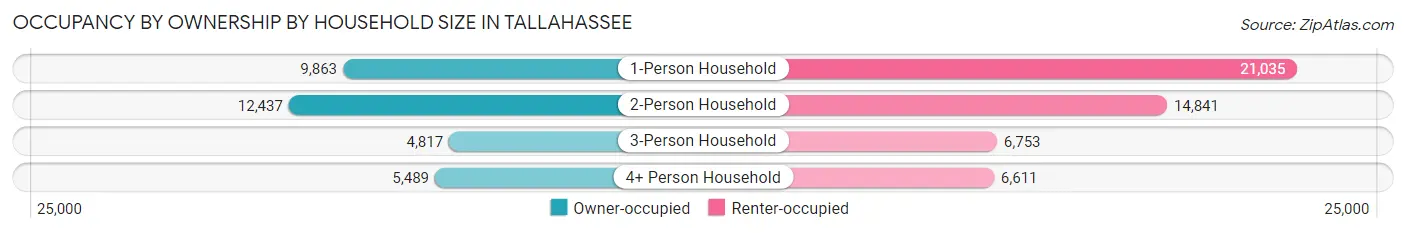
| Household Size | Owner-occupied | Renter-occupied |
| 1-Person Household | 9,863 (31.9%) | 21,035 (68.1%) |
| 2-Person Household | 12,437 (45.6%) | 14,841 (54.4%) |
| 3-Person Household | 4,817 (41.6%) | 6,753 (58.4%) |
| 4+ Person Household | 5,489 (45.4%) | 6,611 (54.6%) |
| Total Housing Units | 32,606 (39.8%) | 49,240 (60.2%) |
Occupancy by Educational Attainment in Tallahassee
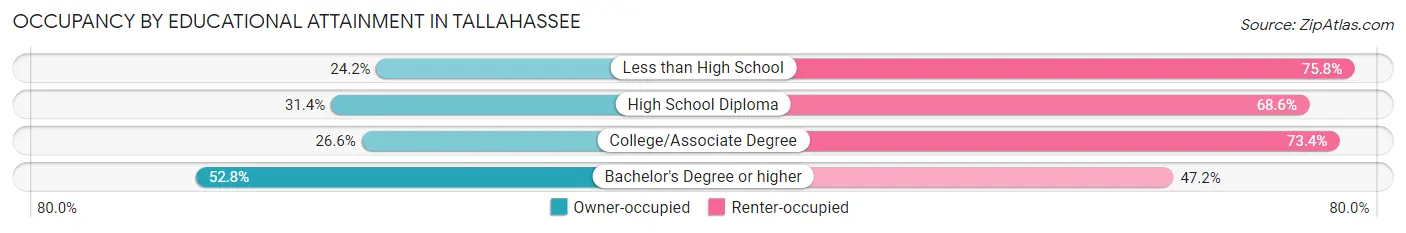
| Household Size | Owner-occupied | Renter-occupied |
| Less than High School | 1,001 (24.2%) | 3,135 (75.8%) |
| High School Diploma | 3,273 (31.4%) | 7,152 (68.6%) |
| College/Associate Degree | 7,301 (26.6%) | 20,179 (73.4%) |
| Bachelor's Degree or higher | 21,031 (52.8%) | 18,774 (47.2%) |
Occupancy by Age of Householder in Tallahassee
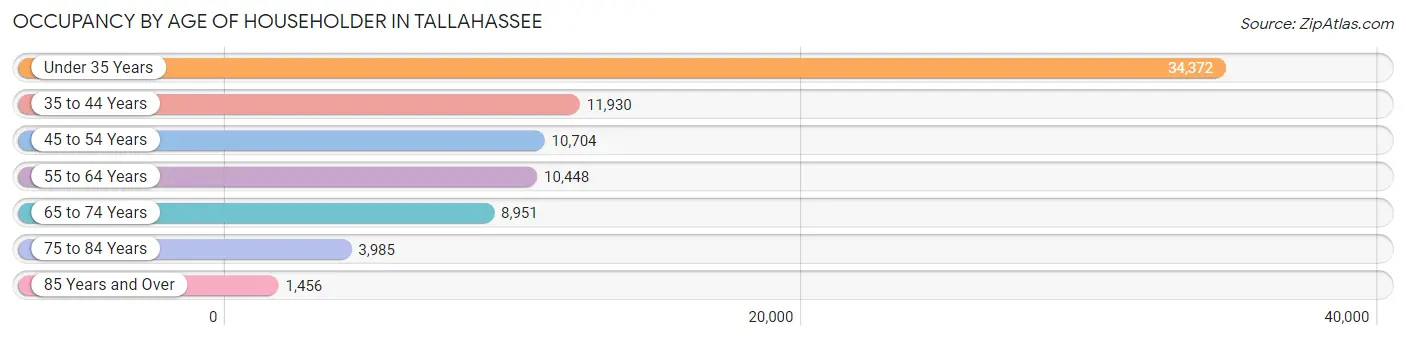
| Age Bracket | # Households | % Households |
| Under 35 Years | 34,372 | 42.0% |
| 35 to 44 Years | 11,930 | 14.6% |
| 45 to 54 Years | 10,704 | 13.1% |
| 55 to 64 Years | 10,448 | 12.8% |
| 65 to 74 Years | 8,951 | 10.9% |
| 75 to 84 Years | 3,985 | 4.9% |
| 85 Years and Over | 1,456 | 1.8% |
| Total | 81,846 | 100.0% |
Housing Finances in Tallahassee
Median Income by Occupancy in Tallahassee
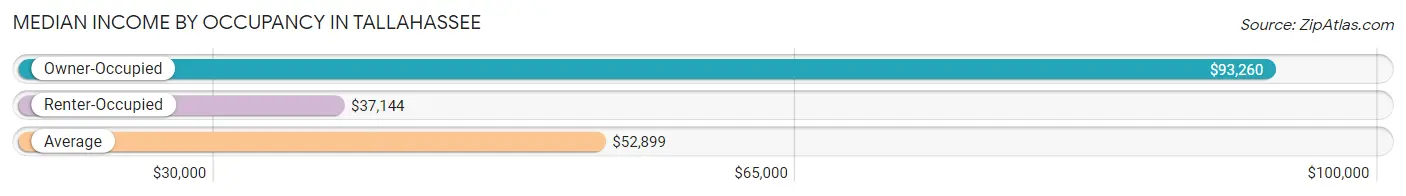
| Occupancy Type | # Households | Median Income |
| Owner-Occupied | 32,606 (39.8%) | $93,260 |
| Renter-Occupied | 49,240 (60.2%) | $37,144 |
| Average | 81,846 (100.0%) | $52,899 |
Occupancy by Householder Income Bracket in Tallahassee
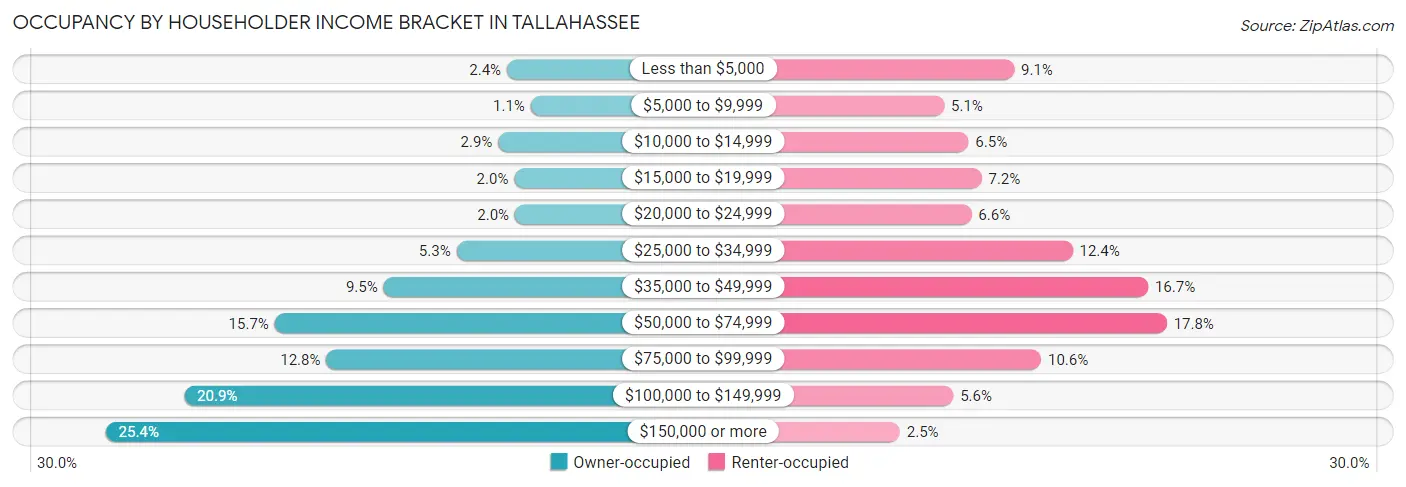
| Income Bracket | Owner-occupied | Renter-occupied |
| Less than $5,000 | 797 (2.4%) | 4,463 (9.1%) |
| $5,000 to $9,999 | 351 (1.1%) | 2,491 (5.1%) |
| $10,000 to $14,999 | 960 (2.9%) | 3,178 (6.5%) |
| $15,000 to $19,999 | 660 (2.0%) | 3,546 (7.2%) |
| $20,000 to $24,999 | 647 (2.0%) | 3,262 (6.6%) |
| $25,000 to $34,999 | 1,734 (5.3%) | 6,104 (12.4%) |
| $35,000 to $49,999 | 3,093 (9.5%) | 8,227 (16.7%) |
| $50,000 to $74,999 | 5,123 (15.7%) | 8,757 (17.8%) |
| $75,000 to $99,999 | 4,159 (12.8%) | 5,217 (10.6%) |
| $100,000 to $149,999 | 6,809 (20.9%) | 2,750 (5.6%) |
| $150,000 or more | 8,273 (25.4%) | 1,245 (2.5%) |
| Total | 32,606 (100.0%) | 49,240 (100.0%) |
Monthly Housing Cost Tiers in Tallahassee
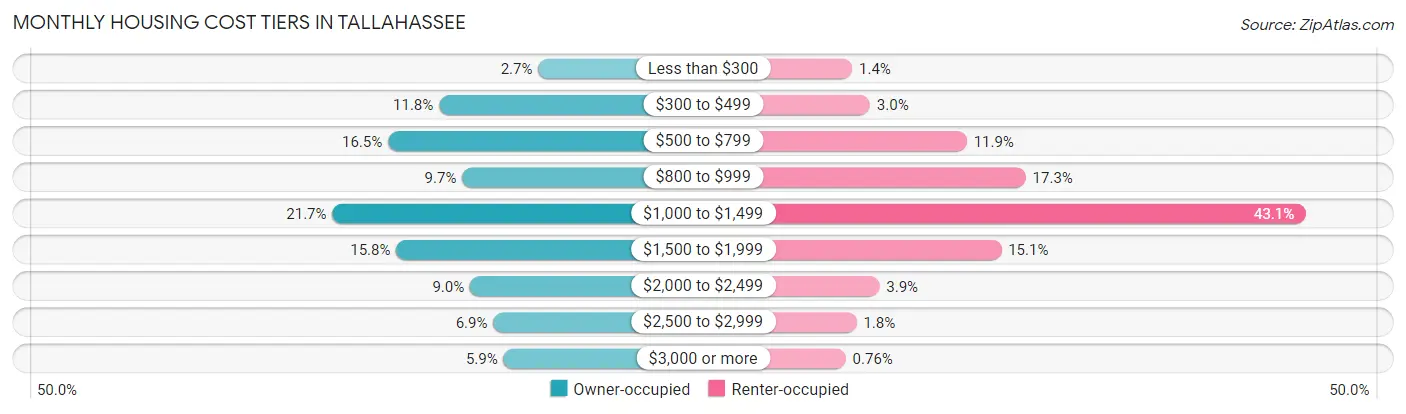
| Monthly Cost | Owner-occupied | Renter-occupied |
| Less than $300 | 885 (2.7%) | 664 (1.3%) |
| $300 to $499 | 3,860 (11.8%) | 1,471 (3.0%) |
| $500 to $799 | 5,393 (16.5%) | 5,859 (11.9%) |
| $800 to $999 | 3,165 (9.7%) | 8,534 (17.3%) |
| $1,000 to $1,499 | 7,067 (21.7%) | 21,242 (43.1%) |
| $1,500 to $1,999 | 5,146 (15.8%) | 7,424 (15.1%) |
| $2,000 to $2,499 | 2,930 (9.0%) | 1,903 (3.9%) |
| $2,500 to $2,999 | 2,234 (6.9%) | 863 (1.8%) |
| $3,000 or more | 1,926 (5.9%) | 372 (0.8%) |
| Total | 32,606 (100.0%) | 49,240 (100.0%) |
Physical Housing Characteristics in Tallahassee
Housing Structures in Tallahassee
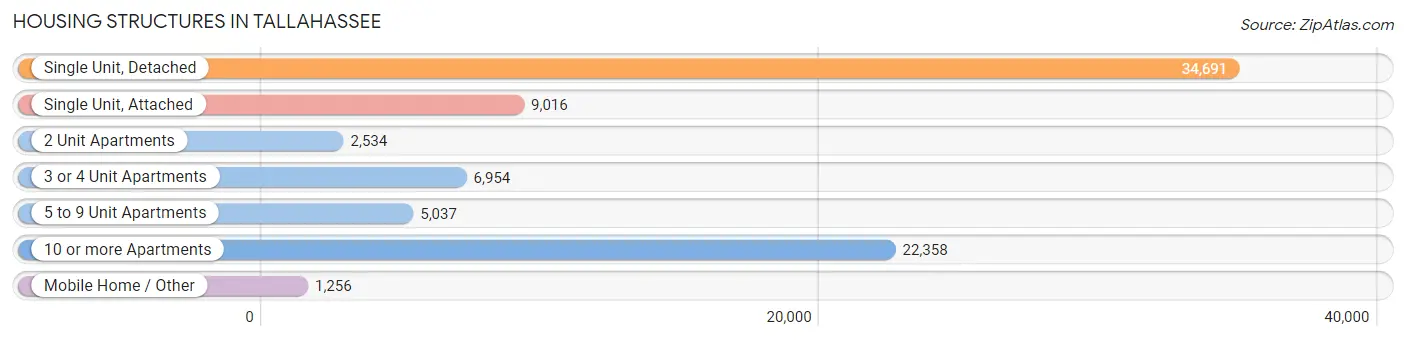
| Structure Type | # Housing Units | % Housing Units |
| Single Unit, Detached | 34,691 | 42.4% |
| Single Unit, Attached | 9,016 | 11.0% |
| 2 Unit Apartments | 2,534 | 3.1% |
| 3 or 4 Unit Apartments | 6,954 | 8.5% |
| 5 to 9 Unit Apartments | 5,037 | 6.1% |
| 10 or more Apartments | 22,358 | 27.3% |
| Mobile Home / Other | 1,256 | 1.5% |
| Total | 81,846 | 100.0% |
Housing Structures by Occupancy in Tallahassee
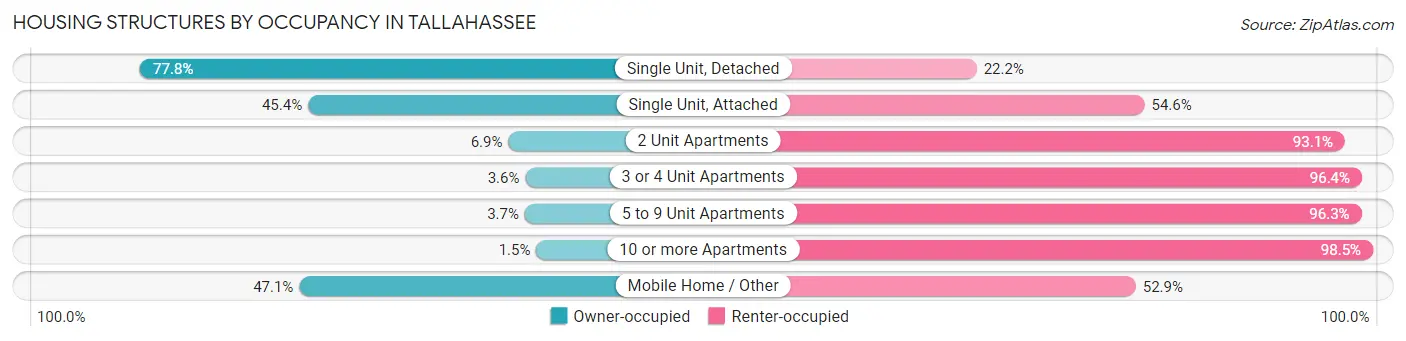
| Structure Type | Owner-occupied | Renter-occupied |
| Single Unit, Detached | 26,976 (77.8%) | 7,715 (22.2%) |
| Single Unit, Attached | 4,097 (45.4%) | 4,919 (54.6%) |
| 2 Unit Apartments | 174 (6.9%) | 2,360 (93.1%) |
| 3 or 4 Unit Apartments | 250 (3.6%) | 6,704 (96.4%) |
| 5 to 9 Unit Apartments | 186 (3.7%) | 4,851 (96.3%) |
| 10 or more Apartments | 331 (1.5%) | 22,027 (98.5%) |
| Mobile Home / Other | 592 (47.1%) | 664 (52.9%) |
| Total | 32,606 (39.8%) | 49,240 (60.2%) |
Housing Structures by Number of Rooms in Tallahassee
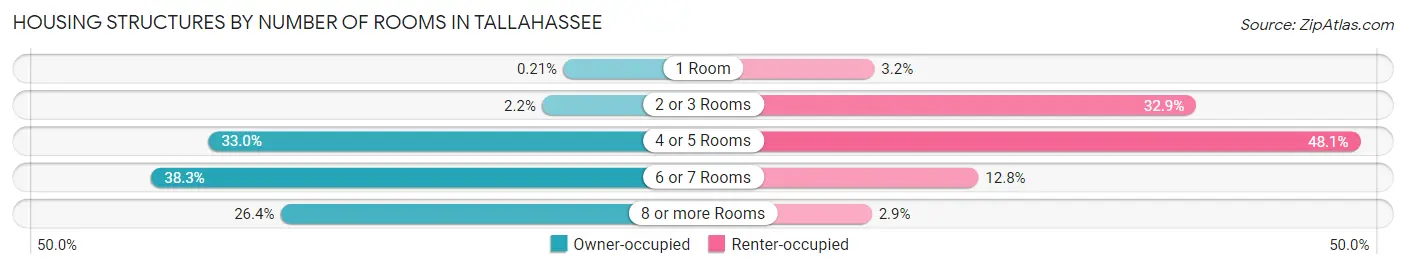
| Number of Rooms | Owner-occupied | Renter-occupied |
| 1 Room | 69 (0.2%) | 1,573 (3.2%) |
| 2 or 3 Rooms | 707 (2.2%) | 16,218 (32.9%) |
| 4 or 5 Rooms | 10,756 (33.0%) | 23,695 (48.1%) |
| 6 or 7 Rooms | 12,479 (38.3%) | 6,306 (12.8%) |
| 8 or more Rooms | 8,595 (26.4%) | 1,448 (2.9%) |
| Total | 32,606 (100.0%) | 49,240 (100.0%) |
Housing Structure by Heating Type in Tallahassee
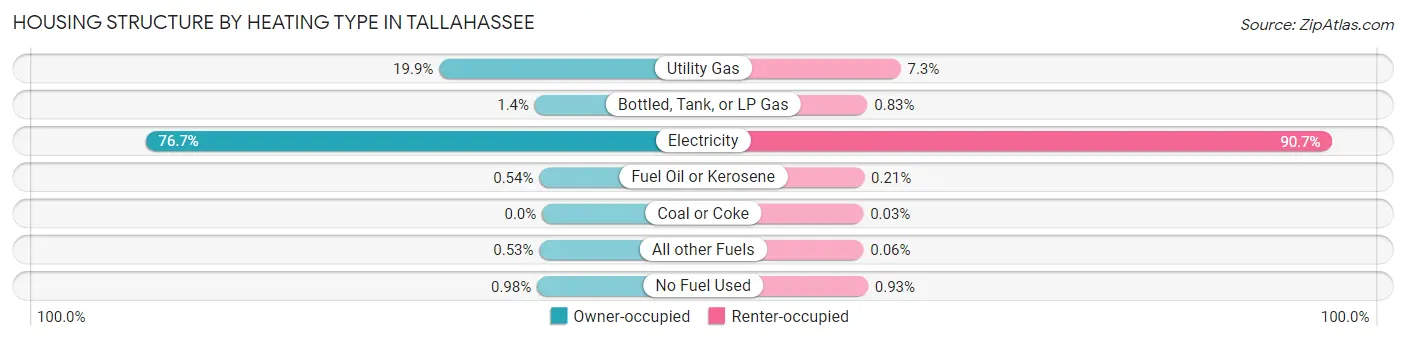
| Heating Type | Owner-occupied | Renter-occupied |
| Utility Gas | 6,486 (19.9%) | 3,569 (7.2%) |
| Bottled, Tank, or LP Gas | 458 (1.4%) | 408 (0.8%) |
| Electricity | 24,994 (76.6%) | 44,661 (90.7%) |
| Fuel Oil or Kerosene | 175 (0.5%) | 101 (0.2%) |
| Coal or Coke | 0 (0.0%) | 16 (0.0%) |
| All other Fuels | 173 (0.5%) | 28 (0.1%) |
| No Fuel Used | 320 (1.0%) | 457 (0.9%) |
| Total | 32,606 (100.0%) | 49,240 (100.0%) |
Household Vehicle Usage in Tallahassee

| Vehicles per Household | Owner-occupied | Renter-occupied |
| No Vehicle | 691 (2.1%) | 6,122 (12.4%) |
| 1 Vehicle | 11,210 (34.4%) | 24,518 (49.8%) |
| 2 Vehicles | 14,867 (45.6%) | 13,779 (28.0%) |
| 3 or more Vehicles | 5,838 (17.9%) | 4,821 (9.8%) |
| Total | 32,606 (100.0%) | 49,240 (100.0%) |
Real Estate & Mortgages in Tallahassee
Real Estate and Mortgage Overview in Tallahassee
| Characteristic | Without Mortgage | With Mortgage |
| Housing Units | 11,619 | 20,987 |
| Median Property Value | $247,800 | $260,300 |
| Median Household Income | $77,600 | $5,857 |
| Monthly Housing Costs | $564 | $1,884 |
| Real Estate Taxes | $2,135 | $547 |
Property Value by Mortgage Status in Tallahassee
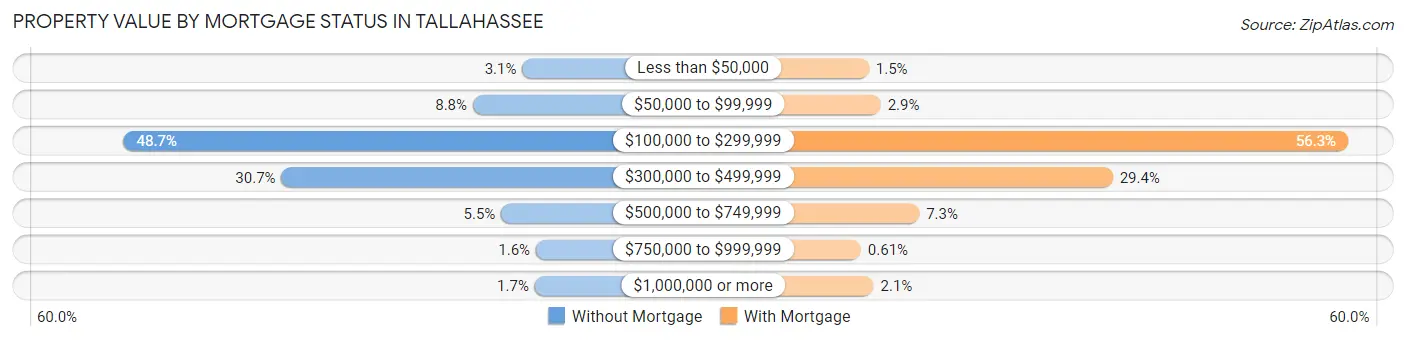
| Property Value | Without Mortgage | With Mortgage |
| Less than $50,000 | 362 (3.1%) | 318 (1.5%) |
| $50,000 to $99,999 | 1,019 (8.8%) | 605 (2.9%) |
| $100,000 to $299,999 | 5,656 (48.7%) | 11,809 (56.3%) |
| $300,000 to $499,999 | 3,561 (30.6%) | 6,168 (29.4%) |
| $500,000 to $749,999 | 643 (5.5%) | 1,527 (7.3%) |
| $750,000 to $999,999 | 181 (1.6%) | 128 (0.6%) |
| $1,000,000 or more | 197 (1.7%) | 432 (2.1%) |
| Total | 11,619 (100.0%) | 20,987 (100.0%) |
Household Income by Mortgage Status in Tallahassee
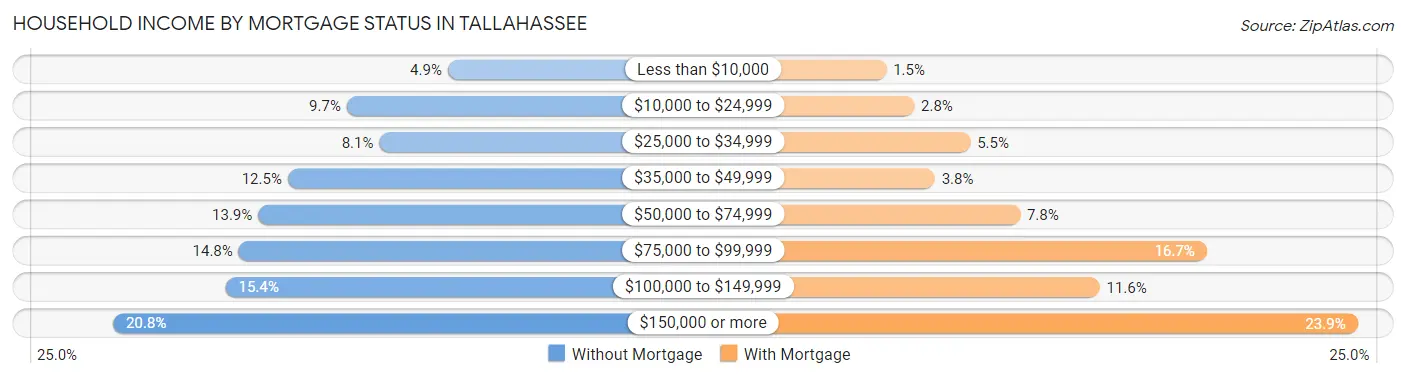
| Household Income | Without Mortgage | With Mortgage |
| Less than $10,000 | 563 (4.9%) | 307 (1.5%) |
| $10,000 to $24,999 | 1,122 (9.7%) | 585 (2.8%) |
| $25,000 to $34,999 | 942 (8.1%) | 1,145 (5.5%) |
| $35,000 to $49,999 | 1,449 (12.5%) | 792 (3.8%) |
| $50,000 to $74,999 | 1,613 (13.9%) | 1,644 (7.8%) |
| $75,000 to $99,999 | 1,721 (14.8%) | 3,510 (16.7%) |
| $100,000 to $149,999 | 1,793 (15.4%) | 2,438 (11.6%) |
| $150,000 or more | 2,416 (20.8%) | 5,016 (23.9%) |
| Total | 11,619 (100.0%) | 20,987 (100.0%) |
Property Value to Household Income Ratio in Tallahassee
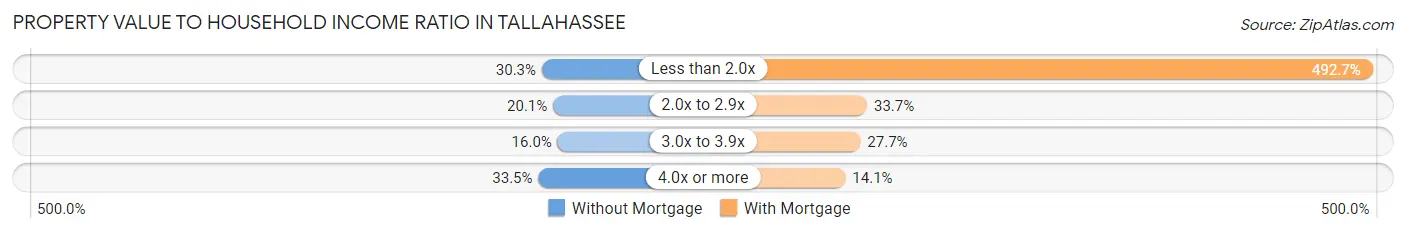
| Value-to-Income Ratio | Without Mortgage | With Mortgage |
| Less than 2.0x | 3,521 (30.3%) | 103,410 (492.7%) |
| 2.0x to 2.9x | 2,331 (20.1%) | 7,076 (33.7%) |
| 3.0x to 3.9x | 1,856 (16.0%) | 5,810 (27.7%) |
| 4.0x or more | 3,887 (33.5%) | 2,954 (14.1%) |
| Total | 11,619 (100.0%) | 20,987 (100.0%) |
Real Estate Taxes by Mortgage Status in Tallahassee
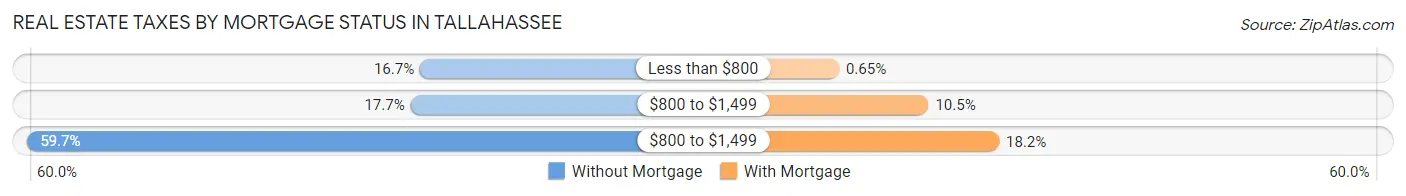
| Property Taxes | Without Mortgage | With Mortgage |
| Less than $800 | 1,937 (16.7%) | 137 (0.6%) |
| $800 to $1,499 | 2,058 (17.7%) | 2,195 (10.5%) |
| $800 to $1,499 | 6,938 (59.7%) | 3,819 (18.2%) |
| Total | 11,619 (100.0%) | 20,987 (100.0%) |
Health & Disability in Tallahassee
Health Insurance Coverage by Age in Tallahassee
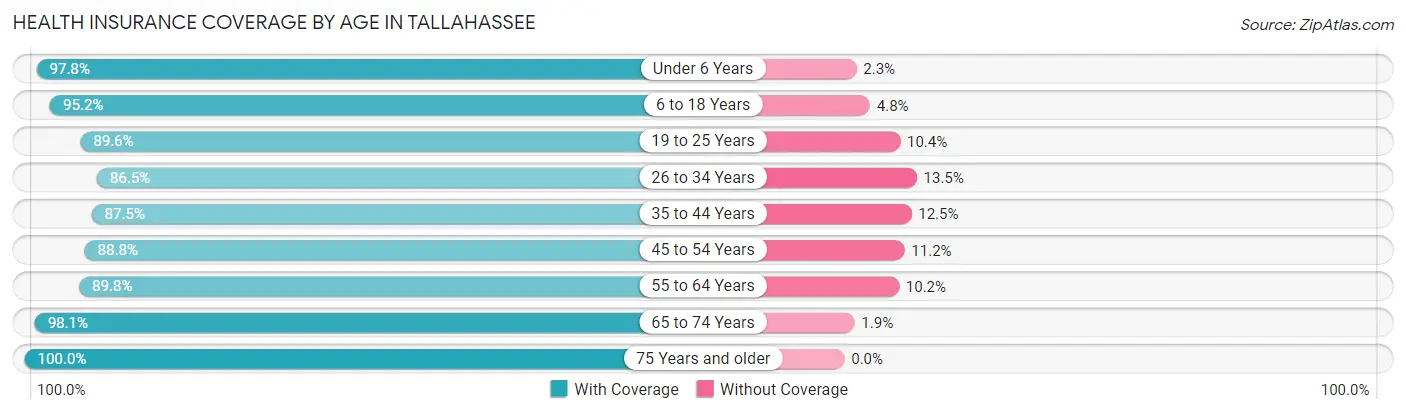
| Age Bracket | With Coverage | Without Coverage |
| Under 6 Years | 10,604 (97.8%) | 244 (2.2%) |
| 6 to 18 Years | 28,632 (95.2%) | 1,434 (4.8%) |
| 19 to 25 Years | 47,064 (89.6%) | 5,461 (10.4%) |
| 26 to 34 Years | 22,663 (86.5%) | 3,533 (13.5%) |
| 35 to 44 Years | 18,283 (87.5%) | 2,610 (12.5%) |
| 45 to 54 Years | 15,297 (88.8%) | 1,932 (11.2%) |
| 55 to 64 Years | 14,397 (89.8%) | 1,630 (10.2%) |
| 65 to 74 Years | 13,009 (98.1%) | 250 (1.9%) |
| 75 Years and older | 8,061 (100.0%) | 0 (0.0%) |
| Total | 178,010 (91.2%) | 17,094 (8.8%) |
Health Insurance Coverage by Citizenship Status in Tallahassee
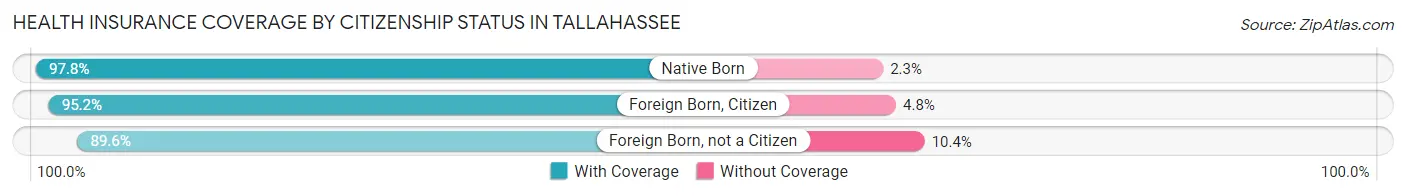
| Citizenship Status | With Coverage | Without Coverage |
| Native Born | 10,604 (97.8%) | 244 (2.2%) |
| Foreign Born, Citizen | 28,632 (95.2%) | 1,434 (4.8%) |
| Foreign Born, not a Citizen | 47,064 (89.6%) | 5,461 (10.4%) |
Health Insurance Coverage by Household Income in Tallahassee
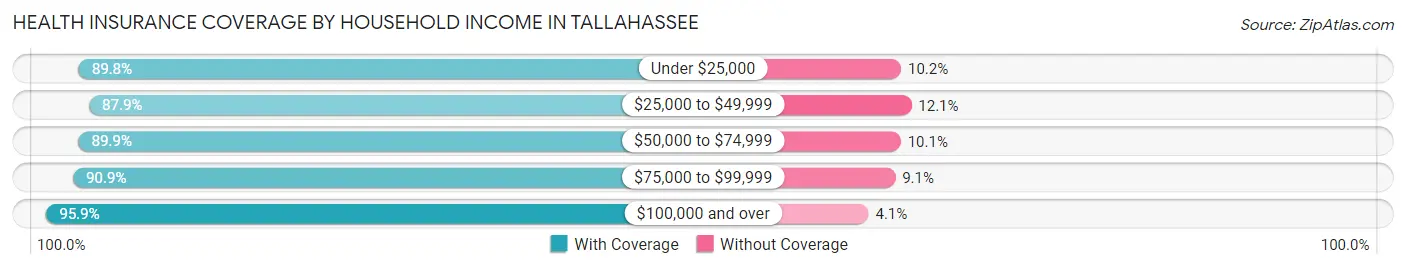
| Household Income | With Coverage | Without Coverage |
| Under $25,000 | 31,750 (89.8%) | 3,590 (10.2%) |
| $25,000 to $49,999 | 33,353 (87.9%) | 4,590 (12.1%) |
| $50,000 to $74,999 | 27,916 (89.9%) | 3,141 (10.1%) |
| $75,000 to $99,999 | 20,977 (90.9%) | 2,092 (9.1%) |
| $100,000 and over | 51,178 (95.9%) | 2,170 (4.1%) |
Public vs Private Health Insurance Coverage by Age in Tallahassee
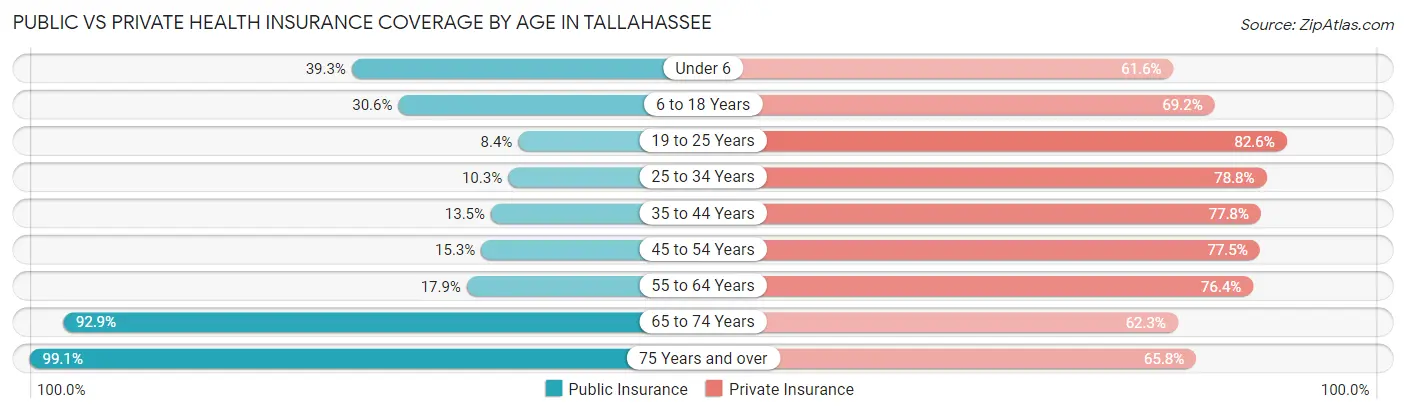
| Age Bracket | Public Insurance | Private Insurance |
| Under 6 | 4,262 (39.3%) | 6,677 (61.6%) |
| 6 to 18 Years | 9,213 (30.6%) | 20,797 (69.2%) |
| 19 to 25 Years | 4,408 (8.4%) | 43,361 (82.6%) |
| 25 to 34 Years | 2,692 (10.3%) | 20,643 (78.8%) |
| 35 to 44 Years | 2,811 (13.5%) | 16,250 (77.8%) |
| 45 to 54 Years | 2,630 (15.3%) | 13,358 (77.5%) |
| 55 to 64 Years | 2,876 (17.9%) | 12,236 (76.3%) |
| 65 to 74 Years | 12,316 (92.9%) | 8,265 (62.3%) |
| 75 Years and over | 7,986 (99.1%) | 5,301 (65.8%) |
| Total | 49,194 (25.2%) | 146,888 (75.3%) |
Disability Status by Sex by Age in Tallahassee
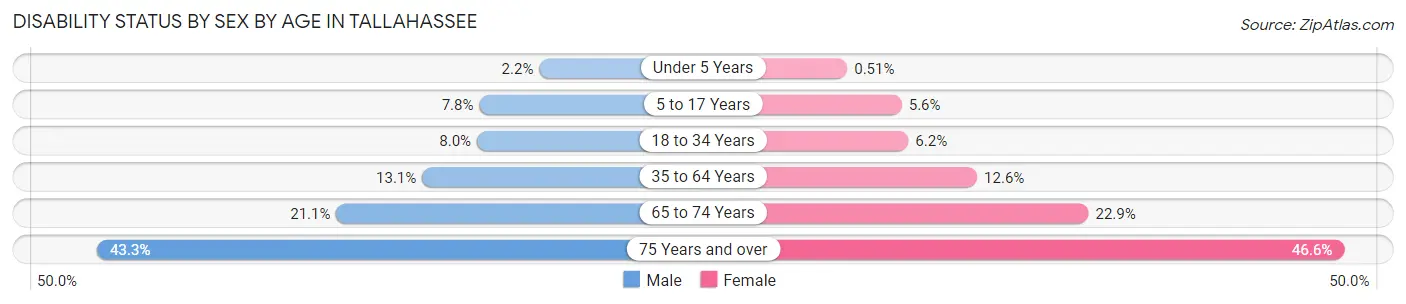
| Age Bracket | Male | Female |
| Under 5 Years | 111 (2.2%) | 22 (0.5%) |
| 5 to 17 Years | 980 (7.8%) | 624 (5.6%) |
| 18 to 34 Years | 3,172 (8.0%) | 2,908 (6.2%) |
| 35 to 64 Years | 3,371 (13.1%) | 3,574 (12.6%) |
| 65 to 74 Years | 1,257 (21.1%) | 1,670 (22.9%) |
| 75 Years and over | 1,374 (43.3%) | 2,278 (46.6%) |
Disability Class by Sex by Age in Tallahassee
Disability Class: Hearing Difficulty
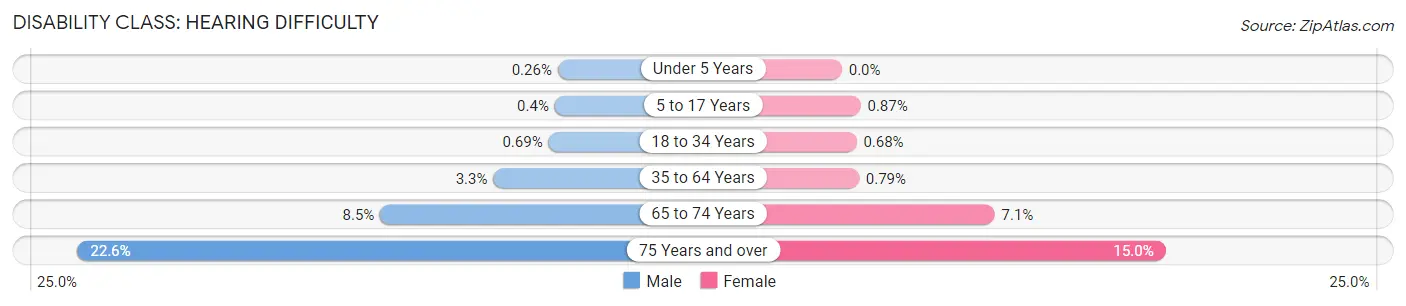
| Age Bracket | Male | Female |
| Under 5 Years | 13 (0.3%) | 0 (0.0%) |
| 5 to 17 Years | 50 (0.4%) | 97 (0.9%) |
| 18 to 34 Years | 271 (0.7%) | 320 (0.7%) |
| 35 to 64 Years | 835 (3.3%) | 226 (0.8%) |
| 65 to 74 Years | 507 (8.5%) | 517 (7.1%) |
| 75 Years and over | 716 (22.6%) | 734 (15.0%) |
Disability Class: Vision Difficulty
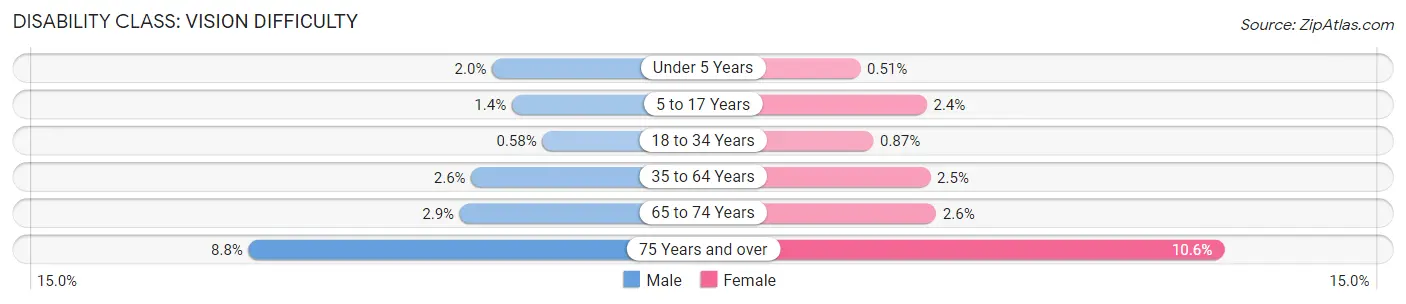
| Age Bracket | Male | Female |
| Under 5 Years | 98 (2.0%) | 22 (0.5%) |
| 5 to 17 Years | 180 (1.4%) | 265 (2.4%) |
| 18 to 34 Years | 231 (0.6%) | 408 (0.9%) |
| 35 to 64 Years | 657 (2.6%) | 699 (2.5%) |
| 65 to 74 Years | 172 (2.9%) | 191 (2.6%) |
| 75 Years and over | 278 (8.8%) | 520 (10.6%) |
Disability Class: Cognitive Difficulty
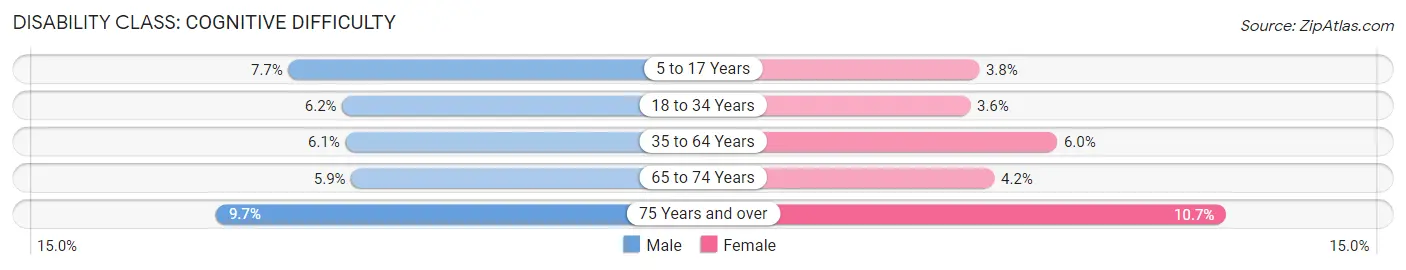
| Age Bracket | Male | Female |
| 5 to 17 Years | 962 (7.6%) | 428 (3.8%) |
| 18 to 34 Years | 2,432 (6.1%) | 1,679 (3.6%) |
| 35 to 64 Years | 1,557 (6.1%) | 1,703 (6.0%) |
| 65 to 74 Years | 352 (5.9%) | 309 (4.2%) |
| 75 Years and over | 307 (9.7%) | 523 (10.7%) |
Disability Class: Ambulatory Difficulty
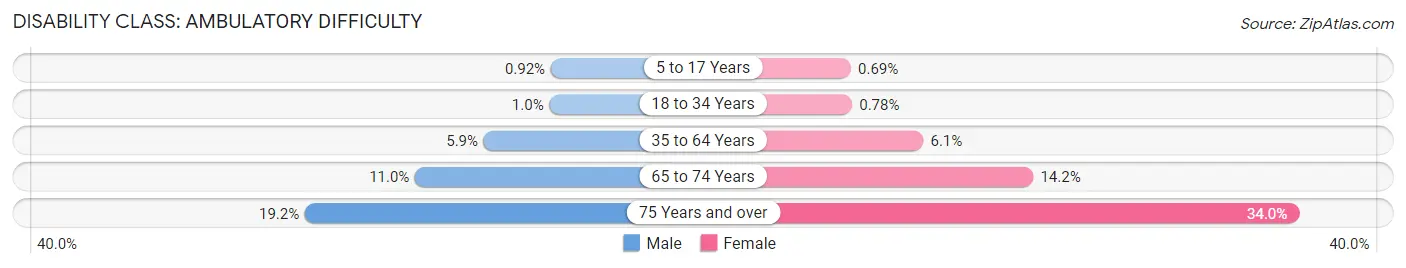
| Age Bracket | Male | Female |
| 5 to 17 Years | 115 (0.9%) | 77 (0.7%) |
| 18 to 34 Years | 408 (1.0%) | 365 (0.8%) |
| 35 to 64 Years | 1,516 (5.9%) | 1,727 (6.1%) |
| 65 to 74 Years | 656 (11.0%) | 1,038 (14.2%) |
| 75 Years and over | 609 (19.2%) | 1,659 (34.0%) |
Disability Class: Self-Care Difficulty
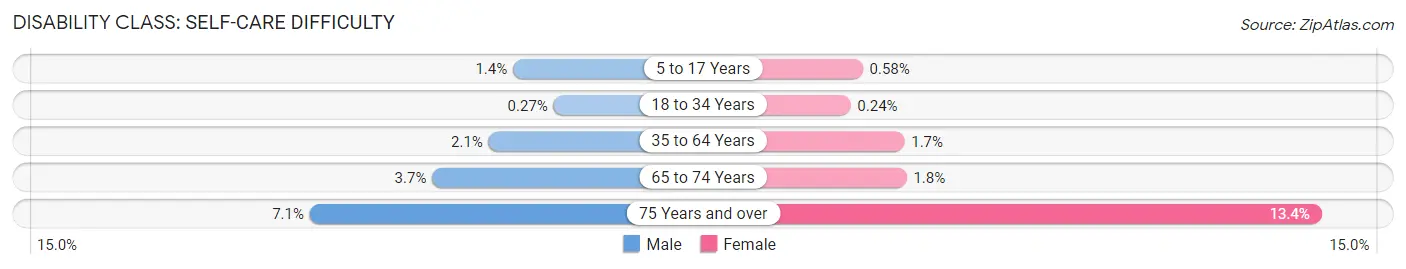
| Age Bracket | Male | Female |
| 5 to 17 Years | 176 (1.4%) | 65 (0.6%) |
| 18 to 34 Years | 106 (0.3%) | 111 (0.2%) |
| 35 to 64 Years | 535 (2.1%) | 494 (1.7%) |
| 65 to 74 Years | 218 (3.6%) | 131 (1.8%) |
| 75 Years and over | 224 (7.1%) | 653 (13.4%) |
Technology Access in Tallahassee
Computing Device Access in Tallahassee
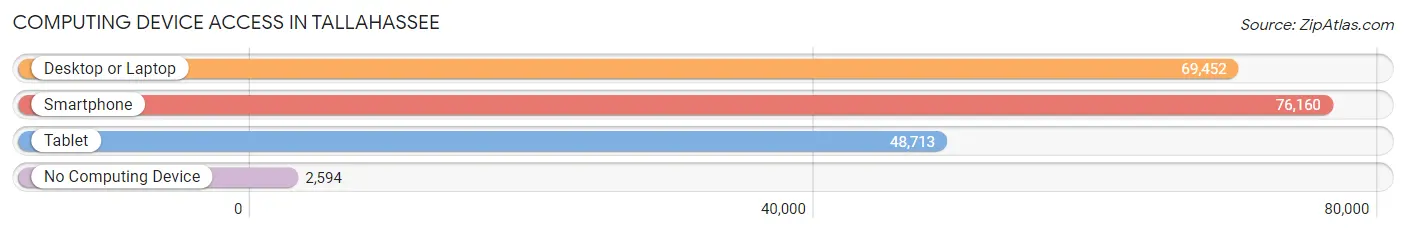
| Device Type | # Households | % Households |
| Desktop or Laptop | 69,452 | 84.9% |
| Smartphone | 76,160 | 93.0% |
| Tablet | 48,713 | 59.5% |
| No Computing Device | 2,594 | 3.2% |
| Total | 81,846 | 100.0% |
Internet Access in Tallahassee
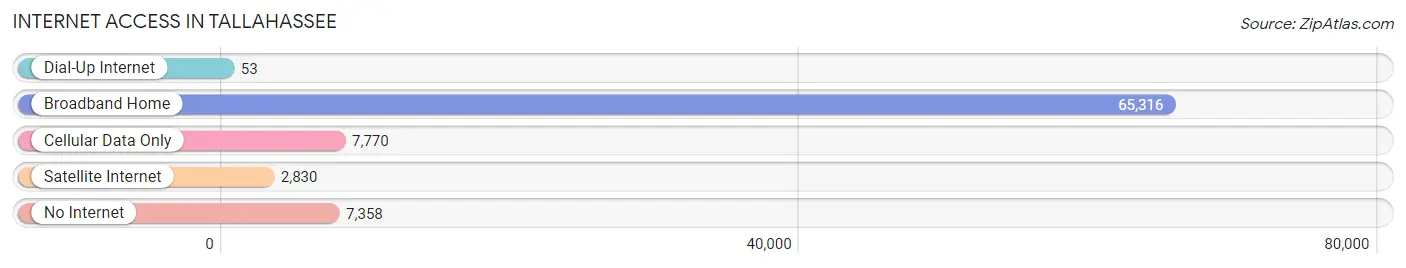
| Internet Type | # Households | % Households |
| Dial-Up Internet | 53 | 0.1% |
| Broadband Home | 65,316 | 79.8% |
| Cellular Data Only | 7,770 | 9.5% |
| Satellite Internet | 2,830 | 3.5% |
| No Internet | 7,358 | 9.0% |
| Total | 81,846 | 100.0% |
Tallahassee Summary
Tallahassee is the capital of the state of Florida and the county seat of Leon County. It is located in the Florida Panhandle, along the Apalachicola River, and is the largest city in the region. The city is home to Florida State University, Florida A&M University, and Tallahassee Community College. It is also the center of government and business for the region.
History
Tallahassee was founded in 1824 as the capital of the Florida Territory. The city was named after the Apalachee Indian word for “old fields” or “old town.” The city was originally a trading post and was the site of several battles during the Second Seminole War.
In 1845, Florida became the 27th state in the Union and Tallahassee was named the state capital. The city grew rapidly in the late 19th century and early 20th century, becoming a center of government and business.
Geography
Tallahassee is located in the Florida Panhandle, along the Apalachicola River. The city is situated on a high bluff overlooking the river and is surrounded by rolling hills and forests. The city covers an area of about 60 square miles and has a population of over 190,000.
The climate in Tallahassee is subtropical, with hot, humid summers and mild winters. The average temperature in the summer is around 90°F and in the winter it is around 50°F.
Economy
Tallahassee is the center of government and business for the region. The city is home to several state government offices, including the Florida State Capitol, the Florida Supreme Court, and the Florida Department of Education.
The city is also home to several major corporations, including Florida Power & Light, Capital Health Plan, and the St. Joe Company. The city is also home to several universities and colleges, including Florida State University, Florida A&M University, and Tallahassee Community College.
Demographics
As of the 2010 census, the population of Tallahassee was 181,376. The racial makeup of the city was 54.3% White, 34.2% African American, 5.2% Hispanic or Latino, 2.7% Asian, and 0.7% Native American.
The median household income in Tallahassee was $41,845 in 2010. The median age of the city was 28.7 years. The city has a higher percentage of college-educated residents than the national average.
Tallahassee is a diverse city with a vibrant culture. The city is home to several museums, galleries, and performing arts venues. The city also hosts several festivals and events throughout the year, including the Tallahassee Film Festival and the Tallahassee Jazz & Blues Festival.
Common Questions
What is Per Capita Income in Tallahassee?
Per Capita income in Tallahassee is $33,803.
What is the Median Family Income in Tallahassee?
Median Family Income in Tallahassee is $80,462.
What is the Median Household income in Tallahassee?
Median Household Income in Tallahassee is $52,899.
What is Income or Wage Gap in Tallahassee?
Income or Wage Gap in Tallahassee is 15.1%.
Women in Tallahassee earn 84.9 cents for every dollar earned by a man.
What is Family Income Deficit in Tallahassee?
Family Income Deficit in Tallahassee is $10,703.
Families that are below poverty line in Tallahassee earn $10,703 less on average than the poverty threshold level.
What is Inequality or Gini Index in Tallahassee?
Inequality or Gini Index in Tallahassee is 0.52.
What is the Total Population of Tallahassee?
Total Population of Tallahassee is 198,259.
What is the Total Male Population of Tallahassee?
Total Male Population of Tallahassee is 93,308.
What is the Total Female Population of Tallahassee?
Total Female Population of Tallahassee is 104,951.
What is the Ratio of Males per 100 Females in Tallahassee?
There are 88.91 Males per 100 Females in Tallahassee.
What is the Ratio of Females per 100 Males in Tallahassee?
There are 112.48 Females per 100 Males in Tallahassee.
What is the Median Population Age in Tallahassee?
Median Population Age in Tallahassee is 27.6 Years.
What is the Average Family Size in Tallahassee
Average Family Size in Tallahassee is 3.0 People.
What is the Average Household Size in Tallahassee
Average Household Size in Tallahassee is 2.2 People.
How Large is the Labor Force in Tallahassee?
There are 111,121 People in the Labor Forcein in Tallahassee.
What is the Percentage of People in the Labor Force in Tallahassee?
65.9% of People are in the Labor Force in Tallahassee.
What is the Unemployment Rate in Tallahassee?
Unemployment Rate in Tallahassee is 6.5%.