Huntsville, AL Map & Demographics
Huntsville Map
Huntsville Overview
$43,202
PER CAPITA INCOME
$90,775
AVG FAMILY INCOME
$67,874
AVG HOUSEHOLD INCOME
41.6%
WAGE / INCOME GAP [ % ]
58.4¢/ $1
WAGE / INCOME GAP [ $ ]
$10,345
FAMILY INCOME DEFICIT
0.49
INEQUALITY / GINI INDEX
215,025
TOTAL POPULATION
105,273
MALE POPULATION
109,752
FEMALE POPULATION
95.92
MALES / 100 FEMALES
104.25
FEMALES / 100 MALES
36.5
MEDIAN AGE
2.9
AVG FAMILY SIZE
2.2
AVG HOUSEHOLD SIZE
112,525
LABOR FORCE [ PEOPLE ]
63.4%
PERCENT IN LABOR FORCE
4.6%
UNEMPLOYMENT RATE
Huntsville Area Codes
Income in Huntsville
Income Overview in Huntsville
Per Capita Income in Huntsville is $43,202, while median incomes of families and households are $90,775 and $67,874 respectively.
| Characteristic | Number | Measure |
| Per Capita Income | 215,025 | $43,202 |
| Median Family Income | 52,445 | $90,775 |
| Mean Family Income | 52,445 | $125,782 |
| Median Household Income | 92,291 | $67,874 |
| Mean Household Income | 92,291 | $98,437 |
| Income Deficit | 52,445 | $10,345 |
| Wage / Income Gap (%) | 215,025 | 41.61% |
| Wage / Income Gap ($) | 215,025 | 58.39¢ per $1 |
| Gini / Inequality Index | 215,025 | 0.49 |
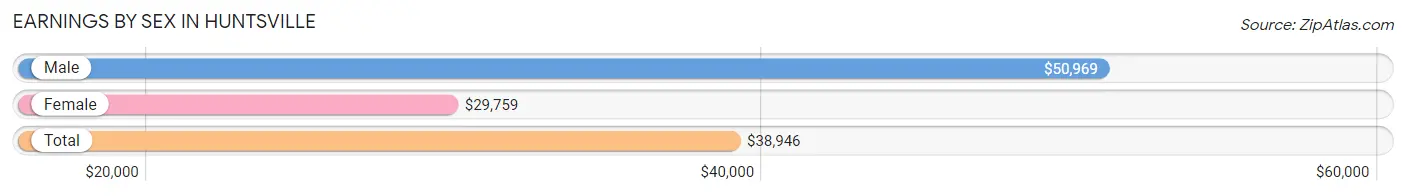
Earnings by Sex in Huntsville
Average Earnings in Huntsville are $38,946, $50,969 for men and $29,759 for women, a difference of 41.6%.
| Sex | Number | Average Earnings |
| Male | 63,149 (53.2%) | $50,969 |
| Female | 55,538 (46.8%) | $29,759 |
| Total | 118,687 (100.0%) | $38,946 |
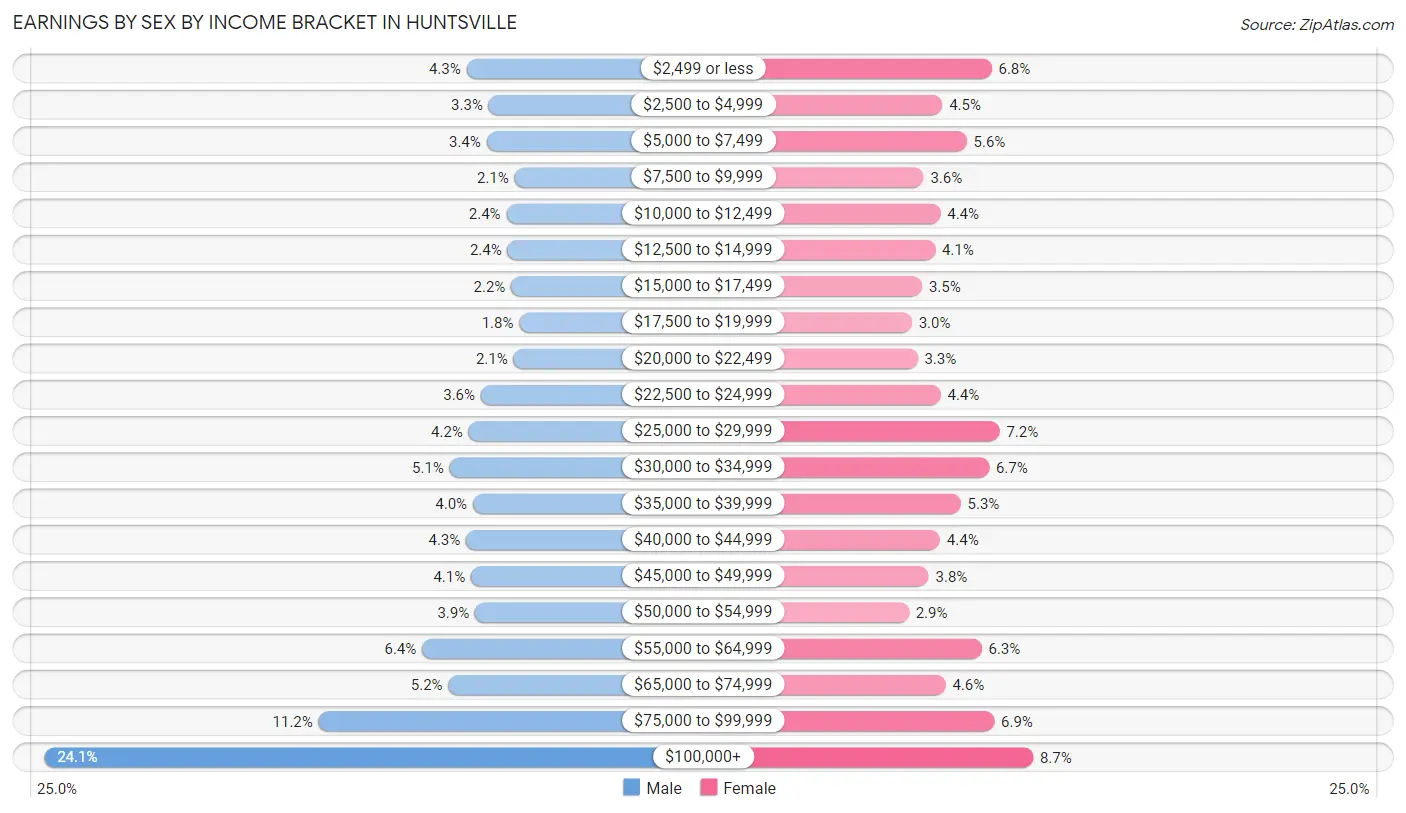
Earnings by Sex by Income Bracket in Huntsville
The most common earnings brackets in Huntsville are $100,000+ for men (15,208 | 24.1%) and $100,000+ for women (4,841 | 8.7%).
| Income | Male | Female |
| $2,499 or less | 2,714 (4.3%) | 3,768 (6.8%) |
| $2,500 to $4,999 | 2,060 (3.3%) | 2,485 (4.5%) |
| $5,000 to $7,499 | 2,124 (3.4%) | 3,113 (5.6%) |
| $7,500 to $9,999 | 1,294 (2.1%) | 1,993 (3.6%) |
| $10,000 to $12,499 | 1,534 (2.4%) | 2,432 (4.4%) |
| $12,500 to $14,999 | 1,503 (2.4%) | 2,296 (4.1%) |
| $15,000 to $17,499 | 1,393 (2.2%) | 1,957 (3.5%) |
| $17,500 to $19,999 | 1,158 (1.8%) | 1,686 (3.0%) |
| $20,000 to $22,499 | 1,327 (2.1%) | 1,841 (3.3%) |
| $22,500 to $24,999 | 2,294 (3.6%) | 2,438 (4.4%) |
| $25,000 to $29,999 | 2,651 (4.2%) | 3,971 (7.1%) |
| $30,000 to $34,999 | 3,217 (5.1%) | 3,698 (6.7%) |
| $35,000 to $39,999 | 2,527 (4.0%) | 2,958 (5.3%) |
| $40,000 to $44,999 | 2,726 (4.3%) | 2,424 (4.4%) |
| $45,000 to $49,999 | 2,585 (4.1%) | 2,127 (3.8%) |
| $50,000 to $54,999 | 2,465 (3.9%) | 1,608 (2.9%) |
| $55,000 to $64,999 | 4,027 (6.4%) | 3,504 (6.3%) |
| $65,000 to $74,999 | 3,253 (5.1%) | 2,567 (4.6%) |
| $75,000 to $99,999 | 7,089 (11.2%) | 3,831 (6.9%) |
| $100,000+ | 15,208 (24.1%) | 4,841 (8.7%) |
| Total | 63,149 (100.0%) | 55,538 (100.0%) |
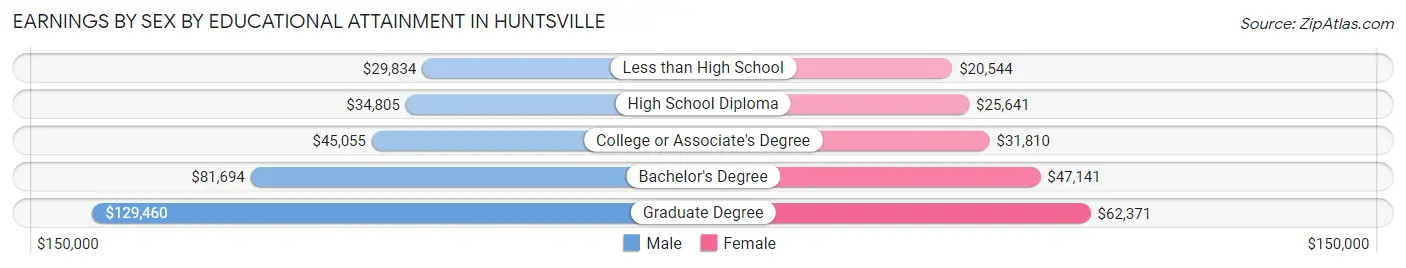
Earnings by Sex by Educational Attainment in Huntsville
Average earnings in Huntsville are $59,607 for men and $36,540 for women, a difference of 38.7%. Men with an educational attainment of graduate degree enjoy the highest average annual earnings of $129,460, while those with less than high school education earn the least with $29,834. Women with an educational attainment of graduate degree earn the most with the average annual earnings of $62,371, while those with less than high school education have the smallest earnings of $20,544.
| Educational Attainment | Male Income | Female Income |
| Less than High School | $29,834 | $20,544 |
| High School Diploma | $34,805 | $25,641 |
| College or Associate's Degree | $45,055 | $31,810 |
| Bachelor's Degree | $81,694 | $47,141 |
| Graduate Degree | $129,460 | $62,371 |
| Total | $59,607 | $36,540 |
Family Income in Huntsville
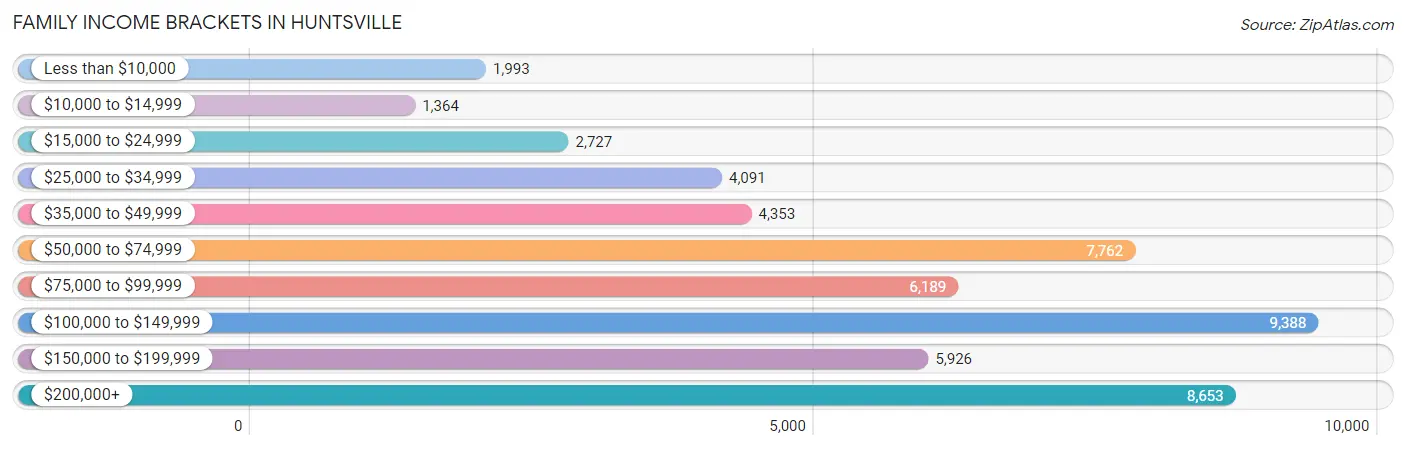
Family Income Brackets in Huntsville
According to the Huntsville family income data, there are 9,388 families falling into the $100,000 to $149,999 income range, which is the most common income bracket and makes up 17.9% of all families. Conversely, the $10,000 to $14,999 income bracket is the least frequent group with only 1,364 families (2.6%) belonging to this category.
| Income Bracket | # Families | % Families |
| Less than $10,000 | 1,993 | 3.8% |
| $10,000 to $14,999 | 1,364 | 2.6% |
| $15,000 to $24,999 | 2,727 | 5.2% |
| $25,000 to $34,999 | 4,091 | 7.8% |
| $35,000 to $49,999 | 4,353 | 8.3% |
| $50,000 to $74,999 | 7,762 | 14.8% |
| $75,000 to $99,999 | 6,189 | 11.8% |
| $100,000 to $149,999 | 9,388 | 17.9% |
| $150,000 to $199,999 | 5,926 | 11.3% |
| $200,000+ | 8,653 | 16.5% |
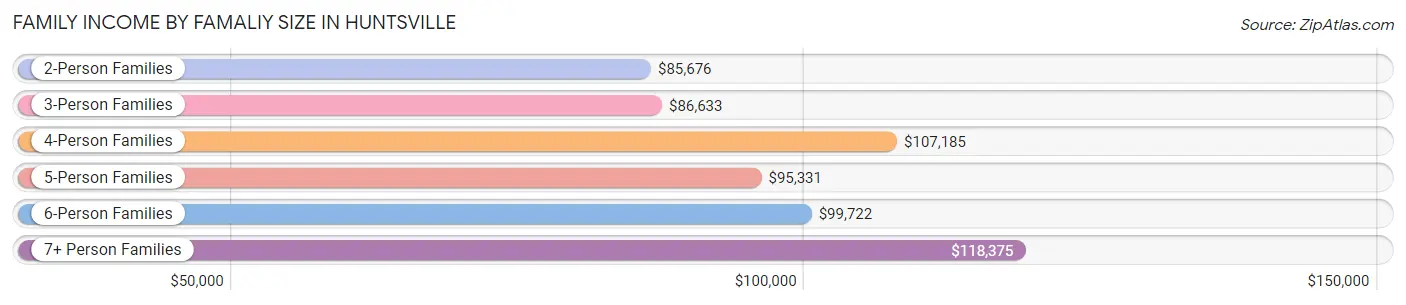
Family Income by Famaliy Size in Huntsville
7+ person families (342 | 0.6%) account for the highest median family income in Huntsville with $118,375 per family, while 2-person families (28,609 | 54.5%) have the highest median income of $42,838 per family member.
| Income Bracket | # Families | Median Income |
| 2-Person Families | 28,609 (54.5%) | $85,676 |
| 3-Person Families | 11,870 (22.6%) | $86,633 |
| 4-Person Families | 7,401 (14.1%) | $107,185 |
| 5-Person Families | 3,423 (6.5%) | $95,331 |
| 6-Person Families | 800 (1.5%) | $99,722 |
| 7+ Person Families | 342 (0.6%) | $118,375 |
| Total | 52,445 (100.0%) | $90,775 |
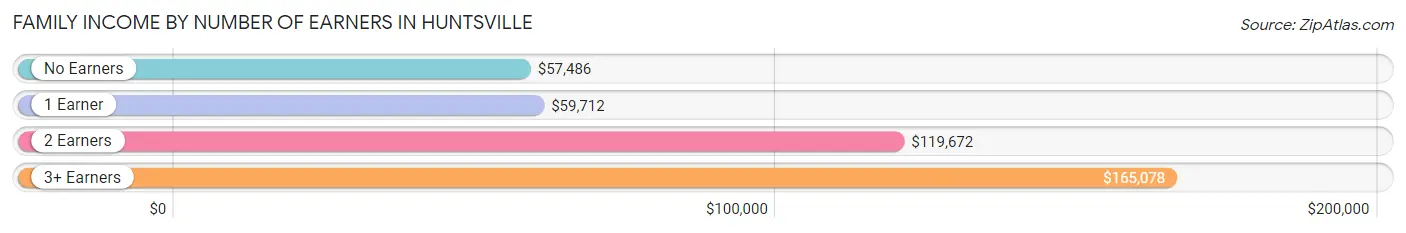
Family Income by Number of Earners in Huntsville
The median family income in Huntsville is $90,775, with families comprising 3+ earners (3,697) having the highest median family income of $165,078, while families with no earners (8,060) have the lowest median family income of $57,486, accounting for 7.0% and 15.4% of families, respectively.
| Number of Earners | # Families | Median Income |
| No Earners | 8,060 (15.4%) | $57,486 |
| 1 Earner | 18,924 (36.1%) | $59,712 |
| 2 Earners | 21,764 (41.5%) | $119,672 |
| 3+ Earners | 3,697 (7.0%) | $165,078 |
| Total | 52,445 (100.0%) | $90,775 |
Household Income in Huntsville
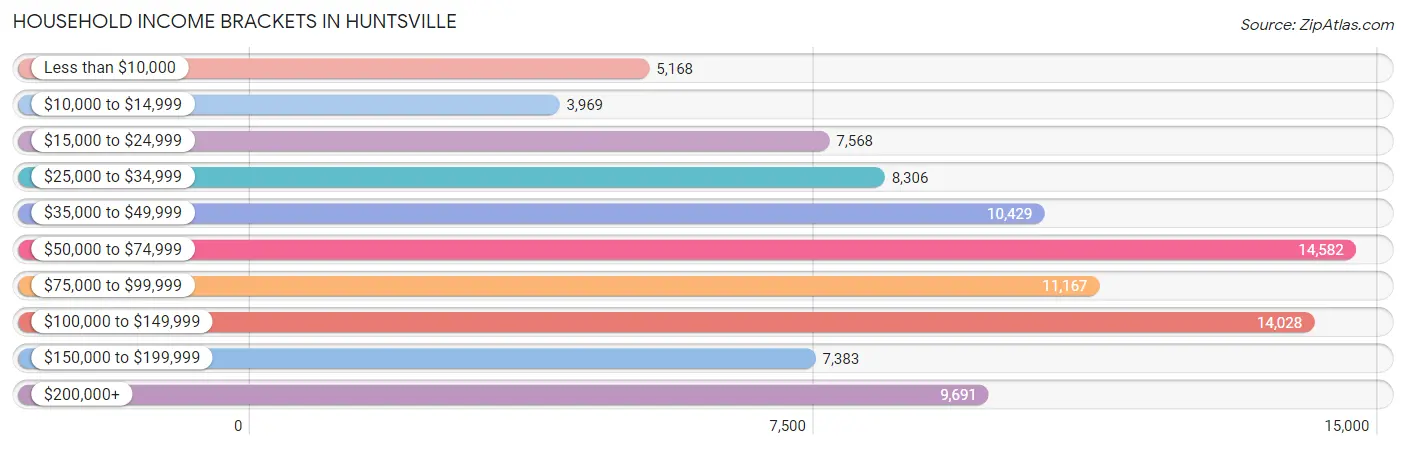
Household Income Brackets in Huntsville
With 14,582 households falling in the category, the $50,000 to $74,999 income range is the most frequent in Huntsville, accounting for 15.8% of all households. In contrast, only 3,969 households (4.3%) fall into the $10,000 to $14,999 income bracket, making it the least populous group.
| Income Bracket | # Households | % Households |
| Less than $10,000 | 5,168 | 5.6% |
| $10,000 to $14,999 | 3,969 | 4.3% |
| $15,000 to $24,999 | 7,568 | 8.2% |
| $25,000 to $34,999 | 8,306 | 9.0% |
| $35,000 to $49,999 | 10,429 | 11.3% |
| $50,000 to $74,999 | 14,582 | 15.8% |
| $75,000 to $99,999 | 11,167 | 12.1% |
| $100,000 to $149,999 | 14,028 | 15.2% |
| $150,000 to $199,999 | 7,383 | 8.0% |
| $200,000+ | 9,691 | 10.5% |
Household Income by Householder Age in Huntsville
The median household income in Huntsville is $67,874, with the highest median household income of $83,402 found in the 45 to 64 years age bracket for the primary householder. A total of 30,756 households (33.3%) fall into this category. Meanwhile, the 15 to 24 years age bracket for the primary householder has the lowest median household income of $31,889, with 6,811 households (7.4%) in this group.
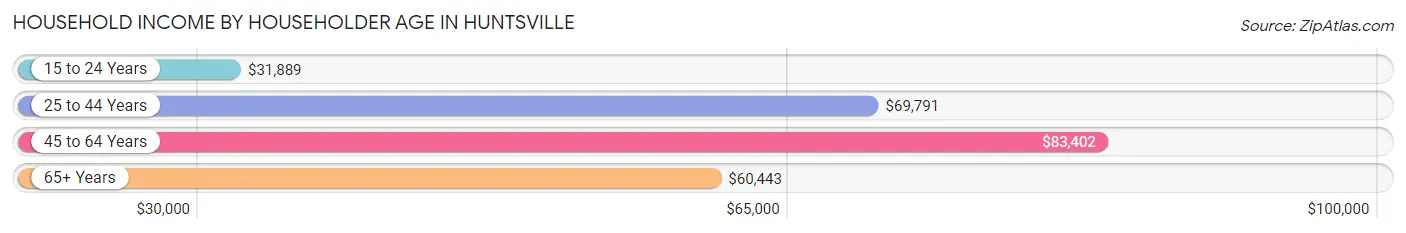
| Income Bracket | # Households | Median Income |
| 15 to 24 Years | 6,811 (7.4%) | $31,889 |
| 25 to 44 Years | 32,146 (34.8%) | $69,791 |
| 45 to 64 Years | 30,756 (33.3%) | $83,402 |
| 65+ Years | 22,578 (24.5%) | $60,443 |
| Total | 92,291 (100.0%) | $67,874 |
Poverty in Huntsville
Income Below Poverty by Sex and Age in Huntsville
With 11.7% poverty level for males and 16.4% for females among the residents of Huntsville, under 5 year old males and 18 to 24 year old females are the most vulnerable to poverty, with 1,355 males (21.5%) and 3,542 females (32.7%) in their respective age groups living below the poverty level.
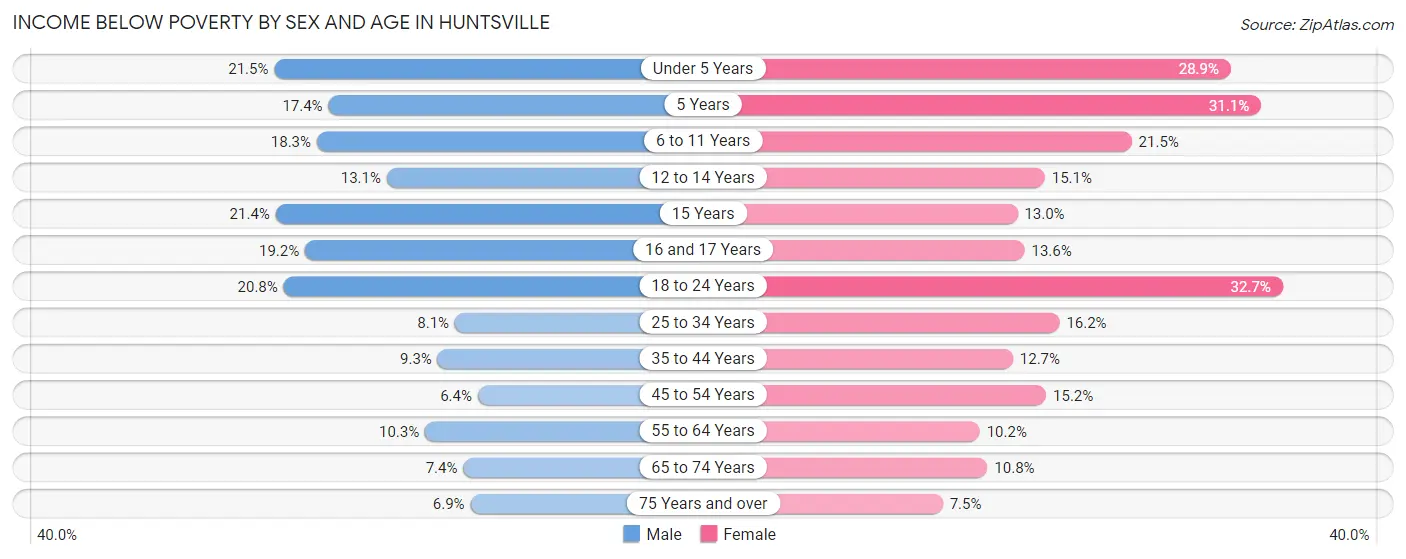
| Age Bracket | Male | Female |
| Under 5 Years | 1,355 (21.5%) | 1,652 (28.9%) |
| 5 Years | 226 (17.4%) | 433 (31.1%) |
| 6 to 11 Years | 1,264 (18.3%) | 1,351 (21.5%) |
| 12 to 14 Years | 473 (13.1%) | 524 (15.1%) |
| 15 Years | 201 (21.4%) | 162 (13.0%) |
| 16 and 17 Years | 391 (19.2%) | 277 (13.6%) |
| 18 to 24 Years | 2,056 (20.8%) | 3,542 (32.7%) |
| 25 to 34 Years | 1,304 (8.1%) | 2,681 (16.2%) |
| 35 to 44 Years | 1,181 (9.3%) | 1,590 (12.7%) |
| 45 to 54 Years | 761 (6.4%) | 1,802 (15.2%) |
| 55 to 64 Years | 1,315 (10.3%) | 1,428 (10.2%) |
| 65 to 74 Years | 643 (7.4%) | 1,116 (10.8%) |
| 75 Years and over | 406 (6.9%) | 675 (7.5%) |
| Total | 11,576 (11.7%) | 17,233 (16.4%) |
Income Above Poverty by Sex and Age in Huntsville
According to the poverty statistics in Huntsville, males aged 45 to 54 years and females aged 75 years and over are the age groups that are most secure financially, with 93.6% of males and 92.5% of females in these age groups living above the poverty line.
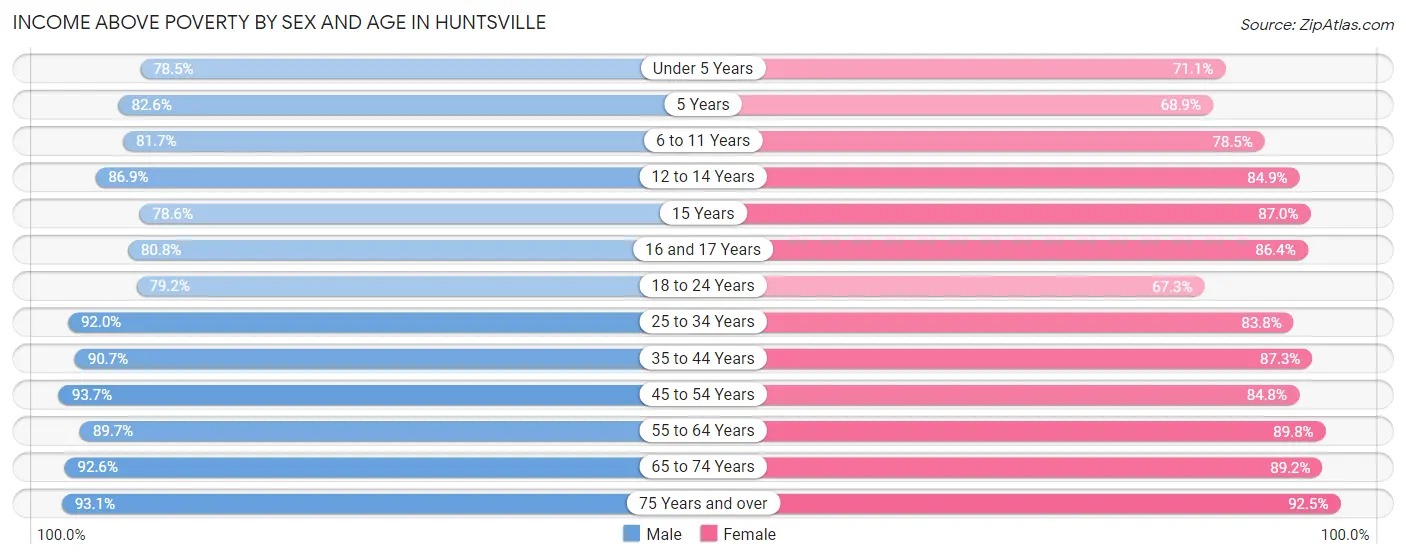
| Age Bracket | Male | Female |
| Under 5 Years | 4,959 (78.5%) | 4,068 (71.1%) |
| 5 Years | 1,070 (82.6%) | 958 (68.9%) |
| 6 to 11 Years | 5,643 (81.7%) | 4,927 (78.5%) |
| 12 to 14 Years | 3,134 (86.9%) | 2,953 (84.9%) |
| 15 Years | 740 (78.6%) | 1,080 (87.0%) |
| 16 and 17 Years | 1,648 (80.8%) | 1,764 (86.4%) |
| 18 to 24 Years | 7,842 (79.2%) | 7,279 (67.3%) |
| 25 to 34 Years | 14,899 (91.9%) | 13,906 (83.8%) |
| 35 to 44 Years | 11,474 (90.7%) | 10,929 (87.3%) |
| 45 to 54 Years | 11,229 (93.6%) | 10,080 (84.8%) |
| 55 to 64 Years | 11,495 (89.7%) | 12,511 (89.8%) |
| 65 to 74 Years | 8,011 (92.6%) | 9,210 (89.2%) |
| 75 Years and over | 5,475 (93.1%) | 8,333 (92.5%) |
| Total | 87,619 (88.3%) | 87,998 (83.6%) |
Income Below Poverty Among Married-Couple Families in Huntsville
The poverty statistics for married-couple families in Huntsville show that 4.5% or 1,626 of the total 36,313 families live below the poverty line. Families with 3 or 4 children have the highest poverty rate of 12.0%, comprising of 301 families. On the other hand, families with no children have the lowest poverty rate of 3.0%, which includes 710 families.
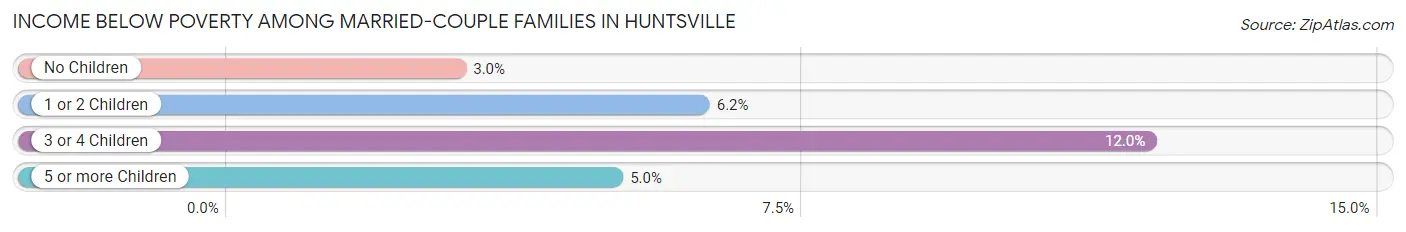
| Children | Above Poverty | Below Poverty |
| No Children | 23,076 (97.0%) | 710 (3.0%) |
| 1 or 2 Children | 9,253 (93.8%) | 607 (6.2%) |
| 3 or 4 Children | 2,207 (88.0%) | 301 (12.0%) |
| 5 or more Children | 151 (95.0%) | 8 (5.0%) |
| Total | 34,687 (95.5%) | 1,626 (4.5%) |
Income Below Poverty Among Single-Parent Households in Huntsville
According to the poverty data in Huntsville, 9.2% or 406 single-father households and 31.0% or 3,644 single-mother households are living below the poverty line. Among single-father households, those with 1 or 2 children have the highest poverty rate, with 238 households (11.4%) experiencing poverty. Likewise, among single-mother households, those with 5 or more children have the highest poverty rate, with 37 households (100.0%) falling below the poverty line.
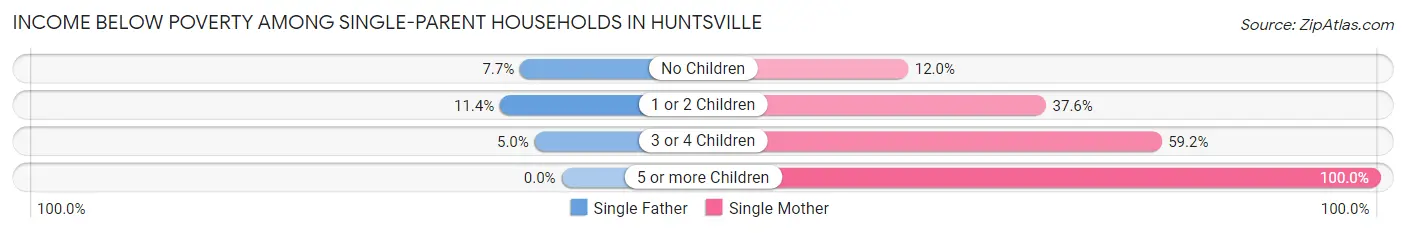
| Children | Single Father | Single Mother |
| No Children | 161 (7.7%) | 512 (11.9%) |
| 1 or 2 Children | 238 (11.4%) | 2,261 (37.6%) |
| 3 or 4 Children | 7 (5.0%) | 834 (59.2%) |
| 5 or more Children | 0 (0.0%) | 37 (100.0%) |
| Total | 406 (9.2%) | 3,644 (31.0%) |
Income Below Poverty Among Married-Couple vs Single-Parent Households in Huntsville
The poverty data for Huntsville shows that 1,626 of the married-couple family households (4.5%) and 4,050 of the single-parent households (25.1%) are living below the poverty level. Within the married-couple family households, those with 3 or 4 children have the highest poverty rate, with 301 households (12.0%) falling below the poverty line. Among the single-parent households, those with 3 or 4 children have the highest poverty rate, with 841 household (54.3%) living below poverty.
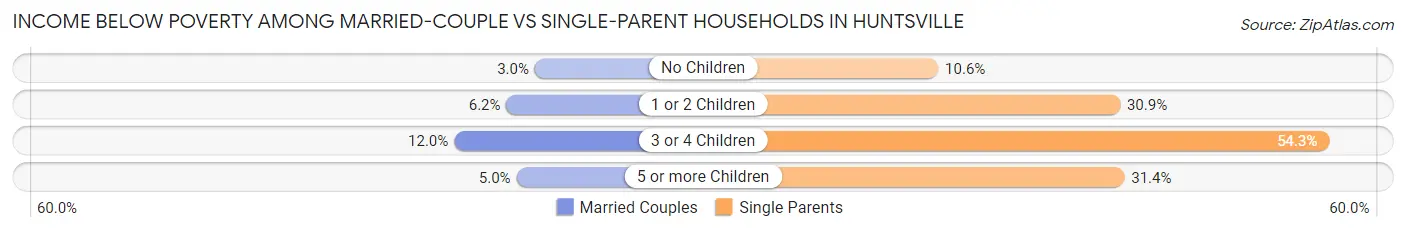
| Children | Married-Couple Families | Single-Parent Households |
| No Children | 710 (3.0%) | 673 (10.6%) |
| 1 or 2 Children | 607 (6.2%) | 2,499 (30.9%) |
| 3 or 4 Children | 301 (12.0%) | 841 (54.3%) |
| 5 or more Children | 8 (5.0%) | 37 (31.4%) |
| Total | 1,626 (4.5%) | 4,050 (25.1%) |
Race in Huntsville
The most populous races in Huntsville are White / Caucasian (126,836 | 59.0%), Black / African American (65,393 | 30.4%), and Hispanic or Latino (13,825 | 6.4%).
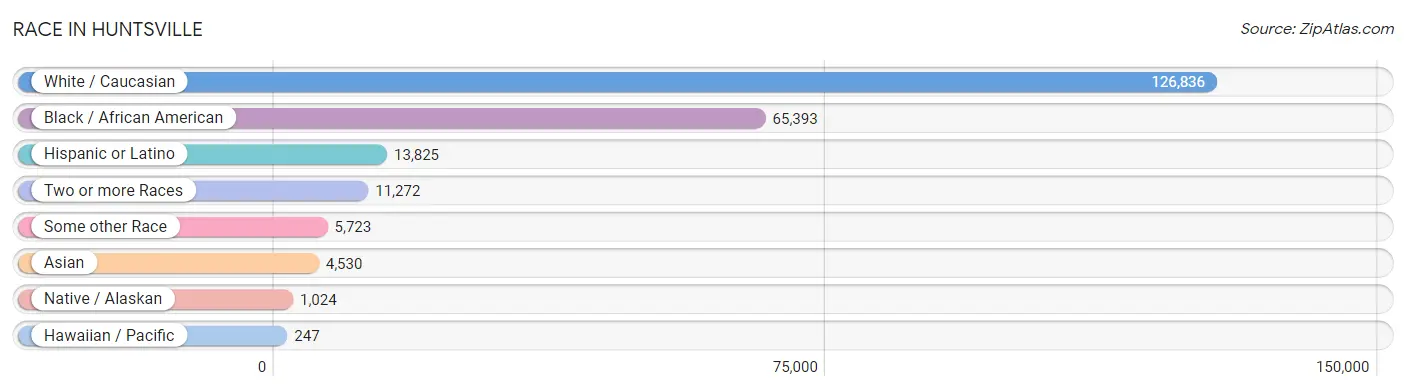
| Race | # Population | % Population |
| Asian | 4,530 | 2.1% |
| Black / African American | 65,393 | 30.4% |
| Hawaiian / Pacific | 247 | 0.1% |
| Hispanic or Latino | 13,825 | 6.4% |
| Native / Alaskan | 1,024 | 0.5% |
| White / Caucasian | 126,836 | 59.0% |
| Two or more Races | 11,272 | 5.2% |
| Some other Race | 5,723 | 2.7% |
| Total | 215,025 | 100.0% |
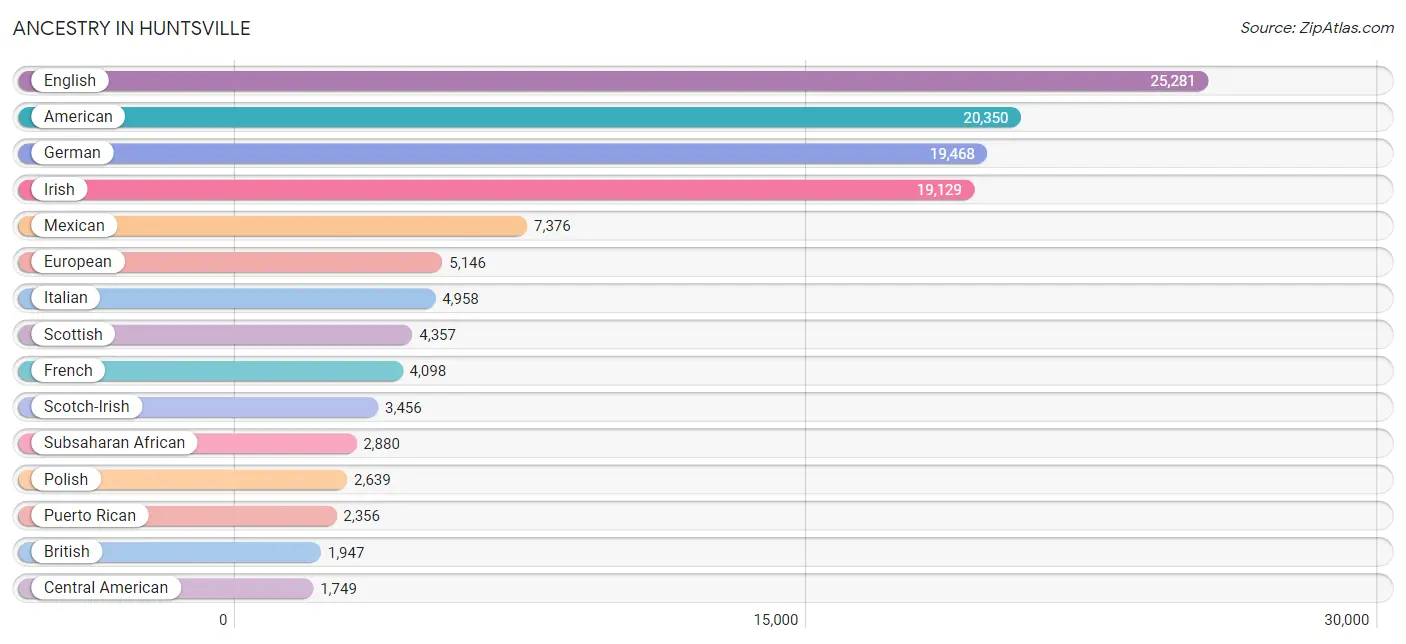
Ancestry in Huntsville
The most populous ancestries reported in Huntsville are English (25,281 | 11.8%), American (20,350 | 9.5%), German (19,468 | 9.0%), Irish (19,129 | 8.9%), and Mexican (7,376 | 3.4%), together accounting for 42.6% of all Huntsville residents.
| Ancestry | # Population | % Population |
| Afghan | 10 | 0.0% |
| African | 1,569 | 0.7% |
| Alaska Native | 26 | 0.0% |
| Albanian | 36 | 0.0% |
| American | 20,350 | 9.5% |
| Arab | 633 | 0.3% |
| Argentinean | 74 | 0.0% |
| Armenian | 32 | 0.0% |
| Australian | 12 | 0.0% |
| Austrian | 306 | 0.1% |
| Bahamian | 33 | 0.0% |
| Bangladeshi | 65 | 0.0% |
| Barbadian | 84 | 0.0% |
| Basque | 53 | 0.0% |
| Belgian | 80 | 0.0% |
| Bermudan | 394 | 0.2% |
| Bhutanese | 633 | 0.3% |
| Blackfeet | 66 | 0.0% |
| Brazilian | 96 | 0.0% |
| British | 1,947 | 0.9% |
| British West Indian | 29 | 0.0% |
| Burmese | 871 | 0.4% |
| Cajun | 33 | 0.0% |
| Cambodian | 22 | 0.0% |
| Canadian | 102 | 0.1% |
| Cape Verdean | 10 | 0.0% |
| Celtic | 21 | 0.0% |
| Central American | 1,749 | 0.8% |
| Central American Indian | 199 | 0.1% |
| Cherokee | 1,450 | 0.7% |
| Chickasaw | 33 | 0.0% |
| Chilean | 46 | 0.0% |
| Chippewa | 109 | 0.1% |
| Choctaw | 202 | 0.1% |
| Colombian | 487 | 0.2% |
| Costa Rican | 49 | 0.0% |
| Creek | 163 | 0.1% |
| Croatian | 142 | 0.1% |
| Cuban | 284 | 0.1% |
| Czech | 411 | 0.2% |
| Czechoslovakian | 153 | 0.1% |
| Danish | 195 | 0.1% |
| Dominican | 502 | 0.2% |
| Dutch | 1,592 | 0.7% |
| Eastern European | 289 | 0.1% |
| Ecuadorian | 8 | 0.0% |
| Egyptian | 63 | 0.0% |
| English | 25,281 | 11.8% |
| Estonian | 7 | 0.0% |
| Ethiopian | 21 | 0.0% |
| European | 5,146 | 2.4% |
| Fijian | 57 | 0.0% |
| Filipino | 52 | 0.0% |
| Finnish | 385 | 0.2% |
| French | 4,098 | 1.9% |
| French American Indian | 9 | 0.0% |
| French Canadian | 752 | 0.4% |
| German | 19,468 | 9.0% |
| Greek | 476 | 0.2% |
| Guamanian / Chamorro | 102 | 0.1% |
| Guatemalan | 1,100 | 0.5% |
| Guyanese | 29 | 0.0% |
| Haitian | 249 | 0.1% |
| Honduran | 281 | 0.1% |
| Hopi | 2 | 0.0% |
| Hungarian | 321 | 0.2% |
| Icelander | 32 | 0.0% |
| Indian (Asian) | 1,468 | 0.7% |
| Iranian | 466 | 0.2% |
| Irish | 19,129 | 8.9% |
| Iroquois | 52 | 0.0% |
| Israeli | 16 | 0.0% |
| Italian | 4,958 | 2.3% |
| Jamaican | 1,017 | 0.5% |
| Japanese | 15 | 0.0% |
| Kenyan | 135 | 0.1% |
| Korean | 902 | 0.4% |
| Laotian | 83 | 0.0% |
| Latvian | 121 | 0.1% |
| Lebanese | 211 | 0.1% |
| Lithuanian | 181 | 0.1% |
| Luxembourger | 21 | 0.0% |
| Malaysian | 166 | 0.1% |
| Mexican | 7,376 | 3.4% |
| Mexican American Indian | 124 | 0.1% |
| Moroccan | 6 | 0.0% |
| Native Hawaiian | 238 | 0.1% |
| New Zealander | 63 | 0.0% |
| Nigerian | 888 | 0.4% |
| Northern European | 422 | 0.2% |
| Norwegian | 895 | 0.4% |
| Ottawa | 10 | 0.0% |
| Pakistani | 226 | 0.1% |
| Palestinian | 25 | 0.0% |
| Panamanian | 215 | 0.1% |
| Pennsylvania German | 89 | 0.0% |
| Peruvian | 69 | 0.0% |
| Polish | 2,639 | 1.2% |
| Portuguese | 385 | 0.2% |
| Potawatomi | 25 | 0.0% |
| Pueblo | 15 | 0.0% |
| Puerto Rican | 2,356 | 1.1% |
| Romanian | 106 | 0.1% |
| Russian | 443 | 0.2% |
| Salvadoran | 74 | 0.0% |
| Samoan | 102 | 0.1% |
| Scandinavian | 463 | 0.2% |
| Scotch-Irish | 3,456 | 1.6% |
| Scottish | 4,357 | 2.0% |
| Seminole | 21 | 0.0% |
| Serbian | 13 | 0.0% |
| Sierra Leonean | 14 | 0.0% |
| Sioux | 20 | 0.0% |
| Slavic | 109 | 0.1% |
| Slovak | 210 | 0.1% |
| Slovene | 41 | 0.0% |
| South African | 20 | 0.0% |
| South American | 912 | 0.4% |
| South American Indian | 4 | 0.0% |
| Spaniard | 291 | 0.1% |
| Spanish | 163 | 0.1% |
| Sri Lankan | 356 | 0.2% |
| Subsaharan African | 2,880 | 1.3% |
| Sudanese | 28 | 0.0% |
| Swedish | 1,260 | 0.6% |
| Swiss | 322 | 0.2% |
| Syrian | 137 | 0.1% |
| Thai | 1,053 | 0.5% |
| Tlingit-Haida | 25 | 0.0% |
| Tohono O'Odham | 2 | 0.0% |
| Tongan | 1 | 0.0% |
| Trinidadian and Tobagonian | 133 | 0.1% |
| Turkish | 30 | 0.0% |
| U.S. Virgin Islander | 40 | 0.0% |
| Ukrainian | 345 | 0.2% |
| Venezuelan | 228 | 0.1% |
| Welsh | 1,046 | 0.5% |
| West Indian | 492 | 0.2% |
| Yugoslavian | 60 | 0.0% |
| Yup'ik | 21 | 0.0% | View All 140 Rows |
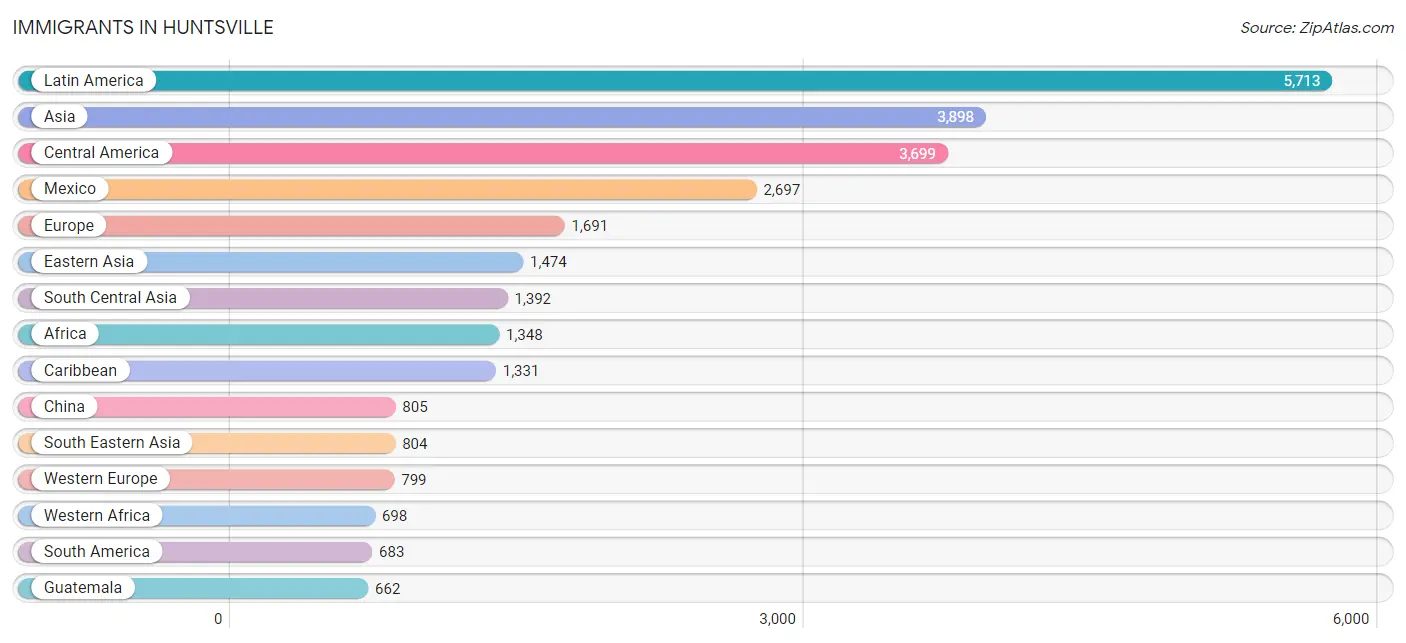
Immigrants in Huntsville
The most numerous immigrant groups reported in Huntsville came from Latin America (5,713 | 2.7%), Asia (3,898 | 1.8%), Central America (3,699 | 1.7%), Mexico (2,697 | 1.3%), and Europe (1,691 | 0.8%), together accounting for 8.2% of all Huntsville residents.
| Immigration Origin | # Population | % Population |
| Africa | 1,348 | 0.6% |
| Argentina | 7 | 0.0% |
| Asia | 3,898 | 1.8% |
| Australia | 10 | 0.0% |
| Austria | 9 | 0.0% |
| Bahamas | 11 | 0.0% |
| Bangladesh | 188 | 0.1% |
| Belgium | 24 | 0.0% |
| Brazil | 73 | 0.0% |
| Cameroon | 88 | 0.0% |
| Canada | 345 | 0.2% |
| Caribbean | 1,331 | 0.6% |
| Central America | 3,699 | 1.7% |
| Chile | 46 | 0.0% |
| China | 805 | 0.4% |
| Colombia | 252 | 0.1% |
| Costa Rica | 59 | 0.0% |
| Croatia | 58 | 0.0% |
| Cuba | 21 | 0.0% |
| Czechoslovakia | 9 | 0.0% |
| Denmark | 6 | 0.0% |
| Dominican Republic | 372 | 0.2% |
| Eastern Africa | 274 | 0.1% |
| Eastern Asia | 1,474 | 0.7% |
| Eastern Europe | 319 | 0.2% |
| Ecuador | 24 | 0.0% |
| Egypt | 45 | 0.0% |
| El Salvador | 49 | 0.0% |
| England | 157 | 0.1% |
| Ethiopia | 36 | 0.0% |
| Europe | 1,691 | 0.8% |
| France | 111 | 0.1% |
| Germany | 634 | 0.3% |
| Ghana | 31 | 0.0% |
| Greece | 32 | 0.0% |
| Grenada | 13 | 0.0% |
| Guatemala | 662 | 0.3% |
| Guyana | 109 | 0.1% |
| Haiti | 86 | 0.0% |
| Honduras | 183 | 0.1% |
| Hong Kong | 16 | 0.0% |
| India | 598 | 0.3% |
| Iran | 223 | 0.1% |
| Iraq | 13 | 0.0% |
| Ireland | 41 | 0.0% |
| Israel | 13 | 0.0% |
| Italy | 55 | 0.0% |
| Jamaica | 553 | 0.3% |
| Japan | 261 | 0.1% |
| Jordan | 15 | 0.0% |
| Kazakhstan | 28 | 0.0% |
| Kenya | 150 | 0.1% |
| Korea | 408 | 0.2% |
| Laos | 111 | 0.1% |
| Latin America | 5,713 | 2.7% |
| Lebanon | 23 | 0.0% |
| Malaysia | 96 | 0.0% |
| Mexico | 2,697 | 1.3% |
| Middle Africa | 88 | 0.0% |
| Nepal | 53 | 0.0% |
| Netherlands | 21 | 0.0% |
| Nigeria | 622 | 0.3% |
| Northern Africa | 126 | 0.1% |
| Northern Europe | 467 | 0.2% |
| Oceania | 30 | 0.0% |
| Pakistan | 249 | 0.1% |
| Panama | 49 | 0.0% |
| Peru | 43 | 0.0% |
| Philippines | 197 | 0.1% |
| Poland | 23 | 0.0% |
| Portugal | 15 | 0.0% |
| Romania | 39 | 0.0% |
| Russia | 48 | 0.0% |
| Scotland | 109 | 0.1% |
| Sierra Leone | 14 | 0.0% |
| South Africa | 162 | 0.1% |
| South America | 683 | 0.3% |
| South Central Asia | 1,392 | 0.6% |
| South Eastern Asia | 804 | 0.4% |
| Southern Europe | 106 | 0.1% |
| Spain | 4 | 0.0% |
| Sri Lanka | 42 | 0.0% |
| Sudan | 81 | 0.0% |
| Syria | 15 | 0.0% |
| Taiwan | 312 | 0.2% |
| Thailand | 85 | 0.0% |
| Trinidad and Tobago | 196 | 0.1% |
| Turkey | 30 | 0.0% |
| Ukraine | 93 | 0.0% |
| Venezuela | 129 | 0.1% |
| Vietnam | 315 | 0.2% |
| West Indies | 8 | 0.0% |
| Western Africa | 698 | 0.3% |
| Western Asia | 190 | 0.1% |
| Western Europe | 799 | 0.4% |
| Yemen | 71 | 0.0% |
| Zimbabwe | 23 | 0.0% | View All 97 Rows |
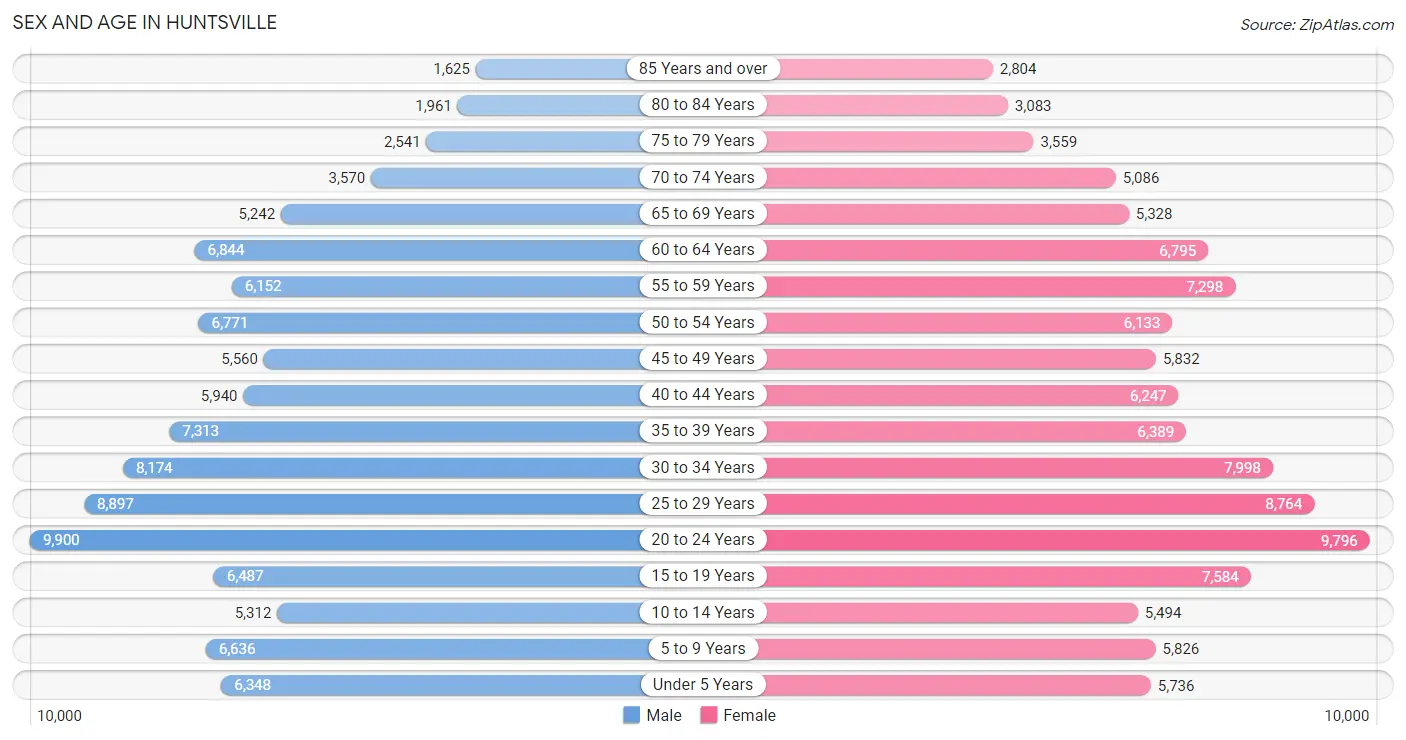
Sex and Age in Huntsville
Sex and Age in Huntsville
The most populous age groups in Huntsville are 20 to 24 Years (9,900 | 9.4%) for men and 20 to 24 Years (9,796 | 8.9%) for women.
| Age Bracket | Male | Female |
| Under 5 Years | 6,348 (6.0%) | 5,736 (5.2%) |
| 5 to 9 Years | 6,636 (6.3%) | 5,826 (5.3%) |
| 10 to 14 Years | 5,312 (5.1%) | 5,494 (5.0%) |
| 15 to 19 Years | 6,487 (6.2%) | 7,584 (6.9%) |
| 20 to 24 Years | 9,900 (9.4%) | 9,796 (8.9%) |
| 25 to 29 Years | 8,897 (8.5%) | 8,764 (8.0%) |
| 30 to 34 Years | 8,174 (7.8%) | 7,998 (7.3%) |
| 35 to 39 Years | 7,313 (7.0%) | 6,389 (5.8%) |
| 40 to 44 Years | 5,940 (5.6%) | 6,247 (5.7%) |
| 45 to 49 Years | 5,560 (5.3%) | 5,832 (5.3%) |
| 50 to 54 Years | 6,771 (6.4%) | 6,133 (5.6%) |
| 55 to 59 Years | 6,152 (5.8%) | 7,298 (6.7%) |
| 60 to 64 Years | 6,844 (6.5%) | 6,795 (6.2%) |
| 65 to 69 Years | 5,242 (5.0%) | 5,328 (4.9%) |
| 70 to 74 Years | 3,570 (3.4%) | 5,086 (4.6%) |
| 75 to 79 Years | 2,541 (2.4%) | 3,559 (3.2%) |
| 80 to 84 Years | 1,961 (1.9%) | 3,083 (2.8%) |
| 85 Years and over | 1,625 (1.5%) | 2,804 (2.5%) |
| Total | 105,273 (100.0%) | 109,752 (100.0%) |
Families and Households in Huntsville
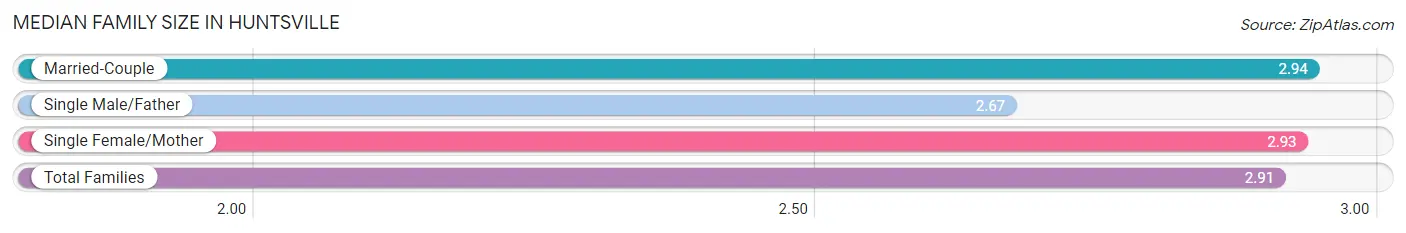
Median Family Size in Huntsville
The median family size in Huntsville is 2.91 persons per family, with married-couple families (36,313 | 69.2%) accounting for the largest median family size of 2.94 persons per family. On the other hand, single male/father families (4,388 | 8.4%) represent the smallest median family size with 2.67 persons per family.
| Family Type | # Families | Family Size |
| Married-Couple | 36,313 (69.2%) | 2.94 |
| Single Male/Father | 4,388 (8.4%) | 2.67 |
| Single Female/Mother | 11,744 (22.4%) | 2.93 |
| Total Families | 52,445 (100.0%) | 2.91 |
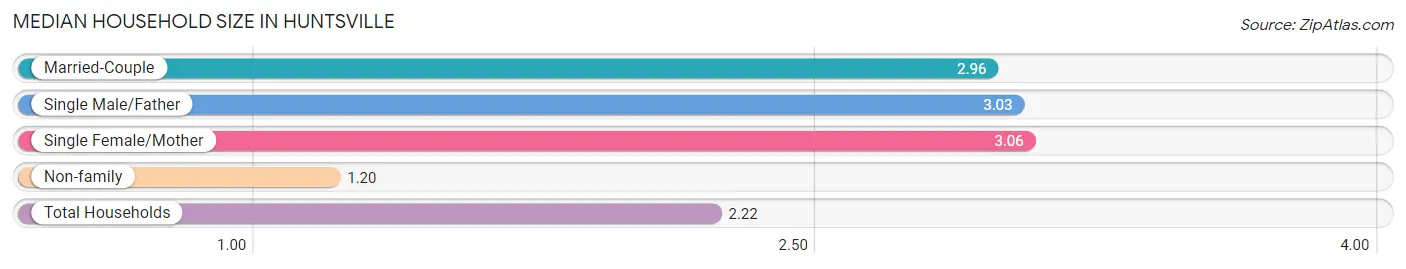
Median Household Size in Huntsville
The median household size in Huntsville is 2.22 persons per household, with single female/mother households (11,744 | 12.7%) accounting for the largest median household size of 3.06 persons per household. non-family households (39,846 | 43.2%) represent the smallest median household size with 1.20 persons per household.
| Household Type | # Households | Household Size |
| Married-Couple | 36,313 (39.4%) | 2.96 |
| Single Male/Father | 4,388 (4.8%) | 3.03 |
| Single Female/Mother | 11,744 (12.7%) | 3.06 |
| Non-family | 39,846 (43.2%) | 1.20 |
| Total Households | 92,291 (100.0%) | 2.22 |
Household Size by Marriage Status in Huntsville
Out of a total of 92,291 households in Huntsville, 52,445 (56.8%) are family households, while 39,846 (43.2%) are nonfamily households. The most numerous type of family households are 2-person households, comprising 26,585, and the most common type of nonfamily households are 1-person households, comprising 33,424.
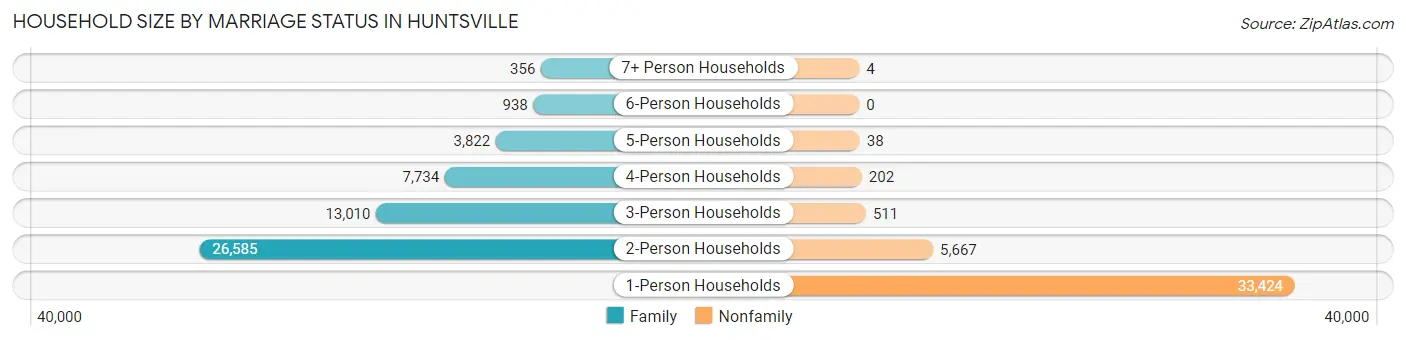
| Household Size | Family Households | Nonfamily Households |
| 1-Person Households | - | 33,424 (36.2%) |
| 2-Person Households | 26,585 (28.8%) | 5,667 (6.1%) |
| 3-Person Households | 13,010 (14.1%) | 511 (0.5%) |
| 4-Person Households | 7,734 (8.4%) | 202 (0.2%) |
| 5-Person Households | 3,822 (4.1%) | 38 (0.0%) |
| 6-Person Households | 938 (1.0%) | 0 (0.0%) |
| 7+ Person Households | 356 (0.4%) | 4 (0.0%) |
| Total | 52,445 (56.8%) | 39,846 (43.2%) |
Female Fertility in Huntsville
Fertility by Age in Huntsville
Average fertility rate in Huntsville is 47.0 births per 1,000 women. Women in the age bracket of 20 to 34 years have the highest fertility rate with 70.0 births per 1,000 women. Women in the age bracket of 20 to 34 years acount for 74.0% of all women with births.
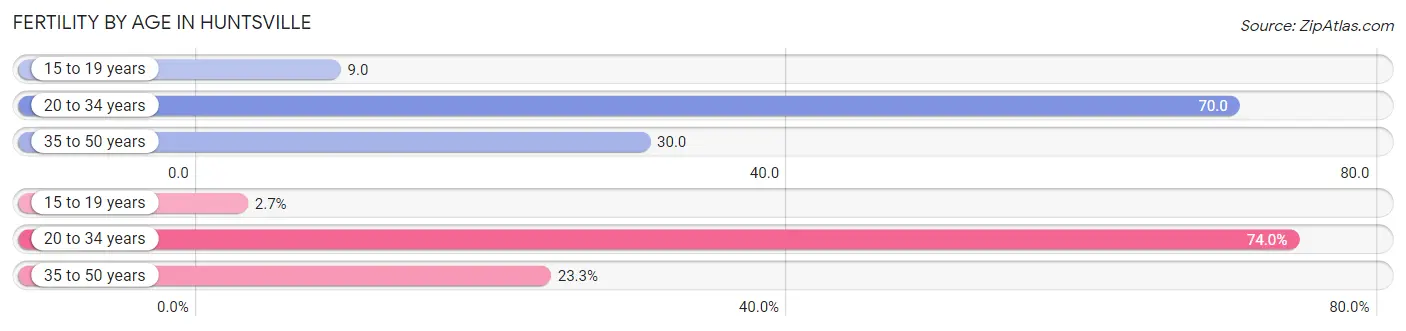
| Age Bracket | Women with Births | Births / 1,000 Women |
| 15 to 19 years | 68 (2.7%) | 9.0 |
| 20 to 34 years | 1,862 (74.0%) | 70.0 |
| 35 to 50 years | 585 (23.3%) | 30.0 |
| Total | 2,515 (100.0%) | 47.0 |
Fertility by Age by Marriage Status in Huntsville
62.1% of women with births (2,515) in Huntsville are married. The highest percentage of unmarried women with births falls into 15 to 19 years age bracket with 91.2% of them unmarried at the time of birth, while the lowest percentage of unmarried women with births belong to 35 to 50 years age bracket with 18.8% of them unmarried.
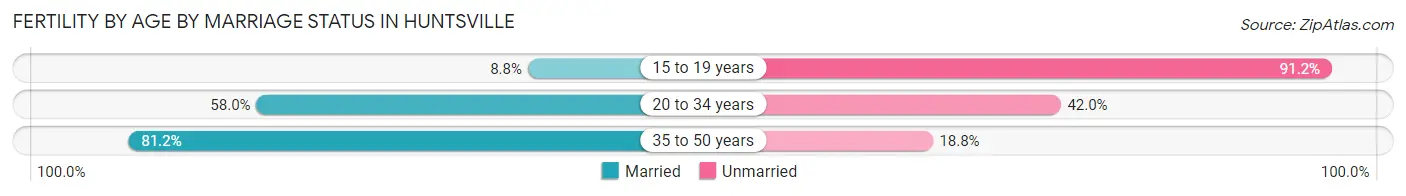
| Age Bracket | Married | Unmarried |
| 15 to 19 years | 6 (8.8%) | 62 (91.2%) |
| 20 to 34 years | 1,080 (58.0%) | 782 (42.0%) |
| 35 to 50 years | 475 (81.2%) | 110 (18.8%) |
| Total | 1,562 (62.1%) | 953 (37.9%) |
Fertility by Education in Huntsville
Average fertility rate in Huntsville is 47.0 births per 1,000 women. Women with the education attainment of high school diploma have the highest fertility rate of 72.0 births per 1,000 women, while women with the education attainment of less than high school have the lowest fertility at 19.0 births per 1,000 women. Women with the education attainment of college or associate's degree represent 30.1% of all women with births.
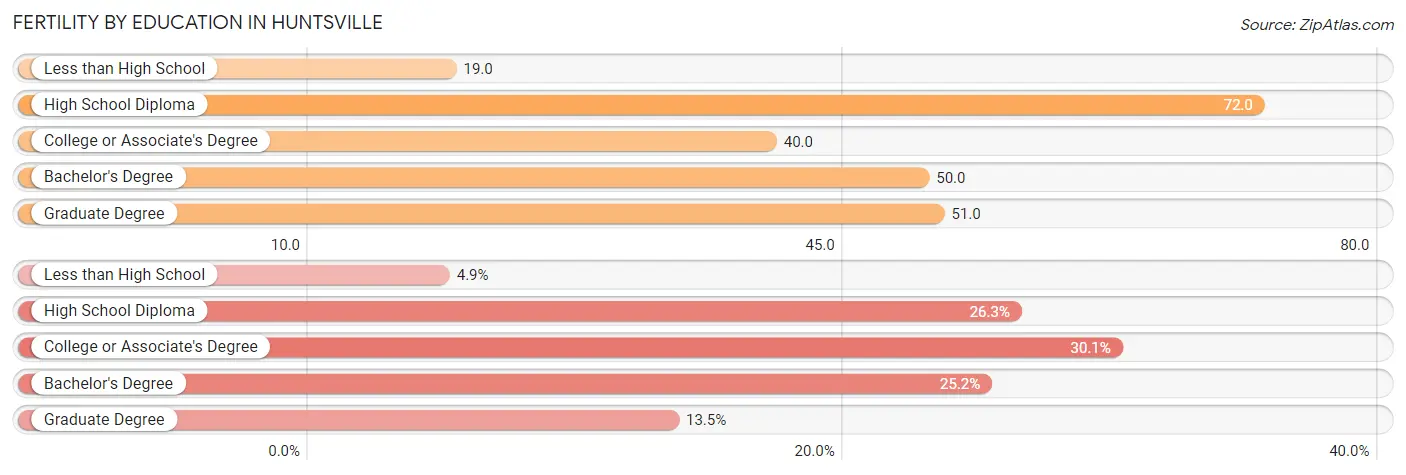
| Educational Attainment | Women with Births | Births / 1,000 Women |
| Less than High School | 123 (4.9%) | 19.0 |
| High School Diploma | 662 (26.3%) | 72.0 |
| College or Associate's Degree | 757 (30.1%) | 40.0 |
| Bachelor's Degree | 634 (25.2%) | 50.0 |
| Graduate Degree | 339 (13.5%) | 51.0 |
| Total | 2,515 (100.0%) | 47.0 |
Fertility by Education by Marriage Status in Huntsville
37.9% of women with births in Huntsville are unmarried. Women with the educational attainment of graduate degree are most likely to be married with 92.3% of them married at childbirth, while women with the educational attainment of high school diploma are least likely to be married with 65.7% of them unmarried at childbirth.
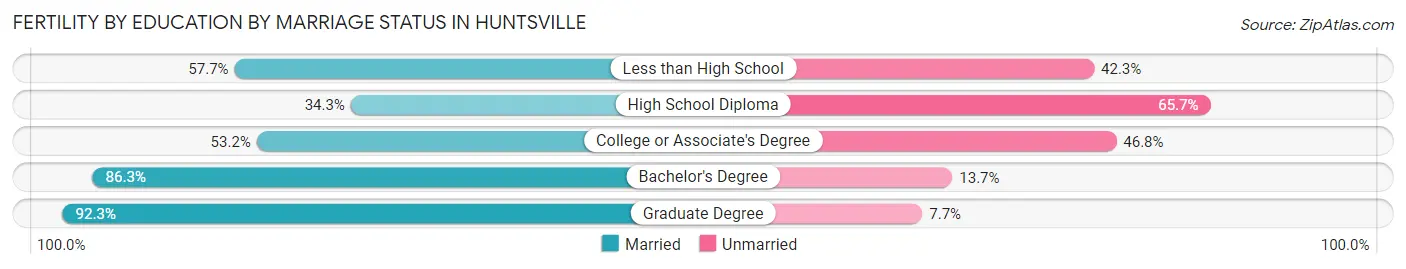
| Educational Attainment | Married | Unmarried |
| Less than High School | 71 (57.7%) | 52 (42.3%) |
| High School Diploma | 227 (34.3%) | 435 (65.7%) |
| College or Associate's Degree | 403 (53.2%) | 354 (46.8%) |
| Bachelor's Degree | 547 (86.3%) | 87 (13.7%) |
| Graduate Degree | 313 (92.3%) | 26 (7.7%) |
| Total | 1,562 (62.1%) | 953 (37.9%) |
Employment Characteristics in Huntsville
Employment by Class of Employer in Huntsville
Among the 105,856 employed individuals in Huntsville, private company employees (71,400 | 67.4%), federal government employees (9,574 | 9.0%), and not-for-profit organizations (8,002 | 7.6%) make up the most common classes of employment.
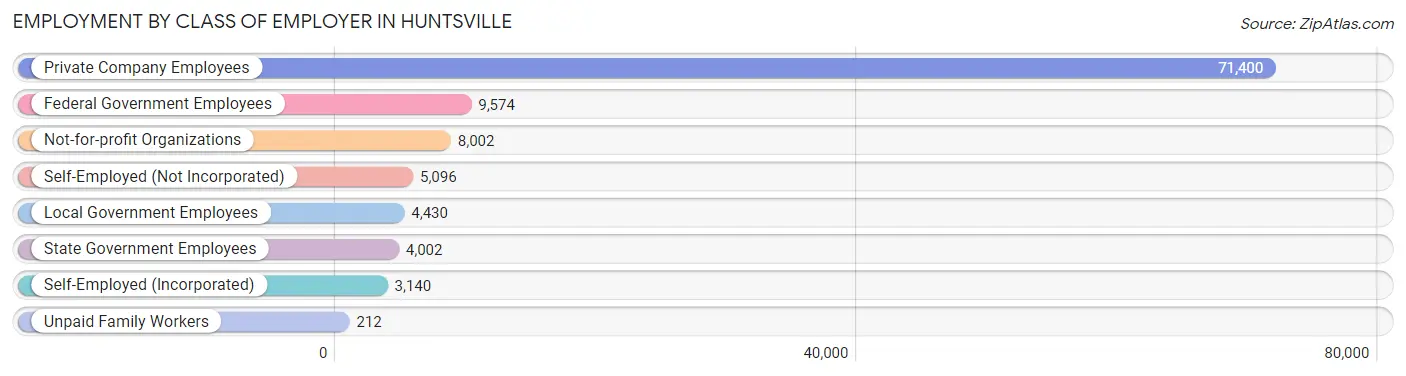
| Employer Class | # Employees | % Employees |
| Private Company Employees | 71,400 | 67.4% |
| Self-Employed (Incorporated) | 3,140 | 3.0% |
| Self-Employed (Not Incorporated) | 5,096 | 4.8% |
| Not-for-profit Organizations | 8,002 | 7.6% |
| Local Government Employees | 4,430 | 4.2% |
| State Government Employees | 4,002 | 3.8% |
| Federal Government Employees | 9,574 | 9.0% |
| Unpaid Family Workers | 212 | 0.2% |
| Total | 105,856 | 100.0% |
Employment Status by Age in Huntsville
According to the labor force statistics for Huntsville, out of the total population over 16 years of age (177,484), 63.4% or 112,525 individuals are in the labor force, with 4.6% or 5,176 of them unemployed. The age group with the highest labor force participation rate is 25 to 29 years, with 86.0% or 15,188 individuals in the labor force. Within the labor force, the 16 to 19 years age range has the highest percentage of unemployed individuals, with 15.2% or 657 of them being unemployed.
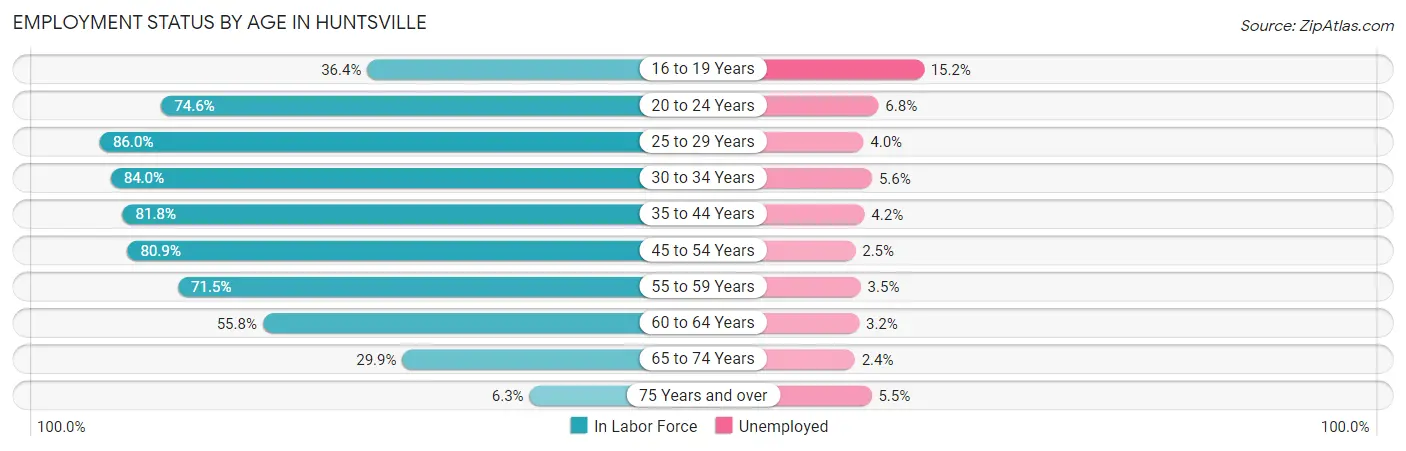
| Age Bracket | In Labor Force | Unemployed |
| 16 to 19 Years | 4,325 (36.4%) | 657 (15.2%) |
| 20 to 24 Years | 14,693 (74.6%) | 999 (6.8%) |
| 25 to 29 Years | 15,188 (86.0%) | 608 (4.0%) |
| 30 to 34 Years | 13,584 (84.0%) | 761 (5.6%) |
| 35 to 44 Years | 21,177 (81.8%) | 889 (4.2%) |
| 45 to 54 Years | 19,655 (80.9%) | 491 (2.5%) |
| 55 to 59 Years | 9,617 (71.5%) | 337 (3.5%) |
| 60 to 64 Years | 7,611 (55.8%) | 244 (3.2%) |
| 65 to 74 Years | 5,749 (29.9%) | 138 (2.4%) |
| 75 Years and over | 981 (6.3%) | 54 (5.5%) |
| Total | 112,525 (63.4%) | 5,176 (4.6%) |
Employment Status by Educational Attainment in Huntsville
According to labor force statistics for Huntsville, 78.1% of individuals (86,775) out of the total population between 25 and 64 years of age (111,107) are in the labor force, with 3.8% or 3,297 of them being unemployed. The group with the highest labor force participation rate are those with the educational attainment of bachelor's degree or higher, with 85.3% or 44,005 individuals in the labor force. Within the labor force, individuals with less than high school education have the highest percentage of unemployment, with 13.1% or 681 of them being unemployed.
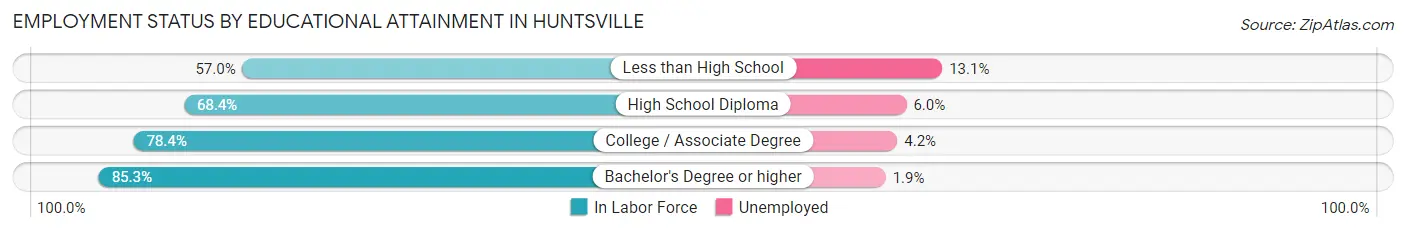
| Educational Attainment | In Labor Force | Unemployed |
| Less than High School | 5,197 (57.0%) | 1,194 (13.1%) |
| High School Diploma | 12,790 (68.4%) | 1,122 (6.0%) |
| College / Associate Degree | 24,854 (78.4%) | 1,331 (4.2%) |
| Bachelor's Degree or higher | 44,005 (85.3%) | 980 (1.9%) |
| Total | 86,775 (78.1%) | 4,222 (3.8%) |
Employment Occupations by Sex in Huntsville
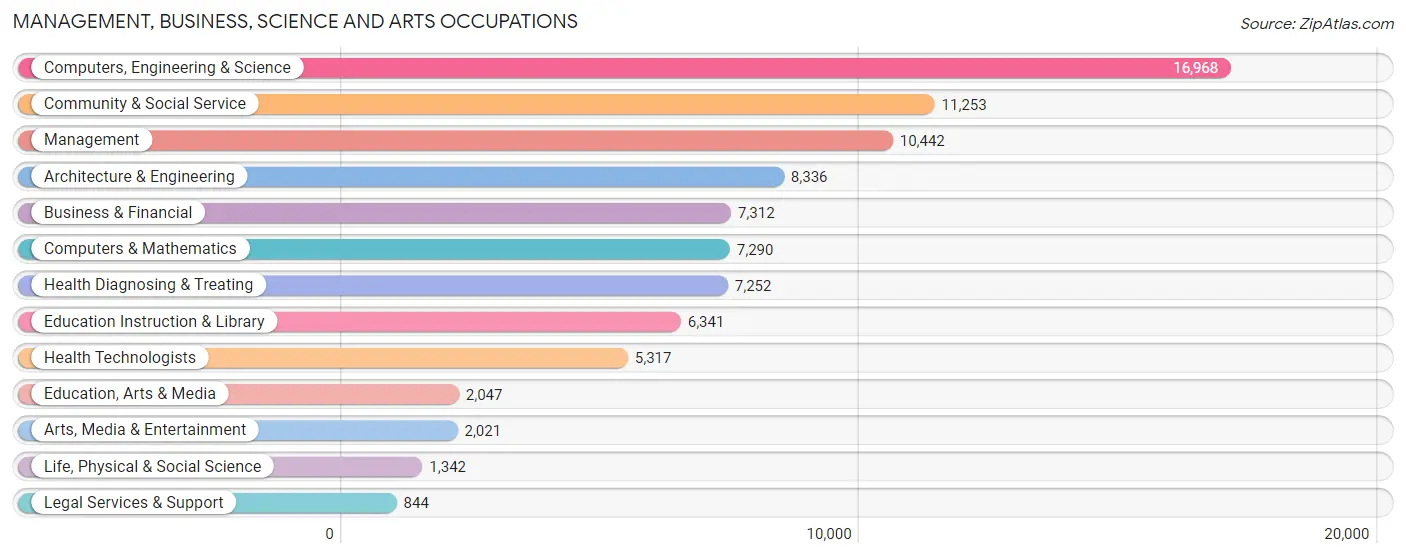
Management, Business, Science and Arts Occupations
The most common Management, Business, Science and Arts occupations in Huntsville are Computers, Engineering & Science (16,968 | 15.9%), Community & Social Service (11,253 | 10.5%), Management (10,442 | 9.8%), Architecture & Engineering (8,336 | 7.8%), and Business & Financial (7,312 | 6.8%).
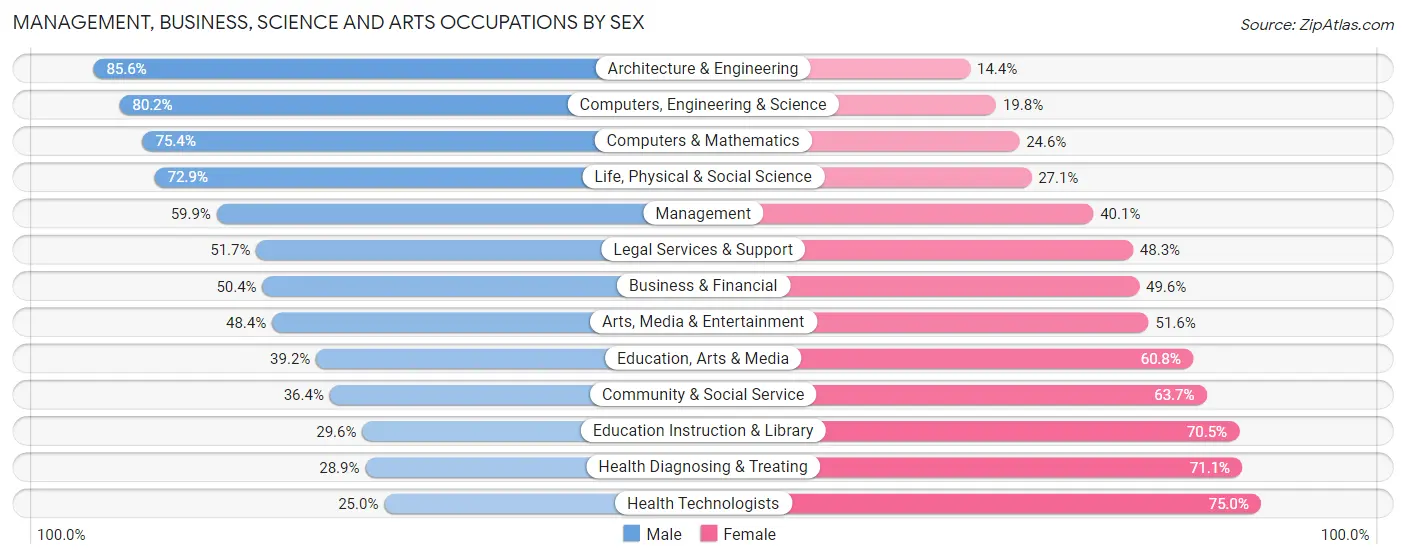
Management, Business, Science and Arts Occupations by Sex
Within the Management, Business, Science and Arts occupations in Huntsville, the most male-oriented occupations are Architecture & Engineering (85.6%), Computers, Engineering & Science (80.2%), and Computers & Mathematics (75.4%), while the most female-oriented occupations are Health Technologists (75.0%), Health Diagnosing & Treating (71.1%), and Education Instruction & Library (70.5%).
| Occupation | Male | Female |
| Management | 6,258 (59.9%) | 4,184 (40.1%) |
| Business & Financial | 3,684 (50.4%) | 3,628 (49.6%) |
| Computers, Engineering & Science | 13,611 (80.2%) | 3,357 (19.8%) |
| Computers & Mathematics | 5,495 (75.4%) | 1,795 (24.6%) |
| Architecture & Engineering | 7,138 (85.6%) | 1,198 (14.4%) |
| Life, Physical & Social Science | 978 (72.9%) | 364 (27.1%) |
| Community & Social Service | 4,090 (36.3%) | 7,163 (63.6%) |
| Education, Arts & Media | 802 (39.2%) | 1,245 (60.8%) |
| Legal Services & Support | 436 (51.7%) | 408 (48.3%) |
| Education Instruction & Library | 1,874 (29.5%) | 4,467 (70.5%) |
| Arts, Media & Entertainment | 978 (48.4%) | 1,043 (51.6%) |
| Health Diagnosing & Treating | 2,097 (28.9%) | 5,155 (71.1%) |
| Health Technologists | 1,328 (25.0%) | 3,989 (75.0%) |
| Total (Category) | 29,740 (55.9%) | 23,487 (44.1%) |
| Total (Overall) | 56,779 (53.1%) | 50,090 (46.9%) |
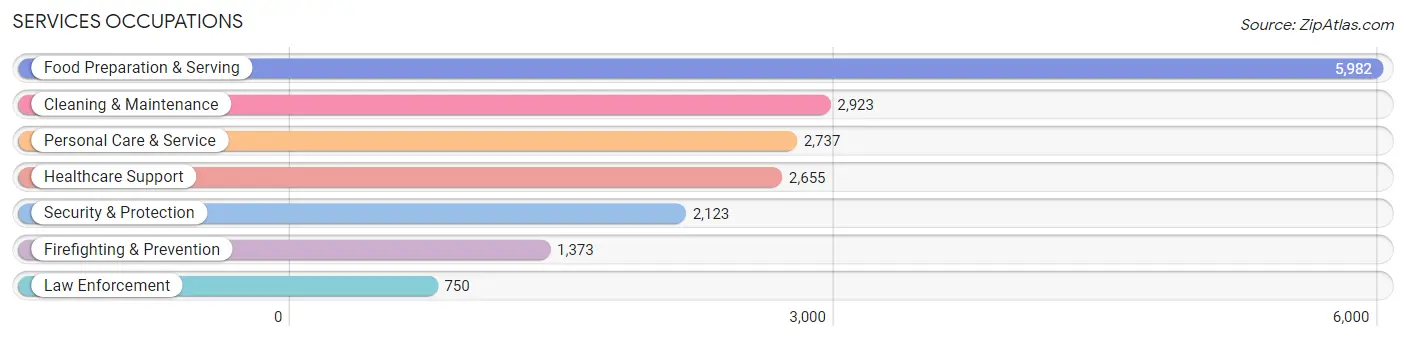
Services Occupations
The most common Services occupations in Huntsville are Food Preparation & Serving (5,982 | 5.6%), Cleaning & Maintenance (2,923 | 2.7%), Personal Care & Service (2,737 | 2.6%), Healthcare Support (2,655 | 2.5%), and Security & Protection (2,123 | 2.0%).
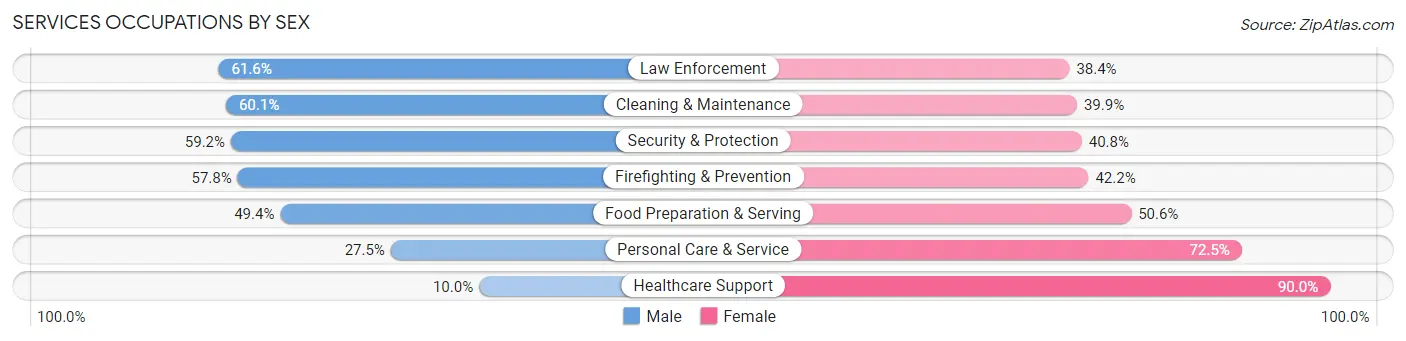
Services Occupations by Sex
Within the Services occupations in Huntsville, the most male-oriented occupations are Law Enforcement (61.6%), Cleaning & Maintenance (60.1%), and Security & Protection (59.2%), while the most female-oriented occupations are Healthcare Support (90.0%), Personal Care & Service (72.5%), and Food Preparation & Serving (50.6%).
| Occupation | Male | Female |
| Healthcare Support | 266 (10.0%) | 2,389 (90.0%) |
| Security & Protection | 1,256 (59.2%) | 867 (40.8%) |
| Firefighting & Prevention | 794 (57.8%) | 579 (42.2%) |
| Law Enforcement | 462 (61.6%) | 288 (38.4%) |
| Food Preparation & Serving | 2,954 (49.4%) | 3,028 (50.6%) |
| Cleaning & Maintenance | 1,757 (60.1%) | 1,166 (39.9%) |
| Personal Care & Service | 753 (27.5%) | 1,984 (72.5%) |
| Total (Category) | 6,986 (42.5%) | 9,434 (57.5%) |
| Total (Overall) | 56,779 (53.1%) | 50,090 (46.9%) |
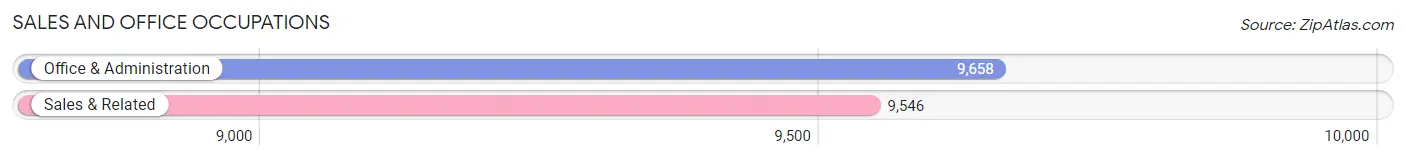
Sales and Office Occupations
The most common Sales and Office occupations in Huntsville are Office & Administration (9,658 | 9.0%), and Sales & Related (9,546 | 8.9%).
Sales and Office Occupations by Sex
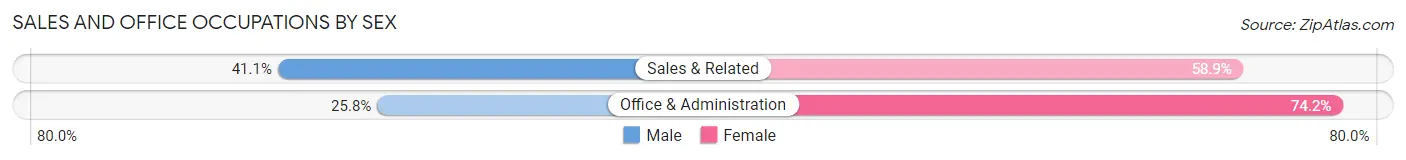
| Occupation | Male | Female |
| Sales & Related | 3,920 (41.1%) | 5,626 (58.9%) |
| Office & Administration | 2,488 (25.8%) | 7,170 (74.2%) |
| Total (Category) | 6,408 (33.4%) | 12,796 (66.6%) |
| Total (Overall) | 56,779 (53.1%) | 50,090 (46.9%) |
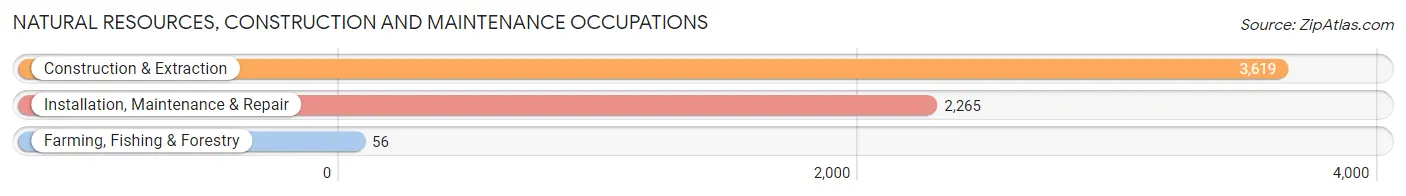
Natural Resources, Construction and Maintenance Occupations
The most common Natural Resources, Construction and Maintenance occupations in Huntsville are Construction & Extraction (3,619 | 3.4%), Installation, Maintenance & Repair (2,265 | 2.1%), and Farming, Fishing & Forestry (56 | 0.1%).
Natural Resources, Construction and Maintenance Occupations by Sex
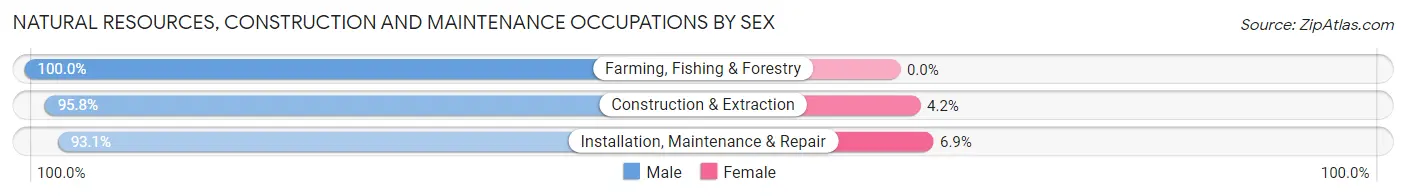
| Occupation | Male | Female |
| Farming, Fishing & Forestry | 56 (100.0%) | 0 (0.0%) |
| Construction & Extraction | 3,467 (95.8%) | 152 (4.2%) |
| Installation, Maintenance & Repair | 2,109 (93.1%) | 156 (6.9%) |
| Total (Category) | 5,632 (94.8%) | 308 (5.2%) |
| Total (Overall) | 56,779 (53.1%) | 50,090 (46.9%) |
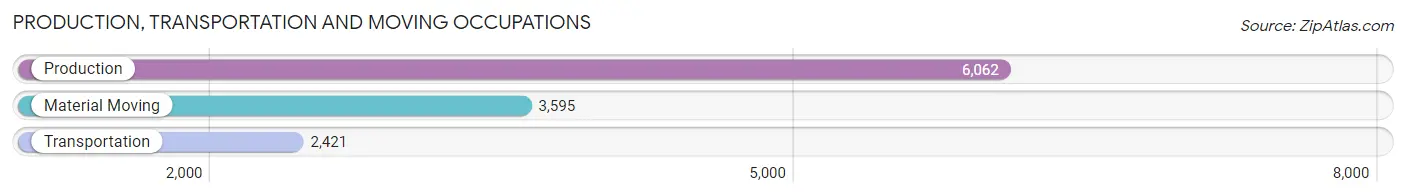
Production, Transportation and Moving Occupations
The most common Production, Transportation and Moving occupations in Huntsville are Production (6,062 | 5.7%), Material Moving (3,595 | 3.4%), and Transportation (2,421 | 2.3%).
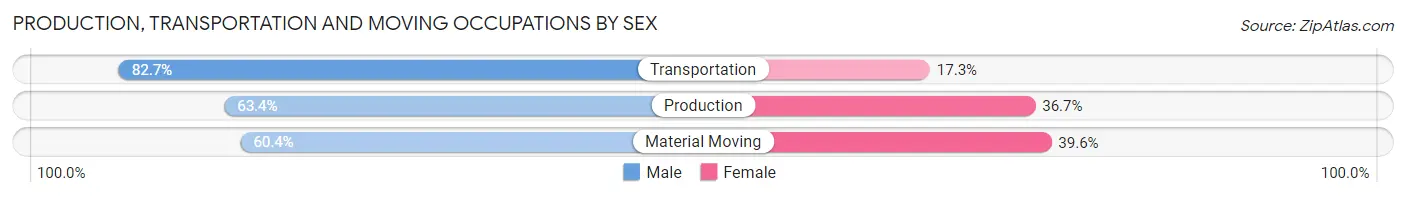
Production, Transportation and Moving Occupations by Sex
| Occupation | Male | Female |
| Production | 3,840 (63.3%) | 2,222 (36.6%) |
| Transportation | 2,002 (82.7%) | 419 (17.3%) |
| Material Moving | 2,171 (60.4%) | 1,424 (39.6%) |
| Total (Category) | 8,013 (66.3%) | 4,065 (33.7%) |
| Total (Overall) | 56,779 (53.1%) | 50,090 (46.9%) |
Employment Industries by Sex in Huntsville
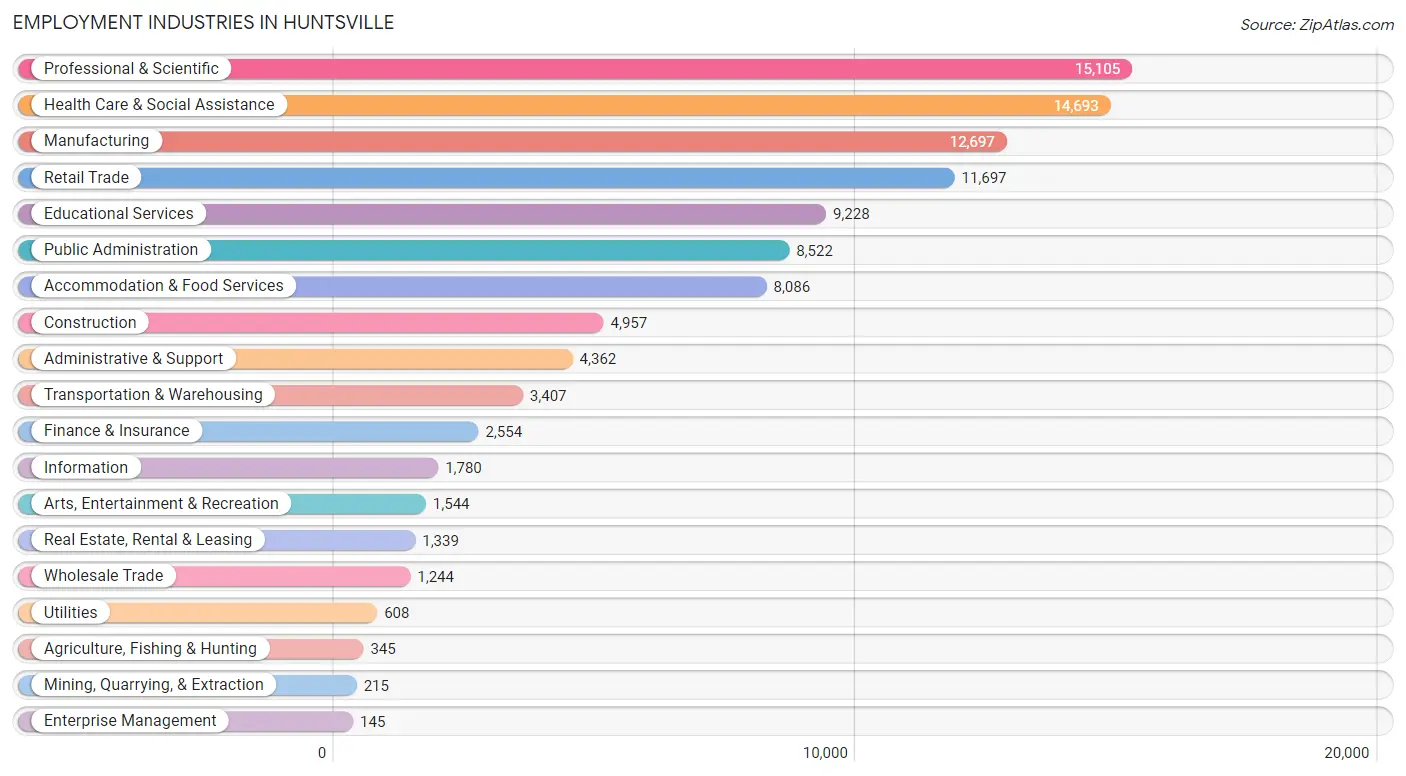
Employment Industries in Huntsville
The major employment industries in Huntsville include Professional & Scientific (15,105 | 14.1%), Health Care & Social Assistance (14,693 | 13.8%), Manufacturing (12,697 | 11.9%), Retail Trade (11,697 | 11.0%), and Educational Services (9,228 | 8.6%).
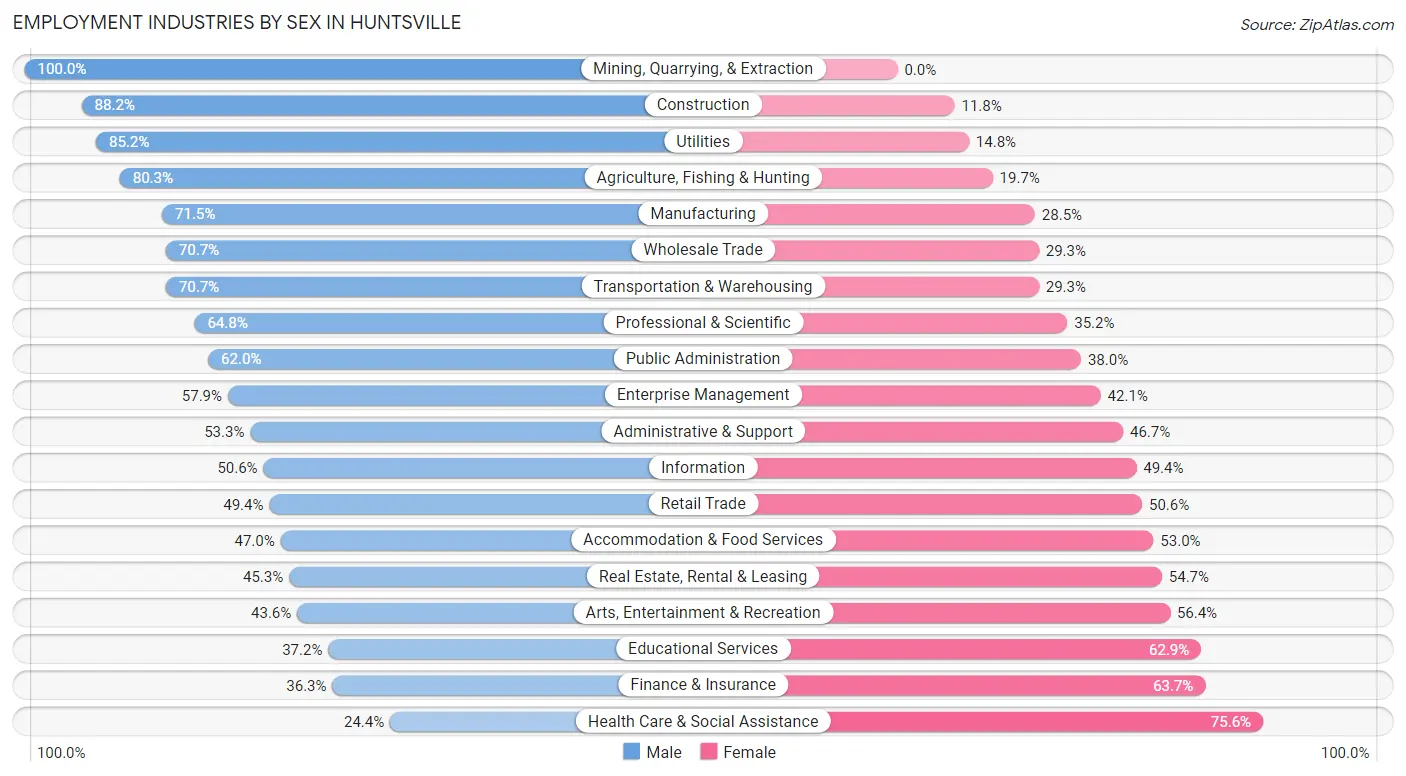
Employment Industries by Sex in Huntsville
The Huntsville industries that see more men than women are Mining, Quarrying, & Extraction (100.0%), Construction (88.2%), and Utilities (85.2%), whereas the industries that tend to have a higher number of women are Health Care & Social Assistance (75.6%), Finance & Insurance (63.7%), and Educational Services (62.8%).
| Industry | Male | Female |
| Agriculture, Fishing & Hunting | 277 (80.3%) | 68 (19.7%) |
| Mining, Quarrying, & Extraction | 215 (100.0%) | 0 (0.0%) |
| Construction | 4,371 (88.2%) | 586 (11.8%) |
| Manufacturing | 9,083 (71.5%) | 3,614 (28.5%) |
| Wholesale Trade | 880 (70.7%) | 364 (29.3%) |
| Retail Trade | 5,774 (49.4%) | 5,923 (50.6%) |
| Transportation & Warehousing | 2,410 (70.7%) | 997 (29.3%) |
| Utilities | 518 (85.2%) | 90 (14.8%) |
| Information | 900 (50.6%) | 880 (49.4%) |
| Finance & Insurance | 927 (36.3%) | 1,627 (63.7%) |
| Real Estate, Rental & Leasing | 606 (45.3%) | 733 (54.7%) |
| Professional & Scientific | 9,793 (64.8%) | 5,312 (35.2%) |
| Enterprise Management | 84 (57.9%) | 61 (42.1%) |
| Administrative & Support | 2,325 (53.3%) | 2,037 (46.7%) |
| Educational Services | 3,428 (37.1%) | 5,800 (62.8%) |
| Health Care & Social Assistance | 3,579 (24.4%) | 11,114 (75.6%) |
| Arts, Entertainment & Recreation | 673 (43.6%) | 871 (56.4%) |
| Accommodation & Food Services | 3,802 (47.0%) | 4,284 (53.0%) |
| Public Administration | 5,284 (62.0%) | 3,238 (38.0%) |
| Total | 56,779 (53.1%) | 50,090 (46.9%) |
Education in Huntsville
School Enrollment in Huntsville
The most common levels of schooling among the 54,864 students in Huntsville are college / undergraduate (18,794 | 34.3%), elementary school (8,642 | 15.8%), and middle school (8,394 | 15.3%).
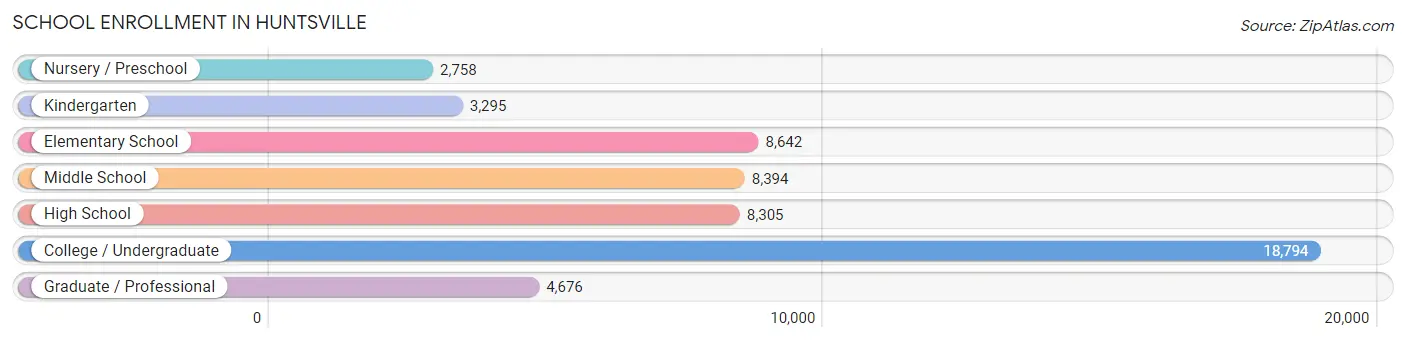
| School Level | # Students | % Students |
| Nursery / Preschool | 2,758 | 5.0% |
| Kindergarten | 3,295 | 6.0% |
| Elementary School | 8,642 | 15.8% |
| Middle School | 8,394 | 15.3% |
| High School | 8,305 | 15.1% |
| College / Undergraduate | 18,794 | 34.3% |
| Graduate / Professional | 4,676 | 8.5% |
| Total | 54,864 | 100.0% |
School Enrollment by Age by Funding Source in Huntsville
Out of a total of 54,864 students who are enrolled in schools in Huntsville, 10,314 (18.8%) attend a private institution, while the remaining 44,550 (81.2%) are enrolled in public schools. The age group of 3 to 4 year olds has the highest likelihood of being enrolled in private schools, with 847 (40.9% in the age bracket) enrolled. Conversely, the age group of 25 to 34 year olds has the lowest likelihood of being enrolled in a private school, with 3,774 (89.7% in the age bracket) attending a public institution.
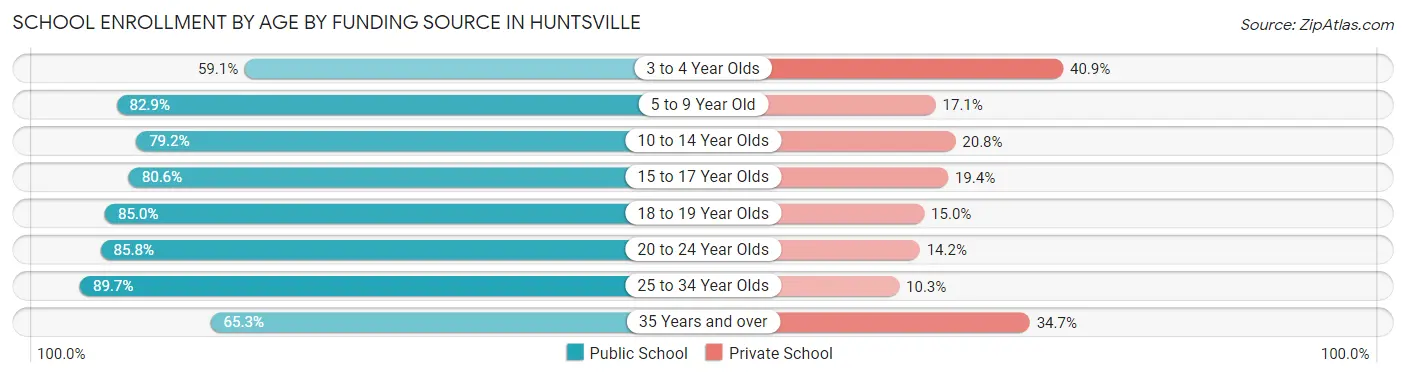
| Age Bracket | Public School | Private School |
| 3 to 4 Year Olds | 1,226 (59.1%) | 847 (40.9%) |
| 5 to 9 Year Old | 9,732 (82.9%) | 2,012 (17.1%) |
| 10 to 14 Year Olds | 8,278 (79.2%) | 2,174 (20.8%) |
| 15 to 17 Year Olds | 4,835 (80.6%) | 1,166 (19.4%) |
| 18 to 19 Year Olds | 5,346 (85.0%) | 943 (15.0%) |
| 20 to 24 Year Olds | 9,047 (85.8%) | 1,494 (14.2%) |
| 25 to 34 Year Olds | 3,774 (89.7%) | 435 (10.3%) |
| 35 Years and over | 2,323 (65.3%) | 1,232 (34.7%) |
| Total | 44,550 (81.2%) | 10,314 (18.8%) |
Educational Attainment by Field of Study in Huntsville
Business (14,943 | 20.8%), engineering (11,683 | 16.3%), education (6,878 | 9.6%), science & technology (5,980 | 8.4%), and computers & mathematics (4,698 | 6.6%) are the most common fields of study among 71,652 individuals in Huntsville who have obtained a bachelor's degree or higher.
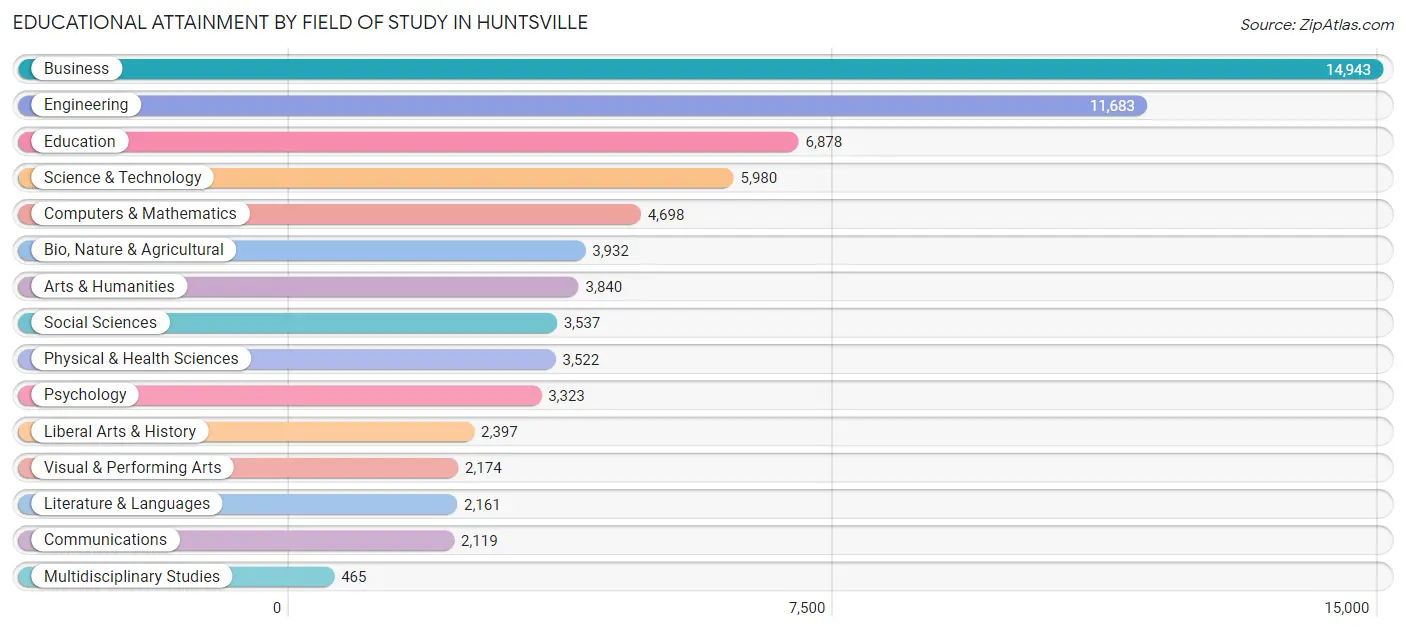
| Field of Study | # Graduates | % Graduates |
| Computers & Mathematics | 4,698 | 6.6% |
| Bio, Nature & Agricultural | 3,932 | 5.5% |
| Physical & Health Sciences | 3,522 | 4.9% |
| Psychology | 3,323 | 4.6% |
| Social Sciences | 3,537 | 4.9% |
| Engineering | 11,683 | 16.3% |
| Multidisciplinary Studies | 465 | 0.6% |
| Science & Technology | 5,980 | 8.4% |
| Business | 14,943 | 20.8% |
| Education | 6,878 | 9.6% |
| Literature & Languages | 2,161 | 3.0% |
| Liberal Arts & History | 2,397 | 3.4% |
| Visual & Performing Arts | 2,174 | 3.0% |
| Communications | 2,119 | 3.0% |
| Arts & Humanities | 3,840 | 5.4% |
| Total | 71,652 | 100.0% |
Transportation & Commute in Huntsville
Vehicle Availability by Sex in Huntsville
The most prevalent vehicle ownership categories in Huntsville are males with 2 vehicles (24,863, accounting for 44.4%) and females with 2 vehicles (18,877, making up 51.9%).
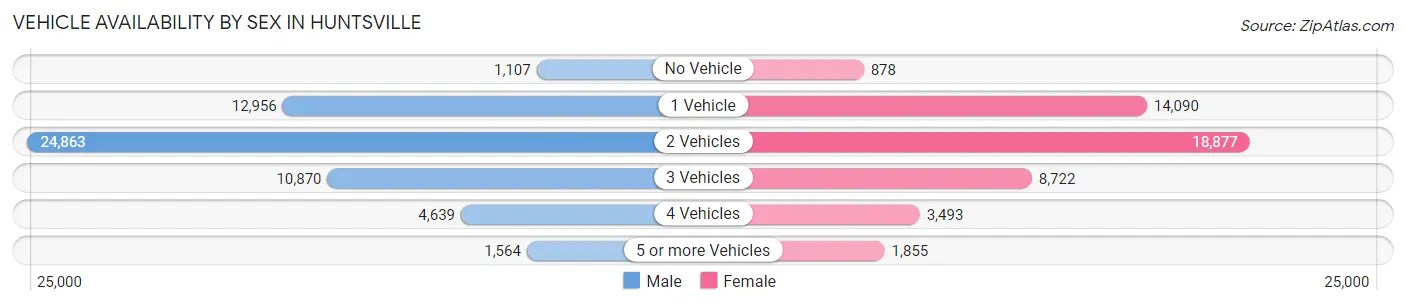
| Vehicles Available | Male | Female |
| No Vehicle | 1,107 (2.0%) | 878 (1.8%) |
| 1 Vehicle | 12,956 (23.1%) | 14,090 (29.4%) |
| 2 Vehicles | 24,863 (44.4%) | 18,877 (39.4%) |
| 3 Vehicles | 10,870 (19.4%) | 8,722 (18.2%) |
| 4 Vehicles | 4,639 (8.3%) | 3,493 (7.3%) |
| 5 or more Vehicles | 1,564 (2.8%) | 1,855 (3.9%) |
| Total | 55,999 (100.0%) | 47,915 (100.0%) |
Commute Time in Huntsville
The most frequently occuring commute durations in Huntsville are 15 to 19 minutes (21,848 commuters, 23.3%), 20 to 24 minutes (18,850 commuters, 20.1%), and 10 to 14 minutes (15,592 commuters, 16.6%).
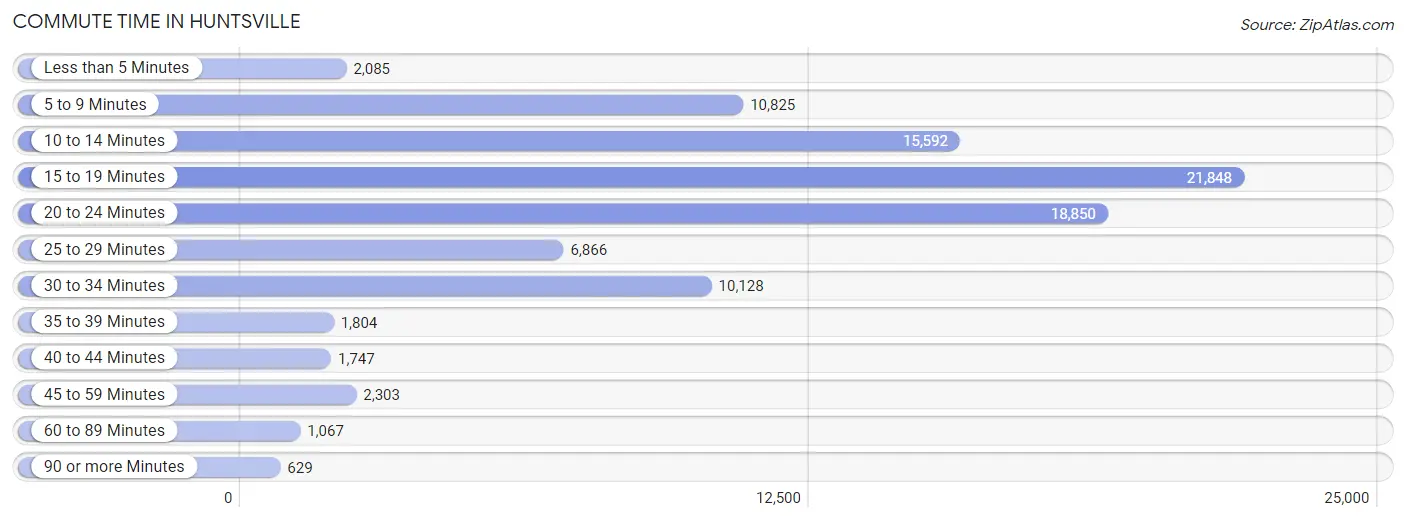
| Commute Time | # Commuters | % Commuters |
| Less than 5 Minutes | 2,085 | 2.2% |
| 5 to 9 Minutes | 10,825 | 11.6% |
| 10 to 14 Minutes | 15,592 | 16.6% |
| 15 to 19 Minutes | 21,848 | 23.3% |
| 20 to 24 Minutes | 18,850 | 20.1% |
| 25 to 29 Minutes | 6,866 | 7.3% |
| 30 to 34 Minutes | 10,128 | 10.8% |
| 35 to 39 Minutes | 1,804 | 1.9% |
| 40 to 44 Minutes | 1,747 | 1.9% |
| 45 to 59 Minutes | 2,303 | 2.5% |
| 60 to 89 Minutes | 1,067 | 1.1% |
| 90 or more Minutes | 629 | 0.7% |
Commute Time by Sex in Huntsville
The most common commute times in Huntsville are 15 to 19 minutes (11,711 commuters, 23.5%) for males and 15 to 19 minutes (10,137 commuters, 23.1%) for females.
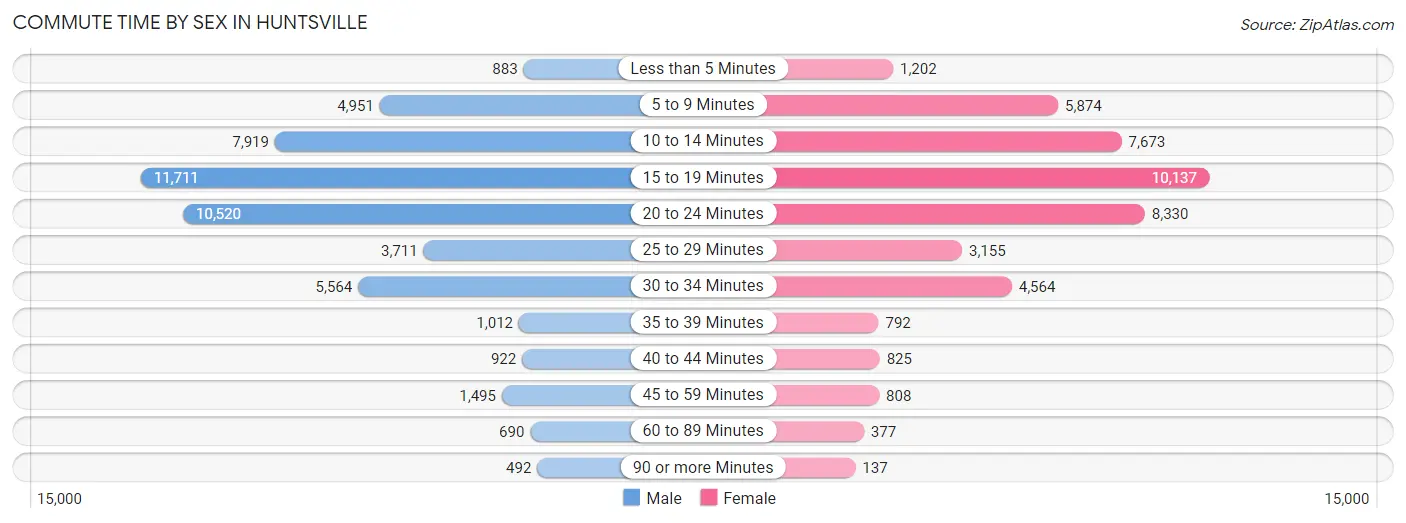
| Commute Time | Male | Female |
| Less than 5 Minutes | 883 (1.8%) | 1,202 (2.7%) |
| 5 to 9 Minutes | 4,951 (9.9%) | 5,874 (13.4%) |
| 10 to 14 Minutes | 7,919 (15.9%) | 7,673 (17.5%) |
| 15 to 19 Minutes | 11,711 (23.5%) | 10,137 (23.1%) |
| 20 to 24 Minutes | 10,520 (21.1%) | 8,330 (19.0%) |
| 25 to 29 Minutes | 3,711 (7.4%) | 3,155 (7.2%) |
| 30 to 34 Minutes | 5,564 (11.2%) | 4,564 (10.4%) |
| 35 to 39 Minutes | 1,012 (2.0%) | 792 (1.8%) |
| 40 to 44 Minutes | 922 (1.8%) | 825 (1.9%) |
| 45 to 59 Minutes | 1,495 (3.0%) | 808 (1.8%) |
| 60 to 89 Minutes | 690 (1.4%) | 377 (0.9%) |
| 90 or more Minutes | 492 (1.0%) | 137 (0.3%) |
Time of Departure to Work by Sex in Huntsville
The most frequent times of departure to work in Huntsville are 7:00 AM to 7:29 AM (8,762, 17.6%) for males and 7:30 AM to 7:59 AM (7,399, 16.9%) for females.
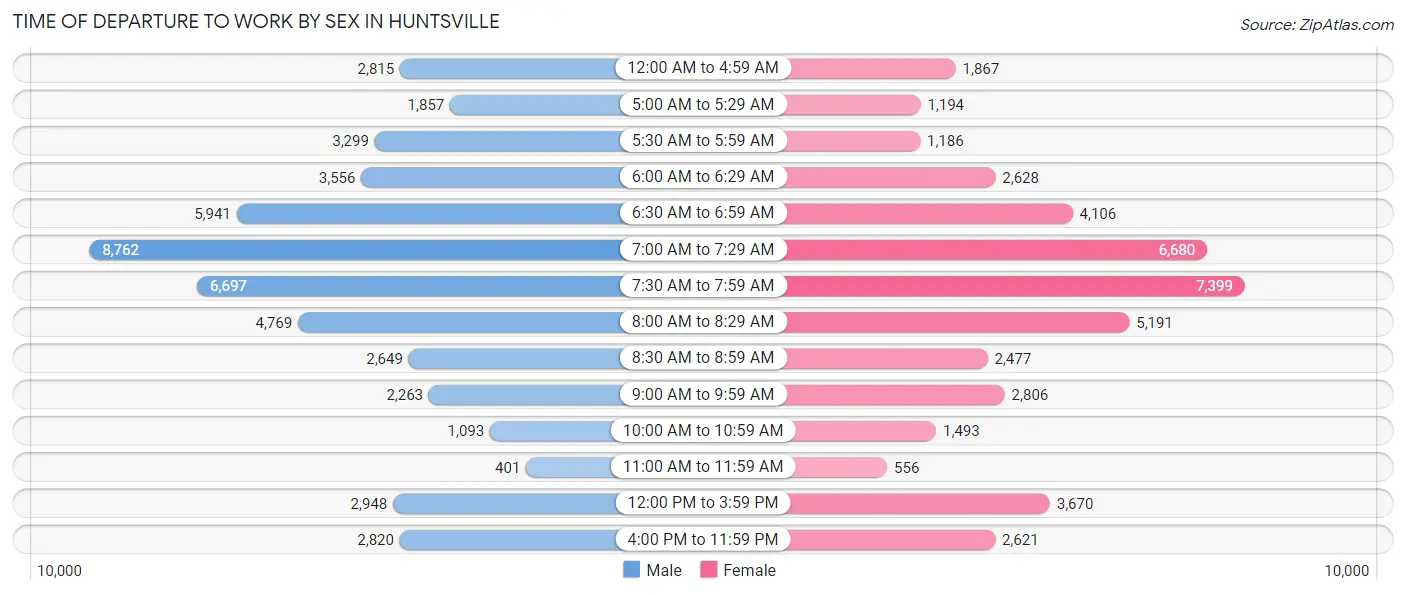
| Time of Departure | Male | Female |
| 12:00 AM to 4:59 AM | 2,815 (5.6%) | 1,867 (4.3%) |
| 5:00 AM to 5:29 AM | 1,857 (3.7%) | 1,194 (2.7%) |
| 5:30 AM to 5:59 AM | 3,299 (6.6%) | 1,186 (2.7%) |
| 6:00 AM to 6:29 AM | 3,556 (7.1%) | 2,628 (6.0%) |
| 6:30 AM to 6:59 AM | 5,941 (11.9%) | 4,106 (9.4%) |
| 7:00 AM to 7:29 AM | 8,762 (17.6%) | 6,680 (15.2%) |
| 7:30 AM to 7:59 AM | 6,697 (13.4%) | 7,399 (16.9%) |
| 8:00 AM to 8:29 AM | 4,769 (9.6%) | 5,191 (11.8%) |
| 8:30 AM to 8:59 AM | 2,649 (5.3%) | 2,477 (5.7%) |
| 9:00 AM to 9:59 AM | 2,263 (4.5%) | 2,806 (6.4%) |
| 10:00 AM to 10:59 AM | 1,093 (2.2%) | 1,493 (3.4%) |
| 11:00 AM to 11:59 AM | 401 (0.8%) | 556 (1.3%) |
| 12:00 PM to 3:59 PM | 2,948 (5.9%) | 3,670 (8.4%) |
| 4:00 PM to 11:59 PM | 2,820 (5.7%) | 2,621 (6.0%) |
| Total | 49,870 (100.0%) | 43,874 (100.0%) |
Housing Occupancy in Huntsville
Occupancy by Ownership in Huntsville
Of the total 92,291 dwellings in Huntsville, owner-occupied units account for 53,060 (57.5%), while renter-occupied units make up 39,231 (42.5%).
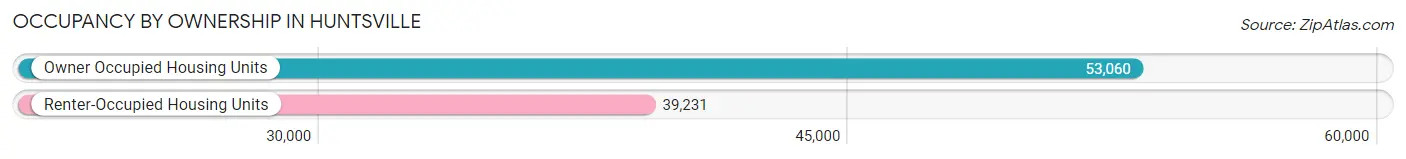
| Occupancy | # Housing Units | % Housing Units |
| Owner Occupied Housing Units | 53,060 | 57.5% |
| Renter-Occupied Housing Units | 39,231 | 42.5% |
| Total Occupied Housing Units | 92,291 | 100.0% |
Occupancy by Household Size in Huntsville
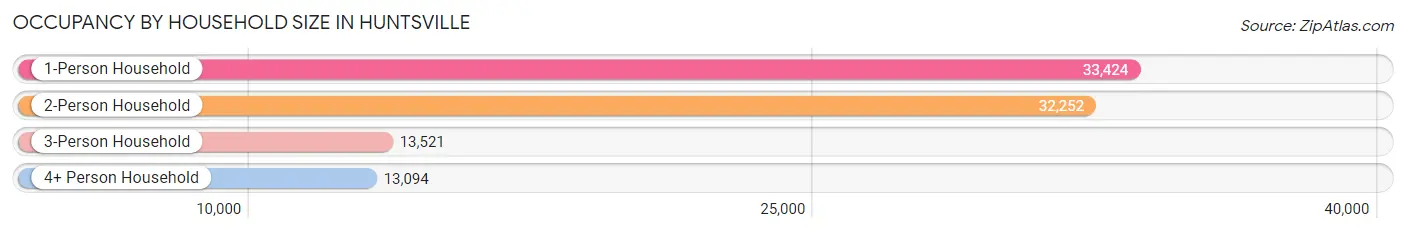
| Household Size | # Housing Units | % Housing Units |
| 1-Person Household | 33,424 | 36.2% |
| 2-Person Household | 32,252 | 34.9% |
| 3-Person Household | 13,521 | 14.6% |
| 4+ Person Household | 13,094 | 14.2% |
| Total Housing Units | 92,291 | 100.0% |
Occupancy by Ownership by Household Size in Huntsville
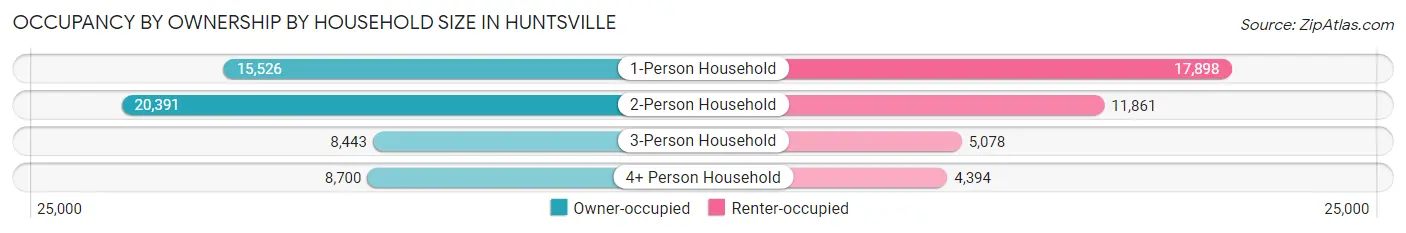
| Household Size | Owner-occupied | Renter-occupied |
| 1-Person Household | 15,526 (46.5%) | 17,898 (53.5%) |
| 2-Person Household | 20,391 (63.2%) | 11,861 (36.8%) |
| 3-Person Household | 8,443 (62.4%) | 5,078 (37.6%) |
| 4+ Person Household | 8,700 (66.4%) | 4,394 (33.6%) |
| Total Housing Units | 53,060 (57.5%) | 39,231 (42.5%) |
Occupancy by Educational Attainment in Huntsville
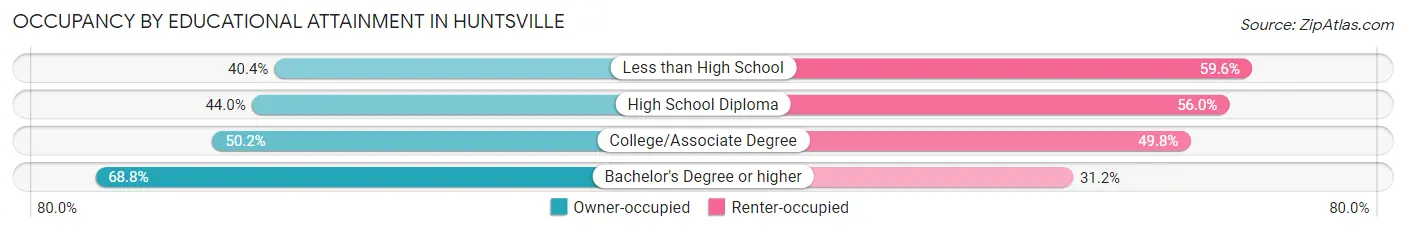
| Household Size | Owner-occupied | Renter-occupied |
| Less than High School | 2,597 (40.4%) | 3,828 (59.6%) |
| High School Diploma | 6,422 (44.0%) | 8,171 (56.0%) |
| College/Associate Degree | 13,465 (50.2%) | 13,360 (49.8%) |
| Bachelor's Degree or higher | 30,576 (68.8%) | 13,872 (31.2%) |
Occupancy by Age of Householder in Huntsville
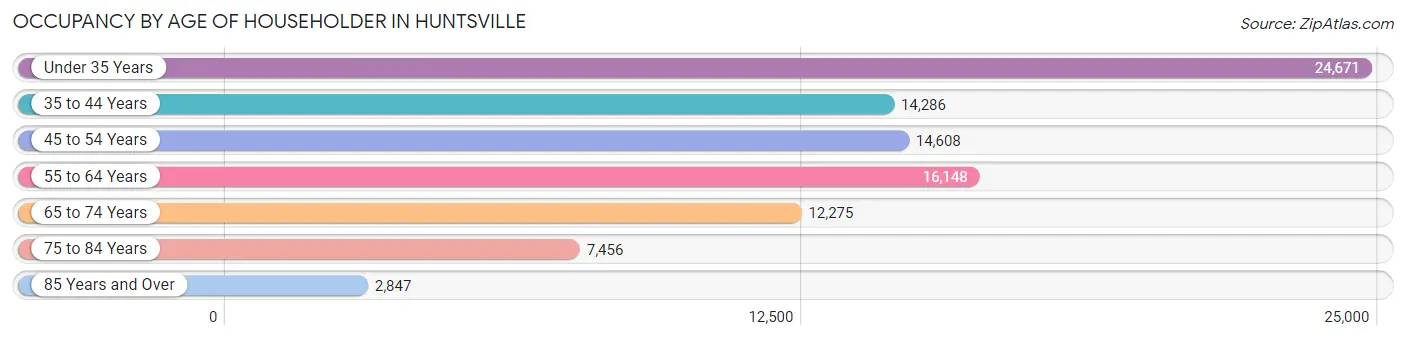
| Age Bracket | # Households | % Households |
| Under 35 Years | 24,671 | 26.7% |
| 35 to 44 Years | 14,286 | 15.5% |
| 45 to 54 Years | 14,608 | 15.8% |
| 55 to 64 Years | 16,148 | 17.5% |
| 65 to 74 Years | 12,275 | 13.3% |
| 75 to 84 Years | 7,456 | 8.1% |
| 85 Years and Over | 2,847 | 3.1% |
| Total | 92,291 | 100.0% |
Housing Finances in Huntsville
Median Income by Occupancy in Huntsville
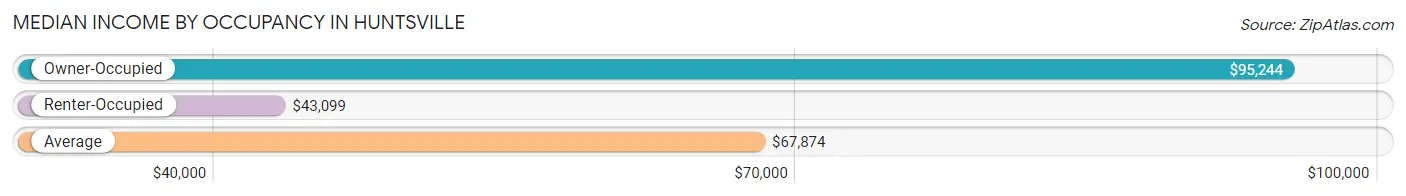
| Occupancy Type | # Households | Median Income |
| Owner-Occupied | 53,060 (57.5%) | $95,244 |
| Renter-Occupied | 39,231 (42.5%) | $43,099 |
| Average | 92,291 (100.0%) | $67,874 |
Occupancy by Householder Income Bracket in Huntsville
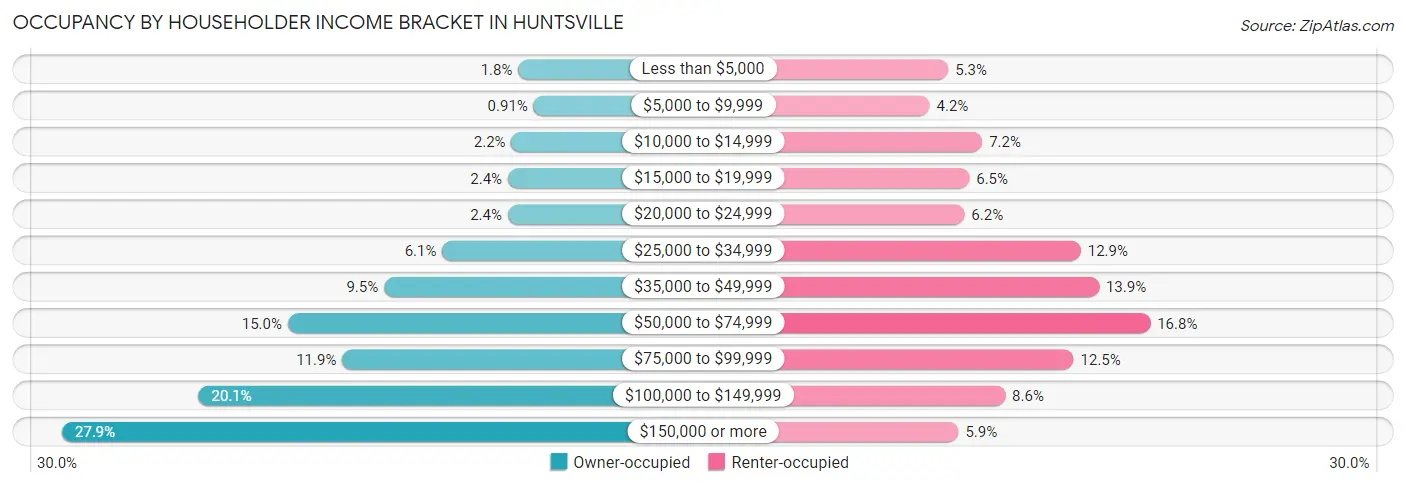
| Income Bracket | Owner-occupied | Renter-occupied |
| Less than $5,000 | 948 (1.8%) | 2,080 (5.3%) |
| $5,000 to $9,999 | 482 (0.9%) | 1,660 (4.2%) |
| $10,000 to $14,999 | 1,159 (2.2%) | 2,839 (7.2%) |
| $15,000 to $19,999 | 1,262 (2.4%) | 2,550 (6.5%) |
| $20,000 to $24,999 | 1,270 (2.4%) | 2,441 (6.2%) |
| $25,000 to $34,999 | 3,255 (6.1%) | 5,049 (12.9%) |
| $35,000 to $49,999 | 5,018 (9.5%) | 5,457 (13.9%) |
| $50,000 to $74,999 | 7,938 (15.0%) | 6,606 (16.8%) |
| $75,000 to $99,999 | 6,289 (11.8%) | 4,888 (12.5%) |
| $100,000 to $149,999 | 10,649 (20.1%) | 3,354 (8.6%) |
| $150,000 or more | 14,790 (27.9%) | 2,307 (5.9%) |
| Total | 53,060 (100.0%) | 39,231 (100.0%) |
Monthly Housing Cost Tiers in Huntsville
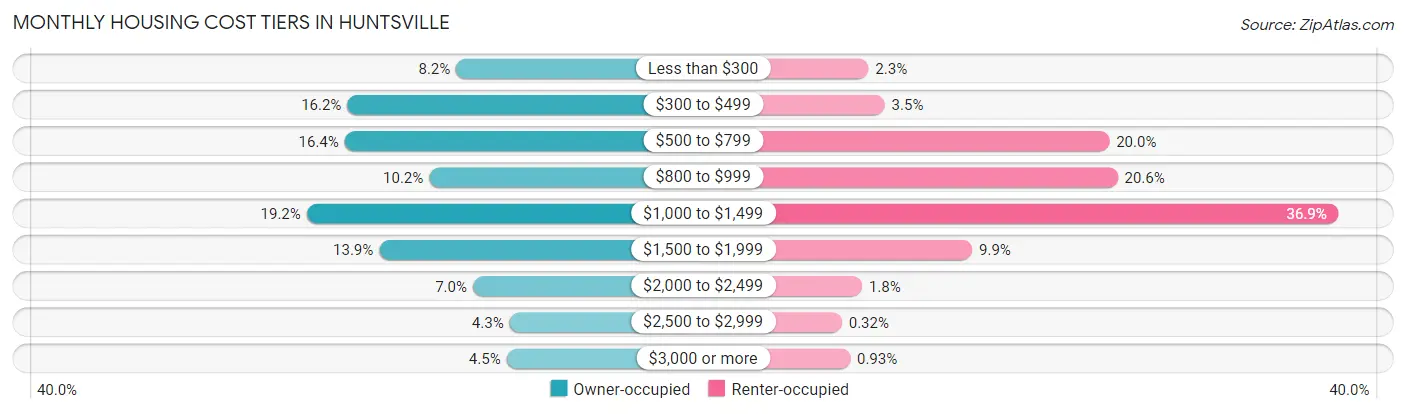
| Monthly Cost | Owner-occupied | Renter-occupied |
| Less than $300 | 4,360 (8.2%) | 895 (2.3%) |
| $300 to $499 | 8,618 (16.2%) | 1,367 (3.5%) |
| $500 to $799 | 8,719 (16.4%) | 7,855 (20.0%) |
| $800 to $999 | 5,416 (10.2%) | 8,093 (20.6%) |
| $1,000 to $1,499 | 10,201 (19.2%) | 14,480 (36.9%) |
| $1,500 to $1,999 | 7,368 (13.9%) | 3,892 (9.9%) |
| $2,000 to $2,499 | 3,708 (7.0%) | 711 (1.8%) |
| $2,500 to $2,999 | 2,278 (4.3%) | 125 (0.3%) |
| $3,000 or more | 2,392 (4.5%) | 363 (0.9%) |
| Total | 53,060 (100.0%) | 39,231 (100.0%) |
Physical Housing Characteristics in Huntsville
Housing Structures in Huntsville
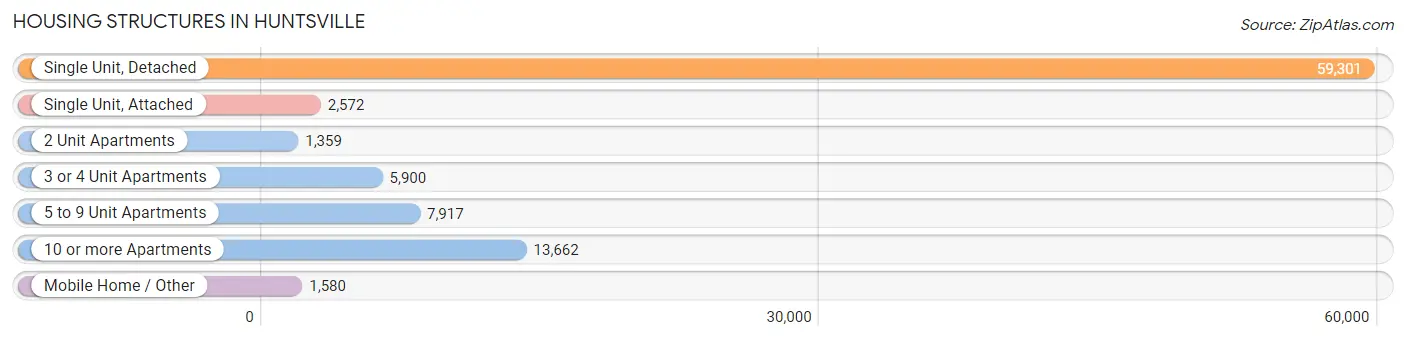
| Structure Type | # Housing Units | % Housing Units |
| Single Unit, Detached | 59,301 | 64.2% |
| Single Unit, Attached | 2,572 | 2.8% |
| 2 Unit Apartments | 1,359 | 1.5% |
| 3 or 4 Unit Apartments | 5,900 | 6.4% |
| 5 to 9 Unit Apartments | 7,917 | 8.6% |
| 10 or more Apartments | 13,662 | 14.8% |
| Mobile Home / Other | 1,580 | 1.7% |
| Total | 92,291 | 100.0% |
Housing Structures by Occupancy in Huntsville
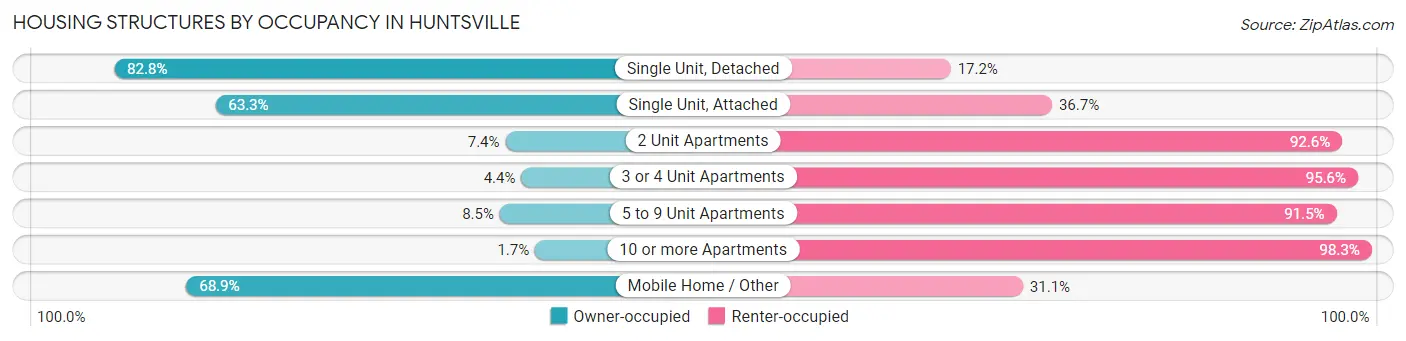
| Structure Type | Owner-occupied | Renter-occupied |
| Single Unit, Detached | 49,077 (82.8%) | 10,224 (17.2%) |
| Single Unit, Attached | 1,627 (63.3%) | 945 (36.7%) |
| 2 Unit Apartments | 101 (7.4%) | 1,258 (92.6%) |
| 3 or 4 Unit Apartments | 258 (4.4%) | 5,642 (95.6%) |
| 5 to 9 Unit Apartments | 674 (8.5%) | 7,243 (91.5%) |
| 10 or more Apartments | 235 (1.7%) | 13,427 (98.3%) |
| Mobile Home / Other | 1,088 (68.9%) | 492 (31.1%) |
| Total | 53,060 (57.5%) | 39,231 (42.5%) |
Housing Structures by Number of Rooms in Huntsville
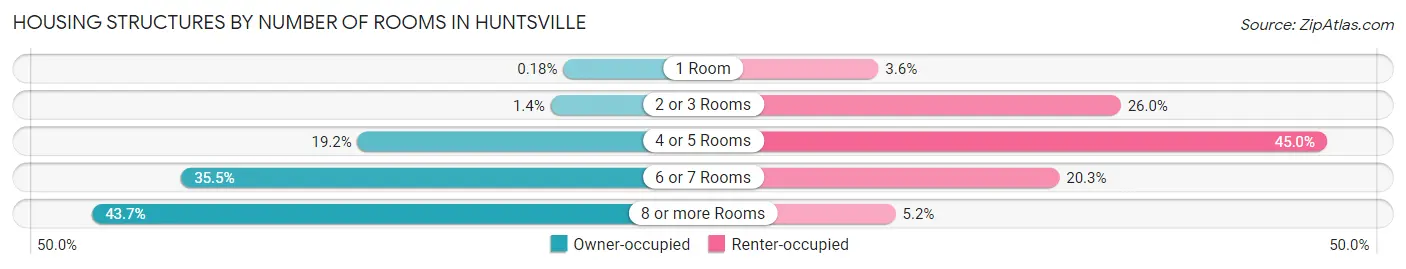
| Number of Rooms | Owner-occupied | Renter-occupied |
| 1 Room | 96 (0.2%) | 1,398 (3.6%) |
| 2 or 3 Rooms | 720 (1.4%) | 10,189 (26.0%) |
| 4 or 5 Rooms | 10,194 (19.2%) | 17,664 (45.0%) |
| 6 or 7 Rooms | 18,841 (35.5%) | 7,960 (20.3%) |
| 8 or more Rooms | 23,209 (43.7%) | 2,020 (5.1%) |
| Total | 53,060 (100.0%) | 39,231 (100.0%) |
Housing Structure by Heating Type in Huntsville
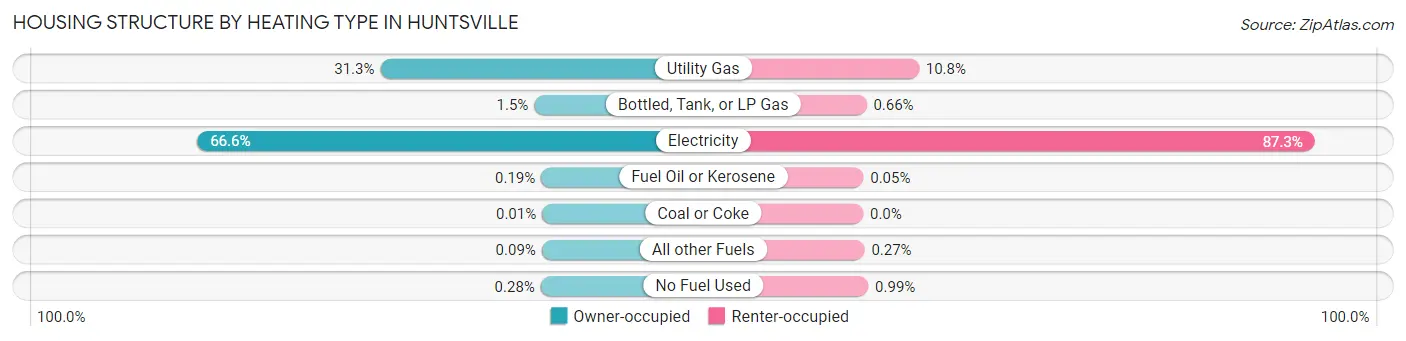
| Heating Type | Owner-occupied | Renter-occupied |
| Utility Gas | 16,592 (31.3%) | 4,226 (10.8%) |
| Bottled, Tank, or LP Gas | 813 (1.5%) | 258 (0.7%) |
| Electricity | 35,355 (66.6%) | 34,235 (87.3%) |
| Fuel Oil or Kerosene | 99 (0.2%) | 18 (0.1%) |
| Coal or Coke | 3 (0.0%) | 0 (0.0%) |
| All other Fuels | 49 (0.1%) | 107 (0.3%) |
| No Fuel Used | 149 (0.3%) | 387 (1.0%) |
| Total | 53,060 (100.0%) | 39,231 (100.0%) |
Household Vehicle Usage in Huntsville
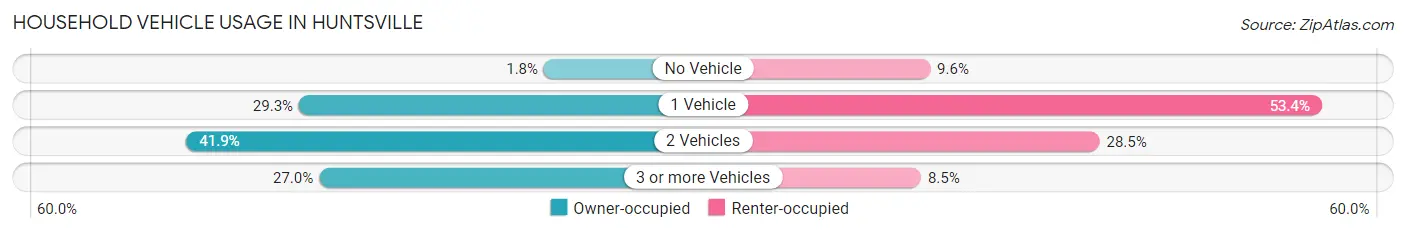
| Vehicles per Household | Owner-occupied | Renter-occupied |
| No Vehicle | 973 (1.8%) | 3,748 (9.6%) |
| 1 Vehicle | 15,531 (29.3%) | 20,954 (53.4%) |
| 2 Vehicles | 22,217 (41.9%) | 11,187 (28.5%) |
| 3 or more Vehicles | 14,339 (27.0%) | 3,342 (8.5%) |
| Total | 53,060 (100.0%) | 39,231 (100.0%) |
Real Estate & Mortgages in Huntsville
Real Estate and Mortgage Overview in Huntsville
| Characteristic | Without Mortgage | With Mortgage |
| Housing Units | 20,731 | 32,329 |
| Median Property Value | $213,100 | $249,200 |
| Median Household Income | $73,557 | $9,962 |
| Monthly Housing Costs | $438 | $2,379 |
| Real Estate Taxes | $1,121 | $2,655 |
Property Value by Mortgage Status in Huntsville
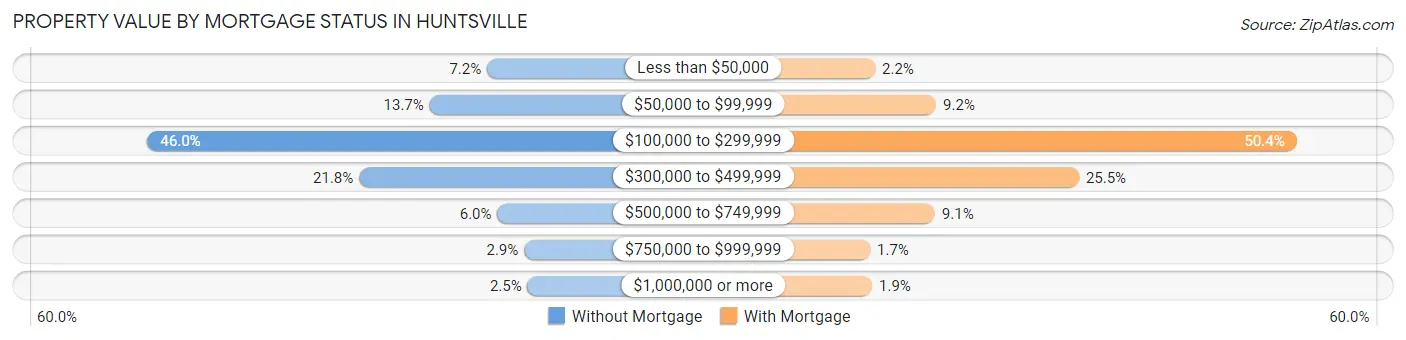
| Property Value | Without Mortgage | With Mortgage |
| Less than $50,000 | 1,482 (7.1%) | 720 (2.2%) |
| $50,000 to $99,999 | 2,843 (13.7%) | 2,979 (9.2%) |
| $100,000 to $299,999 | 9,529 (46.0%) | 16,296 (50.4%) |
| $300,000 to $499,999 | 4,513 (21.8%) | 8,252 (25.5%) |
| $500,000 to $749,999 | 1,238 (6.0%) | 2,932 (9.1%) |
| $750,000 to $999,999 | 604 (2.9%) | 538 (1.7%) |
| $1,000,000 or more | 522 (2.5%) | 612 (1.9%) |
| Total | 20,731 (100.0%) | 32,329 (100.0%) |
Household Income by Mortgage Status in Huntsville
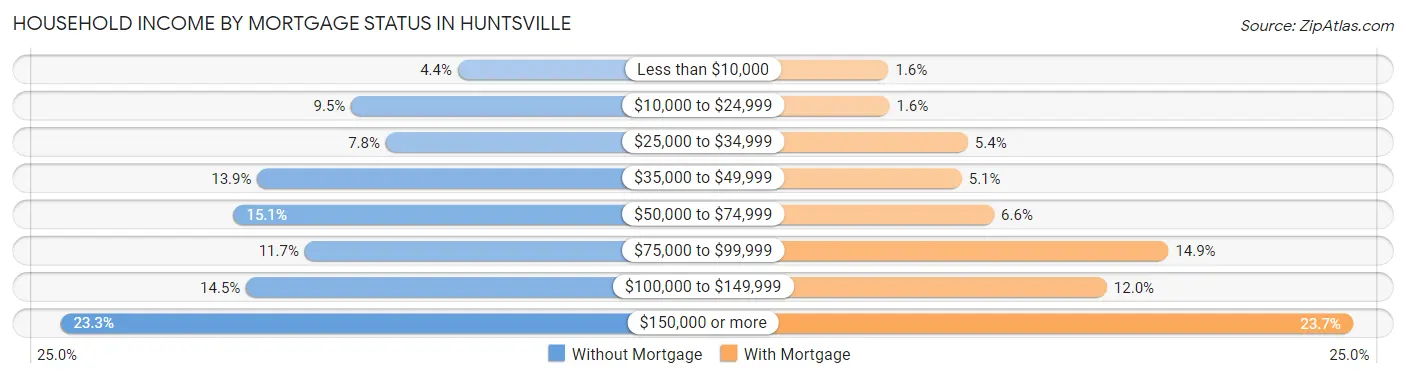
| Household Income | Without Mortgage | With Mortgage |
| Less than $10,000 | 906 (4.4%) | 506 (1.6%) |
| $10,000 to $24,999 | 1,960 (9.5%) | 524 (1.6%) |
| $25,000 to $34,999 | 1,618 (7.8%) | 1,731 (5.3%) |
| $35,000 to $49,999 | 2,885 (13.9%) | 1,637 (5.1%) |
| $50,000 to $74,999 | 3,120 (15.0%) | 2,133 (6.6%) |
| $75,000 to $99,999 | 2,418 (11.7%) | 4,818 (14.9%) |
| $100,000 to $149,999 | 2,996 (14.4%) | 3,871 (12.0%) |
| $150,000 or more | 4,828 (23.3%) | 7,653 (23.7%) |
| Total | 20,731 (100.0%) | 32,329 (100.0%) |
Property Value to Household Income Ratio in Huntsville
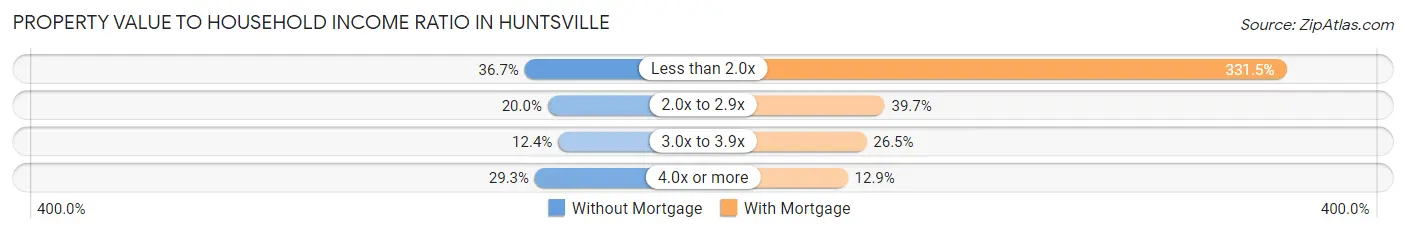
| Value-to-Income Ratio | Without Mortgage | With Mortgage |
| Less than 2.0x | 7,617 (36.7%) | 107,155 (331.4%) |
| 2.0x to 2.9x | 4,141 (20.0%) | 12,831 (39.7%) |
| 3.0x to 3.9x | 2,570 (12.4%) | 8,556 (26.5%) |
| 4.0x or more | 6,082 (29.3%) | 4,157 (12.9%) |
| Total | 20,731 (100.0%) | 32,329 (100.0%) |
Real Estate Taxes by Mortgage Status in Huntsville
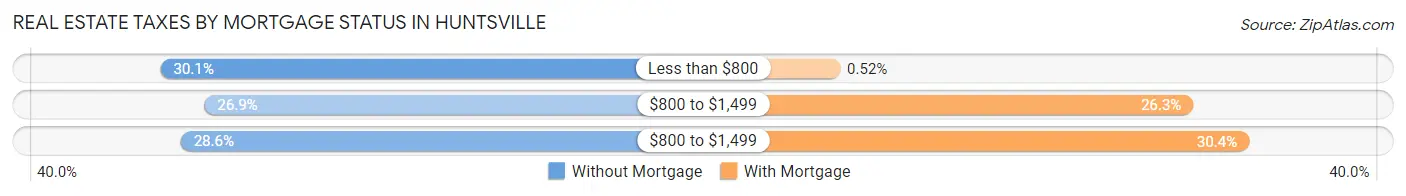
| Property Taxes | Without Mortgage | With Mortgage |
| Less than $800 | 6,233 (30.1%) | 167 (0.5%) |
| $800 to $1,499 | 5,568 (26.9%) | 8,506 (26.3%) |
| $800 to $1,499 | 5,926 (28.6%) | 9,824 (30.4%) |
| Total | 20,731 (100.0%) | 32,329 (100.0%) |
Health & Disability in Huntsville
Health Insurance Coverage by Age in Huntsville
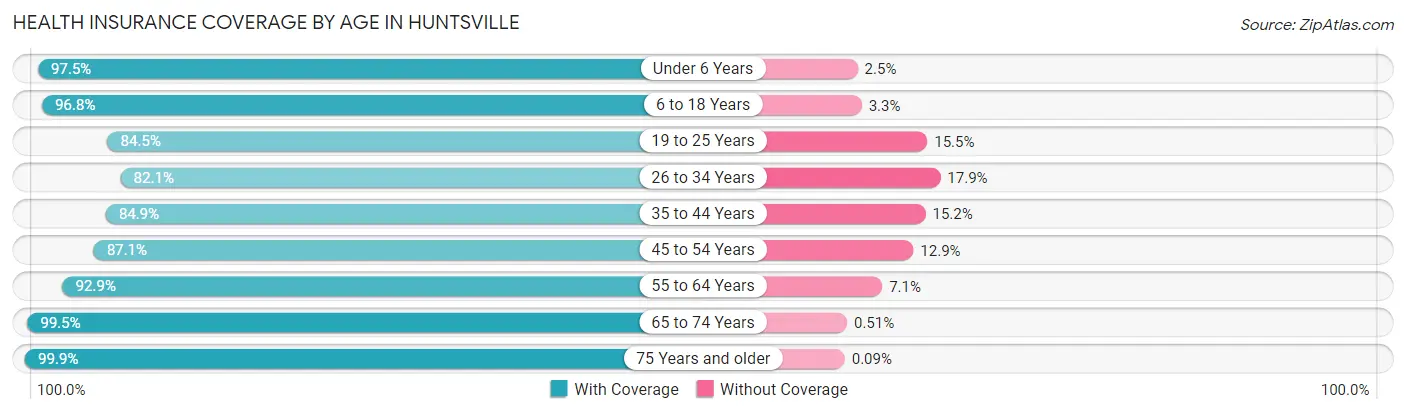
| Age Bracket | With Coverage | Without Coverage |
| Under 6 Years | 14,461 (97.5%) | 369 (2.5%) |
| 6 to 18 Years | 29,351 (96.8%) | 985 (3.3%) |
| 19 to 25 Years | 23,324 (84.5%) | 4,273 (15.5%) |
| 26 to 34 Years | 23,440 (82.1%) | 5,117 (17.9%) |
| 35 to 44 Years | 21,213 (84.9%) | 3,787 (15.1%) |
| 45 to 54 Years | 20,592 (87.1%) | 3,047 (12.9%) |
| 55 to 64 Years | 24,858 (92.9%) | 1,891 (7.1%) |
| 65 to 74 Years | 18,883 (99.5%) | 97 (0.5%) |
| 75 Years and older | 14,875 (99.9%) | 14 (0.1%) |
| Total | 190,997 (90.7%) | 19,580 (9.3%) |
Health Insurance Coverage by Citizenship Status in Huntsville
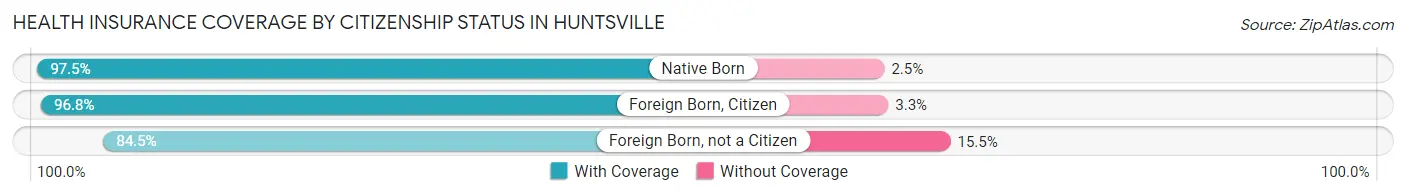
| Citizenship Status | With Coverage | Without Coverage |
| Native Born | 14,461 (97.5%) | 369 (2.5%) |
| Foreign Born, Citizen | 29,351 (96.8%) | 985 (3.3%) |
| Foreign Born, not a Citizen | 23,324 (84.5%) | 4,273 (15.5%) |
Health Insurance Coverage by Household Income in Huntsville
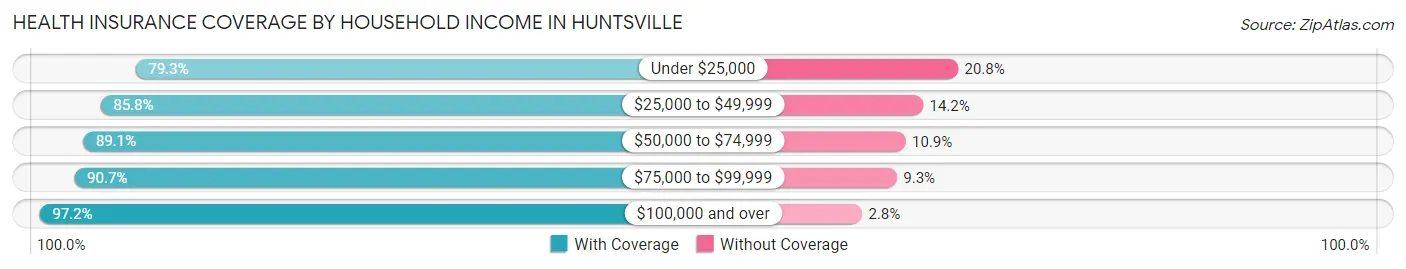
| Household Income | With Coverage | Without Coverage |
| Under $25,000 | 21,870 (79.2%) | 5,726 (20.7%) |
| $25,000 to $49,999 | 31,322 (85.8%) | 5,178 (14.2%) |
| $50,000 to $74,999 | 28,136 (89.1%) | 3,447 (10.9%) |
| $75,000 to $99,999 | 22,714 (90.7%) | 2,326 (9.3%) |
| $100,000 and over | 80,932 (97.2%) | 2,297 (2.8%) |
Public vs Private Health Insurance Coverage by Age in Huntsville
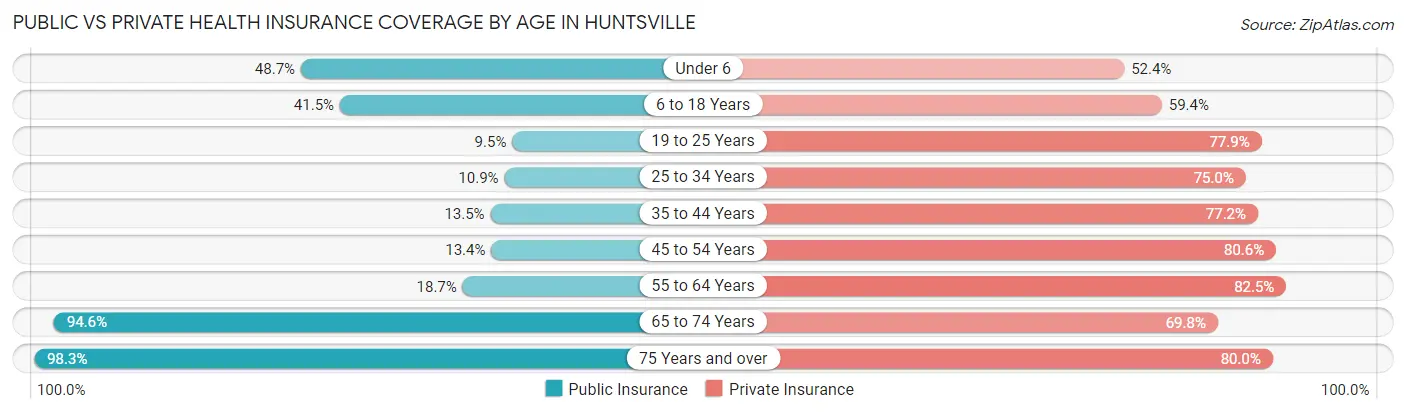
| Age Bracket | Public Insurance | Private Insurance |
| Under 6 | 7,224 (48.7%) | 7,774 (52.4%) |
| 6 to 18 Years | 12,581 (41.5%) | 18,019 (59.4%) |
| 19 to 25 Years | 2,620 (9.5%) | 21,500 (77.9%) |
| 25 to 34 Years | 3,123 (10.9%) | 21,409 (75.0%) |
| 35 to 44 Years | 3,383 (13.5%) | 19,305 (77.2%) |
| 45 to 54 Years | 3,162 (13.4%) | 19,052 (80.6%) |
| 55 to 64 Years | 5,003 (18.7%) | 22,063 (82.5%) |
| 65 to 74 Years | 17,950 (94.6%) | 13,243 (69.8%) |
| 75 Years and over | 14,628 (98.3%) | 11,908 (80.0%) |
| Total | 69,674 (33.1%) | 154,273 (73.3%) |
Disability Status by Sex by Age in Huntsville
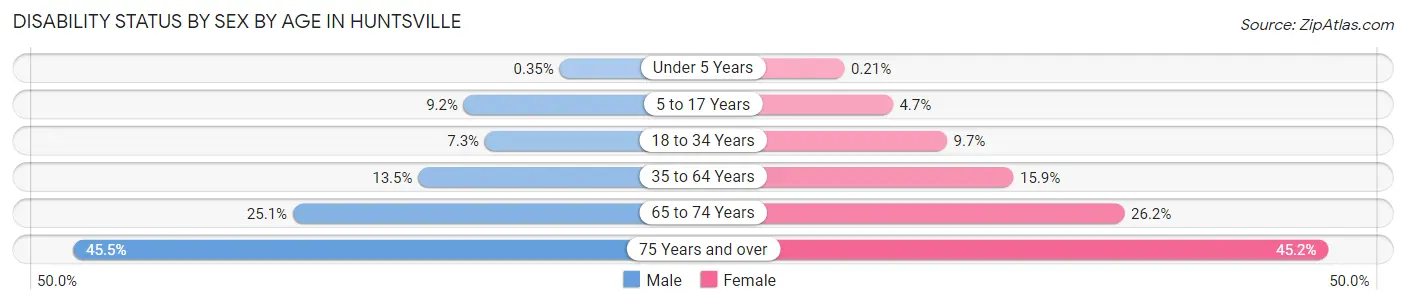
| Age Bracket | Male | Female |
| Under 5 Years | 22 (0.4%) | 12 (0.2%) |
| 5 to 17 Years | 1,379 (9.2%) | 687 (4.7%) |
| 18 to 34 Years | 2,116 (7.3%) | 2,982 (9.7%) |
| 35 to 64 Years | 4,989 (13.5%) | 6,093 (15.9%) |
| 65 to 74 Years | 2,172 (25.1%) | 2,705 (26.2%) |
| 75 Years and over | 2,676 (45.5%) | 4,067 (45.2%) |
Disability Class by Sex by Age in Huntsville
Disability Class: Hearing Difficulty
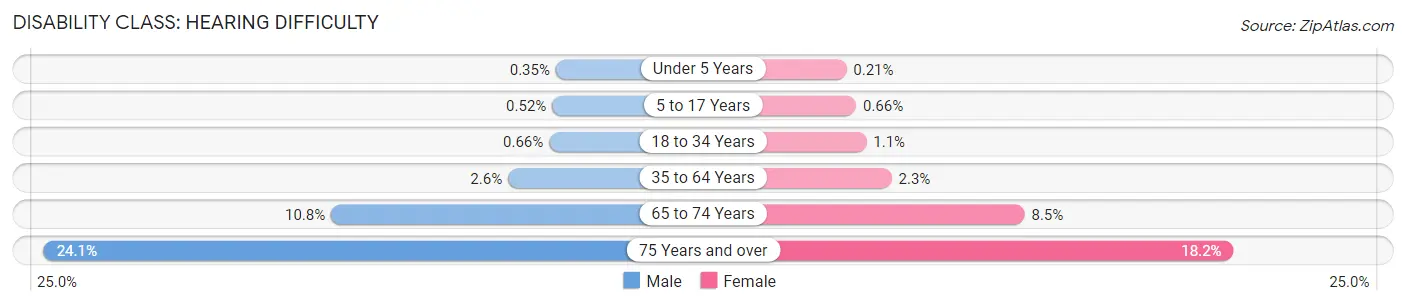
| Age Bracket | Male | Female |
| Under 5 Years | 22 (0.4%) | 12 (0.2%) |
| 5 to 17 Years | 78 (0.5%) | 96 (0.7%) |
| 18 to 34 Years | 191 (0.7%) | 348 (1.1%) |
| 35 to 64 Years | 951 (2.6%) | 887 (2.3%) |
| 65 to 74 Years | 933 (10.8%) | 876 (8.5%) |
| 75 Years and over | 1,418 (24.1%) | 1,637 (18.2%) |
Disability Class: Vision Difficulty
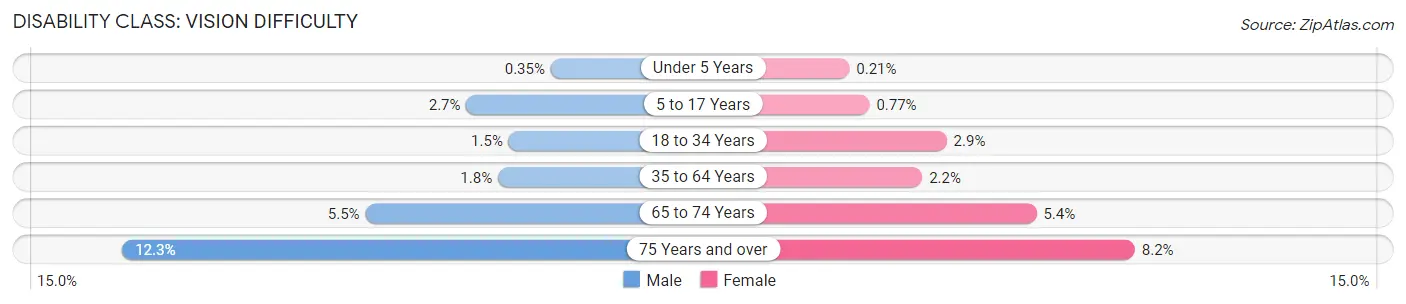
| Age Bracket | Male | Female |
| Under 5 Years | 22 (0.4%) | 12 (0.2%) |
| 5 to 17 Years | 403 (2.7%) | 112 (0.8%) |
| 18 to 34 Years | 441 (1.5%) | 894 (2.9%) |
| 35 to 64 Years | 673 (1.8%) | 859 (2.2%) |
| 65 to 74 Years | 477 (5.5%) | 560 (5.4%) |
| 75 Years and over | 722 (12.3%) | 735 (8.2%) |
Disability Class: Cognitive Difficulty
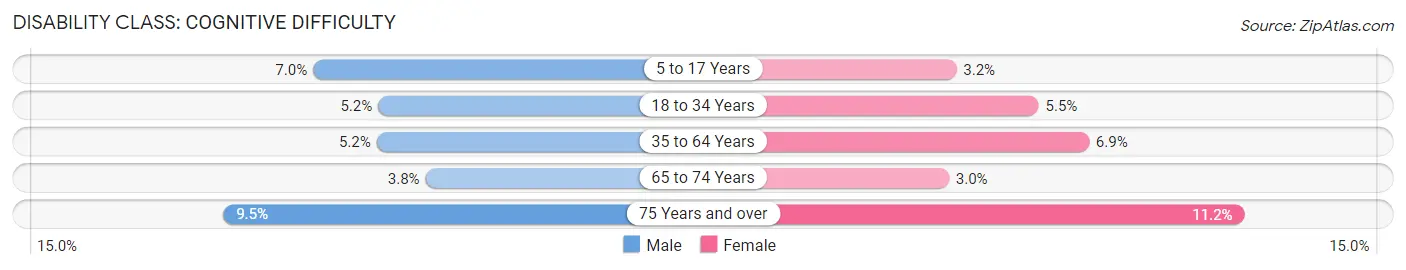
| Age Bracket | Male | Female |
| 5 to 17 Years | 1,041 (7.0%) | 466 (3.2%) |
| 18 to 34 Years | 1,500 (5.2%) | 1,680 (5.5%) |
| 35 to 64 Years | 1,926 (5.2%) | 2,637 (6.9%) |
| 65 to 74 Years | 332 (3.8%) | 308 (3.0%) |
| 75 Years and over | 557 (9.5%) | 1,010 (11.2%) |
Disability Class: Ambulatory Difficulty
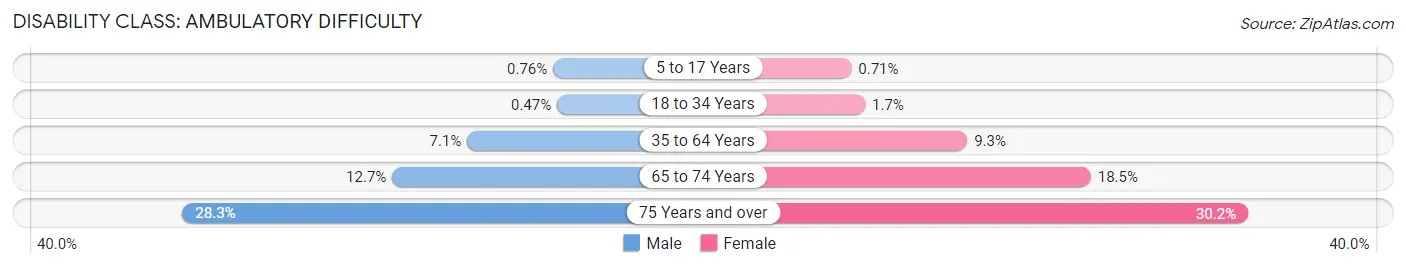
| Age Bracket | Male | Female |
| 5 to 17 Years | 114 (0.8%) | 104 (0.7%) |
| 18 to 34 Years | 136 (0.5%) | 531 (1.7%) |
| 35 to 64 Years | 2,646 (7.1%) | 3,567 (9.3%) |
| 65 to 74 Years | 1,100 (12.7%) | 1,909 (18.5%) |
| 75 Years and over | 1,663 (28.3%) | 2,717 (30.2%) |
Disability Class: Self-Care Difficulty
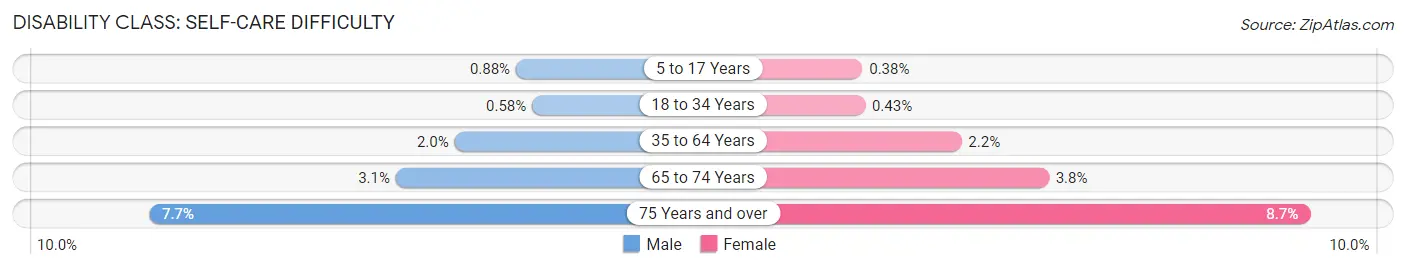
| Age Bracket | Male | Female |
| 5 to 17 Years | 131 (0.9%) | 56 (0.4%) |
| 18 to 34 Years | 169 (0.6%) | 131 (0.4%) |
| 35 to 64 Years | 749 (2.0%) | 850 (2.2%) |
| 65 to 74 Years | 269 (3.1%) | 397 (3.8%) |
| 75 Years and over | 452 (7.7%) | 783 (8.7%) |
Technology Access in Huntsville
Computing Device Access in Huntsville
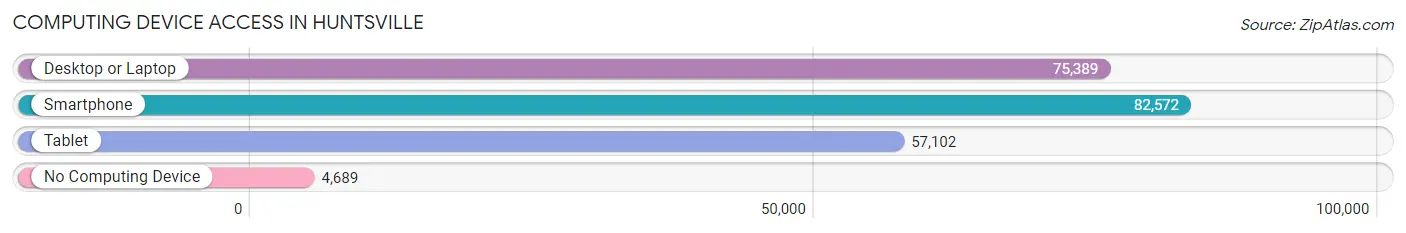
| Device Type | # Households | % Households |
| Desktop or Laptop | 75,389 | 81.7% |
| Smartphone | 82,572 | 89.5% |
| Tablet | 57,102 | 61.9% |
| No Computing Device | 4,689 | 5.1% |
| Total | 92,291 | 100.0% |
Internet Access in Huntsville
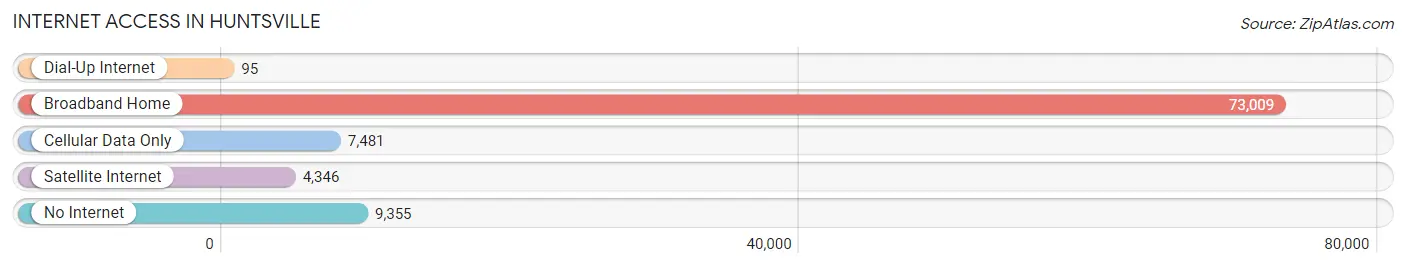
| Internet Type | # Households | % Households |
| Dial-Up Internet | 95 | 0.1% |
| Broadband Home | 73,009 | 79.1% |
| Cellular Data Only | 7,481 | 8.1% |
| Satellite Internet | 4,346 | 4.7% |
| No Internet | 9,355 | 10.1% |
| Total | 92,291 | 100.0% |
Huntsville Summary
Huntsville, Alabama is a city located in Madison County in the northern part of the state. It is the county seat and the largest city in the county. The city is located in the Tennessee Valley and is situated in the foothills of the Appalachian Mountains. The city is home to the U.S. Space and Rocket Center, the Marshall Space Flight Center, and the Redstone Arsenal.
History
The area that is now Huntsville was first settled in 1805 by John Hunt, a settler from Virginia. He established a trading post and a ferry service across the Tennessee River. The city was officially incorporated in 1811 and was named after Hunt. During the Civil War, Huntsville was a major Confederate supply center and was the site of several battles. After the war, the city experienced a period of growth and development. In the late 19th century, Huntsville became a major industrial center, with the establishment of several cotton mills and other industries.
Geography
Huntsville is located in the northern part of Alabama, in Madison County. It is situated in the foothills of the Appalachian Mountains and is part of the Tennessee Valley. The city is located at the intersection of Interstate 65 and U.S. Highway 72. The city covers an area of approximately 150 square miles and has an elevation of 645 feet. The city is located near the Tennessee River and is surrounded by several lakes, including Lake Guntersville, Lake Wheeler, and Lake Guntersville State Park.
Economy
Huntsville is a major economic center in the region. The city is home to several major employers, including the U.S. Space and Rocket Center, the Marshall Space Flight Center, and the Redstone Arsenal. The city is also home to several technology companies, including Intergraph, Teledyne Brown Engineering, and Dynetics. The city is also home to several universities, including the University of Alabama in Huntsville, Alabama A&M University, and Oakwood University.
Demographics
As of the 2010 census, the population of Huntsville was 180,105. The city has a population density of 1,093 people per square mile. The racial makeup of the city is 73.3% White, 19.3% African American, 0.4% Native American, 2.7% Asian, 0.1% Pacific Islander, 1.7% from other races, and 2.5% from two or more races. The median household income in the city is $50,867 and the median family income is $63,837. The per capita income in the city is $27,837.
Huntsville is a diverse and vibrant city with a rich history and a strong economy. The city is home to several major employers and universities, and is a major economic center in the region. The city has a diverse population and is a great place to live, work, and play.
Common Questions
What is Per Capita Income in Huntsville?
Per Capita income in Huntsville is $43,202.
What is the Median Family Income in Huntsville?
Median Family Income in Huntsville is $90,775.
What is the Median Household income in Huntsville?
Median Household Income in Huntsville is $67,874.
What is Income or Wage Gap in Huntsville?
Income or Wage Gap in Huntsville is 41.6%.
Women in Huntsville earn 58.4 cents for every dollar earned by a man.
What is Family Income Deficit in Huntsville?
Family Income Deficit in Huntsville is $10,345.
Families that are below poverty line in Huntsville earn $10,345 less on average than the poverty threshold level.
What is Inequality or Gini Index in Huntsville?
Inequality or Gini Index in Huntsville is 0.49.
What is the Total Population of Huntsville?
Total Population of Huntsville is 215,025.
What is the Total Male Population of Huntsville?
Total Male Population of Huntsville is 105,273.
What is the Total Female Population of Huntsville?
Total Female Population of Huntsville is 109,752.
What is the Ratio of Males per 100 Females in Huntsville?
There are 95.92 Males per 100 Females in Huntsville.
What is the Ratio of Females per 100 Males in Huntsville?
There are 104.25 Females per 100 Males in Huntsville.
What is the Median Population Age in Huntsville?
Median Population Age in Huntsville is 36.5 Years.
What is the Average Family Size in Huntsville
Average Family Size in Huntsville is 2.9 People.
What is the Average Household Size in Huntsville
Average Household Size in Huntsville is 2.2 People.
How Large is the Labor Force in Huntsville?
There are 112,525 People in the Labor Forcein in Huntsville.
What is the Percentage of People in the Labor Force in Huntsville?
63.4% of People are in the Labor Force in Huntsville.
What is the Unemployment Rate in Huntsville?
Unemployment Rate in Huntsville is 4.6%.