Cities with the Largest Black / African American Community in Maryland
RELATED REPORTS & OPTIONS
Black / African American
Maryland
Compare Cities
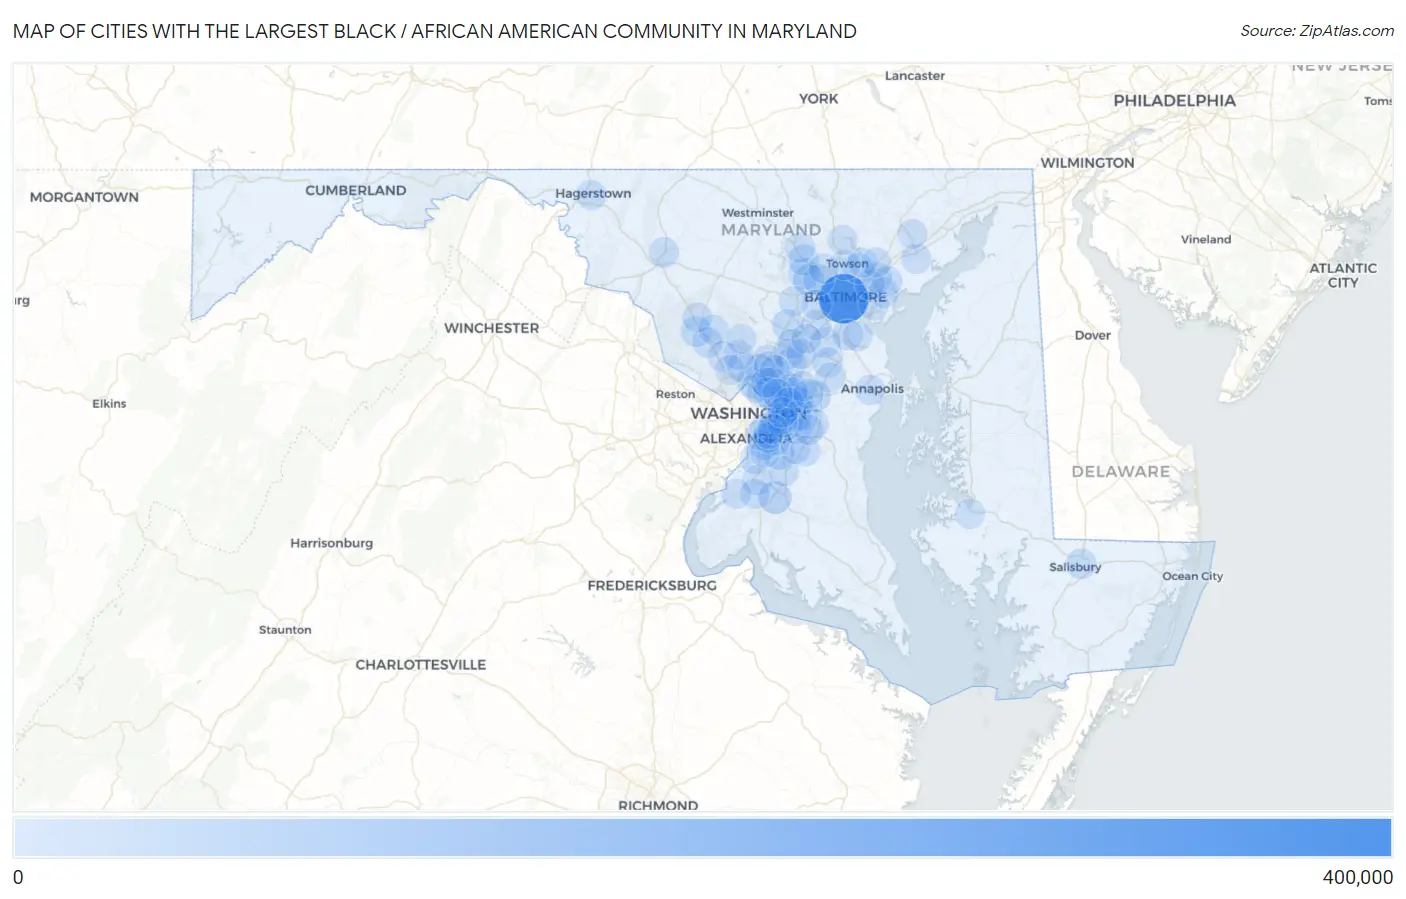
Map of Cities with the Largest Black / African American Community in Maryland
0
400,000
Cities with the Largest Black / African American Community in Maryland
| City | Black / African American | vs State | vs National | |
| 1. | Baltimore | 358,028 | 1,841,926(19.44%)#1 | 41,288,572(0.87%)#7 |
| 2. | Waldorf | 51,052 | 1,841,926(2.77%)#2 | 41,288,572(0.12%)#93 |
| 3. | Bowie | 33,095 | 1,841,926(1.80%)#3 | 41,288,572(0.08%)#140 |
| 4. | Clinton | 31,180 | 1,841,926(1.69%)#4 | 41,288,572(0.08%)#151 |
| 5. | Columbia | 30,057 | 1,841,926(1.63%)#5 | 41,288,572(0.07%)#158 |
| 6. | Randallstown | 28,614 | 1,841,926(1.55%)#6 | 41,288,572(0.07%)#170 |
| 7. | Milford Mill | 25,609 | 1,841,926(1.39%)#7 | 41,288,572(0.06%)#194 |
| 8. | Silver Spring | 24,320 | 1,841,926(1.32%)#8 | 41,288,572(0.06%)#209 |
| 9. | Suitland | 23,120 | 1,841,926(1.26%)#9 | 41,288,572(0.06%)#224 |
| 10. | Germantown | 22,730 | 1,841,926(1.23%)#10 | 41,288,572(0.06%)#231 |
| 11. | Woodlawn Cdp Baltimore County | 21,799 | 1,841,926(1.18%)#11 | 41,288,572(0.05%)#241 |
| 12. | Owings Mills | 21,588 | 1,841,926(1.17%)#12 | 41,288,572(0.05%)#243 |
| 13. | Lochearn | 20,514 | 1,841,926(1.11%)#13 | 41,288,572(0.05%)#253 |
| 14. | Severn | 19,326 | 1,841,926(1.05%)#14 | 41,288,572(0.05%)#268 |
| 15. | Camp Springs | 18,909 | 1,841,926(1.03%)#15 | 41,288,572(0.05%)#274 |
| 16. | Glen Burnie | 18,359 | 1,841,926(1.00%)#16 | 41,288,572(0.04%)#283 |
| 17. | South Laurel | 18,038 | 1,841,926(0.98%)#17 | 41,288,572(0.04%)#290 |
| 18. | Landover | 16,753 | 1,841,926(0.91%)#18 | 41,288,572(0.04%)#314 |
| 19. | Fort Washington | 15,852 | 1,841,926(0.86%)#19 | 41,288,572(0.04%)#332 |
| 20. | Fairland | 15,766 | 1,841,926(0.86%)#20 | 41,288,572(0.04%)#335 |
| 21. | Chillum | 15,513 | 1,841,926(0.84%)#21 | 41,288,572(0.04%)#339 |
| 22. | Laurel | 15,205 | 1,841,926(0.83%)#22 | 41,288,572(0.04%)#346 |
| 23. | Hillcrest Heights | 14,324 | 1,841,926(0.78%)#23 | 41,288,572(0.03%)#366 |
| 24. | Summerfield | 14,070 | 1,841,926(0.76%)#24 | 41,288,572(0.03%)#375 |
| 25. | Frederick | 13,589 | 1,841,926(0.74%)#25 | 41,288,572(0.03%)#387 |
| 26. | Salisbury | 13,310 | 1,841,926(0.72%)#26 | 41,288,572(0.03%)#398 |
| 27. | Oxon Hill | 13,072 | 1,841,926(0.71%)#27 | 41,288,572(0.03%)#412 |
| 28. | Lake Arbor | 13,057 | 1,841,926(0.71%)#28 | 41,288,572(0.03%)#414 |
| 29. | Essex | 13,024 | 1,841,926(0.71%)#29 | 41,288,572(0.03%)#416 |
| 30. | Glassmanor | 12,262 | 1,841,926(0.67%)#30 | 41,288,572(0.03%)#441 |
| 31. | Kettering | 12,089 | 1,841,926(0.66%)#31 | 41,288,572(0.03%)#447 |
| 32. | Edgewood | 11,791 | 1,841,926(0.64%)#32 | 41,288,572(0.03%)#467 |
| 33. | Greenbelt | 11,613 | 1,841,926(0.63%)#33 | 41,288,572(0.03%)#472 |
| 34. | Seabrook | 11,567 | 1,841,926(0.63%)#34 | 41,288,572(0.03%)#475 |
| 35. | Parkville | 11,217 | 1,841,926(0.61%)#35 | 41,288,572(0.03%)#486 |
| 36. | Gaithersburg | 11,208 | 1,841,926(0.61%)#36 | 41,288,572(0.03%)#487 |
| 37. | Dundalk | 11,172 | 1,841,926(0.61%)#37 | 41,288,572(0.03%)#489 |
| 38. | Brock Hall | 11,046 | 1,841,926(0.60%)#38 | 41,288,572(0.03%)#494 |
| 39. | Reisterstown | 10,933 | 1,841,926(0.59%)#39 | 41,288,572(0.03%)#503 |
| 40. | Odenton | 10,814 | 1,841,926(0.59%)#40 | 41,288,572(0.03%)#512 |
| 41. | Mitchellville | 10,541 | 1,841,926(0.57%)#41 | 41,288,572(0.03%)#522 |
| 42. | Wheaton | 10,328 | 1,841,926(0.56%)#42 | 41,288,572(0.03%)#534 |
| 43. | Largo | 10,234 | 1,841,926(0.56%)#43 | 41,288,572(0.02%)#539 |
| 44. | White Oak | 9,840 | 1,841,926(0.53%)#44 | 41,288,572(0.02%)#562 |
| 45. | Rosaryville | 9,833 | 1,841,926(0.53%)#45 | 41,288,572(0.02%)#563 |
| 46. | Towson | 9,352 | 1,841,926(0.51%)#46 | 41,288,572(0.02%)#596 |
| 47. | Annapolis | 9,336 | 1,841,926(0.51%)#47 | 41,288,572(0.02%)#599 |
| 48. | Aspen Hill | 9,326 | 1,841,926(0.51%)#48 | 41,288,572(0.02%)#602 |
| 49. | Hagerstown | 9,192 | 1,841,926(0.50%)#49 | 41,288,572(0.02%)#612 |
| 50. | North Laurel | 9,188 | 1,841,926(0.50%)#50 | 41,288,572(0.02%)#613 |
| 51. | Middle River | 9,005 | 1,841,926(0.49%)#51 | 41,288,572(0.02%)#626 |
| 52. | New Carrollton | 8,851 | 1,841,926(0.48%)#52 | 41,288,572(0.02%)#635 |
| 53. | Forestville | 8,832 | 1,841,926(0.48%)#53 | 41,288,572(0.02%)#637 |
| 54. | Westphalia | 8,763 | 1,841,926(0.48%)#54 | 41,288,572(0.02%)#641 |
| 55. | Walker Mill | 8,742 | 1,841,926(0.47%)#55 | 41,288,572(0.02%)#643 |
| 56. | Marlton | 8,400 | 1,841,926(0.46%)#56 | 41,288,572(0.02%)#673 |
| 57. | Maryland City | 8,337 | 1,841,926(0.45%)#57 | 41,288,572(0.02%)#679 |
| 58. | Elkridge | 8,325 | 1,841,926(0.45%)#58 | 41,288,572(0.02%)#680 |
| 59. | Accokeek | 8,324 | 1,841,926(0.45%)#59 | 41,288,572(0.02%)#681 |
| 60. | Rosedale | 8,288 | 1,841,926(0.45%)#60 | 41,288,572(0.02%)#683 |
| 61. | Glenn Dale | 8,137 | 1,841,926(0.44%)#61 | 41,288,572(0.02%)#691 |
| 62. | Montgomery Village | 8,094 | 1,841,926(0.44%)#62 | 41,288,572(0.02%)#694 |
| 63. | Catonsville | 8,075 | 1,841,926(0.44%)#63 | 41,288,572(0.02%)#695 |
| 64. | Coral Hills | 8,016 | 1,841,926(0.44%)#64 | 41,288,572(0.02%)#705 |
| 65. | Bensville | 7,957 | 1,841,926(0.43%)#65 | 41,288,572(0.02%)#708 |
| 66. | Brandywine | 7,933 | 1,841,926(0.43%)#66 | 41,288,572(0.02%)#713 |
| 67. | College Park | 7,782 | 1,841,926(0.42%)#67 | 41,288,572(0.02%)#727 |
| 68. | Marlboro Village | 7,569 | 1,841,926(0.41%)#68 | 41,288,572(0.02%)#748 |
| 69. | Calverton | 7,480 | 1,841,926(0.41%)#69 | 41,288,572(0.02%)#756 |
| 70. | Temple Hills | 6,919 | 1,841,926(0.38%)#70 | 41,288,572(0.02%)#802 |
| 71. | Rossville | 6,742 | 1,841,926(0.37%)#71 | 41,288,572(0.02%)#815 |
| 72. | Rockville | 6,718 | 1,841,926(0.36%)#72 | 41,288,572(0.02%)#816 |
| 73. | Ellicott City | 6,322 | 1,841,926(0.34%)#73 | 41,288,572(0.02%)#861 |
| 74. | Lanham | 6,284 | 1,841,926(0.34%)#74 | 41,288,572(0.02%)#866 |
| 75. | Bladensburg | 6,268 | 1,841,926(0.34%)#75 | 41,288,572(0.02%)#868 |
| 76. | Friendly | 6,184 | 1,841,926(0.34%)#76 | 41,288,572(0.01%)#879 |
| 77. | Fairwood | 6,166 | 1,841,926(0.33%)#77 | 41,288,572(0.01%)#884 |
| 78. | Bryans Road | 6,064 | 1,841,926(0.33%)#78 | 41,288,572(0.01%)#897 |
| 79. | Takoma Park | 6,011 | 1,841,926(0.33%)#79 | 41,288,572(0.01%)#904 |
| 80. | Beltsville | 5,891 | 1,841,926(0.32%)#80 | 41,288,572(0.01%)#916 |
| 81. | Hyattsville | 5,882 | 1,841,926(0.32%)#81 | 41,288,572(0.01%)#919 |
| 82. | Cambridge | 5,817 | 1,841,926(0.32%)#82 | 41,288,572(0.01%)#930 |
| 83. | Pikesville | 5,745 | 1,841,926(0.31%)#83 | 41,288,572(0.01%)#940 |
| 84. | Bel Air South | 5,569 | 1,841,926(0.30%)#84 | 41,288,572(0.01%)#962 |
| 85. | Pasadena | 5,520 | 1,841,926(0.30%)#85 | 41,288,572(0.01%)#972 |
| 86. | District Heights | 5,483 | 1,841,926(0.30%)#86 | 41,288,572(0.01%)#979 |
| 87. | North Bethesda | 5,371 | 1,841,926(0.29%)#87 | 41,288,572(0.01%)#994 |
| 88. | Carney | 5,349 | 1,841,926(0.29%)#88 | 41,288,572(0.01%)#1,000 |
| 89. | Marlow Heights | 5,301 | 1,841,926(0.29%)#89 | 41,288,572(0.01%)#1,009 |
| 90. | Jessup | 5,156 | 1,841,926(0.28%)#90 | 41,288,572(0.01%)#1,027 |
| 91. | Silver Hill | 5,107 | 1,841,926(0.28%)#91 | 41,288,572(0.01%)#1,039 |
| 92. | Glenarden | 4,955 | 1,841,926(0.27%)#92 | 41,288,572(0.01%)#1,063 |
| 93. | Cockeysville | 4,889 | 1,841,926(0.27%)#93 | 41,288,572(0.01%)#1,076 |
| 94. | Perry Hall | 4,777 | 1,841,926(0.26%)#94 | 41,288,572(0.01%)#1,095 |
| 95. | Adelphi | 4,766 | 1,841,926(0.26%)#95 | 41,288,572(0.01%)#1,096 |
| 96. | Olney | 4,732 | 1,841,926(0.26%)#96 | 41,288,572(0.01%)#1,104 |
| 97. | Clarksburg | 4,687 | 1,841,926(0.25%)#97 | 41,288,572(0.01%)#1,113 |
| 98. | Peppermill Village | 4,632 | 1,841,926(0.25%)#98 | 41,288,572(0.01%)#1,126 |
| 99. | Crofton | 4,578 | 1,841,926(0.25%)#99 | 41,288,572(0.01%)#1,137 |
| 100. | East Riverdale | 4,400 | 1,841,926(0.24%)#100 | 41,288,572(0.01%)#1,174 |
Common Questions
What are the Top 10 Cities with the Largest Black / African American Community in Maryland?
Top 10 Cities with the Largest Black / African American Community in Maryland are:
#1
358,028
#2
51,052
#3
33,095
#4
31,180
#5
30,057
#6
28,614
#7
25,609
#8
24,320
#9
23,120
#10
22,730
What city has the Largest Black / African American Community in Maryland?
Baltimore has the Largest Black / African American Community in Maryland with 358,028.
What is the Total Black / African American Population in the State of Maryland?
Total Black / African American Population in Maryland is 1,841,926.
What is the Total Black / African American Population in the United States?
Total Black / African American Population in the United States is 41,288,572.