Zip Codes with the Highest Percentage of Population Employed in Real Estate, Rental & Leasing in North Richland Hills, TX
RELATED REPORTS & OPTIONS
Real Estate, Rental & Leasing
North Richland Hills
Compare Zip Codes
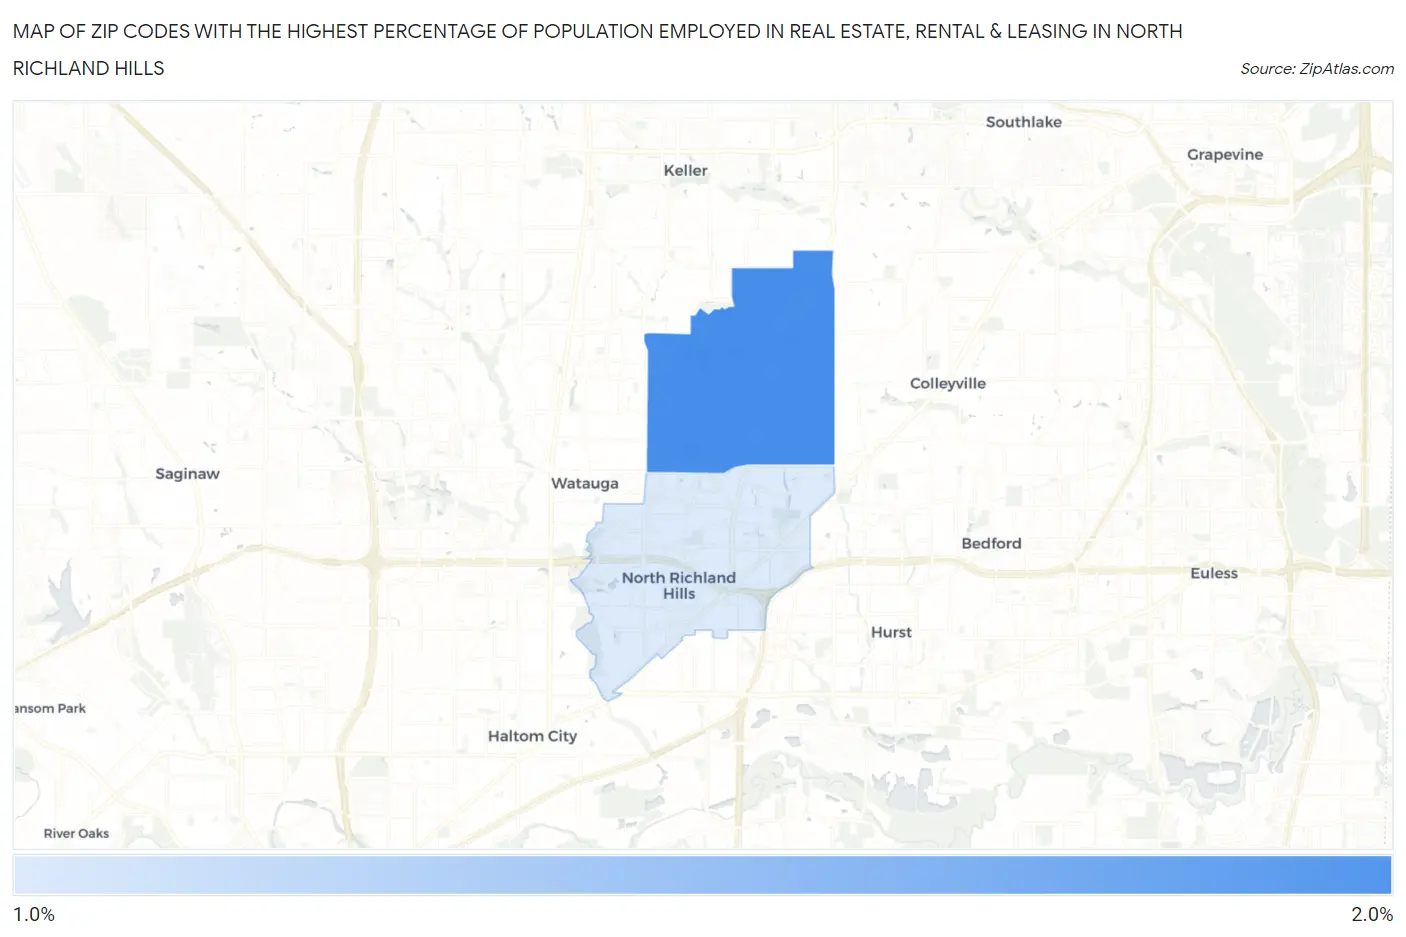
Map of Zip Codes with the Highest Percentage of Population Employed in Real Estate, Rental & Leasing in North Richland Hills
1.7%
2.0%
Zip Codes with the Highest Percentage of Population Employed in Real Estate, Rental & Leasing in North Richland Hills, TX
| Zip Code | % Employed | vs State | vs National | |
| 1. | 76182 | 2.0% | 2.0%(-0.009)#568 | 1.9%(+0.107)#7,849 |
| 2. | 76180 | 1.7% | 2.0%(-0.298)#697 | 1.9%(-0.182)#9,694 |
1
Common Questions
What are the Top Zip Codes with the Highest Percentage of Population Employed in Real Estate, Rental & Leasing in North Richland Hills, TX?
Top Zip Codes with the Highest Percentage of Population Employed in Real Estate, Rental & Leasing in North Richland Hills, TX are:
What zip code has the Highest Percentage of Population Employed in Real Estate, Rental & Leasing in North Richland Hills, TX?
76182 has the Highest Percentage of Population Employed in Real Estate, Rental & Leasing in North Richland Hills, TX with 2.0%.
What is the Percentage of Population Employed in Real Estate, Rental & Leasing in North Richland Hills, TX?
Percentage of Population Employed in Real Estate, Rental & Leasing in North Richland Hills is 1.9%.
What is the Percentage of Population Employed in Real Estate, Rental & Leasing in Texas?
Percentage of Population Employed in Real Estate, Rental & Leasing in Texas is 2.0%.
What is the Percentage of Population Employed in Real Estate, Rental & Leasing in the United States?
Percentage of Population Employed in Real Estate, Rental & Leasing in the United States is 1.9%.