Zip Codes with the Highest Percentage of Population Employed in Real Estate, Rental & Leasing in Sherman, TX
RELATED REPORTS & OPTIONS
Real Estate, Rental & Leasing
Sherman
Compare Zip Codes
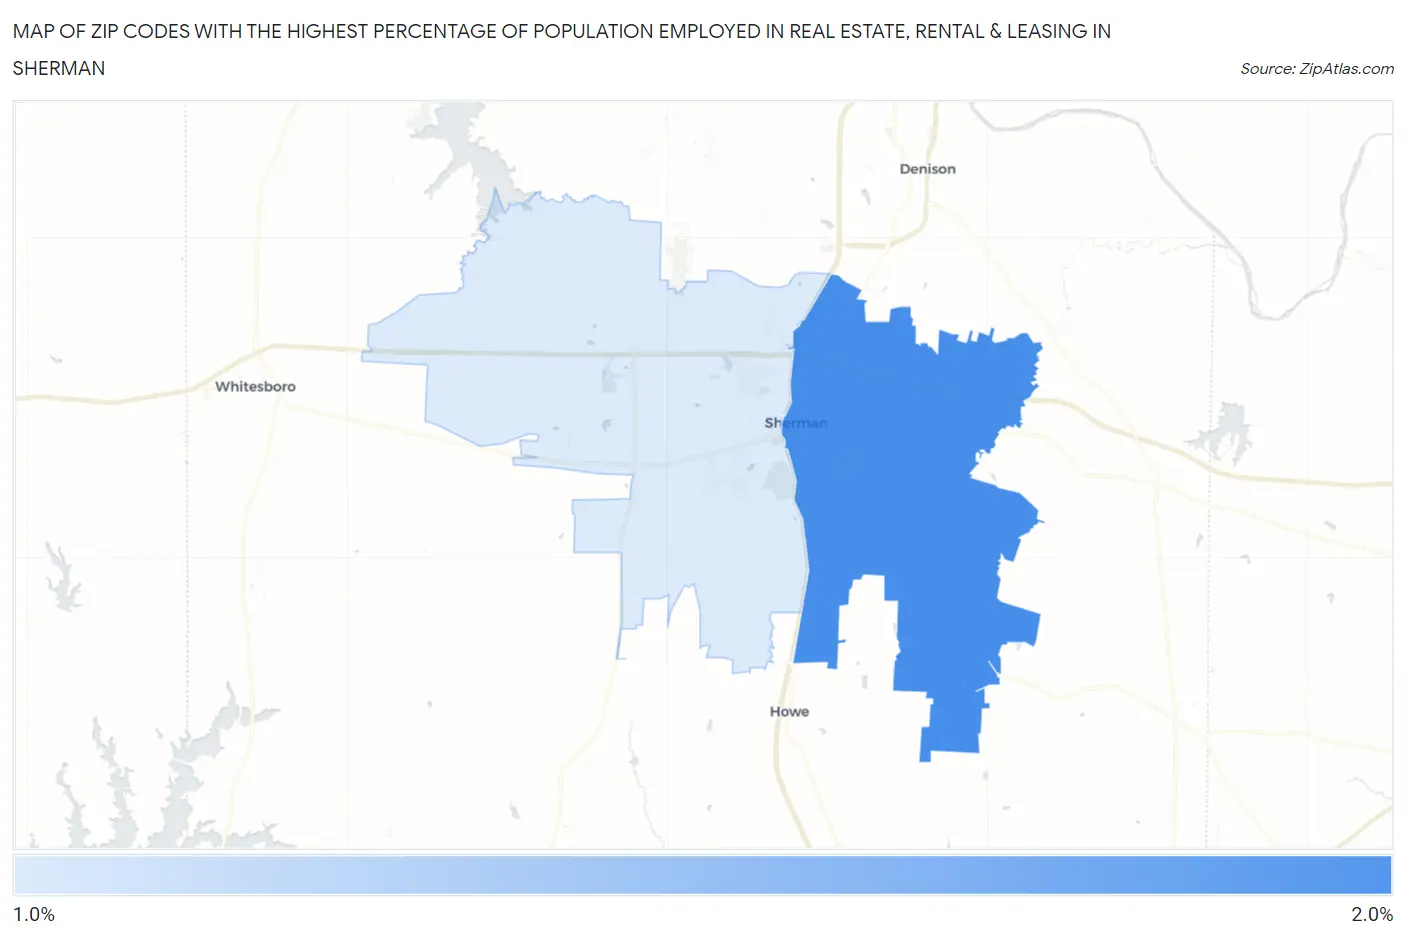
Map of Zip Codes with the Highest Percentage of Population Employed in Real Estate, Rental & Leasing in Sherman
1.3%
1.8%
Zip Codes with the Highest Percentage of Population Employed in Real Estate, Rental & Leasing in Sherman, TX
| Zip Code | % Employed | vs State | vs National | |
| 1. | 75090 | 1.8% | 2.0%(-0.197)#648 | 1.9%(-0.081)#9,048 |
| 2. | 75092 | 1.3% | 2.0%(-0.687)#898 | 1.9%(-0.571)#12,572 |
1
Common Questions
What are the Top Zip Codes with the Highest Percentage of Population Employed in Real Estate, Rental & Leasing in Sherman, TX?
Top Zip Codes with the Highest Percentage of Population Employed in Real Estate, Rental & Leasing in Sherman, TX are:
What zip code has the Highest Percentage of Population Employed in Real Estate, Rental & Leasing in Sherman, TX?
75090 has the Highest Percentage of Population Employed in Real Estate, Rental & Leasing in Sherman, TX with 1.8%.
What is the Percentage of Population Employed in Real Estate, Rental & Leasing in Sherman, TX?
Percentage of Population Employed in Real Estate, Rental & Leasing in Sherman is 1.6%.
What is the Percentage of Population Employed in Real Estate, Rental & Leasing in Texas?
Percentage of Population Employed in Real Estate, Rental & Leasing in Texas is 2.0%.
What is the Percentage of Population Employed in Real Estate, Rental & Leasing in the United States?
Percentage of Population Employed in Real Estate, Rental & Leasing in the United States is 1.9%.