Hilltop Lakes, TX Map & Demographics
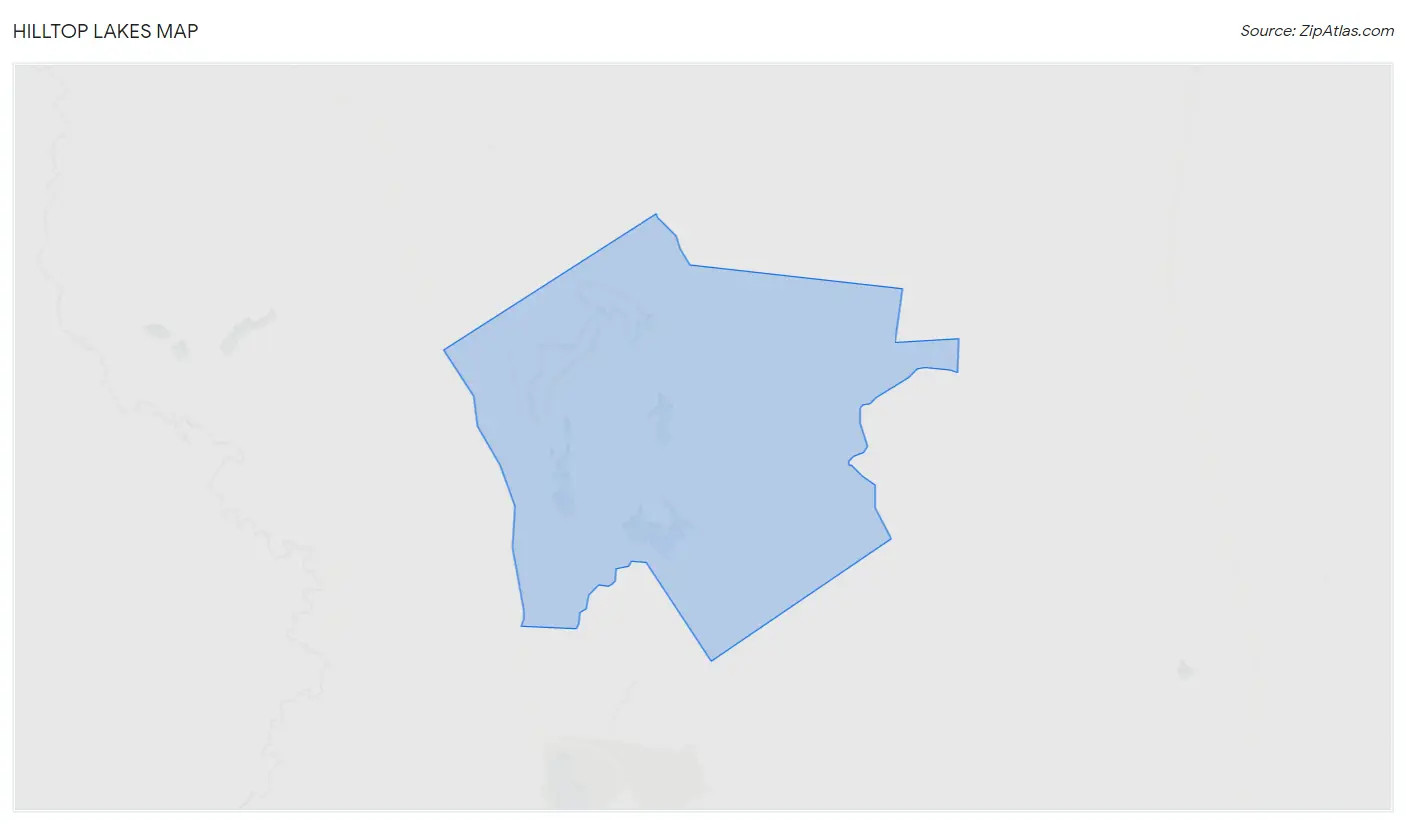
Hilltop Lakes Map
Hilltop Lakes Overview
$43,029
PER CAPITA INCOME
$97,813
AVG FAMILY INCOME
$96,707
AVG HOUSEHOLD INCOME
0.29
INEQUALITY / GINI INDEX
737
TOTAL POPULATION
377
MALE POPULATION
360
FEMALE POPULATION
104.72
MALES / 100 FEMALES
95.49
FEMALES / 100 MALES
56.7
MEDIAN AGE
2.7
AVG FAMILY SIZE
2.2
AVG HOUSEHOLD SIZE
346
LABOR FORCE [ PEOPLE ]
54.1%
PERCENT IN LABOR FORCE
2.0%
UNEMPLOYMENT RATE
Hilltop Lakes Area Codes
Income in Hilltop Lakes
Income Overview in Hilltop Lakes
Per Capita Income in Hilltop Lakes is $43,029, while median incomes of families and households are $97,813 and $96,707 respectively.
| Characteristic | Number | Measure |
| Per Capita Income | 737 | $43,029 |
| Median Family Income | 244 | $97,813 |
| Mean Family Income | 244 | $106,352 |
| Median Household Income | 329 | $96,707 |
| Mean Household Income | 329 | $92,891 |
| Income Deficit | 244 | $0 |
| Wage / Income Gap (%) | 737 | 0.00% |
| Wage / Income Gap ($) | 737 | 100.00¢ per $1 |
| Gini / Inequality Index | 737 | 0.29 |
Earnings by Sex in Hilltop Lakes
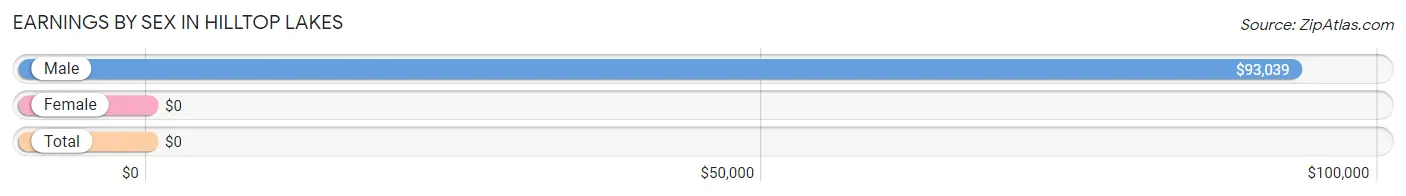
| Sex | Number | Average Earnings |
| Male | 223 (54.9%) | $93,039 |
| Female | 183 (45.1%) | $0 |
| Total | 406 (100.0%) | $0 |
Earnings by Sex by Income Bracket in Hilltop Lakes
The most common earnings brackets in Hilltop Lakes are $75,000 to $99,999 for men (89 | 39.9%) and $2,499 or less for women (57 | 31.1%).
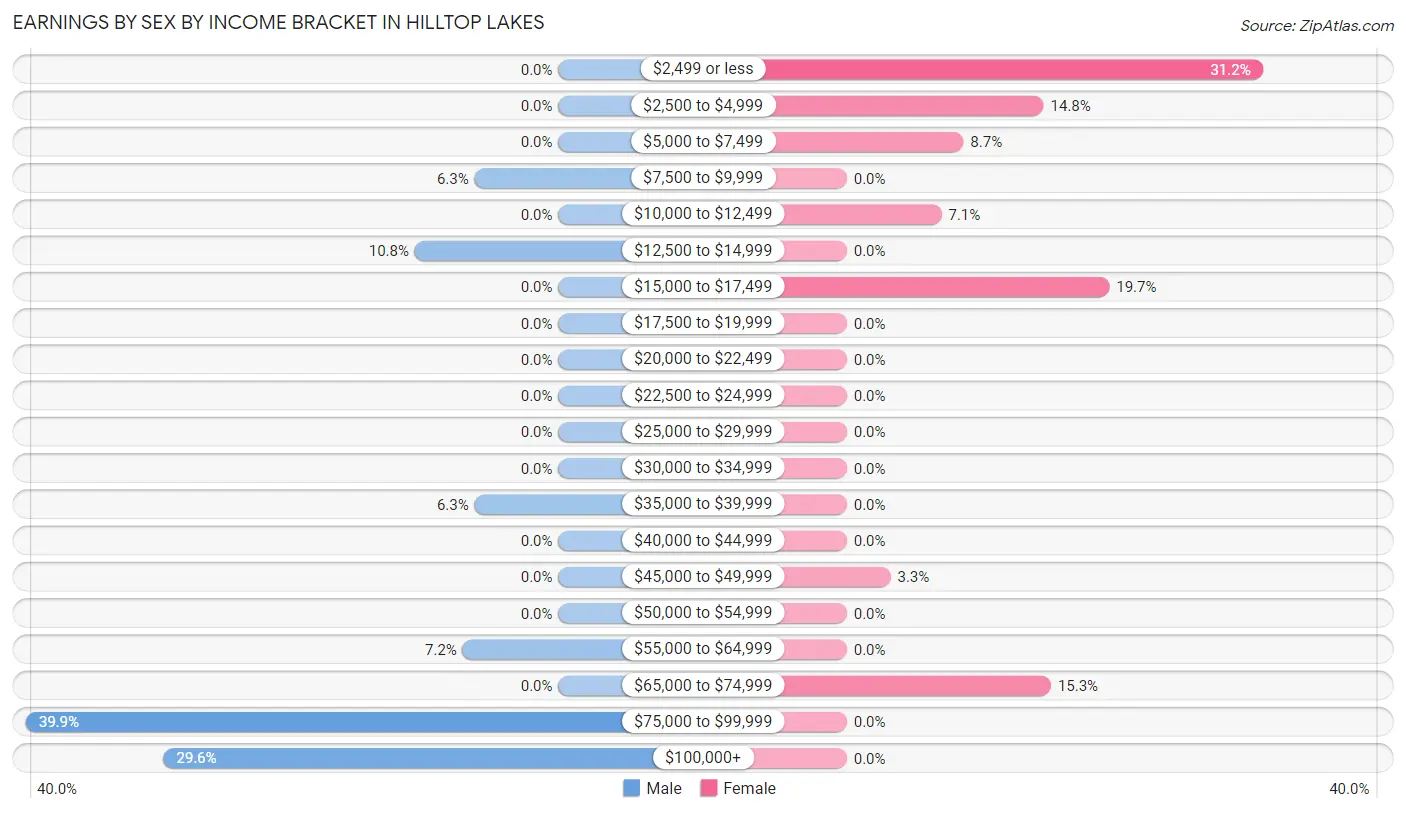
| Income | Male | Female |
| $2,499 or less | 0 (0.0%) | 57 (31.1%) |
| $2,500 to $4,999 | 0 (0.0%) | 27 (14.7%) |
| $5,000 to $7,499 | 0 (0.0%) | 16 (8.7%) |
| $7,500 to $9,999 | 14 (6.3%) | 0 (0.0%) |
| $10,000 to $12,499 | 0 (0.0%) | 13 (7.1%) |
| $12,500 to $14,999 | 24 (10.8%) | 0 (0.0%) |
| $15,000 to $17,499 | 0 (0.0%) | 36 (19.7%) |
| $17,500 to $19,999 | 0 (0.0%) | 0 (0.0%) |
| $20,000 to $22,499 | 0 (0.0%) | 0 (0.0%) |
| $22,500 to $24,999 | 0 (0.0%) | 0 (0.0%) |
| $25,000 to $29,999 | 0 (0.0%) | 0 (0.0%) |
| $30,000 to $34,999 | 0 (0.0%) | 0 (0.0%) |
| $35,000 to $39,999 | 14 (6.3%) | 0 (0.0%) |
| $40,000 to $44,999 | 0 (0.0%) | 0 (0.0%) |
| $45,000 to $49,999 | 0 (0.0%) | 6 (3.3%) |
| $50,000 to $54,999 | 0 (0.0%) | 0 (0.0%) |
| $55,000 to $64,999 | 16 (7.2%) | 0 (0.0%) |
| $65,000 to $74,999 | 0 (0.0%) | 28 (15.3%) |
| $75,000 to $99,999 | 89 (39.9%) | 0 (0.0%) |
| $100,000+ | 66 (29.6%) | 0 (0.0%) |
| Total | 223 (100.0%) | 183 (100.0%) |
Earnings by Sex by Educational Attainment in Hilltop Lakes
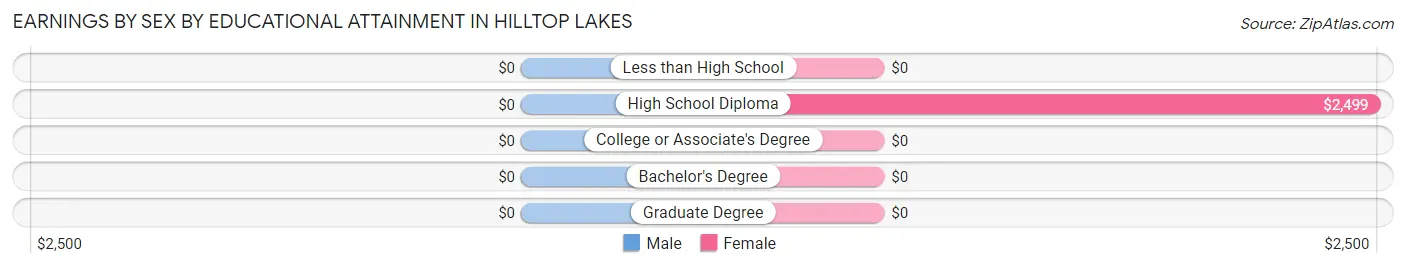
| Educational Attainment | Male Income | Female Income |
| Less than High School | - | - |
| High School Diploma | - | - |
| College or Associate's Degree | - | - |
| Bachelor's Degree | - | - |
| Graduate Degree | - | - |
| Total | $93,039 | $0 |
Family Income in Hilltop Lakes
Family Income Brackets in Hilltop Lakes
According to the Hilltop Lakes family income data, there are 75 families falling into the $75,000 to $99,999 income range, which is the most common income bracket and makes up 30.7% of all families.
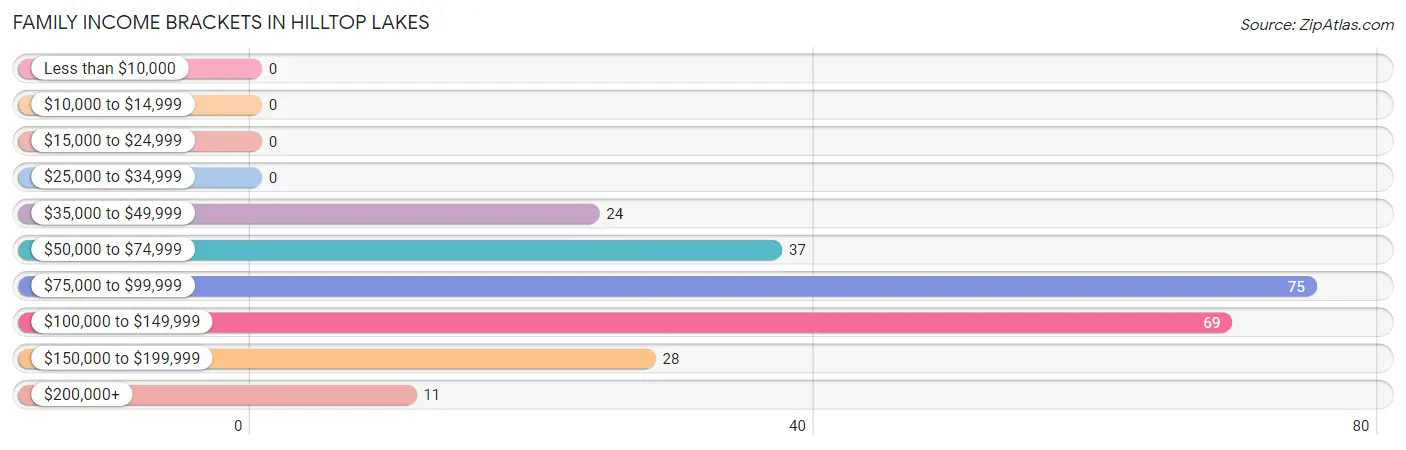
| Income Bracket | # Families | % Families |
| Less than $10,000 | 0 | 0.0% |
| $10,000 to $14,999 | 0 | 0.0% |
| $15,000 to $24,999 | 0 | 0.0% |
| $25,000 to $34,999 | 0 | 0.0% |
| $35,000 to $49,999 | 24 | 9.8% |
| $50,000 to $74,999 | 37 | 15.2% |
| $75,000 to $99,999 | 75 | 30.7% |
| $100,000 to $149,999 | 69 | 28.3% |
| $150,000 to $199,999 | 28 | 11.5% |
| $200,000+ | 11 | 4.5% |
Family Income by Famaliy Size in Hilltop Lakes
2-person families (218 | 89.3%) account for the highest median family income in Hilltop Lakes with $97,452 per family, while 2-person families (218 | 89.3%) have the highest median income of $48,726 per family member.
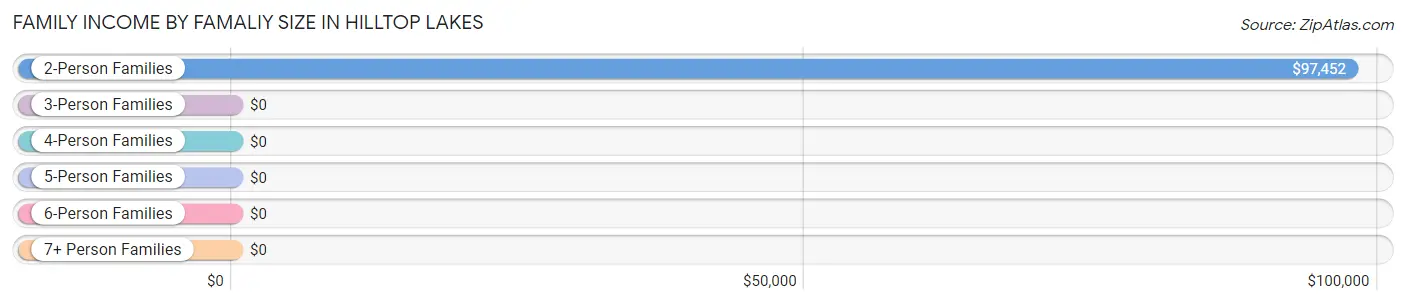
| Income Bracket | # Families | Median Income |
| 2-Person Families | 218 (89.3%) | $97,452 |
| 3-Person Families | 16 (6.6%) | $0 |
| 4-Person Families | 0 (0.0%) | $0 |
| 5-Person Families | 0 (0.0%) | $0 |
| 6-Person Families | 0 (0.0%) | $0 |
| 7+ Person Families | 10 (4.1%) | $0 |
| Total | 244 (100.0%) | $97,813 |
Family Income by Number of Earners in Hilltop Lakes
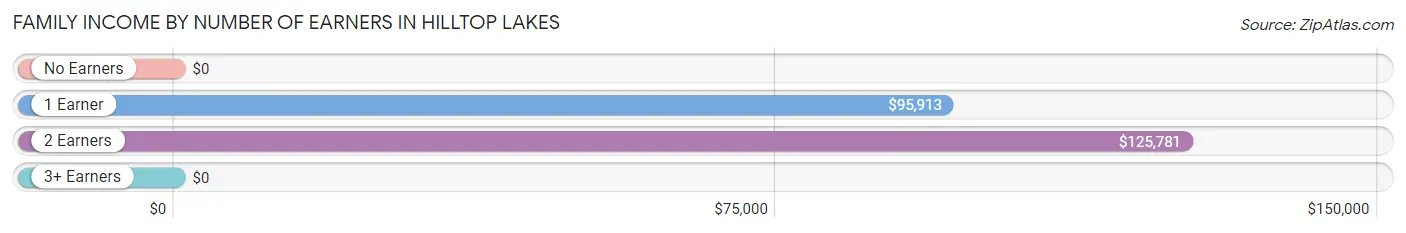
| Number of Earners | # Families | Median Income |
| No Earners | 46 (18.9%) | $0 |
| 1 Earner | 98 (40.2%) | $95,913 |
| 2 Earners | 100 (41.0%) | $125,781 |
| 3+ Earners | 0 (0.0%) | $0 |
| Total | 244 (100.0%) | $97,813 |
Household Income in Hilltop Lakes
Household Income Brackets in Hilltop Lakes
With 93 households falling in the category, the $100,000 to $149,999 income range is the most frequent in Hilltop Lakes, accounting for 28.3% of all households.
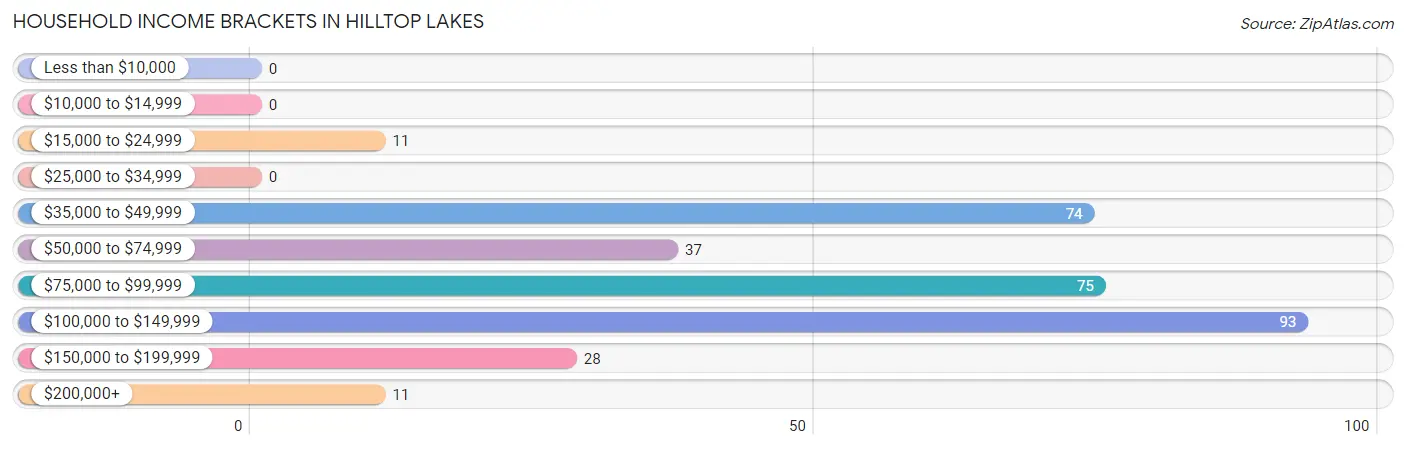
| Income Bracket | # Households | % Households |
| Less than $10,000 | 0 | 0.0% |
| $10,000 to $14,999 | 0 | 0.0% |
| $15,000 to $24,999 | 11 | 3.3% |
| $25,000 to $34,999 | 0 | 0.0% |
| $35,000 to $49,999 | 74 | 22.5% |
| $50,000 to $74,999 | 37 | 11.2% |
| $75,000 to $99,999 | 75 | 22.8% |
| $100,000 to $149,999 | 93 | 28.3% |
| $150,000 to $199,999 | 28 | 8.5% |
| $200,000+ | 11 | 3.3% |
Household Income by Householder Age in Hilltop Lakes
The median household income in Hilltop Lakes is $96,707, with the highest median household income of $96,587 found in the 45 to 64 years age bracket for the primary householder. A total of 178 households (54.1%) fall into this category.
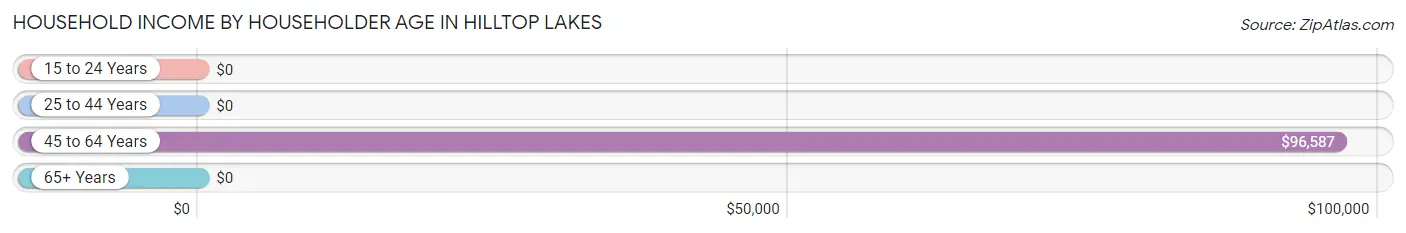
| Income Bracket | # Households | Median Income |
| 15 to 24 Years | 0 (0.0%) | $0 |
| 25 to 44 Years | 34 (10.3%) | $0 |
| 45 to 64 Years | 178 (54.1%) | $96,587 |
| 65+ Years | 117 (35.6%) | $0 |
| Total | 329 (100.0%) | $96,707 |
Poverty in Hilltop Lakes
Income Below Poverty by Sex and Age in Hilltop Lakes
With 18.0% poverty level for males and 15.0% for females among the residents of Hilltop Lakes, 6 to 11 year old males and under 5 year old females are the most vulnerable to poverty, with 9 males (100.0%) and 17 females (100.0%) in their respective age groups living below the poverty level.
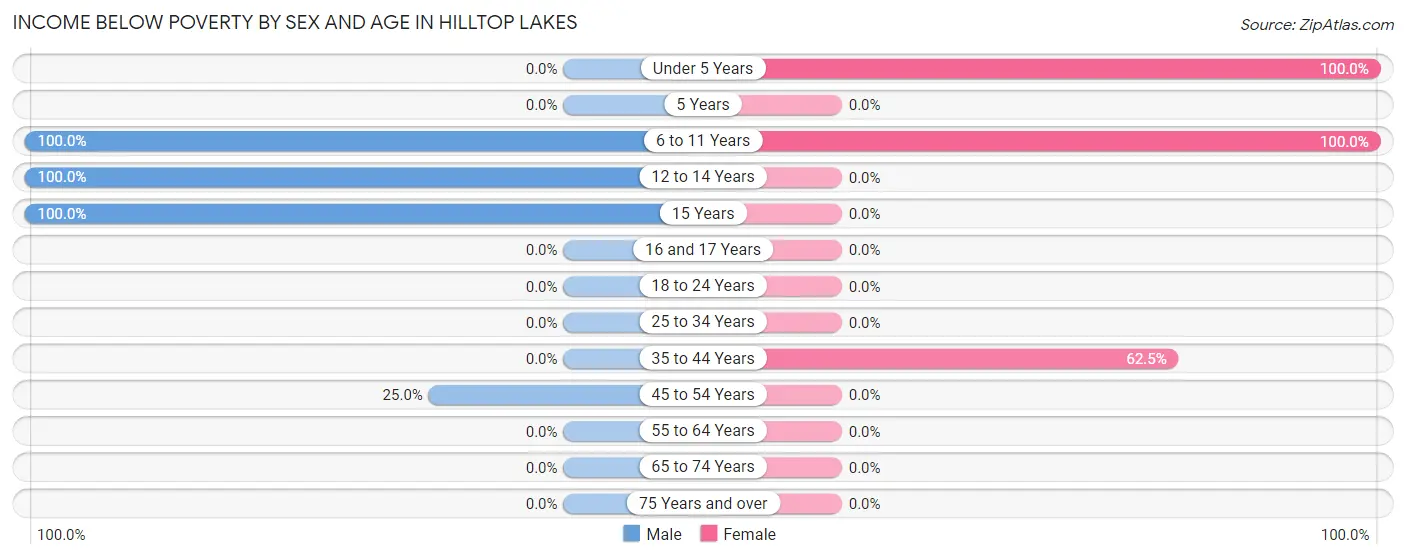
| Age Bracket | Male | Female |
| Under 5 Years | 0 (0.0%) | 17 (100.0%) |
| 5 Years | 0 (0.0%) | 0 (0.0%) |
| 6 to 11 Years | 9 (100.0%) | 27 (100.0%) |
| 12 to 14 Years | 18 (100.0%) | 0 (0.0%) |
| 15 Years | 27 (100.0%) | 0 (0.0%) |
| 16 and 17 Years | 0 (0.0%) | 0 (0.0%) |
| 18 to 24 Years | 0 (0.0%) | 0 (0.0%) |
| 25 to 34 Years | 0 (0.0%) | 0 (0.0%) |
| 35 to 44 Years | 0 (0.0%) | 10 (62.5%) |
| 45 to 54 Years | 14 (25.0%) | 0 (0.0%) |
| 55 to 64 Years | 0 (0.0%) | 0 (0.0%) |
| 65 to 74 Years | 0 (0.0%) | 0 (0.0%) |
| 75 Years and over | 0 (0.0%) | 0 (0.0%) |
| Total | 68 (18.0%) | 54 (15.0%) |
Income Above Poverty by Sex and Age in Hilltop Lakes
According to the poverty statistics in Hilltop Lakes, males aged 35 to 44 years and females aged 45 to 54 years are the age groups that are most secure financially, with 100.0% of males and 100.0% of females in these age groups living above the poverty line.
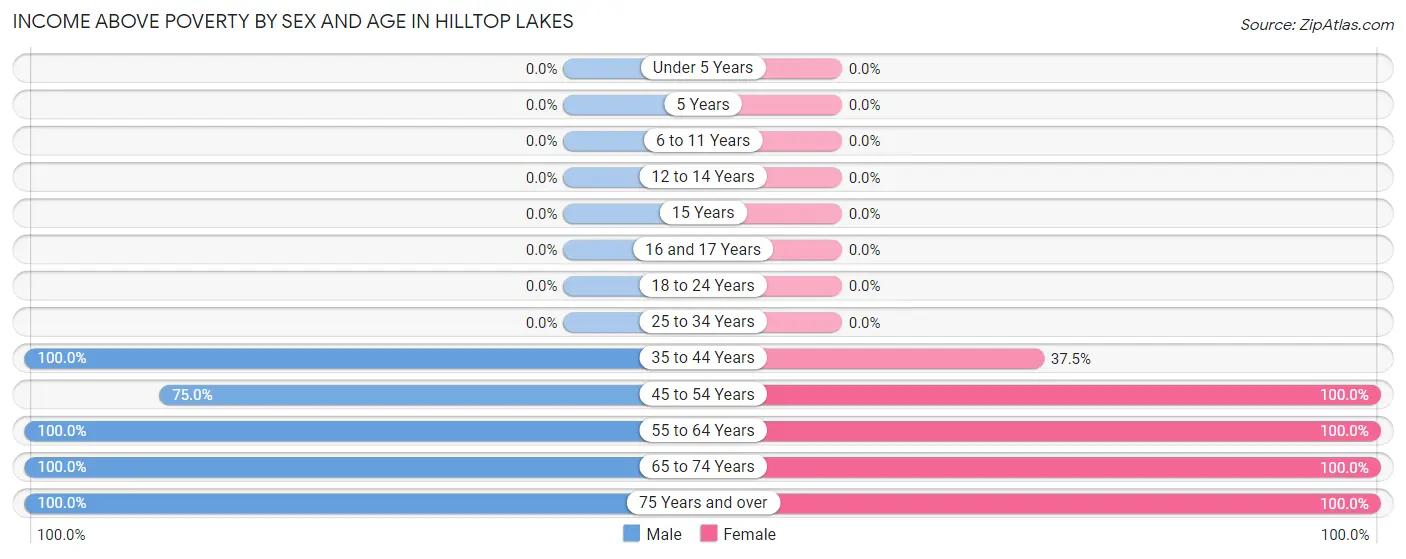
| Age Bracket | Male | Female |
| Under 5 Years | 0 (0.0%) | 0 (0.0%) |
| 5 Years | 0 (0.0%) | 0 (0.0%) |
| 6 to 11 Years | 0 (0.0%) | 0 (0.0%) |
| 12 to 14 Years | 0 (0.0%) | 0 (0.0%) |
| 15 Years | 0 (0.0%) | 0 (0.0%) |
| 16 and 17 Years | 0 (0.0%) | 0 (0.0%) |
| 18 to 24 Years | 0 (0.0%) | 0 (0.0%) |
| 25 to 34 Years | 0 (0.0%) | 0 (0.0%) |
| 35 to 44 Years | 48 (100.0%) | 6 (37.5%) |
| 45 to 54 Years | 42 (75.0%) | 57 (100.0%) |
| 55 to 64 Years | 102 (100.0%) | 136 (100.0%) |
| 65 to 74 Years | 49 (100.0%) | 30 (100.0%) |
| 75 Years and over | 68 (100.0%) | 77 (100.0%) |
| Total | 309 (82.0%) | 306 (85.0%) |
Income Below Poverty Among Married-Couple Families in Hilltop Lakes
The poverty statistics for married-couple families in Hilltop Lakes show that 4.1% or 10 of the total 244 families live below the poverty line. Families with 5 or more children have the highest poverty rate of 100.0%, comprising of 10 families. On the other hand, families with no children have the lowest poverty rate of 0.0%, which includes 0 families.
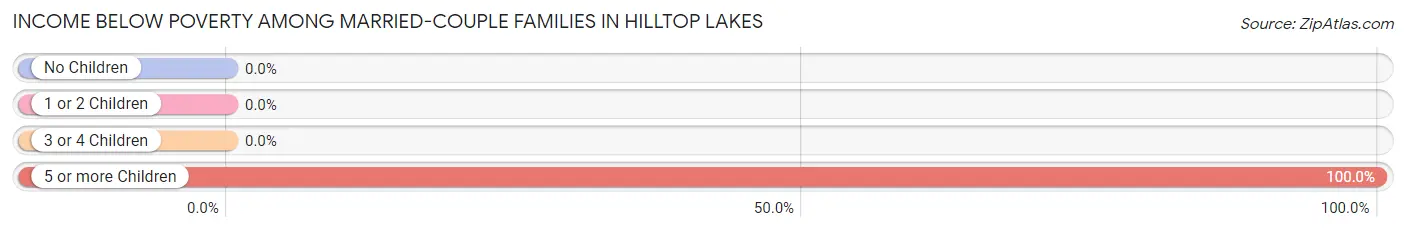
| Children | Above Poverty | Below Poverty |
| No Children | 234 (100.0%) | 0 (0.0%) |
| 1 or 2 Children | 0 (0.0%) | 0 (0.0%) |
| 3 or 4 Children | 0 (0.0%) | 0 (0.0%) |
| 5 or more Children | 0 (0.0%) | 10 (100.0%) |
| Total | 234 (95.9%) | 10 (4.1%) |
Income Below Poverty Among Single-Parent Households in Hilltop Lakes
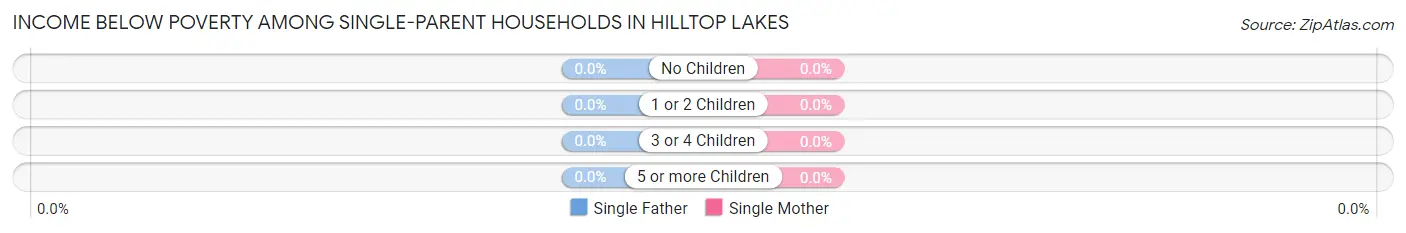
| Children | Single Father | Single Mother |
| No Children | 0 (0.0%) | 0 (0.0%) |
| 1 or 2 Children | 0 (0.0%) | 0 (0.0%) |
| 3 or 4 Children | 0 (0.0%) | 0 (0.0%) |
| 5 or more Children | 0 (0.0%) | 0 (0.0%) |
| Total | 0 (0.0%) | 0 (0.0%) |
Income Below Poverty Among Married-Couple vs Single-Parent Households in Hilltop Lakes
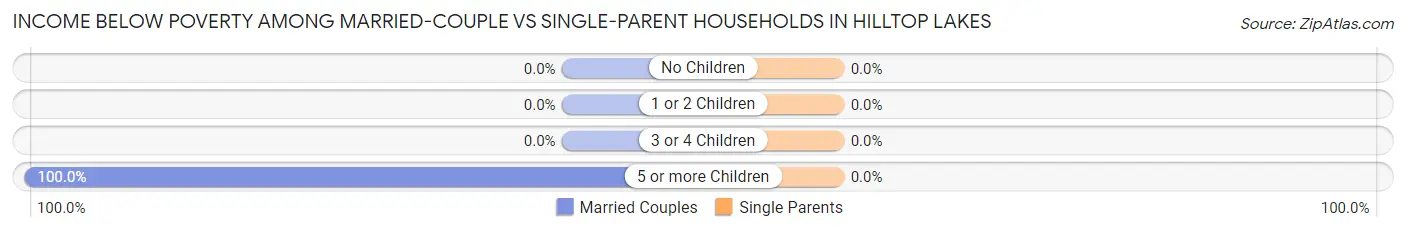
| Children | Married-Couple Families | Single-Parent Households |
| No Children | 0 (0.0%) | 0 (0.0%) |
| 1 or 2 Children | 0 (0.0%) | 0 (0.0%) |
| 3 or 4 Children | 0 (0.0%) | 0 (0.0%) |
| 5 or more Children | 10 (100.0%) | 0 (0.0%) |
| Total | 10 (4.1%) | 0 (0.0%) |
Race in Hilltop Lakes
The most populous races in Hilltop Lakes are White / Caucasian (563 | 76.4%), Hispanic or Latino (159 | 21.6%), and Some other Race (128 | 17.4%).
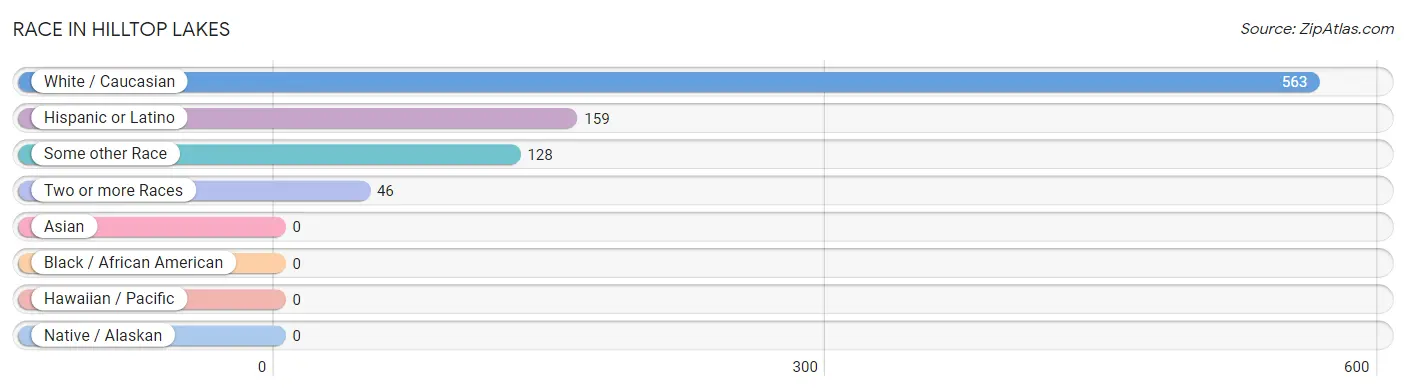
| Race | # Population | % Population |
| Asian | 0 | 0.0% |
| Black / African American | 0 | 0.0% |
| Hawaiian / Pacific | 0 | 0.0% |
| Hispanic or Latino | 159 | 21.6% |
| Native / Alaskan | 0 | 0.0% |
| White / Caucasian | 563 | 76.4% |
| Two or more Races | 46 | 6.2% |
| Some other Race | 128 | 17.4% |
| Total | 737 | 100.0% |
Ancestry in Hilltop Lakes
The most populous ancestries reported in Hilltop Lakes are Irish (134 | 18.2%), Mexican (81 | 11.0%), English (74 | 10.0%), Spaniard (31 | 4.2%), and French (29 | 3.9%), together accounting for 47.3% of all Hilltop Lakes residents.
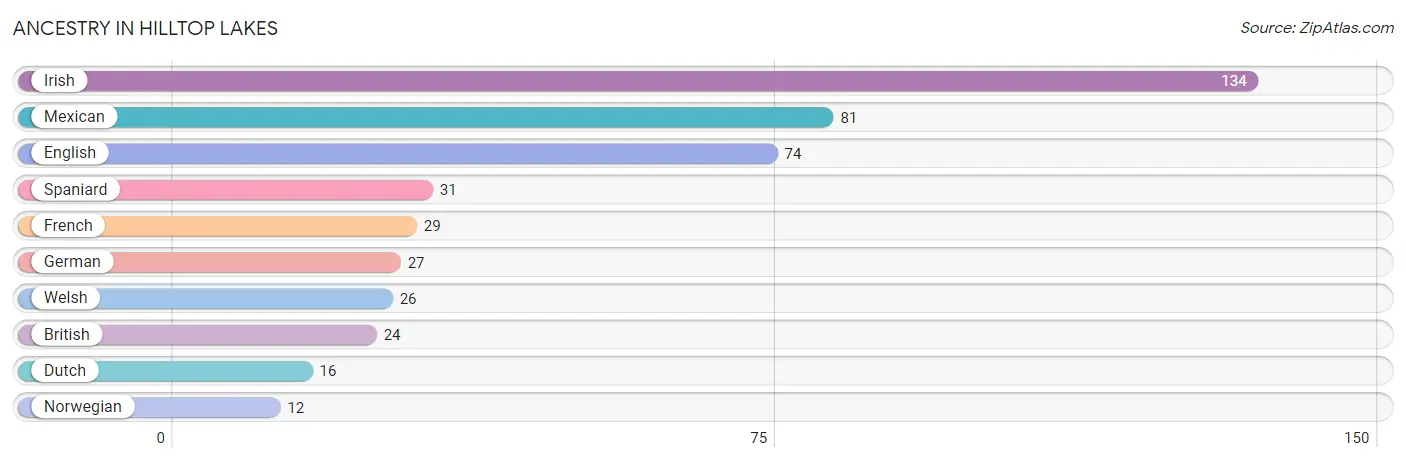
| Ancestry | # Population | % Population |
| British | 24 | 3.3% |
| Dutch | 16 | 2.2% |
| English | 74 | 10.0% |
| French | 29 | 3.9% |
| German | 27 | 3.7% |
| Irish | 134 | 18.2% |
| Mexican | 81 | 11.0% |
| Norwegian | 12 | 1.6% |
| Spaniard | 31 | 4.2% |
| Welsh | 26 | 3.5% | View All 10 Rows |
Immigrants in Hilltop Lakes
The most numerous immigrant groups reported in Hilltop Lakes came from Central America (14 | 1.9%), Latin America (14 | 1.9%), and Mexico (14 | 1.9%), together accounting for 5.7% of all Hilltop Lakes residents.
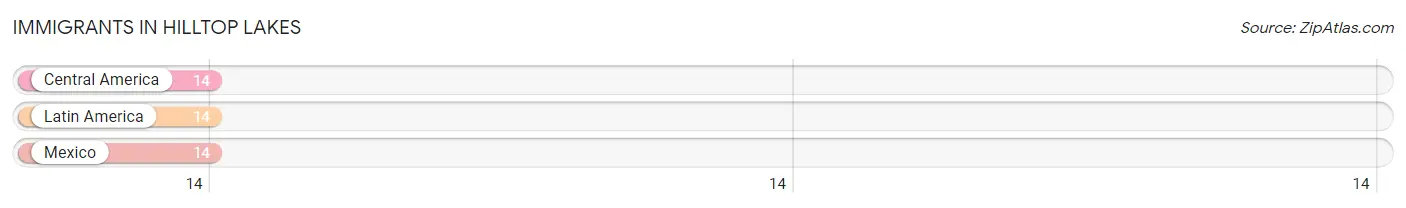
| Immigration Origin | # Population | % Population |
| Central America | 14 | 1.9% |
| Latin America | 14 | 1.9% |
| Mexico | 14 | 1.9% | View All 3 Rows |
Sex and Age in Hilltop Lakes
Sex and Age in Hilltop Lakes
The most populous age groups in Hilltop Lakes are 55 to 59 Years (58 | 15.4%) for men and 60 to 64 Years (84 | 23.3%) for women.
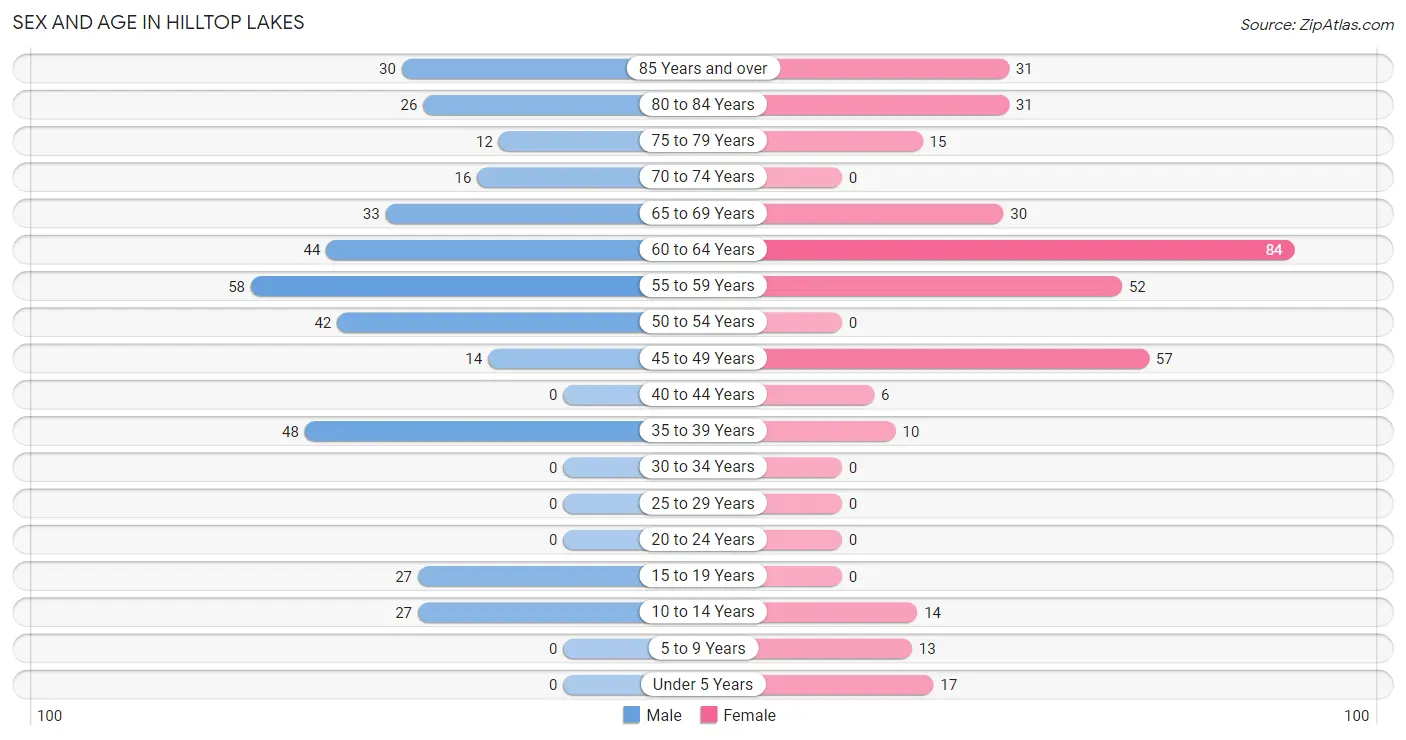
| Age Bracket | Male | Female |
| Under 5 Years | 0 (0.0%) | 17 (4.7%) |
| 5 to 9 Years | 0 (0.0%) | 13 (3.6%) |
| 10 to 14 Years | 27 (7.2%) | 14 (3.9%) |
| 15 to 19 Years | 27 (7.2%) | 0 (0.0%) |
| 20 to 24 Years | 0 (0.0%) | 0 (0.0%) |
| 25 to 29 Years | 0 (0.0%) | 0 (0.0%) |
| 30 to 34 Years | 0 (0.0%) | 0 (0.0%) |
| 35 to 39 Years | 48 (12.7%) | 10 (2.8%) |
| 40 to 44 Years | 0 (0.0%) | 6 (1.7%) |
| 45 to 49 Years | 14 (3.7%) | 57 (15.8%) |
| 50 to 54 Years | 42 (11.1%) | 0 (0.0%) |
| 55 to 59 Years | 58 (15.4%) | 52 (14.4%) |
| 60 to 64 Years | 44 (11.7%) | 84 (23.3%) |
| 65 to 69 Years | 33 (8.7%) | 30 (8.3%) |
| 70 to 74 Years | 16 (4.2%) | 0 (0.0%) |
| 75 to 79 Years | 12 (3.2%) | 15 (4.2%) |
| 80 to 84 Years | 26 (6.9%) | 31 (8.6%) |
| 85 Years and over | 30 (8.0%) | 31 (8.6%) |
| Total | 377 (100.0%) | 360 (100.0%) |
Families and Households in Hilltop Lakes
Median Family Size in Hilltop Lakes
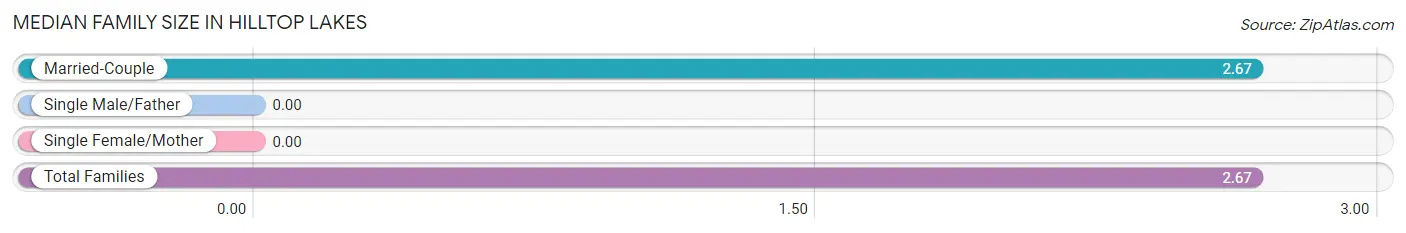
| Family Type | # Families | Family Size |
| Married-Couple | 244 (100.0%) | 2.67 |
| Single Male/Father | 0 (0.0%) | - |
| Single Female/Mother | 0 (0.0%) | - |
| Total Families | 244 (100.0%) | 2.67 |
Median Household Size in Hilltop Lakes
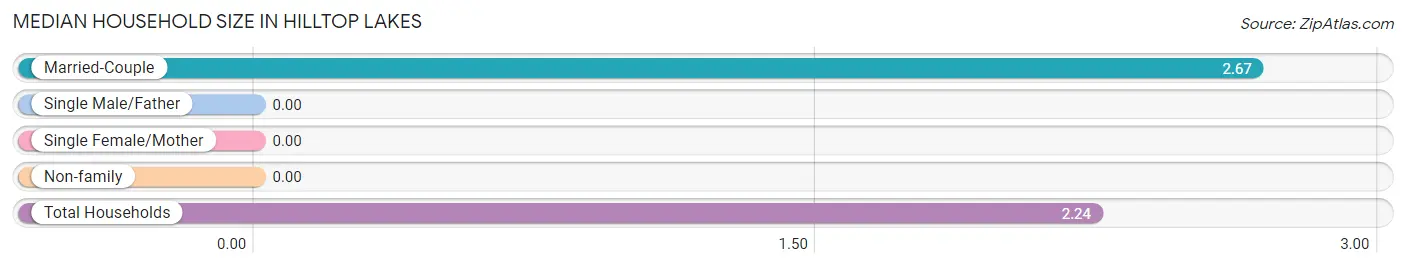
| Household Type | # Households | Household Size |
| Married-Couple | 244 (74.2%) | 2.67 |
| Single Male/Father | 0 (0.0%) | - |
| Single Female/Mother | 0 (0.0%) | - |
| Non-family | 85 (25.8%) | - |
| Total Households | 329 (100.0%) | 2.24 |
Household Size by Marriage Status in Hilltop Lakes
Out of a total of 329 households in Hilltop Lakes, 244 (74.2%) are family households, while 85 (25.8%) are nonfamily households. The most numerous type of family households are 2-person households, comprising 218, and the most common type of nonfamily households are 1-person households, comprising 85.
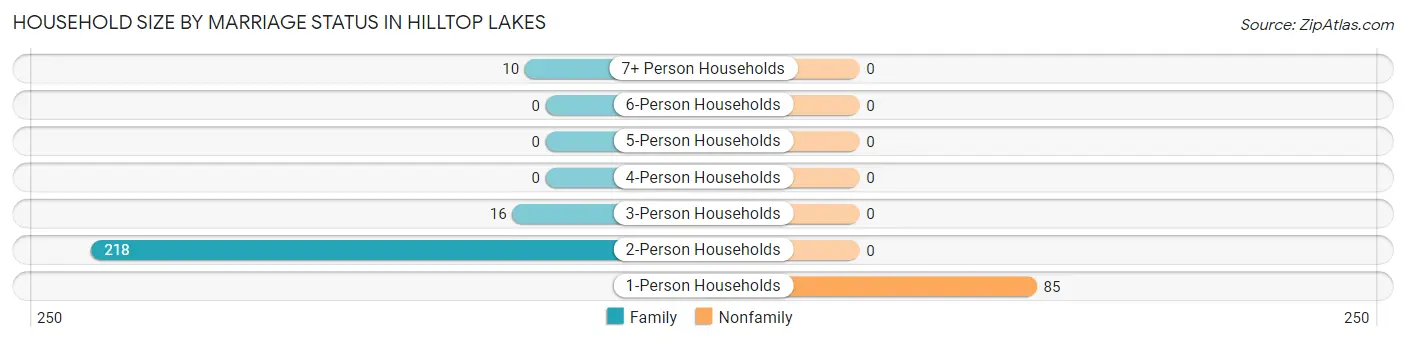
| Household Size | Family Households | Nonfamily Households |
| 1-Person Households | - | 85 (25.8%) |
| 2-Person Households | 218 (66.3%) | 0 (0.0%) |
| 3-Person Households | 16 (4.9%) | 0 (0.0%) |
| 4-Person Households | 0 (0.0%) | 0 (0.0%) |
| 5-Person Households | 0 (0.0%) | 0 (0.0%) |
| 6-Person Households | 0 (0.0%) | 0 (0.0%) |
| 7+ Person Households | 10 (3.0%) | 0 (0.0%) |
| Total | 244 (74.2%) | 85 (25.8%) |
Female Fertility in Hilltop Lakes
Fertility by Age in Hilltop Lakes
Average fertility rate in Hilltop Lakes is 137.0 births per 1,000 women. Women in the age bracket of 35 to 50 years have the highest fertility rate with 137.0 births per 1,000 women. Women in the age bracket of 35 to 50 years acount for 100.0% of all women with births.
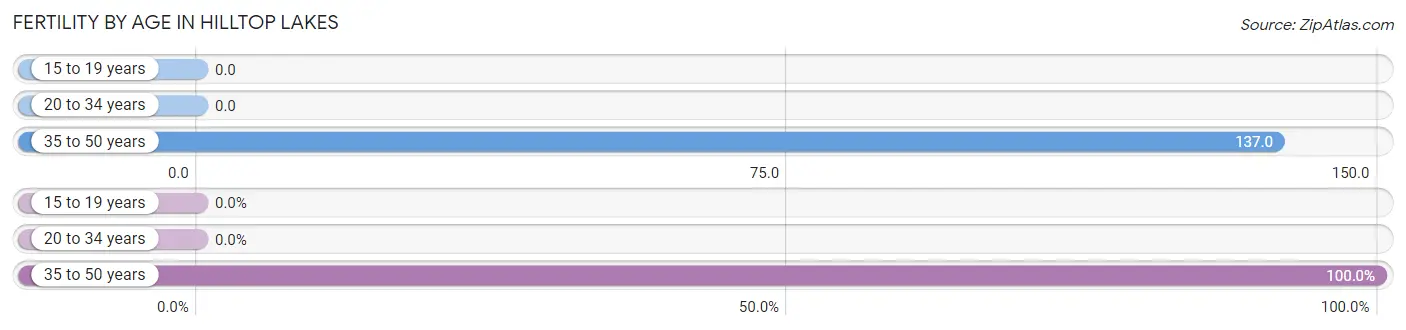
| Age Bracket | Women with Births | Births / 1,000 Women |
| 15 to 19 years | 0 (0.0%) | 0.0 |
| 20 to 34 years | 0 (0.0%) | 0.0 |
| 35 to 50 years | 10 (100.0%) | 137.0 |
| Total | 10 (100.0%) | 137.0 |
Fertility by Age by Marriage Status in Hilltop Lakes
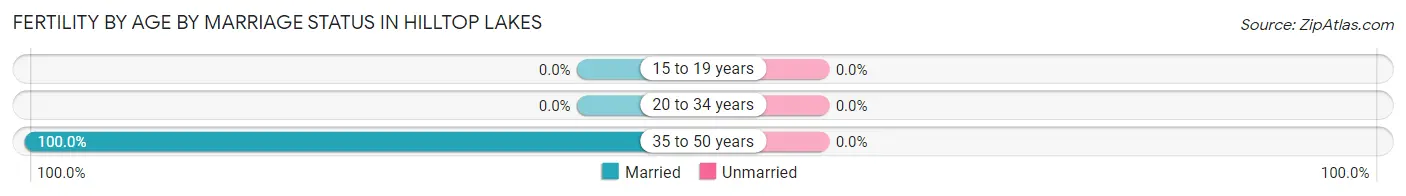
| Age Bracket | Married | Unmarried |
| 15 to 19 years | 0 (0.0%) | 0 (0.0%) |
| 20 to 34 years | 0 (0.0%) | 0 (0.0%) |
| 35 to 50 years | 10 (100.0%) | 0 (0.0%) |
| Total | 10 (100.0%) | 0 (0.0%) |
Fertility by Education in Hilltop Lakes
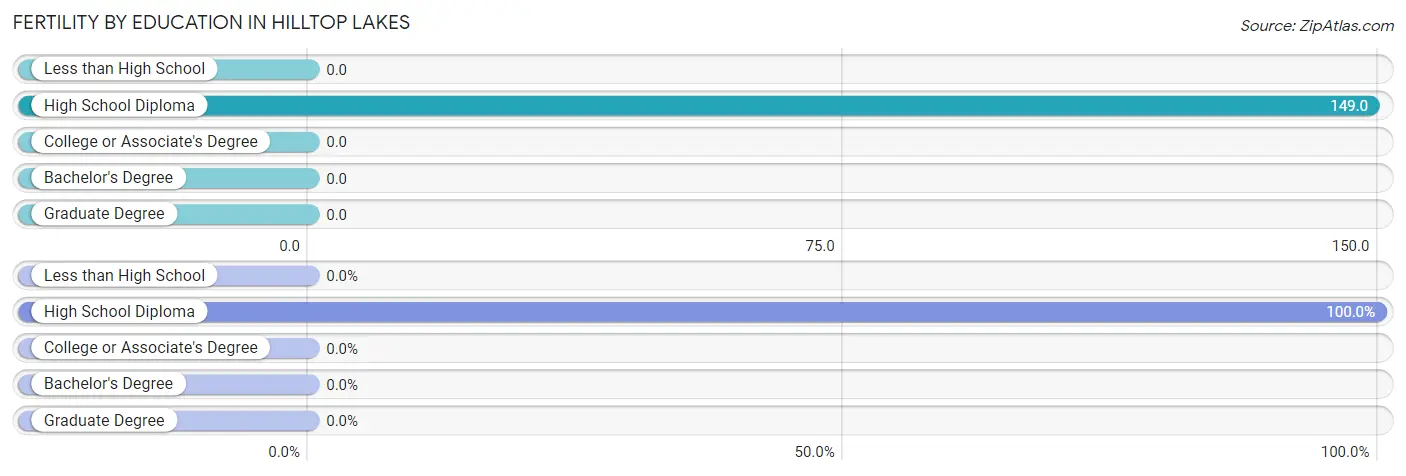
| Educational Attainment | Women with Births | Births / 1,000 Women |
| Less than High School | 0 (0.0%) | 0.0 |
| High School Diploma | 10 (100.0%) | 149.0 |
| College or Associate's Degree | 0 (0.0%) | 0.0 |
| Bachelor's Degree | 0 (0.0%) | 0.0 |
| Graduate Degree | 0 (0.0%) | 0.0 |
| Total | 10 (100.0%) | 137.0 |
Fertility by Education by Marriage Status in Hilltop Lakes
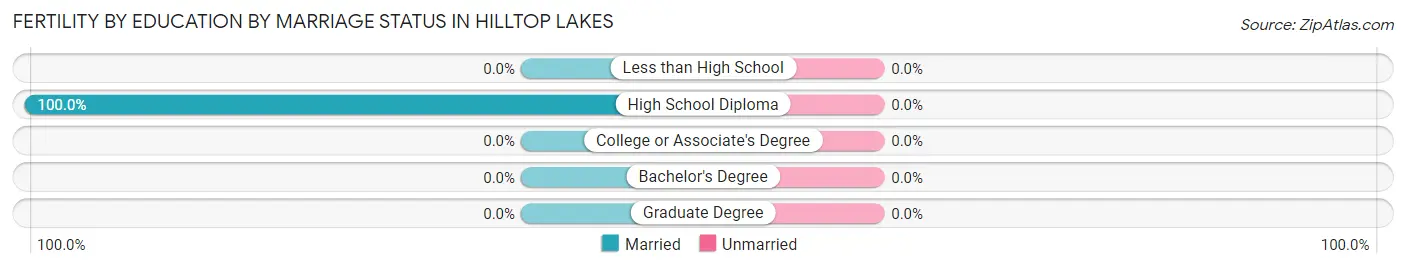
| Educational Attainment | Married | Unmarried |
| Less than High School | 0 (0.0%) | 0 (0.0%) |
| High School Diploma | 10 (100.0%) | 0 (0.0%) |
| College or Associate's Degree | 0 (0.0%) | 0 (0.0%) |
| Bachelor's Degree | 0 (0.0%) | 0 (0.0%) |
| Graduate Degree | 0 (0.0%) | 0 (0.0%) |
| Total | 10 (100.0%) | 0 (0.0%) |
Employment Characteristics in Hilltop Lakes
Employment by Class of Employer in Hilltop Lakes
Among the 339 employed individuals in Hilltop Lakes, private company employees (281 | 82.9%), state government employees (39 | 11.5%), and self-employed (not incorporated) (13 | 3.8%) make up the most common classes of employment.
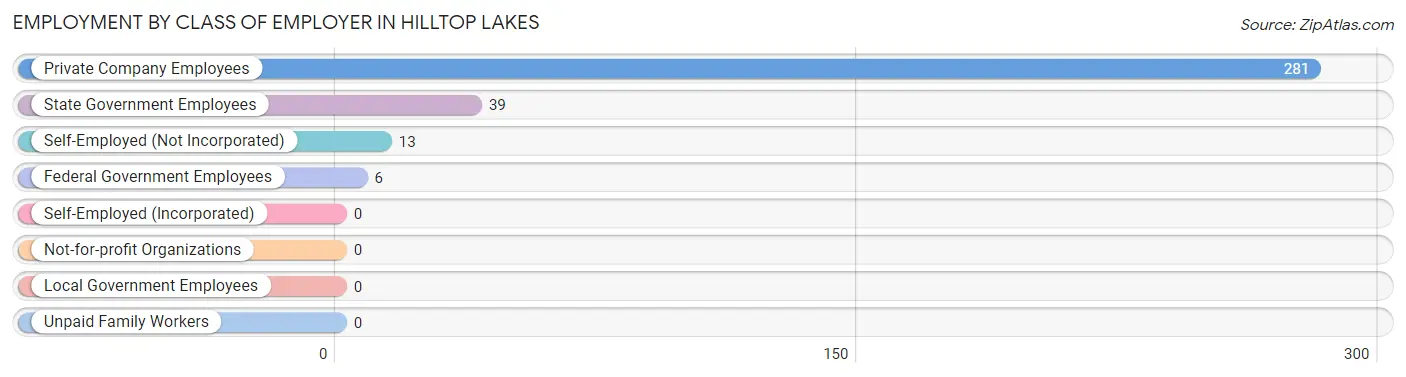
| Employer Class | # Employees | % Employees |
| Private Company Employees | 281 | 82.9% |
| Self-Employed (Incorporated) | 0 | 0.0% |
| Self-Employed (Not Incorporated) | 13 | 3.8% |
| Not-for-profit Organizations | 0 | 0.0% |
| Local Government Employees | 0 | 0.0% |
| State Government Employees | 39 | 11.5% |
| Federal Government Employees | 6 | 1.8% |
| Unpaid Family Workers | 0 | 0.0% |
| Total | 339 | 100.0% |
Employment Status by Age in Hilltop Lakes
According to the labor force statistics for Hilltop Lakes, out of the total population over 16 years of age (639), 54.1% or 346 individuals are in the labor force, with 2.0% or 7 of them unemployed. The age group with the highest labor force participation rate is 45 to 54 years, with 100.0% or 113 individuals in the labor force. Within the labor force, the 60 to 64 years age range has the highest percentage of unemployed individuals, with 6.1% or 7 of them being unemployed.
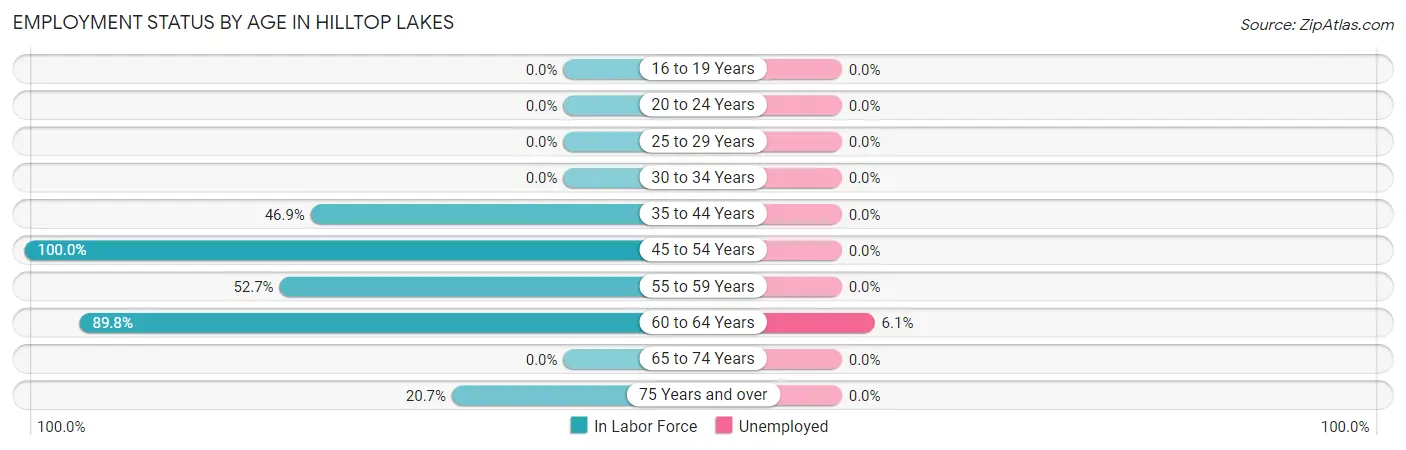
| Age Bracket | In Labor Force | Unemployed |
| 16 to 19 Years | 0 (0.0%) | 0 (0.0%) |
| 20 to 24 Years | 0 (0.0%) | 0 (0.0%) |
| 25 to 29 Years | 0 (0.0%) | 0 (0.0%) |
| 30 to 34 Years | 0 (0.0%) | 0 (0.0%) |
| 35 to 44 Years | 30 (46.9%) | 0 (0.0%) |
| 45 to 54 Years | 113 (100.0%) | 0 (0.0%) |
| 55 to 59 Years | 58 (52.7%) | 0 (0.0%) |
| 60 to 64 Years | 115 (89.8%) | 7 (6.1%) |
| 65 to 74 Years | 0 (0.0%) | 0 (0.0%) |
| 75 Years and over | 30 (20.7%) | 0 (0.0%) |
| Total | 346 (54.1%) | 7 (2.0%) |
Employment Status by Educational Attainment in Hilltop Lakes
According to labor force statistics for Hilltop Lakes, 76.1% of individuals (316) out of the total population between 25 and 64 years of age (415) are in the labor force, with 2.2% or 7 of them being unemployed. The group with the highest labor force participation rate are those with the educational attainment of less than high school, with 100.0% or 14 individuals in the labor force. Within the labor force, individuals with college / associate degree education have the highest percentage of unemployment, with 7.1% or 7 of them being unemployed.
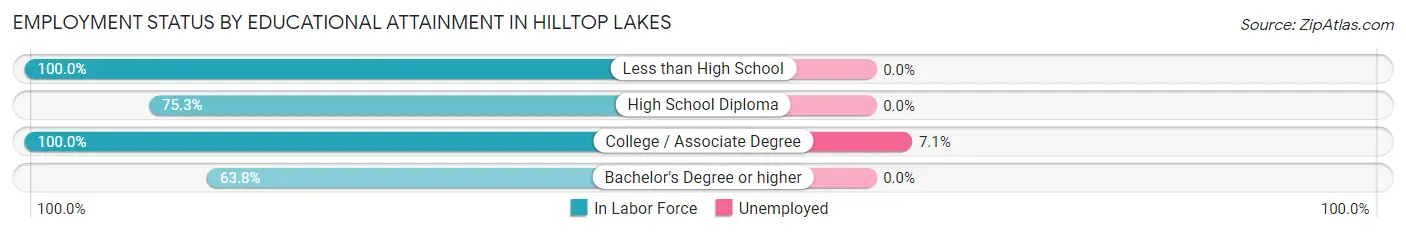
| Educational Attainment | In Labor Force | Unemployed |
| Less than High School | 14 (100.0%) | 0 (0.0%) |
| High School Diploma | 70 (75.3%) | 0 (0.0%) |
| College / Associate Degree | 98 (100.0%) | 7 (7.1%) |
| Bachelor's Degree or higher | 134 (63.8%) | 0 (0.0%) |
| Total | 316 (76.1%) | 9 (2.2%) |
Employment Occupations by Sex in Hilltop Lakes
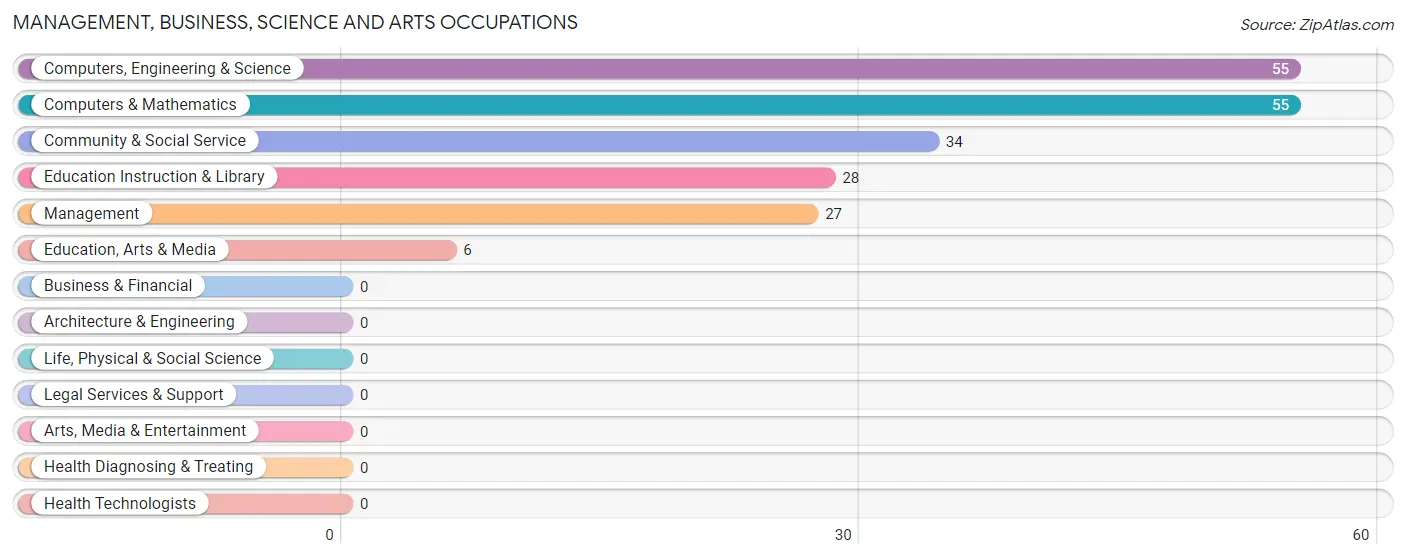
Management, Business, Science and Arts Occupations
The most common Management, Business, Science and Arts occupations in Hilltop Lakes are Computers, Engineering & Science (55 | 16.2%), Computers & Mathematics (55 | 16.2%), Community & Social Service (34 | 10.0%), Education Instruction & Library (28 | 8.3%), and Management (27 | 8.0%).
Management, Business, Science and Arts Occupations by Sex
Within the Management, Business, Science and Arts occupations in Hilltop Lakes, the most male-oriented occupations are Management (100.0%), Computers, Engineering & Science (100.0%), and Computers & Mathematics (100.0%), while the most female-oriented occupations are Community & Social Service (100.0%), Education, Arts & Media (100.0%), and Education Instruction & Library (100.0%).
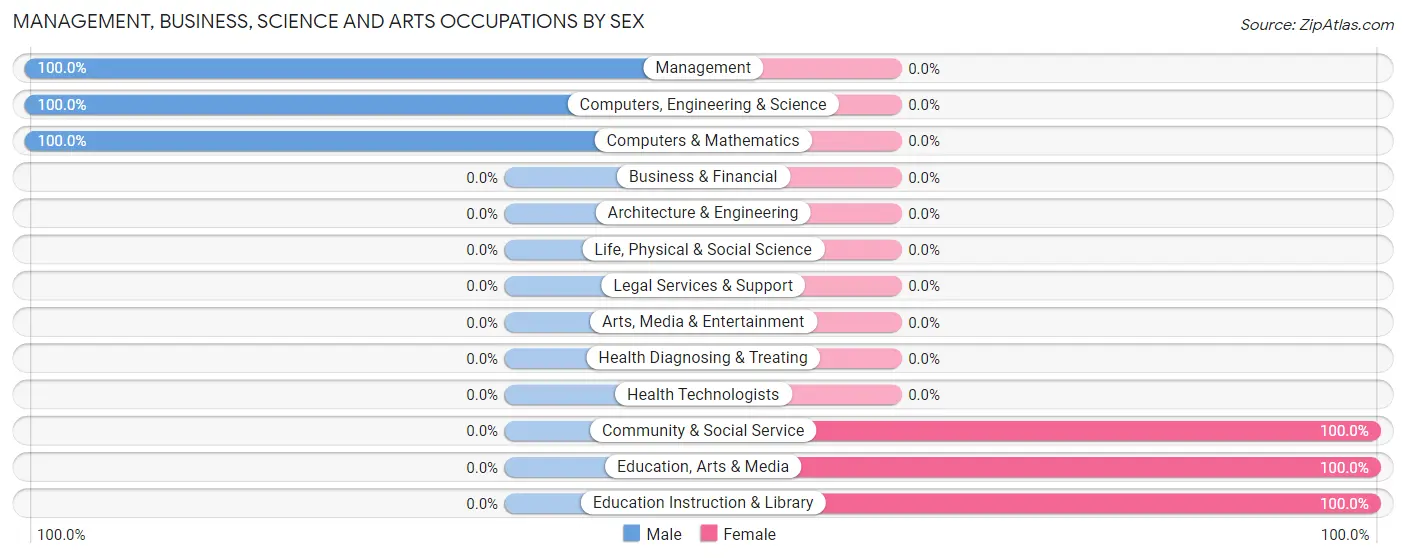
| Occupation | Male | Female |
| Management | 27 (100.0%) | 0 (0.0%) |
| Business & Financial | 0 (0.0%) | 0 (0.0%) |
| Computers, Engineering & Science | 55 (100.0%) | 0 (0.0%) |
| Computers & Mathematics | 55 (100.0%) | 0 (0.0%) |
| Architecture & Engineering | 0 (0.0%) | 0 (0.0%) |
| Life, Physical & Social Science | 0 (0.0%) | 0 (0.0%) |
| Community & Social Service | 0 (0.0%) | 34 (100.0%) |
| Education, Arts & Media | 0 (0.0%) | 6 (100.0%) |
| Legal Services & Support | 0 (0.0%) | 0 (0.0%) |
| Education Instruction & Library | 0 (0.0%) | 28 (100.0%) |
| Arts, Media & Entertainment | 0 (0.0%) | 0 (0.0%) |
| Health Diagnosing & Treating | 0 (0.0%) | 0 (0.0%) |
| Health Technologists | 0 (0.0%) | 0 (0.0%) |
| Total (Category) | 82 (70.7%) | 34 (29.3%) |
| Total (Overall) | 199 (58.7%) | 140 (41.3%) |
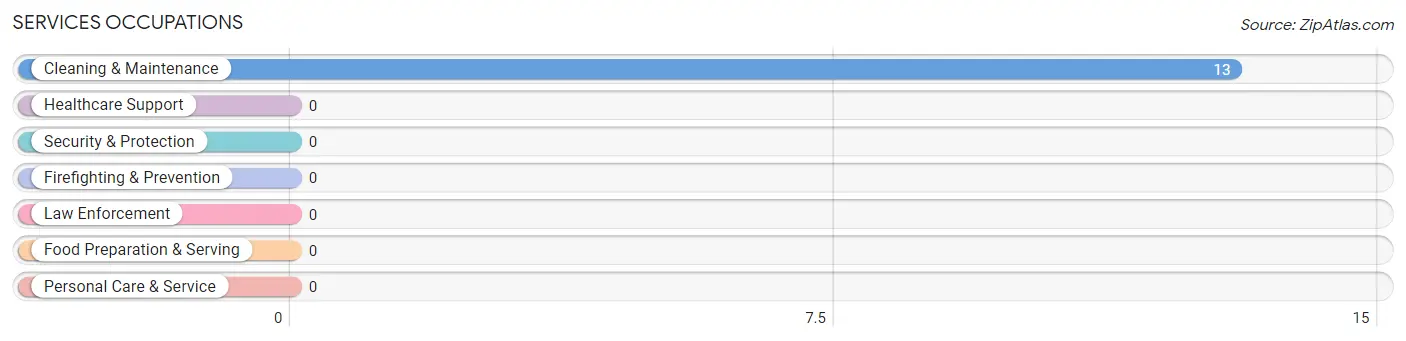
Services Occupations
The most common Services occupations in Hilltop Lakes are , and Cleaning & Maintenance (13 | 3.8%).
Services Occupations by Sex
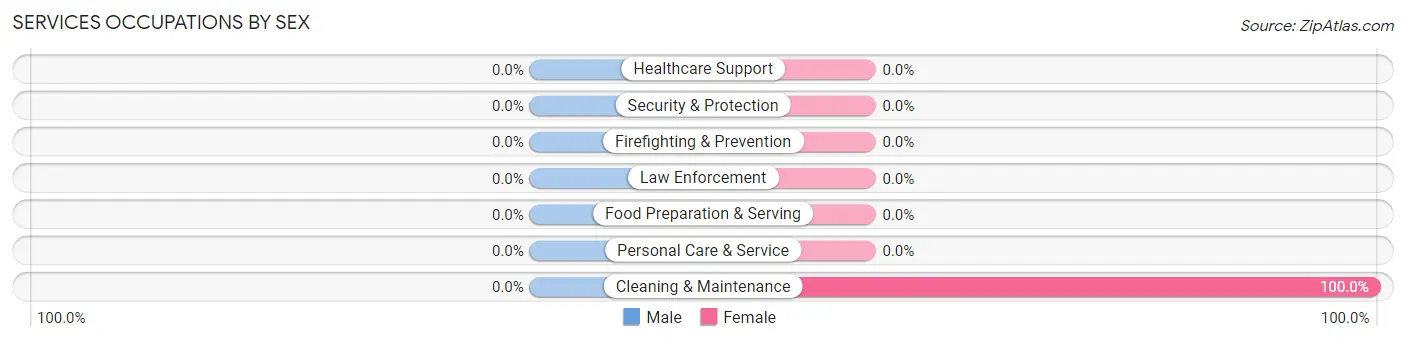
| Occupation | Male | Female |
| Healthcare Support | 0 (0.0%) | 0 (0.0%) |
| Security & Protection | 0 (0.0%) | 0 (0.0%) |
| Firefighting & Prevention | 0 (0.0%) | 0 (0.0%) |
| Law Enforcement | 0 (0.0%) | 0 (0.0%) |
| Food Preparation & Serving | 0 (0.0%) | 0 (0.0%) |
| Cleaning & Maintenance | 0 (0.0%) | 13 (100.0%) |
| Personal Care & Service | 0 (0.0%) | 0 (0.0%) |
| Total (Category) | 0 (0.0%) | 13 (100.0%) |
| Total (Overall) | 199 (58.7%) | 140 (41.3%) |
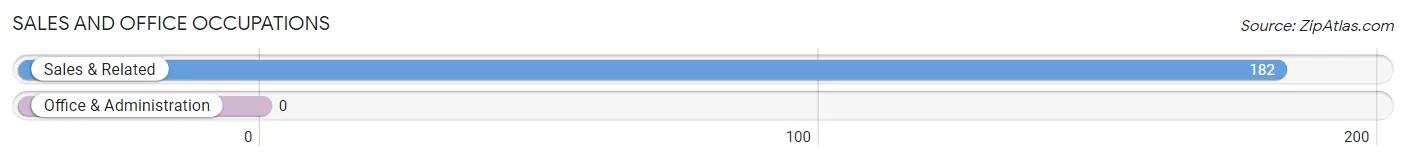
Sales and Office Occupations
The most common Sales and Office occupations in Hilltop Lakes are , and Sales & Related (182 | 53.7%).
Sales and Office Occupations by Sex
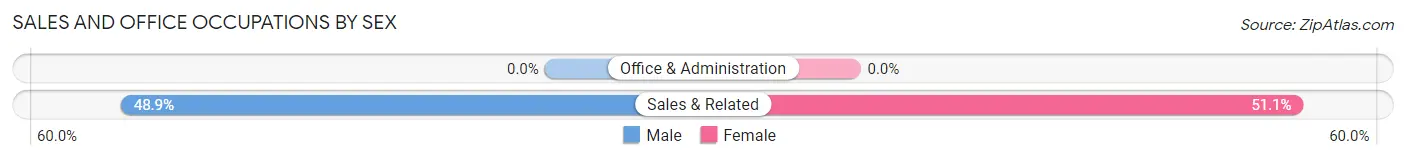
| Occupation | Male | Female |
| Sales & Related | 89 (48.9%) | 93 (51.1%) |
| Office & Administration | 0 (0.0%) | 0 (0.0%) |
| Total (Category) | 89 (48.9%) | 93 (51.1%) |
| Total (Overall) | 199 (58.7%) | 140 (41.3%) |
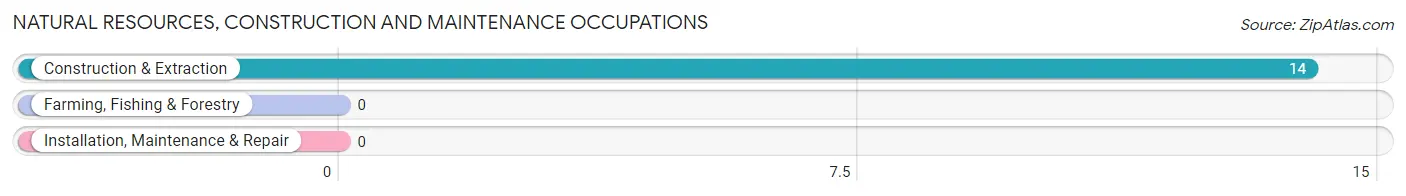
Natural Resources, Construction and Maintenance Occupations
The most common Natural Resources, Construction and Maintenance occupations in Hilltop Lakes are , and Construction & Extraction (14 | 4.1%).
Natural Resources, Construction and Maintenance Occupations by Sex
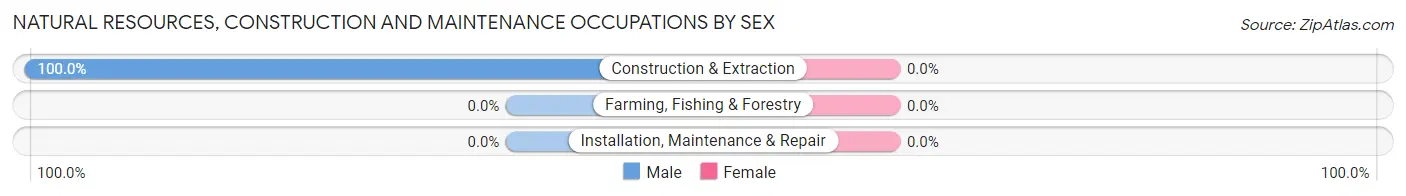
| Occupation | Male | Female |
| Farming, Fishing & Forestry | 0 (0.0%) | 0 (0.0%) |
| Construction & Extraction | 14 (100.0%) | 0 (0.0%) |
| Installation, Maintenance & Repair | 0 (0.0%) | 0 (0.0%) |
| Total (Category) | 14 (100.0%) | 0 (0.0%) |
| Total (Overall) | 199 (58.7%) | 140 (41.3%) |
Production, Transportation and Moving Occupations
The most common Production, Transportation and Moving occupations in Hilltop Lakes are , and Transportation (14 | 4.1%).
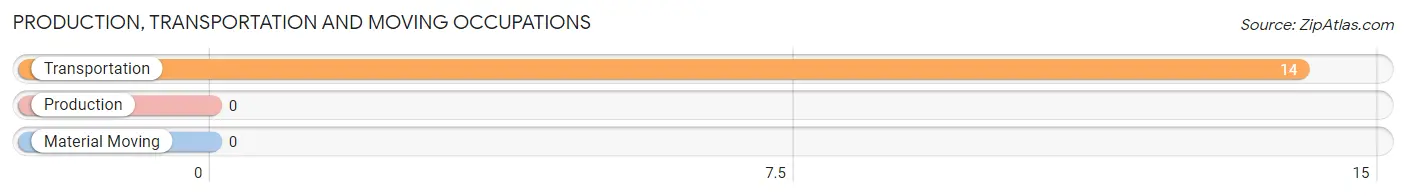
Production, Transportation and Moving Occupations by Sex
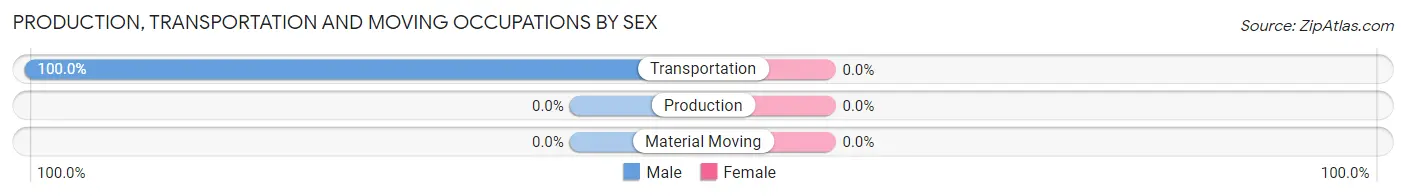
| Occupation | Male | Female |
| Production | 0 (0.0%) | 0 (0.0%) |
| Transportation | 14 (100.0%) | 0 (0.0%) |
| Material Moving | 0 (0.0%) | 0 (0.0%) |
| Total (Category) | 14 (100.0%) | 0 (0.0%) |
| Total (Overall) | 199 (58.7%) | 140 (41.3%) |
Employment Industries by Sex in Hilltop Lakes
Employment Industries in Hilltop Lakes
The major employment industries in Hilltop Lakes include Retail Trade (107 | 31.6%), Administrative & Support (71 | 20.9%), Manufacturing (55 | 16.2%), Real Estate, Rental & Leasing (31 | 9.1%), and Educational Services (28 | 8.3%).
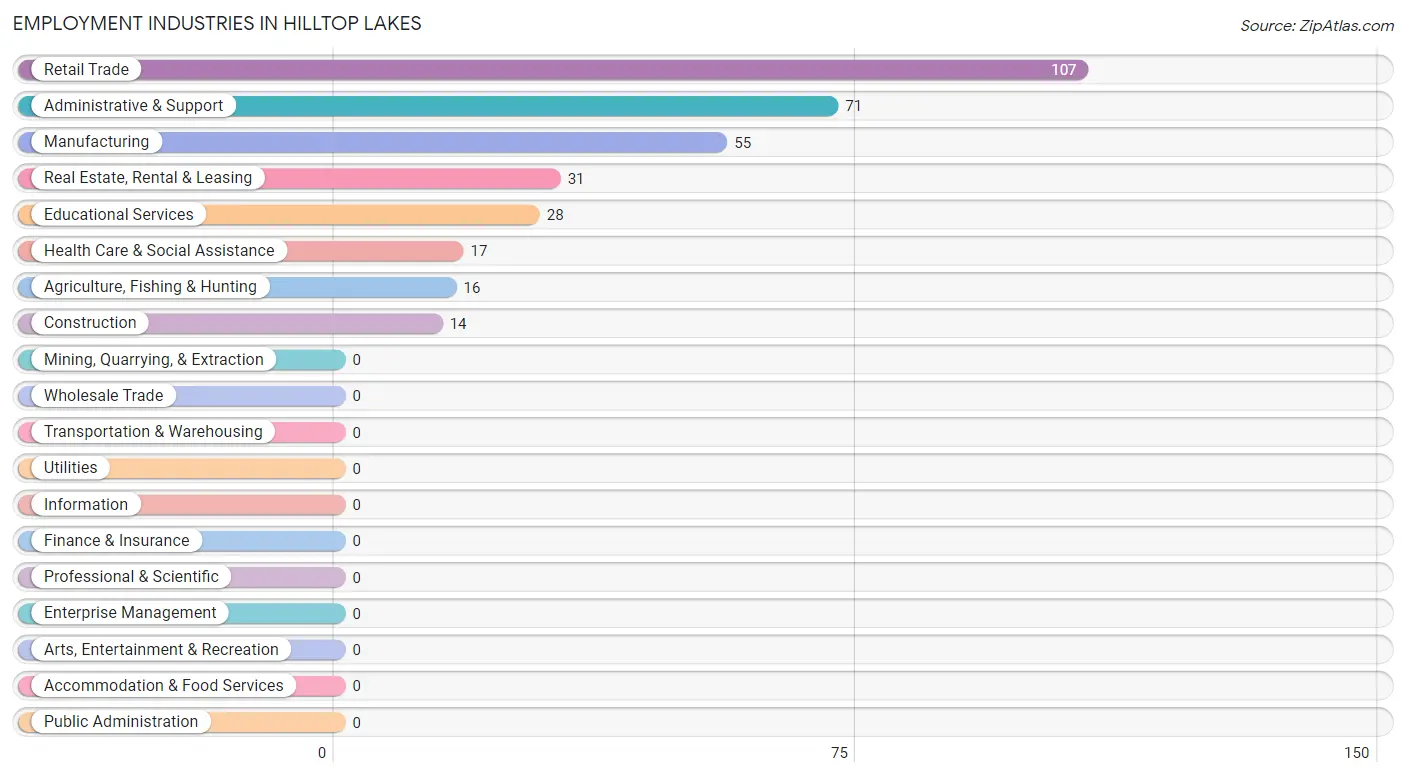
Employment Industries by Sex in Hilltop Lakes
The Hilltop Lakes industries that see more men than women are Agriculture, Fishing & Hunting (100.0%), Construction (100.0%), and Manufacturing (100.0%), whereas the industries that tend to have a higher number of women are Educational Services (100.0%), Retail Trade (86.9%), and Health Care & Social Assistance (35.3%).
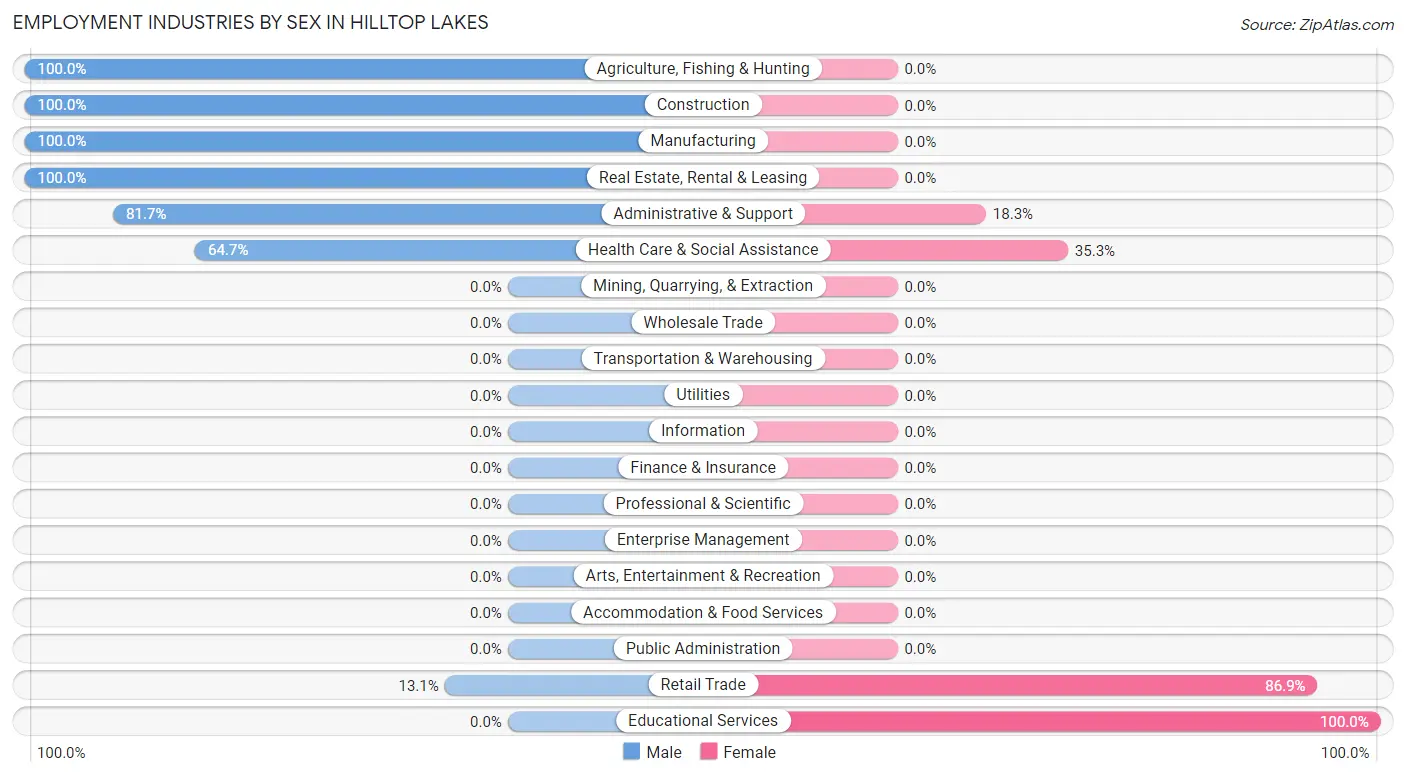
| Industry | Male | Female |
| Agriculture, Fishing & Hunting | 16 (100.0%) | 0 (0.0%) |
| Mining, Quarrying, & Extraction | 0 (0.0%) | 0 (0.0%) |
| Construction | 14 (100.0%) | 0 (0.0%) |
| Manufacturing | 55 (100.0%) | 0 (0.0%) |
| Wholesale Trade | 0 (0.0%) | 0 (0.0%) |
| Retail Trade | 14 (13.1%) | 93 (86.9%) |
| Transportation & Warehousing | 0 (0.0%) | 0 (0.0%) |
| Utilities | 0 (0.0%) | 0 (0.0%) |
| Information | 0 (0.0%) | 0 (0.0%) |
| Finance & Insurance | 0 (0.0%) | 0 (0.0%) |
| Real Estate, Rental & Leasing | 31 (100.0%) | 0 (0.0%) |
| Professional & Scientific | 0 (0.0%) | 0 (0.0%) |
| Enterprise Management | 0 (0.0%) | 0 (0.0%) |
| Administrative & Support | 58 (81.7%) | 13 (18.3%) |
| Educational Services | 0 (0.0%) | 28 (100.0%) |
| Health Care & Social Assistance | 11 (64.7%) | 6 (35.3%) |
| Arts, Entertainment & Recreation | 0 (0.0%) | 0 (0.0%) |
| Accommodation & Food Services | 0 (0.0%) | 0 (0.0%) |
| Public Administration | 0 (0.0%) | 0 (0.0%) |
| Total | 199 (58.7%) | 140 (41.3%) |
Education in Hilltop Lakes
School Enrollment in Hilltop Lakes
The most common levels of schooling among the 81 students in Hilltop Lakes are middle school (68 | 84.0%), and elementary school (13 | 16.1%).
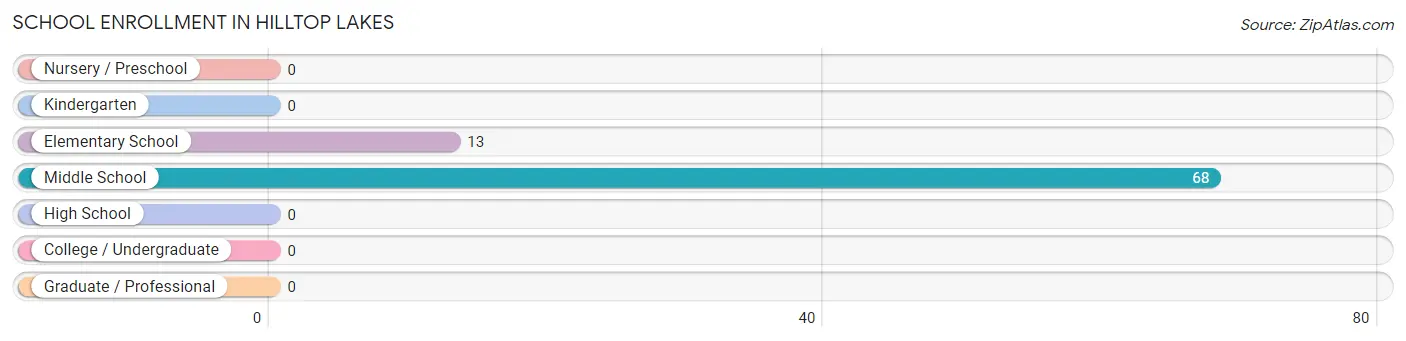
| School Level | # Students | % Students |
| Nursery / Preschool | 0 | 0.0% |
| Kindergarten | 0 | 0.0% |
| Elementary School | 13 | 16.1% |
| Middle School | 68 | 84.0% |
| High School | 0 | 0.0% |
| College / Undergraduate | 0 | 0.0% |
| Graduate / Professional | 0 | 0.0% |
| Total | 81 | 100.0% |
School Enrollment by Age by Funding Source in Hilltop Lakes
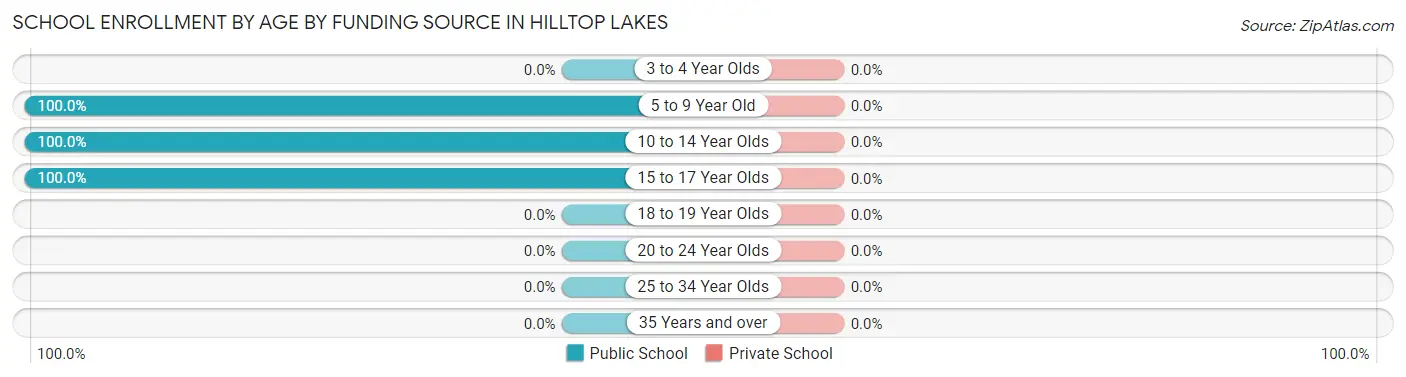
| Age Bracket | Public School | Private School |
| 3 to 4 Year Olds | 0 (0.0%) | 0 (0.0%) |
| 5 to 9 Year Old | 13 (100.0%) | 0 (0.0%) |
| 10 to 14 Year Olds | 41 (100.0%) | 0 (0.0%) |
| 15 to 17 Year Olds | 27 (100.0%) | 0 (0.0%) |
| 18 to 19 Year Olds | 0 (0.0%) | 0 (0.0%) |
| 20 to 24 Year Olds | 0 (0.0%) | 0 (0.0%) |
| 25 to 34 Year Olds | 0 (0.0%) | 0 (0.0%) |
| 35 Years and over | 0 (0.0%) | 0 (0.0%) |
| Total | 81 (100.0%) | 0 (0.0%) |
Educational Attainment by Field of Study in Hilltop Lakes
Education (76 | 25.8%), engineering (70 | 23.7%), science & technology (52 | 17.6%), liberal arts & history (31 | 10.5%), and communications (24 | 8.1%) are the most common fields of study among 295 individuals in Hilltop Lakes who have obtained a bachelor's degree or higher.
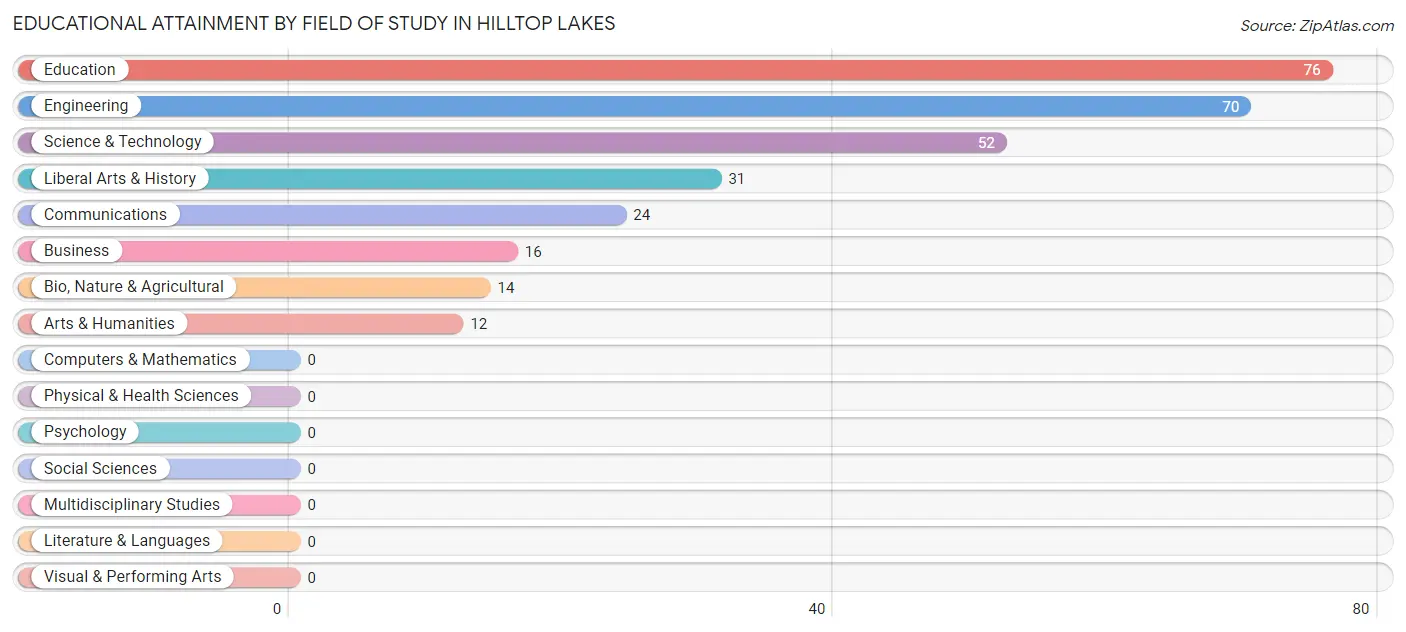
| Field of Study | # Graduates | % Graduates |
| Computers & Mathematics | 0 | 0.0% |
| Bio, Nature & Agricultural | 14 | 4.8% |
| Physical & Health Sciences | 0 | 0.0% |
| Psychology | 0 | 0.0% |
| Social Sciences | 0 | 0.0% |
| Engineering | 70 | 23.7% |
| Multidisciplinary Studies | 0 | 0.0% |
| Science & Technology | 52 | 17.6% |
| Business | 16 | 5.4% |
| Education | 76 | 25.8% |
| Literature & Languages | 0 | 0.0% |
| Liberal Arts & History | 31 | 10.5% |
| Visual & Performing Arts | 0 | 0.0% |
| Communications | 24 | 8.1% |
| Arts & Humanities | 12 | 4.1% |
| Total | 295 | 100.0% |
Transportation & Commute in Hilltop Lakes
Vehicle Availability by Sex in Hilltop Lakes
The most prevalent vehicle ownership categories in Hilltop Lakes are males with 2 vehicles (83, accounting for 41.7%) and females with 2 vehicles (93, making up 59.3%).
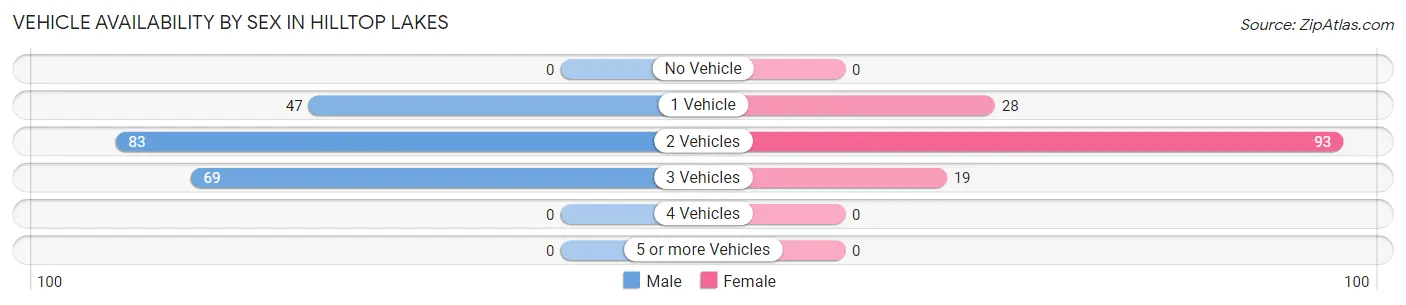
| Vehicles Available | Male | Female |
| No Vehicle | 0 (0.0%) | 0 (0.0%) |
| 1 Vehicle | 47 (23.6%) | 28 (20.0%) |
| 2 Vehicles | 83 (41.7%) | 93 (66.4%) |
| 3 Vehicles | 69 (34.7%) | 19 (13.6%) |
| 4 Vehicles | 0 (0.0%) | 0 (0.0%) |
| 5 or more Vehicles | 0 (0.0%) | 0 (0.0%) |
| Total | 199 (100.0%) | 140 (100.0%) |
Commute Time in Hilltop Lakes
The most frequently occuring commute durations in Hilltop Lakes are 10 to 14 minutes (125 commuters, 36.9%), 60 to 89 minutes (109 commuters, 32.2%), and 45 to 59 minutes (45 commuters, 13.3%).
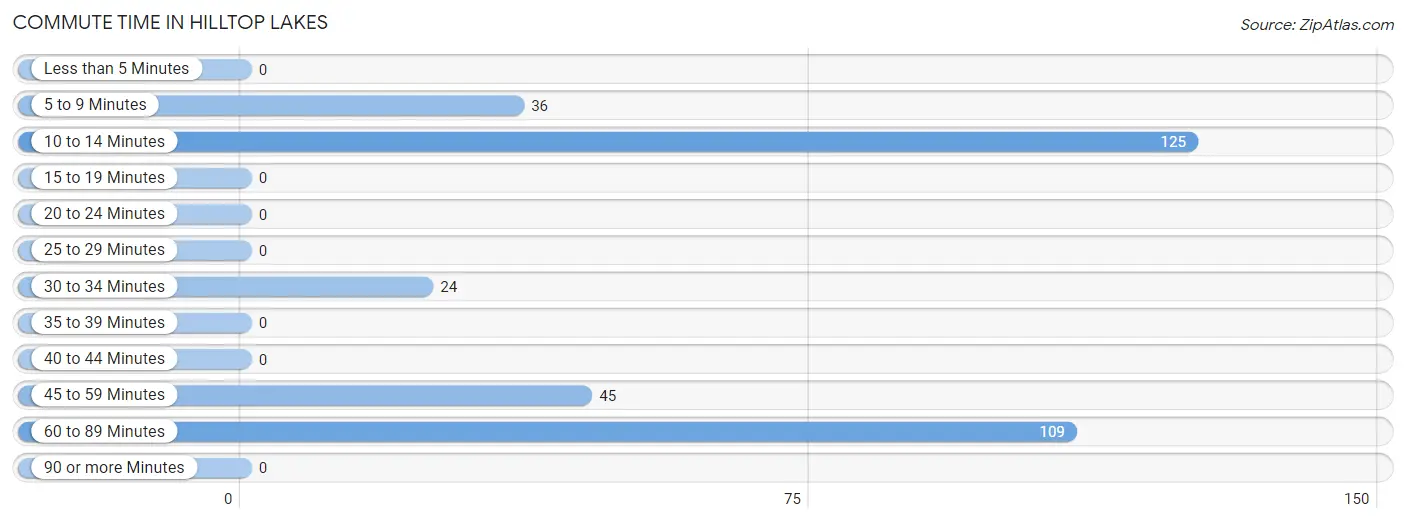
| Commute Time | # Commuters | % Commuters |
| Less than 5 Minutes | 0 | 0.0% |
| 5 to 9 Minutes | 36 | 10.6% |
| 10 to 14 Minutes | 125 | 36.9% |
| 15 to 19 Minutes | 0 | 0.0% |
| 20 to 24 Minutes | 0 | 0.0% |
| 25 to 29 Minutes | 0 | 0.0% |
| 30 to 34 Minutes | 24 | 7.1% |
| 35 to 39 Minutes | 0 | 0.0% |
| 40 to 44 Minutes | 0 | 0.0% |
| 45 to 59 Minutes | 45 | 13.3% |
| 60 to 89 Minutes | 109 | 32.2% |
| 90 or more Minutes | 0 | 0.0% |
Commute Time by Sex in Hilltop Lakes
The most common commute times in Hilltop Lakes are 60 to 89 minutes (103 commuters, 51.8%) for males and 10 to 14 minutes (98 commuters, 70.0%) for females.
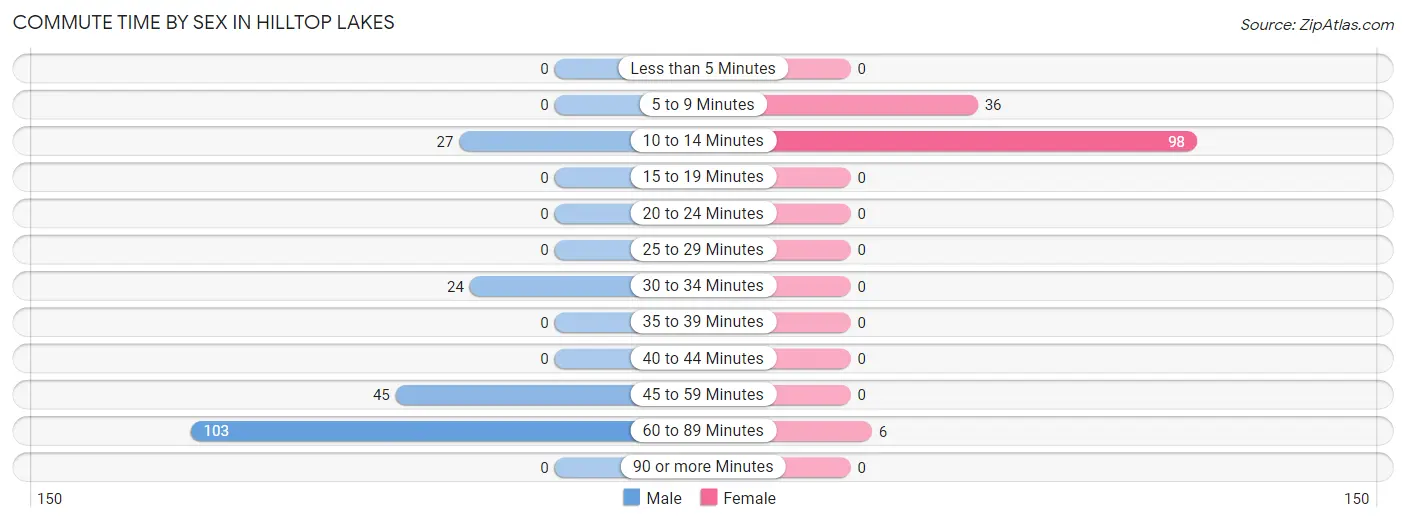
| Commute Time | Male | Female |
| Less than 5 Minutes | 0 (0.0%) | 0 (0.0%) |
| 5 to 9 Minutes | 0 (0.0%) | 36 (25.7%) |
| 10 to 14 Minutes | 27 (13.6%) | 98 (70.0%) |
| 15 to 19 Minutes | 0 (0.0%) | 0 (0.0%) |
| 20 to 24 Minutes | 0 (0.0%) | 0 (0.0%) |
| 25 to 29 Minutes | 0 (0.0%) | 0 (0.0%) |
| 30 to 34 Minutes | 24 (12.1%) | 0 (0.0%) |
| 35 to 39 Minutes | 0 (0.0%) | 0 (0.0%) |
| 40 to 44 Minutes | 0 (0.0%) | 0 (0.0%) |
| 45 to 59 Minutes | 45 (22.6%) | 0 (0.0%) |
| 60 to 89 Minutes | 103 (51.8%) | 6 (4.3%) |
| 90 or more Minutes | 0 (0.0%) | 0 (0.0%) |
Time of Departure to Work by Sex in Hilltop Lakes
The most frequent times of departure to work in Hilltop Lakes are 6:00 AM to 6:29 AM (73, 36.7%) for males and 7:30 AM to 7:59 AM (63, 45.0%) for females.
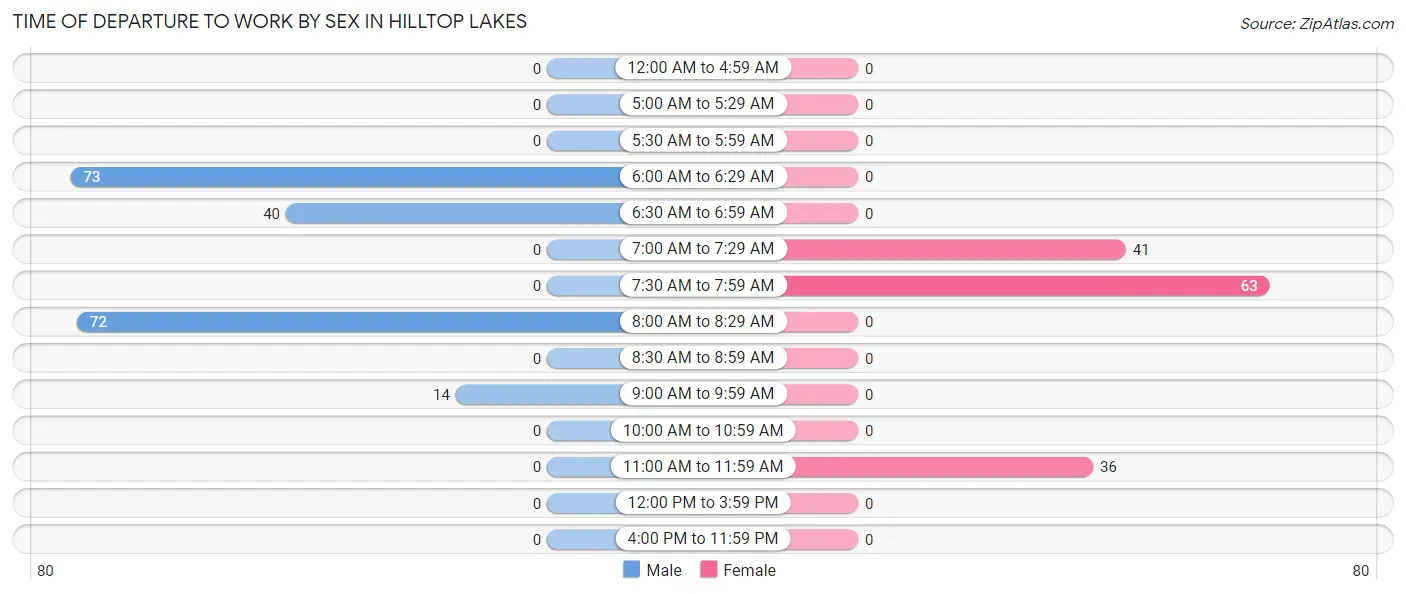
| Time of Departure | Male | Female |
| 12:00 AM to 4:59 AM | 0 (0.0%) | 0 (0.0%) |
| 5:00 AM to 5:29 AM | 0 (0.0%) | 0 (0.0%) |
| 5:30 AM to 5:59 AM | 0 (0.0%) | 0 (0.0%) |
| 6:00 AM to 6:29 AM | 73 (36.7%) | 0 (0.0%) |
| 6:30 AM to 6:59 AM | 40 (20.1%) | 0 (0.0%) |
| 7:00 AM to 7:29 AM | 0 (0.0%) | 41 (29.3%) |
| 7:30 AM to 7:59 AM | 0 (0.0%) | 63 (45.0%) |
| 8:00 AM to 8:29 AM | 72 (36.2%) | 0 (0.0%) |
| 8:30 AM to 8:59 AM | 0 (0.0%) | 0 (0.0%) |
| 9:00 AM to 9:59 AM | 14 (7.0%) | 0 (0.0%) |
| 10:00 AM to 10:59 AM | 0 (0.0%) | 0 (0.0%) |
| 11:00 AM to 11:59 AM | 0 (0.0%) | 36 (25.7%) |
| 12:00 PM to 3:59 PM | 0 (0.0%) | 0 (0.0%) |
| 4:00 PM to 11:59 PM | 0 (0.0%) | 0 (0.0%) |
| Total | 199 (100.0%) | 140 (100.0%) |
Housing Occupancy in Hilltop Lakes
Occupancy by Ownership in Hilltop Lakes
Of the total 329 dwellings in Hilltop Lakes, owner-occupied units account for 249 (75.7%), while renter-occupied units make up 80 (24.3%).
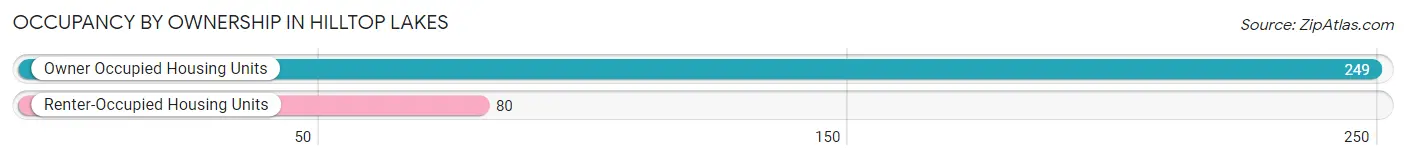
| Occupancy | # Housing Units | % Housing Units |
| Owner Occupied Housing Units | 249 | 75.7% |
| Renter-Occupied Housing Units | 80 | 24.3% |
| Total Occupied Housing Units | 329 | 100.0% |
Occupancy by Household Size in Hilltop Lakes
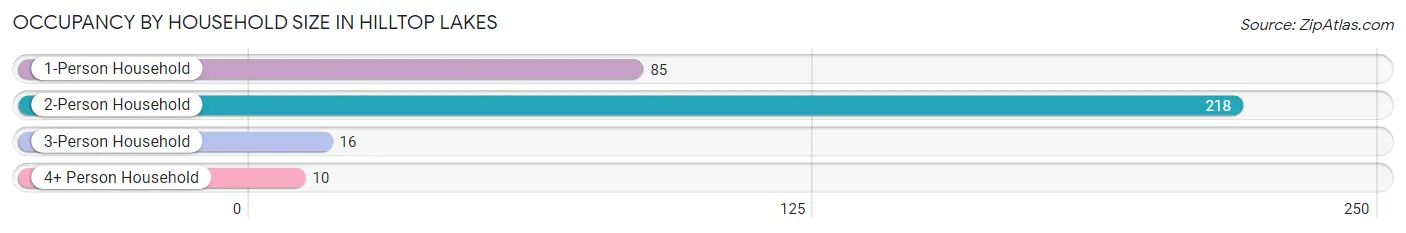
| Household Size | # Housing Units | % Housing Units |
| 1-Person Household | 85 | 25.8% |
| 2-Person Household | 218 | 66.3% |
| 3-Person Household | 16 | 4.9% |
| 4+ Person Household | 10 | 3.0% |
| Total Housing Units | 329 | 100.0% |
Occupancy by Ownership by Household Size in Hilltop Lakes
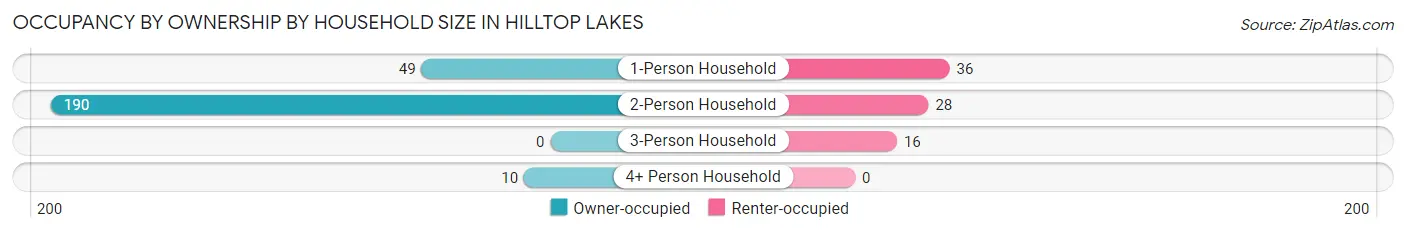
| Household Size | Owner-occupied | Renter-occupied |
| 1-Person Household | 49 (57.7%) | 36 (42.3%) |
| 2-Person Household | 190 (87.2%) | 28 (12.8%) |
| 3-Person Household | 0 (0.0%) | 16 (100.0%) |
| 4+ Person Household | 10 (100.0%) | 0 (0.0%) |
| Total Housing Units | 249 (75.7%) | 80 (24.3%) |
Occupancy by Educational Attainment in Hilltop Lakes
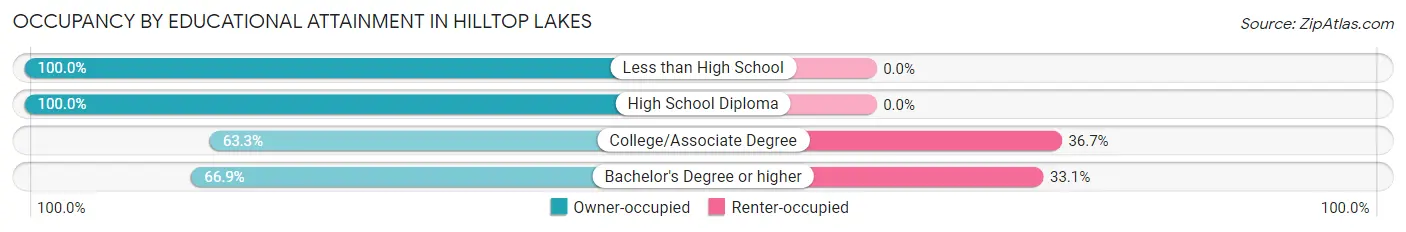
| Household Size | Owner-occupied | Renter-occupied |
| Less than High School | 16 (100.0%) | 0 (0.0%) |
| High School Diploma | 82 (100.0%) | 0 (0.0%) |
| College/Associate Degree | 62 (63.3%) | 36 (36.7%) |
| Bachelor's Degree or higher | 89 (66.9%) | 44 (33.1%) |
Occupancy by Age of Householder in Hilltop Lakes
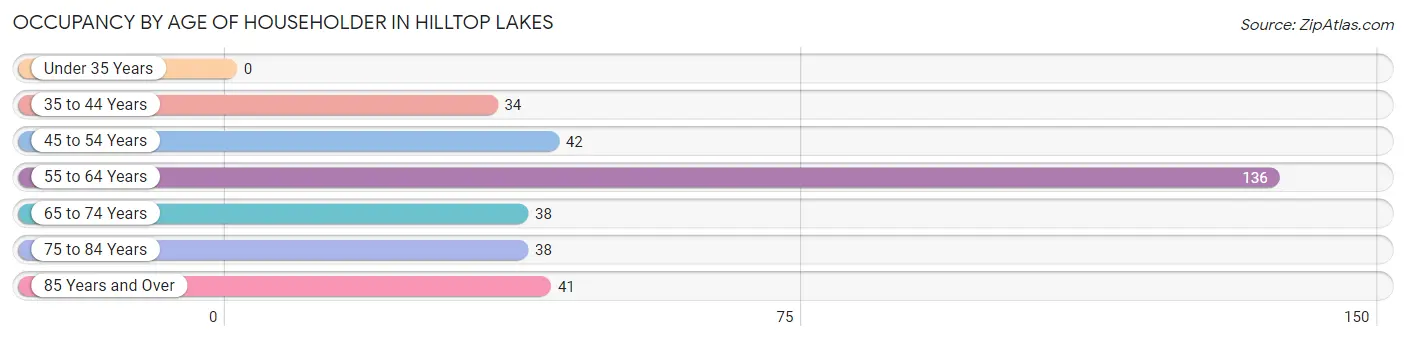
| Age Bracket | # Households | % Households |
| Under 35 Years | 0 | 0.0% |
| 35 to 44 Years | 34 | 10.3% |
| 45 to 54 Years | 42 | 12.8% |
| 55 to 64 Years | 136 | 41.3% |
| 65 to 74 Years | 38 | 11.6% |
| 75 to 84 Years | 38 | 11.6% |
| 85 Years and Over | 41 | 12.5% |
| Total | 329 | 100.0% |
Housing Finances in Hilltop Lakes
Median Income by Occupancy in Hilltop Lakes
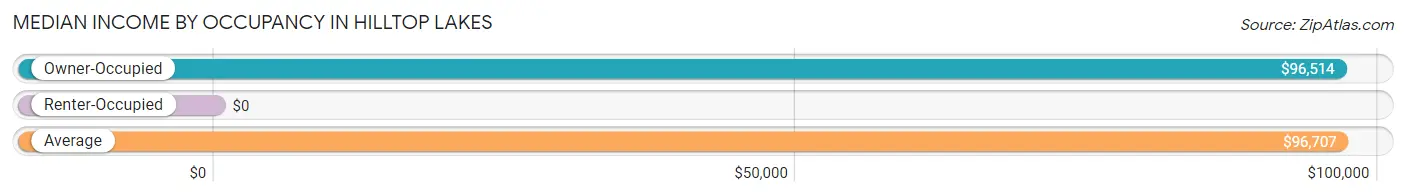
| Occupancy Type | # Households | Median Income |
| Owner-Occupied | 249 (75.7%) | $96,514 |
| Renter-Occupied | 80 (24.3%) | $0 |
| Average | 329 (100.0%) | $96,707 |
Occupancy by Householder Income Bracket in Hilltop Lakes
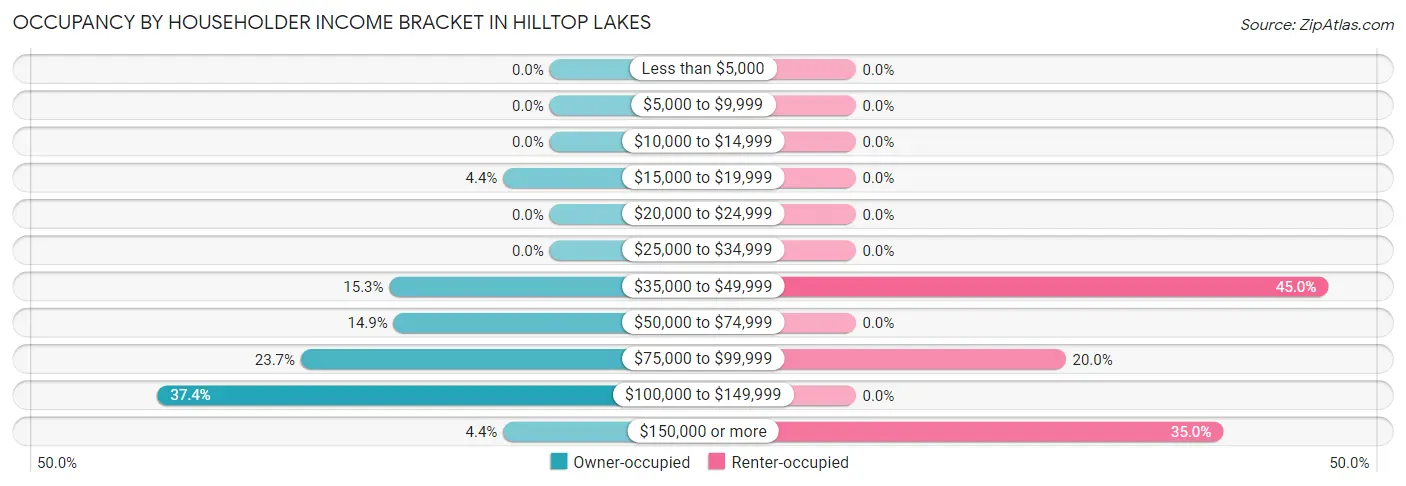
| Income Bracket | Owner-occupied | Renter-occupied |
| Less than $5,000 | 0 (0.0%) | 0 (0.0%) |
| $5,000 to $9,999 | 0 (0.0%) | 0 (0.0%) |
| $10,000 to $14,999 | 0 (0.0%) | 0 (0.0%) |
| $15,000 to $19,999 | 11 (4.4%) | 0 (0.0%) |
| $20,000 to $24,999 | 0 (0.0%) | 0 (0.0%) |
| $25,000 to $34,999 | 0 (0.0%) | 0 (0.0%) |
| $35,000 to $49,999 | 38 (15.3%) | 36 (45.0%) |
| $50,000 to $74,999 | 37 (14.9%) | 0 (0.0%) |
| $75,000 to $99,999 | 59 (23.7%) | 16 (20.0%) |
| $100,000 to $149,999 | 93 (37.3%) | 0 (0.0%) |
| $150,000 or more | 11 (4.4%) | 28 (35.0%) |
| Total | 249 (100.0%) | 80 (100.0%) |
Monthly Housing Cost Tiers in Hilltop Lakes
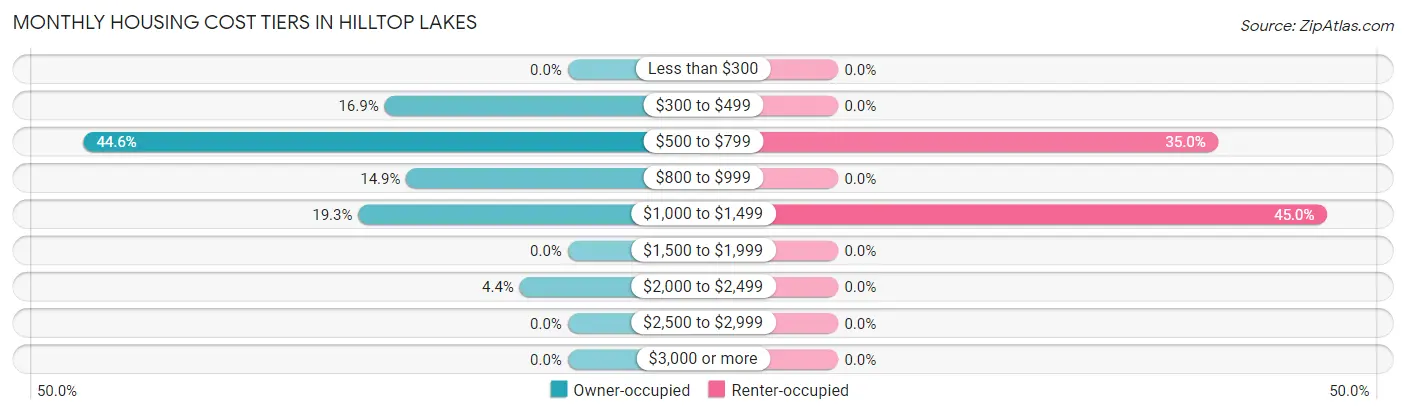
| Monthly Cost | Owner-occupied | Renter-occupied |
| Less than $300 | 0 (0.0%) | 0 (0.0%) |
| $300 to $499 | 42 (16.9%) | 0 (0.0%) |
| $500 to $799 | 111 (44.6%) | 28 (35.0%) |
| $800 to $999 | 37 (14.9%) | 0 (0.0%) |
| $1,000 to $1,499 | 48 (19.3%) | 36 (45.0%) |
| $1,500 to $1,999 | 0 (0.0%) | 0 (0.0%) |
| $2,000 to $2,499 | 11 (4.4%) | 0 (0.0%) |
| $2,500 to $2,999 | 0 (0.0%) | 0 (0.0%) |
| $3,000 or more | 0 (0.0%) | 0 (0.0%) |
| Total | 249 (100.0%) | 80 (100.0%) |
Physical Housing Characteristics in Hilltop Lakes
Housing Structures in Hilltop Lakes
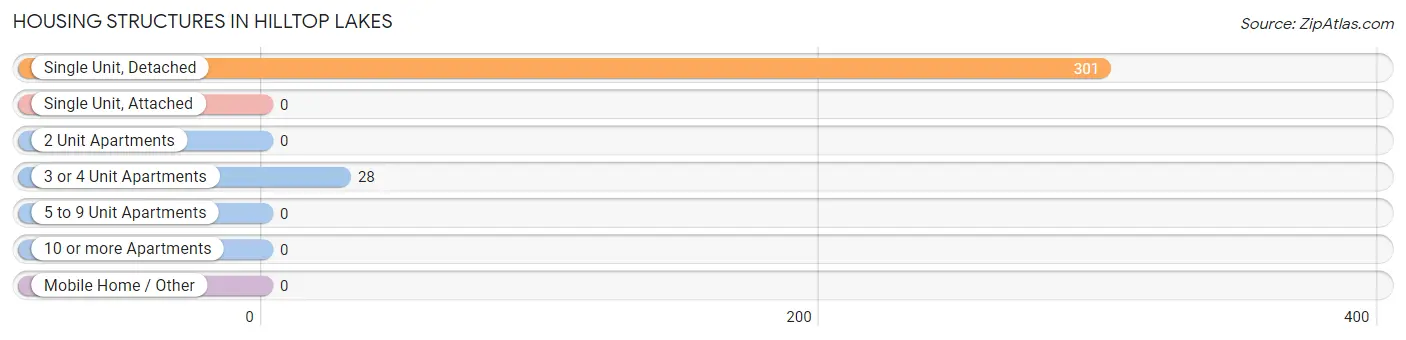
| Structure Type | # Housing Units | % Housing Units |
| Single Unit, Detached | 301 | 91.5% |
| Single Unit, Attached | 0 | 0.0% |
| 2 Unit Apartments | 0 | 0.0% |
| 3 or 4 Unit Apartments | 28 | 8.5% |
| 5 to 9 Unit Apartments | 0 | 0.0% |
| 10 or more Apartments | 0 | 0.0% |
| Mobile Home / Other | 0 | 0.0% |
| Total | 329 | 100.0% |
Housing Structures by Occupancy in Hilltop Lakes
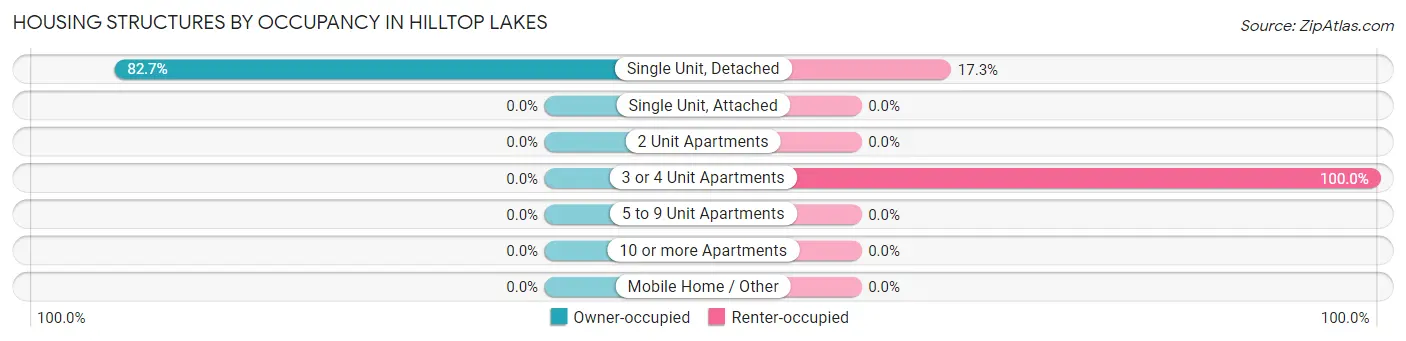
| Structure Type | Owner-occupied | Renter-occupied |
| Single Unit, Detached | 249 (82.7%) | 52 (17.3%) |
| Single Unit, Attached | 0 (0.0%) | 0 (0.0%) |
| 2 Unit Apartments | 0 (0.0%) | 0 (0.0%) |
| 3 or 4 Unit Apartments | 0 (0.0%) | 28 (100.0%) |
| 5 to 9 Unit Apartments | 0 (0.0%) | 0 (0.0%) |
| 10 or more Apartments | 0 (0.0%) | 0 (0.0%) |
| Mobile Home / Other | 0 (0.0%) | 0 (0.0%) |
| Total | 249 (75.7%) | 80 (24.3%) |
Housing Structures by Number of Rooms in Hilltop Lakes
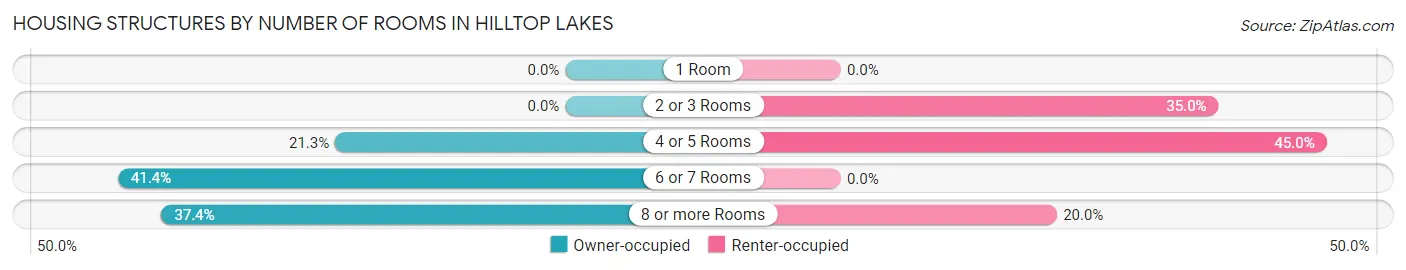
| Number of Rooms | Owner-occupied | Renter-occupied |
| 1 Room | 0 (0.0%) | 0 (0.0%) |
| 2 or 3 Rooms | 0 (0.0%) | 28 (35.0%) |
| 4 or 5 Rooms | 53 (21.3%) | 36 (45.0%) |
| 6 or 7 Rooms | 103 (41.4%) | 0 (0.0%) |
| 8 or more Rooms | 93 (37.3%) | 16 (20.0%) |
| Total | 249 (100.0%) | 80 (100.0%) |
Housing Structure by Heating Type in Hilltop Lakes
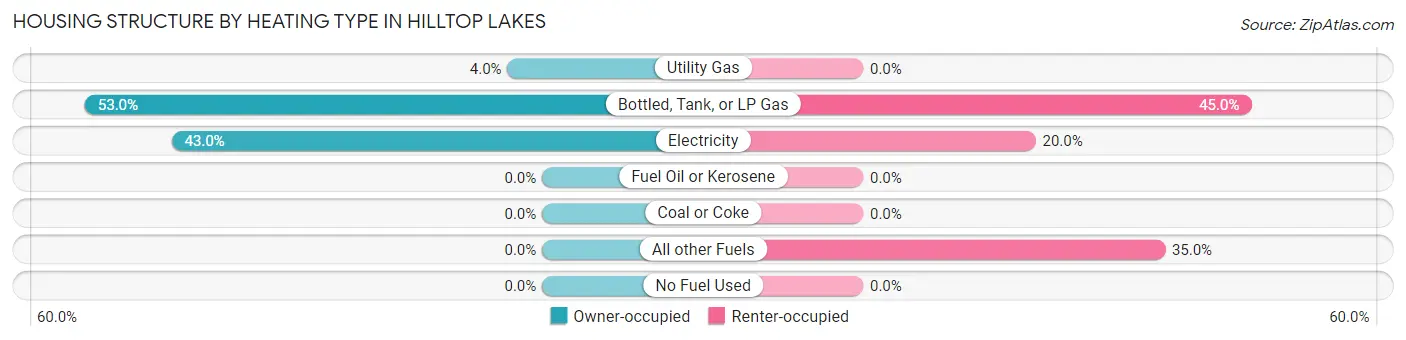
| Heating Type | Owner-occupied | Renter-occupied |
| Utility Gas | 10 (4.0%) | 0 (0.0%) |
| Bottled, Tank, or LP Gas | 132 (53.0%) | 36 (45.0%) |
| Electricity | 107 (43.0%) | 16 (20.0%) |
| Fuel Oil or Kerosene | 0 (0.0%) | 0 (0.0%) |
| Coal or Coke | 0 (0.0%) | 0 (0.0%) |
| All other Fuels | 0 (0.0%) | 28 (35.0%) |
| No Fuel Used | 0 (0.0%) | 0 (0.0%) |
| Total | 249 (100.0%) | 80 (100.0%) |
Household Vehicle Usage in Hilltop Lakes
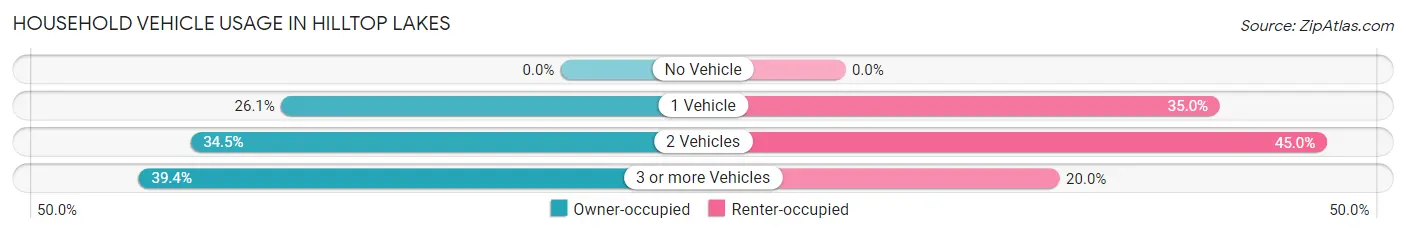
| Vehicles per Household | Owner-occupied | Renter-occupied |
| No Vehicle | 0 (0.0%) | 0 (0.0%) |
| 1 Vehicle | 65 (26.1%) | 28 (35.0%) |
| 2 Vehicles | 86 (34.5%) | 36 (45.0%) |
| 3 or more Vehicles | 98 (39.4%) | 16 (20.0%) |
| Total | 249 (100.0%) | 80 (100.0%) |
Real Estate & Mortgages in Hilltop Lakes
Real Estate and Mortgage Overview in Hilltop Lakes
| Characteristic | Without Mortgage | With Mortgage |
| Housing Units | 166 | 83 |
| Median Property Value | $204,800 | $258,900 |
| Median Household Income | $95,337 | $11 |
| Monthly Housing Costs | $547 | $0 |
| Real Estate Taxes | - | - |
Property Value by Mortgage Status in Hilltop Lakes
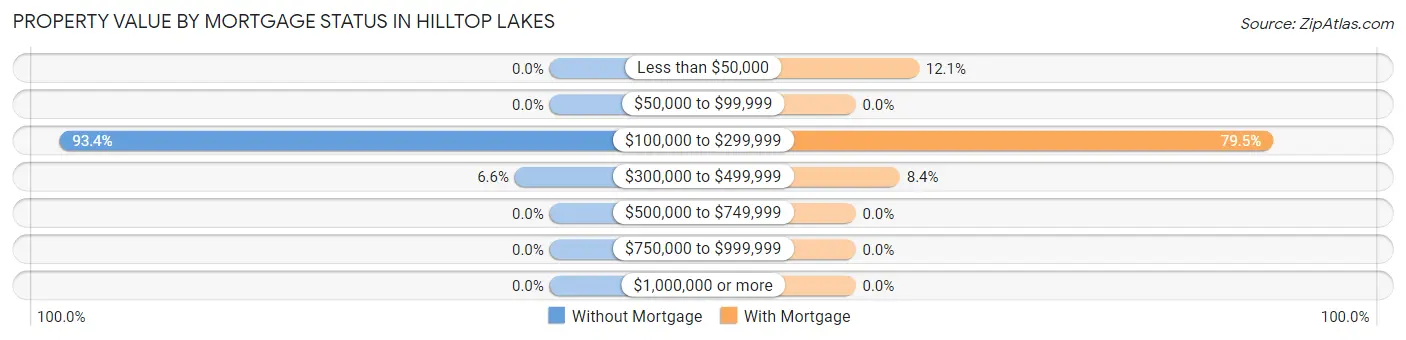
| Property Value | Without Mortgage | With Mortgage |
| Less than $50,000 | 0 (0.0%) | 10 (12.0%) |
| $50,000 to $99,999 | 0 (0.0%) | 0 (0.0%) |
| $100,000 to $299,999 | 155 (93.4%) | 66 (79.5%) |
| $300,000 to $499,999 | 11 (6.6%) | 7 (8.4%) |
| $500,000 to $749,999 | 0 (0.0%) | 0 (0.0%) |
| $750,000 to $999,999 | 0 (0.0%) | 0 (0.0%) |
| $1,000,000 or more | 0 (0.0%) | 0 (0.0%) |
| Total | 166 (100.0%) | 83 (100.0%) |
Household Income by Mortgage Status in Hilltop Lakes
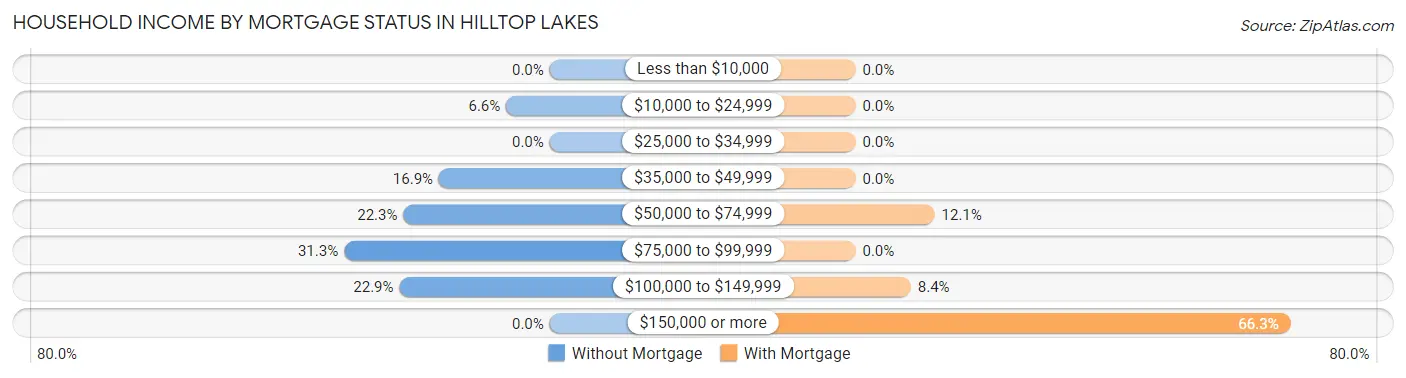
| Household Income | Without Mortgage | With Mortgage |
| Less than $10,000 | 0 (0.0%) | 0 (0.0%) |
| $10,000 to $24,999 | 11 (6.6%) | 0 (0.0%) |
| $25,000 to $34,999 | 0 (0.0%) | 0 (0.0%) |
| $35,000 to $49,999 | 28 (16.9%) | 0 (0.0%) |
| $50,000 to $74,999 | 37 (22.3%) | 10 (12.0%) |
| $75,000 to $99,999 | 52 (31.3%) | 0 (0.0%) |
| $100,000 to $149,999 | 38 (22.9%) | 7 (8.4%) |
| $150,000 or more | 0 (0.0%) | 55 (66.3%) |
| Total | 166 (100.0%) | 83 (100.0%) |
Property Value to Household Income Ratio in Hilltop Lakes
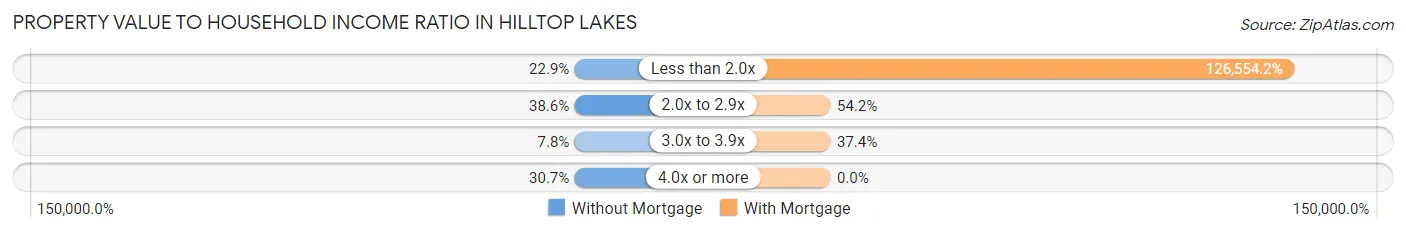
| Value-to-Income Ratio | Without Mortgage | With Mortgage |
| Less than 2.0x | 38 (22.9%) | 105,040 (126,554.2%) |
| 2.0x to 2.9x | 64 (38.6%) | 45 (54.2%) |
| 3.0x to 3.9x | 13 (7.8%) | 31 (37.3%) |
| 4.0x or more | 51 (30.7%) | 0 (0.0%) |
| Total | 166 (100.0%) | 83 (100.0%) |
Real Estate Taxes by Mortgage Status in Hilltop Lakes
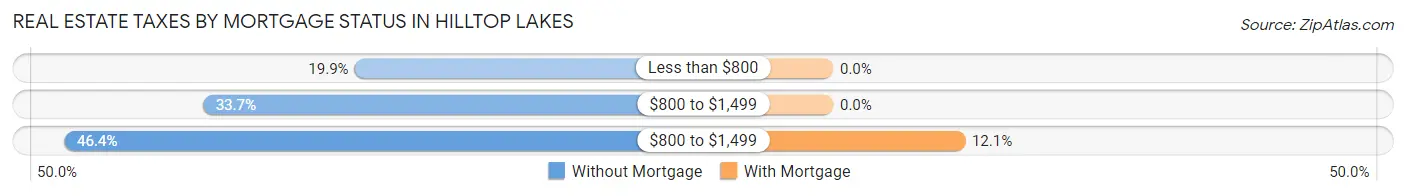
| Property Taxes | Without Mortgage | With Mortgage |
| Less than $800 | 33 (19.9%) | 0 (0.0%) |
| $800 to $1,499 | 56 (33.7%) | 0 (0.0%) |
| $800 to $1,499 | 77 (46.4%) | 10 (12.0%) |
| Total | 166 (100.0%) | 83 (100.0%) |
Health & Disability in Hilltop Lakes
Health Insurance Coverage by Age in Hilltop Lakes
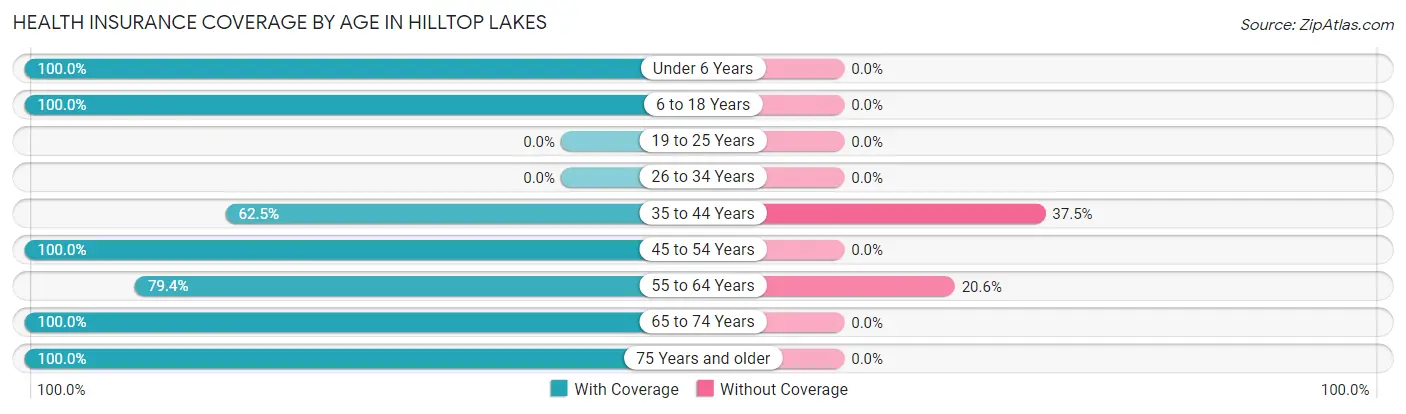
| Age Bracket | With Coverage | Without Coverage |
| Under 6 Years | 17 (100.0%) | 0 (0.0%) |
| 6 to 18 Years | 81 (100.0%) | 0 (0.0%) |
| 19 to 25 Years | 0 (0.0%) | 0 (0.0%) |
| 26 to 34 Years | 0 (0.0%) | 0 (0.0%) |
| 35 to 44 Years | 40 (62.5%) | 24 (37.5%) |
| 45 to 54 Years | 113 (100.0%) | 0 (0.0%) |
| 55 to 64 Years | 189 (79.4%) | 49 (20.6%) |
| 65 to 74 Years | 79 (100.0%) | 0 (0.0%) |
| 75 Years and older | 145 (100.0%) | 0 (0.0%) |
| Total | 664 (90.1%) | 73 (9.9%) |
Health Insurance Coverage by Citizenship Status in Hilltop Lakes
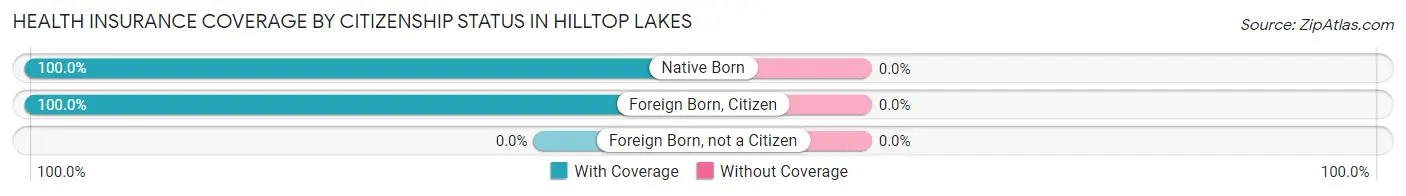
| Citizenship Status | With Coverage | Without Coverage |
| Native Born | 17 (100.0%) | 0 (0.0%) |
| Foreign Born, Citizen | 81 (100.0%) | 0 (0.0%) |
| Foreign Born, not a Citizen | 0 (0.0%) | 0 (0.0%) |
Health Insurance Coverage by Household Income in Hilltop Lakes
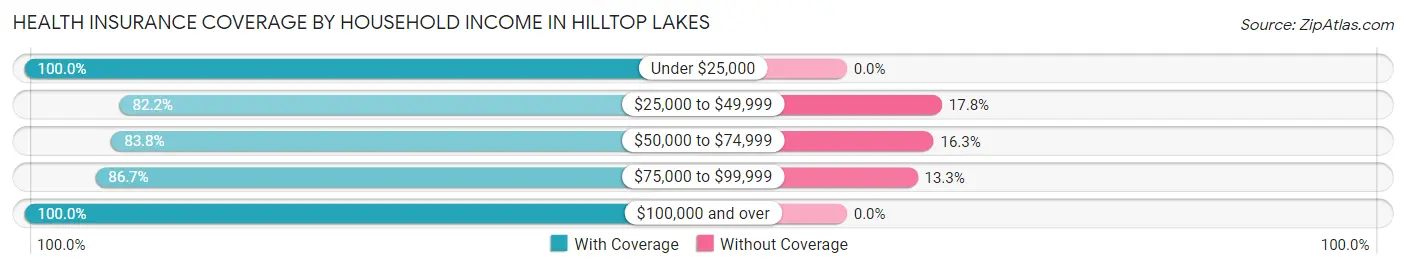
| Household Income | With Coverage | Without Coverage |
| Under $25,000 | 11 (100.0%) | 0 (0.0%) |
| $25,000 to $49,999 | 166 (82.2%) | 36 (17.8%) |
| $50,000 to $74,999 | 67 (83.8%) | 13 (16.3%) |
| $75,000 to $99,999 | 157 (86.7%) | 24 (13.3%) |
| $100,000 and over | 263 (100.0%) | 0 (0.0%) |
Public vs Private Health Insurance Coverage by Age in Hilltop Lakes
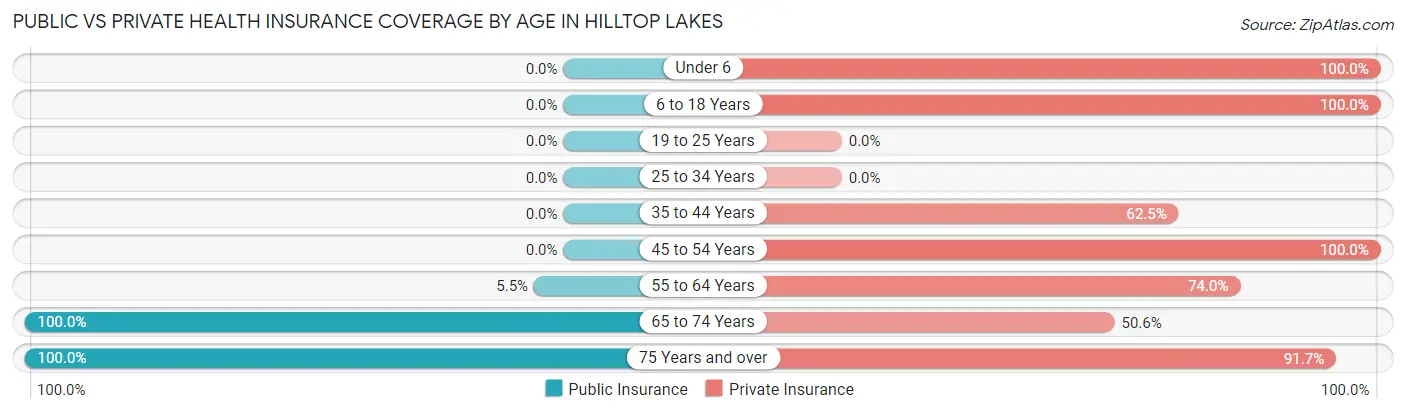
| Age Bracket | Public Insurance | Private Insurance |
| Under 6 | 0 (0.0%) | 17 (100.0%) |
| 6 to 18 Years | 0 (0.0%) | 81 (100.0%) |
| 19 to 25 Years | 0 (0.0%) | 0 (0.0%) |
| 25 to 34 Years | 0 (0.0%) | 0 (0.0%) |
| 35 to 44 Years | 0 (0.0%) | 40 (62.5%) |
| 45 to 54 Years | 0 (0.0%) | 113 (100.0%) |
| 55 to 64 Years | 13 (5.5%) | 176 (74.0%) |
| 65 to 74 Years | 79 (100.0%) | 40 (50.6%) |
| 75 Years and over | 145 (100.0%) | 133 (91.7%) |
| Total | 237 (32.2%) | 600 (81.4%) |
Disability Status by Sex by Age in Hilltop Lakes
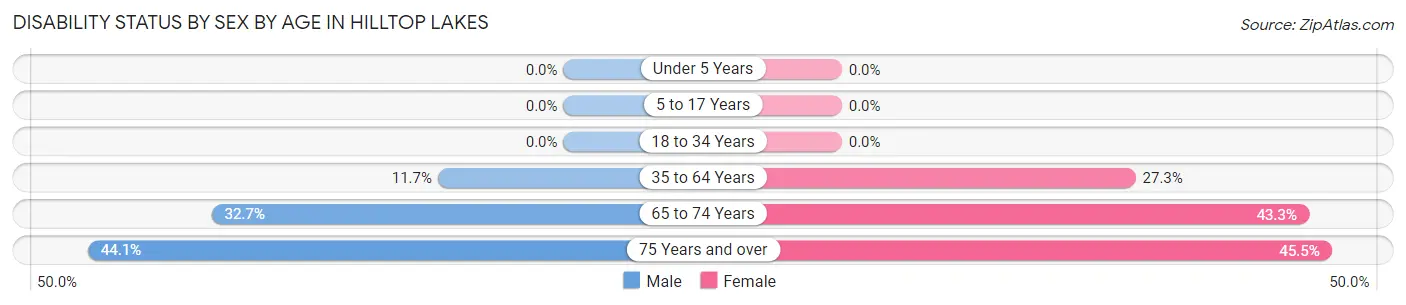
| Age Bracket | Male | Female |
| Under 5 Years | 0 (0.0%) | 0 (0.0%) |
| 5 to 17 Years | 0 (0.0%) | 0 (0.0%) |
| 18 to 34 Years | 0 (0.0%) | 0 (0.0%) |
| 35 to 64 Years | 24 (11.7%) | 57 (27.3%) |
| 65 to 74 Years | 16 (32.7%) | 13 (43.3%) |
| 75 Years and over | 30 (44.1%) | 35 (45.5%) |
Disability Class by Sex by Age in Hilltop Lakes
Disability Class: Hearing Difficulty
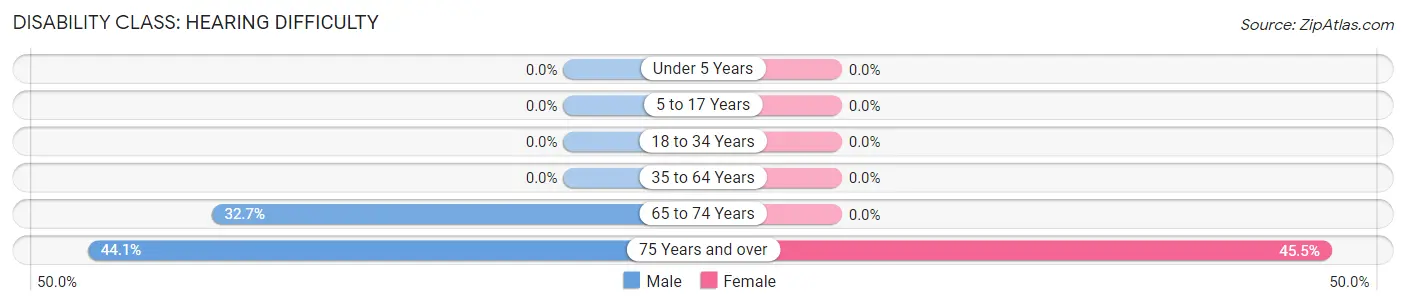
| Age Bracket | Male | Female |
| Under 5 Years | 0 (0.0%) | 0 (0.0%) |
| 5 to 17 Years | 0 (0.0%) | 0 (0.0%) |
| 18 to 34 Years | 0 (0.0%) | 0 (0.0%) |
| 35 to 64 Years | 0 (0.0%) | 0 (0.0%) |
| 65 to 74 Years | 16 (32.7%) | 0 (0.0%) |
| 75 Years and over | 30 (44.1%) | 35 (45.5%) |
Disability Class: Vision Difficulty
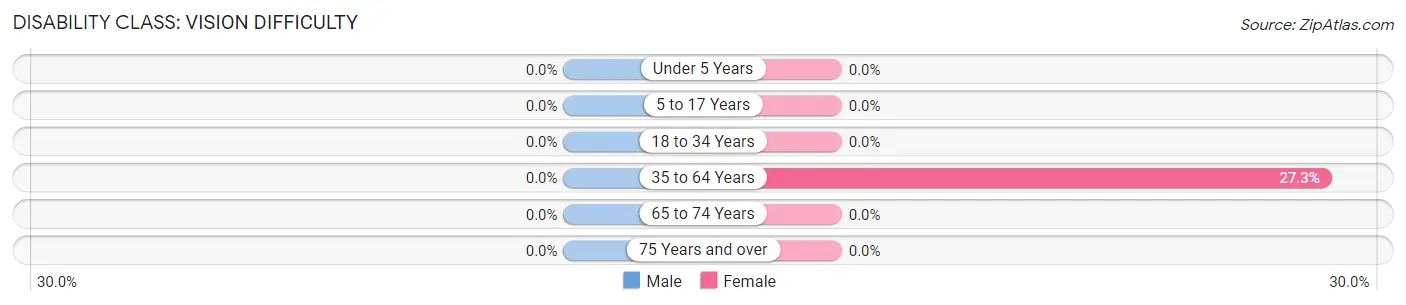
| Age Bracket | Male | Female |
| Under 5 Years | 0 (0.0%) | 0 (0.0%) |
| 5 to 17 Years | 0 (0.0%) | 0 (0.0%) |
| 18 to 34 Years | 0 (0.0%) | 0 (0.0%) |
| 35 to 64 Years | 0 (0.0%) | 57 (27.3%) |
| 65 to 74 Years | 0 (0.0%) | 0 (0.0%) |
| 75 Years and over | 0 (0.0%) | 0 (0.0%) |
Disability Class: Cognitive Difficulty
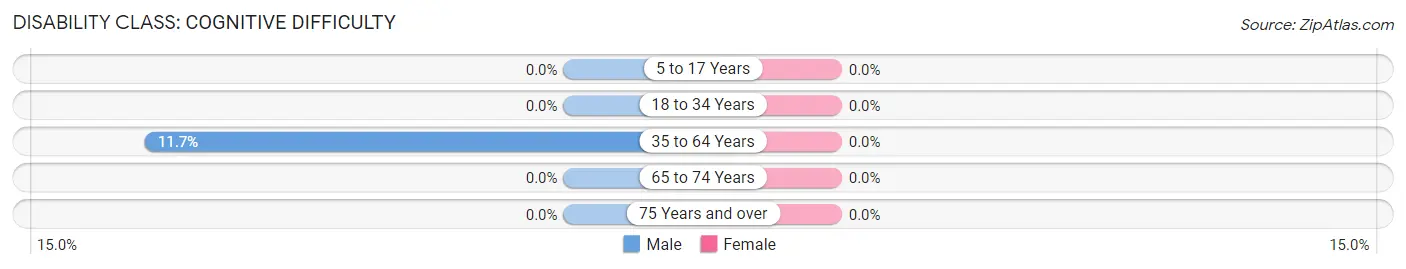
| Age Bracket | Male | Female |
| 5 to 17 Years | 0 (0.0%) | 0 (0.0%) |
| 18 to 34 Years | 0 (0.0%) | 0 (0.0%) |
| 35 to 64 Years | 24 (11.7%) | 0 (0.0%) |
| 65 to 74 Years | 0 (0.0%) | 0 (0.0%) |
| 75 Years and over | 0 (0.0%) | 0 (0.0%) |
Disability Class: Ambulatory Difficulty
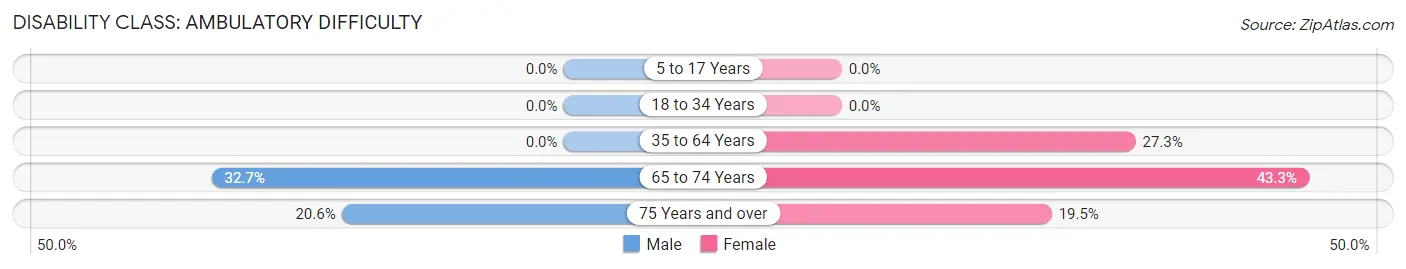
| Age Bracket | Male | Female |
| 5 to 17 Years | 0 (0.0%) | 0 (0.0%) |
| 18 to 34 Years | 0 (0.0%) | 0 (0.0%) |
| 35 to 64 Years | 0 (0.0%) | 57 (27.3%) |
| 65 to 74 Years | 16 (32.7%) | 13 (43.3%) |
| 75 Years and over | 14 (20.6%) | 15 (19.5%) |
Disability Class: Self-Care Difficulty
| Age Bracket | Male | Female |
| 5 to 17 Years | 0 (0.0%) | 0 (0.0%) |
| 18 to 34 Years | 0 (0.0%) | 0 (0.0%) |
| 35 to 64 Years | 0 (0.0%) | 0 (0.0%) |
| 65 to 74 Years | 0 (0.0%) | 0 (0.0%) |
| 75 Years and over | 0 (0.0%) | 0 (0.0%) |
Technology Access in Hilltop Lakes
Computing Device Access in Hilltop Lakes
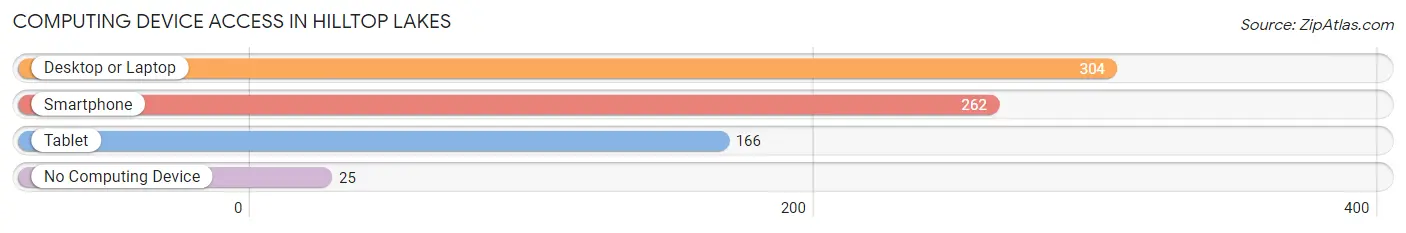
| Device Type | # Households | % Households |
| Desktop or Laptop | 304 | 92.4% |
| Smartphone | 262 | 79.6% |
| Tablet | 166 | 50.5% |
| No Computing Device | 25 | 7.6% |
| Total | 329 | 100.0% |
Internet Access in Hilltop Lakes
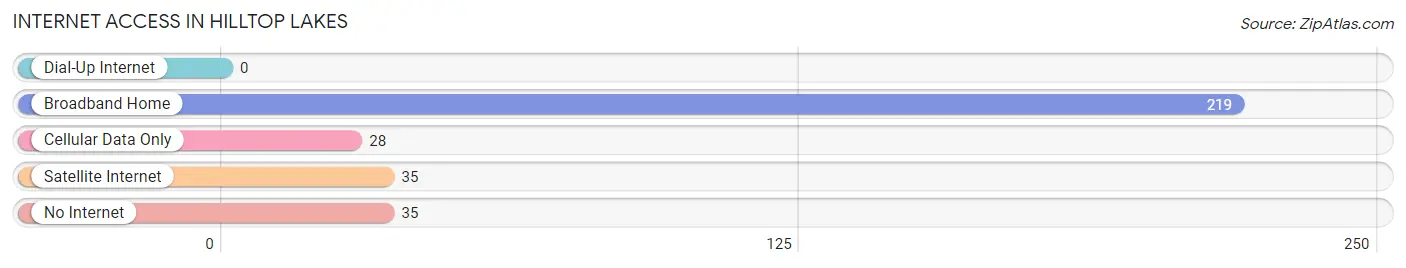
| Internet Type | # Households | % Households |
| Dial-Up Internet | 0 | 0.0% |
| Broadband Home | 219 | 66.6% |
| Cellular Data Only | 28 | 8.5% |
| Satellite Internet | 35 | 10.6% |
| No Internet | 35 | 10.6% |
| Total | 329 | 100.0% |
Hilltop Lakes Summary
Hilltop Lakes is a small unincorporated community located in Leon County, Texas, United States. It is situated approximately 10 miles east of the city of Centerville and is part of the Bryan-College Station metropolitan area. The population of Hilltop Lakes was estimated to be around 1,000 in 2020.
History
Hilltop Lakes was founded in the late 1950s by a group of investors led by oilman and rancher, J.D. “Bud” Adams. The group purchased a large tract of land in Leon County and began developing it into a recreational community. The first homes were built in the early 1960s and the community was officially incorporated in 1965.
The community was named after the hilltop lakes that were created when the developers dammed up a nearby creek. The lakes provided a great source of recreation for the residents, including fishing, swimming, and boating.
Geography
Hilltop Lakes is located in Leon County, Texas, approximately 10 miles east of the city of Centerville. The community is situated on a hilltop, surrounded by rolling hills and wooded areas. The terrain is mostly flat, with some areas of rolling hills. The climate is generally mild, with temperatures ranging from the mid-50s in the winter to the mid-90s in the summer.
The community is served by two major highways, US Highway 79 and State Highway 7. The nearest airport is Easterwood Airport, located in College Station, approximately 25 miles away.
Economy
The economy of Hilltop Lakes is largely based on agriculture and tourism. The community is home to several farms and ranches, which produce a variety of crops and livestock. The area is also popular with tourists, who come to enjoy the lakes, fishing, and other outdoor activities.
In addition to agriculture and tourism, Hilltop Lakes is home to several small businesses, including a grocery store, a hardware store, and a few restaurants. The community also has a post office and a volunteer fire department.
Demographics
As of the 2020 census, the population of Hilltop Lakes was estimated to be around 1,000. The racial makeup of the community was 94.3% White, 2.2% Hispanic or Latino, 1.2% African American, 0.7% Asian, and 1.6% other. The median household income was $45,000, and the median home value was $150,000.
Conclusion
Hilltop Lakes is a small unincorporated community located in Leon County, Texas. It was founded in the late 1950s and has since grown into a popular recreational destination. The economy of Hilltop Lakes is largely based on agriculture and tourism, and the population is estimated to be around 1,000. The community is served by two major highways and is home to several small businesses.
Common Questions
What is Per Capita Income in Hilltop Lakes?
Per Capita income in Hilltop Lakes is $43,029.
What is the Median Family Income in Hilltop Lakes?
Median Family Income in Hilltop Lakes is $97,813.
What is the Median Household income in Hilltop Lakes?
Median Household Income in Hilltop Lakes is $96,707.
What is Inequality or Gini Index in Hilltop Lakes?
Inequality or Gini Index in Hilltop Lakes is 0.29.
What is the Total Population of Hilltop Lakes?
Total Population of Hilltop Lakes is 737.
What is the Total Male Population of Hilltop Lakes?
Total Male Population of Hilltop Lakes is 377.
What is the Total Female Population of Hilltop Lakes?
Total Female Population of Hilltop Lakes is 360.
What is the Ratio of Males per 100 Females in Hilltop Lakes?
There are 104.72 Males per 100 Females in Hilltop Lakes.
What is the Ratio of Females per 100 Males in Hilltop Lakes?
There are 95.49 Females per 100 Males in Hilltop Lakes.
What is the Median Population Age in Hilltop Lakes?
Median Population Age in Hilltop Lakes is 56.7 Years.
What is the Average Family Size in Hilltop Lakes
Average Family Size in Hilltop Lakes is 2.7 People.
What is the Average Household Size in Hilltop Lakes
Average Household Size in Hilltop Lakes is 2.2 People.
How Large is the Labor Force in Hilltop Lakes?
There are 346 People in the Labor Forcein in Hilltop Lakes.
What is the Percentage of People in the Labor Force in Hilltop Lakes?
54.1% of People are in the Labor Force in Hilltop Lakes.
What is the Unemployment Rate in Hilltop Lakes?
Unemployment Rate in Hilltop Lakes is 2.0%.