Bluetown, TX Map & Demographics
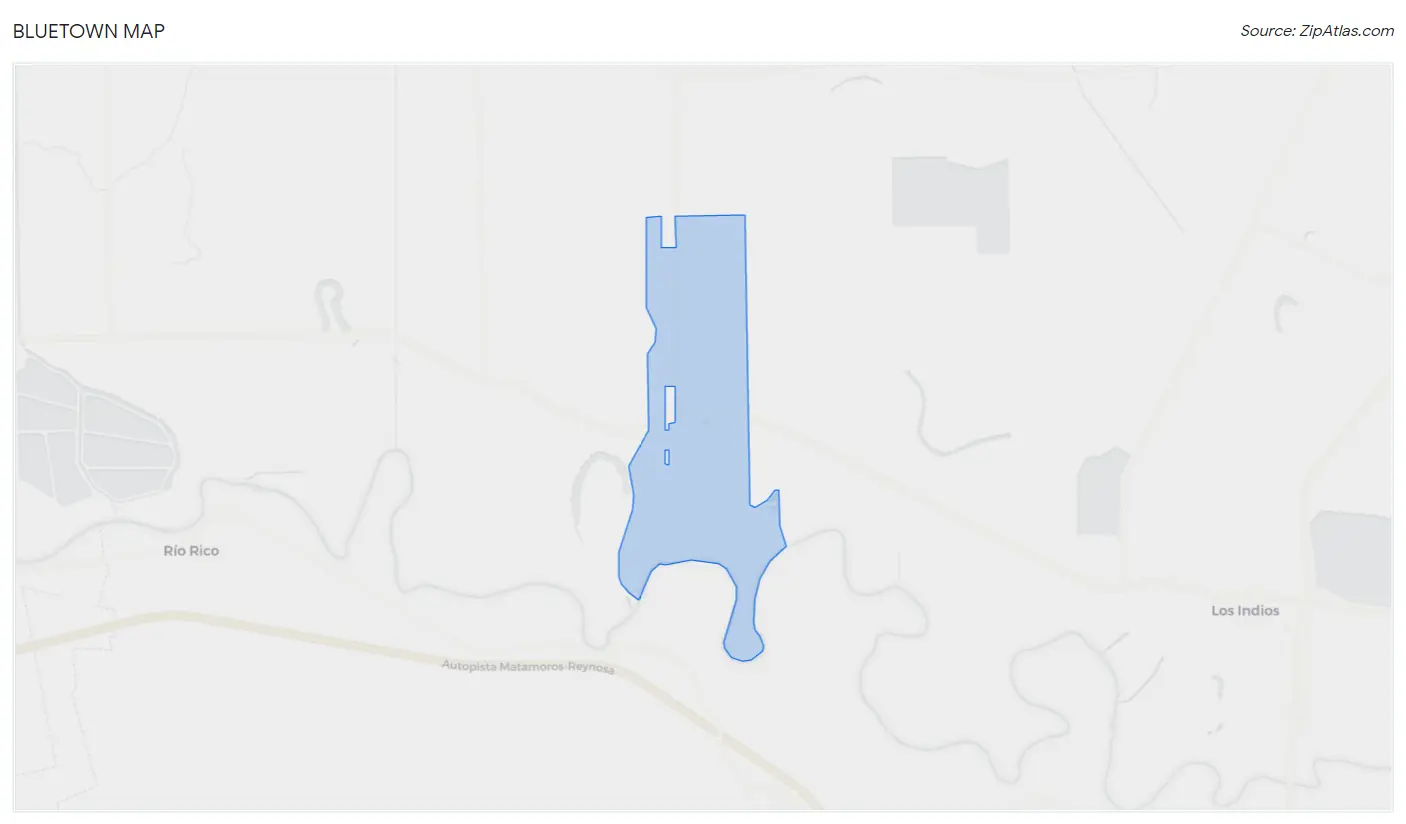
Bluetown Map
Bluetown Overview
$9,995
PER CAPITA INCOME
$32,679
AVG FAMILY INCOME
$33,036
AVG HOUSEHOLD INCOME
69.7%
WAGE / INCOME GAP [ % ]
30.3¢/ $1
WAGE / INCOME GAP [ $ ]
0.35
INEQUALITY / GINI INDEX
619
TOTAL POPULATION
337
MALE POPULATION
282
FEMALE POPULATION
119.50
MALES / 100 FEMALES
83.68
FEMALES / 100 MALES
28.7
MEDIAN AGE
5.3
AVG FAMILY SIZE
4.6
AVG HOUSEHOLD SIZE
143
LABOR FORCE [ PEOPLE ]
36.0%
PERCENT IN LABOR FORCE
2.1%
UNEMPLOYMENT RATE
Income in Bluetown
Income Overview in Bluetown
Per Capita Income in Bluetown is $9,995, while median incomes of families and households are $32,679 and $33,036 respectively.
| Characteristic | Number | Measure |
| Per Capita Income | 619 | $9,995 |
| Median Family Income | 110 | $32,679 |
| Mean Family Income | 110 | $42,383 |
| Median Household Income | 134 | $33,036 |
| Mean Household Income | 134 | $42,068 |
| Income Deficit | 110 | $0 |
| Wage / Income Gap (%) | 619 | 69.66% |
| Wage / Income Gap ($) | 619 | 30.34¢ per $1 |
| Gini / Inequality Index | 619 | 0.35 |
Earnings by Sex in Bluetown
Average Earnings in Bluetown are $23,750, $41,750 for men and $12,667 for women, a difference of 69.7%.
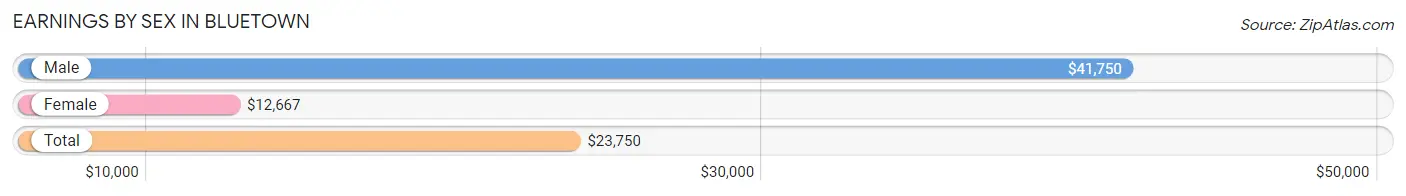
| Sex | Number | Average Earnings |
| Male | 102 (68.9%) | $41,750 |
| Female | 46 (31.1%) | $12,667 |
| Total | 148 (100.0%) | $23,750 |
Earnings by Sex by Income Bracket in Bluetown
The most common earnings brackets in Bluetown are $17,500 to $19,999 for men (23 | 22.6%) and $12,500 to $14,999 for women (15 | 32.6%).
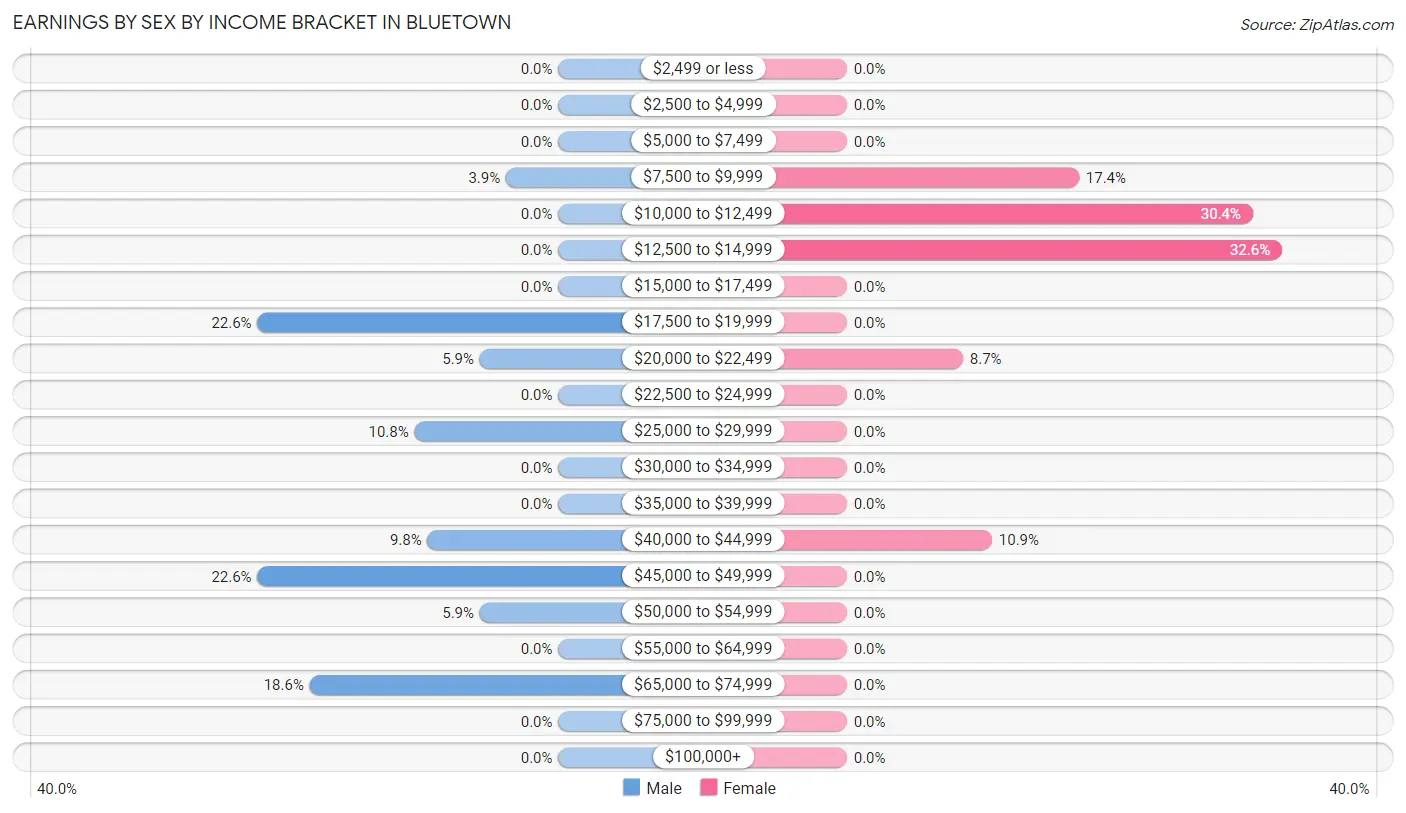
| Income | Male | Female |
| $2,499 or less | 0 (0.0%) | 0 (0.0%) |
| $2,500 to $4,999 | 0 (0.0%) | 0 (0.0%) |
| $5,000 to $7,499 | 0 (0.0%) | 0 (0.0%) |
| $7,500 to $9,999 | 4 (3.9%) | 8 (17.4%) |
| $10,000 to $12,499 | 0 (0.0%) | 14 (30.4%) |
| $12,500 to $14,999 | 0 (0.0%) | 15 (32.6%) |
| $15,000 to $17,499 | 0 (0.0%) | 0 (0.0%) |
| $17,500 to $19,999 | 23 (22.6%) | 0 (0.0%) |
| $20,000 to $22,499 | 6 (5.9%) | 4 (8.7%) |
| $22,500 to $24,999 | 0 (0.0%) | 0 (0.0%) |
| $25,000 to $29,999 | 11 (10.8%) | 0 (0.0%) |
| $30,000 to $34,999 | 0 (0.0%) | 0 (0.0%) |
| $35,000 to $39,999 | 0 (0.0%) | 0 (0.0%) |
| $40,000 to $44,999 | 10 (9.8%) | 5 (10.9%) |
| $45,000 to $49,999 | 23 (22.6%) | 0 (0.0%) |
| $50,000 to $54,999 | 6 (5.9%) | 0 (0.0%) |
| $55,000 to $64,999 | 0 (0.0%) | 0 (0.0%) |
| $65,000 to $74,999 | 19 (18.6%) | 0 (0.0%) |
| $75,000 to $99,999 | 0 (0.0%) | 0 (0.0%) |
| $100,000+ | 0 (0.0%) | 0 (0.0%) |
| Total | 102 (100.0%) | 46 (100.0%) |
Earnings by Sex by Educational Attainment in Bluetown
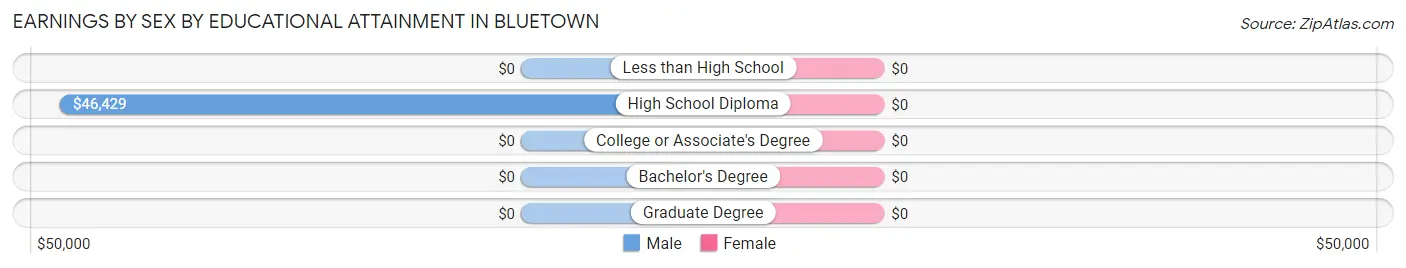
| Educational Attainment | Male Income | Female Income |
| Less than High School | - | - |
| High School Diploma | $46,429 | $0 |
| College or Associate's Degree | - | - |
| Bachelor's Degree | - | - |
| Graduate Degree | - | - |
| Total | $47,734 | $12,667 |
Family Income in Bluetown
Family Income Brackets in Bluetown
According to the Bluetown family income data, there are 53 families falling into the $25,000 to $34,999 income range, which is the most common income bracket and makes up 48.2% of all families.
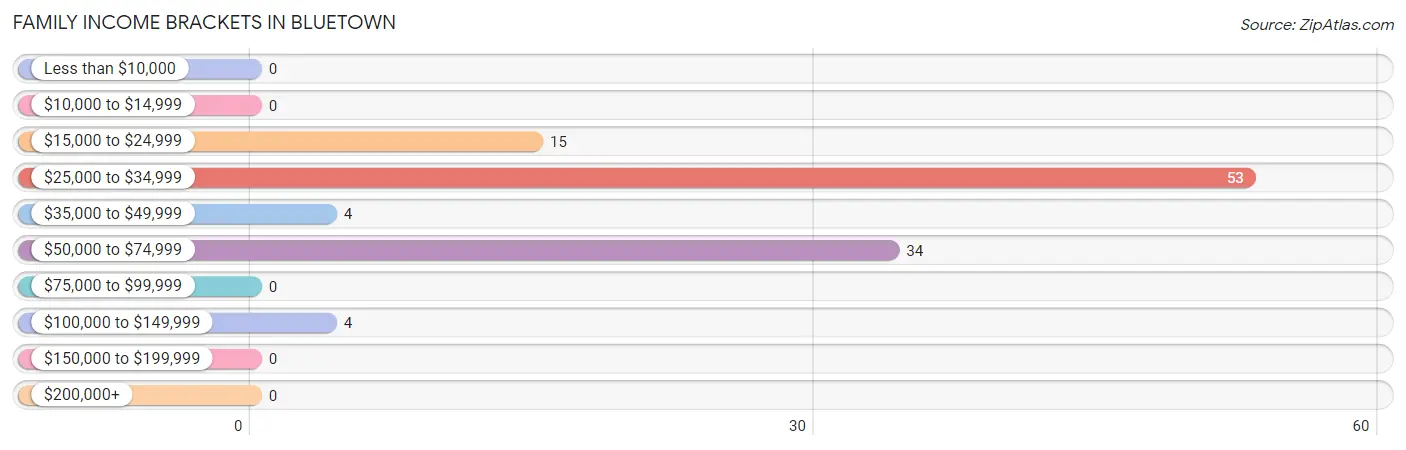
| Income Bracket | # Families | % Families |
| Less than $10,000 | 0 | 0.0% |
| $10,000 to $14,999 | 0 | 0.0% |
| $15,000 to $24,999 | 15 | 13.6% |
| $25,000 to $34,999 | 53 | 48.2% |
| $35,000 to $49,999 | 4 | 3.6% |
| $50,000 to $74,999 | 34 | 30.9% |
| $75,000 to $99,999 | 0 | 0.0% |
| $100,000 to $149,999 | 4 | 3.6% |
| $150,000 to $199,999 | 0 | 0.0% |
| $200,000+ | 0 | 0.0% |
Family Income by Famaliy Size in Bluetown
4-person families (37 | 33.6%) account for the highest median family income in Bluetown with $28,884 per family, while 4-person families (37 | 33.6%) have the highest median income of $7,221 per family member.
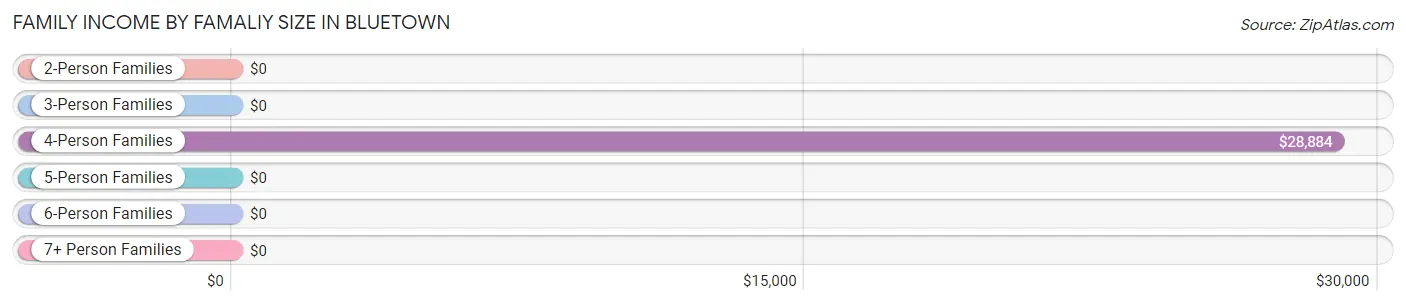
| Income Bracket | # Families | Median Income |
| 2-Person Families | 8 (7.3%) | $0 |
| 3-Person Families | 10 (9.1%) | $0 |
| 4-Person Families | 37 (33.6%) | $28,884 |
| 5-Person Families | 25 (22.7%) | $0 |
| 6-Person Families | 4 (3.6%) | $0 |
| 7+ Person Families | 26 (23.6%) | $0 |
| Total | 110 (100.0%) | $32,679 |
Family Income by Number of Earners in Bluetown
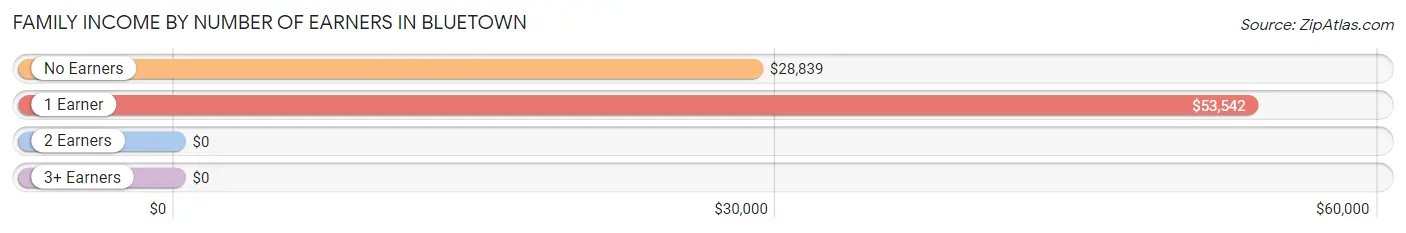
| Number of Earners | # Families | Median Income |
| No Earners | 21 (19.1%) | $28,839 |
| 1 Earner | 63 (57.3%) | $53,542 |
| 2 Earners | 22 (20.0%) | $0 |
| 3+ Earners | 4 (3.6%) | $0 |
| Total | 110 (100.0%) | $32,679 |
Household Income in Bluetown
Household Income Brackets in Bluetown
With 39 households falling in the category, the $25,000 to $34,999 income range is the most frequent in Bluetown, accounting for 29.1% of all households.
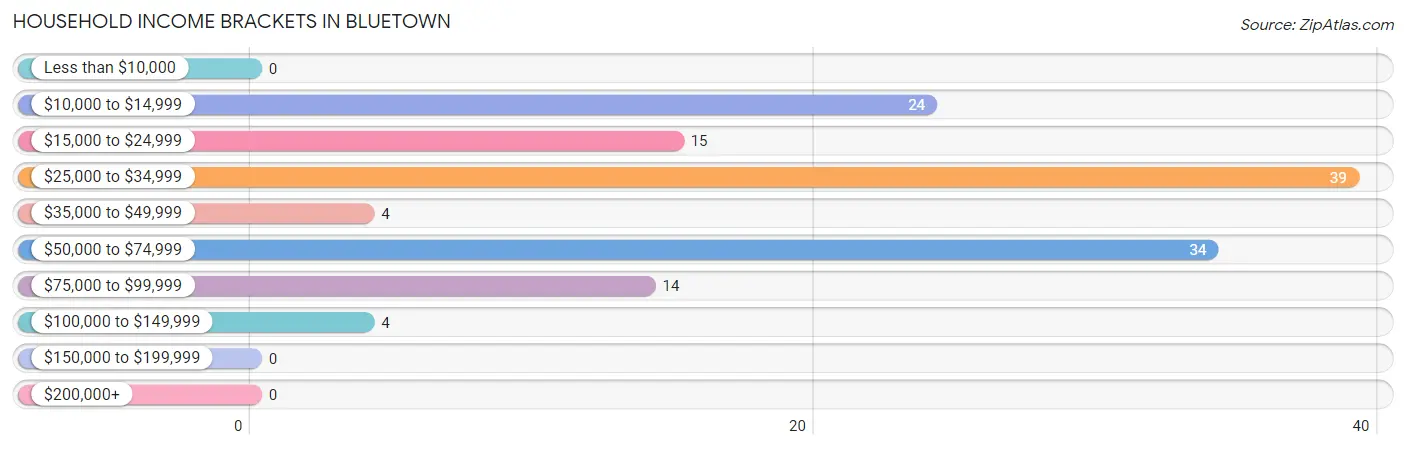
| Income Bracket | # Households | % Households |
| Less than $10,000 | 0 | 0.0% |
| $10,000 to $14,999 | 24 | 17.9% |
| $15,000 to $24,999 | 15 | 11.2% |
| $25,000 to $34,999 | 39 | 29.1% |
| $35,000 to $49,999 | 4 | 3.0% |
| $50,000 to $74,999 | 34 | 25.4% |
| $75,000 to $99,999 | 14 | 10.4% |
| $100,000 to $149,999 | 4 | 3.0% |
| $150,000 to $199,999 | 0 | 0.0% |
| $200,000+ | 0 | 0.0% |
Household Income by Householder Age in Bluetown
The median household income in Bluetown is $33,036, with the highest median household income of $29,464 found in the 65+ years age bracket for the primary householder. A total of 70 households (52.2%) fall into this category.
| Income Bracket | # Households | Median Income |
| 15 to 24 Years | 0 (0.0%) | $0 |
| 25 to 44 Years | 46 (34.3%) | $0 |
| 45 to 64 Years | 18 (13.4%) | $0 |
| 65+ Years | 70 (52.2%) | $29,464 |
| Total | 134 (100.0%) | $33,036 |
Poverty in Bluetown
Income Below Poverty by Sex and Age in Bluetown
With 57.0% poverty level for males and 45.0% for females among the residents of Bluetown, 5 year old males and 16 and 17 year old females are the most vulnerable to poverty, with 2 males (100.0%) and 12 females (100.0%) in their respective age groups living below the poverty level.
| Age Bracket | Male | Female |
| Under 5 Years | 18 (45.0%) | 0 (0.0%) |
| 5 Years | 2 (100.0%) | 0 (0.0%) |
| 6 to 11 Years | 28 (60.9%) | 17 (39.5%) |
| 12 to 14 Years | 3 (100.0%) | 0 (0.0%) |
| 15 Years | 16 (100.0%) | 0 (0.0%) |
| 16 and 17 Years | 0 (0.0%) | 12 (100.0%) |
| 18 to 24 Years | 25 (100.0%) | 19 (82.6%) |
| 25 to 34 Years | 0 (0.0%) | 0 (0.0%) |
| 35 to 44 Years | 33 (100.0%) | 32 (100.0%) |
| 45 to 54 Years | 4 (8.9%) | 14 (60.9%) |
| 55 to 64 Years | 16 (44.4%) | 0 (0.0%) |
| 65 to 74 Years | 19 (100.0%) | 28 (100.0%) |
| 75 Years and over | 28 (77.8%) | 5 (20.0%) |
| Total | 192 (57.0%) | 127 (45.0%) |
Income Above Poverty by Sex and Age in Bluetown
According to the poverty statistics in Bluetown, males aged 25 to 34 years and females aged under 5 years are the age groups that are most secure financially, with 100.0% of males and 100.0% of females in these age groups living above the poverty line.
| Age Bracket | Male | Female |
| Under 5 Years | 22 (55.0%) | 12 (100.0%) |
| 5 Years | 0 (0.0%) | 20 (100.0%) |
| 6 to 11 Years | 18 (39.1%) | 26 (60.5%) |
| 12 to 14 Years | 0 (0.0%) | 40 (100.0%) |
| 15 Years | 0 (0.0%) | 0 (0.0%) |
| 16 and 17 Years | 0 (0.0%) | 0 (0.0%) |
| 18 to 24 Years | 0 (0.0%) | 4 (17.4%) |
| 25 to 34 Years | 36 (100.0%) | 24 (100.0%) |
| 35 to 44 Years | 0 (0.0%) | 0 (0.0%) |
| 45 to 54 Years | 41 (91.1%) | 9 (39.1%) |
| 55 to 64 Years | 20 (55.6%) | 0 (0.0%) |
| 65 to 74 Years | 0 (0.0%) | 0 (0.0%) |
| 75 Years and over | 8 (22.2%) | 20 (80.0%) |
| Total | 145 (43.0%) | 155 (55.0%) |
Income Below Poverty Among Married-Couple Families in Bluetown
The poverty statistics for married-couple families in Bluetown show that 59.5% or 47 of the total 79 families live below the poverty line. Families with no children have the highest poverty rate of 77.8%, comprising of 14 families. On the other hand, families with 5 or more children have the lowest poverty rate of 0.0%, which includes 0 families.
| Children | Above Poverty | Below Poverty |
| No Children | 4 (22.2%) | 14 (77.8%) |
| 1 or 2 Children | 10 (23.3%) | 33 (76.7%) |
| 3 or 4 Children | 0 (0.0%) | 0 (0.0%) |
| 5 or more Children | 18 (100.0%) | 0 (0.0%) |
| Total | 32 (40.5%) | 47 (59.5%) |
Income Below Poverty Among Single-Parent Households in Bluetown
According to the poverty data in Bluetown, 100.0% or 3 single-father households and 50.0% or 14 single-mother households are living below the poverty line. Among single-father households, those with 3 or 4 children have the highest poverty rate, with 3 households (100.0%) experiencing poverty. Likewise, among single-mother households, those with 1 or 2 children have the highest poverty rate, with 14 households (100.0%) falling below the poverty line.
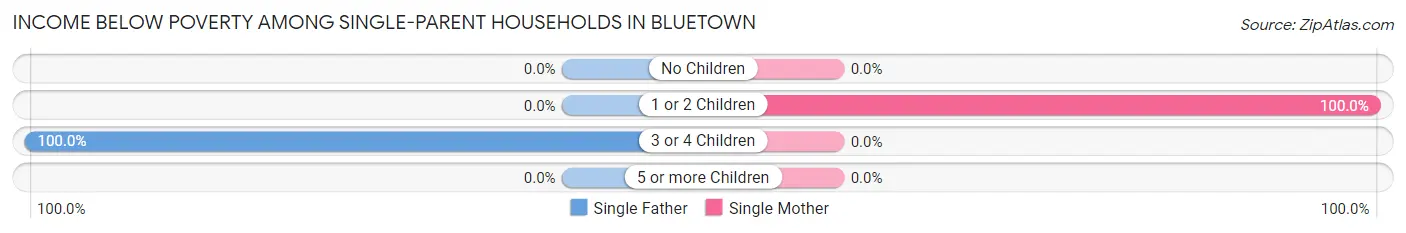
| Children | Single Father | Single Mother |
| No Children | 0 (0.0%) | 0 (0.0%) |
| 1 or 2 Children | 0 (0.0%) | 14 (100.0%) |
| 3 or 4 Children | 3 (100.0%) | 0 (0.0%) |
| 5 or more Children | 0 (0.0%) | 0 (0.0%) |
| Total | 3 (100.0%) | 14 (50.0%) |
Income Below Poverty Among Married-Couple vs Single-Parent Households in Bluetown
The poverty data for Bluetown shows that 47 of the married-couple family households (59.5%) and 17 of the single-parent households (54.8%) are living below the poverty level. Within the married-couple family households, those with no children have the highest poverty rate, with 14 households (77.8%) falling below the poverty line. Among the single-parent households, those with 1 or 2 children have the highest poverty rate, with 14 household (100.0%) living below poverty.
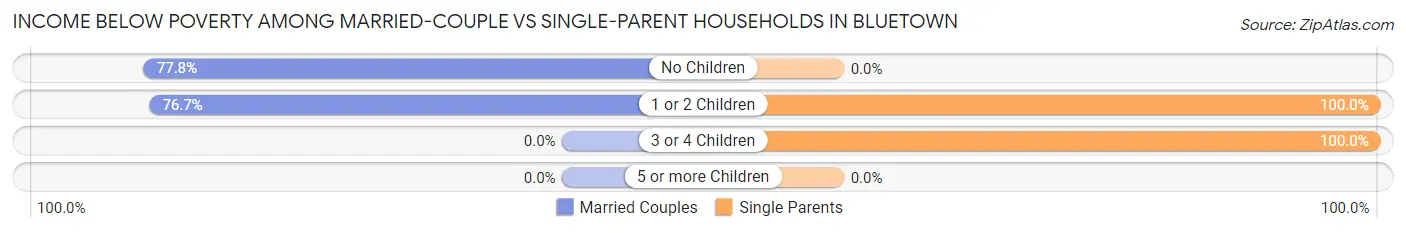
| Children | Married-Couple Families | Single-Parent Households |
| No Children | 14 (77.8%) | 0 (0.0%) |
| 1 or 2 Children | 33 (76.7%) | 14 (100.0%) |
| 3 or 4 Children | 0 (0.0%) | 3 (100.0%) |
| 5 or more Children | 0 (0.0%) | 0 (0.0%) |
| Total | 47 (59.5%) | 17 (54.8%) |
Race in Bluetown
The most populous races in Bluetown are Hispanic or Latino (593 | 95.8%), White / Caucasian (438 | 70.8%), and Two or more Races (157 | 25.4%).
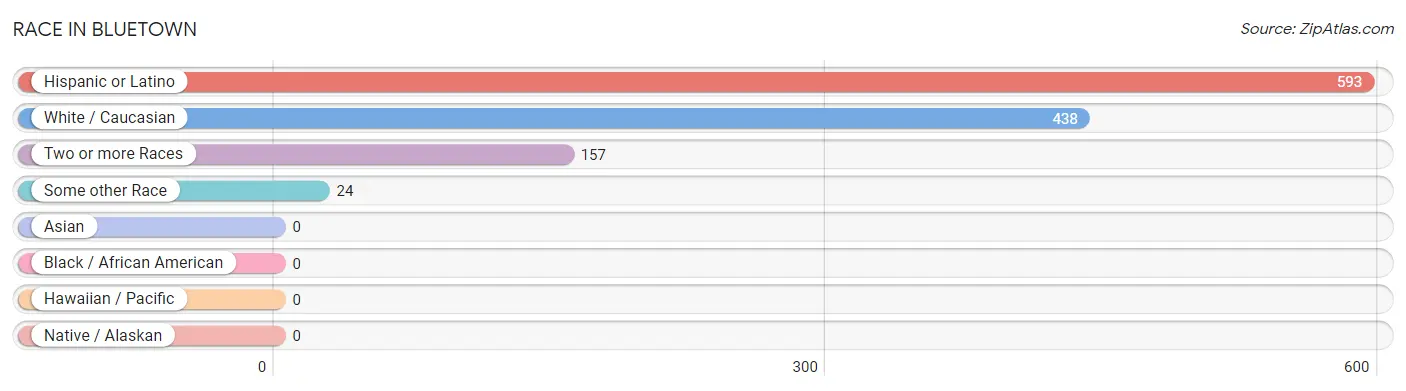
| Race | # Population | % Population |
| Asian | 0 | 0.0% |
| Black / African American | 0 | 0.0% |
| Hawaiian / Pacific | 0 | 0.0% |
| Hispanic or Latino | 593 | 95.8% |
| Native / Alaskan | 0 | 0.0% |
| White / Caucasian | 438 | 70.8% |
| Two or more Races | 157 | 25.4% |
| Some other Race | 24 | 3.9% |
| Total | 619 | 100.0% |
Ancestry in Bluetown
The most populous ancestries reported in Bluetown are Mexican (593 | 95.8%), American (18 | 2.9%), and German (8 | 1.3%), together accounting for 100.0% of all Bluetown residents.
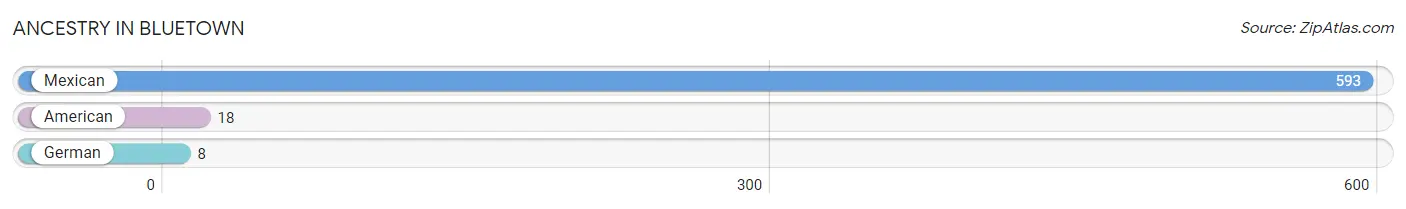
| Ancestry | # Population | % Population |
| American | 18 | 2.9% |
| German | 8 | 1.3% |
| Mexican | 593 | 95.8% | View All 3 Rows |
Immigrants in Bluetown
The most numerous immigrant groups reported in Bluetown came from Central America (226 | 36.5%), Latin America (226 | 36.5%), and Mexico (226 | 36.5%), together accounting for 109.5% of all Bluetown residents.
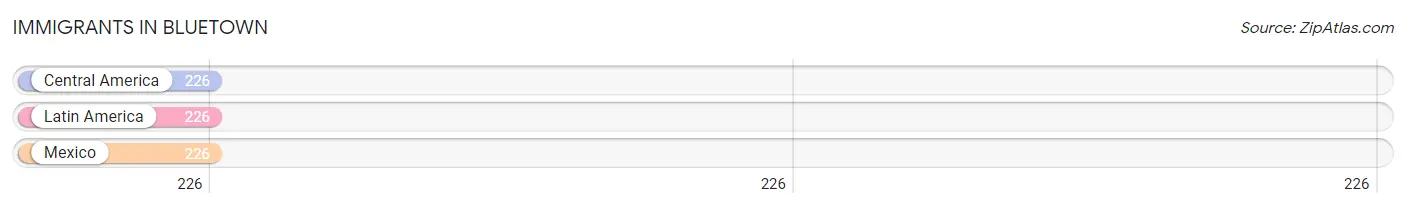
| Immigration Origin | # Population | % Population |
| Central America | 226 | 36.5% |
| Latin America | 226 | 36.5% |
| Mexico | 226 | 36.5% | View All 3 Rows |
Sex and Age in Bluetown
Sex and Age in Bluetown
The most populous age groups in Bluetown are 5 to 9 Years (45 | 13.4%) for men and 5 to 9 Years (63 | 22.3%) for women.
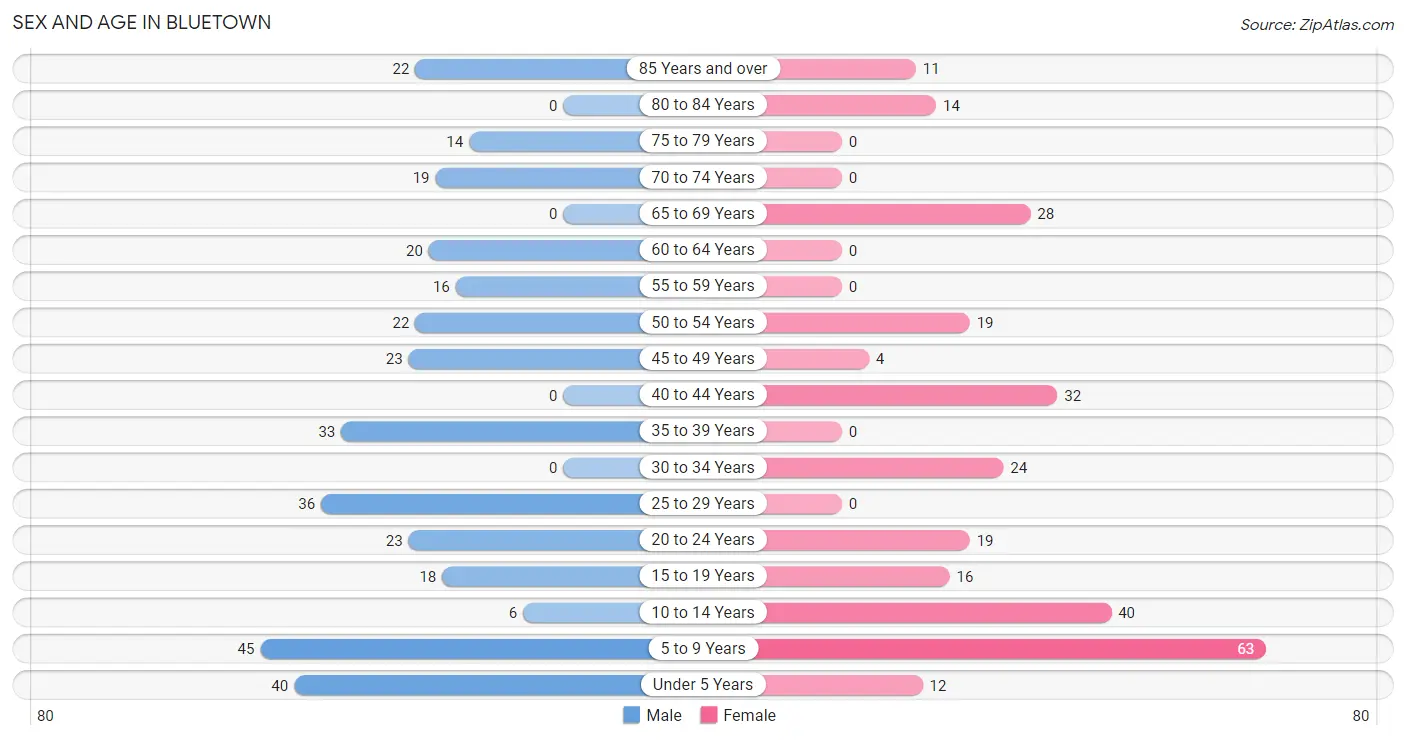
| Age Bracket | Male | Female |
| Under 5 Years | 40 (11.9%) | 12 (4.3%) |
| 5 to 9 Years | 45 (13.4%) | 63 (22.3%) |
| 10 to 14 Years | 6 (1.8%) | 40 (14.2%) |
| 15 to 19 Years | 18 (5.3%) | 16 (5.7%) |
| 20 to 24 Years | 23 (6.8%) | 19 (6.7%) |
| 25 to 29 Years | 36 (10.7%) | 0 (0.0%) |
| 30 to 34 Years | 0 (0.0%) | 24 (8.5%) |
| 35 to 39 Years | 33 (9.8%) | 0 (0.0%) |
| 40 to 44 Years | 0 (0.0%) | 32 (11.4%) |
| 45 to 49 Years | 23 (6.8%) | 4 (1.4%) |
| 50 to 54 Years | 22 (6.5%) | 19 (6.7%) |
| 55 to 59 Years | 16 (4.8%) | 0 (0.0%) |
| 60 to 64 Years | 20 (5.9%) | 0 (0.0%) |
| 65 to 69 Years | 0 (0.0%) | 28 (9.9%) |
| 70 to 74 Years | 19 (5.6%) | 0 (0.0%) |
| 75 to 79 Years | 14 (4.2%) | 0 (0.0%) |
| 80 to 84 Years | 0 (0.0%) | 14 (5.0%) |
| 85 Years and over | 22 (6.5%) | 11 (3.9%) |
| Total | 337 (100.0%) | 282 (100.0%) |
Families and Households in Bluetown
Median Family Size in Bluetown
The median family size in Bluetown is 5.26 persons per family, with married-couple families (79 | 71.8%) accounting for the largest median family size of 5.82 persons per family. On the other hand, single male/father families (3 | 2.7%) represent the smallest median family size with 3.67 persons per family.
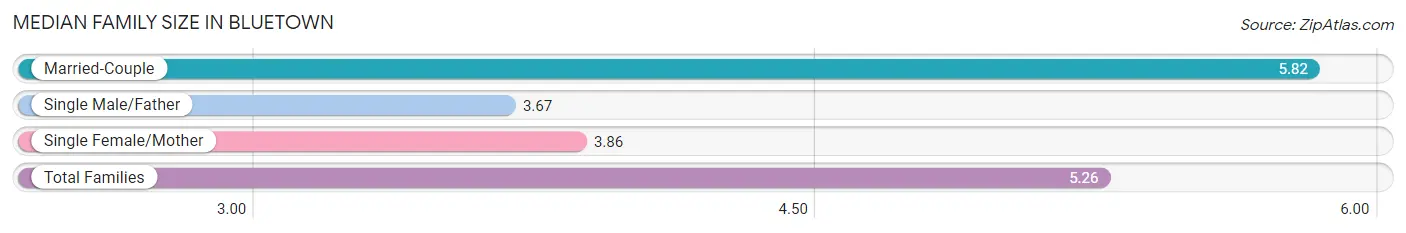
| Family Type | # Families | Family Size |
| Married-Couple | 79 (71.8%) | 5.82 |
| Single Male/Father | 3 (2.7%) | 3.67 |
| Single Female/Mother | 28 (25.5%) | 3.86 |
| Total Families | 110 (100.0%) | 5.26 |
Median Household Size in Bluetown
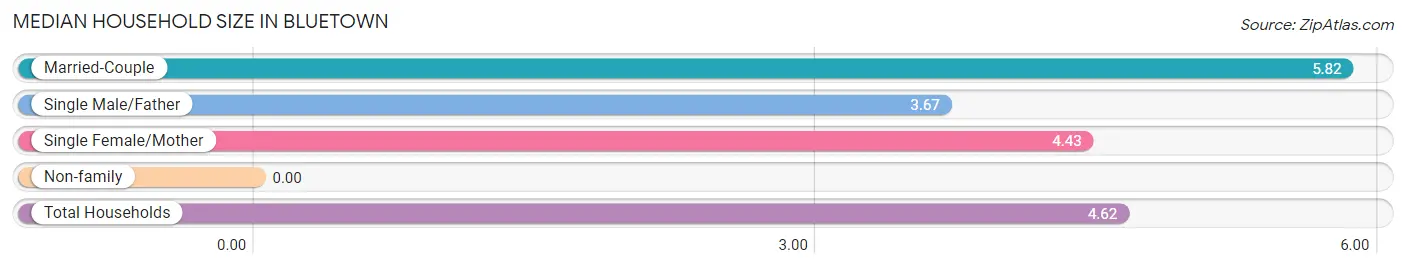
| Household Type | # Households | Household Size |
| Married-Couple | 79 (59.0%) | 5.82 |
| Single Male/Father | 3 (2.2%) | 3.67 |
| Single Female/Mother | 28 (20.9%) | 4.43 |
| Non-family | 24 (17.9%) | - |
| Total Households | 134 (100.0%) | 4.62 |
Household Size by Marriage Status in Bluetown
Out of a total of 134 households in Bluetown, 110 (82.1%) are family households, while 24 (17.9%) are nonfamily households. The most numerous type of family households are 5-person households, comprising 39, and the most common type of nonfamily households are 1-person households, comprising 24.
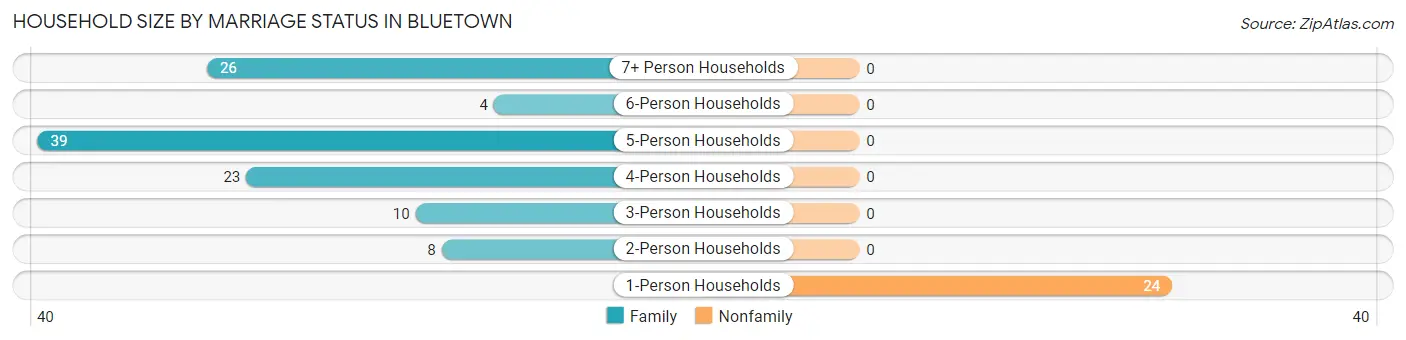
| Household Size | Family Households | Nonfamily Households |
| 1-Person Households | - | 24 (17.9%) |
| 2-Person Households | 8 (6.0%) | 0 (0.0%) |
| 3-Person Households | 10 (7.5%) | 0 (0.0%) |
| 4-Person Households | 23 (17.2%) | 0 (0.0%) |
| 5-Person Households | 39 (29.1%) | 0 (0.0%) |
| 6-Person Households | 4 (3.0%) | 0 (0.0%) |
| 7+ Person Households | 26 (19.4%) | 0 (0.0%) |
| Total | 110 (82.1%) | 24 (17.9%) |
Female Fertility in Bluetown
Fertility by Age in Bluetown
| Age Bracket | Women with Births | Births / 1,000 Women |
| 15 to 19 years | 0 (0.0%) | 0.0 |
| 20 to 34 years | 0 (0.0%) | 0.0 |
| 35 to 50 years | 0 (0.0%) | 0.0 |
| Total | 0 (0.0%) | 0.0 |
Fertility by Age by Marriage Status in Bluetown
| Age Bracket | Married | Unmarried |
| 15 to 19 years | 0 (0.0%) | 0 (0.0%) |
| 20 to 34 years | 0 (0.0%) | 0 (0.0%) |
| 35 to 50 years | 0 (0.0%) | 0 (0.0%) |
| Total | 0 (0.0%) | 0 (0.0%) |
Fertility by Education in Bluetown
| Educational Attainment | Women with Births | Births / 1,000 Women |
| Less than High School | 0 (0.0%) | 0.0 |
| High School Diploma | 0 (0.0%) | 0.0 |
| College or Associate's Degree | 0 (0.0%) | 0.0 |
| Bachelor's Degree | 0 (0.0%) | 0.0 |
| Graduate Degree | 0 (0.0%) | 0.0 |
| Total | 0 (0.0%) | 0.0 |
Fertility by Education by Marriage Status in Bluetown
| Educational Attainment | Married | Unmarried |
| Less than High School | 0 (0.0%) | 0 (0.0%) |
| High School Diploma | 0 (0.0%) | 0 (0.0%) |
| College or Associate's Degree | 0 (0.0%) | 0 (0.0%) |
| Bachelor's Degree | 0 (0.0%) | 0 (0.0%) |
| Graduate Degree | 0 (0.0%) | 0 (0.0%) |
| Total | 0 (0.0%) | 0 (0.0%) |
Employment Characteristics in Bluetown
Employment by Class of Employer in Bluetown
Among the 140 employed individuals in Bluetown, private company employees (90 | 64.3%), self-employed (not incorporated) (44 | 31.4%), and federal government employees (6 | 4.3%) make up the most common classes of employment.
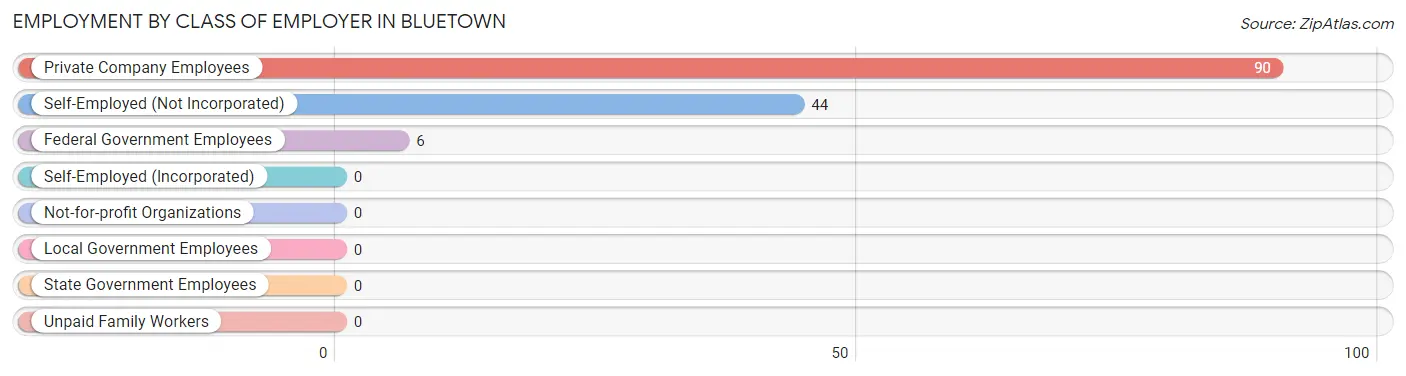
| Employer Class | # Employees | % Employees |
| Private Company Employees | 90 | 64.3% |
| Self-Employed (Incorporated) | 0 | 0.0% |
| Self-Employed (Not Incorporated) | 44 | 31.4% |
| Not-for-profit Organizations | 0 | 0.0% |
| Local Government Employees | 0 | 0.0% |
| State Government Employees | 0 | 0.0% |
| Federal Government Employees | 6 | 4.3% |
| Unpaid Family Workers | 0 | 0.0% |
| Total | 140 | 100.0% |
Employment Status by Age in Bluetown
According to the labor force statistics for Bluetown, out of the total population over 16 years of age (397), 36.0% or 143 individuals are in the labor force, with 2.1% or 3 of them unemployed. The age group with the highest labor force participation rate is 45 to 54 years, with 100.0% or 68 individuals in the labor force. Within the labor force, the 35 to 44 years age range has the highest percentage of unemployed individuals, with 10.3% or 3 of them being unemployed.
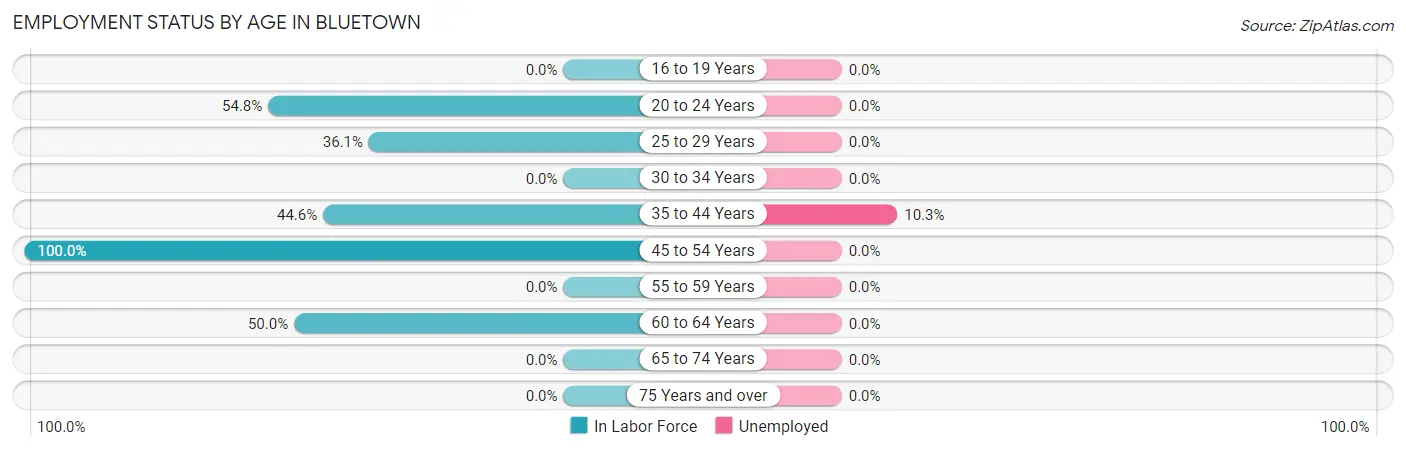
| Age Bracket | In Labor Force | Unemployed |
| 16 to 19 Years | 0 (0.0%) | 0 (0.0%) |
| 20 to 24 Years | 23 (54.8%) | 0 (0.0%) |
| 25 to 29 Years | 13 (36.1%) | 0 (0.0%) |
| 30 to 34 Years | 0 (0.0%) | 0 (0.0%) |
| 35 to 44 Years | 29 (44.6%) | 3 (10.3%) |
| 45 to 54 Years | 68 (100.0%) | 0 (0.0%) |
| 55 to 59 Years | 0 (0.0%) | 0 (0.0%) |
| 60 to 64 Years | 10 (50.0%) | 0 (0.0%) |
| 65 to 74 Years | 0 (0.0%) | 0 (0.0%) |
| 75 Years and over | 0 (0.0%) | 0 (0.0%) |
| Total | 143 (36.0%) | 3 (2.1%) |
Employment Status by Educational Attainment in Bluetown
According to labor force statistics for Bluetown, 52.4% of individuals (120) out of the total population between 25 and 64 years of age (229) are in the labor force, with 2.5% or 3 of them being unemployed. The group with the highest labor force participation rate are those with the educational attainment of college / associate degree, with 100.0% or 12 individuals in the labor force. Within the labor force, individuals with high school diploma education have the highest percentage of unemployment, with 5.4% or 3 of them being unemployed.
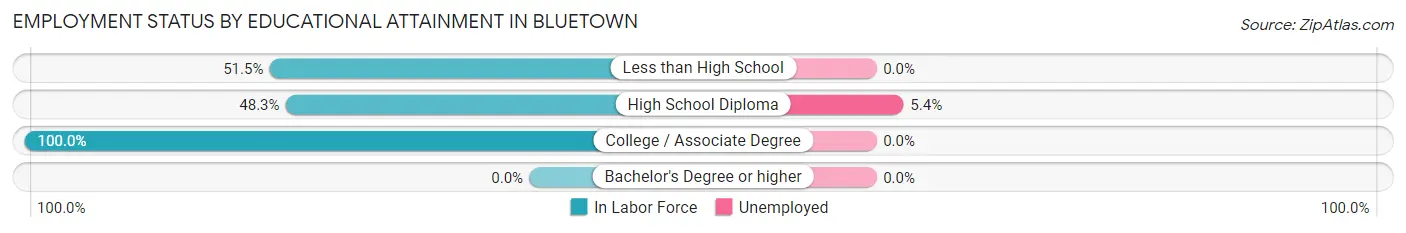
| Educational Attainment | In Labor Force | Unemployed |
| Less than High School | 52 (51.5%) | 0 (0.0%) |
| High School Diploma | 56 (48.3%) | 6 (5.4%) |
| College / Associate Degree | 12 (100.0%) | 0 (0.0%) |
| Bachelor's Degree or higher | 0 (0.0%) | 0 (0.0%) |
| Total | 120 (52.4%) | 6 (2.5%) |
Employment Occupations by Sex in Bluetown
Management, Business, Science and Arts Occupations
The most common Management, Business, Science and Arts occupations in Bluetown are , and Management (23 | 16.4%).
Management, Business, Science and Arts Occupations by Sex
| Occupation | Male | Female |
| Management | 23 (100.0%) | 0 (0.0%) |
| Business & Financial | 0 (0.0%) | 0 (0.0%) |
| Computers, Engineering & Science | 0 (0.0%) | 0 (0.0%) |
| Computers & Mathematics | 0 (0.0%) | 0 (0.0%) |
| Architecture & Engineering | 0 (0.0%) | 0 (0.0%) |
| Life, Physical & Social Science | 0 (0.0%) | 0 (0.0%) |
| Community & Social Service | 0 (0.0%) | 0 (0.0%) |
| Education, Arts & Media | 0 (0.0%) | 0 (0.0%) |
| Legal Services & Support | 0 (0.0%) | 0 (0.0%) |
| Education Instruction & Library | 0 (0.0%) | 0 (0.0%) |
| Arts, Media & Entertainment | 0 (0.0%) | 0 (0.0%) |
| Health Diagnosing & Treating | 0 (0.0%) | 0 (0.0%) |
| Health Technologists | 0 (0.0%) | 0 (0.0%) |
| Total (Category) | 23 (100.0%) | 0 (0.0%) |
| Total (Overall) | 102 (72.9%) | 38 (27.1%) |
Services Occupations
The most common Services occupations in Bluetown are Personal Care & Service (14 | 10.0%), Security & Protection (4 | 2.9%), and Firefighting & Prevention (4 | 2.9%).
Services Occupations by Sex
| Occupation | Male | Female |
| Healthcare Support | 0 (0.0%) | 0 (0.0%) |
| Security & Protection | 4 (100.0%) | 0 (0.0%) |
| Firefighting & Prevention | 4 (100.0%) | 0 (0.0%) |
| Law Enforcement | 0 (0.0%) | 0 (0.0%) |
| Food Preparation & Serving | 0 (0.0%) | 0 (0.0%) |
| Cleaning & Maintenance | 0 (0.0%) | 0 (0.0%) |
| Personal Care & Service | 0 (0.0%) | 14 (100.0%) |
| Total (Category) | 4 (22.2%) | 14 (77.8%) |
| Total (Overall) | 102 (72.9%) | 38 (27.1%) |
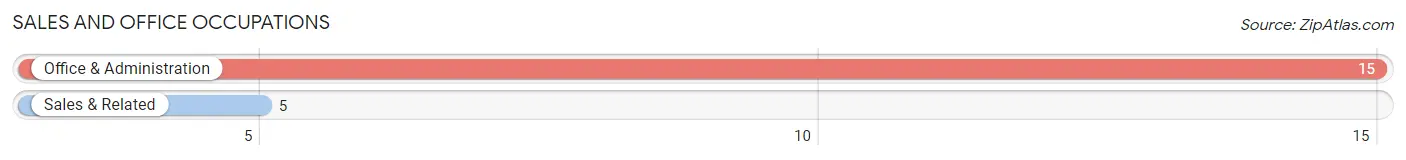
Sales and Office Occupations
The most common Sales and Office occupations in Bluetown are Office & Administration (15 | 10.7%), and Sales & Related (5 | 3.6%).
Sales and Office Occupations by Sex
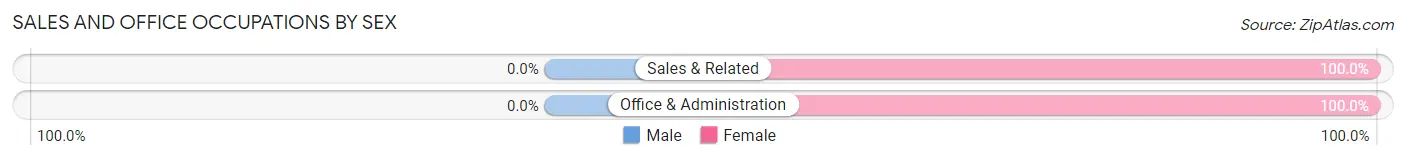
| Occupation | Male | Female |
| Sales & Related | 0 (0.0%) | 5 (100.0%) |
| Office & Administration | 0 (0.0%) | 15 (100.0%) |
| Total (Category) | 0 (0.0%) | 20 (100.0%) |
| Total (Overall) | 102 (72.9%) | 38 (27.1%) |
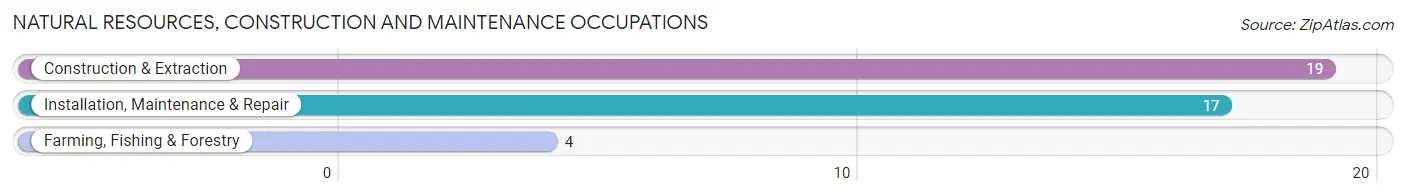
Natural Resources, Construction and Maintenance Occupations
The most common Natural Resources, Construction and Maintenance occupations in Bluetown are Construction & Extraction (19 | 13.6%), Installation, Maintenance & Repair (17 | 12.1%), and Farming, Fishing & Forestry (4 | 2.9%).
Natural Resources, Construction and Maintenance Occupations by Sex
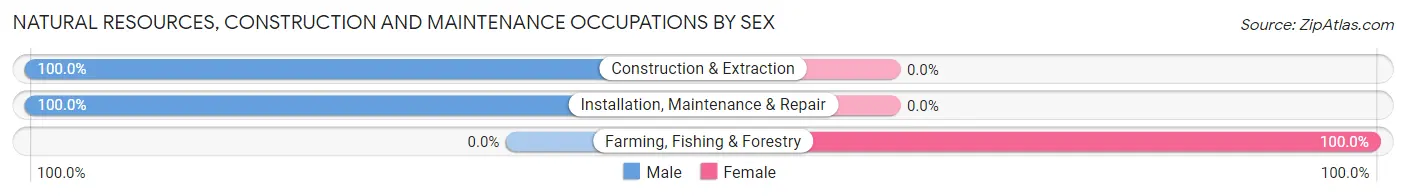
| Occupation | Male | Female |
| Farming, Fishing & Forestry | 0 (0.0%) | 4 (100.0%) |
| Construction & Extraction | 19 (100.0%) | 0 (0.0%) |
| Installation, Maintenance & Repair | 17 (100.0%) | 0 (0.0%) |
| Total (Category) | 36 (90.0%) | 4 (10.0%) |
| Total (Overall) | 102 (72.9%) | 38 (27.1%) |
Production, Transportation and Moving Occupations
The most common Production, Transportation and Moving occupations in Bluetown are Transportation (26 | 18.6%), and Material Moving (13 | 9.3%).
Production, Transportation and Moving Occupations by Sex
| Occupation | Male | Female |
| Production | 0 (0.0%) | 0 (0.0%) |
| Transportation | 26 (100.0%) | 0 (0.0%) |
| Material Moving | 13 (100.0%) | 0 (0.0%) |
| Total (Category) | 39 (100.0%) | 0 (0.0%) |
| Total (Overall) | 102 (72.9%) | 38 (27.1%) |
Employment Industries by Sex in Bluetown
Employment Industries in Bluetown
The major employment industries in Bluetown include Real Estate, Rental & Leasing (23 | 16.4%), Construction (19 | 13.6%), Administrative & Support (19 | 13.6%), Health Care & Social Assistance (19 | 13.6%), and Transportation & Warehousing (16 | 11.4%).
Employment Industries by Sex in Bluetown
The Bluetown industries that see more men than women are Construction (100.0%), Retail Trade (100.0%), and Transportation & Warehousing (100.0%), whereas the industries that tend to have a higher number of women are Agriculture, Fishing & Hunting (100.0%), Health Care & Social Assistance (100.0%), and Administrative & Support (78.9%).
| Industry | Male | Female |
| Agriculture, Fishing & Hunting | 0 (0.0%) | 4 (100.0%) |
| Mining, Quarrying, & Extraction | 0 (0.0%) | 0 (0.0%) |
| Construction | 19 (100.0%) | 0 (0.0%) |
| Manufacturing | 0 (0.0%) | 0 (0.0%) |
| Wholesale Trade | 0 (0.0%) | 0 (0.0%) |
| Retail Trade | 7 (100.0%) | 0 (0.0%) |
| Transportation & Warehousing | 16 (100.0%) | 0 (0.0%) |
| Utilities | 6 (100.0%) | 0 (0.0%) |
| Information | 0 (0.0%) | 0 (0.0%) |
| Finance & Insurance | 0 (0.0%) | 0 (0.0%) |
| Real Estate, Rental & Leasing | 23 (100.0%) | 0 (0.0%) |
| Professional & Scientific | 0 (0.0%) | 0 (0.0%) |
| Enterprise Management | 0 (0.0%) | 0 (0.0%) |
| Administrative & Support | 4 (21.0%) | 15 (78.9%) |
| Educational Services | 0 (0.0%) | 0 (0.0%) |
| Health Care & Social Assistance | 0 (0.0%) | 19 (100.0%) |
| Arts, Entertainment & Recreation | 0 (0.0%) | 0 (0.0%) |
| Accommodation & Food Services | 10 (100.0%) | 0 (0.0%) |
| Public Administration | 6 (100.0%) | 0 (0.0%) |
| Total | 102 (72.9%) | 38 (27.1%) |
Education in Bluetown
School Enrollment in Bluetown
The most common levels of schooling among the 194 students in Bluetown are elementary school (86 | 44.3%), middle school (46 | 23.7%), and high school (32 | 16.5%).
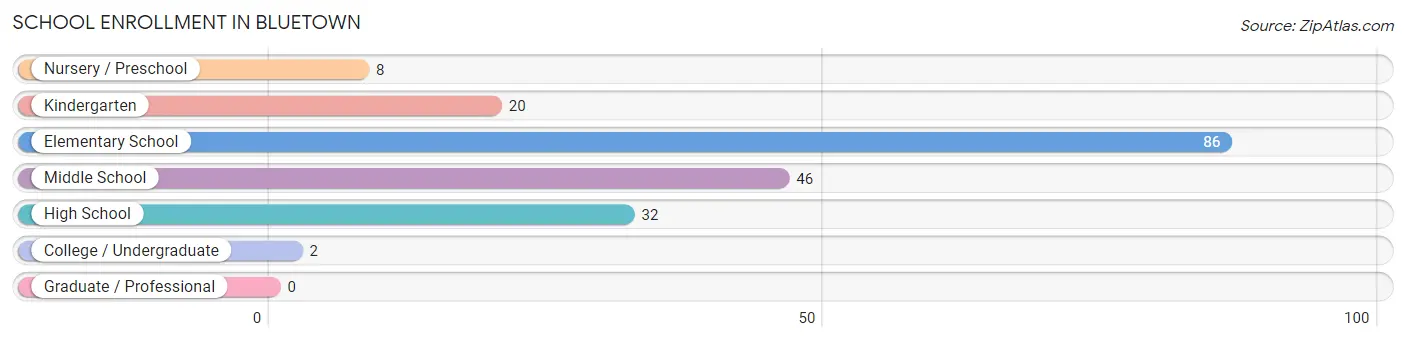
| School Level | # Students | % Students |
| Nursery / Preschool | 8 | 4.1% |
| Kindergarten | 20 | 10.3% |
| Elementary School | 86 | 44.3% |
| Middle School | 46 | 23.7% |
| High School | 32 | 16.5% |
| College / Undergraduate | 2 | 1.0% |
| Graduate / Professional | 0 | 0.0% |
| Total | 194 | 100.0% |
School Enrollment by Age by Funding Source in Bluetown
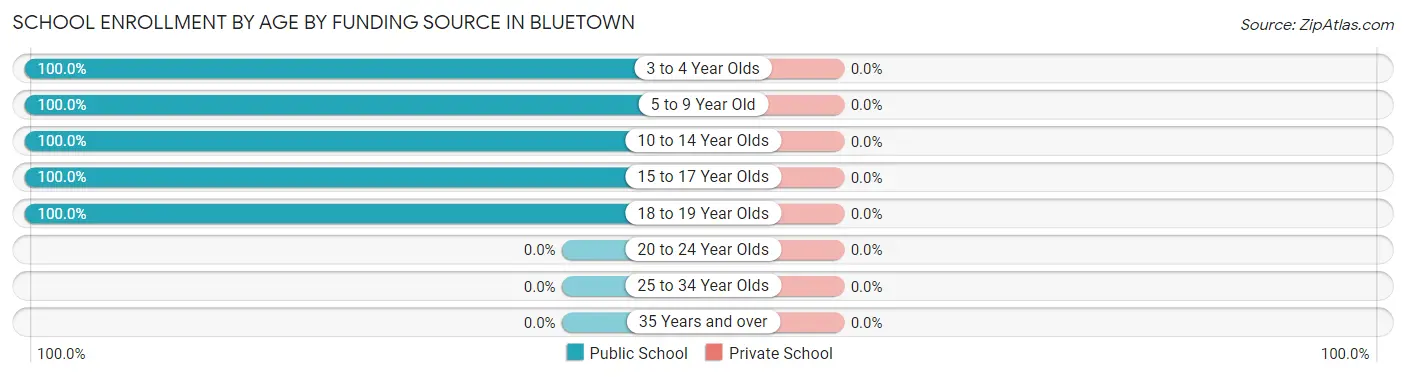
| Age Bracket | Public School | Private School |
| 3 to 4 Year Olds | 6 (100.0%) | 0 (0.0%) |
| 5 to 9 Year Old | 108 (100.0%) | 0 (0.0%) |
| 10 to 14 Year Olds | 46 (100.0%) | 0 (0.0%) |
| 15 to 17 Year Olds | 28 (100.0%) | 0 (0.0%) |
| 18 to 19 Year Olds | 6 (100.0%) | 0 (0.0%) |
| 20 to 24 Year Olds | 0 (0.0%) | 0 (0.0%) |
| 25 to 34 Year Olds | 0 (0.0%) | 0 (0.0%) |
| 35 Years and over | 0 (0.0%) | 0 (0.0%) |
| Total | 194 (100.0%) | 0 (0.0%) |
Educational Attainment by Field of Study in Bluetown
| Field of Study | # Graduates | % Graduates |
| Computers & Mathematics | 0 | 0.0% |
| Bio, Nature & Agricultural | 0 | 0.0% |
| Physical & Health Sciences | 0 | 0.0% |
| Psychology | 0 | 0.0% |
| Social Sciences | 0 | 0.0% |
| Engineering | 0 | 0.0% |
| Multidisciplinary Studies | 0 | 0.0% |
| Science & Technology | 0 | 0.0% |
| Business | 0 | 0.0% |
| Education | 0 | 0.0% |
| Literature & Languages | 0 | 0.0% |
| Liberal Arts & History | 0 | 0.0% |
| Visual & Performing Arts | 0 | 0.0% |
| Communications | 0 | 0.0% |
| Arts & Humanities | 0 | 0.0% |
| Total | 0 | 0.0% |
Transportation & Commute in Bluetown
Vehicle Availability by Sex in Bluetown
The most prevalent vehicle ownership categories in Bluetown are males with 3 vehicles (63, accounting for 61.8%) and females with 3 vehicles (19, making up 165.8%).
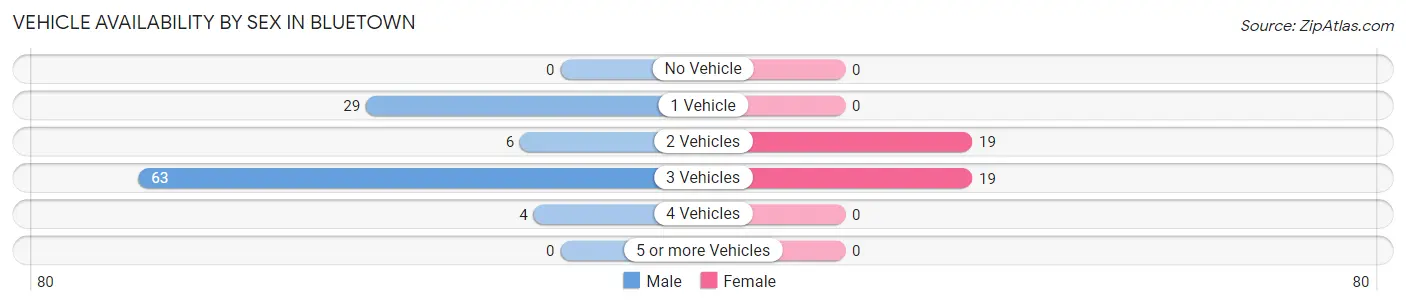
| Vehicles Available | Male | Female |
| No Vehicle | 0 (0.0%) | 0 (0.0%) |
| 1 Vehicle | 29 (28.4%) | 0 (0.0%) |
| 2 Vehicles | 6 (5.9%) | 19 (50.0%) |
| 3 Vehicles | 63 (61.8%) | 19 (50.0%) |
| 4 Vehicles | 4 (3.9%) | 0 (0.0%) |
| 5 or more Vehicles | 0 (0.0%) | 0 (0.0%) |
| Total | 102 (100.0%) | 38 (100.0%) |
Commute Time in Bluetown
The most frequently occuring commute durations in Bluetown are 30 to 34 minutes (88 commuters, 76.5%), 40 to 44 minutes (23 commuters, 20.0%), and 10 to 14 minutes (4 commuters, 3.5%).
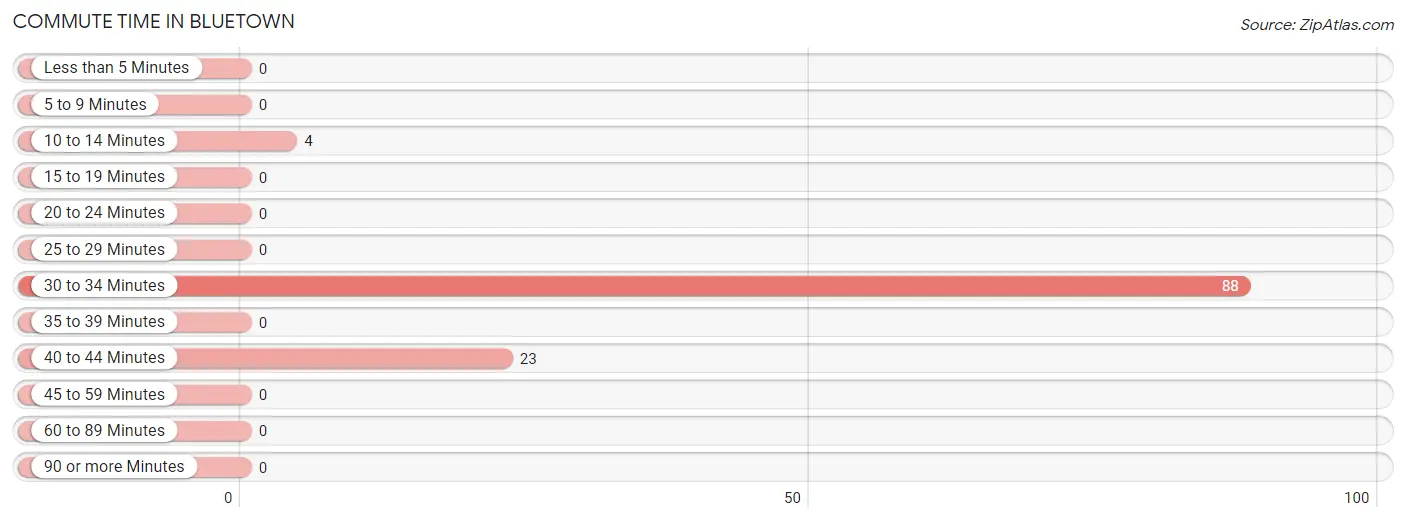
| Commute Time | # Commuters | % Commuters |
| Less than 5 Minutes | 0 | 0.0% |
| 5 to 9 Minutes | 0 | 0.0% |
| 10 to 14 Minutes | 4 | 3.5% |
| 15 to 19 Minutes | 0 | 0.0% |
| 20 to 24 Minutes | 0 | 0.0% |
| 25 to 29 Minutes | 0 | 0.0% |
| 30 to 34 Minutes | 88 | 76.5% |
| 35 to 39 Minutes | 0 | 0.0% |
| 40 to 44 Minutes | 23 | 20.0% |
| 45 to 59 Minutes | 0 | 0.0% |
| 60 to 89 Minutes | 0 | 0.0% |
| 90 or more Minutes | 0 | 0.0% |
Commute Time by Sex in Bluetown
The most common commute times in Bluetown are 30 to 34 minutes (68 commuters, 74.7%) for males and 30 to 34 minutes (20 commuters, 83.3%) for females.
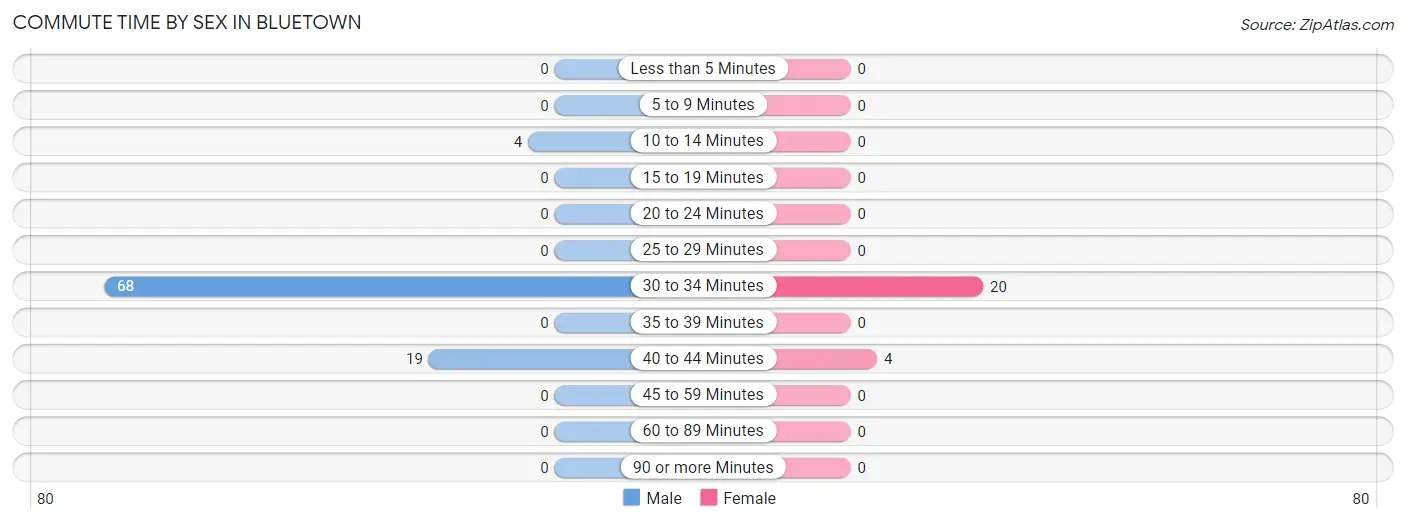
| Commute Time | Male | Female |
| Less than 5 Minutes | 0 (0.0%) | 0 (0.0%) |
| 5 to 9 Minutes | 0 (0.0%) | 0 (0.0%) |
| 10 to 14 Minutes | 4 (4.4%) | 0 (0.0%) |
| 15 to 19 Minutes | 0 (0.0%) | 0 (0.0%) |
| 20 to 24 Minutes | 0 (0.0%) | 0 (0.0%) |
| 25 to 29 Minutes | 0 (0.0%) | 0 (0.0%) |
| 30 to 34 Minutes | 68 (74.7%) | 20 (83.3%) |
| 35 to 39 Minutes | 0 (0.0%) | 0 (0.0%) |
| 40 to 44 Minutes | 19 (20.9%) | 4 (16.7%) |
| 45 to 59 Minutes | 0 (0.0%) | 0 (0.0%) |
| 60 to 89 Minutes | 0 (0.0%) | 0 (0.0%) |
| 90 or more Minutes | 0 (0.0%) | 0 (0.0%) |
Time of Departure to Work by Sex in Bluetown
The most frequent times of departure to work in Bluetown are 5:00 AM to 5:29 AM (23, 25.3%) for males and 5:00 AM to 5:29 AM (15, 62.5%) for females.
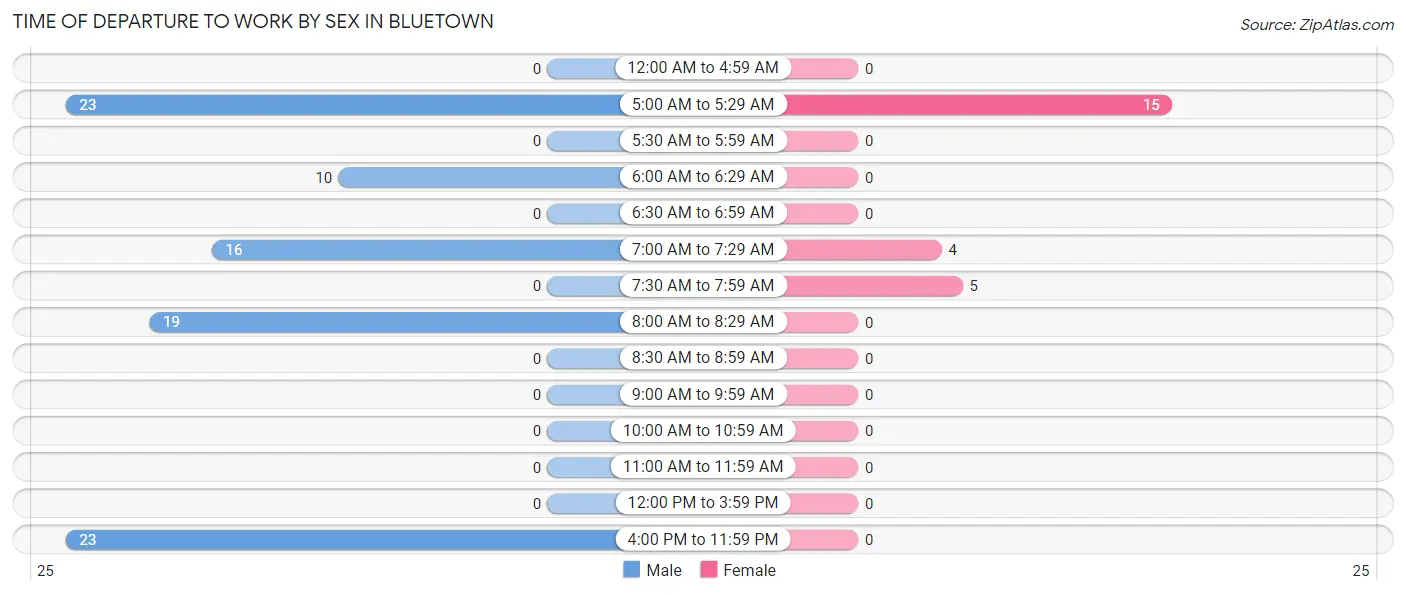
| Time of Departure | Male | Female |
| 12:00 AM to 4:59 AM | 0 (0.0%) | 0 (0.0%) |
| 5:00 AM to 5:29 AM | 23 (25.3%) | 15 (62.5%) |
| 5:30 AM to 5:59 AM | 0 (0.0%) | 0 (0.0%) |
| 6:00 AM to 6:29 AM | 10 (11.0%) | 0 (0.0%) |
| 6:30 AM to 6:59 AM | 0 (0.0%) | 0 (0.0%) |
| 7:00 AM to 7:29 AM | 16 (17.6%) | 4 (16.7%) |
| 7:30 AM to 7:59 AM | 0 (0.0%) | 5 (20.8%) |
| 8:00 AM to 8:29 AM | 19 (20.9%) | 0 (0.0%) |
| 8:30 AM to 8:59 AM | 0 (0.0%) | 0 (0.0%) |
| 9:00 AM to 9:59 AM | 0 (0.0%) | 0 (0.0%) |
| 10:00 AM to 10:59 AM | 0 (0.0%) | 0 (0.0%) |
| 11:00 AM to 11:59 AM | 0 (0.0%) | 0 (0.0%) |
| 12:00 PM to 3:59 PM | 0 (0.0%) | 0 (0.0%) |
| 4:00 PM to 11:59 PM | 23 (25.3%) | 0 (0.0%) |
| Total | 91 (100.0%) | 24 (100.0%) |
Housing Occupancy in Bluetown
Occupancy by Ownership in Bluetown
Of the total 134 dwellings in Bluetown, owner-occupied units account for 109 (81.3%), while renter-occupied units make up 25 (18.7%).
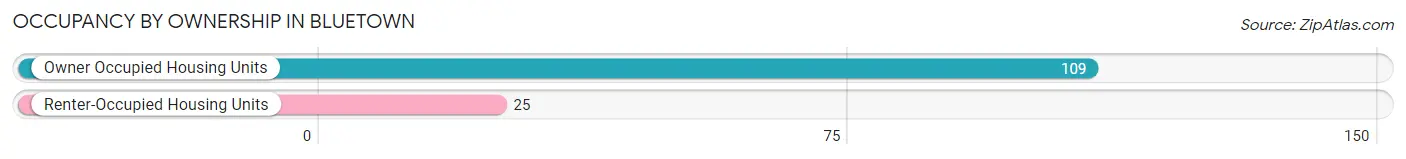
| Occupancy | # Housing Units | % Housing Units |
| Owner Occupied Housing Units | 109 | 81.3% |
| Renter-Occupied Housing Units | 25 | 18.7% |
| Total Occupied Housing Units | 134 | 100.0% |
Occupancy by Household Size in Bluetown
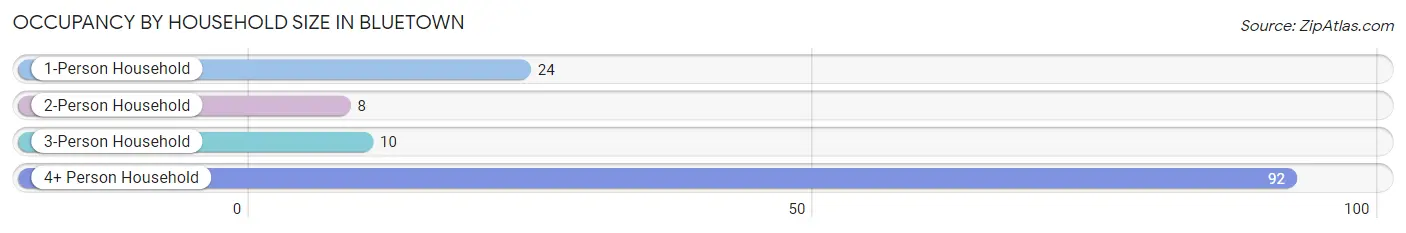
| Household Size | # Housing Units | % Housing Units |
| 1-Person Household | 24 | 17.9% |
| 2-Person Household | 8 | 6.0% |
| 3-Person Household | 10 | 7.5% |
| 4+ Person Household | 92 | 68.7% |
| Total Housing Units | 134 | 100.0% |
Occupancy by Ownership by Household Size in Bluetown
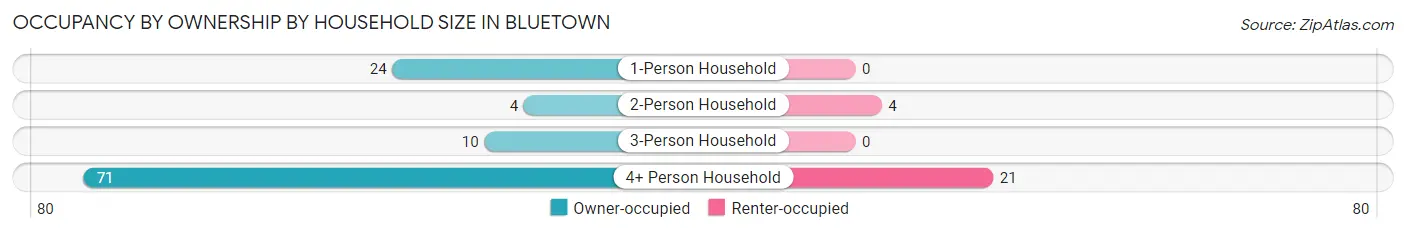
| Household Size | Owner-occupied | Renter-occupied |
| 1-Person Household | 24 (100.0%) | 0 (0.0%) |
| 2-Person Household | 4 (50.0%) | 4 (50.0%) |
| 3-Person Household | 10 (100.0%) | 0 (0.0%) |
| 4+ Person Household | 71 (77.2%) | 21 (22.8%) |
| Total Housing Units | 109 (81.3%) | 25 (18.7%) |
Occupancy by Educational Attainment in Bluetown
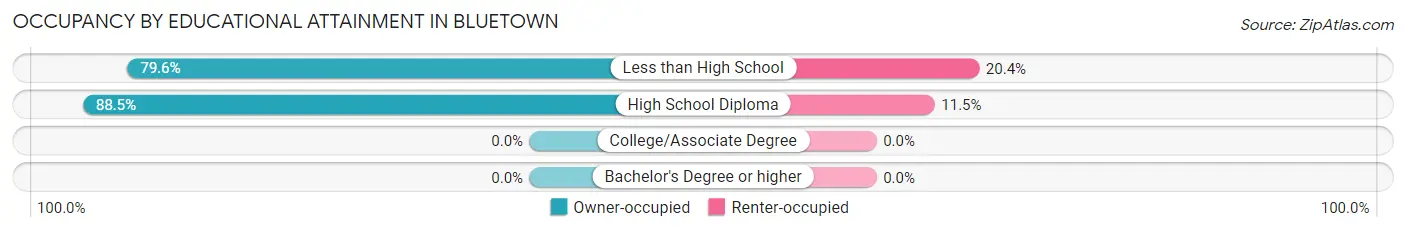
| Household Size | Owner-occupied | Renter-occupied |
| Less than High School | 86 (79.6%) | 22 (20.4%) |
| High School Diploma | 23 (88.5%) | 3 (11.5%) |
| College/Associate Degree | 0 (0.0%) | 0 (0.0%) |
| Bachelor's Degree or higher | 0 (0.0%) | 0 (0.0%) |
Occupancy by Age of Householder in Bluetown
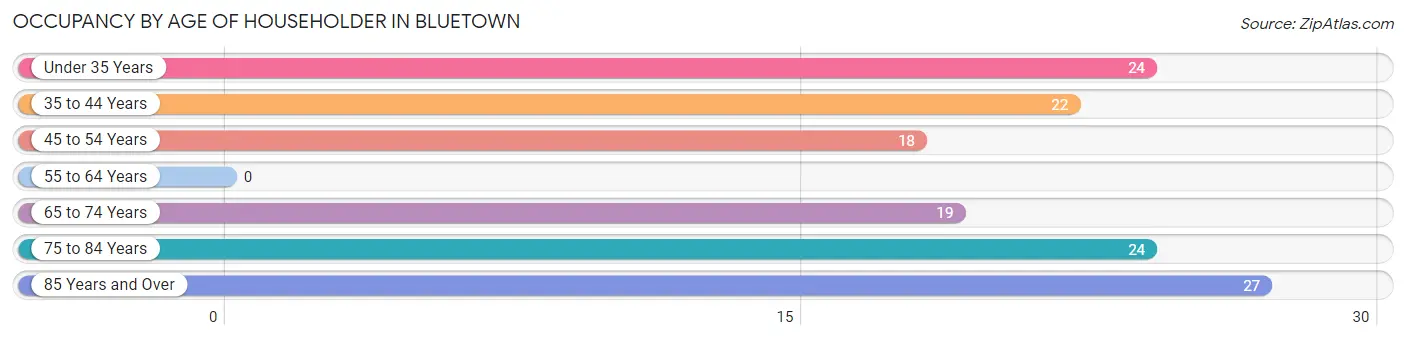
| Age Bracket | # Households | % Households |
| Under 35 Years | 24 | 17.9% |
| 35 to 44 Years | 22 | 16.4% |
| 45 to 54 Years | 18 | 13.4% |
| 55 to 64 Years | 0 | 0.0% |
| 65 to 74 Years | 19 | 14.2% |
| 75 to 84 Years | 24 | 17.9% |
| 85 Years and Over | 27 | 20.2% |
| Total | 134 | 100.0% |
Housing Finances in Bluetown
Median Income by Occupancy in Bluetown
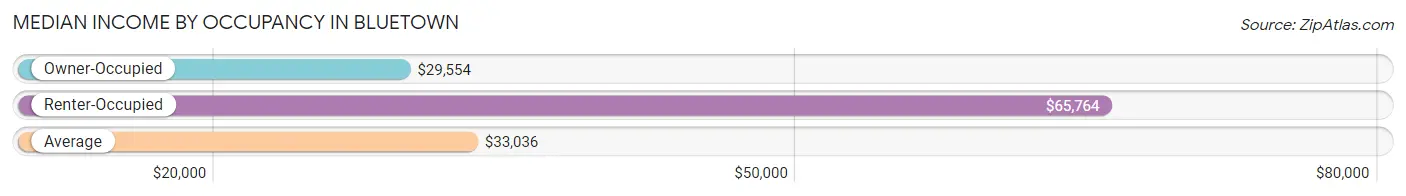
| Occupancy Type | # Households | Median Income |
| Owner-Occupied | 109 (81.3%) | $29,554 |
| Renter-Occupied | 25 (18.7%) | $65,764 |
| Average | 134 (100.0%) | $33,036 |
Occupancy by Householder Income Bracket in Bluetown
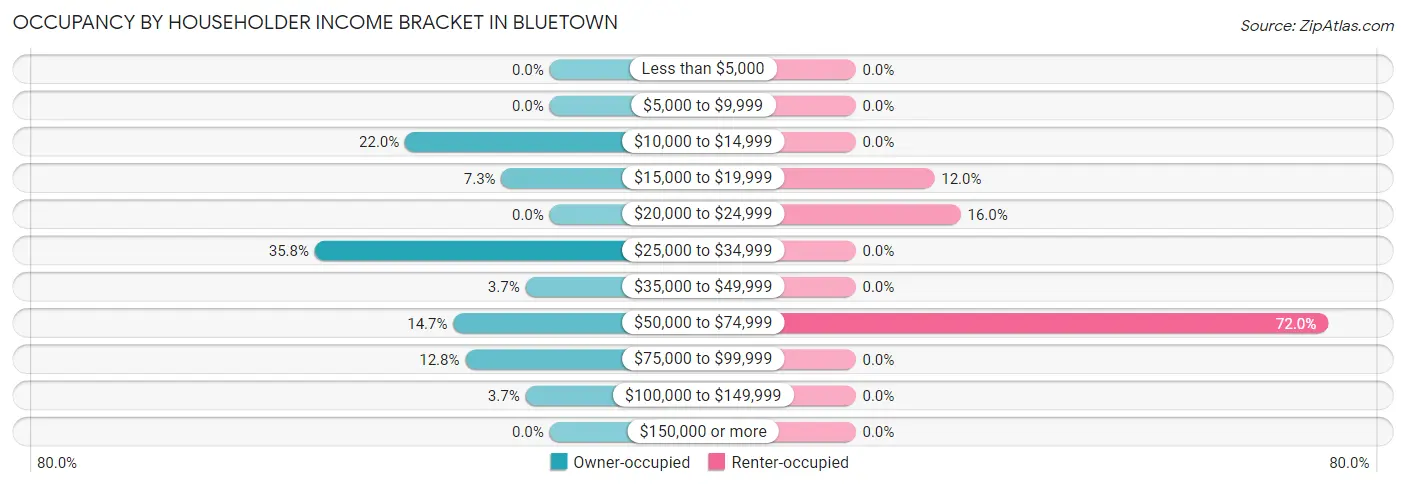
| Income Bracket | Owner-occupied | Renter-occupied |
| Less than $5,000 | 0 (0.0%) | 0 (0.0%) |
| $5,000 to $9,999 | 0 (0.0%) | 0 (0.0%) |
| $10,000 to $14,999 | 24 (22.0%) | 0 (0.0%) |
| $15,000 to $19,999 | 8 (7.3%) | 3 (12.0%) |
| $20,000 to $24,999 | 0 (0.0%) | 4 (16.0%) |
| $25,000 to $34,999 | 39 (35.8%) | 0 (0.0%) |
| $35,000 to $49,999 | 4 (3.7%) | 0 (0.0%) |
| $50,000 to $74,999 | 16 (14.7%) | 18 (72.0%) |
| $75,000 to $99,999 | 14 (12.8%) | 0 (0.0%) |
| $100,000 to $149,999 | 4 (3.7%) | 0 (0.0%) |
| $150,000 or more | 0 (0.0%) | 0 (0.0%) |
| Total | 109 (100.0%) | 25 (100.0%) |
Monthly Housing Cost Tiers in Bluetown
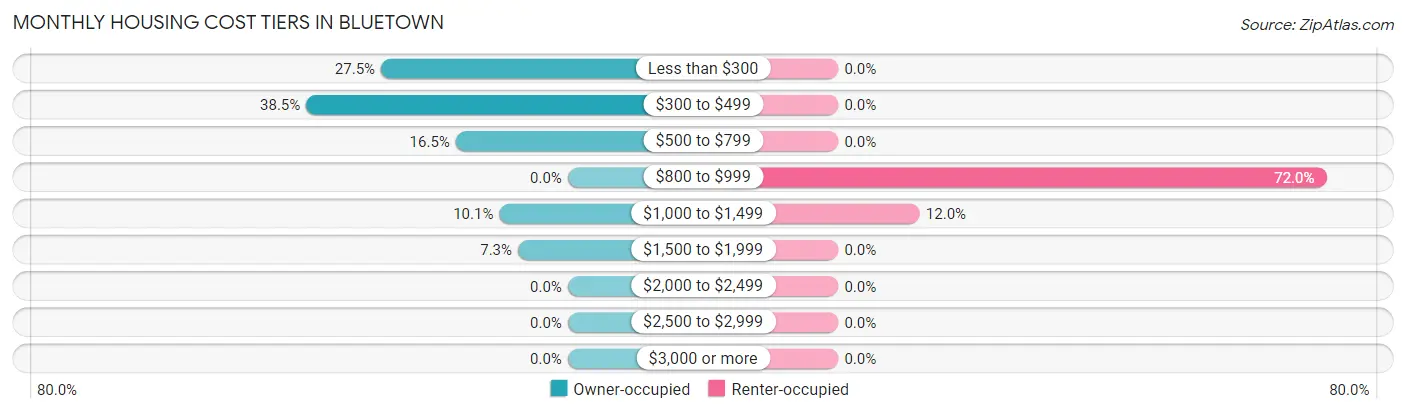
| Monthly Cost | Owner-occupied | Renter-occupied |
| Less than $300 | 30 (27.5%) | 0 (0.0%) |
| $300 to $499 | 42 (38.5%) | 0 (0.0%) |
| $500 to $799 | 18 (16.5%) | 0 (0.0%) |
| $800 to $999 | 0 (0.0%) | 18 (72.0%) |
| $1,000 to $1,499 | 11 (10.1%) | 3 (12.0%) |
| $1,500 to $1,999 | 8 (7.3%) | 0 (0.0%) |
| $2,000 to $2,499 | 0 (0.0%) | 0 (0.0%) |
| $2,500 to $2,999 | 0 (0.0%) | 0 (0.0%) |
| $3,000 or more | 0 (0.0%) | 0 (0.0%) |
| Total | 109 (100.0%) | 25 (100.0%) |
Physical Housing Characteristics in Bluetown
Housing Structures in Bluetown
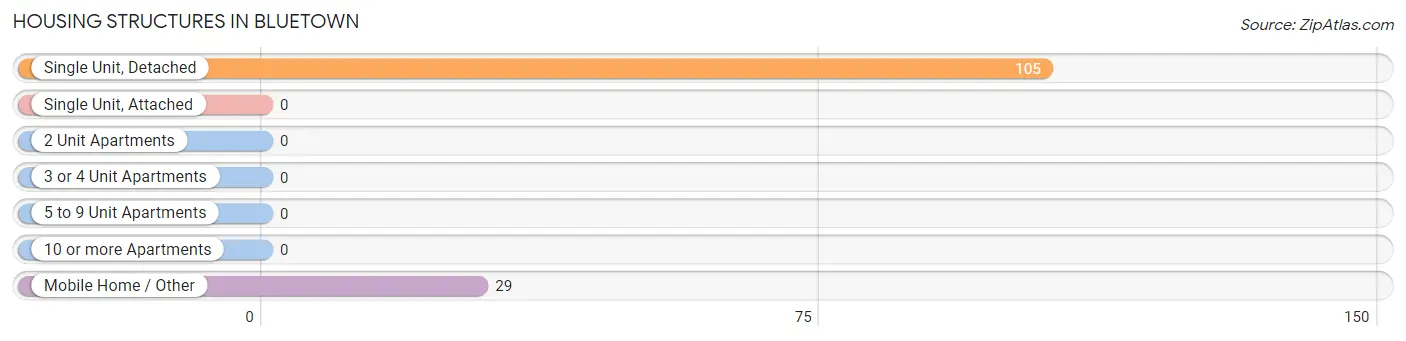
| Structure Type | # Housing Units | % Housing Units |
| Single Unit, Detached | 105 | 78.4% |
| Single Unit, Attached | 0 | 0.0% |
| 2 Unit Apartments | 0 | 0.0% |
| 3 or 4 Unit Apartments | 0 | 0.0% |
| 5 to 9 Unit Apartments | 0 | 0.0% |
| 10 or more Apartments | 0 | 0.0% |
| Mobile Home / Other | 29 | 21.6% |
| Total | 134 | 100.0% |
Housing Structures by Occupancy in Bluetown
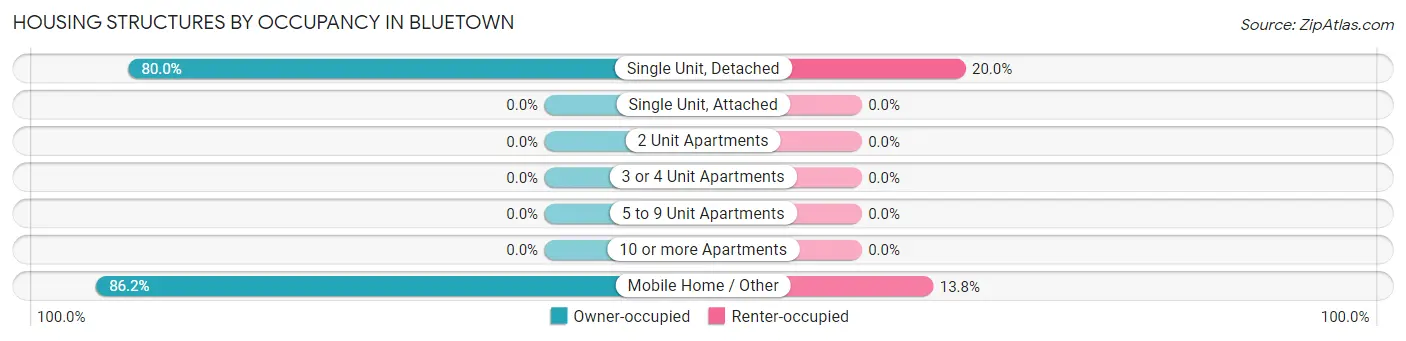
| Structure Type | Owner-occupied | Renter-occupied |
| Single Unit, Detached | 84 (80.0%) | 21 (20.0%) |
| Single Unit, Attached | 0 (0.0%) | 0 (0.0%) |
| 2 Unit Apartments | 0 (0.0%) | 0 (0.0%) |
| 3 or 4 Unit Apartments | 0 (0.0%) | 0 (0.0%) |
| 5 to 9 Unit Apartments | 0 (0.0%) | 0 (0.0%) |
| 10 or more Apartments | 0 (0.0%) | 0 (0.0%) |
| Mobile Home / Other | 25 (86.2%) | 4 (13.8%) |
| Total | 109 (81.3%) | 25 (18.7%) |
Housing Structures by Number of Rooms in Bluetown
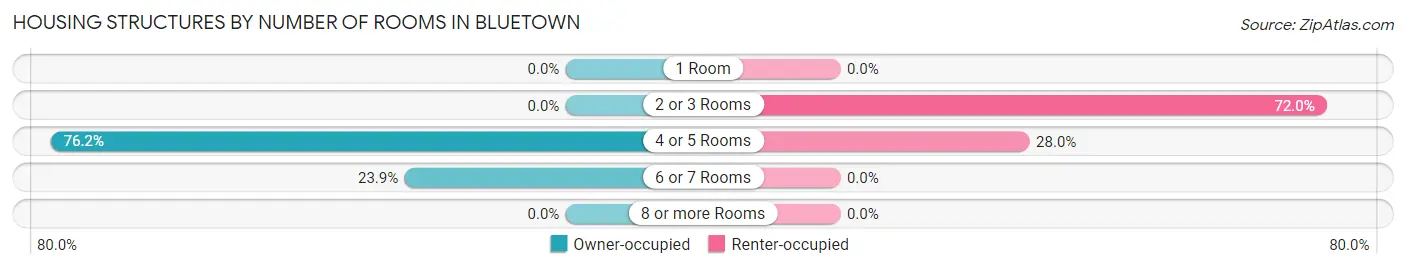
| Number of Rooms | Owner-occupied | Renter-occupied |
| 1 Room | 0 (0.0%) | 0 (0.0%) |
| 2 or 3 Rooms | 0 (0.0%) | 18 (72.0%) |
| 4 or 5 Rooms | 83 (76.1%) | 7 (28.0%) |
| 6 or 7 Rooms | 26 (23.8%) | 0 (0.0%) |
| 8 or more Rooms | 0 (0.0%) | 0 (0.0%) |
| Total | 109 (100.0%) | 25 (100.0%) |
Housing Structure by Heating Type in Bluetown
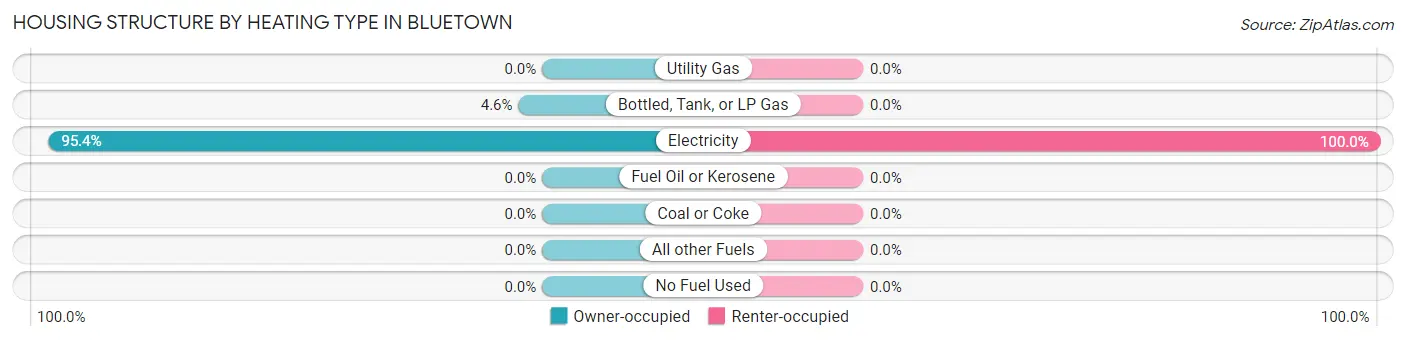
| Heating Type | Owner-occupied | Renter-occupied |
| Utility Gas | 0 (0.0%) | 0 (0.0%) |
| Bottled, Tank, or LP Gas | 5 (4.6%) | 0 (0.0%) |
| Electricity | 104 (95.4%) | 25 (100.0%) |
| Fuel Oil or Kerosene | 0 (0.0%) | 0 (0.0%) |
| Coal or Coke | 0 (0.0%) | 0 (0.0%) |
| All other Fuels | 0 (0.0%) | 0 (0.0%) |
| No Fuel Used | 0 (0.0%) | 0 (0.0%) |
| Total | 109 (100.0%) | 25 (100.0%) |
Household Vehicle Usage in Bluetown
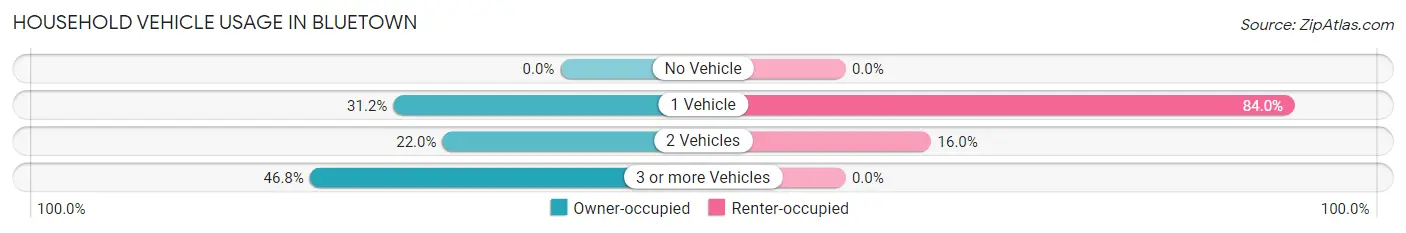
| Vehicles per Household | Owner-occupied | Renter-occupied |
| No Vehicle | 0 (0.0%) | 0 (0.0%) |
| 1 Vehicle | 34 (31.2%) | 21 (84.0%) |
| 2 Vehicles | 24 (22.0%) | 4 (16.0%) |
| 3 or more Vehicles | 51 (46.8%) | 0 (0.0%) |
| Total | 109 (100.0%) | 25 (100.0%) |
Real Estate & Mortgages in Bluetown
Real Estate and Mortgage Overview in Bluetown
| Characteristic | Without Mortgage | With Mortgage |
| Housing Units | 90 | 19 |
| Median Property Value | $53,600 | $0 |
| Median Household Income | $33,750 | $0 |
| Monthly Housing Costs | $364 | $0 |
| Real Estate Taxes | $906 | $0 |
Property Value by Mortgage Status in Bluetown
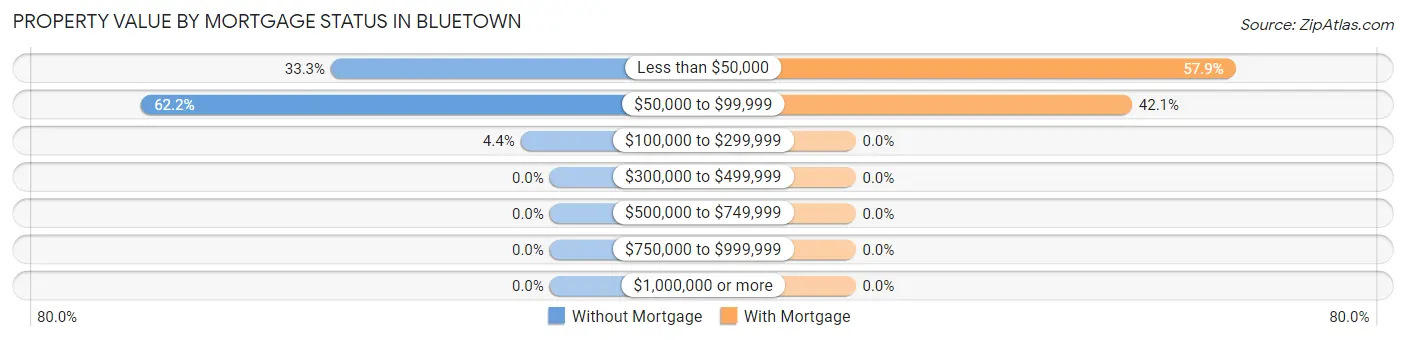
| Property Value | Without Mortgage | With Mortgage |
| Less than $50,000 | 30 (33.3%) | 11 (57.9%) |
| $50,000 to $99,999 | 56 (62.2%) | 8 (42.1%) |
| $100,000 to $299,999 | 4 (4.4%) | 0 (0.0%) |
| $300,000 to $499,999 | 0 (0.0%) | 0 (0.0%) |
| $500,000 to $749,999 | 0 (0.0%) | 0 (0.0%) |
| $750,000 to $999,999 | 0 (0.0%) | 0 (0.0%) |
| $1,000,000 or more | 0 (0.0%) | 0 (0.0%) |
| Total | 90 (100.0%) | 19 (100.0%) |
Household Income by Mortgage Status in Bluetown
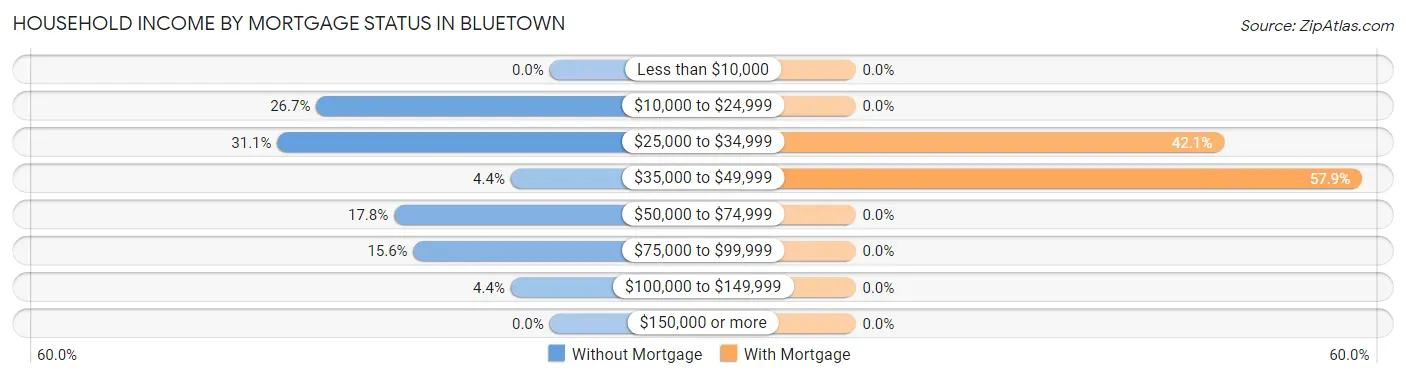
| Household Income | Without Mortgage | With Mortgage |
| Less than $10,000 | 0 (0.0%) | 0 (0.0%) |
| $10,000 to $24,999 | 24 (26.7%) | 0 (0.0%) |
| $25,000 to $34,999 | 28 (31.1%) | 8 (42.1%) |
| $35,000 to $49,999 | 4 (4.4%) | 11 (57.9%) |
| $50,000 to $74,999 | 16 (17.8%) | 0 (0.0%) |
| $75,000 to $99,999 | 14 (15.6%) | 0 (0.0%) |
| $100,000 to $149,999 | 4 (4.4%) | 0 (0.0%) |
| $150,000 or more | 0 (0.0%) | 0 (0.0%) |
| Total | 90 (100.0%) | 19 (100.0%) |
Property Value to Household Income Ratio in Bluetown
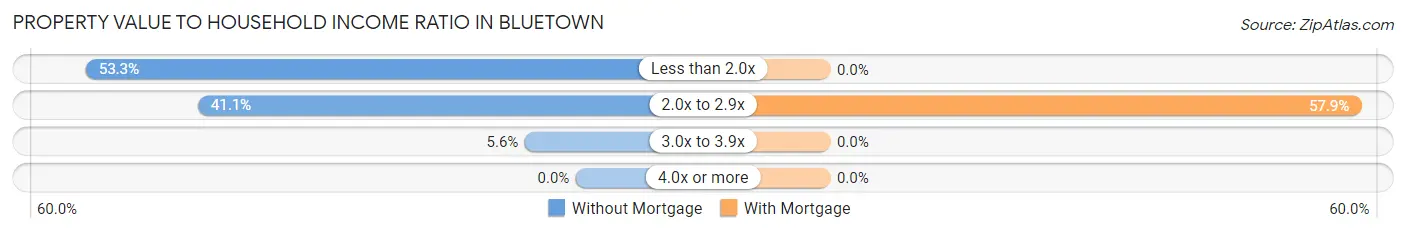
| Value-to-Income Ratio | Without Mortgage | With Mortgage |
| Less than 2.0x | 48 (53.3%) | 0 (0.0%) |
| 2.0x to 2.9x | 37 (41.1%) | 11 (57.9%) |
| 3.0x to 3.9x | 5 (5.6%) | 0 (0.0%) |
| 4.0x or more | 0 (0.0%) | 0 (0.0%) |
| Total | 90 (100.0%) | 19 (100.0%) |
Real Estate Taxes by Mortgage Status in Bluetown
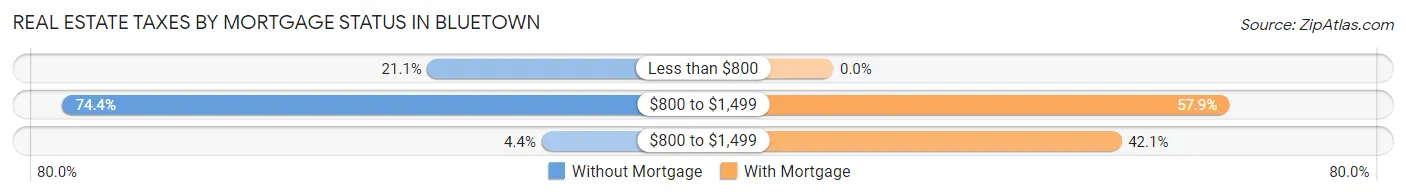
| Property Taxes | Without Mortgage | With Mortgage |
| Less than $800 | 19 (21.1%) | 0 (0.0%) |
| $800 to $1,499 | 67 (74.4%) | 11 (57.9%) |
| $800 to $1,499 | 4 (4.4%) | 8 (42.1%) |
| Total | 90 (100.0%) | 19 (100.0%) |
Health & Disability in Bluetown
Health Insurance Coverage by Age in Bluetown
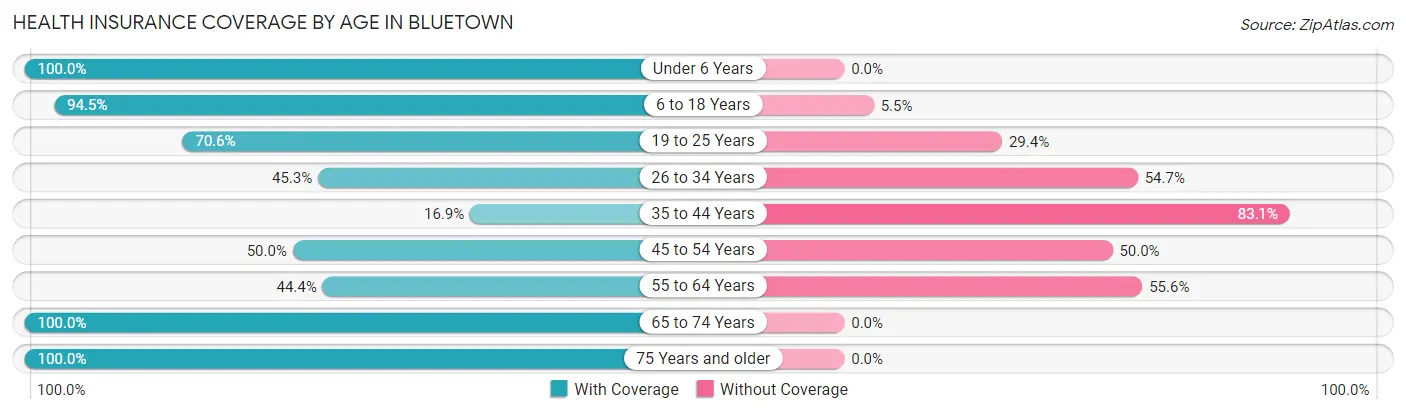
| Age Bracket | With Coverage | Without Coverage |
| Under 6 Years | 74 (100.0%) | 0 (0.0%) |
| 6 to 18 Years | 155 (94.5%) | 9 (5.5%) |
| 19 to 25 Years | 36 (70.6%) | 15 (29.4%) |
| 26 to 34 Years | 24 (45.3%) | 29 (54.7%) |
| 35 to 44 Years | 11 (16.9%) | 54 (83.1%) |
| 45 to 54 Years | 34 (50.0%) | 34 (50.0%) |
| 55 to 64 Years | 16 (44.4%) | 20 (55.6%) |
| 65 to 74 Years | 47 (100.0%) | 0 (0.0%) |
| 75 Years and older | 61 (100.0%) | 0 (0.0%) |
| Total | 458 (74.0%) | 161 (26.0%) |
Health Insurance Coverage by Citizenship Status in Bluetown
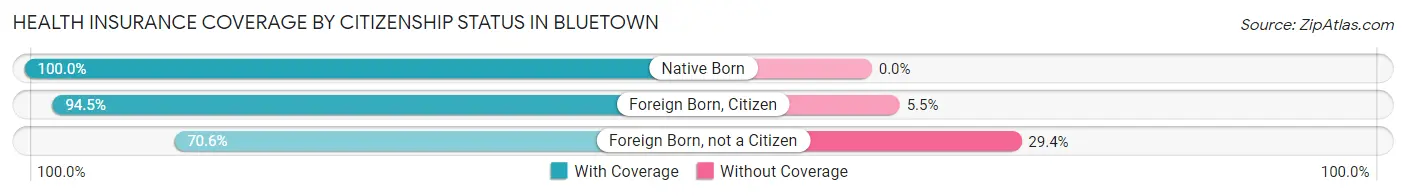
| Citizenship Status | With Coverage | Without Coverage |
| Native Born | 74 (100.0%) | 0 (0.0%) |
| Foreign Born, Citizen | 155 (94.5%) | 9 (5.5%) |
| Foreign Born, not a Citizen | 36 (70.6%) | 15 (29.4%) |
Health Insurance Coverage by Household Income in Bluetown
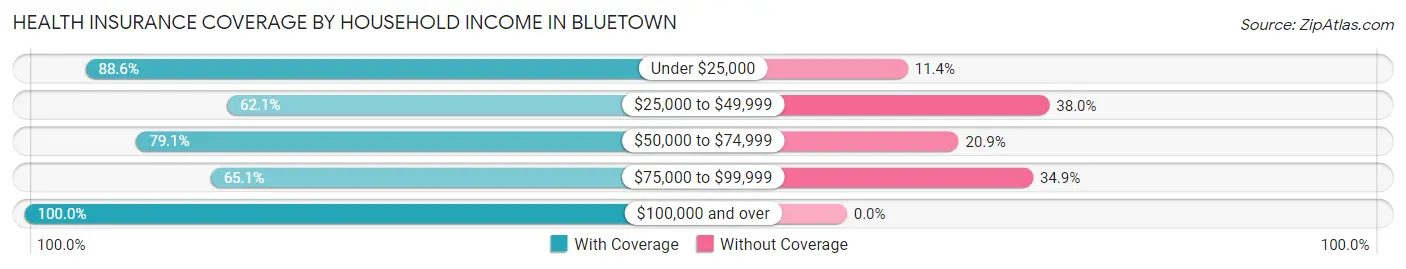
| Household Income | With Coverage | Without Coverage |
| Under $25,000 | 62 (88.6%) | 8 (11.4%) |
| $25,000 to $49,999 | 121 (62.1%) | 74 (38.0%) |
| $50,000 to $74,999 | 185 (79.1%) | 49 (20.9%) |
| $75,000 to $99,999 | 56 (65.1%) | 30 (34.9%) |
| $100,000 and over | 34 (100.0%) | 0 (0.0%) |
Public vs Private Health Insurance Coverage by Age in Bluetown
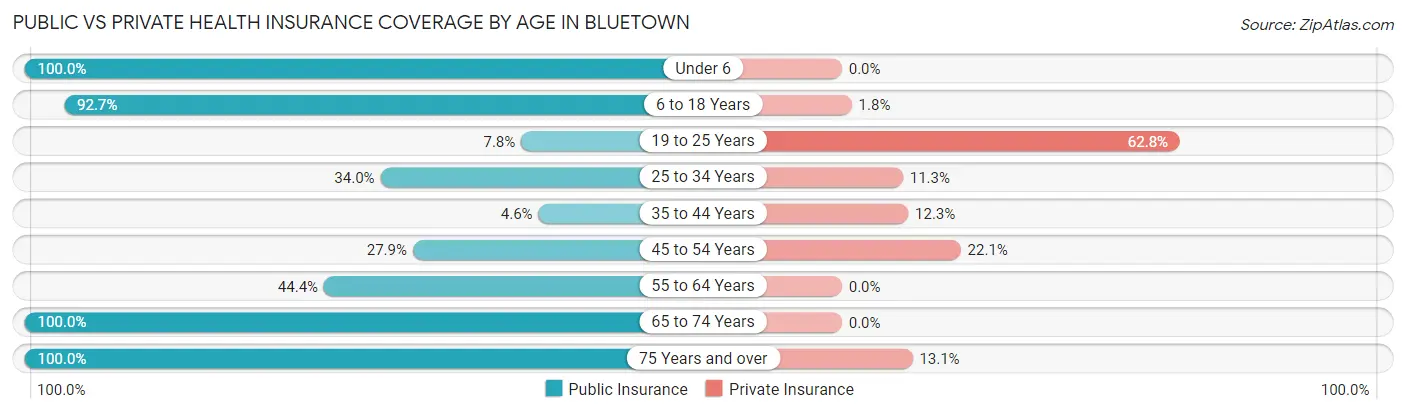
| Age Bracket | Public Insurance | Private Insurance |
| Under 6 | 74 (100.0%) | 0 (0.0%) |
| 6 to 18 Years | 152 (92.7%) | 3 (1.8%) |
| 19 to 25 Years | 4 (7.8%) | 32 (62.7%) |
| 25 to 34 Years | 18 (34.0%) | 6 (11.3%) |
| 35 to 44 Years | 3 (4.6%) | 8 (12.3%) |
| 45 to 54 Years | 19 (27.9%) | 15 (22.1%) |
| 55 to 64 Years | 16 (44.4%) | 0 (0.0%) |
| 65 to 74 Years | 47 (100.0%) | 0 (0.0%) |
| 75 Years and over | 61 (100.0%) | 8 (13.1%) |
| Total | 394 (63.6%) | 72 (11.6%) |
Disability Status by Sex by Age in Bluetown
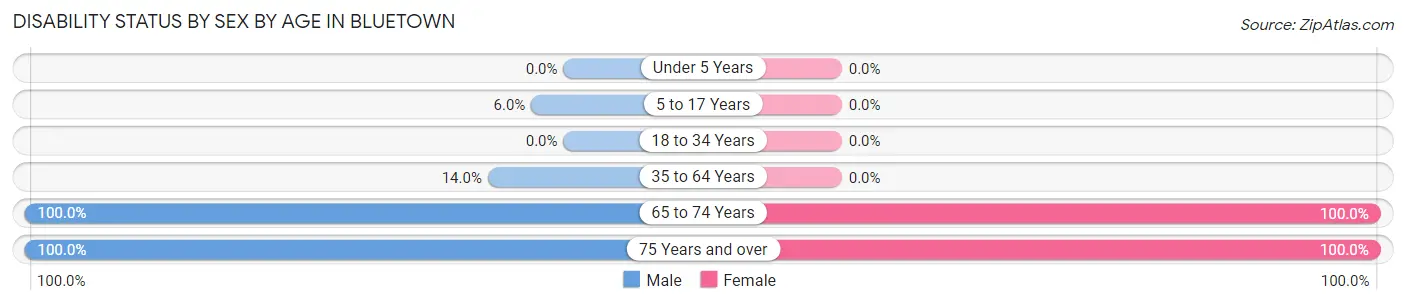
| Age Bracket | Male | Female |
| Under 5 Years | 0 (0.0%) | 0 (0.0%) |
| 5 to 17 Years | 4 (6.0%) | 0 (0.0%) |
| 18 to 34 Years | 0 (0.0%) | 0 (0.0%) |
| 35 to 64 Years | 16 (14.0%) | 0 (0.0%) |
| 65 to 74 Years | 19 (100.0%) | 28 (100.0%) |
| 75 Years and over | 36 (100.0%) | 25 (100.0%) |
Disability Class by Sex by Age in Bluetown
Disability Class: Hearing Difficulty
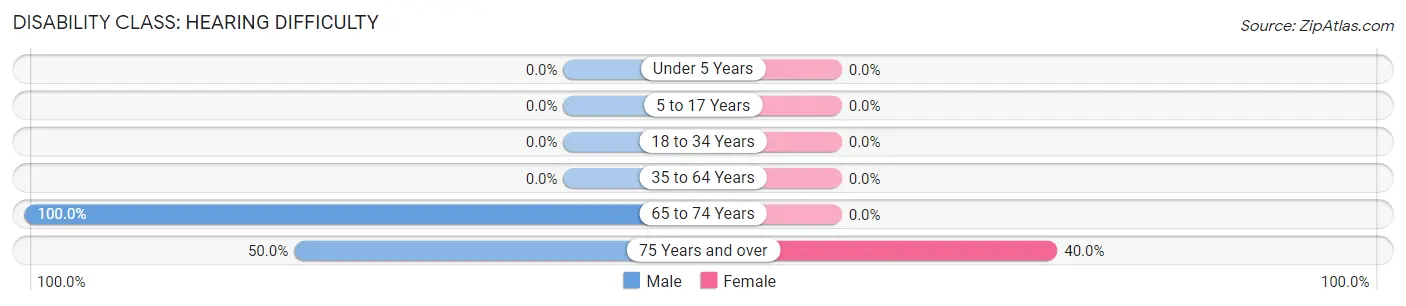
| Age Bracket | Male | Female |
| Under 5 Years | 0 (0.0%) | 0 (0.0%) |
| 5 to 17 Years | 0 (0.0%) | 0 (0.0%) |
| 18 to 34 Years | 0 (0.0%) | 0 (0.0%) |
| 35 to 64 Years | 0 (0.0%) | 0 (0.0%) |
| 65 to 74 Years | 19 (100.0%) | 0 (0.0%) |
| 75 Years and over | 18 (50.0%) | 10 (40.0%) |
Disability Class: Vision Difficulty
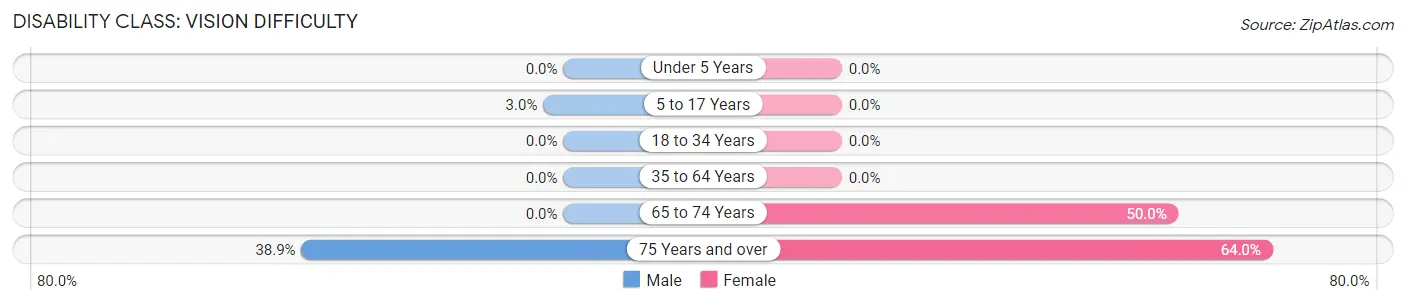
| Age Bracket | Male | Female |
| Under 5 Years | 0 (0.0%) | 0 (0.0%) |
| 5 to 17 Years | 2 (3.0%) | 0 (0.0%) |
| 18 to 34 Years | 0 (0.0%) | 0 (0.0%) |
| 35 to 64 Years | 0 (0.0%) | 0 (0.0%) |
| 65 to 74 Years | 0 (0.0%) | 14 (50.0%) |
| 75 Years and over | 14 (38.9%) | 16 (64.0%) |
Disability Class: Cognitive Difficulty
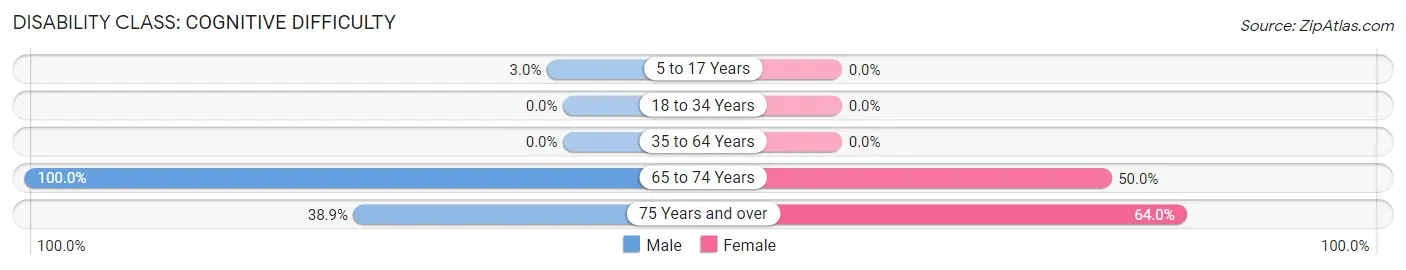
| Age Bracket | Male | Female |
| 5 to 17 Years | 2 (3.0%) | 0 (0.0%) |
| 18 to 34 Years | 0 (0.0%) | 0 (0.0%) |
| 35 to 64 Years | 0 (0.0%) | 0 (0.0%) |
| 65 to 74 Years | 19 (100.0%) | 14 (50.0%) |
| 75 Years and over | 14 (38.9%) | 16 (64.0%) |
Disability Class: Ambulatory Difficulty
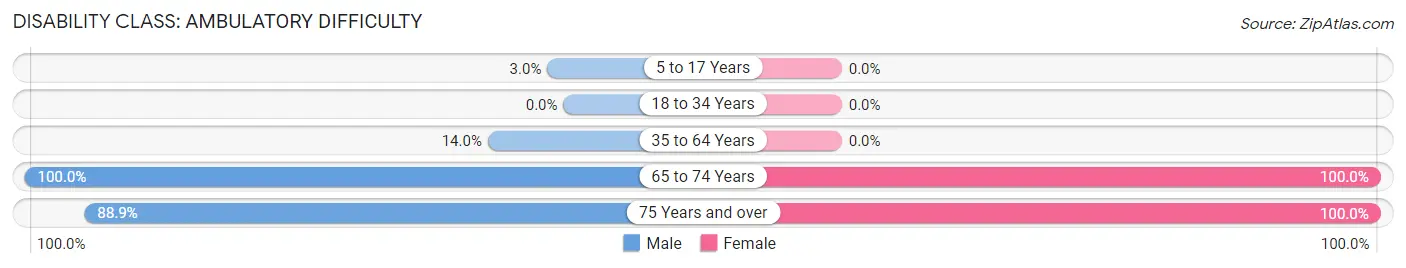
| Age Bracket | Male | Female |
| 5 to 17 Years | 2 (3.0%) | 0 (0.0%) |
| 18 to 34 Years | 0 (0.0%) | 0 (0.0%) |
| 35 to 64 Years | 16 (14.0%) | 0 (0.0%) |
| 65 to 74 Years | 19 (100.0%) | 28 (100.0%) |
| 75 Years and over | 32 (88.9%) | 25 (100.0%) |
Disability Class: Self-Care Difficulty
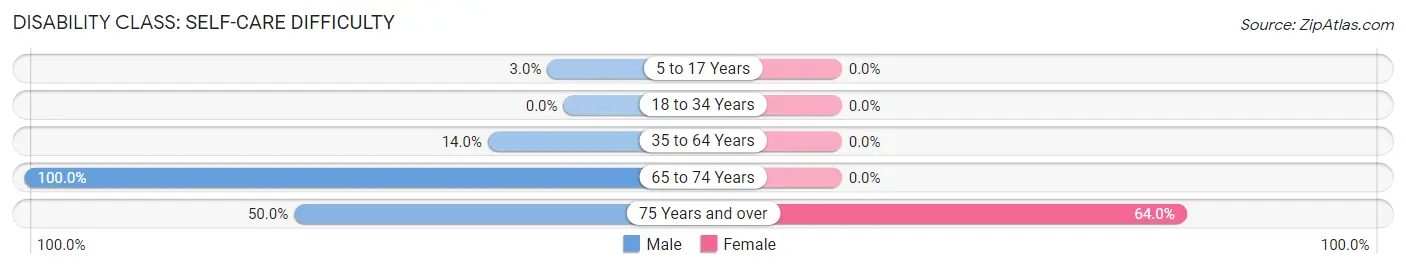
| Age Bracket | Male | Female |
| 5 to 17 Years | 2 (3.0%) | 0 (0.0%) |
| 18 to 34 Years | 0 (0.0%) | 0 (0.0%) |
| 35 to 64 Years | 16 (14.0%) | 0 (0.0%) |
| 65 to 74 Years | 19 (100.0%) | 0 (0.0%) |
| 75 Years and over | 18 (50.0%) | 16 (64.0%) |
Technology Access in Bluetown
Computing Device Access in Bluetown
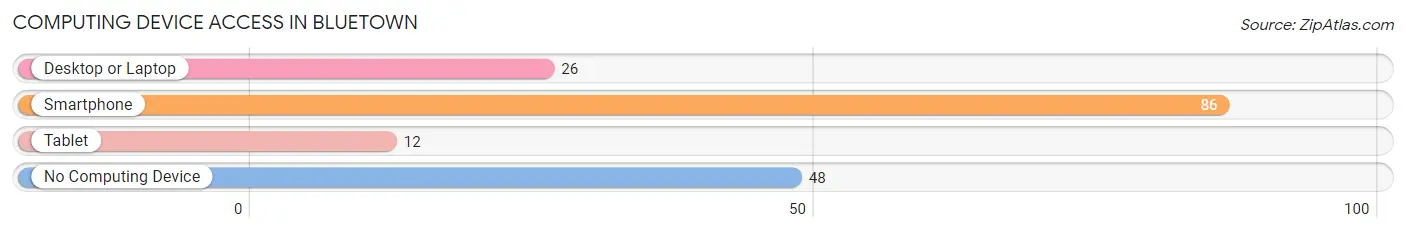
| Device Type | # Households | % Households |
| Desktop or Laptop | 26 | 19.4% |
| Smartphone | 86 | 64.2% |
| Tablet | 12 | 9.0% |
| No Computing Device | 48 | 35.8% |
| Total | 134 | 100.0% |
Internet Access in Bluetown
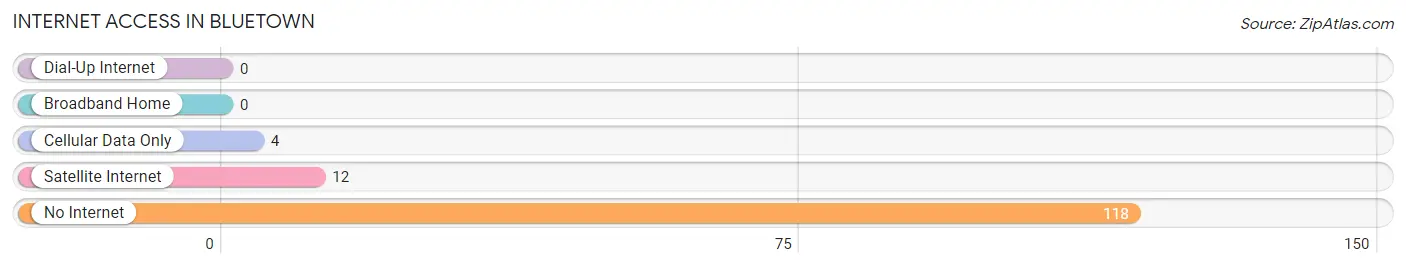
| Internet Type | # Households | % Households |
| Dial-Up Internet | 0 | 0.0% |
| Broadband Home | 0 | 0.0% |
| Cellular Data Only | 4 | 3.0% |
| Satellite Internet | 12 | 9.0% |
| No Internet | 118 | 88.1% |
| Total | 134 | 100.0% |
Bluetown Summary
Bluetown, Texas is a small town located in the southeastern part of the state, about an hour and a half from the state capital of Austin. It is situated in the rolling hills of the Texas Hill Country, and is surrounded by lush green pastures and rolling hills. The town is home to a population of just over 1,000 people, and is known for its small-town charm and friendly atmosphere.
Geography
Bluetown is located in the southeastern part of Texas, in the rolling hills of the Texas Hill Country. The town is situated on the banks of the San Marcos River, and is surrounded by lush green pastures and rolling hills. The town is located about an hour and a half from the state capital of Austin, and is close to the cities of San Antonio and Houston. The town is also close to the Guadalupe River, which is a popular destination for fishing and other outdoor activities.
The climate in Bluetown is generally mild, with temperatures ranging from the mid-50s in the winter to the mid-90s in the summer. The town receives an average of about 30 inches of rain per year, and is known for its mild winters and hot summers.
Economy
The economy of Bluetown is largely based on agriculture and tourism. The town is home to several farms and ranches, which produce a variety of crops and livestock. The town is also home to several small businesses, including restaurants, shops, and other services. Tourism is also an important part of the local economy, as the town is a popular destination for outdoor activities such as fishing, camping, and hiking.
Demographics
As of the 2010 census, the population of Bluetown was 1,072. The population is largely white, with about 75% of the population identifying as white. The remaining 25% of the population is made up of African Americans, Hispanics, and other ethnicities. The median household income in Bluetown is $45,000, and the median age is 37.
Bluetown is a small town with a big heart. The town is known for its friendly atmosphere and small-town charm, and is a popular destination for outdoor activities and relaxation. The town is home to a diverse population, and is a great place to live, work, and play.
Common Questions
What is Per Capita Income in Bluetown?
Per Capita income in Bluetown is $9,995.
What is the Median Family Income in Bluetown?
Median Family Income in Bluetown is $32,679.
What is the Median Household income in Bluetown?
Median Household Income in Bluetown is $33,036.
What is Income or Wage Gap in Bluetown?
Income or Wage Gap in Bluetown is 69.7%.
Women in Bluetown earn 30.3 cents for every dollar earned by a man.
What is Inequality or Gini Index in Bluetown?
Inequality or Gini Index in Bluetown is 0.35.
What is the Total Population of Bluetown?
Total Population of Bluetown is 619.
What is the Total Male Population of Bluetown?
Total Male Population of Bluetown is 337.
What is the Total Female Population of Bluetown?
Total Female Population of Bluetown is 282.
What is the Ratio of Males per 100 Females in Bluetown?
There are 119.50 Males per 100 Females in Bluetown.
What is the Ratio of Females per 100 Males in Bluetown?
There are 83.68 Females per 100 Males in Bluetown.
What is the Median Population Age in Bluetown?
Median Population Age in Bluetown is 28.7 Years.
What is the Average Family Size in Bluetown
Average Family Size in Bluetown is 5.3 People.
What is the Average Household Size in Bluetown
Average Household Size in Bluetown is 4.6 People.
How Large is the Labor Force in Bluetown?
There are 143 People in the Labor Forcein in Bluetown.
What is the Percentage of People in the Labor Force in Bluetown?
36.0% of People are in the Labor Force in Bluetown.
What is the Unemployment Rate in Bluetown?
Unemployment Rate in Bluetown is 2.1%.