San Leanna, TX Map & Demographics
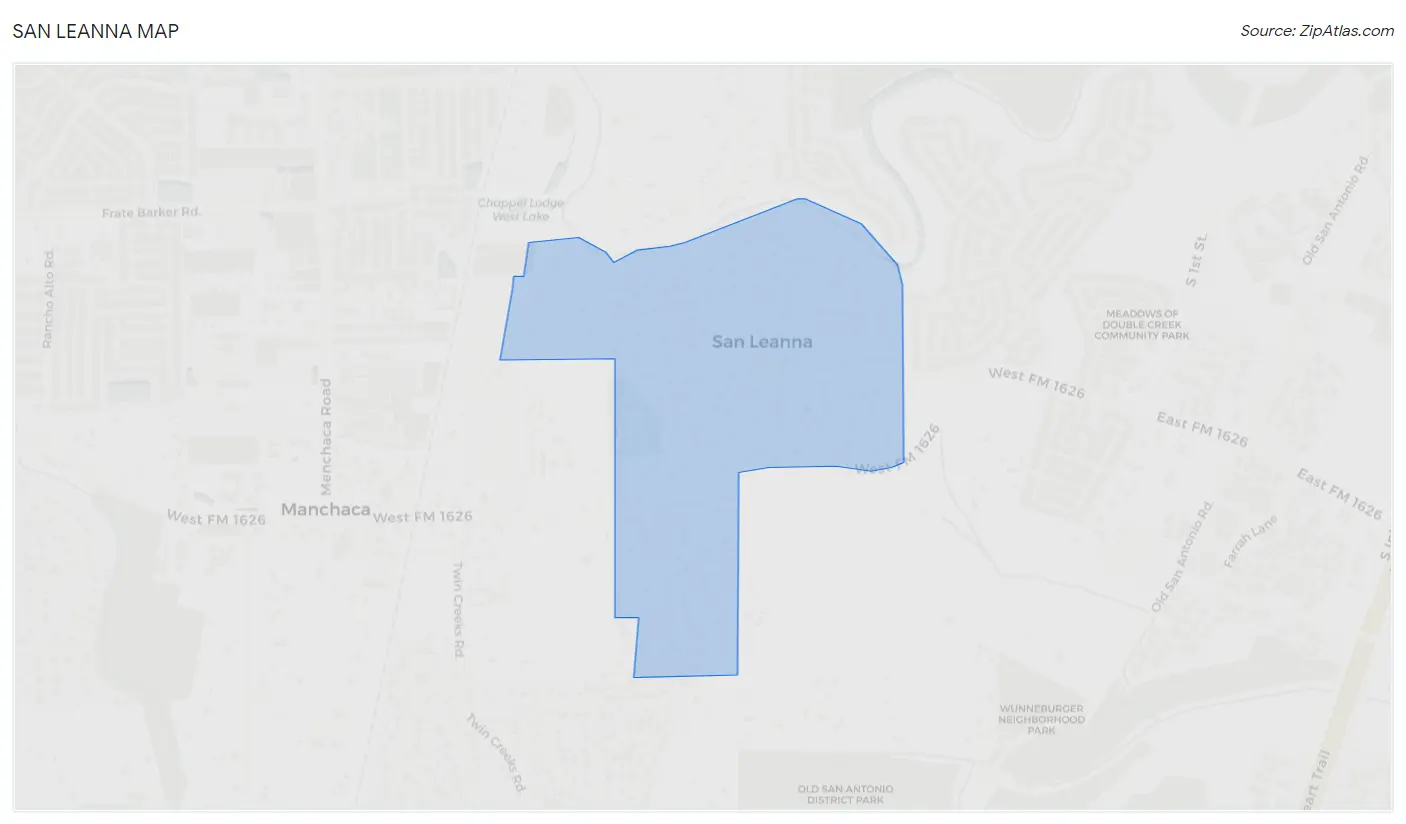
San Leanna Map
San Leanna Overview
$51,296
PER CAPITA INCOME
$120,313
AVG FAMILY INCOME
$100,000
AVG HOUSEHOLD INCOME
27.6%
WAGE / INCOME GAP [ % ]
72.4¢/ $1
WAGE / INCOME GAP [ $ ]
0.39
INEQUALITY / GINI INDEX
492
TOTAL POPULATION
220
MALE POPULATION
272
FEMALE POPULATION
80.88
MALES / 100 FEMALES
123.64
FEMALES / 100 MALES
51.0
MEDIAN AGE
2.6
AVG FAMILY SIZE
2.0
AVG HOUSEHOLD SIZE
244
LABOR FORCE [ PEOPLE ]
55.5%
PERCENT IN LABOR FORCE
9.4%
UNEMPLOYMENT RATE
Income in San Leanna
Income Overview in San Leanna
Per Capita Income in San Leanna is $51,296, while median incomes of families and households are $120,313 and $100,000 respectively.
| Characteristic | Number | Measure |
| Per Capita Income | 492 | $51,296 |
| Median Family Income | 143 | $120,313 |
| Mean Family Income | 143 | $132,514 |
| Median Household Income | 244 | $100,000 |
| Mean Household Income | 244 | $102,195 |
| Income Deficit | 143 | $0 |
| Wage / Income Gap (%) | 492 | 27.65% |
| Wage / Income Gap ($) | 492 | 72.35¢ per $1 |
| Gini / Inequality Index | 492 | 0.39 |
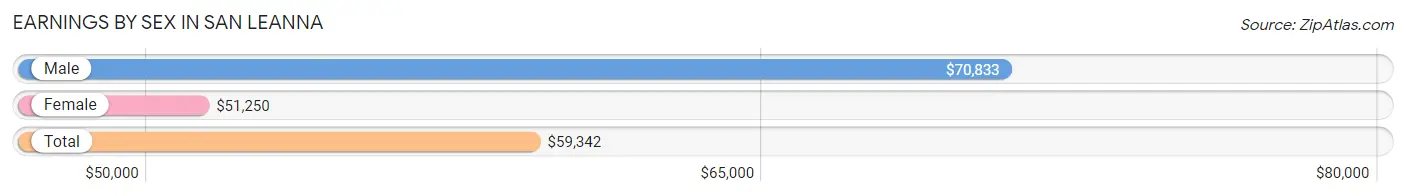
Earnings by Sex in San Leanna
Average Earnings in San Leanna are $59,342, $70,833 for men and $51,250 for women, a difference of 27.7%.
| Sex | Number | Average Earnings |
| Male | 134 (51.9%) | $70,833 |
| Female | 124 (48.1%) | $51,250 |
| Total | 258 (100.0%) | $59,342 |
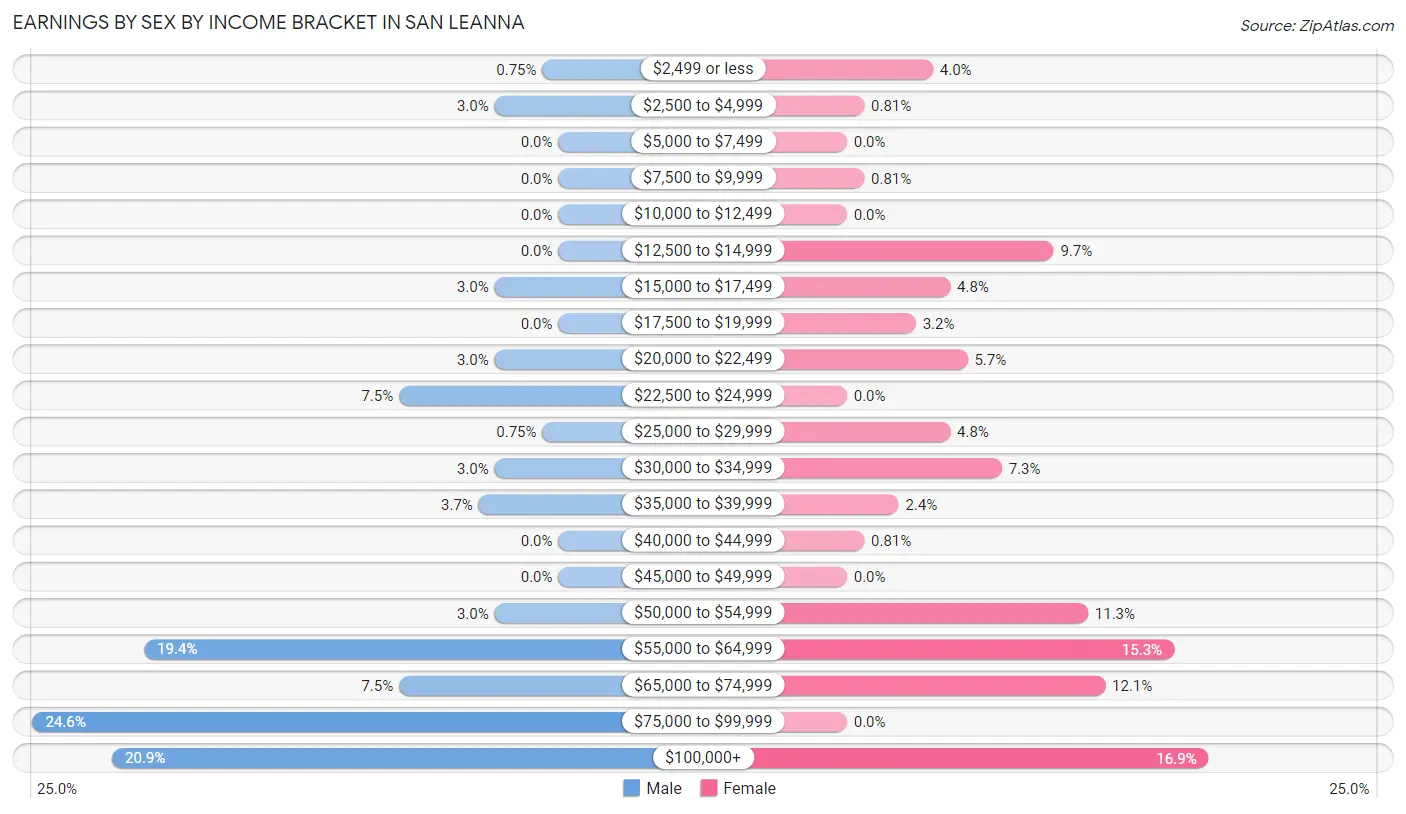
Earnings by Sex by Income Bracket in San Leanna
The most common earnings brackets in San Leanna are $75,000 to $99,999 for men (33 | 24.6%) and $100,000+ for women (21 | 16.9%).
| Income | Male | Female |
| $2,499 or less | 1 (0.7%) | 5 (4.0%) |
| $2,500 to $4,999 | 4 (3.0%) | 1 (0.8%) |
| $5,000 to $7,499 | 0 (0.0%) | 0 (0.0%) |
| $7,500 to $9,999 | 0 (0.0%) | 1 (0.8%) |
| $10,000 to $12,499 | 0 (0.0%) | 0 (0.0%) |
| $12,500 to $14,999 | 0 (0.0%) | 12 (9.7%) |
| $15,000 to $17,499 | 4 (3.0%) | 6 (4.8%) |
| $17,500 to $19,999 | 0 (0.0%) | 4 (3.2%) |
| $20,000 to $22,499 | 4 (3.0%) | 7 (5.7%) |
| $22,500 to $24,999 | 10 (7.5%) | 0 (0.0%) |
| $25,000 to $29,999 | 1 (0.7%) | 6 (4.8%) |
| $30,000 to $34,999 | 4 (3.0%) | 9 (7.3%) |
| $35,000 to $39,999 | 5 (3.7%) | 3 (2.4%) |
| $40,000 to $44,999 | 0 (0.0%) | 1 (0.8%) |
| $45,000 to $49,999 | 0 (0.0%) | 0 (0.0%) |
| $50,000 to $54,999 | 4 (3.0%) | 14 (11.3%) |
| $55,000 to $64,999 | 26 (19.4%) | 19 (15.3%) |
| $65,000 to $74,999 | 10 (7.5%) | 15 (12.1%) |
| $75,000 to $99,999 | 33 (24.6%) | 0 (0.0%) |
| $100,000+ | 28 (20.9%) | 21 (16.9%) |
| Total | 134 (100.0%) | 124 (100.0%) |
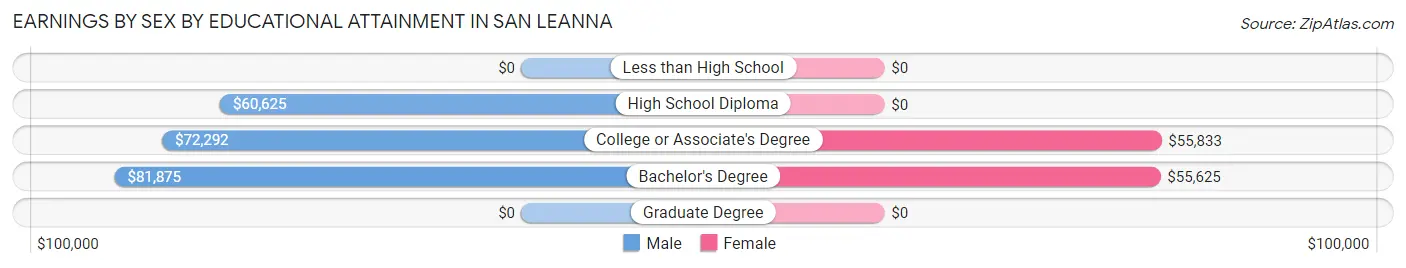
Earnings by Sex by Educational Attainment in San Leanna
Average earnings in San Leanna are $71,806 for men and $51,786 for women, a difference of 27.9%. Men with an educational attainment of bachelor's degree enjoy the highest average annual earnings of $81,875, while those with high school diploma education earn the least with $60,625. Women with an educational attainment of college or associate's degree earn the most with the average annual earnings of $55,833, while those with bachelor's degree education have the smallest earnings of $55,625.
| Educational Attainment | Male Income | Female Income |
| Less than High School | - | - |
| High School Diploma | $60,625 | $0 |
| College or Associate's Degree | $72,292 | $55,833 |
| Bachelor's Degree | $81,875 | $55,625 |
| Graduate Degree | - | - |
| Total | $71,806 | $51,786 |
Family Income in San Leanna
Family Income Brackets in San Leanna
According to the San Leanna family income data, there are 62 families falling into the $100,000 to $149,999 income range, which is the most common income bracket and makes up 43.4% of all families.
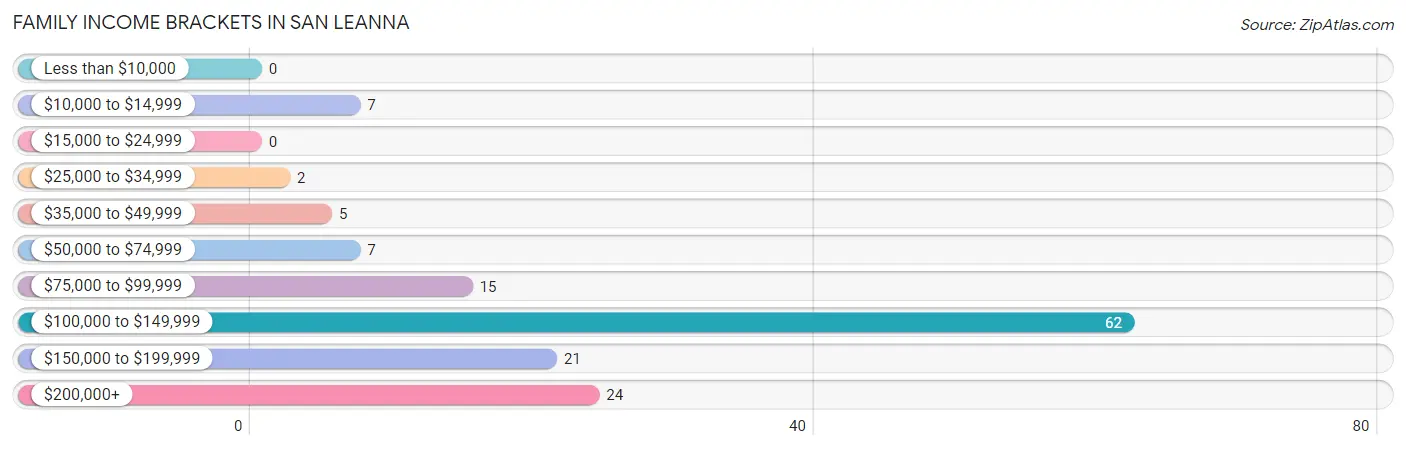
| Income Bracket | # Families | % Families |
| Less than $10,000 | 0 | 0.0% |
| $10,000 to $14,999 | 7 | 4.9% |
| $15,000 to $24,999 | 0 | 0.0% |
| $25,000 to $34,999 | 2 | 1.4% |
| $35,000 to $49,999 | 5 | 3.5% |
| $50,000 to $74,999 | 7 | 4.9% |
| $75,000 to $99,999 | 15 | 10.5% |
| $100,000 to $149,999 | 62 | 43.4% |
| $150,000 to $199,999 | 21 | 14.7% |
| $200,000+ | 24 | 16.8% |
Family Income by Famaliy Size in San Leanna
3-person families (30 | 21.0%) account for the highest median family income in San Leanna with $145,500 per family, while 2-person families (90 | 62.9%) have the highest median income of $61,875 per family member.
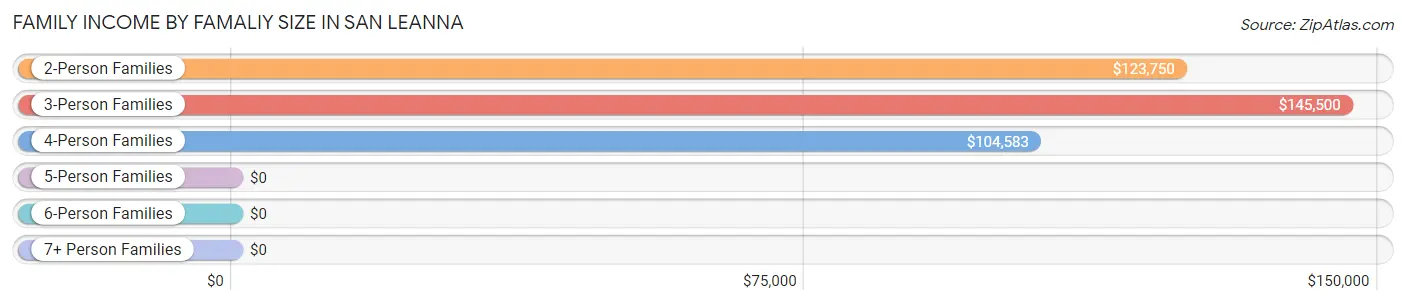
| Income Bracket | # Families | Median Income |
| 2-Person Families | 90 (62.9%) | $123,750 |
| 3-Person Families | 30 (21.0%) | $145,500 |
| 4-Person Families | 18 (12.6%) | $104,583 |
| 5-Person Families | 5 (3.5%) | $0 |
| 6-Person Families | 0 (0.0%) | $0 |
| 7+ Person Families | 0 (0.0%) | $0 |
| Total | 143 (100.0%) | $120,313 |
Family Income by Number of Earners in San Leanna
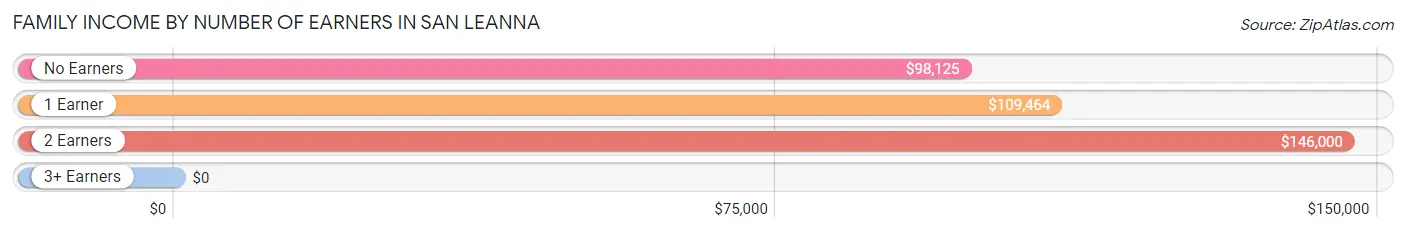
| Number of Earners | # Families | Median Income |
| No Earners | 35 (24.5%) | $98,125 |
| 1 Earner | 45 (31.5%) | $109,464 |
| 2 Earners | 62 (43.4%) | $146,000 |
| 3+ Earners | 1 (0.7%) | $0 |
| Total | 143 (100.0%) | $120,313 |
Household Income in San Leanna
Household Income Brackets in San Leanna
With 67 households falling in the category, the $100,000 to $149,999 income range is the most frequent in San Leanna, accounting for 27.5% of all households. In contrast, only 4 households (1.6%) fall into the less than $10,000 income bracket, making it the least populous group.
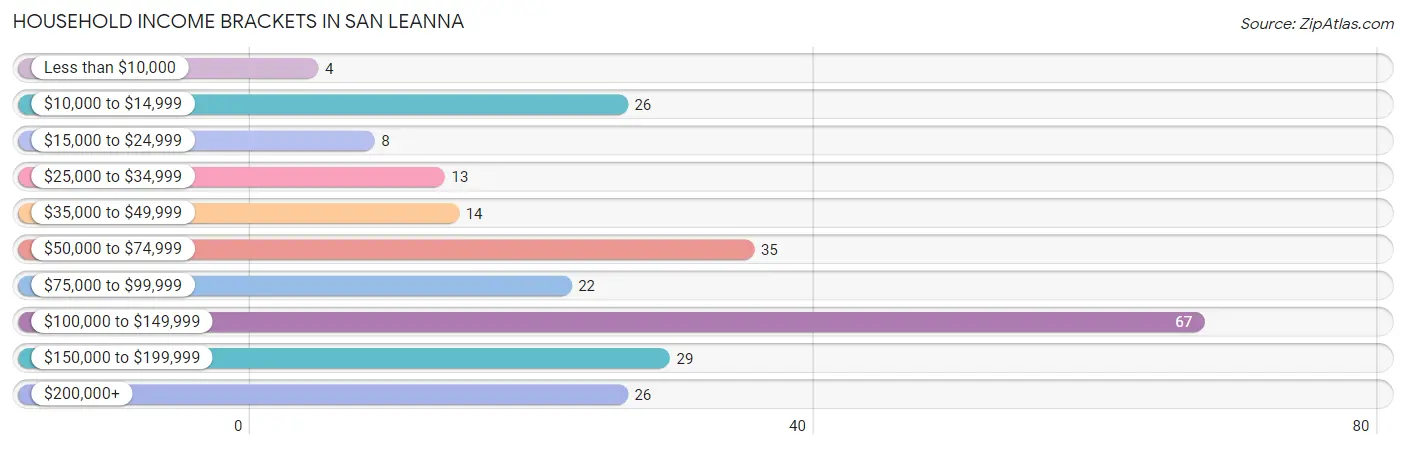
| Income Bracket | # Households | % Households |
| Less than $10,000 | 4 | 1.6% |
| $10,000 to $14,999 | 26 | 10.7% |
| $15,000 to $24,999 | 8 | 3.3% |
| $25,000 to $34,999 | 13 | 5.3% |
| $35,000 to $49,999 | 14 | 5.7% |
| $50,000 to $74,999 | 35 | 14.3% |
| $75,000 to $99,999 | 22 | 9.0% |
| $100,000 to $149,999 | 67 | 27.5% |
| $150,000 to $199,999 | 29 | 11.9% |
| $200,000+ | 26 | 10.7% |
Household Income by Householder Age in San Leanna
The median household income in San Leanna is $100,000, with the highest median household income of $138,438 found in the 25 to 44 years age bracket for the primary householder. A total of 88 households (36.1%) fall into this category. Meanwhile, the 15 to 24 years age bracket for the primary householder has the lowest median household income of $0, with 10 households (4.1%) in this group.
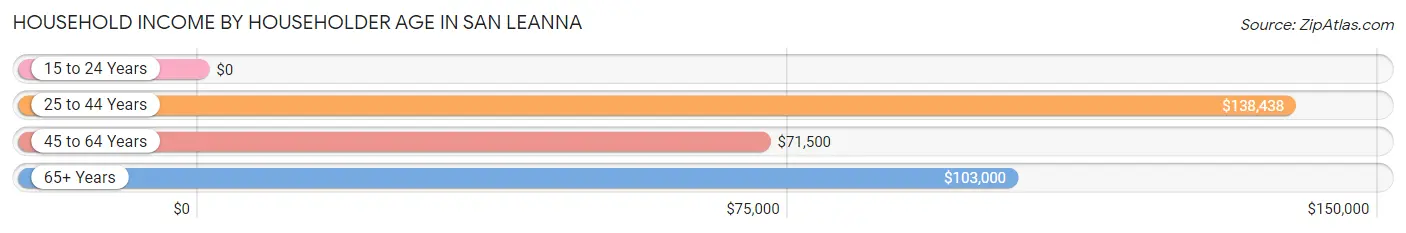
| Income Bracket | # Households | Median Income |
| 15 to 24 Years | 10 (4.1%) | $0 |
| 25 to 44 Years | 88 (36.1%) | $138,438 |
| 45 to 64 Years | 64 (26.2%) | $71,500 |
| 65+ Years | 82 (33.6%) | $103,000 |
| Total | 244 (100.0%) | $100,000 |
Poverty in San Leanna
Income Below Poverty by Sex and Age in San Leanna
With 5.9% poverty level for males and 9.9% for females among the residents of San Leanna, 18 to 24 year old males and 35 to 44 year old females are the most vulnerable to poverty, with 4 males (57.1%) and 12 females (33.3%) in their respective age groups living below the poverty level.
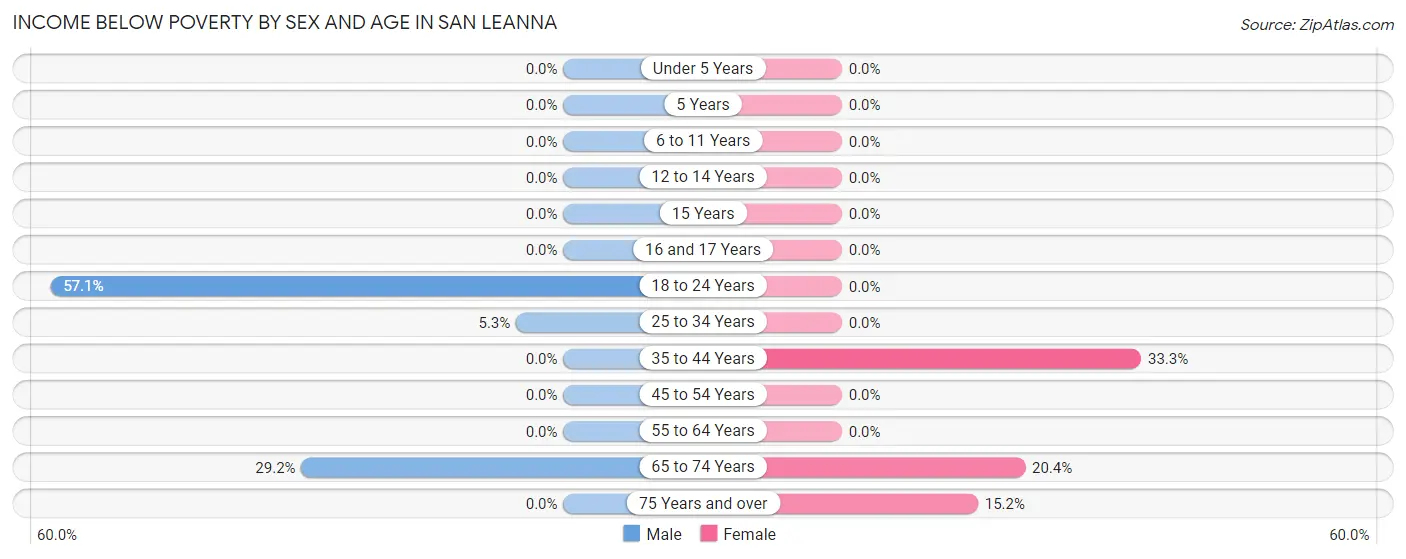
| Age Bracket | Male | Female |
| Under 5 Years | 0 (0.0%) | 0 (0.0%) |
| 5 Years | 0 (0.0%) | 0 (0.0%) |
| 6 to 11 Years | 0 (0.0%) | 0 (0.0%) |
| 12 to 14 Years | 0 (0.0%) | 0 (0.0%) |
| 15 Years | 0 (0.0%) | 0 (0.0%) |
| 16 and 17 Years | 0 (0.0%) | 0 (0.0%) |
| 18 to 24 Years | 4 (57.1%) | 0 (0.0%) |
| 25 to 34 Years | 2 (5.3%) | 0 (0.0%) |
| 35 to 44 Years | 0 (0.0%) | 12 (33.3%) |
| 45 to 54 Years | 0 (0.0%) | 0 (0.0%) |
| 55 to 64 Years | 0 (0.0%) | 0 (0.0%) |
| 65 to 74 Years | 7 (29.2%) | 10 (20.4%) |
| 75 Years and over | 0 (0.0%) | 5 (15.1%) |
| Total | 13 (5.9%) | 27 (9.9%) |
Income Above Poverty by Sex and Age in San Leanna
According to the poverty statistics in San Leanna, males aged under 5 years and females aged under 5 years are the age groups that are most secure financially, with 100.0% of males and 100.0% of females in these age groups living above the poverty line.
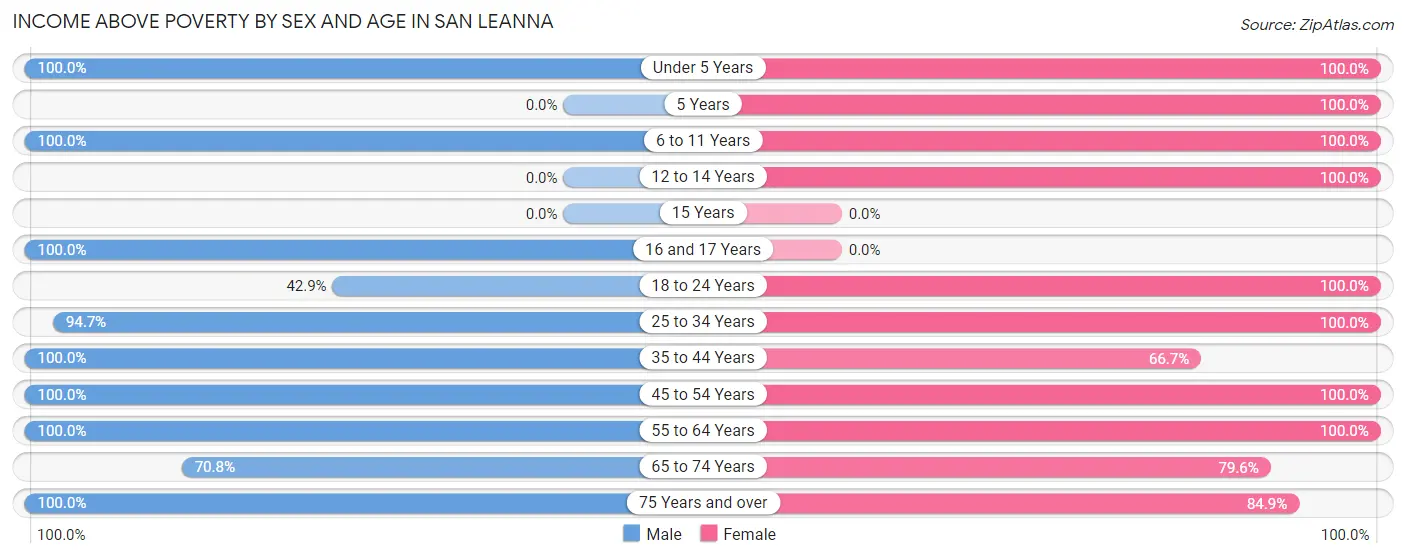
| Age Bracket | Male | Female |
| Under 5 Years | 8 (100.0%) | 25 (100.0%) |
| 5 Years | 0 (0.0%) | 2 (100.0%) |
| 6 to 11 Years | 7 (100.0%) | 7 (100.0%) |
| 12 to 14 Years | 0 (0.0%) | 3 (100.0%) |
| 15 Years | 0 (0.0%) | 0 (0.0%) |
| 16 and 17 Years | 3 (100.0%) | 0 (0.0%) |
| 18 to 24 Years | 3 (42.9%) | 9 (100.0%) |
| 25 to 34 Years | 36 (94.7%) | 52 (100.0%) |
| 35 to 44 Years | 38 (100.0%) | 24 (66.7%) |
| 45 to 54 Years | 22 (100.0%) | 13 (100.0%) |
| 55 to 64 Years | 43 (100.0%) | 43 (100.0%) |
| 65 to 74 Years | 17 (70.8%) | 39 (79.6%) |
| 75 Years and over | 30 (100.0%) | 28 (84.9%) |
| Total | 207 (94.1%) | 245 (90.1%) |
Income Below Poverty Among Married-Couple Families in San Leanna
The poverty statistics for married-couple families in San Leanna show that 5.9% or 7 of the total 119 families live below the poverty line. Families with no children have the highest poverty rate of 7.4%, comprising of 7 families. On the other hand, families with 1 or 2 children have the lowest poverty rate of 0.0%, which includes 0 families.
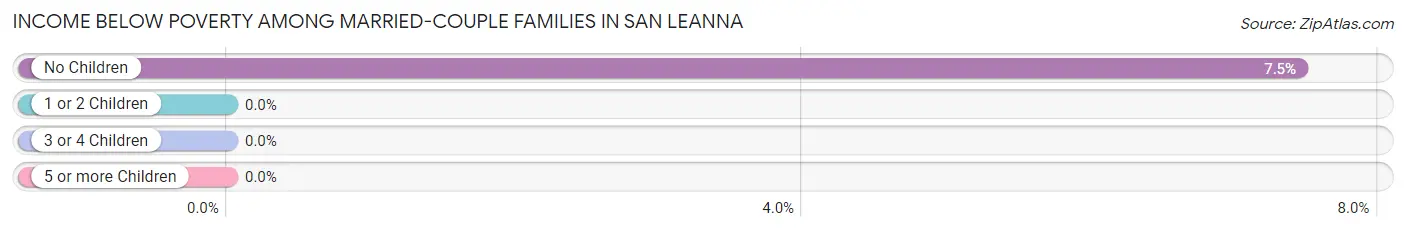
| Children | Above Poverty | Below Poverty |
| No Children | 87 (92.5%) | 7 (7.4%) |
| 1 or 2 Children | 23 (100.0%) | 0 (0.0%) |
| 3 or 4 Children | 2 (100.0%) | 0 (0.0%) |
| 5 or more Children | 0 (0.0%) | 0 (0.0%) |
| Total | 112 (94.1%) | 7 (5.9%) |
Income Below Poverty Among Single-Parent Households in San Leanna
| Children | Single Father | Single Mother |
| No Children | 0 (0.0%) | 0 (0.0%) |
| 1 or 2 Children | 0 (0.0%) | 0 (0.0%) |
| 3 or 4 Children | 0 (0.0%) | 0 (0.0%) |
| 5 or more Children | 0 (0.0%) | 0 (0.0%) |
| Total | 0 (0.0%) | 0 (0.0%) |
Income Below Poverty Among Married-Couple vs Single-Parent Households in San Leanna
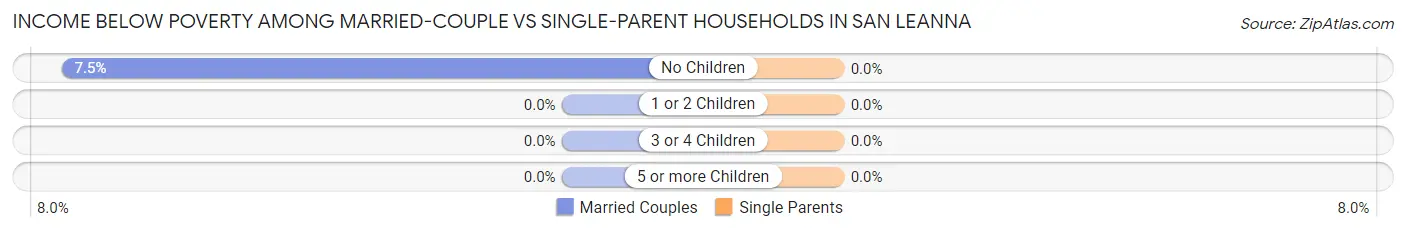
| Children | Married-Couple Families | Single-Parent Households |
| No Children | 7 (7.4%) | 0 (0.0%) |
| 1 or 2 Children | 0 (0.0%) | 0 (0.0%) |
| 3 or 4 Children | 0 (0.0%) | 0 (0.0%) |
| 5 or more Children | 0 (0.0%) | 0 (0.0%) |
| Total | 7 (5.9%) | 0 (0.0%) |
Race in San Leanna
The most populous races in San Leanna are White / Caucasian (424 | 86.2%), Hispanic or Latino (106 | 21.5%), and Some other Race (33 | 6.7%).
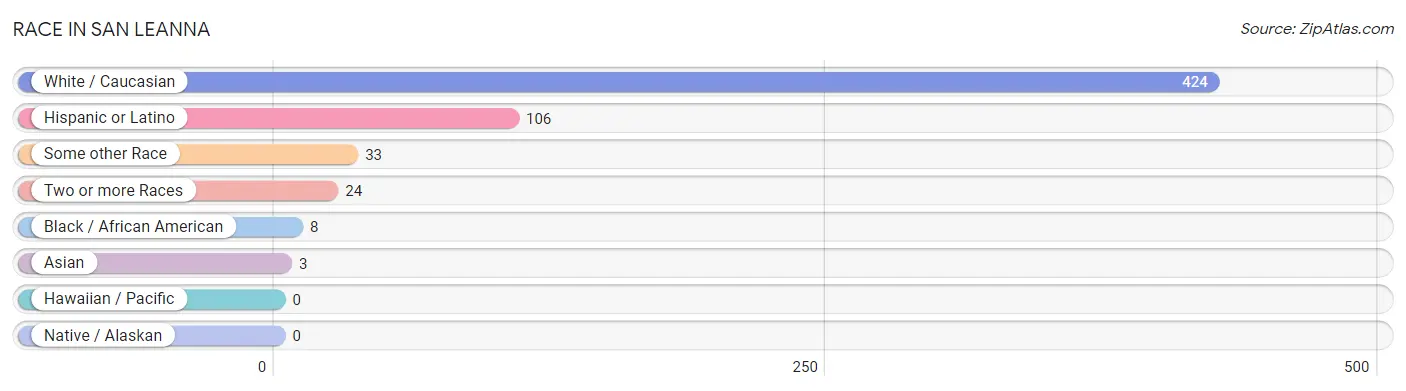
| Race | # Population | % Population |
| Asian | 3 | 0.6% |
| Black / African American | 8 | 1.6% |
| Hawaiian / Pacific | 0 | 0.0% |
| Hispanic or Latino | 106 | 21.5% |
| Native / Alaskan | 0 | 0.0% |
| White / Caucasian | 424 | 86.2% |
| Two or more Races | 24 | 4.9% |
| Some other Race | 33 | 6.7% |
| Total | 492 | 100.0% |
Ancestry in San Leanna
The most populous ancestries reported in San Leanna are Mexican (81 | 16.5%), Irish (71 | 14.4%), German (70 | 14.2%), English (66 | 13.4%), and American (61 | 12.4%), together accounting for 70.9% of all San Leanna residents.
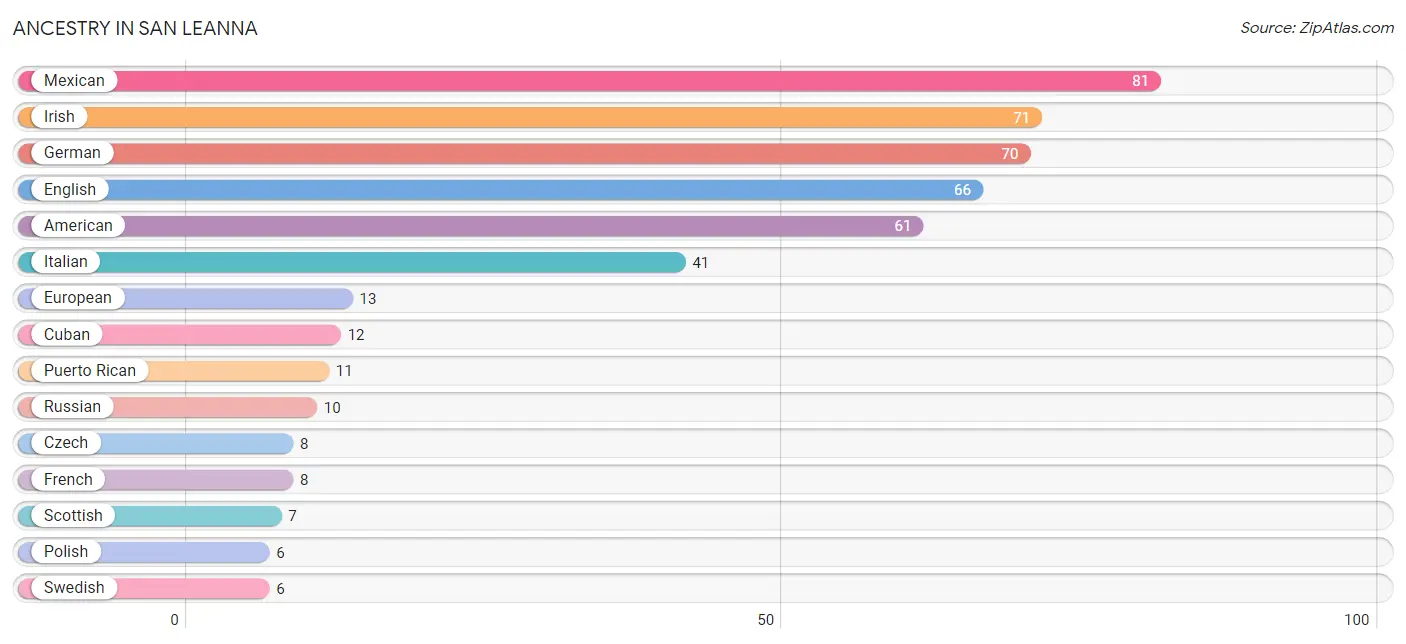
| Ancestry | # Population | % Population |
| American | 61 | 12.4% |
| Arab | 4 | 0.8% |
| British | 3 | 0.6% |
| Cherokee | 2 | 0.4% |
| Cuban | 12 | 2.4% |
| Czech | 8 | 1.6% |
| Dutch | 3 | 0.6% |
| English | 66 | 13.4% |
| European | 13 | 2.6% |
| French | 8 | 1.6% |
| German | 70 | 14.2% |
| Irish | 71 | 14.4% |
| Italian | 41 | 8.3% |
| Mexican | 81 | 16.5% |
| Norwegian | 5 | 1.0% |
| Pakistani | 3 | 0.6% |
| Palestinian | 4 | 0.8% |
| Polish | 6 | 1.2% |
| Puerto Rican | 11 | 2.2% |
| Russian | 10 | 2.0% |
| Scotch-Irish | 4 | 0.8% |
| Scottish | 7 | 1.4% |
| Swedish | 6 | 1.2% |
| Welsh | 1 | 0.2% | View All 24 Rows |
Immigrants in San Leanna
The most numerous immigrant groups reported in San Leanna came from Caribbean (11 | 2.2%), Cuba (11 | 2.2%), Europe (11 | 2.2%), Latin America (11 | 2.2%), and Asia (7 | 1.4%), together accounting for 10.4% of all San Leanna residents.
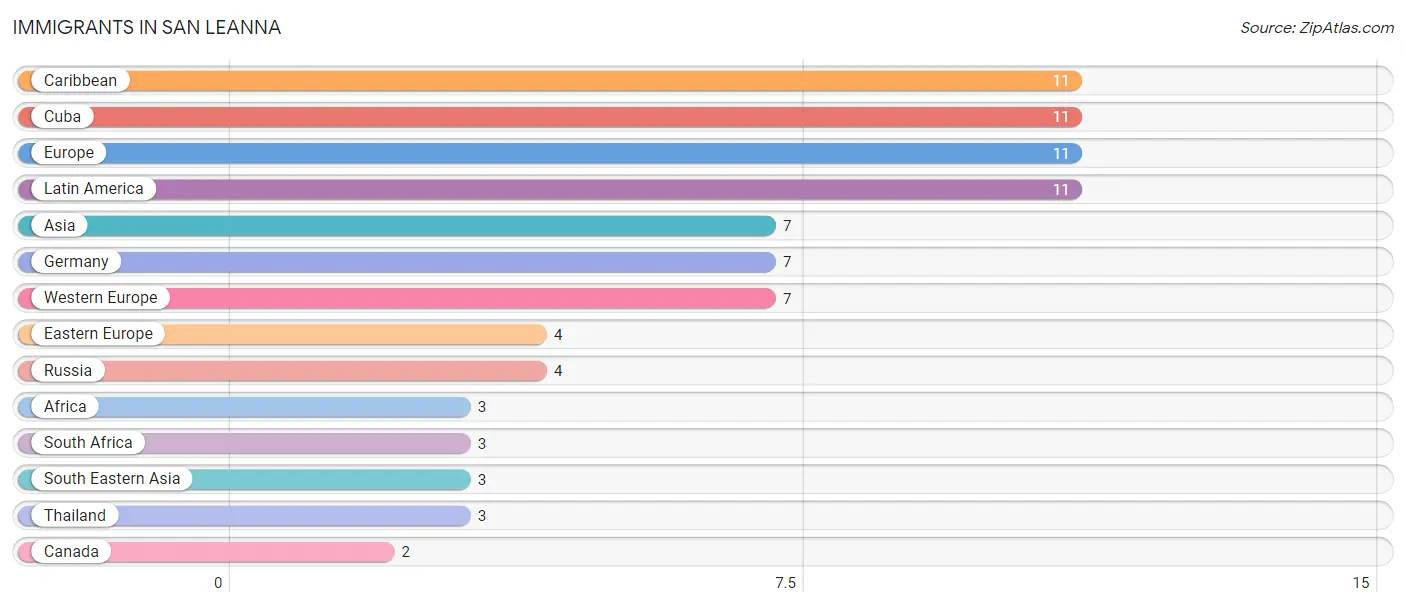
| Immigration Origin | # Population | % Population |
| Africa | 3 | 0.6% |
| Asia | 7 | 1.4% |
| Canada | 2 | 0.4% |
| Caribbean | 11 | 2.2% |
| Cuba | 11 | 2.2% |
| Eastern Europe | 4 | 0.8% |
| Europe | 11 | 2.2% |
| Germany | 7 | 1.4% |
| Latin America | 11 | 2.2% |
| Russia | 4 | 0.8% |
| South Africa | 3 | 0.6% |
| South Eastern Asia | 3 | 0.6% |
| Thailand | 3 | 0.6% |
| Western Europe | 7 | 1.4% | View All 14 Rows |
Sex and Age in San Leanna
Sex and Age in San Leanna
The most populous age groups in San Leanna are 30 to 34 Years (29 | 13.2%) for men and 30 to 34 Years (36 | 13.2%) for women.
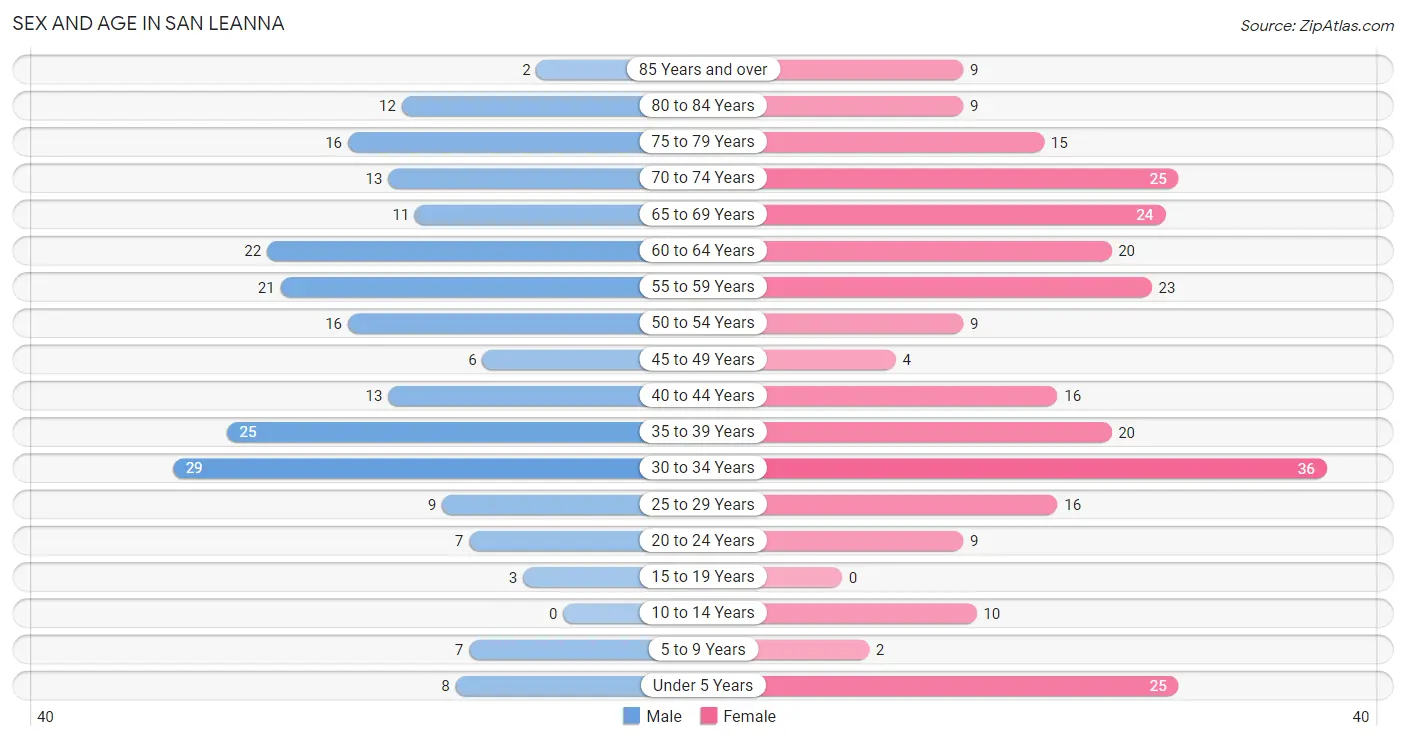
| Age Bracket | Male | Female |
| Under 5 Years | 8 (3.6%) | 25 (9.2%) |
| 5 to 9 Years | 7 (3.2%) | 2 (0.7%) |
| 10 to 14 Years | 0 (0.0%) | 10 (3.7%) |
| 15 to 19 Years | 3 (1.4%) | 0 (0.0%) |
| 20 to 24 Years | 7 (3.2%) | 9 (3.3%) |
| 25 to 29 Years | 9 (4.1%) | 16 (5.9%) |
| 30 to 34 Years | 29 (13.2%) | 36 (13.2%) |
| 35 to 39 Years | 25 (11.4%) | 20 (7.3%) |
| 40 to 44 Years | 13 (5.9%) | 16 (5.9%) |
| 45 to 49 Years | 6 (2.7%) | 4 (1.5%) |
| 50 to 54 Years | 16 (7.3%) | 9 (3.3%) |
| 55 to 59 Years | 21 (9.6%) | 23 (8.5%) |
| 60 to 64 Years | 22 (10.0%) | 20 (7.3%) |
| 65 to 69 Years | 11 (5.0%) | 24 (8.8%) |
| 70 to 74 Years | 13 (5.9%) | 25 (9.2%) |
| 75 to 79 Years | 16 (7.3%) | 15 (5.5%) |
| 80 to 84 Years | 12 (5.4%) | 9 (3.3%) |
| 85 Years and over | 2 (0.9%) | 9 (3.3%) |
| Total | 220 (100.0%) | 272 (100.0%) |
Families and Households in San Leanna
Median Family Size in San Leanna
The median family size in San Leanna is 2.58 persons per family, with single female/mother families (20 | 14.0%) accounting for the largest median family size of 3.5 persons per family. On the other hand, single male/father families (4 | 2.8%) represent the smallest median family size with 2.00 persons per family.
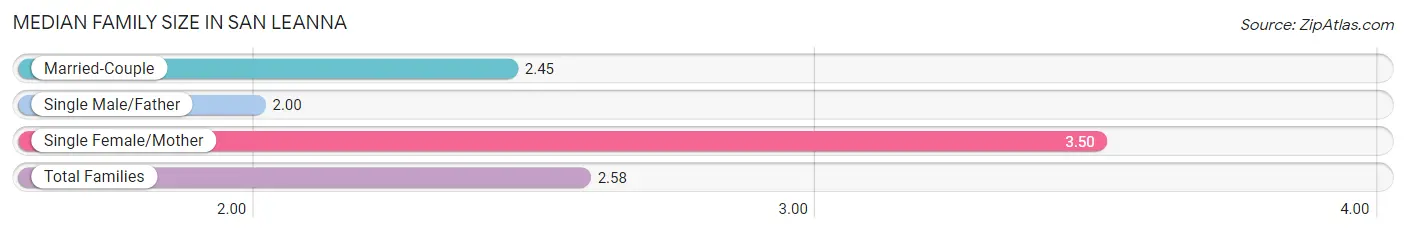
| Family Type | # Families | Family Size |
| Married-Couple | 119 (83.2%) | 2.45 |
| Single Male/Father | 4 (2.8%) | 2.00 |
| Single Female/Mother | 20 (14.0%) | 3.50 |
| Total Families | 143 (100.0%) | 2.58 |
Median Household Size in San Leanna
The median household size in San Leanna is 2.00 persons per household, with single female/mother households (20 | 8.2%) accounting for the largest median household size of 3.5 persons per household. non-family households (101 | 41.4%) represent the smallest median household size with 1.19 persons per household.
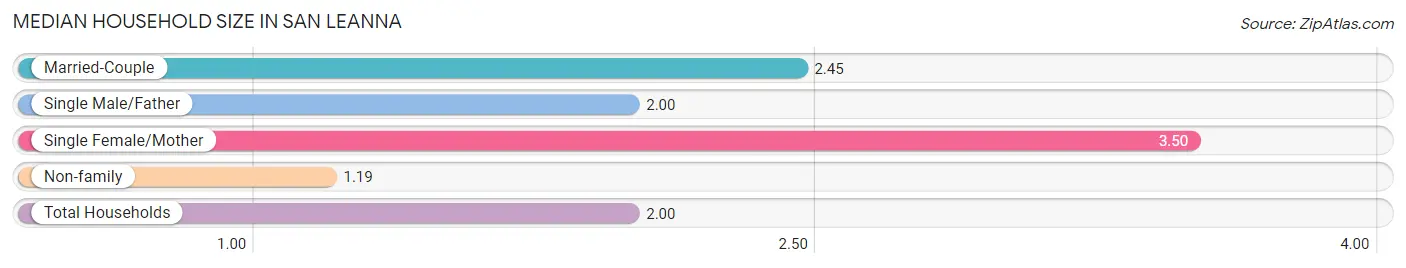
| Household Type | # Households | Household Size |
| Married-Couple | 119 (48.8%) | 2.45 |
| Single Male/Father | 4 (1.6%) | 2.00 |
| Single Female/Mother | 20 (8.2%) | 3.50 |
| Non-family | 101 (41.4%) | 1.19 |
| Total Households | 244 (100.0%) | 2.00 |
Household Size by Marriage Status in San Leanna
Out of a total of 244 households in San Leanna, 143 (58.6%) are family households, while 101 (41.4%) are nonfamily households. The most numerous type of family households are 2-person households, comprising 90, and the most common type of nonfamily households are 1-person households, comprising 85.
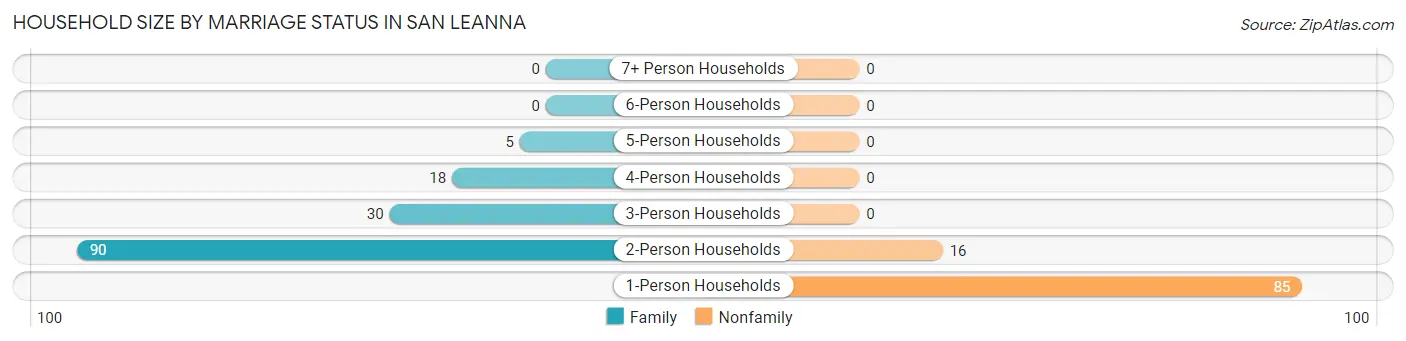
| Household Size | Family Households | Nonfamily Households |
| 1-Person Households | - | 85 (34.8%) |
| 2-Person Households | 90 (36.9%) | 16 (6.6%) |
| 3-Person Households | 30 (12.3%) | 0 (0.0%) |
| 4-Person Households | 18 (7.4%) | 0 (0.0%) |
| 5-Person Households | 5 (2.1%) | 0 (0.0%) |
| 6-Person Households | 0 (0.0%) | 0 (0.0%) |
| 7+ Person Households | 0 (0.0%) | 0 (0.0%) |
| Total | 143 (58.6%) | 101 (41.4%) |
Female Fertility in San Leanna
Fertility by Age in San Leanna
Average fertility rate in San Leanna is 59.0 births per 1,000 women. Women in the age bracket of 20 to 34 years have the highest fertility rate with 98.0 births per 1,000 women. Women in the age bracket of 20 to 34 years acount for 100.0% of all women with births.
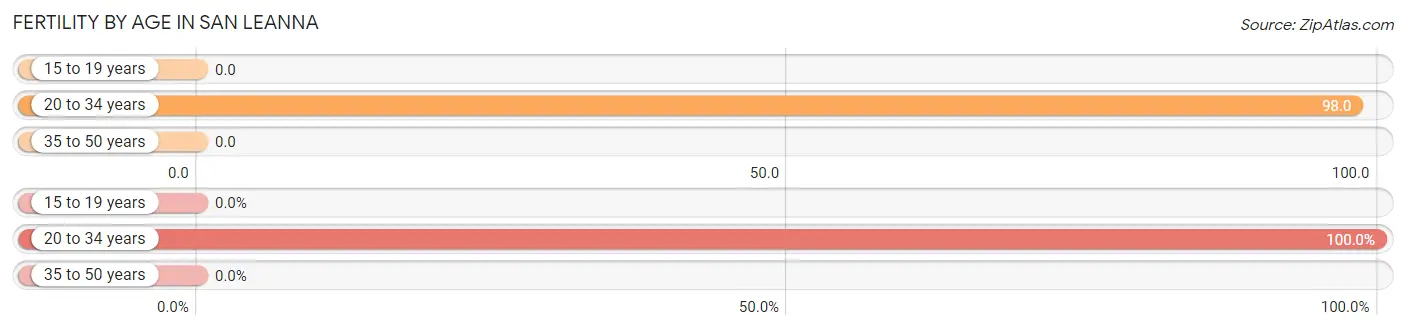
| Age Bracket | Women with Births | Births / 1,000 Women |
| 15 to 19 years | 0 (0.0%) | 0.0 |
| 20 to 34 years | 6 (100.0%) | 98.0 |
| 35 to 50 years | 0 (0.0%) | 0.0 |
| Total | 6 (100.0%) | 59.0 |
Fertility by Age by Marriage Status in San Leanna
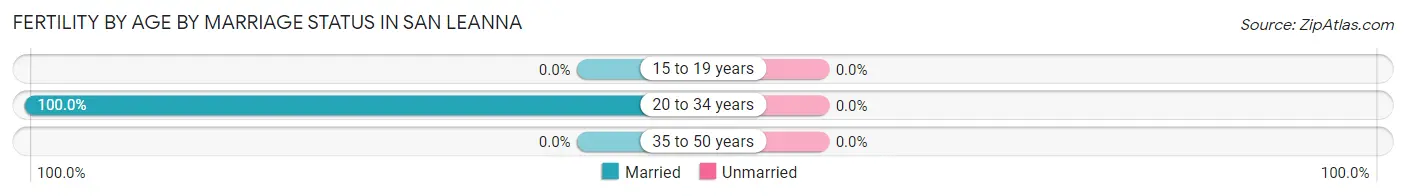
| Age Bracket | Married | Unmarried |
| 15 to 19 years | 0 (0.0%) | 0 (0.0%) |
| 20 to 34 years | 6 (100.0%) | 0 (0.0%) |
| 35 to 50 years | 0 (0.0%) | 0 (0.0%) |
| Total | 6 (100.0%) | 0 (0.0%) |
Fertility by Education in San Leanna
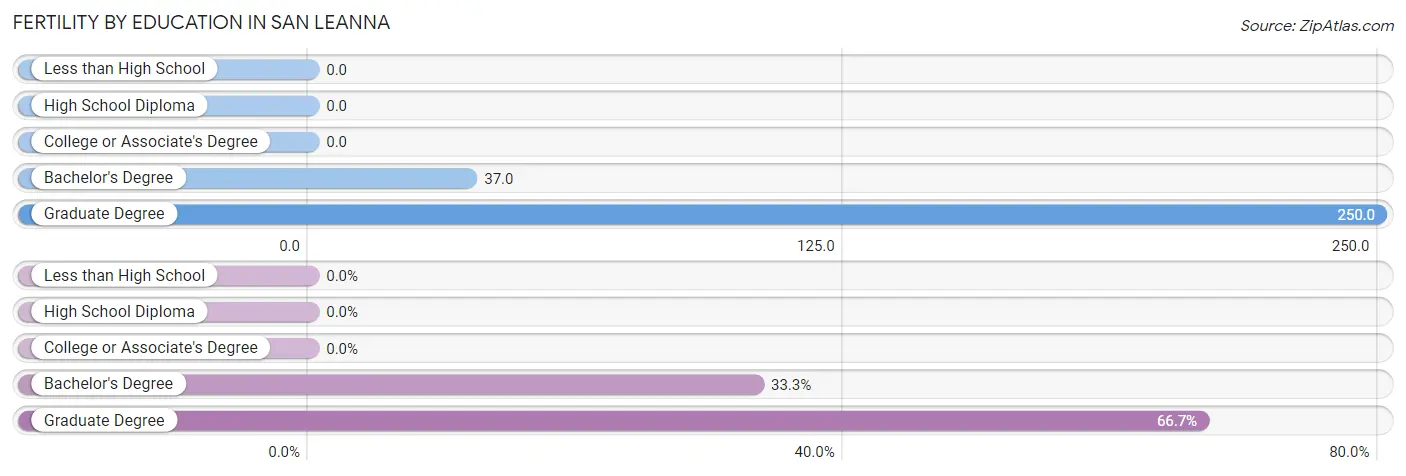
| Educational Attainment | Women with Births | Births / 1,000 Women |
| Less than High School | 0 (0.0%) | 0.0 |
| High School Diploma | 0 (0.0%) | 0.0 |
| College or Associate's Degree | 0 (0.0%) | 0.0 |
| Bachelor's Degree | 2 (33.3%) | 37.0 |
| Graduate Degree | 4 (66.7%) | 250.0 |
| Total | 6 (100.0%) | 59.0 |
Fertility by Education by Marriage Status in San Leanna
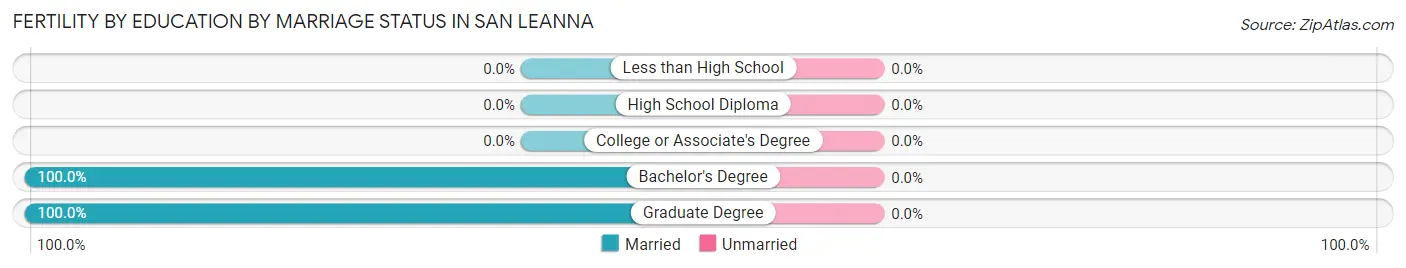
| Educational Attainment | Married | Unmarried |
| Less than High School | 0 (0.0%) | 0 (0.0%) |
| High School Diploma | 0 (0.0%) | 0 (0.0%) |
| College or Associate's Degree | 0 (0.0%) | 0 (0.0%) |
| Bachelor's Degree | 2 (100.0%) | 0 (0.0%) |
| Graduate Degree | 4 (100.0%) | 0 (0.0%) |
| Total | 6 (100.0%) | 0 (0.0%) |
Employment Characteristics in San Leanna
Employment by Class of Employer in San Leanna
Among the 219 employed individuals in San Leanna, private company employees (132 | 60.3%), local government employees (30 | 13.7%), and self-employed (not incorporated) (15 | 6.9%) make up the most common classes of employment.
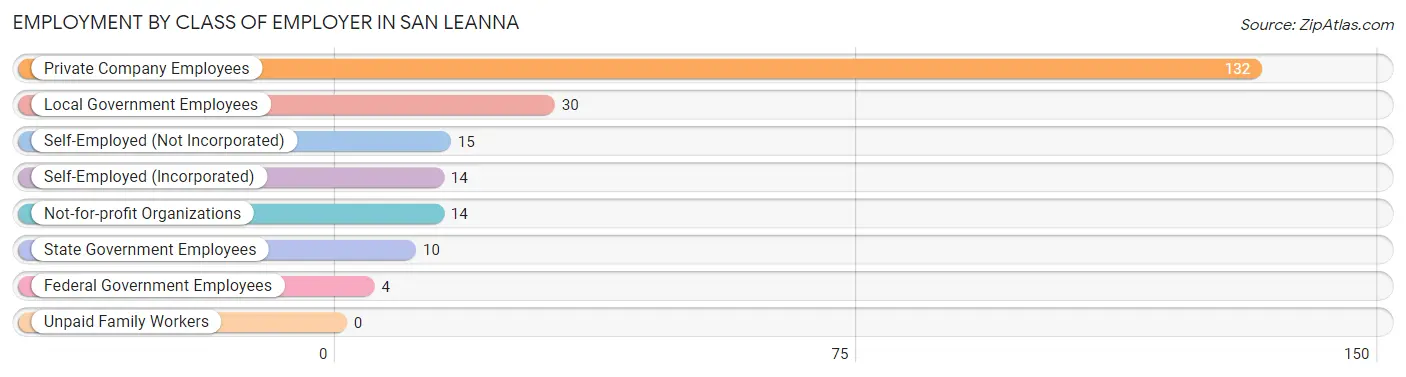
| Employer Class | # Employees | % Employees |
| Private Company Employees | 132 | 60.3% |
| Self-Employed (Incorporated) | 14 | 6.4% |
| Self-Employed (Not Incorporated) | 15 | 6.9% |
| Not-for-profit Organizations | 14 | 6.4% |
| Local Government Employees | 30 | 13.7% |
| State Government Employees | 10 | 4.6% |
| Federal Government Employees | 4 | 1.8% |
| Unpaid Family Workers | 0 | 0.0% |
| Total | 219 | 100.0% |
Employment Status by Age in San Leanna
According to the labor force statistics for San Leanna, out of the total population over 16 years of age (440), 55.5% or 244 individuals are in the labor force, with 9.4% or 23 of them unemployed. The age group with the highest labor force participation rate is 55 to 59 years, with 90.9% or 40 individuals in the labor force. Within the labor force, the 30 to 34 years age range has the highest percentage of unemployed individuals, with 30.2% or 16 of them being unemployed.
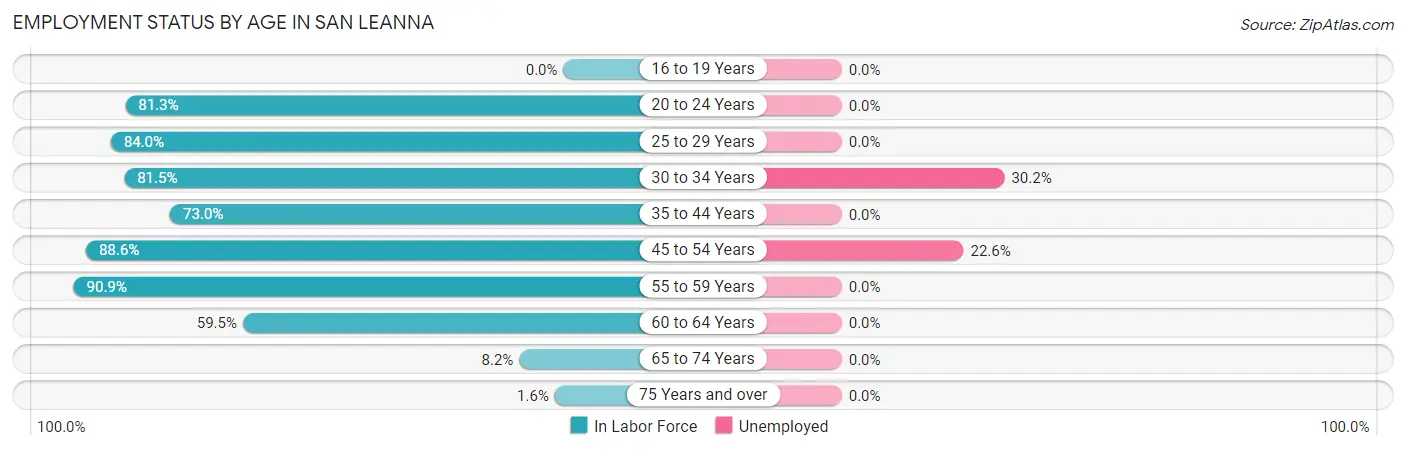
| Age Bracket | In Labor Force | Unemployed |
| 16 to 19 Years | 0 (0.0%) | 0 (0.0%) |
| 20 to 24 Years | 13 (81.3%) | 0 (0.0%) |
| 25 to 29 Years | 21 (84.0%) | 0 (0.0%) |
| 30 to 34 Years | 53 (81.5%) | 16 (30.2%) |
| 35 to 44 Years | 54 (73.0%) | 0 (0.0%) |
| 45 to 54 Years | 31 (88.6%) | 7 (22.6%) |
| 55 to 59 Years | 40 (90.9%) | 0 (0.0%) |
| 60 to 64 Years | 25 (59.5%) | 0 (0.0%) |
| 65 to 74 Years | 6 (8.2%) | 0 (0.0%) |
| 75 Years and over | 1 (1.6%) | 0 (0.0%) |
| Total | 244 (55.5%) | 23 (9.4%) |
Employment Status by Educational Attainment in San Leanna
According to labor force statistics for San Leanna, 78.6% of individuals (224) out of the total population between 25 and 64 years of age (285) are in the labor force, with 10.3% or 23 of them being unemployed. The group with the highest labor force participation rate are those with the educational attainment of college / associate degree, with 85.5% or 47 individuals in the labor force. Within the labor force, individuals with bachelor's degree or higher education have the highest percentage of unemployment, with 15.7% or 21 of them being unemployed.
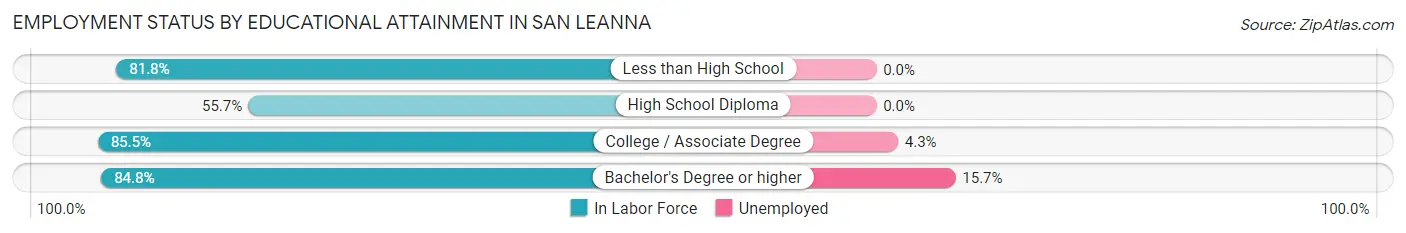
| Educational Attainment | In Labor Force | Unemployed |
| Less than High School | 9 (81.8%) | 0 (0.0%) |
| High School Diploma | 34 (55.7%) | 0 (0.0%) |
| College / Associate Degree | 47 (85.5%) | 2 (4.3%) |
| Bachelor's Degree or higher | 134 (84.8%) | 25 (15.7%) |
| Total | 224 (78.6%) | 29 (10.3%) |
Employment Occupations by Sex in San Leanna
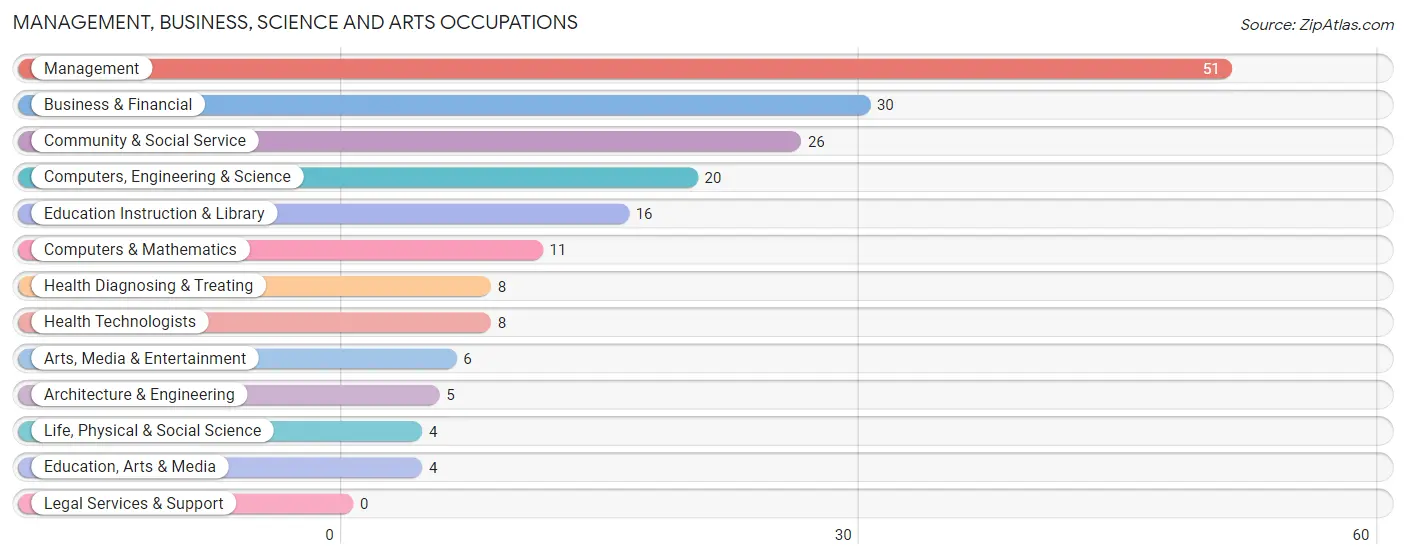
Management, Business, Science and Arts Occupations
The most common Management, Business, Science and Arts occupations in San Leanna are Management (51 | 23.1%), Business & Financial (30 | 13.6%), Community & Social Service (26 | 11.8%), Computers, Engineering & Science (20 | 9.0%), and Education Instruction & Library (16 | 7.2%).
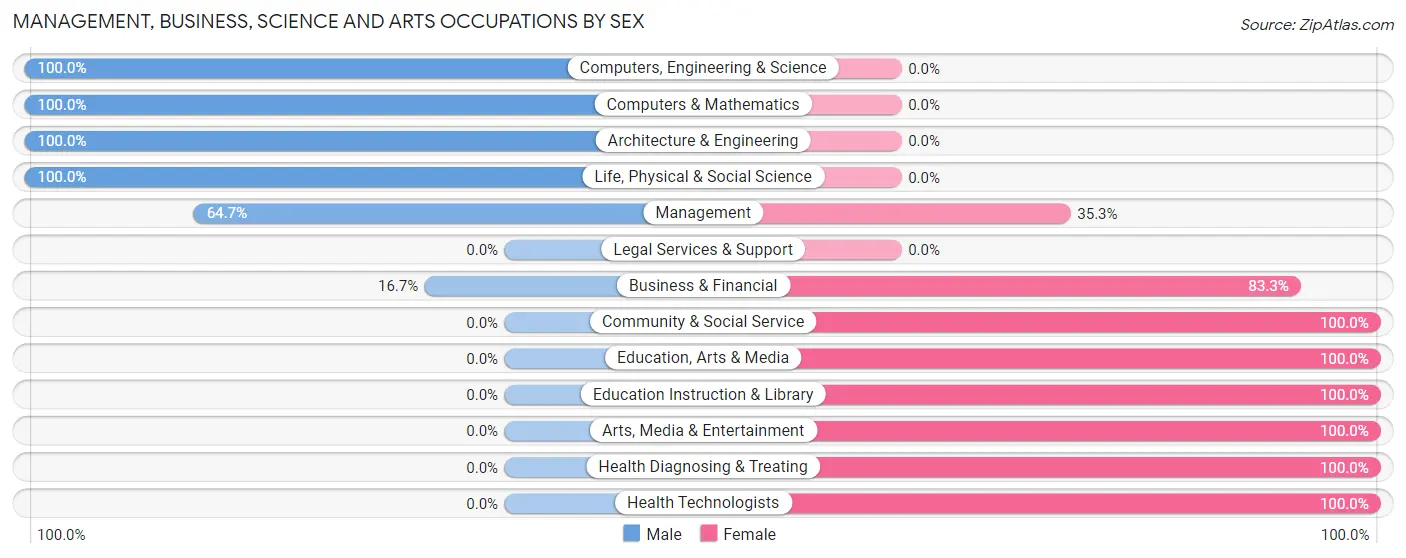
Management, Business, Science and Arts Occupations by Sex
Within the Management, Business, Science and Arts occupations in San Leanna, the most male-oriented occupations are Computers, Engineering & Science (100.0%), Computers & Mathematics (100.0%), and Architecture & Engineering (100.0%), while the most female-oriented occupations are Community & Social Service (100.0%), Education, Arts & Media (100.0%), and Education Instruction & Library (100.0%).
| Occupation | Male | Female |
| Management | 33 (64.7%) | 18 (35.3%) |
| Business & Financial | 5 (16.7%) | 25 (83.3%) |
| Computers, Engineering & Science | 20 (100.0%) | 0 (0.0%) |
| Computers & Mathematics | 11 (100.0%) | 0 (0.0%) |
| Architecture & Engineering | 5 (100.0%) | 0 (0.0%) |
| Life, Physical & Social Science | 4 (100.0%) | 0 (0.0%) |
| Community & Social Service | 0 (0.0%) | 26 (100.0%) |
| Education, Arts & Media | 0 (0.0%) | 4 (100.0%) |
| Legal Services & Support | 0 (0.0%) | 0 (0.0%) |
| Education Instruction & Library | 0 (0.0%) | 16 (100.0%) |
| Arts, Media & Entertainment | 0 (0.0%) | 6 (100.0%) |
| Health Diagnosing & Treating | 0 (0.0%) | 8 (100.0%) |
| Health Technologists | 0 (0.0%) | 8 (100.0%) |
| Total (Category) | 58 (43.0%) | 77 (57.0%) |
| Total (Overall) | 123 (55.7%) | 98 (44.3%) |
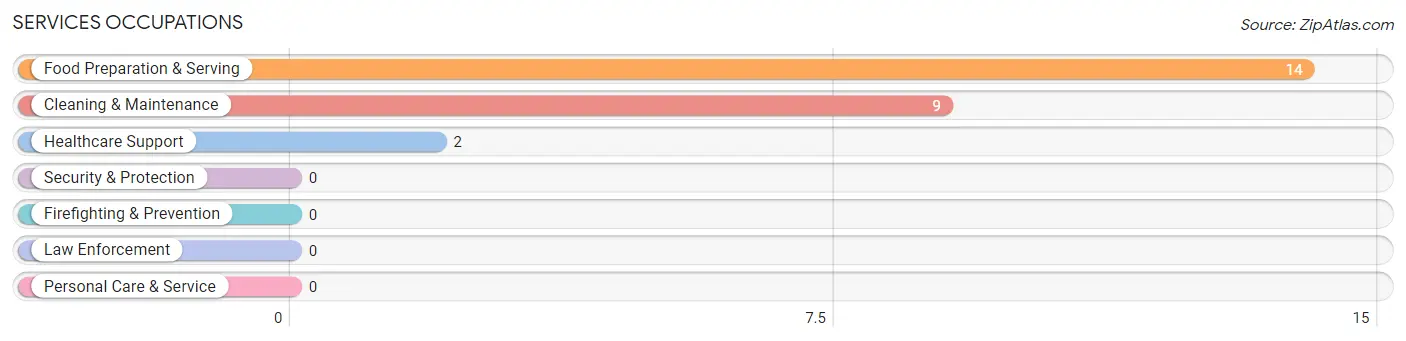
Services Occupations
The most common Services occupations in San Leanna are Food Preparation & Serving (14 | 6.3%), Cleaning & Maintenance (9 | 4.1%), and Healthcare Support (2 | 0.9%).
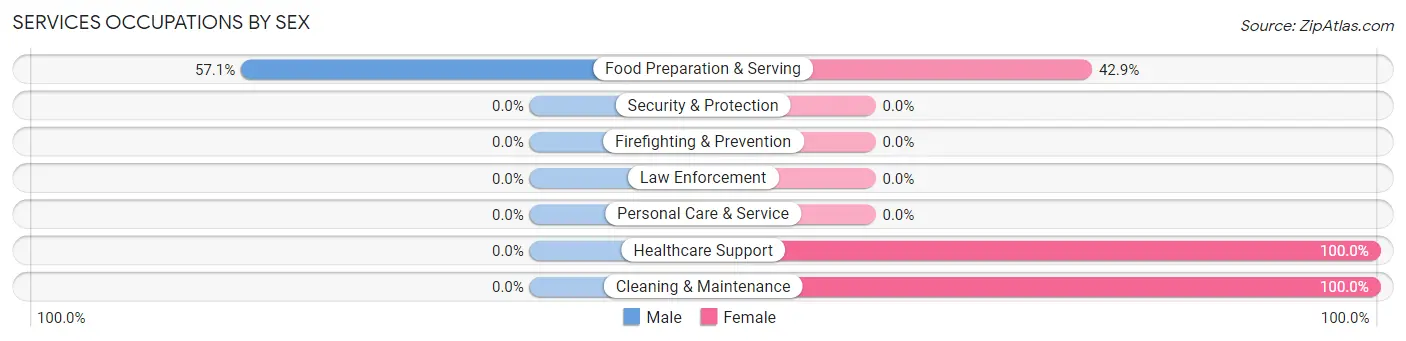
Services Occupations by Sex
| Occupation | Male | Female |
| Healthcare Support | 0 (0.0%) | 2 (100.0%) |
| Security & Protection | 0 (0.0%) | 0 (0.0%) |
| Firefighting & Prevention | 0 (0.0%) | 0 (0.0%) |
| Law Enforcement | 0 (0.0%) | 0 (0.0%) |
| Food Preparation & Serving | 8 (57.1%) | 6 (42.9%) |
| Cleaning & Maintenance | 0 (0.0%) | 9 (100.0%) |
| Personal Care & Service | 0 (0.0%) | 0 (0.0%) |
| Total (Category) | 8 (32.0%) | 17 (68.0%) |
| Total (Overall) | 123 (55.7%) | 98 (44.3%) |
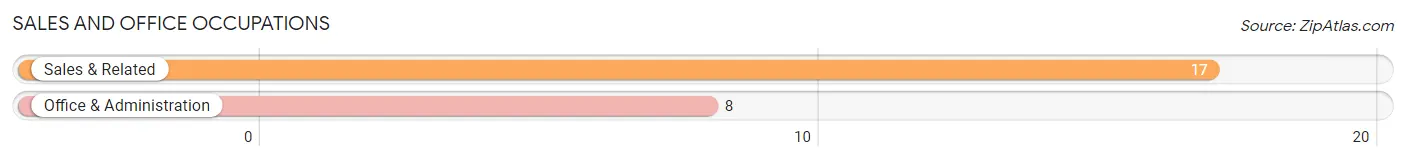
Sales and Office Occupations
The most common Sales and Office occupations in San Leanna are Sales & Related (17 | 7.7%), and Office & Administration (8 | 3.6%).
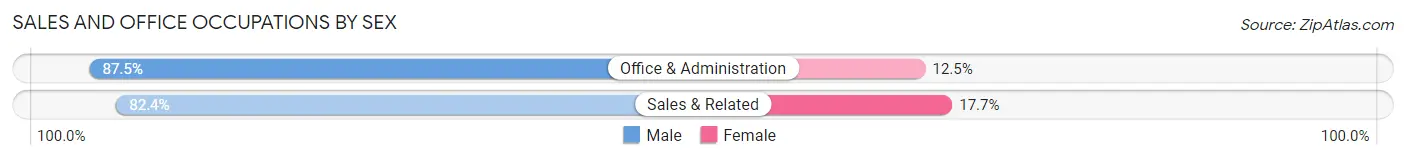
Sales and Office Occupations by Sex
| Occupation | Male | Female |
| Sales & Related | 14 (82.4%) | 3 (17.6%) |
| Office & Administration | 7 (87.5%) | 1 (12.5%) |
| Total (Category) | 21 (84.0%) | 4 (16.0%) |
| Total (Overall) | 123 (55.7%) | 98 (44.3%) |
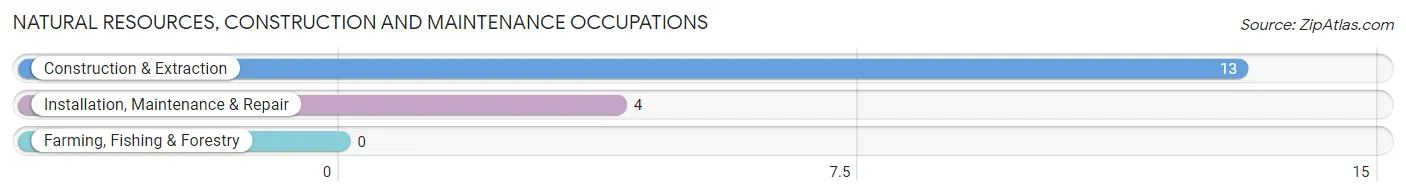
Natural Resources, Construction and Maintenance Occupations
The most common Natural Resources, Construction and Maintenance occupations in San Leanna are Construction & Extraction (13 | 5.9%), and Installation, Maintenance & Repair (4 | 1.8%).
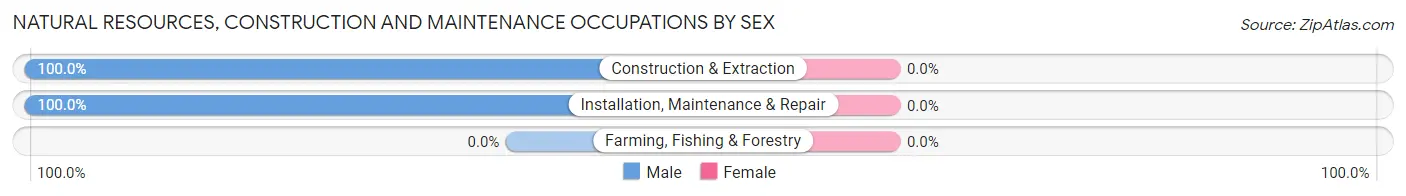
Natural Resources, Construction and Maintenance Occupations by Sex
| Occupation | Male | Female |
| Farming, Fishing & Forestry | 0 (0.0%) | 0 (0.0%) |
| Construction & Extraction | 13 (100.0%) | 0 (0.0%) |
| Installation, Maintenance & Repair | 4 (100.0%) | 0 (0.0%) |
| Total (Category) | 17 (100.0%) | 0 (0.0%) |
| Total (Overall) | 123 (55.7%) | 98 (44.3%) |
Production, Transportation and Moving Occupations
The most common Production, Transportation and Moving occupations in San Leanna are Material Moving (10 | 4.5%), Production (5 | 2.3%), and Transportation (4 | 1.8%).
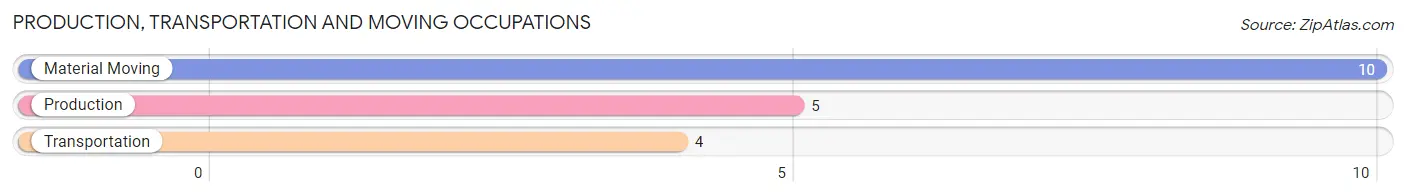
Production, Transportation and Moving Occupations by Sex
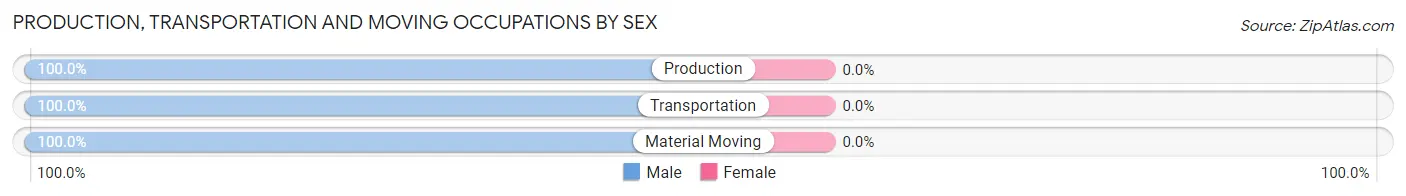
| Occupation | Male | Female |
| Production | 5 (100.0%) | 0 (0.0%) |
| Transportation | 4 (100.0%) | 0 (0.0%) |
| Material Moving | 10 (100.0%) | 0 (0.0%) |
| Total (Category) | 19 (100.0%) | 0 (0.0%) |
| Total (Overall) | 123 (55.7%) | 98 (44.3%) |
Employment Industries by Sex in San Leanna
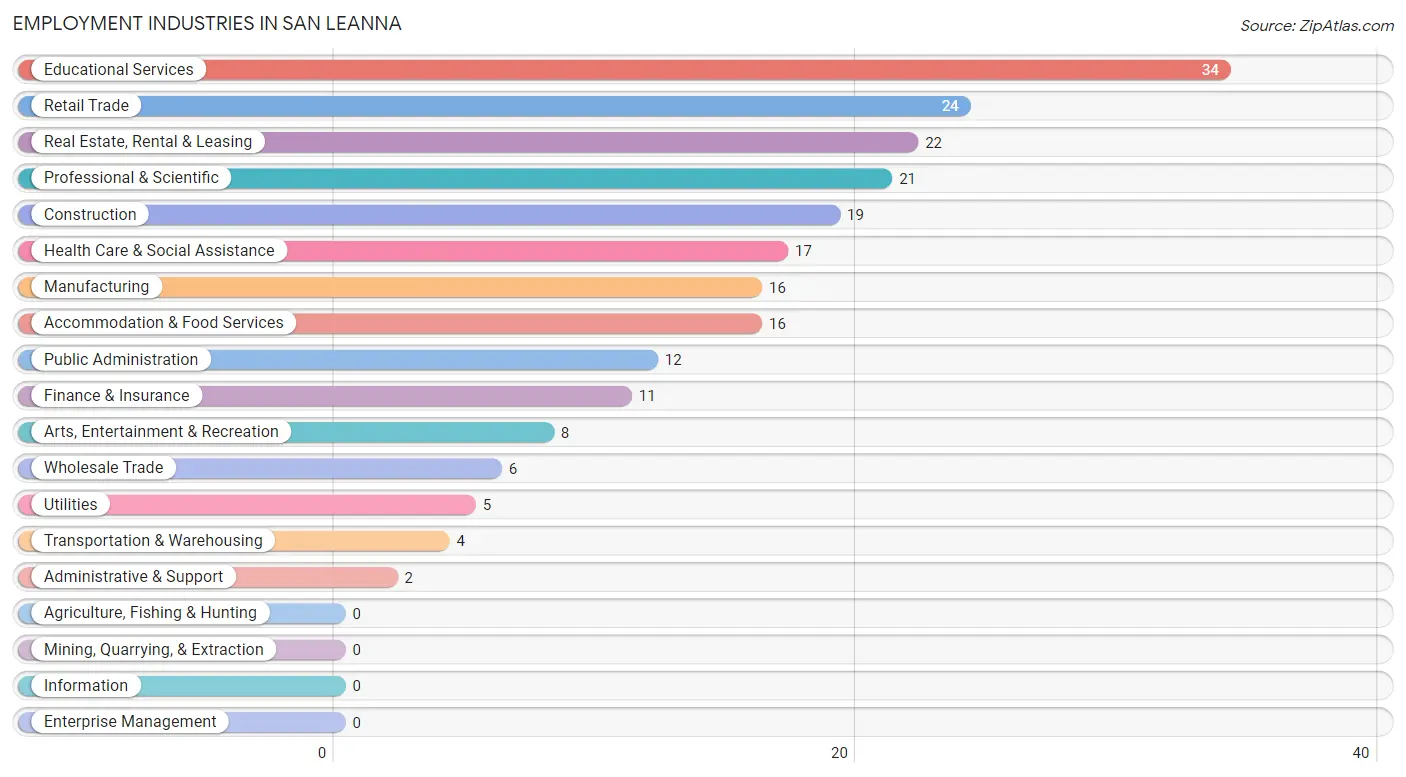
Employment Industries in San Leanna
The major employment industries in San Leanna include Educational Services (34 | 15.4%), Retail Trade (24 | 10.9%), Real Estate, Rental & Leasing (22 | 10.0%), Professional & Scientific (21 | 9.5%), and Construction (19 | 8.6%).
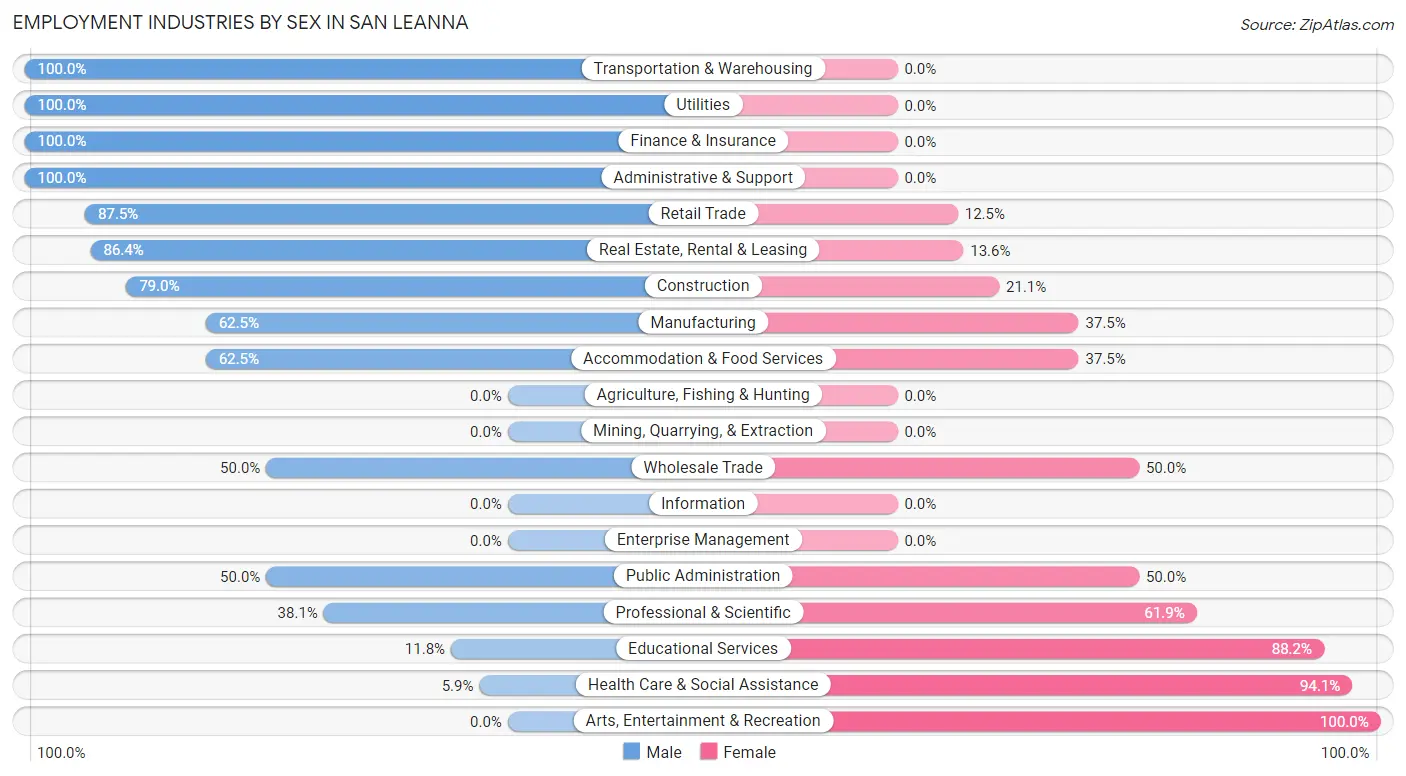
Employment Industries by Sex in San Leanna
The San Leanna industries that see more men than women are Transportation & Warehousing (100.0%), Utilities (100.0%), and Finance & Insurance (100.0%), whereas the industries that tend to have a higher number of women are Arts, Entertainment & Recreation (100.0%), Health Care & Social Assistance (94.1%), and Educational Services (88.2%).
| Industry | Male | Female |
| Agriculture, Fishing & Hunting | 0 (0.0%) | 0 (0.0%) |
| Mining, Quarrying, & Extraction | 0 (0.0%) | 0 (0.0%) |
| Construction | 15 (78.9%) | 4 (21.0%) |
| Manufacturing | 10 (62.5%) | 6 (37.5%) |
| Wholesale Trade | 3 (50.0%) | 3 (50.0%) |
| Retail Trade | 21 (87.5%) | 3 (12.5%) |
| Transportation & Warehousing | 4 (100.0%) | 0 (0.0%) |
| Utilities | 5 (100.0%) | 0 (0.0%) |
| Information | 0 (0.0%) | 0 (0.0%) |
| Finance & Insurance | 11 (100.0%) | 0 (0.0%) |
| Real Estate, Rental & Leasing | 19 (86.4%) | 3 (13.6%) |
| Professional & Scientific | 8 (38.1%) | 13 (61.9%) |
| Enterprise Management | 0 (0.0%) | 0 (0.0%) |
| Administrative & Support | 2 (100.0%) | 0 (0.0%) |
| Educational Services | 4 (11.8%) | 30 (88.2%) |
| Health Care & Social Assistance | 1 (5.9%) | 16 (94.1%) |
| Arts, Entertainment & Recreation | 0 (0.0%) | 8 (100.0%) |
| Accommodation & Food Services | 10 (62.5%) | 6 (37.5%) |
| Public Administration | 6 (50.0%) | 6 (50.0%) |
| Total | 123 (55.7%) | 98 (44.3%) |
Education in San Leanna
School Enrollment in San Leanna
The most common levels of schooling among the 46 students in San Leanna are nursery / preschool (12 | 26.1%), college / undergraduate (12 | 26.1%), and elementary school (7 | 15.2%).
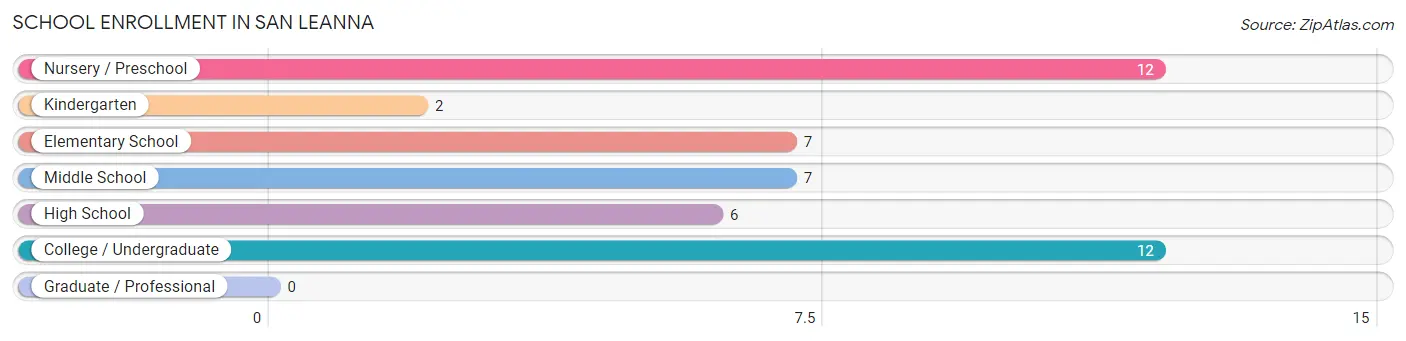
| School Level | # Students | % Students |
| Nursery / Preschool | 12 | 26.1% |
| Kindergarten | 2 | 4.3% |
| Elementary School | 7 | 15.2% |
| Middle School | 7 | 15.2% |
| High School | 6 | 13.0% |
| College / Undergraduate | 12 | 26.1% |
| Graduate / Professional | 0 | 0.0% |
| Total | 46 | 100.0% |
School Enrollment by Age by Funding Source in San Leanna
Out of a total of 46 students who are enrolled in schools in San Leanna, 10 (21.7%) attend a private institution, while the remaining 36 (78.3%) are enrolled in public schools. The age group of 3 to 4 year olds has the highest likelihood of being enrolled in private schools, with 10 (83.3% in the age bracket) enrolled. Conversely, the age group of 5 to 9 year old has the lowest likelihood of being enrolled in a private school, with 9 (100.0% in the age bracket) attending a public institution.
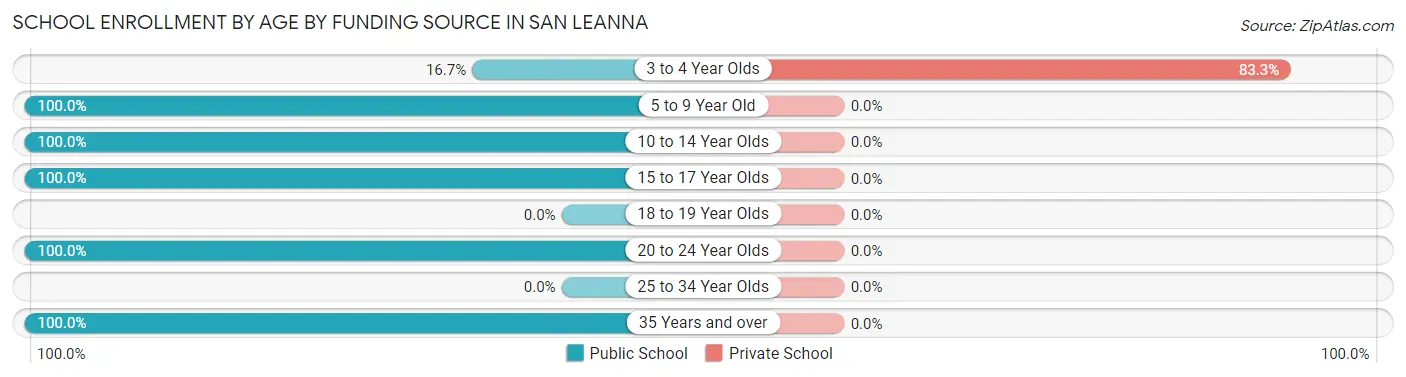
| Age Bracket | Public School | Private School |
| 3 to 4 Year Olds | 2 (16.7%) | 10 (83.3%) |
| 5 to 9 Year Old | 9 (100.0%) | 0 (0.0%) |
| 10 to 14 Year Olds | 10 (100.0%) | 0 (0.0%) |
| 15 to 17 Year Olds | 3 (100.0%) | 0 (0.0%) |
| 18 to 19 Year Olds | 0 (0.0%) | 0 (0.0%) |
| 20 to 24 Year Olds | 10 (100.0%) | 0 (0.0%) |
| 25 to 34 Year Olds | 0 (0.0%) | 0 (0.0%) |
| 35 Years and over | 2 (100.0%) | 0 (0.0%) |
| Total | 36 (78.3%) | 10 (21.7%) |
Educational Attainment by Field of Study in San Leanna
Business (33 | 14.9%), education (31 | 14.0%), literature & languages (21 | 9.5%), liberal arts & history (21 | 9.5%), and social sciences (19 | 8.6%) are the most common fields of study among 221 individuals in San Leanna who have obtained a bachelor's degree or higher.
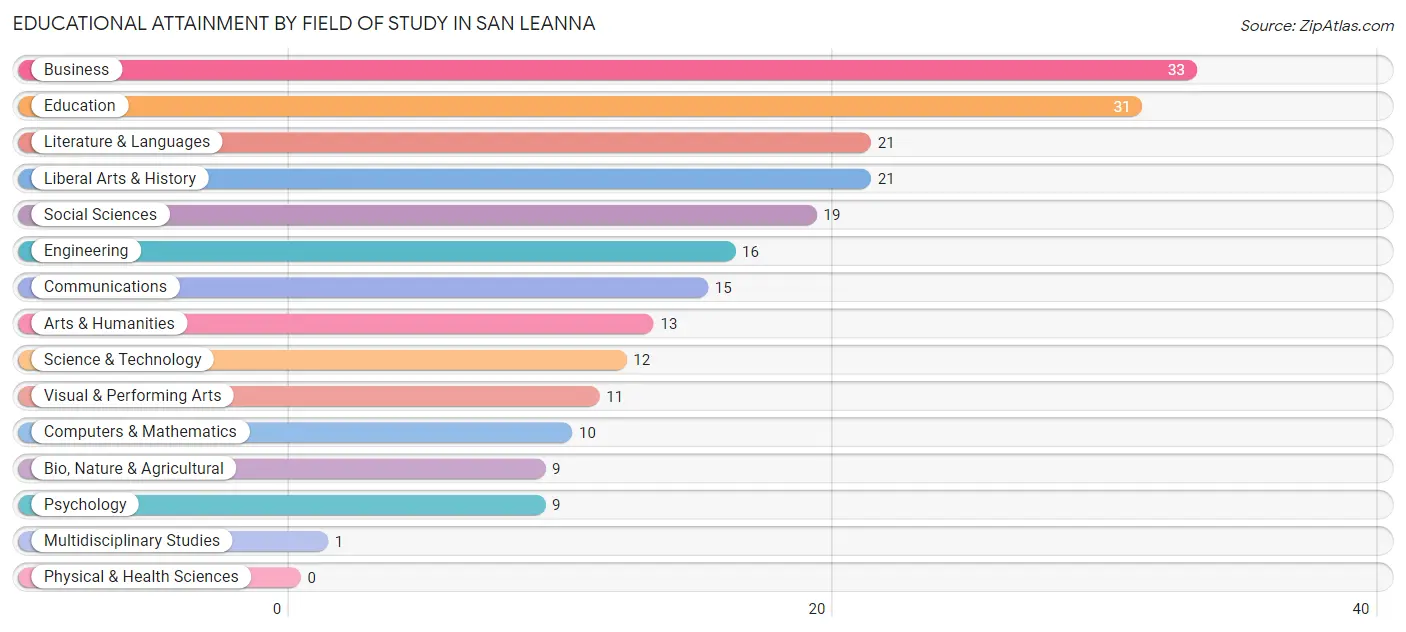
| Field of Study | # Graduates | % Graduates |
| Computers & Mathematics | 10 | 4.5% |
| Bio, Nature & Agricultural | 9 | 4.1% |
| Physical & Health Sciences | 0 | 0.0% |
| Psychology | 9 | 4.1% |
| Social Sciences | 19 | 8.6% |
| Engineering | 16 | 7.2% |
| Multidisciplinary Studies | 1 | 0.4% |
| Science & Technology | 12 | 5.4% |
| Business | 33 | 14.9% |
| Education | 31 | 14.0% |
| Literature & Languages | 21 | 9.5% |
| Liberal Arts & History | 21 | 9.5% |
| Visual & Performing Arts | 11 | 5.0% |
| Communications | 15 | 6.8% |
| Arts & Humanities | 13 | 5.9% |
| Total | 221 | 100.0% |
Transportation & Commute in San Leanna
Vehicle Availability by Sex in San Leanna
The most prevalent vehicle ownership categories in San Leanna are males with 2 vehicles (61, accounting for 50.4%) and females with 2 vehicles (50, making up 62.2%).
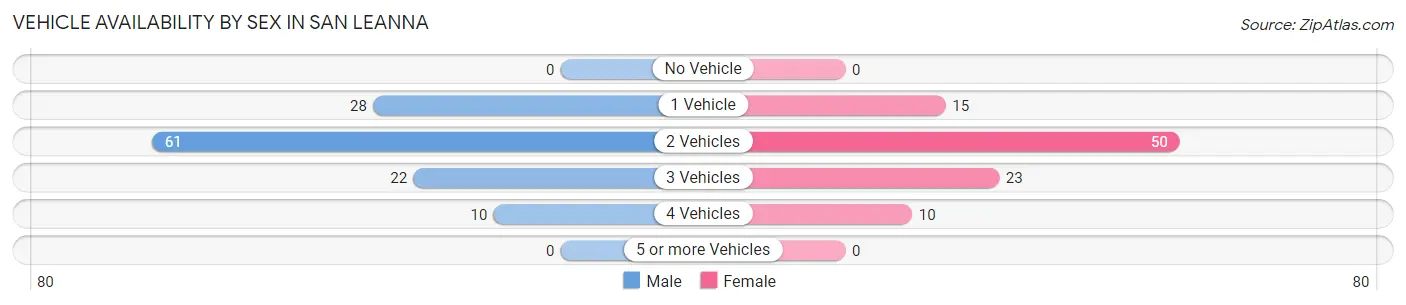
| Vehicles Available | Male | Female |
| No Vehicle | 0 (0.0%) | 0 (0.0%) |
| 1 Vehicle | 28 (23.1%) | 15 (15.3%) |
| 2 Vehicles | 61 (50.4%) | 50 (51.0%) |
| 3 Vehicles | 22 (18.2%) | 23 (23.5%) |
| 4 Vehicles | 10 (8.3%) | 10 (10.2%) |
| 5 or more Vehicles | 0 (0.0%) | 0 (0.0%) |
| Total | 121 (100.0%) | 98 (100.0%) |
Commute Time in San Leanna
The most frequently occuring commute durations in San Leanna are 30 to 34 minutes (40 commuters, 20.7%), 20 to 24 minutes (38 commuters, 19.7%), and 45 to 59 minutes (25 commuters, 13.0%).
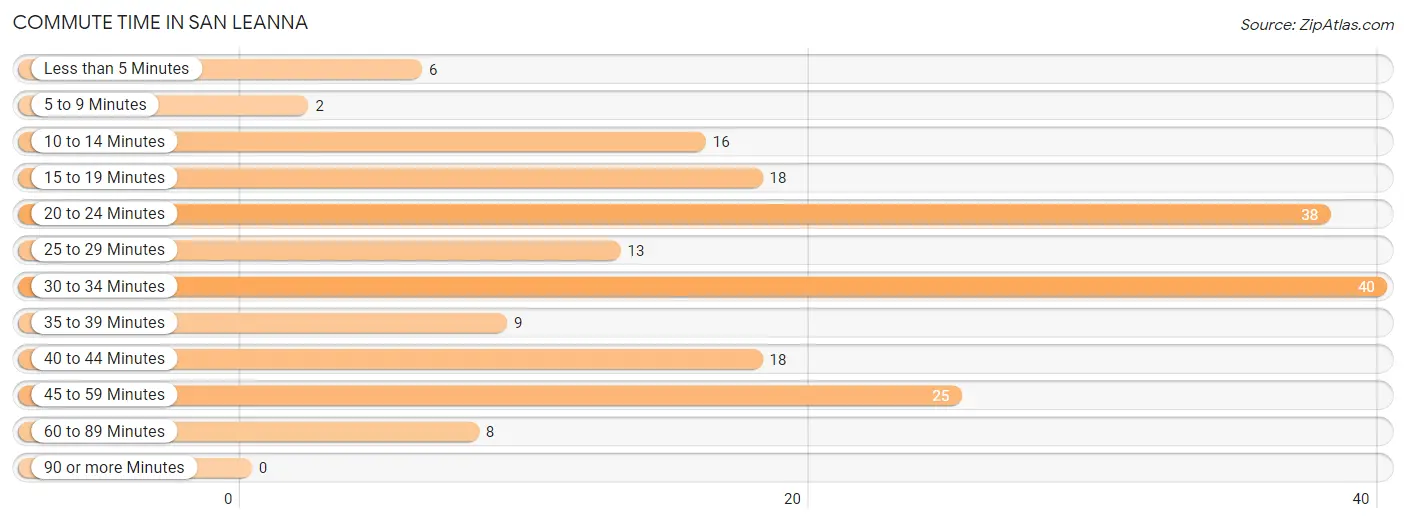
| Commute Time | # Commuters | % Commuters |
| Less than 5 Minutes | 6 | 3.1% |
| 5 to 9 Minutes | 2 | 1.0% |
| 10 to 14 Minutes | 16 | 8.3% |
| 15 to 19 Minutes | 18 | 9.3% |
| 20 to 24 Minutes | 38 | 19.7% |
| 25 to 29 Minutes | 13 | 6.7% |
| 30 to 34 Minutes | 40 | 20.7% |
| 35 to 39 Minutes | 9 | 4.7% |
| 40 to 44 Minutes | 18 | 9.3% |
| 45 to 59 Minutes | 25 | 13.0% |
| 60 to 89 Minutes | 8 | 4.2% |
| 90 or more Minutes | 0 | 0.0% |
Commute Time by Sex in San Leanna
The most common commute times in San Leanna are 20 to 24 minutes (22 commuters, 21.1%) for males and 30 to 34 minutes (34 commuters, 38.2%) for females.
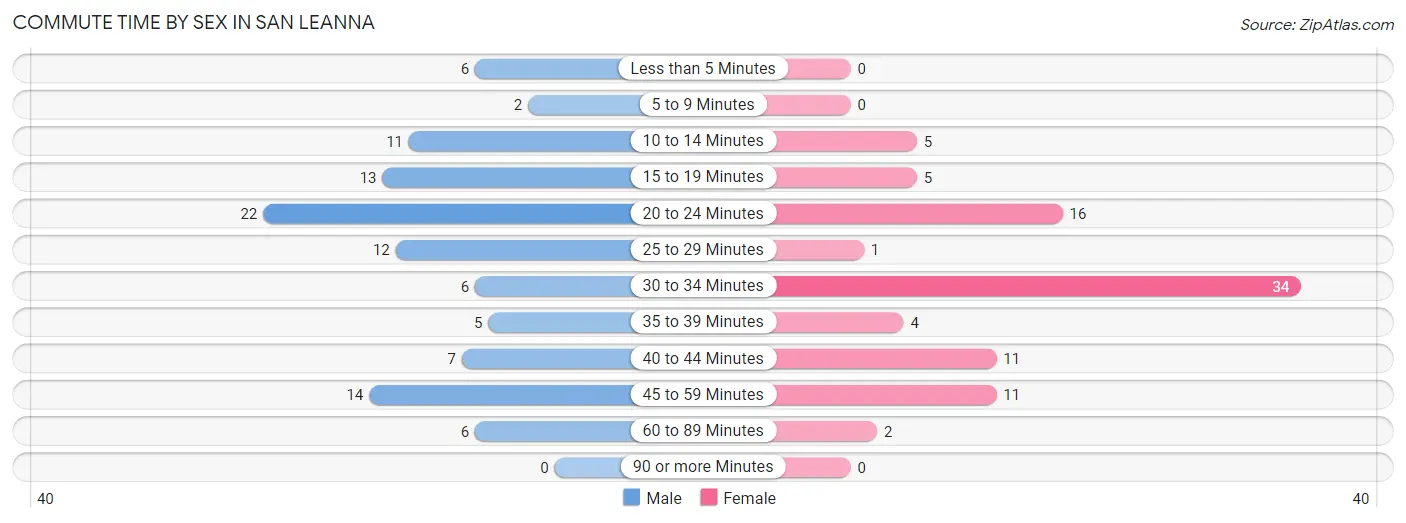
| Commute Time | Male | Female |
| Less than 5 Minutes | 6 (5.8%) | 0 (0.0%) |
| 5 to 9 Minutes | 2 (1.9%) | 0 (0.0%) |
| 10 to 14 Minutes | 11 (10.6%) | 5 (5.6%) |
| 15 to 19 Minutes | 13 (12.5%) | 5 (5.6%) |
| 20 to 24 Minutes | 22 (21.1%) | 16 (18.0%) |
| 25 to 29 Minutes | 12 (11.5%) | 1 (1.1%) |
| 30 to 34 Minutes | 6 (5.8%) | 34 (38.2%) |
| 35 to 39 Minutes | 5 (4.8%) | 4 (4.5%) |
| 40 to 44 Minutes | 7 (6.7%) | 11 (12.4%) |
| 45 to 59 Minutes | 14 (13.5%) | 11 (12.4%) |
| 60 to 89 Minutes | 6 (5.8%) | 2 (2.2%) |
| 90 or more Minutes | 0 (0.0%) | 0 (0.0%) |
Time of Departure to Work by Sex in San Leanna
The most frequent times of departure to work in San Leanna are 12:00 PM to 3:59 PM (18, 17.3%) for males and 6:30 AM to 6:59 AM (35, 39.3%) for females.
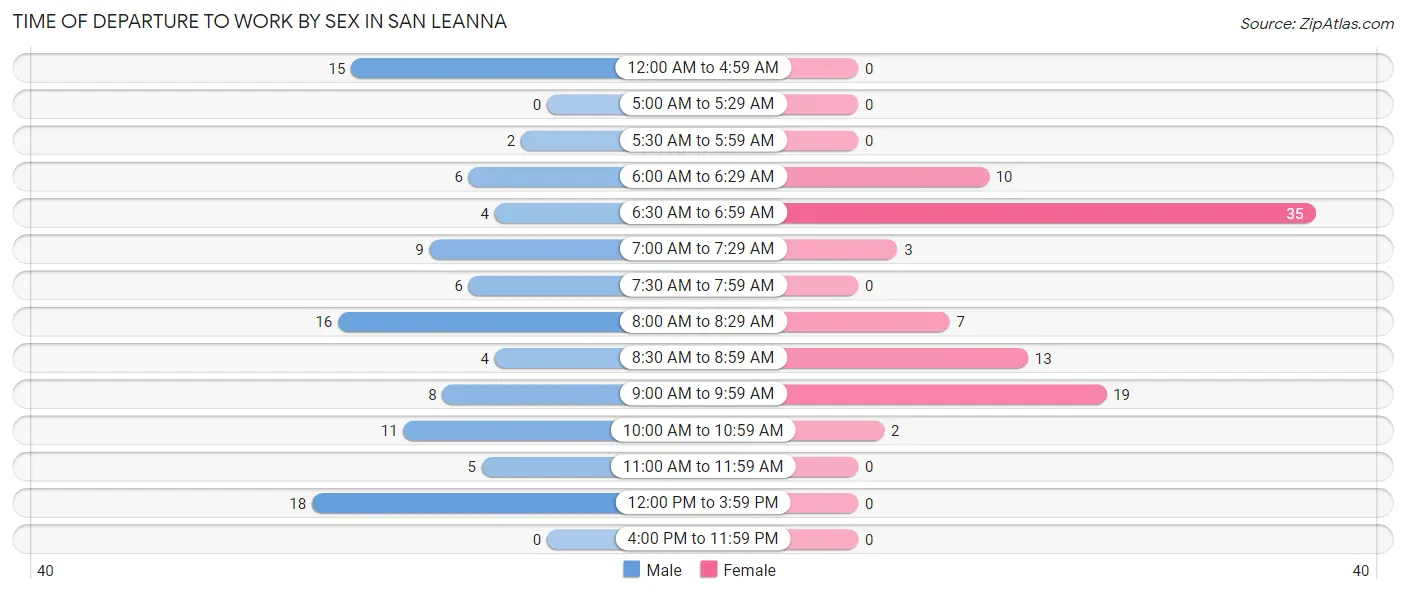
| Time of Departure | Male | Female |
| 12:00 AM to 4:59 AM | 15 (14.4%) | 0 (0.0%) |
| 5:00 AM to 5:29 AM | 0 (0.0%) | 0 (0.0%) |
| 5:30 AM to 5:59 AM | 2 (1.9%) | 0 (0.0%) |
| 6:00 AM to 6:29 AM | 6 (5.8%) | 10 (11.2%) |
| 6:30 AM to 6:59 AM | 4 (3.8%) | 35 (39.3%) |
| 7:00 AM to 7:29 AM | 9 (8.6%) | 3 (3.4%) |
| 7:30 AM to 7:59 AM | 6 (5.8%) | 0 (0.0%) |
| 8:00 AM to 8:29 AM | 16 (15.4%) | 7 (7.9%) |
| 8:30 AM to 8:59 AM | 4 (3.8%) | 13 (14.6%) |
| 9:00 AM to 9:59 AM | 8 (7.7%) | 19 (21.3%) |
| 10:00 AM to 10:59 AM | 11 (10.6%) | 2 (2.2%) |
| 11:00 AM to 11:59 AM | 5 (4.8%) | 0 (0.0%) |
| 12:00 PM to 3:59 PM | 18 (17.3%) | 0 (0.0%) |
| 4:00 PM to 11:59 PM | 0 (0.0%) | 0 (0.0%) |
| Total | 104 (100.0%) | 89 (100.0%) |
Housing Occupancy in San Leanna
Occupancy by Ownership in San Leanna
Of the total 244 dwellings in San Leanna, owner-occupied units account for 206 (84.4%), while renter-occupied units make up 38 (15.6%).
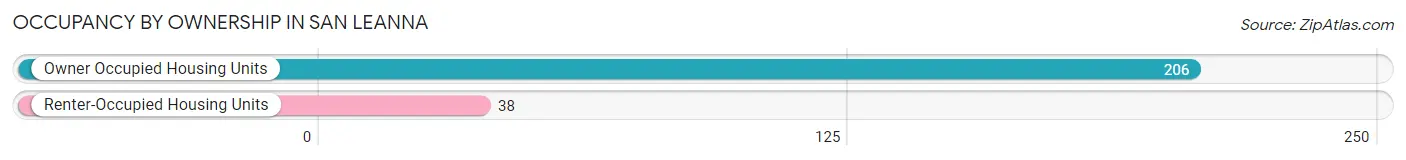
| Occupancy | # Housing Units | % Housing Units |
| Owner Occupied Housing Units | 206 | 84.4% |
| Renter-Occupied Housing Units | 38 | 15.6% |
| Total Occupied Housing Units | 244 | 100.0% |
Occupancy by Household Size in San Leanna
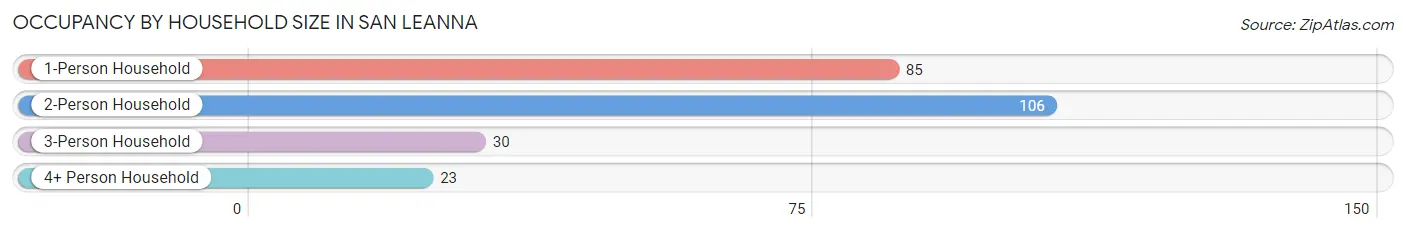
| Household Size | # Housing Units | % Housing Units |
| 1-Person Household | 85 | 34.8% |
| 2-Person Household | 106 | 43.4% |
| 3-Person Household | 30 | 12.3% |
| 4+ Person Household | 23 | 9.4% |
| Total Housing Units | 244 | 100.0% |
Occupancy by Ownership by Household Size in San Leanna
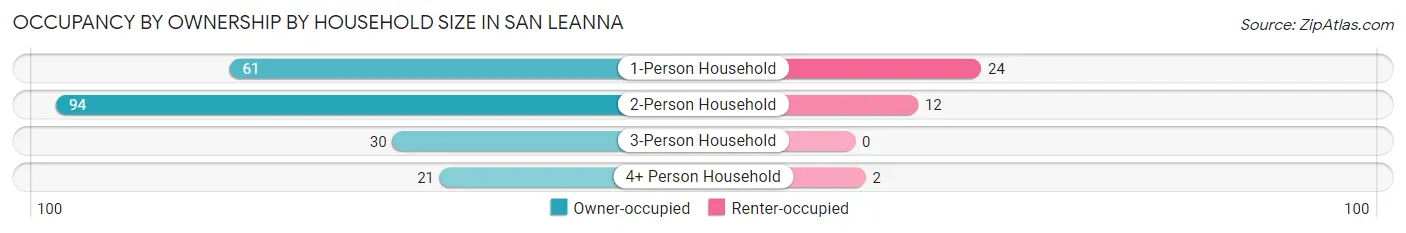
| Household Size | Owner-occupied | Renter-occupied |
| 1-Person Household | 61 (71.8%) | 24 (28.2%) |
| 2-Person Household | 94 (88.7%) | 12 (11.3%) |
| 3-Person Household | 30 (100.0%) | 0 (0.0%) |
| 4+ Person Household | 21 (91.3%) | 2 (8.7%) |
| Total Housing Units | 206 (84.4%) | 38 (15.6%) |
Occupancy by Educational Attainment in San Leanna
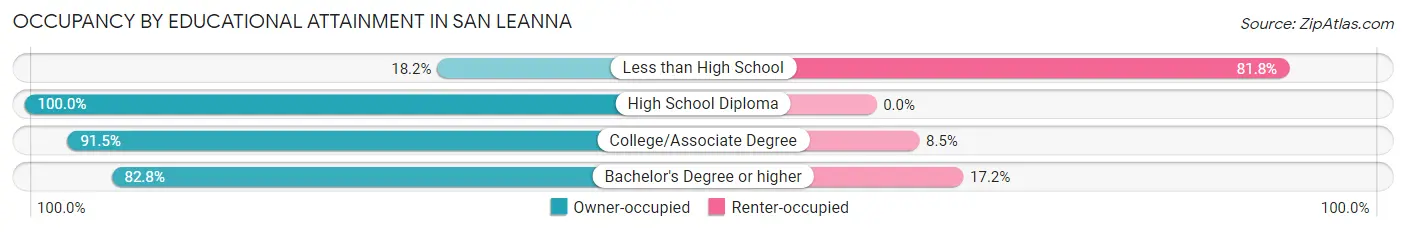
| Household Size | Owner-occupied | Renter-occupied |
| Less than High School | 2 (18.2%) | 9 (81.8%) |
| High School Diploma | 41 (100.0%) | 0 (0.0%) |
| College/Associate Degree | 43 (91.5%) | 4 (8.5%) |
| Bachelor's Degree or higher | 120 (82.8%) | 25 (17.2%) |
Occupancy by Age of Householder in San Leanna
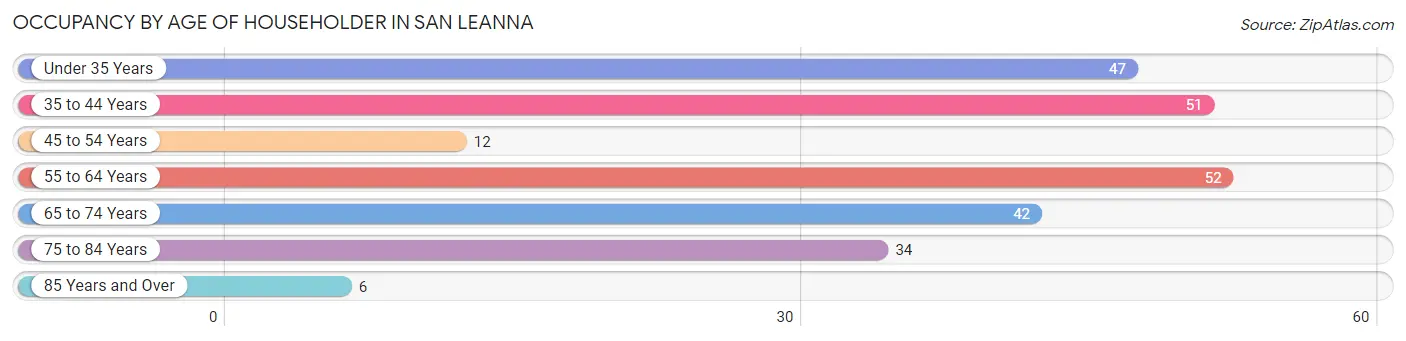
| Age Bracket | # Households | % Households |
| Under 35 Years | 47 | 19.3% |
| 35 to 44 Years | 51 | 20.9% |
| 45 to 54 Years | 12 | 4.9% |
| 55 to 64 Years | 52 | 21.3% |
| 65 to 74 Years | 42 | 17.2% |
| 75 to 84 Years | 34 | 13.9% |
| 85 Years and Over | 6 | 2.5% |
| Total | 244 | 100.0% |
Housing Finances in San Leanna
Median Income by Occupancy in San Leanna
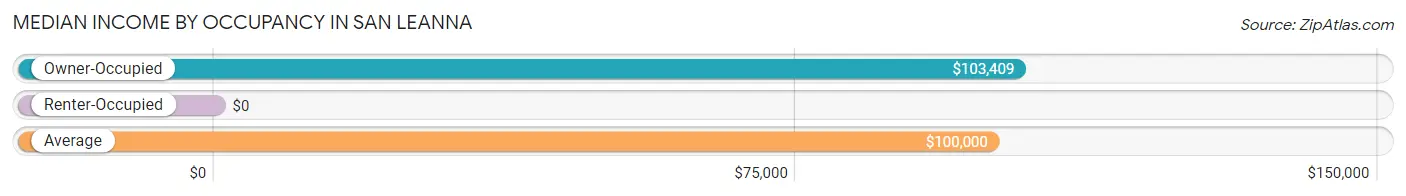
| Occupancy Type | # Households | Median Income |
| Owner-Occupied | 206 (84.4%) | $103,409 |
| Renter-Occupied | 38 (15.6%) | $0 |
| Average | 244 (100.0%) | $100,000 |
Occupancy by Householder Income Bracket in San Leanna
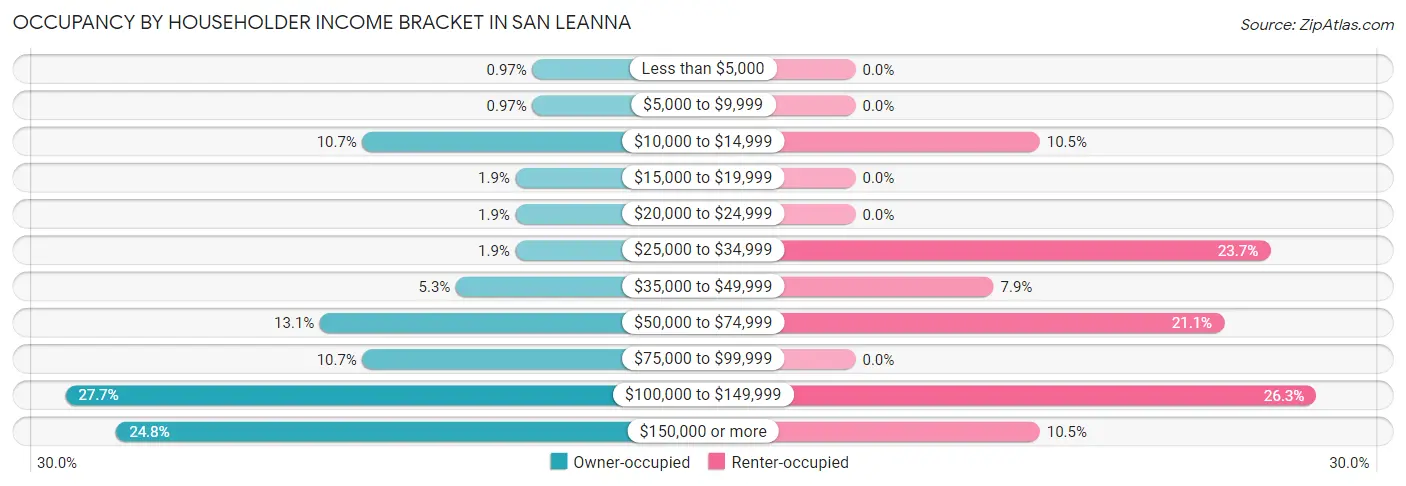
| Income Bracket | Owner-occupied | Renter-occupied |
| Less than $5,000 | 2 (1.0%) | 0 (0.0%) |
| $5,000 to $9,999 | 2 (1.0%) | 0 (0.0%) |
| $10,000 to $14,999 | 22 (10.7%) | 4 (10.5%) |
| $15,000 to $19,999 | 4 (1.9%) | 0 (0.0%) |
| $20,000 to $24,999 | 4 (1.9%) | 0 (0.0%) |
| $25,000 to $34,999 | 4 (1.9%) | 9 (23.7%) |
| $35,000 to $49,999 | 11 (5.3%) | 3 (7.9%) |
| $50,000 to $74,999 | 27 (13.1%) | 8 (21.0%) |
| $75,000 to $99,999 | 22 (10.7%) | 0 (0.0%) |
| $100,000 to $149,999 | 57 (27.7%) | 10 (26.3%) |
| $150,000 or more | 51 (24.8%) | 4 (10.5%) |
| Total | 206 (100.0%) | 38 (100.0%) |
Monthly Housing Cost Tiers in San Leanna
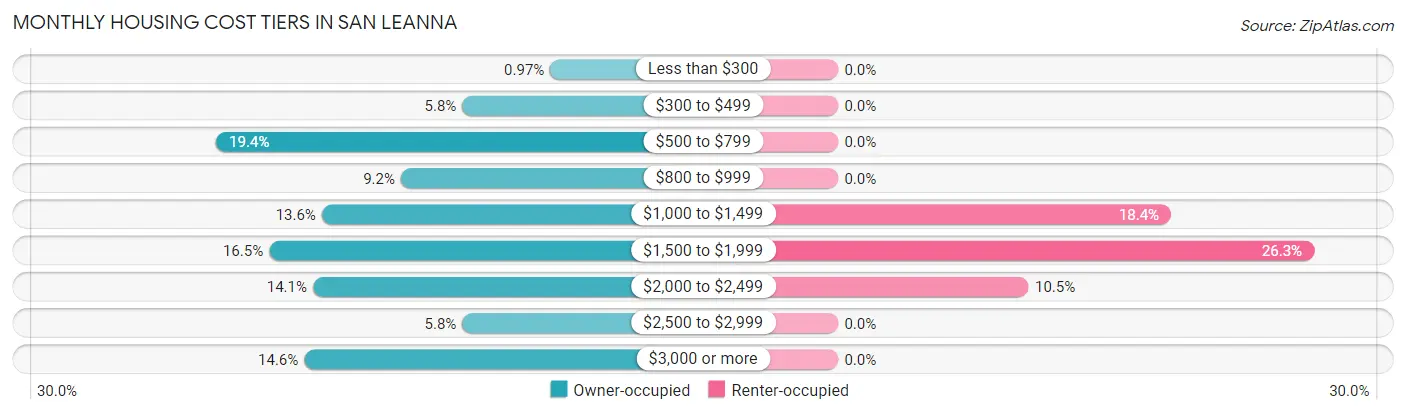
| Monthly Cost | Owner-occupied | Renter-occupied |
| Less than $300 | 2 (1.0%) | 0 (0.0%) |
| $300 to $499 | 12 (5.8%) | 0 (0.0%) |
| $500 to $799 | 40 (19.4%) | 0 (0.0%) |
| $800 to $999 | 19 (9.2%) | 0 (0.0%) |
| $1,000 to $1,499 | 28 (13.6%) | 7 (18.4%) |
| $1,500 to $1,999 | 34 (16.5%) | 10 (26.3%) |
| $2,000 to $2,499 | 29 (14.1%) | 4 (10.5%) |
| $2,500 to $2,999 | 12 (5.8%) | 0 (0.0%) |
| $3,000 or more | 30 (14.6%) | 0 (0.0%) |
| Total | 206 (100.0%) | 38 (100.0%) |
Physical Housing Characteristics in San Leanna
Housing Structures in San Leanna
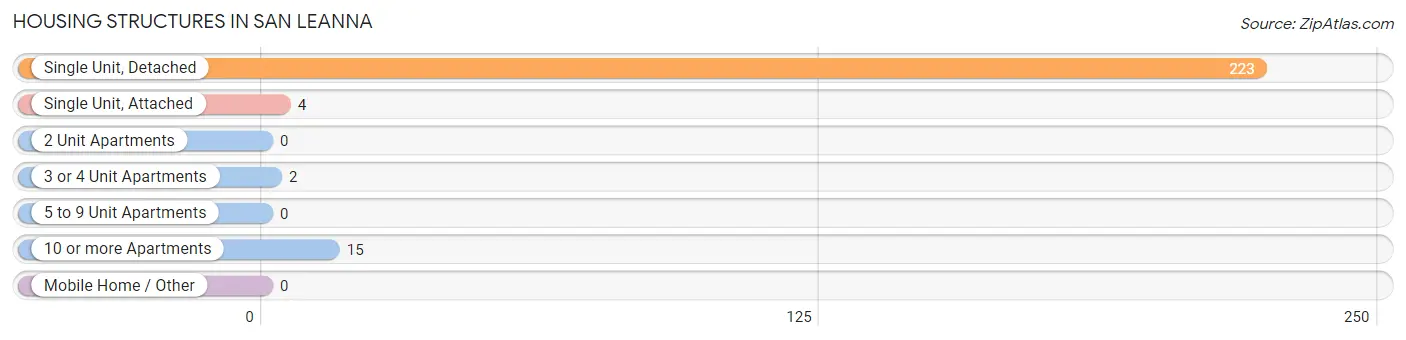
| Structure Type | # Housing Units | % Housing Units |
| Single Unit, Detached | 223 | 91.4% |
| Single Unit, Attached | 4 | 1.6% |
| 2 Unit Apartments | 0 | 0.0% |
| 3 or 4 Unit Apartments | 2 | 0.8% |
| 5 to 9 Unit Apartments | 0 | 0.0% |
| 10 or more Apartments | 15 | 6.1% |
| Mobile Home / Other | 0 | 0.0% |
| Total | 244 | 100.0% |
Housing Structures by Occupancy in San Leanna
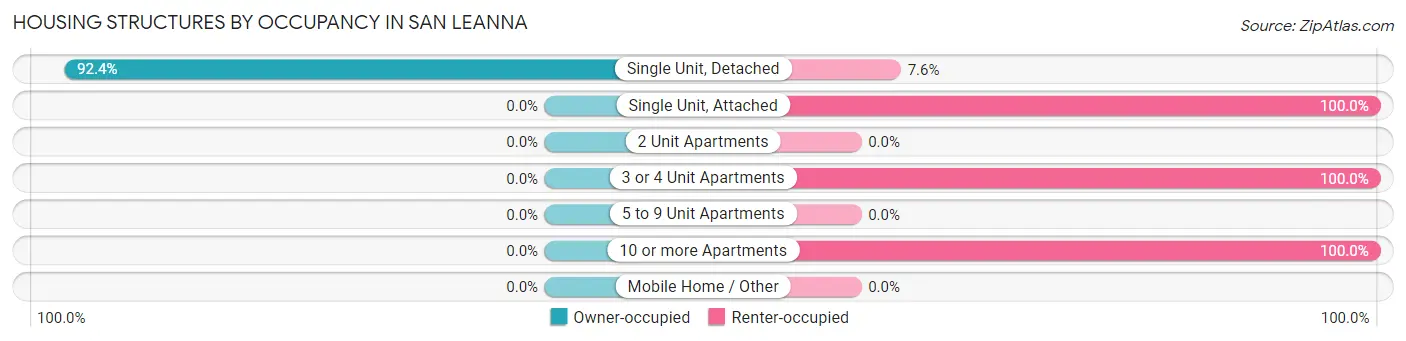
| Structure Type | Owner-occupied | Renter-occupied |
| Single Unit, Detached | 206 (92.4%) | 17 (7.6%) |
| Single Unit, Attached | 0 (0.0%) | 4 (100.0%) |
| 2 Unit Apartments | 0 (0.0%) | 0 (0.0%) |
| 3 or 4 Unit Apartments | 0 (0.0%) | 2 (100.0%) |
| 5 to 9 Unit Apartments | 0 (0.0%) | 0 (0.0%) |
| 10 or more Apartments | 0 (0.0%) | 15 (100.0%) |
| Mobile Home / Other | 0 (0.0%) | 0 (0.0%) |
| Total | 206 (84.4%) | 38 (15.6%) |
Housing Structures by Number of Rooms in San Leanna
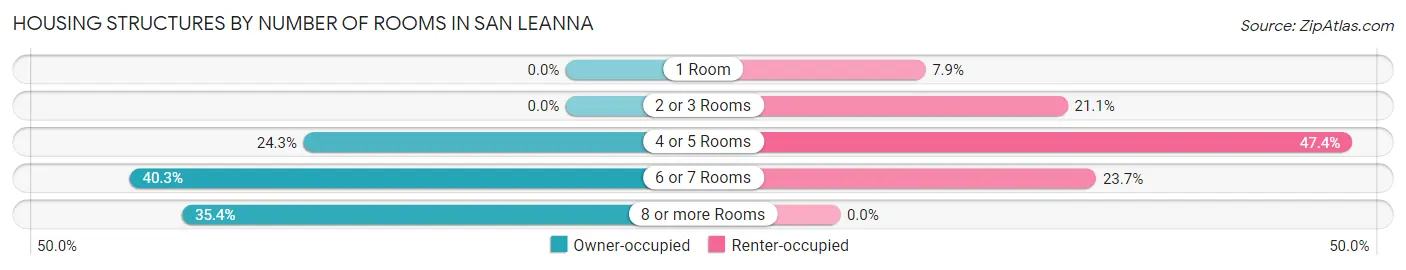
| Number of Rooms | Owner-occupied | Renter-occupied |
| 1 Room | 0 (0.0%) | 3 (7.9%) |
| 2 or 3 Rooms | 0 (0.0%) | 8 (21.0%) |
| 4 or 5 Rooms | 50 (24.3%) | 18 (47.4%) |
| 6 or 7 Rooms | 83 (40.3%) | 9 (23.7%) |
| 8 or more Rooms | 73 (35.4%) | 0 (0.0%) |
| Total | 206 (100.0%) | 38 (100.0%) |
Housing Structure by Heating Type in San Leanna
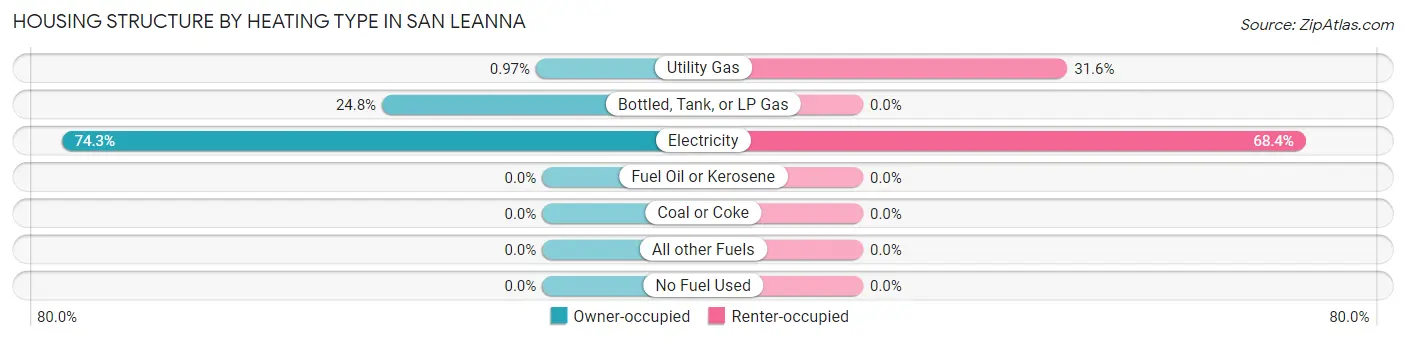
| Heating Type | Owner-occupied | Renter-occupied |
| Utility Gas | 2 (1.0%) | 12 (31.6%) |
| Bottled, Tank, or LP Gas | 51 (24.8%) | 0 (0.0%) |
| Electricity | 153 (74.3%) | 26 (68.4%) |
| Fuel Oil or Kerosene | 0 (0.0%) | 0 (0.0%) |
| Coal or Coke | 0 (0.0%) | 0 (0.0%) |
| All other Fuels | 0 (0.0%) | 0 (0.0%) |
| No Fuel Used | 0 (0.0%) | 0 (0.0%) |
| Total | 206 (100.0%) | 38 (100.0%) |
Household Vehicle Usage in San Leanna
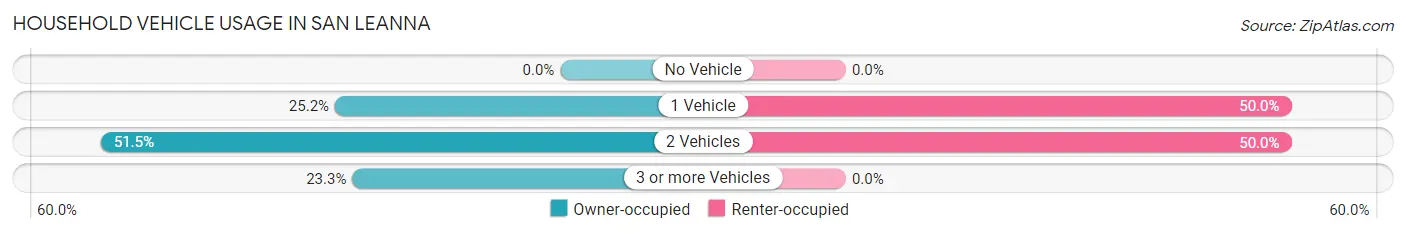
| Vehicles per Household | Owner-occupied | Renter-occupied |
| No Vehicle | 0 (0.0%) | 0 (0.0%) |
| 1 Vehicle | 52 (25.2%) | 19 (50.0%) |
| 2 Vehicles | 106 (51.5%) | 19 (50.0%) |
| 3 or more Vehicles | 48 (23.3%) | 0 (0.0%) |
| Total | 206 (100.0%) | 38 (100.0%) |
Real Estate & Mortgages in San Leanna
Real Estate and Mortgage Overview in San Leanna
| Characteristic | Without Mortgage | With Mortgage |
| Housing Units | 93 | 113 |
| Median Property Value | $477,100 | $448,000 |
| Median Household Income | $78,125 | $34 |
| Monthly Housing Costs | $769 | $30 |
| Real Estate Taxes | $3,737 | $2 |
Property Value by Mortgage Status in San Leanna
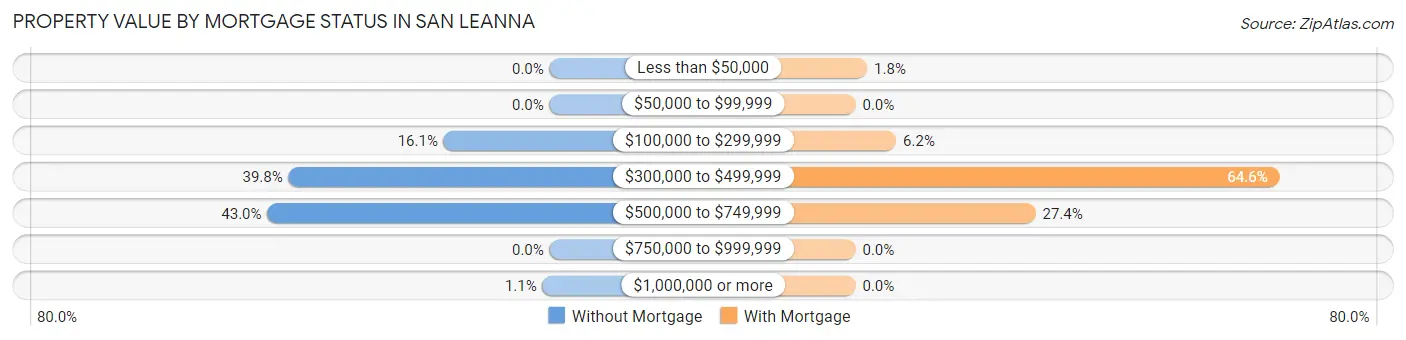
| Property Value | Without Mortgage | With Mortgage |
| Less than $50,000 | 0 (0.0%) | 2 (1.8%) |
| $50,000 to $99,999 | 0 (0.0%) | 0 (0.0%) |
| $100,000 to $299,999 | 15 (16.1%) | 7 (6.2%) |
| $300,000 to $499,999 | 37 (39.8%) | 73 (64.6%) |
| $500,000 to $749,999 | 40 (43.0%) | 31 (27.4%) |
| $750,000 to $999,999 | 0 (0.0%) | 0 (0.0%) |
| $1,000,000 or more | 1 (1.1%) | 0 (0.0%) |
| Total | 93 (100.0%) | 113 (100.0%) |
Household Income by Mortgage Status in San Leanna
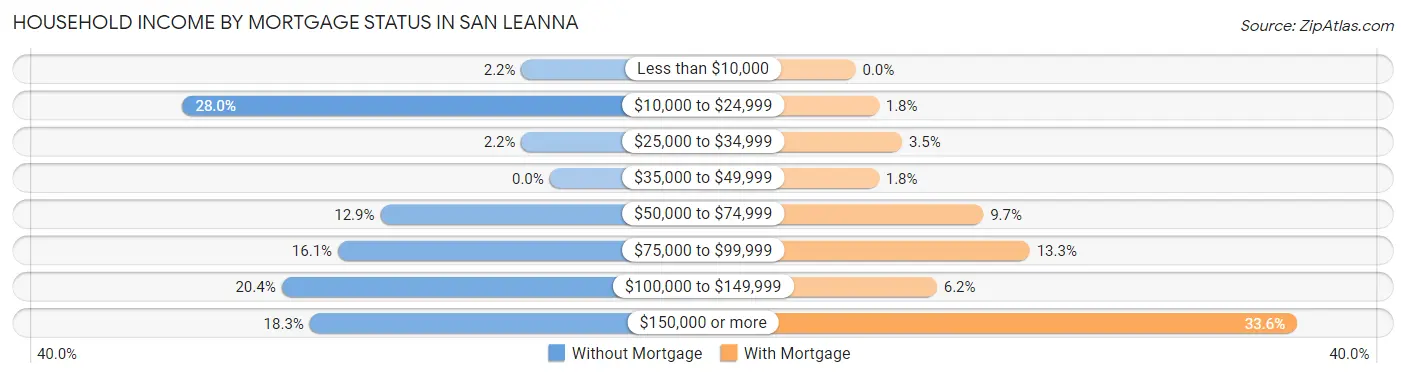
| Household Income | Without Mortgage | With Mortgage |
| Less than $10,000 | 2 (2.1%) | 0 (0.0%) |
| $10,000 to $24,999 | 26 (28.0%) | 2 (1.8%) |
| $25,000 to $34,999 | 2 (2.1%) | 4 (3.5%) |
| $35,000 to $49,999 | 0 (0.0%) | 2 (1.8%) |
| $50,000 to $74,999 | 12 (12.9%) | 11 (9.7%) |
| $75,000 to $99,999 | 15 (16.1%) | 15 (13.3%) |
| $100,000 to $149,999 | 19 (20.4%) | 7 (6.2%) |
| $150,000 or more | 17 (18.3%) | 38 (33.6%) |
| Total | 93 (100.0%) | 113 (100.0%) |
Property Value to Household Income Ratio in San Leanna
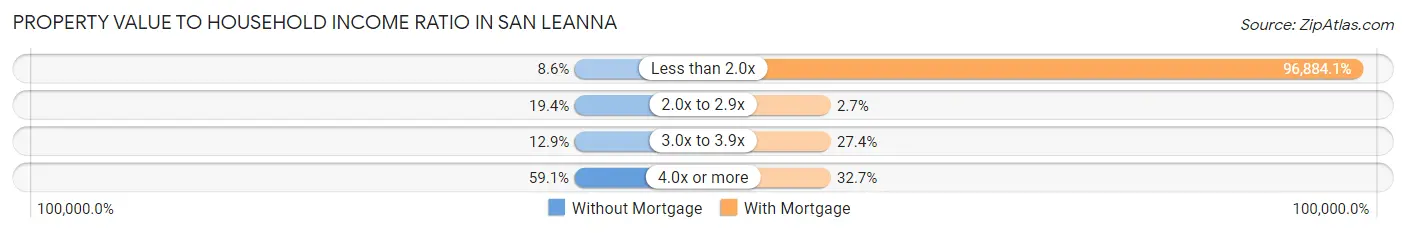
| Value-to-Income Ratio | Without Mortgage | With Mortgage |
| Less than 2.0x | 8 (8.6%) | 109,479 (96,884.1%) |
| 2.0x to 2.9x | 18 (19.4%) | 3 (2.6%) |
| 3.0x to 3.9x | 12 (12.9%) | 31 (27.4%) |
| 4.0x or more | 55 (59.1%) | 37 (32.7%) |
| Total | 93 (100.0%) | 113 (100.0%) |
Real Estate Taxes by Mortgage Status in San Leanna
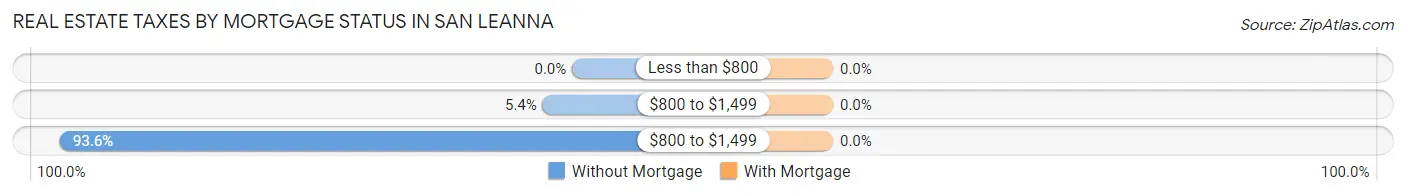
| Property Taxes | Without Mortgage | With Mortgage |
| Less than $800 | 0 (0.0%) | 0 (0.0%) |
| $800 to $1,499 | 5 (5.4%) | 0 (0.0%) |
| $800 to $1,499 | 87 (93.5%) | 0 (0.0%) |
| Total | 93 (100.0%) | 113 (100.0%) |
Health & Disability in San Leanna
Health Insurance Coverage by Age in San Leanna
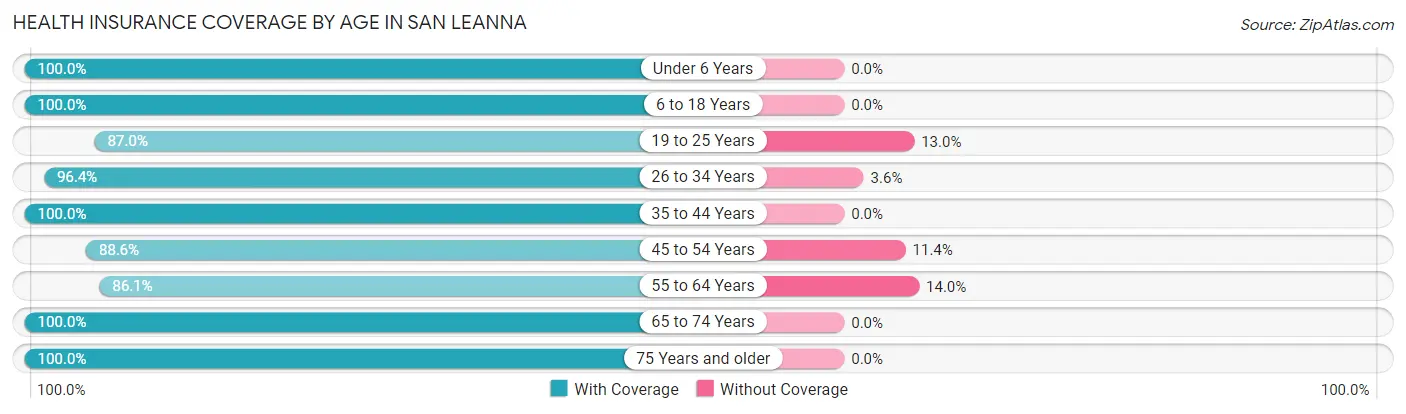
| Age Bracket | With Coverage | Without Coverage |
| Under 6 Years | 35 (100.0%) | 0 (0.0%) |
| 6 to 18 Years | 20 (100.0%) | 0 (0.0%) |
| 19 to 25 Years | 20 (87.0%) | 3 (13.0%) |
| 26 to 34 Years | 80 (96.4%) | 3 (3.6%) |
| 35 to 44 Years | 74 (100.0%) | 0 (0.0%) |
| 45 to 54 Years | 31 (88.6%) | 4 (11.4%) |
| 55 to 64 Years | 74 (86.1%) | 12 (14.0%) |
| 65 to 74 Years | 73 (100.0%) | 0 (0.0%) |
| 75 Years and older | 63 (100.0%) | 0 (0.0%) |
| Total | 470 (95.5%) | 22 (4.5%) |
Health Insurance Coverage by Citizenship Status in San Leanna
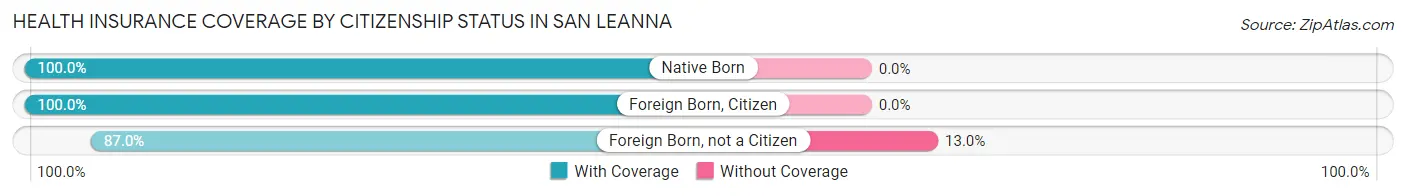
| Citizenship Status | With Coverage | Without Coverage |
| Native Born | 35 (100.0%) | 0 (0.0%) |
| Foreign Born, Citizen | 20 (100.0%) | 0 (0.0%) |
| Foreign Born, not a Citizen | 20 (87.0%) | 3 (13.0%) |
Health Insurance Coverage by Household Income in San Leanna
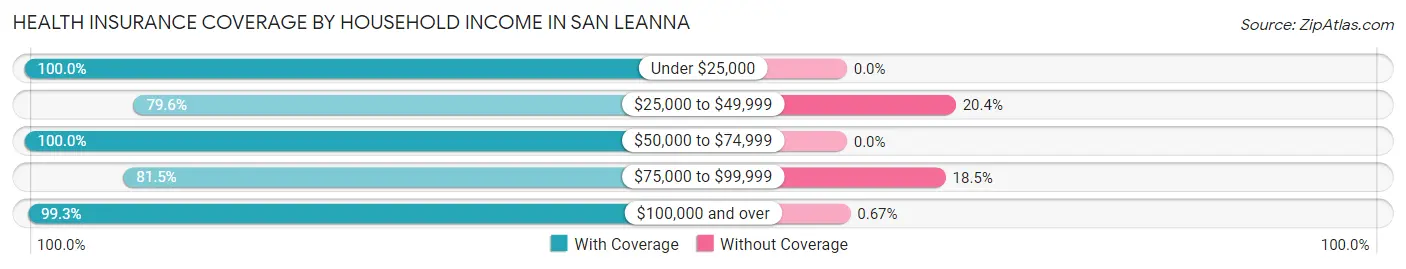
| Household Income | With Coverage | Without Coverage |
| Under $25,000 | 45 (100.0%) | 0 (0.0%) |
| $25,000 to $49,999 | 39 (79.6%) | 10 (20.4%) |
| $50,000 to $74,999 | 44 (100.0%) | 0 (0.0%) |
| $75,000 to $99,999 | 44 (81.5%) | 10 (18.5%) |
| $100,000 and over | 295 (99.3%) | 2 (0.7%) |
Public vs Private Health Insurance Coverage by Age in San Leanna
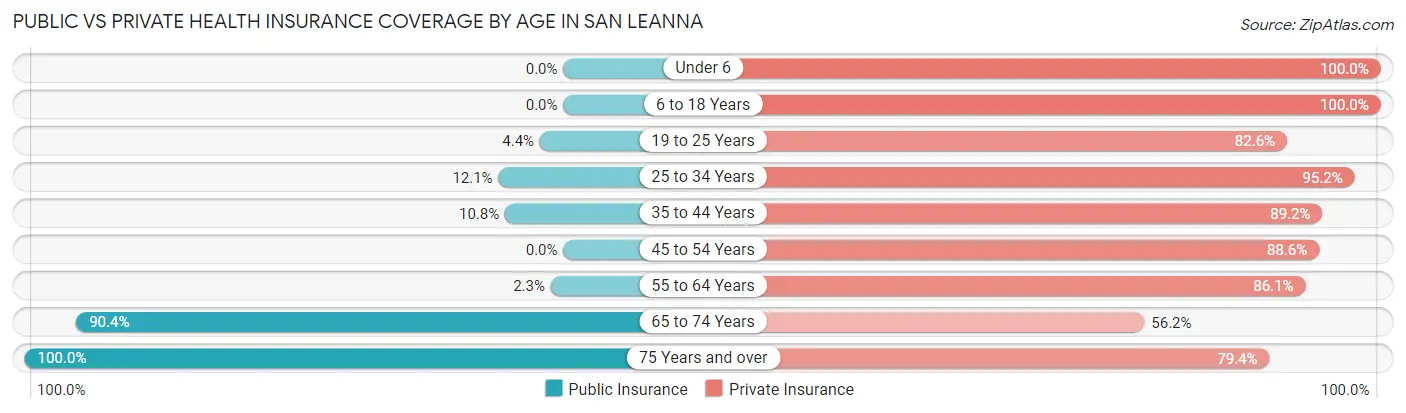
| Age Bracket | Public Insurance | Private Insurance |
| Under 6 | 0 (0.0%) | 35 (100.0%) |
| 6 to 18 Years | 0 (0.0%) | 20 (100.0%) |
| 19 to 25 Years | 1 (4.3%) | 19 (82.6%) |
| 25 to 34 Years | 10 (12.0%) | 79 (95.2%) |
| 35 to 44 Years | 8 (10.8%) | 66 (89.2%) |
| 45 to 54 Years | 0 (0.0%) | 31 (88.6%) |
| 55 to 64 Years | 2 (2.3%) | 74 (86.1%) |
| 65 to 74 Years | 66 (90.4%) | 41 (56.2%) |
| 75 Years and over | 63 (100.0%) | 50 (79.4%) |
| Total | 150 (30.5%) | 415 (84.4%) |
Disability Status by Sex by Age in San Leanna
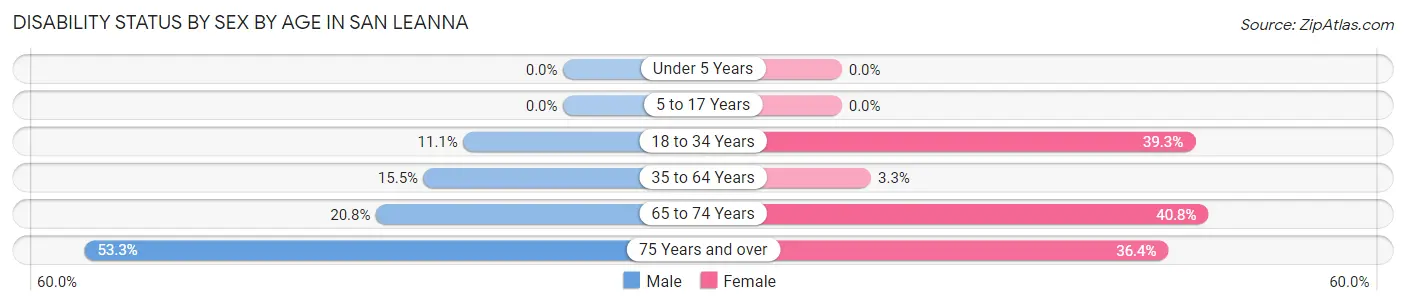
| Age Bracket | Male | Female |
| Under 5 Years | 0 (0.0%) | 0 (0.0%) |
| 5 to 17 Years | 0 (0.0%) | 0 (0.0%) |
| 18 to 34 Years | 5 (11.1%) | 24 (39.3%) |
| 35 to 64 Years | 16 (15.5%) | 3 (3.3%) |
| 65 to 74 Years | 5 (20.8%) | 20 (40.8%) |
| 75 Years and over | 16 (53.3%) | 12 (36.4%) |
Disability Class by Sex by Age in San Leanna
Disability Class: Hearing Difficulty
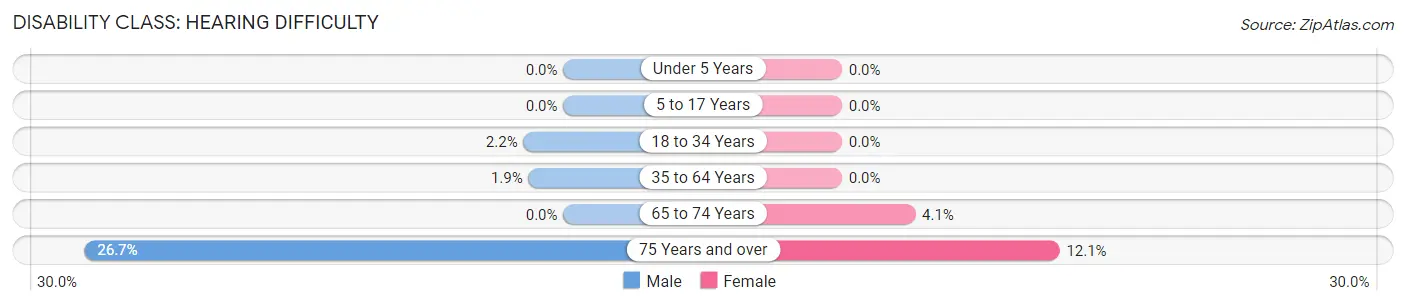
| Age Bracket | Male | Female |
| Under 5 Years | 0 (0.0%) | 0 (0.0%) |
| 5 to 17 Years | 0 (0.0%) | 0 (0.0%) |
| 18 to 34 Years | 1 (2.2%) | 0 (0.0%) |
| 35 to 64 Years | 2 (1.9%) | 0 (0.0%) |
| 65 to 74 Years | 0 (0.0%) | 2 (4.1%) |
| 75 Years and over | 8 (26.7%) | 4 (12.1%) |
Disability Class: Vision Difficulty
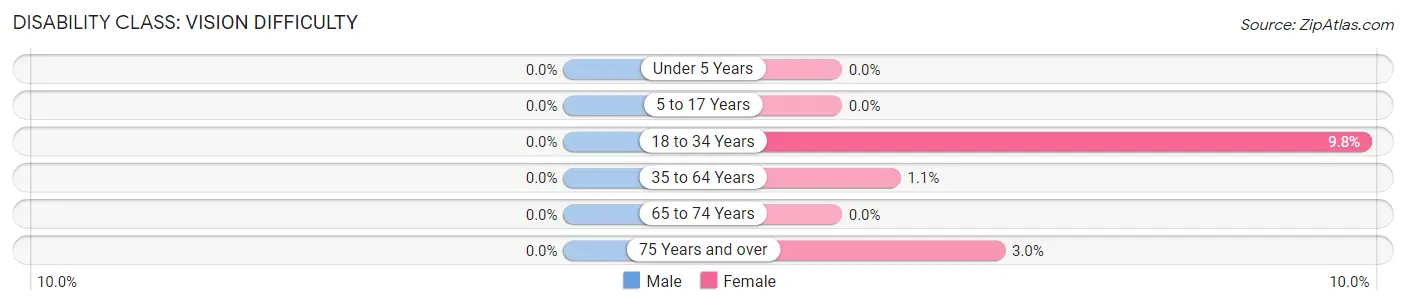
| Age Bracket | Male | Female |
| Under 5 Years | 0 (0.0%) | 0 (0.0%) |
| 5 to 17 Years | 0 (0.0%) | 0 (0.0%) |
| 18 to 34 Years | 0 (0.0%) | 6 (9.8%) |
| 35 to 64 Years | 0 (0.0%) | 1 (1.1%) |
| 65 to 74 Years | 0 (0.0%) | 0 (0.0%) |
| 75 Years and over | 0 (0.0%) | 1 (3.0%) |
Disability Class: Cognitive Difficulty
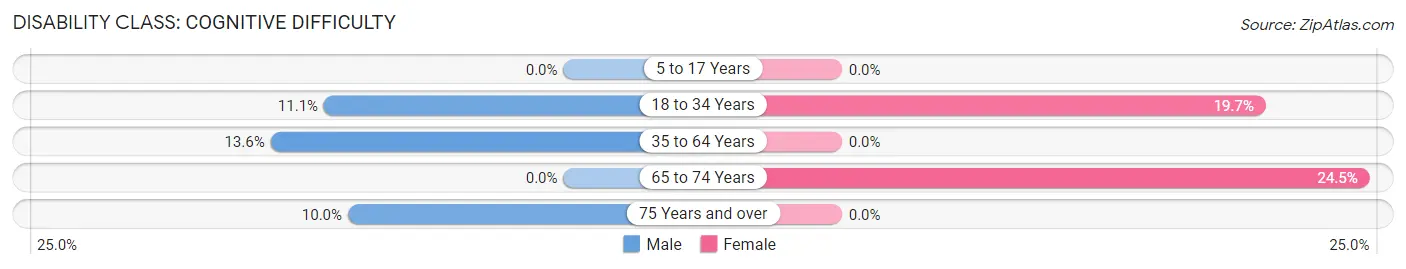
| Age Bracket | Male | Female |
| 5 to 17 Years | 0 (0.0%) | 0 (0.0%) |
| 18 to 34 Years | 5 (11.1%) | 12 (19.7%) |
| 35 to 64 Years | 14 (13.6%) | 0 (0.0%) |
| 65 to 74 Years | 0 (0.0%) | 12 (24.5%) |
| 75 Years and over | 3 (10.0%) | 0 (0.0%) |
Disability Class: Ambulatory Difficulty
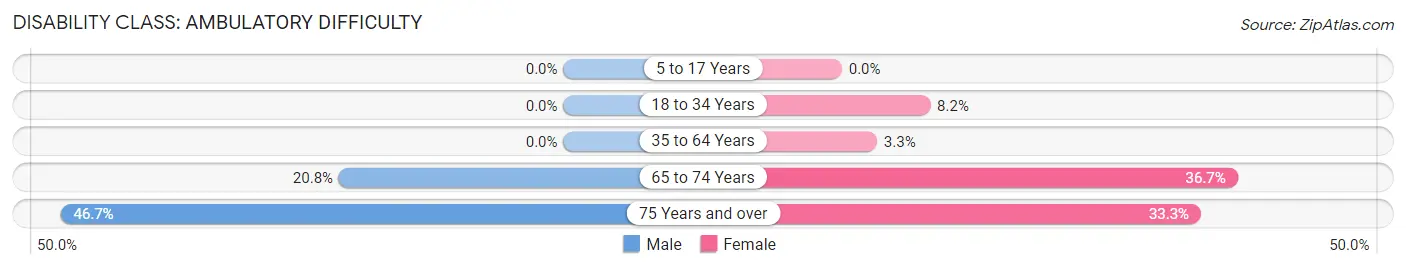
| Age Bracket | Male | Female |
| 5 to 17 Years | 0 (0.0%) | 0 (0.0%) |
| 18 to 34 Years | 0 (0.0%) | 5 (8.2%) |
| 35 to 64 Years | 0 (0.0%) | 3 (3.3%) |
| 65 to 74 Years | 5 (20.8%) | 18 (36.7%) |
| 75 Years and over | 14 (46.7%) | 11 (33.3%) |
Disability Class: Self-Care Difficulty
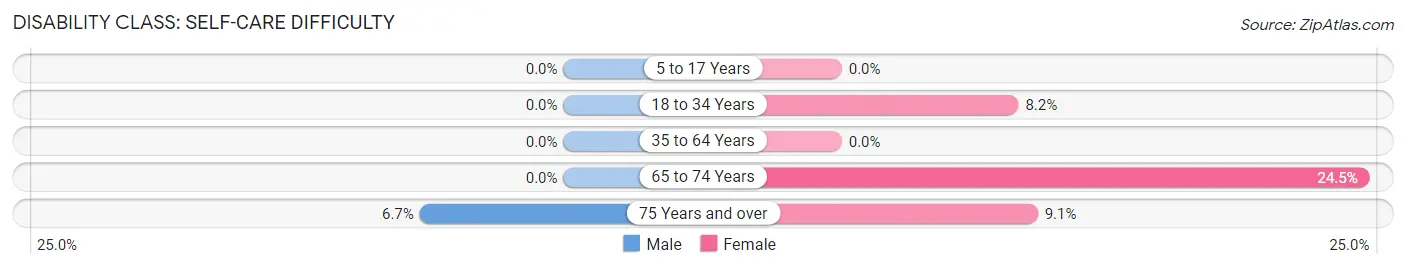
| Age Bracket | Male | Female |
| 5 to 17 Years | 0 (0.0%) | 0 (0.0%) |
| 18 to 34 Years | 0 (0.0%) | 5 (8.2%) |
| 35 to 64 Years | 0 (0.0%) | 0 (0.0%) |
| 65 to 74 Years | 0 (0.0%) | 12 (24.5%) |
| 75 Years and over | 2 (6.7%) | 3 (9.1%) |
Technology Access in San Leanna
Computing Device Access in San Leanna
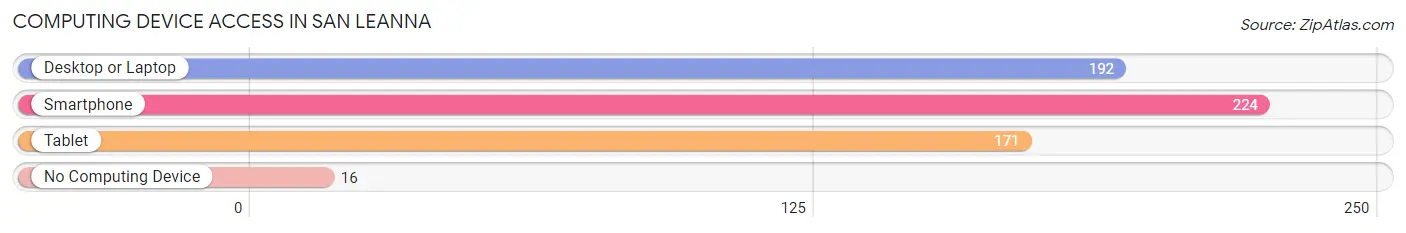
| Device Type | # Households | % Households |
| Desktop or Laptop | 192 | 78.7% |
| Smartphone | 224 | 91.8% |
| Tablet | 171 | 70.1% |
| No Computing Device | 16 | 6.6% |
| Total | 244 | 100.0% |
Internet Access in San Leanna
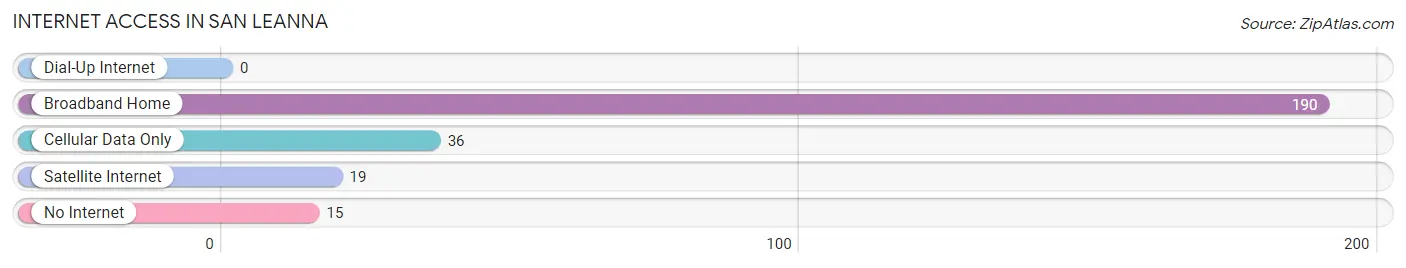
| Internet Type | # Households | % Households |
| Dial-Up Internet | 0 | 0.0% |
| Broadband Home | 190 | 77.9% |
| Cellular Data Only | 36 | 14.7% |
| Satellite Internet | 19 | 7.8% |
| No Internet | 15 | 6.1% |
| Total | 244 | 100.0% |
San Leanna Summary
San Leanna is a small town located in Travis County, Texas, United States. It is situated about 15 miles south of Austin, the state capital. The population of San Leanna was estimated to be 1,093 in 2019.
History
San Leanna was founded in 1876 by a group of settlers from the nearby town of Manchaca. The town was named after a local creek, which was named after a Spanish land grantee, Leanna. The town was originally a farming community, but it soon became a popular stop for travelers on the Chisholm Trail.
In the early 1900s, San Leanna began to grow as a small town. The town was home to a post office, a general store, a blacksmith shop, and a cotton gin. The town also had a school, which was built in 1910.
In the 1950s, San Leanna began to experience a population boom. This was due to the growth of nearby Austin, which was becoming a major city. As a result, many people moved to San Leanna to take advantage of the town's proximity to Austin.
Geography
San Leanna is located in Travis County, Texas. It is situated about 15 miles south of Austin, the state capital. The town is located on the banks of the San Leanna Creek, which is a tributary of the Colorado River.
The town is surrounded by rolling hills and is located in a region of Texas known as the Hill Country. The climate in San Leanna is generally mild, with temperatures ranging from the mid-50s in the winter to the mid-90s in the summer.
Economy
San Leanna is a small town with a limited economy. The town is primarily a bedroom community, with most of its residents commuting to nearby Austin for work. The town does have some local businesses, including a few restaurants, a grocery store, and a few small shops.
The town is also home to a few small farms, which produce a variety of crops, including corn, cotton, and hay.
Demographics
As of 2019, the population of San Leanna was estimated to be 1,093. The town is predominantly white, with about 85% of the population identifying as such. The remaining 15% of the population is made up of African Americans, Hispanics, and other ethnicities.
The median household income in San Leanna is $50,000, which is slightly lower than the median income for Travis County. The town has a poverty rate of about 10%, which is slightly higher than the county average.
Conclusion
San Leanna is a small town located in Travis County, Texas. It was founded in 1876 and has since grown into a bedroom community for nearby Austin. The town has a population of 1,093 and is predominantly white. The town has a limited economy, with most of its residents commuting to Austin for work. The town is also home to a few small farms, which produce a variety of crops.
Common Questions
What is Per Capita Income in San Leanna?
Per Capita income in San Leanna is $51,296.
What is the Median Family Income in San Leanna?
Median Family Income in San Leanna is $120,313.
What is the Median Household income in San Leanna?
Median Household Income in San Leanna is $100,000.
What is Income or Wage Gap in San Leanna?
Income or Wage Gap in San Leanna is 27.6%.
Women in San Leanna earn 72.4 cents for every dollar earned by a man.
What is Inequality or Gini Index in San Leanna?
Inequality or Gini Index in San Leanna is 0.39.
What is the Total Population of San Leanna?
Total Population of San Leanna is 492.
What is the Total Male Population of San Leanna?
Total Male Population of San Leanna is 220.
What is the Total Female Population of San Leanna?
Total Female Population of San Leanna is 272.
What is the Ratio of Males per 100 Females in San Leanna?
There are 80.88 Males per 100 Females in San Leanna.
What is the Ratio of Females per 100 Males in San Leanna?
There are 123.64 Females per 100 Males in San Leanna.
What is the Median Population Age in San Leanna?
Median Population Age in San Leanna is 51.0 Years.
What is the Average Family Size in San Leanna
Average Family Size in San Leanna is 2.6 People.
What is the Average Household Size in San Leanna
Average Household Size in San Leanna is 2.0 People.
How Large is the Labor Force in San Leanna?
There are 244 People in the Labor Forcein in San Leanna.
What is the Percentage of People in the Labor Force in San Leanna?
55.5% of People are in the Labor Force in San Leanna.
What is the Unemployment Rate in San Leanna?
Unemployment Rate in San Leanna is 9.4%.