Los Alvarez, TX Map & Demographics
Los Alvarez Map
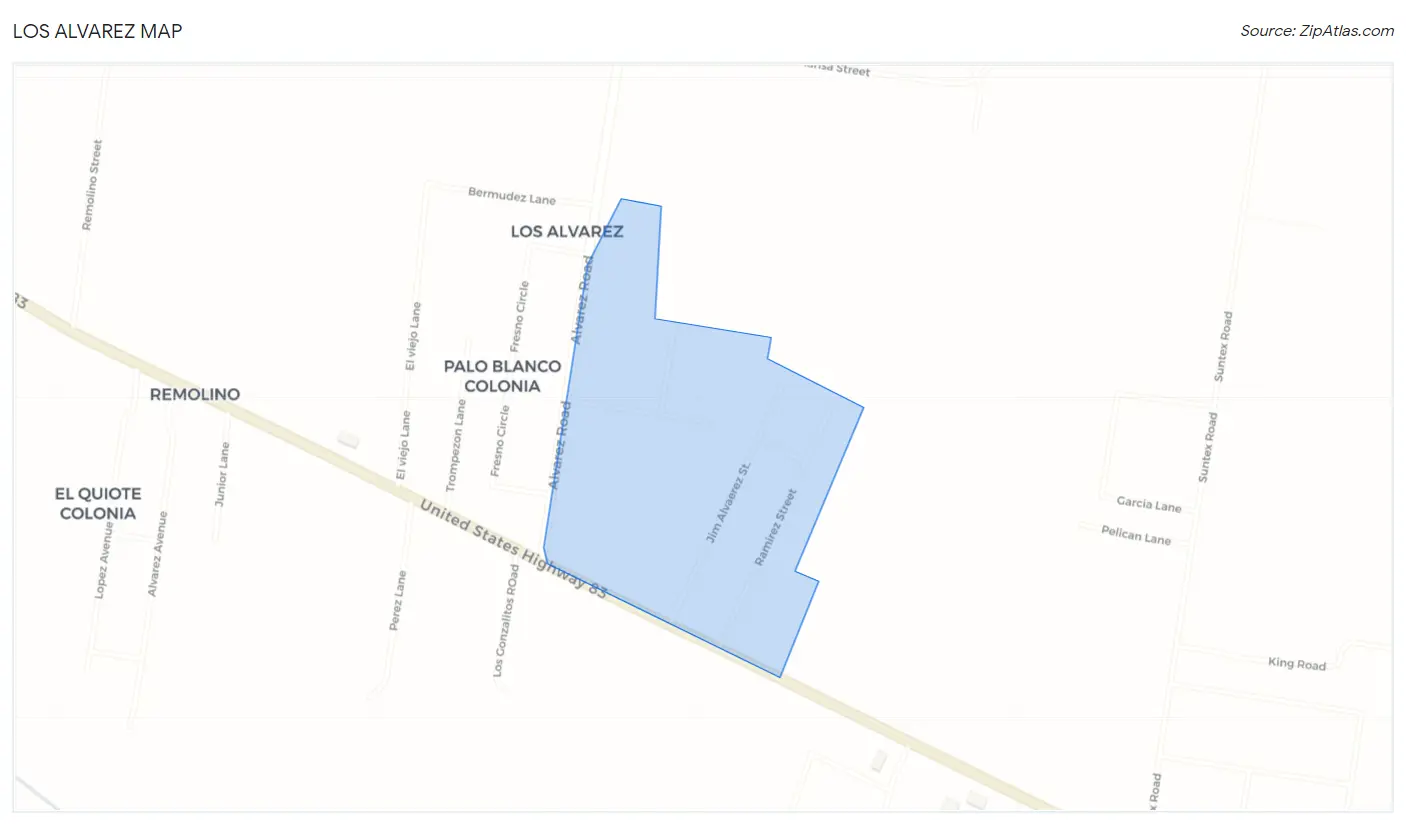
Los Alvarez Overview
$6,204
PER CAPITA INCOME
$8,862
AVG HOUSEHOLD INCOME
0.26
INEQUALITY / GINI INDEX
181
TOTAL POPULATION
2
MALE POPULATION
179
FEMALE POPULATION
1.12
MALES / 100 FEMALES
8,950.00
FEMALES / 100 MALES
21.8
MEDIAN AGE
3.6
AVG FAMILY SIZE
2.5
AVG HOUSEHOLD SIZE
4
LABOR FORCE [ PEOPLE ]
2.2%
PERCENT IN LABOR FORCE
Income in Los Alvarez
Income Overview in Los Alvarez
| Characteristic | Number | Measure |
| Per Capita Income | 181 | $6,204 |
| Median Family Income | 41 | $0 |
| Mean Family Income | 41 | $0 |
| Median Household Income | 73 | $8,862 |
| Mean Household Income | 73 | $12,960 |
| Income Deficit | 41 | $0 |
| Wage / Income Gap (%) | 181 | 0.00% |
| Wage / Income Gap ($) | 181 | 100.00¢ per $1 |
| Gini / Inequality Index | 181 | 0.26 |
Earnings by Sex in Los Alvarez
| Sex | Number | Average Earnings |
| Male | 0 (0.0%) | $0 |
| Female | 61 (100.0%) | $0 |
| Total | 61 (100.0%) | $0 |
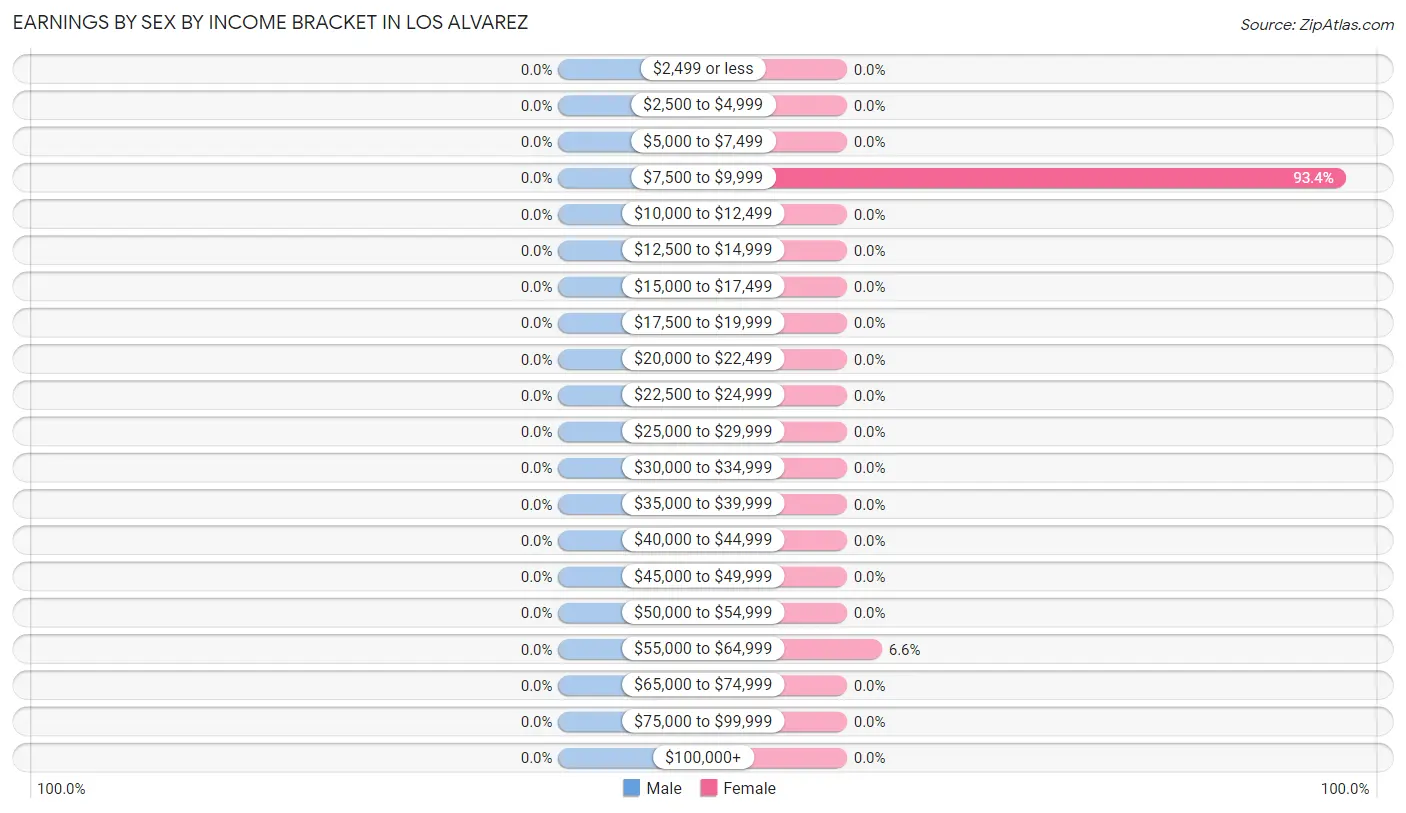
Earnings by Sex by Income Bracket in Los Alvarez
| Income | Male | Female |
| $2,499 or less | 0 (0.0%) | 0 (0.0%) |
| $2,500 to $4,999 | 0 (0.0%) | 0 (0.0%) |
| $5,000 to $7,499 | 0 (0.0%) | 0 (0.0%) |
| $7,500 to $9,999 | 0 (0.0%) | 57 (93.4%) |
| $10,000 to $12,499 | 0 (0.0%) | 0 (0.0%) |
| $12,500 to $14,999 | 0 (0.0%) | 0 (0.0%) |
| $15,000 to $17,499 | 0 (0.0%) | 0 (0.0%) |
| $17,500 to $19,999 | 0 (0.0%) | 0 (0.0%) |
| $20,000 to $22,499 | 0 (0.0%) | 0 (0.0%) |
| $22,500 to $24,999 | 0 (0.0%) | 0 (0.0%) |
| $25,000 to $29,999 | 0 (0.0%) | 0 (0.0%) |
| $30,000 to $34,999 | 0 (0.0%) | 0 (0.0%) |
| $35,000 to $39,999 | 0 (0.0%) | 0 (0.0%) |
| $40,000 to $44,999 | 0 (0.0%) | 0 (0.0%) |
| $45,000 to $49,999 | 0 (0.0%) | 0 (0.0%) |
| $50,000 to $54,999 | 0 (0.0%) | 0 (0.0%) |
| $55,000 to $64,999 | 0 (0.0%) | 4 (6.6%) |
| $65,000 to $74,999 | 0 (0.0%) | 0 (0.0%) |
| $75,000 to $99,999 | 0 (0.0%) | 0 (0.0%) |
| $100,000+ | 0 (0.0%) | 0 (0.0%) |
| Total | 0 (0.0%) | 61 (100.0%) |
Earnings by Sex by Educational Attainment in Los Alvarez
| Educational Attainment | Male Income | Female Income |
| Less than High School | - | - |
| High School Diploma | - | - |
| College or Associate's Degree | - | - |
| Bachelor's Degree | - | - |
| Graduate Degree | - | - |
| Total | - | - |
Family Income in Los Alvarez
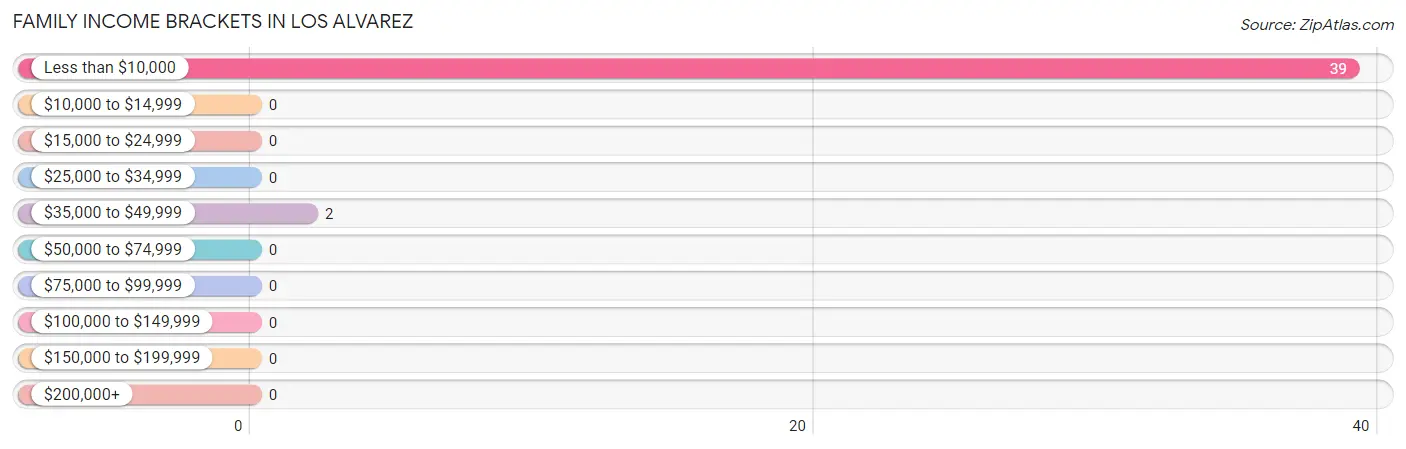
Family Income Brackets in Los Alvarez
According to the Los Alvarez family income data, there are 39 families falling into the less than $10,000 income range, which is the most common income bracket and makes up 95.1% of all families.
| Income Bracket | # Families | % Families |
| Less than $10,000 | 39 | 95.1% |
| $10,000 to $14,999 | 0 | 0.0% |
| $15,000 to $24,999 | 0 | 0.0% |
| $25,000 to $34,999 | 0 | 0.0% |
| $35,000 to $49,999 | 2 | 4.9% |
| $50,000 to $74,999 | 0 | 0.0% |
| $75,000 to $99,999 | 0 | 0.0% |
| $100,000 to $149,999 | 0 | 0.0% |
| $150,000 to $199,999 | 0 | 0.0% |
| $200,000+ | 0 | 0.0% |
Family Income by Famaliy Size in Los Alvarez
| Income Bracket | # Families | Median Income |
| 2-Person Families | 0 (0.0%) | $0 |
| 3-Person Families | 41 (100.0%) | $0 |
| 4-Person Families | 0 (0.0%) | $0 |
| 5-Person Families | 0 (0.0%) | $0 |
| 6-Person Families | 0 (0.0%) | $0 |
| 7+ Person Families | 0 (0.0%) | $0 |
| Total | 41 (100.0%) | $0 |
Family Income by Number of Earners in Los Alvarez
| Number of Earners | # Families | Median Income |
| No Earners | 2 (4.9%) | $0 |
| 1 Earner | 39 (95.1%) | $0 |
| 2 Earners | 0 (0.0%) | $0 |
| 3+ Earners | 0 (0.0%) | $0 |
| Total | 41 (100.0%) | $0 |
Household Income in Los Alvarez
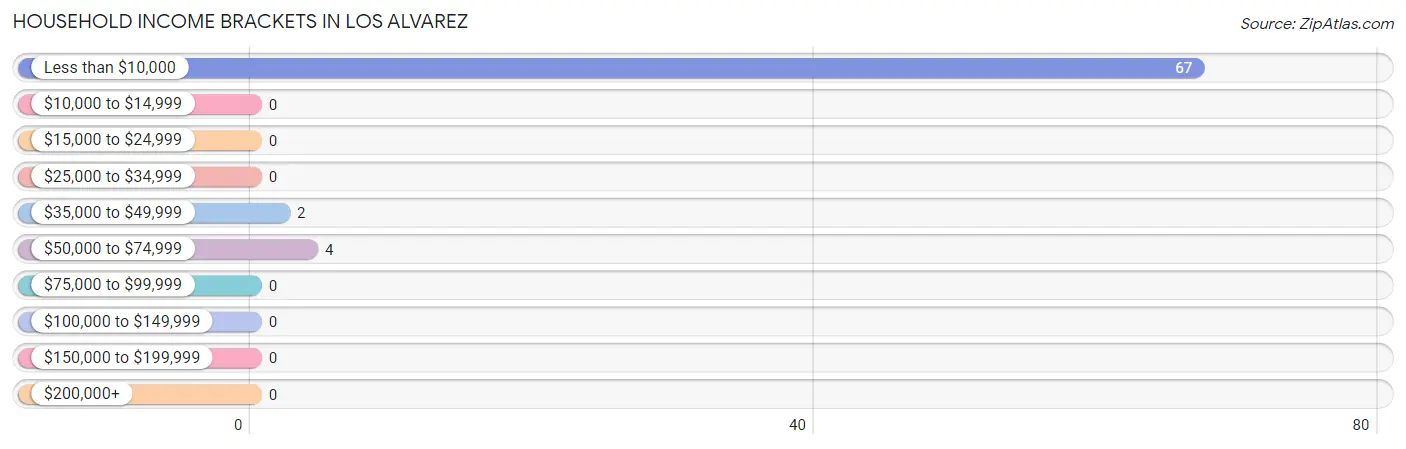
Household Income Brackets in Los Alvarez
With 67 households falling in the category, the less than $10,000 income range is the most frequent in Los Alvarez, accounting for 91.8% of all households.
| Income Bracket | # Households | % Households |
| Less than $10,000 | 67 | 91.8% |
| $10,000 to $14,999 | 0 | 0.0% |
| $15,000 to $24,999 | 0 | 0.0% |
| $25,000 to $34,999 | 0 | 0.0% |
| $35,000 to $49,999 | 2 | 2.7% |
| $50,000 to $74,999 | 4 | 5.5% |
| $75,000 to $99,999 | 0 | 0.0% |
| $100,000 to $149,999 | 0 | 0.0% |
| $150,000 to $199,999 | 0 | 0.0% |
| $200,000+ | 0 | 0.0% |
Household Income by Householder Age in Los Alvarez
The median household income in Los Alvarez is $8,862, with the highest median household income of $8,942 found in the 45 to 64 years age bracket for the primary householder. A total of 45 households (61.6%) fall into this category.
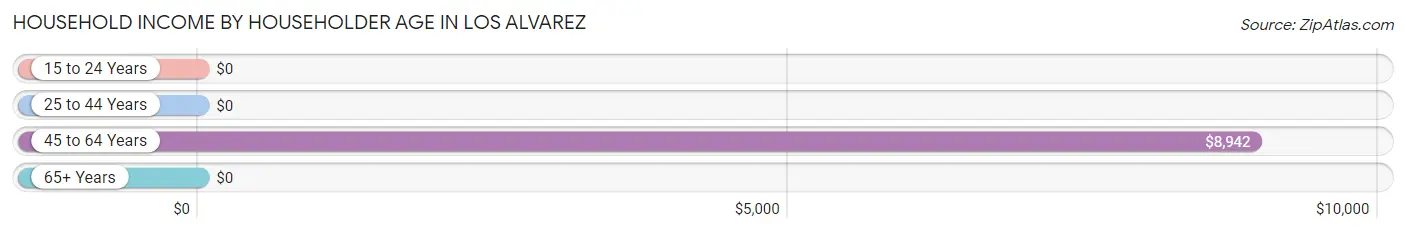
| Income Bracket | # Households | Median Income |
| 15 to 24 Years | 0 (0.0%) | $0 |
| 25 to 44 Years | 0 (0.0%) | $0 |
| 45 to 64 Years | 45 (61.6%) | $8,942 |
| 65+ Years | 28 (38.4%) | $0 |
| Total | 73 (100.0%) | $8,862 |
Poverty in Los Alvarez
Income Below Poverty by Sex and Age in Los Alvarez
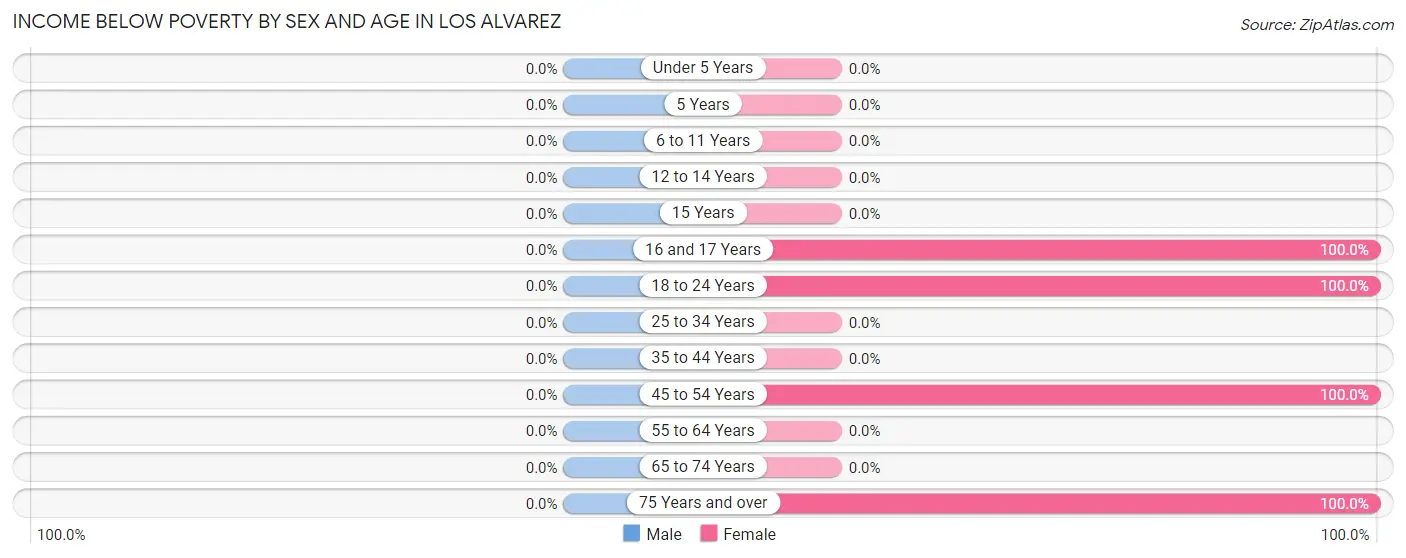
| Age Bracket | Male | Female |
| Under 5 Years | 0 (0.0%) | 0 (0.0%) |
| 5 Years | 0 (0.0%) | 0 (0.0%) |
| 6 to 11 Years | 0 (0.0%) | 0 (0.0%) |
| 12 to 14 Years | 0 (0.0%) | 0 (0.0%) |
| 15 Years | 0 (0.0%) | 0 (0.0%) |
| 16 and 17 Years | 0 (0.0%) | 46 (100.0%) |
| 18 to 24 Years | 0 (0.0%) | 57 (100.0%) |
| 25 to 34 Years | 0 (0.0%) | 0 (0.0%) |
| 35 to 44 Years | 0 (0.0%) | 0 (0.0%) |
| 45 to 54 Years | 0 (0.0%) | 39 (100.0%) |
| 55 to 64 Years | 0 (0.0%) | 0 (0.0%) |
| 65 to 74 Years | 0 (0.0%) | 0 (0.0%) |
| 75 Years and over | 0 (0.0%) | 28 (100.0%) |
| Total | 0 (0.0%) | 170 (95.0%) |
Income Above Poverty by Sex and Age in Los Alvarez
According to the poverty statistics in Los Alvarez, males aged 65 to 74 years and females aged 55 to 64 years are the age groups that are most secure financially, with 100.0% of males and 100.0% of females in these age groups living above the poverty line.
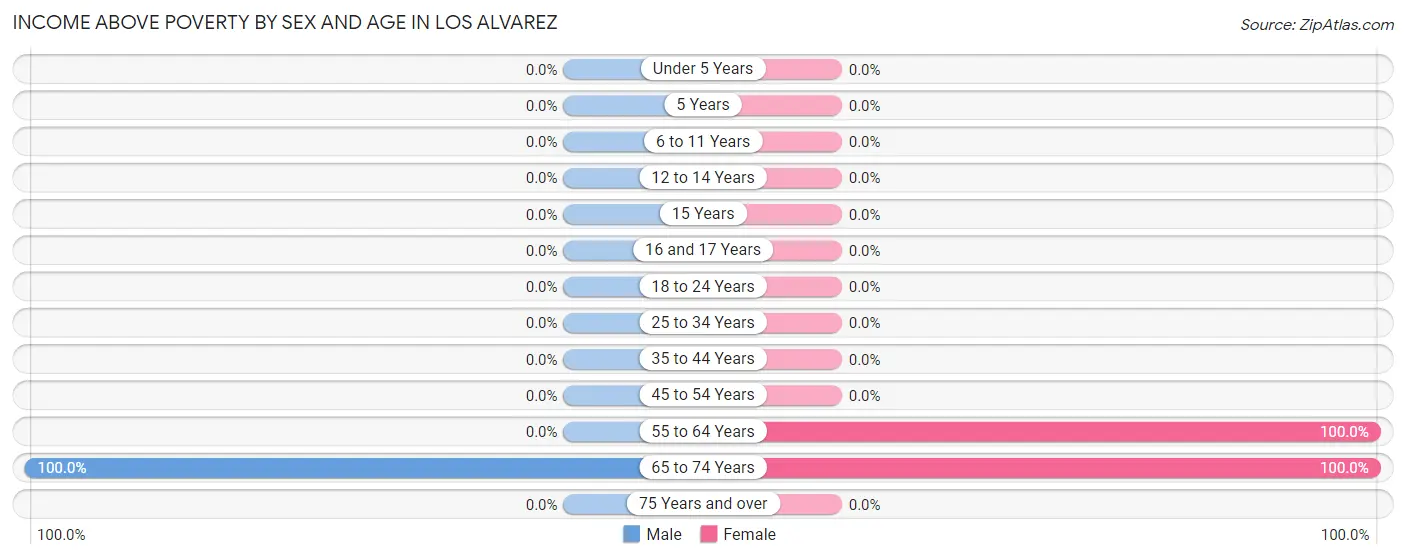
| Age Bracket | Male | Female |
| Under 5 Years | 0 (0.0%) | 0 (0.0%) |
| 5 Years | 0 (0.0%) | 0 (0.0%) |
| 6 to 11 Years | 0 (0.0%) | 0 (0.0%) |
| 12 to 14 Years | 0 (0.0%) | 0 (0.0%) |
| 15 Years | 0 (0.0%) | 0 (0.0%) |
| 16 and 17 Years | 0 (0.0%) | 0 (0.0%) |
| 18 to 24 Years | 0 (0.0%) | 0 (0.0%) |
| 25 to 34 Years | 0 (0.0%) | 0 (0.0%) |
| 35 to 44 Years | 0 (0.0%) | 0 (0.0%) |
| 45 to 54 Years | 0 (0.0%) | 0 (0.0%) |
| 55 to 64 Years | 0 (0.0%) | 6 (100.0%) |
| 65 to 74 Years | 2 (100.0%) | 3 (100.0%) |
| 75 Years and over | 0 (0.0%) | 0 (0.0%) |
| Total | 2 (100.0%) | 9 (5.0%) |
Income Below Poverty Among Married-Couple Families in Los Alvarez
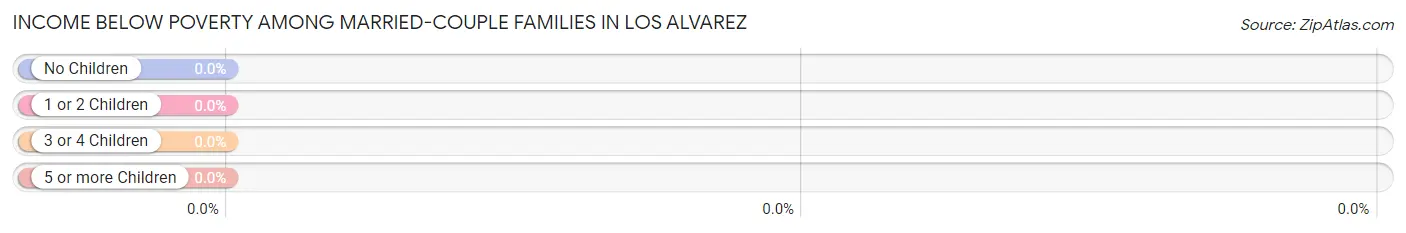
| Children | Above Poverty | Below Poverty |
| No Children | 2 (100.0%) | 0 (0.0%) |
| 1 or 2 Children | 0 (0.0%) | 0 (0.0%) |
| 3 or 4 Children | 0 (0.0%) | 0 (0.0%) |
| 5 or more Children | 0 (0.0%) | 0 (0.0%) |
| Total | 2 (100.0%) | 0 (0.0%) |
Income Below Poverty Among Single-Parent Households in Los Alvarez
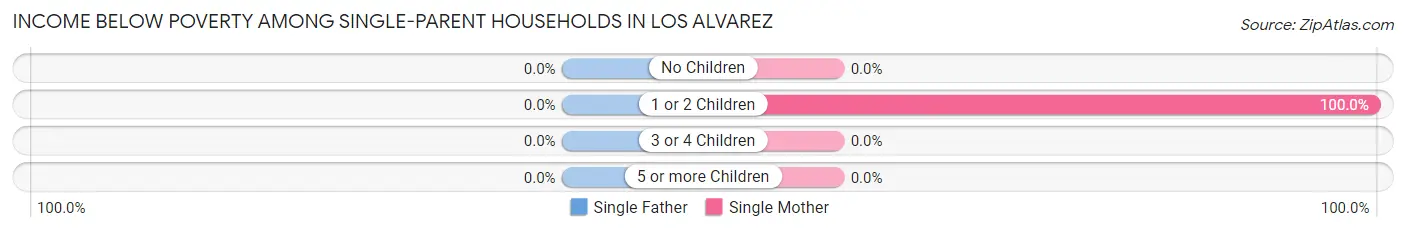
| Children | Single Father | Single Mother |
| No Children | 0 (0.0%) | 0 (0.0%) |
| 1 or 2 Children | 0 (0.0%) | 39 (100.0%) |
| 3 or 4 Children | 0 (0.0%) | 0 (0.0%) |
| 5 or more Children | 0 (0.0%) | 0 (0.0%) |
| Total | 0 (0.0%) | 39 (100.0%) |
Income Below Poverty Among Married-Couple vs Single-Parent Households in Los Alvarez
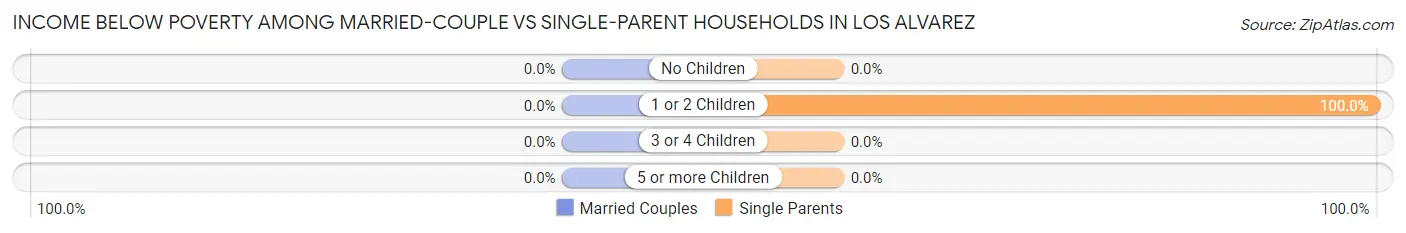
| Children | Married-Couple Families | Single-Parent Households |
| No Children | 0 (0.0%) | 0 (0.0%) |
| 1 or 2 Children | 0 (0.0%) | 39 (100.0%) |
| 3 or 4 Children | 0 (0.0%) | 0 (0.0%) |
| 5 or more Children | 0 (0.0%) | 0 (0.0%) |
| Total | 0 (0.0%) | 39 (100.0%) |
Race in Los Alvarez
The most populous races in Los Alvarez are Hispanic or Latino (181 | 100.0%), Two or more Races (175 | 96.7%), and White / Caucasian (4 | 2.2%).
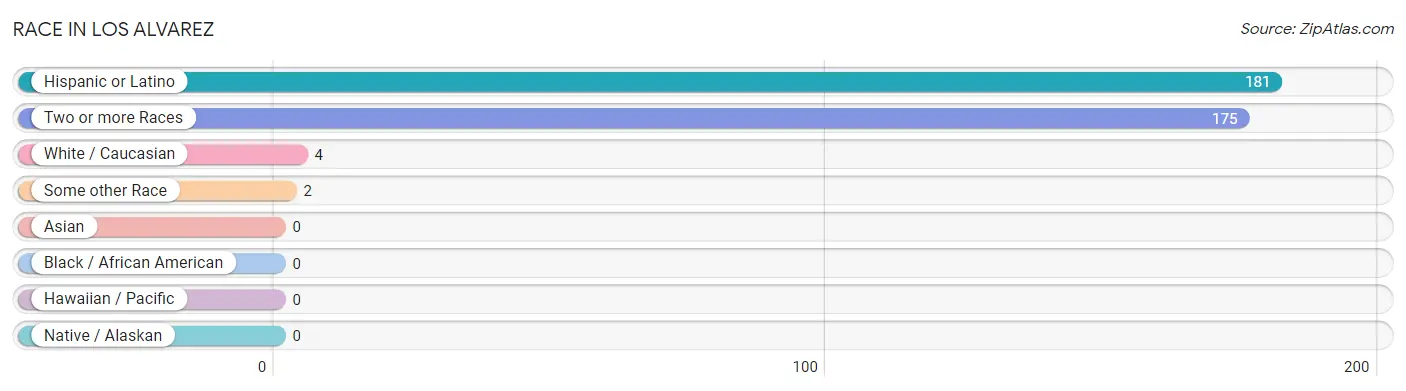
| Race | # Population | % Population |
| Asian | 0 | 0.0% |
| Black / African American | 0 | 0.0% |
| Hawaiian / Pacific | 0 | 0.0% |
| Hispanic or Latino | 181 | 100.0% |
| Native / Alaskan | 0 | 0.0% |
| White / Caucasian | 4 | 2.2% |
| Two or more Races | 175 | 96.7% |
| Some other Race | 2 | 1.1% |
| Total | 181 | 100.0% |
Ancestry in Los Alvarez
The most populous ancestries reported in Los Alvarez are , and Mexican (181 | 100.0%), together accounting for 100.0% of all Los Alvarez residents.

| Ancestry | # Population | % Population |
| Mexican | 181 | 100.0% | View All 1 Rows |
Immigrants in Los Alvarez
The most numerous immigrant groups reported in Los Alvarez came from Central America (71 | 39.2%), Latin America (71 | 39.2%), and Mexico (71 | 39.2%), together accounting for 117.7% of all Los Alvarez residents.
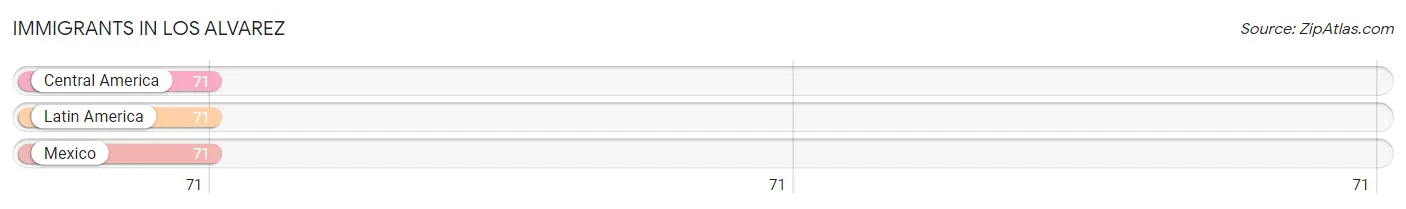
| Immigration Origin | # Population | % Population |
| Central America | 71 | 39.2% |
| Latin America | 71 | 39.2% |
| Mexico | 71 | 39.2% | View All 3 Rows |
Sex and Age in Los Alvarez
Sex and Age in Los Alvarez
The most populous age groups in Los Alvarez are 65 to 69 Years (2 | 100.0%) for men and 20 to 24 Years (57 | 31.8%) for women.
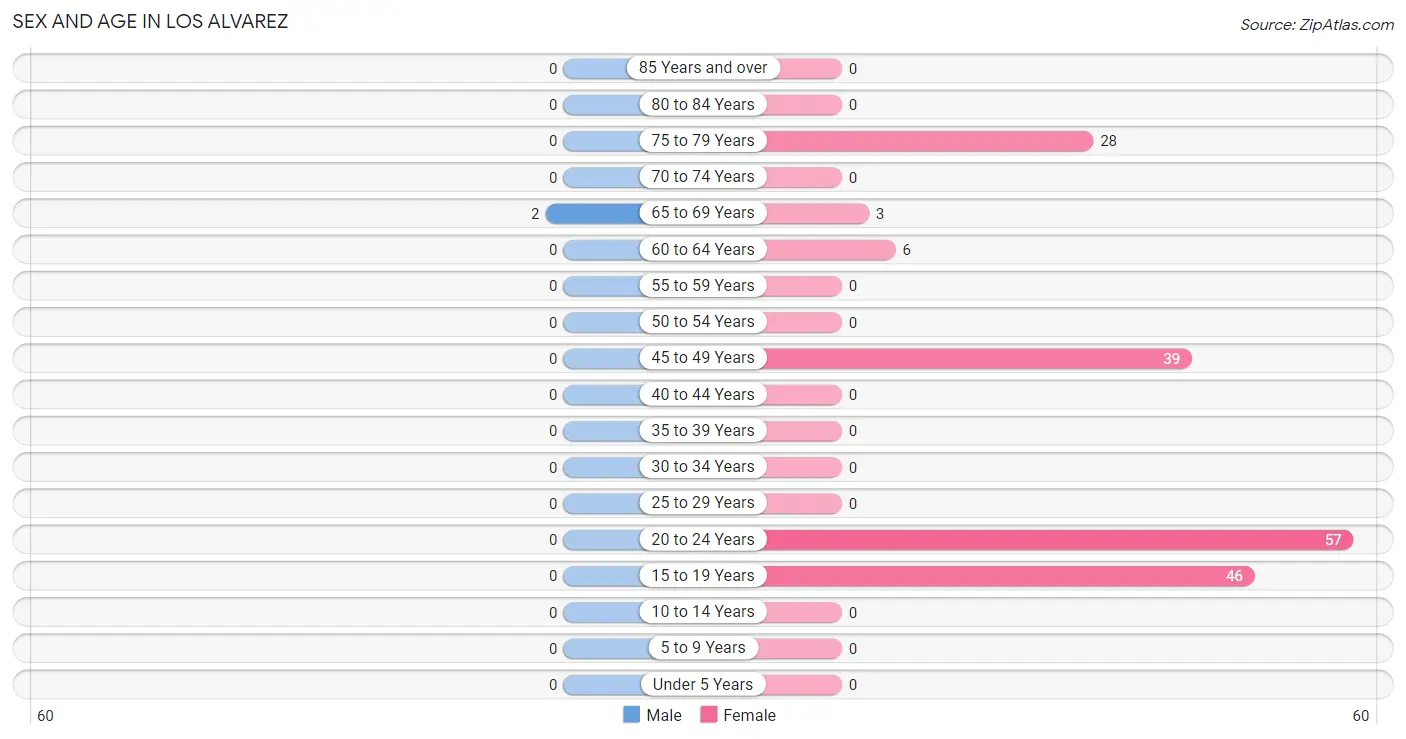
| Age Bracket | Male | Female |
| Under 5 Years | 0 (0.0%) | 0 (0.0%) |
| 5 to 9 Years | 0 (0.0%) | 0 (0.0%) |
| 10 to 14 Years | 0 (0.0%) | 0 (0.0%) |
| 15 to 19 Years | 0 (0.0%) | 46 (25.7%) |
| 20 to 24 Years | 0 (0.0%) | 57 (31.8%) |
| 25 to 29 Years | 0 (0.0%) | 0 (0.0%) |
| 30 to 34 Years | 0 (0.0%) | 0 (0.0%) |
| 35 to 39 Years | 0 (0.0%) | 0 (0.0%) |
| 40 to 44 Years | 0 (0.0%) | 0 (0.0%) |
| 45 to 49 Years | 0 (0.0%) | 39 (21.8%) |
| 50 to 54 Years | 0 (0.0%) | 0 (0.0%) |
| 55 to 59 Years | 0 (0.0%) | 0 (0.0%) |
| 60 to 64 Years | 0 (0.0%) | 6 (3.4%) |
| 65 to 69 Years | 2 (100.0%) | 3 (1.7%) |
| 70 to 74 Years | 0 (0.0%) | 0 (0.0%) |
| 75 to 79 Years | 0 (0.0%) | 28 (15.6%) |
| 80 to 84 Years | 0 (0.0%) | 0 (0.0%) |
| 85 Years and over | 0 (0.0%) | 0 (0.0%) |
| Total | 2 (100.0%) | 179 (100.0%) |
Families and Households in Los Alvarez
Median Family Size in Los Alvarez
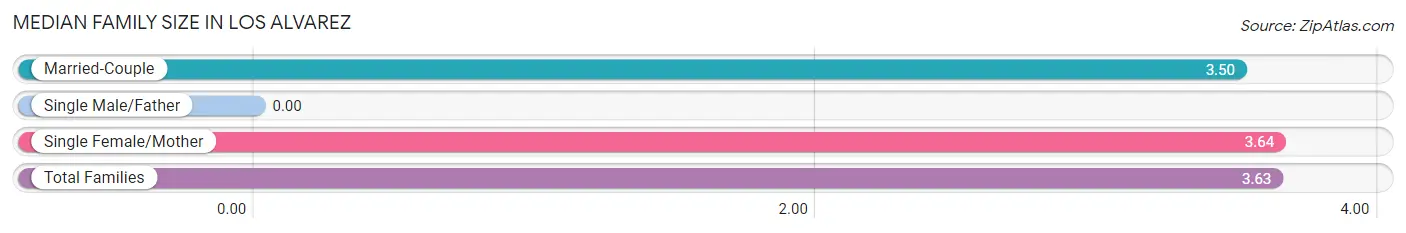
| Family Type | # Families | Family Size |
| Married-Couple | 2 (4.9%) | 3.50 |
| Single Male/Father | 0 (0.0%) | - |
| Single Female/Mother | 39 (95.1%) | 3.64 |
| Total Families | 41 (100.0%) | 3.63 |
Median Household Size in Los Alvarez
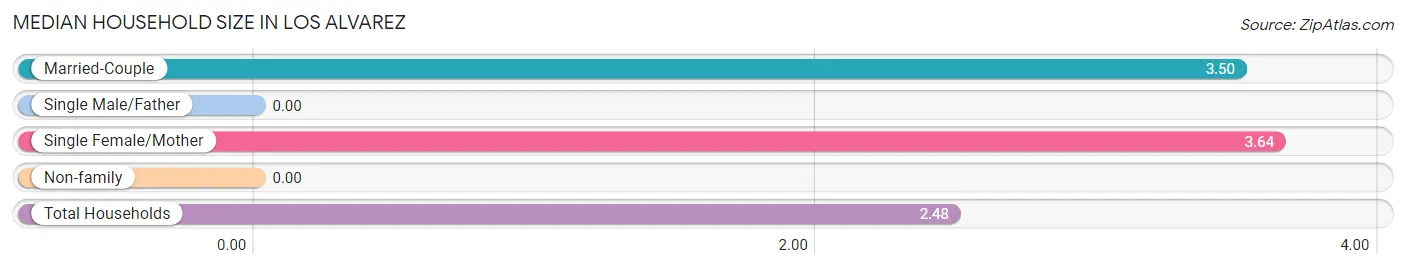
| Household Type | # Households | Household Size |
| Married-Couple | 2 (2.7%) | 3.50 |
| Single Male/Father | 0 (0.0%) | - |
| Single Female/Mother | 39 (53.4%) | 3.64 |
| Non-family | 32 (43.8%) | - |
| Total Households | 73 (100.0%) | 2.48 |
Household Size by Marriage Status in Los Alvarez
Out of a total of 73 households in Los Alvarez, 41 (56.2%) are family households, while 32 (43.8%) are nonfamily households. The most numerous type of family households are 3-person households, comprising 41, and the most common type of nonfamily households are 1-person households, comprising 32.
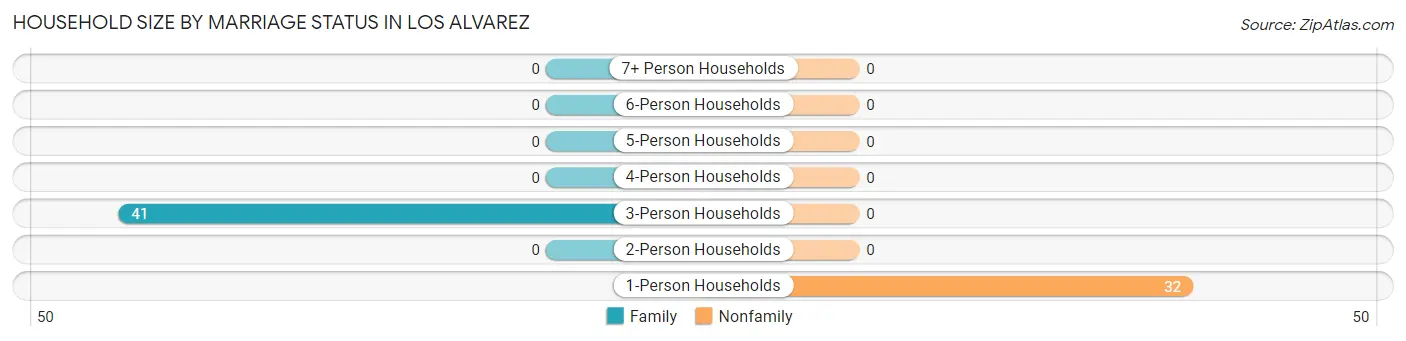
| Household Size | Family Households | Nonfamily Households |
| 1-Person Households | - | 32 (43.8%) |
| 2-Person Households | 0 (0.0%) | 0 (0.0%) |
| 3-Person Households | 41 (56.2%) | 0 (0.0%) |
| 4-Person Households | 0 (0.0%) | 0 (0.0%) |
| 5-Person Households | 0 (0.0%) | 0 (0.0%) |
| 6-Person Households | 0 (0.0%) | 0 (0.0%) |
| 7+ Person Households | 0 (0.0%) | 0 (0.0%) |
| Total | 41 (56.2%) | 32 (43.8%) |
Female Fertility in Los Alvarez
Fertility by Age in Los Alvarez
| Age Bracket | Women with Births | Births / 1,000 Women |
| 15 to 19 years | 0 (0.0%) | 0.0 |
| 20 to 34 years | 0 (0.0%) | 0.0 |
| 35 to 50 years | 0 (0.0%) | 0.0 |
| Total | 0 (0.0%) | 0.0 |
Fertility by Age by Marriage Status in Los Alvarez
| Age Bracket | Married | Unmarried |
| 15 to 19 years | 0 (0.0%) | 0 (0.0%) |
| 20 to 34 years | 0 (0.0%) | 0 (0.0%) |
| 35 to 50 years | 0 (0.0%) | 0 (0.0%) |
| Total | 0 (0.0%) | 0 (0.0%) |
Fertility by Education in Los Alvarez
| Educational Attainment | Women with Births | Births / 1,000 Women |
| Less than High School | 0 (0.0%) | 0.0 |
| High School Diploma | 0 (0.0%) | 0.0 |
| College or Associate's Degree | 0 (0.0%) | 0.0 |
| Bachelor's Degree | 0 (0.0%) | 0.0 |
| Graduate Degree | 0 (0.0%) | 0.0 |
| Total | 0 (0.0%) | 0.0 |
Fertility by Education by Marriage Status in Los Alvarez
| Educational Attainment | Married | Unmarried |
| Less than High School | 0 (0.0%) | 0 (0.0%) |
| High School Diploma | 0 (0.0%) | 0 (0.0%) |
| College or Associate's Degree | 0 (0.0%) | 0 (0.0%) |
| Bachelor's Degree | 0 (0.0%) | 0 (0.0%) |
| Graduate Degree | 0 (0.0%) | 0 (0.0%) |
| Total | 0 (0.0%) | 0 (0.0%) |
Employment Characteristics in Los Alvarez
Employment by Class of Employer in Los Alvarez
Among the 4 employed individuals in Los Alvarez, , and private company employees (4 | 100.0%) make up the most common classes of employment.
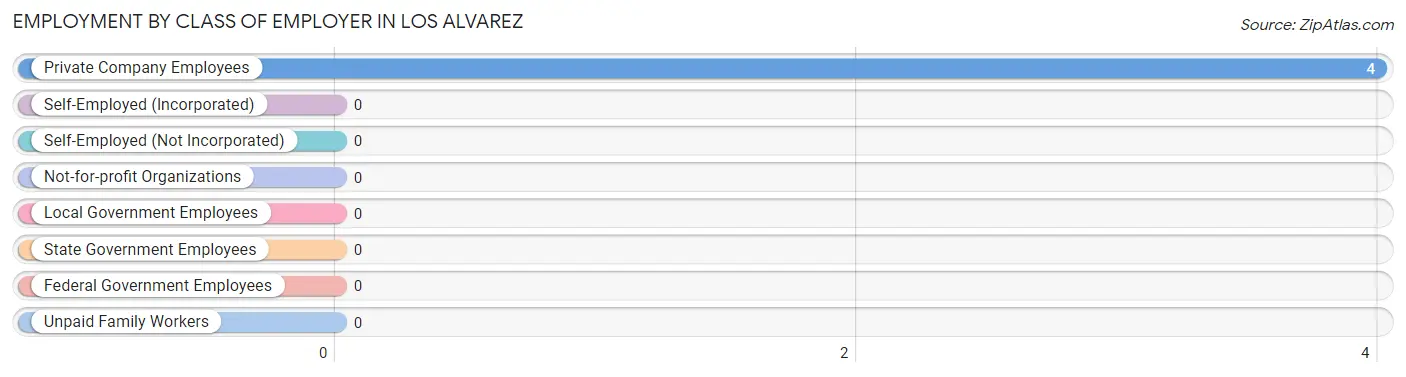
| Employer Class | # Employees | % Employees |
| Private Company Employees | 4 | 100.0% |
| Self-Employed (Incorporated) | 0 | 0.0% |
| Self-Employed (Not Incorporated) | 0 | 0.0% |
| Not-for-profit Organizations | 0 | 0.0% |
| Local Government Employees | 0 | 0.0% |
| State Government Employees | 0 | 0.0% |
| Federal Government Employees | 0 | 0.0% |
| Unpaid Family Workers | 0 | 0.0% |
| Total | 4 | 100.0% |
Employment Status by Age in Los Alvarez
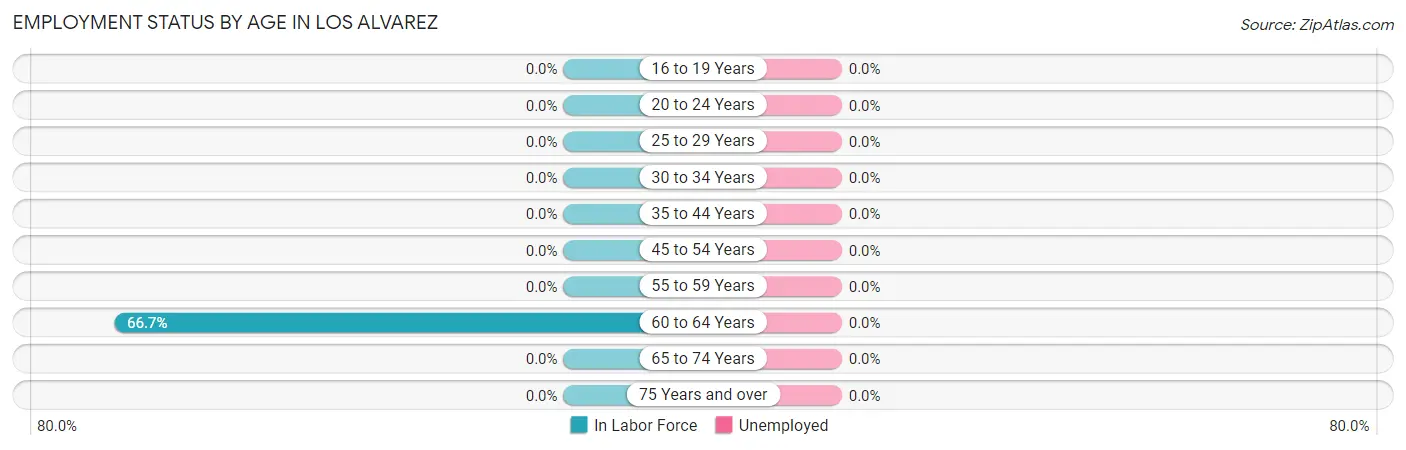
| Age Bracket | In Labor Force | Unemployed |
| 16 to 19 Years | 0 (0.0%) | 0 (0.0%) |
| 20 to 24 Years | 0 (0.0%) | 0 (0.0%) |
| 25 to 29 Years | 0 (0.0%) | 0 (0.0%) |
| 30 to 34 Years | 0 (0.0%) | 0 (0.0%) |
| 35 to 44 Years | 0 (0.0%) | 0 (0.0%) |
| 45 to 54 Years | 0 (0.0%) | 0 (0.0%) |
| 55 to 59 Years | 0 (0.0%) | 0 (0.0%) |
| 60 to 64 Years | 4 (66.7%) | 0 (0.0%) |
| 65 to 74 Years | 0 (0.0%) | 0 (0.0%) |
| 75 Years and over | 0 (0.0%) | 0 (0.0%) |
| Total | 4 (2.2%) | 0 (0.0%) |
Employment Status by Educational Attainment in Los Alvarez
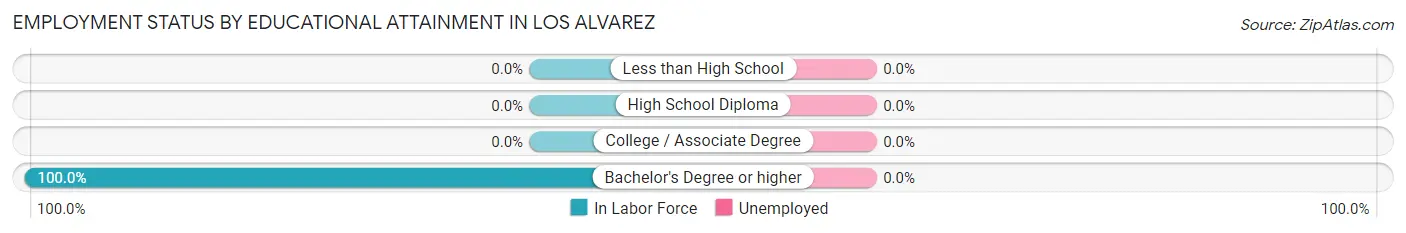
| Educational Attainment | In Labor Force | Unemployed |
| Less than High School | 0 (0.0%) | 0 (0.0%) |
| High School Diploma | 0 (0.0%) | 0 (0.0%) |
| College / Associate Degree | 0 (0.0%) | 0 (0.0%) |
| Bachelor's Degree or higher | 4 (100.0%) | 0 (0.0%) |
| Total | 4 (8.9%) | 0 (0.0%) |
Employment Occupations by Sex in Los Alvarez
Management, Business, Science and Arts Occupations
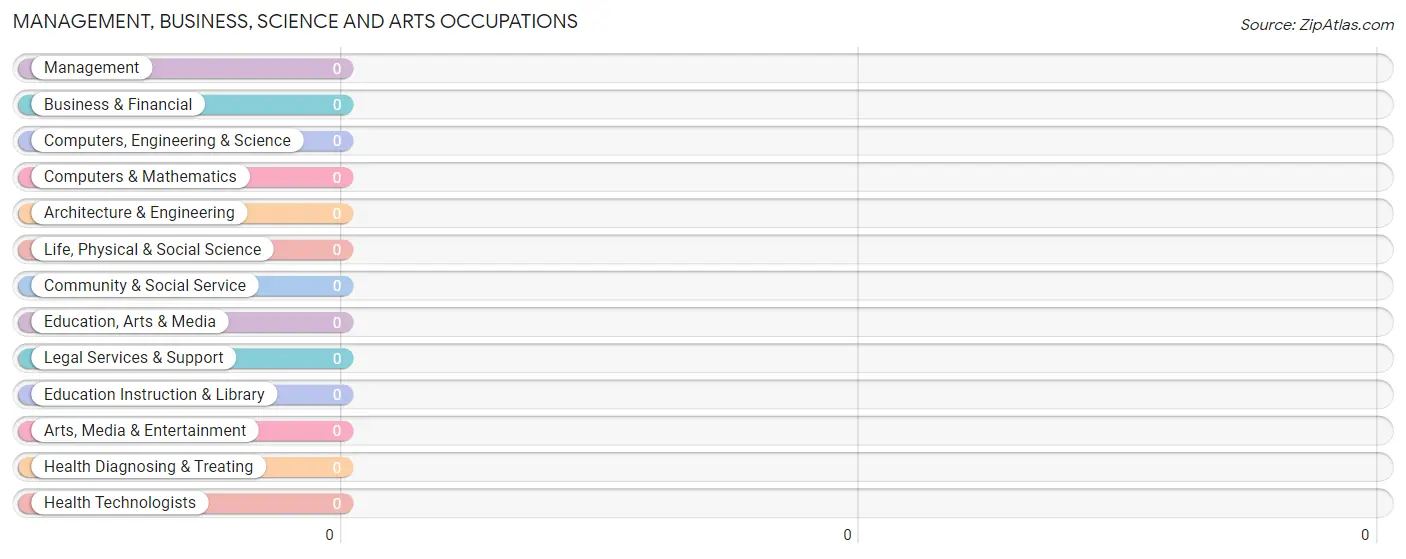
Management, Business, Science and Arts Occupations by Sex
| Occupation | Male | Female |
| Management | 0 (0.0%) | 0 (0.0%) |
| Business & Financial | 0 (0.0%) | 0 (0.0%) |
| Computers, Engineering & Science | 0 (0.0%) | 0 (0.0%) |
| Computers & Mathematics | 0 (0.0%) | 0 (0.0%) |
| Architecture & Engineering | 0 (0.0%) | 0 (0.0%) |
| Life, Physical & Social Science | 0 (0.0%) | 0 (0.0%) |
| Community & Social Service | 0 (0.0%) | 0 (0.0%) |
| Education, Arts & Media | 0 (0.0%) | 0 (0.0%) |
| Legal Services & Support | 0 (0.0%) | 0 (0.0%) |
| Education Instruction & Library | 0 (0.0%) | 0 (0.0%) |
| Arts, Media & Entertainment | 0 (0.0%) | 0 (0.0%) |
| Health Diagnosing & Treating | 0 (0.0%) | 0 (0.0%) |
| Health Technologists | 0 (0.0%) | 0 (0.0%) |
| Total (Category) | 0 (0.0%) | 0 (0.0%) |
| Total (Overall) | 0 (0.0%) | 4 (100.0%) |
Services Occupations
Services Occupations by Sex
| Occupation | Male | Female |
| Healthcare Support | 0 (0.0%) | 0 (0.0%) |
| Security & Protection | 0 (0.0%) | 0 (0.0%) |
| Firefighting & Prevention | 0 (0.0%) | 0 (0.0%) |
| Law Enforcement | 0 (0.0%) | 0 (0.0%) |
| Food Preparation & Serving | 0 (0.0%) | 0 (0.0%) |
| Cleaning & Maintenance | 0 (0.0%) | 0 (0.0%) |
| Personal Care & Service | 0 (0.0%) | 0 (0.0%) |
| Total (Category) | 0 (0.0%) | 0 (0.0%) |
| Total (Overall) | 0 (0.0%) | 4 (100.0%) |
Sales and Office Occupations
The most common Sales and Office occupations in Los Alvarez are , and Office & Administration (4 | 100.0%).
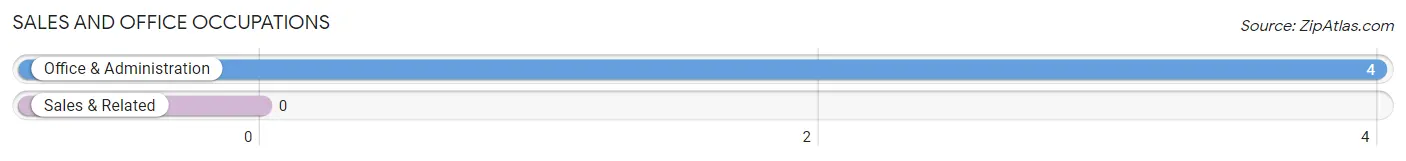
Sales and Office Occupations by Sex
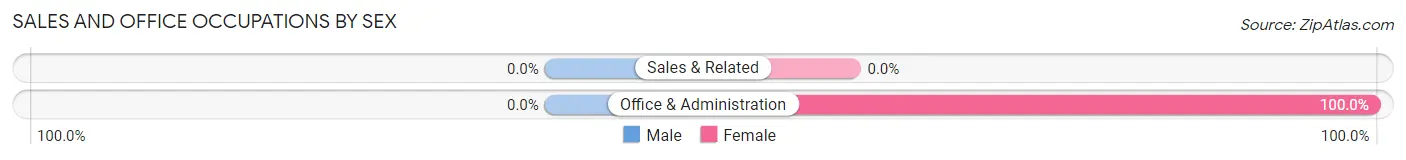
| Occupation | Male | Female |
| Sales & Related | 0 (0.0%) | 0 (0.0%) |
| Office & Administration | 0 (0.0%) | 4 (100.0%) |
| Total (Category) | 0 (0.0%) | 4 (100.0%) |
| Total (Overall) | 0 (0.0%) | 4 (100.0%) |
Natural Resources, Construction and Maintenance Occupations
Natural Resources, Construction and Maintenance Occupations by Sex
| Occupation | Male | Female |
| Farming, Fishing & Forestry | 0 (0.0%) | 0 (0.0%) |
| Construction & Extraction | 0 (0.0%) | 0 (0.0%) |
| Installation, Maintenance & Repair | 0 (0.0%) | 0 (0.0%) |
| Total (Category) | 0 (0.0%) | 0 (0.0%) |
| Total (Overall) | 0 (0.0%) | 4 (100.0%) |
Production, Transportation and Moving Occupations
Production, Transportation and Moving Occupations by Sex
| Occupation | Male | Female |
| Production | 0 (0.0%) | 0 (0.0%) |
| Transportation | 0 (0.0%) | 0 (0.0%) |
| Material Moving | 0 (0.0%) | 0 (0.0%) |
| Total (Category) | 0 (0.0%) | 0 (0.0%) |
| Total (Overall) | 0 (0.0%) | 4 (100.0%) |
Employment Industries by Sex in Los Alvarez
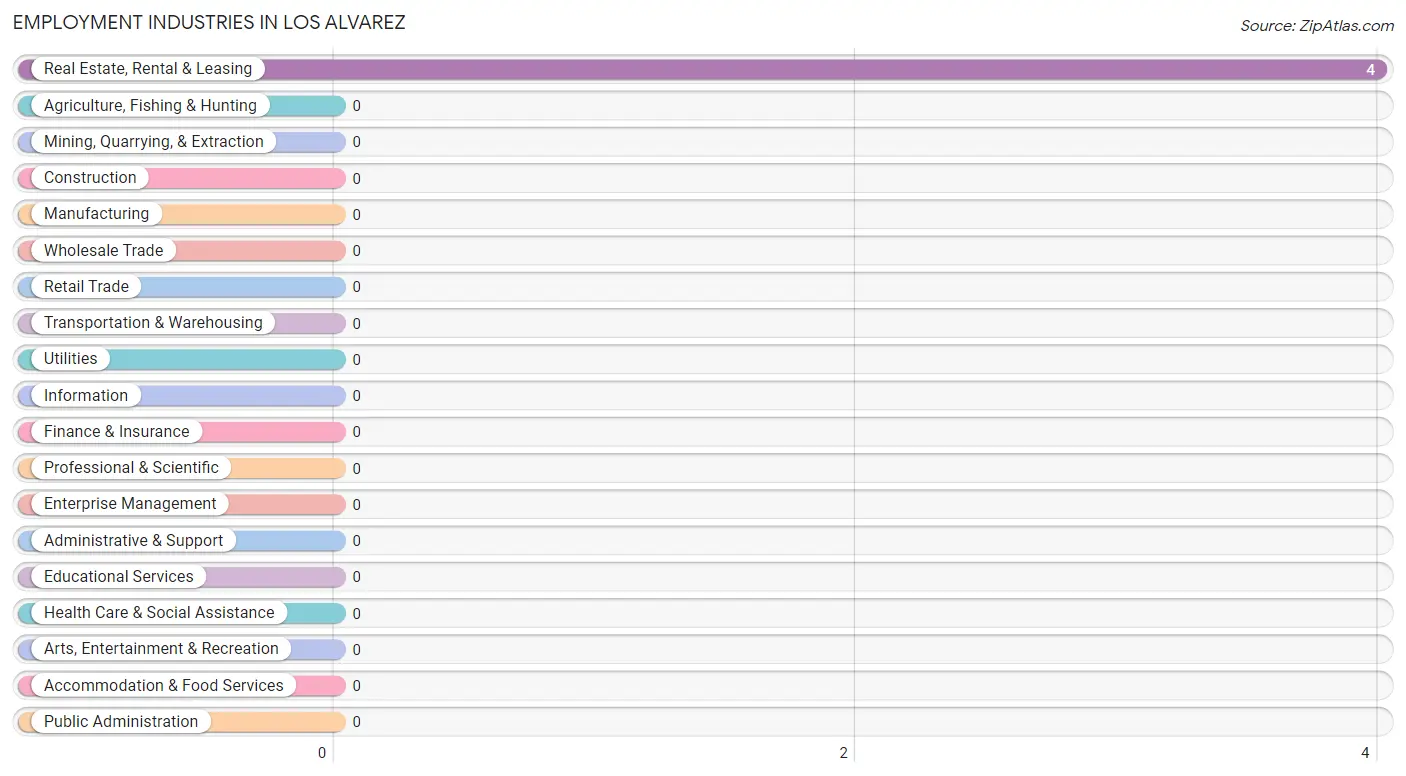
Employment Industries in Los Alvarez
The major employment industries in Los Alvarez include , and Real Estate, Rental & Leasing (4 | 100.0%).
Employment Industries by Sex in Los Alvarez
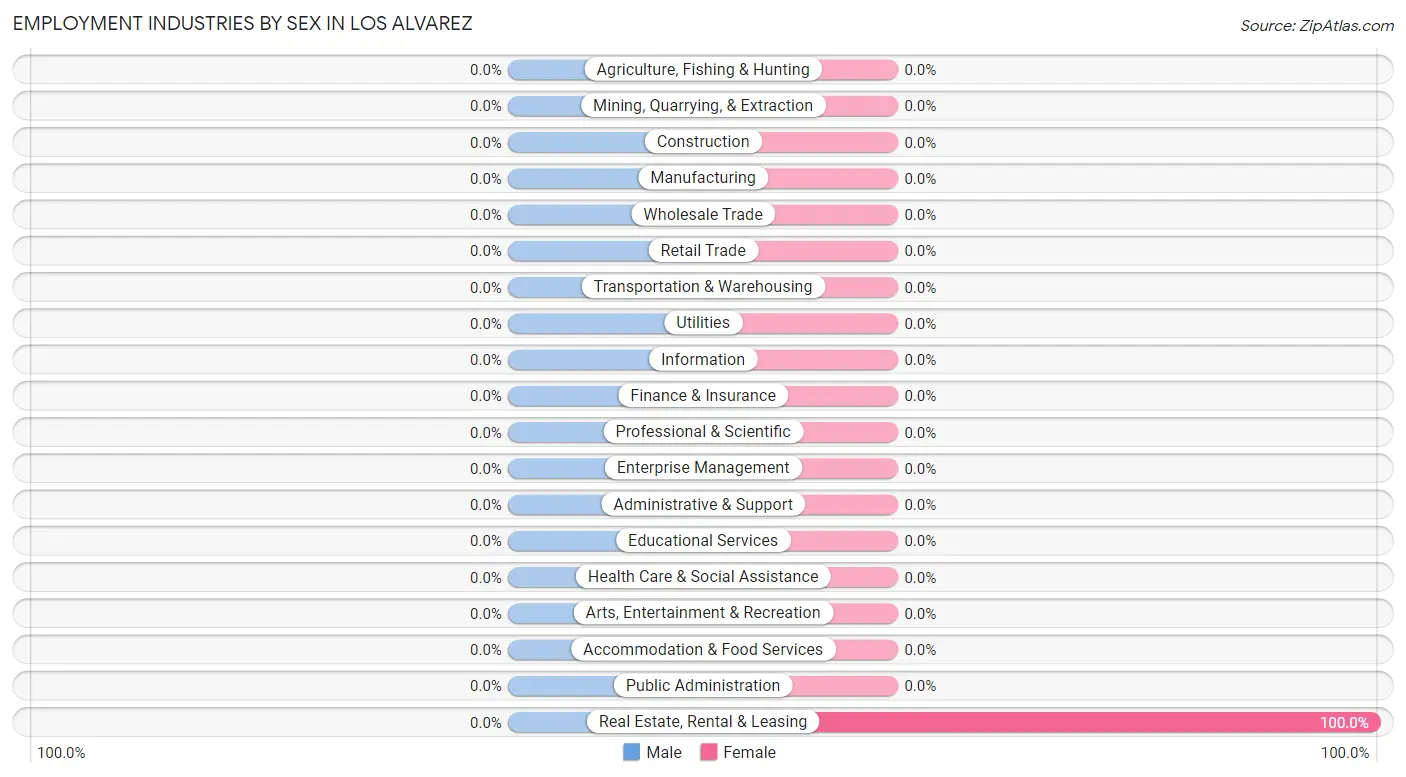
| Industry | Male | Female |
| Agriculture, Fishing & Hunting | 0 (0.0%) | 0 (0.0%) |
| Mining, Quarrying, & Extraction | 0 (0.0%) | 0 (0.0%) |
| Construction | 0 (0.0%) | 0 (0.0%) |
| Manufacturing | 0 (0.0%) | 0 (0.0%) |
| Wholesale Trade | 0 (0.0%) | 0 (0.0%) |
| Retail Trade | 0 (0.0%) | 0 (0.0%) |
| Transportation & Warehousing | 0 (0.0%) | 0 (0.0%) |
| Utilities | 0 (0.0%) | 0 (0.0%) |
| Information | 0 (0.0%) | 0 (0.0%) |
| Finance & Insurance | 0 (0.0%) | 0 (0.0%) |
| Real Estate, Rental & Leasing | 0 (0.0%) | 4 (100.0%) |
| Professional & Scientific | 0 (0.0%) | 0 (0.0%) |
| Enterprise Management | 0 (0.0%) | 0 (0.0%) |
| Administrative & Support | 0 (0.0%) | 0 (0.0%) |
| Educational Services | 0 (0.0%) | 0 (0.0%) |
| Health Care & Social Assistance | 0 (0.0%) | 0 (0.0%) |
| Arts, Entertainment & Recreation | 0 (0.0%) | 0 (0.0%) |
| Accommodation & Food Services | 0 (0.0%) | 0 (0.0%) |
| Public Administration | 0 (0.0%) | 0 (0.0%) |
| Total | 0 (0.0%) | 4 (100.0%) |
Education in Los Alvarez
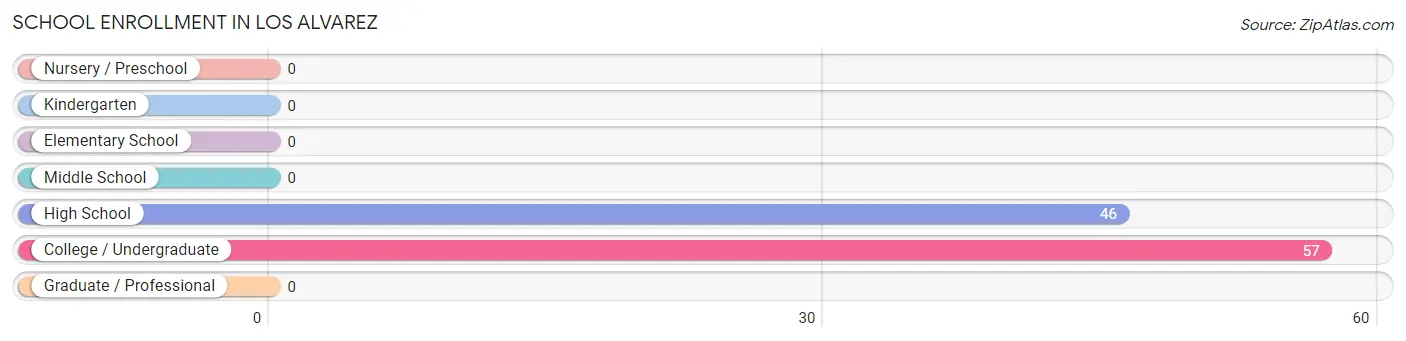
School Enrollment in Los Alvarez
The most common levels of schooling among the 103 students in Los Alvarez are college / undergraduate (57 | 55.3%), and high school (46 | 44.7%).
| School Level | # Students | % Students |
| Nursery / Preschool | 0 | 0.0% |
| Kindergarten | 0 | 0.0% |
| Elementary School | 0 | 0.0% |
| Middle School | 0 | 0.0% |
| High School | 46 | 44.7% |
| College / Undergraduate | 57 | 55.3% |
| Graduate / Professional | 0 | 0.0% |
| Total | 103 | 100.0% |
School Enrollment by Age by Funding Source in Los Alvarez
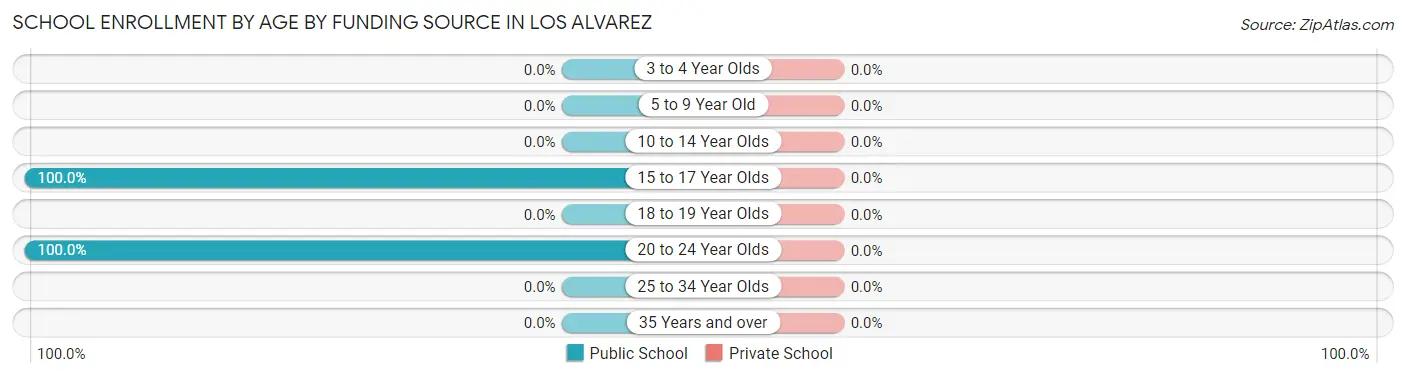
| Age Bracket | Public School | Private School |
| 3 to 4 Year Olds | 0 (0.0%) | 0 (0.0%) |
| 5 to 9 Year Old | 0 (0.0%) | 0 (0.0%) |
| 10 to 14 Year Olds | 0 (0.0%) | 0 (0.0%) |
| 15 to 17 Year Olds | 46 (100.0%) | 0 (0.0%) |
| 18 to 19 Year Olds | 0 (0.0%) | 0 (0.0%) |
| 20 to 24 Year Olds | 57 (100.0%) | 0 (0.0%) |
| 25 to 34 Year Olds | 0 (0.0%) | 0 (0.0%) |
| 35 Years and over | 0 (0.0%) | 0 (0.0%) |
| Total | 103 (100.0%) | 0 (0.0%) |
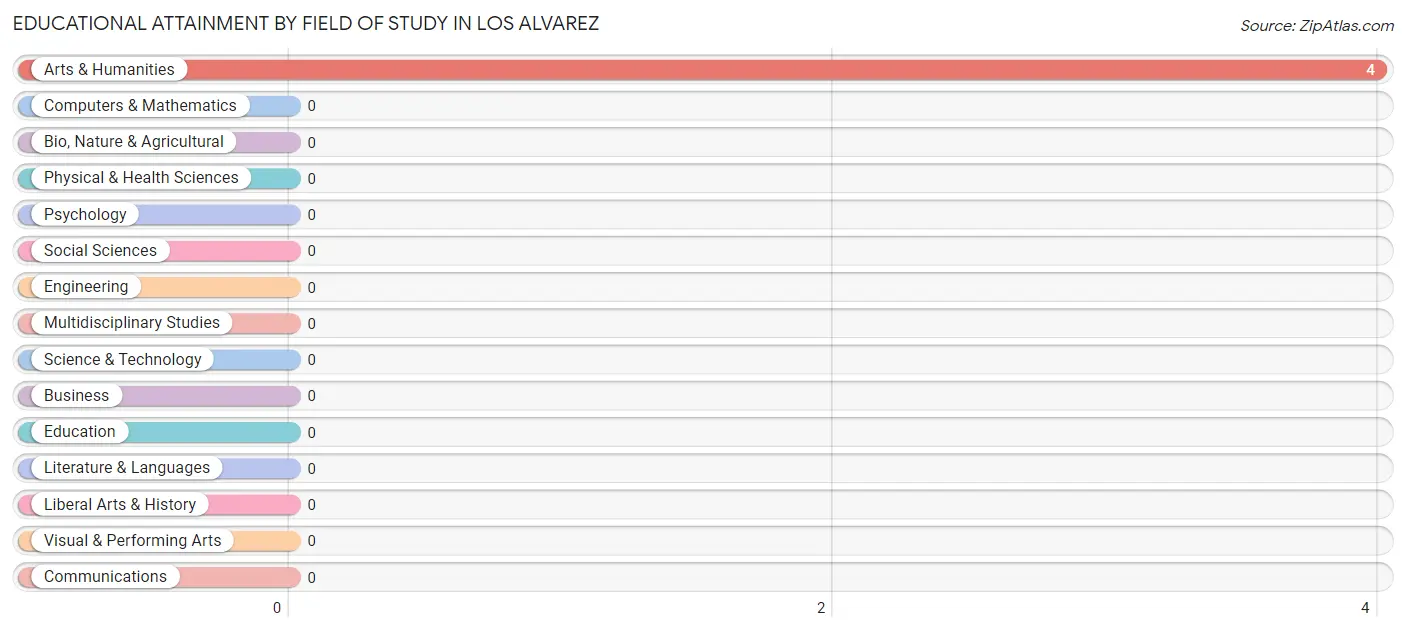
Educational Attainment by Field of Study in Los Alvarez
, and arts & humanities (4 | 100.0%) are the most common fields of study among 4 individuals in Los Alvarez who have obtained a bachelor's degree or higher.
| Field of Study | # Graduates | % Graduates |
| Computers & Mathematics | 0 | 0.0% |
| Bio, Nature & Agricultural | 0 | 0.0% |
| Physical & Health Sciences | 0 | 0.0% |
| Psychology | 0 | 0.0% |
| Social Sciences | 0 | 0.0% |
| Engineering | 0 | 0.0% |
| Multidisciplinary Studies | 0 | 0.0% |
| Science & Technology | 0 | 0.0% |
| Business | 0 | 0.0% |
| Education | 0 | 0.0% |
| Literature & Languages | 0 | 0.0% |
| Liberal Arts & History | 0 | 0.0% |
| Visual & Performing Arts | 0 | 0.0% |
| Communications | 0 | 0.0% |
| Arts & Humanities | 4 | 100.0% |
| Total | 4 | 100.0% |
Transportation & Commute in Los Alvarez
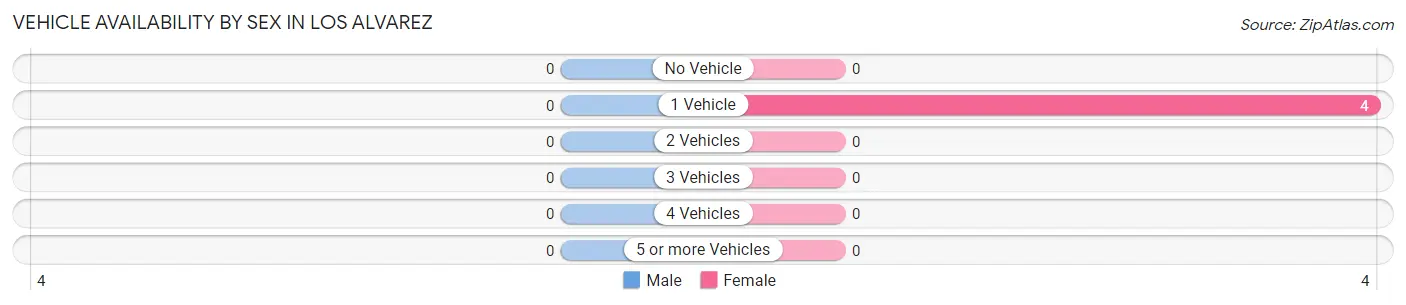
Vehicle Availability by Sex in Los Alvarez
| Vehicles Available | Male | Female |
| No Vehicle | 0 (0.0%) | 0 (0.0%) |
| 1 Vehicle | 0 (0.0%) | 4 (100.0%) |
| 2 Vehicles | 0 (0.0%) | 0 (0.0%) |
| 3 Vehicles | 0 (0.0%) | 0 (0.0%) |
| 4 Vehicles | 0 (0.0%) | 0 (0.0%) |
| 5 or more Vehicles | 0 (0.0%) | 0 (0.0%) |
| Total | 0 (0.0%) | 4 (100.0%) |
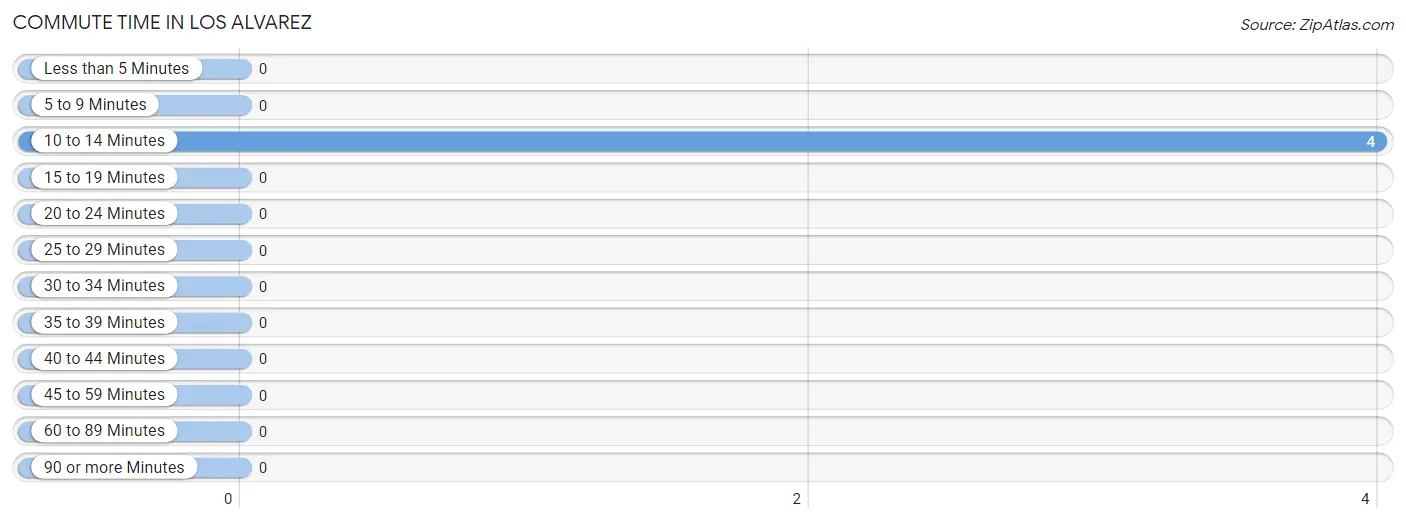
Commute Time in Los Alvarez
The most frequently occuring commute durations in Los Alvarez are 10 to 14 minutes (4 commuters, 100.0%), less than 5 minutes (0 commuters, 0.0%), and 5 to 9 minutes (0 commuters, 0.0%).
| Commute Time | # Commuters | % Commuters |
| Less than 5 Minutes | 0 | 0.0% |
| 5 to 9 Minutes | 0 | 0.0% |
| 10 to 14 Minutes | 4 | 100.0% |
| 15 to 19 Minutes | 0 | 0.0% |
| 20 to 24 Minutes | 0 | 0.0% |
| 25 to 29 Minutes | 0 | 0.0% |
| 30 to 34 Minutes | 0 | 0.0% |
| 35 to 39 Minutes | 0 | 0.0% |
| 40 to 44 Minutes | 0 | 0.0% |
| 45 to 59 Minutes | 0 | 0.0% |
| 60 to 89 Minutes | 0 | 0.0% |
| 90 or more Minutes | 0 | 0.0% |
Commute Time by Sex in Los Alvarez
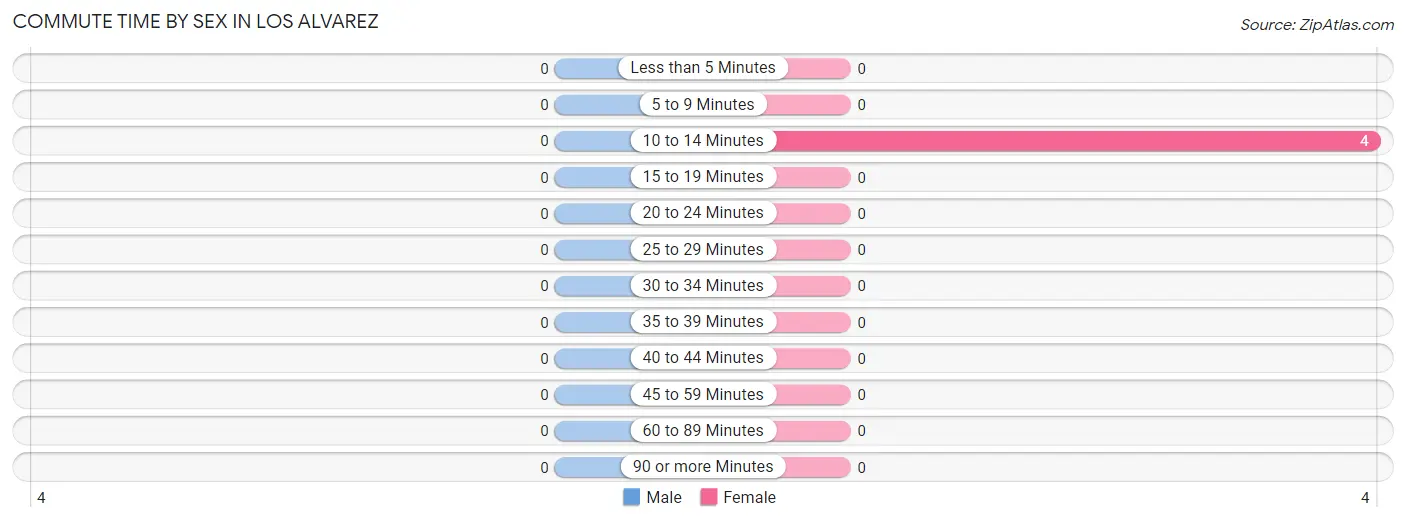
| Commute Time | Male | Female |
| Less than 5 Minutes | 0 (0.0%) | 0 (0.0%) |
| 5 to 9 Minutes | 0 (0.0%) | 0 (0.0%) |
| 10 to 14 Minutes | 0 (0.0%) | 4 (100.0%) |
| 15 to 19 Minutes | 0 (0.0%) | 0 (0.0%) |
| 20 to 24 Minutes | 0 (0.0%) | 0 (0.0%) |
| 25 to 29 Minutes | 0 (0.0%) | 0 (0.0%) |
| 30 to 34 Minutes | 0 (0.0%) | 0 (0.0%) |
| 35 to 39 Minutes | 0 (0.0%) | 0 (0.0%) |
| 40 to 44 Minutes | 0 (0.0%) | 0 (0.0%) |
| 45 to 59 Minutes | 0 (0.0%) | 0 (0.0%) |
| 60 to 89 Minutes | 0 (0.0%) | 0 (0.0%) |
| 90 or more Minutes | 0 (0.0%) | 0 (0.0%) |
Time of Departure to Work by Sex in Los Alvarez
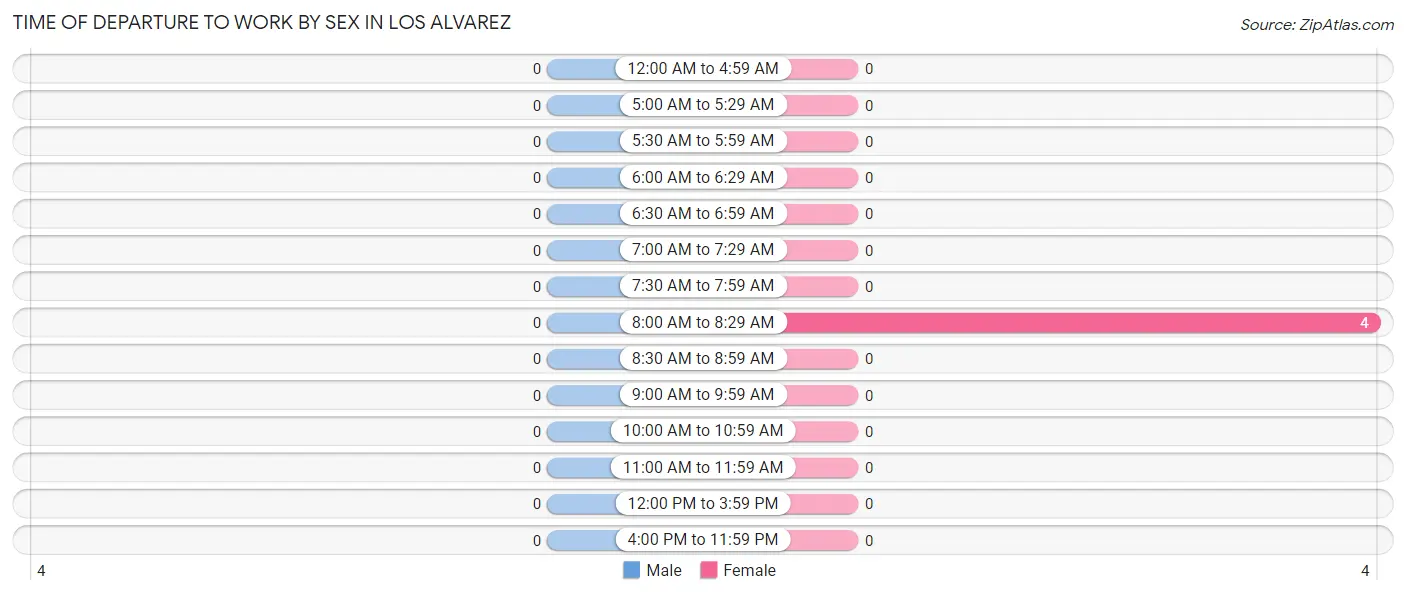
| Time of Departure | Male | Female |
| 12:00 AM to 4:59 AM | 0 (0.0%) | 0 (0.0%) |
| 5:00 AM to 5:29 AM | 0 (0.0%) | 0 (0.0%) |
| 5:30 AM to 5:59 AM | 0 (0.0%) | 0 (0.0%) |
| 6:00 AM to 6:29 AM | 0 (0.0%) | 0 (0.0%) |
| 6:30 AM to 6:59 AM | 0 (0.0%) | 0 (0.0%) |
| 7:00 AM to 7:29 AM | 0 (0.0%) | 0 (0.0%) |
| 7:30 AM to 7:59 AM | 0 (0.0%) | 0 (0.0%) |
| 8:00 AM to 8:29 AM | 0 (0.0%) | 4 (100.0%) |
| 8:30 AM to 8:59 AM | 0 (0.0%) | 0 (0.0%) |
| 9:00 AM to 9:59 AM | 0 (0.0%) | 0 (0.0%) |
| 10:00 AM to 10:59 AM | 0 (0.0%) | 0 (0.0%) |
| 11:00 AM to 11:59 AM | 0 (0.0%) | 0 (0.0%) |
| 12:00 PM to 3:59 PM | 0 (0.0%) | 0 (0.0%) |
| 4:00 PM to 11:59 PM | 0 (0.0%) | 0 (0.0%) |
| Total | 0 (0.0%) | 4 (100.0%) |
Housing Occupancy in Los Alvarez
Occupancy by Ownership in Los Alvarez
Of the total 73 dwellings in Los Alvarez, owner-occupied units account for 73 (100.0%), while renter-occupied units make up 0 (0.0%).
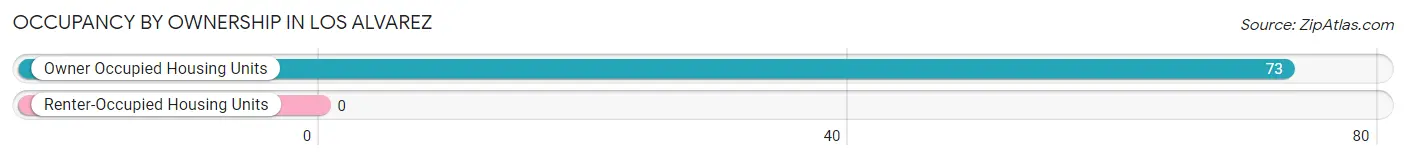
| Occupancy | # Housing Units | % Housing Units |
| Owner Occupied Housing Units | 73 | 100.0% |
| Renter-Occupied Housing Units | 0 | 0.0% |
| Total Occupied Housing Units | 73 | 100.0% |
Occupancy by Household Size in Los Alvarez
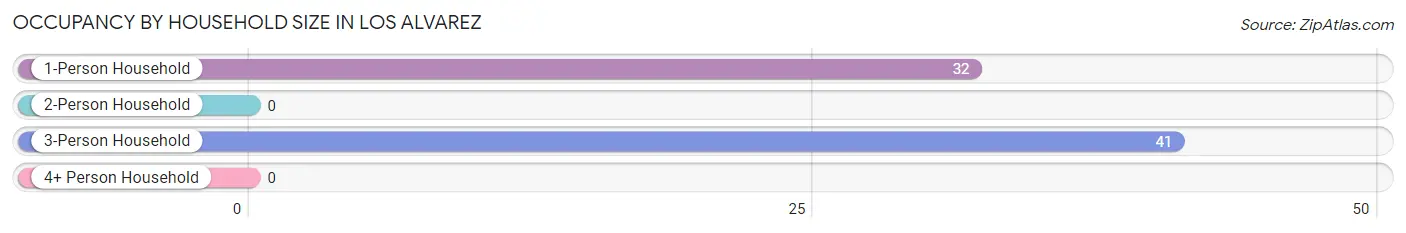
| Household Size | # Housing Units | % Housing Units |
| 1-Person Household | 32 | 43.8% |
| 2-Person Household | 0 | 0.0% |
| 3-Person Household | 41 | 56.2% |
| 4+ Person Household | 0 | 0.0% |
| Total Housing Units | 73 | 100.0% |
Occupancy by Ownership by Household Size in Los Alvarez
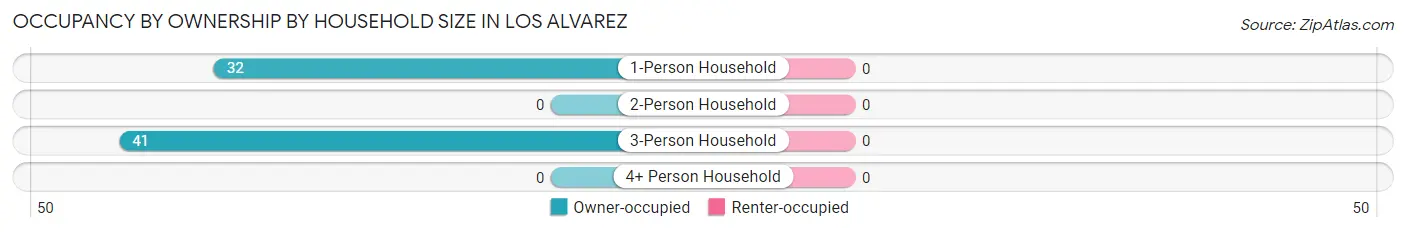
| Household Size | Owner-occupied | Renter-occupied |
| 1-Person Household | 32 (100.0%) | 0 (0.0%) |
| 2-Person Household | 0 (0.0%) | 0 (0.0%) |
| 3-Person Household | 41 (100.0%) | 0 (0.0%) |
| 4+ Person Household | 0 (0.0%) | 0 (0.0%) |
| Total Housing Units | 73 (100.0%) | 0 (0.0%) |
Occupancy by Educational Attainment in Los Alvarez
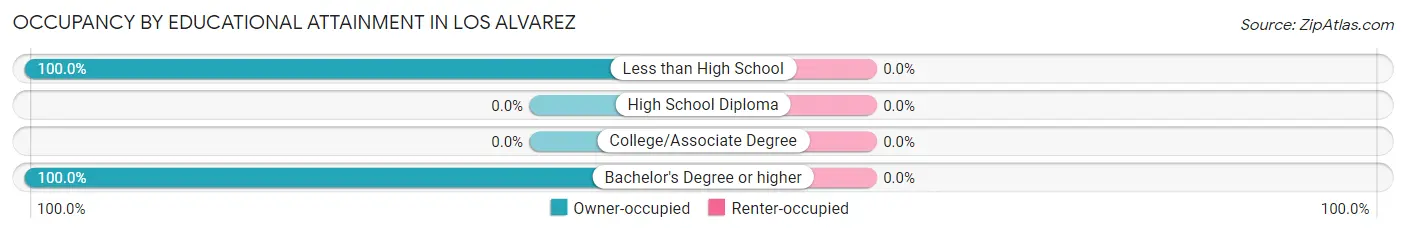
| Household Size | Owner-occupied | Renter-occupied |
| Less than High School | 69 (100.0%) | 0 (0.0%) |
| High School Diploma | 0 (0.0%) | 0 (0.0%) |
| College/Associate Degree | 0 (0.0%) | 0 (0.0%) |
| Bachelor's Degree or higher | 4 (100.0%) | 0 (0.0%) |
Occupancy by Age of Householder in Los Alvarez
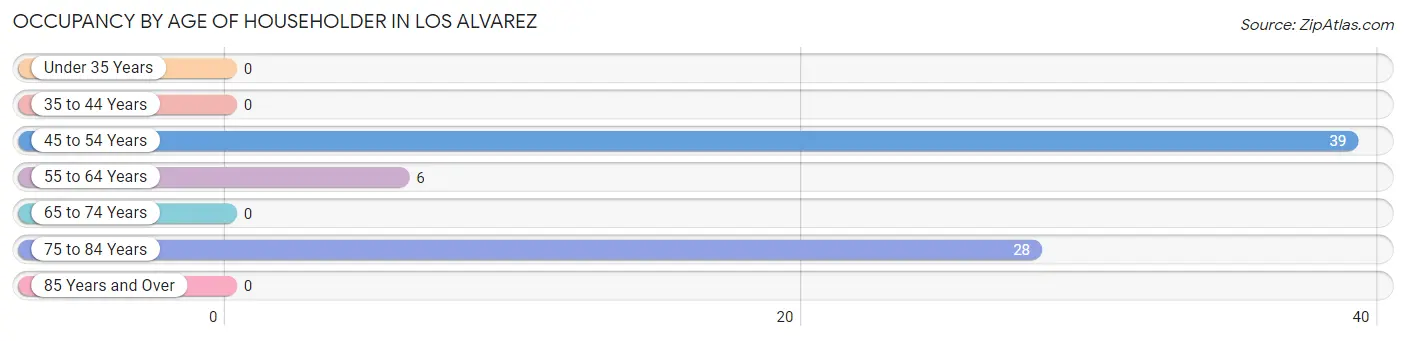
| Age Bracket | # Households | % Households |
| Under 35 Years | 0 | 0.0% |
| 35 to 44 Years | 0 | 0.0% |
| 45 to 54 Years | 39 | 53.4% |
| 55 to 64 Years | 6 | 8.2% |
| 65 to 74 Years | 0 | 0.0% |
| 75 to 84 Years | 28 | 38.4% |
| 85 Years and Over | 0 | 0.0% |
| Total | 73 | 100.0% |
Housing Finances in Los Alvarez
Median Income by Occupancy in Los Alvarez
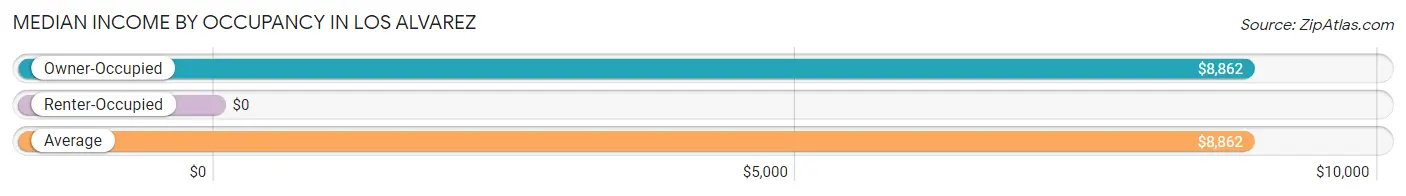
| Occupancy Type | # Households | Median Income |
| Owner-Occupied | 73 (100.0%) | $8,862 |
| Renter-Occupied | 0 (0.0%) | $0 |
| Average | 73 (100.0%) | $8,862 |
Occupancy by Householder Income Bracket in Los Alvarez
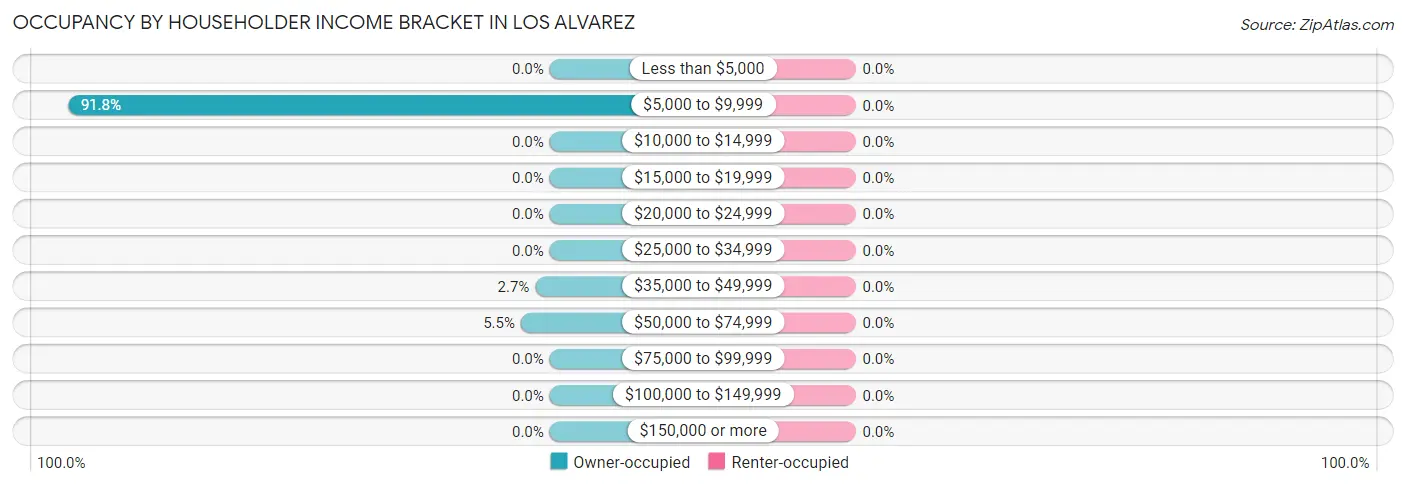
| Income Bracket | Owner-occupied | Renter-occupied |
| Less than $5,000 | 0 (0.0%) | 0 (0.0%) |
| $5,000 to $9,999 | 67 (91.8%) | 0 (0.0%) |
| $10,000 to $14,999 | 0 (0.0%) | 0 (0.0%) |
| $15,000 to $19,999 | 0 (0.0%) | 0 (0.0%) |
| $20,000 to $24,999 | 0 (0.0%) | 0 (0.0%) |
| $25,000 to $34,999 | 0 (0.0%) | 0 (0.0%) |
| $35,000 to $49,999 | 2 (2.7%) | 0 (0.0%) |
| $50,000 to $74,999 | 4 (5.5%) | 0 (0.0%) |
| $75,000 to $99,999 | 0 (0.0%) | 0 (0.0%) |
| $100,000 to $149,999 | 0 (0.0%) | 0 (0.0%) |
| $150,000 or more | 0 (0.0%) | 0 (0.0%) |
| Total | 73 (100.0%) | 0 (0.0%) |
Monthly Housing Cost Tiers in Los Alvarez
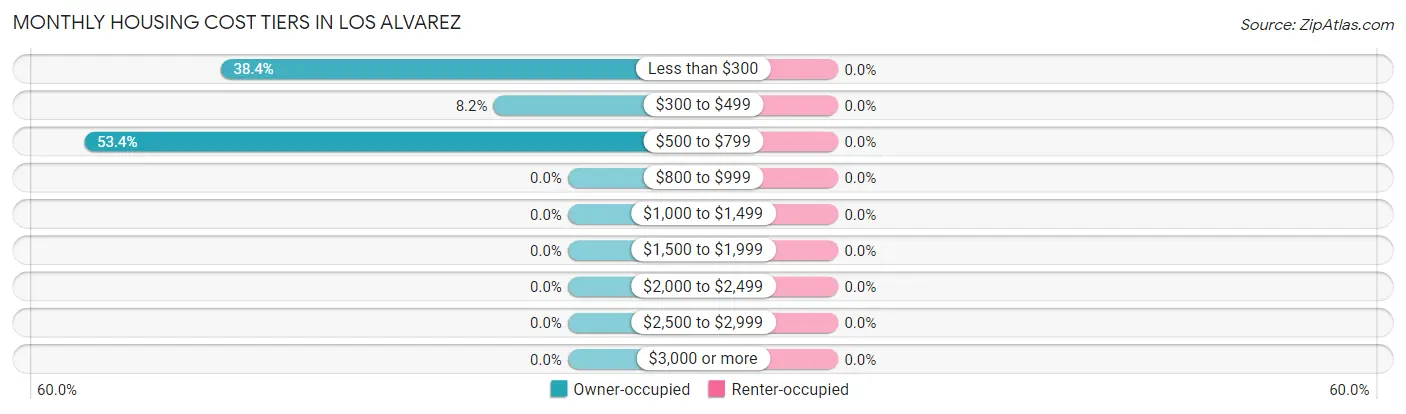
| Monthly Cost | Owner-occupied | Renter-occupied |
| Less than $300 | 28 (38.4%) | 0 (0.0%) |
| $300 to $499 | 6 (8.2%) | 0 (0.0%) |
| $500 to $799 | 39 (53.4%) | 0 (0.0%) |
| $800 to $999 | 0 (0.0%) | 0 (0.0%) |
| $1,000 to $1,499 | 0 (0.0%) | 0 (0.0%) |
| $1,500 to $1,999 | 0 (0.0%) | 0 (0.0%) |
| $2,000 to $2,499 | 0 (0.0%) | 0 (0.0%) |
| $2,500 to $2,999 | 0 (0.0%) | 0 (0.0%) |
| $3,000 or more | 0 (0.0%) | 0 (0.0%) |
| Total | 73 (100.0%) | 0 (0.0%) |
Physical Housing Characteristics in Los Alvarez
Housing Structures in Los Alvarez
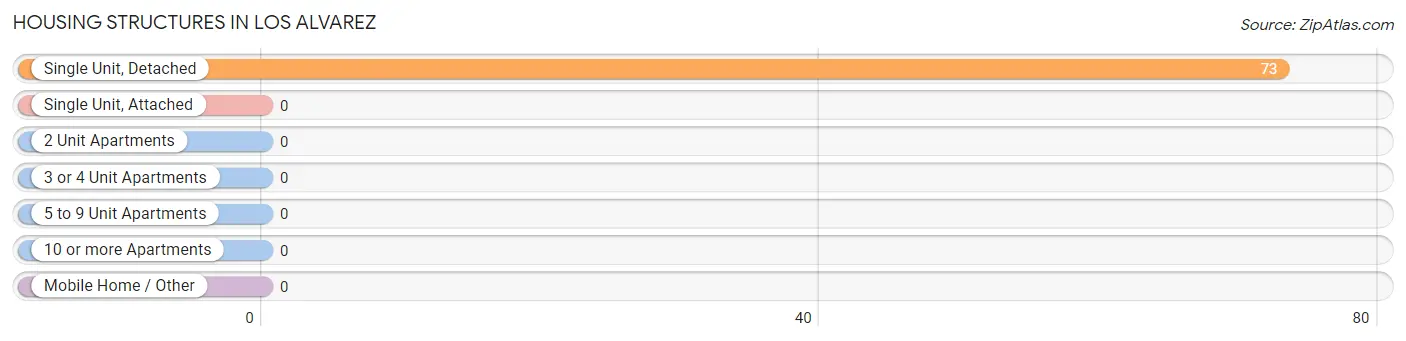
| Structure Type | # Housing Units | % Housing Units |
| Single Unit, Detached | 73 | 100.0% |
| Single Unit, Attached | 0 | 0.0% |
| 2 Unit Apartments | 0 | 0.0% |
| 3 or 4 Unit Apartments | 0 | 0.0% |
| 5 to 9 Unit Apartments | 0 | 0.0% |
| 10 or more Apartments | 0 | 0.0% |
| Mobile Home / Other | 0 | 0.0% |
| Total | 73 | 100.0% |
Housing Structures by Occupancy in Los Alvarez
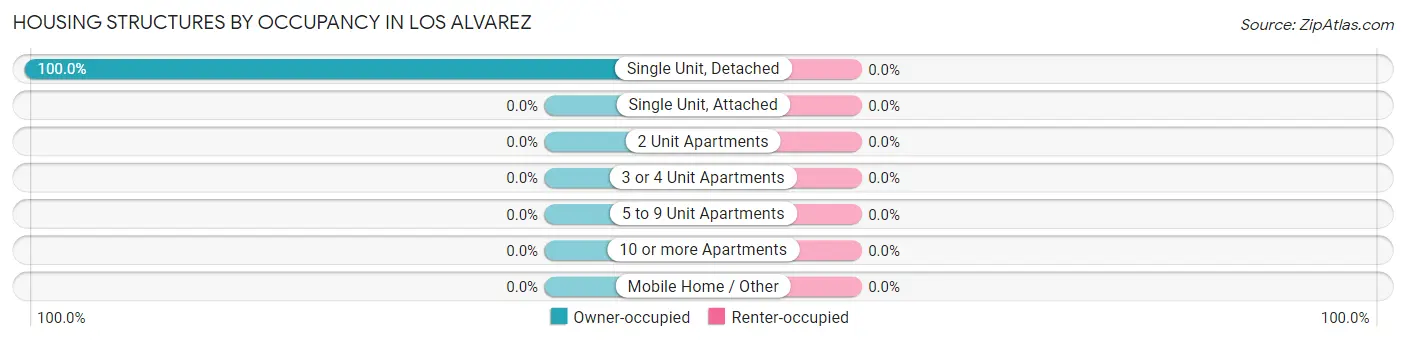
| Structure Type | Owner-occupied | Renter-occupied |
| Single Unit, Detached | 73 (100.0%) | 0 (0.0%) |
| Single Unit, Attached | 0 (0.0%) | 0 (0.0%) |
| 2 Unit Apartments | 0 (0.0%) | 0 (0.0%) |
| 3 or 4 Unit Apartments | 0 (0.0%) | 0 (0.0%) |
| 5 to 9 Unit Apartments | 0 (0.0%) | 0 (0.0%) |
| 10 or more Apartments | 0 (0.0%) | 0 (0.0%) |
| Mobile Home / Other | 0 (0.0%) | 0 (0.0%) |
| Total | 73 (100.0%) | 0 (0.0%) |
Housing Structures by Number of Rooms in Los Alvarez
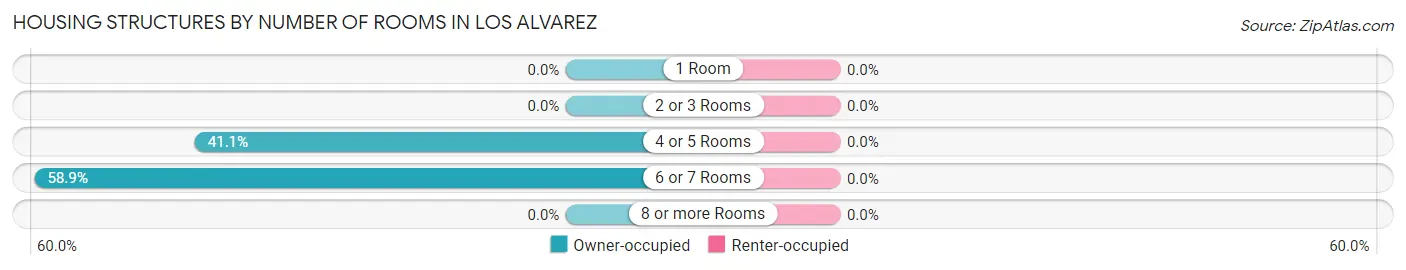
| Number of Rooms | Owner-occupied | Renter-occupied |
| 1 Room | 0 (0.0%) | 0 (0.0%) |
| 2 or 3 Rooms | 0 (0.0%) | 0 (0.0%) |
| 4 or 5 Rooms | 30 (41.1%) | 0 (0.0%) |
| 6 or 7 Rooms | 43 (58.9%) | 0 (0.0%) |
| 8 or more Rooms | 0 (0.0%) | 0 (0.0%) |
| Total | 73 (100.0%) | 0 (0.0%) |
Housing Structure by Heating Type in Los Alvarez
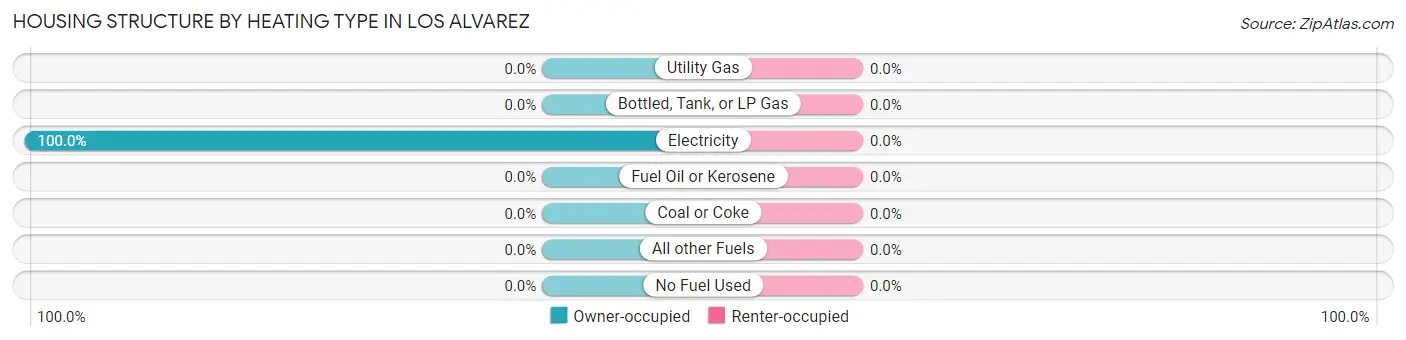
| Heating Type | Owner-occupied | Renter-occupied |
| Utility Gas | 0 (0.0%) | 0 (0.0%) |
| Bottled, Tank, or LP Gas | 0 (0.0%) | 0 (0.0%) |
| Electricity | 73 (100.0%) | 0 (0.0%) |
| Fuel Oil or Kerosene | 0 (0.0%) | 0 (0.0%) |
| Coal or Coke | 0 (0.0%) | 0 (0.0%) |
| All other Fuels | 0 (0.0%) | 0 (0.0%) |
| No Fuel Used | 0 (0.0%) | 0 (0.0%) |
| Total | 73 (100.0%) | 0 (0.0%) |
Household Vehicle Usage in Los Alvarez
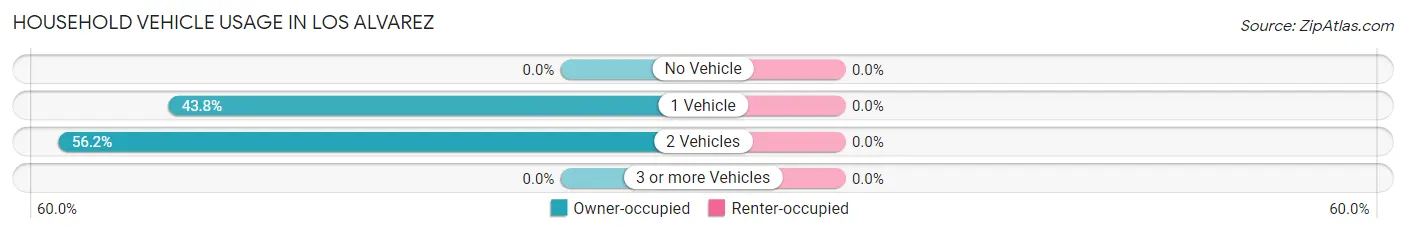
| Vehicles per Household | Owner-occupied | Renter-occupied |
| No Vehicle | 0 (0.0%) | 0 (0.0%) |
| 1 Vehicle | 32 (43.8%) | 0 (0.0%) |
| 2 Vehicles | 41 (56.2%) | 0 (0.0%) |
| 3 or more Vehicles | 0 (0.0%) | 0 (0.0%) |
| Total | 73 (100.0%) | 0 (0.0%) |
Real Estate & Mortgages in Los Alvarez
Real Estate and Mortgage Overview in Los Alvarez
| Characteristic | Without Mortgage | With Mortgage |
| Housing Units | 73 | 0 |
| Median Property Value | $113,200 | $0 |
| Median Household Income | $8,862 | $0 |
| Monthly Housing Costs | $506 | $0 |
| Real Estate Taxes | - | - |
Property Value by Mortgage Status in Los Alvarez
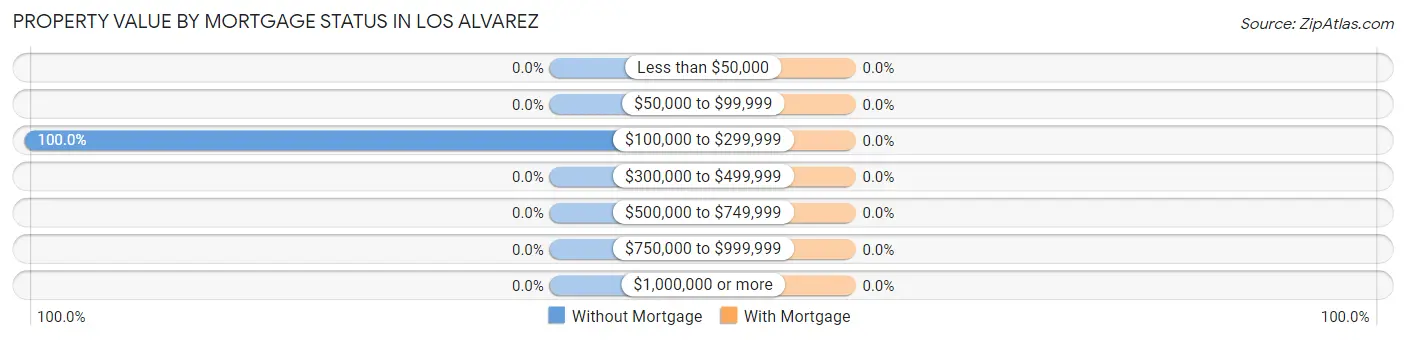
| Property Value | Without Mortgage | With Mortgage |
| Less than $50,000 | 0 (0.0%) | 0 (0.0%) |
| $50,000 to $99,999 | 0 (0.0%) | 0 (0.0%) |
| $100,000 to $299,999 | 73 (100.0%) | 0 (0.0%) |
| $300,000 to $499,999 | 0 (0.0%) | 0 (0.0%) |
| $500,000 to $749,999 | 0 (0.0%) | 0 (0.0%) |
| $750,000 to $999,999 | 0 (0.0%) | 0 (0.0%) |
| $1,000,000 or more | 0 (0.0%) | 0 (0.0%) |
| Total | 73 (100.0%) | 0 (0.0%) |
Household Income by Mortgage Status in Los Alvarez
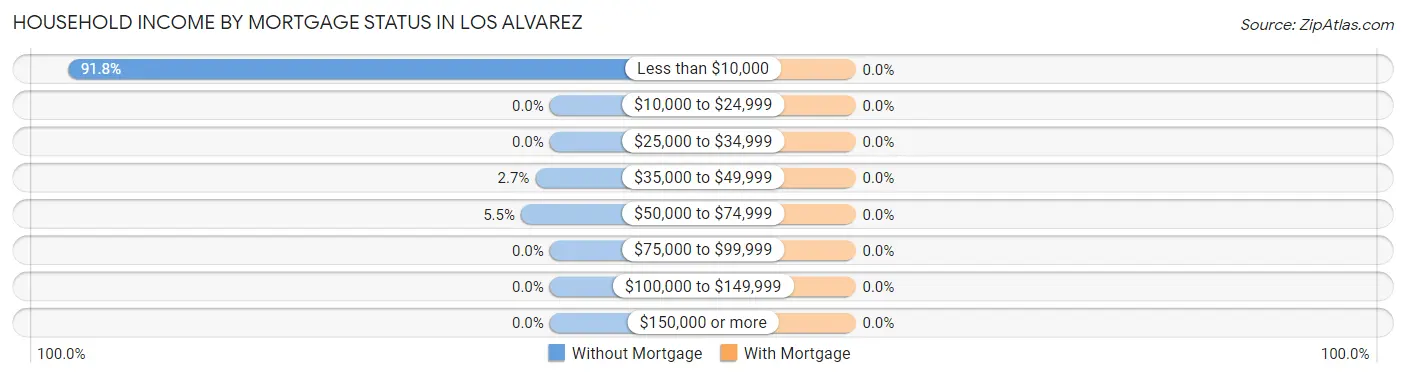
| Household Income | Without Mortgage | With Mortgage |
| Less than $10,000 | 67 (91.8%) | 0 (0.0%) |
| $10,000 to $24,999 | 0 (0.0%) | 0 (0.0%) |
| $25,000 to $34,999 | 0 (0.0%) | 0 (0.0%) |
| $35,000 to $49,999 | 2 (2.7%) | 0 (0.0%) |
| $50,000 to $74,999 | 4 (5.5%) | 0 (0.0%) |
| $75,000 to $99,999 | 0 (0.0%) | 0 (0.0%) |
| $100,000 to $149,999 | 0 (0.0%) | 0 (0.0%) |
| $150,000 or more | 0 (0.0%) | 0 (0.0%) |
| Total | 73 (100.0%) | 0 (0.0%) |
Property Value to Household Income Ratio in Los Alvarez
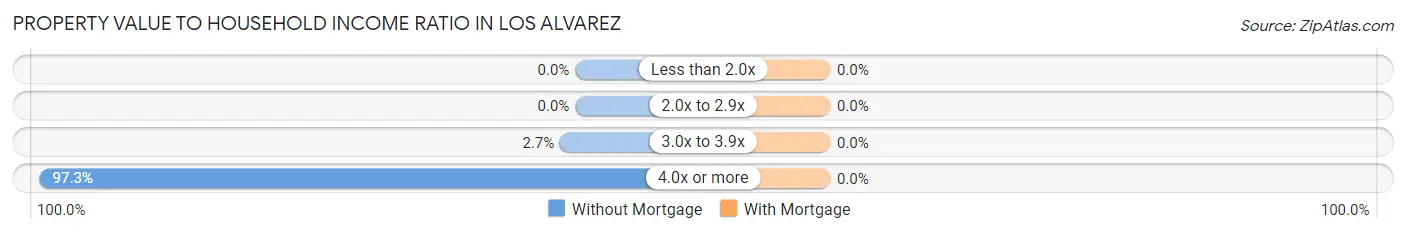
| Value-to-Income Ratio | Without Mortgage | With Mortgage |
| Less than 2.0x | 0 (0.0%) | 0 (0.0%) |
| 2.0x to 2.9x | 0 (0.0%) | 0 (0.0%) |
| 3.0x to 3.9x | 2 (2.7%) | 0 (0.0%) |
| 4.0x or more | 71 (97.3%) | 0 (0.0%) |
| Total | 73 (100.0%) | 0 (0.0%) |
Real Estate Taxes by Mortgage Status in Los Alvarez
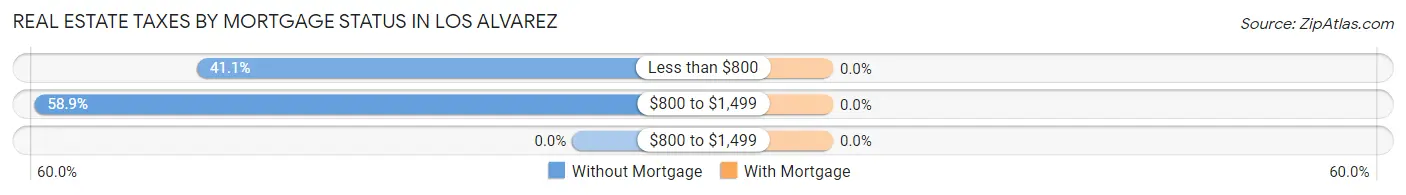
| Property Taxes | Without Mortgage | With Mortgage |
| Less than $800 | 30 (41.1%) | 0 (0.0%) |
| $800 to $1,499 | 43 (58.9%) | 0 (0.0%) |
| $800 to $1,499 | 0 (0.0%) | 0 (0.0%) |
| Total | 73 (100.0%) | 0 (0.0%) |
Health & Disability in Los Alvarez
Health Insurance Coverage by Age in Los Alvarez
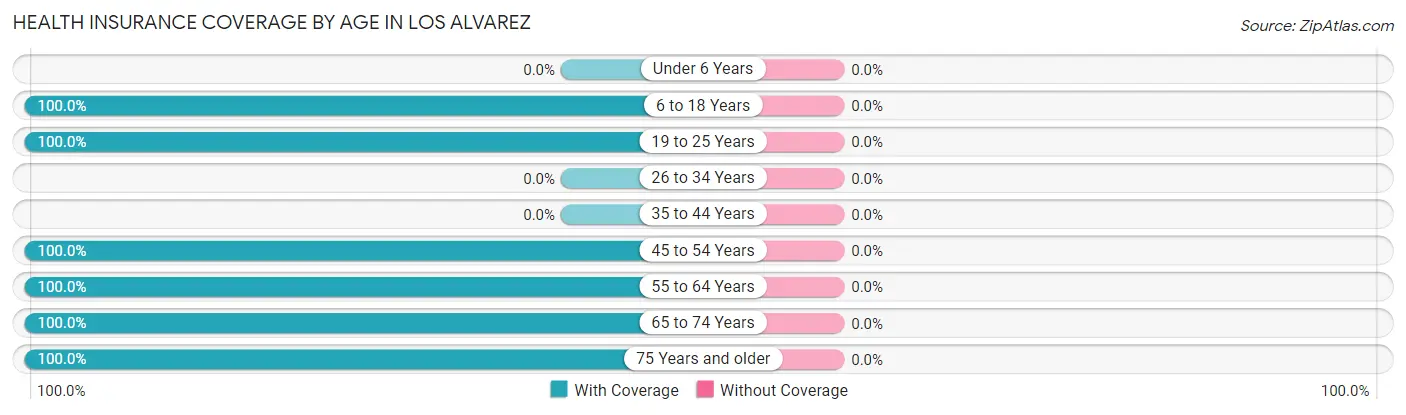
| Age Bracket | With Coverage | Without Coverage |
| Under 6 Years | 0 (0.0%) | 0 (0.0%) |
| 6 to 18 Years | 46 (100.0%) | 0 (0.0%) |
| 19 to 25 Years | 57 (100.0%) | 0 (0.0%) |
| 26 to 34 Years | 0 (0.0%) | 0 (0.0%) |
| 35 to 44 Years | 0 (0.0%) | 0 (0.0%) |
| 45 to 54 Years | 39 (100.0%) | 0 (0.0%) |
| 55 to 64 Years | 6 (100.0%) | 0 (0.0%) |
| 65 to 74 Years | 5 (100.0%) | 0 (0.0%) |
| 75 Years and older | 28 (100.0%) | 0 (0.0%) |
| Total | 181 (100.0%) | 0 (0.0%) |
Health Insurance Coverage by Citizenship Status in Los Alvarez
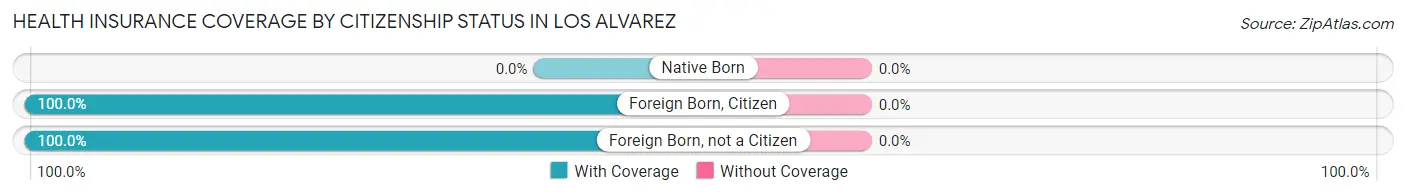
| Citizenship Status | With Coverage | Without Coverage |
| Native Born | 0 (0.0%) | 0 (0.0%) |
| Foreign Born, Citizen | 46 (100.0%) | 0 (0.0%) |
| Foreign Born, not a Citizen | 57 (100.0%) | 0 (0.0%) |
Health Insurance Coverage by Household Income in Los Alvarez
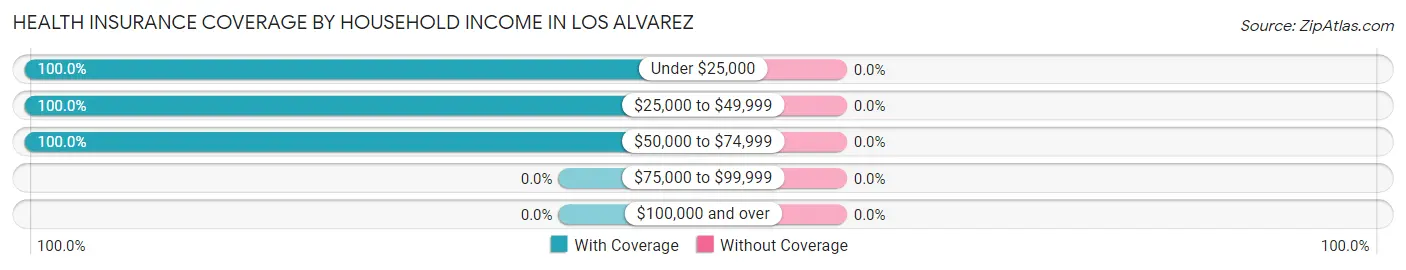
| Household Income | With Coverage | Without Coverage |
| Under $25,000 | 170 (100.0%) | 0 (0.0%) |
| $25,000 to $49,999 | 7 (100.0%) | 0 (0.0%) |
| $50,000 to $74,999 | 4 (100.0%) | 0 (0.0%) |
| $75,000 to $99,999 | 0 (0.0%) | 0 (0.0%) |
| $100,000 and over | 0 (0.0%) | 0 (0.0%) |
Public vs Private Health Insurance Coverage by Age in Los Alvarez
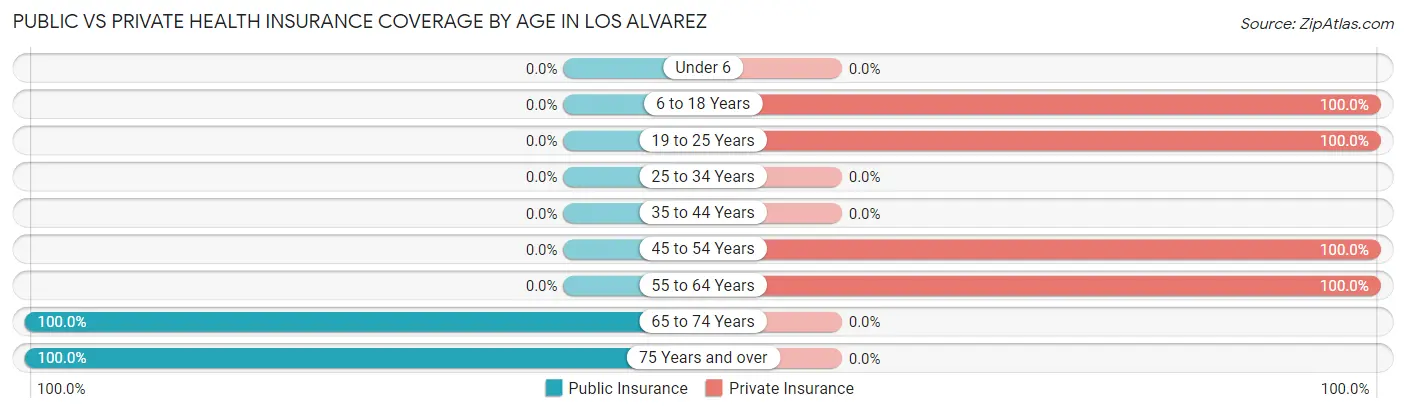
| Age Bracket | Public Insurance | Private Insurance |
| Under 6 | 0 (0.0%) | 0 (0.0%) |
| 6 to 18 Years | 0 (0.0%) | 46 (100.0%) |
| 19 to 25 Years | 0 (0.0%) | 57 (100.0%) |
| 25 to 34 Years | 0 (0.0%) | 0 (0.0%) |
| 35 to 44 Years | 0 (0.0%) | 0 (0.0%) |
| 45 to 54 Years | 0 (0.0%) | 39 (100.0%) |
| 55 to 64 Years | 0 (0.0%) | 6 (100.0%) |
| 65 to 74 Years | 5 (100.0%) | 0 (0.0%) |
| 75 Years and over | 28 (100.0%) | 0 (0.0%) |
| Total | 33 (18.2%) | 148 (81.8%) |
Disability Status by Sex by Age in Los Alvarez
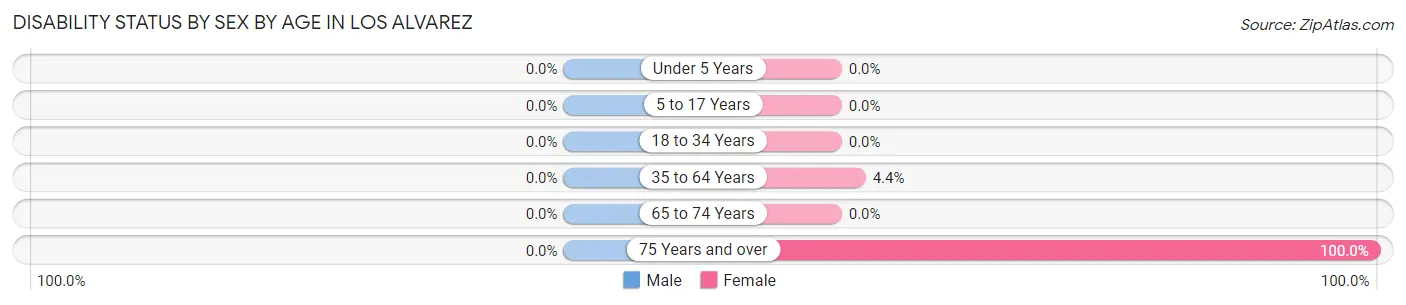
| Age Bracket | Male | Female |
| Under 5 Years | 0 (0.0%) | 0 (0.0%) |
| 5 to 17 Years | 0 (0.0%) | 0 (0.0%) |
| 18 to 34 Years | 0 (0.0%) | 0 (0.0%) |
| 35 to 64 Years | 0 (0.0%) | 2 (4.4%) |
| 65 to 74 Years | 0 (0.0%) | 0 (0.0%) |
| 75 Years and over | 0 (0.0%) | 28 (100.0%) |
Disability Class by Sex by Age in Los Alvarez
Disability Class: Hearing Difficulty
| Age Bracket | Male | Female |
| Under 5 Years | 0 (0.0%) | 0 (0.0%) |
| 5 to 17 Years | 0 (0.0%) | 0 (0.0%) |
| 18 to 34 Years | 0 (0.0%) | 0 (0.0%) |
| 35 to 64 Years | 0 (0.0%) | 0 (0.0%) |
| 65 to 74 Years | 0 (0.0%) | 0 (0.0%) |
| 75 Years and over | 0 (0.0%) | 0 (0.0%) |
Disability Class: Vision Difficulty
| Age Bracket | Male | Female |
| Under 5 Years | 0 (0.0%) | 0 (0.0%) |
| 5 to 17 Years | 0 (0.0%) | 0 (0.0%) |
| 18 to 34 Years | 0 (0.0%) | 0 (0.0%) |
| 35 to 64 Years | 0 (0.0%) | 2 (4.4%) |
| 65 to 74 Years | 0 (0.0%) | 0 (0.0%) |
| 75 Years and over | 0 (0.0%) | 0 (0.0%) |
Disability Class: Cognitive Difficulty
| Age Bracket | Male | Female |
| 5 to 17 Years | 0 (0.0%) | 0 (0.0%) |
| 18 to 34 Years | 0 (0.0%) | 0 (0.0%) |
| 35 to 64 Years | 0 (0.0%) | 0 (0.0%) |
| 65 to 74 Years | 0 (0.0%) | 0 (0.0%) |
| 75 Years and over | 0 (0.0%) | 28 (100.0%) |
Disability Class: Ambulatory Difficulty
| Age Bracket | Male | Female |
| 5 to 17 Years | 0 (0.0%) | 0 (0.0%) |
| 18 to 34 Years | 0 (0.0%) | 0 (0.0%) |
| 35 to 64 Years | 0 (0.0%) | 0 (0.0%) |
| 65 to 74 Years | 0 (0.0%) | 0 (0.0%) |
| 75 Years and over | 0 (0.0%) | 0 (0.0%) |
Disability Class: Self-Care Difficulty
| Age Bracket | Male | Female |
| 5 to 17 Years | 0 (0.0%) | 0 (0.0%) |
| 18 to 34 Years | 0 (0.0%) | 0 (0.0%) |
| 35 to 64 Years | 0 (0.0%) | 0 (0.0%) |
| 65 to 74 Years | 0 (0.0%) | 0 (0.0%) |
| 75 Years and over | 0 (0.0%) | 0 (0.0%) |
Technology Access in Los Alvarez
Computing Device Access in Los Alvarez
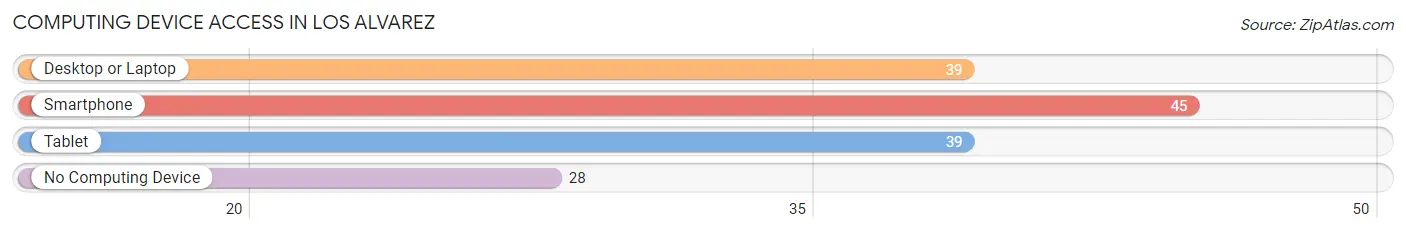
| Device Type | # Households | % Households |
| Desktop or Laptop | 39 | 53.4% |
| Smartphone | 45 | 61.6% |
| Tablet | 39 | 53.4% |
| No Computing Device | 28 | 38.4% |
| Total | 73 | 100.0% |
Internet Access in Los Alvarez
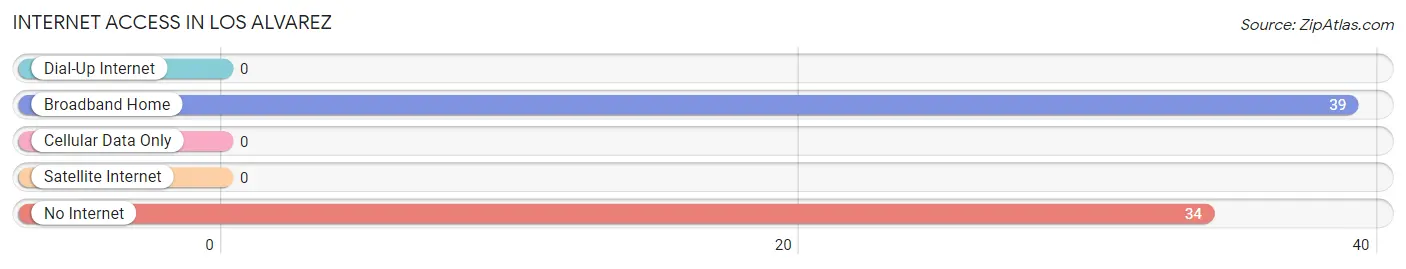
| Internet Type | # Households | % Households |
| Dial-Up Internet | 0 | 0.0% |
| Broadband Home | 39 | 53.4% |
| Cellular Data Only | 0 | 0.0% |
| Satellite Internet | 0 | 0.0% |
| No Internet | 34 | 46.6% |
| Total | 73 | 100.0% |
Los Alvarez Summary
Alvarez, Texas is a small town located in the southern part of the state, in the county of Hidalgo. It is situated on the banks of the Rio Grande, and is part of the McAllen-Edinburg-Mission Metropolitan Statistical Area. The town has a population of just over 1,000 people, and is known for its rich history, diverse geography, and vibrant economy.
History
Alvarez, Texas was founded in 1848 by a group of Mexican settlers who were looking for a place to settle and start a new life. The town was named after the first settler, Don Jose Alvarez, who was a rancher and farmer. The town grew quickly, and by the late 1800s, it had become a bustling center of commerce and industry. The town was home to several businesses, including a cotton gin, a blacksmith shop, and a general store.
In the early 1900s, the town began to experience a period of growth and prosperity. The population increased, and the town was home to several businesses, including a bank, a hotel, and a movie theater. The town also had a school, a post office, and a library.
In the mid-1900s, the town experienced a period of decline. Many of the businesses closed, and the population began to decline. However, in the late 1990s, the town began to experience a period of revitalization. The population began to increase, and new businesses began to open.
Geography
Alvarez, Texas is located in the southern part of the state, in the county of Hidalgo. It is situated on the banks of the Rio Grande, and is part of the McAllen-Edinburg-Mission Metropolitan Statistical Area. The town is located in a semi-arid climate, with hot summers and mild winters. The average temperature in the summer is around 90 degrees Fahrenheit, and the average temperature in the winter is around 60 degrees Fahrenheit.
The town is surrounded by a variety of terrain, including flat plains, rolling hills, and rugged mountains. The town is also home to several rivers, including the Rio Grande, the San Juan, and the Pecos.
Economy
Alvarez, Texas has a vibrant economy that is driven by agriculture, tourism, and manufacturing. The town is home to several farms, which produce a variety of crops, including cotton, corn, and sorghum. The town is also home to several tourist attractions, including the Rio Grande Valley State Park, the San Juan National Wildlife Refuge, and the Pecos National Historic Park.
The town is also home to several manufacturing companies, which produce a variety of products, including furniture, clothing, and electronics. The town is also home to several retail stores, which sell a variety of goods, including clothing, jewelry, and home goods.
Demographics
As of the 2010 census, the population of Alvarez, Texas was 1,072. The town is predominantly Hispanic, with a population that is 97.3% Hispanic or Latino. The median household income in the town is $25,972, and the median age is 33.7 years. The town is also home to a variety of religious denominations, including Catholic, Baptist, and Methodist.
Conclusion
Alvarez, Texas is a small town with a rich history, diverse geography, and vibrant economy. The town is predominantly Hispanic, and is home to a variety of businesses, including farms, tourist attractions, and manufacturing companies. The town is also home to several retail stores, which sell a variety of goods. The town has a population of just over 1,000 people, and is known for its rich history, diverse geography, and vibrant economy.
Common Questions
What is Per Capita Income in Los Alvarez?
Per Capita income in Los Alvarez is $6,204.
What is the Median Household income in Los Alvarez?
Median Household Income in Los Alvarez is $8,862.
What is Inequality or Gini Index in Los Alvarez?
Inequality or Gini Index in Los Alvarez is 0.26.
What is the Total Population of Los Alvarez?
Total Population of Los Alvarez is 181.
What is the Total Male Population of Los Alvarez?
Total Male Population of Los Alvarez is 2.
What is the Total Female Population of Los Alvarez?
Total Female Population of Los Alvarez is 179.
What is the Ratio of Males per 100 Females in Los Alvarez?
There are 1.12 Males per 100 Females in Los Alvarez.
What is the Ratio of Females per 100 Males in Los Alvarez?
There are 8,950.00 Females per 100 Males in Los Alvarez.
What is the Median Population Age in Los Alvarez?
Median Population Age in Los Alvarez is 21.8 Years.
What is the Average Family Size in Los Alvarez
Average Family Size in Los Alvarez is 3.6 People.
What is the Average Household Size in Los Alvarez
Average Household Size in Los Alvarez is 2.5 People.
How Large is the Labor Force in Los Alvarez?
There are 4 People in the Labor Forcein in Los Alvarez.
What is the Percentage of People in the Labor Force in Los Alvarez?
2.2% of People are in the Labor Force in Los Alvarez.