New Chapel Hill, TX Map & Demographics
New Chapel Hill Map
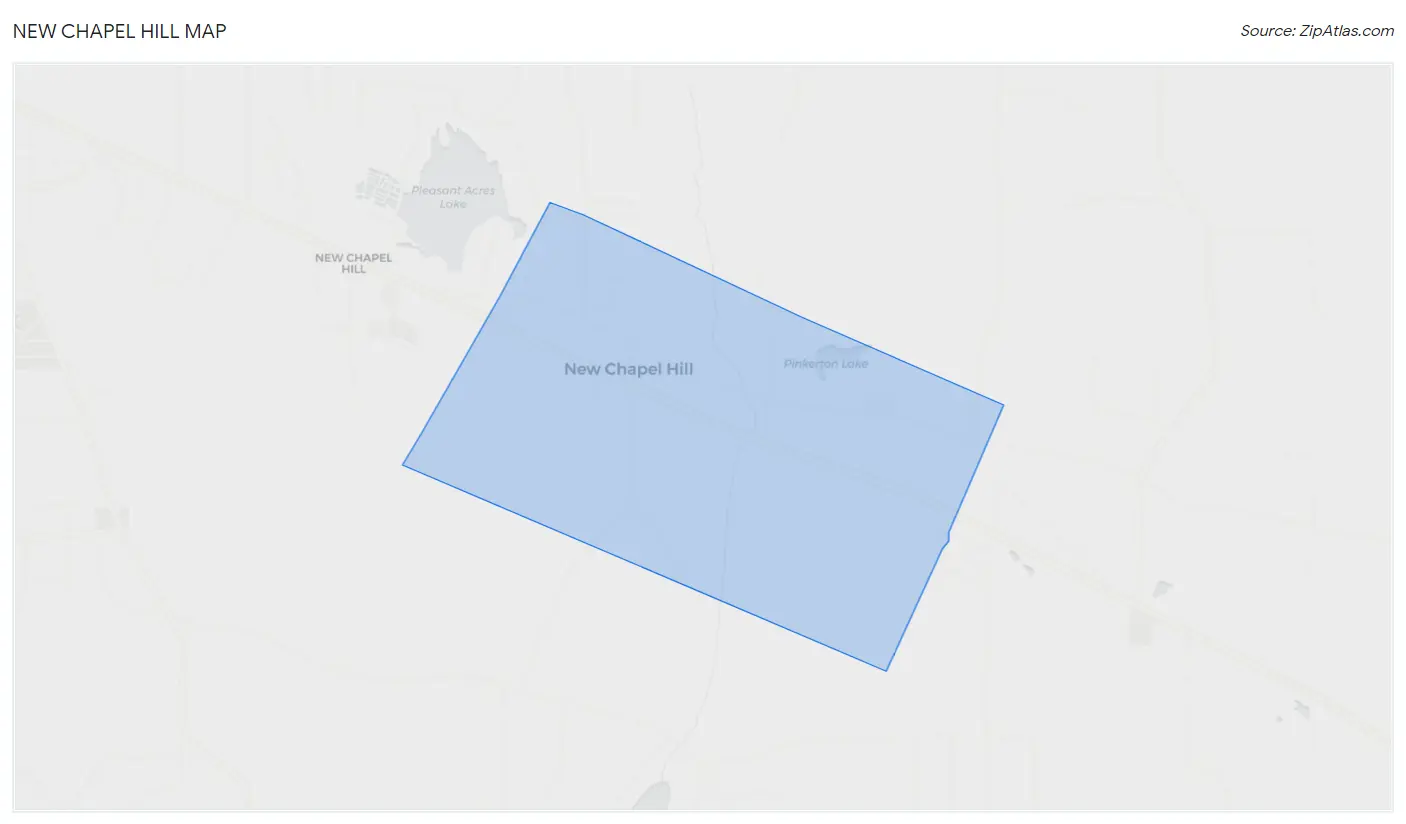
New Chapel Hill Overview
$28,210
PER CAPITA INCOME
$86,346
AVG FAMILY INCOME
$58,304
AVG HOUSEHOLD INCOME
14.4%
WAGE / INCOME GAP [ % ]
85.6¢/ $1
WAGE / INCOME GAP [ $ ]
0.47
INEQUALITY / GINI INDEX
768
TOTAL POPULATION
382
MALE POPULATION
386
FEMALE POPULATION
98.96
MALES / 100 FEMALES
101.05
FEMALES / 100 MALES
47.3
MEDIAN AGE
3.6
AVG FAMILY SIZE
2.8
AVG HOUSEHOLD SIZE
364
LABOR FORCE [ PEOPLE ]
55.2%
PERCENT IN LABOR FORCE
10.7%
UNEMPLOYMENT RATE
Income in New Chapel Hill
Income Overview in New Chapel Hill
Per Capita Income in New Chapel Hill is $28,210, while median incomes of families and households are $86,346 and $58,304 respectively.
| Characteristic | Number | Measure |
| Per Capita Income | 768 | $28,210 |
| Median Family Income | 166 | $86,346 |
| Mean Family Income | 166 | $100,659 |
| Median Household Income | 279 | $58,304 |
| Mean Household Income | 279 | $76,067 |
| Income Deficit | 166 | $0 |
| Wage / Income Gap (%) | 768 | 14.37% |
| Wage / Income Gap ($) | 768 | 85.63¢ per $1 |
| Gini / Inequality Index | 768 | 0.47 |
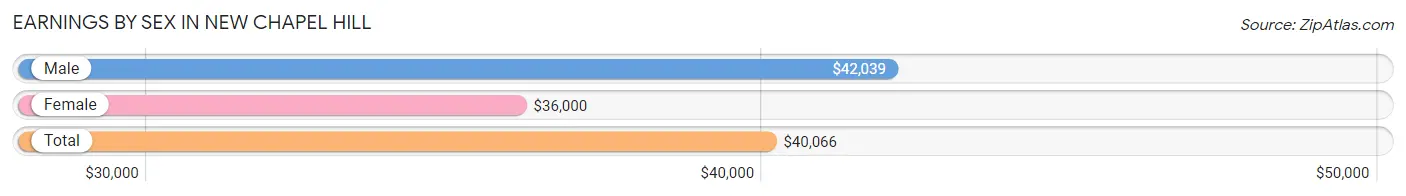
Earnings by Sex in New Chapel Hill
Average Earnings in New Chapel Hill are $40,066, $42,039 for men and $36,000 for women, a difference of 14.4%.
| Sex | Number | Average Earnings |
| Male | 179 (53.7%) | $42,039 |
| Female | 154 (46.3%) | $36,000 |
| Total | 333 (100.0%) | $40,066 |
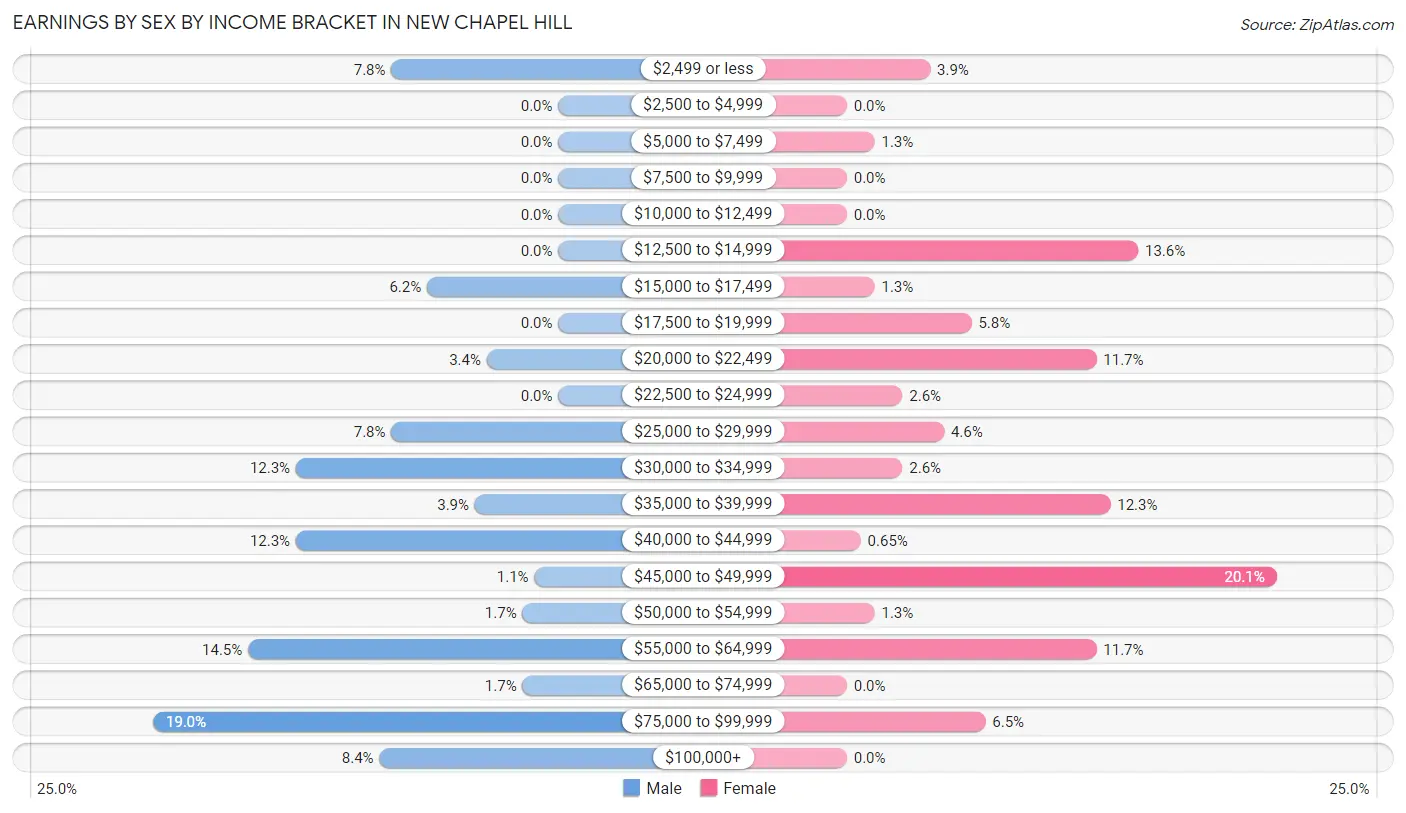
Earnings by Sex by Income Bracket in New Chapel Hill
The most common earnings brackets in New Chapel Hill are $75,000 to $99,999 for men (34 | 19.0%) and $45,000 to $49,999 for women (31 | 20.1%).
| Income | Male | Female |
| $2,499 or less | 14 (7.8%) | 6 (3.9%) |
| $2,500 to $4,999 | 0 (0.0%) | 0 (0.0%) |
| $5,000 to $7,499 | 0 (0.0%) | 2 (1.3%) |
| $7,500 to $9,999 | 0 (0.0%) | 0 (0.0%) |
| $10,000 to $12,499 | 0 (0.0%) | 0 (0.0%) |
| $12,500 to $14,999 | 0 (0.0%) | 21 (13.6%) |
| $15,000 to $17,499 | 11 (6.1%) | 2 (1.3%) |
| $17,500 to $19,999 | 0 (0.0%) | 9 (5.8%) |
| $20,000 to $22,499 | 6 (3.4%) | 18 (11.7%) |
| $22,500 to $24,999 | 0 (0.0%) | 4 (2.6%) |
| $25,000 to $29,999 | 14 (7.8%) | 7 (4.5%) |
| $30,000 to $34,999 | 22 (12.3%) | 4 (2.6%) |
| $35,000 to $39,999 | 7 (3.9%) | 19 (12.3%) |
| $40,000 to $44,999 | 22 (12.3%) | 1 (0.6%) |
| $45,000 to $49,999 | 2 (1.1%) | 31 (20.1%) |
| $50,000 to $54,999 | 3 (1.7%) | 2 (1.3%) |
| $55,000 to $64,999 | 26 (14.5%) | 18 (11.7%) |
| $65,000 to $74,999 | 3 (1.7%) | 0 (0.0%) |
| $75,000 to $99,999 | 34 (19.0%) | 10 (6.5%) |
| $100,000+ | 15 (8.4%) | 0 (0.0%) |
| Total | 179 (100.0%) | 154 (100.0%) |
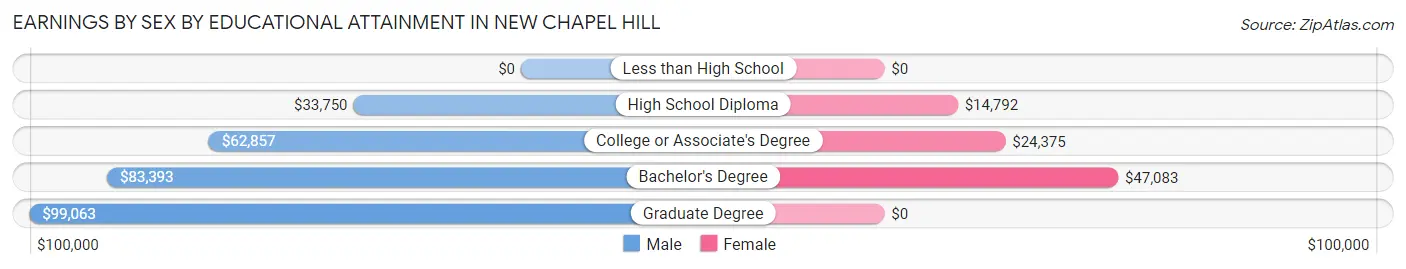
Earnings by Sex by Educational Attainment in New Chapel Hill
Average earnings in New Chapel Hill are $53,750 for men and $37,125 for women, a difference of 30.9%. Men with an educational attainment of graduate degree enjoy the highest average annual earnings of $99,063, while those with high school diploma education earn the least with $33,750. Women with an educational attainment of bachelor's degree earn the most with the average annual earnings of $47,083, while those with high school diploma education have the smallest earnings of $14,792.
| Educational Attainment | Male Income | Female Income |
| Less than High School | - | - |
| High School Diploma | $33,750 | $14,792 |
| College or Associate's Degree | $62,857 | $24,375 |
| Bachelor's Degree | $83,393 | $47,083 |
| Graduate Degree | $99,063 | $0 |
| Total | $53,750 | $37,125 |
Family Income in New Chapel Hill
Family Income Brackets in New Chapel Hill
According to the New Chapel Hill family income data, there are 53 families falling into the $100,000 to $149,999 income range, which is the most common income bracket and makes up 31.9% of all families. Conversely, the less than $10,000 income bracket is the least frequent group with only 2 families (1.2%) belonging to this category.
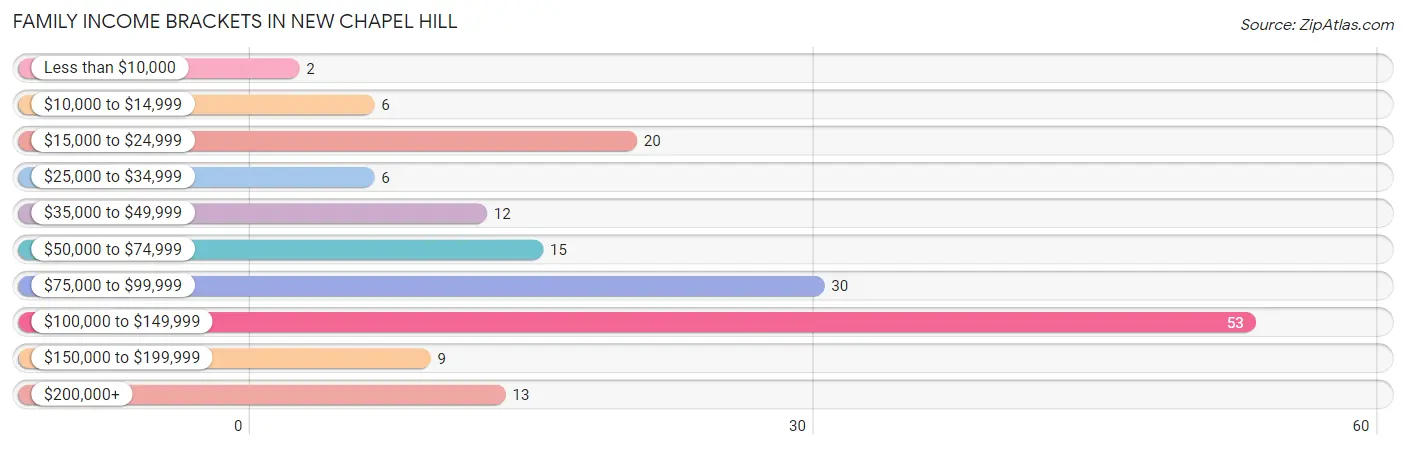
| Income Bracket | # Families | % Families |
| Less than $10,000 | 2 | 1.2% |
| $10,000 to $14,999 | 6 | 3.6% |
| $15,000 to $24,999 | 20 | 12.0% |
| $25,000 to $34,999 | 6 | 3.6% |
| $35,000 to $49,999 | 12 | 7.2% |
| $50,000 to $74,999 | 15 | 9.0% |
| $75,000 to $99,999 | 30 | 18.1% |
| $100,000 to $149,999 | 53 | 31.9% |
| $150,000 to $199,999 | 9 | 5.4% |
| $200,000+ | 13 | 7.8% |
Family Income by Famaliy Size in New Chapel Hill
5-person families (17 | 10.2%) account for the highest median family income in New Chapel Hill with $137,125 per family, while 3-person families (50 | 30.1%) have the highest median income of $31,667 per family member.
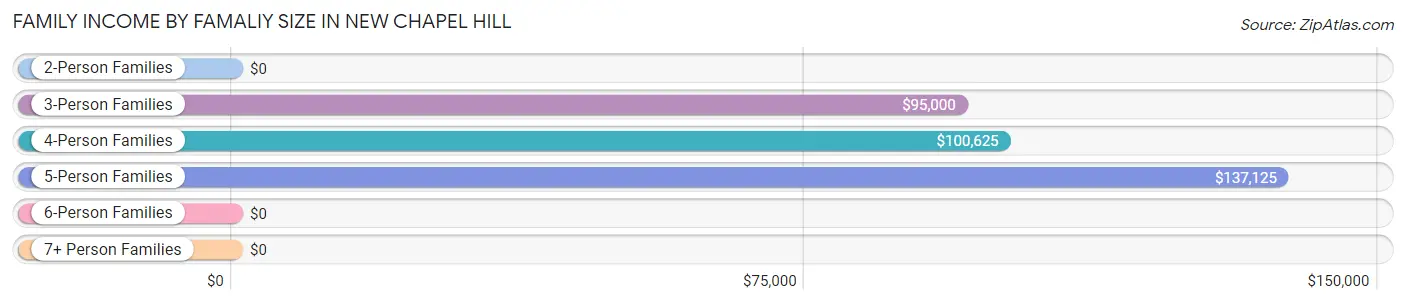
| Income Bracket | # Families | Median Income |
| 2-Person Families | 71 (42.8%) | $0 |
| 3-Person Families | 50 (30.1%) | $95,000 |
| 4-Person Families | 21 (12.7%) | $100,625 |
| 5-Person Families | 17 (10.2%) | $137,125 |
| 6-Person Families | 1 (0.6%) | $0 |
| 7+ Person Families | 6 (3.6%) | $0 |
| Total | 166 (100.0%) | $86,346 |
Family Income by Number of Earners in New Chapel Hill
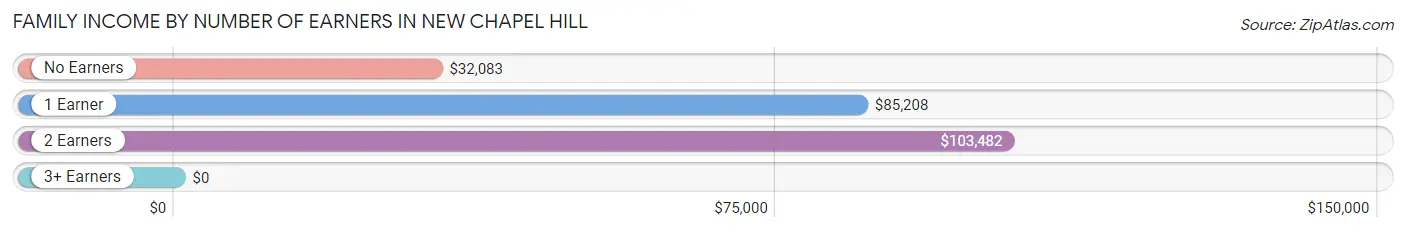
| Number of Earners | # Families | Median Income |
| No Earners | 19 (11.5%) | $32,083 |
| 1 Earner | 77 (46.4%) | $85,208 |
| 2 Earners | 67 (40.4%) | $103,482 |
| 3+ Earners | 3 (1.8%) | $0 |
| Total | 166 (100.0%) | $86,346 |
Household Income in New Chapel Hill
Household Income Brackets in New Chapel Hill
With 58 households falling in the category, the $100,000 to $149,999 income range is the most frequent in New Chapel Hill, accounting for 20.8% of all households. In contrast, only 9 households (3.2%) fall into the $150,000 to $199,999 income bracket, making it the least populous group.
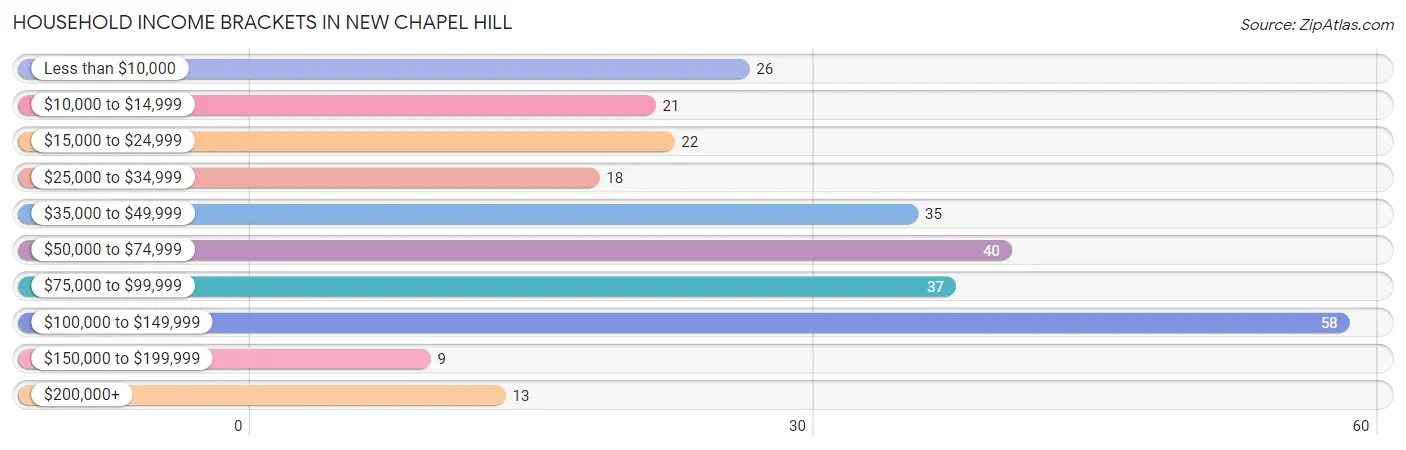
| Income Bracket | # Households | % Households |
| Less than $10,000 | 26 | 9.3% |
| $10,000 to $14,999 | 21 | 7.5% |
| $15,000 to $24,999 | 22 | 7.9% |
| $25,000 to $34,999 | 18 | 6.5% |
| $35,000 to $49,999 | 35 | 12.5% |
| $50,000 to $74,999 | 40 | 14.3% |
| $75,000 to $99,999 | 37 | 13.3% |
| $100,000 to $149,999 | 58 | 20.8% |
| $150,000 to $199,999 | 9 | 3.2% |
| $200,000+ | 13 | 4.7% |
Household Income by Householder Age in New Chapel Hill
The median household income in New Chapel Hill is $58,304, with the highest median household income of $86,071 found in the 45 to 64 years age bracket for the primary householder. A total of 102 households (36.6%) fall into this category. Meanwhile, the 15 to 24 years age bracket for the primary householder has the lowest median household income of $0, with 8 households (2.9%) in this group.
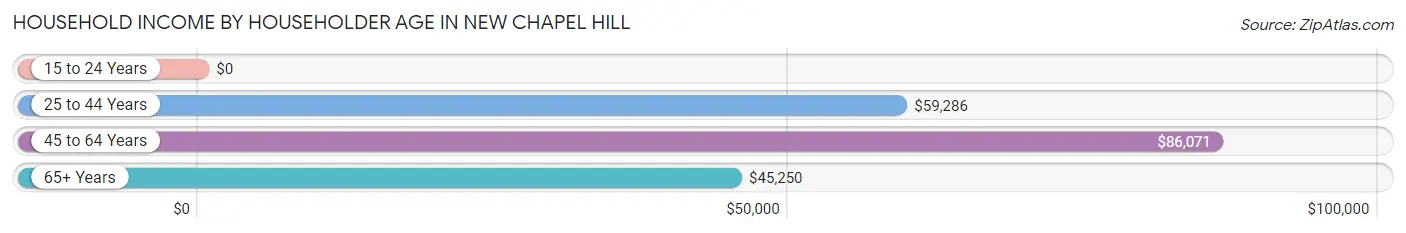
| Income Bracket | # Households | Median Income |
| 15 to 24 Years | 8 (2.9%) | $0 |
| 25 to 44 Years | 78 (28.0%) | $59,286 |
| 45 to 64 Years | 102 (36.6%) | $86,071 |
| 65+ Years | 91 (32.6%) | $45,250 |
| Total | 279 (100.0%) | $58,304 |
Poverty in New Chapel Hill
Income Below Poverty by Sex and Age in New Chapel Hill
With 8.9% poverty level for males and 18.9% for females among the residents of New Chapel Hill, 6 to 11 year old males and under 5 year old females are the most vulnerable to poverty, with 3 males (60.0%) and 7 females (77.8%) in their respective age groups living below the poverty level.
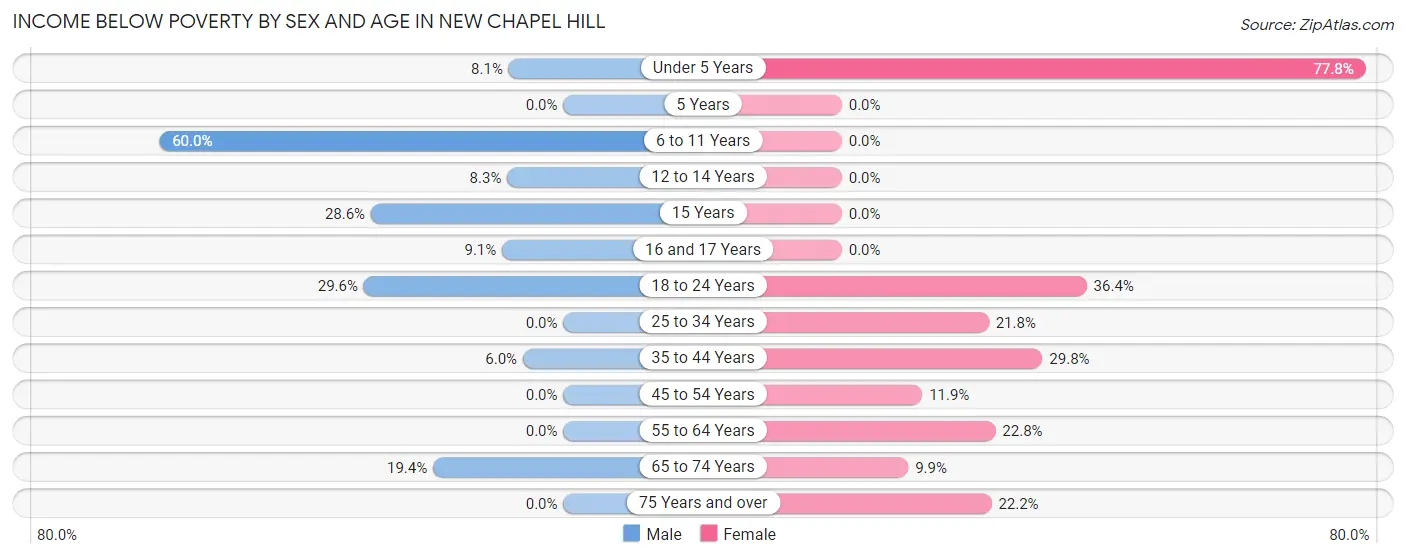
| Age Bracket | Male | Female |
| Under 5 Years | 3 (8.1%) | 7 (77.8%) |
| 5 Years | 0 (0.0%) | 0 (0.0%) |
| 6 to 11 Years | 3 (60.0%) | 0 (0.0%) |
| 12 to 14 Years | 2 (8.3%) | 0 (0.0%) |
| 15 Years | 2 (28.6%) | 0 (0.0%) |
| 16 and 17 Years | 1 (9.1%) | 0 (0.0%) |
| 18 to 24 Years | 8 (29.6%) | 4 (36.4%) |
| 25 to 34 Years | 0 (0.0%) | 12 (21.8%) |
| 35 to 44 Years | 3 (6.0%) | 14 (29.8%) |
| 45 to 54 Years | 0 (0.0%) | 8 (11.9%) |
| 55 to 64 Years | 0 (0.0%) | 13 (22.8%) |
| 65 to 74 Years | 12 (19.4%) | 7 (9.9%) |
| 75 Years and over | 0 (0.0%) | 8 (22.2%) |
| Total | 34 (8.9%) | 73 (18.9%) |
Income Above Poverty by Sex and Age in New Chapel Hill
According to the poverty statistics in New Chapel Hill, males aged 5 years and females aged 6 to 11 years are the age groups that are most secure financially, with 100.0% of males and 100.0% of females in these age groups living above the poverty line.
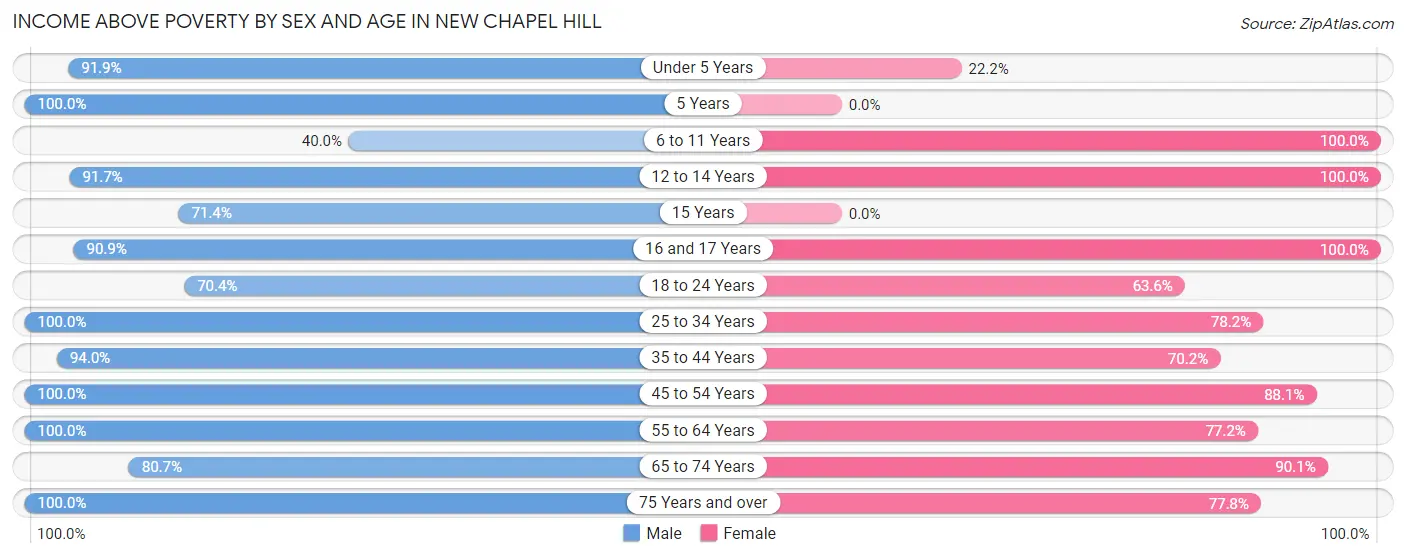
| Age Bracket | Male | Female |
| Under 5 Years | 34 (91.9%) | 2 (22.2%) |
| 5 Years | 1 (100.0%) | 0 (0.0%) |
| 6 to 11 Years | 2 (40.0%) | 20 (100.0%) |
| 12 to 14 Years | 22 (91.7%) | 6 (100.0%) |
| 15 Years | 5 (71.4%) | 0 (0.0%) |
| 16 and 17 Years | 10 (90.9%) | 7 (100.0%) |
| 18 to 24 Years | 19 (70.4%) | 7 (63.6%) |
| 25 to 34 Years | 34 (100.0%) | 43 (78.2%) |
| 35 to 44 Years | 47 (94.0%) | 33 (70.2%) |
| 45 to 54 Years | 51 (100.0%) | 59 (88.1%) |
| 55 to 64 Years | 41 (100.0%) | 44 (77.2%) |
| 65 to 74 Years | 50 (80.6%) | 64 (90.1%) |
| 75 Years and over | 32 (100.0%) | 28 (77.8%) |
| Total | 348 (91.1%) | 313 (81.1%) |
Income Below Poverty Among Married-Couple Families in New Chapel Hill
The poverty statistics for married-couple families in New Chapel Hill show that 3.8% or 5 of the total 132 families live below the poverty line. Families with 3 or 4 children have the highest poverty rate of 7.7%, comprising of 1 families. On the other hand, families with no children have the lowest poverty rate of 2.4%, which includes 2 families.
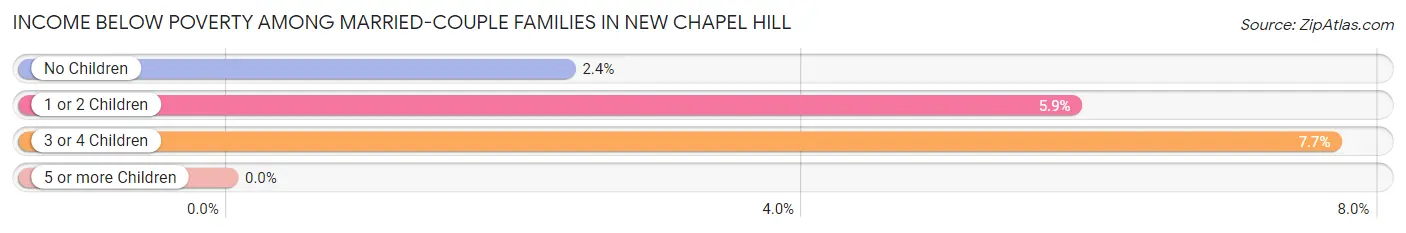
| Children | Above Poverty | Below Poverty |
| No Children | 83 (97.7%) | 2 (2.4%) |
| 1 or 2 Children | 32 (94.1%) | 2 (5.9%) |
| 3 or 4 Children | 12 (92.3%) | 1 (7.7%) |
| 5 or more Children | 0 (0.0%) | 0 (0.0%) |
| Total | 127 (96.2%) | 5 (3.8%) |
Income Below Poverty Among Single-Parent Households in New Chapel Hill
According to the poverty data in New Chapel Hill, 50.0% or 2 single-father households and 20.0% or 6 single-mother households are living below the poverty line. Among single-father households, those with 1 or 2 children have the highest poverty rate, with 2 households (50.0%) experiencing poverty. Likewise, among single-mother households, those with 1 or 2 children have the highest poverty rate, with 6 households (30.0%) falling below the poverty line.
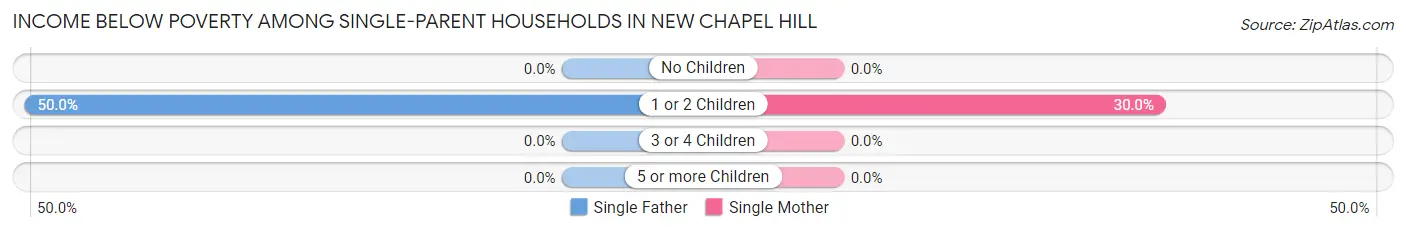
| Children | Single Father | Single Mother |
| No Children | 0 (0.0%) | 0 (0.0%) |
| 1 or 2 Children | 2 (50.0%) | 6 (30.0%) |
| 3 or 4 Children | 0 (0.0%) | 0 (0.0%) |
| 5 or more Children | 0 (0.0%) | 0 (0.0%) |
| Total | 2 (50.0%) | 6 (20.0%) |
Income Below Poverty Among Married-Couple vs Single-Parent Households in New Chapel Hill
The poverty data for New Chapel Hill shows that 5 of the married-couple family households (3.8%) and 8 of the single-parent households (23.5%) are living below the poverty level. Within the married-couple family households, those with 3 or 4 children have the highest poverty rate, with 1 households (7.7%) falling below the poverty line. Among the single-parent households, those with 1 or 2 children have the highest poverty rate, with 8 household (33.3%) living below poverty.
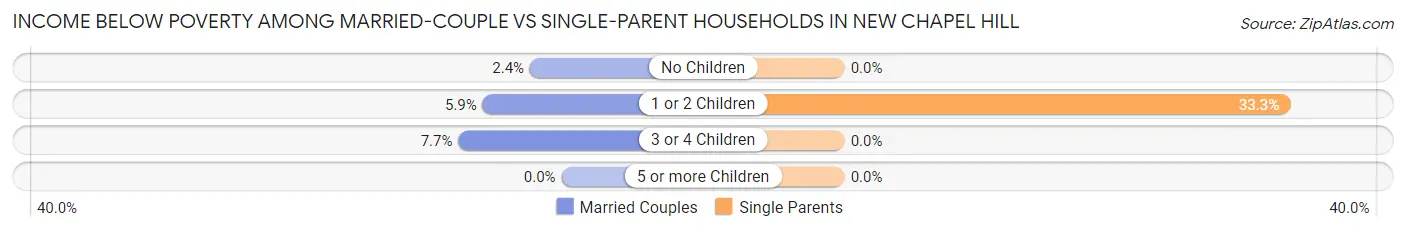
| Children | Married-Couple Families | Single-Parent Households |
| No Children | 2 (2.4%) | 0 (0.0%) |
| 1 or 2 Children | 2 (5.9%) | 8 (33.3%) |
| 3 or 4 Children | 1 (7.7%) | 0 (0.0%) |
| 5 or more Children | 0 (0.0%) | 0 (0.0%) |
| Total | 5 (3.8%) | 8 (23.5%) |
Race in New Chapel Hill
The most populous races in New Chapel Hill are White / Caucasian (586 | 76.3%), Hispanic or Latino (156 | 20.3%), and Two or more Races (141 | 18.4%).
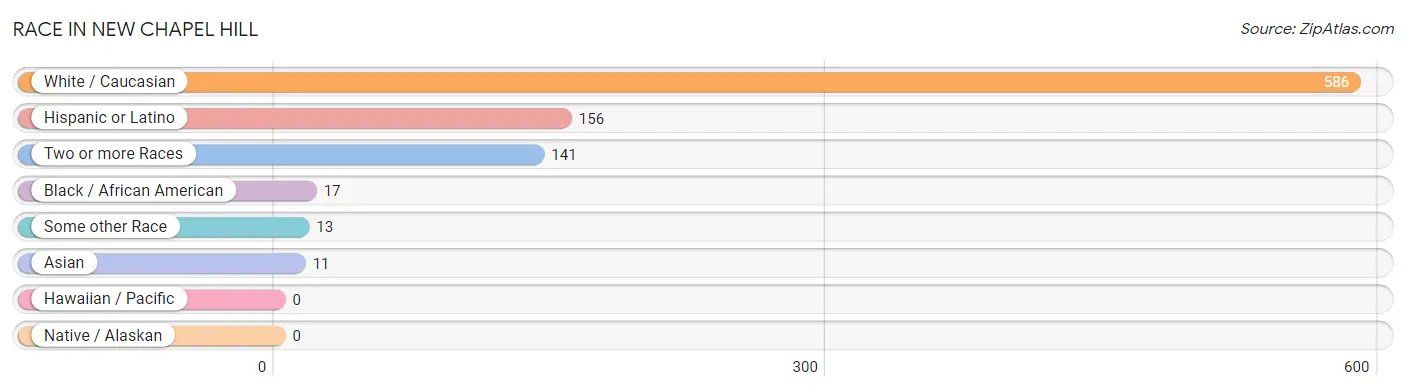
| Race | # Population | % Population |
| Asian | 11 | 1.4% |
| Black / African American | 17 | 2.2% |
| Hawaiian / Pacific | 0 | 0.0% |
| Hispanic or Latino | 156 | 20.3% |
| Native / Alaskan | 0 | 0.0% |
| White / Caucasian | 586 | 76.3% |
| Two or more Races | 141 | 18.4% |
| Some other Race | 13 | 1.7% |
| Total | 768 | 100.0% |
Ancestry in New Chapel Hill
The most populous ancestries reported in New Chapel Hill are American (175 | 22.8%), Irish (109 | 14.2%), Mexican (104 | 13.5%), English (99 | 12.9%), and German (73 | 9.5%), together accounting for 72.9% of all New Chapel Hill residents.
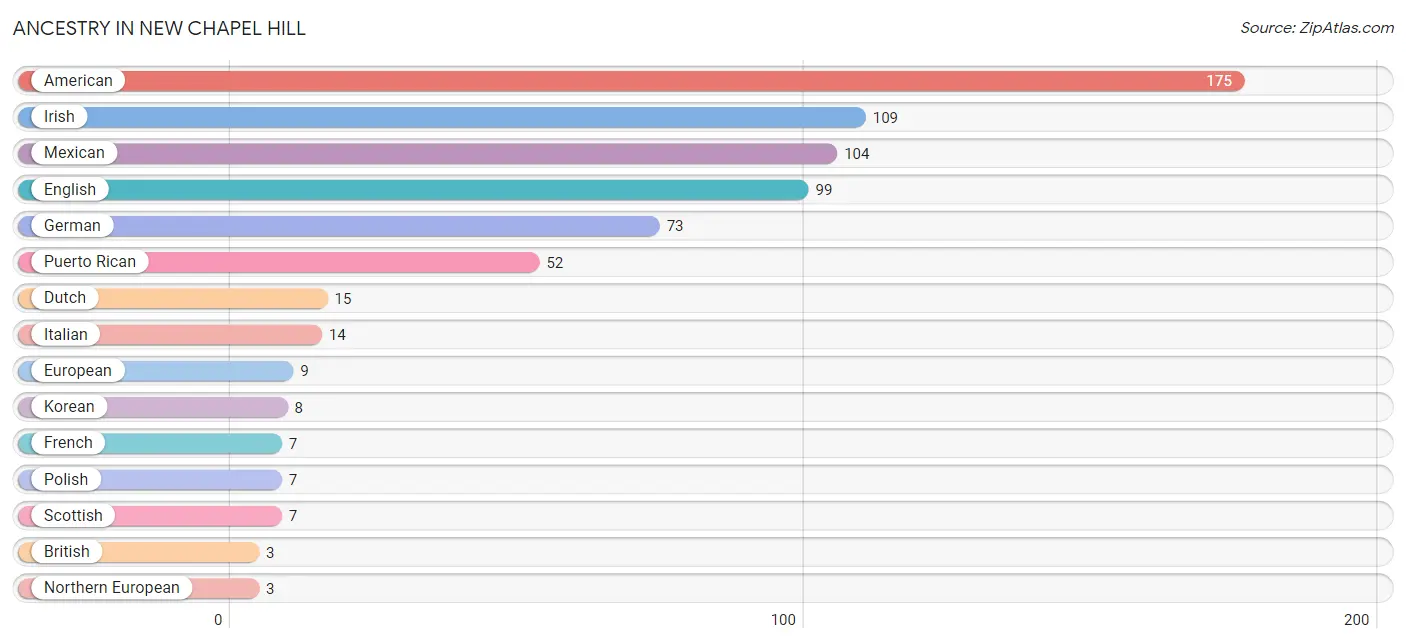
| Ancestry | # Population | % Population |
| American | 175 | 22.8% |
| British | 3 | 0.4% |
| Czechoslovakian | 2 | 0.3% |
| Dutch | 15 | 1.9% |
| English | 99 | 12.9% |
| European | 9 | 1.2% |
| French | 7 | 0.9% |
| German | 73 | 9.5% |
| Irish | 109 | 14.2% |
| Italian | 14 | 1.8% |
| Korean | 8 | 1.0% |
| Mexican | 104 | 13.5% |
| Northern European | 3 | 0.4% |
| Polish | 7 | 0.9% |
| Puerto Rican | 52 | 6.8% |
| Scotch-Irish | 3 | 0.4% |
| Scottish | 7 | 0.9% | View All 17 Rows |
Immigrants in New Chapel Hill

| Immigration Origin | # Population | % Population | View All 0 Rows |
Sex and Age in New Chapel Hill
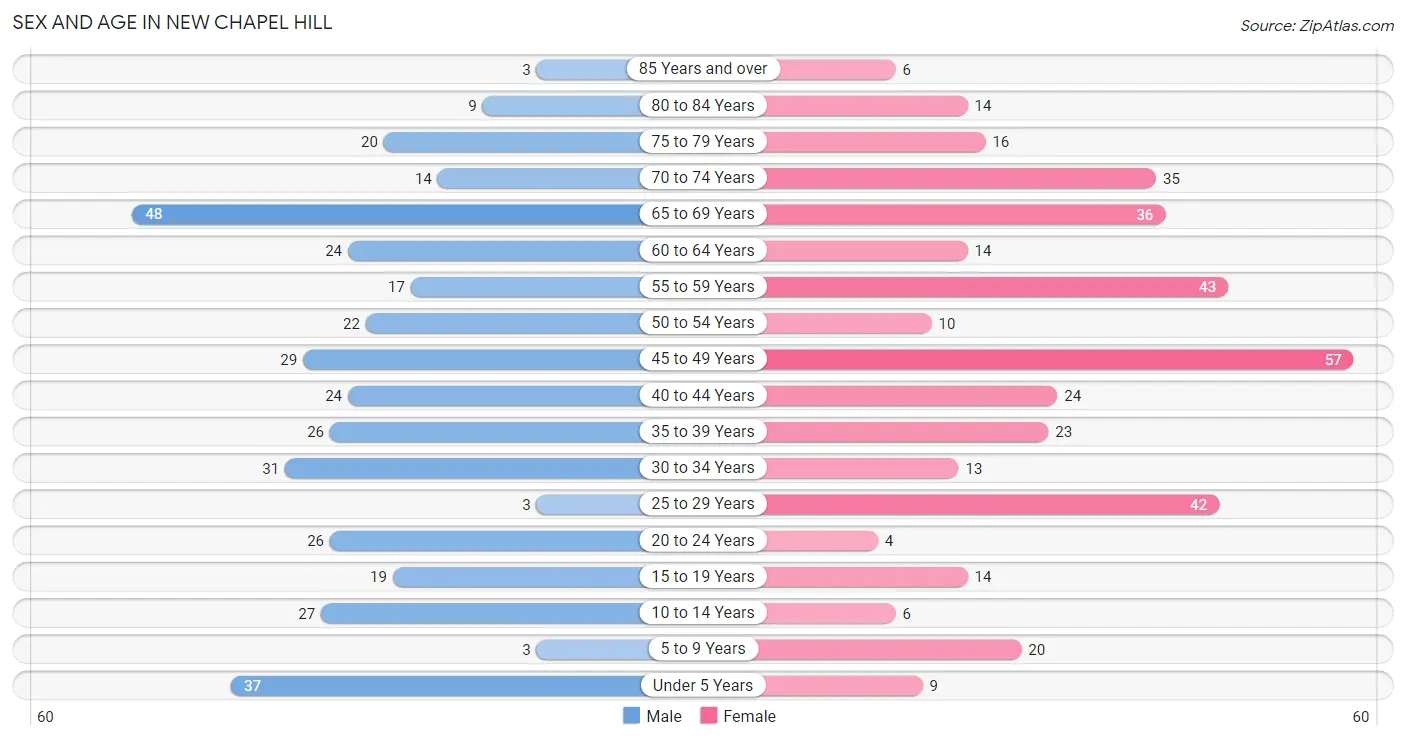
Sex and Age in New Chapel Hill
The most populous age groups in New Chapel Hill are 65 to 69 Years (48 | 12.6%) for men and 45 to 49 Years (57 | 14.8%) for women.
| Age Bracket | Male | Female |
| Under 5 Years | 37 (9.7%) | 9 (2.3%) |
| 5 to 9 Years | 3 (0.8%) | 20 (5.2%) |
| 10 to 14 Years | 27 (7.1%) | 6 (1.5%) |
| 15 to 19 Years | 19 (5.0%) | 14 (3.6%) |
| 20 to 24 Years | 26 (6.8%) | 4 (1.0%) |
| 25 to 29 Years | 3 (0.8%) | 42 (10.9%) |
| 30 to 34 Years | 31 (8.1%) | 13 (3.4%) |
| 35 to 39 Years | 26 (6.8%) | 23 (6.0%) |
| 40 to 44 Years | 24 (6.3%) | 24 (6.2%) |
| 45 to 49 Years | 29 (7.6%) | 57 (14.8%) |
| 50 to 54 Years | 22 (5.8%) | 10 (2.6%) |
| 55 to 59 Years | 17 (4.4%) | 43 (11.1%) |
| 60 to 64 Years | 24 (6.3%) | 14 (3.6%) |
| 65 to 69 Years | 48 (12.6%) | 36 (9.3%) |
| 70 to 74 Years | 14 (3.7%) | 35 (9.1%) |
| 75 to 79 Years | 20 (5.2%) | 16 (4.2%) |
| 80 to 84 Years | 9 (2.4%) | 14 (3.6%) |
| 85 Years and over | 3 (0.8%) | 6 (1.5%) |
| Total | 382 (100.0%) | 386 (100.0%) |
Families and Households in New Chapel Hill
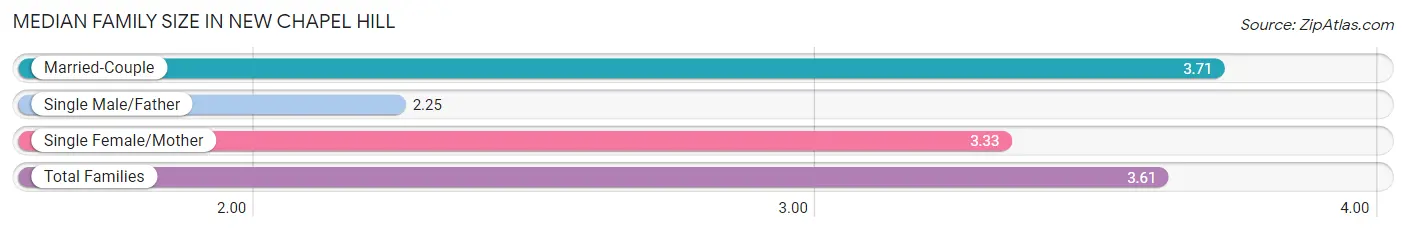
Median Family Size in New Chapel Hill
The median family size in New Chapel Hill is 3.61 persons per family, with married-couple families (132 | 79.5%) accounting for the largest median family size of 3.71 persons per family. On the other hand, single male/father families (4 | 2.4%) represent the smallest median family size with 2.25 persons per family.
| Family Type | # Families | Family Size |
| Married-Couple | 132 (79.5%) | 3.71 |
| Single Male/Father | 4 (2.4%) | 2.25 |
| Single Female/Mother | 30 (18.1%) | 3.33 |
| Total Families | 166 (100.0%) | 3.61 |
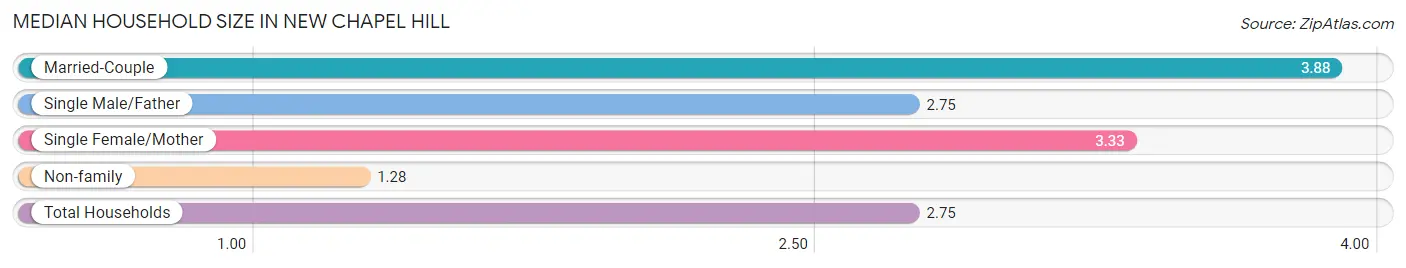
Median Household Size in New Chapel Hill
The median household size in New Chapel Hill is 2.75 persons per household, with married-couple households (132 | 47.3%) accounting for the largest median household size of 3.88 persons per household. non-family households (113 | 40.5%) represent the smallest median household size with 1.28 persons per household.
| Household Type | # Households | Household Size |
| Married-Couple | 132 (47.3%) | 3.88 |
| Single Male/Father | 4 (1.4%) | 2.75 |
| Single Female/Mother | 30 (10.7%) | 3.33 |
| Non-family | 113 (40.5%) | 1.28 |
| Total Households | 279 (100.0%) | 2.75 |
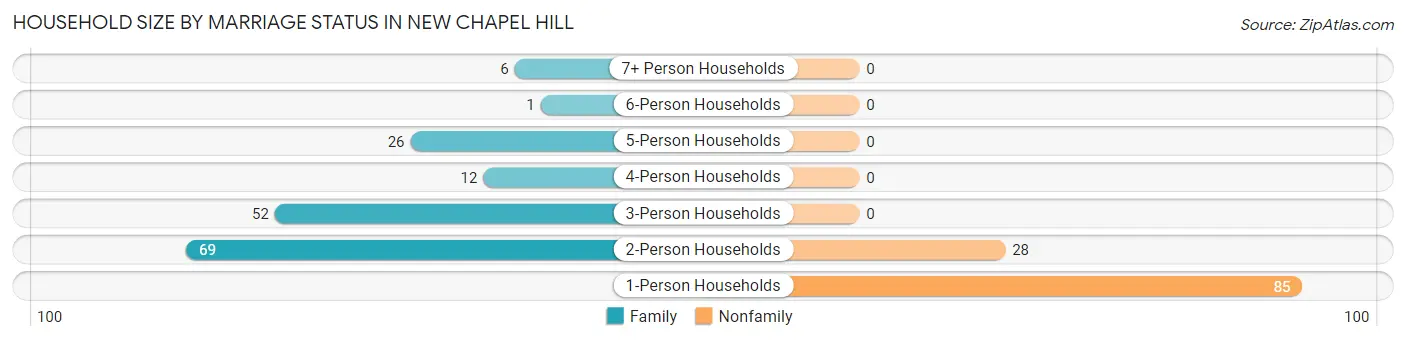
Household Size by Marriage Status in New Chapel Hill
Out of a total of 279 households in New Chapel Hill, 166 (59.5%) are family households, while 113 (40.5%) are nonfamily households. The most numerous type of family households are 2-person households, comprising 69, and the most common type of nonfamily households are 1-person households, comprising 85.
| Household Size | Family Households | Nonfamily Households |
| 1-Person Households | - | 85 (30.5%) |
| 2-Person Households | 69 (24.7%) | 28 (10.0%) |
| 3-Person Households | 52 (18.6%) | 0 (0.0%) |
| 4-Person Households | 12 (4.3%) | 0 (0.0%) |
| 5-Person Households | 26 (9.3%) | 0 (0.0%) |
| 6-Person Households | 1 (0.4%) | 0 (0.0%) |
| 7+ Person Households | 6 (2.1%) | 0 (0.0%) |
| Total | 166 (59.5%) | 113 (40.5%) |
Female Fertility in New Chapel Hill
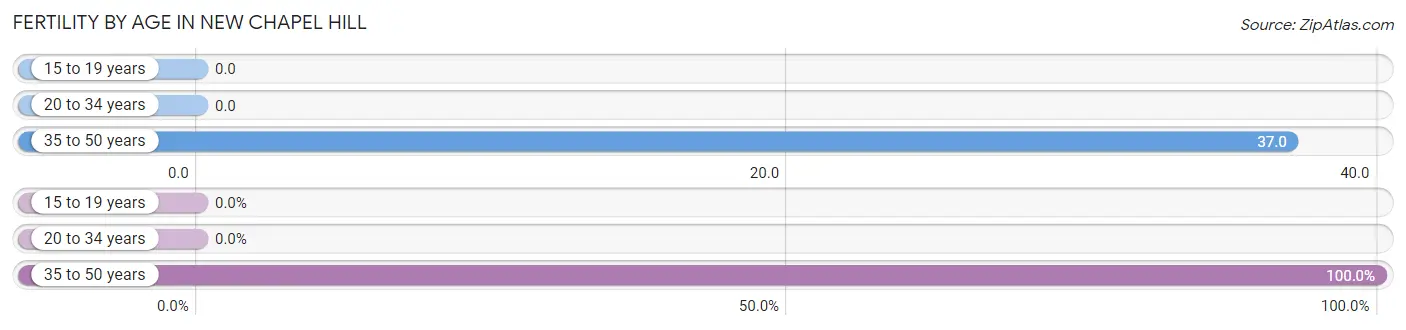
Fertility by Age in New Chapel Hill
Average fertility rate in New Chapel Hill is 22.0 births per 1,000 women. Women in the age bracket of 35 to 50 years have the highest fertility rate with 37.0 births per 1,000 women. Women in the age bracket of 35 to 50 years acount for 100.0% of all women with births.
| Age Bracket | Women with Births | Births / 1,000 Women |
| 15 to 19 years | 0 (0.0%) | 0.0 |
| 20 to 34 years | 0 (0.0%) | 0.0 |
| 35 to 50 years | 4 (100.0%) | 37.0 |
| Total | 4 (100.0%) | 22.0 |
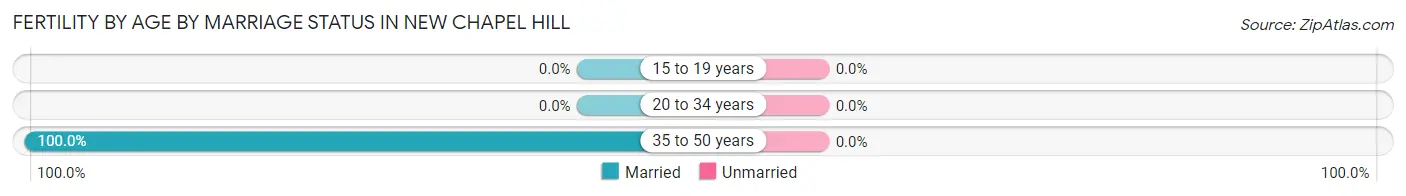
Fertility by Age by Marriage Status in New Chapel Hill
| Age Bracket | Married | Unmarried |
| 15 to 19 years | 0 (0.0%) | 0 (0.0%) |
| 20 to 34 years | 0 (0.0%) | 0 (0.0%) |
| 35 to 50 years | 4 (100.0%) | 0 (0.0%) |
| Total | 4 (100.0%) | 0 (0.0%) |
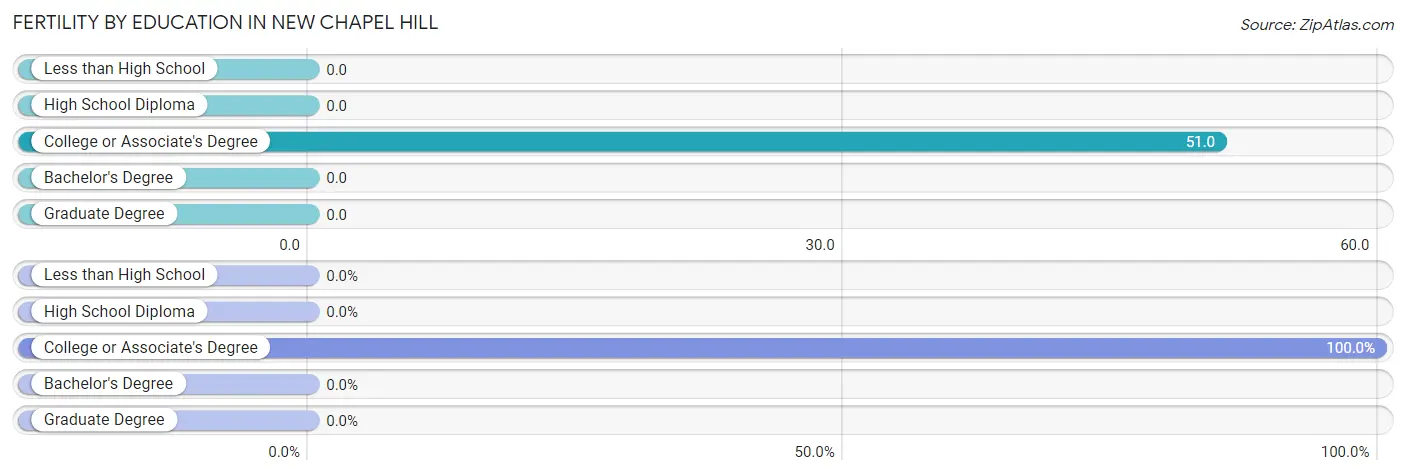
Fertility by Education in New Chapel Hill
| Educational Attainment | Women with Births | Births / 1,000 Women |
| Less than High School | 0 (0.0%) | 0.0 |
| High School Diploma | 0 (0.0%) | 0.0 |
| College or Associate's Degree | 4 (100.0%) | 51.0 |
| Bachelor's Degree | 0 (0.0%) | 0.0 |
| Graduate Degree | 0 (0.0%) | 0.0 |
| Total | 4 (100.0%) | 22.0 |
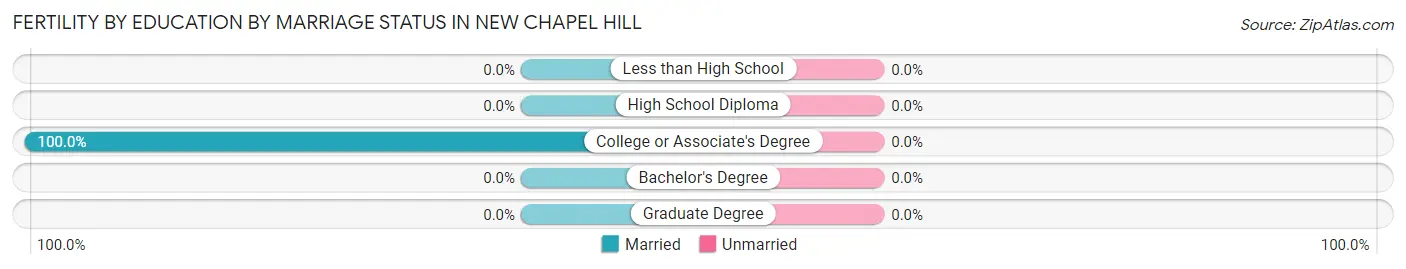
Fertility by Education by Marriage Status in New Chapel Hill
| Educational Attainment | Married | Unmarried |
| Less than High School | 0 (0.0%) | 0 (0.0%) |
| High School Diploma | 0 (0.0%) | 0 (0.0%) |
| College or Associate's Degree | 4 (100.0%) | 0 (0.0%) |
| Bachelor's Degree | 0 (0.0%) | 0 (0.0%) |
| Graduate Degree | 0 (0.0%) | 0 (0.0%) |
| Total | 4 (100.0%) | 0 (0.0%) |
Employment Characteristics in New Chapel Hill
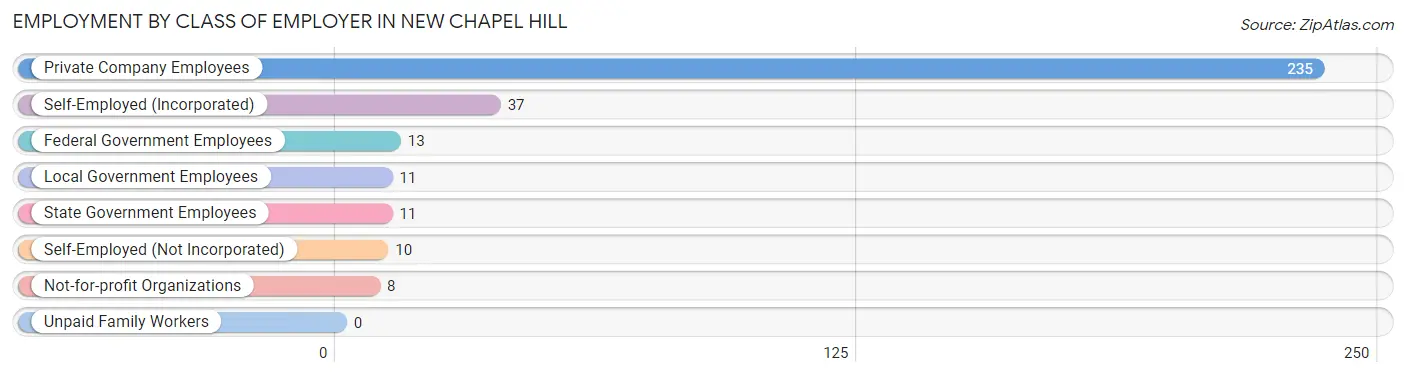
Employment by Class of Employer in New Chapel Hill
Among the 325 employed individuals in New Chapel Hill, private company employees (235 | 72.3%), self-employed (incorporated) (37 | 11.4%), and federal government employees (13 | 4.0%) make up the most common classes of employment.
| Employer Class | # Employees | % Employees |
| Private Company Employees | 235 | 72.3% |
| Self-Employed (Incorporated) | 37 | 11.4% |
| Self-Employed (Not Incorporated) | 10 | 3.1% |
| Not-for-profit Organizations | 8 | 2.5% |
| Local Government Employees | 11 | 3.4% |
| State Government Employees | 11 | 3.4% |
| Federal Government Employees | 13 | 4.0% |
| Unpaid Family Workers | 0 | 0.0% |
| Total | 325 | 100.0% |
Employment Status by Age in New Chapel Hill
According to the labor force statistics for New Chapel Hill, out of the total population over 16 years of age (659), 55.2% or 364 individuals are in the labor force, with 10.7% or 39 of them unemployed. The age group with the highest labor force participation rate is 30 to 34 years, with 93.2% or 41 individuals in the labor force. Within the labor force, the 30 to 34 years age range has the highest percentage of unemployed individuals, with 48.8% or 20 of them being unemployed.
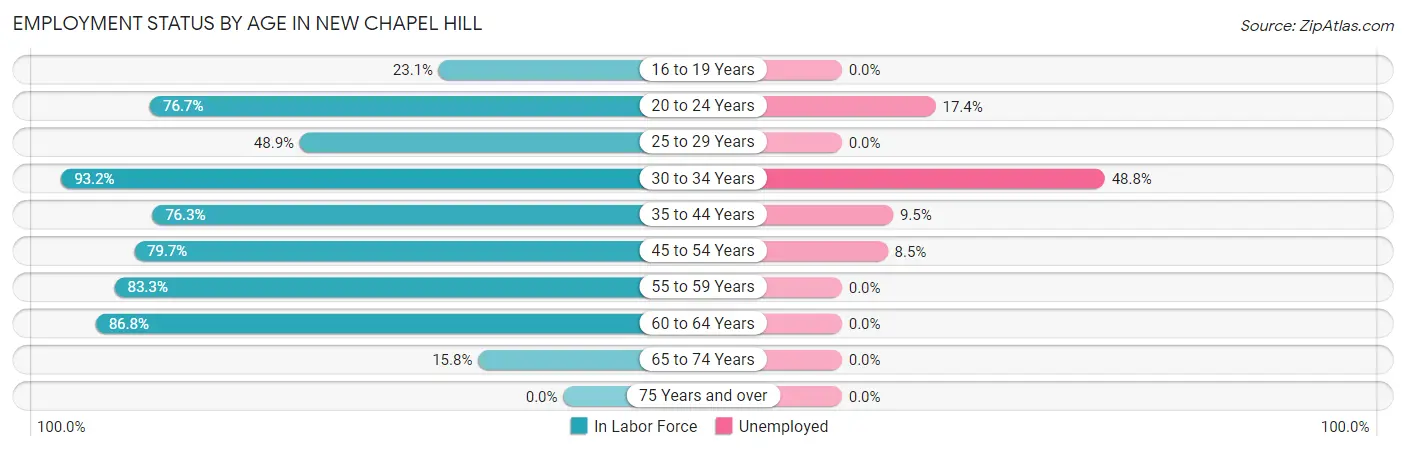
| Age Bracket | In Labor Force | Unemployed |
| 16 to 19 Years | 6 (23.1%) | 0 (0.0%) |
| 20 to 24 Years | 23 (76.7%) | 4 (17.4%) |
| 25 to 29 Years | 22 (48.9%) | 0 (0.0%) |
| 30 to 34 Years | 41 (93.2%) | 20 (48.8%) |
| 35 to 44 Years | 74 (76.3%) | 7 (9.5%) |
| 45 to 54 Years | 94 (79.7%) | 8 (8.5%) |
| 55 to 59 Years | 50 (83.3%) | 0 (0.0%) |
| 60 to 64 Years | 33 (86.8%) | 0 (0.0%) |
| 65 to 74 Years | 21 (15.8%) | 0 (0.0%) |
| 75 Years and over | 0 (0.0%) | 0 (0.0%) |
| Total | 364 (55.2%) | 39 (10.7%) |
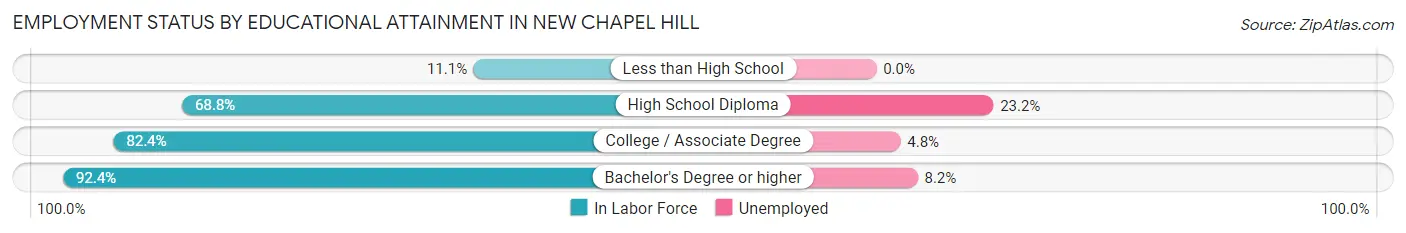
Employment Status by Educational Attainment in New Chapel Hill
According to labor force statistics for New Chapel Hill, 78.1% of individuals (314) out of the total population between 25 and 64 years of age (402) are in the labor force, with 11.1% or 35 of them being unemployed. The group with the highest labor force participation rate are those with the educational attainment of bachelor's degree or higher, with 92.4% or 73 individuals in the labor force. Within the labor force, individuals with high school diploma education have the highest percentage of unemployment, with 23.2% or 22 of them being unemployed.
| Educational Attainment | In Labor Force | Unemployed |
| Less than High School | 1 (11.1%) | 0 (0.0%) |
| High School Diploma | 95 (68.8%) | 32 (23.2%) |
| College / Associate Degree | 145 (82.4%) | 8 (4.8%) |
| Bachelor's Degree or higher | 73 (92.4%) | 6 (8.2%) |
| Total | 314 (78.1%) | 45 (11.1%) |
Employment Occupations by Sex in New Chapel Hill
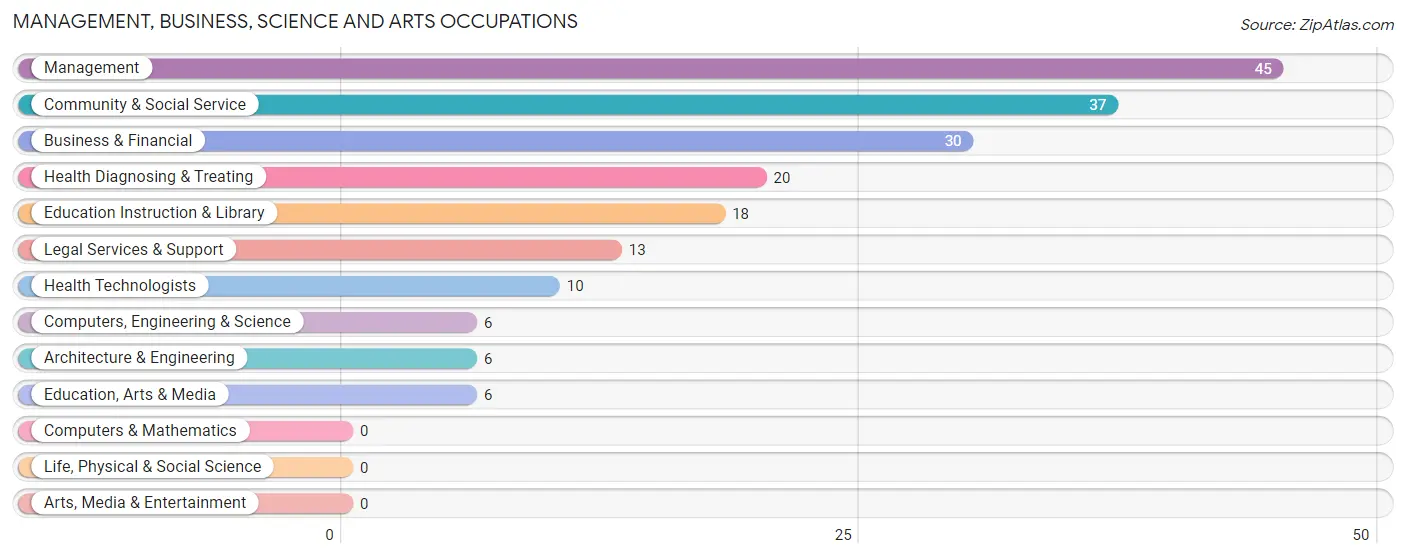
Management, Business, Science and Arts Occupations
The most common Management, Business, Science and Arts occupations in New Chapel Hill are Management (45 | 13.9%), Community & Social Service (37 | 11.4%), Business & Financial (30 | 9.2%), Health Diagnosing & Treating (20 | 6.1%), and Education Instruction & Library (18 | 5.5%).
Management, Business, Science and Arts Occupations by Sex
Within the Management, Business, Science and Arts occupations in New Chapel Hill, the most male-oriented occupations are Computers, Engineering & Science (100.0%), Architecture & Engineering (100.0%), and Education, Arts & Media (100.0%), while the most female-oriented occupations are Education Instruction & Library (100.0%), Health Technologists (100.0%), and Health Diagnosing & Treating (90.0%).
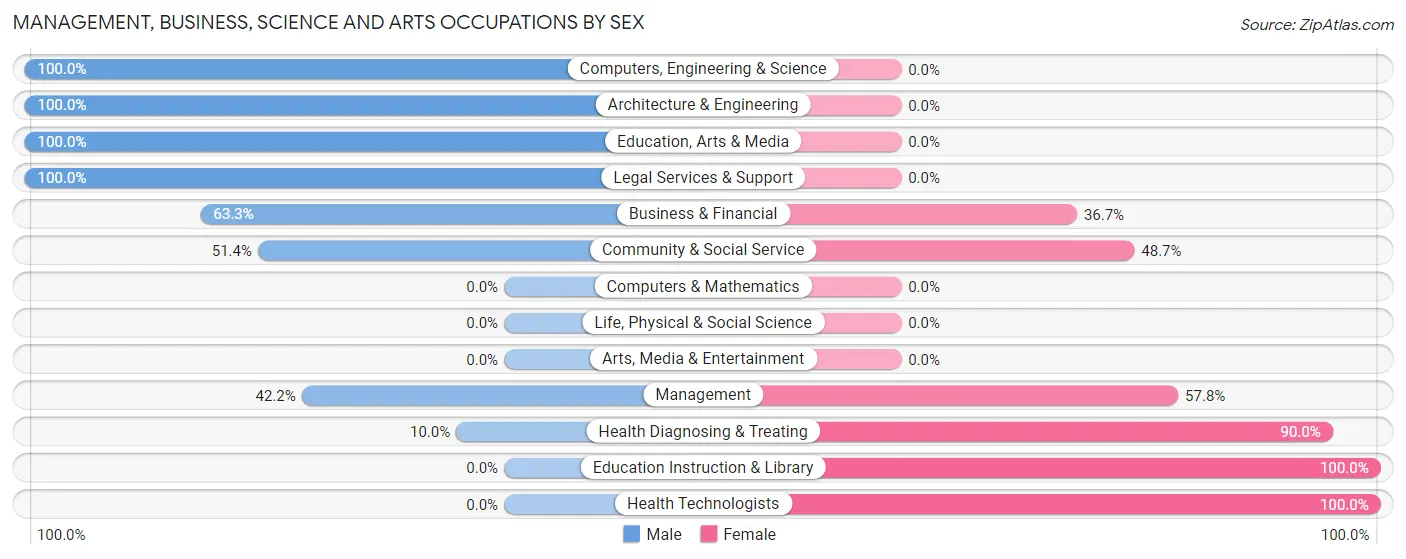
| Occupation | Male | Female |
| Management | 19 (42.2%) | 26 (57.8%) |
| Business & Financial | 19 (63.3%) | 11 (36.7%) |
| Computers, Engineering & Science | 6 (100.0%) | 0 (0.0%) |
| Computers & Mathematics | 0 (0.0%) | 0 (0.0%) |
| Architecture & Engineering | 6 (100.0%) | 0 (0.0%) |
| Life, Physical & Social Science | 0 (0.0%) | 0 (0.0%) |
| Community & Social Service | 19 (51.3%) | 18 (48.6%) |
| Education, Arts & Media | 6 (100.0%) | 0 (0.0%) |
| Legal Services & Support | 13 (100.0%) | 0 (0.0%) |
| Education Instruction & Library | 0 (0.0%) | 18 (100.0%) |
| Arts, Media & Entertainment | 0 (0.0%) | 0 (0.0%) |
| Health Diagnosing & Treating | 2 (10.0%) | 18 (90.0%) |
| Health Technologists | 0 (0.0%) | 10 (100.0%) |
| Total (Category) | 65 (47.1%) | 73 (52.9%) |
| Total (Overall) | 177 (54.5%) | 148 (45.5%) |
Services Occupations
The most common Services occupations in New Chapel Hill are Food Preparation & Serving (14 | 4.3%), and Healthcare Support (3 | 0.9%).
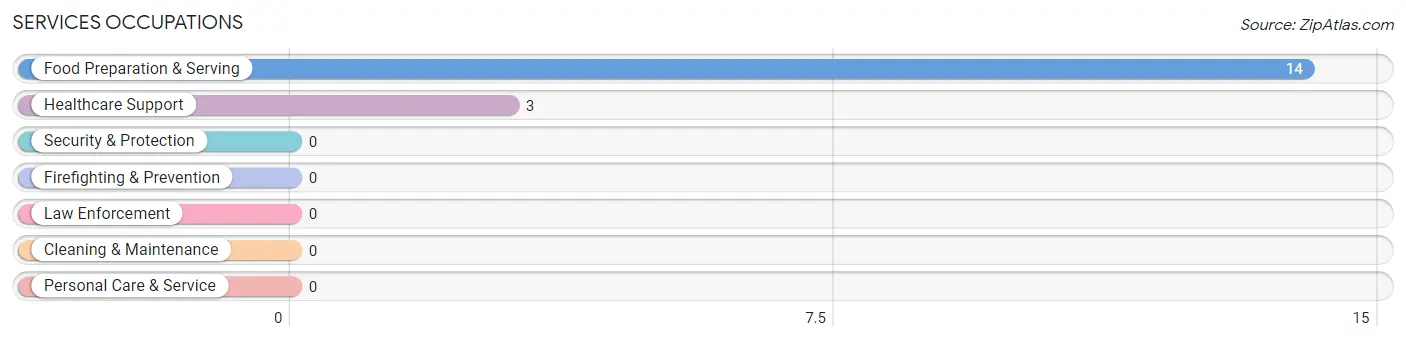
Services Occupations by Sex
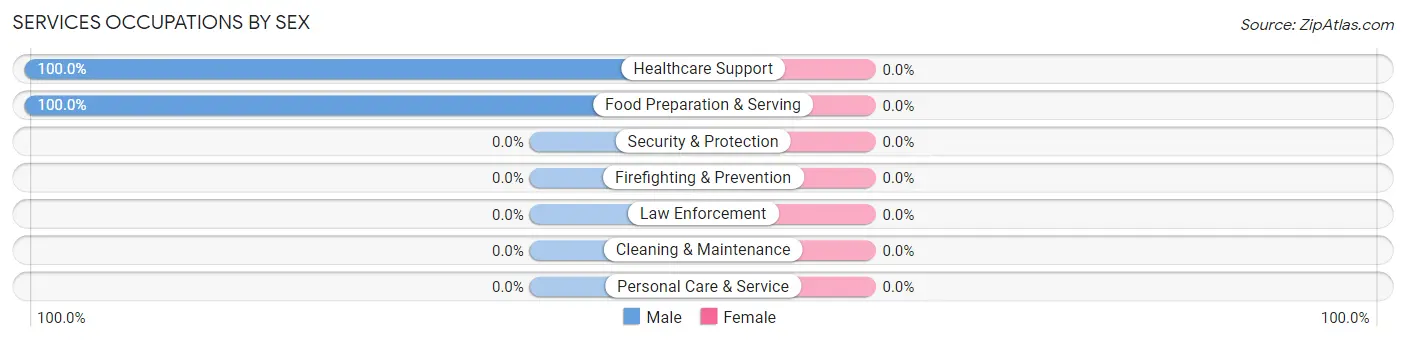
| Occupation | Male | Female |
| Healthcare Support | 3 (100.0%) | 0 (0.0%) |
| Security & Protection | 0 (0.0%) | 0 (0.0%) |
| Firefighting & Prevention | 0 (0.0%) | 0 (0.0%) |
| Law Enforcement | 0 (0.0%) | 0 (0.0%) |
| Food Preparation & Serving | 14 (100.0%) | 0 (0.0%) |
| Cleaning & Maintenance | 0 (0.0%) | 0 (0.0%) |
| Personal Care & Service | 0 (0.0%) | 0 (0.0%) |
| Total (Category) | 17 (100.0%) | 0 (0.0%) |
| Total (Overall) | 177 (54.5%) | 148 (45.5%) |
Sales and Office Occupations
The most common Sales and Office occupations in New Chapel Hill are Office & Administration (52 | 16.0%), and Sales & Related (35 | 10.8%).

Sales and Office Occupations by Sex
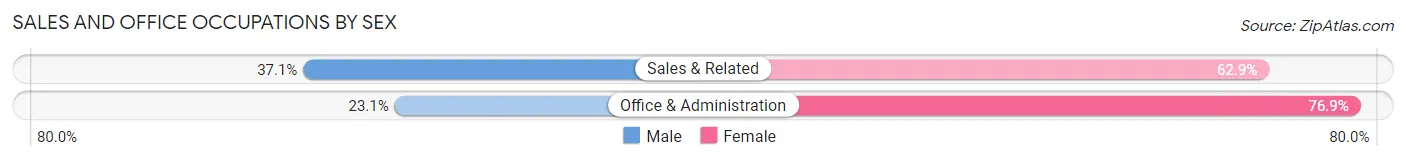
| Occupation | Male | Female |
| Sales & Related | 13 (37.1%) | 22 (62.9%) |
| Office & Administration | 12 (23.1%) | 40 (76.9%) |
| Total (Category) | 25 (28.7%) | 62 (71.3%) |
| Total (Overall) | 177 (54.5%) | 148 (45.5%) |
Natural Resources, Construction and Maintenance Occupations
The most common Natural Resources, Construction and Maintenance occupations in New Chapel Hill are Construction & Extraction (19 | 5.9%), and Installation, Maintenance & Repair (11 | 3.4%).
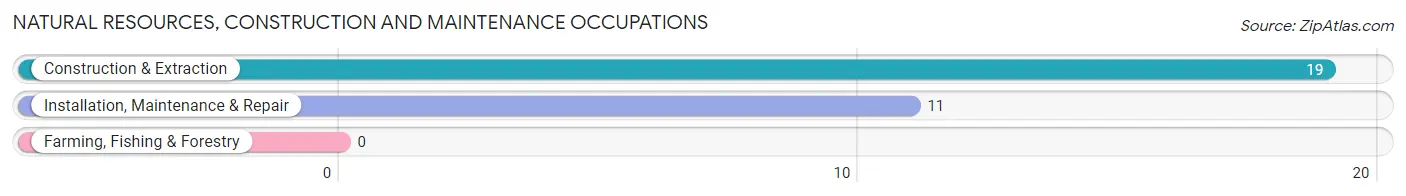
Natural Resources, Construction and Maintenance Occupations by Sex
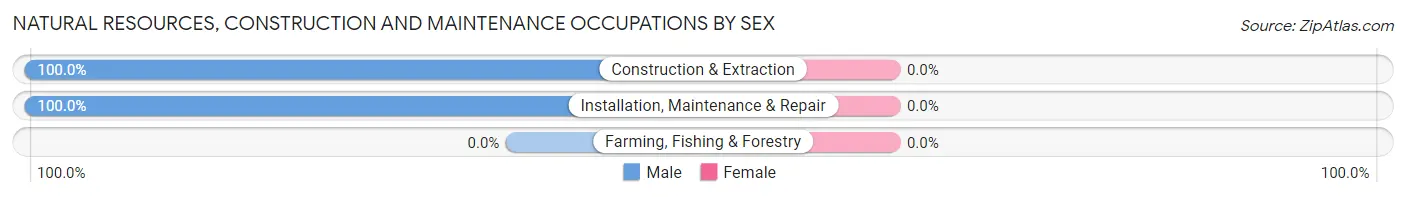
| Occupation | Male | Female |
| Farming, Fishing & Forestry | 0 (0.0%) | 0 (0.0%) |
| Construction & Extraction | 19 (100.0%) | 0 (0.0%) |
| Installation, Maintenance & Repair | 11 (100.0%) | 0 (0.0%) |
| Total (Category) | 30 (100.0%) | 0 (0.0%) |
| Total (Overall) | 177 (54.5%) | 148 (45.5%) |
Production, Transportation and Moving Occupations
The most common Production, Transportation and Moving occupations in New Chapel Hill are Transportation (27 | 8.3%), Material Moving (14 | 4.3%), and Production (12 | 3.7%).
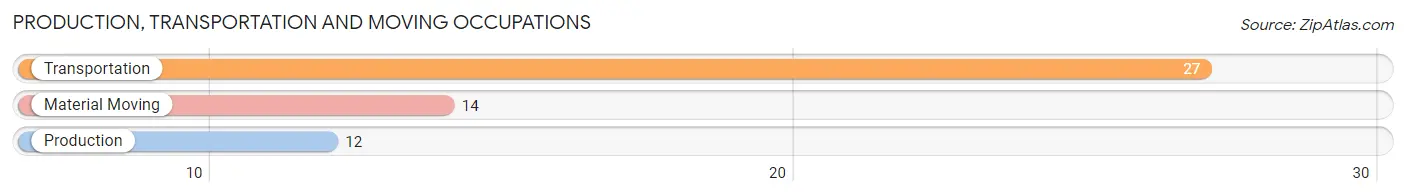
Production, Transportation and Moving Occupations by Sex

| Occupation | Male | Female |
| Production | 12 (100.0%) | 0 (0.0%) |
| Transportation | 27 (100.0%) | 0 (0.0%) |
| Material Moving | 1 (7.1%) | 13 (92.9%) |
| Total (Category) | 40 (75.5%) | 13 (24.5%) |
| Total (Overall) | 177 (54.5%) | 148 (45.5%) |
Employment Industries by Sex in New Chapel Hill
Employment Industries in New Chapel Hill
The major employment industries in New Chapel Hill include Retail Trade (56 | 17.2%), Health Care & Social Assistance (40 | 12.3%), Construction (36 | 11.1%), Transportation & Warehousing (27 | 8.3%), and Real Estate, Rental & Leasing (26 | 8.0%).
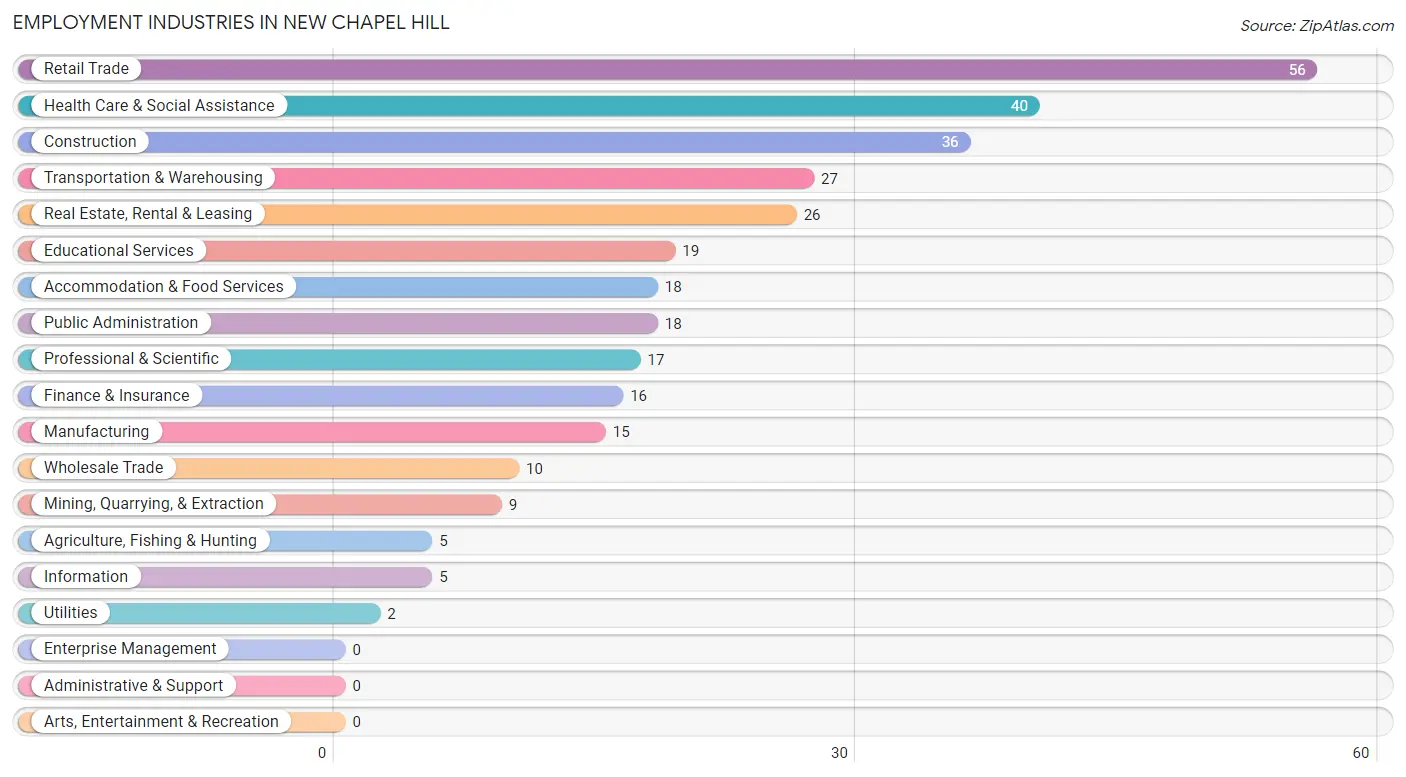
Employment Industries by Sex in New Chapel Hill
The New Chapel Hill industries that see more men than women are Mining, Quarrying, & Extraction (100.0%), Manufacturing (100.0%), and Wholesale Trade (100.0%), whereas the industries that tend to have a higher number of women are Agriculture, Fishing & Hunting (100.0%), Utilities (100.0%), and Real Estate, Rental & Leasing (100.0%).
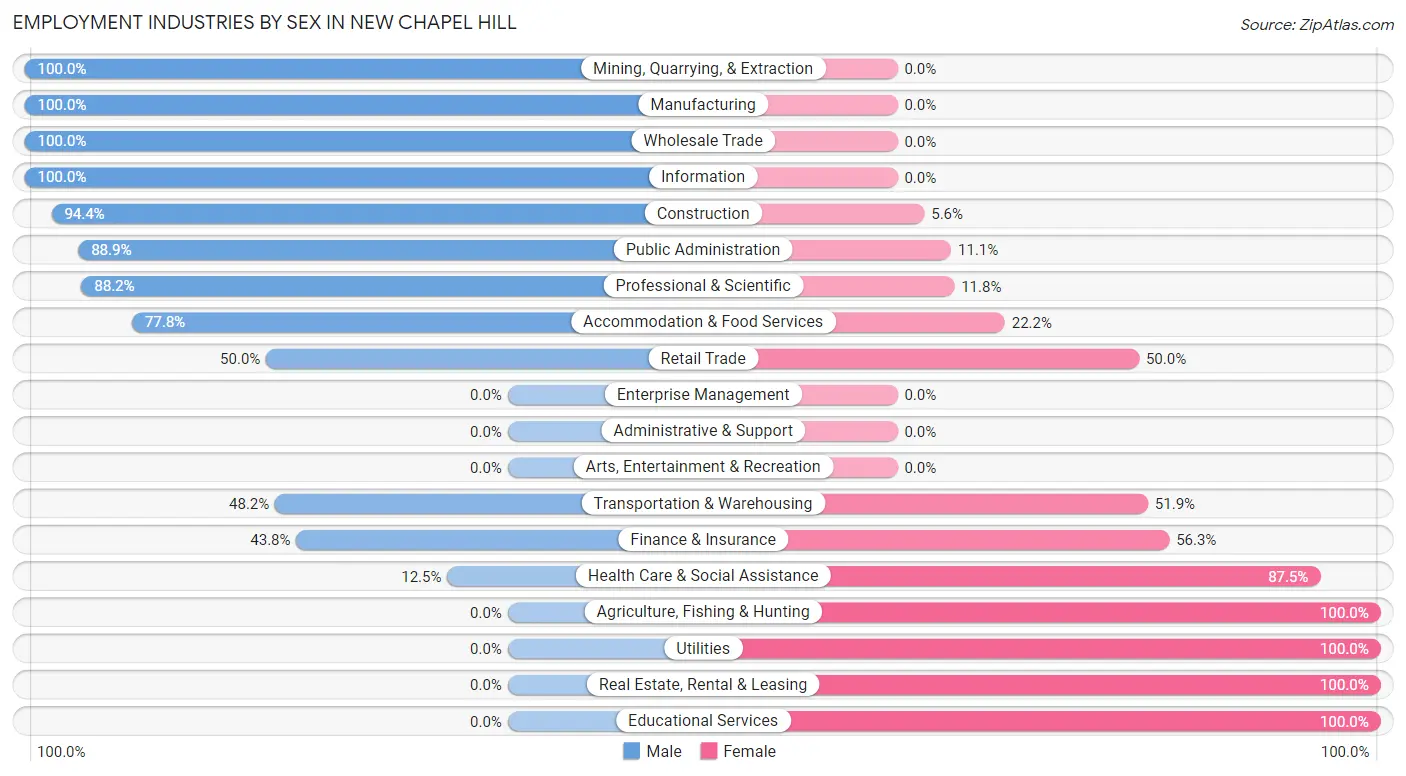
| Industry | Male | Female |
| Agriculture, Fishing & Hunting | 0 (0.0%) | 5 (100.0%) |
| Mining, Quarrying, & Extraction | 9 (100.0%) | 0 (0.0%) |
| Construction | 34 (94.4%) | 2 (5.6%) |
| Manufacturing | 15 (100.0%) | 0 (0.0%) |
| Wholesale Trade | 10 (100.0%) | 0 (0.0%) |
| Retail Trade | 28 (50.0%) | 28 (50.0%) |
| Transportation & Warehousing | 13 (48.1%) | 14 (51.8%) |
| Utilities | 0 (0.0%) | 2 (100.0%) |
| Information | 5 (100.0%) | 0 (0.0%) |
| Finance & Insurance | 7 (43.8%) | 9 (56.2%) |
| Real Estate, Rental & Leasing | 0 (0.0%) | 26 (100.0%) |
| Professional & Scientific | 15 (88.2%) | 2 (11.8%) |
| Enterprise Management | 0 (0.0%) | 0 (0.0%) |
| Administrative & Support | 0 (0.0%) | 0 (0.0%) |
| Educational Services | 0 (0.0%) | 19 (100.0%) |
| Health Care & Social Assistance | 5 (12.5%) | 35 (87.5%) |
| Arts, Entertainment & Recreation | 0 (0.0%) | 0 (0.0%) |
| Accommodation & Food Services | 14 (77.8%) | 4 (22.2%) |
| Public Administration | 16 (88.9%) | 2 (11.1%) |
| Total | 177 (54.5%) | 148 (45.5%) |
Education in New Chapel Hill
School Enrollment in New Chapel Hill
The most common levels of schooling among the 115 students in New Chapel Hill are middle school (31 | 27.0%), college / undergraduate (25 | 21.7%), and high school (24 | 20.9%).
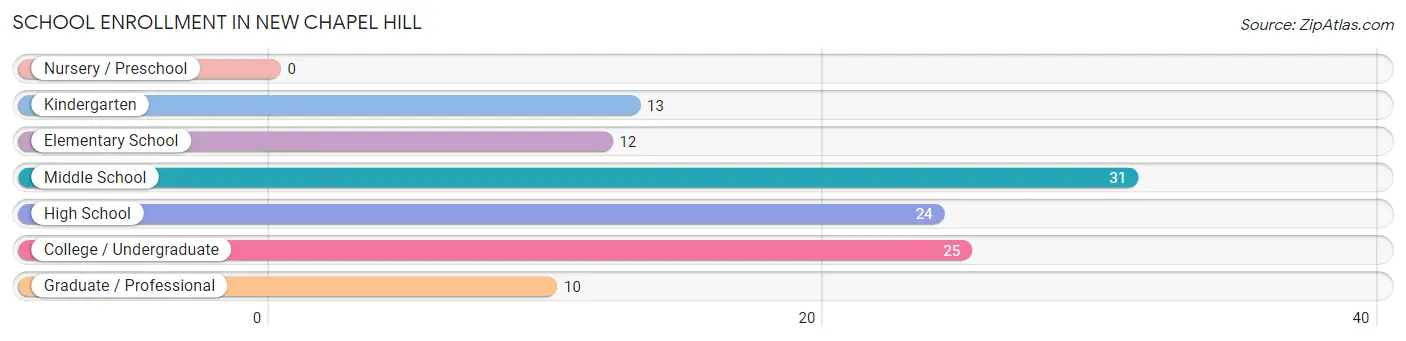
| School Level | # Students | % Students |
| Nursery / Preschool | 0 | 0.0% |
| Kindergarten | 13 | 11.3% |
| Elementary School | 12 | 10.4% |
| Middle School | 31 | 27.0% |
| High School | 24 | 20.9% |
| College / Undergraduate | 25 | 21.7% |
| Graduate / Professional | 10 | 8.7% |
| Total | 115 | 100.0% |
School Enrollment by Age by Funding Source in New Chapel Hill
Out of a total of 115 students who are enrolled in schools in New Chapel Hill, 5 (4.3%) attend a private institution, while the remaining 110 (95.7%) are enrolled in public schools. The age group of 10 to 14 year olds has the highest likelihood of being enrolled in private schools, with 3 (9.1% in the age bracket) enrolled. Conversely, the age group of 15 to 17 year olds has the lowest likelihood of being enrolled in a private school, with 25 (100.0% in the age bracket) attending a public institution.
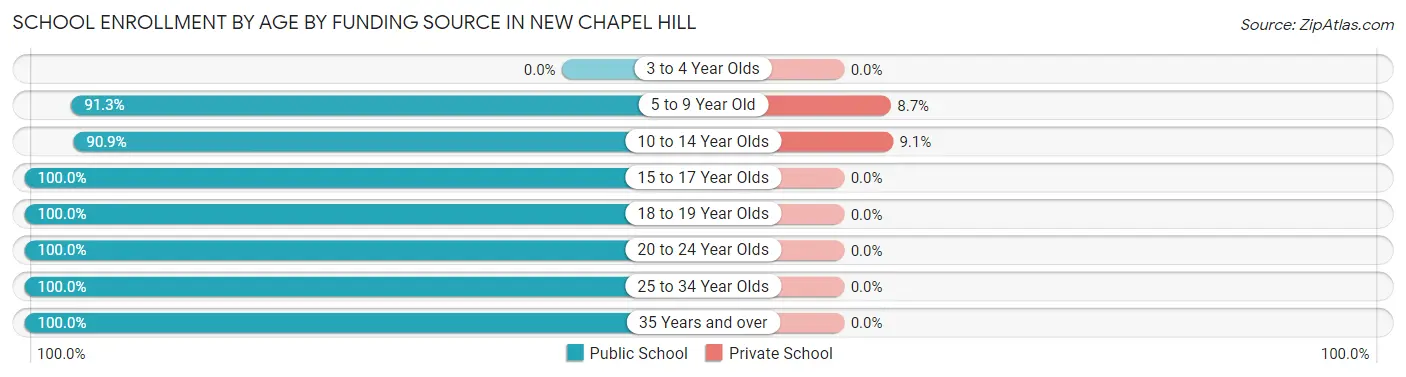
| Age Bracket | Public School | Private School |
| 3 to 4 Year Olds | 0 (0.0%) | 0 (0.0%) |
| 5 to 9 Year Old | 21 (91.3%) | 2 (8.7%) |
| 10 to 14 Year Olds | 30 (90.9%) | 3 (9.1%) |
| 15 to 17 Year Olds | 25 (100.0%) | 0 (0.0%) |
| 18 to 19 Year Olds | 7 (100.0%) | 0 (0.0%) |
| 20 to 24 Year Olds | 3 (100.0%) | 0 (0.0%) |
| 25 to 34 Year Olds | 3 (100.0%) | 0 (0.0%) |
| 35 Years and over | 21 (100.0%) | 0 (0.0%) |
| Total | 110 (95.7%) | 5 (4.3%) |
Educational Attainment by Field of Study in New Chapel Hill
Business (66 | 38.6%), literature & languages (23 | 13.5%), liberal arts & history (20 | 11.7%), education (14 | 8.2%), and physical & health sciences (12 | 7.0%) are the most common fields of study among 171 individuals in New Chapel Hill who have obtained a bachelor's degree or higher.
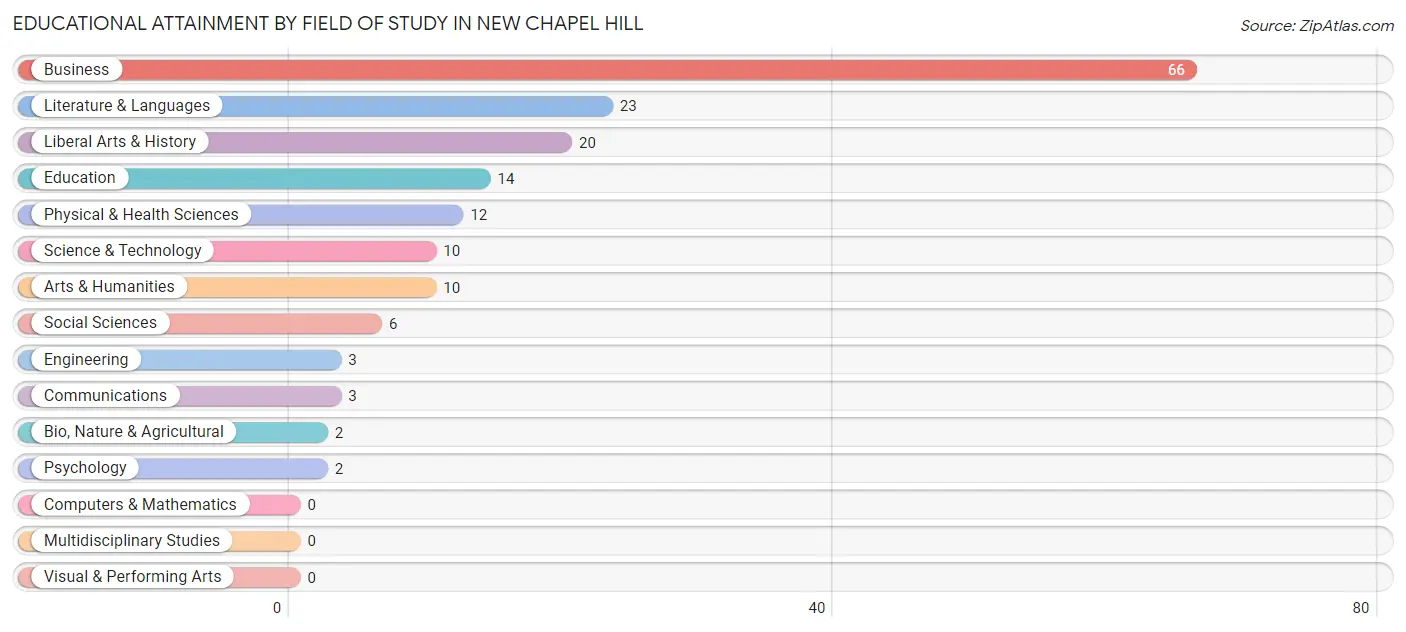
| Field of Study | # Graduates | % Graduates |
| Computers & Mathematics | 0 | 0.0% |
| Bio, Nature & Agricultural | 2 | 1.2% |
| Physical & Health Sciences | 12 | 7.0% |
| Psychology | 2 | 1.2% |
| Social Sciences | 6 | 3.5% |
| Engineering | 3 | 1.8% |
| Multidisciplinary Studies | 0 | 0.0% |
| Science & Technology | 10 | 5.9% |
| Business | 66 | 38.6% |
| Education | 14 | 8.2% |
| Literature & Languages | 23 | 13.5% |
| Liberal Arts & History | 20 | 11.7% |
| Visual & Performing Arts | 0 | 0.0% |
| Communications | 3 | 1.8% |
| Arts & Humanities | 10 | 5.9% |
| Total | 171 | 100.0% |
Transportation & Commute in New Chapel Hill
Vehicle Availability by Sex in New Chapel Hill
The most prevalent vehicle ownership categories in New Chapel Hill are males with 3 vehicles (91, accounting for 51.4%) and females with 3 vehicles (37, making up 61.5%).
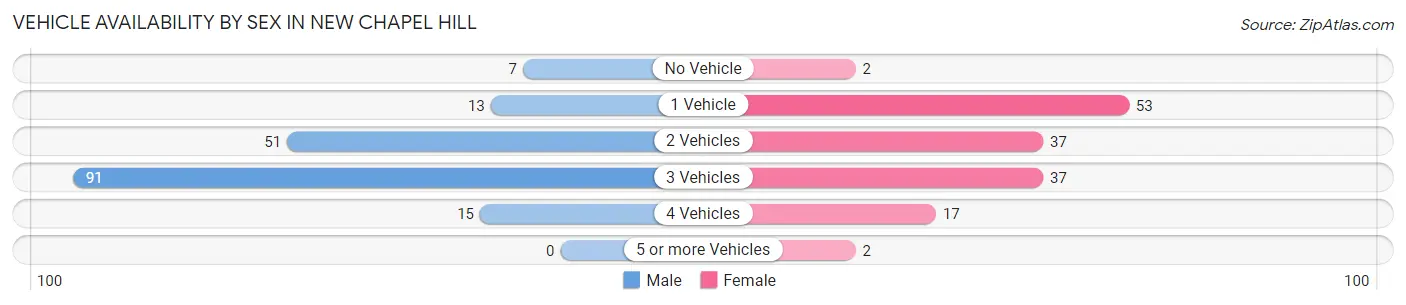
| Vehicles Available | Male | Female |
| No Vehicle | 7 (4.0%) | 2 (1.3%) |
| 1 Vehicle | 13 (7.3%) | 53 (35.8%) |
| 2 Vehicles | 51 (28.8%) | 37 (25.0%) |
| 3 Vehicles | 91 (51.4%) | 37 (25.0%) |
| 4 Vehicles | 15 (8.5%) | 17 (11.5%) |
| 5 or more Vehicles | 0 (0.0%) | 2 (1.3%) |
| Total | 177 (100.0%) | 148 (100.0%) |
Commute Time in New Chapel Hill
The most frequently occuring commute durations in New Chapel Hill are 20 to 24 minutes (100 commuters, 35.2%), 30 to 34 minutes (68 commuters, 23.9%), and 15 to 19 minutes (44 commuters, 15.5%).
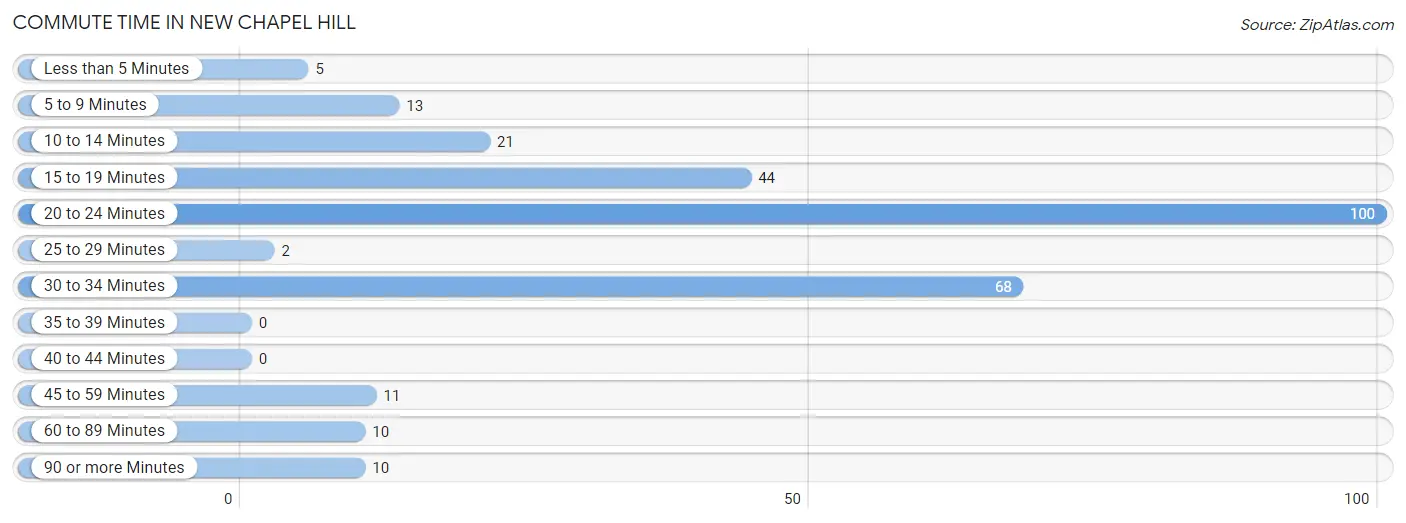
| Commute Time | # Commuters | % Commuters |
| Less than 5 Minutes | 5 | 1.8% |
| 5 to 9 Minutes | 13 | 4.6% |
| 10 to 14 Minutes | 21 | 7.4% |
| 15 to 19 Minutes | 44 | 15.5% |
| 20 to 24 Minutes | 100 | 35.2% |
| 25 to 29 Minutes | 2 | 0.7% |
| 30 to 34 Minutes | 68 | 23.9% |
| 35 to 39 Minutes | 0 | 0.0% |
| 40 to 44 Minutes | 0 | 0.0% |
| 45 to 59 Minutes | 11 | 3.9% |
| 60 to 89 Minutes | 10 | 3.5% |
| 90 or more Minutes | 10 | 3.5% |
Commute Time by Sex in New Chapel Hill
The most common commute times in New Chapel Hill are 20 to 24 minutes (54 commuters, 36.2%) for males and 20 to 24 minutes (46 commuters, 34.1%) for females.
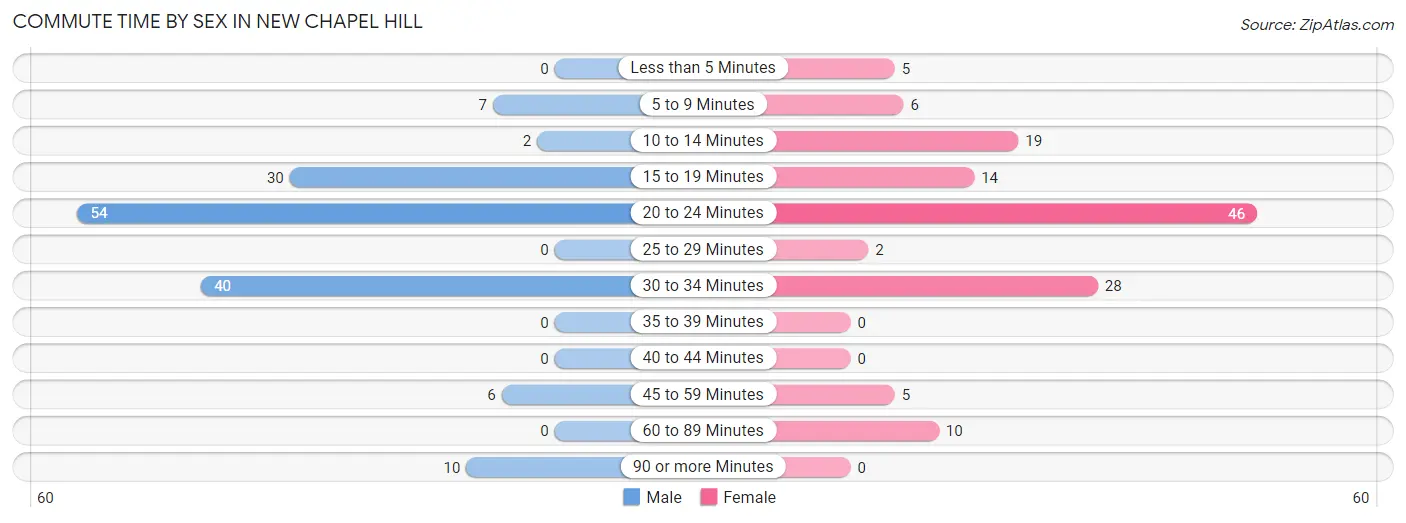
| Commute Time | Male | Female |
| Less than 5 Minutes | 0 (0.0%) | 5 (3.7%) |
| 5 to 9 Minutes | 7 (4.7%) | 6 (4.4%) |
| 10 to 14 Minutes | 2 (1.3%) | 19 (14.1%) |
| 15 to 19 Minutes | 30 (20.1%) | 14 (10.4%) |
| 20 to 24 Minutes | 54 (36.2%) | 46 (34.1%) |
| 25 to 29 Minutes | 0 (0.0%) | 2 (1.5%) |
| 30 to 34 Minutes | 40 (26.9%) | 28 (20.7%) |
| 35 to 39 Minutes | 0 (0.0%) | 0 (0.0%) |
| 40 to 44 Minutes | 0 (0.0%) | 0 (0.0%) |
| 45 to 59 Minutes | 6 (4.0%) | 5 (3.7%) |
| 60 to 89 Minutes | 0 (0.0%) | 10 (7.4%) |
| 90 or more Minutes | 10 (6.7%) | 0 (0.0%) |
Time of Departure to Work by Sex in New Chapel Hill
The most frequent times of departure to work in New Chapel Hill are 12:00 AM to 4:59 AM (39, 26.2%) for males and 7:00 AM to 7:29 AM (35, 25.9%) for females.
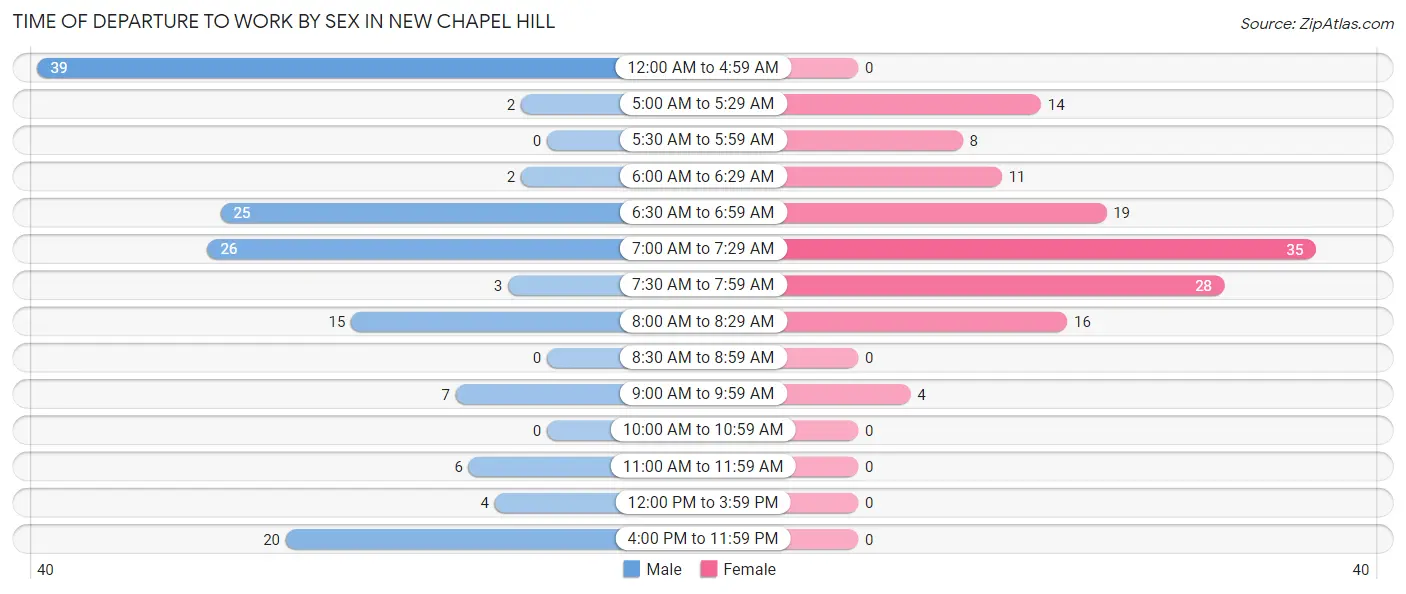
| Time of Departure | Male | Female |
| 12:00 AM to 4:59 AM | 39 (26.2%) | 0 (0.0%) |
| 5:00 AM to 5:29 AM | 2 (1.3%) | 14 (10.4%) |
| 5:30 AM to 5:59 AM | 0 (0.0%) | 8 (5.9%) |
| 6:00 AM to 6:29 AM | 2 (1.3%) | 11 (8.2%) |
| 6:30 AM to 6:59 AM | 25 (16.8%) | 19 (14.1%) |
| 7:00 AM to 7:29 AM | 26 (17.4%) | 35 (25.9%) |
| 7:30 AM to 7:59 AM | 3 (2.0%) | 28 (20.7%) |
| 8:00 AM to 8:29 AM | 15 (10.1%) | 16 (11.8%) |
| 8:30 AM to 8:59 AM | 0 (0.0%) | 0 (0.0%) |
| 9:00 AM to 9:59 AM | 7 (4.7%) | 4 (3.0%) |
| 10:00 AM to 10:59 AM | 0 (0.0%) | 0 (0.0%) |
| 11:00 AM to 11:59 AM | 6 (4.0%) | 0 (0.0%) |
| 12:00 PM to 3:59 PM | 4 (2.7%) | 0 (0.0%) |
| 4:00 PM to 11:59 PM | 20 (13.4%) | 0 (0.0%) |
| Total | 149 (100.0%) | 135 (100.0%) |
Housing Occupancy in New Chapel Hill
Occupancy by Ownership in New Chapel Hill
Of the total 279 dwellings in New Chapel Hill, owner-occupied units account for 197 (70.6%), while renter-occupied units make up 82 (29.4%).
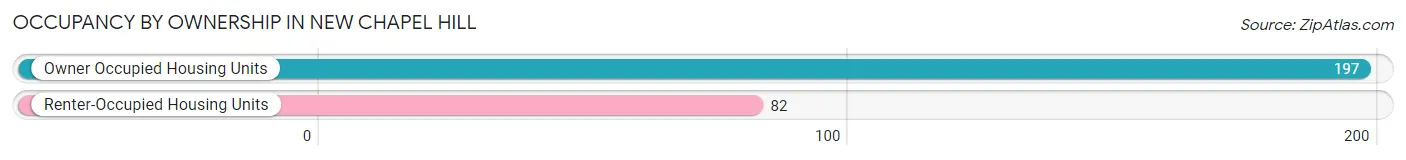
| Occupancy | # Housing Units | % Housing Units |
| Owner Occupied Housing Units | 197 | 70.6% |
| Renter-Occupied Housing Units | 82 | 29.4% |
| Total Occupied Housing Units | 279 | 100.0% |
Occupancy by Household Size in New Chapel Hill
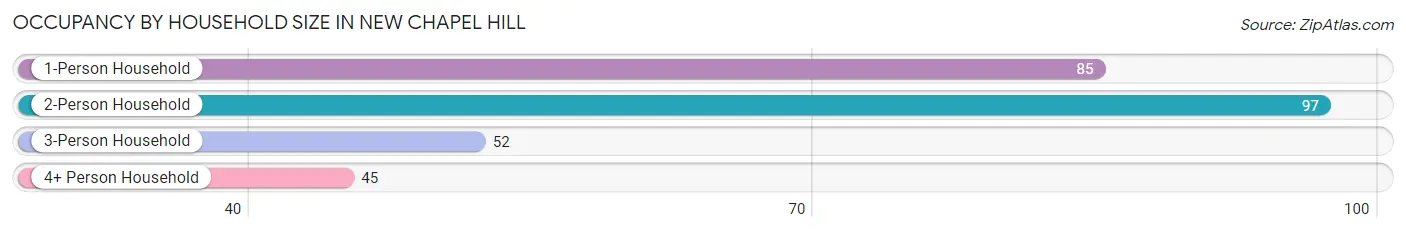
| Household Size | # Housing Units | % Housing Units |
| 1-Person Household | 85 | 30.5% |
| 2-Person Household | 97 | 34.8% |
| 3-Person Household | 52 | 18.6% |
| 4+ Person Household | 45 | 16.1% |
| Total Housing Units | 279 | 100.0% |
Occupancy by Ownership by Household Size in New Chapel Hill
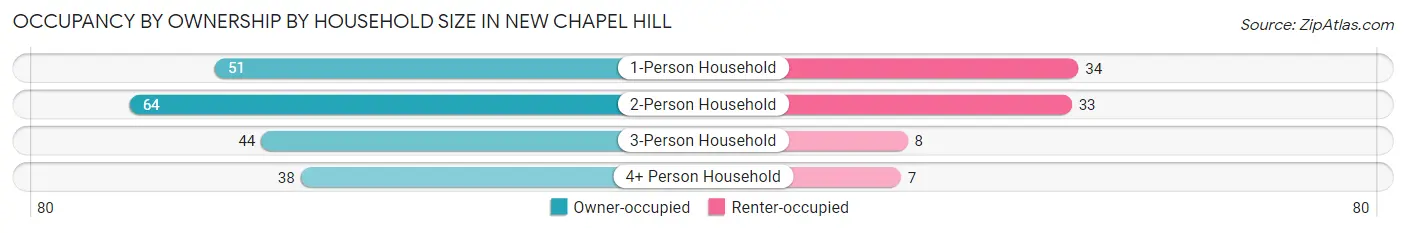
| Household Size | Owner-occupied | Renter-occupied |
| 1-Person Household | 51 (60.0%) | 34 (40.0%) |
| 2-Person Household | 64 (66.0%) | 33 (34.0%) |
| 3-Person Household | 44 (84.6%) | 8 (15.4%) |
| 4+ Person Household | 38 (84.4%) | 7 (15.6%) |
| Total Housing Units | 197 (70.6%) | 82 (29.4%) |
Occupancy by Educational Attainment in New Chapel Hill
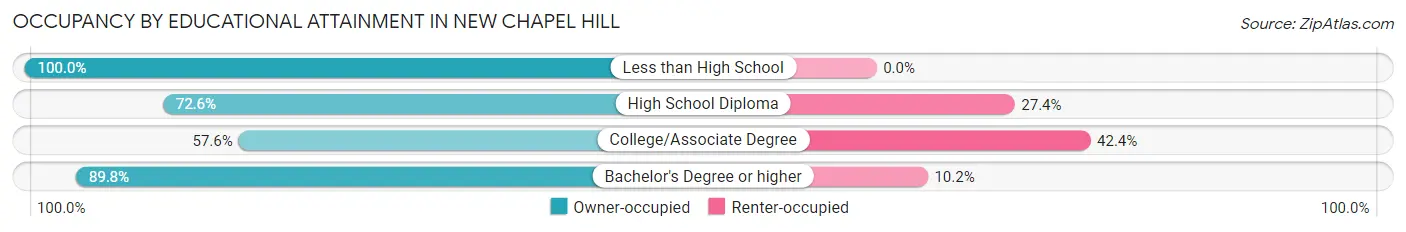
| Household Size | Owner-occupied | Renter-occupied |
| Less than High School | 15 (100.0%) | 0 (0.0%) |
| High School Diploma | 53 (72.6%) | 20 (27.4%) |
| College/Associate Degree | 76 (57.6%) | 56 (42.4%) |
| Bachelor's Degree or higher | 53 (89.8%) | 6 (10.2%) |
Occupancy by Age of Householder in New Chapel Hill
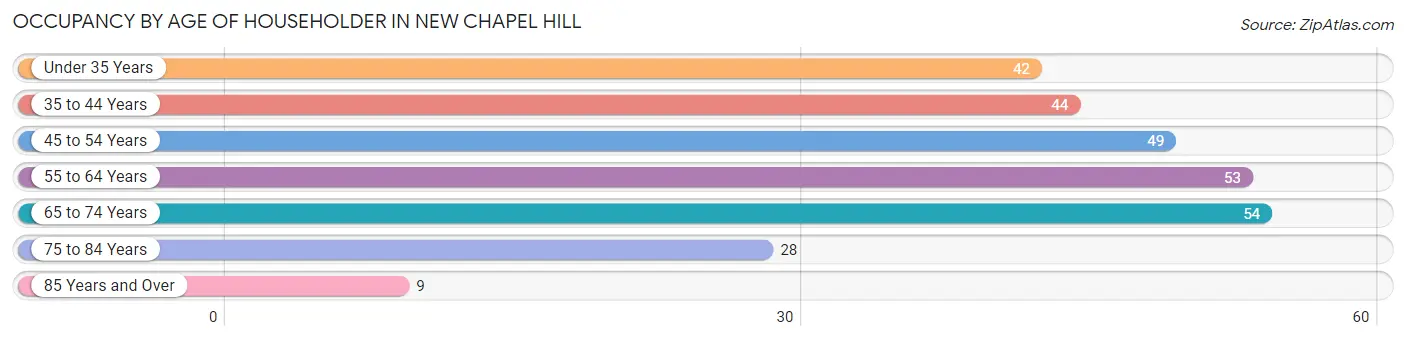
| Age Bracket | # Households | % Households |
| Under 35 Years | 42 | 15.0% |
| 35 to 44 Years | 44 | 15.8% |
| 45 to 54 Years | 49 | 17.6% |
| 55 to 64 Years | 53 | 19.0% |
| 65 to 74 Years | 54 | 19.4% |
| 75 to 84 Years | 28 | 10.0% |
| 85 Years and Over | 9 | 3.2% |
| Total | 279 | 100.0% |
Housing Finances in New Chapel Hill
Median Income by Occupancy in New Chapel Hill
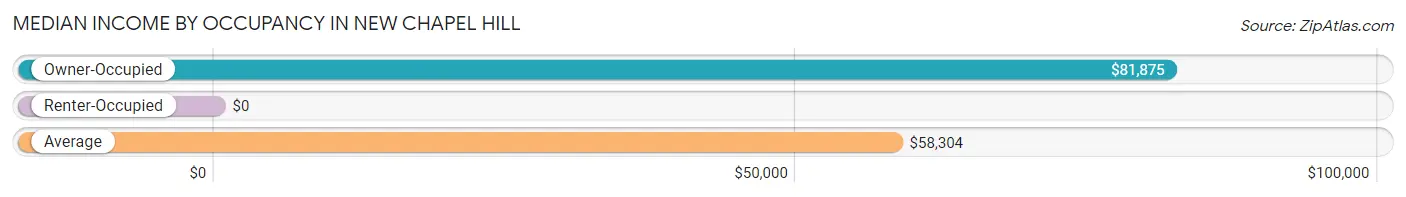
| Occupancy Type | # Households | Median Income |
| Owner-Occupied | 197 (70.6%) | $81,875 |
| Renter-Occupied | 82 (29.4%) | $0 |
| Average | 279 (100.0%) | $58,304 |
Occupancy by Householder Income Bracket in New Chapel Hill
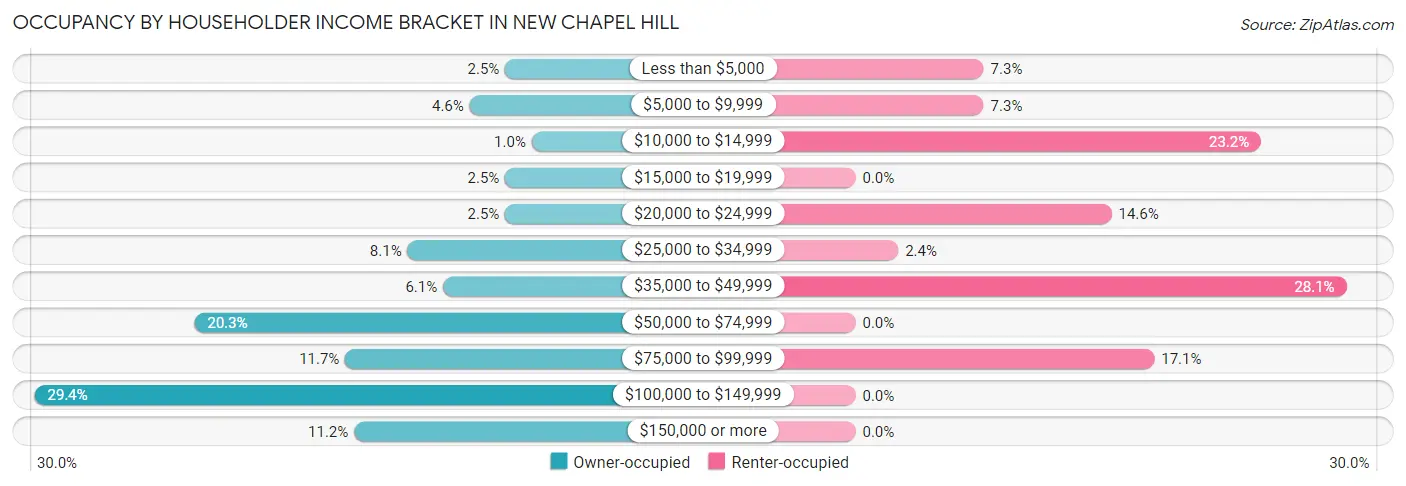
| Income Bracket | Owner-occupied | Renter-occupied |
| Less than $5,000 | 5 (2.5%) | 6 (7.3%) |
| $5,000 to $9,999 | 9 (4.6%) | 6 (7.3%) |
| $10,000 to $14,999 | 2 (1.0%) | 19 (23.2%) |
| $15,000 to $19,999 | 5 (2.5%) | 0 (0.0%) |
| $20,000 to $24,999 | 5 (2.5%) | 12 (14.6%) |
| $25,000 to $34,999 | 16 (8.1%) | 2 (2.4%) |
| $35,000 to $49,999 | 12 (6.1%) | 23 (28.1%) |
| $50,000 to $74,999 | 40 (20.3%) | 0 (0.0%) |
| $75,000 to $99,999 | 23 (11.7%) | 14 (17.1%) |
| $100,000 to $149,999 | 58 (29.4%) | 0 (0.0%) |
| $150,000 or more | 22 (11.2%) | 0 (0.0%) |
| Total | 197 (100.0%) | 82 (100.0%) |
Monthly Housing Cost Tiers in New Chapel Hill
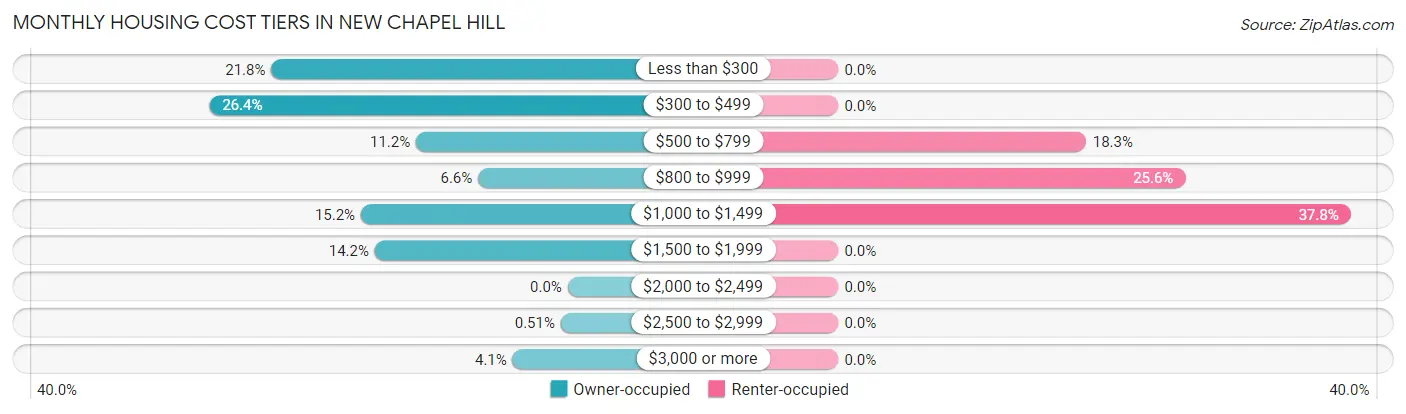
| Monthly Cost | Owner-occupied | Renter-occupied |
| Less than $300 | 43 (21.8%) | 0 (0.0%) |
| $300 to $499 | 52 (26.4%) | 0 (0.0%) |
| $500 to $799 | 22 (11.2%) | 15 (18.3%) |
| $800 to $999 | 13 (6.6%) | 21 (25.6%) |
| $1,000 to $1,499 | 30 (15.2%) | 31 (37.8%) |
| $1,500 to $1,999 | 28 (14.2%) | 0 (0.0%) |
| $2,000 to $2,499 | 0 (0.0%) | 0 (0.0%) |
| $2,500 to $2,999 | 1 (0.5%) | 0 (0.0%) |
| $3,000 or more | 8 (4.1%) | 0 (0.0%) |
| Total | 197 (100.0%) | 82 (100.0%) |
Physical Housing Characteristics in New Chapel Hill
Housing Structures in New Chapel Hill
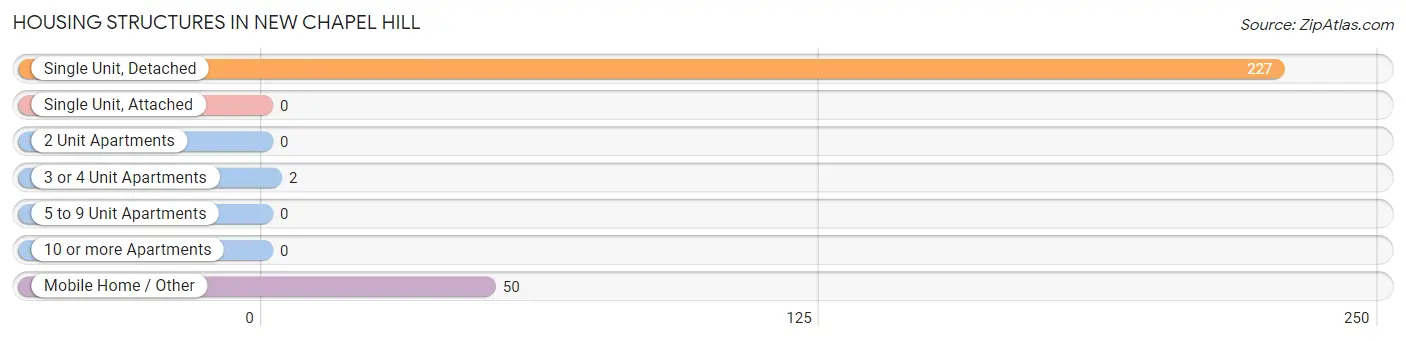
| Structure Type | # Housing Units | % Housing Units |
| Single Unit, Detached | 227 | 81.4% |
| Single Unit, Attached | 0 | 0.0% |
| 2 Unit Apartments | 0 | 0.0% |
| 3 or 4 Unit Apartments | 2 | 0.7% |
| 5 to 9 Unit Apartments | 0 | 0.0% |
| 10 or more Apartments | 0 | 0.0% |
| Mobile Home / Other | 50 | 17.9% |
| Total | 279 | 100.0% |
Housing Structures by Occupancy in New Chapel Hill
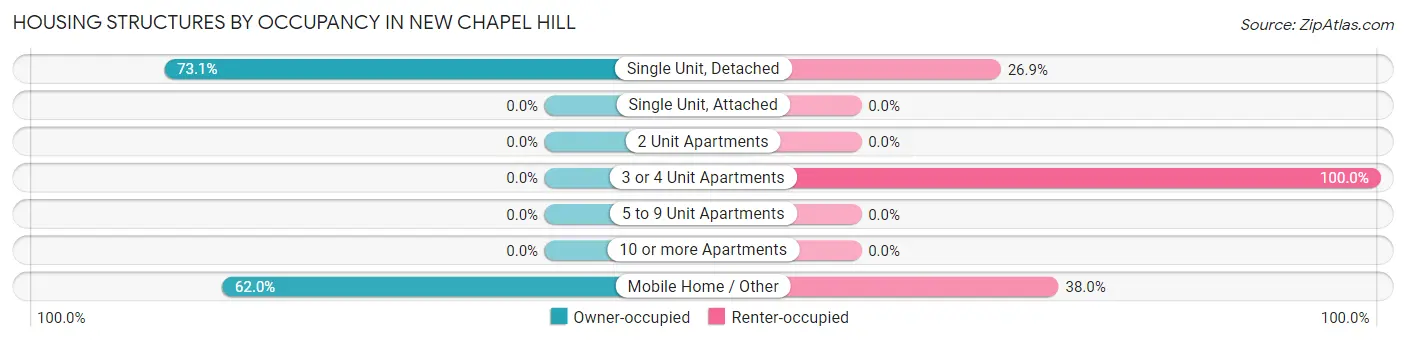
| Structure Type | Owner-occupied | Renter-occupied |
| Single Unit, Detached | 166 (73.1%) | 61 (26.9%) |
| Single Unit, Attached | 0 (0.0%) | 0 (0.0%) |
| 2 Unit Apartments | 0 (0.0%) | 0 (0.0%) |
| 3 or 4 Unit Apartments | 0 (0.0%) | 2 (100.0%) |
| 5 to 9 Unit Apartments | 0 (0.0%) | 0 (0.0%) |
| 10 or more Apartments | 0 (0.0%) | 0 (0.0%) |
| Mobile Home / Other | 31 (62.0%) | 19 (38.0%) |
| Total | 197 (70.6%) | 82 (29.4%) |
Housing Structures by Number of Rooms in New Chapel Hill
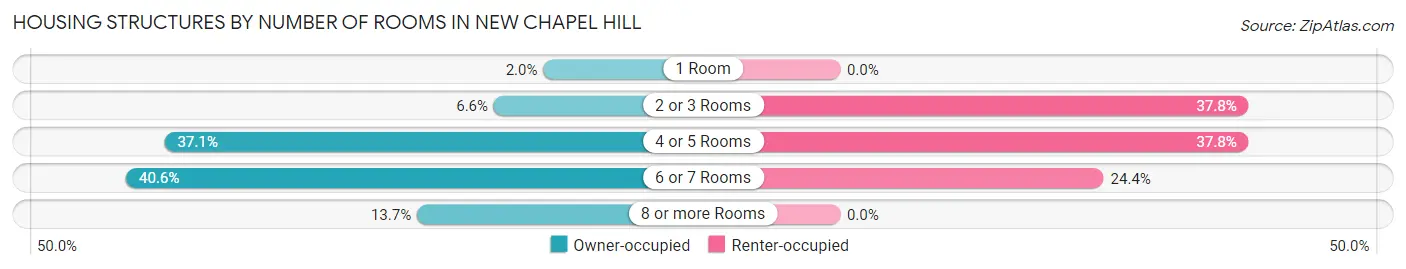
| Number of Rooms | Owner-occupied | Renter-occupied |
| 1 Room | 4 (2.0%) | 0 (0.0%) |
| 2 or 3 Rooms | 13 (6.6%) | 31 (37.8%) |
| 4 or 5 Rooms | 73 (37.1%) | 31 (37.8%) |
| 6 or 7 Rooms | 80 (40.6%) | 20 (24.4%) |
| 8 or more Rooms | 27 (13.7%) | 0 (0.0%) |
| Total | 197 (100.0%) | 82 (100.0%) |
Housing Structure by Heating Type in New Chapel Hill
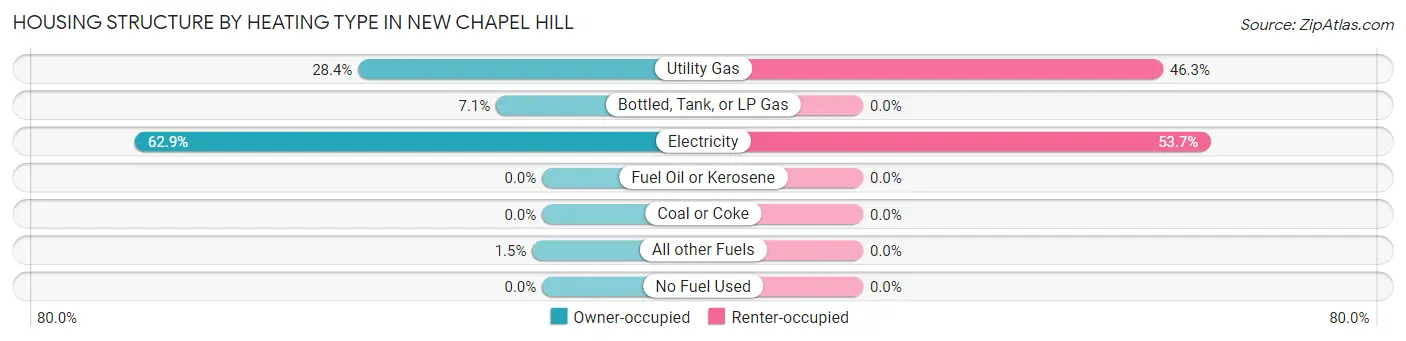
| Heating Type | Owner-occupied | Renter-occupied |
| Utility Gas | 56 (28.4%) | 38 (46.3%) |
| Bottled, Tank, or LP Gas | 14 (7.1%) | 0 (0.0%) |
| Electricity | 124 (62.9%) | 44 (53.7%) |
| Fuel Oil or Kerosene | 0 (0.0%) | 0 (0.0%) |
| Coal or Coke | 0 (0.0%) | 0 (0.0%) |
| All other Fuels | 3 (1.5%) | 0 (0.0%) |
| No Fuel Used | 0 (0.0%) | 0 (0.0%) |
| Total | 197 (100.0%) | 82 (100.0%) |
Household Vehicle Usage in New Chapel Hill
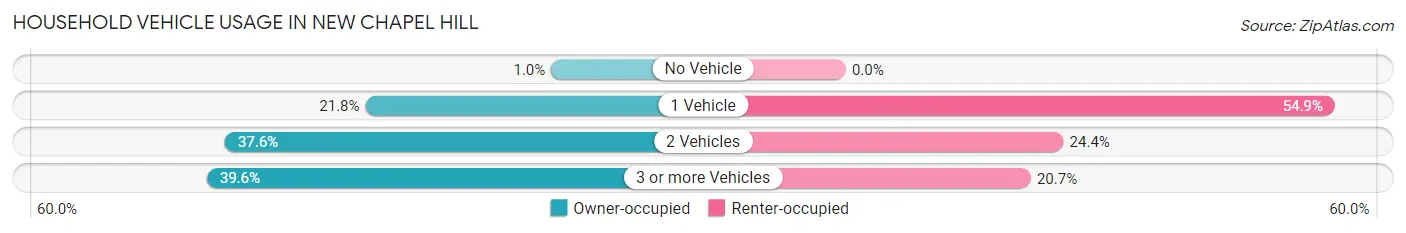
| Vehicles per Household | Owner-occupied | Renter-occupied |
| No Vehicle | 2 (1.0%) | 0 (0.0%) |
| 1 Vehicle | 43 (21.8%) | 45 (54.9%) |
| 2 Vehicles | 74 (37.6%) | 20 (24.4%) |
| 3 or more Vehicles | 78 (39.6%) | 17 (20.7%) |
| Total | 197 (100.0%) | 82 (100.0%) |
Real Estate & Mortgages in New Chapel Hill
Real Estate and Mortgage Overview in New Chapel Hill
| Characteristic | Without Mortgage | With Mortgage |
| Housing Units | 117 | 80 |
| Median Property Value | $113,300 | $155,000 |
| Median Household Income | $51,442 | $15 |
| Monthly Housing Costs | $380 | $8 |
| Real Estate Taxes | $1,224 | $4 |
Property Value by Mortgage Status in New Chapel Hill
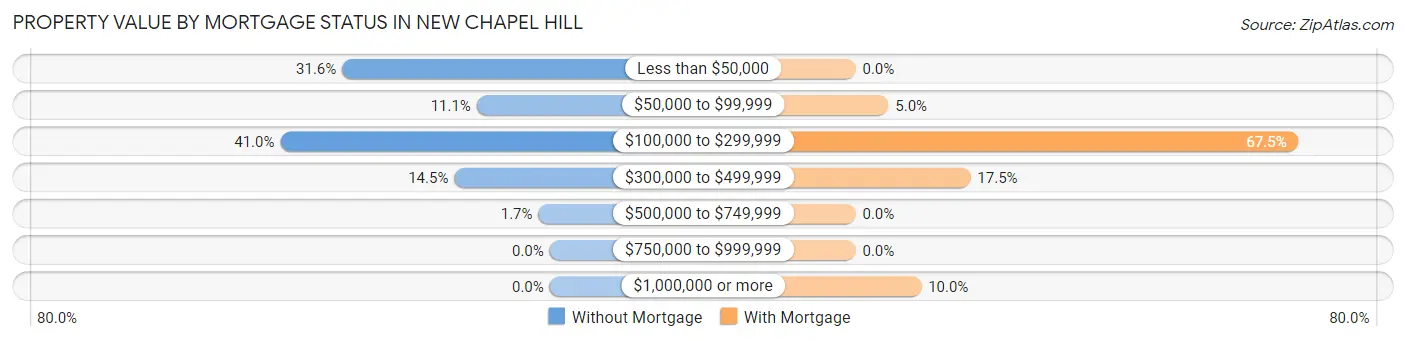
| Property Value | Without Mortgage | With Mortgage |
| Less than $50,000 | 37 (31.6%) | 0 (0.0%) |
| $50,000 to $99,999 | 13 (11.1%) | 4 (5.0%) |
| $100,000 to $299,999 | 48 (41.0%) | 54 (67.5%) |
| $300,000 to $499,999 | 17 (14.5%) | 14 (17.5%) |
| $500,000 to $749,999 | 2 (1.7%) | 0 (0.0%) |
| $750,000 to $999,999 | 0 (0.0%) | 0 (0.0%) |
| $1,000,000 or more | 0 (0.0%) | 8 (10.0%) |
| Total | 117 (100.0%) | 80 (100.0%) |
Household Income by Mortgage Status in New Chapel Hill
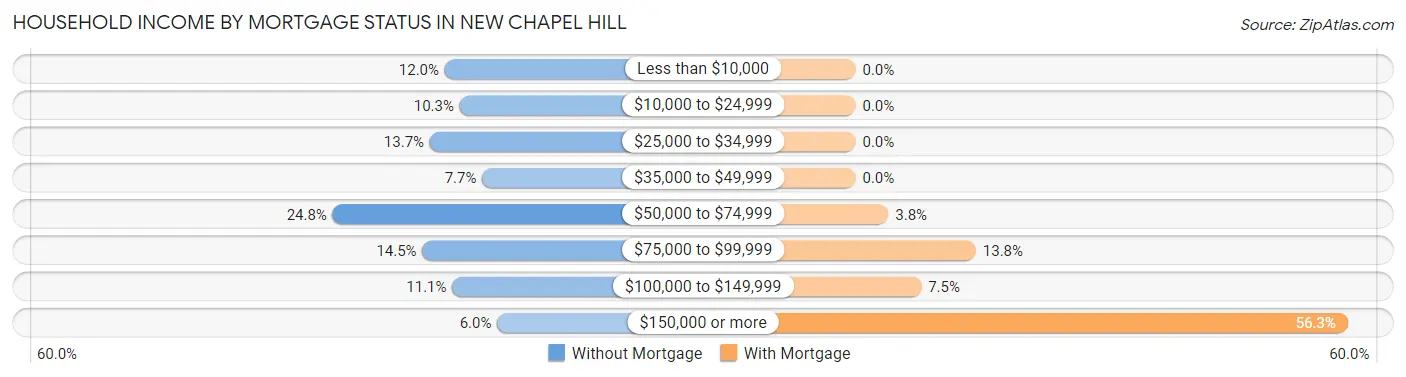
| Household Income | Without Mortgage | With Mortgage |
| Less than $10,000 | 14 (12.0%) | 0 (0.0%) |
| $10,000 to $24,999 | 12 (10.3%) | 0 (0.0%) |
| $25,000 to $34,999 | 16 (13.7%) | 0 (0.0%) |
| $35,000 to $49,999 | 9 (7.7%) | 0 (0.0%) |
| $50,000 to $74,999 | 29 (24.8%) | 3 (3.7%) |
| $75,000 to $99,999 | 17 (14.5%) | 11 (13.8%) |
| $100,000 to $149,999 | 13 (11.1%) | 6 (7.5%) |
| $150,000 or more | 7 (6.0%) | 45 (56.2%) |
| Total | 117 (100.0%) | 80 (100.0%) |
Property Value to Household Income Ratio in New Chapel Hill
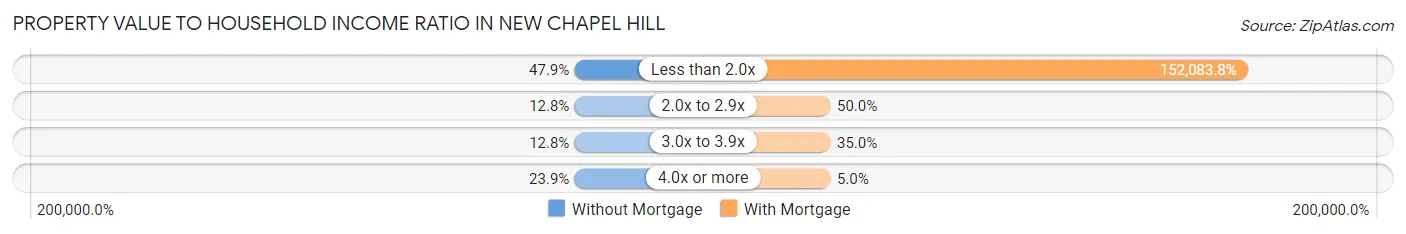
| Value-to-Income Ratio | Without Mortgage | With Mortgage |
| Less than 2.0x | 56 (47.9%) | 121,667 (152,083.8%) |
| 2.0x to 2.9x | 15 (12.8%) | 40 (50.0%) |
| 3.0x to 3.9x | 15 (12.8%) | 28 (35.0%) |
| 4.0x or more | 28 (23.9%) | 4 (5.0%) |
| Total | 117 (100.0%) | 80 (100.0%) |
Real Estate Taxes by Mortgage Status in New Chapel Hill
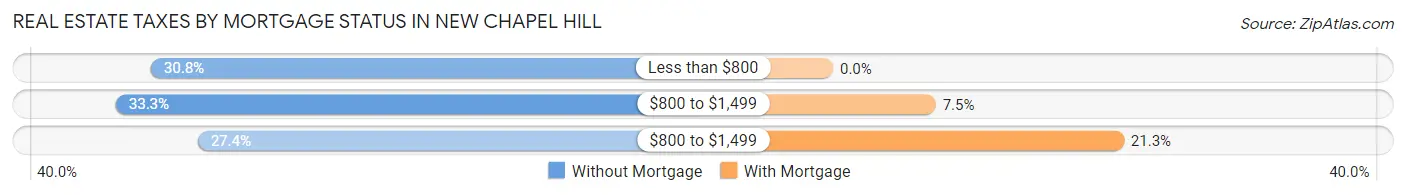
| Property Taxes | Without Mortgage | With Mortgage |
| Less than $800 | 36 (30.8%) | 0 (0.0%) |
| $800 to $1,499 | 39 (33.3%) | 6 (7.5%) |
| $800 to $1,499 | 32 (27.4%) | 17 (21.2%) |
| Total | 117 (100.0%) | 80 (100.0%) |
Health & Disability in New Chapel Hill
Health Insurance Coverage by Age in New Chapel Hill
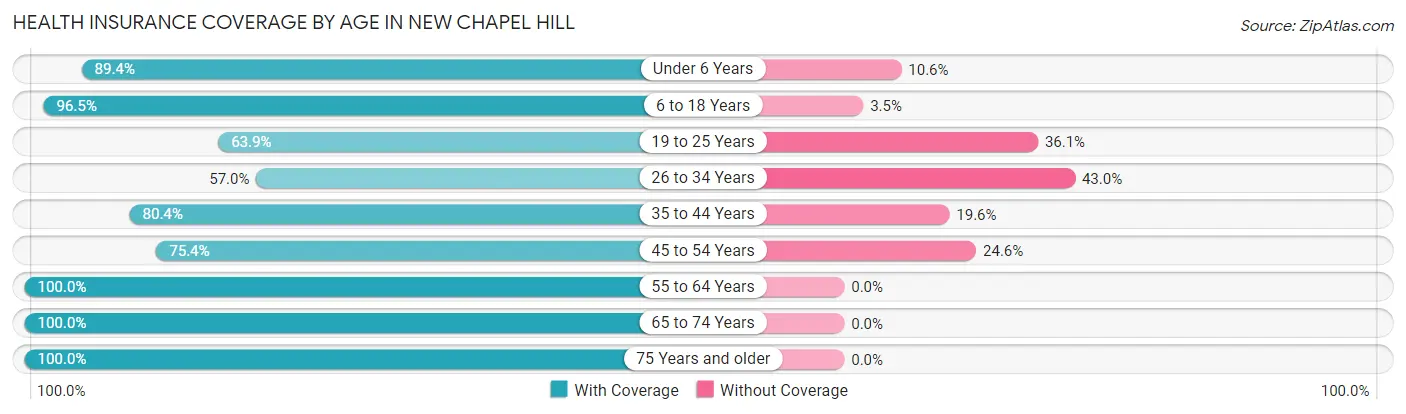
| Age Bracket | With Coverage | Without Coverage |
| Under 6 Years | 42 (89.4%) | 5 (10.6%) |
| 6 to 18 Years | 82 (96.5%) | 3 (3.5%) |
| 19 to 25 Years | 23 (63.9%) | 13 (36.1%) |
| 26 to 34 Years | 49 (57.0%) | 37 (43.0%) |
| 35 to 44 Years | 78 (80.4%) | 19 (19.6%) |
| 45 to 54 Years | 89 (75.4%) | 29 (24.6%) |
| 55 to 64 Years | 98 (100.0%) | 0 (0.0%) |
| 65 to 74 Years | 133 (100.0%) | 0 (0.0%) |
| 75 Years and older | 68 (100.0%) | 0 (0.0%) |
| Total | 662 (86.2%) | 106 (13.8%) |
Health Insurance Coverage by Citizenship Status in New Chapel Hill
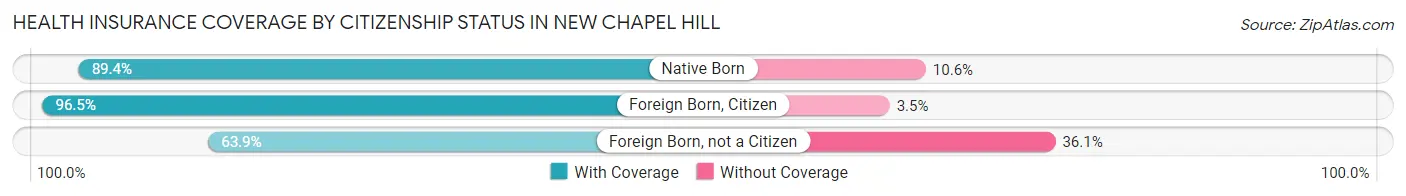
| Citizenship Status | With Coverage | Without Coverage |
| Native Born | 42 (89.4%) | 5 (10.6%) |
| Foreign Born, Citizen | 82 (96.5%) | 3 (3.5%) |
| Foreign Born, not a Citizen | 23 (63.9%) | 13 (36.1%) |
Health Insurance Coverage by Household Income in New Chapel Hill
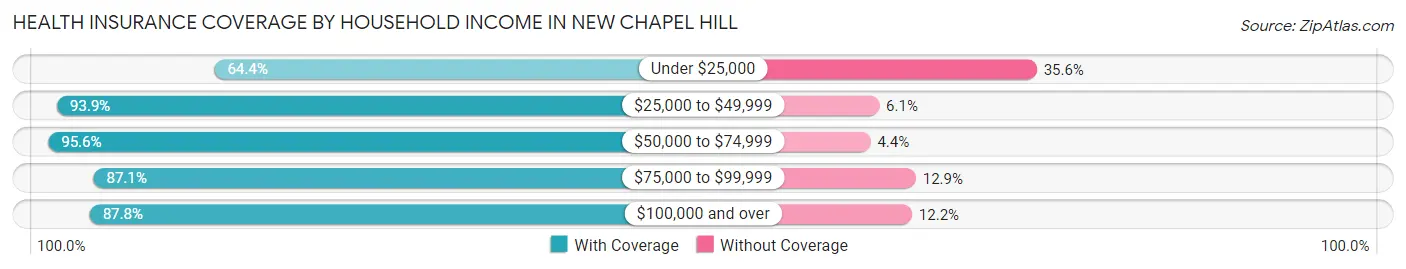
| Household Income | With Coverage | Without Coverage |
| Under $25,000 | 67 (64.4%) | 37 (35.6%) |
| $25,000 to $49,999 | 93 (93.9%) | 6 (6.1%) |
| $50,000 to $74,999 | 86 (95.6%) | 4 (4.4%) |
| $75,000 to $99,999 | 128 (87.1%) | 19 (12.9%) |
| $100,000 and over | 288 (87.8%) | 40 (12.2%) |
Public vs Private Health Insurance Coverage by Age in New Chapel Hill
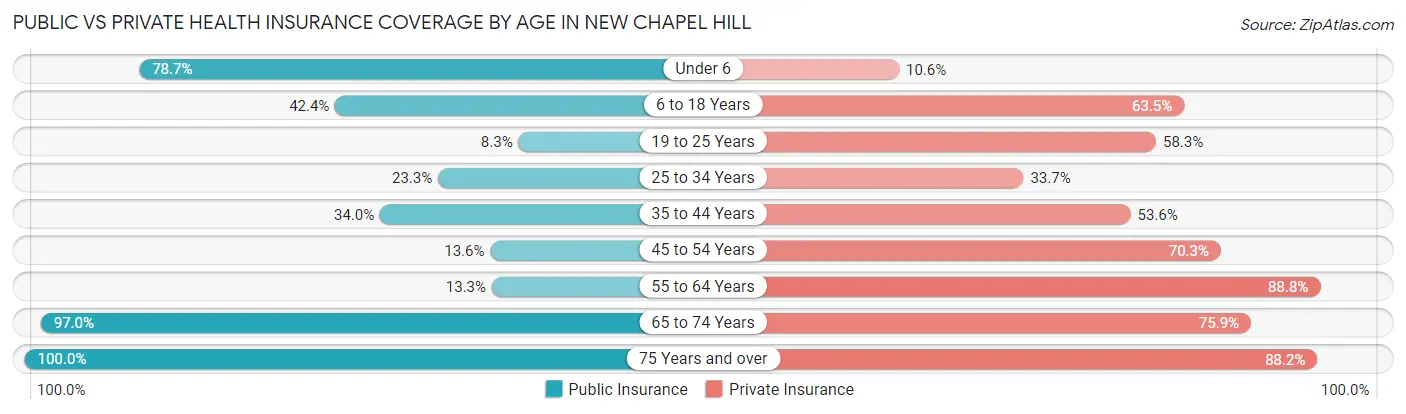
| Age Bracket | Public Insurance | Private Insurance |
| Under 6 | 37 (78.7%) | 5 (10.6%) |
| 6 to 18 Years | 36 (42.3%) | 54 (63.5%) |
| 19 to 25 Years | 3 (8.3%) | 21 (58.3%) |
| 25 to 34 Years | 20 (23.3%) | 29 (33.7%) |
| 35 to 44 Years | 33 (34.0%) | 52 (53.6%) |
| 45 to 54 Years | 16 (13.6%) | 83 (70.3%) |
| 55 to 64 Years | 13 (13.3%) | 87 (88.8%) |
| 65 to 74 Years | 129 (97.0%) | 101 (75.9%) |
| 75 Years and over | 68 (100.0%) | 60 (88.2%) |
| Total | 355 (46.2%) | 492 (64.1%) |
Disability Status by Sex by Age in New Chapel Hill
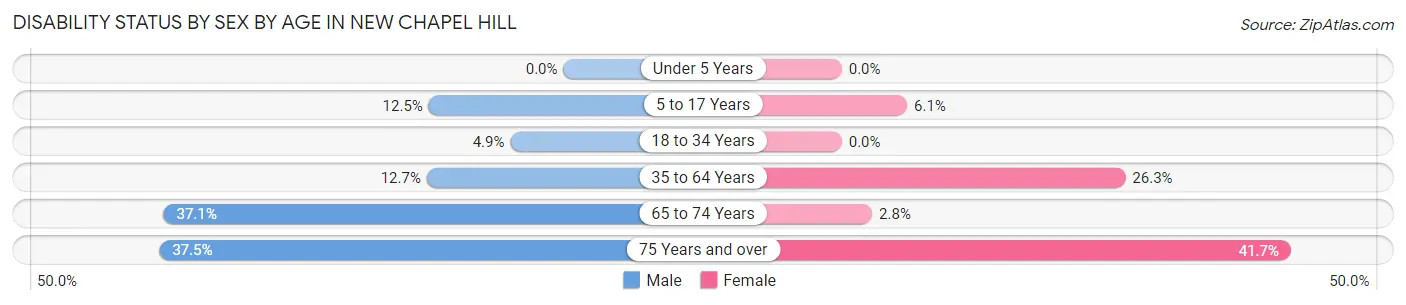
| Age Bracket | Male | Female |
| Under 5 Years | 0 (0.0%) | 0 (0.0%) |
| 5 to 17 Years | 6 (12.5%) | 2 (6.1%) |
| 18 to 34 Years | 3 (4.9%) | 0 (0.0%) |
| 35 to 64 Years | 18 (12.7%) | 45 (26.3%) |
| 65 to 74 Years | 23 (37.1%) | 2 (2.8%) |
| 75 Years and over | 12 (37.5%) | 15 (41.7%) |
Disability Class by Sex by Age in New Chapel Hill
Disability Class: Hearing Difficulty
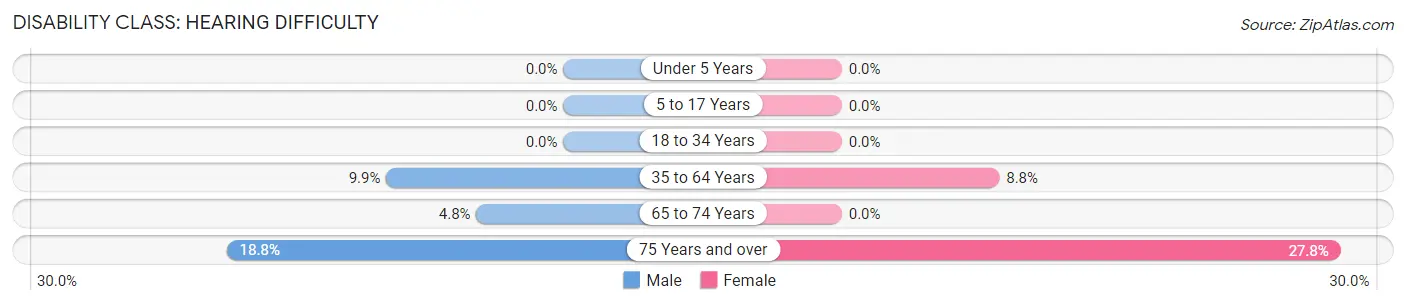
| Age Bracket | Male | Female |
| Under 5 Years | 0 (0.0%) | 0 (0.0%) |
| 5 to 17 Years | 0 (0.0%) | 0 (0.0%) |
| 18 to 34 Years | 0 (0.0%) | 0 (0.0%) |
| 35 to 64 Years | 14 (9.9%) | 15 (8.8%) |
| 65 to 74 Years | 3 (4.8%) | 0 (0.0%) |
| 75 Years and over | 6 (18.8%) | 10 (27.8%) |
Disability Class: Vision Difficulty
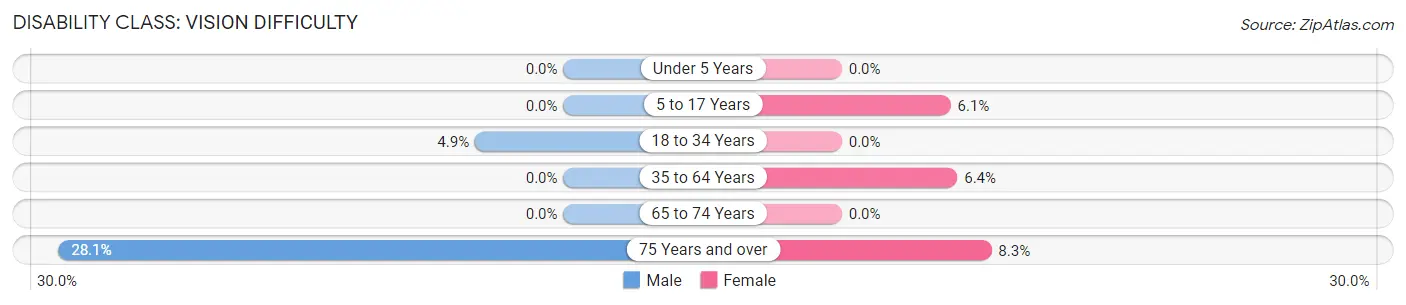
| Age Bracket | Male | Female |
| Under 5 Years | 0 (0.0%) | 0 (0.0%) |
| 5 to 17 Years | 0 (0.0%) | 2 (6.1%) |
| 18 to 34 Years | 3 (4.9%) | 0 (0.0%) |
| 35 to 64 Years | 0 (0.0%) | 11 (6.4%) |
| 65 to 74 Years | 0 (0.0%) | 0 (0.0%) |
| 75 Years and over | 9 (28.1%) | 3 (8.3%) |
Disability Class: Cognitive Difficulty
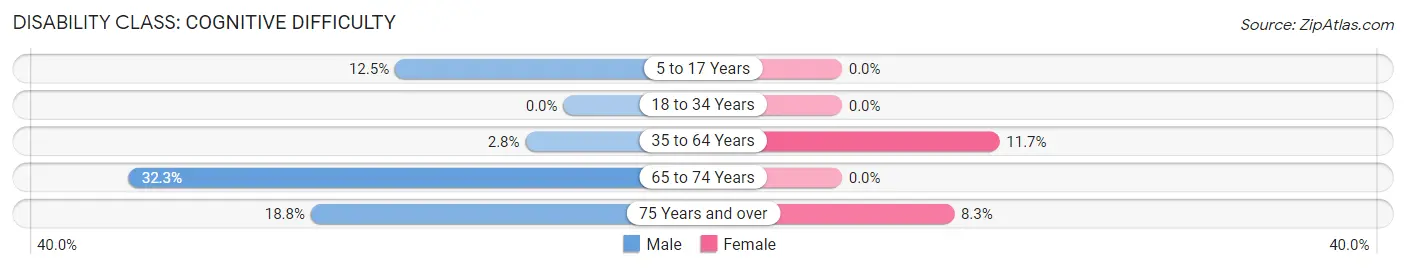
| Age Bracket | Male | Female |
| 5 to 17 Years | 6 (12.5%) | 0 (0.0%) |
| 18 to 34 Years | 0 (0.0%) | 0 (0.0%) |
| 35 to 64 Years | 4 (2.8%) | 20 (11.7%) |
| 65 to 74 Years | 20 (32.3%) | 0 (0.0%) |
| 75 Years and over | 6 (18.8%) | 3 (8.3%) |
Disability Class: Ambulatory Difficulty
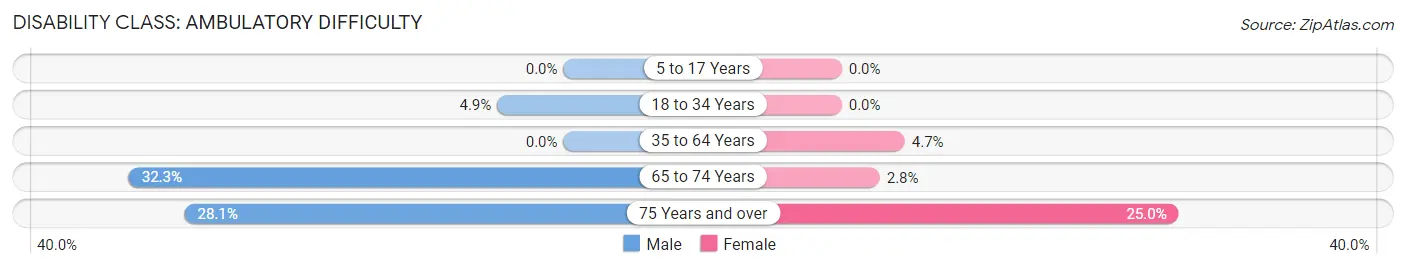
| Age Bracket | Male | Female |
| 5 to 17 Years | 0 (0.0%) | 0 (0.0%) |
| 18 to 34 Years | 3 (4.9%) | 0 (0.0%) |
| 35 to 64 Years | 0 (0.0%) | 8 (4.7%) |
| 65 to 74 Years | 20 (32.3%) | 2 (2.8%) |
| 75 Years and over | 9 (28.1%) | 9 (25.0%) |
Disability Class: Self-Care Difficulty
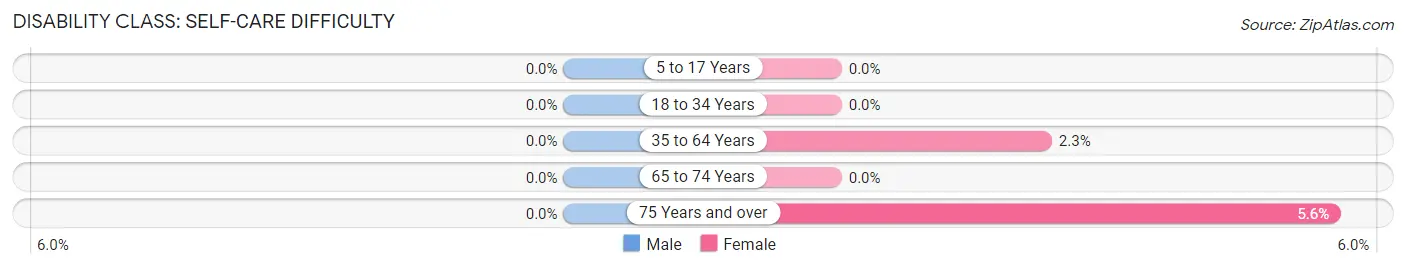
| Age Bracket | Male | Female |
| 5 to 17 Years | 0 (0.0%) | 0 (0.0%) |
| 18 to 34 Years | 0 (0.0%) | 0 (0.0%) |
| 35 to 64 Years | 0 (0.0%) | 4 (2.3%) |
| 65 to 74 Years | 0 (0.0%) | 0 (0.0%) |
| 75 Years and over | 0 (0.0%) | 2 (5.6%) |
Technology Access in New Chapel Hill
Computing Device Access in New Chapel Hill
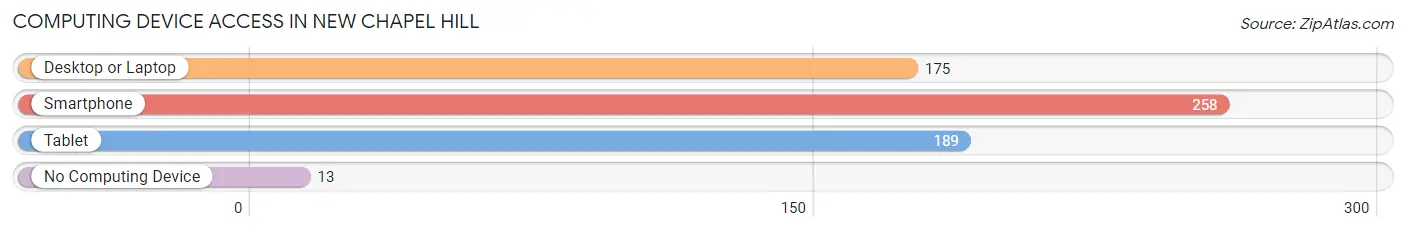
| Device Type | # Households | % Households |
| Desktop or Laptop | 175 | 62.7% |
| Smartphone | 258 | 92.5% |
| Tablet | 189 | 67.7% |
| No Computing Device | 13 | 4.7% |
| Total | 279 | 100.0% |
Internet Access in New Chapel Hill
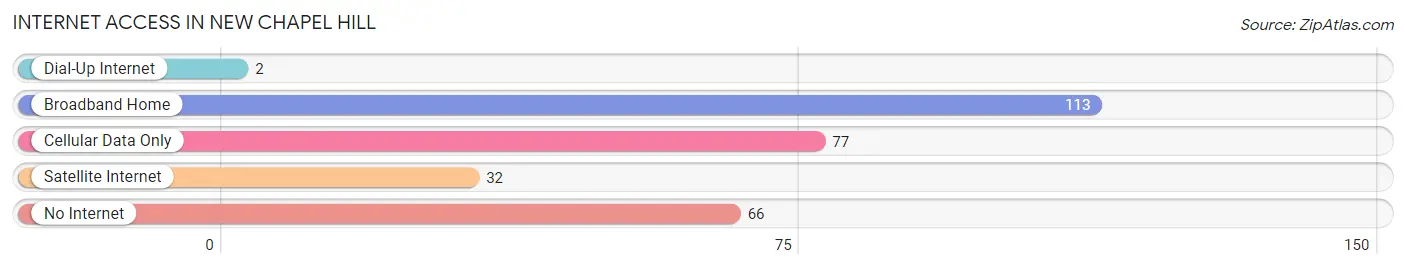
| Internet Type | # Households | % Households |
| Dial-Up Internet | 2 | 0.7% |
| Broadband Home | 113 | 40.5% |
| Cellular Data Only | 77 | 27.6% |
| Satellite Internet | 32 | 11.5% |
| No Internet | 66 | 23.7% |
| Total | 279 | 100.0% |
New Chapel Hill Summary
Chapel Hill, Texas is a small town located in Smith County, Texas, United States. The town is situated approximately 10 miles east of Tyler, the county seat. The population of Chapel Hill was 1,845 at the 2010 census, up from 1,619 at the 2000 census.
History
Chapel Hill was founded in 1845 by a group of settlers from North Carolina. The town was named after the chapel that was built in the area. The chapel was built by the settlers to serve as a place of worship for the community.
The town was incorporated in 1876 and the first post office was established in 1877. The town grew slowly but steadily over the years and by the early 1900s, it had become a thriving community.
The town was home to several businesses, including a cotton gin, a grist mill, a sawmill, and a blacksmith shop. The town also had a school, a bank, and a hotel.
Geography
Chapel Hill is located at 32°14'25" North, 95°25'45" West (32.240278, -95.429167). The town is situated in the rolling hills of East Texas, approximately 10 miles east of Tyler, the county seat.
The town is located in the Piney Woods region of Texas, which is characterized by dense forests of pine and hardwood trees. The area is known for its mild climate and abundant wildlife.
The town is served by U S Route 271 which runs through the center of town
Economy
The economy of Chapel Hill is largely based on agriculture and timber. The town is home to several farms and ranches, as well as several timber companies.
The town is also home to several small businesses, including a grocery store, a hardware store, and a restaurant.
Demographics
As of the 2010 census, the population of Chapel Hill was 1,845. The racial makeup of the town was 79.3% White, 16.2% African American, 0.7% Native American, 0.3% Asian, 0.1% Pacific Islander, 1.7% from other races, and 1.9% from two or more races. Hispanic or Latino of any race were 4.2% of the population.
The median income for a household in the town was $37,917, and the median income for a family was $45,625. The per capita income for the town was $17,945. About 15.2% of families and 18.2% of the population were below the poverty line, including 25.2% of those under age 18 and 11.2% of those age 65 or over.
Conclusion
Chapel Hill, Texas is a small town located in Smith County, Texas, United States. The town is situated approximately 10 miles east of Tyler, the county seat. The population of Chapel Hill was 1,845 at the 2010 census, up from 1,619 at the 2000 census. The town was founded in 1845 by a group of settlers from North Carolina and was named after the chapel that was built in the area. The economy of Chapel Hill is largely based on agriculture and timber, and the town is home to several small businesses. The racial makeup of the town was 79.3% White, 16.2% African American, 0.7% Native American, 0.3% Asian, 0.1% Pacific Islander, 1.7% from other races, and 1.9% from two or more races. The median income for a household in the town was $37,917, and the median income for a family was $45,625.
Common Questions
What is Per Capita Income in New Chapel Hill?
Per Capita income in New Chapel Hill is $28,210.
What is the Median Family Income in New Chapel Hill?
Median Family Income in New Chapel Hill is $86,346.
What is the Median Household income in New Chapel Hill?
Median Household Income in New Chapel Hill is $58,304.
What is Income or Wage Gap in New Chapel Hill?
Income or Wage Gap in New Chapel Hill is 14.4%.
Women in New Chapel Hill earn 85.6 cents for every dollar earned by a man.
What is Inequality or Gini Index in New Chapel Hill?
Inequality or Gini Index in New Chapel Hill is 0.47.
What is the Total Population of New Chapel Hill?
Total Population of New Chapel Hill is 768.
What is the Total Male Population of New Chapel Hill?
Total Male Population of New Chapel Hill is 382.
What is the Total Female Population of New Chapel Hill?
Total Female Population of New Chapel Hill is 386.
What is the Ratio of Males per 100 Females in New Chapel Hill?
There are 98.96 Males per 100 Females in New Chapel Hill.
What is the Ratio of Females per 100 Males in New Chapel Hill?
There are 101.05 Females per 100 Males in New Chapel Hill.
What is the Median Population Age in New Chapel Hill?
Median Population Age in New Chapel Hill is 47.3 Years.
What is the Average Family Size in New Chapel Hill
Average Family Size in New Chapel Hill is 3.6 People.
What is the Average Household Size in New Chapel Hill
Average Household Size in New Chapel Hill is 2.8 People.
How Large is the Labor Force in New Chapel Hill?
There are 364 People in the Labor Forcein in New Chapel Hill.
What is the Percentage of People in the Labor Force in New Chapel Hill?
55.2% of People are in the Labor Force in New Chapel Hill.
What is the Unemployment Rate in New Chapel Hill?
Unemployment Rate in New Chapel Hill is 10.7%.