Laguna Vista, TX Map & Demographics
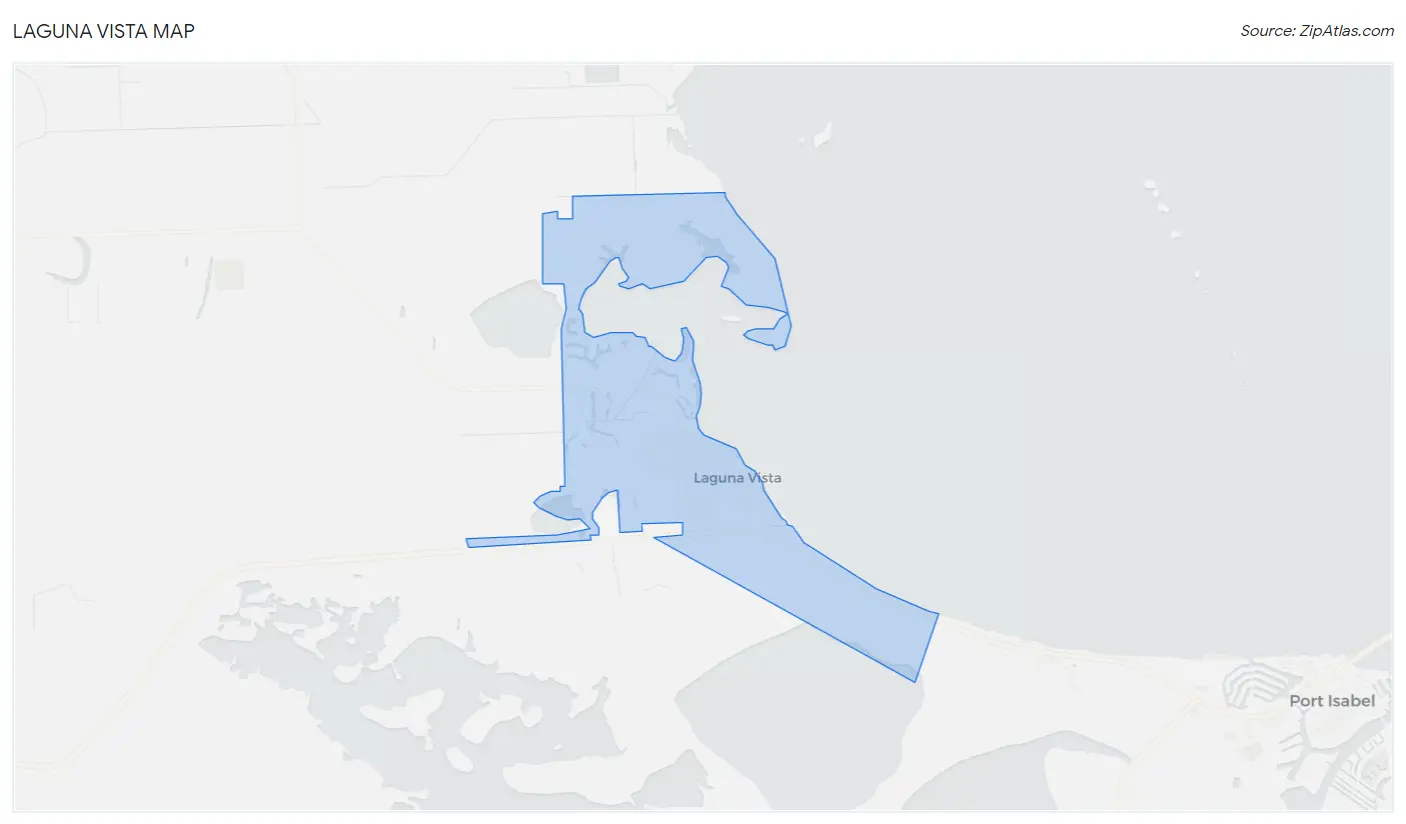
Laguna Vista Map
Laguna Vista Overview
$44,018
PER CAPITA INCOME
$78,036
AVG FAMILY INCOME
$60,833
AVG HOUSEHOLD INCOME
35.4%
WAGE / INCOME GAP [ % ]
64.6¢/ $1
WAGE / INCOME GAP [ $ ]
$8,978
FAMILY INCOME DEFICIT
0.58
INEQUALITY / GINI INDEX
3,555
TOTAL POPULATION
1,794
MALE POPULATION
1,761
FEMALE POPULATION
101.87
MALES / 100 FEMALES
98.16
FEMALES / 100 MALES
56.2
MEDIAN AGE
2.7
AVG FAMILY SIZE
2.3
AVG HOUSEHOLD SIZE
1,272
LABOR FORCE [ PEOPLE ]
41.6%
PERCENT IN LABOR FORCE
2.0%
UNEMPLOYMENT RATE
Laguna Vista Area Codes
Income in Laguna Vista
Income Overview in Laguna Vista
Per Capita Income in Laguna Vista is $44,018, while median incomes of families and households are $78,036 and $60,833 respectively.
| Characteristic | Number | Measure |
| Per Capita Income | 3,555 | $44,018 |
| Median Family Income | 1,155 | $78,036 |
| Mean Family Income | 1,155 | $115,218 |
| Median Household Income | 1,524 | $60,833 |
| Mean Household Income | 1,524 | $102,610 |
| Income Deficit | 1,155 | $8,978 |
| Wage / Income Gap (%) | 3,555 | 35.37% |
| Wage / Income Gap ($) | 3,555 | 64.63¢ per $1 |
| Gini / Inequality Index | 3,555 | 0.58 |
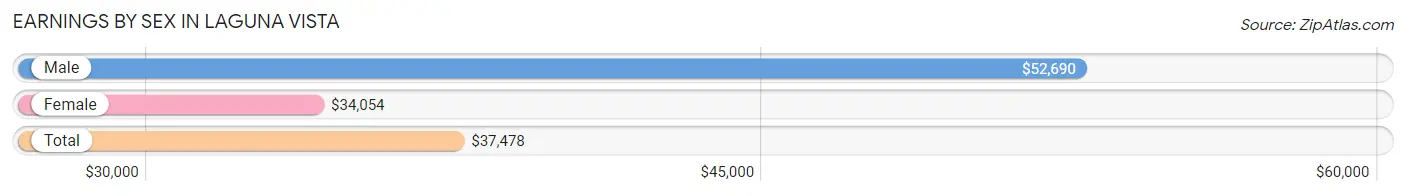
Earnings by Sex in Laguna Vista
Average Earnings in Laguna Vista are $37,478, $52,690 for men and $34,054 for women, a difference of 35.4%.
| Sex | Number | Average Earnings |
| Male | 781 (58.2%) | $52,690 |
| Female | 561 (41.8%) | $34,054 |
| Total | 1,342 (100.0%) | $37,478 |
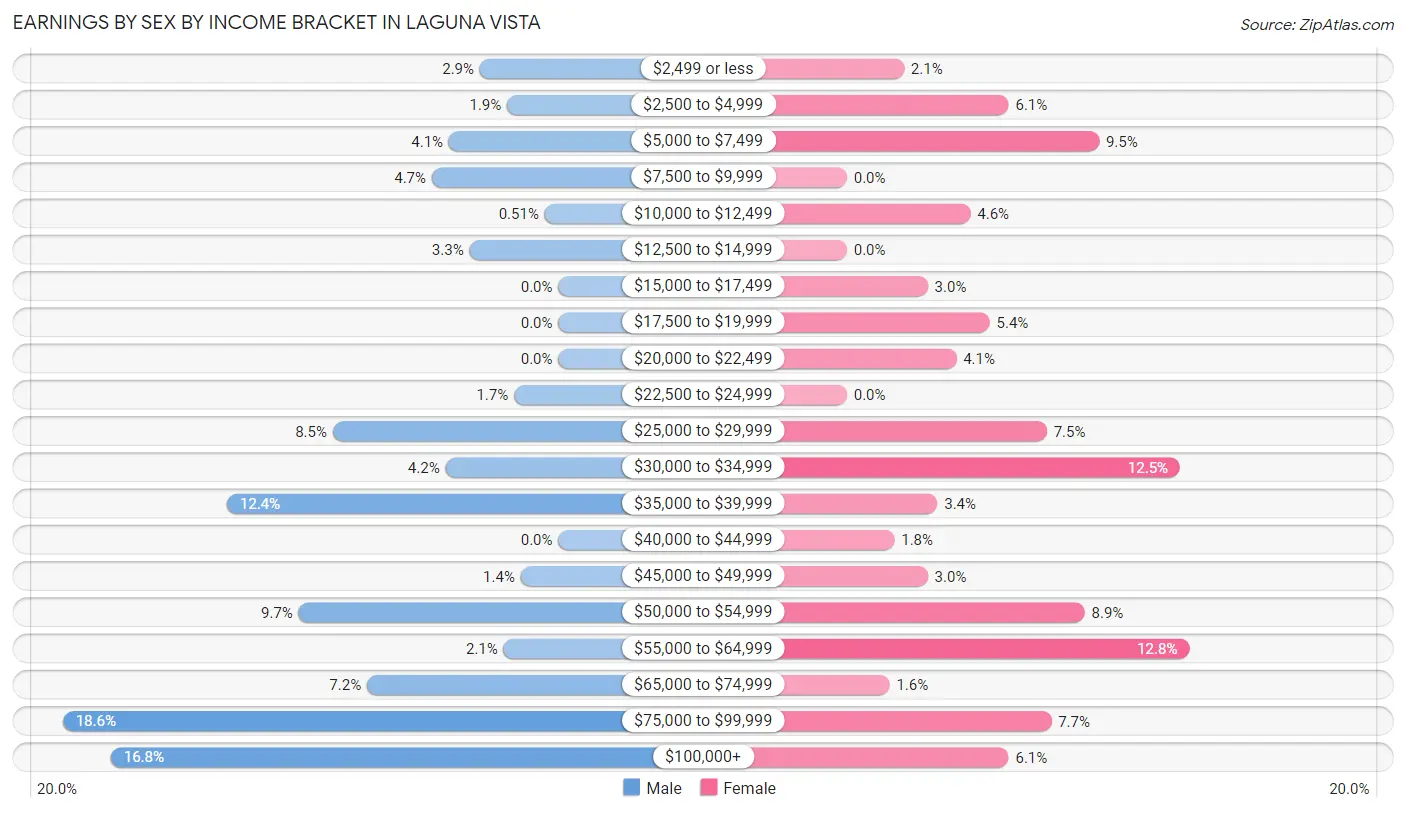
Earnings by Sex by Income Bracket in Laguna Vista
The most common earnings brackets in Laguna Vista are $75,000 to $99,999 for men (145 | 18.6%) and $55,000 to $64,999 for women (72 | 12.8%).
| Income | Male | Female |
| $2,499 or less | 23 (2.9%) | 12 (2.1%) |
| $2,500 to $4,999 | 15 (1.9%) | 34 (6.1%) |
| $5,000 to $7,499 | 32 (4.1%) | 53 (9.5%) |
| $7,500 to $9,999 | 37 (4.7%) | 0 (0.0%) |
| $10,000 to $12,499 | 4 (0.5%) | 26 (4.6%) |
| $12,500 to $14,999 | 26 (3.3%) | 0 (0.0%) |
| $15,000 to $17,499 | 0 (0.0%) | 17 (3.0%) |
| $17,500 to $19,999 | 0 (0.0%) | 30 (5.3%) |
| $20,000 to $22,499 | 0 (0.0%) | 23 (4.1%) |
| $22,500 to $24,999 | 13 (1.7%) | 0 (0.0%) |
| $25,000 to $29,999 | 66 (8.5%) | 42 (7.5%) |
| $30,000 to $34,999 | 33 (4.2%) | 70 (12.5%) |
| $35,000 to $39,999 | 97 (12.4%) | 19 (3.4%) |
| $40,000 to $44,999 | 0 (0.0%) | 10 (1.8%) |
| $45,000 to $49,999 | 11 (1.4%) | 17 (3.0%) |
| $50,000 to $54,999 | 76 (9.7%) | 50 (8.9%) |
| $55,000 to $64,999 | 16 (2.1%) | 72 (12.8%) |
| $65,000 to $74,999 | 56 (7.2%) | 9 (1.6%) |
| $75,000 to $99,999 | 145 (18.6%) | 43 (7.7%) |
| $100,000+ | 131 (16.8%) | 34 (6.1%) |
| Total | 781 (100.0%) | 561 (100.0%) |
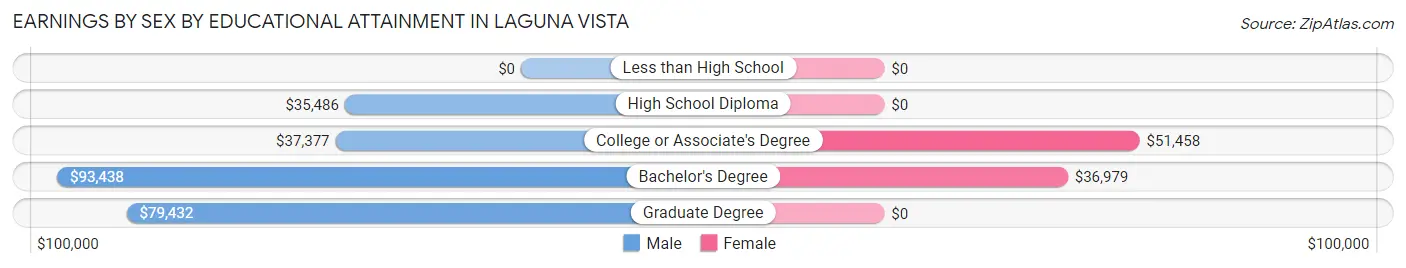
Earnings by Sex by Educational Attainment in Laguna Vista
Average earnings in Laguna Vista are $53,804 for men and $33,714 for women, a difference of 37.3%. Men with an educational attainment of bachelor's degree enjoy the highest average annual earnings of $93,438, while those with high school diploma education earn the least with $35,486. Women with an educational attainment of college or associate's degree earn the most with the average annual earnings of $51,458, while those with bachelor's degree education have the smallest earnings of $36,979.
| Educational Attainment | Male Income | Female Income |
| Less than High School | - | - |
| High School Diploma | $35,486 | $0 |
| College or Associate's Degree | $37,377 | $51,458 |
| Bachelor's Degree | $93,438 | $36,979 |
| Graduate Degree | $79,432 | $0 |
| Total | $53,804 | $33,714 |
Family Income in Laguna Vista
Family Income Brackets in Laguna Vista
According to the Laguna Vista family income data, there are 195 families falling into the $75,000 to $99,999 income range, which is the most common income bracket and makes up 16.9% of all families. Conversely, the $10,000 to $14,999 income bracket is the least frequent group with only 37 families (3.2%) belonging to this category.
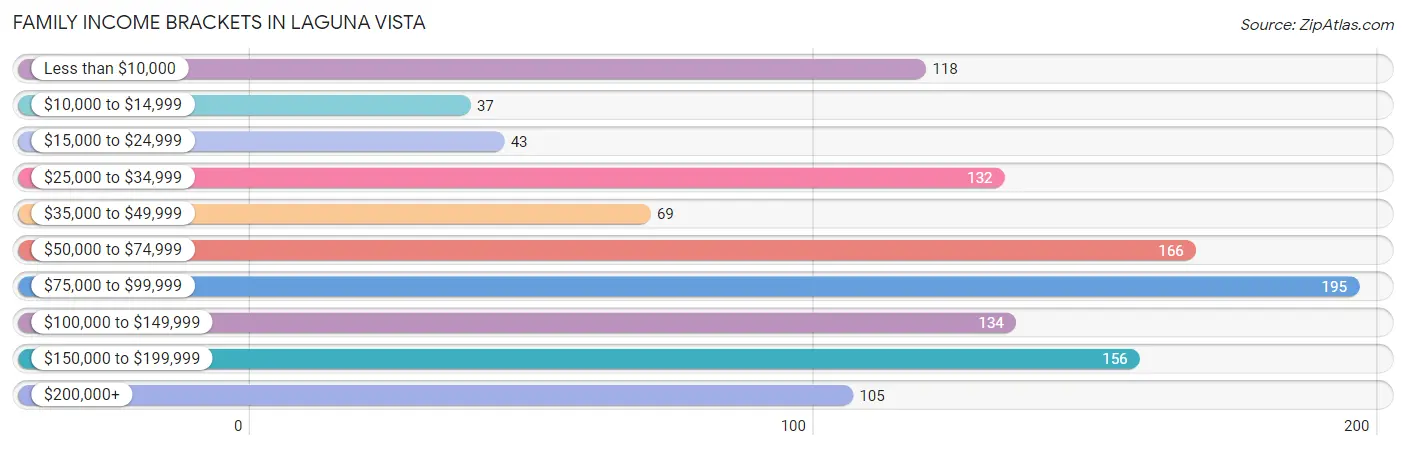
| Income Bracket | # Families | % Families |
| Less than $10,000 | 118 | 10.2% |
| $10,000 to $14,999 | 37 | 3.2% |
| $15,000 to $24,999 | 43 | 3.7% |
| $25,000 to $34,999 | 132 | 11.4% |
| $35,000 to $49,999 | 69 | 6.0% |
| $50,000 to $74,999 | 166 | 14.4% |
| $75,000 to $99,999 | 195 | 16.9% |
| $100,000 to $149,999 | 134 | 11.6% |
| $150,000 to $199,999 | 156 | 13.5% |
| $200,000+ | 105 | 9.1% |
Family Income by Famaliy Size in Laguna Vista
3-person families (162 | 14.0%) account for the highest median family income in Laguna Vista with $146,250 per family, while 3-person families (162 | 14.0%) have the highest median income of $48,750 per family member.
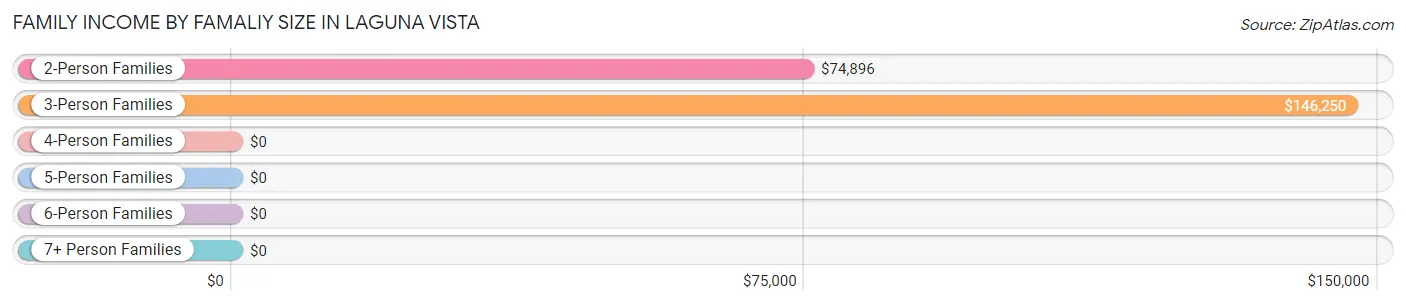
| Income Bracket | # Families | Median Income |
| 2-Person Families | 722 (62.5%) | $74,896 |
| 3-Person Families | 162 (14.0%) | $146,250 |
| 4-Person Families | 205 (17.7%) | $0 |
| 5-Person Families | 66 (5.7%) | $0 |
| 6-Person Families | 0 (0.0%) | $0 |
| 7+ Person Families | 0 (0.0%) | $0 |
| Total | 1,155 (100.0%) | $78,036 |
Family Income by Number of Earners in Laguna Vista
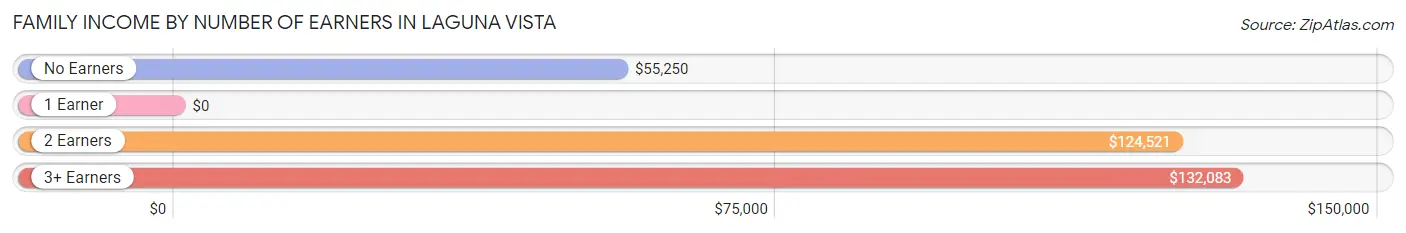
| Number of Earners | # Families | Median Income |
| No Earners | 443 (38.4%) | $55,250 |
| 1 Earner | 336 (29.1%) | $0 |
| 2 Earners | 310 (26.8%) | $124,521 |
| 3+ Earners | 66 (5.7%) | $132,083 |
| Total | 1,155 (100.0%) | $78,036 |
Household Income in Laguna Vista
Household Income Brackets in Laguna Vista
With 248 households falling in the category, the $50,000 to $74,999 income range is the most frequent in Laguna Vista, accounting for 16.3% of all households. In contrast, only 82 households (5.4%) fall into the $10,000 to $14,999 income bracket, making it the least populous group.
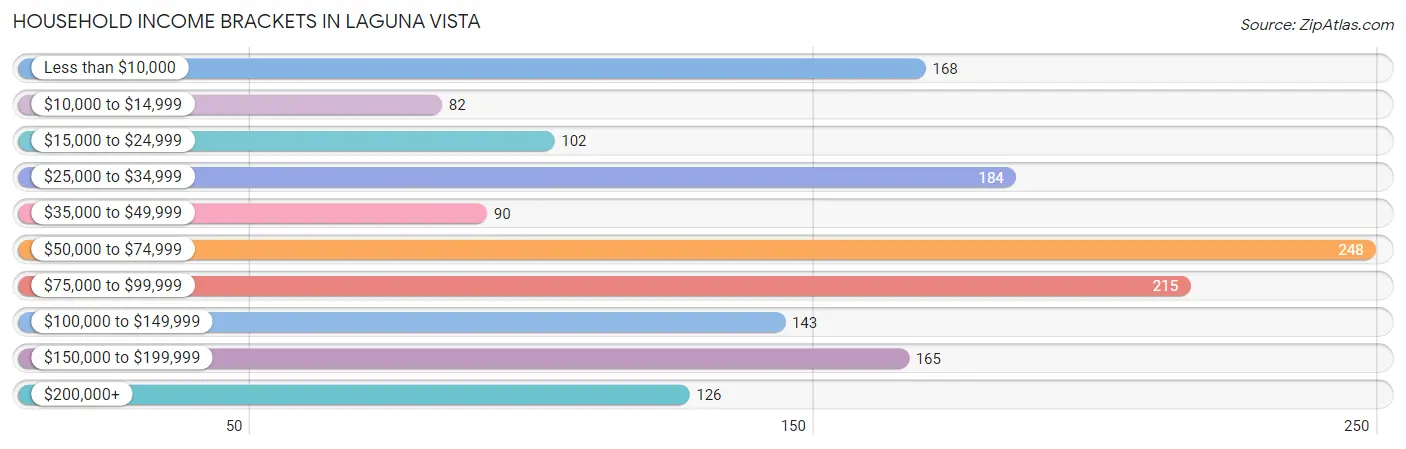
| Income Bracket | # Households | % Households |
| Less than $10,000 | 168 | 11.0% |
| $10,000 to $14,999 | 82 | 5.4% |
| $15,000 to $24,999 | 102 | 6.7% |
| $25,000 to $34,999 | 184 | 12.1% |
| $35,000 to $49,999 | 90 | 5.9% |
| $50,000 to $74,999 | 248 | 16.3% |
| $75,000 to $99,999 | 215 | 14.1% |
| $100,000 to $149,999 | 143 | 9.4% |
| $150,000 to $199,999 | 165 | 10.8% |
| $200,000+ | 126 | 8.3% |
Household Income by Householder Age in Laguna Vista
The median household income in Laguna Vista is $60,833, with the highest median household income of $85,096 found in the 25 to 44 years age bracket for the primary householder. A total of 245 households (16.1%) fall into this category. Meanwhile, the 15 to 24 years age bracket for the primary householder has the lowest median household income of $0, with 121 households (7.9%) in this group.
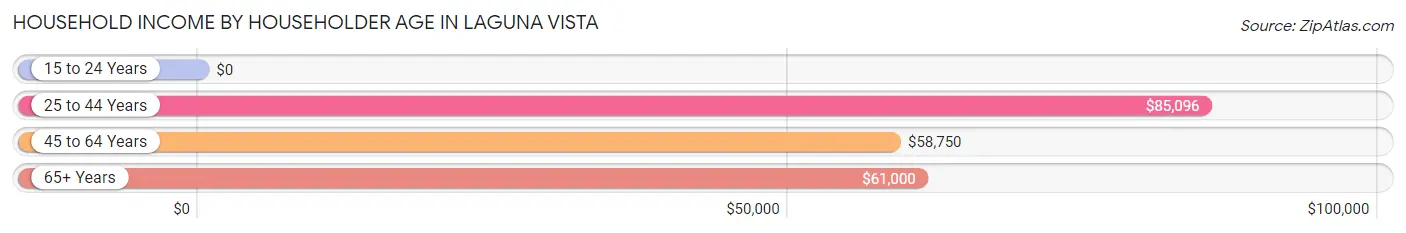
| Income Bracket | # Households | Median Income |
| 15 to 24 Years | 121 (7.9%) | $0 |
| 25 to 44 Years | 245 (16.1%) | $85,096 |
| 45 to 64 Years | 514 (33.7%) | $58,750 |
| 65+ Years | 644 (42.3%) | $61,000 |
| Total | 1,524 (100.0%) | $60,833 |
Poverty in Laguna Vista
Income Below Poverty by Sex and Age in Laguna Vista
With 14.7% poverty level for males and 23.5% for females among the residents of Laguna Vista, 16 and 17 year old males and 16 and 17 year old females are the most vulnerable to poverty, with 31 males (73.8%) and 53 females (100.0%) in their respective age groups living below the poverty level.
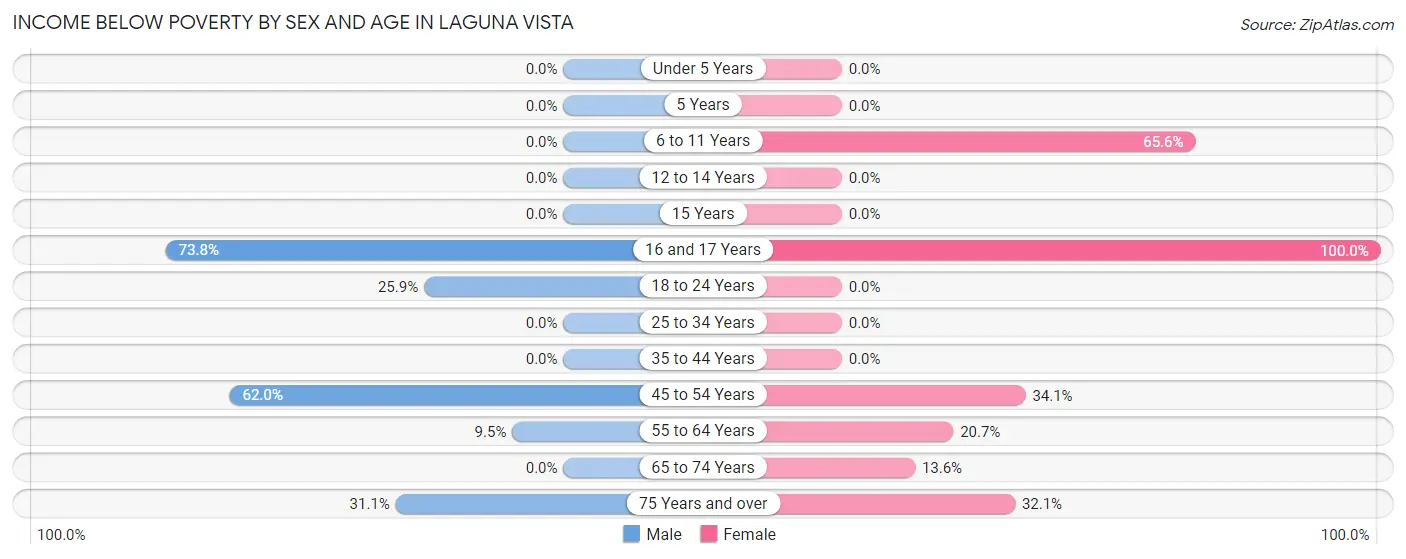
| Age Bracket | Male | Female |
| Under 5 Years | 0 (0.0%) | 0 (0.0%) |
| 5 Years | 0 (0.0%) | 0 (0.0%) |
| 6 to 11 Years | 0 (0.0%) | 82 (65.6%) |
| 12 to 14 Years | 0 (0.0%) | 0 (0.0%) |
| 15 Years | 0 (0.0%) | 0 (0.0%) |
| 16 and 17 Years | 31 (73.8%) | 53 (100.0%) |
| 18 to 24 Years | 37 (25.9%) | 0 (0.0%) |
| 25 to 34 Years | 0 (0.0%) | 0 (0.0%) |
| 35 to 44 Years | 0 (0.0%) | 0 (0.0%) |
| 45 to 54 Years | 70 (62.0%) | 75 (34.1%) |
| 55 to 64 Years | 26 (9.5%) | 61 (20.7%) |
| 65 to 74 Years | 0 (0.0%) | 44 (13.6%) |
| 75 Years and over | 99 (31.1%) | 99 (32.1%) |
| Total | 263 (14.7%) | 414 (23.5%) |
Income Above Poverty by Sex and Age in Laguna Vista
According to the poverty statistics in Laguna Vista, males aged under 5 years and females aged under 5 years are the age groups that are most secure financially, with 100.0% of males and 100.0% of females in these age groups living above the poverty line.
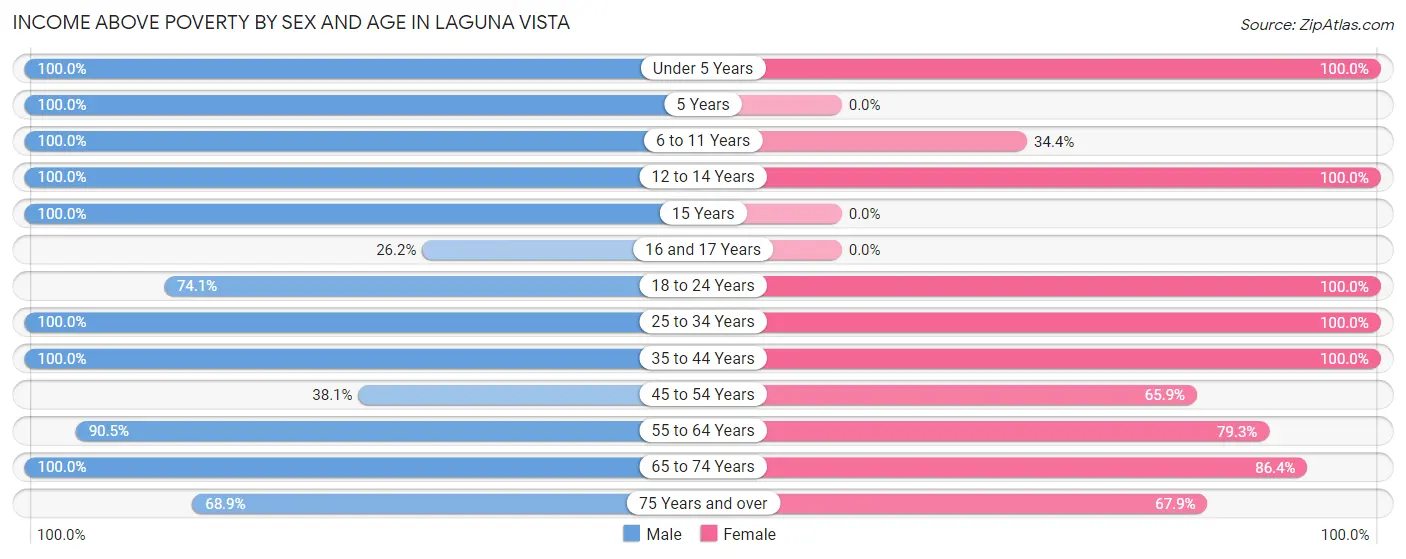
| Age Bracket | Male | Female |
| Under 5 Years | 101 (100.0%) | 113 (100.0%) |
| 5 Years | 11 (100.0%) | 0 (0.0%) |
| 6 to 11 Years | 48 (100.0%) | 43 (34.4%) |
| 12 to 14 Years | 23 (100.0%) | 42 (100.0%) |
| 15 Years | 35 (100.0%) | 0 (0.0%) |
| 16 and 17 Years | 11 (26.2%) | 0 (0.0%) |
| 18 to 24 Years | 106 (74.1%) | 90 (100.0%) |
| 25 to 34 Years | 229 (100.0%) | 114 (100.0%) |
| 35 to 44 Years | 176 (100.0%) | 77 (100.0%) |
| 45 to 54 Years | 43 (38.1%) | 145 (65.9%) |
| 55 to 64 Years | 248 (90.5%) | 234 (79.3%) |
| 65 to 74 Years | 281 (100.0%) | 280 (86.4%) |
| 75 Years and over | 219 (68.9%) | 209 (67.9%) |
| Total | 1,531 (85.3%) | 1,347 (76.5%) |
Income Below Poverty Among Married-Couple Families in Laguna Vista
The poverty statistics for married-couple families in Laguna Vista show that 10.2% or 98 of the total 961 families live below the poverty line. Families with 1 or 2 children have the highest poverty rate of 16.9%, comprising of 38 families. On the other hand, families with 3 or 4 children have the lowest poverty rate of 0.0%, which includes 0 families.
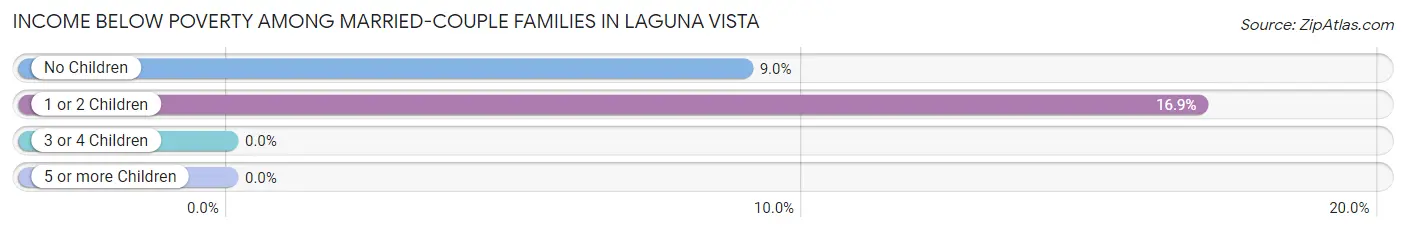
| Children | Above Poverty | Below Poverty |
| No Children | 610 (91.0%) | 60 (9.0%) |
| 1 or 2 Children | 187 (83.1%) | 38 (16.9%) |
| 3 or 4 Children | 66 (100.0%) | 0 (0.0%) |
| 5 or more Children | 0 (0.0%) | 0 (0.0%) |
| Total | 863 (89.8%) | 98 (10.2%) |
Income Below Poverty Among Single-Parent Households in Laguna Vista
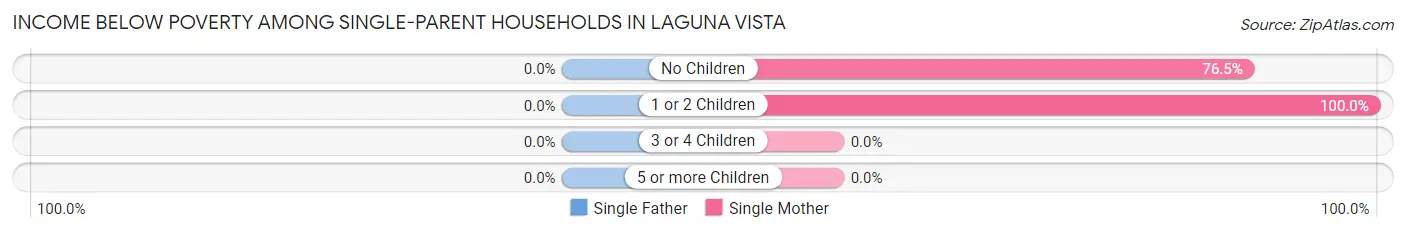
| Children | Single Father | Single Mother |
| No Children | 0 (0.0%) | 88 (76.5%) |
| 1 or 2 Children | 0 (0.0%) | 32 (100.0%) |
| 3 or 4 Children | 0 (0.0%) | 0 (0.0%) |
| 5 or more Children | 0 (0.0%) | 0 (0.0%) |
| Total | 0 (0.0%) | 120 (81.6%) |
Income Below Poverty Among Married-Couple vs Single-Parent Households in Laguna Vista
The poverty data for Laguna Vista shows that 98 of the married-couple family households (10.2%) and 120 of the single-parent households (61.9%) are living below the poverty level. Within the married-couple family households, those with 1 or 2 children have the highest poverty rate, with 38 households (16.9%) falling below the poverty line. Among the single-parent households, those with 1 or 2 children have the highest poverty rate, with 32 household (100.0%) living below poverty.
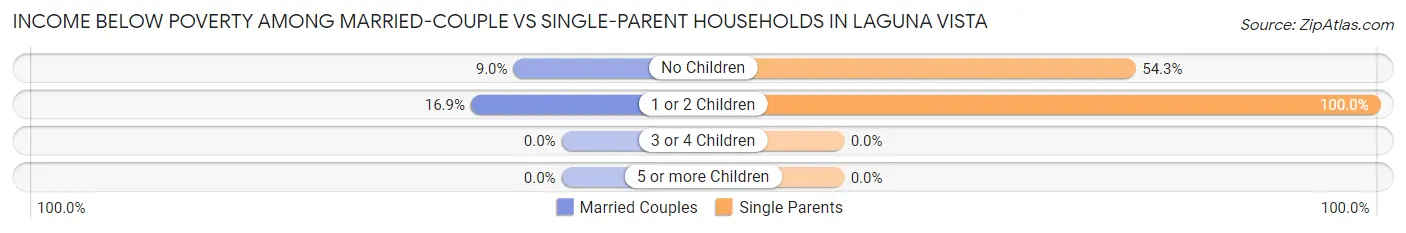
| Children | Married-Couple Families | Single-Parent Households |
| No Children | 60 (9.0%) | 88 (54.3%) |
| 1 or 2 Children | 38 (16.9%) | 32 (100.0%) |
| 3 or 4 Children | 0 (0.0%) | 0 (0.0%) |
| 5 or more Children | 0 (0.0%) | 0 (0.0%) |
| Total | 98 (10.2%) | 120 (61.9%) |
Race in Laguna Vista
The most populous races in Laguna Vista are White / Caucasian (3,305 | 93.0%), Hispanic or Latino (1,185 | 33.3%), and Two or more Races (204 | 5.7%).
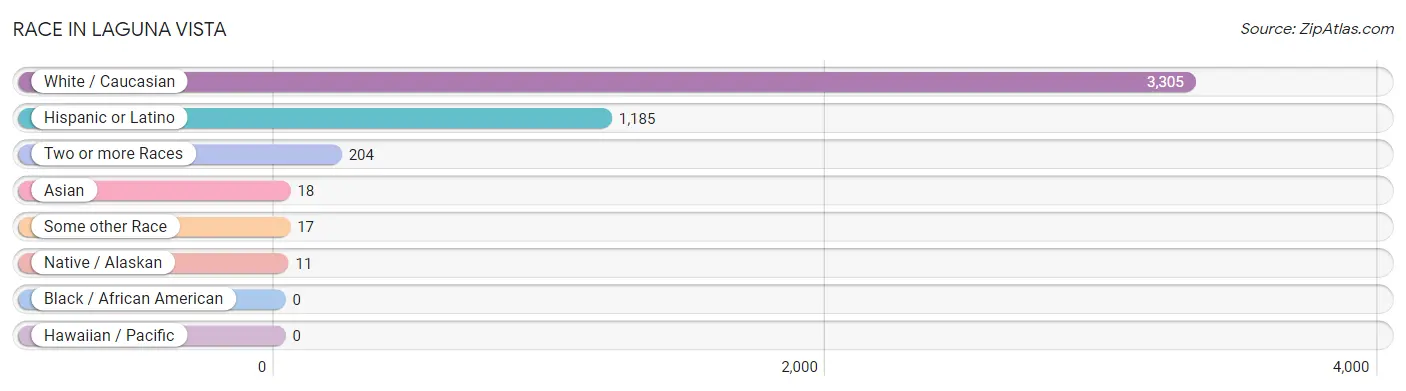
| Race | # Population | % Population |
| Asian | 18 | 0.5% |
| Black / African American | 0 | 0.0% |
| Hawaiian / Pacific | 0 | 0.0% |
| Hispanic or Latino | 1,185 | 33.3% |
| Native / Alaskan | 11 | 0.3% |
| White / Caucasian | 3,305 | 93.0% |
| Two or more Races | 204 | 5.7% |
| Some other Race | 17 | 0.5% |
| Total | 3,555 | 100.0% |
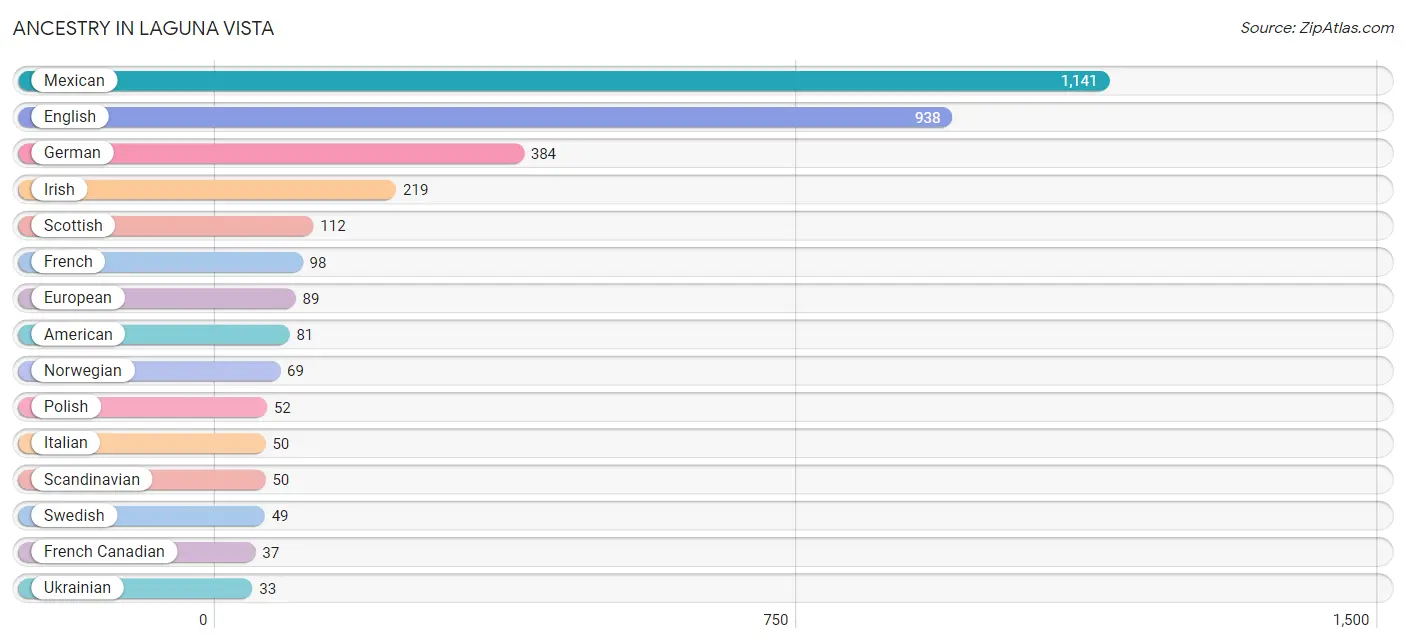
Ancestry in Laguna Vista
The most populous ancestries reported in Laguna Vista are Mexican (1,141 | 32.1%), English (938 | 26.4%), German (384 | 10.8%), Irish (219 | 6.2%), and Scottish (112 | 3.2%), together accounting for 78.6% of all Laguna Vista residents.
| Ancestry | # Population | % Population |
| American | 81 | 2.3% |
| Austrian | 23 | 0.6% |
| Canadian | 18 | 0.5% |
| Central American | 17 | 0.5% |
| Cherokee | 12 | 0.3% |
| Czech | 22 | 0.6% |
| Dutch | 25 | 0.7% |
| English | 938 | 26.4% |
| European | 89 | 2.5% |
| French | 98 | 2.8% |
| French Canadian | 37 | 1.0% |
| German | 384 | 10.8% |
| Guatemalan | 17 | 0.5% |
| Hungarian | 9 | 0.3% |
| Irish | 219 | 6.2% |
| Italian | 50 | 1.4% |
| Korean | 18 | 0.5% |
| Mexican | 1,141 | 32.1% |
| Northern European | 8 | 0.2% |
| Norwegian | 69 | 1.9% |
| Polish | 52 | 1.5% |
| Portuguese | 9 | 0.3% |
| Puerto Rican | 6 | 0.2% |
| Romanian | 10 | 0.3% |
| Scandinavian | 50 | 1.4% |
| Scotch-Irish | 27 | 0.8% |
| Scottish | 112 | 3.2% |
| Sioux | 11 | 0.3% |
| Slovak | 13 | 0.4% |
| Spaniard | 8 | 0.2% |
| Swedish | 49 | 1.4% |
| Ukrainian | 33 | 0.9% |
| Welsh | 9 | 0.3% | View All 33 Rows |
Immigrants in Laguna Vista
The most numerous immigrant groups reported in Laguna Vista came from Central America (185 | 5.2%), Latin America (185 | 5.2%), Mexico (131 | 3.7%), Canada (81 | 2.3%), and Honduras (54 | 1.5%), together accounting for 17.9% of all Laguna Vista residents.
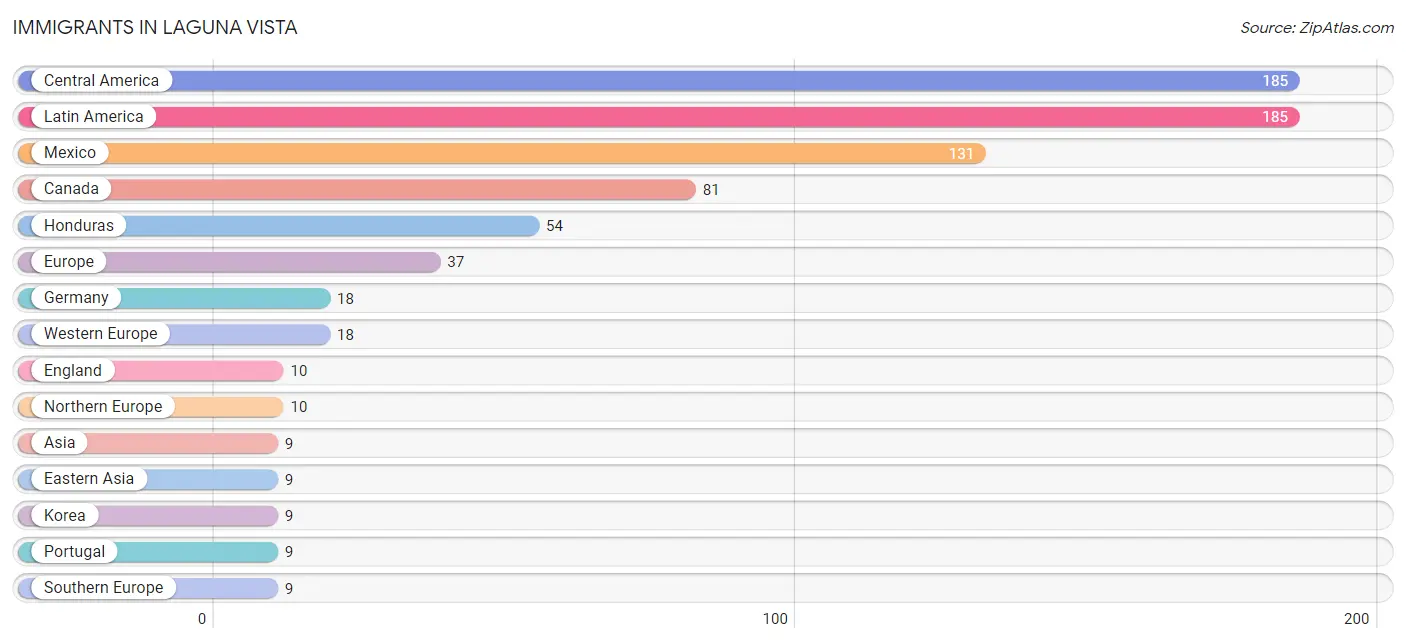
| Immigration Origin | # Population | % Population |
| Asia | 9 | 0.3% |
| Canada | 81 | 2.3% |
| Central America | 185 | 5.2% |
| Eastern Asia | 9 | 0.3% |
| England | 10 | 0.3% |
| Europe | 37 | 1.0% |
| Germany | 18 | 0.5% |
| Honduras | 54 | 1.5% |
| Korea | 9 | 0.3% |
| Latin America | 185 | 5.2% |
| Mexico | 131 | 3.7% |
| Northern Europe | 10 | 0.3% |
| Portugal | 9 | 0.3% |
| Southern Europe | 9 | 0.3% |
| Western Europe | 18 | 0.5% | View All 15 Rows |
Sex and Age in Laguna Vista
Sex and Age in Laguna Vista
The most populous age groups in Laguna Vista are 60 to 64 Years (221 | 12.3%) for men and 65 to 69 Years (206 | 11.7%) for women.
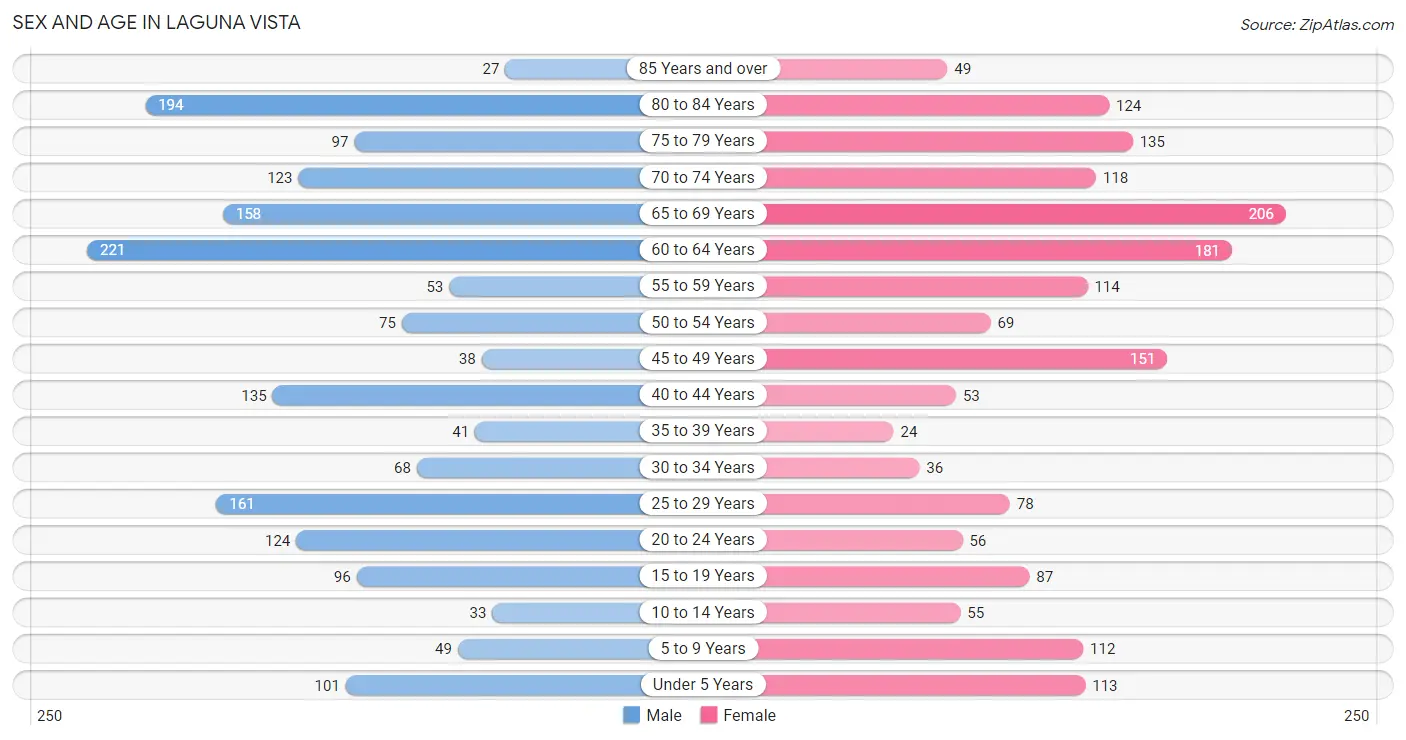
| Age Bracket | Male | Female |
| Under 5 Years | 101 (5.6%) | 113 (6.4%) |
| 5 to 9 Years | 49 (2.7%) | 112 (6.4%) |
| 10 to 14 Years | 33 (1.8%) | 55 (3.1%) |
| 15 to 19 Years | 96 (5.3%) | 87 (4.9%) |
| 20 to 24 Years | 124 (6.9%) | 56 (3.2%) |
| 25 to 29 Years | 161 (9.0%) | 78 (4.4%) |
| 30 to 34 Years | 68 (3.8%) | 36 (2.0%) |
| 35 to 39 Years | 41 (2.3%) | 24 (1.4%) |
| 40 to 44 Years | 135 (7.5%) | 53 (3.0%) |
| 45 to 49 Years | 38 (2.1%) | 151 (8.6%) |
| 50 to 54 Years | 75 (4.2%) | 69 (3.9%) |
| 55 to 59 Years | 53 (2.9%) | 114 (6.5%) |
| 60 to 64 Years | 221 (12.3%) | 181 (10.3%) |
| 65 to 69 Years | 158 (8.8%) | 206 (11.7%) |
| 70 to 74 Years | 123 (6.9%) | 118 (6.7%) |
| 75 to 79 Years | 97 (5.4%) | 135 (7.7%) |
| 80 to 84 Years | 194 (10.8%) | 124 (7.0%) |
| 85 Years and over | 27 (1.5%) | 49 (2.8%) |
| Total | 1,794 (100.0%) | 1,761 (100.0%) |
Families and Households in Laguna Vista
Median Family Size in Laguna Vista
The median family size in Laguna Vista is 2.73 persons per family, with single male/father families (47 | 4.1%) accounting for the largest median family size of 2.89 persons per family. On the other hand, single female/mother families (147 | 12.7%) represent the smallest median family size with 2.23 persons per family.
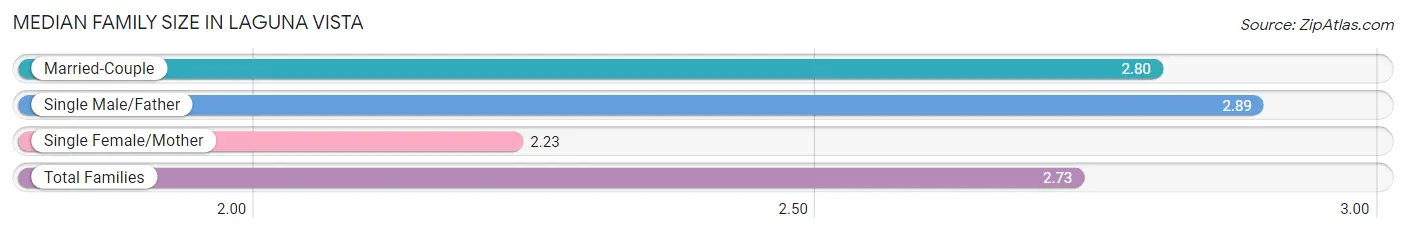
| Family Type | # Families | Family Size |
| Married-Couple | 961 (83.2%) | 2.80 |
| Single Male/Father | 47 (4.1%) | 2.89 |
| Single Female/Mother | 147 (12.7%) | 2.23 |
| Total Families | 1,155 (100.0%) | 2.73 |
Median Household Size in Laguna Vista
The median household size in Laguna Vista is 2.33 persons per household, with single male/father households (47 | 3.1%) accounting for the largest median household size of 2.89 persons per household. non-family households (369 | 24.2%) represent the smallest median household size with 1.08 persons per household.
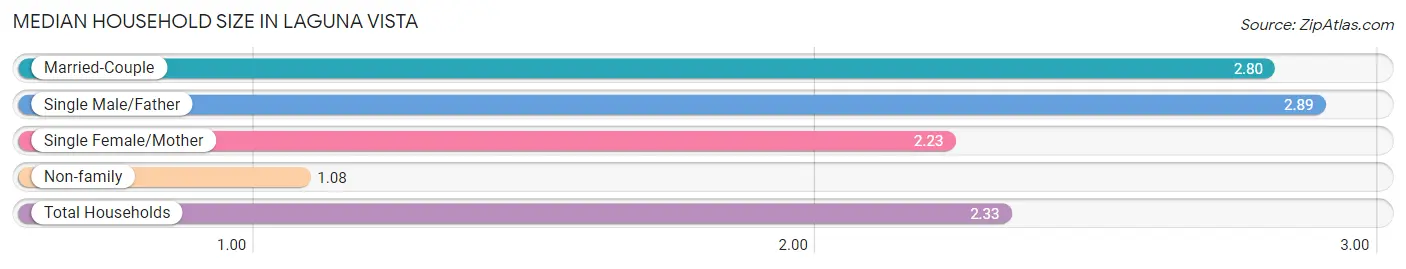
| Household Type | # Households | Household Size |
| Married-Couple | 961 (63.1%) | 2.80 |
| Single Male/Father | 47 (3.1%) | 2.89 |
| Single Female/Mother | 147 (9.7%) | 2.23 |
| Non-family | 369 (24.2%) | 1.08 |
| Total Households | 1,524 (100.0%) | 2.33 |
Household Size by Marriage Status in Laguna Vista
Out of a total of 1,524 households in Laguna Vista, 1,155 (75.8%) are family households, while 369 (24.2%) are nonfamily households. The most numerous type of family households are 2-person households, comprising 722, and the most common type of nonfamily households are 1-person households, comprising 343.
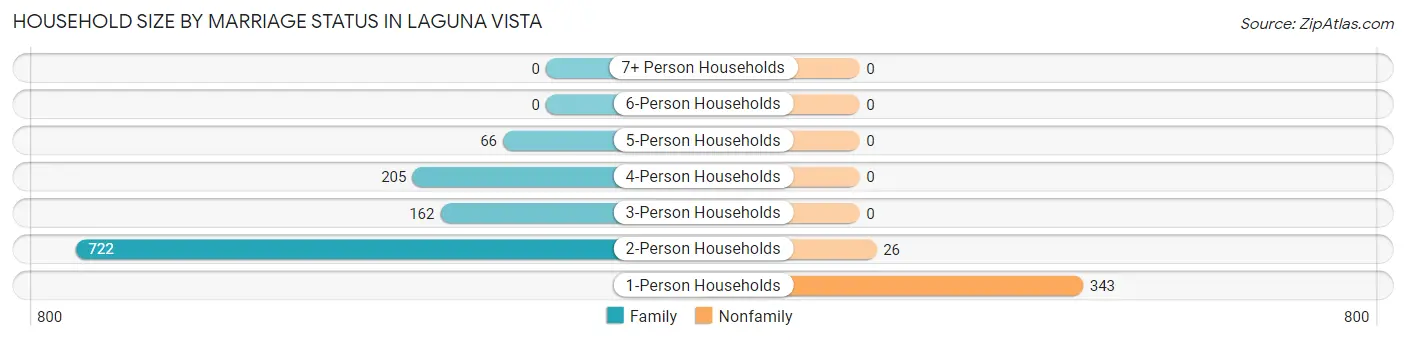
| Household Size | Family Households | Nonfamily Households |
| 1-Person Households | - | 343 (22.5%) |
| 2-Person Households | 722 (47.4%) | 26 (1.7%) |
| 3-Person Households | 162 (10.6%) | 0 (0.0%) |
| 4-Person Households | 205 (13.5%) | 0 (0.0%) |
| 5-Person Households | 66 (4.3%) | 0 (0.0%) |
| 6-Person Households | 0 (0.0%) | 0 (0.0%) |
| 7+ Person Households | 0 (0.0%) | 0 (0.0%) |
| Total | 1,155 (75.8%) | 369 (24.2%) |
Female Fertility in Laguna Vista
Fertility by Age in Laguna Vista
| Age Bracket | Women with Births | Births / 1,000 Women |
| 15 to 19 years | 0 (0.0%) | 0.0 |
| 20 to 34 years | 0 (0.0%) | 0.0 |
| 35 to 50 years | 0 (0.0%) | 0.0 |
| Total | 0 (0.0%) | 0.0 |
Fertility by Age by Marriage Status in Laguna Vista
| Age Bracket | Married | Unmarried |
| 15 to 19 years | 0 (0.0%) | 0 (0.0%) |
| 20 to 34 years | 0 (0.0%) | 0 (0.0%) |
| 35 to 50 years | 0 (0.0%) | 0 (0.0%) |
| Total | 0 (0.0%) | 0 (0.0%) |
Fertility by Education in Laguna Vista
| Educational Attainment | Women with Births | Births / 1,000 Women |
| Less than High School | 0 (0.0%) | 0.0 |
| High School Diploma | 0 (0.0%) | 0.0 |
| College or Associate's Degree | 0 (0.0%) | 0.0 |
| Bachelor's Degree | 0 (0.0%) | 0.0 |
| Graduate Degree | 0 (0.0%) | 0.0 |
| Total | 0 (0.0%) | 0.0 |
Fertility by Education by Marriage Status in Laguna Vista
| Educational Attainment | Married | Unmarried |
| Less than High School | 0 (0.0%) | 0 (0.0%) |
| High School Diploma | 0 (0.0%) | 0 (0.0%) |
| College or Associate's Degree | 0 (0.0%) | 0 (0.0%) |
| Bachelor's Degree | 0 (0.0%) | 0 (0.0%) |
| Graduate Degree | 0 (0.0%) | 0 (0.0%) |
| Total | 0 (0.0%) | 0 (0.0%) |
Employment Characteristics in Laguna Vista
Employment by Class of Employer in Laguna Vista
Among the 1,197 employed individuals in Laguna Vista, private company employees (572 | 47.8%), self-employed (not incorporated) (197 | 16.5%), and local government employees (189 | 15.8%) make up the most common classes of employment.
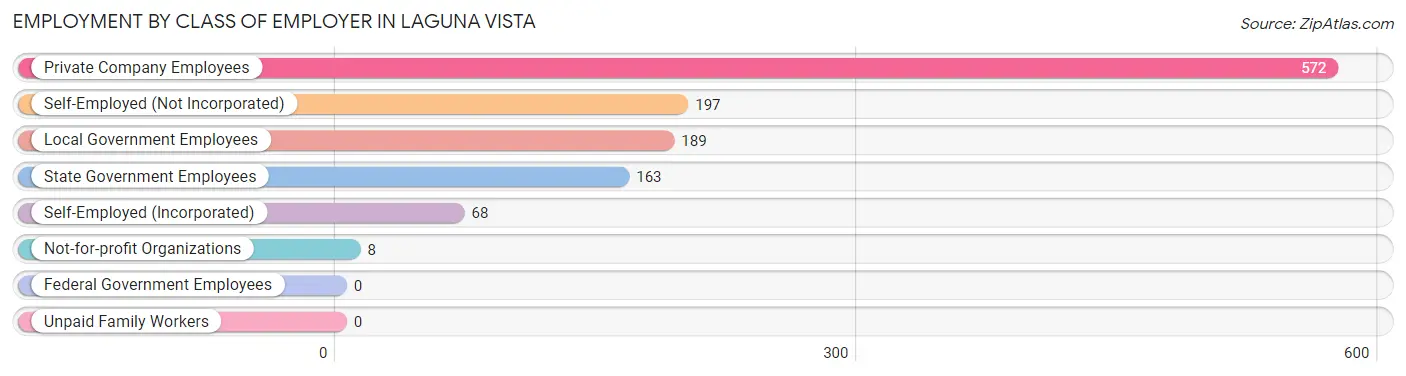
| Employer Class | # Employees | % Employees |
| Private Company Employees | 572 | 47.8% |
| Self-Employed (Incorporated) | 68 | 5.7% |
| Self-Employed (Not Incorporated) | 197 | 16.5% |
| Not-for-profit Organizations | 8 | 0.7% |
| Local Government Employees | 189 | 15.8% |
| State Government Employees | 163 | 13.6% |
| Federal Government Employees | 0 | 0.0% |
| Unpaid Family Workers | 0 | 0.0% |
| Total | 1,197 | 100.0% |
Employment Status by Age in Laguna Vista
According to the labor force statistics for Laguna Vista, out of the total population over 16 years of age (3,057), 41.6% or 1,272 individuals are in the labor force, with 2.0% or 25 of them unemployed. The age group with the highest labor force participation rate is 35 to 44 years, with 95.7% or 242 individuals in the labor force. Within the labor force, the 25 to 29 years age range has the highest percentage of unemployed individuals, with 8.5% or 11 of them being unemployed.
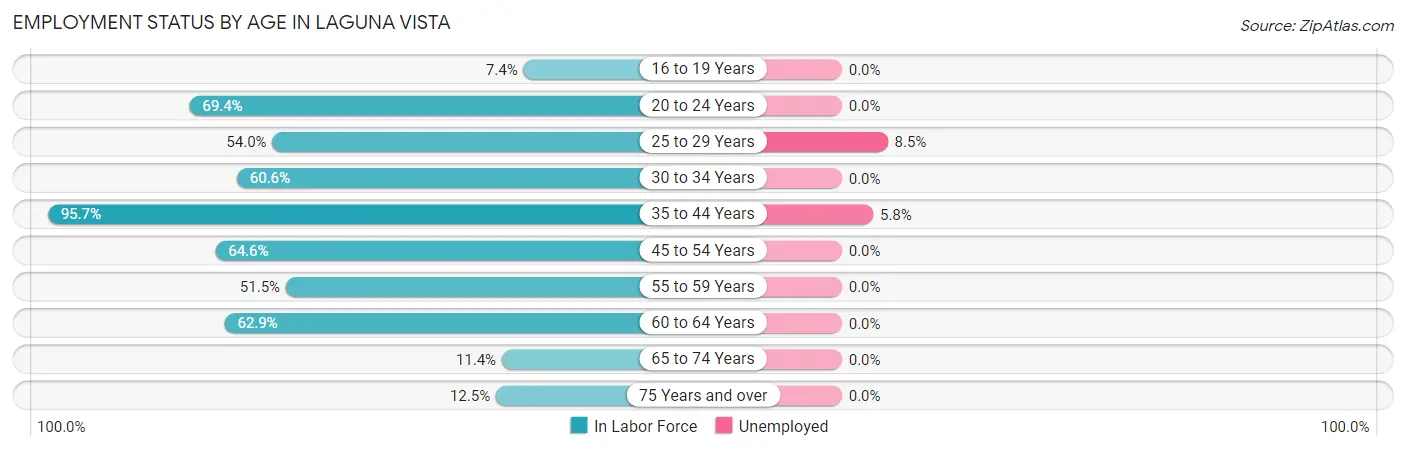
| Age Bracket | In Labor Force | Unemployed |
| 16 to 19 Years | 11 (7.4%) | 0 (0.0%) |
| 20 to 24 Years | 125 (69.4%) | 0 (0.0%) |
| 25 to 29 Years | 129 (54.0%) | 11 (8.5%) |
| 30 to 34 Years | 63 (60.6%) | 0 (0.0%) |
| 35 to 44 Years | 242 (95.7%) | 14 (5.8%) |
| 45 to 54 Years | 215 (64.6%) | 0 (0.0%) |
| 55 to 59 Years | 86 (51.5%) | 0 (0.0%) |
| 60 to 64 Years | 253 (62.9%) | 0 (0.0%) |
| 65 to 74 Years | 69 (11.4%) | 0 (0.0%) |
| 75 Years and over | 78 (12.5%) | 0 (0.0%) |
| Total | 1,272 (41.6%) | 25 (2.0%) |
Employment Status by Educational Attainment in Laguna Vista
According to labor force statistics for Laguna Vista, 66.0% of individuals (989) out of the total population between 25 and 64 years of age (1,498) are in the labor force, with 2.5% or 25 of them being unemployed. The group with the highest labor force participation rate are those with the educational attainment of bachelor's degree or higher, with 81.0% or 422 individuals in the labor force. Within the labor force, individuals with high school diploma education have the highest percentage of unemployment, with 5.1% or 14 of them being unemployed.
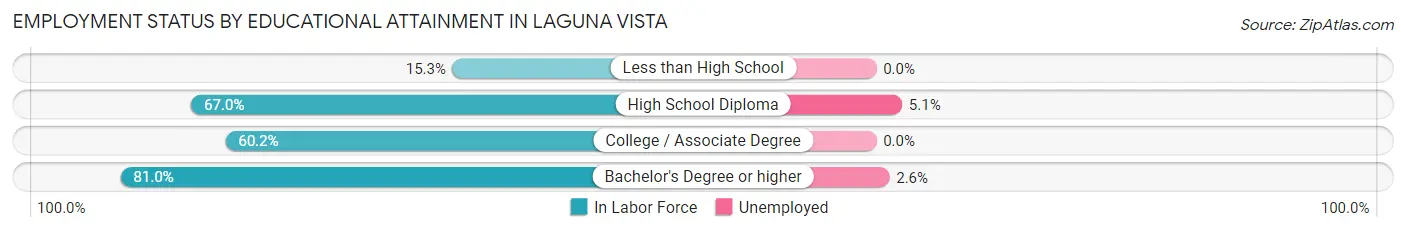
| Educational Attainment | In Labor Force | Unemployed |
| Less than High School | 17 (15.3%) | 0 (0.0%) |
| High School Diploma | 272 (67.0%) | 21 (5.1%) |
| College / Associate Degree | 277 (60.2%) | 0 (0.0%) |
| Bachelor's Degree or higher | 422 (81.0%) | 14 (2.6%) |
| Total | 989 (66.0%) | 37 (2.5%) |
Employment Occupations by Sex in Laguna Vista
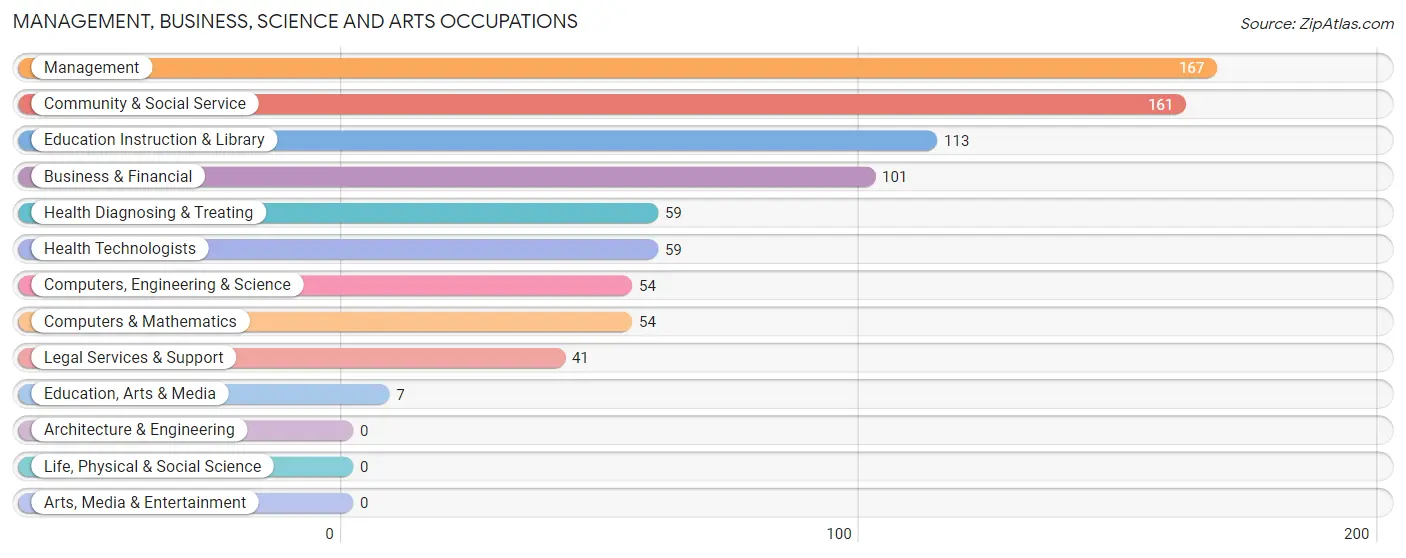
Management, Business, Science and Arts Occupations
The most common Management, Business, Science and Arts occupations in Laguna Vista are Management (167 | 13.4%), Community & Social Service (161 | 12.9%), Education Instruction & Library (113 | 9.1%), Business & Financial (101 | 8.1%), and Health Diagnosing & Treating (59 | 4.7%).
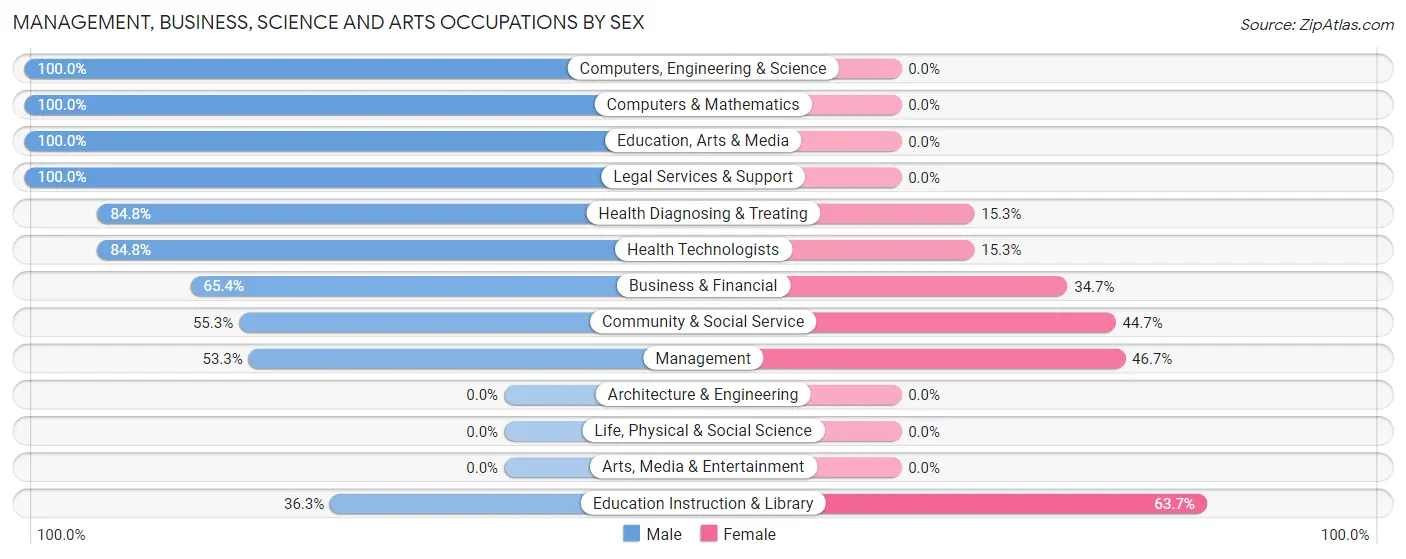
Management, Business, Science and Arts Occupations by Sex
Within the Management, Business, Science and Arts occupations in Laguna Vista, the most male-oriented occupations are Computers, Engineering & Science (100.0%), Computers & Mathematics (100.0%), and Education, Arts & Media (100.0%), while the most female-oriented occupations are Education Instruction & Library (63.7%), Management (46.7%), and Community & Social Service (44.7%).
| Occupation | Male | Female |
| Management | 89 (53.3%) | 78 (46.7%) |
| Business & Financial | 66 (65.3%) | 35 (34.6%) |
| Computers, Engineering & Science | 54 (100.0%) | 0 (0.0%) |
| Computers & Mathematics | 54 (100.0%) | 0 (0.0%) |
| Architecture & Engineering | 0 (0.0%) | 0 (0.0%) |
| Life, Physical & Social Science | 0 (0.0%) | 0 (0.0%) |
| Community & Social Service | 89 (55.3%) | 72 (44.7%) |
| Education, Arts & Media | 7 (100.0%) | 0 (0.0%) |
| Legal Services & Support | 41 (100.0%) | 0 (0.0%) |
| Education Instruction & Library | 41 (36.3%) | 72 (63.7%) |
| Arts, Media & Entertainment | 0 (0.0%) | 0 (0.0%) |
| Health Diagnosing & Treating | 50 (84.8%) | 9 (15.2%) |
| Health Technologists | 50 (84.8%) | 9 (15.2%) |
| Total (Category) | 348 (64.2%) | 194 (35.8%) |
| Total (Overall) | 736 (59.1%) | 510 (40.9%) |
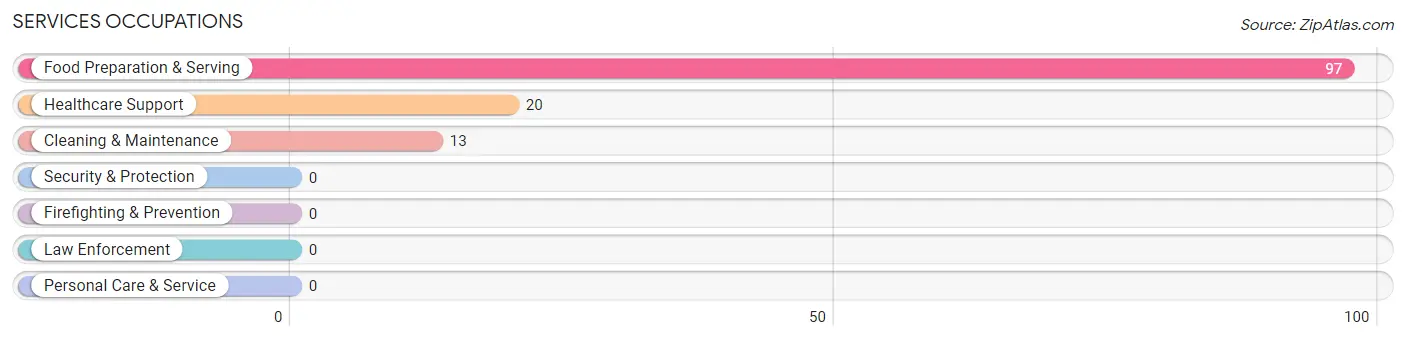
Services Occupations
The most common Services occupations in Laguna Vista are Food Preparation & Serving (97 | 7.8%), Healthcare Support (20 | 1.6%), and Cleaning & Maintenance (13 | 1.0%).
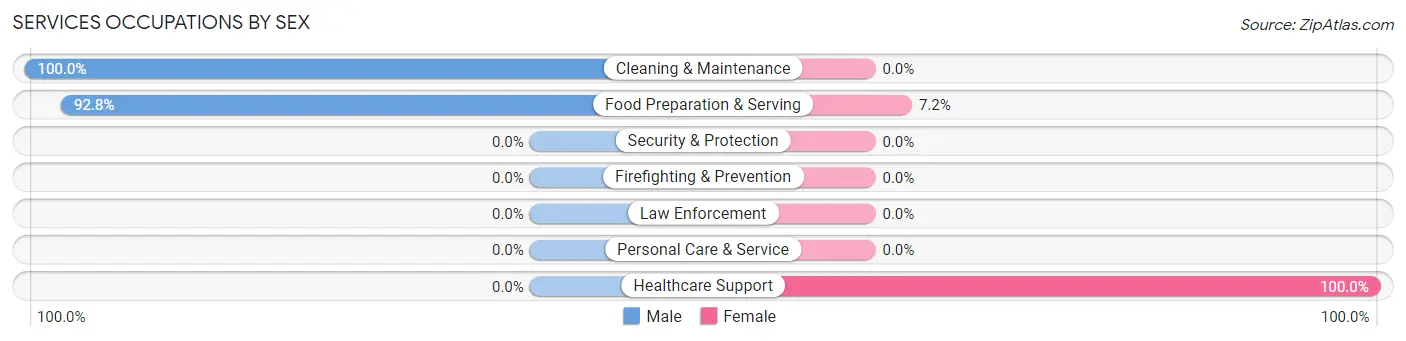
Services Occupations by Sex
Within the Services occupations in Laguna Vista, the most male-oriented occupations are Cleaning & Maintenance (100.0%), and Food Preparation & Serving (92.8%), while the most female-oriented occupations are Healthcare Support (100.0%), and Food Preparation & Serving (7.2%).
| Occupation | Male | Female |
| Healthcare Support | 0 (0.0%) | 20 (100.0%) |
| Security & Protection | 0 (0.0%) | 0 (0.0%) |
| Firefighting & Prevention | 0 (0.0%) | 0 (0.0%) |
| Law Enforcement | 0 (0.0%) | 0 (0.0%) |
| Food Preparation & Serving | 90 (92.8%) | 7 (7.2%) |
| Cleaning & Maintenance | 13 (100.0%) | 0 (0.0%) |
| Personal Care & Service | 0 (0.0%) | 0 (0.0%) |
| Total (Category) | 103 (79.2%) | 27 (20.8%) |
| Total (Overall) | 736 (59.1%) | 510 (40.9%) |
Sales and Office Occupations
The most common Sales and Office occupations in Laguna Vista are Office & Administration (240 | 19.3%), and Sales & Related (138 | 11.1%).
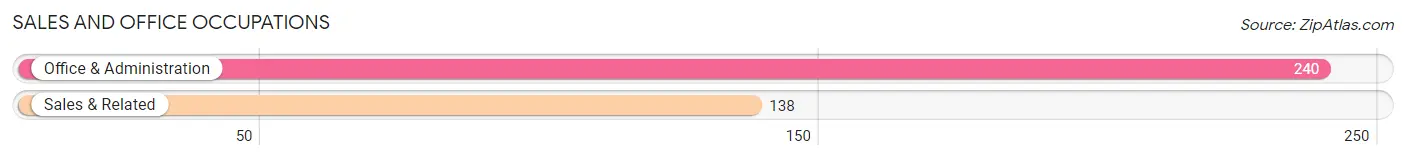
Sales and Office Occupations by Sex

| Occupation | Male | Female |
| Sales & Related | 73 (52.9%) | 65 (47.1%) |
| Office & Administration | 25 (10.4%) | 215 (89.6%) |
| Total (Category) | 98 (25.9%) | 280 (74.1%) |
| Total (Overall) | 736 (59.1%) | 510 (40.9%) |
Natural Resources, Construction and Maintenance Occupations
The most common Natural Resources, Construction and Maintenance occupations in Laguna Vista are Farming, Fishing & Forestry (20 | 1.6%), Construction & Extraction (19 | 1.5%), and Installation, Maintenance & Repair (19 | 1.5%).
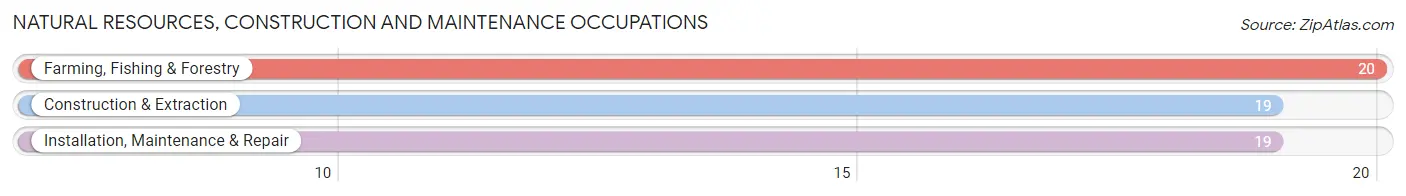
Natural Resources, Construction and Maintenance Occupations by Sex
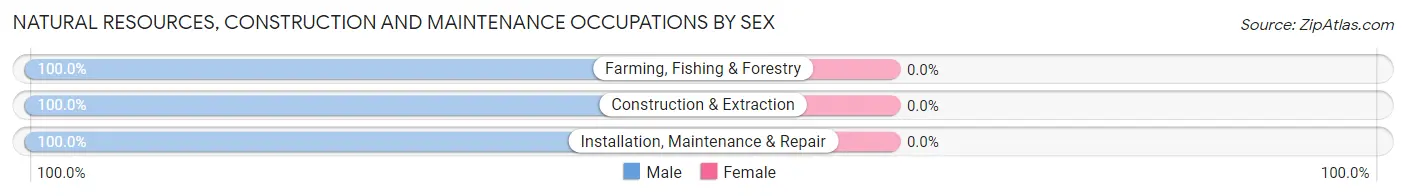
| Occupation | Male | Female |
| Farming, Fishing & Forestry | 20 (100.0%) | 0 (0.0%) |
| Construction & Extraction | 19 (100.0%) | 0 (0.0%) |
| Installation, Maintenance & Repair | 19 (100.0%) | 0 (0.0%) |
| Total (Category) | 58 (100.0%) | 0 (0.0%) |
| Total (Overall) | 736 (59.1%) | 510 (40.9%) |
Production, Transportation and Moving Occupations
The most common Production, Transportation and Moving occupations in Laguna Vista are Transportation (70 | 5.6%), Material Moving (37 | 3.0%), and Production (31 | 2.5%).
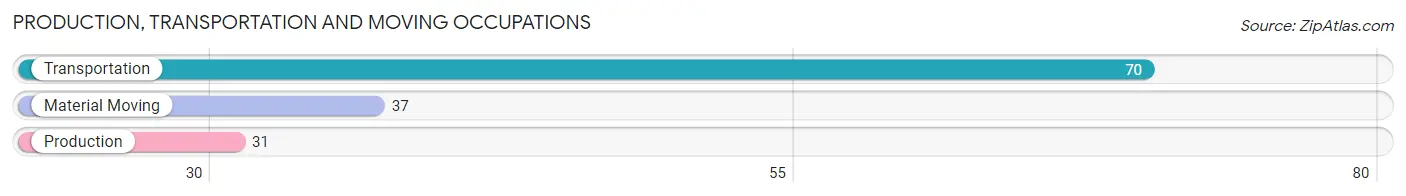
Production, Transportation and Moving Occupations by Sex
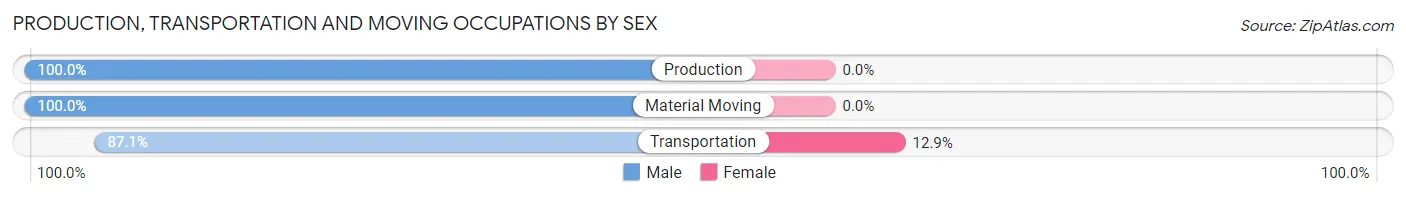
| Occupation | Male | Female |
| Production | 31 (100.0%) | 0 (0.0%) |
| Transportation | 61 (87.1%) | 9 (12.9%) |
| Material Moving | 37 (100.0%) | 0 (0.0%) |
| Total (Category) | 129 (93.5%) | 9 (6.5%) |
| Total (Overall) | 736 (59.1%) | 510 (40.9%) |
Employment Industries by Sex in Laguna Vista
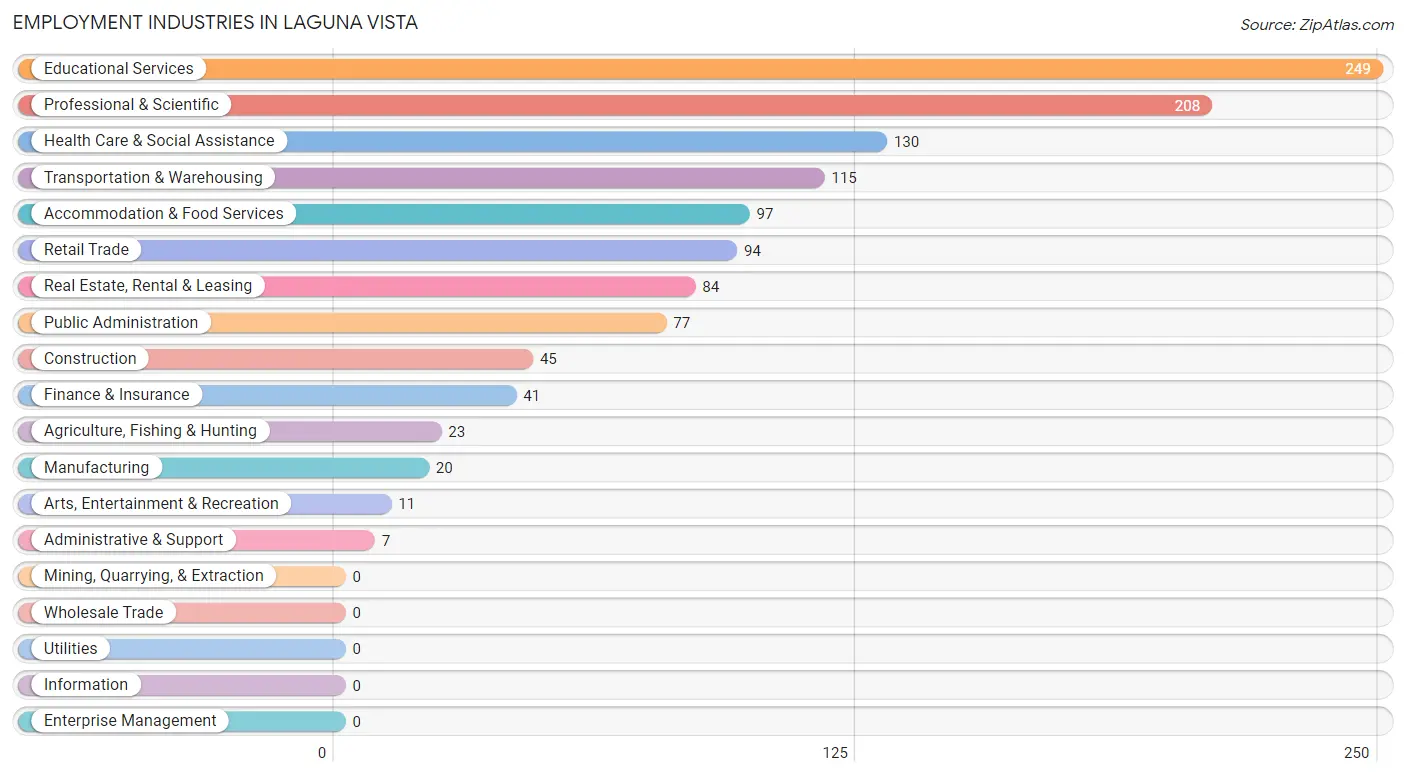
Employment Industries in Laguna Vista
The major employment industries in Laguna Vista include Educational Services (249 | 20.0%), Professional & Scientific (208 | 16.7%), Health Care & Social Assistance (130 | 10.4%), Transportation & Warehousing (115 | 9.2%), and Accommodation & Food Services (97 | 7.8%).
Employment Industries by Sex in Laguna Vista
The Laguna Vista industries that see more men than women are Manufacturing (100.0%), Administrative & Support (100.0%), and Arts, Entertainment & Recreation (100.0%), whereas the industries that tend to have a higher number of women are Finance & Insurance (70.7%), Educational Services (69.5%), and Real Estate, Rental & Leasing (60.7%).
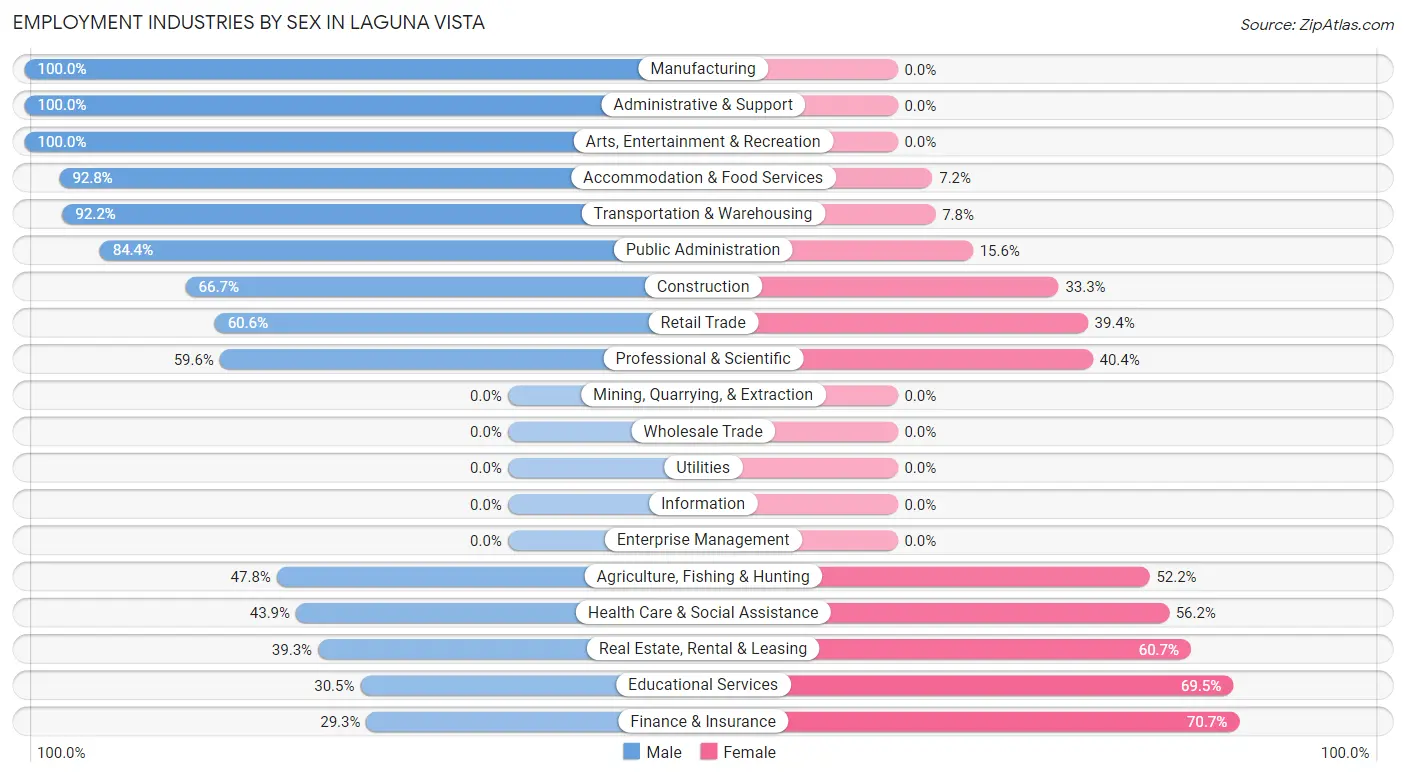
| Industry | Male | Female |
| Agriculture, Fishing & Hunting | 11 (47.8%) | 12 (52.2%) |
| Mining, Quarrying, & Extraction | 0 (0.0%) | 0 (0.0%) |
| Construction | 30 (66.7%) | 15 (33.3%) |
| Manufacturing | 20 (100.0%) | 0 (0.0%) |
| Wholesale Trade | 0 (0.0%) | 0 (0.0%) |
| Retail Trade | 57 (60.6%) | 37 (39.4%) |
| Transportation & Warehousing | 106 (92.2%) | 9 (7.8%) |
| Utilities | 0 (0.0%) | 0 (0.0%) |
| Information | 0 (0.0%) | 0 (0.0%) |
| Finance & Insurance | 12 (29.3%) | 29 (70.7%) |
| Real Estate, Rental & Leasing | 33 (39.3%) | 51 (60.7%) |
| Professional & Scientific | 124 (59.6%) | 84 (40.4%) |
| Enterprise Management | 0 (0.0%) | 0 (0.0%) |
| Administrative & Support | 7 (100.0%) | 0 (0.0%) |
| Educational Services | 76 (30.5%) | 173 (69.5%) |
| Health Care & Social Assistance | 57 (43.9%) | 73 (56.1%) |
| Arts, Entertainment & Recreation | 11 (100.0%) | 0 (0.0%) |
| Accommodation & Food Services | 90 (92.8%) | 7 (7.2%) |
| Public Administration | 65 (84.4%) | 12 (15.6%) |
| Total | 736 (59.1%) | 510 (40.9%) |
Education in Laguna Vista
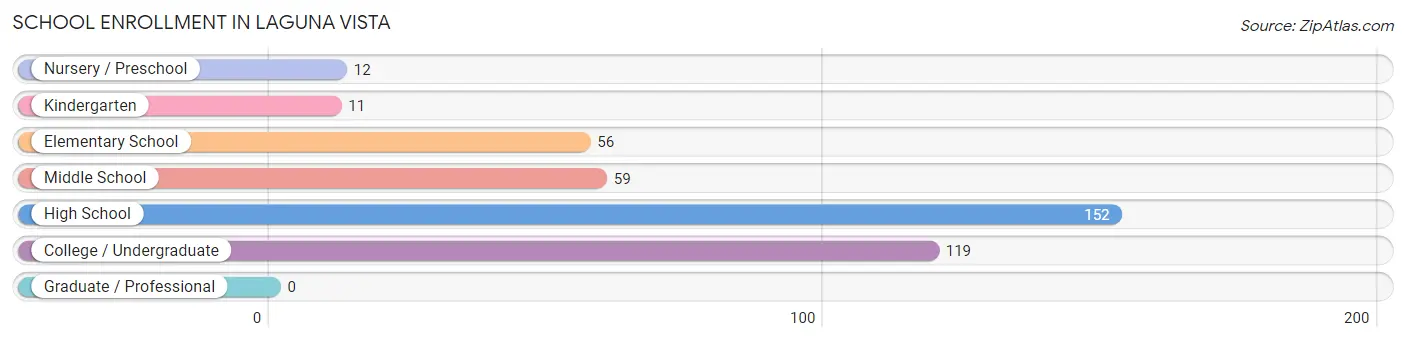
School Enrollment in Laguna Vista
The most common levels of schooling among the 409 students in Laguna Vista are high school (152 | 37.2%), college / undergraduate (119 | 29.1%), and middle school (59 | 14.4%).
| School Level | # Students | % Students |
| Nursery / Preschool | 12 | 2.9% |
| Kindergarten | 11 | 2.7% |
| Elementary School | 56 | 13.7% |
| Middle School | 59 | 14.4% |
| High School | 152 | 37.2% |
| College / Undergraduate | 119 | 29.1% |
| Graduate / Professional | 0 | 0.0% |
| Total | 409 | 100.0% |
School Enrollment by Age by Funding Source in Laguna Vista
Out of a total of 409 students who are enrolled in schools in Laguna Vista, 93 (22.7%) attend a private institution, while the remaining 316 (77.3%) are enrolled in public schools. The age group of 10 to 14 year olds has the highest likelihood of being enrolled in private schools, with 41 (46.6% in the age bracket) enrolled. Conversely, the age group of 3 to 4 year olds has the lowest likelihood of being enrolled in a private school, with 12 (100.0% in the age bracket) attending a public institution.
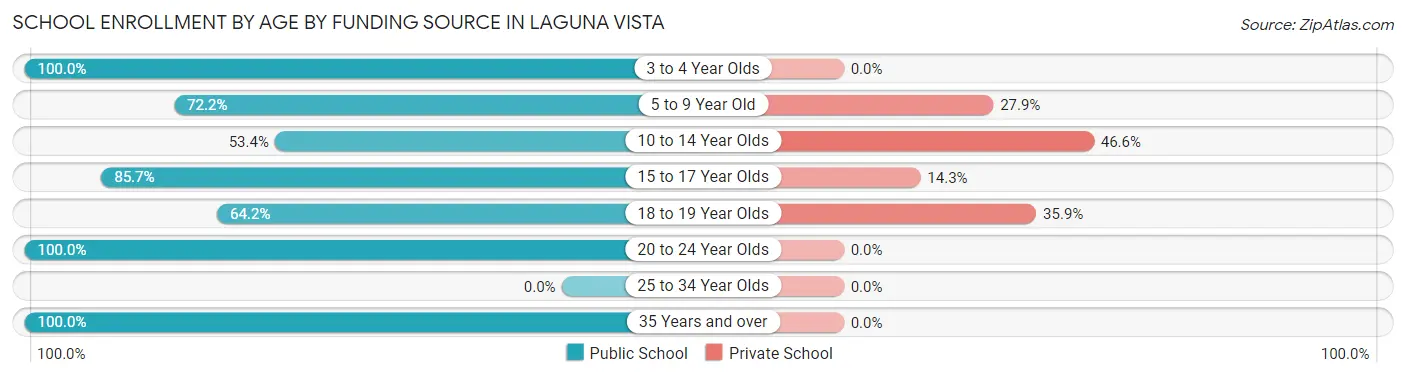
| Age Bracket | Public School | Private School |
| 3 to 4 Year Olds | 12 (100.0%) | 0 (0.0%) |
| 5 to 9 Year Old | 57 (72.2%) | 22 (27.9%) |
| 10 to 14 Year Olds | 47 (53.4%) | 41 (46.6%) |
| 15 to 17 Year Olds | 66 (85.7%) | 11 (14.3%) |
| 18 to 19 Year Olds | 34 (64.1%) | 19 (35.8%) |
| 20 to 24 Year Olds | 94 (100.0%) | 0 (0.0%) |
| 25 to 34 Year Olds | 0 (0.0%) | 0 (0.0%) |
| 35 Years and over | 6 (100.0%) | 0 (0.0%) |
| Total | 316 (77.3%) | 93 (22.7%) |
Educational Attainment by Field of Study in Laguna Vista
Education (220 | 20.9%), business (150 | 14.2%), social sciences (112 | 10.6%), literature & languages (96 | 9.1%), and arts & humanities (81 | 7.7%) are the most common fields of study among 1,054 individuals in Laguna Vista who have obtained a bachelor's degree or higher.
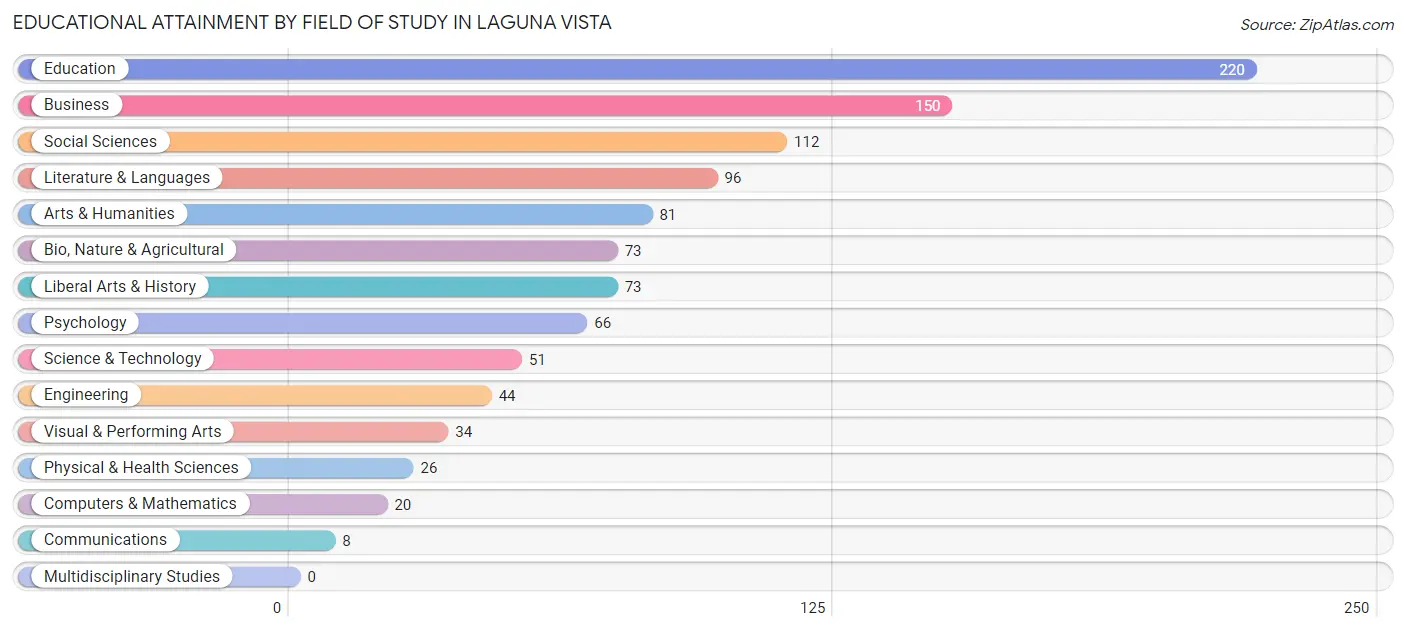
| Field of Study | # Graduates | % Graduates |
| Computers & Mathematics | 20 | 1.9% |
| Bio, Nature & Agricultural | 73 | 6.9% |
| Physical & Health Sciences | 26 | 2.5% |
| Psychology | 66 | 6.3% |
| Social Sciences | 112 | 10.6% |
| Engineering | 44 | 4.2% |
| Multidisciplinary Studies | 0 | 0.0% |
| Science & Technology | 51 | 4.8% |
| Business | 150 | 14.2% |
| Education | 220 | 20.9% |
| Literature & Languages | 96 | 9.1% |
| Liberal Arts & History | 73 | 6.9% |
| Visual & Performing Arts | 34 | 3.2% |
| Communications | 8 | 0.8% |
| Arts & Humanities | 81 | 7.7% |
| Total | 1,054 | 100.0% |
Transportation & Commute in Laguna Vista
Vehicle Availability by Sex in Laguna Vista
The most prevalent vehicle ownership categories in Laguna Vista are males with 2 vehicles (399, accounting for 55.6%) and females with 2 vehicles (266, making up 83.3%).
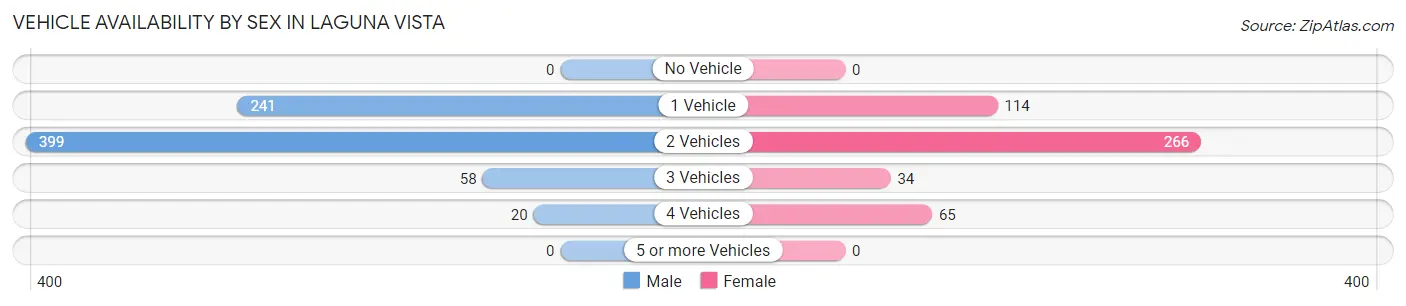
| Vehicles Available | Male | Female |
| No Vehicle | 0 (0.0%) | 0 (0.0%) |
| 1 Vehicle | 241 (33.6%) | 114 (23.8%) |
| 2 Vehicles | 399 (55.6%) | 266 (55.5%) |
| 3 Vehicles | 58 (8.1%) | 34 (7.1%) |
| 4 Vehicles | 20 (2.8%) | 65 (13.6%) |
| 5 or more Vehicles | 0 (0.0%) | 0 (0.0%) |
| Total | 718 (100.0%) | 479 (100.0%) |
Commute Time in Laguna Vista
The most frequently occuring commute durations in Laguna Vista are 15 to 19 minutes (224 commuters, 22.5%), 5 to 9 minutes (206 commuters, 20.7%), and 20 to 24 minutes (153 commuters, 15.4%).
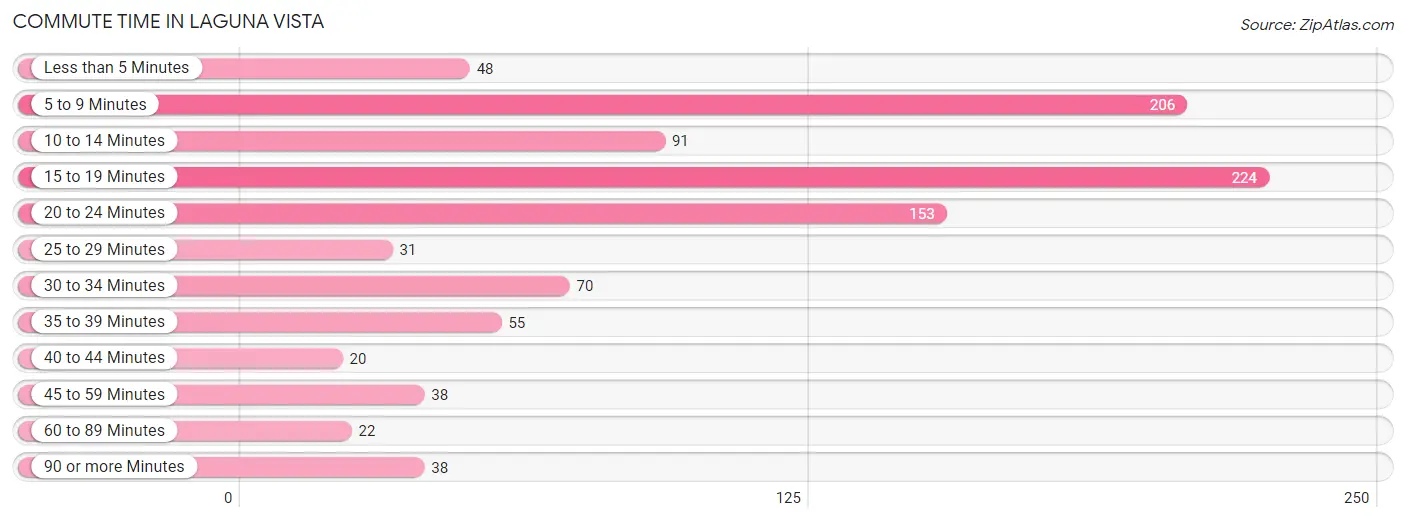
| Commute Time | # Commuters | % Commuters |
| Less than 5 Minutes | 48 | 4.8% |
| 5 to 9 Minutes | 206 | 20.7% |
| 10 to 14 Minutes | 91 | 9.1% |
| 15 to 19 Minutes | 224 | 22.5% |
| 20 to 24 Minutes | 153 | 15.4% |
| 25 to 29 Minutes | 31 | 3.1% |
| 30 to 34 Minutes | 70 | 7.0% |
| 35 to 39 Minutes | 55 | 5.5% |
| 40 to 44 Minutes | 20 | 2.0% |
| 45 to 59 Minutes | 38 | 3.8% |
| 60 to 89 Minutes | 22 | 2.2% |
| 90 or more Minutes | 38 | 3.8% |
Commute Time by Sex in Laguna Vista
The most common commute times in Laguna Vista are 15 to 19 minutes (147 commuters, 24.3%) for males and 5 to 9 minutes (102 commuters, 26.1%) for females.
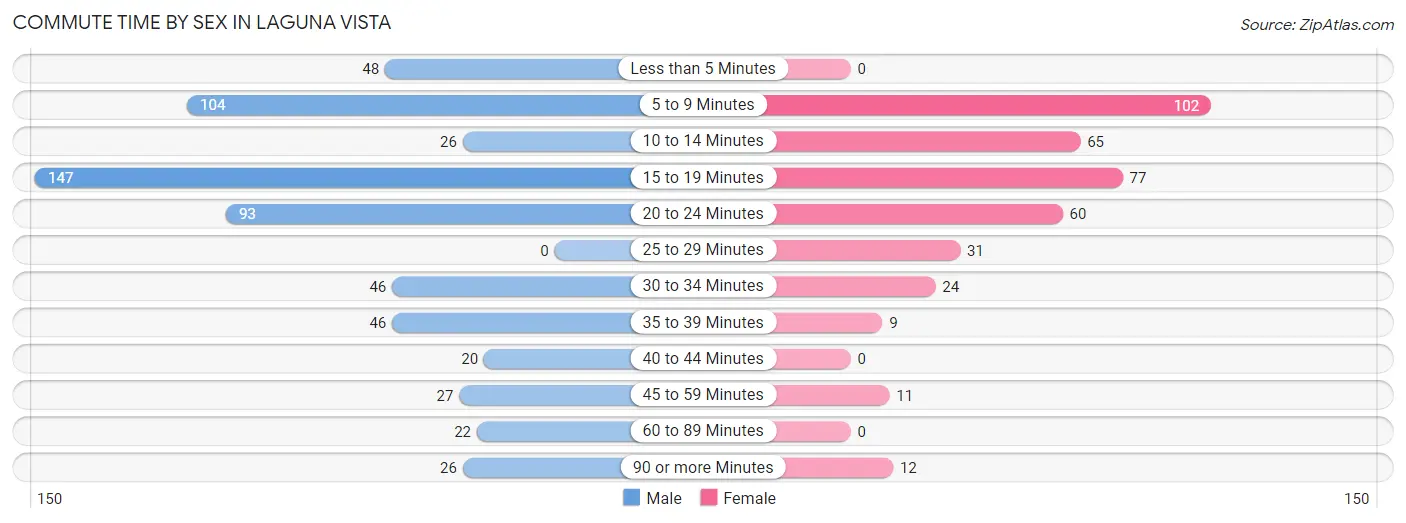
| Commute Time | Male | Female |
| Less than 5 Minutes | 48 (7.9%) | 0 (0.0%) |
| 5 to 9 Minutes | 104 (17.2%) | 102 (26.1%) |
| 10 to 14 Minutes | 26 (4.3%) | 65 (16.6%) |
| 15 to 19 Minutes | 147 (24.3%) | 77 (19.7%) |
| 20 to 24 Minutes | 93 (15.4%) | 60 (15.3%) |
| 25 to 29 Minutes | 0 (0.0%) | 31 (7.9%) |
| 30 to 34 Minutes | 46 (7.6%) | 24 (6.1%) |
| 35 to 39 Minutes | 46 (7.6%) | 9 (2.3%) |
| 40 to 44 Minutes | 20 (3.3%) | 0 (0.0%) |
| 45 to 59 Minutes | 27 (4.5%) | 11 (2.8%) |
| 60 to 89 Minutes | 22 (3.6%) | 0 (0.0%) |
| 90 or more Minutes | 26 (4.3%) | 12 (3.1%) |
Time of Departure to Work by Sex in Laguna Vista
The most frequent times of departure to work in Laguna Vista are 8:00 AM to 8:29 AM (140, 23.1%) for males and 7:30 AM to 7:59 AM (163, 41.7%) for females.
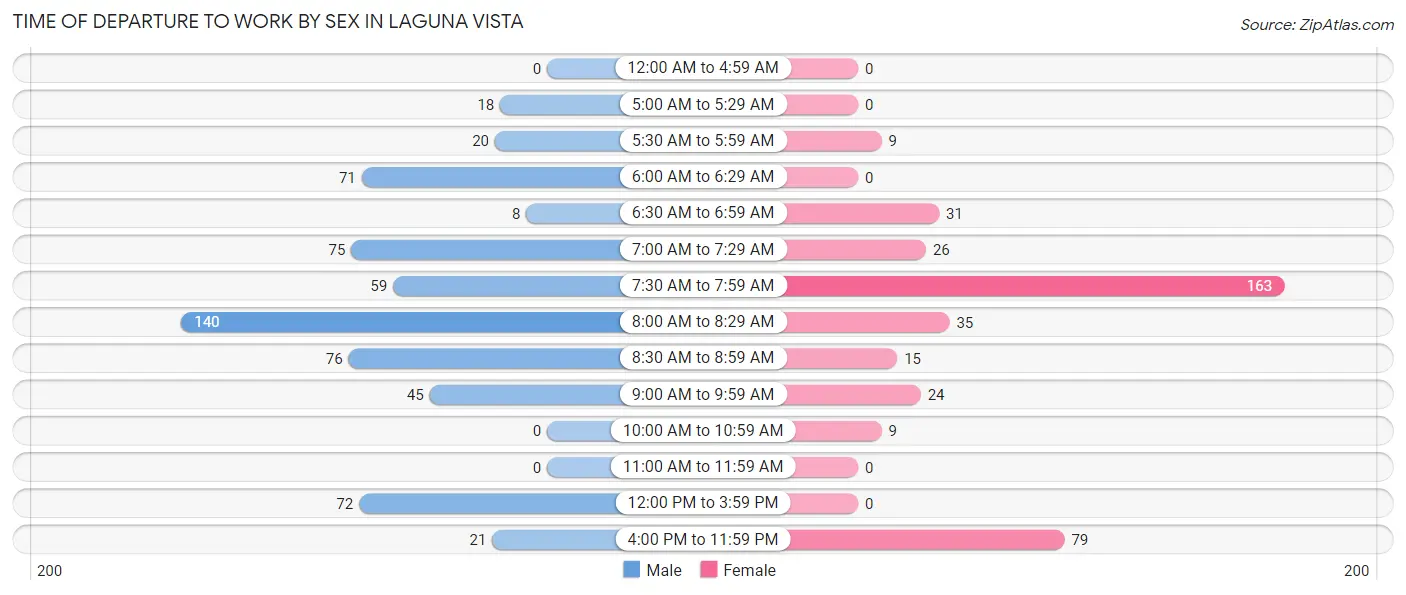
| Time of Departure | Male | Female |
| 12:00 AM to 4:59 AM | 0 (0.0%) | 0 (0.0%) |
| 5:00 AM to 5:29 AM | 18 (3.0%) | 0 (0.0%) |
| 5:30 AM to 5:59 AM | 20 (3.3%) | 9 (2.3%) |
| 6:00 AM to 6:29 AM | 71 (11.7%) | 0 (0.0%) |
| 6:30 AM to 6:59 AM | 8 (1.3%) | 31 (7.9%) |
| 7:00 AM to 7:29 AM | 75 (12.4%) | 26 (6.7%) |
| 7:30 AM to 7:59 AM | 59 (9.8%) | 163 (41.7%) |
| 8:00 AM to 8:29 AM | 140 (23.1%) | 35 (8.9%) |
| 8:30 AM to 8:59 AM | 76 (12.6%) | 15 (3.8%) |
| 9:00 AM to 9:59 AM | 45 (7.4%) | 24 (6.1%) |
| 10:00 AM to 10:59 AM | 0 (0.0%) | 9 (2.3%) |
| 11:00 AM to 11:59 AM | 0 (0.0%) | 0 (0.0%) |
| 12:00 PM to 3:59 PM | 72 (11.9%) | 0 (0.0%) |
| 4:00 PM to 11:59 PM | 21 (3.5%) | 79 (20.2%) |
| Total | 605 (100.0%) | 391 (100.0%) |
Housing Occupancy in Laguna Vista
Occupancy by Ownership in Laguna Vista
Of the total 1,524 dwellings in Laguna Vista, owner-occupied units account for 1,318 (86.5%), while renter-occupied units make up 206 (13.5%).
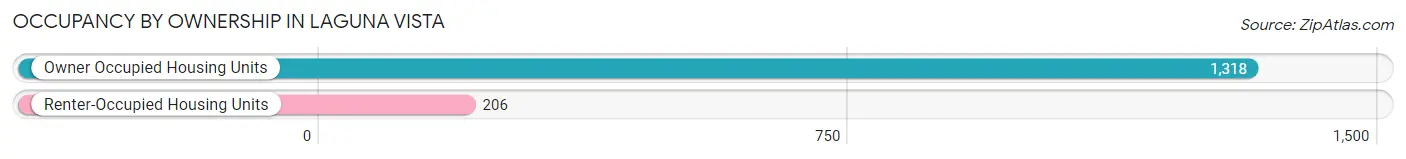
| Occupancy | # Housing Units | % Housing Units |
| Owner Occupied Housing Units | 1,318 | 86.5% |
| Renter-Occupied Housing Units | 206 | 13.5% |
| Total Occupied Housing Units | 1,524 | 100.0% |
Occupancy by Household Size in Laguna Vista
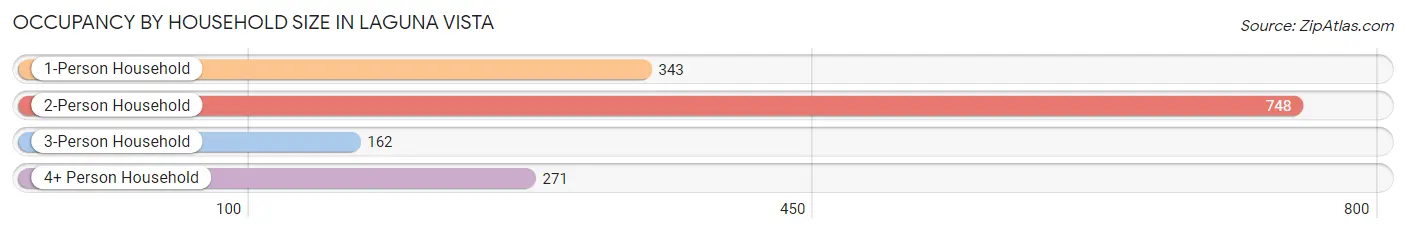
| Household Size | # Housing Units | % Housing Units |
| 1-Person Household | 343 | 22.5% |
| 2-Person Household | 748 | 49.1% |
| 3-Person Household | 162 | 10.6% |
| 4+ Person Household | 271 | 17.8% |
| Total Housing Units | 1,524 | 100.0% |
Occupancy by Ownership by Household Size in Laguna Vista
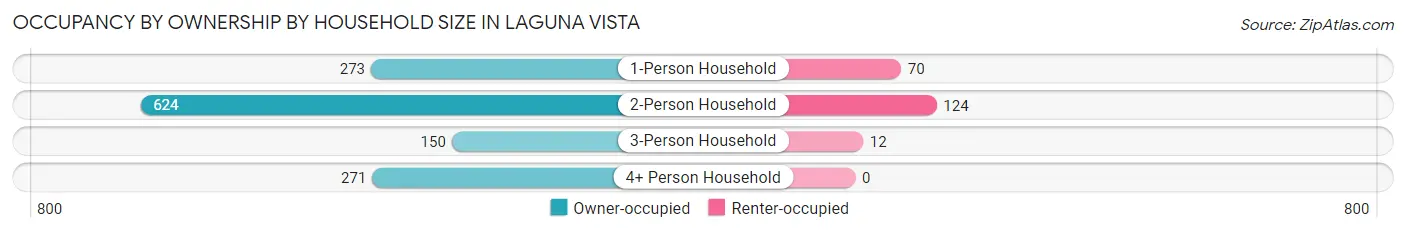
| Household Size | Owner-occupied | Renter-occupied |
| 1-Person Household | 273 (79.6%) | 70 (20.4%) |
| 2-Person Household | 624 (83.4%) | 124 (16.6%) |
| 3-Person Household | 150 (92.6%) | 12 (7.4%) |
| 4+ Person Household | 271 (100.0%) | 0 (0.0%) |
| Total Housing Units | 1,318 (86.5%) | 206 (13.5%) |
Occupancy by Educational Attainment in Laguna Vista
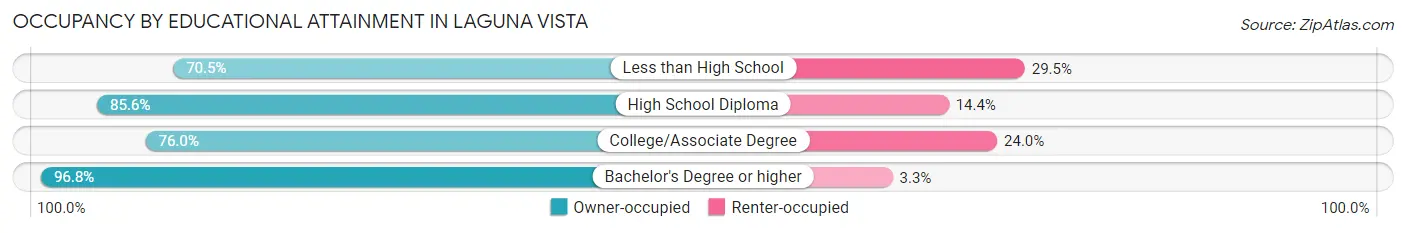
| Household Size | Owner-occupied | Renter-occupied |
| Less than High School | 67 (70.5%) | 28 (29.5%) |
| High School Diploma | 387 (85.6%) | 65 (14.4%) |
| College/Associate Degree | 298 (76.0%) | 94 (24.0%) |
| Bachelor's Degree or higher | 566 (96.8%) | 19 (3.3%) |
Occupancy by Age of Householder in Laguna Vista
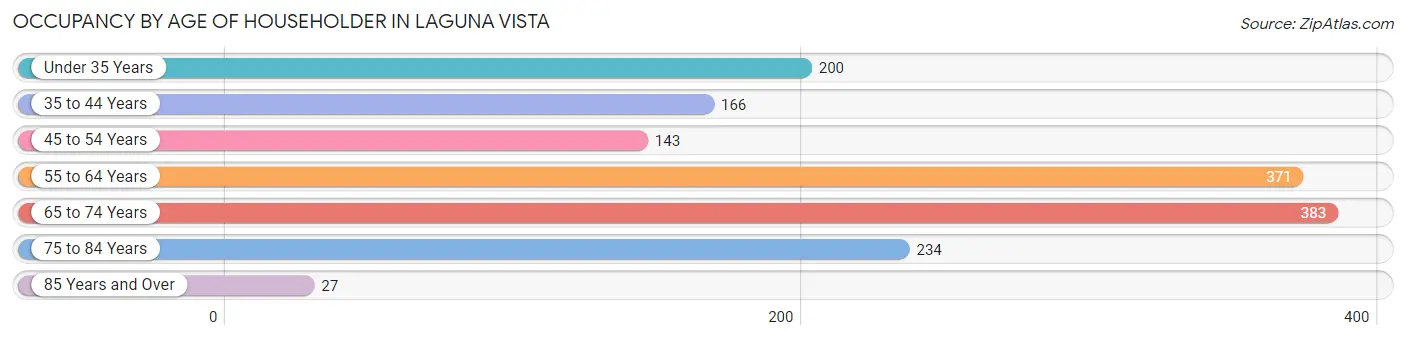
| Age Bracket | # Households | % Households |
| Under 35 Years | 200 | 13.1% |
| 35 to 44 Years | 166 | 10.9% |
| 45 to 54 Years | 143 | 9.4% |
| 55 to 64 Years | 371 | 24.3% |
| 65 to 74 Years | 383 | 25.1% |
| 75 to 84 Years | 234 | 15.3% |
| 85 Years and Over | 27 | 1.8% |
| Total | 1,524 | 100.0% |
Housing Finances in Laguna Vista
Median Income by Occupancy in Laguna Vista
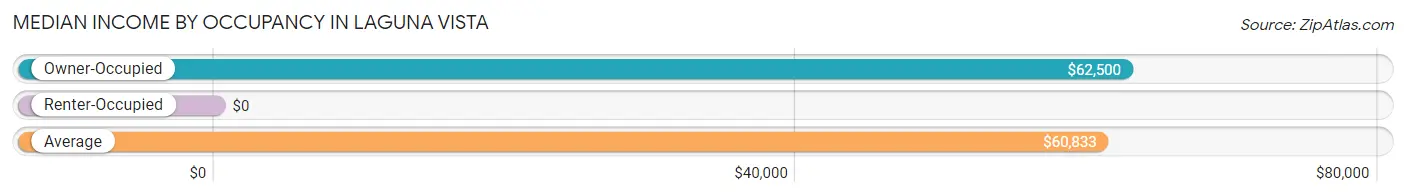
| Occupancy Type | # Households | Median Income |
| Owner-Occupied | 1,318 (86.5%) | $62,500 |
| Renter-Occupied | 206 (13.5%) | $0 |
| Average | 1,524 (100.0%) | $60,833 |
Occupancy by Householder Income Bracket in Laguna Vista
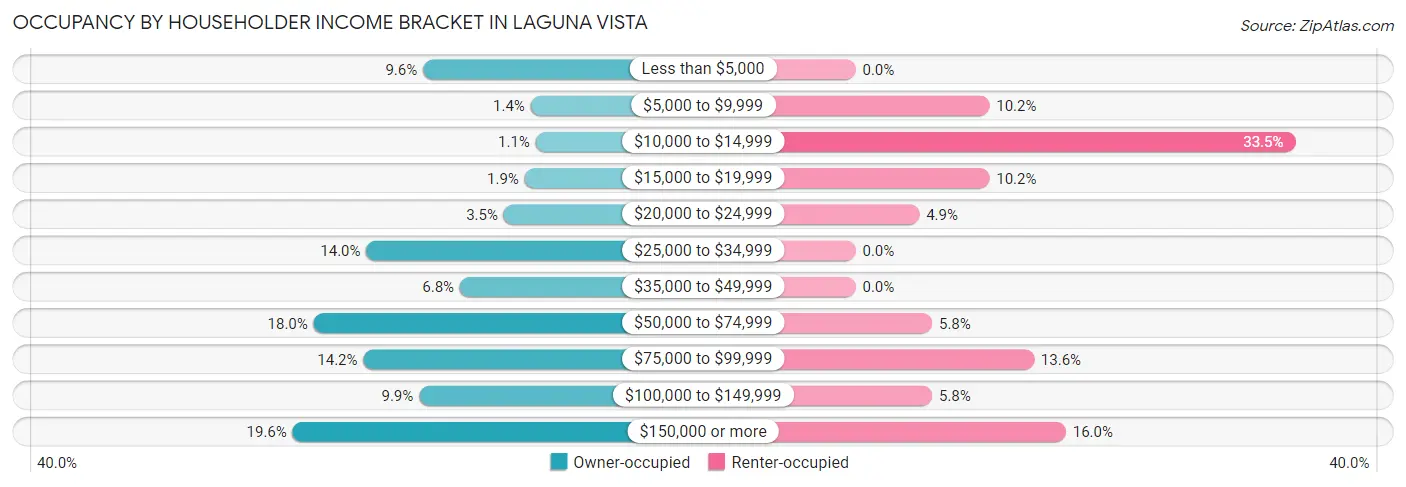
| Income Bracket | Owner-occupied | Renter-occupied |
| Less than $5,000 | 127 (9.6%) | 0 (0.0%) |
| $5,000 to $9,999 | 19 (1.4%) | 21 (10.2%) |
| $10,000 to $14,999 | 14 (1.1%) | 69 (33.5%) |
| $15,000 to $19,999 | 25 (1.9%) | 21 (10.2%) |
| $20,000 to $24,999 | 46 (3.5%) | 10 (4.9%) |
| $25,000 to $34,999 | 184 (14.0%) | 0 (0.0%) |
| $35,000 to $49,999 | 90 (6.8%) | 0 (0.0%) |
| $50,000 to $74,999 | 237 (18.0%) | 12 (5.8%) |
| $75,000 to $99,999 | 187 (14.2%) | 28 (13.6%) |
| $100,000 to $149,999 | 131 (9.9%) | 12 (5.8%) |
| $150,000 or more | 258 (19.6%) | 33 (16.0%) |
| Total | 1,318 (100.0%) | 206 (100.0%) |
Monthly Housing Cost Tiers in Laguna Vista
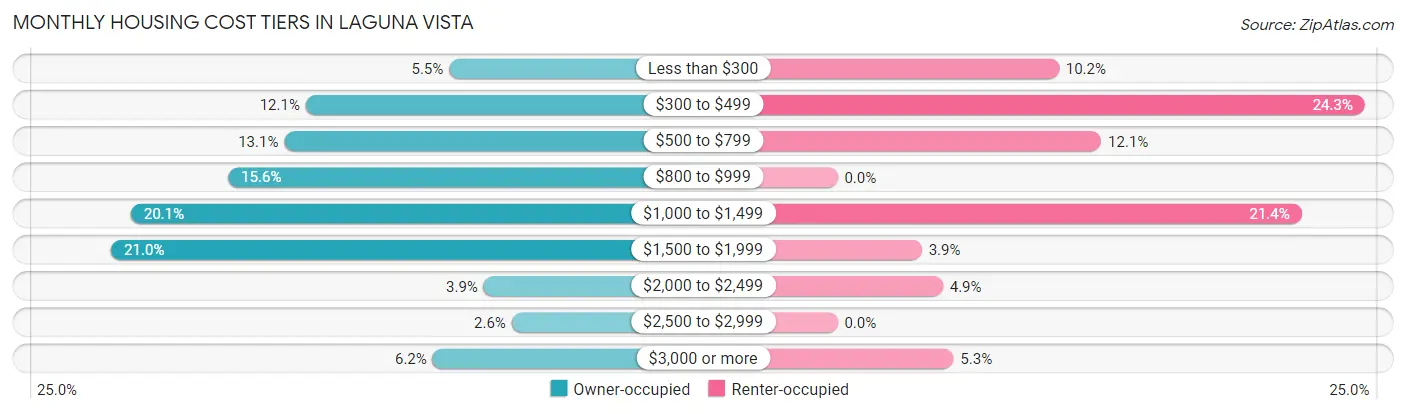
| Monthly Cost | Owner-occupied | Renter-occupied |
| Less than $300 | 72 (5.5%) | 21 (10.2%) |
| $300 to $499 | 159 (12.1%) | 50 (24.3%) |
| $500 to $799 | 172 (13.1%) | 25 (12.1%) |
| $800 to $999 | 206 (15.6%) | 0 (0.0%) |
| $1,000 to $1,499 | 265 (20.1%) | 44 (21.4%) |
| $1,500 to $1,999 | 277 (21.0%) | 8 (3.9%) |
| $2,000 to $2,499 | 51 (3.9%) | 10 (4.9%) |
| $2,500 to $2,999 | 34 (2.6%) | 0 (0.0%) |
| $3,000 or more | 82 (6.2%) | 11 (5.3%) |
| Total | 1,318 (100.0%) | 206 (100.0%) |
Physical Housing Characteristics in Laguna Vista
Housing Structures in Laguna Vista
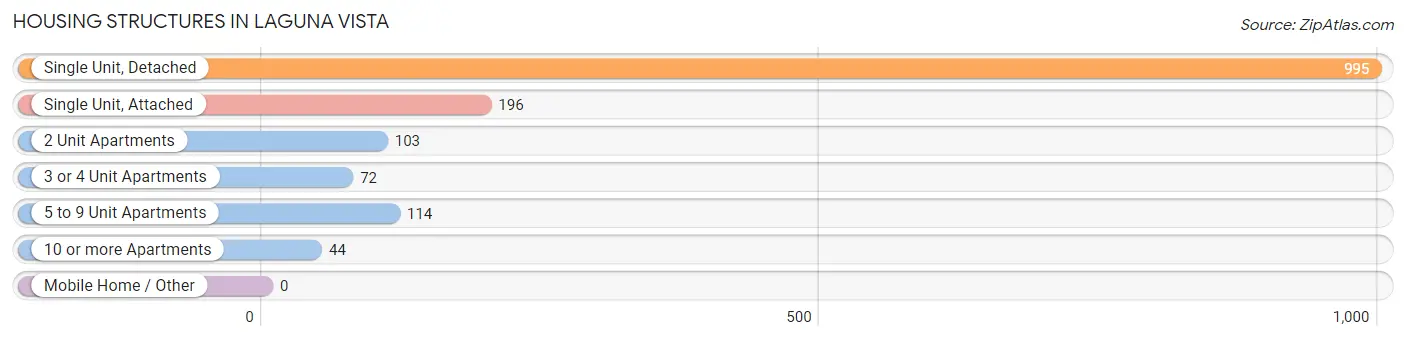
| Structure Type | # Housing Units | % Housing Units |
| Single Unit, Detached | 995 | 65.3% |
| Single Unit, Attached | 196 | 12.9% |
| 2 Unit Apartments | 103 | 6.8% |
| 3 or 4 Unit Apartments | 72 | 4.7% |
| 5 to 9 Unit Apartments | 114 | 7.5% |
| 10 or more Apartments | 44 | 2.9% |
| Mobile Home / Other | 0 | 0.0% |
| Total | 1,524 | 100.0% |
Housing Structures by Occupancy in Laguna Vista
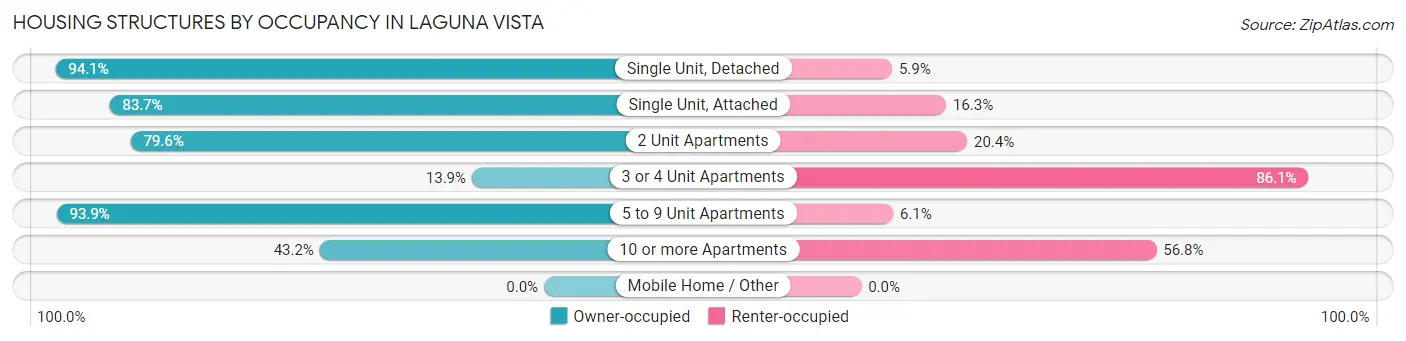
| Structure Type | Owner-occupied | Renter-occupied |
| Single Unit, Detached | 936 (94.1%) | 59 (5.9%) |
| Single Unit, Attached | 164 (83.7%) | 32 (16.3%) |
| 2 Unit Apartments | 82 (79.6%) | 21 (20.4%) |
| 3 or 4 Unit Apartments | 10 (13.9%) | 62 (86.1%) |
| 5 to 9 Unit Apartments | 107 (93.9%) | 7 (6.1%) |
| 10 or more Apartments | 19 (43.2%) | 25 (56.8%) |
| Mobile Home / Other | 0 (0.0%) | 0 (0.0%) |
| Total | 1,318 (86.5%) | 206 (13.5%) |
Housing Structures by Number of Rooms in Laguna Vista
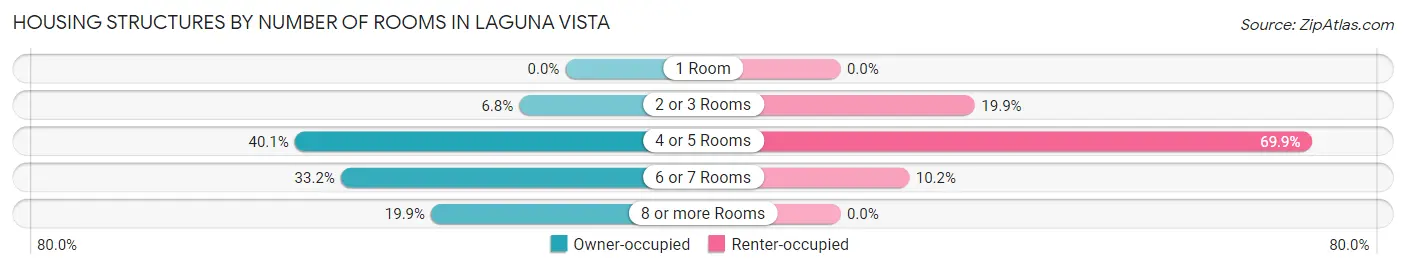
| Number of Rooms | Owner-occupied | Renter-occupied |
| 1 Room | 0 (0.0%) | 0 (0.0%) |
| 2 or 3 Rooms | 90 (6.8%) | 41 (19.9%) |
| 4 or 5 Rooms | 528 (40.1%) | 144 (69.9%) |
| 6 or 7 Rooms | 438 (33.2%) | 21 (10.2%) |
| 8 or more Rooms | 262 (19.9%) | 0 (0.0%) |
| Total | 1,318 (100.0%) | 206 (100.0%) |
Housing Structure by Heating Type in Laguna Vista
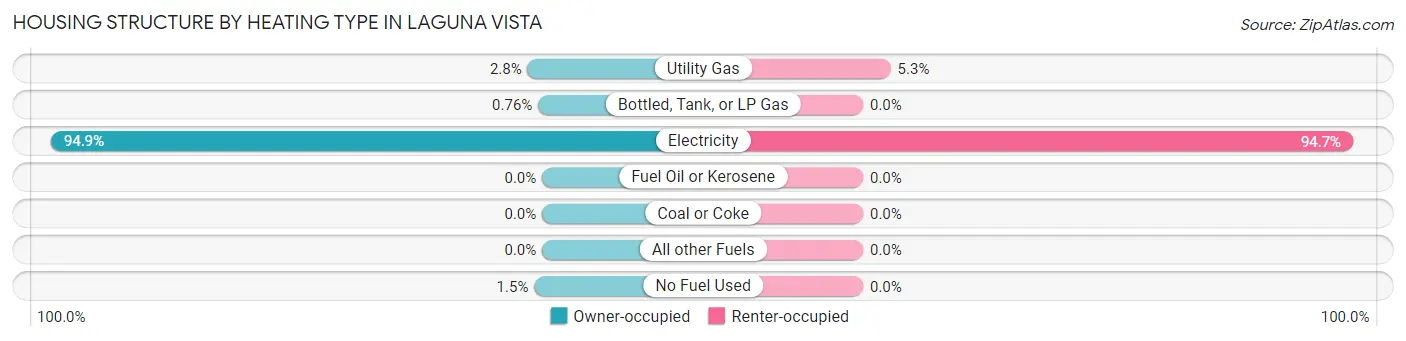
| Heating Type | Owner-occupied | Renter-occupied |
| Utility Gas | 37 (2.8%) | 11 (5.3%) |
| Bottled, Tank, or LP Gas | 10 (0.8%) | 0 (0.0%) |
| Electricity | 1,251 (94.9%) | 195 (94.7%) |
| Fuel Oil or Kerosene | 0 (0.0%) | 0 (0.0%) |
| Coal or Coke | 0 (0.0%) | 0 (0.0%) |
| All other Fuels | 0 (0.0%) | 0 (0.0%) |
| No Fuel Used | 20 (1.5%) | 0 (0.0%) |
| Total | 1,318 (100.0%) | 206 (100.0%) |
Household Vehicle Usage in Laguna Vista
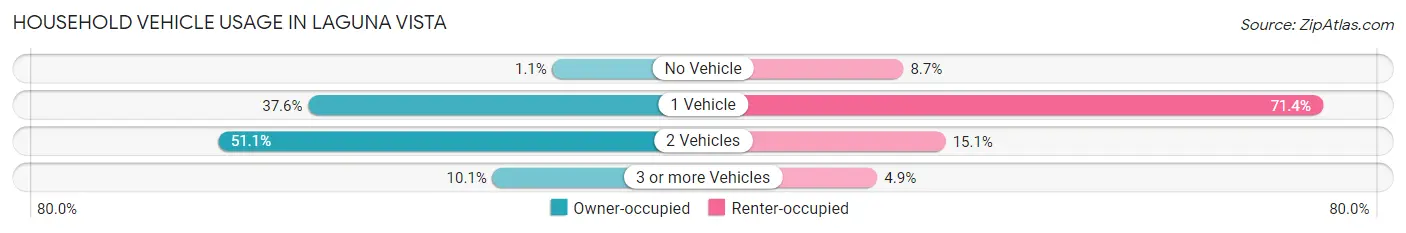
| Vehicles per Household | Owner-occupied | Renter-occupied |
| No Vehicle | 15 (1.1%) | 18 (8.7%) |
| 1 Vehicle | 496 (37.6%) | 147 (71.4%) |
| 2 Vehicles | 674 (51.1%) | 31 (15.0%) |
| 3 or more Vehicles | 133 (10.1%) | 10 (4.9%) |
| Total | 1,318 (100.0%) | 206 (100.0%) |
Real Estate & Mortgages in Laguna Vista
Real Estate and Mortgage Overview in Laguna Vista
| Characteristic | Without Mortgage | With Mortgage |
| Housing Units | 675 | 643 |
| Median Property Value | $263,600 | $223,700 |
| Median Household Income | $74,957 | $113 |
| Monthly Housing Costs | $693 | $82 |
| Real Estate Taxes | $3,457 | $8 |
Property Value by Mortgage Status in Laguna Vista
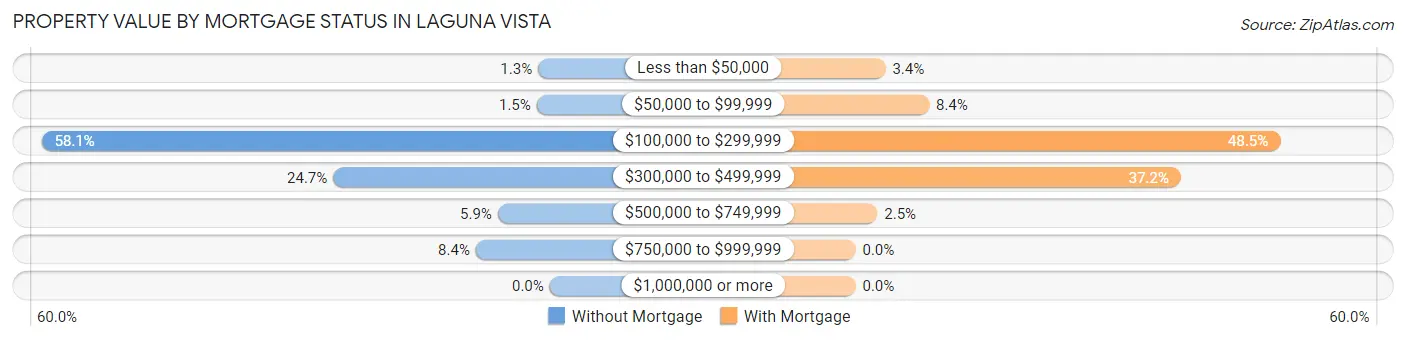
| Property Value | Without Mortgage | With Mortgage |
| Less than $50,000 | 9 (1.3%) | 22 (3.4%) |
| $50,000 to $99,999 | 10 (1.5%) | 54 (8.4%) |
| $100,000 to $299,999 | 392 (58.1%) | 312 (48.5%) |
| $300,000 to $499,999 | 167 (24.7%) | 239 (37.2%) |
| $500,000 to $749,999 | 40 (5.9%) | 16 (2.5%) |
| $750,000 to $999,999 | 57 (8.4%) | 0 (0.0%) |
| $1,000,000 or more | 0 (0.0%) | 0 (0.0%) |
| Total | 675 (100.0%) | 643 (100.0%) |
Household Income by Mortgage Status in Laguna Vista
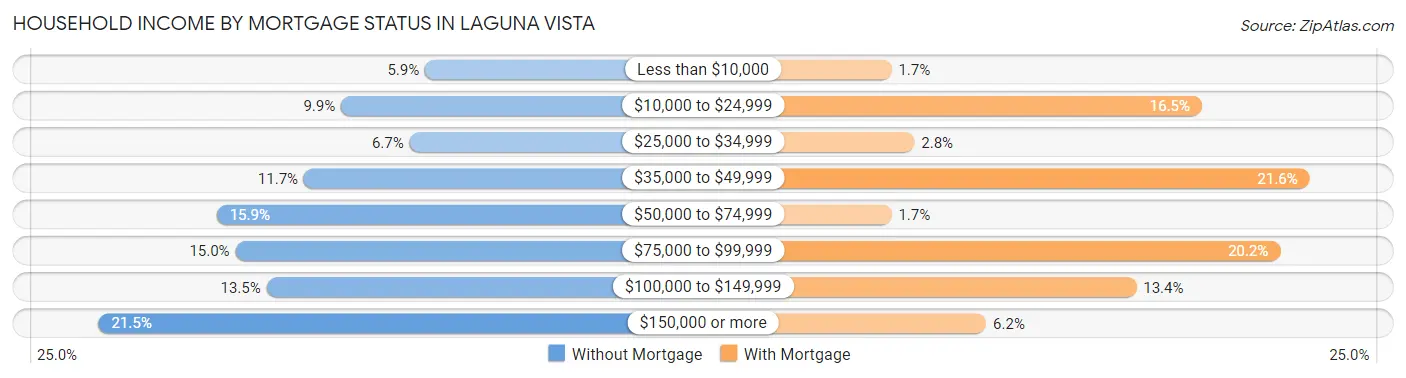
| Household Income | Without Mortgage | With Mortgage |
| Less than $10,000 | 40 (5.9%) | 11 (1.7%) |
| $10,000 to $24,999 | 67 (9.9%) | 106 (16.5%) |
| $25,000 to $34,999 | 45 (6.7%) | 18 (2.8%) |
| $35,000 to $49,999 | 79 (11.7%) | 139 (21.6%) |
| $50,000 to $74,999 | 107 (15.9%) | 11 (1.7%) |
| $75,000 to $99,999 | 101 (15.0%) | 130 (20.2%) |
| $100,000 to $149,999 | 91 (13.5%) | 86 (13.4%) |
| $150,000 or more | 145 (21.5%) | 40 (6.2%) |
| Total | 675 (100.0%) | 643 (100.0%) |
Property Value to Household Income Ratio in Laguna Vista
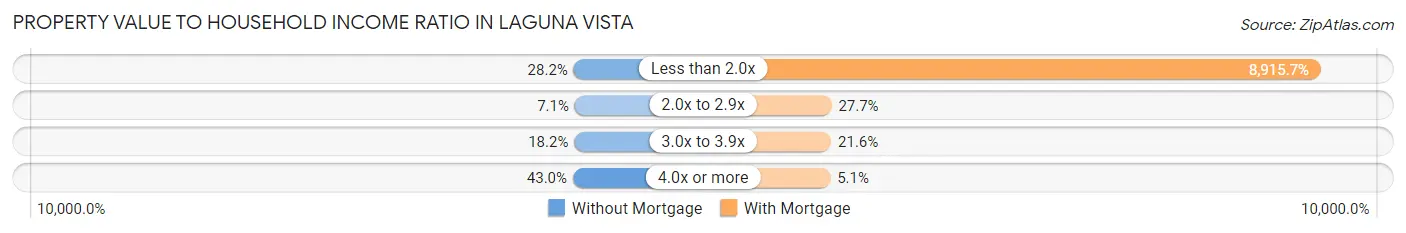
| Value-to-Income Ratio | Without Mortgage | With Mortgage |
| Less than 2.0x | 190 (28.1%) | 57,328 (8,915.7%) |
| 2.0x to 2.9x | 48 (7.1%) | 178 (27.7%) |
| 3.0x to 3.9x | 123 (18.2%) | 139 (21.6%) |
| 4.0x or more | 290 (43.0%) | 33 (5.1%) |
| Total | 675 (100.0%) | 643 (100.0%) |
Real Estate Taxes by Mortgage Status in Laguna Vista

| Property Taxes | Without Mortgage | With Mortgage |
| Less than $800 | 27 (4.0%) | 96 (14.9%) |
| $800 to $1,499 | 38 (5.6%) | 32 (5.0%) |
| $800 to $1,499 | 553 (81.9%) | 11 (1.7%) |
| Total | 675 (100.0%) | 643 (100.0%) |
Health & Disability in Laguna Vista
Health Insurance Coverage by Age in Laguna Vista
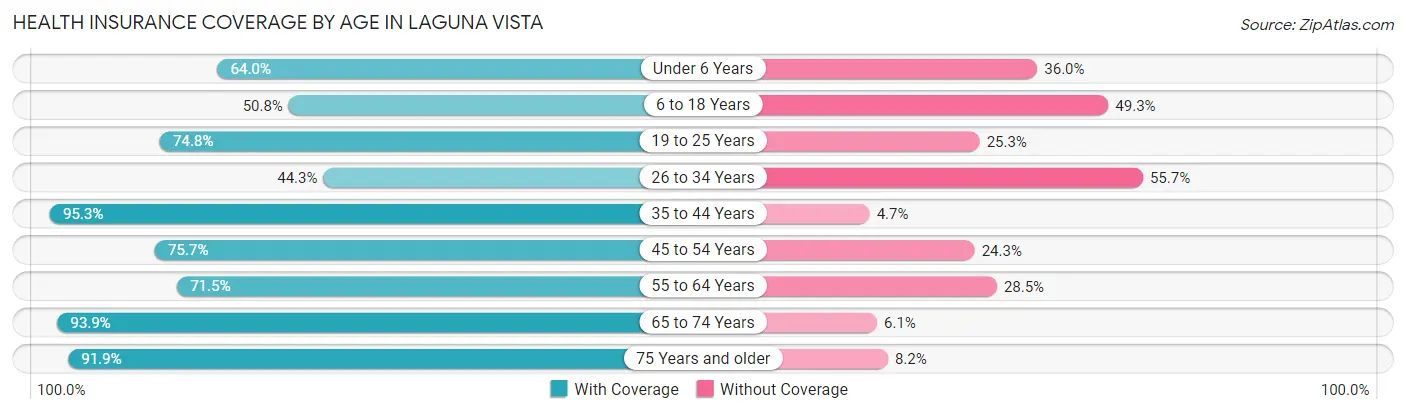
| Age Bracket | With Coverage | Without Coverage |
| Under 6 Years | 144 (64.0%) | 81 (36.0%) |
| 6 to 18 Years | 204 (50.7%) | 198 (49.2%) |
| 19 to 25 Years | 228 (74.8%) | 77 (25.3%) |
| 26 to 34 Years | 105 (44.3%) | 132 (55.7%) |
| 35 to 44 Years | 241 (95.3%) | 12 (4.7%) |
| 45 to 54 Years | 252 (75.7%) | 81 (24.3%) |
| 55 to 64 Years | 407 (71.5%) | 162 (28.5%) |
| 65 to 74 Years | 568 (93.9%) | 37 (6.1%) |
| 75 Years and older | 575 (91.8%) | 51 (8.2%) |
| Total | 2,724 (76.6%) | 831 (23.4%) |
Health Insurance Coverage by Citizenship Status in Laguna Vista

| Citizenship Status | With Coverage | Without Coverage |
| Native Born | 144 (64.0%) | 81 (36.0%) |
| Foreign Born, Citizen | 204 (50.7%) | 198 (49.2%) |
| Foreign Born, not a Citizen | 228 (74.8%) | 77 (25.3%) |
Health Insurance Coverage by Household Income in Laguna Vista
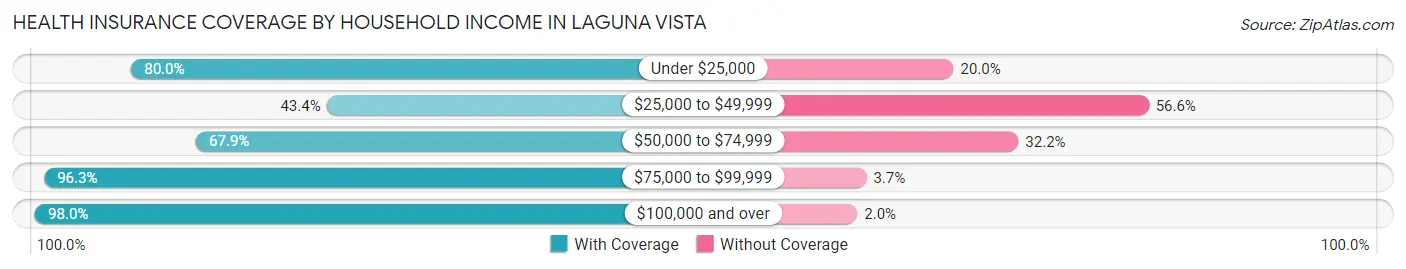
| Household Income | With Coverage | Without Coverage |
| Under $25,000 | 444 (80.0%) | 111 (20.0%) |
| $25,000 to $49,999 | 397 (43.4%) | 517 (56.6%) |
| $50,000 to $74,999 | 344 (67.8%) | 163 (32.2%) |
| $75,000 to $99,999 | 498 (96.3%) | 19 (3.7%) |
| $100,000 and over | 1,041 (98.0%) | 21 (2.0%) |
Public vs Private Health Insurance Coverage by Age in Laguna Vista
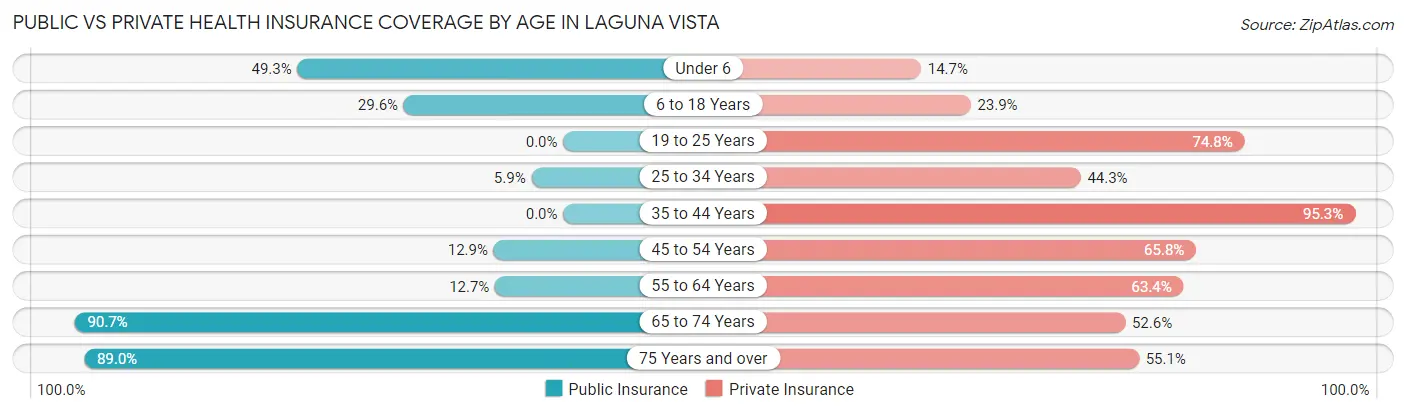
| Age Bracket | Public Insurance | Private Insurance |
| Under 6 | 111 (49.3%) | 33 (14.7%) |
| 6 to 18 Years | 119 (29.6%) | 96 (23.9%) |
| 19 to 25 Years | 0 (0.0%) | 228 (74.8%) |
| 25 to 34 Years | 14 (5.9%) | 105 (44.3%) |
| 35 to 44 Years | 0 (0.0%) | 241 (95.3%) |
| 45 to 54 Years | 43 (12.9%) | 219 (65.8%) |
| 55 to 64 Years | 72 (12.7%) | 361 (63.4%) |
| 65 to 74 Years | 549 (90.7%) | 318 (52.6%) |
| 75 Years and over | 557 (89.0%) | 345 (55.1%) |
| Total | 1,465 (41.2%) | 1,946 (54.7%) |
Disability Status by Sex by Age in Laguna Vista
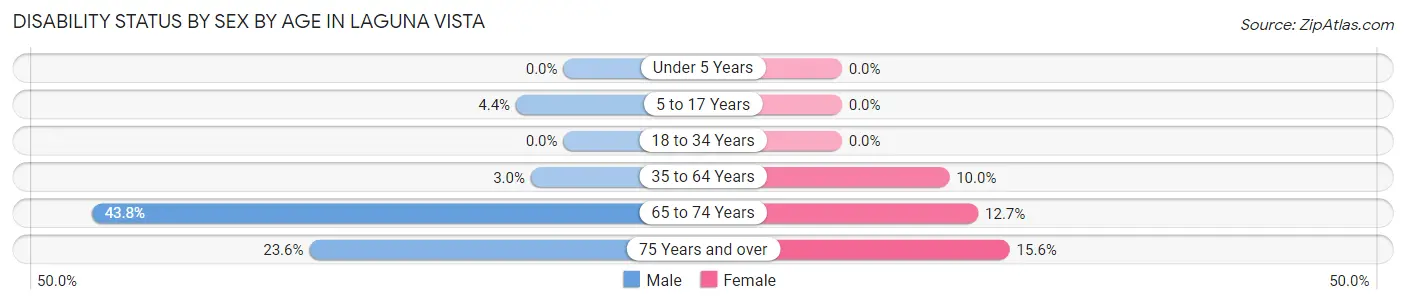
| Age Bracket | Male | Female |
| Under 5 Years | 0 (0.0%) | 0 (0.0%) |
| 5 to 17 Years | 7 (4.4%) | 0 (0.0%) |
| 18 to 34 Years | 0 (0.0%) | 0 (0.0%) |
| 35 to 64 Years | 17 (3.0%) | 59 (10.0%) |
| 65 to 74 Years | 123 (43.8%) | 41 (12.7%) |
| 75 Years and over | 75 (23.6%) | 48 (15.6%) |
Disability Class by Sex by Age in Laguna Vista
Disability Class: Hearing Difficulty
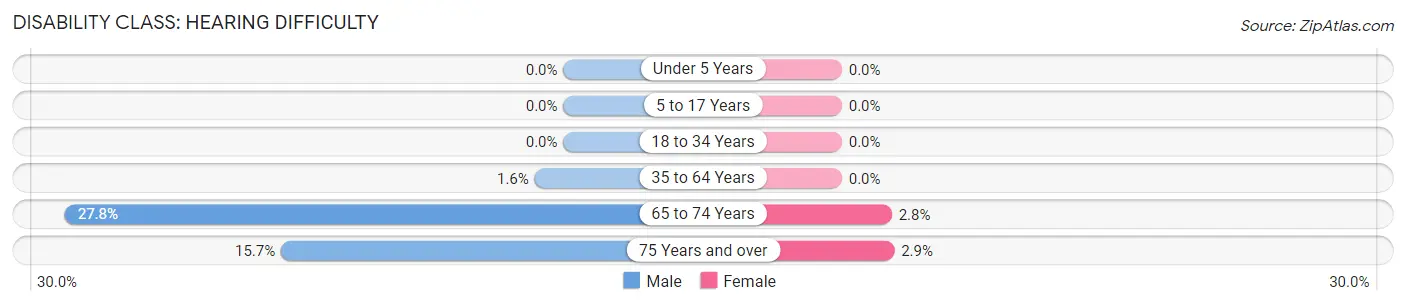
| Age Bracket | Male | Female |
| Under 5 Years | 0 (0.0%) | 0 (0.0%) |
| 5 to 17 Years | 0 (0.0%) | 0 (0.0%) |
| 18 to 34 Years | 0 (0.0%) | 0 (0.0%) |
| 35 to 64 Years | 9 (1.6%) | 0 (0.0%) |
| 65 to 74 Years | 78 (27.8%) | 9 (2.8%) |
| 75 Years and over | 50 (15.7%) | 9 (2.9%) |
Disability Class: Vision Difficulty
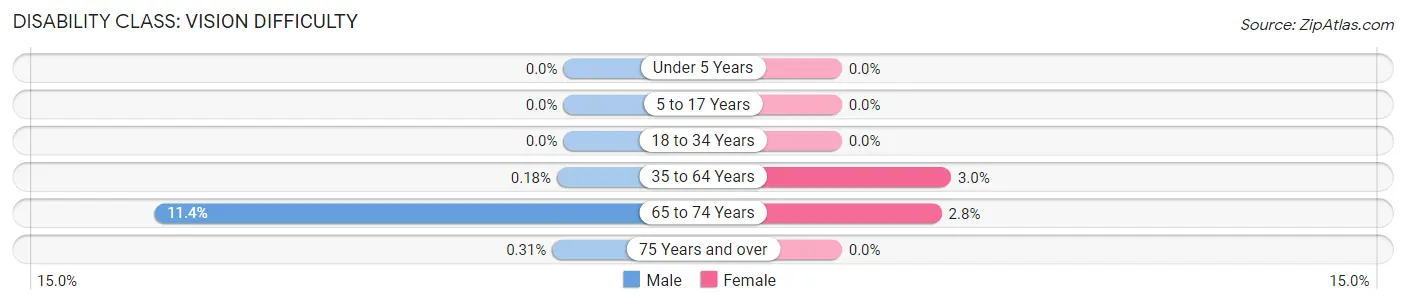
| Age Bracket | Male | Female |
| Under 5 Years | 0 (0.0%) | 0 (0.0%) |
| 5 to 17 Years | 0 (0.0%) | 0 (0.0%) |
| 18 to 34 Years | 0 (0.0%) | 0 (0.0%) |
| 35 to 64 Years | 1 (0.2%) | 18 (3.0%) |
| 65 to 74 Years | 32 (11.4%) | 9 (2.8%) |
| 75 Years and over | 1 (0.3%) | 0 (0.0%) |
Disability Class: Cognitive Difficulty
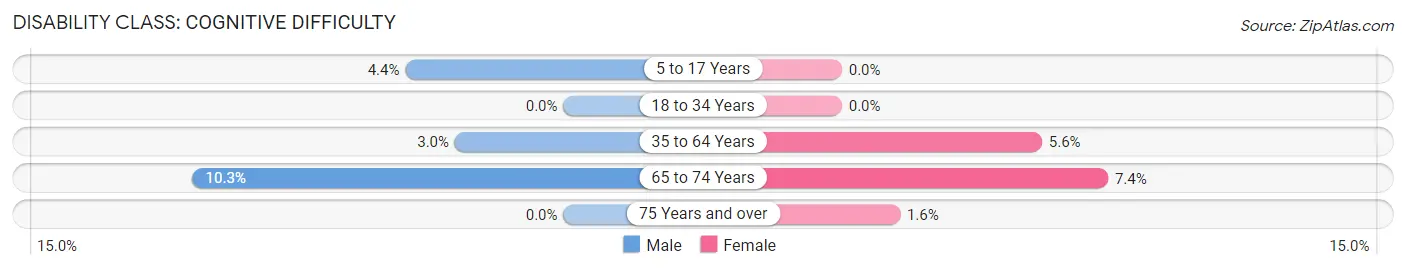
| Age Bracket | Male | Female |
| 5 to 17 Years | 7 (4.4%) | 0 (0.0%) |
| 18 to 34 Years | 0 (0.0%) | 0 (0.0%) |
| 35 to 64 Years | 17 (3.0%) | 33 (5.6%) |
| 65 to 74 Years | 29 (10.3%) | 24 (7.4%) |
| 75 Years and over | 0 (0.0%) | 5 (1.6%) |
Disability Class: Ambulatory Difficulty
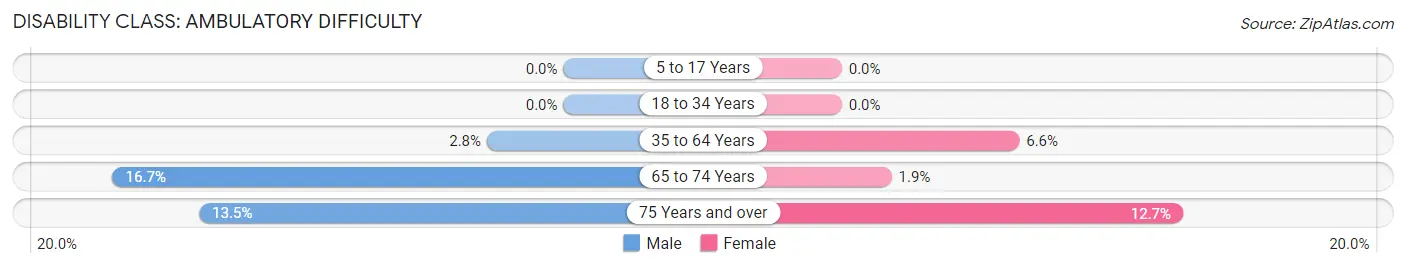
| Age Bracket | Male | Female |
| 5 to 17 Years | 0 (0.0%) | 0 (0.0%) |
| 18 to 34 Years | 0 (0.0%) | 0 (0.0%) |
| 35 to 64 Years | 16 (2.8%) | 39 (6.6%) |
| 65 to 74 Years | 47 (16.7%) | 6 (1.8%) |
| 75 Years and over | 43 (13.5%) | 39 (12.7%) |
Disability Class: Self-Care Difficulty
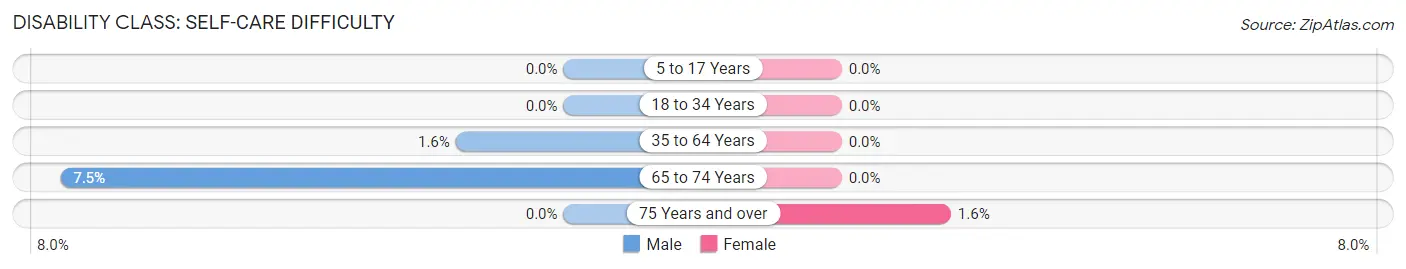
| Age Bracket | Male | Female |
| 5 to 17 Years | 0 (0.0%) | 0 (0.0%) |
| 18 to 34 Years | 0 (0.0%) | 0 (0.0%) |
| 35 to 64 Years | 9 (1.6%) | 0 (0.0%) |
| 65 to 74 Years | 21 (7.5%) | 0 (0.0%) |
| 75 Years and over | 0 (0.0%) | 5 (1.6%) |
Technology Access in Laguna Vista
Computing Device Access in Laguna Vista
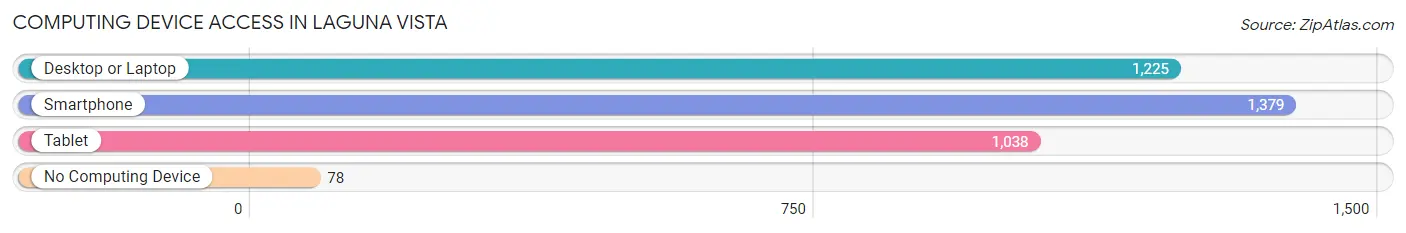
| Device Type | # Households | % Households |
| Desktop or Laptop | 1,225 | 80.4% |
| Smartphone | 1,379 | 90.5% |
| Tablet | 1,038 | 68.1% |
| No Computing Device | 78 | 5.1% |
| Total | 1,524 | 100.0% |
Internet Access in Laguna Vista
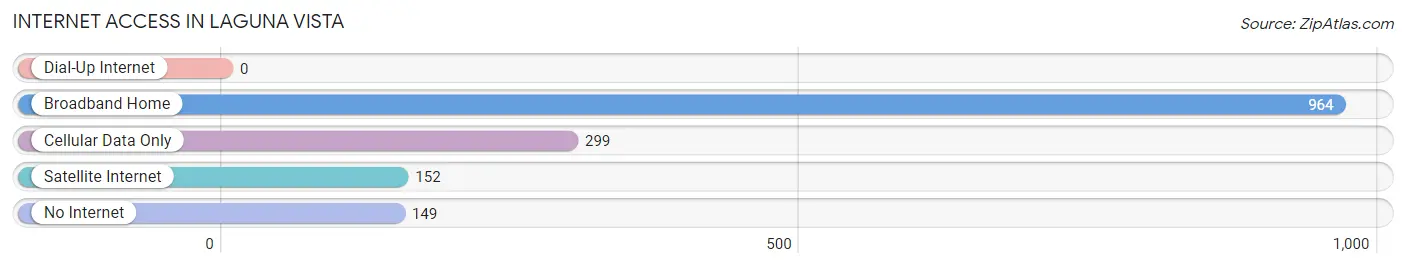
| Internet Type | # Households | % Households |
| Dial-Up Internet | 0 | 0.0% |
| Broadband Home | 964 | 63.2% |
| Cellular Data Only | 299 | 19.6% |
| Satellite Internet | 152 | 10.0% |
| No Internet | 149 | 9.8% |
| Total | 1,524 | 100.0% |
Laguna Vista Summary
Laguna Vista is a small town located in Cameron County, Texas, United States. It is situated on the south shore of South Padre Island, a barrier island located on the Gulf of Mexico. The town was incorporated in 1966 and has a population of approximately 2,000 people.
History
The area that is now Laguna Vista was originally inhabited by the Karankawa Indians. The first European settlers arrived in the area in the late 1800s and established a small fishing village. The town was officially incorporated in 1966 and was named after the nearby Laguna Madre, a shallow lagoon that separates South Padre Island from the mainland.
Geography
Laguna Vista is located in Cameron County, Texas, on the south shore of South Padre Island. The town is situated on the Laguna Madre, a shallow lagoon that separates South Padre Island from the mainland. The town is bordered by the Gulf of Mexico to the east and the Laguna Madre to the west. The town has a total area of 1.2 square miles, all of which is land.
Economy
The economy of Laguna Vista is largely based on tourism. The town is a popular destination for beachgoers, fishermen, and birdwatchers. The town is also home to several resorts, restaurants, and other businesses that cater to tourists. Additionally, the town is home to a number of small businesses, including a grocery store, a hardware store, and a pharmacy.
Demographics
As of the 2010 census, the population of Laguna Vista was 2,000. The racial makeup of the town was 94.2% White, 0.7% African American, 0.3% Native American, 0.7% Asian, 0.1% Pacific Islander, 2.2% from other races, and 1.7% from two or more races. Hispanic or Latino of any race were 8.2% of the population.
The median income for a household in the town was $37,500, and the median income for a family was $45,000. The per capita income for the town was $20,000. About 11.2% of families and 14.2% of the population were below the poverty line, including 18.2% of those under age 18 and 8.2% of those age 65 or over.
Conclusion
Laguna Vista is a small town located in Cameron County, Texas, United States. It is situated on the south shore of South Padre Island, a barrier island located on the Gulf of Mexico. The town was incorporated in 1966 and has a population of approximately 2,000 people. The economy of Laguna Vista is largely based on tourism, and the town is a popular destination for beachgoers, fishermen, and birdwatchers. The racial makeup of the town is 94.2% White, 0.7% African American, 0.3% Native American, 0.7% Asian, 0.1% Pacific Islander, 2.2% from other races, and 1.7% from two or more races. The median income for a household in the town was $37,500, and the median income for a family was $45,000.
Common Questions
What is Per Capita Income in Laguna Vista?
Per Capita income in Laguna Vista is $44,018.
What is the Median Family Income in Laguna Vista?
Median Family Income in Laguna Vista is $78,036.
What is the Median Household income in Laguna Vista?
Median Household Income in Laguna Vista is $60,833.
What is Income or Wage Gap in Laguna Vista?
Income or Wage Gap in Laguna Vista is 35.4%.
Women in Laguna Vista earn 64.6 cents for every dollar earned by a man.
What is Family Income Deficit in Laguna Vista?
Family Income Deficit in Laguna Vista is $8,978.
Families that are below poverty line in Laguna Vista earn $8,978 less on average than the poverty threshold level.
What is Inequality or Gini Index in Laguna Vista?
Inequality or Gini Index in Laguna Vista is 0.58.
What is the Total Population of Laguna Vista?
Total Population of Laguna Vista is 3,555.
What is the Total Male Population of Laguna Vista?
Total Male Population of Laguna Vista is 1,794.
What is the Total Female Population of Laguna Vista?
Total Female Population of Laguna Vista is 1,761.
What is the Ratio of Males per 100 Females in Laguna Vista?
There are 101.87 Males per 100 Females in Laguna Vista.
What is the Ratio of Females per 100 Males in Laguna Vista?
There are 98.16 Females per 100 Males in Laguna Vista.
What is the Median Population Age in Laguna Vista?
Median Population Age in Laguna Vista is 56.2 Years.
What is the Average Family Size in Laguna Vista
Average Family Size in Laguna Vista is 2.7 People.
What is the Average Household Size in Laguna Vista
Average Household Size in Laguna Vista is 2.3 People.
How Large is the Labor Force in Laguna Vista?
There are 1,272 People in the Labor Forcein in Laguna Vista.
What is the Percentage of People in the Labor Force in Laguna Vista?
41.6% of People are in the Labor Force in Laguna Vista.
What is the Unemployment Rate in Laguna Vista?
Unemployment Rate in Laguna Vista is 2.0%.