Enchanted Oaks, TX Map & Demographics
Enchanted Oaks Map
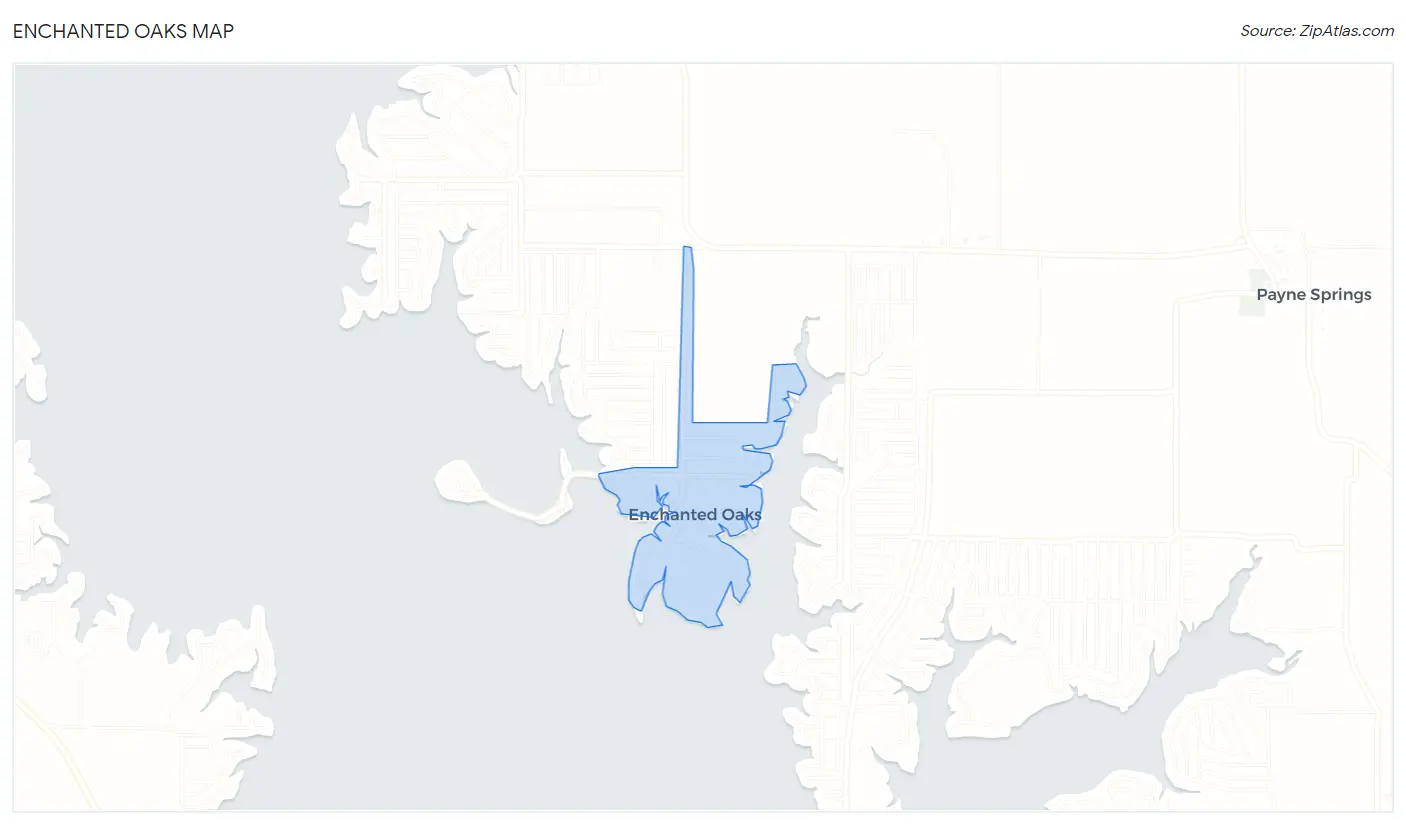
Enchanted Oaks Overview
$60,824
PER CAPITA INCOME
$98,750
AVG FAMILY INCOME
$94,375
AVG HOUSEHOLD INCOME
44.7%
WAGE / INCOME GAP [ % ]
55.3¢/ $1
WAGE / INCOME GAP [ $ ]
$12,100
FAMILY INCOME DEFICIT
0.46
INEQUALITY / GINI INDEX
252
TOTAL POPULATION
114
MALE POPULATION
138
FEMALE POPULATION
82.61
MALES / 100 FEMALES
121.05
FEMALES / 100 MALES
61.5
MEDIAN AGE
2.3
AVG FAMILY SIZE
2.1
AVG HOUSEHOLD SIZE
118
LABOR FORCE [ PEOPLE ]
48.6%
PERCENT IN LABOR FORCE
1.7%
UNEMPLOYMENT RATE
Income in Enchanted Oaks
Income Overview in Enchanted Oaks
Per Capita Income in Enchanted Oaks is $60,824, while median incomes of families and households are $98,750 and $94,375 respectively.
| Characteristic | Number | Measure |
| Per Capita Income | 252 | $60,824 |
| Median Family Income | 97 | $98,750 |
| Mean Family Income | 97 | $134,799 |
| Median Household Income | 121 | $94,375 |
| Mean Household Income | 121 | $124,260 |
| Income Deficit | 97 | $12,100 |
| Wage / Income Gap (%) | 252 | 44.75% |
| Wage / Income Gap ($) | 252 | 55.25¢ per $1 |
| Gini / Inequality Index | 252 | 0.46 |
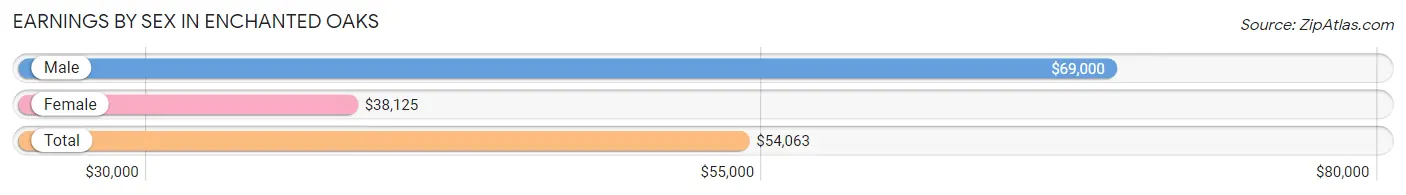
Earnings by Sex in Enchanted Oaks
Average Earnings in Enchanted Oaks are $54,063, $69,000 for men and $38,125 for women, a difference of 44.8%.
| Sex | Number | Average Earnings |
| Male | 72 (57.6%) | $69,000 |
| Female | 53 (42.4%) | $38,125 |
| Total | 125 (100.0%) | $54,063 |
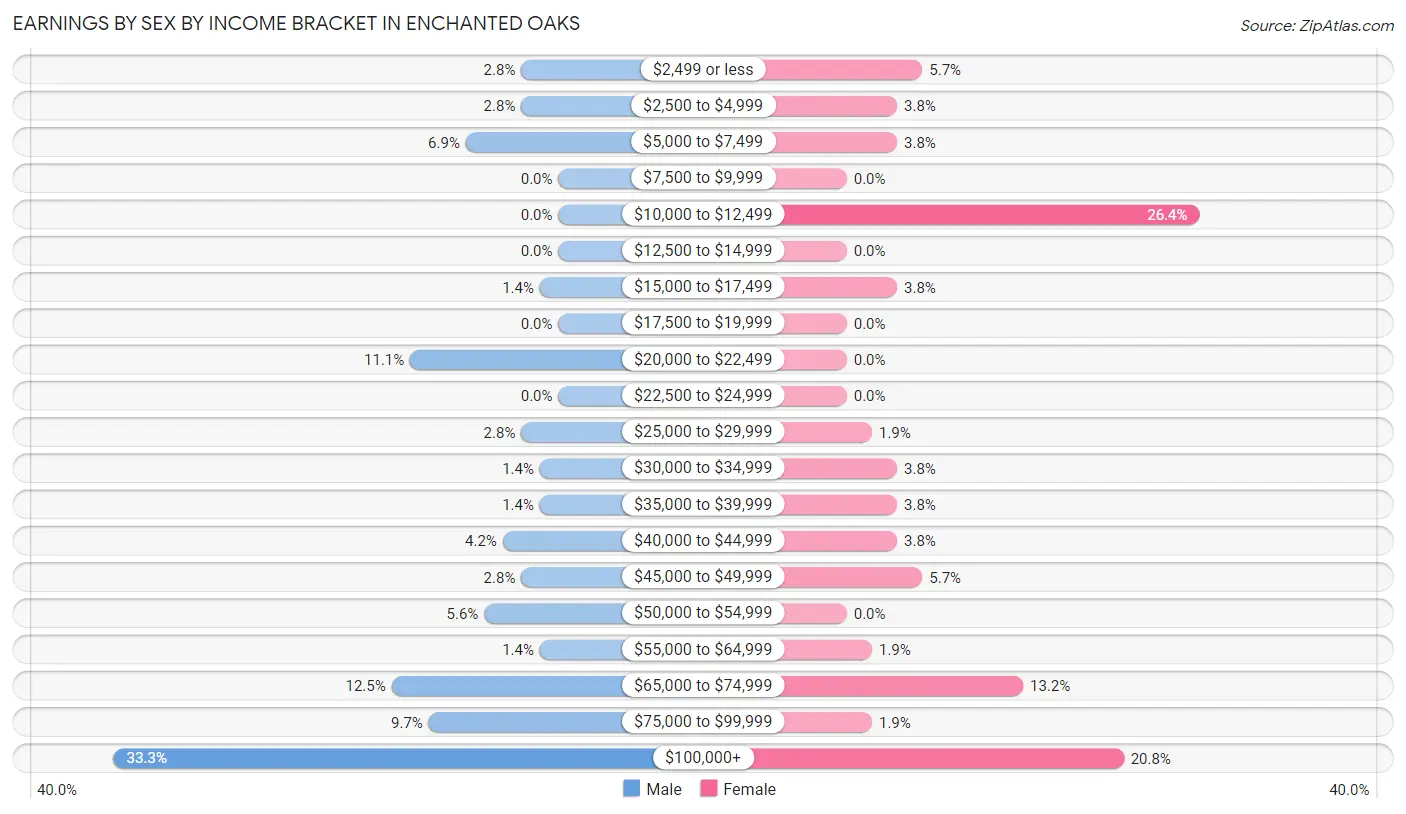
Earnings by Sex by Income Bracket in Enchanted Oaks
The most common earnings brackets in Enchanted Oaks are $100,000+ for men (24 | 33.3%) and $10,000 to $12,499 for women (14 | 26.4%).
| Income | Male | Female |
| $2,499 or less | 2 (2.8%) | 3 (5.7%) |
| $2,500 to $4,999 | 2 (2.8%) | 2 (3.8%) |
| $5,000 to $7,499 | 5 (6.9%) | 2 (3.8%) |
| $7,500 to $9,999 | 0 (0.0%) | 0 (0.0%) |
| $10,000 to $12,499 | 0 (0.0%) | 14 (26.4%) |
| $12,500 to $14,999 | 0 (0.0%) | 0 (0.0%) |
| $15,000 to $17,499 | 1 (1.4%) | 2 (3.8%) |
| $17,500 to $19,999 | 0 (0.0%) | 0 (0.0%) |
| $20,000 to $22,499 | 8 (11.1%) | 0 (0.0%) |
| $22,500 to $24,999 | 0 (0.0%) | 0 (0.0%) |
| $25,000 to $29,999 | 2 (2.8%) | 1 (1.9%) |
| $30,000 to $34,999 | 1 (1.4%) | 2 (3.8%) |
| $35,000 to $39,999 | 1 (1.4%) | 2 (3.8%) |
| $40,000 to $44,999 | 3 (4.2%) | 2 (3.8%) |
| $45,000 to $49,999 | 2 (2.8%) | 3 (5.7%) |
| $50,000 to $54,999 | 4 (5.6%) | 0 (0.0%) |
| $55,000 to $64,999 | 1 (1.4%) | 1 (1.9%) |
| $65,000 to $74,999 | 9 (12.5%) | 7 (13.2%) |
| $75,000 to $99,999 | 7 (9.7%) | 1 (1.9%) |
| $100,000+ | 24 (33.3%) | 11 (20.7%) |
| Total | 72 (100.0%) | 53 (100.0%) |
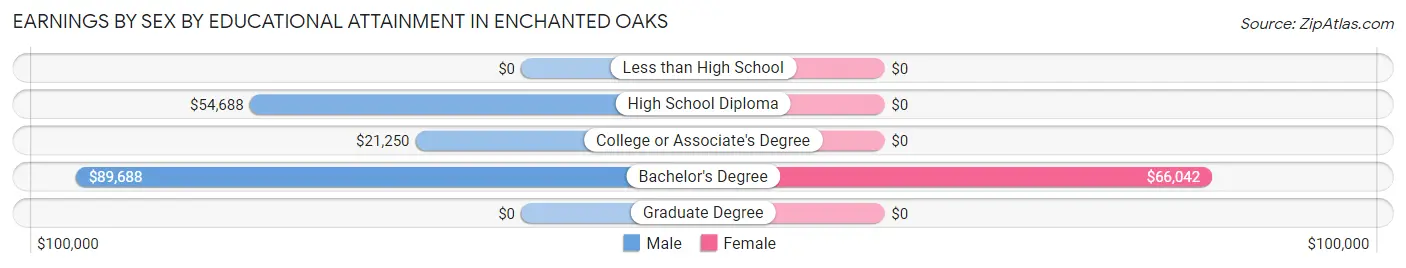
Earnings by Sex by Educational Attainment in Enchanted Oaks
Average earnings in Enchanted Oaks are $68,750 for men and $39,375 for women, a difference of 42.7%. Men with an educational attainment of bachelor's degree enjoy the highest average annual earnings of $89,688, while those with college or associate's degree education earn the least with $21,250. Women with an educational attainment of bachelor's degree earn the most with the average annual earnings of $66,042, while those with bachelor's degree education have the smallest earnings of $66,042.
| Educational Attainment | Male Income | Female Income |
| Less than High School | - | - |
| High School Diploma | $54,688 | $0 |
| College or Associate's Degree | $21,250 | $0 |
| Bachelor's Degree | $89,688 | $66,042 |
| Graduate Degree | - | - |
| Total | $68,750 | $39,375 |
Family Income in Enchanted Oaks
Family Income Brackets in Enchanted Oaks
According to the Enchanted Oaks family income data, there are 19 families falling into the $100,000 to $149,999 income range, which is the most common income bracket and makes up 19.6% of all families. Conversely, the less than $10,000 income bracket is the least frequent group with only 2 families (2.1%) belonging to this category.
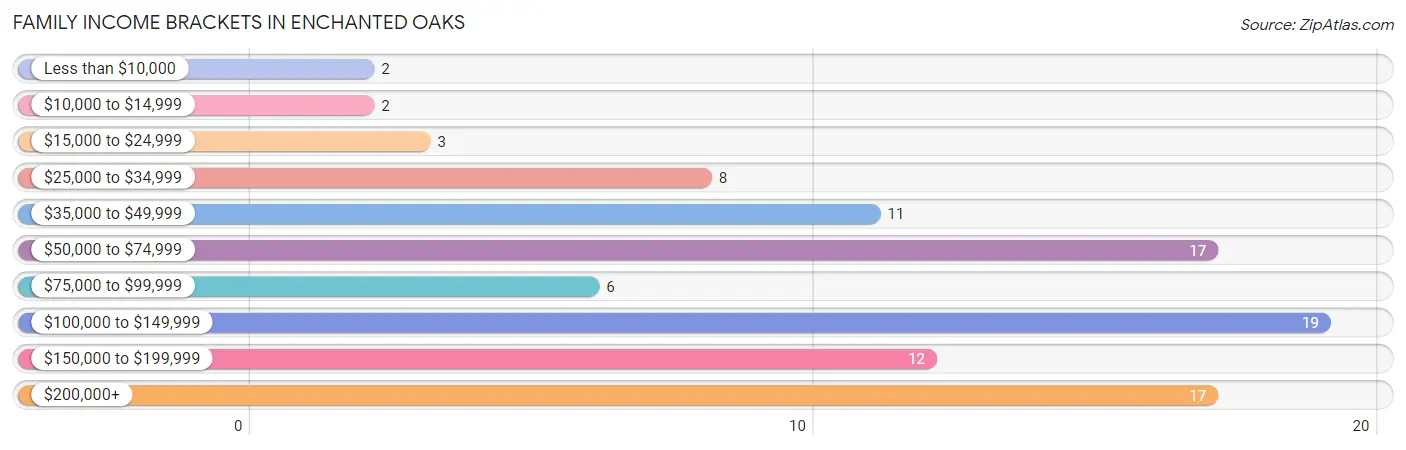
| Income Bracket | # Families | % Families |
| Less than $10,000 | 2 | 2.1% |
| $10,000 to $14,999 | 2 | 2.1% |
| $15,000 to $24,999 | 3 | 3.1% |
| $25,000 to $34,999 | 8 | 8.2% |
| $35,000 to $49,999 | 11 | 11.3% |
| $50,000 to $74,999 | 17 | 17.5% |
| $75,000 to $99,999 | 6 | 6.2% |
| $100,000 to $149,999 | 19 | 19.6% |
| $150,000 to $199,999 | 12 | 12.4% |
| $200,000+ | 17 | 17.5% |
Family Income by Famaliy Size in Enchanted Oaks
3-person families (20 | 20.6%) account for the highest median family income in Enchanted Oaks with $109,375 per family, while 2-person families (77 | 79.4%) have the highest median income of $36,875 per family member.
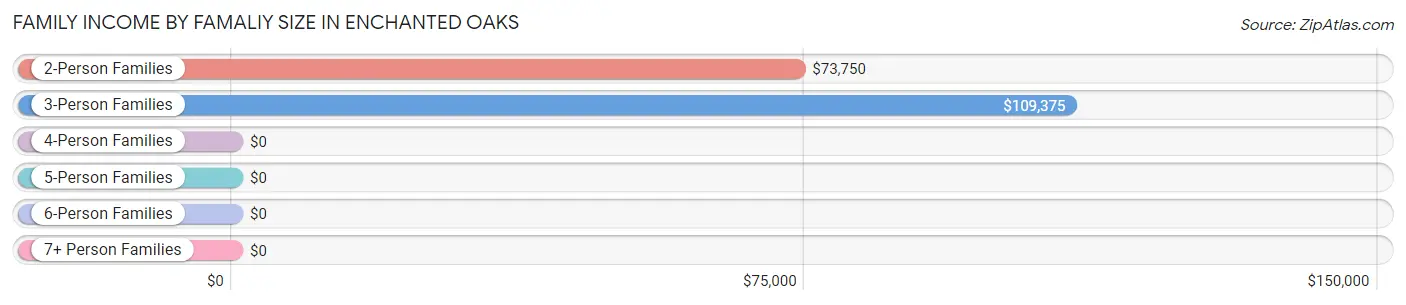
| Income Bracket | # Families | Median Income |
| 2-Person Families | 77 (79.4%) | $73,750 |
| 3-Person Families | 20 (20.6%) | $109,375 |
| 4-Person Families | 0 (0.0%) | $0 |
| 5-Person Families | 0 (0.0%) | $0 |
| 6-Person Families | 0 (0.0%) | $0 |
| 7+ Person Families | 0 (0.0%) | $0 |
| Total | 97 (100.0%) | $98,750 |
Family Income by Number of Earners in Enchanted Oaks
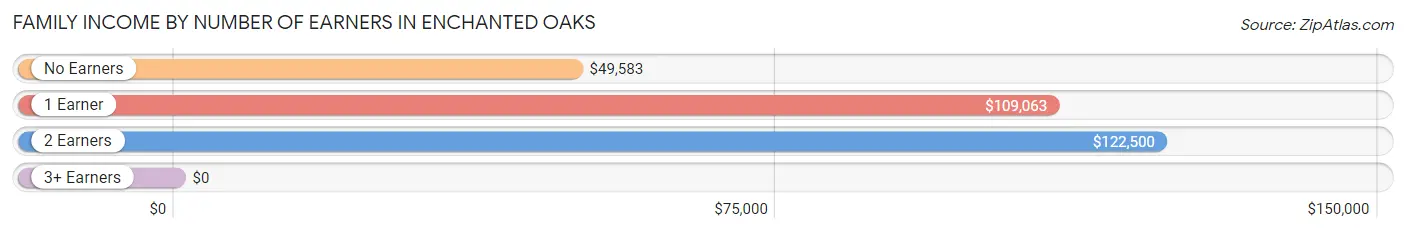
| Number of Earners | # Families | Median Income |
| No Earners | 29 (29.9%) | $49,583 |
| 1 Earner | 35 (36.1%) | $109,063 |
| 2 Earners | 32 (33.0%) | $122,500 |
| 3+ Earners | 1 (1.0%) | $0 |
| Total | 97 (100.0%) | $98,750 |
Household Income in Enchanted Oaks
Household Income Brackets in Enchanted Oaks
With 24 households falling in the category, the $100,000 to $149,999 income range is the most frequent in Enchanted Oaks, accounting for 19.8% of all households. In contrast, only 2 households (1.7%) fall into the less than $10,000 income bracket, making it the least populous group.
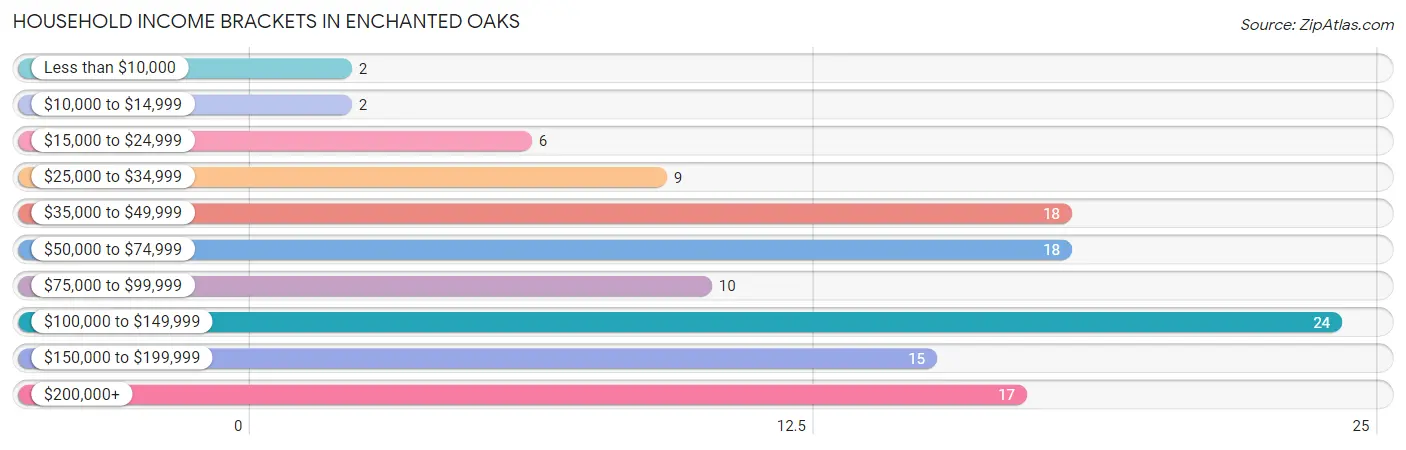
| Income Bracket | # Households | % Households |
| Less than $10,000 | 2 | 1.7% |
| $10,000 to $14,999 | 2 | 1.7% |
| $15,000 to $24,999 | 6 | 5.0% |
| $25,000 to $34,999 | 9 | 7.4% |
| $35,000 to $49,999 | 18 | 14.9% |
| $50,000 to $74,999 | 18 | 14.9% |
| $75,000 to $99,999 | 10 | 8.3% |
| $100,000 to $149,999 | 24 | 19.8% |
| $150,000 to $199,999 | 15 | 12.4% |
| $200,000+ | 17 | 14.0% |
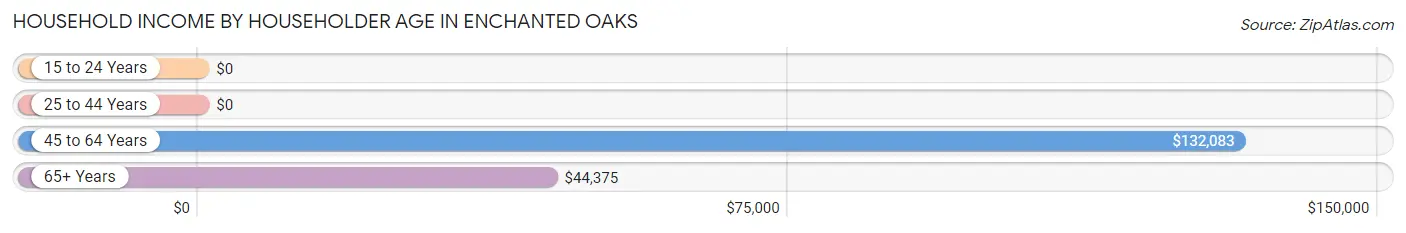
Household Income by Householder Age in Enchanted Oaks
The median household income in Enchanted Oaks is $94,375, with the highest median household income of $132,083 found in the 45 to 64 years age bracket for the primary householder. A total of 53 households (43.8%) fall into this category. Meanwhile, the 15 to 24 years age bracket for the primary householder has the lowest median household income of $0, with 3 households (2.5%) in this group.
| Income Bracket | # Households | Median Income |
| 15 to 24 Years | 3 (2.5%) | $0 |
| 25 to 44 Years | 6 (5.0%) | $0 |
| 45 to 64 Years | 53 (43.8%) | $132,083 |
| 65+ Years | 59 (48.8%) | $44,375 |
| Total | 121 (100.0%) | $94,375 |
Poverty in Enchanted Oaks
Income Below Poverty by Sex and Age in Enchanted Oaks
With 6.2% poverty level for males and 3.6% for females among the residents of Enchanted Oaks, 65 to 74 year old males and 6 to 11 year old females are the most vulnerable to poverty, with 4 males (14.3%) and 1 females (100.0%) in their respective age groups living below the poverty level.
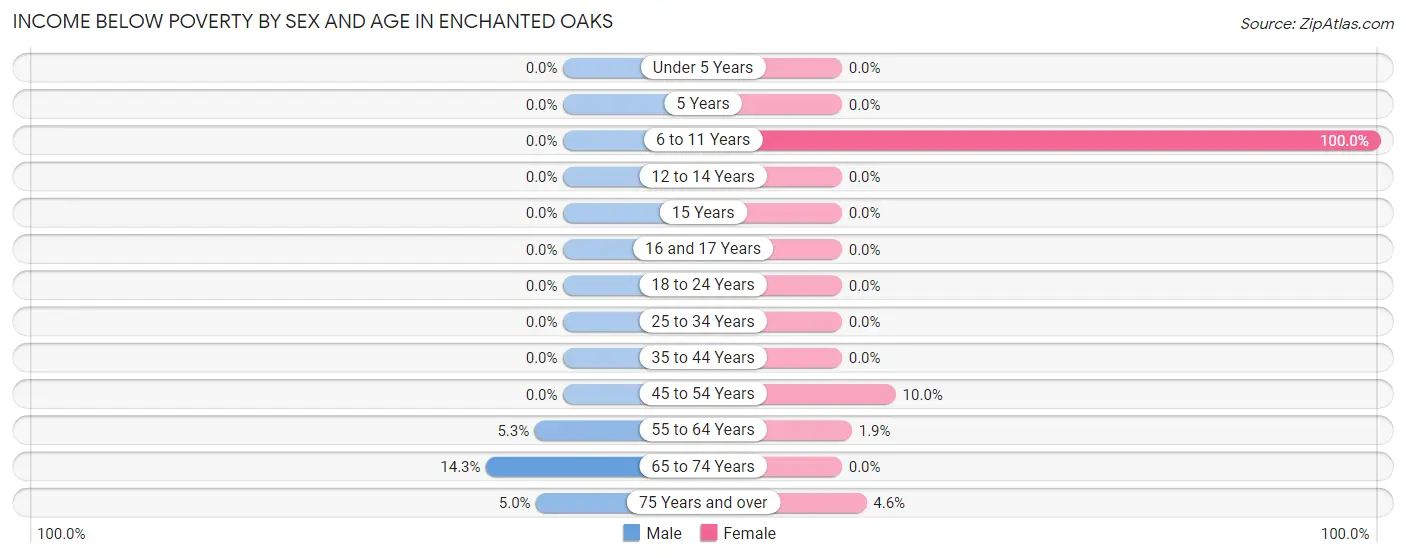
| Age Bracket | Male | Female |
| Under 5 Years | 0 (0.0%) | 0 (0.0%) |
| 5 Years | 0 (0.0%) | 0 (0.0%) |
| 6 to 11 Years | 0 (0.0%) | 1 (100.0%) |
| 12 to 14 Years | 0 (0.0%) | 0 (0.0%) |
| 15 Years | 0 (0.0%) | 0 (0.0%) |
| 16 and 17 Years | 0 (0.0%) | 0 (0.0%) |
| 18 to 24 Years | 0 (0.0%) | 0 (0.0%) |
| 25 to 34 Years | 0 (0.0%) | 0 (0.0%) |
| 35 to 44 Years | 0 (0.0%) | 0 (0.0%) |
| 45 to 54 Years | 0 (0.0%) | 2 (10.0%) |
| 55 to 64 Years | 2 (5.3%) | 1 (1.8%) |
| 65 to 74 Years | 4 (14.3%) | 0 (0.0%) |
| 75 Years and over | 1 (5.0%) | 1 (4.5%) |
| Total | 7 (6.2%) | 5 (3.6%) |
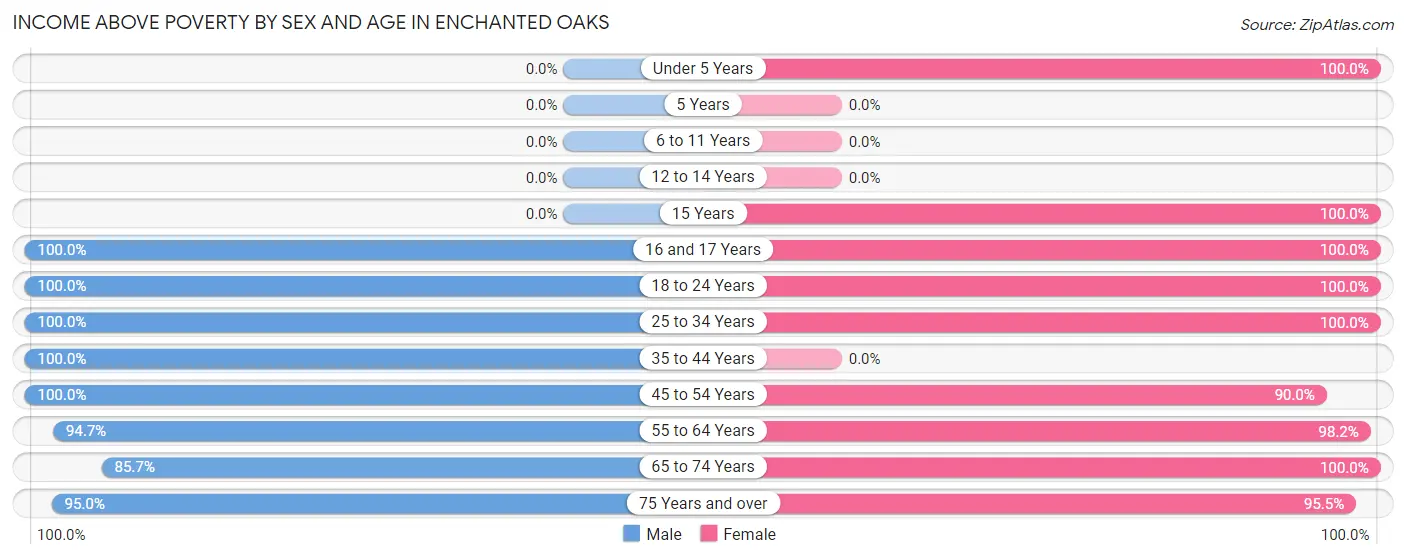
Income Above Poverty by Sex and Age in Enchanted Oaks
According to the poverty statistics in Enchanted Oaks, males aged 16 and 17 years and females aged under 5 years are the age groups that are most secure financially, with 100.0% of males and 100.0% of females in these age groups living above the poverty line.
| Age Bracket | Male | Female |
| Under 5 Years | 0 (0.0%) | 2 (100.0%) |
| 5 Years | 0 (0.0%) | 0 (0.0%) |
| 6 to 11 Years | 0 (0.0%) | 0 (0.0%) |
| 12 to 14 Years | 0 (0.0%) | 0 (0.0%) |
| 15 Years | 0 (0.0%) | 5 (100.0%) |
| 16 and 17 Years | 1 (100.0%) | 1 (100.0%) |
| 18 to 24 Years | 5 (100.0%) | 2 (100.0%) |
| 25 to 34 Years | 9 (100.0%) | 11 (100.0%) |
| 35 to 44 Years | 1 (100.0%) | 0 (0.0%) |
| 45 to 54 Years | 11 (100.0%) | 18 (90.0%) |
| 55 to 64 Years | 36 (94.7%) | 53 (98.2%) |
| 65 to 74 Years | 24 (85.7%) | 20 (100.0%) |
| 75 Years and over | 19 (95.0%) | 21 (95.5%) |
| Total | 106 (93.8%) | 133 (96.4%) |
Income Below Poverty Among Married-Couple Families in Enchanted Oaks
The poverty statistics for married-couple families in Enchanted Oaks show that 5.9% or 5 of the total 85 families live below the poverty line. Families with 1 or 2 children have the highest poverty rate of 18.2%, comprising of 2 families. On the other hand, families with no children have the lowest poverty rate of 4.1%, which includes 3 families.
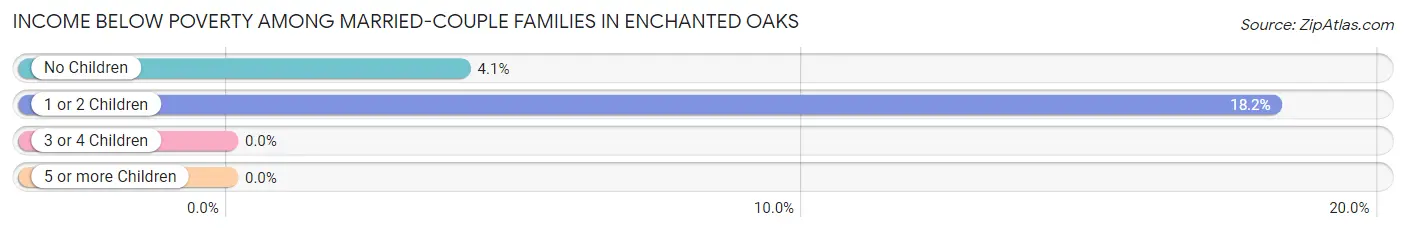
| Children | Above Poverty | Below Poverty |
| No Children | 71 (96.0%) | 3 (4.1%) |
| 1 or 2 Children | 9 (81.8%) | 2 (18.2%) |
| 3 or 4 Children | 0 (0.0%) | 0 (0.0%) |
| 5 or more Children | 0 (0.0%) | 0 (0.0%) |
| Total | 80 (94.1%) | 5 (5.9%) |
Income Below Poverty Among Single-Parent Households in Enchanted Oaks
| Children | Single Father | Single Mother |
| No Children | 0 (0.0%) | 0 (0.0%) |
| 1 or 2 Children | 0 (0.0%) | 0 (0.0%) |
| 3 or 4 Children | 0 (0.0%) | 0 (0.0%) |
| 5 or more Children | 0 (0.0%) | 0 (0.0%) |
| Total | 0 (0.0%) | 0 (0.0%) |
Income Below Poverty Among Married-Couple vs Single-Parent Households in Enchanted Oaks
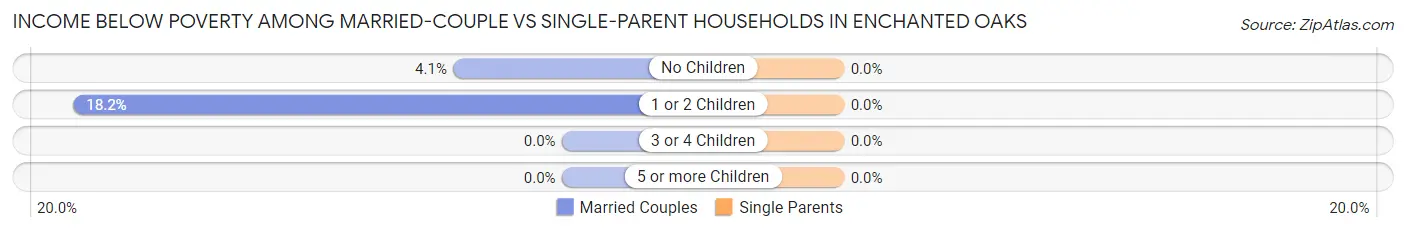
| Children | Married-Couple Families | Single-Parent Households |
| No Children | 3 (4.1%) | 0 (0.0%) |
| 1 or 2 Children | 2 (18.2%) | 0 (0.0%) |
| 3 or 4 Children | 0 (0.0%) | 0 (0.0%) |
| 5 or more Children | 0 (0.0%) | 0 (0.0%) |
| Total | 5 (5.9%) | 0 (0.0%) |
Race in Enchanted Oaks
The most populous races in Enchanted Oaks are White / Caucasian (234 | 92.9%), Two or more Races (14 | 5.6%), and Hispanic or Latino (5 | 2.0%).
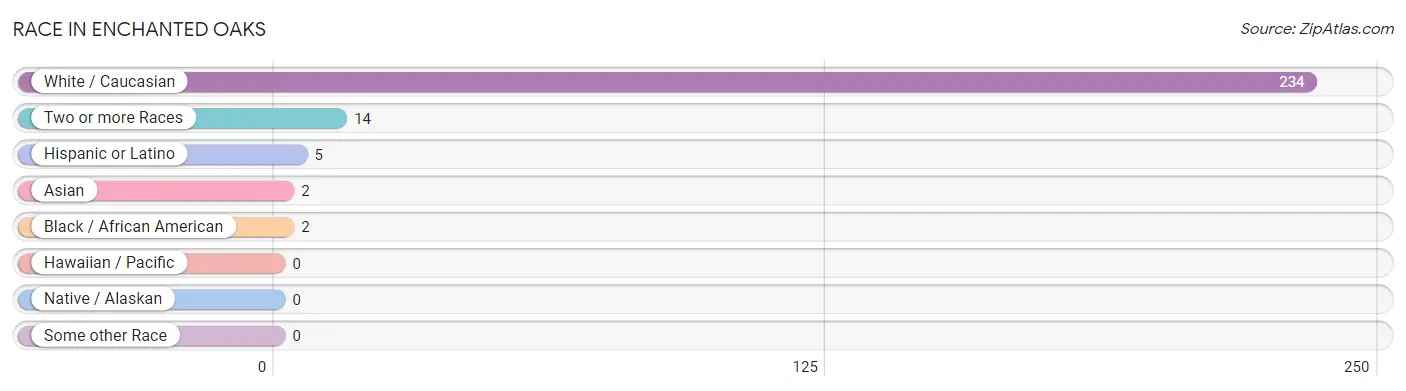
| Race | # Population | % Population |
| Asian | 2 | 0.8% |
| Black / African American | 2 | 0.8% |
| Hawaiian / Pacific | 0 | 0.0% |
| Hispanic or Latino | 5 | 2.0% |
| Native / Alaskan | 0 | 0.0% |
| White / Caucasian | 234 | 92.9% |
| Two or more Races | 14 | 5.6% |
| Some other Race | 0 | 0.0% |
| Total | 252 | 100.0% |
Ancestry in Enchanted Oaks
The most populous ancestries reported in Enchanted Oaks are German (49 | 19.4%), Irish (43 | 17.1%), English (36 | 14.3%), American (21 | 8.3%), and Russian (11 | 4.4%), together accounting for 63.5% of all Enchanted Oaks residents.
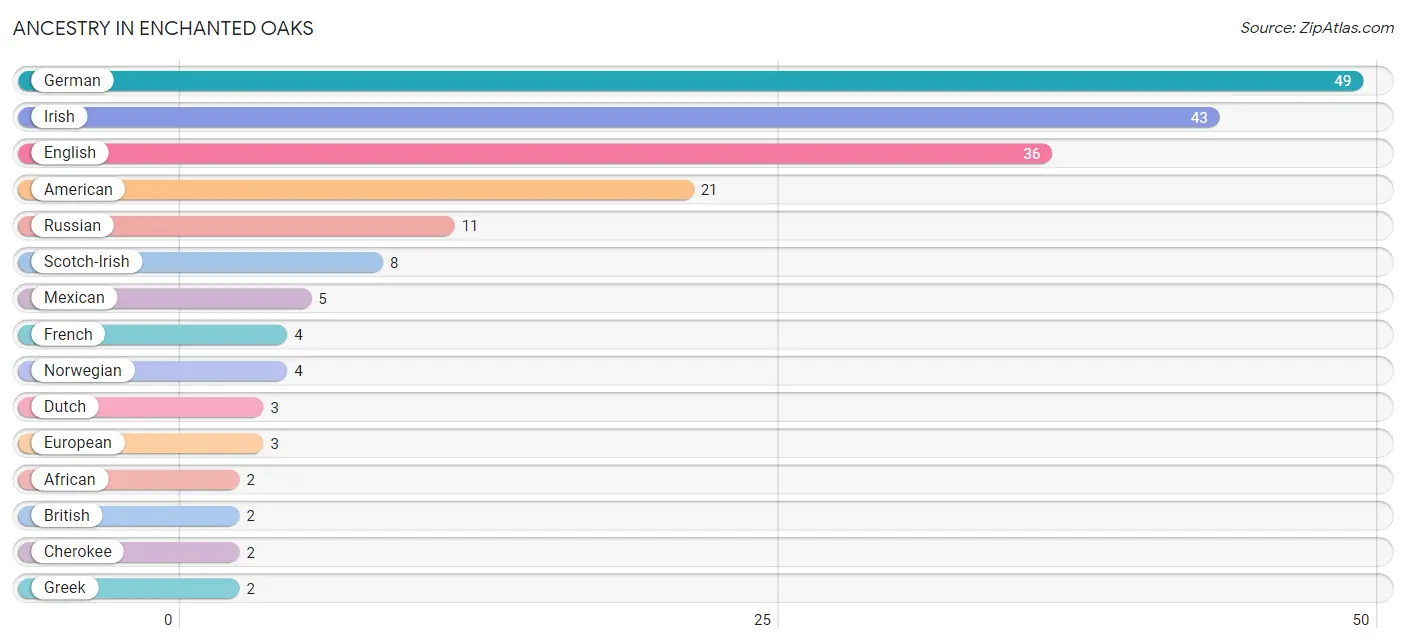
| Ancestry | # Population | % Population |
| African | 2 | 0.8% |
| American | 21 | 8.3% |
| British | 2 | 0.8% |
| Cherokee | 2 | 0.8% |
| Czech | 1 | 0.4% |
| Dutch | 3 | 1.2% |
| English | 36 | 14.3% |
| European | 3 | 1.2% |
| French | 4 | 1.6% |
| German | 49 | 19.4% |
| Greek | 2 | 0.8% |
| Irish | 43 | 17.1% |
| Italian | 2 | 0.8% |
| Korean | 2 | 0.8% |
| Mexican | 5 | 2.0% |
| Norwegian | 4 | 1.6% |
| Polish | 1 | 0.4% |
| Russian | 11 | 4.4% |
| Scandinavian | 1 | 0.4% |
| Scotch-Irish | 8 | 3.2% |
| Scottish | 2 | 0.8% |
| Subsaharan African | 2 | 0.8% |
| Swedish | 1 | 0.4% |
| Swiss | 2 | 0.8% | View All 24 Rows |
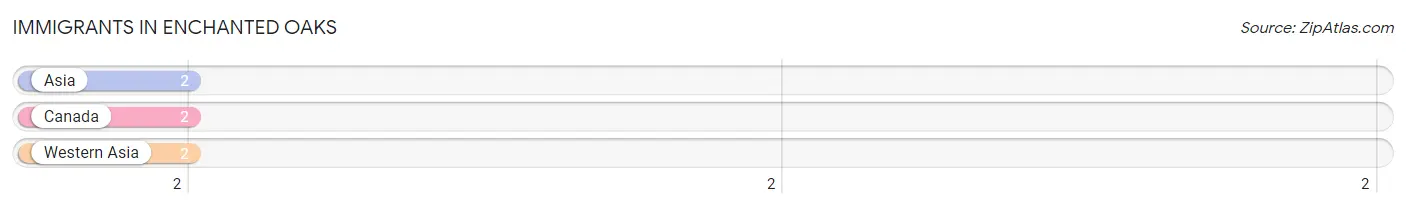
Immigrants in Enchanted Oaks
The most numerous immigrant groups reported in Enchanted Oaks came from Asia (2 | 0.8%), Canada (2 | 0.8%), and Western Asia (2 | 0.8%), together accounting for 2.4% of all Enchanted Oaks residents.
| Immigration Origin | # Population | % Population |
| Asia | 2 | 0.8% |
| Canada | 2 | 0.8% |
| Western Asia | 2 | 0.8% | View All 3 Rows |
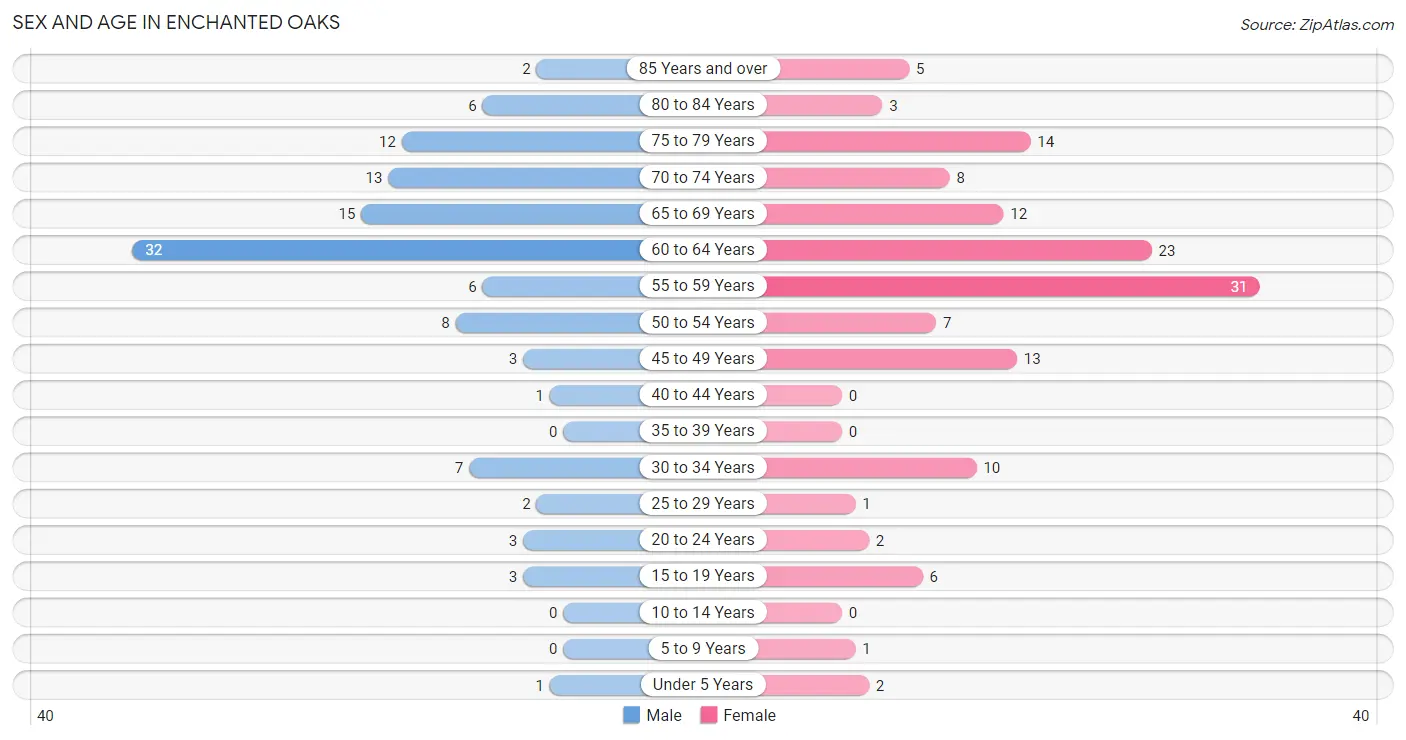
Sex and Age in Enchanted Oaks
Sex and Age in Enchanted Oaks
The most populous age groups in Enchanted Oaks are 60 to 64 Years (32 | 28.1%) for men and 55 to 59 Years (31 | 22.5%) for women.
| Age Bracket | Male | Female |
| Under 5 Years | 1 (0.9%) | 2 (1.5%) |
| 5 to 9 Years | 0 (0.0%) | 1 (0.7%) |
| 10 to 14 Years | 0 (0.0%) | 0 (0.0%) |
| 15 to 19 Years | 3 (2.6%) | 6 (4.3%) |
| 20 to 24 Years | 3 (2.6%) | 2 (1.5%) |
| 25 to 29 Years | 2 (1.8%) | 1 (0.7%) |
| 30 to 34 Years | 7 (6.1%) | 10 (7.2%) |
| 35 to 39 Years | 0 (0.0%) | 0 (0.0%) |
| 40 to 44 Years | 1 (0.9%) | 0 (0.0%) |
| 45 to 49 Years | 3 (2.6%) | 13 (9.4%) |
| 50 to 54 Years | 8 (7.0%) | 7 (5.1%) |
| 55 to 59 Years | 6 (5.3%) | 31 (22.5%) |
| 60 to 64 Years | 32 (28.1%) | 23 (16.7%) |
| 65 to 69 Years | 15 (13.2%) | 12 (8.7%) |
| 70 to 74 Years | 13 (11.4%) | 8 (5.8%) |
| 75 to 79 Years | 12 (10.5%) | 14 (10.1%) |
| 80 to 84 Years | 6 (5.3%) | 3 (2.2%) |
| 85 Years and over | 2 (1.8%) | 5 (3.6%) |
| Total | 114 (100.0%) | 138 (100.0%) |
Families and Households in Enchanted Oaks
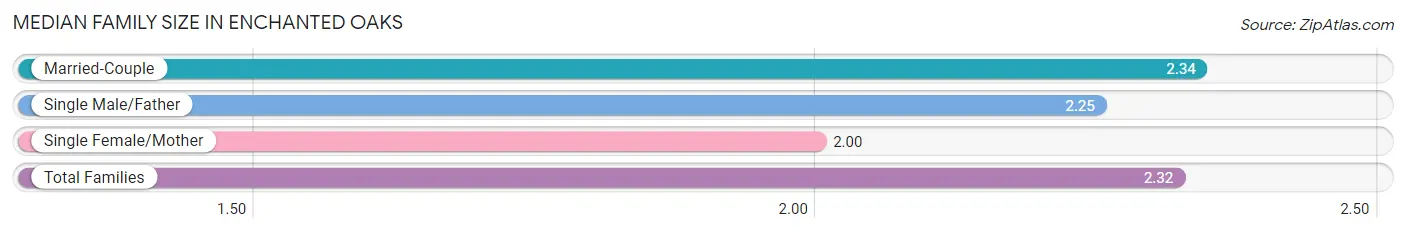
Median Family Size in Enchanted Oaks
The median family size in Enchanted Oaks is 2.32 persons per family, with married-couple families (85 | 87.6%) accounting for the largest median family size of 2.34 persons per family. On the other hand, single female/mother families (4 | 4.1%) represent the smallest median family size with 2.00 persons per family.
| Family Type | # Families | Family Size |
| Married-Couple | 85 (87.6%) | 2.34 |
| Single Male/Father | 8 (8.3%) | 2.25 |
| Single Female/Mother | 4 (4.1%) | 2.00 |
| Total Families | 97 (100.0%) | 2.32 |
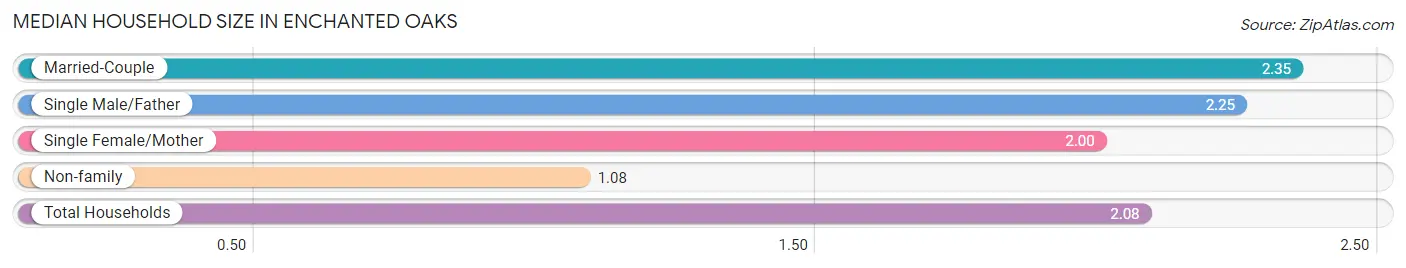
Median Household Size in Enchanted Oaks
The median household size in Enchanted Oaks is 2.08 persons per household, with married-couple households (85 | 70.3%) accounting for the largest median household size of 2.35 persons per household. non-family households (24 | 19.8%) represent the smallest median household size with 1.08 persons per household.
| Household Type | # Households | Household Size |
| Married-Couple | 85 (70.3%) | 2.35 |
| Single Male/Father | 8 (6.6%) | 2.25 |
| Single Female/Mother | 4 (3.3%) | 2.00 |
| Non-family | 24 (19.8%) | 1.08 |
| Total Households | 121 (100.0%) | 2.08 |
Household Size by Marriage Status in Enchanted Oaks
Out of a total of 121 households in Enchanted Oaks, 97 (80.2%) are family households, while 24 (19.8%) are nonfamily households. The most numerous type of family households are 2-person households, comprising 77, and the most common type of nonfamily households are 1-person households, comprising 21.
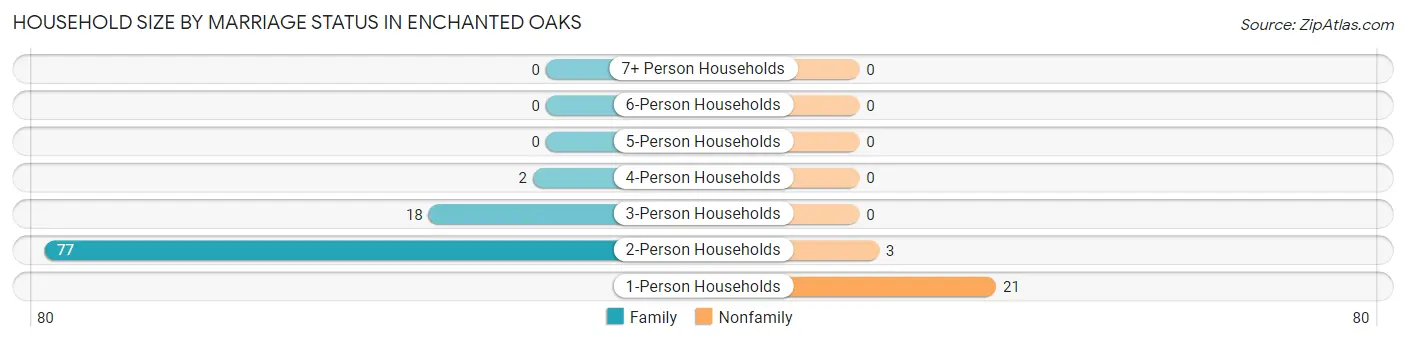
| Household Size | Family Households | Nonfamily Households |
| 1-Person Households | - | 21 (17.4%) |
| 2-Person Households | 77 (63.6%) | 3 (2.5%) |
| 3-Person Households | 18 (14.9%) | 0 (0.0%) |
| 4-Person Households | 2 (1.7%) | 0 (0.0%) |
| 5-Person Households | 0 (0.0%) | 0 (0.0%) |
| 6-Person Households | 0 (0.0%) | 0 (0.0%) |
| 7+ Person Households | 0 (0.0%) | 0 (0.0%) |
| Total | 97 (80.2%) | 24 (19.8%) |
Female Fertility in Enchanted Oaks
Fertility by Age in Enchanted Oaks
| Age Bracket | Women with Births | Births / 1,000 Women |
| 15 to 19 years | 0 (0.0%) | 0.0 |
| 20 to 34 years | 0 (0.0%) | 0.0 |
| 35 to 50 years | 0 (0.0%) | 0.0 |
| Total | 0 (0.0%) | 0.0 |
Fertility by Age by Marriage Status in Enchanted Oaks
| Age Bracket | Married | Unmarried |
| 15 to 19 years | 0 (0.0%) | 0 (0.0%) |
| 20 to 34 years | 0 (0.0%) | 0 (0.0%) |
| 35 to 50 years | 0 (0.0%) | 0 (0.0%) |
| Total | 0 (0.0%) | 0 (0.0%) |
Fertility by Education in Enchanted Oaks
| Educational Attainment | Women with Births | Births / 1,000 Women |
| Less than High School | 0 (0.0%) | 0.0 |
| High School Diploma | 0 (0.0%) | 0.0 |
| College or Associate's Degree | 0 (0.0%) | 0.0 |
| Bachelor's Degree | 0 (0.0%) | 0.0 |
| Graduate Degree | 0 (0.0%) | 0.0 |
| Total | 0 (0.0%) | 0.0 |
Fertility by Education by Marriage Status in Enchanted Oaks
| Educational Attainment | Married | Unmarried |
| Less than High School | 0 (0.0%) | 0 (0.0%) |
| High School Diploma | 0 (0.0%) | 0 (0.0%) |
| College or Associate's Degree | 0 (0.0%) | 0 (0.0%) |
| Bachelor's Degree | 0 (0.0%) | 0 (0.0%) |
| Graduate Degree | 0 (0.0%) | 0 (0.0%) |
| Total | 0 (0.0%) | 0 (0.0%) |
Employment Characteristics in Enchanted Oaks
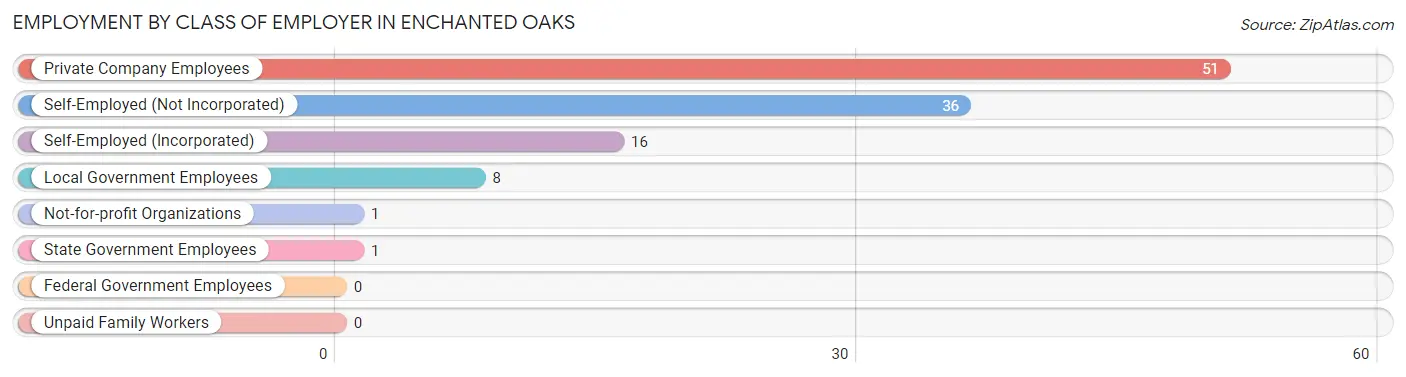
Employment by Class of Employer in Enchanted Oaks
Among the 113 employed individuals in Enchanted Oaks, private company employees (51 | 45.1%), self-employed (not incorporated) (36 | 31.9%), and self-employed (incorporated) (16 | 14.2%) make up the most common classes of employment.
| Employer Class | # Employees | % Employees |
| Private Company Employees | 51 | 45.1% |
| Self-Employed (Incorporated) | 16 | 14.2% |
| Self-Employed (Not Incorporated) | 36 | 31.9% |
| Not-for-profit Organizations | 1 | 0.9% |
| Local Government Employees | 8 | 7.1% |
| State Government Employees | 1 | 0.9% |
| Federal Government Employees | 0 | 0.0% |
| Unpaid Family Workers | 0 | 0.0% |
| Total | 113 | 100.0% |
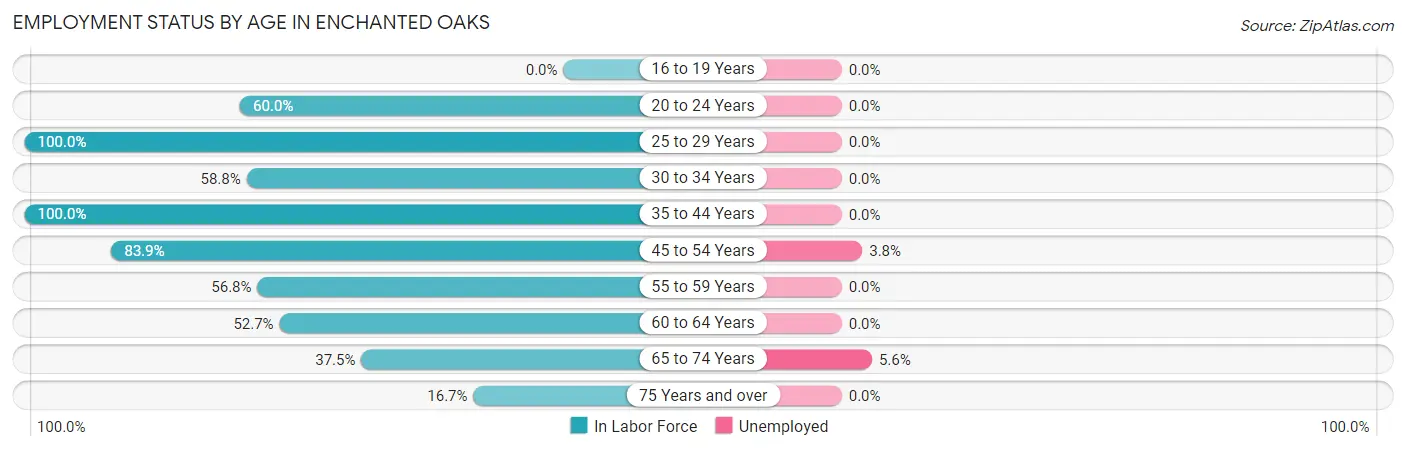
Employment Status by Age in Enchanted Oaks
According to the labor force statistics for Enchanted Oaks, out of the total population over 16 years of age (243), 48.6% or 118 individuals are in the labor force, with 1.7% or 2 of them unemployed. The age group with the highest labor force participation rate is 25 to 29 years, with 100.0% or 3 individuals in the labor force. Within the labor force, the 65 to 74 years age range has the highest percentage of unemployed individuals, with 5.6% or 1 of them being unemployed.
| Age Bracket | In Labor Force | Unemployed |
| 16 to 19 Years | 0 (0.0%) | 0 (0.0%) |
| 20 to 24 Years | 3 (60.0%) | 0 (0.0%) |
| 25 to 29 Years | 3 (100.0%) | 0 (0.0%) |
| 30 to 34 Years | 10 (58.8%) | 0 (0.0%) |
| 35 to 44 Years | 1 (100.0%) | 0 (0.0%) |
| 45 to 54 Years | 26 (83.9%) | 1 (3.8%) |
| 55 to 59 Years | 21 (56.8%) | 0 (0.0%) |
| 60 to 64 Years | 29 (52.7%) | 0 (0.0%) |
| 65 to 74 Years | 18 (37.5%) | 1 (5.6%) |
| 75 Years and over | 7 (16.7%) | 0 (0.0%) |
| Total | 118 (48.6%) | 2 (1.7%) |
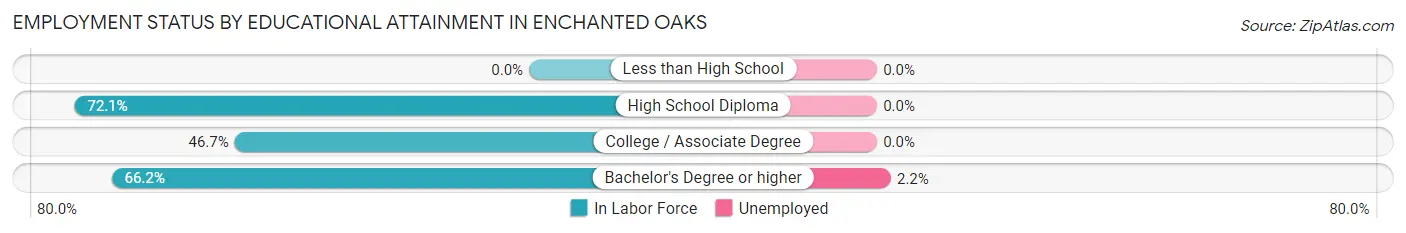
Employment Status by Educational Attainment in Enchanted Oaks
According to labor force statistics for Enchanted Oaks, 62.5% of individuals (90) out of the total population between 25 and 64 years of age (144) are in the labor force, with 1.1% or 1 of them being unemployed. The group with the highest labor force participation rate are those with the educational attainment of high school diploma, with 72.1% or 31 individuals in the labor force. Within the labor force, individuals with bachelor's degree or higher education have the highest percentage of unemployment, with 2.2% or 1 of them being unemployed.
| Educational Attainment | In Labor Force | Unemployed |
| Less than High School | 0 (0.0%) | 0 (0.0%) |
| High School Diploma | 31 (72.1%) | 0 (0.0%) |
| College / Associate Degree | 14 (46.7%) | 0 (0.0%) |
| Bachelor's Degree or higher | 45 (66.2%) | 1 (2.2%) |
| Total | 90 (62.5%) | 2 (1.1%) |
Employment Occupations by Sex in Enchanted Oaks
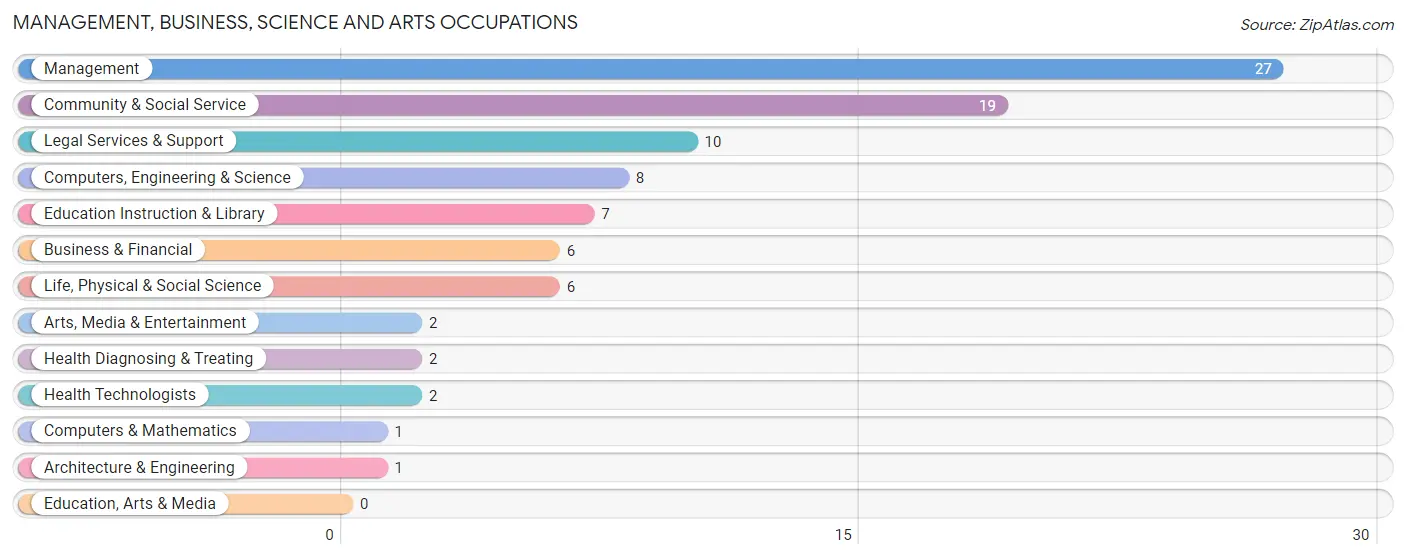
Management, Business, Science and Arts Occupations
The most common Management, Business, Science and Arts occupations in Enchanted Oaks are Management (27 | 23.3%), Community & Social Service (19 | 16.4%), Legal Services & Support (10 | 8.6%), Computers, Engineering & Science (8 | 6.9%), and Education Instruction & Library (7 | 6.0%).
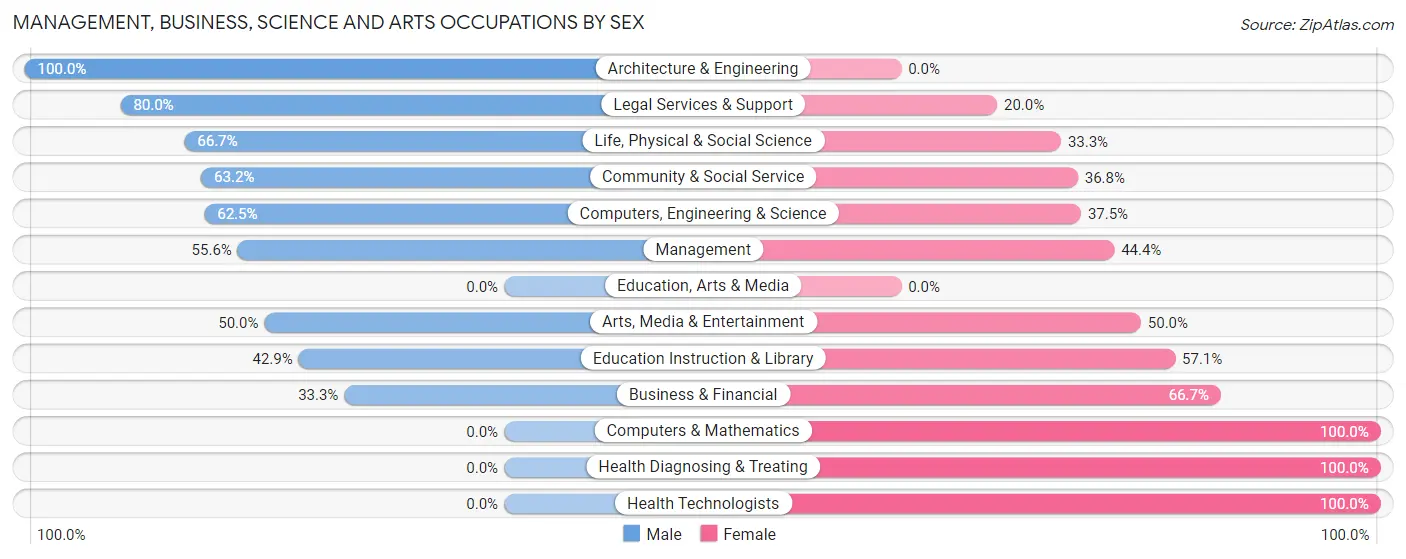
Management, Business, Science and Arts Occupations by Sex
Within the Management, Business, Science and Arts occupations in Enchanted Oaks, the most male-oriented occupations are Architecture & Engineering (100.0%), Legal Services & Support (80.0%), and Life, Physical & Social Science (66.7%), while the most female-oriented occupations are Computers & Mathematics (100.0%), Health Diagnosing & Treating (100.0%), and Health Technologists (100.0%).
| Occupation | Male | Female |
| Management | 15 (55.6%) | 12 (44.4%) |
| Business & Financial | 2 (33.3%) | 4 (66.7%) |
| Computers, Engineering & Science | 5 (62.5%) | 3 (37.5%) |
| Computers & Mathematics | 0 (0.0%) | 1 (100.0%) |
| Architecture & Engineering | 1 (100.0%) | 0 (0.0%) |
| Life, Physical & Social Science | 4 (66.7%) | 2 (33.3%) |
| Community & Social Service | 12 (63.2%) | 7 (36.8%) |
| Education, Arts & Media | 0 (0.0%) | 0 (0.0%) |
| Legal Services & Support | 8 (80.0%) | 2 (20.0%) |
| Education Instruction & Library | 3 (42.9%) | 4 (57.1%) |
| Arts, Media & Entertainment | 1 (50.0%) | 1 (50.0%) |
| Health Diagnosing & Treating | 0 (0.0%) | 2 (100.0%) |
| Health Technologists | 0 (0.0%) | 2 (100.0%) |
| Total (Category) | 34 (54.8%) | 28 (45.2%) |
| Total (Overall) | 69 (59.5%) | 47 (40.5%) |
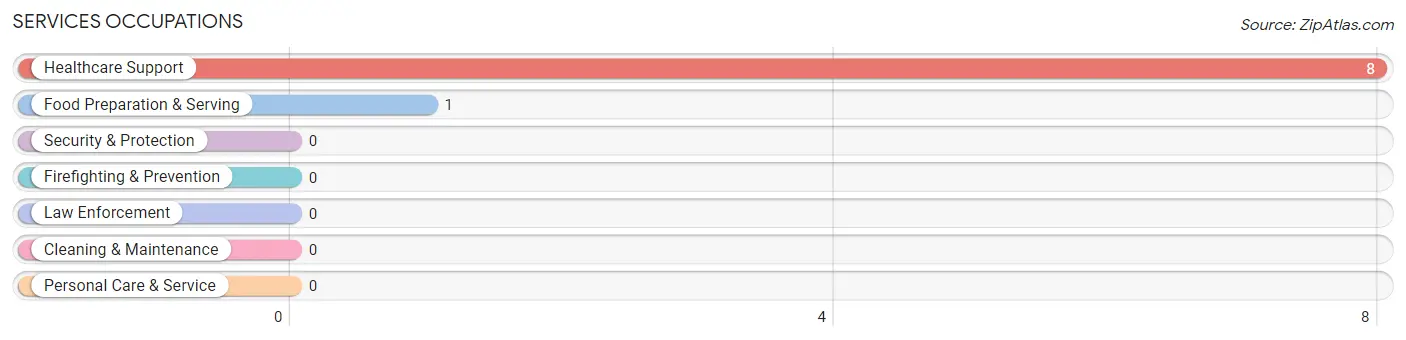
Services Occupations
The most common Services occupations in Enchanted Oaks are Healthcare Support (8 | 6.9%), and Food Preparation & Serving (1 | 0.9%).
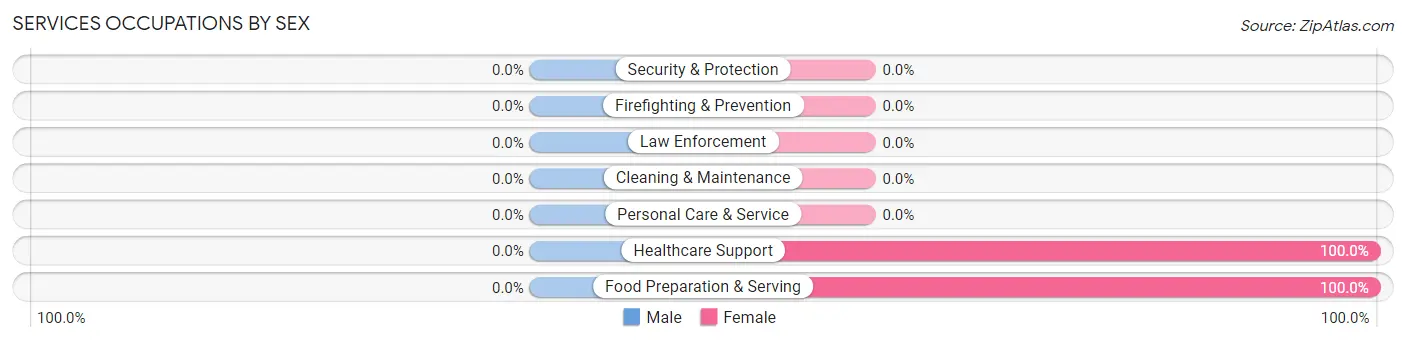
Services Occupations by Sex
| Occupation | Male | Female |
| Healthcare Support | 0 (0.0%) | 8 (100.0%) |
| Security & Protection | 0 (0.0%) | 0 (0.0%) |
| Firefighting & Prevention | 0 (0.0%) | 0 (0.0%) |
| Law Enforcement | 0 (0.0%) | 0 (0.0%) |
| Food Preparation & Serving | 0 (0.0%) | 1 (100.0%) |
| Cleaning & Maintenance | 0 (0.0%) | 0 (0.0%) |
| Personal Care & Service | 0 (0.0%) | 0 (0.0%) |
| Total (Category) | 0 (0.0%) | 9 (100.0%) |
| Total (Overall) | 69 (59.5%) | 47 (40.5%) |
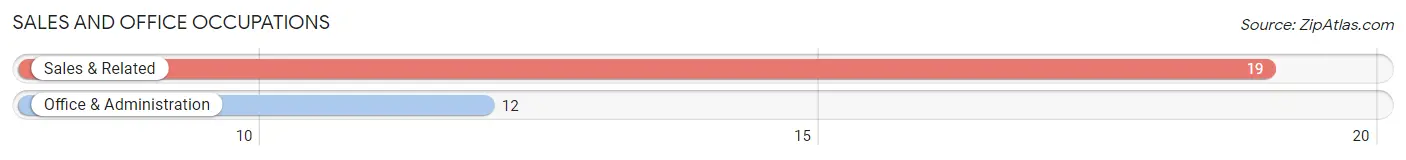
Sales and Office Occupations
The most common Sales and Office occupations in Enchanted Oaks are Sales & Related (19 | 16.4%), and Office & Administration (12 | 10.3%).
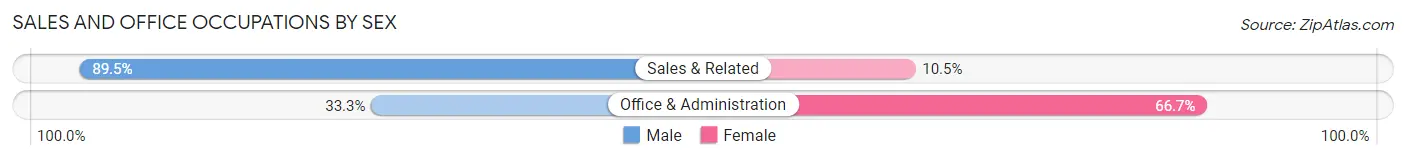
Sales and Office Occupations by Sex
| Occupation | Male | Female |
| Sales & Related | 17 (89.5%) | 2 (10.5%) |
| Office & Administration | 4 (33.3%) | 8 (66.7%) |
| Total (Category) | 21 (67.7%) | 10 (32.3%) |
| Total (Overall) | 69 (59.5%) | 47 (40.5%) |
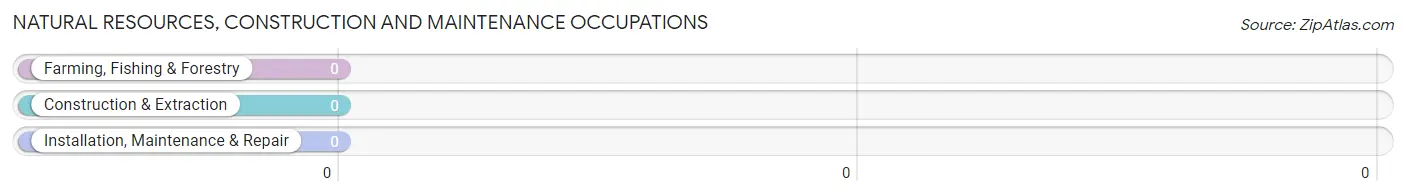
Natural Resources, Construction and Maintenance Occupations
Natural Resources, Construction and Maintenance Occupations by Sex
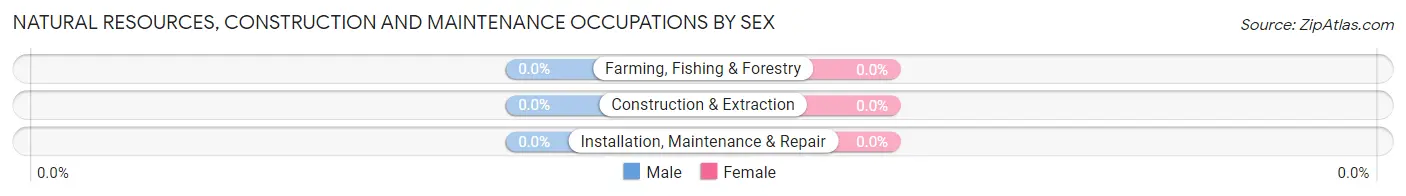
| Occupation | Male | Female |
| Farming, Fishing & Forestry | 0 (0.0%) | 0 (0.0%) |
| Construction & Extraction | 0 (0.0%) | 0 (0.0%) |
| Installation, Maintenance & Repair | 0 (0.0%) | 0 (0.0%) |
| Total (Category) | 0 (0.0%) | 0 (0.0%) |
| Total (Overall) | 69 (59.5%) | 47 (40.5%) |
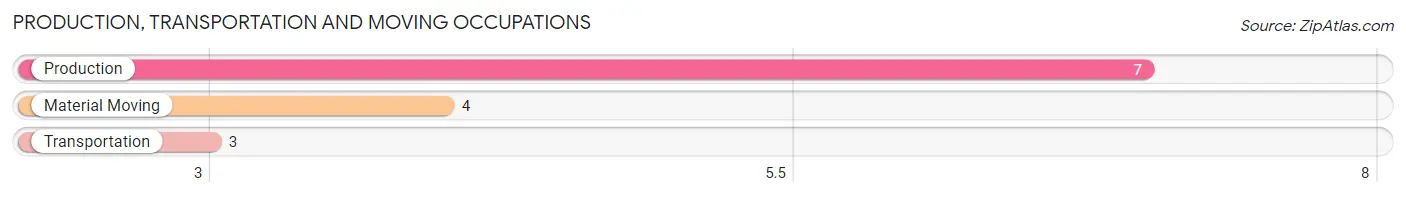
Production, Transportation and Moving Occupations
The most common Production, Transportation and Moving occupations in Enchanted Oaks are Production (7 | 6.0%), Material Moving (4 | 3.5%), and Transportation (3 | 2.6%).
Production, Transportation and Moving Occupations by Sex
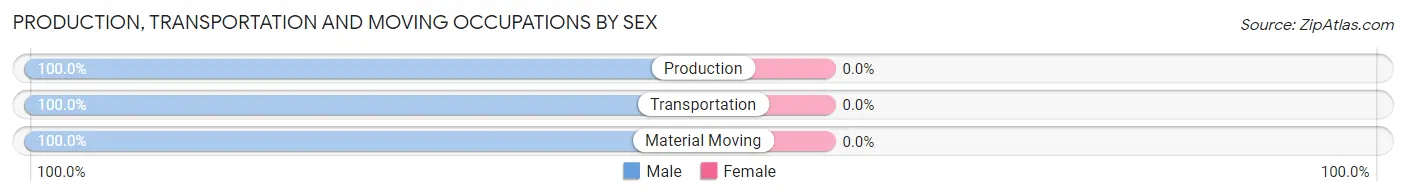
| Occupation | Male | Female |
| Production | 7 (100.0%) | 0 (0.0%) |
| Transportation | 3 (100.0%) | 0 (0.0%) |
| Material Moving | 4 (100.0%) | 0 (0.0%) |
| Total (Category) | 14 (100.0%) | 0 (0.0%) |
| Total (Overall) | 69 (59.5%) | 47 (40.5%) |
Employment Industries by Sex in Enchanted Oaks
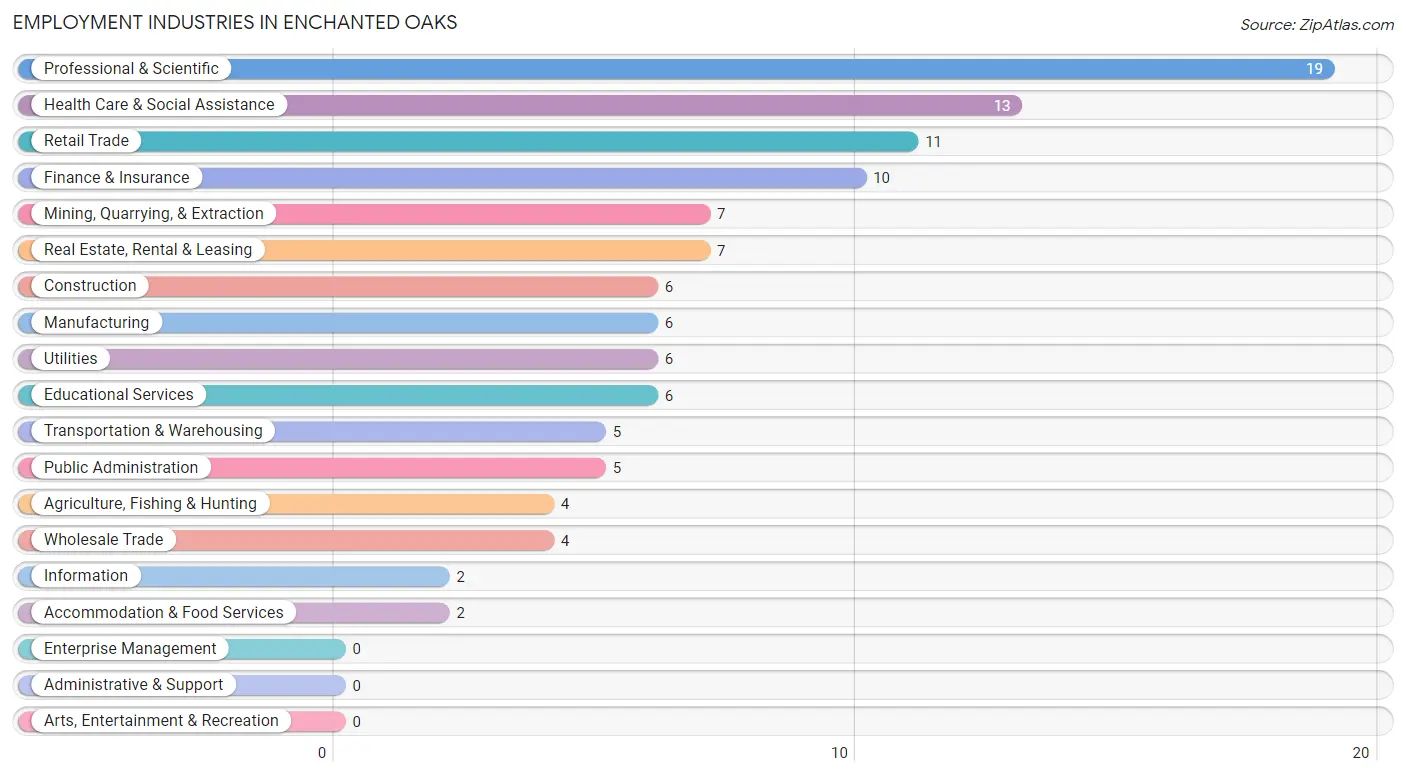
Employment Industries in Enchanted Oaks
The major employment industries in Enchanted Oaks include Professional & Scientific (19 | 16.4%), Health Care & Social Assistance (13 | 11.2%), Retail Trade (11 | 9.5%), Finance & Insurance (10 | 8.6%), and Mining, Quarrying, & Extraction (7 | 6.0%).
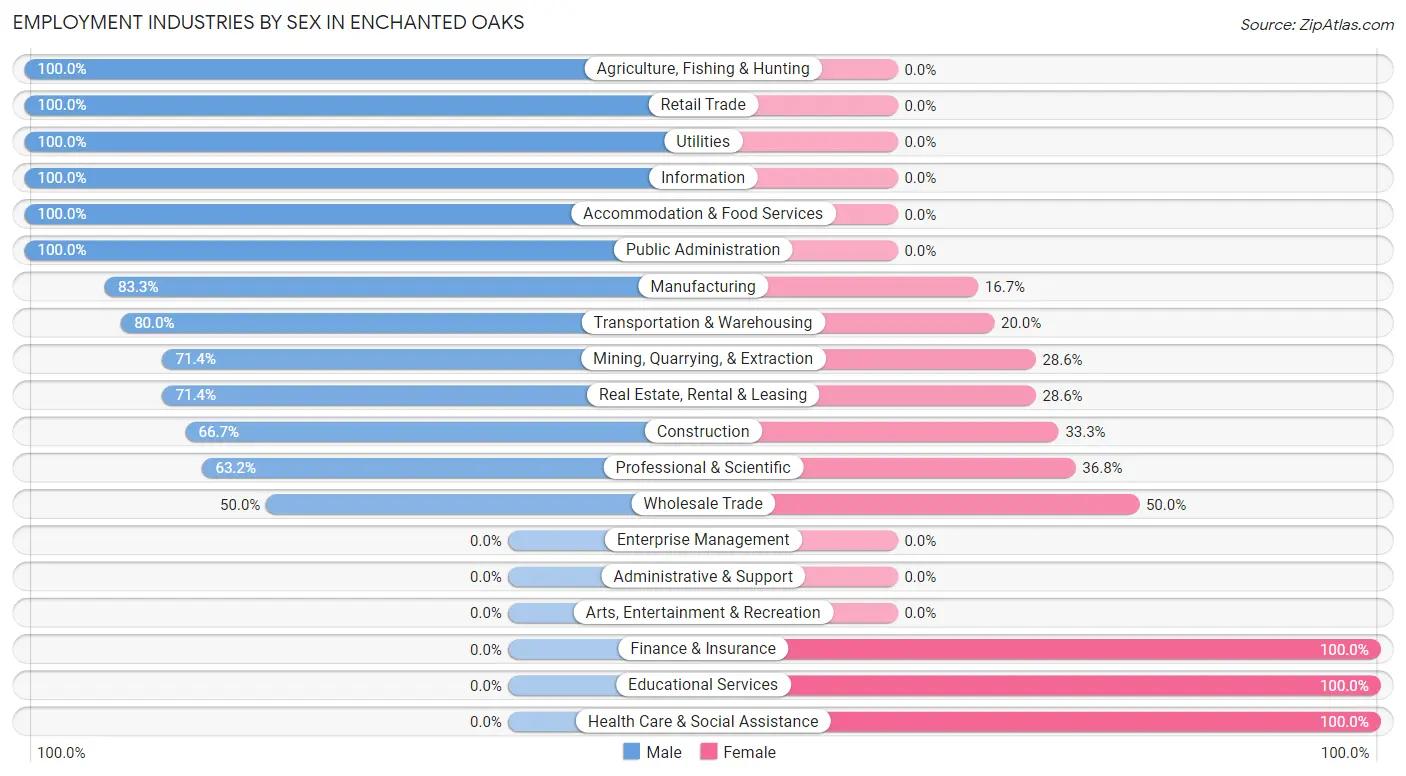
Employment Industries by Sex in Enchanted Oaks
The Enchanted Oaks industries that see more men than women are Agriculture, Fishing & Hunting (100.0%), Retail Trade (100.0%), and Utilities (100.0%), whereas the industries that tend to have a higher number of women are Finance & Insurance (100.0%), Educational Services (100.0%), and Health Care & Social Assistance (100.0%).
| Industry | Male | Female |
| Agriculture, Fishing & Hunting | 4 (100.0%) | 0 (0.0%) |
| Mining, Quarrying, & Extraction | 5 (71.4%) | 2 (28.6%) |
| Construction | 4 (66.7%) | 2 (33.3%) |
| Manufacturing | 5 (83.3%) | 1 (16.7%) |
| Wholesale Trade | 2 (50.0%) | 2 (50.0%) |
| Retail Trade | 11 (100.0%) | 0 (0.0%) |
| Transportation & Warehousing | 4 (80.0%) | 1 (20.0%) |
| Utilities | 6 (100.0%) | 0 (0.0%) |
| Information | 2 (100.0%) | 0 (0.0%) |
| Finance & Insurance | 0 (0.0%) | 10 (100.0%) |
| Real Estate, Rental & Leasing | 5 (71.4%) | 2 (28.6%) |
| Professional & Scientific | 12 (63.2%) | 7 (36.8%) |
| Enterprise Management | 0 (0.0%) | 0 (0.0%) |
| Administrative & Support | 0 (0.0%) | 0 (0.0%) |
| Educational Services | 0 (0.0%) | 6 (100.0%) |
| Health Care & Social Assistance | 0 (0.0%) | 13 (100.0%) |
| Arts, Entertainment & Recreation | 0 (0.0%) | 0 (0.0%) |
| Accommodation & Food Services | 2 (100.0%) | 0 (0.0%) |
| Public Administration | 5 (100.0%) | 0 (0.0%) |
| Total | 69 (59.5%) | 47 (40.5%) |
Education in Enchanted Oaks
School Enrollment in Enchanted Oaks
The most common levels of schooling among the 13 students in Enchanted Oaks are high school (11 | 84.6%), elementary school (1 | 7.7%), and college / undergraduate (1 | 7.7%).
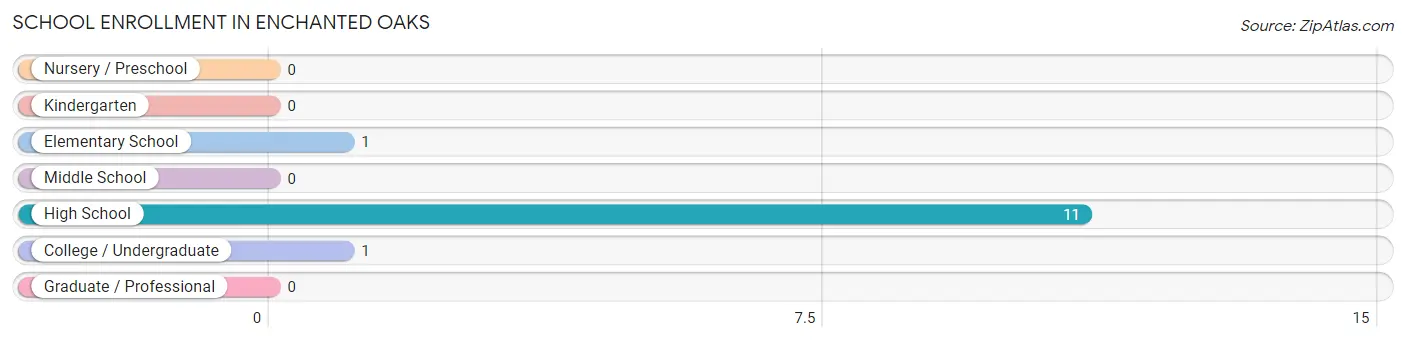
| School Level | # Students | % Students |
| Nursery / Preschool | 0 | 0.0% |
| Kindergarten | 0 | 0.0% |
| Elementary School | 1 | 7.7% |
| Middle School | 0 | 0.0% |
| High School | 11 | 84.6% |
| College / Undergraduate | 1 | 7.7% |
| Graduate / Professional | 0 | 0.0% |
| Total | 13 | 100.0% |
School Enrollment by Age by Funding Source in Enchanted Oaks
Out of a total of 13 students who are enrolled in schools in Enchanted Oaks, 1 (7.7%) attend a private institution, while the remaining 12 (92.3%) are enrolled in public schools. The age group of 5 to 9 year old has the highest likelihood of being enrolled in private schools, with 1 (100.0% in the age bracket) enrolled. Conversely, the age group of 15 to 17 year olds has the lowest likelihood of being enrolled in a private school, with 7 (100.0% in the age bracket) attending a public institution.
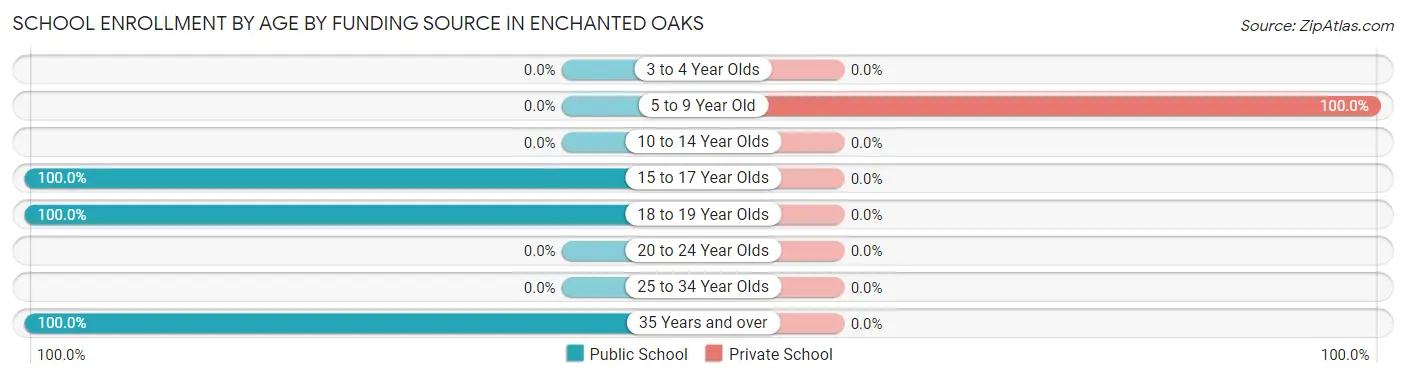
| Age Bracket | Public School | Private School |
| 3 to 4 Year Olds | 0 (0.0%) | 0 (0.0%) |
| 5 to 9 Year Old | 0 (0.0%) | 1 (100.0%) |
| 10 to 14 Year Olds | 0 (0.0%) | 0 (0.0%) |
| 15 to 17 Year Olds | 7 (100.0%) | 0 (0.0%) |
| 18 to 19 Year Olds | 2 (100.0%) | 0 (0.0%) |
| 20 to 24 Year Olds | 0 (0.0%) | 0 (0.0%) |
| 25 to 34 Year Olds | 0 (0.0%) | 0 (0.0%) |
| 35 Years and over | 3 (100.0%) | 0 (0.0%) |
| Total | 12 (92.3%) | 1 (7.7%) |
Educational Attainment by Field of Study in Enchanted Oaks
Business (31 | 29.0%), education (18 | 16.8%), social sciences (12 | 11.2%), engineering (8 | 7.5%), and arts & humanities (7 | 6.5%) are the most common fields of study among 107 individuals in Enchanted Oaks who have obtained a bachelor's degree or higher.
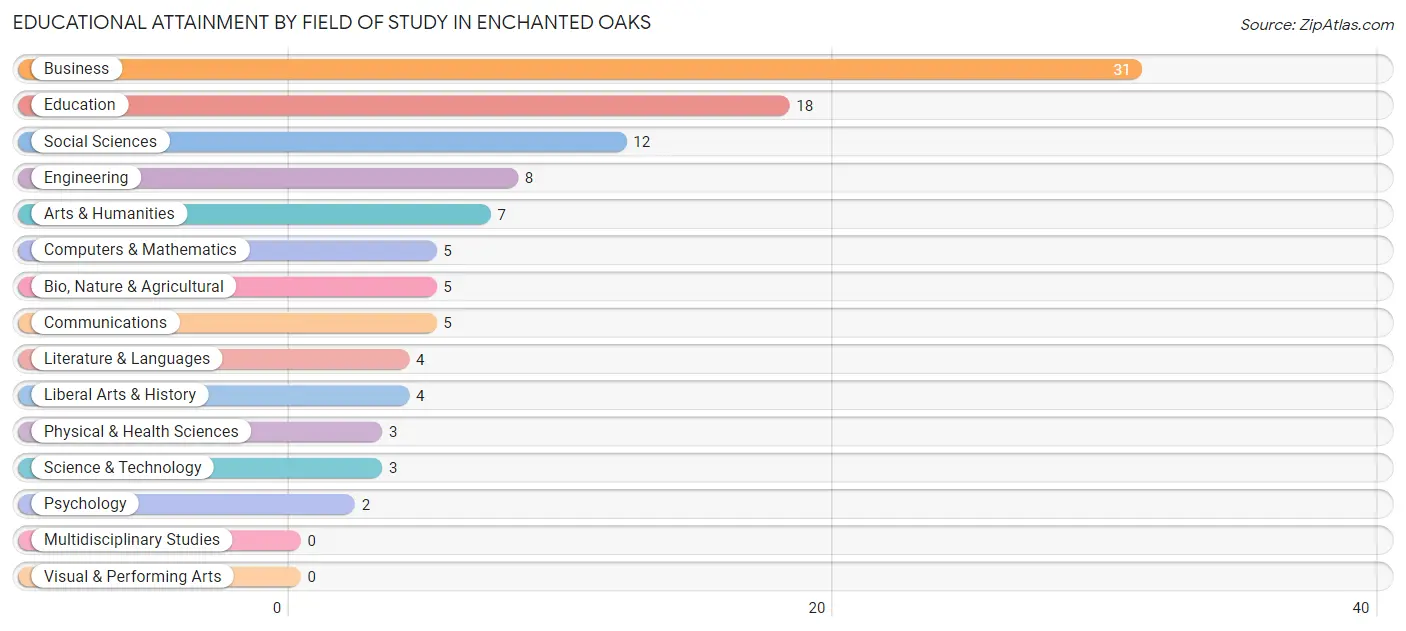
| Field of Study | # Graduates | % Graduates |
| Computers & Mathematics | 5 | 4.7% |
| Bio, Nature & Agricultural | 5 | 4.7% |
| Physical & Health Sciences | 3 | 2.8% |
| Psychology | 2 | 1.9% |
| Social Sciences | 12 | 11.2% |
| Engineering | 8 | 7.5% |
| Multidisciplinary Studies | 0 | 0.0% |
| Science & Technology | 3 | 2.8% |
| Business | 31 | 29.0% |
| Education | 18 | 16.8% |
| Literature & Languages | 4 | 3.7% |
| Liberal Arts & History | 4 | 3.7% |
| Visual & Performing Arts | 0 | 0.0% |
| Communications | 5 | 4.7% |
| Arts & Humanities | 7 | 6.5% |
| Total | 107 | 100.0% |
Transportation & Commute in Enchanted Oaks
Vehicle Availability by Sex in Enchanted Oaks
The most prevalent vehicle ownership categories in Enchanted Oaks are males with 2 vehicles (39, accounting for 59.1%) and females with 2 vehicles (24, making up 83.0%).
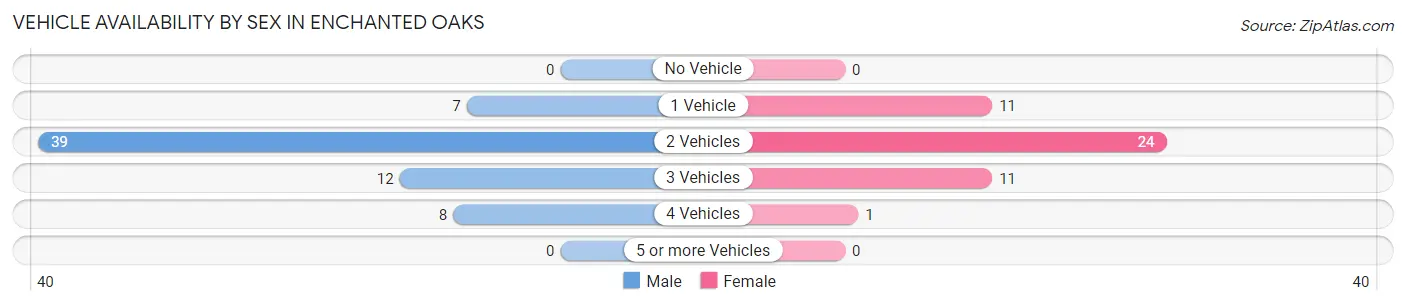
| Vehicles Available | Male | Female |
| No Vehicle | 0 (0.0%) | 0 (0.0%) |
| 1 Vehicle | 7 (10.6%) | 11 (23.4%) |
| 2 Vehicles | 39 (59.1%) | 24 (51.1%) |
| 3 Vehicles | 12 (18.2%) | 11 (23.4%) |
| 4 Vehicles | 8 (12.1%) | 1 (2.1%) |
| 5 or more Vehicles | 0 (0.0%) | 0 (0.0%) |
| Total | 66 (100.0%) | 47 (100.0%) |
Commute Time in Enchanted Oaks
The most frequently occuring commute durations in Enchanted Oaks are 15 to 19 minutes (22 commuters, 23.2%), 10 to 14 minutes (15 commuters, 15.8%), and 20 to 24 minutes (14 commuters, 14.7%).
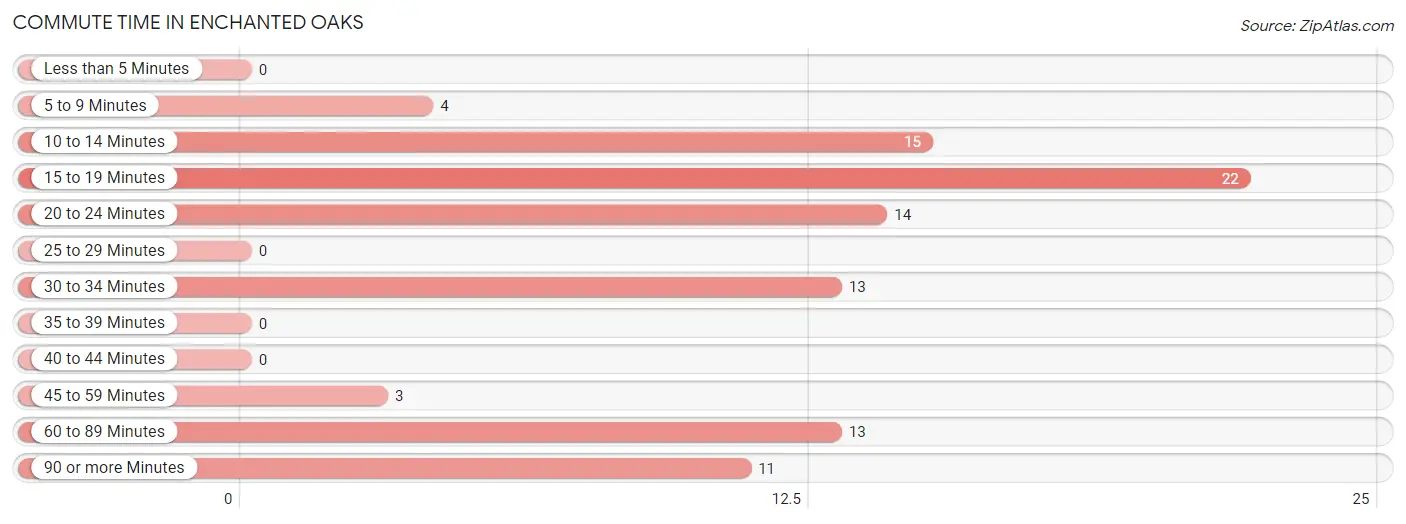
| Commute Time | # Commuters | % Commuters |
| Less than 5 Minutes | 0 | 0.0% |
| 5 to 9 Minutes | 4 | 4.2% |
| 10 to 14 Minutes | 15 | 15.8% |
| 15 to 19 Minutes | 22 | 23.2% |
| 20 to 24 Minutes | 14 | 14.7% |
| 25 to 29 Minutes | 0 | 0.0% |
| 30 to 34 Minutes | 13 | 13.7% |
| 35 to 39 Minutes | 0 | 0.0% |
| 40 to 44 Minutes | 0 | 0.0% |
| 45 to 59 Minutes | 3 | 3.2% |
| 60 to 89 Minutes | 13 | 13.7% |
| 90 or more Minutes | 11 | 11.6% |
Commute Time by Sex in Enchanted Oaks
The most common commute times in Enchanted Oaks are 10 to 14 minutes (14 commuters, 24.6%) for males and 20 to 24 minutes (11 commuters, 28.9%) for females.
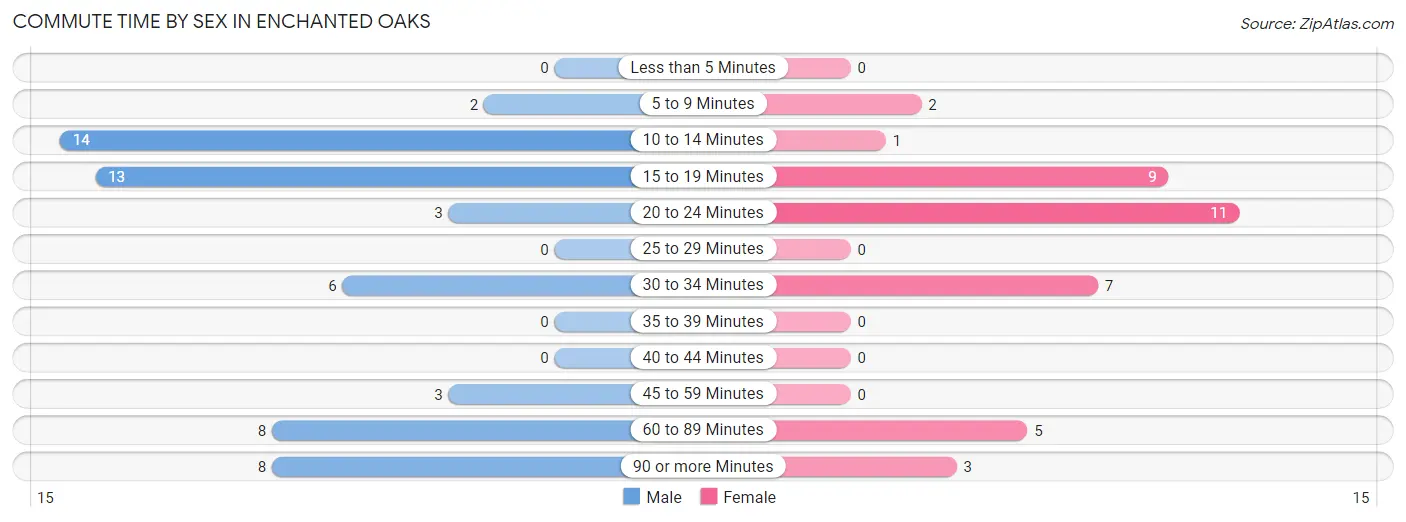
| Commute Time | Male | Female |
| Less than 5 Minutes | 0 (0.0%) | 0 (0.0%) |
| 5 to 9 Minutes | 2 (3.5%) | 2 (5.3%) |
| 10 to 14 Minutes | 14 (24.6%) | 1 (2.6%) |
| 15 to 19 Minutes | 13 (22.8%) | 9 (23.7%) |
| 20 to 24 Minutes | 3 (5.3%) | 11 (28.9%) |
| 25 to 29 Minutes | 0 (0.0%) | 0 (0.0%) |
| 30 to 34 Minutes | 6 (10.5%) | 7 (18.4%) |
| 35 to 39 Minutes | 0 (0.0%) | 0 (0.0%) |
| 40 to 44 Minutes | 0 (0.0%) | 0 (0.0%) |
| 45 to 59 Minutes | 3 (5.3%) | 0 (0.0%) |
| 60 to 89 Minutes | 8 (14.0%) | 5 (13.2%) |
| 90 or more Minutes | 8 (14.0%) | 3 (7.9%) |
Time of Departure to Work by Sex in Enchanted Oaks
The most frequent times of departure to work in Enchanted Oaks are 9:00 AM to 9:59 AM (20, 35.1%) for males and 8:00 AM to 8:29 AM (13, 34.2%) for females.
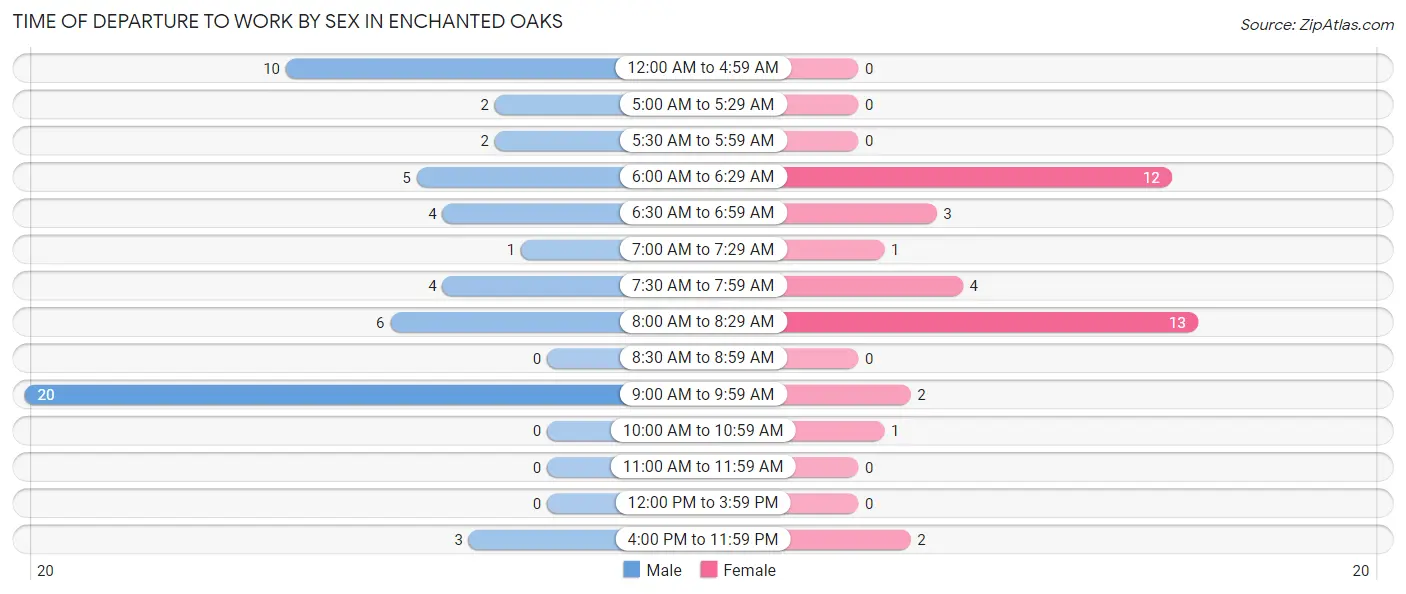
| Time of Departure | Male | Female |
| 12:00 AM to 4:59 AM | 10 (17.5%) | 0 (0.0%) |
| 5:00 AM to 5:29 AM | 2 (3.5%) | 0 (0.0%) |
| 5:30 AM to 5:59 AM | 2 (3.5%) | 0 (0.0%) |
| 6:00 AM to 6:29 AM | 5 (8.8%) | 12 (31.6%) |
| 6:30 AM to 6:59 AM | 4 (7.0%) | 3 (7.9%) |
| 7:00 AM to 7:29 AM | 1 (1.8%) | 1 (2.6%) |
| 7:30 AM to 7:59 AM | 4 (7.0%) | 4 (10.5%) |
| 8:00 AM to 8:29 AM | 6 (10.5%) | 13 (34.2%) |
| 8:30 AM to 8:59 AM | 0 (0.0%) | 0 (0.0%) |
| 9:00 AM to 9:59 AM | 20 (35.1%) | 2 (5.3%) |
| 10:00 AM to 10:59 AM | 0 (0.0%) | 1 (2.6%) |
| 11:00 AM to 11:59 AM | 0 (0.0%) | 0 (0.0%) |
| 12:00 PM to 3:59 PM | 0 (0.0%) | 0 (0.0%) |
| 4:00 PM to 11:59 PM | 3 (5.3%) | 2 (5.3%) |
| Total | 57 (100.0%) | 38 (100.0%) |
Housing Occupancy in Enchanted Oaks
Occupancy by Ownership in Enchanted Oaks
Of the total 121 dwellings in Enchanted Oaks, owner-occupied units account for 111 (91.7%), while renter-occupied units make up 10 (8.3%).
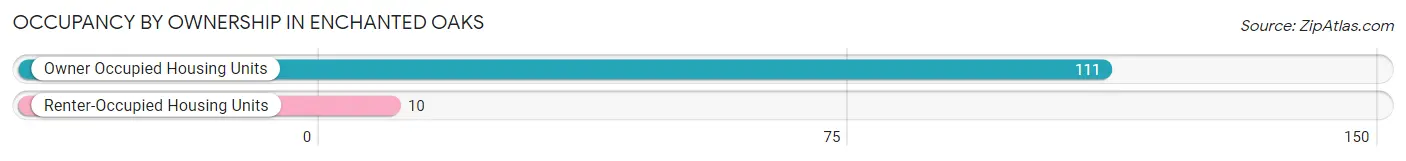
| Occupancy | # Housing Units | % Housing Units |
| Owner Occupied Housing Units | 111 | 91.7% |
| Renter-Occupied Housing Units | 10 | 8.3% |
| Total Occupied Housing Units | 121 | 100.0% |
Occupancy by Household Size in Enchanted Oaks
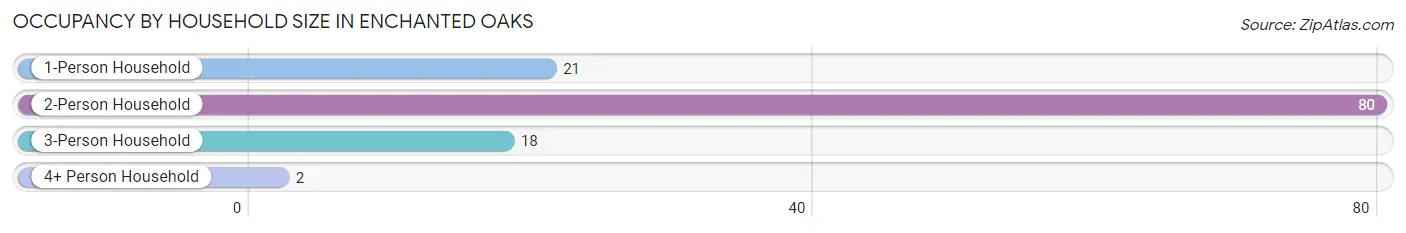
| Household Size | # Housing Units | % Housing Units |
| 1-Person Household | 21 | 17.4% |
| 2-Person Household | 80 | 66.1% |
| 3-Person Household | 18 | 14.9% |
| 4+ Person Household | 2 | 1.7% |
| Total Housing Units | 121 | 100.0% |
Occupancy by Ownership by Household Size in Enchanted Oaks
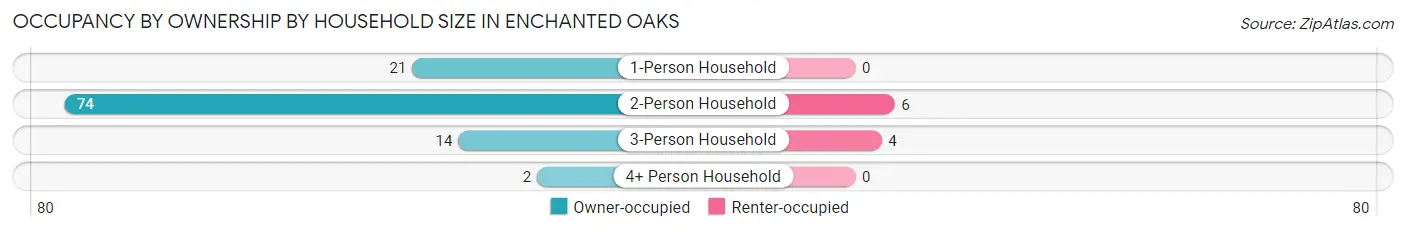
| Household Size | Owner-occupied | Renter-occupied |
| 1-Person Household | 21 (100.0%) | 0 (0.0%) |
| 2-Person Household | 74 (92.5%) | 6 (7.5%) |
| 3-Person Household | 14 (77.8%) | 4 (22.2%) |
| 4+ Person Household | 2 (100.0%) | 0 (0.0%) |
| Total Housing Units | 111 (91.7%) | 10 (8.3%) |
Occupancy by Educational Attainment in Enchanted Oaks
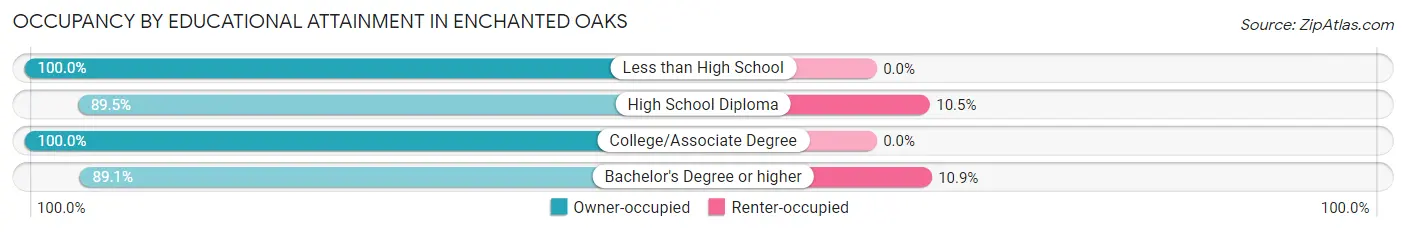
| Household Size | Owner-occupied | Renter-occupied |
| Less than High School | 3 (100.0%) | 0 (0.0%) |
| High School Diploma | 34 (89.5%) | 4 (10.5%) |
| College/Associate Degree | 25 (100.0%) | 0 (0.0%) |
| Bachelor's Degree or higher | 49 (89.1%) | 6 (10.9%) |
Occupancy by Age of Householder in Enchanted Oaks
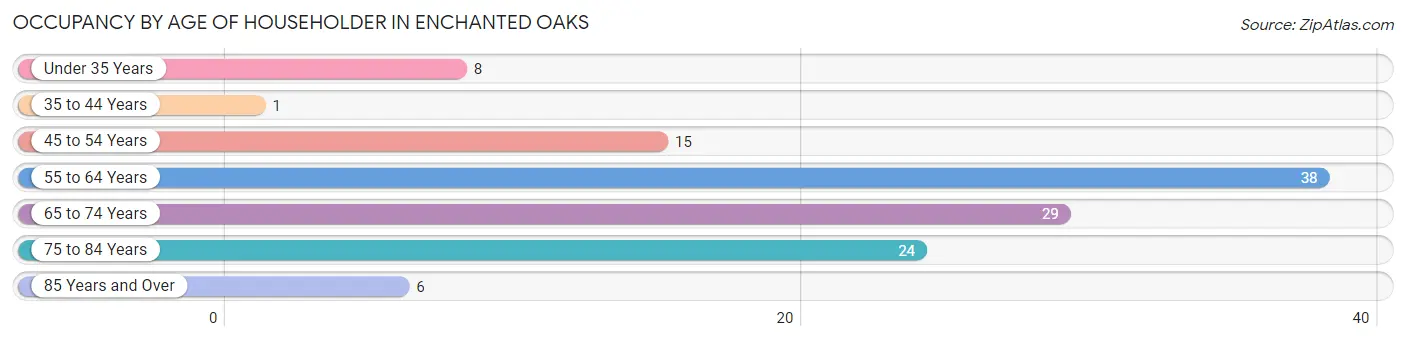
| Age Bracket | # Households | % Households |
| Under 35 Years | 8 | 6.6% |
| 35 to 44 Years | 1 | 0.8% |
| 45 to 54 Years | 15 | 12.4% |
| 55 to 64 Years | 38 | 31.4% |
| 65 to 74 Years | 29 | 24.0% |
| 75 to 84 Years | 24 | 19.8% |
| 85 Years and Over | 6 | 5.0% |
| Total | 121 | 100.0% |
Housing Finances in Enchanted Oaks
Median Income by Occupancy in Enchanted Oaks
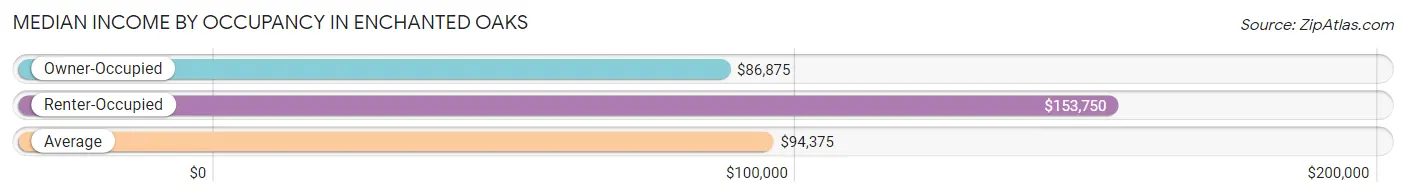
| Occupancy Type | # Households | Median Income |
| Owner-Occupied | 111 (91.7%) | $86,875 |
| Renter-Occupied | 10 (8.3%) | $153,750 |
| Average | 121 (100.0%) | $94,375 |
Occupancy by Householder Income Bracket in Enchanted Oaks
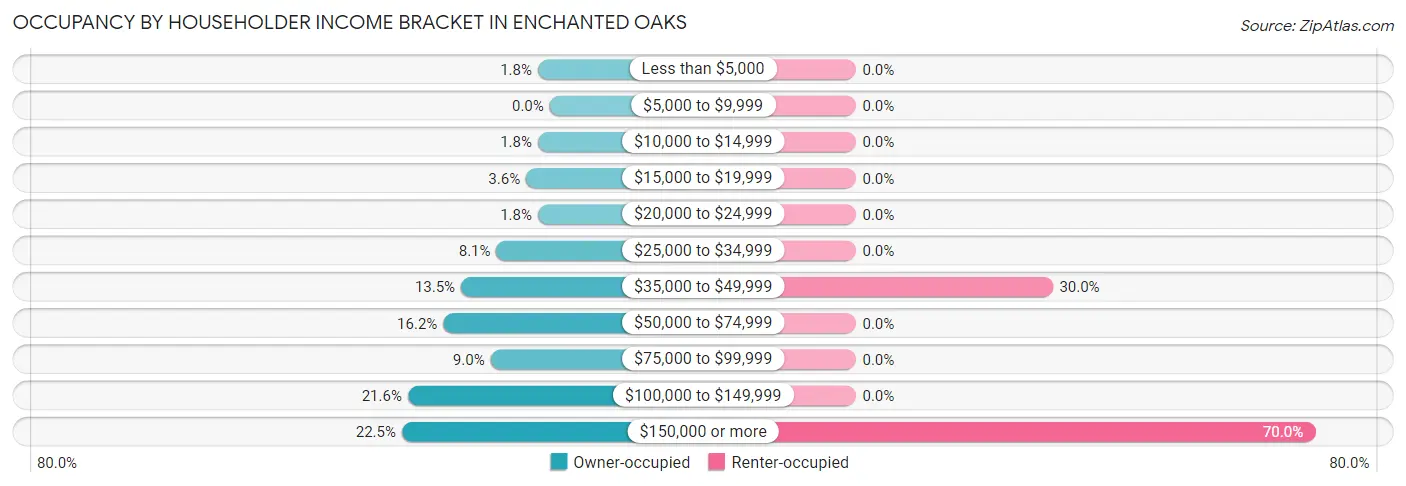
| Income Bracket | Owner-occupied | Renter-occupied |
| Less than $5,000 | 2 (1.8%) | 0 (0.0%) |
| $5,000 to $9,999 | 0 (0.0%) | 0 (0.0%) |
| $10,000 to $14,999 | 2 (1.8%) | 0 (0.0%) |
| $15,000 to $19,999 | 4 (3.6%) | 0 (0.0%) |
| $20,000 to $24,999 | 2 (1.8%) | 0 (0.0%) |
| $25,000 to $34,999 | 9 (8.1%) | 0 (0.0%) |
| $35,000 to $49,999 | 15 (13.5%) | 3 (30.0%) |
| $50,000 to $74,999 | 18 (16.2%) | 0 (0.0%) |
| $75,000 to $99,999 | 10 (9.0%) | 0 (0.0%) |
| $100,000 to $149,999 | 24 (21.6%) | 0 (0.0%) |
| $150,000 or more | 25 (22.5%) | 7 (70.0%) |
| Total | 111 (100.0%) | 10 (100.0%) |
Monthly Housing Cost Tiers in Enchanted Oaks
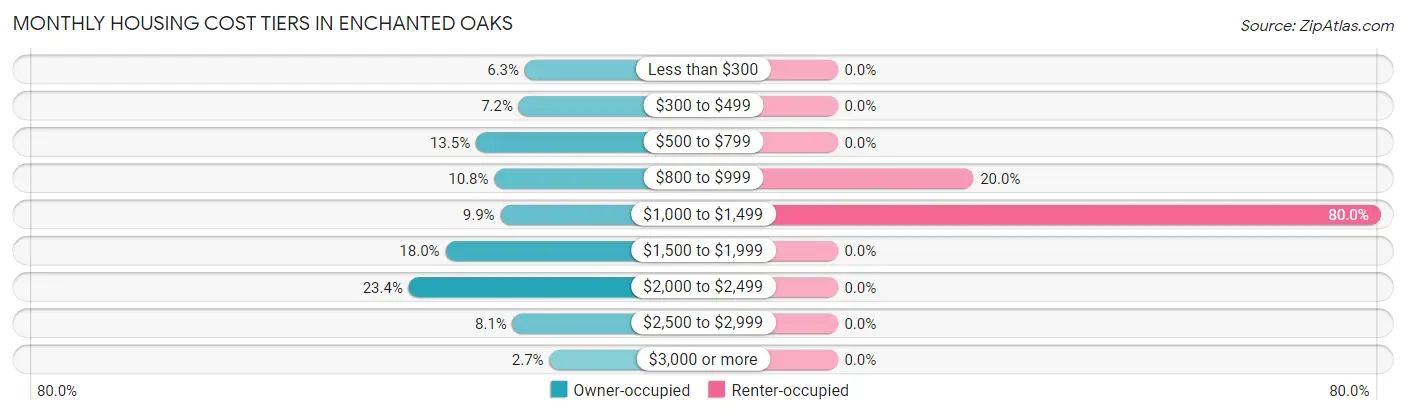
| Monthly Cost | Owner-occupied | Renter-occupied |
| Less than $300 | 7 (6.3%) | 0 (0.0%) |
| $300 to $499 | 8 (7.2%) | 0 (0.0%) |
| $500 to $799 | 15 (13.5%) | 0 (0.0%) |
| $800 to $999 | 12 (10.8%) | 2 (20.0%) |
| $1,000 to $1,499 | 11 (9.9%) | 8 (80.0%) |
| $1,500 to $1,999 | 20 (18.0%) | 0 (0.0%) |
| $2,000 to $2,499 | 26 (23.4%) | 0 (0.0%) |
| $2,500 to $2,999 | 9 (8.1%) | 0 (0.0%) |
| $3,000 or more | 3 (2.7%) | 0 (0.0%) |
| Total | 111 (100.0%) | 10 (100.0%) |
Physical Housing Characteristics in Enchanted Oaks
Housing Structures in Enchanted Oaks
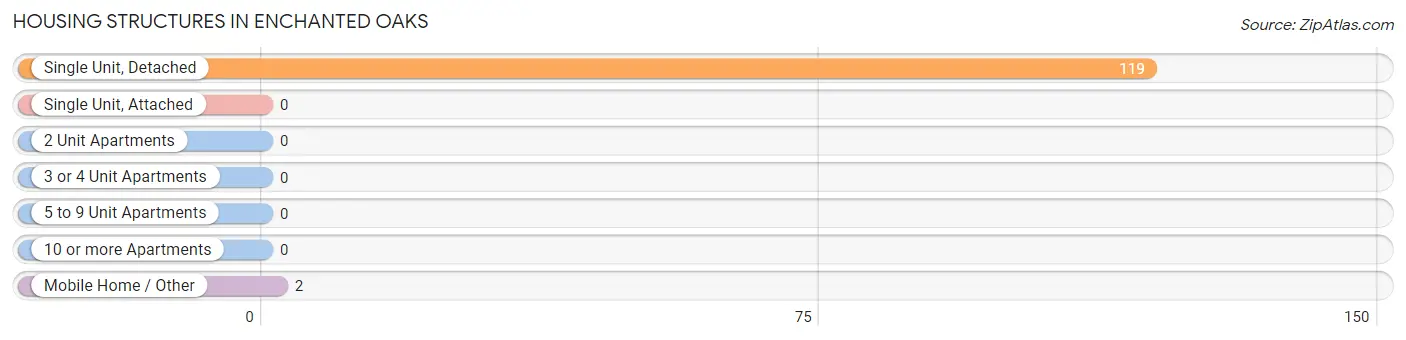
| Structure Type | # Housing Units | % Housing Units |
| Single Unit, Detached | 119 | 98.4% |
| Single Unit, Attached | 0 | 0.0% |
| 2 Unit Apartments | 0 | 0.0% |
| 3 or 4 Unit Apartments | 0 | 0.0% |
| 5 to 9 Unit Apartments | 0 | 0.0% |
| 10 or more Apartments | 0 | 0.0% |
| Mobile Home / Other | 2 | 1.7% |
| Total | 121 | 100.0% |
Housing Structures by Occupancy in Enchanted Oaks
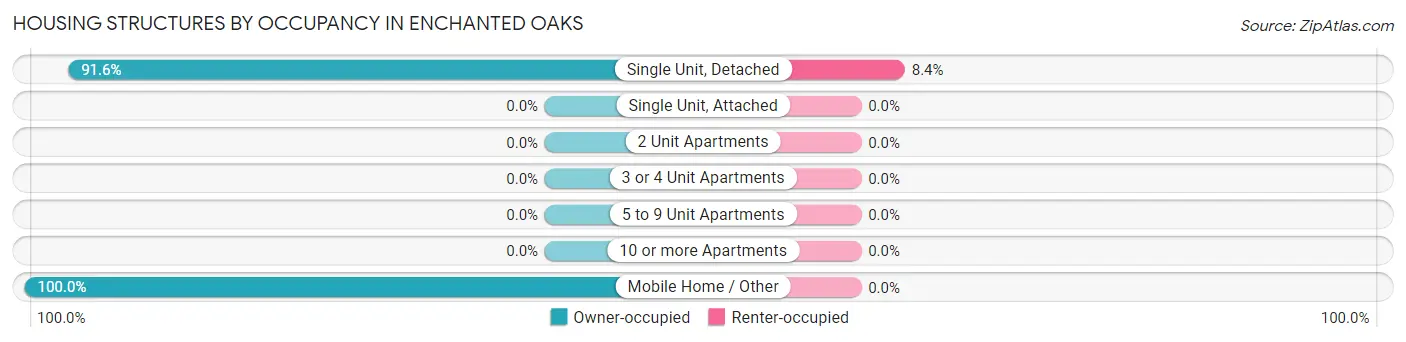
| Structure Type | Owner-occupied | Renter-occupied |
| Single Unit, Detached | 109 (91.6%) | 10 (8.4%) |
| Single Unit, Attached | 0 (0.0%) | 0 (0.0%) |
| 2 Unit Apartments | 0 (0.0%) | 0 (0.0%) |
| 3 or 4 Unit Apartments | 0 (0.0%) | 0 (0.0%) |
| 5 to 9 Unit Apartments | 0 (0.0%) | 0 (0.0%) |
| 10 or more Apartments | 0 (0.0%) | 0 (0.0%) |
| Mobile Home / Other | 2 (100.0%) | 0 (0.0%) |
| Total | 111 (91.7%) | 10 (8.3%) |
Housing Structures by Number of Rooms in Enchanted Oaks
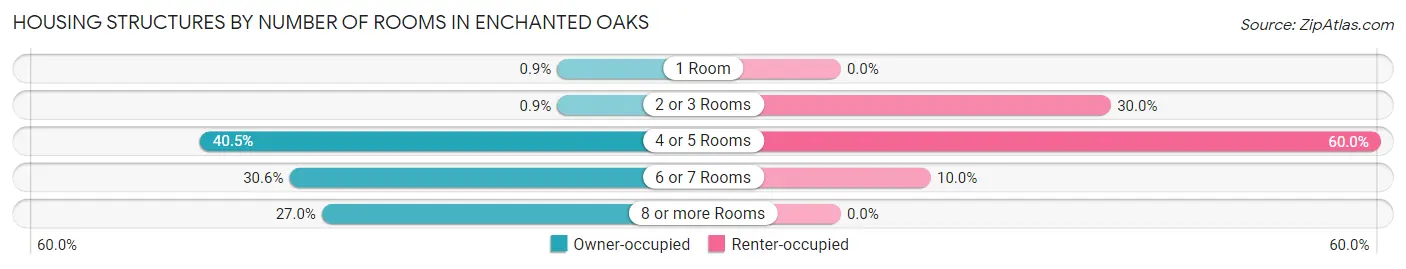
| Number of Rooms | Owner-occupied | Renter-occupied |
| 1 Room | 1 (0.9%) | 0 (0.0%) |
| 2 or 3 Rooms | 1 (0.9%) | 3 (30.0%) |
| 4 or 5 Rooms | 45 (40.5%) | 6 (60.0%) |
| 6 or 7 Rooms | 34 (30.6%) | 1 (10.0%) |
| 8 or more Rooms | 30 (27.0%) | 0 (0.0%) |
| Total | 111 (100.0%) | 10 (100.0%) |
Housing Structure by Heating Type in Enchanted Oaks
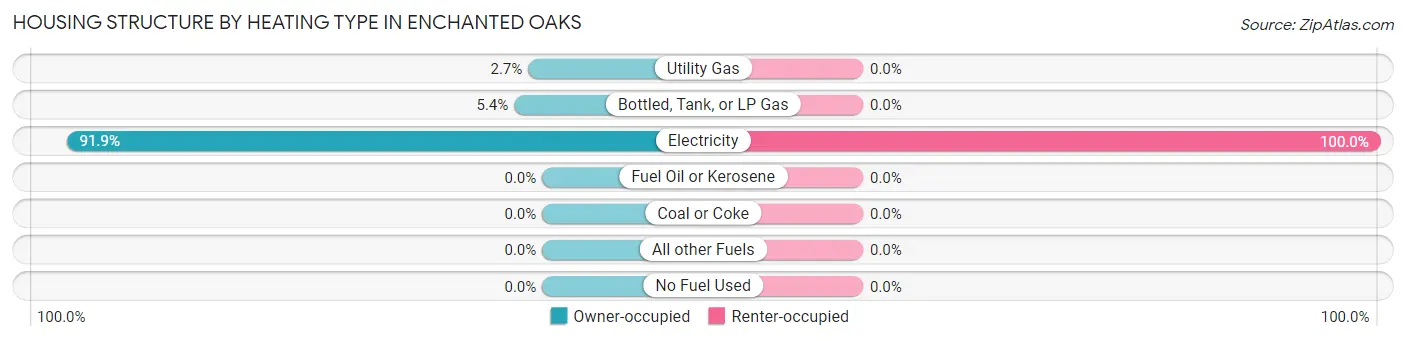
| Heating Type | Owner-occupied | Renter-occupied |
| Utility Gas | 3 (2.7%) | 0 (0.0%) |
| Bottled, Tank, or LP Gas | 6 (5.4%) | 0 (0.0%) |
| Electricity | 102 (91.9%) | 10 (100.0%) |
| Fuel Oil or Kerosene | 0 (0.0%) | 0 (0.0%) |
| Coal or Coke | 0 (0.0%) | 0 (0.0%) |
| All other Fuels | 0 (0.0%) | 0 (0.0%) |
| No Fuel Used | 0 (0.0%) | 0 (0.0%) |
| Total | 111 (100.0%) | 10 (100.0%) |
Household Vehicle Usage in Enchanted Oaks
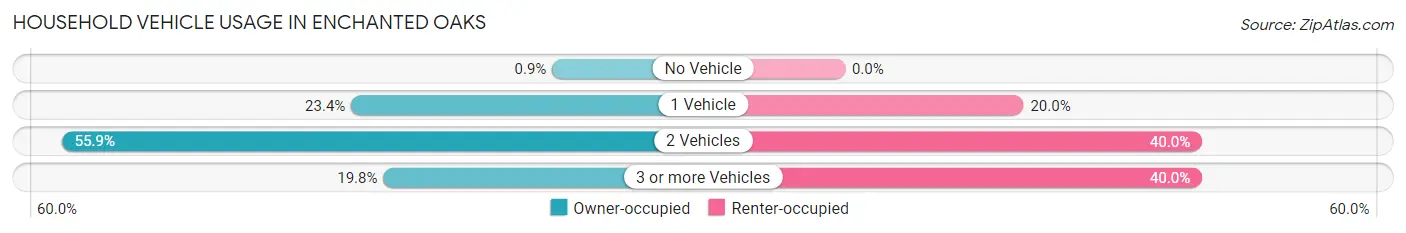
| Vehicles per Household | Owner-occupied | Renter-occupied |
| No Vehicle | 1 (0.9%) | 0 (0.0%) |
| 1 Vehicle | 26 (23.4%) | 2 (20.0%) |
| 2 Vehicles | 62 (55.9%) | 4 (40.0%) |
| 3 or more Vehicles | 22 (19.8%) | 4 (40.0%) |
| Total | 111 (100.0%) | 10 (100.0%) |
Real Estate & Mortgages in Enchanted Oaks
Real Estate and Mortgage Overview in Enchanted Oaks
| Characteristic | Without Mortgage | With Mortgage |
| Housing Units | 45 | 66 |
| Median Property Value | $268,800 | $328,600 |
| Median Household Income | $66,250 | $19 |
| Monthly Housing Costs | $642 | $3 |
| Real Estate Taxes | $2,542 | $0 |
Property Value by Mortgage Status in Enchanted Oaks
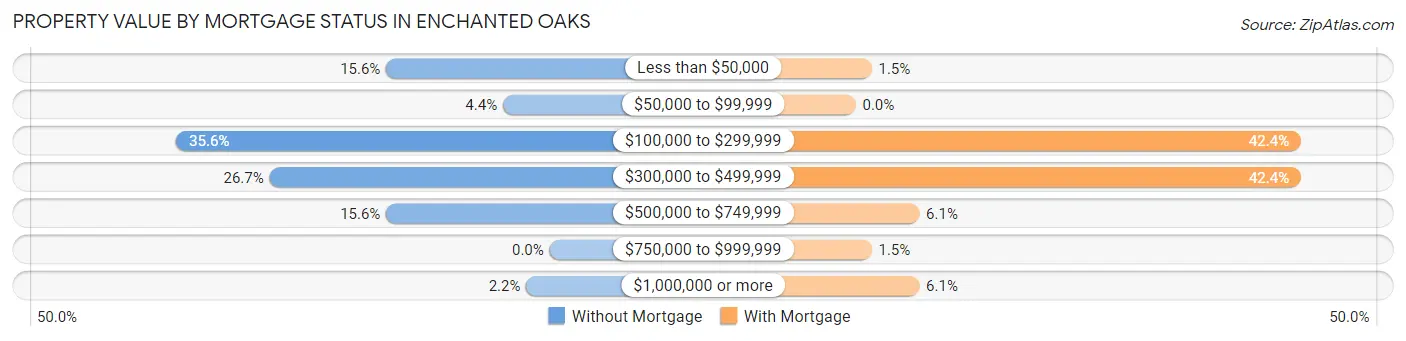
| Property Value | Without Mortgage | With Mortgage |
| Less than $50,000 | 7 (15.6%) | 1 (1.5%) |
| $50,000 to $99,999 | 2 (4.4%) | 0 (0.0%) |
| $100,000 to $299,999 | 16 (35.6%) | 28 (42.4%) |
| $300,000 to $499,999 | 12 (26.7%) | 28 (42.4%) |
| $500,000 to $749,999 | 7 (15.6%) | 4 (6.1%) |
| $750,000 to $999,999 | 0 (0.0%) | 1 (1.5%) |
| $1,000,000 or more | 1 (2.2%) | 4 (6.1%) |
| Total | 45 (100.0%) | 66 (100.0%) |
Household Income by Mortgage Status in Enchanted Oaks
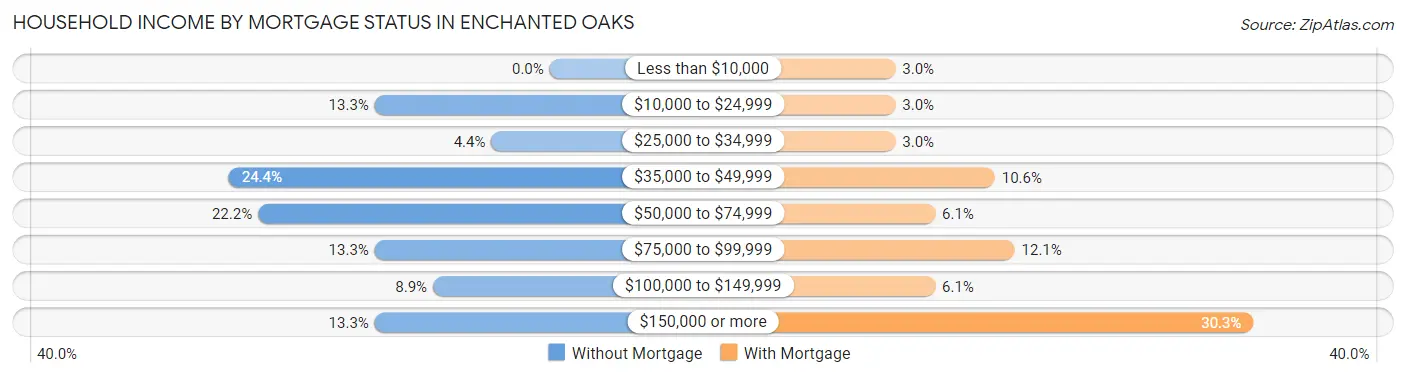
| Household Income | Without Mortgage | With Mortgage |
| Less than $10,000 | 0 (0.0%) | 2 (3.0%) |
| $10,000 to $24,999 | 6 (13.3%) | 2 (3.0%) |
| $25,000 to $34,999 | 2 (4.4%) | 2 (3.0%) |
| $35,000 to $49,999 | 11 (24.4%) | 7 (10.6%) |
| $50,000 to $74,999 | 10 (22.2%) | 4 (6.1%) |
| $75,000 to $99,999 | 6 (13.3%) | 8 (12.1%) |
| $100,000 to $149,999 | 4 (8.9%) | 4 (6.1%) |
| $150,000 or more | 6 (13.3%) | 20 (30.3%) |
| Total | 45 (100.0%) | 66 (100.0%) |
Property Value to Household Income Ratio in Enchanted Oaks
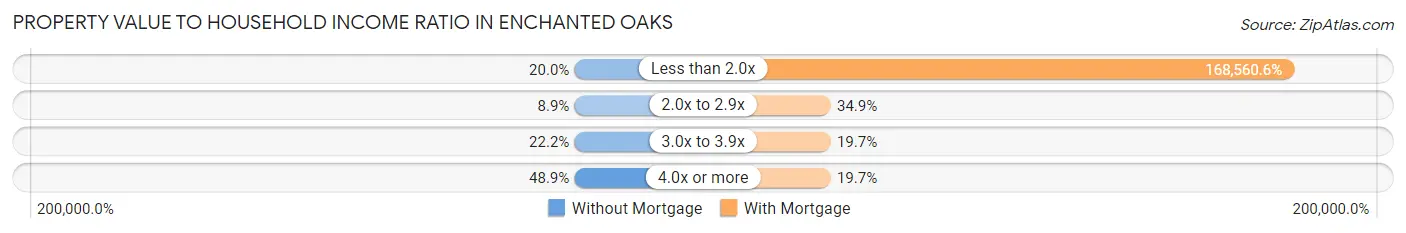
| Value-to-Income Ratio | Without Mortgage | With Mortgage |
| Less than 2.0x | 9 (20.0%) | 111,250 (168,560.6%) |
| 2.0x to 2.9x | 4 (8.9%) | 23 (34.8%) |
| 3.0x to 3.9x | 10 (22.2%) | 13 (19.7%) |
| 4.0x or more | 22 (48.9%) | 13 (19.7%) |
| Total | 45 (100.0%) | 66 (100.0%) |
Real Estate Taxes by Mortgage Status in Enchanted Oaks
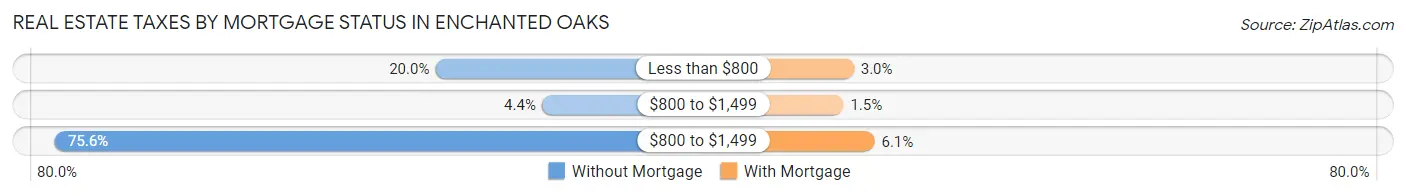
| Property Taxes | Without Mortgage | With Mortgage |
| Less than $800 | 9 (20.0%) | 2 (3.0%) |
| $800 to $1,499 | 2 (4.4%) | 1 (1.5%) |
| $800 to $1,499 | 34 (75.6%) | 4 (6.1%) |
| Total | 45 (100.0%) | 66 (100.0%) |
Health & Disability in Enchanted Oaks
Health Insurance Coverage by Age in Enchanted Oaks
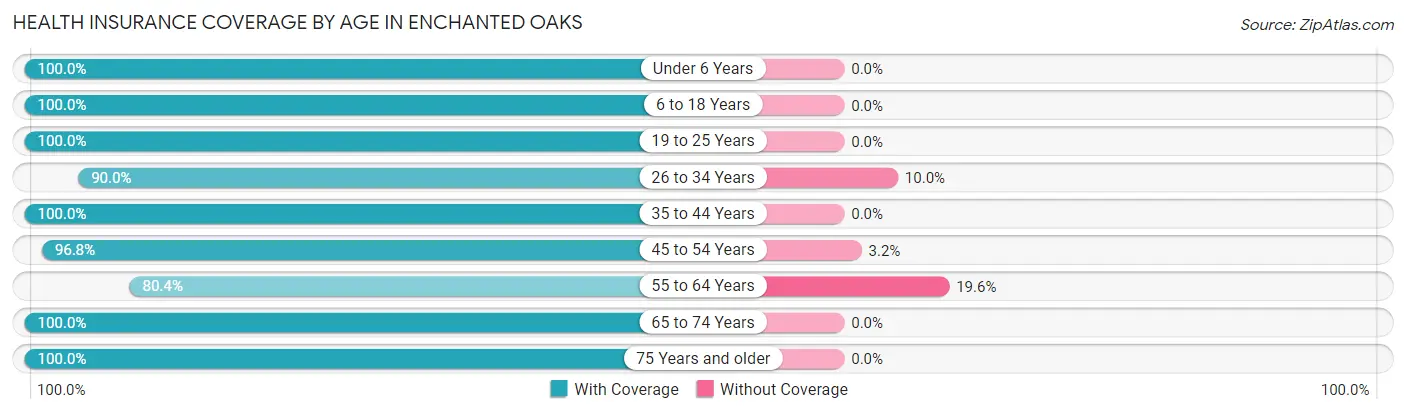
| Age Bracket | With Coverage | Without Coverage |
| Under 6 Years | 3 (100.0%) | 0 (0.0%) |
| 6 to 18 Years | 10 (100.0%) | 0 (0.0%) |
| 19 to 25 Years | 5 (100.0%) | 0 (0.0%) |
| 26 to 34 Years | 18 (90.0%) | 2 (10.0%) |
| 35 to 44 Years | 1 (100.0%) | 0 (0.0%) |
| 45 to 54 Years | 30 (96.8%) | 1 (3.2%) |
| 55 to 64 Years | 74 (80.4%) | 18 (19.6%) |
| 65 to 74 Years | 48 (100.0%) | 0 (0.0%) |
| 75 Years and older | 42 (100.0%) | 0 (0.0%) |
| Total | 231 (91.7%) | 21 (8.3%) |
Health Insurance Coverage by Citizenship Status in Enchanted Oaks
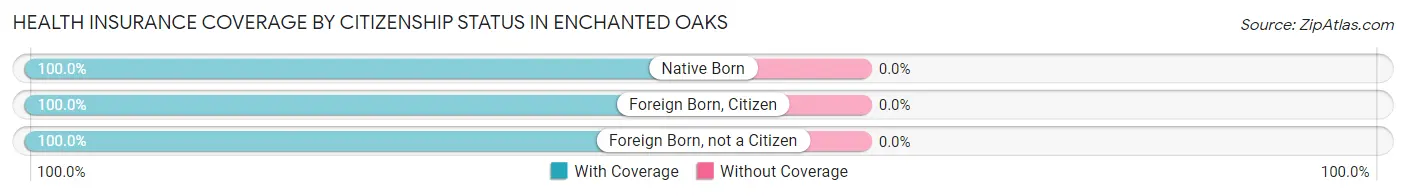
| Citizenship Status | With Coverage | Without Coverage |
| Native Born | 3 (100.0%) | 0 (0.0%) |
| Foreign Born, Citizen | 10 (100.0%) | 0 (0.0%) |
| Foreign Born, not a Citizen | 5 (100.0%) | 0 (0.0%) |
Health Insurance Coverage by Household Income in Enchanted Oaks
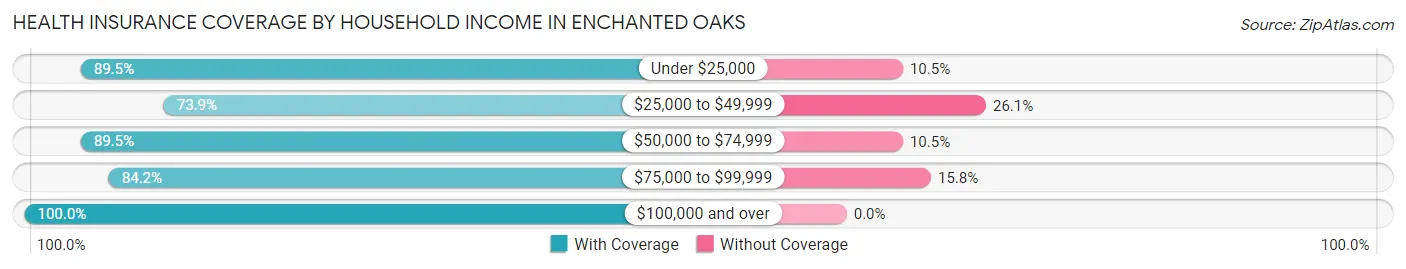
| Household Income | With Coverage | Without Coverage |
| Under $25,000 | 17 (89.5%) | 2 (10.5%) |
| $25,000 to $49,999 | 34 (73.9%) | 12 (26.1%) |
| $50,000 to $74,999 | 34 (89.5%) | 4 (10.5%) |
| $75,000 to $99,999 | 16 (84.2%) | 3 (15.8%) |
| $100,000 and over | 130 (100.0%) | 0 (0.0%) |
Public vs Private Health Insurance Coverage by Age in Enchanted Oaks
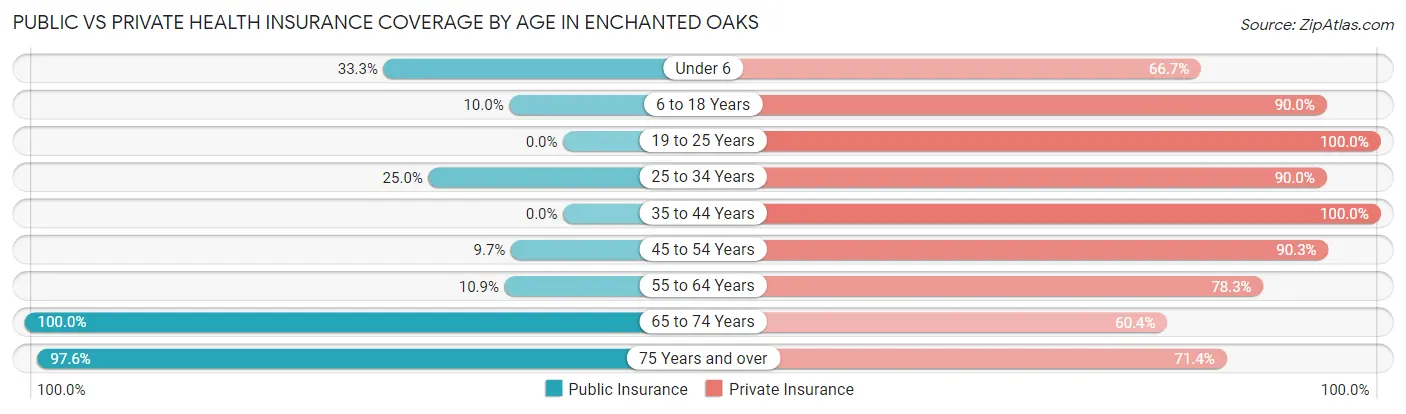
| Age Bracket | Public Insurance | Private Insurance |
| Under 6 | 1 (33.3%) | 2 (66.7%) |
| 6 to 18 Years | 1 (10.0%) | 9 (90.0%) |
| 19 to 25 Years | 0 (0.0%) | 5 (100.0%) |
| 25 to 34 Years | 5 (25.0%) | 18 (90.0%) |
| 35 to 44 Years | 0 (0.0%) | 1 (100.0%) |
| 45 to 54 Years | 3 (9.7%) | 28 (90.3%) |
| 55 to 64 Years | 10 (10.9%) | 72 (78.3%) |
| 65 to 74 Years | 48 (100.0%) | 29 (60.4%) |
| 75 Years and over | 41 (97.6%) | 30 (71.4%) |
| Total | 109 (43.2%) | 194 (77.0%) |
Disability Status by Sex by Age in Enchanted Oaks
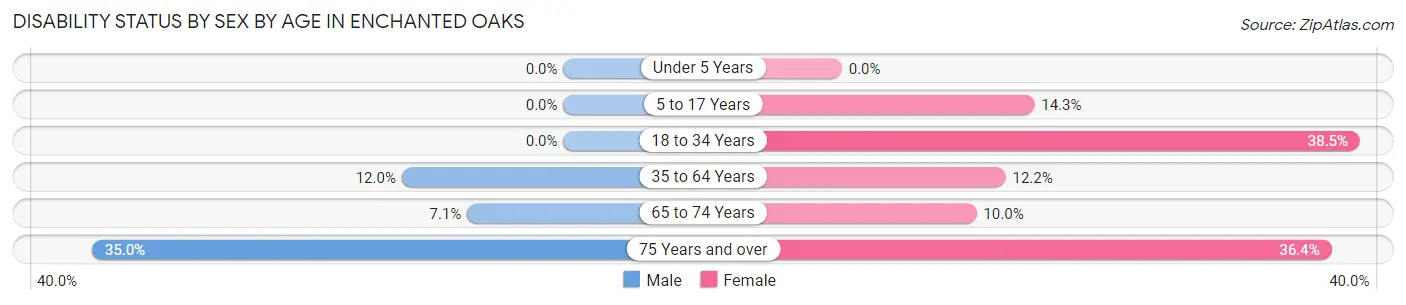
| Age Bracket | Male | Female |
| Under 5 Years | 0 (0.0%) | 0 (0.0%) |
| 5 to 17 Years | 0 (0.0%) | 1 (14.3%) |
| 18 to 34 Years | 0 (0.0%) | 5 (38.5%) |
| 35 to 64 Years | 6 (12.0%) | 9 (12.2%) |
| 65 to 74 Years | 2 (7.1%) | 2 (10.0%) |
| 75 Years and over | 7 (35.0%) | 8 (36.4%) |
Disability Class by Sex by Age in Enchanted Oaks
Disability Class: Hearing Difficulty
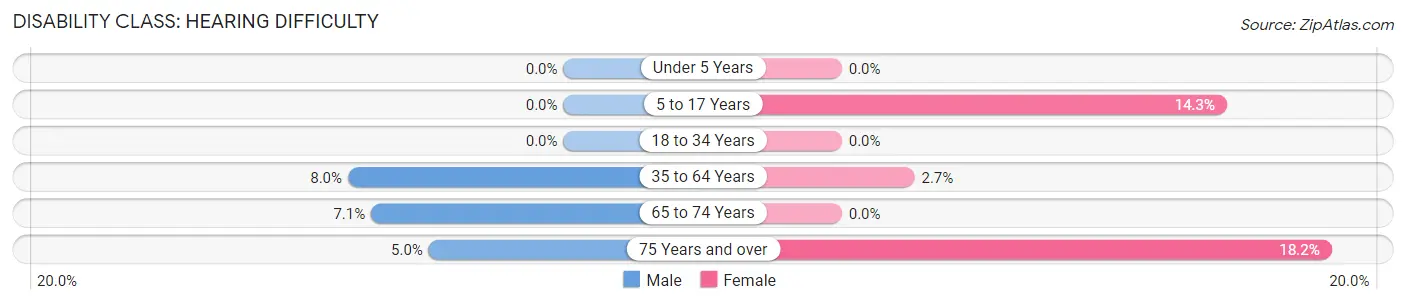
| Age Bracket | Male | Female |
| Under 5 Years | 0 (0.0%) | 0 (0.0%) |
| 5 to 17 Years | 0 (0.0%) | 1 (14.3%) |
| 18 to 34 Years | 0 (0.0%) | 0 (0.0%) |
| 35 to 64 Years | 4 (8.0%) | 2 (2.7%) |
| 65 to 74 Years | 2 (7.1%) | 0 (0.0%) |
| 75 Years and over | 1 (5.0%) | 4 (18.2%) |
Disability Class: Vision Difficulty
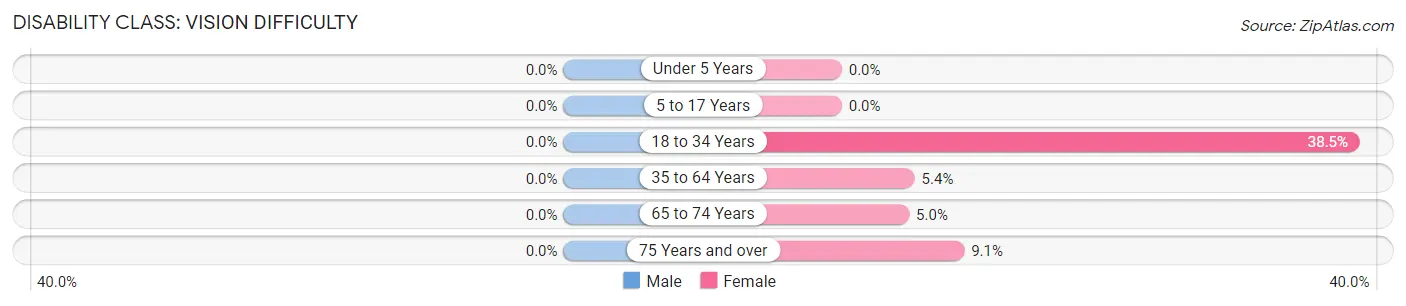
| Age Bracket | Male | Female |
| Under 5 Years | 0 (0.0%) | 0 (0.0%) |
| 5 to 17 Years | 0 (0.0%) | 0 (0.0%) |
| 18 to 34 Years | 0 (0.0%) | 5 (38.5%) |
| 35 to 64 Years | 0 (0.0%) | 4 (5.4%) |
| 65 to 74 Years | 0 (0.0%) | 1 (5.0%) |
| 75 Years and over | 0 (0.0%) | 2 (9.1%) |
Disability Class: Cognitive Difficulty
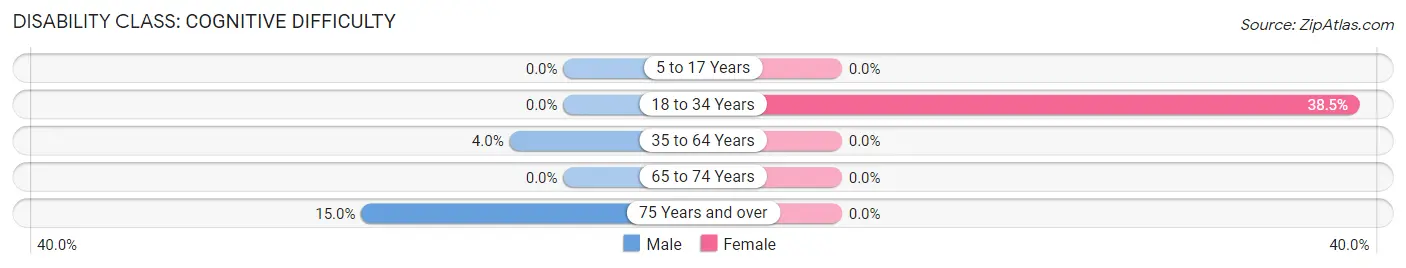
| Age Bracket | Male | Female |
| 5 to 17 Years | 0 (0.0%) | 0 (0.0%) |
| 18 to 34 Years | 0 (0.0%) | 5 (38.5%) |
| 35 to 64 Years | 2 (4.0%) | 0 (0.0%) |
| 65 to 74 Years | 0 (0.0%) | 0 (0.0%) |
| 75 Years and over | 3 (15.0%) | 0 (0.0%) |
Disability Class: Ambulatory Difficulty
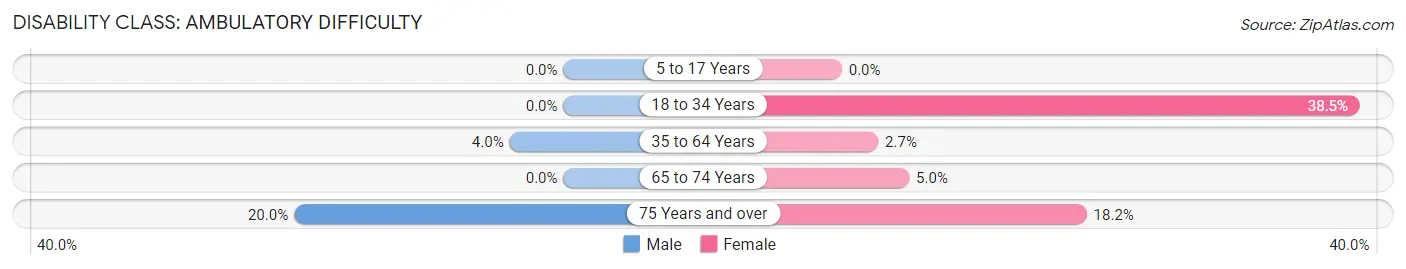
| Age Bracket | Male | Female |
| 5 to 17 Years | 0 (0.0%) | 0 (0.0%) |
| 18 to 34 Years | 0 (0.0%) | 5 (38.5%) |
| 35 to 64 Years | 2 (4.0%) | 2 (2.7%) |
| 65 to 74 Years | 0 (0.0%) | 1 (5.0%) |
| 75 Years and over | 4 (20.0%) | 4 (18.2%) |
Disability Class: Self-Care Difficulty
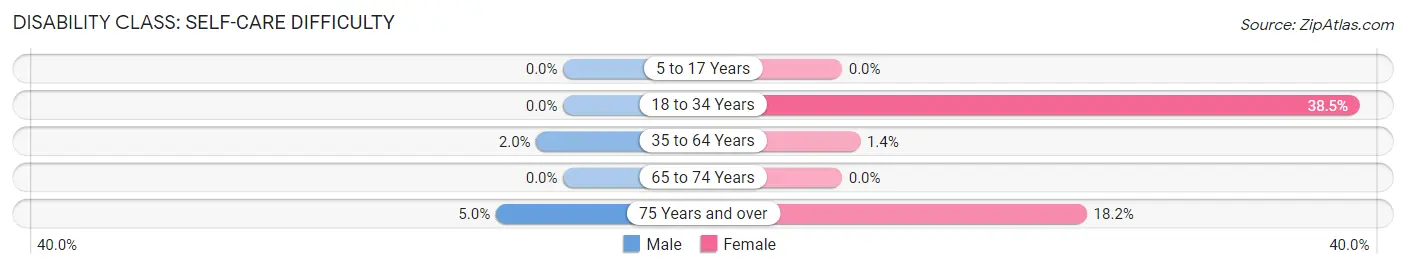
| Age Bracket | Male | Female |
| 5 to 17 Years | 0 (0.0%) | 0 (0.0%) |
| 18 to 34 Years | 0 (0.0%) | 5 (38.5%) |
| 35 to 64 Years | 1 (2.0%) | 1 (1.3%) |
| 65 to 74 Years | 0 (0.0%) | 0 (0.0%) |
| 75 Years and over | 1 (5.0%) | 4 (18.2%) |
Technology Access in Enchanted Oaks
Computing Device Access in Enchanted Oaks
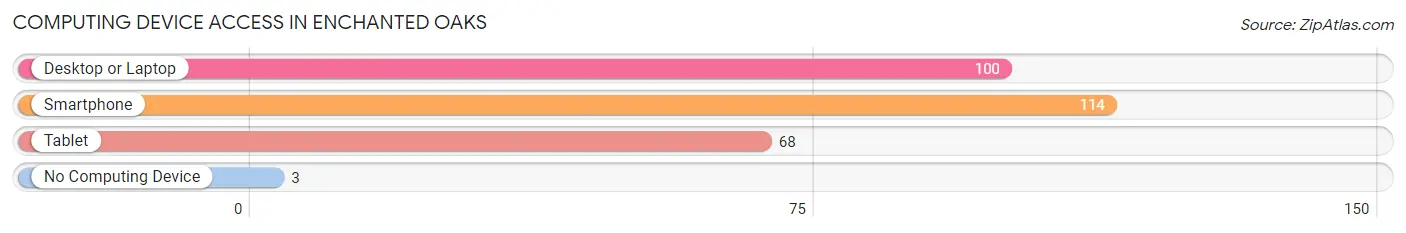
| Device Type | # Households | % Households |
| Desktop or Laptop | 100 | 82.6% |
| Smartphone | 114 | 94.2% |
| Tablet | 68 | 56.2% |
| No Computing Device | 3 | 2.5% |
| Total | 121 | 100.0% |
Internet Access in Enchanted Oaks
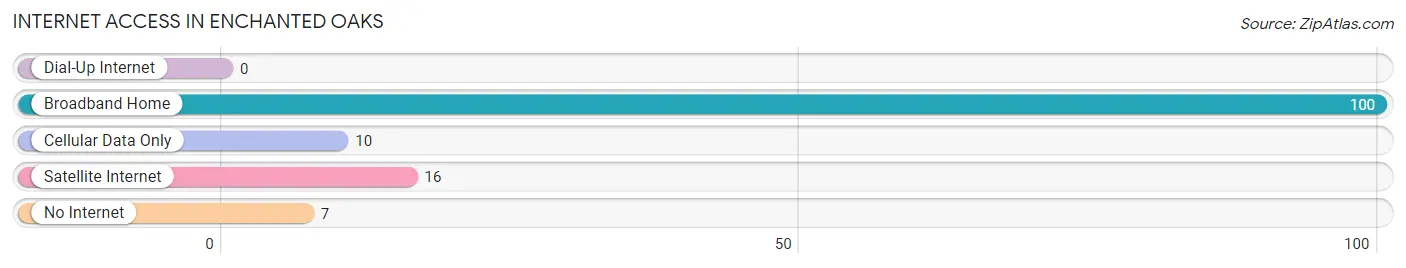
| Internet Type | # Households | % Households |
| Dial-Up Internet | 0 | 0.0% |
| Broadband Home | 100 | 82.6% |
| Cellular Data Only | 10 | 8.3% |
| Satellite Internet | 16 | 13.2% |
| No Internet | 7 | 5.8% |
| Total | 121 | 100.0% |
Enchanted Oaks Summary
Enchanted Oaks is a small town located in Henderson County, Texas. It is situated about 20 miles east of Tyler and about 100 miles east of Dallas. The town was founded in the late 1800s and has a population of about 1,000 people.
History
Enchanted Oaks was founded in the late 1800s by a group of settlers who were looking for a place to settle down and start a new life. The town was originally called “Oak Grove” and was later changed to “Enchanted Oaks” in the early 1900s. The name was chosen to reflect the beauty of the area, which was filled with oak trees.
The town was a small farming community for many years, but in the 1950s, the population began to grow as more people moved to the area. The town was incorporated in 1959 and has since grown to its current population of about 1,000 people.
Geography
Enchanted Oaks is located in Henderson County, Texas. It is situated about 20 miles east of Tyler and about 100 miles east of Dallas. The town is located in the Piney Woods region of East Texas and is surrounded by rolling hills and forests. The town is situated on the banks of the Neches River, which provides a scenic backdrop for the town.
The climate in Enchanted Oaks is generally mild and humid. Summers are hot and humid, with temperatures reaching into the 90s. Winters are mild, with temperatures rarely dropping below freezing.
Economy
Enchanted Oaks is a small town with a limited economy. The town is primarily supported by small businesses, such as restaurants, stores, and service providers. The town also has a few manufacturing plants, which provide jobs for the local population.
The town is also home to a few tourist attractions, such as the Enchanted Oaks State Park and the Enchanted Oaks Wildlife Refuge. These attractions bring in visitors from all over the state and provide a boost to the local economy.
Demographics
As of the 2010 census, the population of Enchanted Oaks was 1,000 people. The racial makeup of the town was 95.2% White, 0.7% African American, 0.7% Native American, 0.7% Asian, 0.7% from other races, and 2.1% from two or more races. Hispanic or Latino of any race were 2.7% of the population.
The median income for a household in Enchanted Oaks was $37,500, and the median income for a family was $41,250. The per capita income for the town was $17,857. About 11.2% of families and 13.2% of the population were below the poverty line, including 16.7% of those under age 18 and 8.3% of those age 65 or over.
Enchanted Oaks is a small town with a rich history and a unique culture. The town is home to a diverse population and is a great place to live and work. The town is surrounded by beautiful scenery and offers a variety of activities for residents and visitors alike.
Common Questions
What is Per Capita Income in Enchanted Oaks?
Per Capita income in Enchanted Oaks is $60,824.
What is the Median Family Income in Enchanted Oaks?
Median Family Income in Enchanted Oaks is $98,750.
What is the Median Household income in Enchanted Oaks?
Median Household Income in Enchanted Oaks is $94,375.
What is Income or Wage Gap in Enchanted Oaks?
Income or Wage Gap in Enchanted Oaks is 44.7%.
Women in Enchanted Oaks earn 55.3 cents for every dollar earned by a man.
What is Family Income Deficit in Enchanted Oaks?
Family Income Deficit in Enchanted Oaks is $12,100.
Families that are below poverty line in Enchanted Oaks earn $12,100 less on average than the poverty threshold level.
What is Inequality or Gini Index in Enchanted Oaks?
Inequality or Gini Index in Enchanted Oaks is 0.46.
What is the Total Population of Enchanted Oaks?
Total Population of Enchanted Oaks is 252.
What is the Total Male Population of Enchanted Oaks?
Total Male Population of Enchanted Oaks is 114.
What is the Total Female Population of Enchanted Oaks?
Total Female Population of Enchanted Oaks is 138.
What is the Ratio of Males per 100 Females in Enchanted Oaks?
There are 82.61 Males per 100 Females in Enchanted Oaks.
What is the Ratio of Females per 100 Males in Enchanted Oaks?
There are 121.05 Females per 100 Males in Enchanted Oaks.
What is the Median Population Age in Enchanted Oaks?
Median Population Age in Enchanted Oaks is 61.5 Years.
What is the Average Family Size in Enchanted Oaks
Average Family Size in Enchanted Oaks is 2.3 People.
What is the Average Household Size in Enchanted Oaks
Average Household Size in Enchanted Oaks is 2.1 People.
How Large is the Labor Force in Enchanted Oaks?
There are 118 People in the Labor Forcein in Enchanted Oaks.
What is the Percentage of People in the Labor Force in Enchanted Oaks?
48.6% of People are in the Labor Force in Enchanted Oaks.
What is the Unemployment Rate in Enchanted Oaks?
Unemployment Rate in Enchanted Oaks is 1.7%.