The Hills, TX Map & Demographics
The Hills Map
The Hills Overview
$83,315
PER CAPITA INCOME
$182,885
AVG FAMILY INCOME
$152,250
AVG HOUSEHOLD INCOME
60.8%
WAGE / INCOME GAP [ % ]
39.2¢/ $1
WAGE / INCOME GAP [ $ ]
$9,045
FAMILY INCOME DEFICIT
0.41
INEQUALITY / GINI INDEX
2,505
TOTAL POPULATION
1,195
MALE POPULATION
1,310
FEMALE POPULATION
91.22
MALES / 100 FEMALES
109.62
FEMALES / 100 MALES
55.7
MEDIAN AGE
2.5
AVG FAMILY SIZE
2.3
AVG HOUSEHOLD SIZE
1,006
LABOR FORCE [ PEOPLE ]
46.9%
PERCENT IN LABOR FORCE
2.6%
UNEMPLOYMENT RATE
The Hills Area Codes
Income in The Hills
Income Overview in The Hills
Per Capita Income in The Hills is $83,315, while median incomes of families and households are $182,885 and $152,250 respectively.
| Characteristic | Number | Measure |
| Per Capita Income | 2,505 | $83,315 |
| Median Family Income | 902 | $182,885 |
| Mean Family Income | 902 | $210,123 |
| Median Household Income | 1,083 | $152,250 |
| Mean Household Income | 1,083 | $193,362 |
| Income Deficit | 902 | $9,045 |
| Wage / Income Gap (%) | 2,505 | 60.81% |
| Wage / Income Gap ($) | 2,505 | 39.19¢ per $1 |
| Gini / Inequality Index | 2,505 | 0.41 |
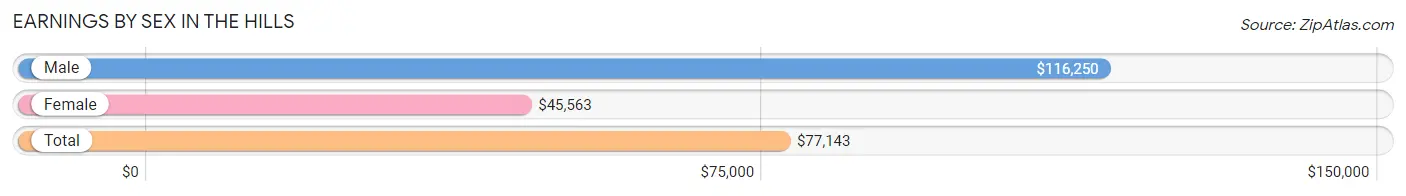
Earnings by Sex in The Hills
Average Earnings in The Hills are $77,143, $116,250 for men and $45,563 for women, a difference of 60.8%.
| Sex | Number | Average Earnings |
| Male | 671 (57.1%) | $116,250 |
| Female | 505 (42.9%) | $45,563 |
| Total | 1,176 (100.0%) | $77,143 |
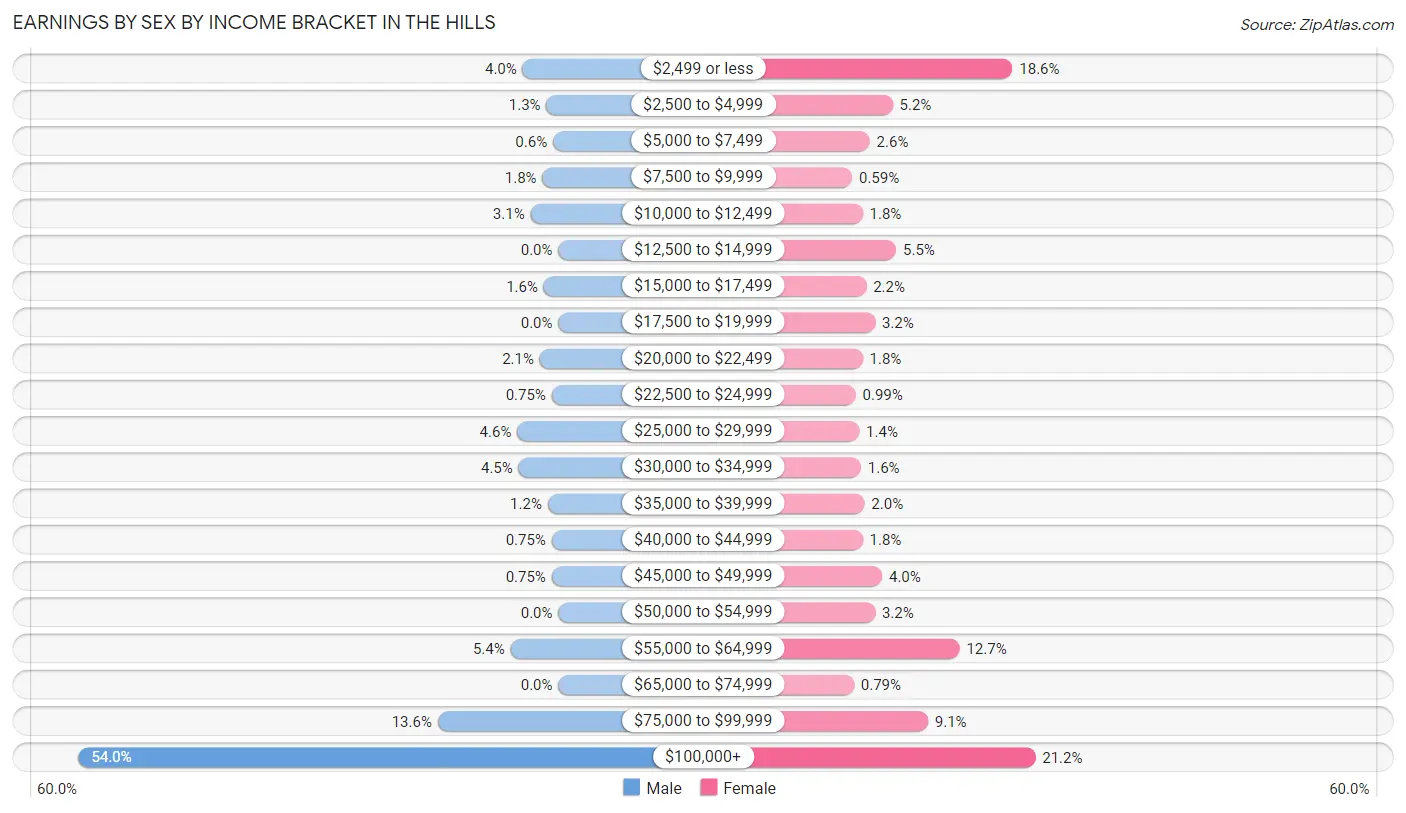
Earnings by Sex by Income Bracket in The Hills
The most common earnings brackets in The Hills are $100,000+ for men (362 | 53.9%) and $100,000+ for women (107 | 21.2%).
| Income | Male | Female |
| $2,499 or less | 27 (4.0%) | 94 (18.6%) |
| $2,500 to $4,999 | 9 (1.3%) | 26 (5.1%) |
| $5,000 to $7,499 | 4 (0.6%) | 13 (2.6%) |
| $7,500 to $9,999 | 12 (1.8%) | 3 (0.6%) |
| $10,000 to $12,499 | 21 (3.1%) | 9 (1.8%) |
| $12,500 to $14,999 | 0 (0.0%) | 28 (5.5%) |
| $15,000 to $17,499 | 11 (1.6%) | 11 (2.2%) |
| $17,500 to $19,999 | 0 (0.0%) | 16 (3.2%) |
| $20,000 to $22,499 | 14 (2.1%) | 9 (1.8%) |
| $22,500 to $24,999 | 5 (0.7%) | 5 (1.0%) |
| $25,000 to $29,999 | 31 (4.6%) | 7 (1.4%) |
| $30,000 to $34,999 | 30 (4.5%) | 8 (1.6%) |
| $35,000 to $39,999 | 8 (1.2%) | 10 (2.0%) |
| $40,000 to $44,999 | 5 (0.7%) | 9 (1.8%) |
| $45,000 to $49,999 | 5 (0.7%) | 20 (4.0%) |
| $50,000 to $54,999 | 0 (0.0%) | 16 (3.2%) |
| $55,000 to $64,999 | 36 (5.4%) | 64 (12.7%) |
| $65,000 to $74,999 | 0 (0.0%) | 4 (0.8%) |
| $75,000 to $99,999 | 91 (13.6%) | 46 (9.1%) |
| $100,000+ | 362 (53.9%) | 107 (21.2%) |
| Total | 671 (100.0%) | 505 (100.0%) |
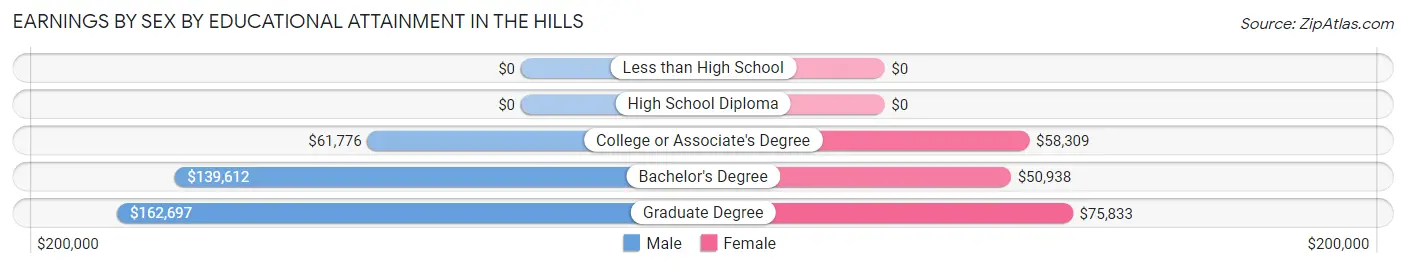
Earnings by Sex by Educational Attainment in The Hills
Average earnings in The Hills are $125,625 for men and $57,619 for women, a difference of 54.1%. Men with an educational attainment of graduate degree enjoy the highest average annual earnings of $162,697, while those with college or associate's degree education earn the least with $61,776. Women with an educational attainment of graduate degree earn the most with the average annual earnings of $75,833, while those with bachelor's degree education have the smallest earnings of $50,938.
| Educational Attainment | Male Income | Female Income |
| Less than High School | - | - |
| High School Diploma | - | - |
| College or Associate's Degree | $61,776 | $58,309 |
| Bachelor's Degree | $139,612 | $50,938 |
| Graduate Degree | $162,697 | $75,833 |
| Total | $125,625 | $57,619 |
Family Income in The Hills
Family Income Brackets in The Hills
According to the The Hills family income data, there are 384 families falling into the $200,000+ income range, which is the most common income bracket and makes up 42.6% of all families.
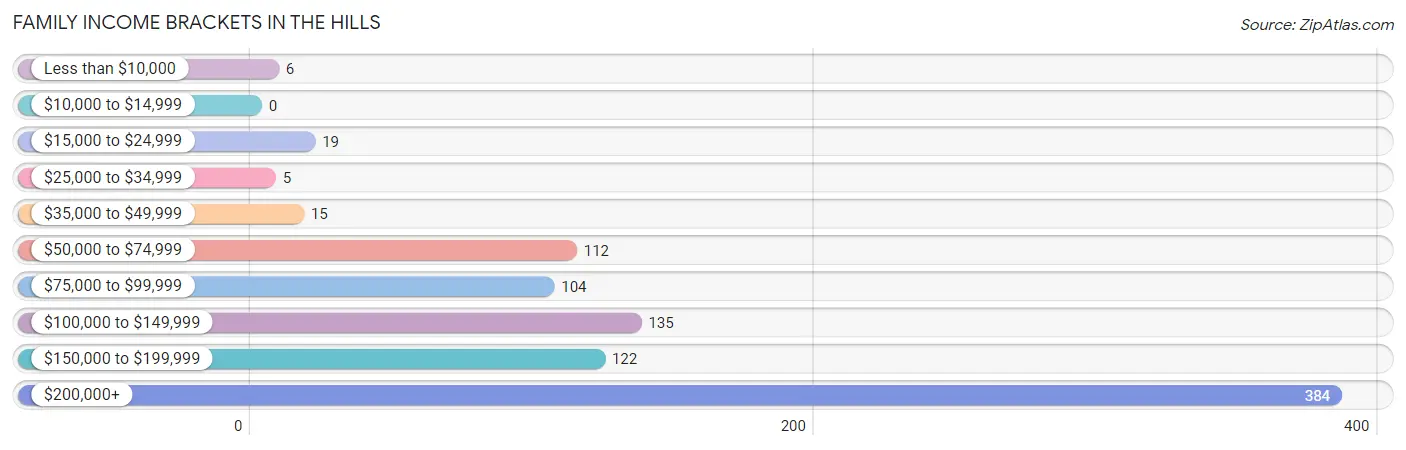
| Income Bracket | # Families | % Families |
| Less than $10,000 | 6 | 0.7% |
| $10,000 to $14,999 | 0 | 0.0% |
| $15,000 to $24,999 | 19 | 2.1% |
| $25,000 to $34,999 | 5 | 0.6% |
| $35,000 to $49,999 | 15 | 1.7% |
| $50,000 to $74,999 | 112 | 12.4% |
| $75,000 to $99,999 | 104 | 11.5% |
| $100,000 to $149,999 | 135 | 15.0% |
| $150,000 to $199,999 | 122 | 13.5% |
| $200,000+ | 384 | 42.6% |
Family Income by Famaliy Size in The Hills
4-person families (76 | 8.4%) account for the highest median family income in The Hills with $250,001 per family, while 2-person families (592 | 65.6%) have the highest median income of $91,553 per family member.
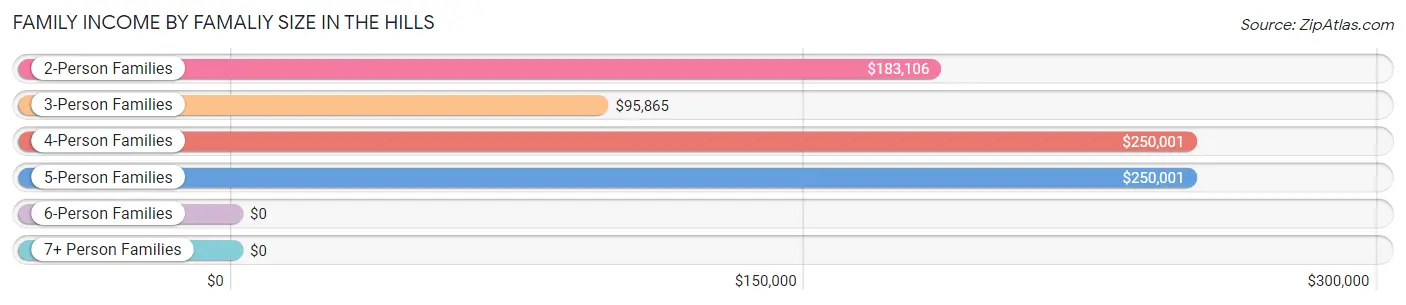
| Income Bracket | # Families | Median Income |
| 2-Person Families | 592 (65.6%) | $183,106 |
| 3-Person Families | 165 (18.3%) | $95,865 |
| 4-Person Families | 76 (8.4%) | $250,001 |
| 5-Person Families | 61 (6.8%) | $250,001 |
| 6-Person Families | 8 (0.9%) | $0 |
| 7+ Person Families | 0 (0.0%) | $0 |
| Total | 902 (100.0%) | $182,885 |
Family Income by Number of Earners in The Hills
The median family income in The Hills is $182,885, with families comprising 3+ earners (28) having the highest median family income of $250,001, while families with 1 earner (237) have the lowest median family income of $124,306, accounting for 3.1% and 26.3% of families, respectively.
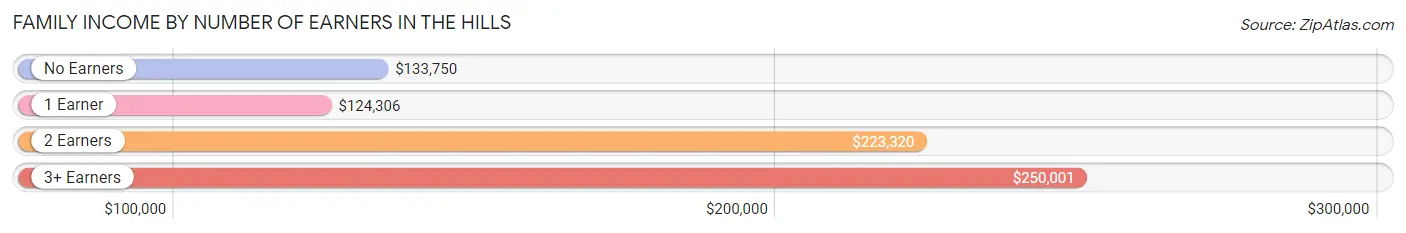
| Number of Earners | # Families | Median Income |
| No Earners | 240 (26.6%) | $133,750 |
| 1 Earner | 237 (26.3%) | $124,306 |
| 2 Earners | 397 (44.0%) | $223,320 |
| 3+ Earners | 28 (3.1%) | $250,001 |
| Total | 902 (100.0%) | $182,885 |
Household Income in The Hills
Household Income Brackets in The Hills
With 414 households falling in the category, the $200,000+ income range is the most frequent in The Hills, accounting for 38.2% of all households.
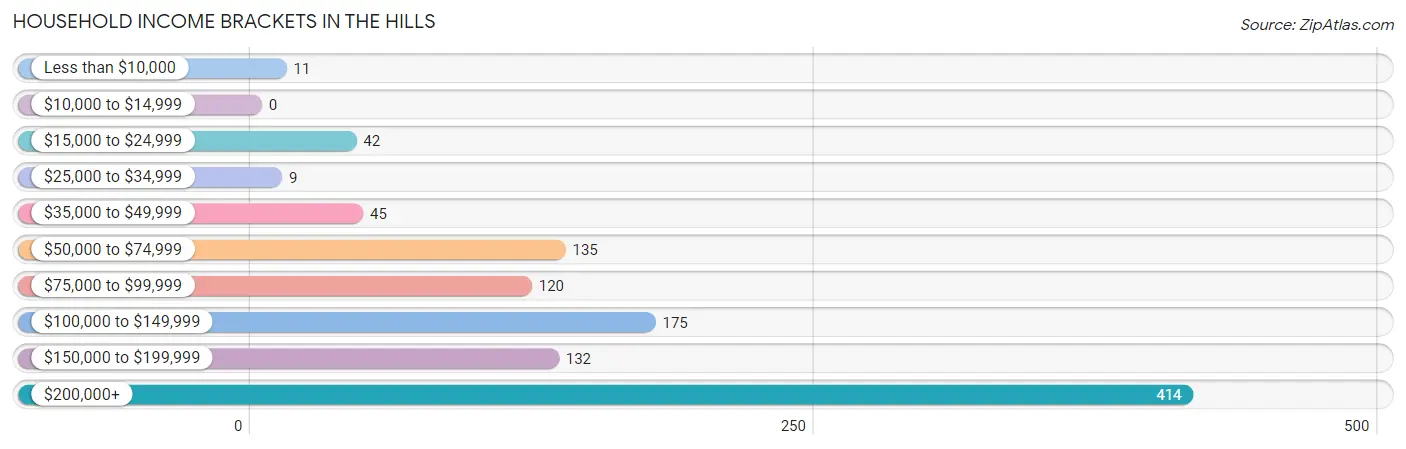
| Income Bracket | # Households | % Households |
| Less than $10,000 | 11 | 1.0% |
| $10,000 to $14,999 | 0 | 0.0% |
| $15,000 to $24,999 | 42 | 3.9% |
| $25,000 to $34,999 | 9 | 0.8% |
| $35,000 to $49,999 | 45 | 4.2% |
| $50,000 to $74,999 | 135 | 12.5% |
| $75,000 to $99,999 | 120 | 11.1% |
| $100,000 to $149,999 | 175 | 16.2% |
| $150,000 to $199,999 | 132 | 12.2% |
| $200,000+ | 414 | 38.2% |
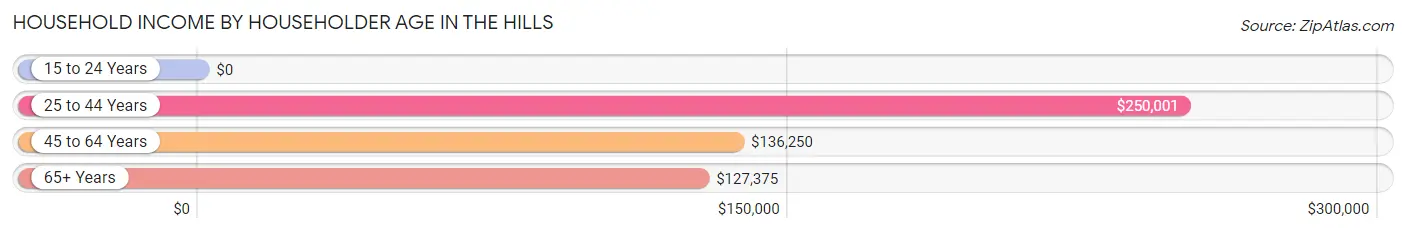
Household Income by Householder Age in The Hills
The median household income in The Hills is $152,250, with the highest median household income of $250,001 found in the 25 to 44 years age bracket for the primary householder. A total of 166 households (15.3%) fall into this category.
| Income Bracket | # Households | Median Income |
| 15 to 24 Years | 0 (0.0%) | $0 |
| 25 to 44 Years | 166 (15.3%) | $250,001 |
| 45 to 64 Years | 464 (42.8%) | $136,250 |
| 65+ Years | 453 (41.8%) | $127,375 |
| Total | 1,083 (100.0%) | $152,250 |
Poverty in The Hills
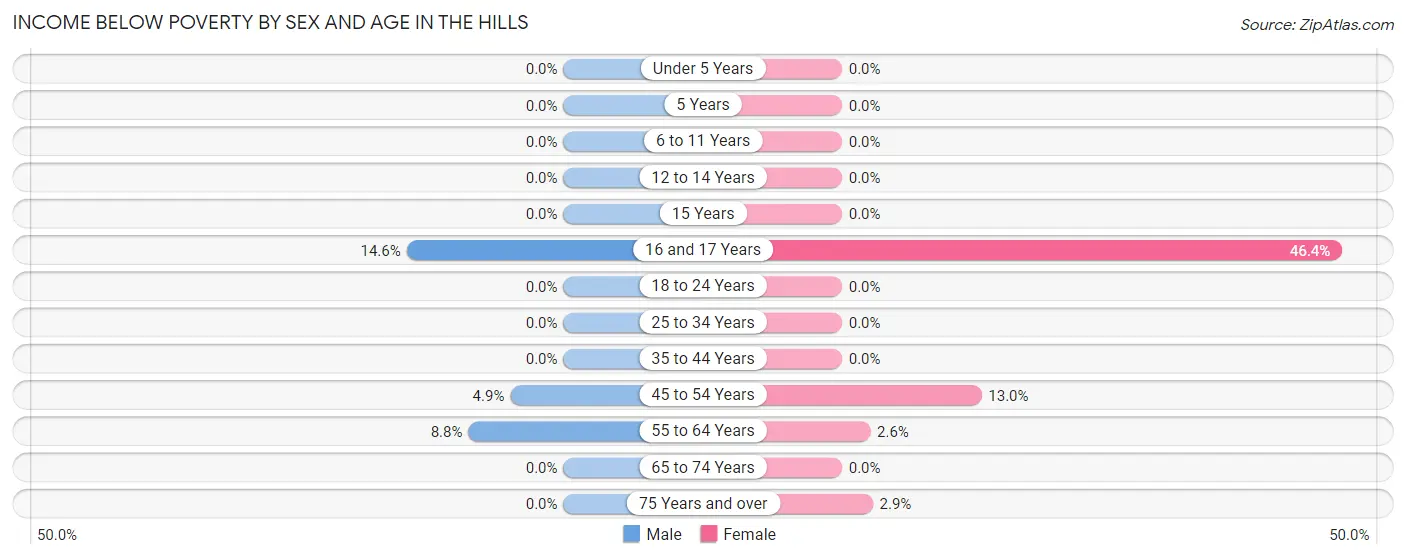
Income Below Poverty by Sex and Age in The Hills
With 2.5% poverty level for males and 3.3% for females among the residents of The Hills, 16 and 17 year old males and 16 and 17 year old females are the most vulnerable to poverty, with 8 males (14.5%) and 13 females (46.4%) in their respective age groups living below the poverty level.
| Age Bracket | Male | Female |
| Under 5 Years | 0 (0.0%) | 0 (0.0%) |
| 5 Years | 0 (0.0%) | 0 (0.0%) |
| 6 to 11 Years | 0 (0.0%) | 0 (0.0%) |
| 12 to 14 Years | 0 (0.0%) | 0 (0.0%) |
| 15 Years | 0 (0.0%) | 0 (0.0%) |
| 16 and 17 Years | 8 (14.5%) | 13 (46.4%) |
| 18 to 24 Years | 0 (0.0%) | 0 (0.0%) |
| 25 to 34 Years | 0 (0.0%) | 0 (0.0%) |
| 35 to 44 Years | 0 (0.0%) | 0 (0.0%) |
| 45 to 54 Years | 7 (4.9%) | 18 (13.0%) |
| 55 to 64 Years | 15 (8.8%) | 7 (2.6%) |
| 65 to 74 Years | 0 (0.0%) | 0 (0.0%) |
| 75 Years and over | 0 (0.0%) | 5 (2.9%) |
| Total | 30 (2.5%) | 43 (3.3%) |
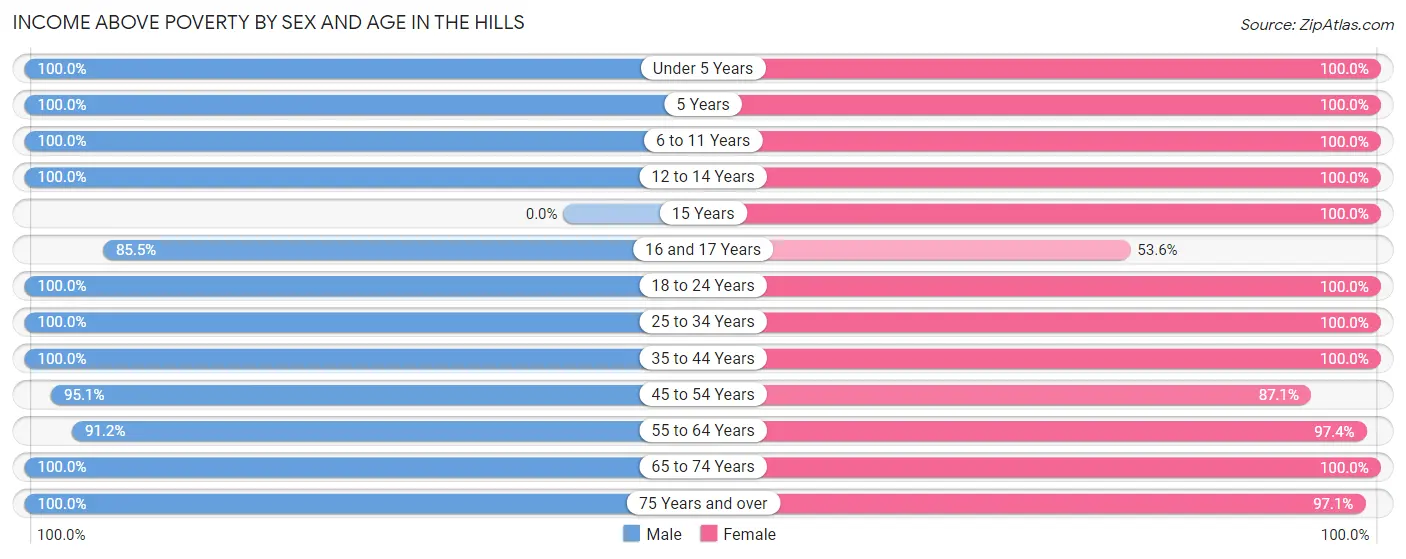
Income Above Poverty by Sex and Age in The Hills
According to the poverty statistics in The Hills, males aged under 5 years and females aged under 5 years are the age groups that are most secure financially, with 100.0% of males and 100.0% of females in these age groups living above the poverty line.
| Age Bracket | Male | Female |
| Under 5 Years | 91 (100.0%) | 13 (100.0%) |
| 5 Years | 10 (100.0%) | 5 (100.0%) |
| 6 to 11 Years | 88 (100.0%) | 98 (100.0%) |
| 12 to 14 Years | 12 (100.0%) | 29 (100.0%) |
| 15 Years | 0 (0.0%) | 9 (100.0%) |
| 16 and 17 Years | 47 (85.5%) | 15 (53.6%) |
| 18 to 24 Years | 6 (100.0%) | 71 (100.0%) |
| 25 to 34 Years | 41 (100.0%) | 113 (100.0%) |
| 35 to 44 Years | 158 (100.0%) | 117 (100.0%) |
| 45 to 54 Years | 135 (95.1%) | 121 (87.1%) |
| 55 to 64 Years | 155 (91.2%) | 259 (97.4%) |
| 65 to 74 Years | 290 (100.0%) | 247 (100.0%) |
| 75 Years and over | 127 (100.0%) | 170 (97.1%) |
| Total | 1,160 (97.5%) | 1,267 (96.7%) |
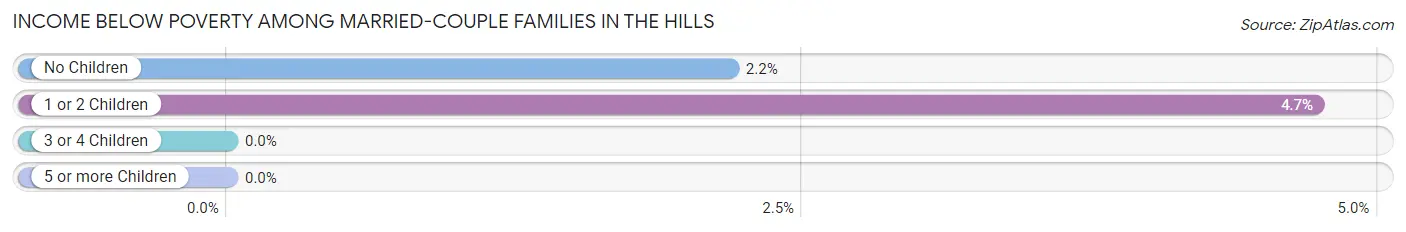
Income Below Poverty Among Married-Couple Families in The Hills
The poverty statistics for married-couple families in The Hills show that 2.5% or 20 of the total 794 families live below the poverty line. Families with 1 or 2 children have the highest poverty rate of 4.7%, comprising of 7 families. On the other hand, families with 3 or 4 children have the lowest poverty rate of 0.0%, which includes 0 families.
| Children | Above Poverty | Below Poverty |
| No Children | 583 (97.8%) | 13 (2.2%) |
| 1 or 2 Children | 141 (95.3%) | 7 (4.7%) |
| 3 or 4 Children | 50 (100.0%) | 0 (0.0%) |
| 5 or more Children | 0 (0.0%) | 0 (0.0%) |
| Total | 774 (97.5%) | 20 (2.5%) |
Income Below Poverty Among Single-Parent Households in The Hills
| Children | Single Father | Single Mother |
| No Children | 0 (0.0%) | 0 (0.0%) |
| 1 or 2 Children | 0 (0.0%) | 0 (0.0%) |
| 3 or 4 Children | 0 (0.0%) | 0 (0.0%) |
| 5 or more Children | 0 (0.0%) | 0 (0.0%) |
| Total | 0 (0.0%) | 0 (0.0%) |
Income Below Poverty Among Married-Couple vs Single-Parent Households in The Hills
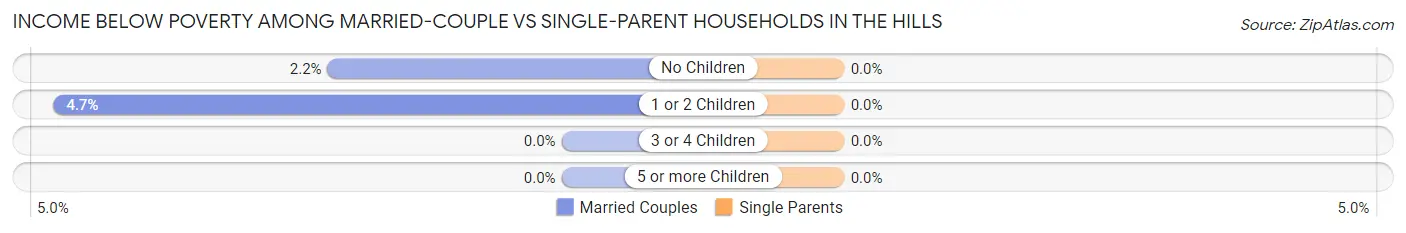
| Children | Married-Couple Families | Single-Parent Households |
| No Children | 13 (2.2%) | 0 (0.0%) |
| 1 or 2 Children | 7 (4.7%) | 0 (0.0%) |
| 3 or 4 Children | 0 (0.0%) | 0 (0.0%) |
| 5 or more Children | 0 (0.0%) | 0 (0.0%) |
| Total | 20 (2.5%) | 0 (0.0%) |
Race in The Hills
The most populous races in The Hills are White / Caucasian (2,116 | 84.5%), Hispanic or Latino (283 | 11.3%), and Two or more Races (261 | 10.4%).
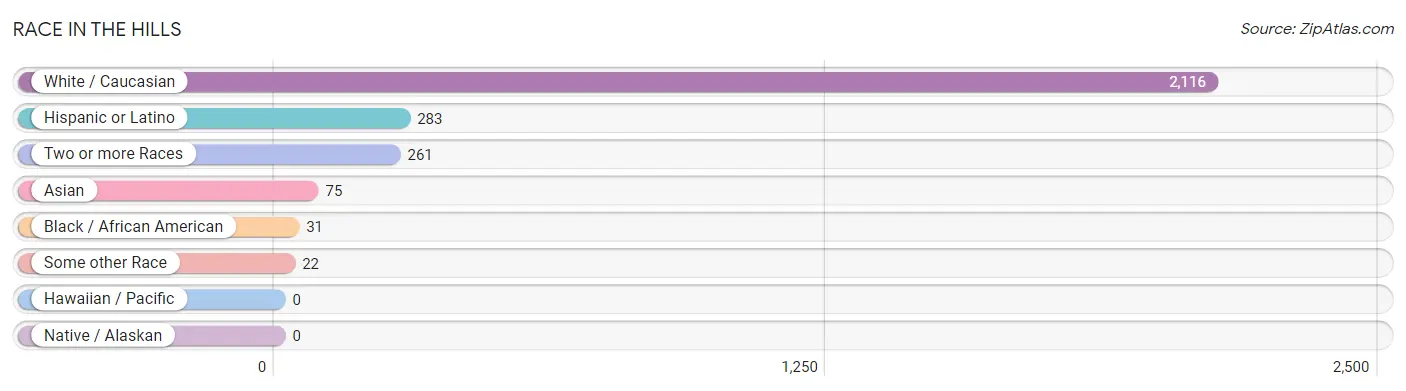
| Race | # Population | % Population |
| Asian | 75 | 3.0% |
| Black / African American | 31 | 1.2% |
| Hawaiian / Pacific | 0 | 0.0% |
| Hispanic or Latino | 283 | 11.3% |
| Native / Alaskan | 0 | 0.0% |
| White / Caucasian | 2,116 | 84.5% |
| Two or more Races | 261 | 10.4% |
| Some other Race | 22 | 0.9% |
| Total | 2,505 | 100.0% |
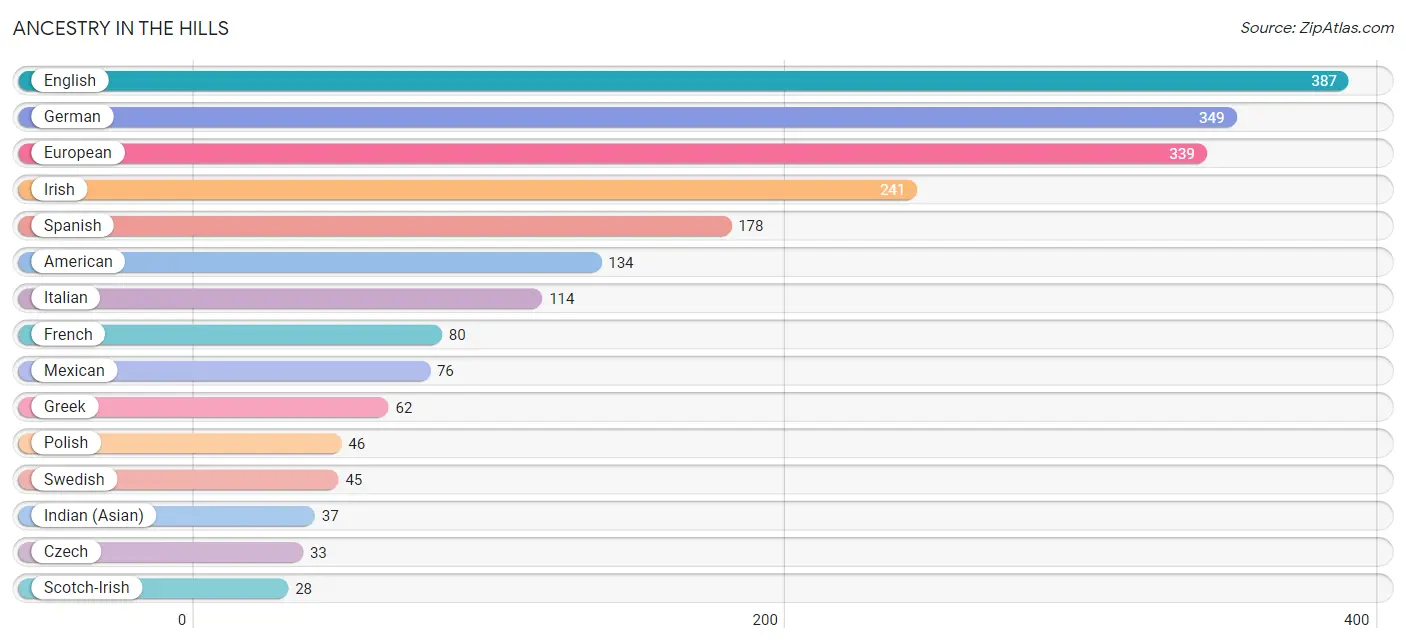
Ancestry in The Hills
The most populous ancestries reported in The Hills are English (387 | 15.4%), German (349 | 13.9%), European (339 | 13.5%), Irish (241 | 9.6%), and Spanish (178 | 7.1%), together accounting for 59.6% of all The Hills residents.
| Ancestry | # Population | % Population |
| American | 134 | 5.3% |
| Arab | 9 | 0.4% |
| Argentinean | 6 | 0.2% |
| Armenian | 6 | 0.2% |
| Austrian | 21 | 0.8% |
| Belgian | 6 | 0.2% |
| British | 26 | 1.0% |
| Burmese | 9 | 0.4% |
| Canadian | 5 | 0.2% |
| Czech | 33 | 1.3% |
| Czechoslovakian | 4 | 0.2% |
| Danish | 5 | 0.2% |
| Dutch | 22 | 0.9% |
| Eastern European | 9 | 0.4% |
| English | 387 | 15.4% |
| European | 339 | 13.5% |
| Finnish | 5 | 0.2% |
| French | 80 | 3.2% |
| French Canadian | 4 | 0.2% |
| German | 349 | 13.9% |
| Greek | 62 | 2.5% |
| Indian (Asian) | 37 | 1.5% |
| Irish | 241 | 9.6% |
| Italian | 114 | 4.5% |
| Korean | 23 | 0.9% |
| Lebanese | 3 | 0.1% |
| Lithuanian | 4 | 0.2% |
| Mexican | 76 | 3.0% |
| Northern European | 13 | 0.5% |
| Norwegian | 24 | 1.0% |
| Osage | 18 | 0.7% |
| Pennsylvania German | 6 | 0.2% |
| Polish | 46 | 1.8% |
| Portuguese | 4 | 0.2% |
| Scotch-Irish | 28 | 1.1% |
| Scottish | 24 | 1.0% |
| Slovak | 6 | 0.2% |
| South American | 6 | 0.2% |
| Spaniard | 23 | 0.9% |
| Spanish | 178 | 7.1% |
| Sri Lankan | 16 | 0.6% |
| Swedish | 45 | 1.8% |
| Swiss | 18 | 0.7% |
| Thai | 19 | 0.8% |
| Ukrainian | 27 | 1.1% |
| Welsh | 24 | 1.0% |
| Yugoslavian | 17 | 0.7% | View All 47 Rows |
Immigrants in The Hills
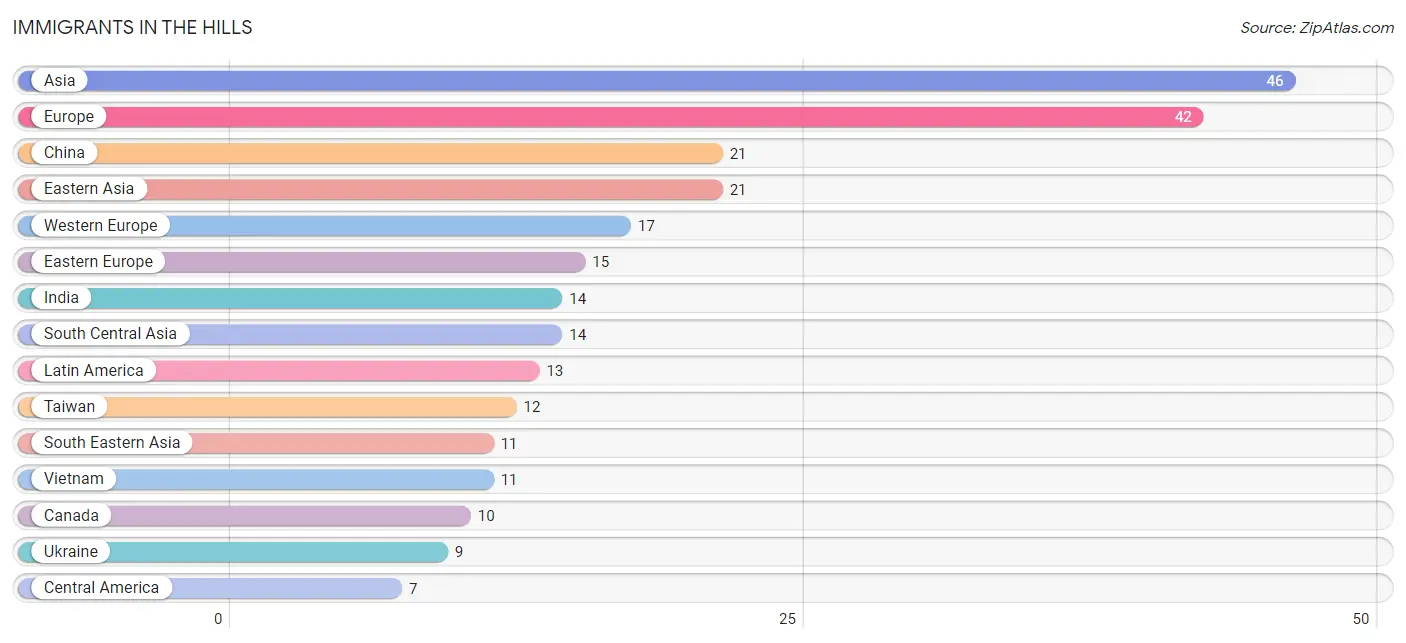
The most numerous immigrant groups reported in The Hills came from Asia (46 | 1.8%), Europe (42 | 1.7%), China (21 | 0.8%), Eastern Asia (21 | 0.8%), and Western Europe (17 | 0.7%), together accounting for 5.9% of all The Hills residents.
| Immigration Origin | # Population | % Population |
| Argentina | 6 | 0.2% |
| Asia | 46 | 1.8% |
| Austria | 6 | 0.2% |
| Canada | 10 | 0.4% |
| Central America | 7 | 0.3% |
| China | 21 | 0.8% |
| Czechoslovakia | 6 | 0.2% |
| Denmark | 5 | 0.2% |
| Eastern Asia | 21 | 0.8% |
| Eastern Europe | 15 | 0.6% |
| Europe | 42 | 1.7% |
| France | 6 | 0.2% |
| Greece | 5 | 0.2% |
| India | 14 | 0.6% |
| Latin America | 13 | 0.5% |
| Mexico | 7 | 0.3% |
| Netherlands | 5 | 0.2% |
| Northern Europe | 5 | 0.2% |
| South America | 6 | 0.2% |
| South Central Asia | 14 | 0.6% |
| South Eastern Asia | 11 | 0.4% |
| Southern Europe | 5 | 0.2% |
| Taiwan | 12 | 0.5% |
| Ukraine | 9 | 0.4% |
| Vietnam | 11 | 0.4% |
| Western Europe | 17 | 0.7% | View All 26 Rows |
Sex and Age in The Hills
Sex and Age in The Hills
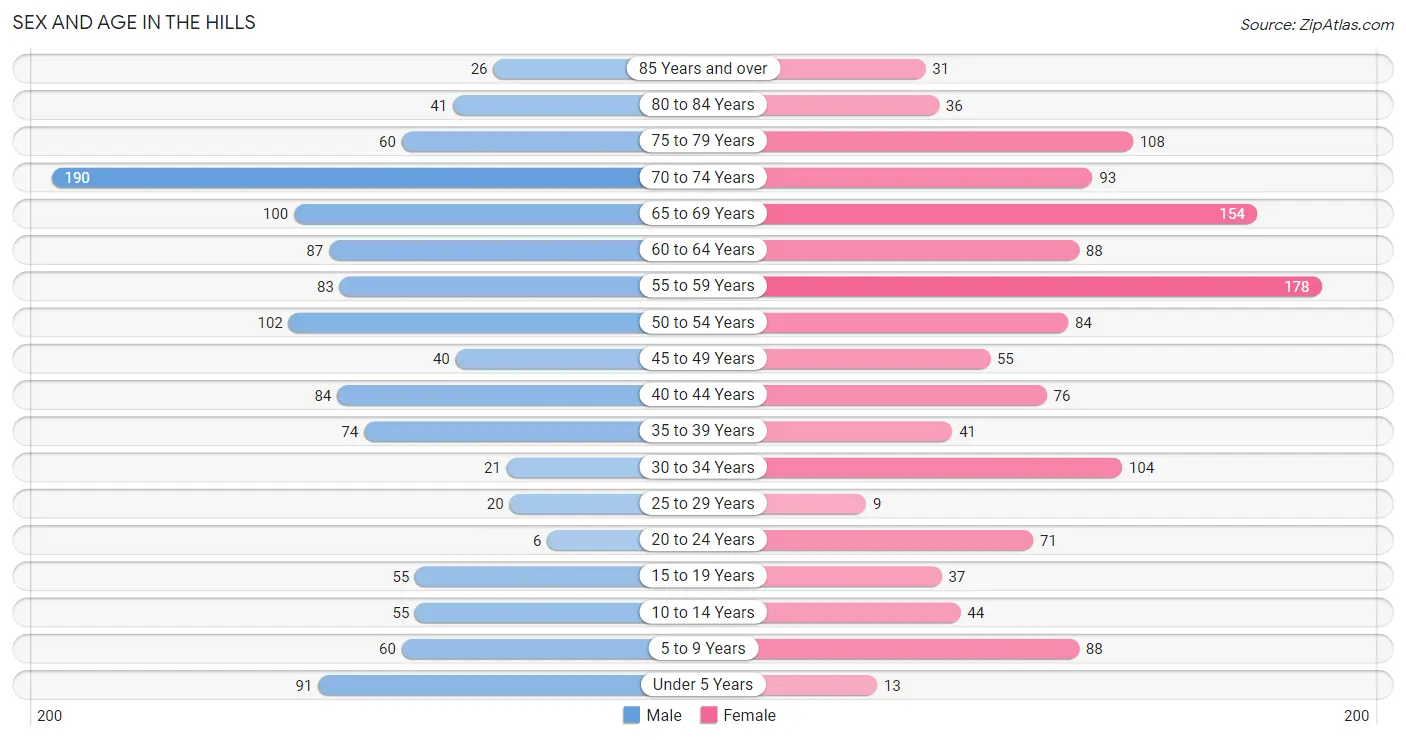
The most populous age groups in The Hills are 70 to 74 Years (190 | 15.9%) for men and 55 to 59 Years (178 | 13.6%) for women.
| Age Bracket | Male | Female |
| Under 5 Years | 91 (7.6%) | 13 (1.0%) |
| 5 to 9 Years | 60 (5.0%) | 88 (6.7%) |
| 10 to 14 Years | 55 (4.6%) | 44 (3.4%) |
| 15 to 19 Years | 55 (4.6%) | 37 (2.8%) |
| 20 to 24 Years | 6 (0.5%) | 71 (5.4%) |
| 25 to 29 Years | 20 (1.7%) | 9 (0.7%) |
| 30 to 34 Years | 21 (1.8%) | 104 (7.9%) |
| 35 to 39 Years | 74 (6.2%) | 41 (3.1%) |
| 40 to 44 Years | 84 (7.0%) | 76 (5.8%) |
| 45 to 49 Years | 40 (3.4%) | 55 (4.2%) |
| 50 to 54 Years | 102 (8.5%) | 84 (6.4%) |
| 55 to 59 Years | 83 (7.0%) | 178 (13.6%) |
| 60 to 64 Years | 87 (7.3%) | 88 (6.7%) |
| 65 to 69 Years | 100 (8.4%) | 154 (11.8%) |
| 70 to 74 Years | 190 (15.9%) | 93 (7.1%) |
| 75 to 79 Years | 60 (5.0%) | 108 (8.2%) |
| 80 to 84 Years | 41 (3.4%) | 36 (2.8%) |
| 85 Years and over | 26 (2.2%) | 31 (2.4%) |
| Total | 1,195 (100.0%) | 1,310 (100.0%) |
Families and Households in The Hills
Median Family Size in The Hills
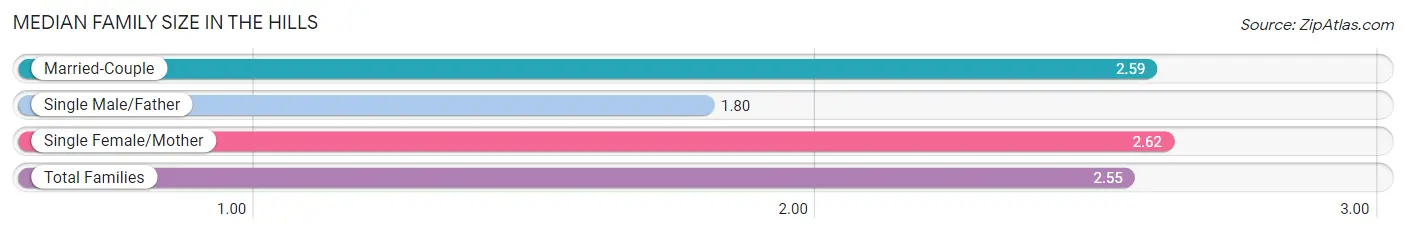
The median family size in The Hills is 2.55 persons per family, with single female/mother families (58 | 6.4%) accounting for the largest median family size of 2.62 persons per family. On the other hand, single male/father families (50 | 5.5%) represent the smallest median family size with 1.80 persons per family.
| Family Type | # Families | Family Size |
| Married-Couple | 794 (88.0%) | 2.59 |
| Single Male/Father | 50 (5.5%) | 1.80 |
| Single Female/Mother | 58 (6.4%) | 2.62 |
| Total Families | 902 (100.0%) | 2.55 |
Median Household Size in The Hills
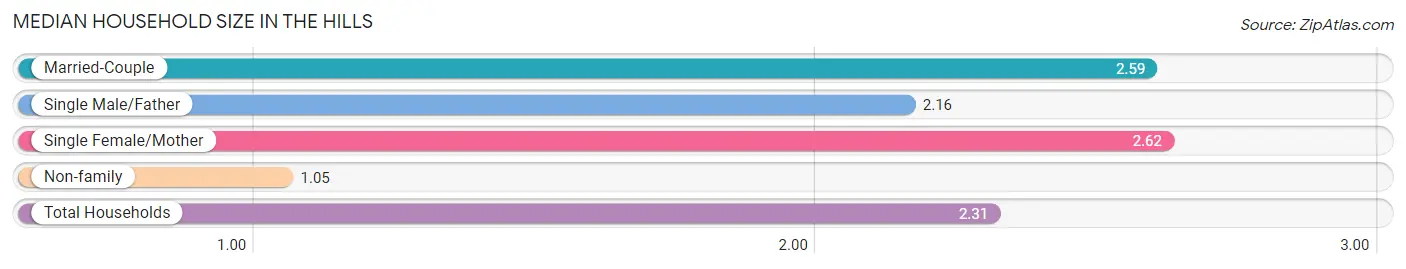
The median household size in The Hills is 2.31 persons per household, with single female/mother households (58 | 5.4%) accounting for the largest median household size of 2.62 persons per household. non-family households (181 | 16.7%) represent the smallest median household size with 1.05 persons per household.
| Household Type | # Households | Household Size |
| Married-Couple | 794 (73.3%) | 2.59 |
| Single Male/Father | 50 (4.6%) | 2.16 |
| Single Female/Mother | 58 (5.4%) | 2.62 |
| Non-family | 181 (16.7%) | 1.05 |
| Total Households | 1,083 (100.0%) | 2.31 |
Household Size by Marriage Status in The Hills
Out of a total of 1,083 households in The Hills, 902 (83.3%) are family households, while 181 (16.7%) are nonfamily households. The most numerous type of family households are 2-person households, comprising 587, and the most common type of nonfamily households are 1-person households, comprising 171.
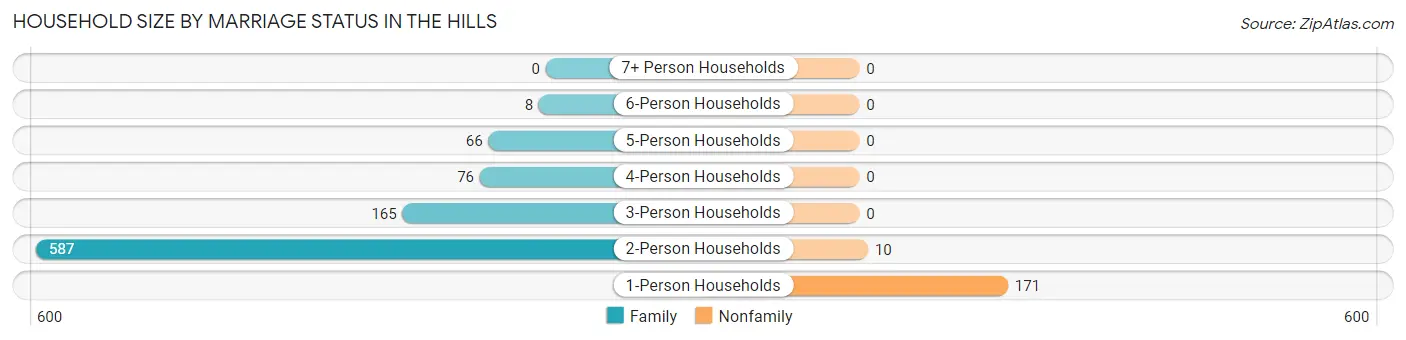
| Household Size | Family Households | Nonfamily Households |
| 1-Person Households | - | 171 (15.8%) |
| 2-Person Households | 587 (54.2%) | 10 (0.9%) |
| 3-Person Households | 165 (15.2%) | 0 (0.0%) |
| 4-Person Households | 76 (7.0%) | 0 (0.0%) |
| 5-Person Households | 66 (6.1%) | 0 (0.0%) |
| 6-Person Households | 8 (0.7%) | 0 (0.0%) |
| 7+ Person Households | 0 (0.0%) | 0 (0.0%) |
| Total | 902 (83.3%) | 181 (16.7%) |
Female Fertility in The Hills
Fertility by Age in The Hills
Average fertility rate in The Hills is 22.0 births per 1,000 women. Women in the age bracket of 35 to 50 years have the highest fertility rate with 50.0 births per 1,000 women. Women in the age bracket of 35 to 50 years acount for 100.0% of all women with births.
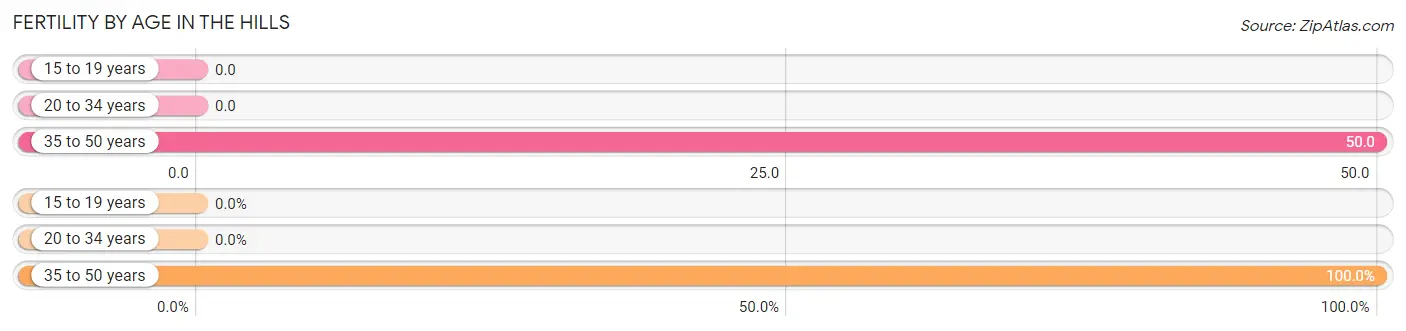
| Age Bracket | Women with Births | Births / 1,000 Women |
| 15 to 19 years | 0 (0.0%) | 0.0 |
| 20 to 34 years | 0 (0.0%) | 0.0 |
| 35 to 50 years | 9 (100.0%) | 50.0 |
| Total | 9 (100.0%) | 22.0 |
Fertility by Age by Marriage Status in The Hills
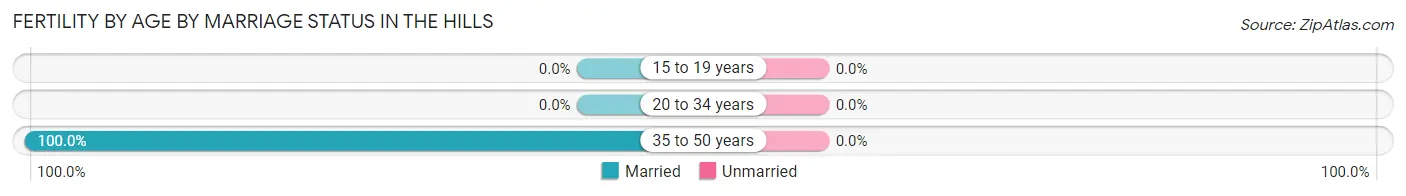
| Age Bracket | Married | Unmarried |
| 15 to 19 years | 0 (0.0%) | 0 (0.0%) |
| 20 to 34 years | 0 (0.0%) | 0 (0.0%) |
| 35 to 50 years | 9 (100.0%) | 0 (0.0%) |
| Total | 9 (100.0%) | 0 (0.0%) |
Fertility by Education in The Hills
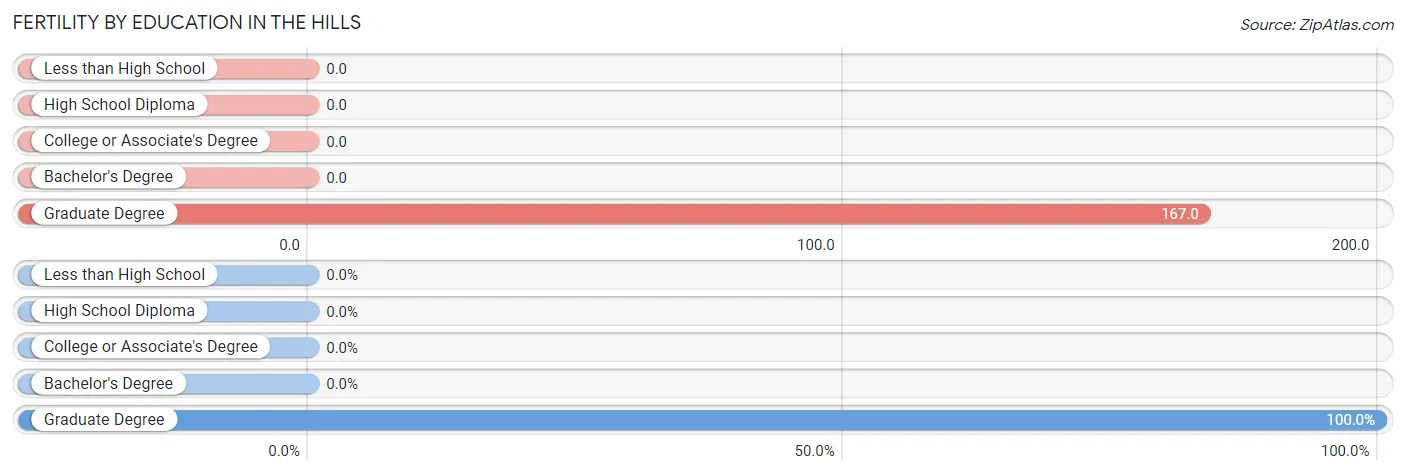
| Educational Attainment | Women with Births | Births / 1,000 Women |
| Less than High School | 0 (0.0%) | 0.0 |
| High School Diploma | 0 (0.0%) | 0.0 |
| College or Associate's Degree | 0 (0.0%) | 0.0 |
| Bachelor's Degree | 0 (0.0%) | 0.0 |
| Graduate Degree | 9 (100.0%) | 167.0 |
| Total | 9 (100.0%) | 22.0 |
Fertility by Education by Marriage Status in The Hills
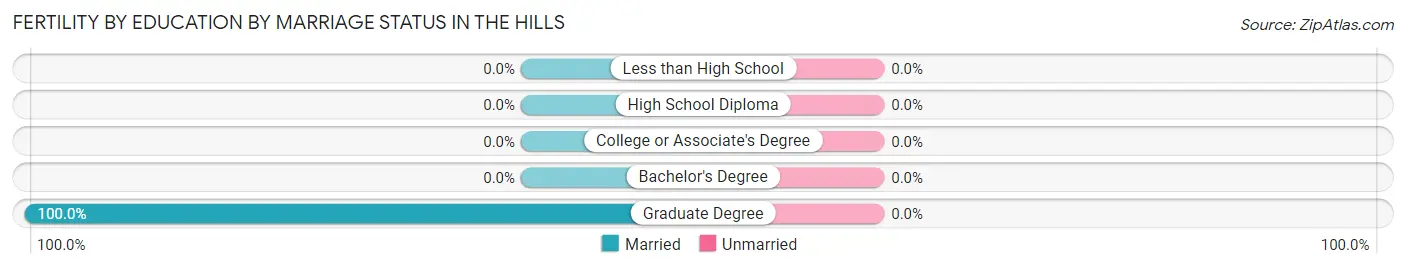
| Educational Attainment | Married | Unmarried |
| Less than High School | 0 (0.0%) | 0 (0.0%) |
| High School Diploma | 0 (0.0%) | 0 (0.0%) |
| College or Associate's Degree | 0 (0.0%) | 0 (0.0%) |
| Bachelor's Degree | 0 (0.0%) | 0 (0.0%) |
| Graduate Degree | 9 (100.0%) | 0 (0.0%) |
| Total | 9 (100.0%) | 0 (0.0%) |
Employment Characteristics in The Hills
Employment by Class of Employer in The Hills
Among the 965 employed individuals in The Hills, private company employees (630 | 65.3%), self-employed (not incorporated) (129 | 13.4%), and self-employed (incorporated) (122 | 12.6%) make up the most common classes of employment.
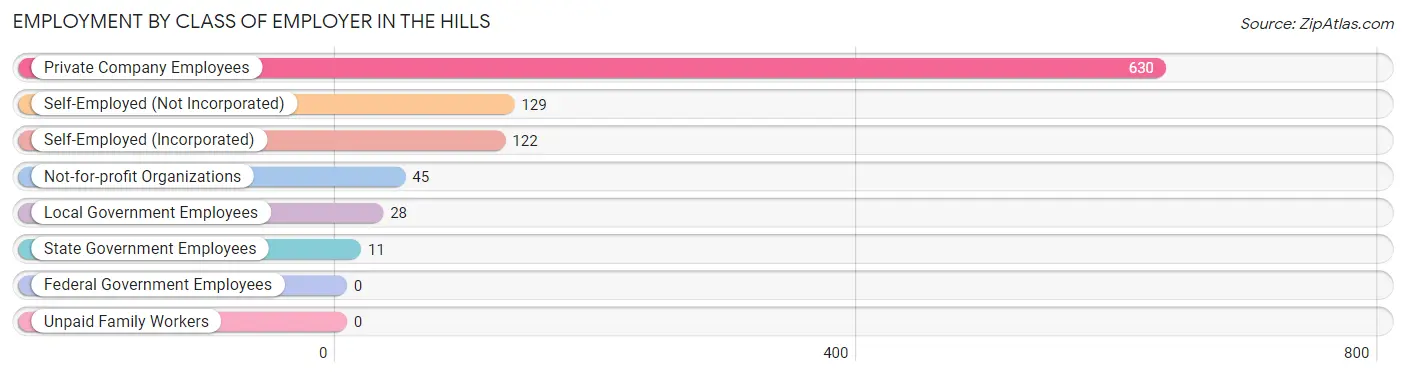
| Employer Class | # Employees | % Employees |
| Private Company Employees | 630 | 65.3% |
| Self-Employed (Incorporated) | 122 | 12.6% |
| Self-Employed (Not Incorporated) | 129 | 13.4% |
| Not-for-profit Organizations | 45 | 4.7% |
| Local Government Employees | 28 | 2.9% |
| State Government Employees | 11 | 1.1% |
| Federal Government Employees | 0 | 0.0% |
| Unpaid Family Workers | 0 | 0.0% |
| Total | 965 | 100.0% |
Employment Status by Age in The Hills
According to the labor force statistics for The Hills, out of the total population over 16 years of age (2,145), 46.9% or 1,006 individuals are in the labor force, with 2.6% or 26 of them unemployed. The age group with the highest labor force participation rate is 25 to 29 years, with 100.0% or 29 individuals in the labor force. Within the labor force, the 60 to 64 years age range has the highest percentage of unemployed individuals, with 10.0% or 11 of them being unemployed.
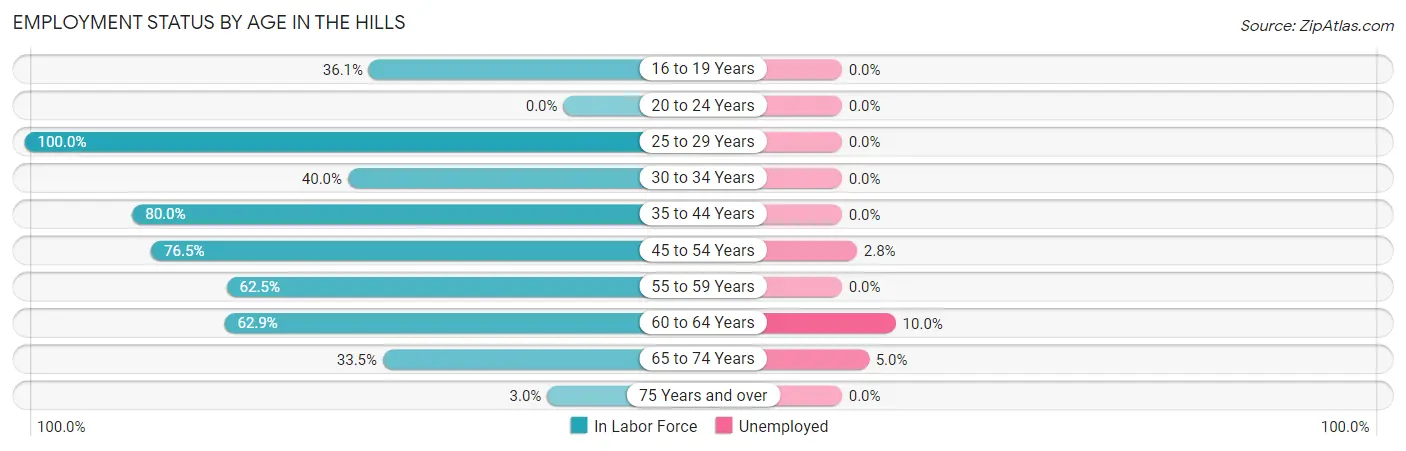
| Age Bracket | In Labor Force | Unemployed |
| 16 to 19 Years | 30 (36.1%) | 0 (0.0%) |
| 20 to 24 Years | 0 (0.0%) | 0 (0.0%) |
| 25 to 29 Years | 29 (100.0%) | 0 (0.0%) |
| 30 to 34 Years | 50 (40.0%) | 0 (0.0%) |
| 35 to 44 Years | 220 (80.0%) | 0 (0.0%) |
| 45 to 54 Years | 215 (76.5%) | 6 (2.8%) |
| 55 to 59 Years | 163 (62.5%) | 0 (0.0%) |
| 60 to 64 Years | 110 (62.9%) | 11 (10.0%) |
| 65 to 74 Years | 180 (33.5%) | 9 (5.0%) |
| 75 Years and over | 9 (3.0%) | 0 (0.0%) |
| Total | 1,006 (46.9%) | 26 (2.6%) |
Employment Status by Educational Attainment in The Hills
According to labor force statistics for The Hills, 68.7% of individuals (787) out of the total population between 25 and 64 years of age (1,146) are in the labor force, with 2.2% or 17 of them being unemployed. The group with the highest labor force participation rate are those with the educational attainment of bachelor's degree or higher, with 74.2% or 611 individuals in the labor force. Within the labor force, individuals with high school diploma education have the highest percentage of unemployment, with 29.4% or 5 of them being unemployed.
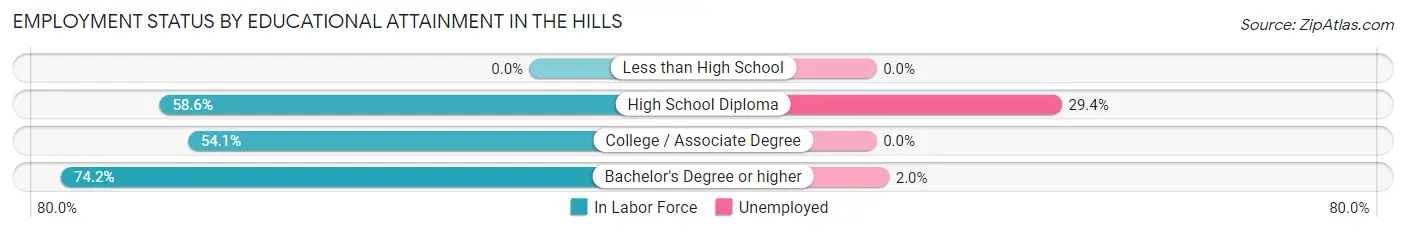
| Educational Attainment | In Labor Force | Unemployed |
| Less than High School | 0 (0.0%) | 0 (0.0%) |
| High School Diploma | 17 (58.6%) | 9 (29.4%) |
| College / Associate Degree | 159 (54.1%) | 0 (0.0%) |
| Bachelor's Degree or higher | 611 (74.2%) | 16 (2.0%) |
| Total | 787 (68.7%) | 25 (2.2%) |
Employment Occupations by Sex in The Hills
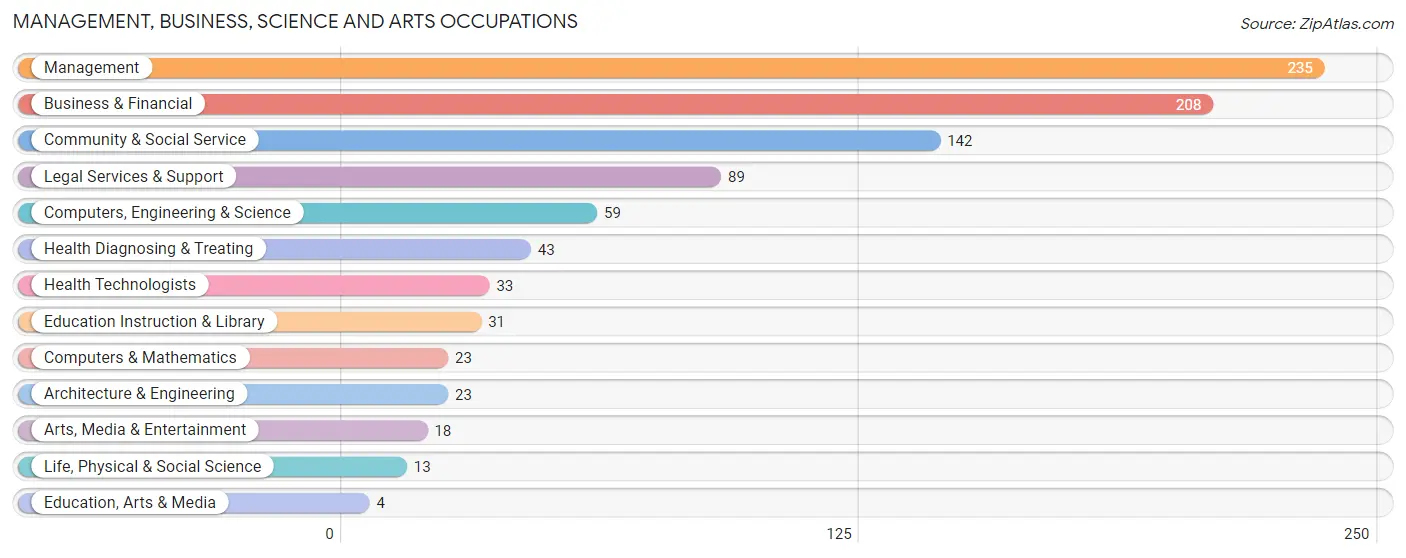
Management, Business, Science and Arts Occupations
The most common Management, Business, Science and Arts occupations in The Hills are Management (235 | 24.0%), Business & Financial (208 | 21.2%), Community & Social Service (142 | 14.5%), Legal Services & Support (89 | 9.1%), and Computers, Engineering & Science (59 | 6.0%).
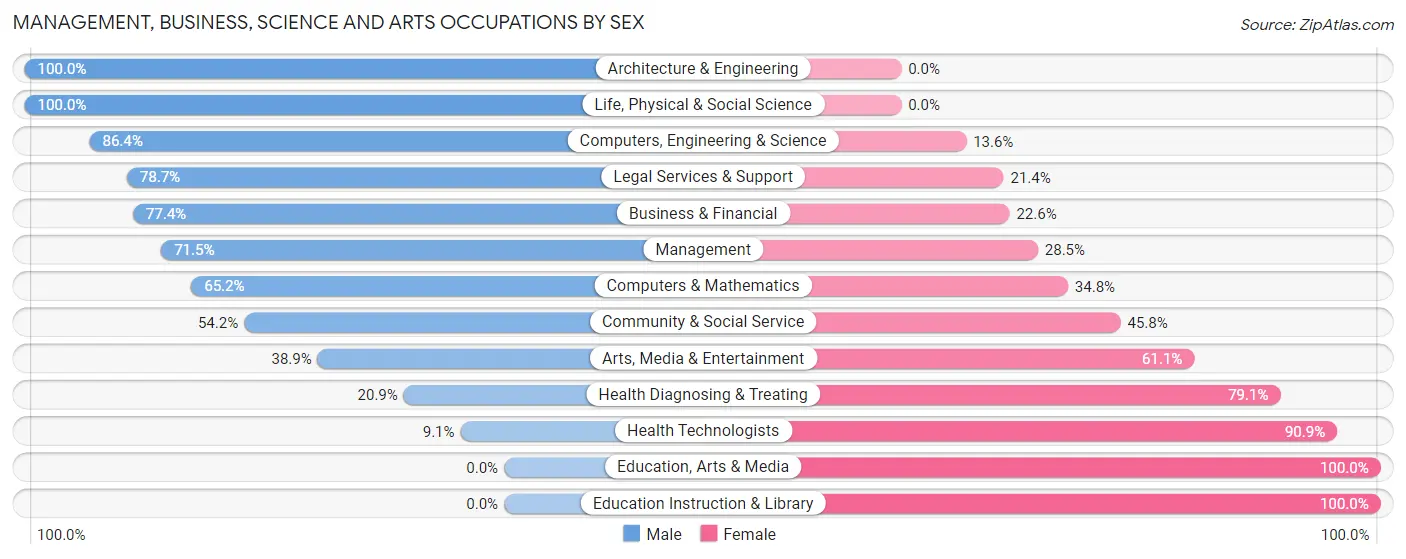
Management, Business, Science and Arts Occupations by Sex
Within the Management, Business, Science and Arts occupations in The Hills, the most male-oriented occupations are Architecture & Engineering (100.0%), Life, Physical & Social Science (100.0%), and Computers, Engineering & Science (86.4%), while the most female-oriented occupations are Education, Arts & Media (100.0%), Education Instruction & Library (100.0%), and Health Technologists (90.9%).
| Occupation | Male | Female |
| Management | 168 (71.5%) | 67 (28.5%) |
| Business & Financial | 161 (77.4%) | 47 (22.6%) |
| Computers, Engineering & Science | 51 (86.4%) | 8 (13.6%) |
| Computers & Mathematics | 15 (65.2%) | 8 (34.8%) |
| Architecture & Engineering | 23 (100.0%) | 0 (0.0%) |
| Life, Physical & Social Science | 13 (100.0%) | 0 (0.0%) |
| Community & Social Service | 77 (54.2%) | 65 (45.8%) |
| Education, Arts & Media | 0 (0.0%) | 4 (100.0%) |
| Legal Services & Support | 70 (78.6%) | 19 (21.3%) |
| Education Instruction & Library | 0 (0.0%) | 31 (100.0%) |
| Arts, Media & Entertainment | 7 (38.9%) | 11 (61.1%) |
| Health Diagnosing & Treating | 9 (20.9%) | 34 (79.1%) |
| Health Technologists | 3 (9.1%) | 30 (90.9%) |
| Total (Category) | 466 (67.8%) | 221 (32.2%) |
| Total (Overall) | 616 (62.9%) | 364 (37.1%) |
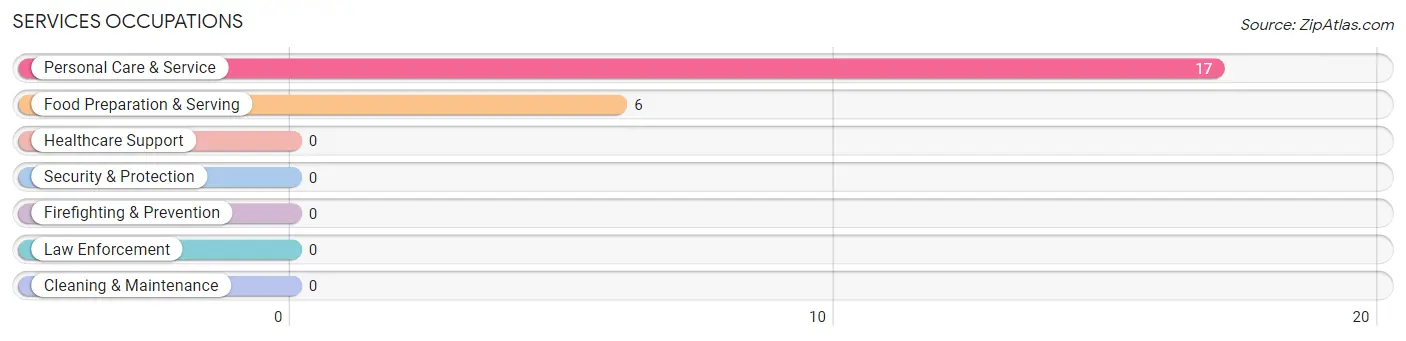
Services Occupations
The most common Services occupations in The Hills are Personal Care & Service (17 | 1.7%), and Food Preparation & Serving (6 | 0.6%).
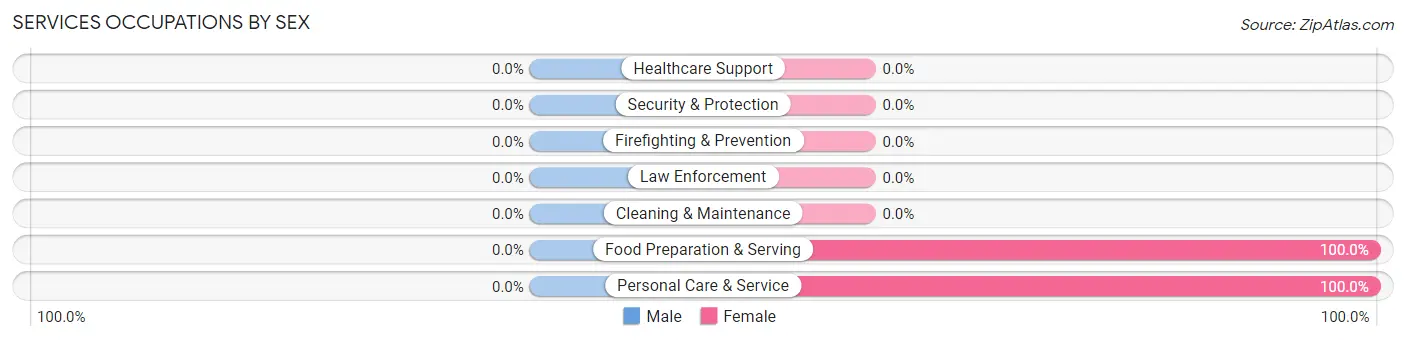
Services Occupations by Sex
| Occupation | Male | Female |
| Healthcare Support | 0 (0.0%) | 0 (0.0%) |
| Security & Protection | 0 (0.0%) | 0 (0.0%) |
| Firefighting & Prevention | 0 (0.0%) | 0 (0.0%) |
| Law Enforcement | 0 (0.0%) | 0 (0.0%) |
| Food Preparation & Serving | 0 (0.0%) | 6 (100.0%) |
| Cleaning & Maintenance | 0 (0.0%) | 0 (0.0%) |
| Personal Care & Service | 0 (0.0%) | 17 (100.0%) |
| Total (Category) | 0 (0.0%) | 23 (100.0%) |
| Total (Overall) | 616 (62.9%) | 364 (37.1%) |
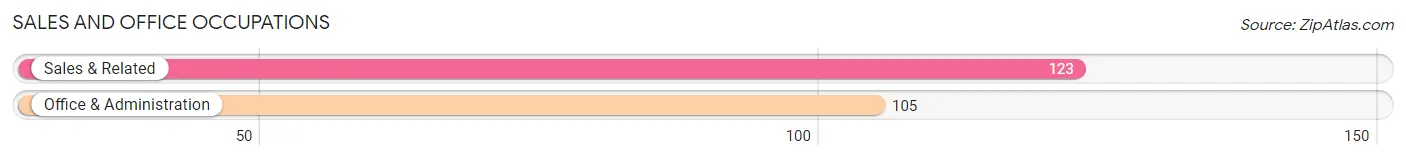
Sales and Office Occupations
The most common Sales and Office occupations in The Hills are Sales & Related (123 | 12.6%), and Office & Administration (105 | 10.7%).
Sales and Office Occupations by Sex
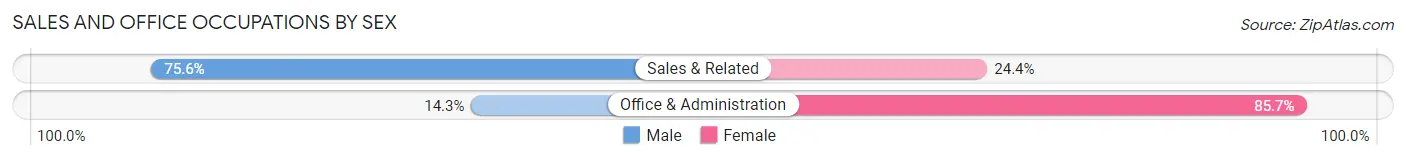
| Occupation | Male | Female |
| Sales & Related | 93 (75.6%) | 30 (24.4%) |
| Office & Administration | 15 (14.3%) | 90 (85.7%) |
| Total (Category) | 108 (47.4%) | 120 (52.6%) |
| Total (Overall) | 616 (62.9%) | 364 (37.1%) |
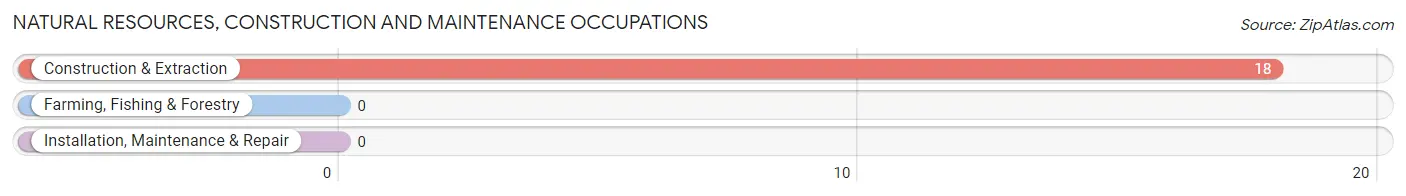
Natural Resources, Construction and Maintenance Occupations
The most common Natural Resources, Construction and Maintenance occupations in The Hills are , and Construction & Extraction (18 | 1.8%).
Natural Resources, Construction and Maintenance Occupations by Sex
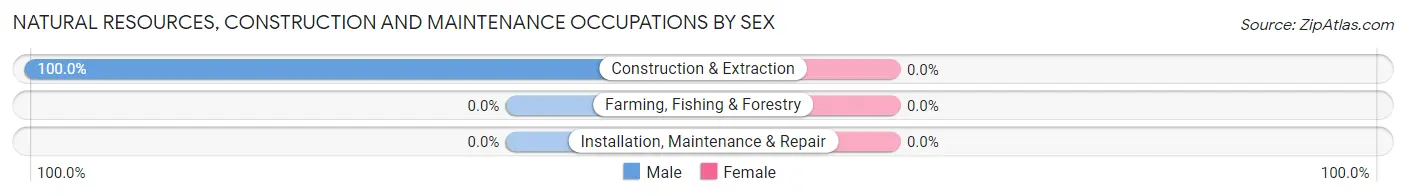
| Occupation | Male | Female |
| Farming, Fishing & Forestry | 0 (0.0%) | 0 (0.0%) |
| Construction & Extraction | 18 (100.0%) | 0 (0.0%) |
| Installation, Maintenance & Repair | 0 (0.0%) | 0 (0.0%) |
| Total (Category) | 18 (100.0%) | 0 (0.0%) |
| Total (Overall) | 616 (62.9%) | 364 (37.1%) |
Production, Transportation and Moving Occupations
The most common Production, Transportation and Moving occupations in The Hills are Material Moving (15 | 1.5%), Production (5 | 0.5%), and Transportation (4 | 0.4%).

Production, Transportation and Moving Occupations by Sex
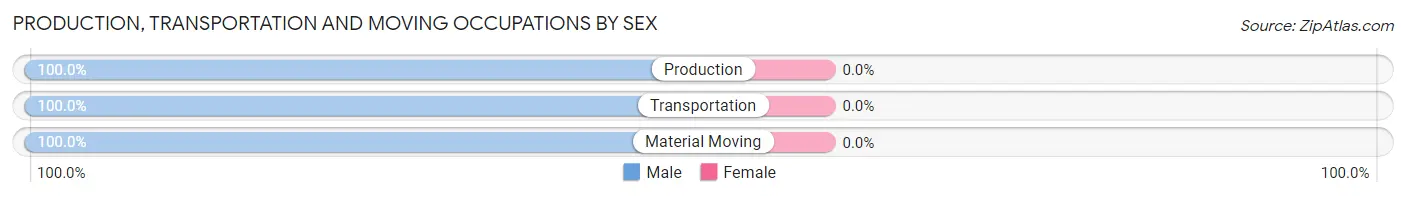
| Occupation | Male | Female |
| Production | 5 (100.0%) | 0 (0.0%) |
| Transportation | 4 (100.0%) | 0 (0.0%) |
| Material Moving | 15 (100.0%) | 0 (0.0%) |
| Total (Category) | 24 (100.0%) | 0 (0.0%) |
| Total (Overall) | 616 (62.9%) | 364 (37.1%) |
Employment Industries by Sex in The Hills
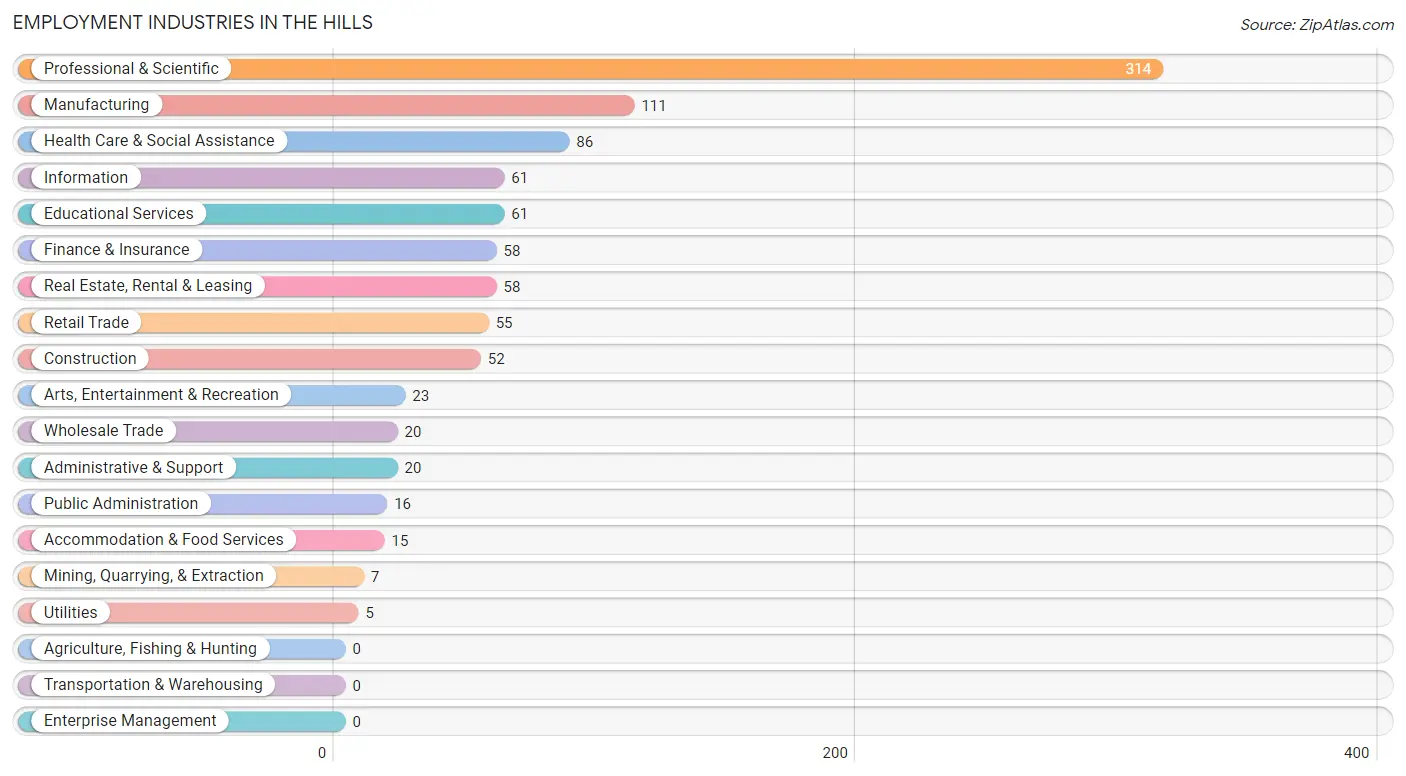
Employment Industries in The Hills
The major employment industries in The Hills include Professional & Scientific (314 | 32.0%), Manufacturing (111 | 11.3%), Health Care & Social Assistance (86 | 8.8%), Information (61 | 6.2%), and Educational Services (61 | 6.2%).
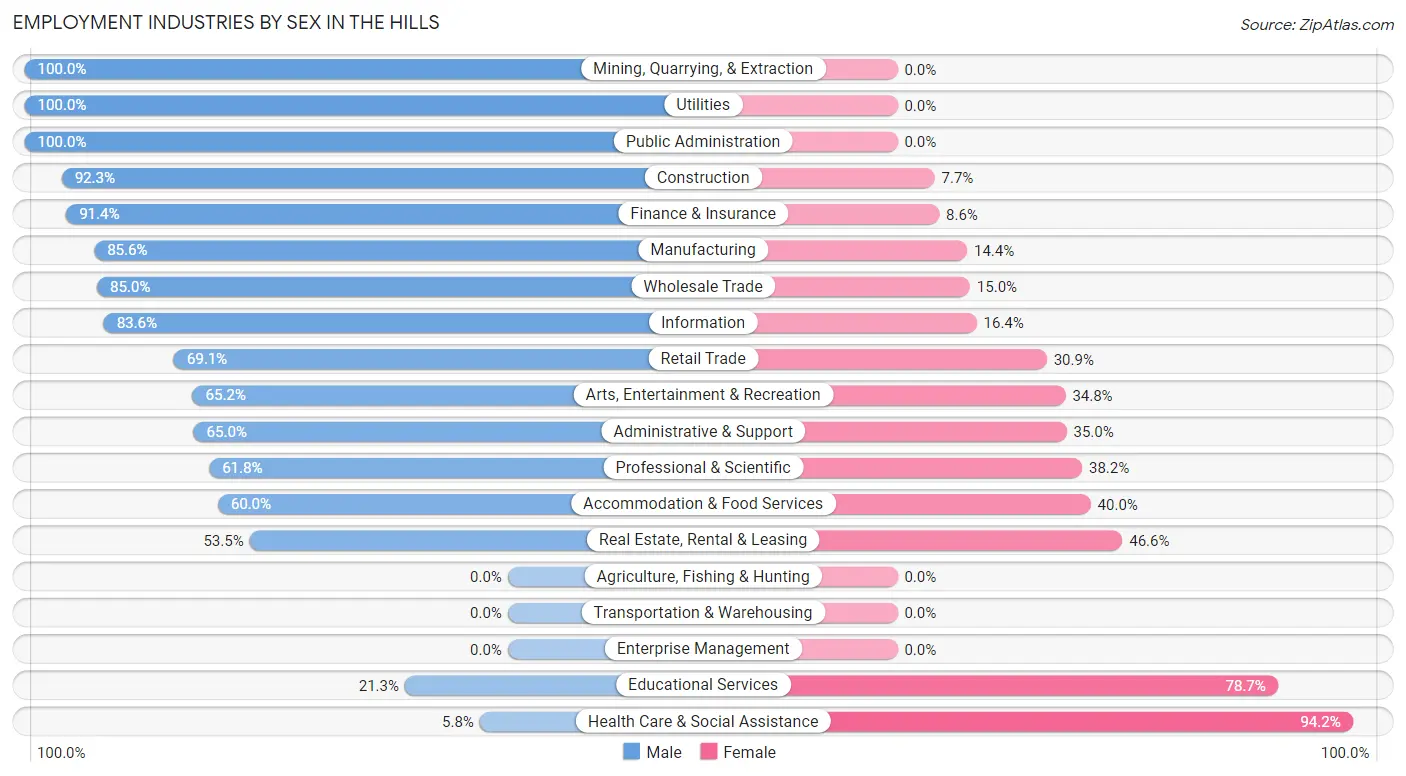
Employment Industries by Sex in The Hills
The The Hills industries that see more men than women are Mining, Quarrying, & Extraction (100.0%), Utilities (100.0%), and Public Administration (100.0%), whereas the industries that tend to have a higher number of women are Health Care & Social Assistance (94.2%), Educational Services (78.7%), and Real Estate, Rental & Leasing (46.6%).
| Industry | Male | Female |
| Agriculture, Fishing & Hunting | 0 (0.0%) | 0 (0.0%) |
| Mining, Quarrying, & Extraction | 7 (100.0%) | 0 (0.0%) |
| Construction | 48 (92.3%) | 4 (7.7%) |
| Manufacturing | 95 (85.6%) | 16 (14.4%) |
| Wholesale Trade | 17 (85.0%) | 3 (15.0%) |
| Retail Trade | 38 (69.1%) | 17 (30.9%) |
| Transportation & Warehousing | 0 (0.0%) | 0 (0.0%) |
| Utilities | 5 (100.0%) | 0 (0.0%) |
| Information | 51 (83.6%) | 10 (16.4%) |
| Finance & Insurance | 53 (91.4%) | 5 (8.6%) |
| Real Estate, Rental & Leasing | 31 (53.4%) | 27 (46.6%) |
| Professional & Scientific | 194 (61.8%) | 120 (38.2%) |
| Enterprise Management | 0 (0.0%) | 0 (0.0%) |
| Administrative & Support | 13 (65.0%) | 7 (35.0%) |
| Educational Services | 13 (21.3%) | 48 (78.7%) |
| Health Care & Social Assistance | 5 (5.8%) | 81 (94.2%) |
| Arts, Entertainment & Recreation | 15 (65.2%) | 8 (34.8%) |
| Accommodation & Food Services | 9 (60.0%) | 6 (40.0%) |
| Public Administration | 16 (100.0%) | 0 (0.0%) |
| Total | 616 (62.9%) | 364 (37.1%) |
Education in The Hills
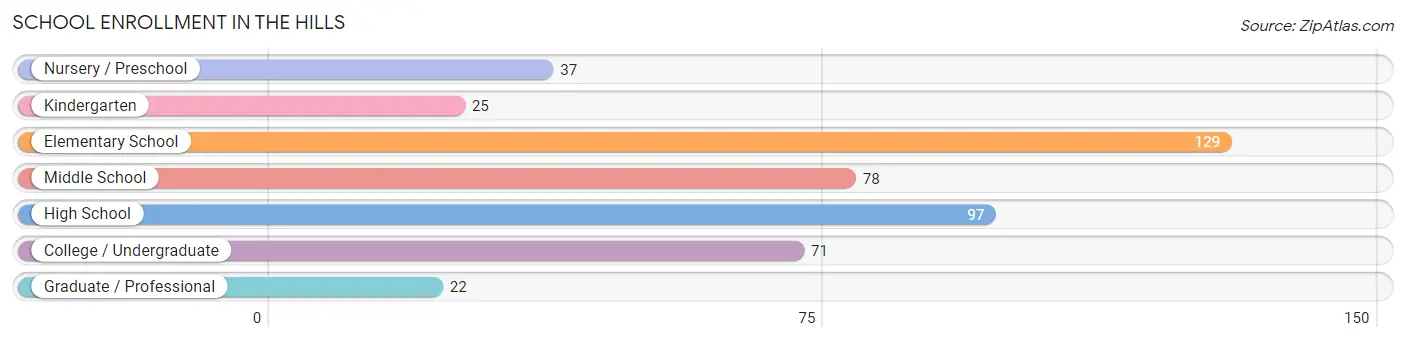
School Enrollment in The Hills
The most common levels of schooling among the 459 students in The Hills are elementary school (129 | 28.1%), high school (97 | 21.1%), and middle school (78 | 17.0%).
| School Level | # Students | % Students |
| Nursery / Preschool | 37 | 8.1% |
| Kindergarten | 25 | 5.4% |
| Elementary School | 129 | 28.1% |
| Middle School | 78 | 17.0% |
| High School | 97 | 21.1% |
| College / Undergraduate | 71 | 15.5% |
| Graduate / Professional | 22 | 4.8% |
| Total | 459 | 100.0% |
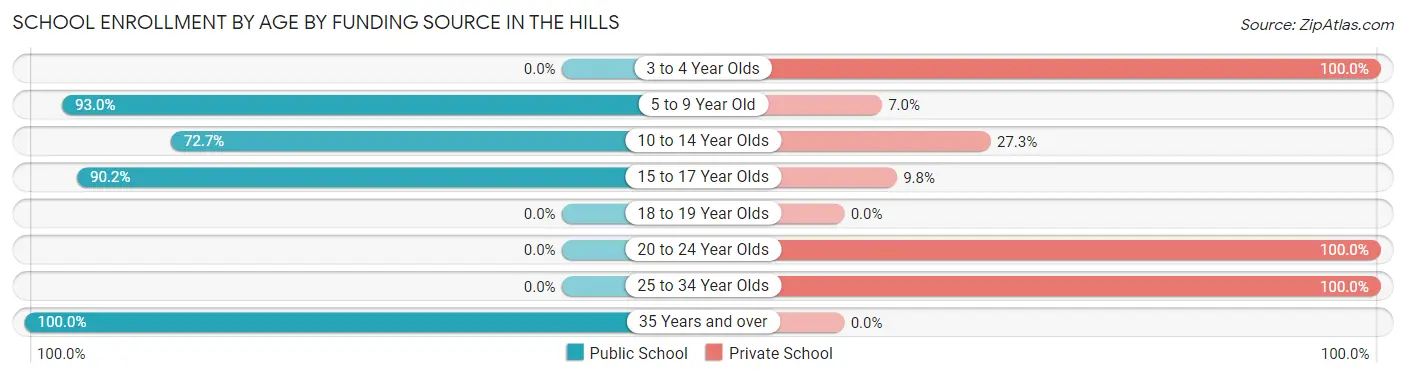
School Enrollment by Age by Funding Source in The Hills
Out of a total of 459 students who are enrolled in schools in The Hills, 164 (35.7%) attend a private institution, while the remaining 295 (64.3%) are enrolled in public schools. The age group of 3 to 4 year olds has the highest likelihood of being enrolled in private schools, with 32 (100.0% in the age bracket) enrolled. Conversely, the age group of 35 years and over has the lowest likelihood of being enrolled in a private school, with 7 (100.0% in the age bracket) attending a public institution.
| Age Bracket | Public School | Private School |
| 3 to 4 Year Olds | 0 (0.0%) | 32 (100.0%) |
| 5 to 9 Year Old | 133 (93.0%) | 10 (7.0%) |
| 10 to 14 Year Olds | 72 (72.7%) | 27 (27.3%) |
| 15 to 17 Year Olds | 83 (90.2%) | 9 (9.8%) |
| 18 to 19 Year Olds | 0 (0.0%) | 0 (0.0%) |
| 20 to 24 Year Olds | 0 (0.0%) | 71 (100.0%) |
| 25 to 34 Year Olds | 0 (0.0%) | 15 (100.0%) |
| 35 Years and over | 7 (100.0%) | 0 (0.0%) |
| Total | 295 (64.3%) | 164 (35.7%) |
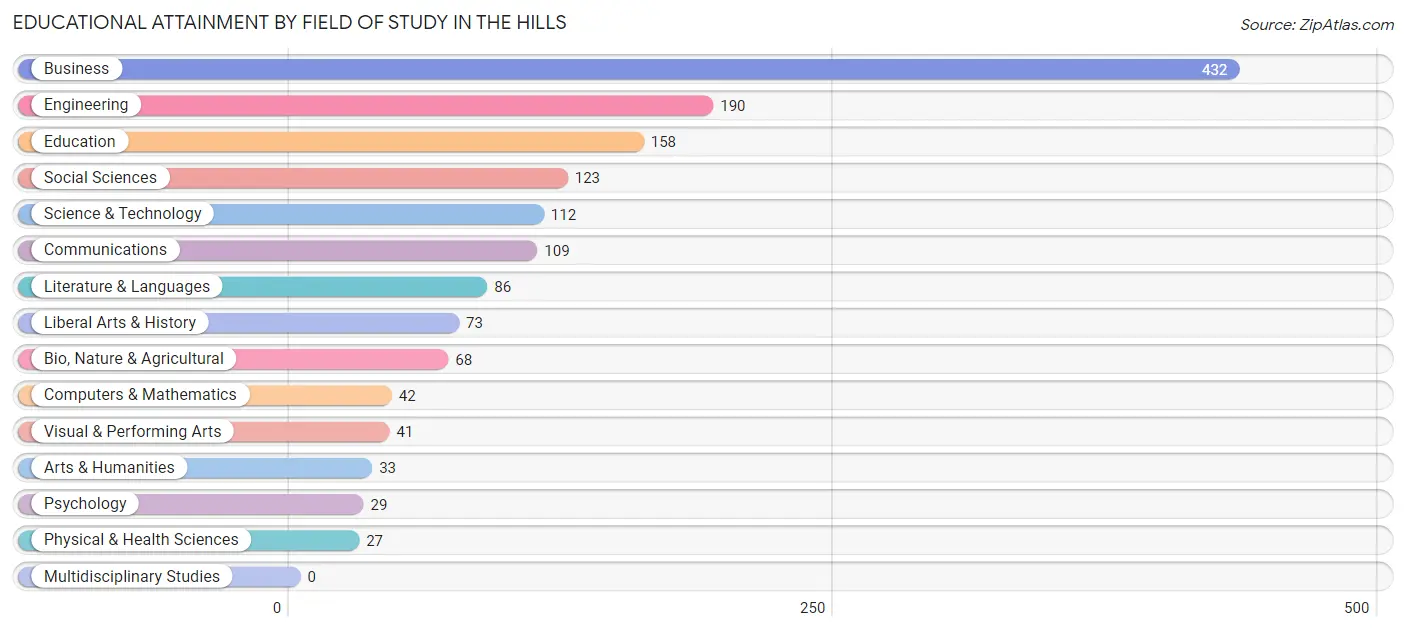
Educational Attainment by Field of Study in The Hills
Business (432 | 28.4%), engineering (190 | 12.5%), education (158 | 10.4%), social sciences (123 | 8.1%), and science & technology (112 | 7.3%) are the most common fields of study among 1,523 individuals in The Hills who have obtained a bachelor's degree or higher.
| Field of Study | # Graduates | % Graduates |
| Computers & Mathematics | 42 | 2.8% |
| Bio, Nature & Agricultural | 68 | 4.5% |
| Physical & Health Sciences | 27 | 1.8% |
| Psychology | 29 | 1.9% |
| Social Sciences | 123 | 8.1% |
| Engineering | 190 | 12.5% |
| Multidisciplinary Studies | 0 | 0.0% |
| Science & Technology | 112 | 7.3% |
| Business | 432 | 28.4% |
| Education | 158 | 10.4% |
| Literature & Languages | 86 | 5.7% |
| Liberal Arts & History | 73 | 4.8% |
| Visual & Performing Arts | 41 | 2.7% |
| Communications | 109 | 7.2% |
| Arts & Humanities | 33 | 2.2% |
| Total | 1,523 | 100.0% |
Transportation & Commute in The Hills
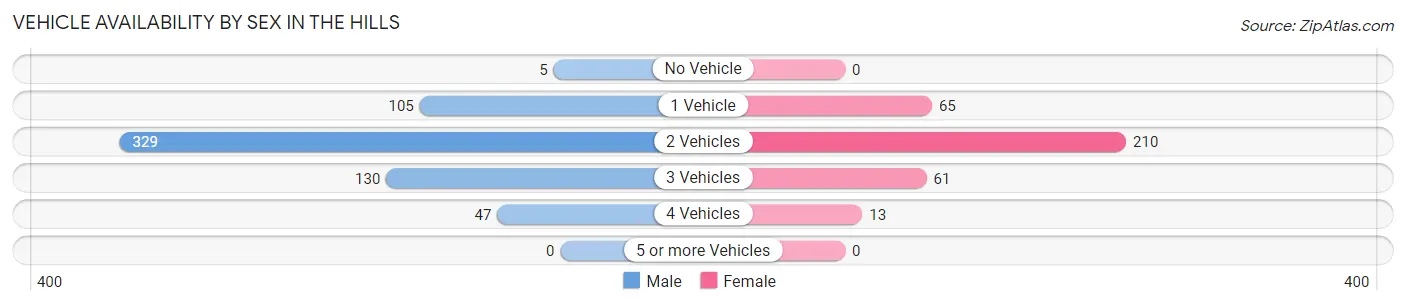
Vehicle Availability by Sex in The Hills
The most prevalent vehicle ownership categories in The Hills are males with 2 vehicles (329, accounting for 53.4%) and females with 2 vehicles (210, making up 94.3%).
| Vehicles Available | Male | Female |
| No Vehicle | 5 (0.8%) | 0 (0.0%) |
| 1 Vehicle | 105 (17.1%) | 65 (18.6%) |
| 2 Vehicles | 329 (53.4%) | 210 (60.2%) |
| 3 Vehicles | 130 (21.1%) | 61 (17.5%) |
| 4 Vehicles | 47 (7.6%) | 13 (3.7%) |
| 5 or more Vehicles | 0 (0.0%) | 0 (0.0%) |
| Total | 616 (100.0%) | 349 (100.0%) |
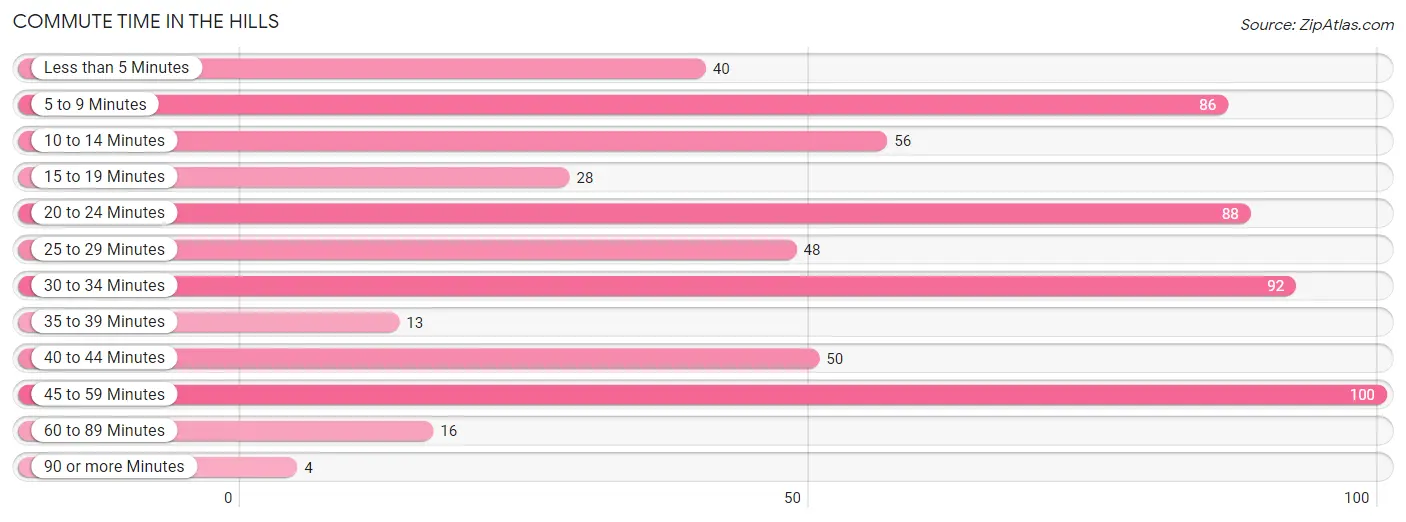
Commute Time in The Hills
The most frequently occuring commute durations in The Hills are 45 to 59 minutes (100 commuters, 16.1%), 30 to 34 minutes (92 commuters, 14.8%), and 20 to 24 minutes (88 commuters, 14.2%).
| Commute Time | # Commuters | % Commuters |
| Less than 5 Minutes | 40 | 6.4% |
| 5 to 9 Minutes | 86 | 13.9% |
| 10 to 14 Minutes | 56 | 9.0% |
| 15 to 19 Minutes | 28 | 4.5% |
| 20 to 24 Minutes | 88 | 14.2% |
| 25 to 29 Minutes | 48 | 7.7% |
| 30 to 34 Minutes | 92 | 14.8% |
| 35 to 39 Minutes | 13 | 2.1% |
| 40 to 44 Minutes | 50 | 8.1% |
| 45 to 59 Minutes | 100 | 16.1% |
| 60 to 89 Minutes | 16 | 2.6% |
| 90 or more Minutes | 4 | 0.6% |
Commute Time by Sex in The Hills
The most common commute times in The Hills are 5 to 9 minutes (63 commuters, 16.0%) for males and 45 to 59 minutes (40 commuters, 17.6%) for females.
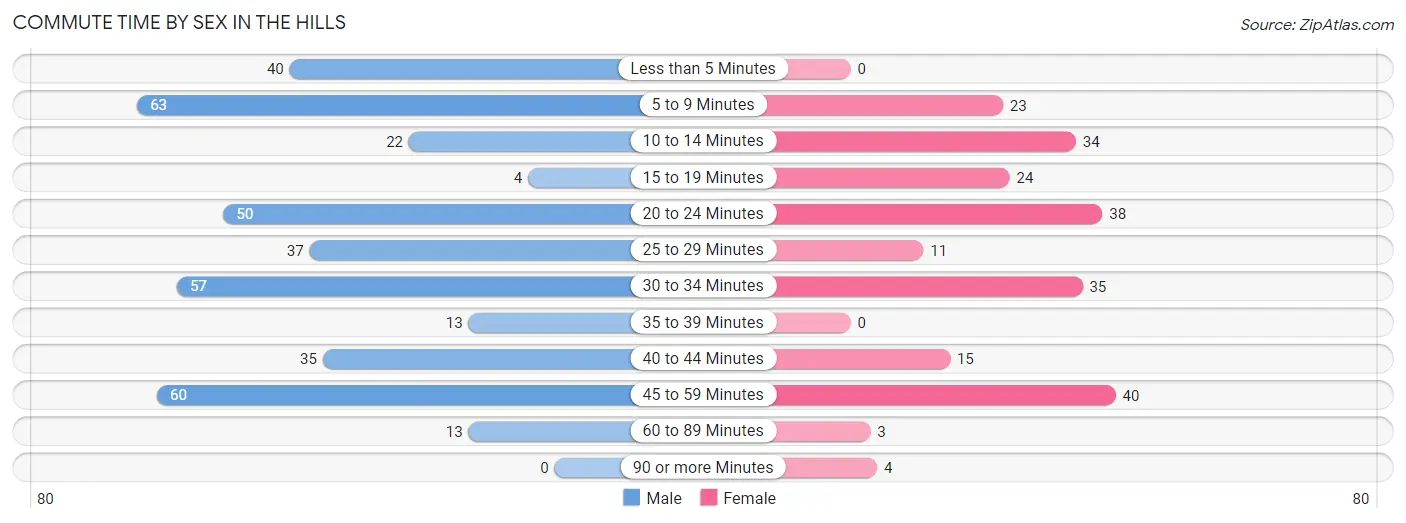
| Commute Time | Male | Female |
| Less than 5 Minutes | 40 (10.2%) | 0 (0.0%) |
| 5 to 9 Minutes | 63 (16.0%) | 23 (10.1%) |
| 10 to 14 Minutes | 22 (5.6%) | 34 (15.0%) |
| 15 to 19 Minutes | 4 (1.0%) | 24 (10.6%) |
| 20 to 24 Minutes | 50 (12.7%) | 38 (16.7%) |
| 25 to 29 Minutes | 37 (9.4%) | 11 (4.9%) |
| 30 to 34 Minutes | 57 (14.5%) | 35 (15.4%) |
| 35 to 39 Minutes | 13 (3.3%) | 0 (0.0%) |
| 40 to 44 Minutes | 35 (8.9%) | 15 (6.6%) |
| 45 to 59 Minutes | 60 (15.2%) | 40 (17.6%) |
| 60 to 89 Minutes | 13 (3.3%) | 3 (1.3%) |
| 90 or more Minutes | 0 (0.0%) | 4 (1.8%) |
Time of Departure to Work by Sex in The Hills
The most frequent times of departure to work in The Hills are 8:00 AM to 8:29 AM (91, 23.1%) for males and 7:30 AM to 7:59 AM (61, 26.9%) for females.
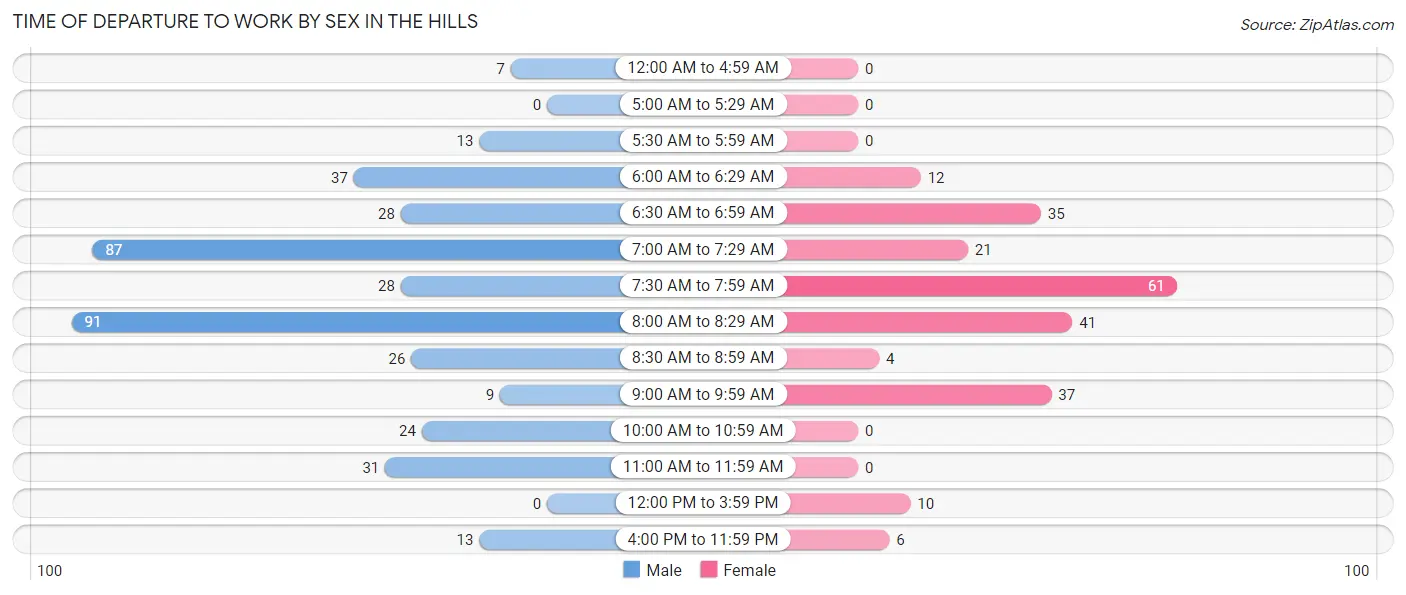
| Time of Departure | Male | Female |
| 12:00 AM to 4:59 AM | 7 (1.8%) | 0 (0.0%) |
| 5:00 AM to 5:29 AM | 0 (0.0%) | 0 (0.0%) |
| 5:30 AM to 5:59 AM | 13 (3.3%) | 0 (0.0%) |
| 6:00 AM to 6:29 AM | 37 (9.4%) | 12 (5.3%) |
| 6:30 AM to 6:59 AM | 28 (7.1%) | 35 (15.4%) |
| 7:00 AM to 7:29 AM | 87 (22.1%) | 21 (9.2%) |
| 7:30 AM to 7:59 AM | 28 (7.1%) | 61 (26.9%) |
| 8:00 AM to 8:29 AM | 91 (23.1%) | 41 (18.1%) |
| 8:30 AM to 8:59 AM | 26 (6.6%) | 4 (1.8%) |
| 9:00 AM to 9:59 AM | 9 (2.3%) | 37 (16.3%) |
| 10:00 AM to 10:59 AM | 24 (6.1%) | 0 (0.0%) |
| 11:00 AM to 11:59 AM | 31 (7.9%) | 0 (0.0%) |
| 12:00 PM to 3:59 PM | 0 (0.0%) | 10 (4.4%) |
| 4:00 PM to 11:59 PM | 13 (3.3%) | 6 (2.6%) |
| Total | 394 (100.0%) | 227 (100.0%) |
Housing Occupancy in The Hills
Occupancy by Ownership in The Hills
Of the total 1,083 dwellings in The Hills, owner-occupied units account for 1,042 (96.2%), while renter-occupied units make up 41 (3.8%).
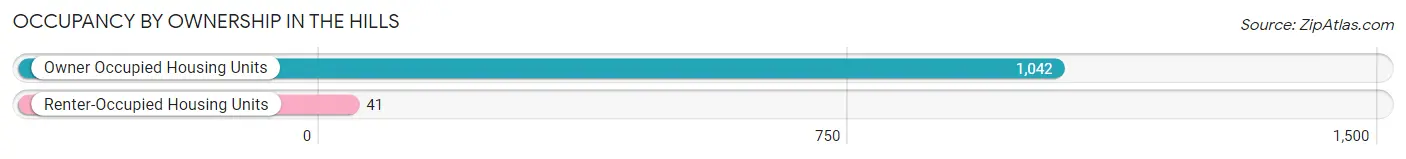
| Occupancy | # Housing Units | % Housing Units |
| Owner Occupied Housing Units | 1,042 | 96.2% |
| Renter-Occupied Housing Units | 41 | 3.8% |
| Total Occupied Housing Units | 1,083 | 100.0% |
Occupancy by Household Size in The Hills
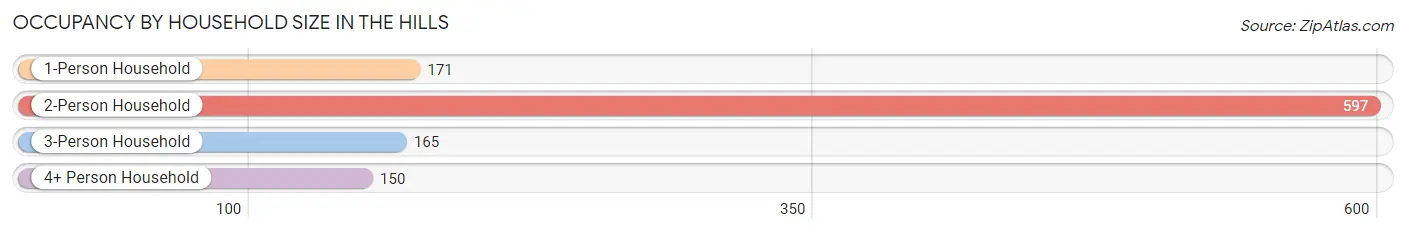
| Household Size | # Housing Units | % Housing Units |
| 1-Person Household | 171 | 15.8% |
| 2-Person Household | 597 | 55.1% |
| 3-Person Household | 165 | 15.2% |
| 4+ Person Household | 150 | 13.9% |
| Total Housing Units | 1,083 | 100.0% |
Occupancy by Ownership by Household Size in The Hills
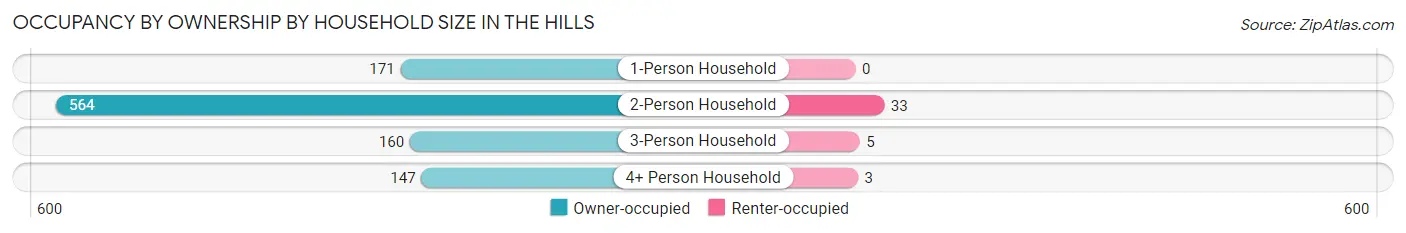
| Household Size | Owner-occupied | Renter-occupied |
| 1-Person Household | 171 (100.0%) | 0 (0.0%) |
| 2-Person Household | 564 (94.5%) | 33 (5.5%) |
| 3-Person Household | 160 (97.0%) | 5 (3.0%) |
| 4+ Person Household | 147 (98.0%) | 3 (2.0%) |
| Total Housing Units | 1,042 (96.2%) | 41 (3.8%) |
Occupancy by Educational Attainment in The Hills
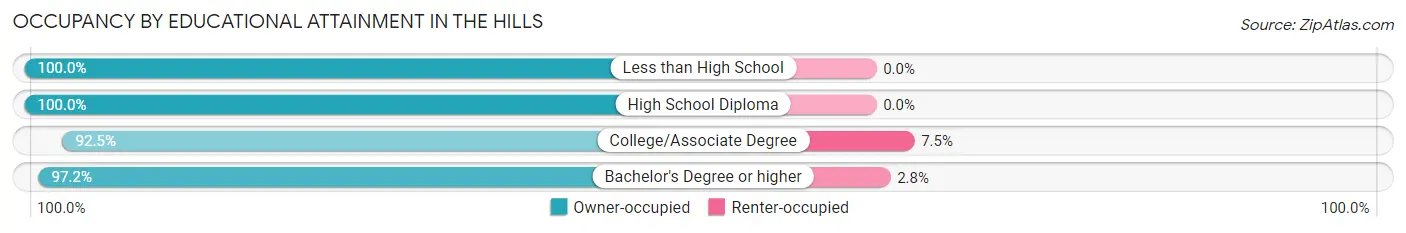
| Household Size | Owner-occupied | Renter-occupied |
| Less than High School | 5 (100.0%) | 0 (0.0%) |
| High School Diploma | 35 (100.0%) | 0 (0.0%) |
| College/Associate Degree | 233 (92.5%) | 19 (7.5%) |
| Bachelor's Degree or higher | 769 (97.2%) | 22 (2.8%) |
Occupancy by Age of Householder in The Hills
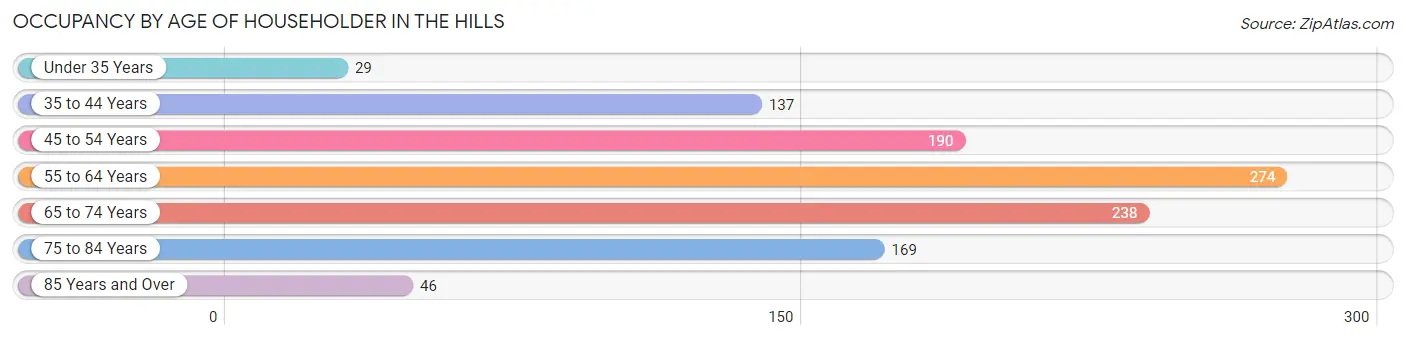
| Age Bracket | # Households | % Households |
| Under 35 Years | 29 | 2.7% |
| 35 to 44 Years | 137 | 12.7% |
| 45 to 54 Years | 190 | 17.5% |
| 55 to 64 Years | 274 | 25.3% |
| 65 to 74 Years | 238 | 22.0% |
| 75 to 84 Years | 169 | 15.6% |
| 85 Years and Over | 46 | 4.3% |
| Total | 1,083 | 100.0% |
Housing Finances in The Hills
Median Income by Occupancy in The Hills
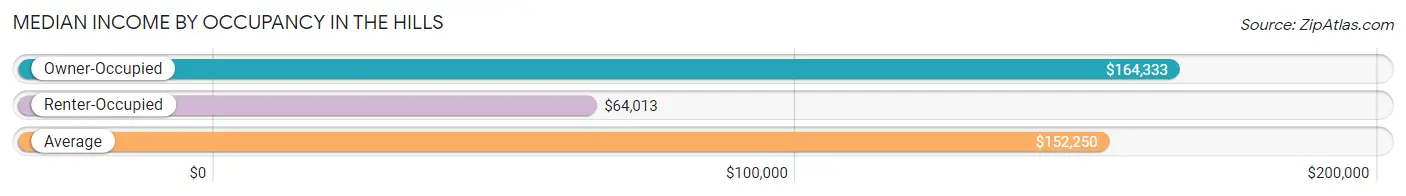
| Occupancy Type | # Households | Median Income |
| Owner-Occupied | 1,042 (96.2%) | $164,333 |
| Renter-Occupied | 41 (3.8%) | $64,013 |
| Average | 1,083 (100.0%) | $152,250 |
Occupancy by Householder Income Bracket in The Hills
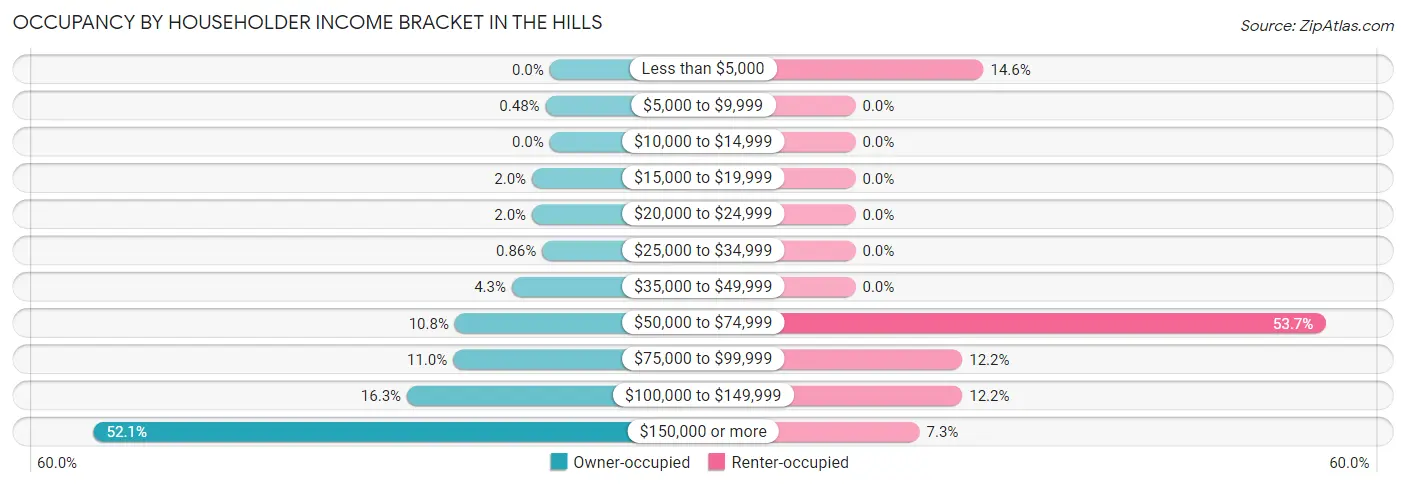
| Income Bracket | Owner-occupied | Renter-occupied |
| Less than $5,000 | 0 (0.0%) | 6 (14.6%) |
| $5,000 to $9,999 | 5 (0.5%) | 0 (0.0%) |
| $10,000 to $14,999 | 0 (0.0%) | 0 (0.0%) |
| $15,000 to $19,999 | 21 (2.0%) | 0 (0.0%) |
| $20,000 to $24,999 | 21 (2.0%) | 0 (0.0%) |
| $25,000 to $34,999 | 9 (0.9%) | 0 (0.0%) |
| $35,000 to $49,999 | 45 (4.3%) | 0 (0.0%) |
| $50,000 to $74,999 | 113 (10.8%) | 22 (53.7%) |
| $75,000 to $99,999 | 115 (11.0%) | 5 (12.2%) |
| $100,000 to $149,999 | 170 (16.3%) | 5 (12.2%) |
| $150,000 or more | 543 (52.1%) | 3 (7.3%) |
| Total | 1,042 (100.0%) | 41 (100.0%) |
Monthly Housing Cost Tiers in The Hills
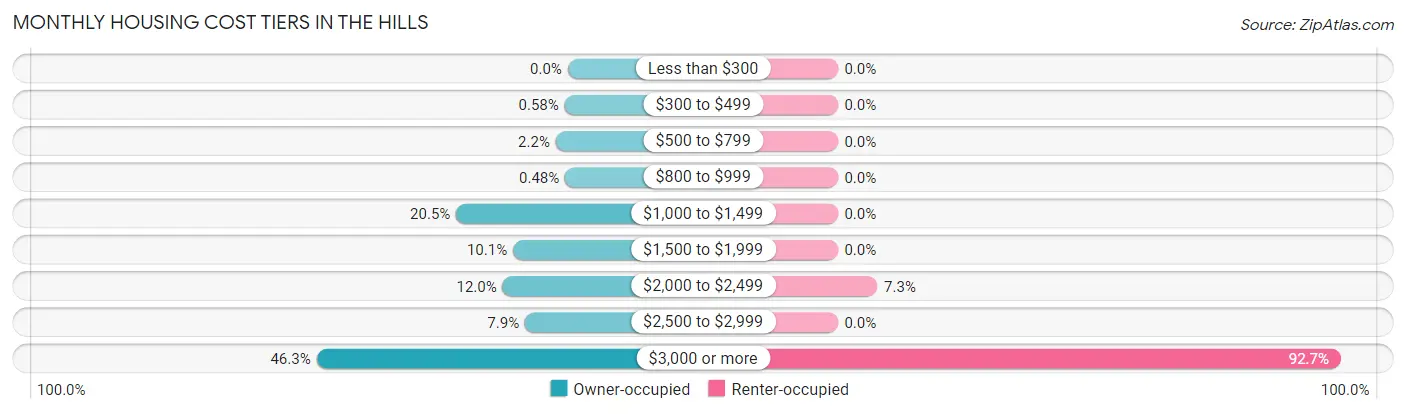
| Monthly Cost | Owner-occupied | Renter-occupied |
| Less than $300 | 0 (0.0%) | 0 (0.0%) |
| $300 to $499 | 6 (0.6%) | 0 (0.0%) |
| $500 to $799 | 23 (2.2%) | 0 (0.0%) |
| $800 to $999 | 5 (0.5%) | 0 (0.0%) |
| $1,000 to $1,499 | 214 (20.5%) | 0 (0.0%) |
| $1,500 to $1,999 | 105 (10.1%) | 0 (0.0%) |
| $2,000 to $2,499 | 125 (12.0%) | 3 (7.3%) |
| $2,500 to $2,999 | 82 (7.9%) | 0 (0.0%) |
| $3,000 or more | 482 (46.3%) | 38 (92.7%) |
| Total | 1,042 (100.0%) | 41 (100.0%) |
Physical Housing Characteristics in The Hills
Housing Structures in The Hills
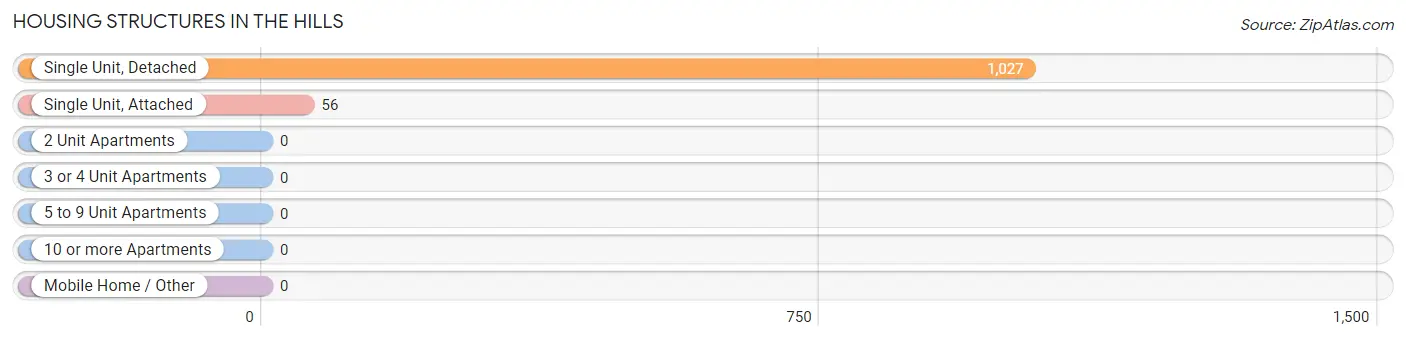
| Structure Type | # Housing Units | % Housing Units |
| Single Unit, Detached | 1,027 | 94.8% |
| Single Unit, Attached | 56 | 5.2% |
| 2 Unit Apartments | 0 | 0.0% |
| 3 or 4 Unit Apartments | 0 | 0.0% |
| 5 to 9 Unit Apartments | 0 | 0.0% |
| 10 or more Apartments | 0 | 0.0% |
| Mobile Home / Other | 0 | 0.0% |
| Total | 1,083 | 100.0% |
Housing Structures by Occupancy in The Hills
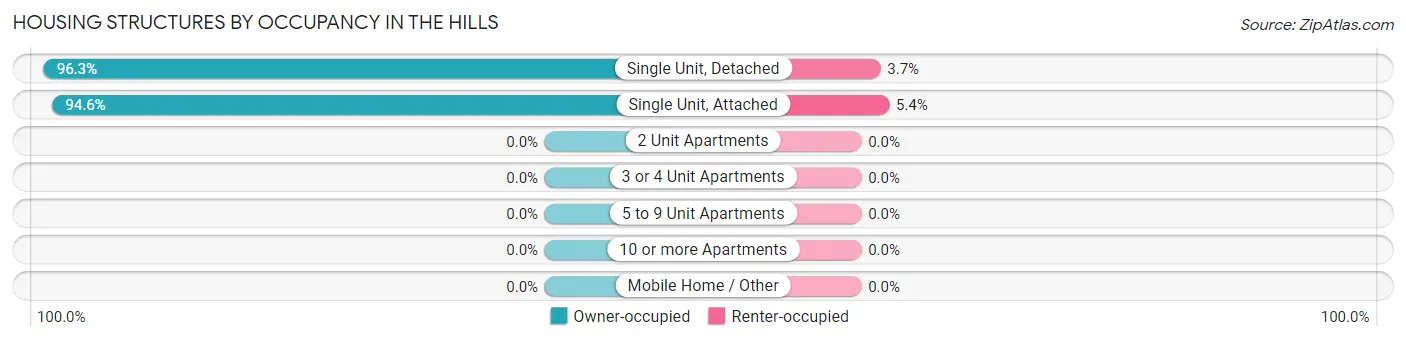
| Structure Type | Owner-occupied | Renter-occupied |
| Single Unit, Detached | 989 (96.3%) | 38 (3.7%) |
| Single Unit, Attached | 53 (94.6%) | 3 (5.4%) |
| 2 Unit Apartments | 0 (0.0%) | 0 (0.0%) |
| 3 or 4 Unit Apartments | 0 (0.0%) | 0 (0.0%) |
| 5 to 9 Unit Apartments | 0 (0.0%) | 0 (0.0%) |
| 10 or more Apartments | 0 (0.0%) | 0 (0.0%) |
| Mobile Home / Other | 0 (0.0%) | 0 (0.0%) |
| Total | 1,042 (96.2%) | 41 (3.8%) |
Housing Structures by Number of Rooms in The Hills
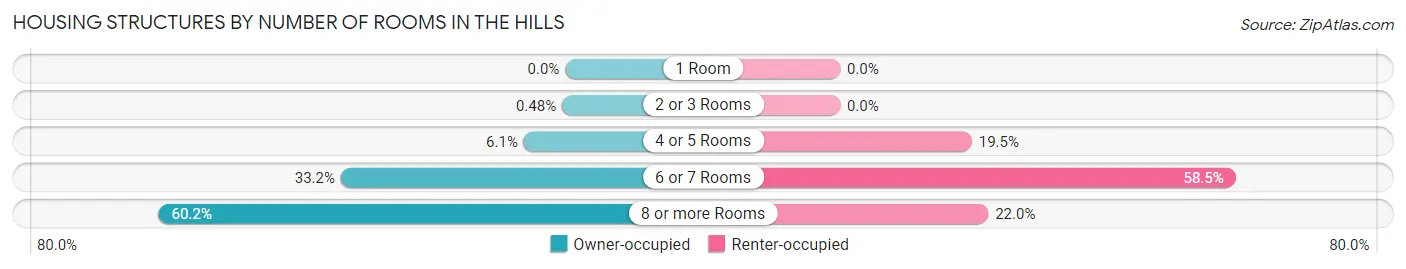
| Number of Rooms | Owner-occupied | Renter-occupied |
| 1 Room | 0 (0.0%) | 0 (0.0%) |
| 2 or 3 Rooms | 5 (0.5%) | 0 (0.0%) |
| 4 or 5 Rooms | 64 (6.1%) | 8 (19.5%) |
| 6 or 7 Rooms | 346 (33.2%) | 24 (58.5%) |
| 8 or more Rooms | 627 (60.2%) | 9 (22.0%) |
| Total | 1,042 (100.0%) | 41 (100.0%) |
Housing Structure by Heating Type in The Hills
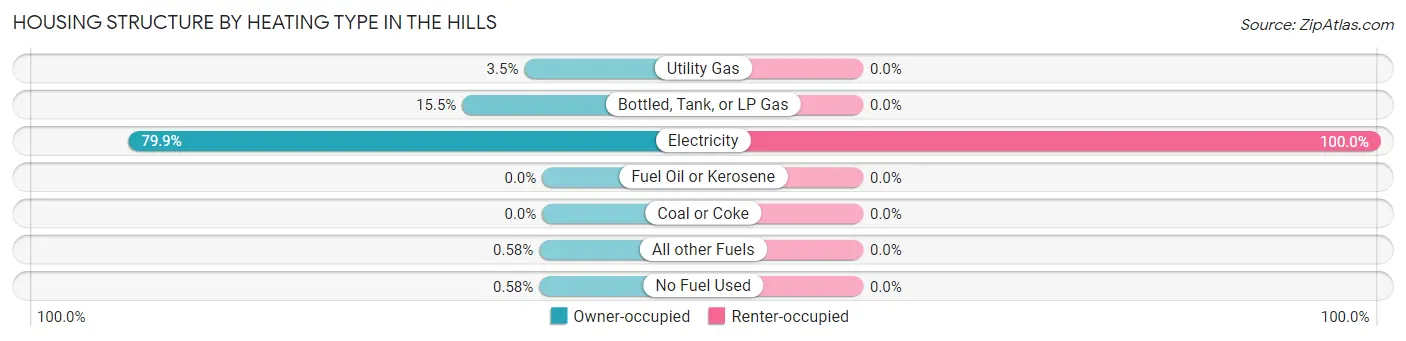
| Heating Type | Owner-occupied | Renter-occupied |
| Utility Gas | 36 (3.5%) | 0 (0.0%) |
| Bottled, Tank, or LP Gas | 161 (15.4%) | 0 (0.0%) |
| Electricity | 833 (79.9%) | 41 (100.0%) |
| Fuel Oil or Kerosene | 0 (0.0%) | 0 (0.0%) |
| Coal or Coke | 0 (0.0%) | 0 (0.0%) |
| All other Fuels | 6 (0.6%) | 0 (0.0%) |
| No Fuel Used | 6 (0.6%) | 0 (0.0%) |
| Total | 1,042 (100.0%) | 41 (100.0%) |
Household Vehicle Usage in The Hills
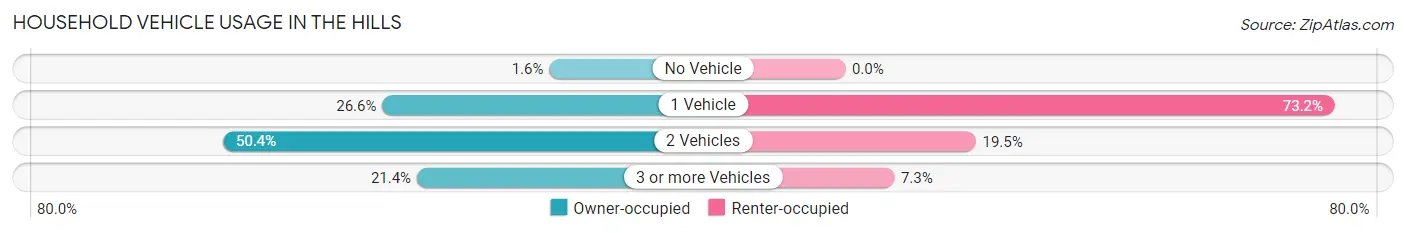
| Vehicles per Household | Owner-occupied | Renter-occupied |
| No Vehicle | 17 (1.6%) | 0 (0.0%) |
| 1 Vehicle | 277 (26.6%) | 30 (73.2%) |
| 2 Vehicles | 525 (50.4%) | 8 (19.5%) |
| 3 or more Vehicles | 223 (21.4%) | 3 (7.3%) |
| Total | 1,042 (100.0%) | 41 (100.0%) |
Real Estate & Mortgages in The Hills
Real Estate and Mortgage Overview in The Hills
| Characteristic | Without Mortgage | With Mortgage |
| Housing Units | 378 | 664 |
| Median Property Value | $702,400 | $755,700 |
| Median Household Income | $115,250 | $405 |
| Monthly Housing Costs | $1,337 | $473 |
| Real Estate Taxes | $10,001 | $13 |
Property Value by Mortgage Status in The Hills
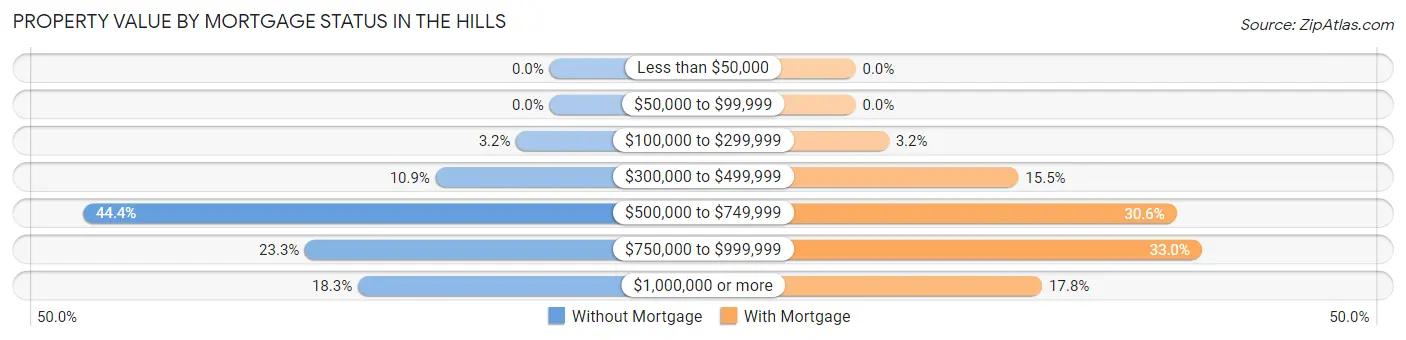
| Property Value | Without Mortgage | With Mortgage |
| Less than $50,000 | 0 (0.0%) | 0 (0.0%) |
| $50,000 to $99,999 | 0 (0.0%) | 0 (0.0%) |
| $100,000 to $299,999 | 12 (3.2%) | 21 (3.2%) |
| $300,000 to $499,999 | 41 (10.8%) | 103 (15.5%) |
| $500,000 to $749,999 | 168 (44.4%) | 203 (30.6%) |
| $750,000 to $999,999 | 88 (23.3%) | 219 (33.0%) |
| $1,000,000 or more | 69 (18.2%) | 118 (17.8%) |
| Total | 378 (100.0%) | 664 (100.0%) |
Household Income by Mortgage Status in The Hills
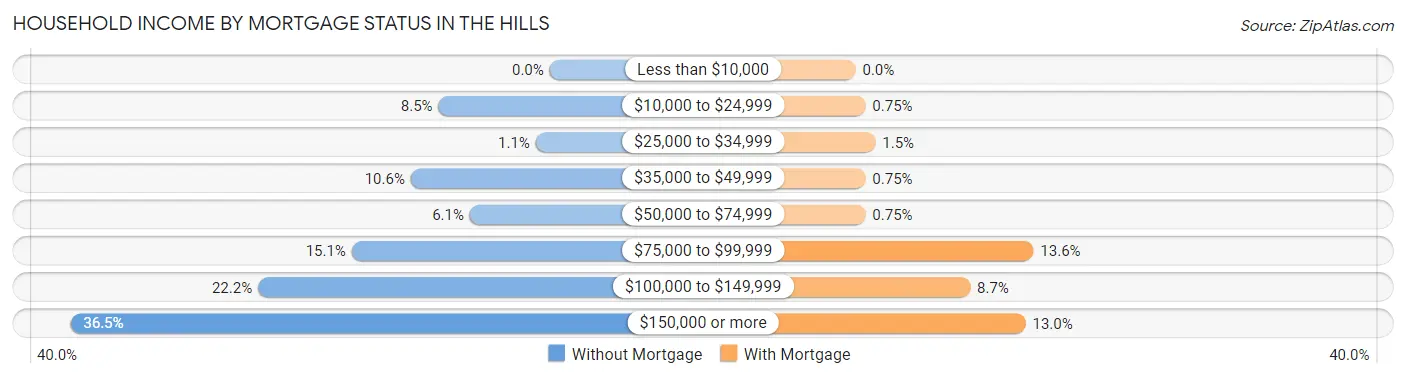
| Household Income | Without Mortgage | With Mortgage |
| Less than $10,000 | 0 (0.0%) | 0 (0.0%) |
| $10,000 to $24,999 | 32 (8.5%) | 5 (0.7%) |
| $25,000 to $34,999 | 4 (1.1%) | 10 (1.5%) |
| $35,000 to $49,999 | 40 (10.6%) | 5 (0.7%) |
| $50,000 to $74,999 | 23 (6.1%) | 5 (0.7%) |
| $75,000 to $99,999 | 57 (15.1%) | 90 (13.6%) |
| $100,000 to $149,999 | 84 (22.2%) | 58 (8.7%) |
| $150,000 or more | 138 (36.5%) | 86 (13.0%) |
| Total | 378 (100.0%) | 664 (100.0%) |
Property Value to Household Income Ratio in The Hills
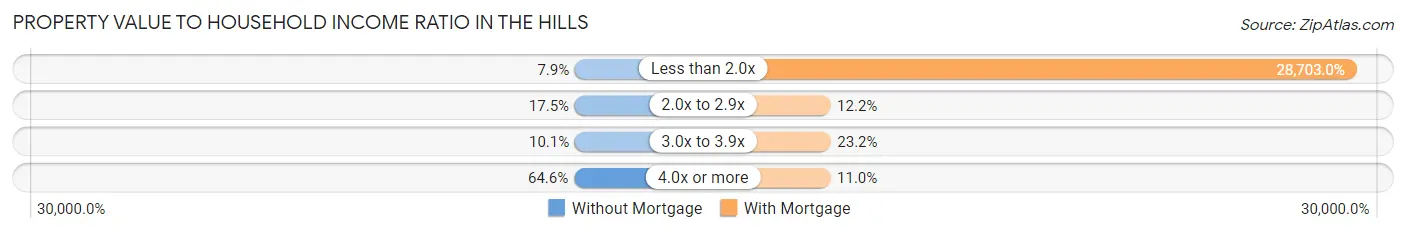
| Value-to-Income Ratio | Without Mortgage | With Mortgage |
| Less than 2.0x | 30 (7.9%) | 190,588 (28,703.0%) |
| 2.0x to 2.9x | 66 (17.5%) | 81 (12.2%) |
| 3.0x to 3.9x | 38 (10.1%) | 154 (23.2%) |
| 4.0x or more | 244 (64.5%) | 73 (11.0%) |
| Total | 378 (100.0%) | 664 (100.0%) |
Real Estate Taxes by Mortgage Status in The Hills
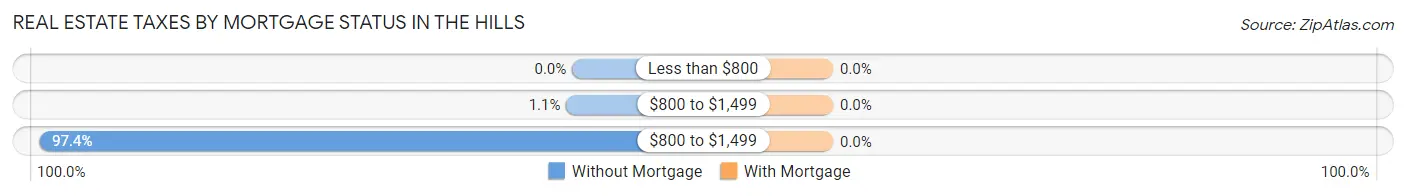
| Property Taxes | Without Mortgage | With Mortgage |
| Less than $800 | 0 (0.0%) | 0 (0.0%) |
| $800 to $1,499 | 4 (1.1%) | 0 (0.0%) |
| $800 to $1,499 | 368 (97.4%) | 0 (0.0%) |
| Total | 378 (100.0%) | 664 (100.0%) |
Health & Disability in The Hills
Health Insurance Coverage by Age in The Hills
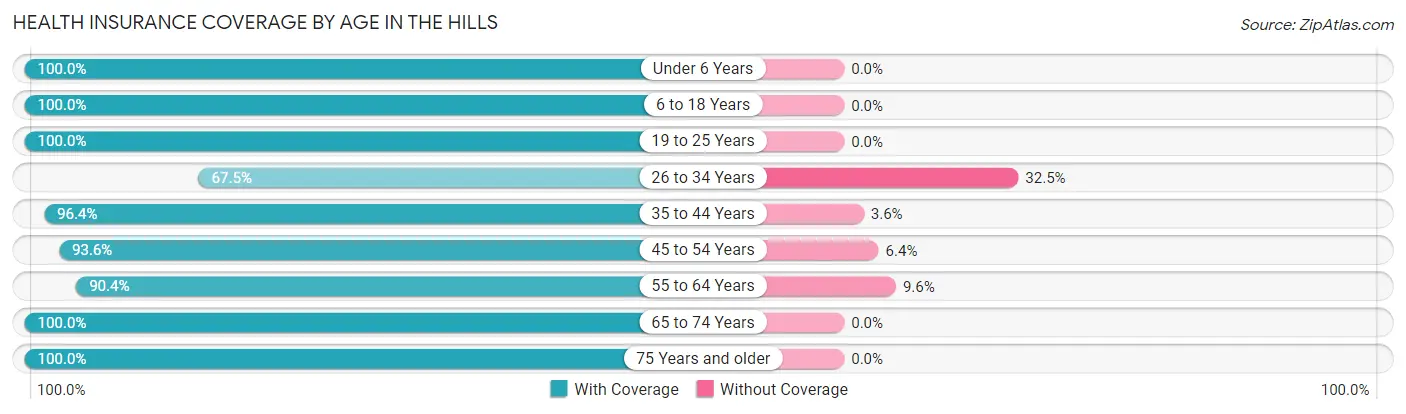
| Age Bracket | With Coverage | Without Coverage |
| Under 6 Years | 119 (100.0%) | 0 (0.0%) |
| 6 to 18 Years | 324 (100.0%) | 0 (0.0%) |
| 19 to 25 Years | 77 (100.0%) | 0 (0.0%) |
| 26 to 34 Years | 104 (67.5%) | 50 (32.5%) |
| 35 to 44 Years | 265 (96.4%) | 10 (3.6%) |
| 45 to 54 Years | 263 (93.6%) | 18 (6.4%) |
| 55 to 64 Years | 394 (90.4%) | 42 (9.6%) |
| 65 to 74 Years | 537 (100.0%) | 0 (0.0%) |
| 75 Years and older | 302 (100.0%) | 0 (0.0%) |
| Total | 2,385 (95.2%) | 120 (4.8%) |
Health Insurance Coverage by Citizenship Status in The Hills
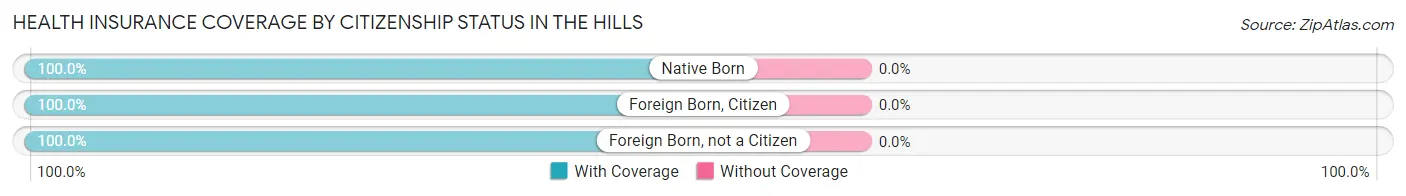
| Citizenship Status | With Coverage | Without Coverage |
| Native Born | 119 (100.0%) | 0 (0.0%) |
| Foreign Born, Citizen | 324 (100.0%) | 0 (0.0%) |
| Foreign Born, not a Citizen | 77 (100.0%) | 0 (0.0%) |
Health Insurance Coverage by Household Income in The Hills
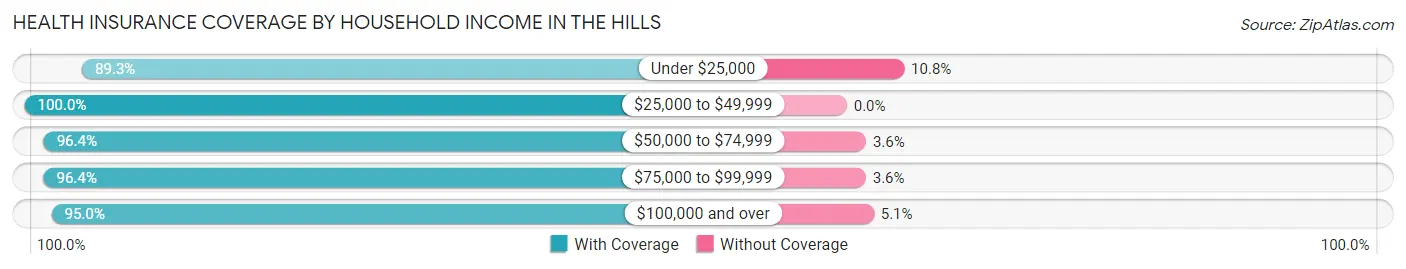
| Household Income | With Coverage | Without Coverage |
| Under $25,000 | 83 (89.2%) | 10 (10.7%) |
| $25,000 to $49,999 | 71 (100.0%) | 0 (0.0%) |
| $50,000 to $74,999 | 295 (96.4%) | 11 (3.6%) |
| $75,000 to $99,999 | 244 (96.4%) | 9 (3.6%) |
| $100,000 and over | 1,692 (95.0%) | 90 (5.1%) |
Public vs Private Health Insurance Coverage by Age in The Hills
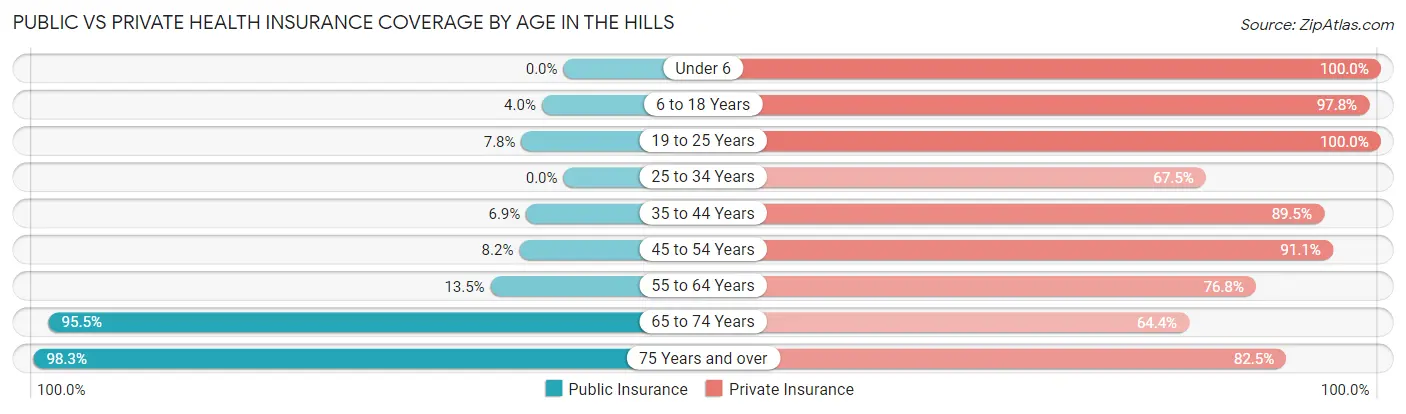
| Age Bracket | Public Insurance | Private Insurance |
| Under 6 | 0 (0.0%) | 119 (100.0%) |
| 6 to 18 Years | 13 (4.0%) | 317 (97.8%) |
| 19 to 25 Years | 6 (7.8%) | 77 (100.0%) |
| 25 to 34 Years | 0 (0.0%) | 104 (67.5%) |
| 35 to 44 Years | 19 (6.9%) | 246 (89.4%) |
| 45 to 54 Years | 23 (8.2%) | 256 (91.1%) |
| 55 to 64 Years | 59 (13.5%) | 335 (76.8%) |
| 65 to 74 Years | 513 (95.5%) | 346 (64.4%) |
| 75 Years and over | 297 (98.3%) | 249 (82.5%) |
| Total | 930 (37.1%) | 2,049 (81.8%) |
Disability Status by Sex by Age in The Hills
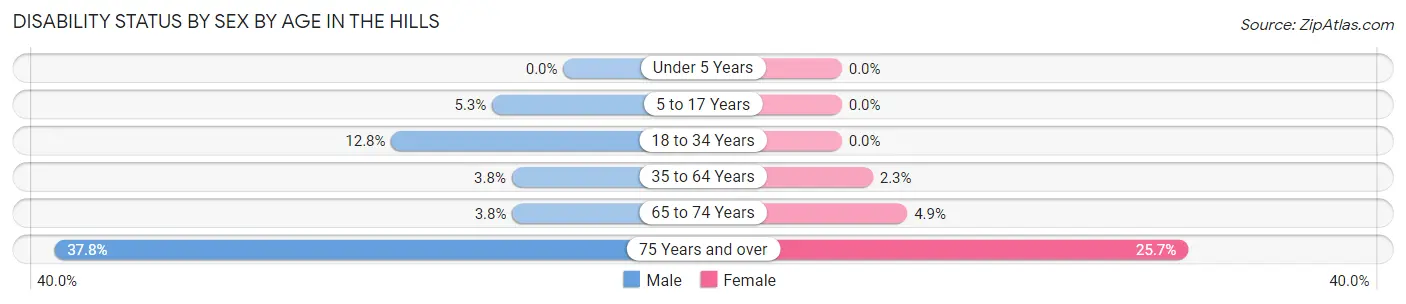
| Age Bracket | Male | Female |
| Under 5 Years | 0 (0.0%) | 0 (0.0%) |
| 5 to 17 Years | 9 (5.3%) | 0 (0.0%) |
| 18 to 34 Years | 6 (12.8%) | 0 (0.0%) |
| 35 to 64 Years | 18 (3.8%) | 12 (2.3%) |
| 65 to 74 Years | 11 (3.8%) | 12 (4.9%) |
| 75 Years and over | 48 (37.8%) | 45 (25.7%) |
Disability Class by Sex by Age in The Hills
Disability Class: Hearing Difficulty
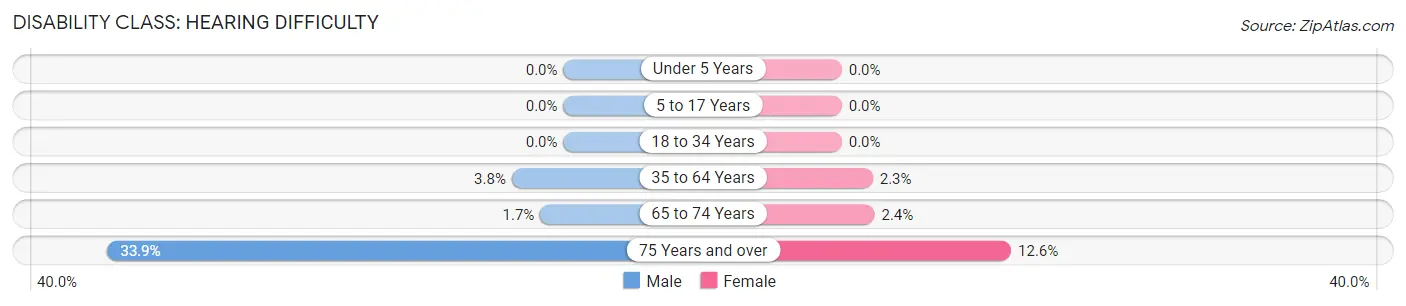
| Age Bracket | Male | Female |
| Under 5 Years | 0 (0.0%) | 0 (0.0%) |
| 5 to 17 Years | 0 (0.0%) | 0 (0.0%) |
| 18 to 34 Years | 0 (0.0%) | 0 (0.0%) |
| 35 to 64 Years | 18 (3.8%) | 12 (2.3%) |
| 65 to 74 Years | 5 (1.7%) | 6 (2.4%) |
| 75 Years and over | 43 (33.9%) | 22 (12.6%) |
Disability Class: Vision Difficulty
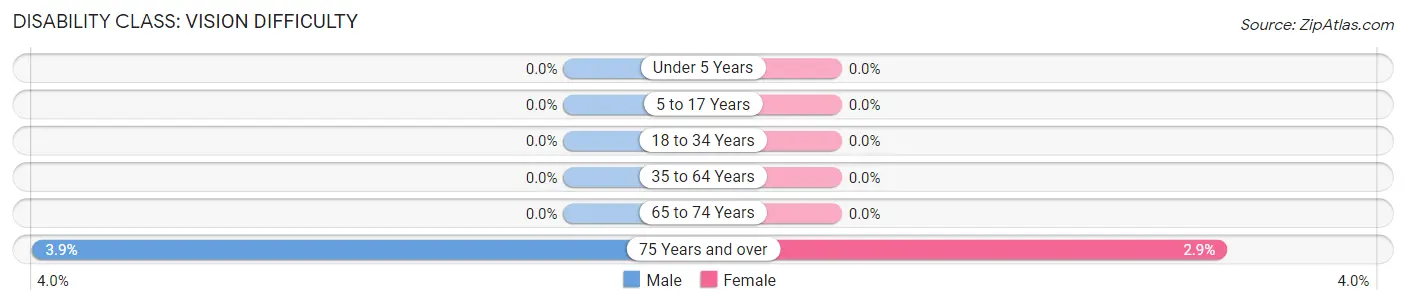
| Age Bracket | Male | Female |
| Under 5 Years | 0 (0.0%) | 0 (0.0%) |
| 5 to 17 Years | 0 (0.0%) | 0 (0.0%) |
| 18 to 34 Years | 0 (0.0%) | 0 (0.0%) |
| 35 to 64 Years | 0 (0.0%) | 0 (0.0%) |
| 65 to 74 Years | 0 (0.0%) | 0 (0.0%) |
| 75 Years and over | 5 (3.9%) | 5 (2.9%) |
Disability Class: Cognitive Difficulty
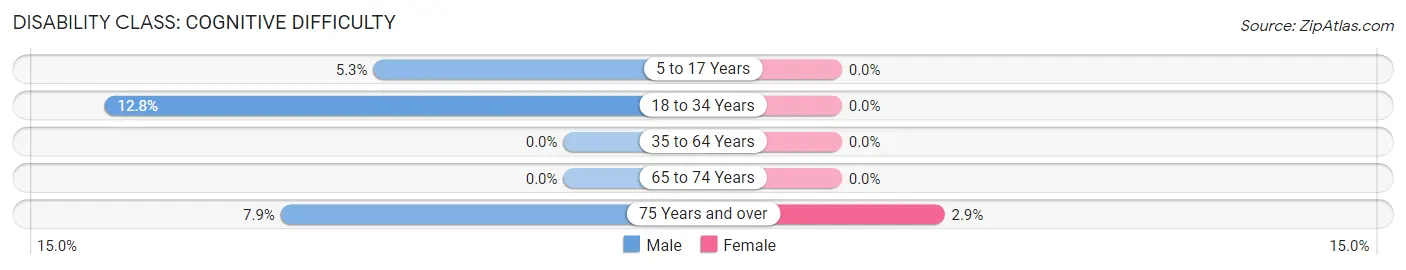
| Age Bracket | Male | Female |
| 5 to 17 Years | 9 (5.3%) | 0 (0.0%) |
| 18 to 34 Years | 6 (12.8%) | 0 (0.0%) |
| 35 to 64 Years | 0 (0.0%) | 0 (0.0%) |
| 65 to 74 Years | 0 (0.0%) | 0 (0.0%) |
| 75 Years and over | 10 (7.9%) | 5 (2.9%) |
Disability Class: Ambulatory Difficulty
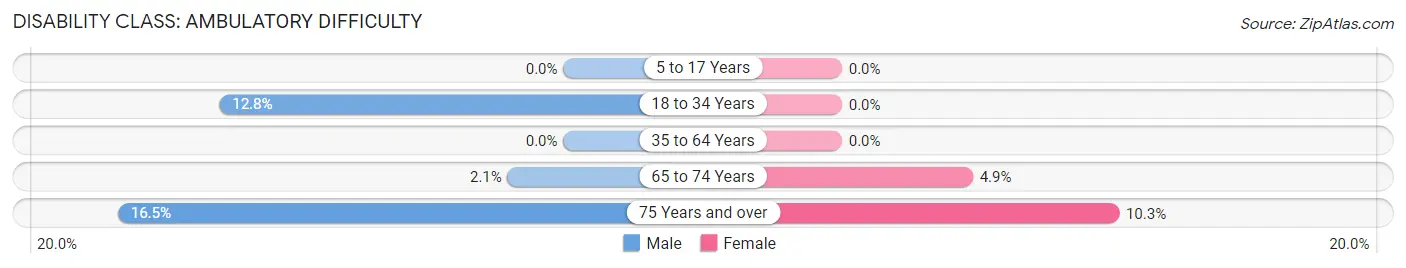
| Age Bracket | Male | Female |
| 5 to 17 Years | 0 (0.0%) | 0 (0.0%) |
| 18 to 34 Years | 6 (12.8%) | 0 (0.0%) |
| 35 to 64 Years | 0 (0.0%) | 0 (0.0%) |
| 65 to 74 Years | 6 (2.1%) | 12 (4.9%) |
| 75 Years and over | 21 (16.5%) | 18 (10.3%) |
Disability Class: Self-Care Difficulty
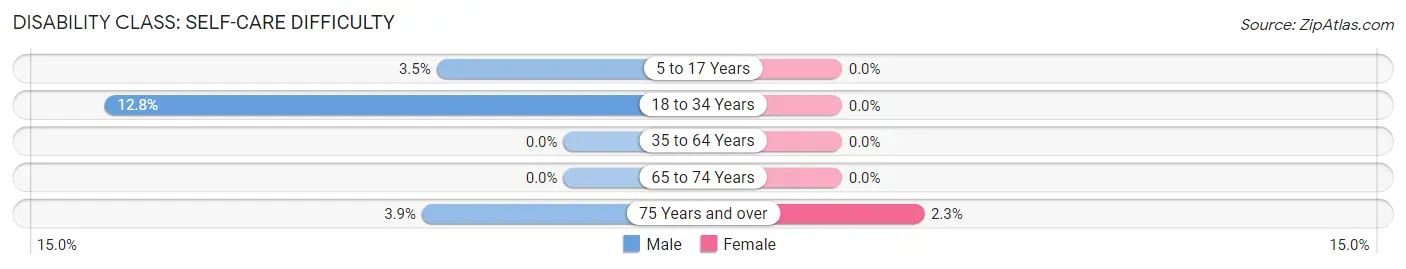
| Age Bracket | Male | Female |
| 5 to 17 Years | 6 (3.5%) | 0 (0.0%) |
| 18 to 34 Years | 6 (12.8%) | 0 (0.0%) |
| 35 to 64 Years | 0 (0.0%) | 0 (0.0%) |
| 65 to 74 Years | 0 (0.0%) | 0 (0.0%) |
| 75 Years and over | 5 (3.9%) | 4 (2.3%) |
Technology Access in The Hills
Computing Device Access in The Hills
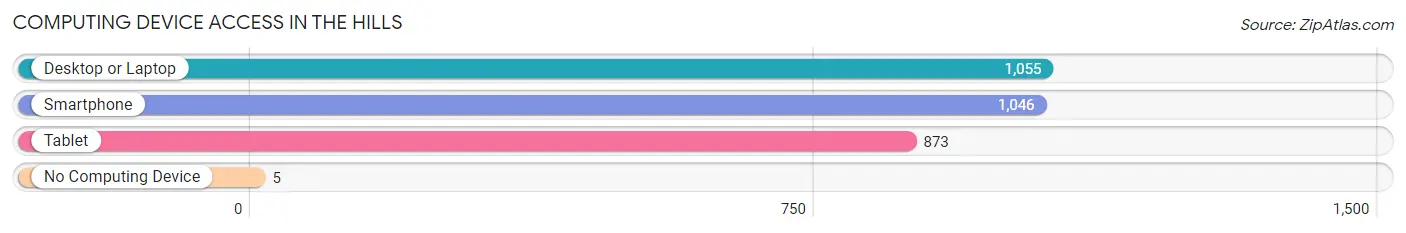
| Device Type | # Households | % Households |
| Desktop or Laptop | 1,055 | 97.4% |
| Smartphone | 1,046 | 96.6% |
| Tablet | 873 | 80.6% |
| No Computing Device | 5 | 0.5% |
| Total | 1,083 | 100.0% |
Internet Access in The Hills
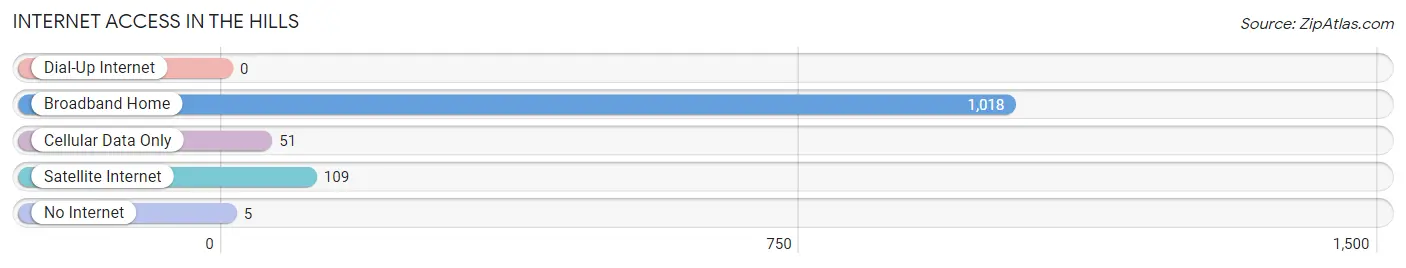
| Internet Type | # Households | % Households |
| Dial-Up Internet | 0 | 0.0% |
| Broadband Home | 1,018 | 94.0% |
| Cellular Data Only | 51 | 4.7% |
| Satellite Internet | 109 | 10.1% |
| No Internet | 5 | 0.5% |
| Total | 1,083 | 100.0% |
The Hills Summary
The Hills, Texas is a small town located in the Hill Country of Central Texas. It is situated in the northern part of Blanco County, about 25 miles northwest of Austin. The town was founded in 1854 and has a population of about 1,000 people.
History
The Hills, Texas was founded in 1854 by a group of settlers from the nearby town of Blanco. The settlers were looking for a place to settle and start a new life. The area was originally known as “The Hills” because of the rolling hills that surrounded the area. The settlers built a small church and a school, and the town quickly grew.
In 1876, the town was officially incorporated and named “The Hills”. The town was a popular stop for travelers on their way to Austin and San Antonio. The town was also known for its cattle and sheep ranching.
In the early 1900s, the town began to experience a decline in population due to the Great Depression. However, the town was able to survive and eventually began to grow again. In the 1950s, the town was home to a number of businesses, including a grocery store, a bank, and a post office.
Geography
The Hills, Texas is located in the Hill Country of Central Texas. The town is situated in the northern part of Blanco County, about 25 miles northwest of Austin. The town is surrounded by rolling hills and is located near the Blanco River. The town is also close to the Pedernales River, which is a popular spot for fishing and swimming.
The town has a total area of 1.2 square miles, all of which is land. The town has a humid subtropical climate, with hot summers and mild winters. The average temperature in the summer is around 90 degrees Fahrenheit, and the average temperature in the winter is around 50 degrees Fahrenheit.
Economy
The economy of The Hills, Texas is largely based on agriculture and tourism. The town is home to a number of farms, which produce a variety of crops, including corn, cotton, and hay. The town is also home to a number of wineries, which produce a variety of wines.
The town is also home to a number of businesses, including a grocery store, a bank, and a post office. The town is also home to a number of restaurants, which serve a variety of cuisines.
Demographics
The population of The Hills, Texas was 1,000 people as of the 2010 census. The town is predominantly white, with about 95% of the population being white. The town also has a small Hispanic population, with about 4% of the population being Hispanic. The town also has a small African American population, with about 1% of the population being African American.
The median household income in The Hills, Texas is $45,000, and the median home value is $150,000. The town has a low unemployment rate, with about 4% of the population being unemployed. The town also has a low poverty rate, with about 8% of the population living below the poverty line.
Conclusion
The Hills, Texas is a small town located in the Hill Country of Central Texas. The town was founded in 1854 and has a population of about 1,000 people. The town is largely based on agriculture and tourism, and is home to a number of businesses, including a grocery store, a bank, and a post office. The town is predominantly white, with about 95% of the population being white. The median household income in The Hills, Texas is $45,000, and the median home value is $150,000. The town has a low unemployment rate, with about 4% of the population being unemployed. The town also has a low poverty rate, with about 8% of the population living below the poverty line.
Common Questions
What is Per Capita Income in The Hills?
Per Capita income in The Hills is $83,315.
What is the Median Family Income in The Hills?
Median Family Income in The Hills is $182,885.
What is the Median Household income in The Hills?
Median Household Income in The Hills is $152,250.
What is Income or Wage Gap in The Hills?
Income or Wage Gap in The Hills is 60.8%.
Women in The Hills earn 39.2 cents for every dollar earned by a man.
What is Family Income Deficit in The Hills?
Family Income Deficit in The Hills is $9,045.
Families that are below poverty line in The Hills earn $9,045 less on average than the poverty threshold level.
What is Inequality or Gini Index in The Hills?
Inequality or Gini Index in The Hills is 0.41.
What is the Total Population of The Hills?
Total Population of The Hills is 2,505.
What is the Total Male Population of The Hills?
Total Male Population of The Hills is 1,195.
What is the Total Female Population of The Hills?
Total Female Population of The Hills is 1,310.
What is the Ratio of Males per 100 Females in The Hills?
There are 91.22 Males per 100 Females in The Hills.
What is the Ratio of Females per 100 Males in The Hills?
There are 109.62 Females per 100 Males in The Hills.
What is the Median Population Age in The Hills?
Median Population Age in The Hills is 55.7 Years.
What is the Average Family Size in The Hills
Average Family Size in The Hills is 2.5 People.
What is the Average Household Size in The Hills
Average Household Size in The Hills is 2.3 People.
How Large is the Labor Force in The Hills?
There are 1,006 People in the Labor Forcein in The Hills.
What is the Percentage of People in the Labor Force in The Hills?
46.9% of People are in the Labor Force in The Hills.
What is the Unemployment Rate in The Hills?
Unemployment Rate in The Hills is 2.6%.